UNITED STATES
SECURITIES AND EXCHANGE COMMISSION
WASHINGTON, D.C. 20549
FORM 10-K
ý ANNUAL REPORT PURSUANT TO SECTION 13 OR 15(d) OF THE SECURITIES EXCHANGE ACT OF 1934
For the Fiscal Year Ended December 31, 2005
OR
o TRANSITION REPORT PURSUANT TO SECTION 13 OR 15(d) OF THE SECURITIES EXCHANGE ACT OF 1934
For the transition period from to
Commission file number 001-09818
ALLIANCEBERNSTEIN HOLDING L.P.
(Exact name of registrant as specified in its charter)
Delaware | | 13-3434400 |
(State or other jurisdiction of
incorporation or organization) | | (I.R.S. Employer
Identification No.) |
| | |
1345 Avenue of the Americas, New York, N.Y. | | 10105 |
(Address of principal executive offices) | | (Zip Code) |
| | |
Registrant’s telephone number, including area code: (212) 969-1000 |
Securities registered pursuant to Section 12(b) of the Act:
Title of Class | | Name of each exchange on which registered |
units representing assignments of beneficial ownership of limited partnership interests* | | New York Stock Exchange |
Securities registered pursuant to Section 12(g) of the Act: None
Indicate by check mark if the registrant is a well-known seasoned issuer, as defined in Rule 405 of the Securities Act. Yes ý No o
Indicate by check mark if the registrant is not required to file reports pursuant to Section 13 or Section 15(d) of the Act. Yes o No ý
Indicate by check mark whether the registrant (1) has filed all reports required to be filed by Section 13 or 15(d) of the Securities Exchange Act of 1934 during the preceding 12 months (or for such shorter period that the registrant was required to file such reports), and (2) has been subject to such filing requirements for the past 90 days. Yes ý No o
Indicate by check mark if disclosure of delinquent filers pursuant to Item 405 of Regulation S-K (§229.405 of this chapter) is not contained herein, and will not be contained, to the best of registrant’s knowledge, in definitive proxy or information statements incorporated by reference in Part III of this Form 10-K or any amendment to this Form 10-K. ý
Indicate by check mark whether the registrant is a large accelerated filer, an accelerated filer, or a non-accelerated filer. See definition of “accelerated filer” and “large accelerated filer” in Rule 12b-2 of the Exchange Act. (Check one):
Large accelerated filer ý | | Accelerated filer o | | Non-accelerated filer o |
Indicate by check mark whether the registrant is a shell company (as defined in Rule 12b-2 of the Exchange Act). Yes o No ý
The aggregate market value of the units representing assignments of beneficial ownership of limited partnership interests held by non-affiliates computed by reference to the price at which such units were last sold on the New York Stock Exchange as of June 30, 2005 was approximately $3,668,403,343.
The number of units representing assignments of beneficial ownership of limited partnership interests outstanding as of January 31, 2006 was 83,613,491.*
DOCUMENTS INCORPORATED BY REFERENCE
This Form 10-K does not incorporate any document by reference.
* includes 100,000 units of general partnership interest having economic interests equivalent to the economic interests of the units representing assignments of beneficial ownership of limited partnership interests
GLOSSARY OF CERTAIN DEFINED TERMS
“AllianceBernstein” — AllianceBernstein L.P. (Delaware limited partnership formerly known as Alliance Capital Management L.P.), the operating partnership, and its subsidiaries and, where appropriate, its predecessors, Holding and ACMC, Inc. and their respective subsidiaries.
“AllianceBernstein Investments”— AllianceBernstein Investments, Inc. (Delaware corporation formerly known as AllianceBernstein Investment Research and Management, Inc.), a wholly-owned subsidiary of AllianceBernstein, that services retail clients and distributes company-sponsored mutual funds.
“AllianceBernstein Partnership Agreement”— the Amended and Restated Agreement of Limited Partnership of AllianceBernstein.
“AllianceBernstein Units”— units of limited partnership interest in AllianceBernstein.
“AUM” — assets under management for clients.
“AXA”— AXA (société anonyme organized under the laws of France), the holding company for an international group of insurance and related financial services companies engaged in the financial protection and wealth management businesses.
“AXA Equitable”— AXA Equitable Life Insurance Company (New York stock life insurance company), an indirect wholly-owned subsidiary of AXA Financial, and its subsidiaries other than AllianceBernstein and its subsidiaries.
“AXA Financial”— AXA Financial, Inc. (Delaware corporation), a wholly-owned subsidiary of AXA.
“Bernstein GWM” — Bernstein Global Wealth Management (formerly known as Bernstein Investment Research and Management), a unit of AllianceBernstein that services private clients.
“Bernstein Transaction”— on October 2, 2000, AllianceBernstein acquired the business and assets of SCB Inc., formerly known as Sanford C. Bernstein Inc. (“Bernstein”), and assumed the liabilities of the Bernstein business.
“Exchange Act”—the Securities Exchange Act of 1934, as amended.
“General Partner”— AllianceBernstein Corporation (Delaware corporation formerly known as Alliance Capital Management Corporation), the general partner of AllianceBernstein and Holding and a wholly-owned subsidiary of AXA Equitable, and, where appropriate, ACMC, Inc., its predecessor.
“Holding” — AllianceBernstein Holding L.P. (Delaware limited partnership formerly known as Alliance Capital Management Holding L.P.).
“Holding Partnership Agreement”— the Amended and Restated Agreement of Limited Partnership of Holding.
“Holding Units”— units representing assignments of beneficial ownership of limited partnership interests in Holding.
“Investment Advisers Act”— the Investment Advisers Act of 1940, as amended.
“Investment Company Act”— the Investment Company Act of 1940, as amended.
“Partnerships”— AllianceBernstein and Holding together.
“SCB LLC”— Sanford C. Bernstein & Co., LLC (Delaware limited liability company), a wholly-owned subsidiary of AllianceBernstein that provides institutional research services in the United States.
“SCBL”— Sanford C. Bernstein Limited (UK company), a wholly-owned subsidiary of AllianceBernstein that provides institutional research services in Europe, Australia, and Asia.
“SEC”— the United States Securities and Exchange Commission.
“Securities Act”— the Securities Act of 1933, as amended.
ii
PART I
Item 1. Business
The words “we” and “our” in this Form 10-K refer collectively to Holding, AllianceBernstein and its subsidiaries, or to their officers and employees. Similarly, the word “company” refers to both Holding and AllianceBernstein. Where the context requires distinguishing between Holding and AllianceBernstein, we identify which of them is being discussed. Holding Unitholders own partnership interests in a holding company whose principal source of income and cash flow is attributable to its limited partnership interests in AllianceBernstein.
We use “global” in this Form 10-K to refer to all nations, including the United States, while we use “international” or “non-U.S.” to refer to all nations except for the United States.
General
Re-branding
Effective February 24, 2006, we changed the name of Alliance Capital Management L.P. to AllianceBernstein L.P., and also changed the names of Alliance Capital Management Holding L.P. and Alliance Capital Management Corporation to AllianceBernstein Holding L.P. and AllianceBernstein Corporation, respectively. Some of our subsidiaries underwent a similar change. We believe our new name better describes the character of our business and the shared mission, values, dedication to research and client focus of all of our employees, and is an affirmation of the success of the combination of Alliance Capital and Sanford Bernstein.
Clients
AllianceBernstein provides diversified investment management and related services globally to a broad range of clients, including:
• institutional clients, including unaffiliated corporate and public employee pension funds, endowment funds, domestic and foreign institutions and governments, and various affiliates;
• retail clients;
• private clients, including high-net-worth individuals, trusts and estates, charitable foundations, partnerships, private and family corporations, and other entities; and
• institutional investors seeking institutional research.
We also provide distribution, shareholder servicing, and administrative services to our sponsored mutual funds.
Recognizing that clients’ trust is imperative to the proper functioning of our company, we are dedicated to creating and sustaining a fiduciary culture. As a fiduciary, we place the interests of our clients first and foremost. We are committed to the fair and equitable treatment of all our clients, to protect them from potential conflicts of interest within our company, and to comply with all applicable rules and regulations and internal compliance policies that impact our business. On a company-wide basis, we pursue these goals through education of our employees to promote awareness, incentives that align employees’ interests with those of our clients, and a range of measures, including active monitoring, to ensure regulatory compliance.
Research
The foundation of our investment management process is our high-quality, in-depth research. We believe that having more knowledge, and using that knowledge better than other market participants, gives us a competitive advantage in achieving investment success for our clients.
Our research disciplines include bottom-up, fundamental research, quantitative research, economic research, and currency forecasting capabilities. In addition, we have created several specialist research units over the past two years, including one unit that examines global strategic changes that can impact multiple industries and geographies, and another dedicated to identifying potentially successful innovations within early-stage companies.
1
Products and Services
We offer a broad range of investment products and services in which our clients can invest:
• To our institutional clients, we offer separately managed accounts, sub-advisory relationships, structured products, group trusts, mutual funds, and other investment vehicles (“Institutional Investment Services”);
• To our retail clients, we offer retail mutual funds sponsored by AllianceBernstein, our subsidiaries, and our affiliated joint venture companies, sub-advisory relationships in respect of mutual funds sponsored by third parties, separately managed account programs that are sponsored by registered broker-dealers (“Separately Managed Account Programs”), and other investment vehicles (“Retail Services”);
• To our private clients, we offer separately managed accounts, hedge funds, mutual funds, and other investment vehicles (“Private Client Services”); and
• To our institutional investors seeking institutional research, we offer in-depth research, portfolio strategy, trading, and brokerage-related services (“Institutional Research Services”).
This broad range of investment services is managed by a group of investment professionals with significant expertise in their respective disciplines. As of December 31, 2005, our clients’ assets were managed by 169 portfolio managers with an average of 14 years of experience in the industry and seven years of experience with AllianceBernstein. These portfolio managers oversee a number of different types of investment products within various vehicles and strategies, including separately managed accounts, mutual funds, hedge funds, structured products, and other investment vehicles. Our investment strategies include:
• Growth and value equity, the two predominant equity strategies;
• Blend, combining growth and value equity components and systematic rebalancing between the two;
• Fixed income, including both taxable and tax-exempt securities;
• Balanced, combining equity and fixed income components; and
• Passive, including both index and enhanced index strategies.
We manage these strategies using various investment disciplines, including market capitalization (e.g., large-, mid-, and small-cap equities), term (e.g., long-, intermediate-, and short-duration debt securities), and geographic location (e.g., U.S., international, global, and emerging markets), as well as local and regional disciplines in major markets around the world.
Blend strategies have become an increasingly important component of our product line. As of December 31, 2005, blend AUM were $85 billion (representing 15% of our company-wide AUM), up 63% from $52 billion on December 31, 2004 and 143% from $35 billion on December 31, 2003.
Sub-advisory client mandates span our investment strategies, including growth, value, blend, and fixed income. We serve as sub-adviser for retail products, insurance products, retirement platforms, and institutional investors. Dedicated marketing and client servicing professionals are responsible for servicing these relationships.
Global Reach
We serve clients in major global markets through operations in 44 cities in 23 countries. Our client base includes investors throughout the Americas, Europe, Asia, Africa, and Australia. We are committed to an integrated global investment platform so that our clients everywhere have access to local (country-specific), international, and global research and investment strategies.
2
AUM by client domicile and investment strategy as of December 31, 2005, 2004, and 2003 were as follows:
By Client Domicile ($ in billions): | | |
| | |
| 
| 
|
December 31, 2005 | December 31, 2004 | December 31, 2003 |
| | |
By Investment Strategy ($ in billions): | | |
| | |

| 
| 
|
December 31, 2005 | December 31, 2004 | December 31, 2003 |
As the above charts indicate, we have significantly enhanced our international client base and product mix over the last three years. We increased our international client base by 30% during 2005 and 27% during 2004 and, likewise, we increased our global and international AUM by 38% during 2005 and 42% during 2004. In addition, approximately 69%, 51%, and 50% of our company-wide gross asset inflows during 2005, 2004, and 2003, respectively, were invested in global and international investment products.
Revenues
We earn revenues by charging fees for managing the investment assets of our clients. We generally calculate fees as a percentage of the value of AUM, with such fees varying by type of investment strategy and discipline, size of account, and total amount of assets we manage for a particular client. Accordingly, fee income generally increases or decreases as AUM increase or decrease. Increases in assets under management generally result from market appreciation, positive investment performance, or net asset inflows from new or existing clients. Similarly, decreases in assets under management generally result from market depreciation, negative investment performance, or net asset outflows due to client redemptions, account terminations, or asset withdrawals.
We sometimes charge a performance-based fee, in addition to or in lieu of a base fee. Performance-based fees are calculated as either a percentage of absolute investment results or a percentage of investment results in excess of a stated benchmark over a specified period of time. Performance-based fees are recorded as revenue at the end of the measurement period and will be higher in favorable markets and lower in unfavorable markets, which may increase the volatility of our revenues and earnings.
3
We sometimes experience periods when the number of new accounts or the amounts of AUM increase significantly, as well as periods when our accounts or AUM have decreased significantly. These shifts result from wide-ranging factors, including conditions of financial markets, our investment performance, and changes in the investment preferences of clients.
Employees
As of December 31, 2005, we had 4,312 full-time employees, including 619 investment professionals, of whom 169 were portfolio managers, 361 were research analysts, 60 were order placement specialists, and 29 were professionals with other investment-related responsibilities. We have employed these professionals for an average period of approximately seven years, and their average investment experience is approximately 14 years. We consider our employee relations to be good.
Institutional Investment Services
We serve our institutional clients through AllianceBernstein Institutional Investments, a unit of AllianceBernstein, and through other units in our international subsidiaries and affiliates. Institutional Investment Services include actively managed equity accounts (including growth, value, and blend accounts), fixed income accounts, and balanced accounts, as well as passive management of index and enhanced index accounts. These services are provided through separately managed accounts, sub-advisory relationships, structured products, group trusts, mutual funds, and other investment vehicles. As of December 31, 2005, institutional assets under management were $359 billion, or 62% of our company-wide assets under management. For more information concerning institutional assets under management, revenues, and fees, see “Assets Under Management, Revenues, and Fees” in this Item 1.
Our institutional client base includes unaffiliated corporate and public employee pension funds, endowment funds, domestic and foreign institutions and governments, and various affiliates, as well as certain sub-advisory relationships with unaffiliated sponsors of various other investment products. We manage approximately 3,450 separate accounts for these clients, which are located in more than 40 countries. As of December 31, 2005, we managed employee benefit plan assets for 37 of the Fortune 100 companies, and we managed public pension fund assets for 37 states.
Our efforts to create an integrated global investment platform are most evident in our institutional investment channel. As of December 31, 2005, our institutional assets under management invested in global and international investment services increased to $172 billion, or 48% of institutional AUM, from $123 billion, or 39% of institutional AUM, as of December 31, 2004, and from $78 billion, or 29% of institutional AUM, as of December 31, 2003. Similarly, as of December 31, 2005, the assets under management we invested for clients domiciled outside the United States increased to $137 billion, or 38% of institutional AUM, from $103 billion, or 33% of institutional AUM, as of December 31, 2004, and from $77 billion, or 29% of institutional AUM, as of December 31, 2003.
Relationship managers, based in 11 offices around the world, work with institutional clients and prospective clients to determine their financial goals and needs, while specialist marketers, located in New York, London, and Tokyo, offer clients specific investment products and services to meet their overall financial plans.
Retail Services
Through financial intermediaries, we provide investment management and related services to a wide variety of individual retail investors, both in the U.S. and internationally, through retail mutual funds sponsored by our company, our subsidiaries and affiliated joint venture companies; sub-advisory relationships with mutual funds sponsored by third parties; Separately Managed Account Programs; and other investment vehicles (“Retail Products”). As of December 31, 2005, retail AUM, which are determined by subtracting applicable liabilities from the value of AUM, were $145 billion, or 25% of our company-wide AUM. For more information concerning retail AUM, revenues, and fees, see “Assets Under Management, Revenues, and Fees” in this Item 1.
4
Our Retail Services are designed to provide disciplined, research-based investments that play a consistent and effective role in a well-diversified investment portfolio. We distribute our Retail Products through a number of financial intermediaries, including broker-dealers, insurance sales representatives, banks, registered investment advisers, and financial planners.
Among our Retail Products are open-end and closed-end funds that are either (i) registered as investment companies under the Investment Company Act (“U.S. Funds”), or (ii) not registered under the Investment Company Act and not publicly offered to United States persons (“Non-U.S. Funds” and collectively with the U.S. Funds, “AllianceBernstein Funds”). Our Retail Products provide a broad range of investment options, including local and global growth equities, value equities, blend, and fixed income securities. Also among these products are retail Separately Managed Account Programs, which are sponsored by various registered broker-dealers and generally charge an all-inclusive fee covering investment management, trade execution, asset allocation, and custodial and administrative services. We also provide distribution, shareholder servicing, and administrative services for our Retail Products.
AllianceBernstein Investments, Inc., a wholly-owned subsidiary of AllianceBernstein, serves as the principal underwriter and distributor of U.S. Funds and as a placing or distribution agent for most of the Non-U.S. Funds. AllianceBernstein Investments employs approximately 185 sales representatives who devote their time exclusively to promoting the sale of Retail Services by financial intermediaries. AllianceBernstein Investments services approximately 3.9 million shareholder accounts globally.
Our efforts to create an integrated global investment platform are applicable to our retail channel as well, although in 2005 the increased global and international share of our total retail assets under management is due more to the disposition of our cash management services (see Note 20 in AllianceBernstein’s consolidated financial statements in Item 8) than to expansion abroad. As of December 31, 2005, our retail AUM invested in global and international investment services increased to $65 billion, or 45% of retail AUM, from $48 billion, or 29% of retail AUM, as of December 31, 2004, and from $42 billion, or 27% of retail AUM, as of December 31, 2003. Similarly, as of December 31, 2005, the AUM we invested for retail clients domiciled outside the United States increased to $39 billion, or 27% of retail AUM, from $32 billion, or 19% of retail AUM, as of December 31, 2004, and $29 billion, or 18% of retail AUM, as of December 31, 2003.
Our Non-U.S. Funds, which represented $36 billion, or 25% of our total Retail assets under management (excluding certain investment vehicles, as discussed below) as of December 31, 2005, include:
• Internationally-distributed funds that offer more than 27 different portfolios to non-U.S. investors distributed through local financial intermediaries by means of distribution agreements in most major international markets (AUM in these funds totaled $21 billion as of December 31, 2005); and
• Local-market funds that we distribute through financial intermediaries in specific countries, including Japan, Singapore, and Taiwan (our most successful local offerings to date have been in Japan where, as of December 31, 2005, AUM in our local Japanese funds totaled $5.4 billion).
Our Non-U.S. Funds also include hedge funds, which we market and distribute to high-net-worth and institutional investors globally, and various types of structured products (e.g., collateralized bond obligations), which we market and distribute to institutional investors globally. We report hedge fund AUM, which totaled $4.6 billion as of December 31, 2005, as either Institutional Investment AUM ($0.8 billion) or Private Client AUM ($3.8 billion). We report structured product AUM, which totaled $4.0 billion as of December 31, 2005, as Institutional Investment AUM.
Our U.S. Funds, which include retail funds, our variable products series fund (an insurance product), and the Sanford C. Bernstein Funds (Private Client Services products), offer approximately 120 different portfolios to U.S. investors. As of December 31, 2005, assets under management in the retail U.S. Funds were approximately $44 billion, or 30% of total Retail AUM. We report nearly all of the AUM in the Sanford C. Bernstein Funds, which totaled $22.2 billion as of December 31, 2005, as Private Client Services AUM.
In 2003, we began offering the AllianceBernstein Wealth Strategies portfolios, which offer investments in various combinations of U.S. and non-U.S. growth equity, value equity, and fixed income securities (with automatic re-balancing of securities), providing diversified solutions for meeting the risk and return appetites of retail
5
investors. As of December 31, 2005, assets under management in the Wealth Strategies portfolios were $3.1 billion.
Cash Management Services
During June 2005, AllianceBernstein and Federated Investors, Inc (“Federated”) completed a transaction pursuant to which Federated acquired our cash management services. For additional information, see Note 20 in AllianceBernstein’s consolidated financial statements in Item 8.
Private Client Services
Bernstein Global Wealth Management (“Bernstein GWM”), a unit of AllianceBernstein, combines the former private client services group of Bernstein, which has served private clients for over 35 years, and the former private client group of AllianceBernstein. As of December 31, 2005, private client assets under management were $75 billion, or 13% of our company-wide assets under management. For more information concerning private client assets under management, revenues, and fees, see “Assets Under Management, Revenues, and Fees” in this Item 1.
Through Bernstein GWM, we provide Private Client Services to high-net-worth individuals, trusts and estates, charitable foundations, partnerships, private and family corporations, and other entities by means of separately managed accounts, hedge funds, mutual funds, and other investment vehicles. We target households with financial assets of $1 million or more, and we have a minimum opening account size of $400,000.
Our private client activities are built on a direct sales effort that involves approximately 260 financial advisors. These advisors do not manage money, but work with private clients and their tax, legal, and other advisors to assist clients in determining a suitable mix of U.S. and non-U.S. equity securities and fixed income investments. The portfolio created for each client is intended to maximize after-tax investment returns, in light of the client’s individual investment goals, income requirements, risk tolerance, tax considerations, and any other factors relevant for that client. Our private clients have access to all of our resources, including research reports, investment planning services, an extensive nationwide referral network, including accountants, attorneys, and consultants, and our Wealth Management Group, which has in-depth knowledge of trust and estate and tax management issues.
Our financial advisors are based in 18 cities in the U.S., including New York City, Atlanta, Boston, Chicago, Cleveland, Dallas, Denver, Houston, Los Angeles, Miami, Minneapolis, Philadelphia, San Diego (newly-opened in January 2006), San Francisco, Seattle, Tampa, Washington, D.C., and West Palm Beach. We plan to open an office in London later this year. These offices service the targeted market within these cities and the surrounding areas. In addition, Bernstein GWM added 70 financial advisors in 2005, and plans to add an additional 27 advisors in 2006.
We have made significant strides with non-U.S. investment services in the private client channel as well. As of December 31, 2005, our private client assets under management invested in global and international investment services increased to $20 billion, or 26% of private client AUM, from $14 billion, or 22% of Private Client Services AUM, as of December 31, 2004, and from $10 billion, or 19% of private client AUM, as of December 31, 2003. When measured by client domicile, there has been little change thus far in Private Client Services AUM, but we believe our launch of a private client office in London later this year will enhance our ability to reach non-U.S. clients.
Institutional Research Services
Institutional Research Services consist of in-depth research, portfolio strategy, trading and brokerage-related services provided to institutional investors such as pension funds, mutual fund managers, asset managers, and other institutional investors. Trade execution and brokerage-related services are provided by Sanford C. Bernstein & Co., LLC (our wholly-owned subsidiary, “SCB LLC”) in the United States and Sanford C. Bernstein Limited (our wholly-owned subsidiary, “SCBL”) in Europe, Australia, and Asia. As of December 31, 2005, SCB LLC and SCBL (together, “SCB”) served approximately 1,200 clients in the U.S. and approximately 365 clients in Europe, Australia, and Asia. For more information concerning the revenues we derive from institutional research services, see “Assets Under Management, Revenues, and Fees” in this Item 1.
6
SCB provides in-depth company and industry reports, along with disciplined research into securities valuation and the factors affecting stock-price movements. Company and industry analysts in most cases have business experience in the industries they cover and are consistently among the highest ranked sell-side research analysts in industry surveys by third-party organizations. Along with quantitative analysts and portfolio strategists, our sell-side research team totals approximately 140 people, including 50 senior analysts.
In 2005, SCB further strengthened its research effort in London and now has 10 published analysts covering industries and companies in Europe, with nine additional analysts due to commence coverage in 2006. In addition, SCB’s trading and brokerage operations were further enhanced in 2005 with the launch of several proprietary algorithmic trading products. These product additions complemented other major changes already undertaken to transform our trading capability, including the launch of a dedicated sector block trading desk and the expansion of our product specialist team.
Assets Under Management, Revenues, and Fees
The following tables summarize our AUM by distribution channel, along with associated revenues:
Assets Under Management(1)(2)
| | December 31, | | % Change | |
| | 2005 | | 2004 | | 2003 | | 2005-04 | | 2004-03 | |
| | | | (in millions) | | | | | | | |
Institutional Investment Services | | $ | 358,545 | | $ | 309,883 | | $ | 267,241 | | 15.7 | % | 16.0 | % |
Retail Services | | 145,134 | | 134,882 | | 125,051 | | 7.6 | | 7.9 | |
Private Client Services | | 74,873 | | 63,600 | | 53,236 | | 17.7 | | 19.5 | |
| | 578,552 | | 508,365 | | 445,528 | | 13.8 | | 14.1 | |
Dispositions(3) | | — | | 30,399 | | 31,739 | | (100.0 | ) | (4.2 | ) |
Total | | $ | 578,552 | | $ | 538,764 | | $ | 477,267 | | 7.4 | % | 12.9 | % |
(1) | Excludes certain non-discretionary client relationships and assets managed by unconsolidated affiliates. |
(2) | Starting in 2005, we revised the way we classified our assets under management to better align publicly reported AUM with our internal reporting, and for consistency, our AUM as of December 31, 2004 and previous years have been reclassified by investment service and distribution channel, including the fixed income portions of balanced accounts previously reported in equity. |
(3) | Includes assets related to cash management services, South African joint venture interest, and Indian mutual funds. For information about these dispositions, see Note 20 in AllianceBernstein’s consolidated financial statements in Item 8. |
Revenues(1)
| | Years Ended December 31, | | % Change | |
| | 2005 | | 2004 | | 2003 | | 2005-04 | | 2004-03 | |
| | | | (in thousands) | | | | | | | |
Institutional Investment Services(2) | | $ | 904,758 | | $ | 755,279 | | $ | 644,441 | | 19.8 | % | 17.2 | % |
Retail Services | | 1,192,059 | | 1,294,267 | | 1,306,475 | | (7.9 | ) | (0.9 | ) |
Private Client Services(2) | | 691,208 | | 627,067 | | 493,903 | | 10.2 | | 27.0 | |
Institutional Research Services | | 321,281 | | 303,609 | | 267,868 | | 5.8 | | 13.3 | |
Other | | 141,374 | | 75,211 | | 52,241 | | 88.0 | | 44.0 | |
Total | | $ | 3,250,680 | | $ | 3,055,433 | | $ | 2,764,928 | | 6.4 | % | 10.5 | % |
(1) Certain prior-year amounts have been reclassified to conform to our 2005 presentation: we reclassified (i) certain sub-accounting payments and networking fees from other promotion and servicing expense to shareholder servicing fees, and (ii) transaction charges paid by our sponsored mutual funds from Institutional Investment Services and Private Client Services to Retail Services.
(2) Includes performance-based fees, incentive allocations or carried interests we earn for managing hedge funds and certain other investment vehicles.
AXA Financial, AXA Equitable, and our other affiliates, whose AUM consist primarily of fixed income investments, together constitute our largest client. Our affiliates represented approximately 19%, 20%, and 18% of our company-wide AUM as of December 31, 2005, 2004, and 2003,
7
respectively. They also represented approximately 5% of our company-wide revenues for each of 2005, 2004, and 2003. We manage our affiliates’ assets as part of our Institutional Investment Services and Retail Services.
Institutional Investment Services
The following tables summarize our Institutional Investment Services assets under management, along with associated revenues:
Institutional Investment Services Assets Under Management(1)
(by Investment Service)
| | December 31, | | % Change | |
| | 2005 | | 2004 | | 2003 | | 2005-04 | | 2004-03 | |
| | | | (in millions) | | | | | | | |
Growth Equity: | | | | | | | | | | | |
U.S. | | $ | 39,721 | | $ | 39,600 | | $ | 51,990 | | 0.3 | % | (23.8 | )% |
Global and International | | 39,327 | | 23,326 | | 15,716 | | 68.6 | | 48.4 | |
| | 79,048 | | 62,926 | | 67,706 | | 25.6 | | (7.1 | ) |
Value Equity: | | | | | | | | | | | |
U.S. | | 50,556 | | 51,006 | | 45,945 | | (0.9 | ) | 11.0 | |
Global and International | | 101,791 | | 68,595 | | 42,876 | | 48.4 | | 60.0 | |
| | 152,347 | | 119,601 | | 88,821 | | 27.4 | | 34.7 | |
Fixed Income: | | | | | | | | | | | |
U.S. | | 74,964 | | 77,314 | | 72,752 | | (3.0 | ) | 6.3 | |
Global and International | | 27,709 | | 25,859 | | 14,009 | | 7.2 | | 84.6 | |
| | 102,673 | | 103,173 | | 86,761 | | (0.5 | ) | 18.9 | |
Index / Structured: | | | | | | | | | | | |
U.S. | | 20,908 | | 19,297 | | 18,403 | | 8.3 | | 4.9 | |
Global and International | | 3,569 | | 4,886 | | 5,550 | | (27.0 | ) | (12.0 | ) |
| | 24,477 | | 24,183 | | 23,953 | | 1.2 | | 1.0 | |
Total: | | | | | | | | | | | |
U.S. | | 186,149 | | 187,217 | | 189,090 | | (0.6 | ) | (1.0 | ) |
Global and International | | 172,396 | | 122,666 | | 78,151 | | 40.5 | | 57.0 | |
| | 358,345 | | 309,883 | | 267,241 | | 15.7 | | 16.0 | |
Dispositions(2) | | — | | 1,375 | | 555 | | (100.0 | ) | 147.7 | |
Total | | $ | 358,545 | | $ | 311,258 | | $ | 267,796 | | 15.2 | % | 16.2 | % |
(1) Excludes certain non-discretionary client relationships and assets managed by unconsolidated affiliates.
(2) Includes assets related to South African joint venture interest. For information about this disposition, see Note 20 in AllianceBernstein’s consolidated financial statements in Item 8.
8
Revenues From Institutional Investment Services(1)
(by Investment Service)
| | Years Ended December 31, | | % Change | |
| | 2005 | | 2004 | | 2003 | | 2005-04 | | 2004-03 | |
| | | | (in thousands) | | | | | | | |
Investment Advisory and Services Fees: | | | | | | | | | | | |
Growth Equity: | | | | | | | | | | | |
U.S. | | $ | 126,083 | | $ | 141,891 | | $ | 164,638 | | (11.1 | )% | (13.8 | )% |
Global and International | | 115,982 | | 68,240 | | 42,061 | | 70.0 | | 62.2 | |
| | 242,065 | | 210,131 | | 206,699 | | 15.2 | | 1.7 | |
Value Equity: | | | | | | | | | | | |
U.S. | | 162,708 | | 178,058 | | 169,675 | | (8.6 | ) | 4.9 | |
Global and International | | 364,480 | | 219,532 | | 127,726 | | 66.0 | | 71.9 | |
| | 527,188 | | 397,590 | | 297,401 | | 32.6 | | 33.7 | |
Fixed Income: | | | | | | | | | | | |
U.S. | | 94,596 | | 110,184 | | 108,348 | | (14.1 | ) | 1.7 | |
Global and International | | 28,965 | | 25,668 | | 20,760 | | 12.8 | | 23.6 | |
| | 123,561 | | 135,852 | | 129,108 | | (9.0 | ) | 5.2 | |
Index / Structured: | | | | | | | | | | | |
U.S. | | 6,432 | | 6,942 | | 6,341 | | (7.3 | ) | 9.5 | |
Global and International | | 5,083 | | 4,764 | | 4,892 | | 6.7 | | (2.6 | ) |
| | 11,515 | | 11,706 | | 11,233 | | (1.6 | ) | 4.2 | |
Total Investment Advisory and Services Fees: | | | | | | | | | | | |
U.S. | | 389,819 | | 437,075 | | 449,002 | | (10.8 | ) | (2.7 | ) |
Global and International | | 514,510 | | 318,204 | | 195,439 | | 61.7 | | 62.8 | |
| | 904,329 | | 755,279 | | 644,441 | | 19.7 | | 17.2 | |
Distribution Revenues | | 429 | | — | | — | | n/m | | — | |
Total | | $ | 904,758 | | $ | 755,279 | | $ | 644,441 | | 19.8 | % | 17.2 | % |
(1) Certain prior-year amounts have been reclassified to conform to our 2005 presentation: we reclassified transaction charges paid by our sponsored mutual funds from Institutional Investment Services and Private Client Services to Retail Services.
As of December 31, 2005, 2004, and 2003, Institutional Investment Services represented approximately 62%, 58%, and 56%, respectively, of our company-wide assets under management. The fees we earned from these services represented approximately 28%, 25%, and 23% of our company-wide revenues for 2005, 2004, and 2003, respectively.
As part of our Institutional Investment Services, we manage assets for AXA and its subsidiaries, which together constitute our largest institutional client. These assets accounted for approximately 18%, 20%, and 19% of our total institutional assets under management as of December 31, 2005, 2004, and 2003, respectively, and approximately 8%, 9%, and 10% of our total institutional revenues for 2005, 2004, and 2003, respectively.
The institutional assets we manage for our affiliates, along with our nine other largest institutional accounts, made up approximately 20% of our total company-wide assets under management as of December 31, 2005 and approximately 4% of our total company-wide revenues for the year ended December 31, 2005. No single institutional client other than AXA and its subsidiaries accounted for more than approximately 1% of our company-wide revenues for the year ended December 31, 2005.
We manage each institutional account pursuant to a written investment management agreement. Each agreement is usually terminable at any time or upon relatively short notice by either party. In general, our contracts may not be assigned without client consent.
We are compensated principally on the basis of management fees calculated as a percentage of assets under management. The percentage we charge varies with the type of portfolio strategy, the size of the account, and the total amount of assets we manage for a particular client.
9
We charge performance-based fees on approximately 16% of institutional assets under management. Performance-based fees provide for a relatively low base fee plus an additional fee based on investment performance.
Retail Services
The following tables summarize our Retail Services assets under management, along with associated revenues:
Retail Services Assets Under Management(1)
(by Investment Service)
| | December 31, | | % Change | |
| | 2005 | | 2004 | | 2003 | | 2005-04 | | 2004-03 | |
| | | | (in millions) | | | | | | | |
Growth Equity: | | | | | | | | | | | |
U.S. | | $ | 31,193 | | $ | 33,436 | | $ | 32,988 | | (6.7 | )% | 1.4 | % |
Global and International | | 19,523 | | 14,670 | | 14,579 | | 33.1 | | 0.6 | |
| | 50,716 | | 48,106 | | 47,567 | | 5.4 | | 1.1 | |
Value Equity: | | | | | | | | | | | |
U.S. | | 32,625 | | 32,113 | | 28,384 | | 1.6 | | 13.1 | |
Global and International | | 16,575 | | 8,600 | | 3,961 | | 92.7 | | 117.1 | |
| | 49,200 | | 40,713 | | 32,345 | | 20.8 | | 25.9 | |
Fixed Income: | | | | | | | | | | | |
U.S. | | 12,053 | | 17,076 | | 18,232 | | (29.4 | ) | (6.3 | ) |
Global and International | | 27,648 | | 23,742 | | 22,446 | | 16.5 | | 5.8 | |
| | 39,701 | | 40,818 | | 40,678 | | (2.7 | ) | 0.3 | |
Index / Structured: | | | | | | | | | | | |
U.S. | | 4,230 | | 4,203 | | 3,584 | | 0.6 | | 17.3 | |
Global and International | | 1,287 | | 1,042 | | 877 | | 23.5 | | 18.8 | |
| | 5,517 | | 5,245 | | 4,461 | | 5.2 | | 17.6 | |
Total: | | | | | | | | | | | |
U.S. | | 80,101 | | 86,828 | | 83,188 | | (7.7 | ) | 4.4 | |
Global and International | | 65,033 | | 48,054 | | 41,863 | | 35.3 | | 14.8 | |
| | 145,134 | | 134,882 | | 125,051 | | 7.6 | | 7.9 | |
Dispositions(2) | | — | | 28,670 | | 30,827 | | (100.0 | ) | (7.0 | ) |
Total | | $ | 145,134 | | $ | 163,552 | | $ | 155,878 | | (11.3 | )% | 4.9 | % |
(1) Excludes assets managed by unconsolidated affiliates.
(2) Includes assets related to cash management services and Indian mutual funds. For information about these dispositions, see Note 20 in AllianceBernstein’s consolidated financial statements in Item 8.
10
Revenues From Retail Services(1)
(by Investment Service)
| | Years Ended December 31, | | % Change | |
| | 2005(2) | | 2004(2) | | 2003 | | 2005-04 | | 2004-03 | |
| | | | (in thousands) | | | | | | | |
Investment Advisory and Services Fees: | | | | | | | | | | | |
Growth Equity: | | | | | | | | | | | |
U.S. | | $ | 142,899 | | $ | 155,518 | | $ | 173,268 | | (8.1 | )% | (10.2 | )% |
Global and International | | 118,574 | | 102,076 | | 104,324 | | 16.2 | | (2.2 | ) |
| | 261,473 | | 257,594 | | 277,592 | | 1.5 | | (7.2 | ) |
Value Equity: | | | | | | | | | | | |
U.S. | | 120,744 | | 118,619 | | 109,074 | | 1.8 | | 8.8 | |
Global and International | | 64,881 | | 28,774 | | 13,519 | | 125.5 | | 112.8 | |
| | 185,625 | | 147,393 | | 122,593 | | 25.9 | | 20.2 | |
Fixed Income: | | | | | | | | | | | |
U.S. | | 112,335 | | 182,865 | | 209,785 | | (38.6 | ) | (12.8 | ) |
Global and International | | 132,480 | | 141,211 | | 132,952 | | (6.2 | ) | 6.2 | |
| | 244,815 | | 324,076 | | 342,737 | | (24.5 | ) | (5.4 | ) |
Index / Structured: | | | | | | | | | | | |
U.S. | | 1,746 | | 1,663 | | 1,253 | | 5.0 | | 32.7 | |
Global and International | | 3,640 | | 1,651 | | 1,212 | | 120.5 | | 36.2 | |
| | 5,386 | | 3,314 | | 2,465 | | 62.5 | | 34.4 | |
Total Investment Advisory and Services Fees: | | | | | | | | | | | |
U.S. | | 377,724 | | 458,665 | | 493,380 | | (17.6 | ) | (7.0 | ) |
Global and International | | 319,575 | | 273,712 | | 252,007 | | 16.8 | | 8.6 | |
| | 697,299 | | 732,377 | | 745,387 | | (4.8 | ) | (1.7 | ) |
Distribution Revenues(3) | | 395,402 | | 445,911 | | 434,705 | | (11.3 | ) | 2.6 | |
Shareholder Servicing Fees(3) | | 99,358 | | 115,979 | | 126,383 | | (14.3 | ) | (8.2 | ) |
Total | | $ | 1,192,059 | | $ | 1,294,267 | | $ | 1,306,475 | | (7.9 | )% | (0.9 | )% |
(1) Certain prior-year amounts have been reclassified to conform to our 2005 presentation: we reclassified (i) certain sub-accounting payments and networking fees from other promotion and servicing expense to shareholder servicing fees, and (ii) transaction charges paid by our sponsored mutual funds from Institutional Investment Services and Private Client Services to Retail Services.
(2) Includes a reduction in advisory fees charged to certain U.S. Funds in connection with the resolution of market timing matters. For additional information, see “Regulation” in this Item 1.
(3) For a description of distribution revenues and shareholder servicing fees, see below.
We generally base our fees for our Retail Products on a percentage of average assets under management. We may also charge performance-based fees. As certain of the U.S. Funds have grown, we have revised our fee schedules to provide lower incremental fees above certain asset levels. In addition, as part of our resolution of the market timing investigation by the New York State Attorney General (“NYAG”), effective January 1, 2004 we reduced by 20% (on a weighted average basis) the advisory fees on U.S. long-term open-end retail mutual funds (for additional information, see “Regulation” in this Item 1). Fees paid by the U.S. Funds, EQAT (as defined below), AXA Enterprise Trust, and AXA Premier VIP Trust are reflected in the applicable investment management agreement and reviewed annually by the boards of directors or trustees of those funds, including by a majority of the independent directors or trustees. Increases in these fees must be approved by fund shareholders. Fees paid by Non-U.S. Funds are reflected in investment management agreements that continue until they are terminated. Increases in these fees must generally be approved by the Non-U.S. Fund shareholders and/or the relevant regulatory authority depending on the domicile and structure of the fund. In general, each investment management agreement with the AllianceBernstein Funds, EQAT, AXA Enterprise Trust, and AXA Premier VIP Trust provides for termination by either party at any time upon 60 days’ notice.
Our Retail Products include variable products, which are open-end mutual funds designed to fund variable annuity contracts and variable life insurance policies offered by the separate accounts of life insurance companies (“Variable Products”). We manage the AllianceBernstein Variable Products Series Fund, Inc. (“ABVPS”), which serves as the investment vehicle for insurance products offered by unaffiliated insurance companies, and we sub-advise EQ Advisors Trust (“EQAT”), AXA Enterprise Multimanager Funds Trust (formerly known as AXA
11
Premier Trust, “AXA Enterprise Trust”), AXA Premier VIP Trust, and mutual funds sponsored by AXA Asia Pacific Holdings Limited and its subsidiaries (“AXA Asia Pacific”). Each of these sub-advised vehicles serves as an investment vehicle for insurance products offered by AXA Equitable and its insurance company affiliates. As of December 31, 2005, the AUM of the portfolios of the Variable Products totaled approximately $51 billion.
EQAT, AXA Enterprise Trust, AXA Premier VIP Trust, and the mutual funds sponsored by AXA Asia Pacific, together with other AXA affiliates, constitute our largest retail client. They accounted for approximately 29%, 26%, and 24% of our total retail AUM as of December 31, 2005, 2004, and 2003, respectively, and approximately 9%, 7%, and 6% of our total retail revenues for 2005, 2004 and 2003, respectively.
Our mutual fund distribution system (the “System”) includes a multi-class share structure that permits open-end AllianceBernstein Funds to offer investors various options for the purchase of mutual fund shares, including both front-end load shares and back-end load shares. For front-end load shares of the open-end U.S. Funds, AllianceBernstein Investments pays sales commissions to financial intermediaries distributing the funds from the front-end sales charge it receives from investors at the time of the sale. For back-end load shares, AllianceBernstein Investments pays sales commissions to financial intermediaries at the time of sale and also receives higher ongoing distribution services fees from the mutual funds. In addition, investors who redeem back-end load shares before the expiration of the minimum holding period (which ranges from one year to four years) pay a contingent deferred sales charge (“CDSC”) to AllianceBernstein Investments. We expect to recover deferred sales commissions over periods not exceeding five and one-half years through receipt of a CDSC and/or the higher ongoing distribution services fees we receive from holders of back-end load shares. Payments of sales commissions made to financial intermediaries in connection with the sale of back-end load shares under the System, net of CDSC received of $21.4 million and $32.9 million, totaled approximately $74.2 million and $44.6 million during 2005 and 2004, respectively.
The rules of the National Association of Securities Dealers, Inc. (“NASD”) effectively cap the aggregate sales charges received by AllianceBernstein Investments. The cap is 6.25% of cumulative gross sales (plus interest at the prime rate plus 1% per annum) in each share class of the open-end U.S. Funds.
Most open-end U.S. Funds have adopted a plan under Rule 12b-1 of the Investment Company Act that allows the fund to pay, out of assets of the fund, asset-based sales charges or distribution and service fees for the distribution and sale of its shares (“Rule 12b-1 Fees”). The open-end AllianceBernstein Funds have entered into agreements with AllianceBernstein Investments under which they pay a distribution services fee. AllianceBernstein Investments and the financial intermediaries have entered into selling and distribution agreements for the distribution of AllianceBernstein Funds pursuant to which AllianceBernstein Investments pays sales commissions. These agreements are terminable by either party upon notice (generally not more than 60 days) and do not obligate the financial intermediary to sell any specific amount of fund shares. A small amount of mutual fund sales is made directly by AllianceBernstein Investments, in which case AllianceBernstein Investments retains the entire sales charge.
In addition to Rule 12b-1 Fees, AllianceBernstein Investments, at its own expense, currently provides additional payments under Distribution Services and Educational Support agreements to firms that sell shares of our funds, a practice sometimes referred to as revenue sharing. Although the individual components may be higher and the total amount of payments made to each qualifying firm in any given year may vary, the total amount paid to a financial intermediary in connection with the sale of shares of U.S. Funds will generally not exceed the sum of (i) 0.25% of the current year’s fund sales by that firm, and (ii) 0.10% of average daily net assets attributable to that firm over the course of the year. These sums may be associated with our funds’ status on a financial intermediary’s preferred list of funds or may be otherwise associated with the financial intermediary’s marketing and other support activities, such as client education meetings and training efforts relating to our funds.
During 2005, the 10 financial intermediaries responsible for the largest volume of sales of open-end AllianceBernstein Funds were responsible for 30% of such sales. AXA Advisors, LLC (“AXA Advisors”), a wholly-owned subsidiary of AXA Financial that utilizes members of AXA Equitable’s insurance sales force as its registered representatives, was responsible for approximately 3%, 4%, and 3% of total sales of shares of open-end AllianceBernstein Funds in 2005, 2004, and 2003, respectively. AXA Advisors is under no obligation to sell
12
a specific amount of AllianceBernstein Fund shares and also sells shares of mutual funds sponsored by other affiliates and unaffiliated organizations.
Subsidiaries of Merrill Lynch & Co., Inc. (collectively “Merrill Lynch”) were responsible for approximately 5%, 6%, and 7% of open-end AllianceBernstein Fund sales in 2005, 2004, and 2003, respectively. Citigroup Inc. (and its subsidiaries, “Citigroup”) was responsible for approximately 5% of open-end AllianceBernstein Fund sales in 2005, 7% in 2004, and 9% in 2003. Neither Merrill Lynch nor Citigroup is under any obligation to sell a specific amount of AllianceBernstein Fund shares and each also sells shares of mutual funds that it sponsors and that are sponsored by unaffiliated organizations.
No dealer or agent has in any year since 2003 accounted for more than 10% of our sales of shares of open-end AllianceBernstein Funds.
Based on industry sales data reported by the Investment Company Institute (December 2005), our market share in the U.S. mutual fund industry is 1.11% of total industry assets and we accounted for 0.65% of total open-end industry sales in the U.S. during 2005. The investment performance of the U.S. Funds is an important factor in the sale of their shares, but there are other factors contributing to sales of our mutual fund shares. These factors include the level and quality of shareholder services (see below) and the amounts and types of distribution assistance and administrative services payments made to financial intermediaries. We believe that our compensation programs with financial intermediaries are competitive with others in the industry.
Under current interpretations of U.S. laws and regulations governing depository institutions, banks and certain of their affiliates generally are permitted to act as agent for their customers in connection with the purchase of mutual fund shares and to receive as compensation a portion of the sales charges paid with respect to such purchases. During 2005, banks and their affiliates accounted for approximately 17% of the sales of shares of open-end U.S. Funds and Variable Products.
During 2004, each of the U.S. Funds appointed an independent compliance officer reporting to the independent directors of each U.S. Fund. The expense of this officer and his staff is borne by AllianceBernstein.
AllianceBernstein Investor Services, Inc. (“Investor Services”), one of our wholly-owned subsidiaries, provides transfer agency and related services for each open-end U.S. Fund and provides shareholder servicing for each open-end U.S. Fund’s shareholder accounts. As of December 31, 2005, Investor Services employed 247 people. Investor Services operates in Secaucus, New Jersey, and San Antonio, Texas. It receives a monthly fee under each of its servicing agreements with the open-end U.S. Funds based on the number and type of shareholder accounts. Each servicing agreement must be approved annually by the relevant open-end U.S. Fund’s board of directors or trustees, including a majority of the independent directors or trustees, and may be terminated by either party without penalty upon 60 days’ notice.
Most AllianceBernstein Funds utilize AllianceBernstein and Investor Services personnel to perform legal, clerical, and accounting services not required to be provided by AllianceBernstein. Payments by the U.S. Funds and certain Non-U.S. Funds for these services must be specifically approved in advance by the fund’s board of directors or trustees. Currently, AllianceBernstein and Investor Services are recording revenues for providing these services to the AllianceBernstein Funds at the rate of approximately $8.0 million per year.
ACM Global Investor Services (“ACMGIS”), a division of Alliance Capital (Luxembourg) S.A. (another of our wholly-owned subsidiaries), is the transfer agent of substantially all of the Non-U.S. Funds. As of December 31, 2005, ACMGIS employed 41 people. ACMGIS operates in Luxembourg and Singapore and receives a monthly fee for its transfer agency services under services agreements, which may be terminated by either party upon 60 days’ notice.
13
Private Client Services
The following tables summarize Private Client Services assets under management, along with associated revenues:
Private Client Services Assets Under Management
(by Investment Service)
| | December 31, | | % Change | |
| | 2005 | | 2004 | | 2003 | | 2005-04 | | 2004-03 | |
| | | | (in millions) | | | | | | | |
Growth Equity: | | | | | | | | | | | |
U.S. | | $ | 9,986 | | $ | 7,022 | | $ | 5,479 | | 42.2 | % | 28.2 | % |
Global and International | | 6,390 | | 4,001 | | 3,065 | | 59.7 | | 30.5 | |
| | 16,376 | | 11,023 | | 8,544 | | 48.6 | | 29.0 | |
Value Equity: | | | | | | | | | | | |
U.S. | | 23,725 | | 22,411 | | 19,681 | | 5.9 | | 13.9 | |
Global and International | | 12,959 | | 9,874 | | 6,921 | | 31.2 | | 42.7 | |
| | 36,684 | | 32,285 | | 26,602 | | 13.6 | | 21.4 | |
Fixed Income: | | | | | | | | | | | |
U.S. | | 21,471 | | 20,111 | | 17,955 | | 6.8 | | 12.0 | |
Global and International | | 241 | | 75 | | 55 | | 221.3 | | 36.4 | |
| | 21,712 | | 20,186 | | 18,010 | | 7.6 | | 12.1 | |
Index / Structured: | | | | | | | | | | | |
U.S. | | 101 | | 106 | | 80 | | (4.7 | ) | 32.5 | |
Global and International | | — | | — | | — | | — | | — | |
| | 101 | | 106 | | 80 | | (4.7 | ) | 32.5 | |
Total: | | | | | | | | | | | |
U.S. | | 55,283 | | 49,650 | | 43,195 | | 11.3 | | 14.9 | |
Global and International | | 19,590 | | 13,950 | | 10,041 | | 40.4 | | 38.9 | |
| | 74,873 | | 63,600 | | 53,236 | | 17.7 | | 19.5 | |
Dispositions(1) | | — | | 354 | | 357 | | (100.0 | ) | (0.8 | ) |
Total | | $ | 74,873 | | $ | 63,954 | | $ | 53,593 | | 17.1 | % | 19.3 | % |
(1) Includes assets related to cash management services. For information about this disposition, see Note 20 in AllianceBernstein’s consolidated financial statements in Item 8.
14
Revenues From Private Client Services(1)
(by Investment Service)
| | Years Ended December 31, | | % Change | |
| | 2005 | | 2004 | | 2003 | | 2005-04 | | 2004-03 | |
| | | | (in thousands) | | | | | | | |
Investment Advisory and Services Fees: | | | | | | | | | | | |
Growth Equity: | | | | | | | | | | | |
U.S. | | $ | 98,601 | | $ | 83,185 | | $ | 56,249 | | 18.5 | % | 47.9 | % |
Global and International | | 58,459 | | 39,273 | | 179 | | 48.9 | | n/m | |
| | 157,060 | | 122,458 | | 56,428 | | 28.3 | | 117.0 | |
Value Equity: | | | | | | | | | | | |
U.S. | | 267,730 | | 297,413 | | 258,928 | | (10.0 | ) | 14.9 | |
Global and International | | 163,568 | | 100,484 | | 85,903 | | 62.8 | | 17.0 | |
| | 431,298 | | 397,897 | | 344,831 | | 8.4 | | 15.4 | |
Fixed Income: | | | | | | | | | | | |
U.S. | | 99,899 | | 104,330 | | 90,960 | | (4.2 | ) | 14.7 | |
Global and International | | 879 | | 248 | | 163 | | 254.4 | | 52.1 | |
| | 100,778 | | 104,578 | | 91,123 | | (3.6 | ) | 14.8 | |
Index / Structured: | | | | | | | | | | | |
U.S. | | 103 | | 762 | | 189 | | (86.5 | ) | 303.2 | |
Global and International | | — | | — | | — | | — | | — | |
| | 103 | | 762 | | 189 | | (86.5 | ) | 303.2 | |
Total Investment Advisory and Services Fees: | | | | | | | | | | | |
U.S. | | 466,333 | | 485,690 | | 406,326 | | (4.0 | ) | 19.5 | |
Global and International | | 222,906 | | 140,005 | | 86,245 | | 59.2 | | 62.3 | |
| | 689,239 | | 625,695 | | 492,571 | | 10.2 | | 27.0 | |
Distribution Revenues | | 1,969 | | 1,372 | | 1,332 | | 43.5 | | 3.0 | |
Total | | $ | 691,208 | | $ | 627,067 | | $ | 493,903 | | 10.2 | % | 27.0 | % |
(1) Certain prior-year amounts have been reclassified to conform to our 2005 presentation: we reclassified transaction charges paid by our sponsored mutual funds from Institutional Investment Services and Private Client Services to Retail Services.
Private client accounts are managed pursuant to a written investment advisory agreement among the client, AllianceBernstein and SCB LLC, which usually is terminable at any time or upon relatively short notice by any party. In general, these contracts may not be assigned without the consent of the client. In providing services to private clients, we are compensated by fees calculated based on the type of portfolio and the size of the account. The aggregate fees we charge for managing hedge funds may be higher than the fees we charge for managing other assets in private client accounts because hedge fund fees provide for performance-based fees, incentive allocations, or carried interests. We charge performance-based fees on approximately 5% of private client assets under management, primarily assets held in hedge funds.
We eliminated transaction charges during 2005 on U.S. equity services for many private clients due to a number of factors, including a management initiative implemented during the first half of 2005 that changed the structure of investment advisory and services fees charged to private clients for our services. The restructuring eliminated transaction charges for most private clients while raising base fees. This restructuring increases the transparency and predictability of asset management costs for our private clients. The elimination of transaction charges was not the result of the Assurance of Discontinuance with the NYAG or an agreement with any other regulator.
Revenues from Private Client Services, which represented approximately 21%, 21%, and 18% of our company-wide revenues for the years ended December 31, 2005, 2004, and 2003, respectively, consist primarily of investment management fees earned from managing client assets, generally measured as a percentage of assets under management and, in the case of certain clients, include transaction charges earned by SCB LLC, a registered broker-dealer, for executing trades relating to equity securities under management.
15
Institutional Research Services
The following table summarizes Institutional Research Services revenues:
Revenues From Institutional Research Services
| | Years Ended December 31, | | % Change | |
| | 2005 | | 2004 | | 2003 | | 2005-04 | | 2004-03 | |
| | | | (in thousands) | | | | | | | |
Transaction Charges: | | | | | | | | | | | |
U.S. Clients | | $ | 226,615 | | $ | 225,820 | | $ | 192,597 | | 0.4 | % | 17.3 | % |
Non-U.S. Clients | | 90,291 | | 74,373 | | 72,800 | | 21.4 | | 2.2 | |
| | 316,906 | | 300,193 | | 265,397 | | 5.6 | | 13.1 | |
Other | | 4,375 | | 3,416 | | 2,471 | | 28.1 | | 38.2 | |
Total | | $ | 321,281 | | $ | 303,609 | | $ | 267,868 | | 5.8 | % | 13.3 | % |
SCB earns revenues by providing investment research to, and executing brokerage transactions for, research clients. Research clients provide compensation principally by directing brokerage transactions to SCB in return for its research products. These services accounted for approximately 10% of our revenues in each of 2005, 2004, and 2003.
AllianceBernstein (acting on behalf of its discretionary clients that have authorized it to transact business with SCB) is one of SCB’s largest client relationships. SCB earned revenues of approximately $36.5 million in 2005 from brokerage transactions executed for clients of AllianceBernstein, of which approximately $5.0 million is reported as Institutional Research Services revenues and approximately $31.5 million is reported as investment advisory and services fees (see Item 7). Beginning January 1, 2006, however, we intend to report all revenues earned by SCB from brokerage transactions executed for clients of AllianceBernstein as Institutional Research Services revenues.
Fee rates charged for brokerage transactions have declined significantly in recent years, but increases in transaction volume have more than offset decreases in fee rates. For additional information, see “Risk Factors” in Item 1A and “Executive Overview” in Item 7.
Custody and Brokerage
Custody
We do not generally maintain custody of client funds and securities. However, SCB LLC does maintain custody for the vast majority of our private clients. Other custodial arrangements are maintained by client-designated banks, trust companies, brokerage firms or other custodians.
Brokerage
We generally have the discretion to select the broker-dealers to execute transactions for client accounts. When selecting brokers, we are required to obtain “best execution”. Although there is no single statutory definition, SEC releases and other legal guidelines make clear that the duty to obtain best execution requires us to seek “the most advantageous terms reasonably available under the circumstances for a customer’s account”. In addition to paying the lowest possible commission rate, we take into account such factors as current market conditions, financial accountability, and the ability and willingness of the broker to commit capital by taking positions in order to execute transactions.
While we select brokers primarily on the basis of their execution capabilities, we may also take into consideration the quality and amount of research services (“Soft Dollar Services”) a broker provides to us for the benefit of our clients. Soft Dollar Services, which we purchase to augment our own research capabilities, are governed by Section 28(e) of the Exchange Act. We use broker-dealers that provide Soft Dollar Services in consideration for the execution of client trades, subject at all times to our duty to seek best execution, and with respect to which we reasonably conclude, in good faith, that the value of the execution and other services we receive from the broker-dealer is reasonable in relation to the amount of commissions paid. The commissions
16
charged by these full-service brokers are higher than those charged by electronic trading networks and other “low-touch” venues.
We sometimes execute client transactions through SCB LLC or SCBL, our affiliated broker-dealers. We do so only when our clients have consented to our use of affiliated broker-dealers or we are otherwise permitted to do so, and only when we can execute these transactions in accordance with applicable law (e.g., our obligation to obtain best execution).
We may use brokers to effect client transactions that sell shares of AllianceBernstein Funds or third party funds we sub-advise; however, we prohibit our investment professionals who place trades from considering these other relationships as a factor when selecting brokers to effect transactions. Similarly, we prohibit our investment professionals from considering the sale of fund shares as a factor when determining which brokers to use.
We have formed two Commission Allocation Committees, one covering growth equities and the other covering value equities. These committees have principal oversight responsibility for evaluating brokerage matters, including how to use the Soft Dollar Services we receive in a manner that is in the best interests of our clients and consistent with current regulatory requirements.
Service Marks
In connection with our recent name changes to AllianceBernstein L.P. and AllianceBernstein Holding L.P., we have applied to register a number of service marks with the U.S. Patent and Trademark Office, including an “AB” design logo and the combination of such logo with the words “AllianceBernstein”.
As a result of the Bernstein Transaction, we acquired all of the rights and title in, and to, the Bernstein service marks, including the name Bernstein. These marks were registered in 1981 and 1982. The marks “AllianceBernstein” and “Bernstein Investment Research and Management” were registered in 2003.
Regulation
AllianceBernstein, Holding, the General Partner, SCB LLC, AllianceBernstein Global Derivatives Corporation (a wholly-owned subsidiary of AllianceBernstein, “Global Derivatives”), and Alliance Corporate Finance Group Incorporated (a wholly-owned subsidiary of AllianceBernstein) are investment advisers registered under the Investment Advisers Act. Global Derivatives is also registered with the Commodity Futures Trading Commission as a commodity pool operator.
Each U.S. Fund is registered with the SEC under the Investment Company Act and the shares of most U.S. Funds are qualified for sale in all states in the United States and the District of Columbia, except for U.S. Funds offered only to residents of a particular state. Investor Services is registered with the SEC as a transfer agent.
SCB LLC and AllianceBernstein Investments are registered with the SEC as broker-dealers. SCB LLC is a member of the New York Stock Exchange, Inc. (“NYSE”). SCBL is a broker regulated by the Financial Services Authority of the United Kingdom (“FSA”) and is a member of the London Stock Exchange. SCB LLC and AllianceBernstein Investments are subject to minimum net capital requirements imposed by the SEC, and SCBL is subject to the financial resources requirements of the FSA, as follows:
| | Minimum Net Capital/
Financial Resources as of
December 31, 2005 | |
| | Required | | Actual | |
| | (in millions) | |
| | | |
AllianceBernstein Investments | | $ | 9.7 | | $ | 47.9 | |
SCB | | 26.3 | | 146.4 | |
SCBL | | 11.2 | | 33.6 | |
Total | | $ | 47.2 | | $ | 227.9 | |
17
Holding Units trade publicly on the NYSE. Holding Units currently trade under the ticker symbol “AC” but, beginning February 27, 2006, will trade under the ticker symbol “AB”. Holding is an NYSE listed company and, therefore, subject to the regulations set forth in the NYSE Listed Company Manual.
Our relationships with AXA and its subsidiaries are subject to applicable provisions of the insurance laws and regulations of New York and other states. Under such laws and regulations, the terms of certain investment advisory and other agreements we enter into with AXA or its subsidiaries are required to be fair and equitable, charges or fees for services performed must be reasonable, and, in some cases, are subject to regulatory approval.
All aspects of our business are subject to various federal and state laws and regulations, rules of various securities regulators and exchanges, and laws in the foreign countries in which our subsidiaries conduct business. These laws and regulations are primarily intended to benefit clients and fund shareholders and generally grant supervisory agencies broad administrative powers, including the power to limit or restrict the carrying on of business for failure to comply with such laws and regulations. In such event, the possible sanctions that may be imposed include the suspension of individual employees, limitations on engaging in business for specific periods, the revocation of the registration as an investment adviser or broker-dealer, censures, and fines.
Market Timing Investigations
On December 18, 2003, we settled with the SEC and the NYAG regarding their investigations into trading practices in the shares of certain of our sponsored mutual funds. Our agreement with the SEC was reflected in an Order of the Commission (“SEC Order”) dated December 18, 2003 (amended and restated January 15, 2004), while our final agreement with the NYAG was reflected in an Assurance of Discontinuance (“AoD”) dated September 1, 2004. We have taken a number of important initiatives to resolve these matters. Specifically, we:
• established a $250 million restitution fund to compensate fund shareholders for the adverse effects of market timing (“Restitution Fund”);
• reduced by 20% (on a weighted average basis) the advisory fees on U.S. long-term open-end retail mutual funds by reducing our advisory fee rates (resulting in an approximate $63 million reduction in 2005 advisory fees and a $70 million reduction in 2004 advisory fees), and we will maintain these reduced fee rates for at least the five-year period that commenced January 1, 2004;
• appointed a new management team and specifically charged it with responsibility for ensuring that we maintain a fiduciary culture in our Retail Services;
• revised our code of ethics to better align the interests of our employees with those of our clients;
• formed two new committees composed of executive management to oversee and resolve code of ethics and compliance-related issues;
• instituted a substantially strengthened policy designed to detect and block market timing and material short duration trading;
• created an ombudsman office, where employees can voice concerns about work-related issues on a confidential basis; and
• initiated firm-wide compliance and ethics training programs.
We retained an Independent Compliance Consultant (“ICC”) to conduct a comprehensive review of supervisory, compliance, and other policies designed to detect and prevent conflicts of interest, breaches of fiduciary duty, and violations of law. The ICC completed its review, and submitted its report to the SEC in December 2004. By December 31, 2005, we had implemented substantially all of the ICC’s recommendations. Also, beginning in 2005 we had, and biannually thereafter will continue to have, an independent third party perform a comprehensive compliance review.
We believe that these remedial actions provide reasonable assurance that the deficiencies in our internal controls related to market timing will not recur.
18
With the approval of the independent directors of the U.S. Fund Boards and the staff of the SEC, we retained an Independent Distribution Consultant (“IDC”) to develop a plan for the distribution of the Restitution Fund. To the extent it is determined that the harm to mutual fund shareholders caused by market timing exceeds $200 million, we will be required to contribute additional monies to the Restitution Fund. On September 30, 2005, the IDC submitted to the SEC Staff the portion of his report concerning his methodology for determining damages. The IDC will, in the coming months, formally submit to the Staff the remainder of his proposed distribution plan, which addresses the mechanics of distribution. Once the Staff has approved both portions of the plan, it will be submitted to the SEC for final approval. The Restitution Fund proceeds will not be distributed until after the SEC has approved the distribution plan and issued an order doing so. Until then, it is not possible to predict the exact timing, method, or amount of the distribution.
On February 10, 2004, we received (i) a subpoena duces tecum from the Office of the Attorney General of the State of West Virginia and (ii) a request for information from the Office of the State Auditor, Securities Commission, for the State of West Virginia (“WV Securities Commissioner”) (subpoena and request together, the “Information Requests”). The Information Requests required us to produce documents concerning, among other things, any market timing or late trading in our sponsored mutual funds. We responded to the Information Requests and have been cooperating fully with the investigation.
On April 11, 2005, a complaint entitled The Attorney General of the State of West Virginia v. AIM Advisors, Inc., et al. (“WVAG Complaint”) was filed against AllianceBernstein, Holding, and various unaffiliated defendants. On May 31, 2005, defendants removed the WVAG Complaint to the United States District Court for the Northern District of West Virginia. On July 12, 2005, plaintiff moved to remand. On October 19, 2005, the WVAG Complaint was transferred to the Mutual Fund MDL (see Market Timing-related Matters in Item 3).
On August 30, 2005, the WV Securities Commissioner signed a “Summary Order to Cease and Desist, and Notice of Right to Hearing” addressed to us. The Summary Order claims that we violated the West Virginia Uniform Securities Act and makes factual allegations generally similar to those in the SEC Order and NYAG AoD. On January 26, 2006, AllianceBernstein, Holding, and various unaffiliated defendants filed a Petition for Writ of Prohibition and Order Suspending Proceedings in West Virginia state court seeking to vacate the Summary Order and for other relief.
As previously disclosed, AllianceBernstein recorded charges totaling $330 million during the second half of 2003, of which (i) $250 million was paid to the Restitution Fund (the $250 million was funded out of operating cash flow and paid to the SEC in January 2004), (ii) $30 million was used to settle a private civil mutual fund litigation unrelated to any regulatory agreements, and (iii) $50 million was reserved for estimated expenses related to our market-timing settlements with the SEC and the NYAG and our market timing-related liabilities (excluding WVAG Complaint-related expenses). AllianceBernstein paid $8 million during 2005 related to market timing and has cumulatively paid $310 million (excluding WVAG Complaint-related expenses). Including $10 million in charges taken in prior periods, we have reserves of approximately $30 million available for market timing-related liabilities in future periods.
Taxes
AllianceBernstein is a private partnership for federal income tax purposes and, accordingly, is not subject to federal and state corporate income taxes. However, AllianceBernstein is subject to the 4.0% New York City unincorporated business tax (“UBT”). Domestic corporate subsidiaries of AllianceBernstein, which are subject to federal, state and local income taxes, are generally included in the filing of a consolidated federal income tax return. Separate state and local income tax returns are filed. Foreign corporate subsidiaries are generally subject to taxes in the jurisdictions where they are located. Holding is a publicly traded partnership for federal income tax purposes and is subject to the 4.0% UBT, net of credits for UBT paid by AllianceBernstein, and a 3.5% federal tax on partnership gross income from the active conduct of a trade or business.
In order to preserve Holding’s status as a “grandfathered” publicly traded partnership for federal income tax purposes, management ensures that Holding does not directly or indirectly (through AllianceBernstein) enter into a substantial new line of business. If Holding were to lose its status as a grandfathered publicly traded partnership, it would be subject to corporate income tax, which would reduce materially Holding’s net income and its quarterly distributions to Holding Unitholders.
In order to preserve AllianceBernstein’s status as a private partnership for federal income tax purposes, AllianceBernstein must not be treated as publicly traded. The AllianceBernstein Partnership Agreement provides that all transfers of AllianceBernstein Units must be approved by AXA Equitable and the General Partner; AXA Equitable and the General Partner approve only those transfers permitted pursuant to one or more of the safe harbors contained in relevant treasury regulations. If such units were considered readily tradable, AllianceBernstein would be subject to federal and state corporate income tax on its net income. Furthermore, as noted above, should AllianceBernstein enter into a substantial new line of business, Holding, by virtue of its ownership of AllianceBernstein, would lose its status as a grandfathered publicly traded partnership and be subject to income tax as set forth above.
19
History and Structure
ACMC, Inc., AllianceBernstein’s predecessor, began providing investment management services in 1971.
In October 1999, Holding reorganized by transferring its business and assets to AllianceBernstein, a newly-formed operating partnership, in exchange for all of the AllianceBernstein Units (“Reorganization”). Since the date of the Reorganization, AllianceBernstein has conducted the business formerly conducted by Holding and Holding’s activities have consisted of owning AllianceBernstein Units and engaging in related activities. Holding Units trade publicly on the NYSE. Holding Units currently trade under the ticker symbol “AC” but, beginning February 27, 2006, will trade under the ticker symbol “AB”. AllianceBernstein Units do not trade publicly and are subject to significant restrictions on transfer. The General Partner is the general partner of both AllianceBernstein and Holding.
In October 2000, AllianceBernstein completed the Bernstein Transaction, whereby AllianceBernstein acquired the business and assets of Bernstein and assumed the liabilities of the Bernstein business. For additional information, see Item 12.
As of December 31, 2005, the condensed ownership structure of AllianceBernstein, as a percentage of limited partnership interests, was as follows (for a more complete description of our ownership structure, see Item 12):
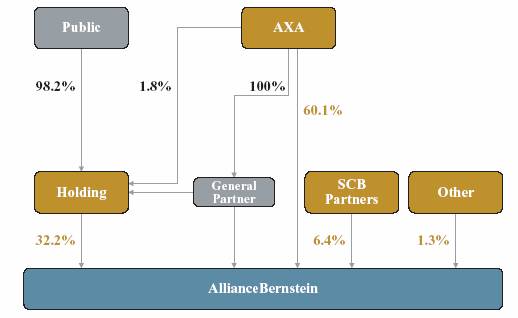
As of December 31, 2005, AXA, through certain of its subsidiaries (see Item 12), beneficially owned approximately 1.8% of the issued and outstanding Holding Units and approximately 60.1% of the issued and outstanding AllianceBernstein Units.
The General Partner, an indirect wholly-owned subsidiary of AXA, owns 100,000 general partnership units in Holding and a 1% general partnership interest in AllianceBernstein. Including the general partnership interests in Holding and AllianceBernstein, and its equity interest in Holding, as of December 31, 2005, AXA, through certain of its subsidiaries, had an approximate 61.1% economic interest in AllianceBernstein.
AXA and its subsidiaries own all of the issued and outstanding shares of the common stock of AXA Financial. AXA Financial owns all of the issued and outstanding shares of AXA Equitable. See Item 12.
AXA, a société anonyme organized under the laws of France, is the holding company for an international group of insurance and related financial services companies engaged in the financial protection and wealth
20
management businesses. AXA is one of the largest insurance groups in the world and operates primarily in Western Europe, North America, and the Asia/Pacific region and, to a lesser extent, in other regions including the Middle East, Africa, and South America. AXA has five operating business segments: life and savings, property and casualty, international insurance (including reinsurance), asset management, and other financial services.
Competition
The financial services industry is intensely competitive and new entrants are continually attracted to it. No single or small group of competitors is dominant in the industry.
We compete in all aspects of our business with numerous investment management firms, mutual fund complexes, brokerage and investment banking firms, insurance companies, banks, savings and loan associations, and other financial institutions that often provide investment products that have similar features and objectives as those we offer. Our competitors offer a wide range of financial services to the same customers that we seek to serve. Some of our competitors are larger, have a broader range of product choices and investment capabilities, conduct business in more markets, and have substantially greater resources than we do. These factors may place us at a competitive disadvantage, and we can give no assurance that our strategies and efforts to maintain and enhance our current client relationships, and create new ones, will be successful.
To grow our business, we must be able to compete effectively for assets under management. Key competitive factors include:
• our commitment to place the interests of our clients first;
• the quality of our research;
• our investment performance;
• the array of investment products we offer;
• the fees we charge;
• our ability to further develop and market our brand; and
• our global presence.
Certain of AXA’s subsidiaries offer financial services, some of which compete with those we offer. The AllianceBernstein Partnership Agreement specifically allows AXA Equitable and its subsidiaries (other than the General Partner) to compete with us. AXA has substantially greater financial resources than we do and is not obligated to provide resources to us.
Increased competition could reduce the demand for our products and services, and that could have a material adverse effect on our financial condition, results of operations, and business prospects.
Competition is a serious risk that our business faces and should be considered along with the other risk factors we discuss below.
Other Information
AllianceBernstein and Holding file or furnish annual reports on Form 10-K, quarterly reports on Form 10-Q, current reports on Form 8-K and other reports required to comply with federal securities laws. The public may read and copy any materials filed with the SEC at the SEC’s Public Reference Room at 450 Fifth Street, NW, Washington, DC 20549. The public may obtain information on the operation of the Public Reference Room by calling the SEC at 1-800-SEC-0330. The SEC also maintains an Internet site (http://www.sec.gov) that contains reports, proxy and information statements and other information regarding issuers that file electronically with the SEC.
AllianceBernstein and Holding maintain an Internet site (http://www.alliancebernstein.com). The portion of the site at “Investor Relations/Reports and SEC Filings” links to both companies’ annual reports on Form 10-K, quarterly reports on Form 10-Q, current reports on Form 8-K, and amendments to those reports filed or furnished
21
pursuant to Section 13(a) or 15(d) of the Exchange Act. These reports are available through the site free of charge as soon as reasonably practicable after such material is filed with, or furnished to, the SEC.
Item 1A. Risk Factors
Please read this section along with the description of our business in Item 1, the competition section just above, and AllianceBernstein’s financial information contained in Items 6, 7, and 8. The majority of the risk factors discussed below directly affect AllianceBernstein. These risk factors also affect Holding because Holding’s principal source of income and cash flow is attributable to its investment in AllianceBernstein. See also our discussion of risks associated with forward-looking statements in Item 7.
Changes in financial market levels have a direct and significant impact on our assets under management; a significant reduction in assets under management could have a material adverse effect on our revenues, financial condition, results of operations, and business prospects.
Performance of financial markets (both domestic and international), global economic conditions, interest rates, inflation rates, tax regulation changes, and other factors that are difficult to predict affect the mix, market values, and levels of assets under management. Investment advisory and services fees, the largest component of revenues, are generally calculated as a percentage of the value of assets under management and vary with the type of account managed. Accordingly, fee income generally increases or decreases as assets under management increase or decrease and is affected by market appreciation or depreciation, inflow of new client assets (including purchases of mutual fund shares), and outflow of client assets (including redemption of mutual fund shares). In addition, changing market conditions and investment trends, particularly with respect to retirement savings, may reduce interest in certain of our investment products and may cause a shift in the mix of assets under management. A shift towards fixed income products might result in a related decline in revenues and income because we generally earn more from assets invested in our equity services than in our fixed income services.
Declines in financial markets or higher redemption levels in our mutual funds, or both, as compared to the assumptions we have used to estimate undiscounted future cash flows from distribution plan fees, as described in Item 7, could result in impairment of the deferred sales commission asset. Due to the volatility of financial markets and changes in redemption rates, we are unable to predict whether or when a future impairment of the deferred sales commission asset might occur. The occurrence of an impairment would result in a material charge to our earnings.
Our business is dependent on investment advisory, selling and distribution agreements that are subject to termination or non-renewal on short notice.
We derive most of our revenues pursuant to written investment advisory and investment management agreements with institutional investors, mutual funds, and private clients, and selling and distribution agreements between AllianceBernstein Investments and financial intermediaries that distribute AllianceBernstein Funds. Generally, the investment advisory and investment management agreements are terminable at any time or upon relatively short notice by either party. The selling and distribution agreements are terminable by either party upon notice (generally not more than sixty days) and do not obligate the financial intermediary to sell any specific amount of fund shares. Any termination of, or failure to renew, a significant number of these agreements could have a material adverse effect on our revenues, financial condition, results of operations, and business prospects.
Our ability to access clients is partly dependent on our relationships with various financial intermediaries and consultants that are not obligated to continue to work with us.
Our ability to market our mutual funds, sub-advisory services, and investment services is partly dependent on our access to a client base of corporate and public employee pension funds, endowment funds, domestic and foreign institutions and governments, insurance companies, securities firms, brokers, banks, and other intermediaries. These intermediaries generally offer their clients various investment products in addition to, and in competition with, our products. In addition, certain institutional investors rely on consultants to advise them on the choice of investment adviser, and we are not always considered among the best choices by all consultants. Also, our Private Client Services group relies on referrals from financial planners, registered investment advisers,
22
and other professionals. We cannot be certain that we will continue to have access to, or receive referrals from, these third parties. If we lose such access or referrals, we could suffer a material adverse effect on our revenues, financial condition, results of operations, and business prospects.
We may be unable to continue to attract and retain key personnel.
Our business is dependent on our ability to attract, retain, and motivate highly skilled, and often highly specialized, technical, managerial, and executive personnel; we can give no assurance that we will be able to do so.
The market for qualified portfolio managers, investment analysts, financial advisers, order placement specialists, and other professionals is extremely competitive and is characterized by frequent movement of these investment professionals among different firms. Portfolio managers and financial advisers often maintain strong, personal relationships with their clients so their departure could cause us to lose client accounts, which could have a material adverse effect on our revenues, financial condition, results of operations, and business prospects.
Poor investment performance could lead to loss of clients and a decline in revenues.
Our ability to achieve investment returns for clients that meet or exceed investment returns for comparable asset classes and competing investment services is a key consideration in a client’s decision to keep their assets with us or invest additional assets, and a prospective client’s decision to invest. Our inability to meet relevant investment benchmarks could result in clients withdrawing assets and in prospective clients choosing to invest with competitors. This could also result in lower investment management fees, including minimal or no performance-based fees, which could result in a decline in our revenues.
We may enter into more performance-based fee arrangements with our clients in the future, which could result in greater fluctuations in our revenues.
We sometimes charge our clients performance-based fees where we earn a relatively low base fee and an additional fee if our investment performance exceeds a specified benchmark. If we do not exceed our investment return target for a particular period, we will not earn a performance-based fee for that period and, if the target is based on cumulative returns, our ability to earn performance-based fees in future periods may be impaired.
We currently charge performance-based fees on approximately 16% of the assets we manage for our institutional investors and approximately 5% of the assets we manage for private clients. Performance-based fee arrangements may become more common in our industry. An increase in performance-based fee arrangements could create greater fluctuations in our revenues.
Unpredictable events, including natural disaster, technology failure, and terrorist attack, could adversely impact our ability to conduct business.
War, terrorist attack, power failure, natural disaster, and rapid spread of serious disease could interrupt our operations by:
• causing disruptions in U.S. or global economic conditions, thus decreasing investor confidence and making investment products generally less attractive;
• inflicting loss of life;
• triggering massive technology failures or delays; and
• requiring substantial capital expenditures and operating expenses to remediate damage and restore operations.
Our operations require experienced, professional staff. Loss of a substantial number of such persons or an inability to provide properly equipped places for them to work may, by interrupting our operations, adversely affect our revenues, financial condition, results of operations, and business prospects.
23
We are dependent on various systems and technologies for our business to function properly and to safeguard confidential information.
We utilize software and related technologies throughout our business, including both proprietary systems and those provided by outside vendors. Although we have established and tested business continuity plans, we may experience systems delays and interruptions and it is not possible to predict with certainty all of the adverse effects that could result from our failure, or the failure of a third party, to efficiently address these problems. These adverse effects could include the inability to perform critical business functions or failure to comply with financial reporting and other regulatory requirements, which could lead to loss of client confidence, harm to our reputation, exposure to disciplinary action, and liability to our clients. Accordingly, potential system failures and the cost necessary to correct those failures could have a material adverse effect on our revenues, financial condition, results of operations, and business prospects.
In addition, we could be subject to losses if we fail to properly safeguard sensitive and confidential information. As part of our normal operations, we maintain and transmit confidential information about our clients as well as proprietary information relating to our business operations. Our systems could be damaged by unauthorized users or corrupted by computer viruses or other malicious software code, or authorized persons could inadvertently or intentionally release confidential or proprietary information. Such disclosure could, among other things, allow competitors access to our proprietary business information and require significant time and expense to investigate and remediate the breach.
The costs of insurance increased in recent years and may continue to increase.
Our insurance expenses increased significantly between 2001 and 2004 and, although they decreased slightly in 2005, increases in the future are possible. In addition, certain insurance coverage may not be available or may only be available at prohibitive costs. As we renew our insurance policies, we may be subject to additional costs resulting from the assumption of higher deductibles and/or co-insurance liability. Higher insurance costs and incurred deductibles reduce our net income.
Our business is based on the trust and confidence of our clients; any damage to that trust and confidence can cause assets under management to decline and can have a material adverse effect on our revenues, results of operations, financial condition, and business prospects.
We are dedicated to earning and maintaining the trust and confidence of our clients; the good reputation created thereby is essential to our business. Damage to our reputation could impair our ability to conduct our business. For example, only recently have we begun to see our U.S. retail business stabilize after the negative impact of market timing. Should we be involved with another matter that damages our reputation and causes clients to redeem their mutual fund investments or withdraw their assets from institutional and private client accounts, our ability to earn investment advisory and services fees would suffer.
Rates we charge for brokerage transactions have declined significantly in recent years, and we expect declines to continue, which could have an adverse effect on our revenues.
The rates charged for brokerage transactions have declined significantly in recent years and this has affected our Institutional Research Services revenues although, to date, increases in transaction volume and market share have more than offset decreases in rates. Brokerage transaction revenues are also being affected by the increasing use of electronic trading systems which charge transaction fees for execution-only services that are a small fraction of the full service fee rates traditionally charged by SCB and other brokers for brokerage services that include the provision of proprietary research. Also, regulatory changes in the United Kingdom and the United States will result in investors being given more information regarding the allocation of amounts they are paying for brokerage between execution services and research services and this may further reduce the willingness of investors to pay current rates for full-service brokerage. All of these factors may result in reductions in per transaction brokerage fees that SCB charges its clients; we expect these reductions to continue.
Our business is subject to pervasive global regulation, with the attendant costs of compliance, and potential material adverse consequences for violations.
Virtually all aspects of our business are subject to various federal and state laws and regulations, rules of various securities regulators and exchanges, and laws in the foreign countries in which our subsidiaries conduct business. If we violate these laws or regulations, we could be subject to civil liability, criminal liability, or sanction, including revocation of our and our subsidiaries’ registrations as investment advisers or broker-dealers, revocation of the licenses of our employees, censures, fines, or temporary suspension or permanent bar from conducting business. A regulatory proceeding, even if it does not result in a finding of wrongdoing or sanction, could require substantial expenditures of time and money. Any such liability or sanction could have a material adverse effect on our revenues, financial condition, results of operations, and business prospects. These laws and regulations generally grant supervisory agencies and bodies broad administrative powers, including, in some cases, the power to limit or restrict doing business for failure to comply with such laws and regulations. Moreover, regulators in non-U.S. jurisdictions could change their policies or laws in a manner that might restrict or otherwise impede our ability to distribute or register investment products in their respective markets. These local requirements could increase the expenses we incur in a specific jurisdiction without any corresponding increase in revenues from operating in the jurisdiction.
24
Due to the extensive laws and regulations to which we are subject, we must devote substantial time and effort to legal and regulatory compliance issues. In addition, the regulatory environment in which we operate changes frequently and regulations have increased significantly in recent years. We may be adversely affected as a result of new or revised legislation or regulations or by changes in the interpretation or enforcement of existing laws and regulations.
We are involved in various legal proceedings and regulatory matters and may be involved in more in the future, any one or combination of which could have a material adverse effect on our financial condition, results of operations, and business prospects.
We are involved in various inquiries, administrative proceedings, and civil litigation, some of which allege substantial damages, and we may be involved in additional matters in the future. Litigation is subject to significant uncertainties, particularly when plaintiffs allege substantial or indeterminate damages, or when the litigation is highly complex or broad in scope. We have described all pending material legal proceedings in Item 3.
Risks related to the Partnerships’ structure
The partnership structure of Holding and AllianceBernstein limits unitholders’ abilities to influence the management and operation of AllianceBernstein’s business and is highly likely to prevent a change in control of Holding and AllianceBernstein.
The General Partner, as general partner of both Holding and AllianceBernstein, generally has the exclusive right and full authority and responsibility to manage, conduct, control, and operate their respective businesses, except as otherwise expressly stated in their respective Amended and Restated Agreements of Limited Partnership. Unlike holders of common stock in a corporation, Holding and AllianceBernstein unitholders have very limited voting rights on matters affecting AllianceBernstein’s business. The respective Amended and Restated Agreements of Limited Partnership provide that unitholders do not have any right to vote for directors of the General Partner and that unitholders can only vote on certain extraordinary matters (including removal of the General Partner under certain extraordinary circumstances). Additionally, the AllianceBernstein Partnership Agreement includes significant restrictions on transfers of AllianceBernstein Units and provisions that have the practical effect of preventing the removal of the General Partner, which are highly likely to prevent a change in control of AllianceBernstein’s management.
AllianceBernstein Units are illiquid.
There is no public trading market for AllianceBernstein Units and AllianceBernstein does not anticipate that a public trading market will ever develop for AllianceBernstein Units. The AllianceBernstein Partnership Agreement restricts our ability to participate in a public trading market or anything substantially equivalent to one by providing that any transfer which may cause AllianceBernstein to be classified as a “publicly traded partnership” as defined in Section 7704 of the Internal Revenue Code of 1986, as amended, shall be deemed void and shall not be recognized by AllianceBernstein. In addition, AllianceBernstein Units are subject to significant restrictions on transfer; all transfers of AllianceBernstein Units are subject to the written consent of AXA Equitable and the General Partner pursuant to the AllianceBernstein Partnership Agreement. Generally, neither AXA Equitable nor the General Partner will permit any transfer that it believes would create a risk that AllianceBernstein would be treated as a corporation for tax purposes. AXA Equitable and the General Partner have implemented a transfer policy that requires a seller to locate a purchaser, and imposes annual volume restrictions on transfers. You may request a copy of the transfer program from our corporate secretary (corporate.secretary@alliancebernstein.com). Also, we filed the transfer program with the SEC as Exhibit 10.3 to our 2003 Form 10-K, a copy of which you can find at http://www.alliancebernstein.com.
25
Item 1B. Unresolved Staff Comments
Neither AllianceBernstein nor Holding have unresolved comments from the staff of the SEC to report.
Item 2. Properties
Our principal executive offices at 1345 Avenue of the Americas, New York, New York are occupied pursuant to a lease which extends until 2019. We currently occupy approximately 783,321 square feet of space at this location. We also occupy approximately 114,097 square feet of space at 135 West 50th Street, New York, New York under a lease expiring in 2016 and approximately 143,409 square feet of space at One North Lexington, White Plains, New York under a lease expiring in 2008. AllianceBernstein Investments and Investor Services occupy approximately 134,261 square feet of space in Secaucus, New Jersey, and approximately 92,067 square feet of space in San Antonio, Texas, under leases expiring in 2016 and 2009, respectively.
We also lease space in 17 other cities in the United States and our subsidiaries and joint ventures lease space in London, England under leases expiring in 2011, 2015, and 2016, in Tokyo, Japan under leases expiring in 2006, 2007, and 2009, and in 13 other cities outside the United States.
Item 3. Legal Proceedings
With respect to all significant litigation matters, we conduct a probability assessment of the likelihood of a negative outcome. If the likelihood of a negative outcome is probable, and the amount of the loss can be reasonably estimated, we record an estimated loss for the expected outcome of the litigation as required by Statement of Financial Accounting Standards No. 5 (“SFAS No. 5”), “Accounting for Contingencies”, and Financial Accounting Standards Board (“FASB”) Interpretation No. 14, “Reasonable Estimation of the Amount of a Loss -an interpretation of FASB Statement No. 5”. If the likelihood of a negative outcome is reasonably possible and we are able to indicate an estimate of the possible loss or range of loss, we disclose that fact together with the estimate of the possible loss or range of loss. However, it is difficult to predict the outcome or estimate a possible loss or range of loss because litigation is subject to significant uncertainties, particularly when plaintiffs allege substantial or indeterminate damages, or when the litigation is highly complex or broad in scope.
26
On April 8, 2002, in In re Enron Corporation Securities Litigation, a consolidated complaint (“Enron Complaint”) was filed in the United States District Court for the Southern District of Texas, Houston Division, against numerous defendants, including AllianceBernstein. The principal allegations of the Enron Complaint, as they pertain to AllianceBernstein, are that AllianceBernstein violated Sections 11 and 15 of the Securities Act with respect to a registration statement filed by Enron Corp. (“Enron”) and effective with the SEC on July 18, 2001, which was used to sell $1.9 billion Enron Zero Coupon Convertible Notes due 2021. Plaintiffs allege that the registration statement was materially misleading and that Frank Savage, a director of Enron, signed the registration statement at issue. Plaintiffs further allege that AllianceBernstein was a controlling person of Frank Savage, who was at that time an employee of AllianceBernstein and a director of the General Partner. Plaintiffs therefore assert that AllianceBernstein is itself liable for the allegedly misleading registration statement. Plaintiffs seek rescission or a rescissionary measure of damages. On June 3, 2002, AllianceBernstein moved to dismiss the Enron Complaint as the allegations therein pertain to it. On March 12, 2003, that motion was denied. A First Amended Consolidated Complaint (“Enron Amended Consolidated Complaint”), with substantially similar allegations as to AllianceBernstein, was filed on May 14, 2003. AllianceBernstein filed its answer on June 13, 2003. On May 28, 2003, plaintiffs filed an Amended Motion for Class Certification. On October 23, 2003, following the completion of class discovery, AllianceBernstein filed its opposition to class certification. That motion is pending. The case is currently in discovery.
We believe that plaintiffs’ allegations in the Enron Amended Consolidated Complaint as to us are without merit and intend to vigorously defend against these allegations. At the present time, we are unable to predict the outcome or estimate a possible loss or range of loss in respect of this matter because of the inherent uncertainty regarding the outcome of complex litigation, the fact that plaintiffs did not specify an amount of damages sought in their complaint, and the fact that, to date, we have not engaged in settlement negotiations.
On September 12, 2002, a complaint entitled Lawrence E. Jaffe Pension Plan, Lawrence E. Jaffe Trustee U/A 1198 v. Alliance Capital Management L.P., Alfred Harrison and Alliance Premier Growth Fund, Inc. (“Jaffe Complaint”) was filed in the United States District Court for the Southern District of New York against AllianceBernstein, Alfred Harrison (a former director) and the AllianceBernstein Premier Growth Fund (now known as the AllianceBernstein Large Cap Growth Fund, “Large Cap Growth Fund”) alleging violation of the Investment Company Act. Plaintiff seeks damages equal to Large Cap Growth Fund’s losses as a result of Large Cap Growth Fund’s investment in shares of Enron and a recovery of all fees paid by Large Cap Growth Fund to AllianceBernstein beginning November 1, 2000. On March 24, 2003, the court granted AllianceBernstein’s motion to transfer the Jaffe Complaint to the United States District Court for the District of New Jersey for coordination with the now dismissed Benak v. Alliance Capital Management L.P. and Alliance Premier Growth Fund action then pending. On December 5, 2003, plaintiff filed an amended complaint (“Amended Jaffe Complaint”) in the United States District Court for the District of New Jersey alleging violations of Section 36(a) of the Investment Company Act, common law negligence, and negligent misrepresentation. Specifically, the Amended Jaffe Complaint alleges that: (i) the defendants breached their fiduciary duties of loyalty, care and good faith to Large Cap Growth Fund by causing Large Cap Growth Fund to invest in securities of Enron, (ii) the defendants were negligent for investing in securities of Enron, and (iii) through prospectuses and other documents defendants misrepresented material facts related to Large Cap Growth Fund’s investment objective and policies. On January 23, 2004, defendants moved to dismiss the Amended Jaffe Complaint. On May 23, 2005, the court granted defendant’s motion and dismissed the case on the ground that plaintiff failed to make a demand on the Large Cap Growth Fund’s Board of Directors (“LCG Board”) pursuant to Rule 23.1 of the Federal Rules of Civil Procedure. Plaintiff’s time to file an appeal has expired. On June 15, 2005, plaintiff made a demand on the LCG Board, requesting that the LCG Board take action against AllianceBernstein for the reasons set forth in the Amended Jaffe Complaint. In December 2005, the LCG Board rejected plaintiff’s demand.
AllianceBernstein, Large Cap Growth Fund, and Alfred Harrison believe that plaintiff’s allegations in the Amended Jaffe Complaint are without merit and intend to vigorously defend against these allegations. At the present time, we are unable to predict the outcome or estimate a possible loss or range of loss in respect of this matter because of the inherent uncertainty regarding the outcome of complex litigation and the fact that, to date, we have not engaged in settlement negotiations.
27
On December 13, 2002, a putative class action complaint entitled Patrick J. Goggins, et al. v. Alliance Capital Management L.P., et al. (“Goggins Complaint”) was filed in the United States District Court for the Southern District of New York against AllianceBernstein, Large Cap Growth Fund and individual directors and certain officers of Large Cap Growth Fund. On August 13, 2003, the court granted AllianceBernstein’s motion to transfer the Goggins Complaint to the United States District Court for the District of New Jersey. On December 5, 2003, plaintiffs filed an amended complaint (“Amended Goggins Complaint”) in the United States District Court for the District of New Jersey, which alleges that defendants violated Sections 11, 12(a)(2) and 15 of the Securities Act because Large Cap Growth Fund’s registration statements and prospectuses contained untrue statements of material fact and omitted material facts. More specifically, the Amended Goggins Complaint alleges that Large Cap Growth Fund’s investment in Enron was inconsistent with the Large Cap Growth Fund’s stated strategic objectives and investment strategies. Plaintiffs seek rescissionary relief or an unspecified amount of compensatory damages on behalf of a class of persons who purchased shares of Large Cap Growth Fund during the period October 31, 2000 through February 14, 2002. On January 23, 2004, AllianceBernstein moved to dismiss the Amended Goggins Complaint. On December 10, 2004, the court granted AllianceBernstein’s motion and dismissed the case. On January 5, 2005, plaintiffs appealed the court’s decision. On January 13, 2006, the U.S. Court of Appeals for the Third Circuit affirmed the dismissal. Plaintiffs’ time to seek further review of the court’s decision expires on April 13, 2006.
AllianceBernstein, Large Cap Growth Fund and the other defendants believe that plaintiffs’ allegations in the Amended Goggins Complaint are without merit and intend to vigorously defend against these allegations. At the present time, we are unable to predict the outcome or estimate a possible loss or range of loss in respect of this matter because of the inherent uncertainty regarding the outcome of complex litigation, the fact that plaintiffs did not specify an amount of damages sought in their complaint, and the fact that, to date, we have not engaged in settlement negotiations.
On October 1, 2003, a class action complaint entitled Erb, et al. v. Alliance Capital Management L.P. (“Erb Complaint”) was filed in the Circuit Court of St. Clair County, Illinois, against AllianceBernstein. The plaintiff, purportedly a shareholder in Large Cap Growth Fund, alleged that AllianceBernstein breached unidentified provisions of Large Cap Growth Fund’s prospectus and subscription and confirmation agreements that allegedly required that every security bought for Large Cap Growth Fund’s portfolio must be a “1-rated” stock, the highest rating that AllianceBernstein’s research analysts could assign. Plaintiff alleges that AllianceBernstein impermissibly purchased shares of stocks that were not 1-rated. On June 24, 2004, plaintiff filed an amended complaint (“Amended Erb Complaint”) in the Circuit Court of St. Clair County, Illinois. The Amended Erb Complaint allegations are substantially similar to those contained in the previous complaint, however, the Amended Erb Complaint adds a new plaintiff and seeks to allege claims on behalf of a purported class of persons or entities holding an interest in any portfolio managed by AllianceBernstein’s Large Cap Growth Team. The Amended Erb Complaint alleges that AllianceBernstein breached its contracts with these persons or entities by impermissibly purchasing shares of stocks that were not 1-rated. Plaintiffs seek rescission of all purchases of any non-1-rated stocks AllianceBernstein made for Large Cap Growth Fund and other Large Cap Growth Team clients’ portfolios over the past eight years, as well as an unspecified amount of damages. On July 13, 2004, AllianceBernstein removed the Erb action to the United States District Court for the Southern District of Illinois on the basis that plaintiffs’ claims are preempted under the Securities Litigation Uniform Standards Act. On August 30, 2004, the District Court remanded the action to the Circuit Court. On September 15, 2004, AllianceBernstein filed a notice of appeal with respect to the District Court’s order. On December 23, 2004, plaintiffs moved to dismiss AllianceBernstein’s appeal. On September 2, 2005, AllianceBernstein’s appeal was denied.
We believe that plaintiffs’ allegations in the Amended Erb Complaint are without merit and intend to vigorously defend against these allegations. At the present time, we are unable to predict the outcome or estimate a possible loss or range of loss in respect of this matter because of the inherent uncertainty regarding the outcome of complex litigation and the fact that plaintiffs did not specify an amount of damages sought in their complaint.
Market Timing-related Matters
On October 2, 2003, a purported class action complaint entitled Hindo, et al. v. AllianceBernstein Growth &
28
Income Fund, et al. (“Hindo Complaint”) was filed against AllianceBernstein, Holding, the General Partner, AXA Financial, the U.S. Funds, the registrants and issuers of those funds, certain officers of AllianceBernstein (“Alliance defendants”), and certain unaffiliated defendants, as well as unnamed Doe defendants. The Hindo Complaint was filed in the United States District Court for the Southern District of New York by alleged shareholders of two of the U.S. Funds. The Hindo Complaint alleges that certain of the Alliance defendants failed to disclose that they improperly allowed certain hedge funds and other unidentified parties to engage in “late trading” and “market timing” of U.S. Fund securities, violating Sections 11 and 15 of the Securities Act, Sections 10(b) and 20(a) of the Exchange Act, and Sections 206 and 215 of the Investment Advisers Act of 1940, as amended (“Advisers Act”). Plaintiffs seek an unspecified amount of compensatory damages and rescission of their contracts with AllianceBernstein, including recovery of all fees paid to AllianceBernstein pursuant to such contracts.
Since October 2, 2003, 43 additional lawsuits making factual allegations generally similar to those in the Hindo Complaint were filed in various federal and state courts against AllianceBernstein and certain other defendants, and others may be filed. The plaintiffs in such lawsuits have asserted a variety of theories for recovery including, but not limited to, violations of the Securities Act, the Exchange Act, the Advisers Act, the Investment Company Act, the Employee Retirement Income Security Act of 1974, as amended (“ERISA”), certain state securities laws, and common law. All state court actions against AllianceBernstein either were voluntarily dismissed or removed to federal court.
On February 20, 2004, the Judicial Panel on Multidistrict Litigation (“MDL Panel”) transferred all federal actions to the United States District Court for the District of Maryland (“Mutual Fund MDL”). All of the actions removed to federal court also were transferred to the Mutual Fund MDL. The plaintiffs in the removed actions have since moved for remand, and that motion is pending.
On September 29, 2004, plaintiffs filed consolidated amended complaints with respect to four claim types: mutual fund shareholder claims; mutual fund derivative claims; derivative claims brought on behalf of Holding; and claims brought under ERISA by participants in the Profit Sharing Plan for Employees of AllianceBernstein. All four complaints include substantially identical factual allegations, which appear to be based in large part on the SEC Order and the NYAG AoD. The claims in the mutual fund derivative consolidated amended complaint are generally based on the theory that all fund advisory agreements, distribution agreements and 12b-1 plans between AllianceBernstein and the U.S. Funds should be invalidated, regardless of whether market timing occurred in each individual fund, because each was approved by fund trustees on the basis of materially misleading information with respect to the level of market timing permitted in funds managed by AllianceBernstein. The claims asserted in the other three consolidated amended complaints are similar to those that the respective plaintiffs asserted in their previous federal lawsuits. All of these lawsuits seek an unspecified amount of damages.
On February 10, 2004, we received (i) a subpoena duces tecum from the Office of the Attorney General of the State of West Virginia and (ii) a request for information from the Office of the State Auditor, Securities Commission, for the State of West Virginia (“WV Securities Commissioner”) (subpoena and request together, the “Information Requests”). Both Information Requests required us to produce documents concerning, among other things, any market timing or late trading in our sponsored mutual funds. We responded to the Information Requests and have been cooperating fully with the investigation.
On April 11, 2005, a complaint entitled The Attorney General of the State of West Virginia v. AIM Advisors, Inc., et al. (“WVAG Complaint”) was filed against AllianceBernstein, Holding, and various unaffiliated defendants. The WVAG Complaint was filed in the Circuit Court of Marshall County, West Virginia by the Attorney General of the State of West Virginia. The WVAG Complaint makes factual allegations generally similar to those in the Hindo Complaint. On May 31, 2005, defendants removed the WVAG Complaint to the United States District Court for the Northern District of West Virginia. On July 12, 2005, plaintiff moved to remand. On October 19, 2005, the WVAG Complaint was transferred to the Mutual Fund MDL.
On August 30, 2005, the WV Securities Commissioner signed a “Summary Order to Cease and Desist, and Notice of Right to Hearing” addressed to AllianceBernstein and Holding. The Summary Order claims that AllianceBernstein and Holding violated the West Virginia Uniform Securities Act and makes factual allegations
29
generally similar to those in the SEC Order and NYAG AoD. On January 26, 2006, AllianceBernstein, Holding, and various unaffiliated defendants filed a Petition for Writ of Prohibition and Order Suspending Proceedings in West Virginia state court seeking to vacate the Summary Order and for other relief.
We intend to vigorously defend against the allegations in the WVAG Complaint. At the present time, we are unable to predict the outcome or estimate a possible loss or range of loss in respect of this matter because of the inherent uncertainty regarding the outcome of complex litigation, the fact that plaintiffs did not specify an amount of damages sought in their complaint, and the fact that, to date, we have not engaged in settlement negotiations.
We previously concluded that the likelihood of a negative outcome in the market timing-related matters (excluding the WVAG Complaint) is probable. As previously disclosed, AllianceBernstein recorded charges totaling $330 million during the second half of 2003, of which (i) $250 million was paid to the Restitution Fund (the $250 million was funded out of operating cash flow and paid to the SEC in January 2004), (ii) $30 million was used to settle a private civil mutual fund litigation unrelated to any regulatory agreements, and (iii) $50 million was reserved for estimated expenses related to our market-timing settlements with the SEC and the NYAG and our market timing-related liabilities (excluding WVAG Complaint-related expenses). AllianceBernstein paid $8 million during 2005 related to market timing and has cumulatively paid $310 million (excluding WVAG Complaint-related expenses). Including $10 million in charges taken in prior periods, we have reserves of approximately $30 million available for market timing-related liabilities in future periods.
We cannot determine at this time the eventual outcome, timing, or impact of the market timing-related matters. Accordingly, it is possible that additional charges in the future may be required, the amount, timing, and impact of which we are unable to estimate at this time.
Revenue Sharing-related Matters
On June 22, 2004, a purported class action complaint entitled Aucoin, et al. v. Alliance Capital Management L.P., et al. (“Aucoin Complaint”) was filed against AllianceBernstein, Holding, the General Partner, AXA Financial, AllianceBernstein Investments, certain current and former directors of the U.S. Funds, and unnamed Doe defendants. The Aucoin Complaint names the U.S. Funds as nominal defendants. The Aucoin Complaint was filed in the United States District Court for the Southern District of New York by an alleged shareholder of the AllianceBernstein Growth & Income Fund. The Aucoin Complaint alleges, among other things, (i) that certain of the defendants improperly authorized the payment of excessive commissions and other fees from U.S. Fund assets to broker-dealers in exchange for preferential marketing services, (ii) that certain of the defendants misrepresented and omitted from registration statements and other reports material facts concerning such payments, and (iii) that certain defendants caused such conduct as control persons of other defendants. The Aucoin Complaint asserts claims for violation of Sections 34(b), 36(b) and
48(a) of the Investment Company Act, Sections 206 and 215 of the Advisers Act, breach of common law fiduciary duties, and aiding and abetting breaches of common law fiduciary duties. Plaintiffs seek an unspecified amount of compensatory damages and punitive damages, rescission of their contracts with AllianceBernstein, including recovery of all fees paid to AllianceBernstein pursuant to such contracts, an accounting of all U.S. Fund-related fees, commissions and soft dollar payments, and restitution of all unlawfully or discriminatorily obtained fees and expenses.
Since June 22, 2004, nine additional lawsuits making factual allegations substantially similar to those in the Aucoin Complaint were filed against AllianceBernstein and certain other defendants. All nine of the lawsuits (i) were brought as class actions filed in the United States District Court for the Southern District of New York, (ii) assert claims substantially identical to the Aucoin Complaint, and (iii) are brought on behalf of shareholders of U.S. Funds.
On February 2, 2005, plaintiffs filed a consolidated amended class action complaint (“Aucoin Consolidated Amended Complaint”) that asserts claims substantially similar to the Aucoin Complaint and the nine additional lawsuits referenced above. On October 19, 2005, the District Court dismissed each of the claims set forth in the Aucoin Consolidated Amended Complaint, except for plaintiff’s claim under Section 36(b) of the Investment Company Act. On January 11, 2006, the District Court granted defendants’ motion for reconsideration and dismissed the remaining Section 36(b) claim. Plaintiffs have moved for leave to amend their consolidated complaint.
30
We believe that plaintiff’s allegations in the Aucoin Consolidated Amended Complaint are without merit and intend to vigorously defend against these allegations. At the present time, we are unable to predict the outcome or estimate a possible loss or range of loss in respect of this matter because of the inherent uncertainty regarding the outcome of complex litigation, the fact that plaintiffs did not specify an amount of damages sought in their complaint, and the fact that, to date, we have not engaged in settlement negotiations.
We are involved in various other inquiries, administrative proceedings, and litigation, some of which allege substantial damages. While any proceeding or litigation has the element of uncertainty, we believe that the outcome of any one of the other lawsuits or claims that is pending or threatened, or all of them combined, will not have a material adverse effect on our results of operations or financial condition.
Item 4. Submission of Matters to a Vote of Security Holders
Neither AllianceBernstein nor Holding submitted a matter to a vote of security holders during the fourth quarter of 2005.
31
PART II
Item 5. Market for Registrant’s Common Equity, Related Stockholder Matters and Issuer Purchases of Equity Securities
Market for Holding Units and AllianceBernstein Units; Cash Distributions
Holding Units trade publicly on the NYSE. Holding Units currently trade under the ticker symbol “AC” but, beginning February 27, 2006, will trade under the ticker symbol “AB”.
There is no established public trading market for AllianceBernstein Units, which are subject to significant restrictions on transfer. In general, transfers of AllianceBernstein Units will be allowed only with the written consent of both AXA Equitable and the General Partner. Generally, neither AXA Equitable nor the General Partner will permit any transfer that it believes would create a risk that AllianceBernstein would be treated as a corporation for tax purposes. AXA Equitable and the General Partner have implemented a transfer policy, a copy of which you may request from our corporate secretary (corporate.secretary@alliancebernstein.com). Also, we filed the transfer program with the SEC as Exhibit 10.3 to our 2003 Form 10-K, a copy of which you can find at http://www.alliancebernstein.com.
Each of Holding and AllianceBernstein distributes on a quarterly basis all of its Available Cash Flow, as defined in the Holding Partnership Agreement and AllianceBernstein Partnership Agreement, to its unitholders and the General Partner. For additional information concerning distribution of Available Cash Flow by Holding, see Note 7 in Holding’s financial statements in Item 8. For additional information concerning distribution of Available Cash Flow by AllianceBernstein, see Note 22 in AllianceBernstein’s consolidated financial statements in Item 8.
Holding’s principal source of income and cash flow is attributable to its investment in AllianceBernstein.
The tables set forth below provide the distributions of Available Cash Flow made by AllianceBernstein and Holding during 2005 and 2004 and the high and low sale prices of Holding Units on the NYSE during 2005 and 2004:
| | Quarters Ended 2005 | |
| | December 31 | | September 30 | | June 30 | | March 31 | |
| | | | | | | | | |
Cash distributions per AllianceBernstein Unit(1) | | $ | 1.12 | | $ | 0.82 | | $ | 0.76 | | $ | 0.63 | |
Cash distributions per Holding Unit(1) | | $ | 1.02 | | $ | 0.74 | | $ | 0.68 | | $ | 0.56 | |
Holding Unit prices: | | | | | | | | | |
High | | $ | 58.46 | | $ | 48.39 | | $ | 47.75 | | $ | 49.90 | |
Low | | $ | 46.00 | | $ | 43.65 | | $ | 42.35 | | $ | 40.25 | |
| | Quarters Ended 2004 | |
| | December 31 | | September 30 | | June 30 | | March 31 | |
| | | | | | | | | |
Cash distributions per AllianceBernstein Unit(1) | | $ | 0.90 | | $ | 0.59 | | $ | 0.61 | | $ | 0.30 | |
Cash distributions per Holding Unit(1) | | $ | 0.82 | | $ | 0.52 | | $ | 0.53 | | $ | 0.14 | |
Holding Unit prices: | | | | | | | | | |
High | | $ | 42.30 | | $ | 36.03 | | $ | 37.60 | | $ | 39.00 | |
Low | | $ | 35.50 | | $ | 32.35 | | $ | 31.47 | | $ | 34.03 | |
(1) Declared and paid during the following quarter.
32
On January 31, 2006, the closing price of Holding Units on the NYSE was $60.44 per Unit and there were approximately 1,180 Holding Unitholders of record for approximately 78,000 beneficial owners. On January 31, 2006, there were approximately 511 AllianceBernstein Unitholders of record, and we do not believe there are substantial additional beneficial owners.
Securities Authorized for Issuance under Equity Compensation Plans
The following table summarizes the Holding Units to be issued pursuant to equity compensation plans as of January 31, 2006.
Equity Compensation Plan Information(1)
Plan Category | | Number of securities to be
issued upon exercise of
outstanding options,
warrants and rights
(a) | | Weighted average
exercise price of
outstanding options,
warrants and rights
(b) | | Number of securities
remaining available for
future issuance
(c) | |
Equity compensation plans approved by security holders | | 6,897,104 | | $ | 40.52 | | 29,145,322 | |
Equity compensation plans not approved by security holders | | — | | — | | — | |
Total | | 6,897,104 | | $ | 40.52 | | 29,145,322 | |
(1) The figures in this table do not include cash awards under certain of AllianceBernstein’s deferred compensation plans pursuant to which employees (including those employees who qualify as “named executive officers”; see Item 11) may choose to invest notionally a portion of such awards in Holding Units. AllianceBernstein satisfies its obligations under these plans by purchasing Holding Units rather than issuing new Holding Units, which is prohibited under the plans. For additional information concerning such plans, see Note 15 of AllianceBernstein’s consolidated financial statements in Item 8.
There are no AllianceBernstein Units to be issued pursuant to an equity compensation plan.
Recent Sales of Unregistered Securities; Use of Proceeds from Registered Securities
As reported in our Form 10-Q for the quarter ended March 31, 2005, on February 25, 2005 and April 1, 2004, we allocated 131,873 and 262,510 Holding Units, respectively, with aggregate values of $5,538,640 and $9,191,996, respectively, for the benefit of certain of our employees under an employee award plan. An exemption from registration under Section 4(2) of the Securities Act was available for the allocation of the Holding Units because such transactions did not involve a public offering.
33
Purchases of Equity Securities by the Issuer and Affiliated Purchasers
The following table provides information relating to any Holding Units bought by us or one of our affiliates in the fourth quarter of the fiscal year covered by this report:
Issuer Purchases of Equity Securities(1)
Period | | (a)
Total Number
of Holding Units
Purchased | | (b)
Average Price
Paid
Per Holding
Unit, net of
Commissions | | (c)
Total Number of
Holding Units
Purchased as
Part of Publicly
Announced Plans
or Programs | | (d)
Maximum
Number
(or Approximate
Dollar Value) of
Holding Units that
May Yet Be
Purchased Under
the Plans or
Programs | |
10/1/05-10/31/05(1)(2) | | 222,154 | | $ | 48.52 | | 30,000 | | — | |
11/1/05-11/30/05(1) | | 272,500 | | 53.95 | | 272,500 | | — | |
12/1/05-12/31/05(3) | | 39,880 | | 54.75 | | — | | — | |
Total | | 534,534 | | $ | 51.77 | | 302,500 | | — | |
(1) On October 26, 2005, we announced that we intended to engage in open-market purchases of up to 500,000 Holding Units to fund obligations under certain of our employee deferred compensation plans. On October 31, 2005, we bought 30,000 Holding Units at an average price of $52.83 per Unit and, from November 1, 2005 through November 14, 2005, we bought 272,500 Holding Units at an average price of $53.95 per Unit.
(2) On October 2, 2005, we purchased 192,154 Holding Units at $47.85 per Unit from employees to allow them to fulfill statutory withholding tax requirements at the time of distribution of deferred compensation awards.
(3) On December 1, 2005, we purchased these Holding Units from employees to allow them to fulfill statutory withholding tax requirements at the time of distribution of deferred compensation awards.
The following table provides information relating to any AllianceBernstein Units bought by us or one of our affiliates in the fourth quarter of the fiscal year covered by this report:
Issuer Purchases of Equity Securities(1)
Period | | (a)
Total Number
of
AllianceBernstein
Units Purchased | | (b)
Average Price
Paid Per
AllianceBernstein
Unit, net of
Commissions | | (c)
Total Number of
AllianceBernstein
Units Purchased as
Part of Publicly
Announced Plans
or Programs | | (d)
Maximum
Number
(or Approximate
Dollar Value) of
AllianceBernstein
Units that May Yet
Be Purchased
Under the Plans or
Programs | |
10/1/05-10/31/05 | | — | | $ | — | | — | | — | |
11/1/05-11/30/05 | | — | | — | | — | | — | |
12/1/05-12/31/05 | | 400,000 | | 51.80 | | — | | — | |
Total | | 400,000 | | $ | 51.80 | | — | | — | |
(1) On December 1, 2005, AXA Equitable purchased 400,000 AllianceBernstein Units from a former director of the General Partner in a private transaction.
34
Item 6. Selected Financial Data
ALLIANCEBERNSTEIN HOLDING L.P.
Selected Financial Data
(in thousands, except per unit amounts)
| | Years Ended December 31, | |
| | 2005 | | 2004 | | 2003 | | 2002 | | 2001 | |
INCOME STATEMENT DATA: | | | | | | | | | | | |
Equity in earnings of AllianceBernstein | | $ | 275,054 | | $ | 219,971 | | $ | 100,424 | | $ | 183,695 | | $ | 182,020 | |
Income taxes | | 26,990 | | 24,798 | | 21,819 | | 21,653 | | 22,729 | |
Net income | | $ | 248,064 | | $ | 195,173 | | $ | 78,605 | | $ | 162,042 | | $ | 159,291 | |
Basic net income per unit | | $ | 3.04 | | $ | 2.45 | | $ | 1.02 | | $ | 2.14 | | $ | 2.15 | |
Diluted net income per unit | | $ | 3.02 | | $ | 2.43 | | $ | 1.01 | | $ | 2.11 | | $ | 2.10 | |
CASH DISTRIBUTIONS PER UNIT(1) | | $ | 3.00 | | $ | 2.01 | | $ | 1.45 | | $ | 2.15 | | $ | 2.73 | |
BALANCE SHEET DATA AT PERIOD END: | | | | | | | | | | | |
Total assets | | $ | 1,377,054 | | $ | 1,303,446 | | $ | 1,166,097 | | $ | 1,237,546 | | $ | 1,230,344 | |
Partners’ capital | | $ | 1,368,846 | | $ | 1,295,670 | | $ | 1,158,606 | | $ | 1,230,543 | | $ | 1,222,037 | |
(1) Holding is required to distribute all of its Available Cash Flow, as defined in the Holding Partnership Agreement, to its unitholders.
35
ALLIANCEBERNSTEIN L.P.
Selected Consolidated Financial Data
(in thousands, except per unit amounts and unless otherwise indicated)
| | Years Ended December 31, | |
| | 2005 | | 2004 | | 2003 | | 2002 | | 2001 | |
INCOME STATEMENT DATA: | | | | | | | | | | | |
Revenues: | | | | | | | | | | | |
Investment advisory and services fees | | $ | 2,290,867 | | $ | 2,113,351 | | $ | 1,882,399 | | $ | 1,847,876 | | $ | 2,023,766 | |
Distribution revenues | | 397,800 | | 447,283 | | 436,037 | | 467,463 | | 544,605 | |
Institutional research services | | 321,281 | | 303,609 | | 267,868 | | 294,910 | | 265,815 | |
Shareholder servicing fees(1) | | 99,358 | | 115,979 | | 126,383 | | 136,871 | | 124,508 | |
Other revenues, net | | 141,374 | | 75,211 | | 52,241 | | 30,604 | | 62,388 | |
| | 3,250,680 | | 3,055,433 | | 2,764,928 | | 2,777,724 | | 3,021,082 | |
Expenses: | | | | | | | | | | | |
Employee compensation and benefits | | 1,263,456 | | 1,085,163 | | 914,529 | | 907,075 | | 930,672 | |
Promotion and servicing: | | | | | | | | | | | |
Distribution plan payments | | 291,953 | | 374,184 | | 370,575 | | 392,780 | | 429,056 | |
Amortization of deferred sales commissions | | 131,979 | | 177,356 | | 208,565 | | 228,968 | | 230,793 | |
Other(1) | | 198,004 | | 202,327 | | 197,079 | | 228,624 | | 261,739 | |
General and administrative | | 386,590 | | 426,389 | | 339,706 | | 329,059 | | 311,958 | |
Interest | | 25,109 | | 24,232 | | 25,286 | | 27,385 | | 32,051 | |
Amortization of goodwill and intangible assets | | 20,700 | | 20,700 | | 20,700 | | 20,700 | | 172,638 | |
Charge for mutual fund matters and legal proceedings | | — | | — | | 330,000 | | — | | — | |
| | 2,317,791 | | 2,310,351 | | 2,406,440 | | 2,134,591 | | 2,368,907 | |
Income before income taxes | | 932,889 | | 745,082 | | 358,488 | | 643,133 | | 652,175 | |
Income taxes | | 64,571 | | 39,932 | | 28,680 | | 32,155 | | 37,550 | |
Net income | | $ | 868,318 | | $ | 705,150 | | $ | 329,808 | | $ | 610,978 | | $ | 614,625 | |
Basic net income per unit | | $ | 3.37 | | $ | 2.76 | | $ | 1.30 | | $ | 2.42 | | $ | 2.45 | |
Diluted net income per unit | | $ | 3.35 | | $ | 2.74 | | $ | 1.29 | | $ | 2.39 | | $ | 2.40 | |
Pre-tax margin(2) | | 28.7 | % | 24.4 | % | 13.0 | % | 23.2 | % | 21.6 | % |
CASH DISTRIBUTIONS PER UNIT(3) | | $ | 3.33 | | $ | 2.40 | | $ | 1.65 | | $ | 2.44 | | $ | 3.03 | |
BALANCE SHEET DATA AT PERIOD END: | | | | | | | | | | | |
Total assets | | $ | 9,490,480 | | $ | 8,779,330 | | $ | 8,171,669 | | $ | 7,217,970 | | $ | 8,175,393 | |
Debt | | $ | 407,291 | | $ | 407,517 | | $ | 405,327 | | $ | 426,907 | | $ | 627,609 | |
Partners’ capital | | $ | 4,302,674 | | $ | 4,183,698 | | $ | 3,778,469 | | $ | 3,963,451 | | $ | 3,988,160 | |
ASSETS UNDER MANAGEMENT AT PERIOD END (in millions)(4) | | $ | 578,552 | | $ | 538,764 | | $ | 477,267 | | $ | 388,743 | | $ | 452,272 | |
(1) Certain prior year amounts have been reclassified to conform to our 2005 presentation: we reclassified certain sub-accounting payments and networking fees from other promotion and servicing expense to shareholder servicing fees.
(2) Income before income taxes as a percentage of total revenues.
(3) AllianceBernstein is required to distribute all of its Available Cash Flow, as defined in the AllianceBernstein Partnership Agreement, to its unitholders and the General Partner.
(4) Assets under management in prior years have been reclassified and certain fixed income assets previously reported at cost are now being reported at market value. Excludes certain non-discretionary client relationships and assets managed by unconsolidated affiliates.
36
Item 7. Management’s Discussion and Analysis of Financial Condition and Results of Operations
Holding
Holding’s principal source of income and cash flow is attributable to its investment in AllianceBernstein. The Holding financial statements and notes and management’s discussion and analysis of financial condition and results of operations should be read in conjunction with those of AllianceBernstein.
Results of Operations
| | Years Ended December 31, | | % Change | |
| | 2005 | | 2004 | | 2003 | | 2005-04 | | 2004-03 | |
| | | | (in thousands) | | | | | | | |
| | | | | | | | | | | |
AllianceBernstein net income | | $ | 868,318 | | $ | 705,150 | | $ | 329,808 | | 23.1 | % | 113.8 | % |
Weighted average equity ownership interest | | 31.7 | % | 31.2 | % | 30.4 | % | | | | |
Equity in earnings of AllianceBernstein | | $ | 275,054 | | $ | 219,971 | | $ | 100,424 | | 25.0 | | 119.0 | |
| | | | | | | | | | | |
Net income of Holding | | $ | 248,064 | | $ | 195,173 | | $ | 78,605 | | 27.1 | | 148.3 | |
Diluted net income per unit | | $ | 3.02 | | $ | 2.43 | | $ | 1.01 | | 24.3 | | 140.6 | |
Distribution per unit | | $ | 3.00 | | $ | 2.01 | | $ | 1.45 | | 49.3 | % | 38.6 | % |
Equity in earnings of AllianceBernstein, net income and diluted net income per unit significantly decreased in 2003 and increased in 2004 as a result of AllianceBernstein’s $330 million in charges taken during the second half of 2003, of which (i) $250 million was paid to the Restitution Fund, (ii) $30 million was used to settle a private civil mutual fund litigation unrelated to any regulatory agreements, and (iii) $50 million was reserved for estimated expenses related to our market-timing settlements with the SEC and the NYAG and our market timing-related liabilities (“2003 Market Timing Charges”).
Capital Resources and Liquidity
| | Years Ended December 31, | | % Change | |
| | 2005 | | 2004 | | 2003 | | 2005-04 | | 2004-03 | |
| | (in millions, except per unit amounts) | | | | | |
| | | | | | | | | | | |
Partners’ capital, as of December 31 | | $ | 1,368.8 | | $ | 1,295.7 | | $ | 1,158.6 | | 5.6 | % | 11.8 | % |
Distributions received | | 253.2 | | 119.8 | | 172.5 | | 111.3 | | (30.5 | ) |
Proceeds from exercise of options | | 42.4 | | 46.7 | | 21.6 | | (9.2 | ) | 116.6 | |
Distributions paid | | (226.7 | ) | (95.4 | ) | (151.5 | ) | 137.6 | | (37.0 | ) |
Available cash flow | | 245.4 | | 161.1 | | 112.1 | | 52.3 | | 43.7 | |
| | | | | | | | | | | | | | |
The significant factors affecting the change in partners’ capital year-to-year are net income and proceeds from the exercise of options for Holding Units, both increasing partners’ capital, and cash distributions paid to unitholders, decreasing partners’ capital. See Statements of Changes in Partners’ Capital and Comprehensive Income in Item 8 for further details. Holding is required to distribute all of its Available Cash Flow, as defined in the Holding Partnership Agreement, to its unitholders. Available Cash Flow in 2005 was significantly higher than in 2004 and 2003 due to the 2003 Market Timing Charges. The third quarter 2003 distribution was declared prior to the recording of these charges. Over the next two quarters, distributions were reduced, reflecting these charges and, commencing in second quarter 2004, quarterly distributions returned to traditional levels in relation to cash flow.
AllianceBernstein paid $8 million during 2005 related to market timing-related matters and has cumulatively paid $310 million. Including $10 million in charges taken in prior periods, AllianceBernstein has reserves of approximately $30 million available for market timing-related liabilities in future periods. We cannot determine at this time the eventual outcome, timing, or impact of market timing-related matters. Accordingly, it is possible that additional charges in the future may be required, the amount, timing, and impact of which we are unable to estimate at this time.
Cash and cash equivalents were $89,000 as of December 31, 2005 and zero as of December 31, 2004, and 2003. Cash inflows from AllianceBernstein distributions received were offset by cash distributions paid to unitholders, income taxes paid, and the movement in other working capital items. Management believes that the cash flow from its investment in AllianceBernstein will provide Holding with the resources to meet its financial obligations.
Commitments and Contingencies
See Note 6 of the Holding financial statements contained in Item 8.
37
AllianceBernstein
Executive Overview
We provide diversified investment management services to institutional clients, high-net-worth clients and retail investors. As of December 31, 2005, we had client assets under management of approximately $579 billion, an increase of 7.4% over December 31, 2004, invested in growth and value equities, blended equities, fixed income, balanced, and index/structured services. Our strategy is to continue to expand and leverage our extensive, global research capabilities to provide both innovative and time-tested wealth management solutions to help our clients achieve investment success and peace of mind. Through Sanford C. Bernstein & Co., LLC and Sanford C. Bernstein Limited (each a wholly-owned subsidiary), we provide in-depth research, portfolio strategy and trade execution services to institutional clients. Importantly, we are striving to ensure that our firm’s culture is one in which client interests are always placed first and the highest ethical standards are maintained.
Our revenues are primarily earned for managing the investment assets of our clients. These revenues vary with the total value of our assets under management, which increase or decrease depending upon:
• capital market appreciation or depreciation,
• investment returns achieved for clients, and
• asset inflows or outflows from new and existing clients.
Both our fourth quarter and full year financial results exceeded our expectations. Our fourth quarter reflected strong investment performance, strong net asset inflows, and improved financial results. Overall, our relative investment returns were competitive. In growth equities, we outperformed benchmarks in many of our key services, including large cap growth, U.S. growth and mid-cap growth services. While growth equities outperformed value equities for a third consecutive quarter, value equities still posted good returns, especially over the longer term. Our style blend equity services performed well, especially in global style blend which had excellent one-year performance results. With this solid performance, we believe we are positioned well to gather additional assets as the shift toward growth style investing continues.
Additionally, 2005 exhibited strong organic growth among all client groups. For the year, we brought in over $80 billion in gross asset flows and $27 billion in net asset flows (before dispositions and market appreciation), both firm records. Value equity fundings led the way with nearly $35 billion and $22 billion in gross and net inflows, respectively.
Institutional Investment Services AUM accounted for 62.0% of our overall AUM. For the year, we had record inflows of $20 billion, owing mainly to the strength in our global and international services. Institutional flows continued to be well diversified geographically and among investment services. Looking ahead, we expect to continue to focus on building our global institutional investment platforms in the Asia-Pacific region, and expanding our presence in continental Europe.
Retail Services ending AUM was up 6.1% for the year, excluding the effect of the dispositions of cash management services and Indian mutual funds assets of nearly $29 billion. Non-U.S. retail inflows continued at a healthy pace, while, in the U.S., our separately managed account business strengthened. However, we continued to experience net U.S. fund outflows, although at a declining rate.
We are confident that Retail Services have begun to stabilize. Our new asset allocation services, such as our target-date retirement funds, are geared toward investors’ long-term interests and have been gaining visibility. These services present us with an opportunity to capture assets in the increasingly important retirement arena. Looking ahead, we will continue to rebuild and enhance our presence in Japan and to upgrade and enlarge our U.S. and non-U.S. sales forces.
Our Private Client Services comprised nearly $75 billion in AUM, a 17.1% increase during 2005. Net inflows totaled almost $7 billion during 2005, but leveled off somewhat during the fourth quarter owing to seasonal factors. Throughout 2005 we continued to invest in our Private Client business — opening up new offices and adding staff. We increased the number of financial advisors during 2005 to 263, an increase of 36.3% from 193 at the end of 2004.
In 2006, we plan to open our first non-U.S. Private Client Services office in London, and to build a deeper presence in the U.S. by increasing the number of financial advisors by 10.3% to 290 by the end of 2006.
Institutional Research Services recorded $321 million in revenues for the year, an increase of 5.8% over 2004. Within the U.S., higher revenues resulted from higher market share and transaction volume, offset partially by lower revenue yields from a shift to program trading and continued industry-wide brokerage commission pricing
38
declines. Our market share gains are the result of the consistent high quality of our research. In London, we achieved 25.6% revenue growth in 2005. The broadening of our trading platforms in the U.S. and the expansion of our research, trading, and sales capabilities in Europe have proven to be successful. On that note, we were again highly-ranked in a recent Institutional Investor survey of best U.S. independent research firms. As we look to 2006, we plan to launch Asian distribution of our U.S. and European research and launch a new electronic trading offering in London.
Recent declines in commission rates charged by broker-dealers are likely to continue and may accelerate. Increasing use of electronic trading networks (which permit investors to execute securities transactions at a fraction of typical full-service broker-dealer charges) and pressure exerted by funds and institutional investors are likely to result in continuing, perhaps significant, declines in commission rates, which would, in turn, reduce the revenues generated by Institutional Research Services.
Looking ahead, the most significant initiative that benefits all of our clients is our continued investment in research, a core competency of our firm. We have a broad foundation in fundamental and quantitative research. Our fundamental research includes comprehensive industry and company coverage from growth, value and fixed income perspectives. More recent activity in this area includes our new research office in Shanghai, China, as well as our Early Stage Growth and Strategic Change units focusing on advancing technologies. Our current focus in quantitative research is based on three areas: finding and exploiting pricing anomalies in the capital markets, solving complex investment planning problems, and utilizing portfolio construction tools to optimize global portfolios. We intend to develop additional research initiatives in the foreseeable future.
Assets Under Management
Starting in 2005 we revised the way we classified our assets under management to better align publicly reported assets under management with our internal reporting, and for consistency our assets under management as of December 31, 2004 and previous years have been reclassified by investment service and distribution channel, including the fixed income components of balanced accounts previously reported in equity. As a result, as of December 31, 2004, approximately $11 billion in assets under management were reclassified from equity ($6 billion from growth equity and $5 billion from value equity) to fixed income. In addition, certain fixed income assets managed for insurance company clients previously reported at cost are now being reported at market value, resulting in approximate increases in fixed income assets under management of between $2 billion and $3 billion at each reporting date. This change did not impact reported revenues, nor will it impact future revenues.
Assets under management by distribution channel were as follows:
| | As of December 31, | | % Change | |
| | 2005 | | 2004 | | 2003 | | 2005-04 | | 2004-03 | |
| | | | (in billions) | | | | | | | |
| | | | | | | | | | | |
Institutional Investment | | $ | 358.6 | | $ | 311.3 | | $ | 267.8 | | 15.2 | % | 16.2 | % |
Retail | | 145.1 | | 163.5 | | 155.9 | | (11.3 | ) | 4.9 | |
Private Client | | 74.9 | | 64.0 | | 53.6 | | 17.1 | | 19.3 | |
Total | | $ | 578.6 | | $ | 538.8 | | $ | 477.3 | | 7.4 | % | 12.9 | % |
39
Assets under management by investment service were as follows:
| | As of December 31, | | % Change | |
| | 2005 | | 2004 | | 2003 | | 2005-04 | | 2004-03 | |
| | | | (in billions) | | | | | | | |
| | | | | | | | | | | |
Growth Equity: | | | | | | | | | | | |
U.S. | | $ | 80.9 | | $ | 80.1 | | $ | 90.5 | | 1.1 | % | (11.5 | )% |
Global & international | | 65.3 | | 43.2 | | 33.9 | | 51.0 | | 27.3 | |
| | 146.2 | | 123.3 | | 124.4 | | 18.6 | | (0.9 | ) |
Value Equity: | | | | | | | | | | | |
U.S. | | 106.9 | | 105.5 | | 94.0 | | 1.3 | | 12.3 | |
Global & international | | 131.3 | | 87.1 | | 53.8 | | 50.8 | | 62.0 | |
| | 238.2 | | 192.6 | | 147.8 | | 23.7 | | 30.3 | |
Fixed income: | | | | | | | | | | | |
U.S. | | 108.5 | | 143.2 | | 139.6 | | (24.2 | ) | 2.6 | |
Global & international | | 55.6 | | 50.2 | | 37.0 | | 10.8 | | 35.6 | |
| | 164.1 | | 193.4 | | 176.6 | | (15.1 | ) | 9.5 | |
Index/Structured: | | | | | | | | | | | |
U.S. | | 25.3 | | 23.6 | | 22.1 | | 6.9 | | 7.0 | |
Global & international | | 4.8 | | 5.9 | | 6.4 | | (18.1 | ) | (7.8 | ) |
| | 30.1 | | 29.5 | | 28.5 | | 1.9 | | 3.6 | |
Total: | | | | | | | | | | | |
U.S. | | 321.6 | | 352.4 | | 346.2 | | (8.8 | ) | 1.8 | |
Global & international | | 257.0 | | 186.4 | | 131.1 | | 37.9 | | 42.1 | |
Total | | $ | 578.6 | | $ | 538.8 | | $ | 477.3 | | 7.4 | % | 12.9 | % |
Changes in assets under management during 2005 were as follows (in billions):
| | Distribution Channel | | Investment Service | |
| | Institutional
Investment | | Retail | | Private
Client | | Total | | Growth
Equity | | Value
Equity | | Fixed
Income | | Index/
Structured | | Total | |
| | | | | | | | | | | | | | | | | | | |
Balance as of January 1, 2005 | | $ | 311.3 | | $ | 163.5 | | $ | 64.0 | | $ | 538.8 | | $ | 123.3 | | $ | 192.6 | | $ | 193.4 | | $ | 29.5 | | $ | 538.8 | |
Long-term flows: | | | | | | | | | | | | | | | | | | | |
Sales/new accounts | | 39.5 | | 30.4 | | 10.8 | | 80.7 | | 27.5 | | 34.6 | | 18.1 | | 0.5 | | 80.7 | |
Redemptions/terminations | | (19.2 | ) | (27.5 | ) | (2.8 | ) | (49.5 | ) | (16.6 | ) | (12.8 | ) | (18.0 | ) | (2.1 | ) | (49.5 | ) |
Cash flow/unreinvested dividends | | (0.6 | ) | (1.8 | ) | (1.3 | ) | (3.7 | ) | (3.6 | ) | — | | (0.4 | ) | 0.3 | | (3.7 | ) |
Net long-term inflows (outflows) | | 19.7 | | 1.1 | | 6.7 | | 27.5 | | 7.3 | | 21.8 | | (0.3 | ) | (1.3 | ) | 27.5 | |
Dispositions | | (1.3 | ) | (28.7 | ) | (0.4 | ) | (30.4 | ) | (1.2 | ) | — | | (29.2 | ) | — | | (30.4 | ) |
Transfers | | 0.6 | | — | | (0.6 | ) | — | | — | | — | | — | | — | | — | |
Market appreciation | | 28.3 | | 9.2 | | 5.2 | | 42.7 | | 16.8 | | 23.8 | | 0.2 | | 1.9 | | 42.7 | |
Net change | | 47.3 | | (18.4 | ) | 10.9 | | 39.8 | | 22.9 | | 45.6 | | (29.3 | ) | 0.6 | | 39.8 | |
Balance as of December 31, 2005 | | $ | 358.6 | | $ | 145.1 | | $ | 74.9 | | $ | 578.6 | | $ | 146.2 | | $ | 238.2 | | $ | 164.1 | | $ | 30.1 | | $ | 578.6 | |
Changes in assets under management during 2004 were as follows (in billions):
| | Distribution Channel | | Investment Service | |
| | Institutional
Investment | | Retail | | Private
Client | | Total | | Growth
Equity | | Value
Equity | | Fixed
Income | | Index/
Structured | | Total | |
| | | | | | | | | | | | | | | | | | | |
Balance as of January 1, 2004 | | $ | 267.8 | | $ | 155.9 | | $ | 53.6 | | $ | 477.3 | | $ | 124.4 | | $ | 147.8 | | $ | 176.6 | | $ | 28.5 | | $ | 477.3 | |
Long-term flows: | | | | | | | | | | | | | | | | | | | |
Sales/new accounts | | 35.5 | | 23.4 | | 8.5 | | 67.4 | | 16.8 | | 25.3 | | 24.5 | | 0.8 | | 67.4 | |
Redemptions/terminations | | (22.9 | ) | (25.8 | ) | (3.0 | ) | (51.7 | ) | (23.7 | ) | (9.0 | ) | (17.1 | ) | (1.9 | ) | (51.7 | ) |
Cash flow/unreinvested dividends | | (4.9 | ) | (1.7 | ) | (0.8 | ) | (7.4 | ) | (7.7 | ) | — | | 1.7 | | (1.4 | ) | (7.4 | ) |
Net long-term inflows (outflows) | | 7.7 | | (4.1 | ) | 4.7 | | 8.3 | | (14.6 | ) | 16.3 | | 9.1 | | (2.5 | ) | 8.3 | |
Net cash management redemptions | | — | | (2.0 | ) | — | | (2.0 | ) | — | | — | | (2.0 | ) | — | | (2.0 | ) |
Market appreciation | | 35.8 | | 13.7 | | 5.7 | | 55.2 | | 13.5 | | 28.5 | | 9.7 | | 3.5 | | 55.2 | |
Net change | | 43.5 | | 7.6 | | 10.4 | | 61.5 | | (1.1 | ) | 44.8 | | 16.8 | | 1.0 | | 61.5 | |
Balance as of December 31, 2004 | | $ | 311.3 | | $ | 163.5 | | $ | 64.0 | | $ | 538.8 | | $ | 123.3 | | $ | 192.6 | | $ | 193.4 | | $ | 29.5 | | $ | 538.8 | |
40
Average assets under management by distribution channel and investment service were as follows:
| | Years Ended December 31, | | % Change | |
| | 2005 | | 2004 | | 2003 | | 2005-04 | | 2004-03 | |
| | | | (in billions) | | | | | | | |
| | | | | | | | | | | |
Distribution Channel: | | | | | | | | | | | |
Institutional Investment | | $ | 325.9 | | $ | 275.9 | | $ | 232.5 | | 18.1 | % | 18.7 | % |
Retail | | 146.7 | | 156.1 | | 145.0 | | (6.0 | ) | 7.7 | |
Private Client | | 68.6 | | 57.6 | | 45.8 | | 18.9 | | 25.8 | |
Total | | $ | 541.2 | | $ | 489.6 | | $ | 423.3 | | 10.5 | % | 15.7 | % |
| | Years Ended December 31, | | % Change | |
| | 2005 | | 2004 | | 2003 | | 2005-04 | | 2004-03 | |
| | | | (in billions) | | | | | | | |
| | | | | | | | | | | |
Investment Service: | | | | | | | | | | | |
Growth Equity | | $ | 128.4 | | $ | 118.9 | | $ | 109.5 | | 7.9 | % | 8.6 | % |
Value Equity | | 208.9 | | 163.0 | | 115.1 | | 28.2 | | 41.6 | |
Fixed Income | | 174.5 | | 179.6 | | 174.6 | | (2.9 | ) | 2.9 | |
Index/Structured | | 29.4 | | 28.1 | | 24.1 | | 4.8 | | 16.5 | |
Total | | $ | 541.2 | | $ | 489.6 | | $ | 423.3 | | 10.5 | % | 15.7 | % |
Consolidated Results of Operations
| | Years Ended December 31, | | % Change | |
| | 2005 | | 2004 | | 2003 | | 2005-04 | | 2004-03 | |
| | | | (in millions) | | | | | | | |
| | | | | | | | | | | |
Revenues | | $ | 3,250.7 | | $ | 3,055.4 | | $ | 2,764.9 | | 6.4 | % | 10.5 | % |
Expenses | | 2,317.8 | | 2,310.3 | | 2,406.4 | | 0.3 | | (4.0 | ) |
Income before income taxes | | 932.9 | | 745.1 | | 358.5 | | 25.2 | | 107.8 | |
Income taxes | | 64.6 | | 39.9 | | 28.7 | | 61.7 | | 39.2 | |
Net income | | $ | 868.3 | | $ | 705.2 | | $ | 329.8 | | 23.1 | % | 113.8 | % |
| | | | | | | | | | | |
Diluted net income per unit | | $ | 3.35 | | $ | 2.74 | | $ | 1.29 | | 22.3 | % | 112.4 | % |
Distributions per unit | | $ | 3.33 | | $ | 2.40 | | $ | 1.65 | | 38.8 | % | 45.5 | % |
Pre-tax margin(1) | | 28.7 | % | 24.4 | % | 13.0 | % | | | | |
(1) Income before income taxes as a percentage of total revenues.
In 2005, net income increased $163.1 million, or 23.1%, to $868.3 million, and net income per unit increased $0.61, or 22.3%, to $3.35. The increase was due primarily to higher investment advisory and services fees, gains recognized on the dispositions of our cash management services, Indian mutual funds and South African joint venture interest, lower promotion and servicing expenses, and lower general and administrative expenses, partially offset by higher employee compensation and benefits and lower distribution revenues.
In 2004, net income increased $375.4 million to $705.2 million and net income per unit increased $1.45 to $2.74. The increases were due principally to the $330 million in charges taken during the second half of 2003, of which (i) $250 million was paid to the Restitution Fund, (ii) $30 million was used to settle a private civil mutual fund litigation unrelated to any regulatory agreements, and (iii) $50 million was reserved for estimated expenses related to our market-timing settlements with the SEC and the NYAG and our market timing-related liabilities (“2003 Market Timing Charges”). Higher net income was also due to an increase in investment advisory and services fees and institutional research services revenues, partially offset by higher employee compensation and general and administrative expenses.
41
Revenues
The following table summarizes the components of total revenues:
| | Years Ended December 31, | | % Change | |
| | 2005 | | 2004 | | 2003 | | 2005-04 | | 2004-03 | |
| | | | (in millions) | | | | | | | |
| | | | | | | | | | | |
Investment advisory and services fees | | $ | 2,290.8 | | $ | 2,113.4 | | $ | 1,882.4 | | 8.4 | % | 12.3 | % |
Distribution revenues | | 397.8 | | 447.3 | | 436.0 | | (11.1 | ) | 2.6 | |
Institutional research services | | 321.3 | | 303.6 | | 267.9 | | 5.8 | | 13.3 | |
Shareholder servicing fees | | 99.4 | | 116.0 | | 126.4 | | (14.3 | ) | (8.2 | ) |
Other revenues, net | | 141.4 | | 75.1 | | 52.2 | | 88.0 | | 44.0 | |
Total | | $ | 3,250.7 | | $ | 3,055.4 | | $ | 2,764.9 | | 6.4 | % | 10.5 | % |
Investment Advisory and Services Fees
The following table summarizes the components of investment advisory and services fees:
| | Years Ended December 31, | | % Change | |
| | 2005 | | 2004 | | 2003 | | 2005-04 | | 2004-03 | |
| | | | (in millions) | | | | | | | |
| | | | | | | | | | | |
Institutional Investment: | | | | | | | | | | | |
Base fees | | $ | 821.3 | | $ | 691.8 | | $ | 570.5 | | 18.7 | % | 21.3 | % |
Transaction charges | | 10.0 | | 27.6 | | 34.6 | | (63.8 | ) | (20.5 | ) |
Performance fees | | 73.0 | | 35.9 | | 39.3 | | 103.5 | | (8.6 | ) |
| | 904.3 | | 755.3 | | 644.4 | | 19.7 | | 17.2 | |
| | | | | | | | | | | |
Retail: | | | | | | | | | | | |
Base fees | | 693.0 | | 728.8 | | 747.4 | | (4.9 | ) | (2.5 | ) |
Transaction charges | | 3.5 | | 5.3 | | — | | (34.2 | ) | n/m | |
Performance fees | | 0.8 | | (1.7 | ) | (2.0 | ) | n/m | | (13.2 | ) |
| | 697.3 | | 732.4 | | 745.4 | | (4.8 | ) | (1.7 | ) |
| | | | | | | | | | | |
Private Client: | | | | | | | | | | | |
Base fees | | 613.1 | | 483.7 | | 369.9 | | 26.8 | | 30.8 | |
Transaction charges | | 18.0 | | 83.6 | | 78.2 | | (78.5 | ) | 7.0 | |
Performance fees | | 58.1 | | 58.4 | | 44.5 | | (0.4 | ) | 31.1 | |
| | 689.2 | | 625.7 | | 492.6 | | 10.2 | | 27.0 | |
| | | | | | | | | | | |
Total: | | | | | | | | | | | |
Base fees | | 2,127.4 | | 1,904.3 | | 1,687.8 | | 11.7 | | 12.8 | |
Transaction charges | | 31.5 | | 116.5 | | 112.8 | | (73.0 | ) | 3.3 | |
Performance fees | | 131.9 | | 92.6 | | 81.8 | | 42.6 | | 13.1 | |
| | $ | 2,290.8 | | $ | 2,113.4 | | $ | 1,882.4 | | 8.4 | % | 12.3 | % |
Investment advisory and services fees, the largest component of our revenues, include base fees, which are generally calculated as a percentage of the value of assets under management (often times referred to as “basis points”) and vary with the type of investment strategy and discipline, the size of account, and the total amount of assets we manage for a particular client. Accordingly, fee income generally increases or decreases as average assets under management increase or decrease and is therefore affected by market appreciation or depreciation, the addition of new client accounts or client contributions of additional assets to existing accounts, withdrawals of assets from and termination of client accounts, purchases and redemptions of mutual fund shares, and shifts of assets between accounts or products with different fee structures. Our base fees increased $223.1 million, or 11.7%, in 2005,
42
primarily due to higher average assets under management in institutional investments and private client, partially offset by the disposition of our cash management services in the retail distribution channel. Our base fees increased $216.5 million, or 12.8%, in 2004, primarily due to a 15.7% increase in average assets under management resulting from market appreciation and net asset inflows, partially offset by retail mutual fund fee reductions described below.
Investment advisory and services fees include brokerage transaction charges earned by SCB LLC for certain private client and institutional investment client transactions. These transaction charges aggregated $31.5 million, $116.5 million, and $112.8 million in 2005, 2004, and 2003, respectively. The decrease in 2005 resulted from a number of factors, including a management initiative implemented during the first half of 2005 which changed the structure of investment advisory and services fees charged to private clients for our services. The restructuring eliminated transaction charges for most private clients while raising base fees. This restructuring increases the transparency and predictability of asset management costs for our private clients. The elimination of these transaction charges was not a result of AllianceBernstein’s agreement with the NYAG or any other regulator. Separately, beginning January 1, 2006, we intend to report all revenues earned by SCB from brokerage transactions executed for clients of AllianceBernstein as Institutional Research Services revenues.
Certain investment advisory contracts provide for a performance-based fee, in addition to or in lieu of a base fee. This fee is calculated as either a percentage of absolute investment results or a percentage of investment results in excess of a stated benchmark over a specified period of time. Performance-based fees are recorded as revenue at the end of the measurement period and will be higher in favorable markets and lower in unfavorable markets, which may increase the volatility of our revenues and earnings. Performance-based fees aggregated $131.9 million, $92.6 million, and $81.8 million in 2005, 2004, and 2003, respectively. The increase in 2005 reflects strong investment performance in hedge funds, equity value and style blend investment services. The increase in 2004 was attributable to higher global equity and fixed income fees from strong investment performance.
Institutional investment advisory and services fees increased 19.7% for 2005 as a result of an 18.1% increase in average assets under management, and higher performance-based fees of $37.1 million, partly offset by lower transaction charges of $17.6 million due to lower transaction volume and the increased use of electronic trading systems. These fees increased 17.2% for 2004, primarily as a result of an 18.7% increase in average assets under management offset by a decrease in brokerage transaction charges of $7.0 million due primarily to lower transaction volume and a decline in performance-based fees of $3.4 million.
Retail investment advisory and services fees decreased 4.8% for 2005, primarily as a result of a 6.0% decrease in average assets under management, reflecting the disposition of assets related to our cash management services during the second quarter of 2005. These fees decreased 1.7% for 2004, primarily as a result of $69.5 million in revenue reductions from company-sponsored U.S. long-term open-end retail mutual funds in connection with the settlement of market timing-related matters discussed in Item 1, partly offset by a 7.7% increase in average assets under management.
Private client investment advisory and services fees increased 10.2% for 2005, primarily as a result of increased billable assets under management, partly offset by decreases in brokerage transaction charges of $65.6 million due primarily to the implementation of a new pricing structure which eliminated transaction charges for most private clients, partly offset by an increase in asset-based fees. These fees increased 27.0% for 2004, primarily as a result of billable assets under management, an increase in performance-based fees of $13.9 million and an increase in brokerage transaction charges of $5.4 million due to higher transaction volume.
Distribution Revenues
AllianceBernstein Investments acts as distributor of our Retail Products and receives distribution services fees from certain of those funds as partial reimbursement of the distribution expenses it incurs. Distribution revenues decreased 11.1% in 2005, principally due to the sale of our cash management services during the second quarter of 2005. Distribution revenues increased 2.6% in 2004, principally due to higher average mutual fund assets under management.
Institutional Research Services
Institutional research services revenue consists principally of brokerage transaction charges received for providing in-depth research and other services to institutional investors. Revenues from institutional research
43
services increased 5.8% for 2005 due to higher market share, higher average daily volumes in both the U.S. and U.K. stock markets and pricing increases in the U.K., partly offset by pricing declines in the U.S. Revenues from institutional research services increased 13.3% for 2004, due to higher market share of NYSE volume and higher revenues from growth in European operations, partly offset by lower domestic pricing.
Shareholder Servicing Fees
Investor Services and ACMGIS provide transfer agency services for our mutual funds. Shareholder servicing fees decreased 14.3%, primarily as a result of the reduction in the number of shareholder accounts and fee reductions. Shareholder servicing fees decreased 8.2% in 2004. The decreases were due to outsourcing certain services and fewer shareholder accounts serviced. The number of shareholder accounts serviced declined to approximately 4.1 million as of December 31, 2005, from approximately 6.7 million and 7.1 million as of December 31, 2004 and 2003, respectively, primarily due to the disposition of our cash management services and net redemptions of long-term U.S. mutual funds.
Other Revenues, Net
These revenues consist of investment income and net interest income earned on securities loaned to and borrowed from brokers and dealers, and fees earned for administration and recordkeeping services provided to our mutual funds and the general accounts of AXA and its subsidiaries. In addition, these revenues include mark-to-market gains or losses on investments related to deferred compensation plan obligations. We purchase shares of AllianceBernstein mutual funds to hedge our deferred compensation plan obligations. We classify these investments as trading investments, and as such, recognize unrealized mark-to-market gains or losses in each reporting period. The cost of our obligations, adjusted for mark-to-market gains and losses, is amortized over the vesting period, which is generally four years.
Other revenues increased $66.3 million, or 88.0%, in 2005, reflecting the net gain on the disposition of our cash management services, including contingent earn out payments, totaling $19.4 million, the net gain on the disposition of our Indian mutual funds of $11.6 million, and the net gain on the disposition of our South African joint venture interest of $7.0 million. Another contributing factor was a $23.8 million increase in brokerage interest and dividends and interest on our deferred compensation investments. Other revenues increased 44.0% in 2004, principally as a result of interest income and net investment gains recorded in connection with the consolidation of a joint venture and its funds under management due to the application of FIN 46-R, as discussed in Note 21 of AllianceBernstein’s consolidated financial statements in Item 8.
Expenses
The following table summarizes the components of expenses:
| | Years Ended December 31, | | % Change | |
| | 2005 | | 2004 | | 2003 | | 2005-04 | | 2004-03 | |
| | | | (in millions) | | | | | | | |
| | | | | | | | | | | |
Employee compensation and benefits | | $ | 1,263.5 | | $ | 1,085.1 | | $ | 914.5 | | 16.4 | % | 18.7 | % |
Promotion and servicing | | 621.9 | | 753.9 | | 776.2 | | (17.5 | ) | (2.9 | ) |
General and administrative | | 386.6 | | 426.4 | | 339.7 | | (9.3 | ) | 25.5 | |
Interest | | 25.1 | | 24.2 | | 25.3 | | 3.6 | | (4.2 | ) |
Amortization of intangible assets | | 20.7 | | 20.7 | | 20.7 | | — | | — | |
Charge for mutual fund matters and legal proceedings | | — | | — | | 330.0 | | — | | n/m | |
Total | | $ | 2,317.8 | | $ | 2,310.3 | | $ | 2,406.4 | | 0.3 | % | (4.0 | )% |
Employee Compensation and Benefits
We had 4,312 full-time employees as of December 31, 2005 compared to 4,100 in 2004 and 4,060 in 2003. Employee compensation and benefits, which represented approximately 54.5% of total expenses in 2005, include base compensation, commissions, fringe benefits, cash and deferred incentive compensation based generally on profitability, and other employment costs.
44
In 2005, base compensation, fringe benefits and other employment costs increased $44.7 million, or 10.7%, primarily as a result of annual merit increases and additional headcount. Incentive compensation increased $90.8 million, or 21.0%, primarily due to higher short-term incentive compensation reflecting higher earnings and higher deferred compensation amortization due to vesting of prior year awards. Commission expense increased $42.9 million, or 18.3%, reflecting higher revenues or sales across all channels.
In 2004, base compensation, fringe benefits and other compensation increased $34.4 million, or 9.0%, primarily due to merit increases, a mix shift to more highly compensated employees and higher recruitment costs. Incentive compensation increased $86.4 million, or 24.9%, as a result of higher short-term incentive compensation expense from higher earnings and higher amortization of deferred compensation expense, due to vesting of prior year awards. Commission expense increased $49.8 million, or 27.1%, primarily due to higher revenues in institutional investment, private client, and institutional research services.
Promotion and Servicing
Promotion and servicing expenses, which represented approximately 26.8% of total expenses in 2005, include distribution plan payments to financial intermediaries for distribution of company-sponsored mutual funds and cash management services products and amortization of deferred sales commissions paid to financial intermediaries for the sale of back-end load shares. See Capital Resources and Liquidity in this Item 7 for a further discussion of deferred sales commissions. See Item 1 for further discussion of deferred sales commissions and the disposition of our cash management services. Also included in this expense category are costs related to travel and entertainment, advertising, promotional materials, and investment meetings and seminars for financial intermediaries that distribute our mutual fund products.
Promotion and servicing expenses decreased 17.5% in 2005 and 2.9% in 2004. The decrease in 2005 was primarily due to an $82.2 million decrease in distribution plan payments, largely reflecting the disposition of our cash management services during the second quarter of 2005, and a $45.4 million decrease in amortization of deferred sales commissions as a result of lower sales of back-end load shares. The decrease in 2004 reflects a $31.2 million decrease in amortization of deferred sales commissions, resulting from lower B-share mutual fund sales, partially offset by an $11.3 million increase in travel and entertainment and printing costs.
General and Administrative
General and administrative expenses, which represented approximately 16.7% of total expenses in 2005, are costs related to operations, including technology, professional fees, occupancy, communications and similar expenses. General and administrative expenses decreased $39.8 million, or 9.3%, in 2005 and increased $86.7 million, or 25.5%, in 2004; significant changes include:
| | Years Ended
December 31, | |
| | 2005 | | 2004 | |
| | (in millions) | |
| | | | | |
Loss on disposals of fixed assets | | $ | (12.9 | ) | $ | 16.9 | |
Occupancy costs | | 0.6 | | 15.0 | |
Minority interests from consolidation of a VIE (FIN 46-R) | | (12.1 | ) | 12.1 | |
Sarbanes-Oxley 404 compliance | | 0.6 | | 9.3 | |
Data processing costs | | 2.2 | | 8.7 | |
Write-downs of capitalized software | | (6.7 | ) | 6.7 | |
Charge for directed brokerage investigations | | (5.0 | ) | 5.0 | |
Impairment of exchange memberships | | (3.5 | ) | 3.5 | |
Legal costs, net of insurance recoveries | | (14.6 | ) | (5.3 | ) |
Other | | 11.6 | | 14.8 | |
| | $ | (39.8 | ) | $ | 86.7 | |
The majority of the decreases in 2005 reflect the impact of specific charges that were recorded in 2004 but not 2005. In addition, legal costs were lower in 2005 as a result of insurance recoveries. In 2004, increased occupancy costs relate to higher rent for new office space and accelerated rent for vacated facilities. Loss on disposals of fixed assets includes the write-off of obsolete software and leasehold improvements at vacated
45
facilities. The minority interests from consolidation of a variable interest entity (“VIE”) required by FIN 46-R reflects nine months of minority interest since adoption of the new accounting pronouncement. The VIE was sold effective December 31, 2004; accordingly, the 2004 impact was reversed in 2005.
Taxes on Income
AllianceBernstein, a private limited partnership, is not subject to federal or state corporate income taxes. However, we are subject to the New York City unincorporated business tax. Our domestic corporate subsidiaries are subject to federal, state and local income taxes, and are generally included in the filing of a consolidated federal income tax return; separate state and local income tax returns are filed. Foreign corporate subsidiaries are generally subject to taxes in the foreign jurisdictions where they are located.
The increase in 2005 is primarily due to a higher proportion of pre-tax earnings of foreign subsidiaries that resulted in a higher effective tax rate. The increase in 2004 was also primarily due to higher pre-tax earnings of our foreign subsidiaries. The lower effective tax rate in 2004, compared to 2003, though, was the result of the non-deductibility in 2003 of approximately $100 million in expenses related to the 2003 Market Timing Charges.
Capital Resources and Liquidity
The following table identifies selected items relating to capital resources and liquidity:
| | | | | | | | % Change | |
| | 2005 | | 2004 | | 2003 | | 2005-04 | | 2004-03 | |
| | (in millions, except per unit amounts) | | | | | |
As of December 31: | | | | | | | | | | | |
Partners’ capital | | $ | 4,302.7 | | $ | 4,183.7 | | $ | 3,778.5 | | 2.8 | % | 10.7 | % |
Cash and cash equivalents | | 654.2 | | 1,061.5 | | 502.9 | | (38.4 | ) | 111.1 | |
| | | | | | | | | | | |
For the years ended December 31: | | | | | | | | | | | |
Cash flow from operations | | 460.1 | | 968.2 | | 758.0 | | (52.5 | ) | 27.7 | |
Additional investments by Holding from proceeds from exercise of compensatory options | | 42.4 | | 46.7 | | 21.6 | | (9.2 | ) | 116.6 | |
Capital expenditures | | (72.6 | ) | (57.3 | ) | (29.2 | ) | 26.6 | | 96.6 | |
Purchases of Holding Units | | (33.3 | ) | (45.1 | ) | (67.1 | ) | (26.2 | ) | (32.8 | ) |
Distributions paid | | (800.5 | ) | (383.0 | ) | (566.6 | ) | 109.0 | | (32.4 | ) |
| | | | | | | | | | | |
Available cash flow | | 858.7 | | 613.8 | | 418.1 | | 39.9 | | 46.8 | |
Distributions per AllianceBernstein Unit | | 3.33 | | 2.40 | | 1.65 | | 38.8 | | 45.5 | |
| | | | | | | | | | | | | | |
The significant factors affecting the change in partners’ capital year-to-year are net income and additional investments by Holding from proceeds from the exercise of options to acquire Holding Units, both increasing partners’ capital, and cash distributions paid to unitholders, decreasing partners’ capital. AllianceBernstein is required to distribute all of its Available Cash Flow, as defined in the AllianceBernstein Partnership Agreement, to its unitholders and the General Partner. Available Cash Flow in 2005 was significantly higher than in 2004 and 2003 due to the 2003 Market Timing Charges. The third quarter 2003 distribution was declared prior to recording these charges. Over the next two quarters, distributions were reduced, reflecting these charges. Commencing in second quarter 2004, quarterly distributions returned to traditional levels in relation to cash flow.
In 2005, cash and cash equivalents decreased $407.3 million and increased $558.6 million and $85.1 million in 2004 and 2003, respectively. Cash inflows are primarily provided from operations and from the proceeds from the exercise of options for Holding Units. Significant cash outflows are cash distributions paid to its unitholders and the General Partner, purchases of Holding Units to fund deferred compensation plans and capital expenditures.
On January 4, 2006 and January 4, 2005, we deposited an additional $49.1 million and $340.8 million, respectively, in United States Treasury Bills in a special reserve account pursuant to Rule 15c3-3 requirements.
46
Contingent Deferred Sales Charge
Our mutual fund distribution system (the “System”) includes a multi-class share structure that permits our open-end mutual funds to offer investors various options for the purchase of mutual fund shares, including both front-end load shares and back-end load shares. For open-end U.S. Fund front-end load shares, AllianceBernstein Investments pays sales commissions to financial intermediaries distributing the funds from the front-end sales charge it receives from investors at the time of sale. For back-end load shares, AllianceBernstein Investments pays sales commissions to the financial intermediaries at the time of sale and also receives higher ongoing distribution services fees from the mutual funds. In addition, investors who redeem before the expiration of the minimum holding period (which ranges from one year to four years) pay a contingent deferred sales charge (“CDSC”) to AllianceBernstein Investments. We expect to recover deferred sales commissions over periods not exceeding five and one-half years. Payments of sales commissions made to financial intermediaries in connection with the sale of back-end load shares under the System, net of CDSC received of $21.4 million, $32.9 million, and $37.5 million, respectively, totaled approximately $74.2 million, $44.6 million, and $94.9 million during 2005, 2004, and 2003, respectively.
Debt and Credit Facilities
Total available credit, debt outstanding, and weighted average interest rates as of December 31, 2005 and 2004 were as follows:
| | December 31, | |
| | 2005 | | 2004 | |
| | Credit
Available | | Debt
Outstanding | | Interest
Rate | | Credit
Available | | Debt
Outstanding | | Interest
Rate | |
| | (in millions) | |
| | | | | | | | | | | | | |
Senior notes | | $ | 600.0 | | $ | 399.7 | | 5.6 | % | $ | 600.0 | | $ | 399.2 | | 5.6 | % |
Commercial paper | | 425.0 | | — | | — | | 425.0 | | — | | — | |
Revolving credit facility | | 375.0 | | — | | — | | 375.0 | | — | | — | |
Extendible commercial notes | | 100.0 | | — | | — | | 100.0 | | — | | — | |
Other | | n/a | | 7.6 | | 4.6 | | n/a | | 8.3 | | 4.0 | |
Total | | $ | 1,500.0 | | $ | 407.3 | | 5.6 | % | $ | 1,500.0 | | $ | 407.5 | | 5.6 | % |
In August 2001, we issued $400 million of 5.625% Notes (“Senior Notes”) pursuant to a shelf registration statement under which we may issue up to $600 million in senior debt securities. The Senior Notes mature in August 2006 and are redeemable at any time. The proceeds from the Senior Notes were used to reduce commercial paper and credit facility borrowings and for other general partnership purposes. We intend to use cash flow from operations to retire the Senior Notes at maturity.
In September 2002, we entered into an $800 million five-year revolving credit facility with a group of commercial banks and other lenders. Of the $800 million total, $425 million is intended to provide back-up liquidity for our $425 million commercial paper program, with the balance available for general purposes. Under this revolving credit facility, the interest rate, at our option, is a floating rate generally based upon a defined prime rate, a rate related to the London Interbank Offered Rate (LIBOR) or the Federal Funds rate. The revolving credit facility contains covenants which, among other things, require us to meet certain financial ratios. We were in compliance with the covenants as of December 31, 2005. On February 17, 2006, we replaced the existing arrangement with a new $800 million five-year revolving credit facility with substantially the same terms.
As of December 31, 2004, we maintained a $100 million extendible commercial notes (“ECN”) program as a supplement to our $425 million commercial paper program. ECNs are short-term uncommitted debt instruments that do not require back-up liquidity support.
Our substantial equity base and access to public and private debt, at competitive terms, should provide adequate liquidity for our general business needs. Management believes that cash flow from operations and the issuance of debt and AllianceBernstein Units or Holding Units will provide us with the resources to meet our financial obligations.
47
Off-Balance Sheet Arrangements and Aggregate Contractual Obligations
We have no off-balance sheet arrangements other than the guarantees and contractual obligations that are discussed below.
Guarantees
In February 2002, AllianceBernstein signed a $125 million agreement with a commercial bank, under which we guaranteed certain obligations in the ordinary course of business of SCBL. In the event SCBL is unable to meet its obligations in full when due, AllianceBernstein will pay the obligations within three days of being notified of SCBL’s failure to pay. This agreement is continuous and remains in effect until payment in full of any such obligation has been made by SCBL. During 2005, we were not required to perform under the agreement and as of December 31, 2005 had no liability outstanding in connection with the agreement.
Aggregate Contractual Obligations
The following table summarizes our contractual obligations:
| | Contractual Obligations | |
| | Total | | Less than
1 Year | | 1-3 Years | | 3-5 Years | | More than
5 Years | |
| | (in millions) | |
| | | | | | | | | | | |
Debt | | $ | 407.3 | | $ | 407.3 | | $ | — | | $ | — | | $ | — | |
Operating leases, net of sublease commitments | | 982.4 | | 86.3 | | 166.6 | | 152.2 | | 577.3 | |
Accrued compensation and benefits | | 173.9 | | — | | 115.1 | | 29.0 | | 29.8 | |
Minority interests in consolidated subsidiaries | | 9.4 | | — | | — | | — | | 9.4 | |
Total | | $ | 1,573.0 | | $ | 493.6 | | $ | 281.7 | | $ | 181.2 | | $ | 616.5 | |
Accrued compensation and benefits amounts above exclude liabilities due within one year and accrued pension expense. Any amounts reflected on the consolidated balance sheet as payables (to broker-dealers, brokerage clients, and our mutual funds) and accounts payable and accrued expenses are excluded from the table above.
Certain of our deferred compensation plans provide for election by participants to have their deferred compensation awards invested notionally in Holding Units and in company-sponsored mutual funds. Since January 1, 2006, we made purchases of mutual funds totaling $208 million to fund our future obligations resulting from participant elections with respect to 2005 awards. During the fourth quarter of 2005, we purchased Holding Units with an aggregate value of approximately $16.3 million. As of December 31, 2005, these Holding Units were held in a deferred compensation trust to fund our future obligations to participants who elected to notionally invest a portion of their 2005 awards in Holding Units.
We expect to make contributions to our qualified profit sharing plan of approximately $22.0 million in each of the next four years. We currently expect to contribute an estimated $3.0 million to our qualified, noncontributory, defined benefit plan during 2006.
Dispositions
See Note 20 of AllianceBernstein’s consolidated financial statements in Item 8 for a discussion of dispositions.
Contingencies
See Note 11 of AllianceBernstein’s consolidated financial statements in Item 8 for a discussion of our mutual fund distribution system and related deferred sales commission asset, certain legal proceedings to which we are a party, and mutual fund investigations.
Critical Accounting Estimates
The preparation of the consolidated financial statements and notes to consolidated financial statements requires management to make estimates and judgments that affect the reported amounts of assets, liabilities,
48
revenues and expenses. Management believes that the critical accounting policies and estimates discussed below involve significant management judgment due to the sensitivity of the methods and assumptions used.
Deferred Sales Commission Asset
Management tests the deferred sales commission asset for impairment quarterly, or monthly when events or changes in circumstances occur that could significantly increase the risk of impairment of the asset. Significant assumptions utilized to estimate the company’s future average assets under management and undiscounted future cash flows from back-end load shares include expected future market levels and redemption rates. Market assumptions are selected using a long-term view of expected average market returns based on historical returns of broad market indices. As of December 31, 2005, management used average market return assumptions of 5% for fixed income and 8% for equity to estimate annual market returns. Higher actual average market returns would increase undiscounted future cash flows, while lower actual average market returns would decrease undiscounted future cash flows. Future redemption rate assumptions of 22%, 25%, and 25% were determined by reference to actual redemption experience over the five-year, three-year, and one-year periods ended December 31, 2005, respectively, calculated as a percentage of the company’s average assets under management of back-end load shares. An increase in the actual rate of redemptions would decrease undiscounted future cash flows, while a decrease in the actual rate of redemptions would increase undiscounted future cash flows. These assumptions are reviewed and updated quarterly, or monthly when events or changes in circumstances occur that could significantly increase the risk of impairment of the asset. Estimates of undiscounted future cash flows and the remaining life of the deferred sales commission asset are made from these assumptions and the aggregate undiscounted future cash flows are compared to the recorded value of the deferred sales commission asset. Management considers the results of these analyses performed at various dates. As of December 31, 2005, management determined that the deferred sales commission asset was not impaired. If management determines in the future that the deferred sales commission asset is not recoverable, an impairment condition would exist and a loss would be measured as the amount by which the recorded amount of the asset exceeds its estimated fair value. Estimated fair value is determined using management’s best estimate of future cash flows discounted to a present value amount.
Goodwill
As a result of the adoption of SFAS No. 142, goodwill is tested annually, as of September 30, for impairment. Significant assumptions are required in performing goodwill impairment tests. Such tests include determining whether the estimated fair value of AllianceBernstein, the reporting unit, exceeds its book value. There are several methods of estimating AllianceBernstein’s fair value, which includes valuation techniques such as market quotations and discounted expected cash flows. In developing estimated fair value using a discounted cash flow valuation technique, business growth rate assumptions are applied over the estimated life of the goodwill asset and the resulting expected cash flows are discounted to arrive at a present value amount that approximates fair value. These assumptions consider all material events that have impacted, or that we believe could potentially impact, future discounted expected cash flows. As of September 30, 2005, the impairment test indicated that goodwill was not impaired. Also, as of December 31, 2005, management believes that goodwill was not impaired. However, future tests may be based upon different assumptions which may or may not result in an impairment of this asset. Any impairment could reduce materially the recorded amount of the goodwill asset with a corresponding charge to our earnings.
Intangible Assets
Acquired intangibles are recognized at fair value and amortized over their estimated useful lives of twenty years. Intangible assets are evaluated for impairment whenever events or changes in circumstances indicate that their carrying amount may not be recoverable. A present value technique is applied to management’s best estimate of future cash flows to estimate the fair value of intangible assets. Estimated fair value is then compared to the recorded book value to determine whether an impairment is indicated. The estimates used include estimating attrition factors of customer accounts, asset growth rates, direct expenses and fee rates. We choose assumptions based on actual historical trends that may or may not occur in the future. As of December 31, 2005, management believes that intangible assets were not impaired. However, future tests may be based upon different assumptions which may or may not result in an impairment of this asset. Any impairment could reduce materially the recorded amount of intangible assets with a corresponding charge to our earnings.
49
Retirement Plan
We maintain a qualified, noncontributory, defined benefit retirement plan covering current and former employees who were employed by the company in the United States prior to October 2, 2000. The amounts recognized in the consolidated financial statements related to the retirement plan are determined from actuarial valuations. Inherent in these valuations are assumptions including expected return on plan assets, discount rates at which liabilities could be settled, rates of annual salary increases, and mortality rates. The assumptions are reviewed annually and may be updated to reflect the current environment. A summary of the key economic assumptions are described in Note 14 to AllianceBernstein’s consolidated financial statements in Item 8. In accordance with U.S. GAAP, actual results that differ from those assumed are accumulated and amortized over future periods and, therefore, affect expense recognized and liabilities recorded in future periods.
In developing the expected long-term rate of return on plan assets of 8.0%, we considered the historical returns and future expectations for returns for each asset category, as well as the target asset allocation of the portfolio. The expected long-term rate of return on assets is based on weighted average expected returns for each asset class. We assumed a target allocation weighting of 70% to 80% for equity securities and 20% to 30% for debt securities. The plan’s equity investment strategy seeks to outperform the Russell 1000 Growth Index by approximately 200 basis points per year before fees on a consistent basis and to outperform the S&P 500 by a similar margin over full market cycles. The plan’s fixed income investment strategy is a defensive mixture invested in both U.S. Treasury Notes and corporate bonds in an effort to reduce interest rate risk. The actual rate of return on plan assets was 13.7%, 9.0%, and 19.9% in 2005, 2004, and 2003, respectively. A 25 basis point adjustment, up or down, in the expected long-term rate of return on plan assets would have decreased or increased the 2005 net pension charge of $5.6 million by approximately $0.1 million.
The objective of our discount rate assumption was to reflect the rate at which the pension benefits could be effectively settled. In making this determination, we took into account the timing and amount of benefits that would be available under the plan’s lump sum option. To that effect, our methodology for selecting the discount rate as of December 31, 2005 was to match the plan’s cash flows to that of a yield curve that provides the equivalent yields on zero-coupon corporate bonds for each maturity. Benefit cash flows due in a particular year can be “settled” theoretically by “investing” them in the zero-coupon bond that matures in the same year. The discount rate is the single rate that produces the same present value of cash flows. The selection of the 5.65% discount rate as of December 31, 2005 represents the approximate mid-point (to the nearest five basis points) of the single rate under two independently constructed yield curves - one prepared by Mercer Human Resource Consulting which produced a rate of 5.73%; and one prepared by Citigroup which produced a rate of 5.54%. The discount rate as of December 31, 2004 was 5.75%. This rate was used in developing the 2005 net pension charge. A lower discount rate increases pension expense and the present value of benefit obligations. A 25 basis point adjustment, up or down, in the discount rate (along with a corresponding adjustment in the assumed lump sum interest rate) would have decreased or increased the 2005 net pension charge of $5.6 million by approximately $0.6 million.
Loss Contingencies
Management continuously reviews with legal counsel the status of regulatory matters and pending or threatened litigation. We evaluate the likelihood that a loss contingency exists in accordance with Statement of Financial Accounting Standards No. 5 (“SFAS No. 5”), “Accounting for Contingencies”. SFAS No. 5 requires a loss contingency to be recorded if it is probable and reasonably estimable as of the date of the financial statements. Based on our evaluation, except as described in Note 11 of AllianceBernstein’s consolidated financial statements in Item 8, no contingency losses have been recorded as of December 31, 2005 and 2004.
Accounting Pronouncements
See Note 21 of AllianceBernstein’s consolidated financial statements in Item 8.
Forward-Looking Statements
Certain statements provided by management in this report are “forward-looking statements” within the meaning of the Private Securities Litigation Reform Act of 1995. Such forward-looking statements are subject to
50
risks, uncertainties and other factors that could cause actual results to differ materially from future results expressed or implied by such forward-looking statements. The most significant of these factors include, but are not limited to, the following: the performance of financial markets, the investment performance of sponsored investment products and separately managed accounts, general economic conditions, future acquisitions, competitive conditions and government regulations, including changes in tax regulations and rates. We caution readers to carefully consider such factors. Further, such forward-looking statements speak only as of the date on which such statements are made; we undertake no obligation to update any forward-looking statements to reflect events or circumstances after the date of such statements. For further information regarding these forward-looking statements and the factors that could cause actual results to differ, see Risk Factors in Item 1A. Any or all of the forward-looking statements that we make in this Form 10-K or any other public statements we issue may turn out to be wrong. It is important to remember that other factors besides those listed in Risk Factors could also adversely affect our revenues, financial condition, results of operations, and business prospects.
The forward-looking statements referred to in the preceding paragraph include statements regarding the outcome of litigation and the effect on future earnings of the sale of our cash management services to Federated Investors, Inc. (“Sale”). Litigation is inherently unpredictable, and excessive judgments do occur. Though we have stated that we do not expect certain legal proceedings to have a material adverse effect on results of operations or financial condition, any settlement or judgment on the merits of a legal proceeding could be significant, and could have a material adverse effect on our results of operations or financial condition. The effect of the Sale on future earnings, resulting from contingent payments to be received in future periods, will depend on the amount of net revenue earned by Federated during these periods on assets under management maintained in Federated’s funds by our former cash management clients. The amount of capital gain realized upon closing the transaction depends on the transaction expenses we incur and on an initial payment by Federated, some of which would, in certain circumstances, need to be returned.
Item 7A. Quantitative and Qualitative Disclosures about Market Risk
Holding
Market Risk, Risk Management and Derivative Financial Instruments
Holding’s sole investment is AllianceBernstein Units. Holding did not own, nor was it a party to any derivative financial instruments during the years ended December 31, 2005, 2004, and 2003.
AllianceBernstein
Market Risk, Risk Management and Derivative Financial Instruments
AllianceBernstein’s investments consist of investments, trading and available-for-sale, and other investments. Investments, trading and available-for-sale, include United States Treasury Bills, and equity and fixed income mutual funds investments. Trading investments are purchased for short-term investment, principally to fund liabilities related to deferred compensation plans. Although investments, available-for-sale, are purchased for long-term investment, the portfolio strategy considers them available-for-sale from time to time due to changes in market interest rates, equity prices and other relevant factors. Other investments include investments in hedge funds sponsored by AllianceBernstein.
51
Trading and Non Trading Market Risk Sensitive Instruments
Investments with Interest Rate Risk—Fair Value
The table below provides our potential exposure with respect to our fixed income investments, measured in terms of fair value, to an immediate 100 basis point increase in interest rates at all maturities from the levels prevailing as of December 31, 2005 and 2004. Such a fluctuation in interest rates is a hypothetical rate scenario used to calibrate potential risk and does not represent our view of future market changes. While these fair value measurements provide a representation of interest rate sensitivity of our investments in fixed income mutual funds and fixed income hedge funds, they are based on our exposures at a particular point in time and may not be representative of future market results. These exposures will change as a result of ongoing changes in investments in response to our assessment of changing market conditions and available investment opportunities:
| | As of December 31, | |
| | 2005 | | 2004 | |
| | Fair Value | | Effect of +100
Basis Point
Change | | Fair Value | | Effect of +100
Basis Point
Change | |
| | (in thousands) | |
Fixed Income Investments: | | | | | | | | | |
Trading | | $ | 30,502 | | $ | (1,424 | ) | $ | 30,008 | | $ | (1,368 | ) |
Available-for-sale and other investments | | 2,537 | | (118 | ) | 2,096 | | (96 | ) |
| | | | | | | | | | | | | |
Investments with Equity Price Risk—Fair Value
Our investments also include investments in equity mutual funds and equity hedge funds. The following table provides our potential exposure with respect to our equity investments, measured in terms of fair value, to an immediate 10% drop in equity prices from those prevailing as of December 31, 2005 and 2004. A 10% decrease in equity prices is a hypothetical scenario used to calibrate potential risk and does not represent our view of future market changes. While these fair value measurements provide a representation of equity price sensitivity of our investments in equity mutual funds and equity hedge funds, they are based on our exposures at a particular point in time and may not be representative of future market results. These exposures will change as a result of ongoing portfolio activities in response to our assessment of changing market conditions and available investment opportunities:
| | As of December 31, | |
| | 2005 | | 2004 | |
| | Fair Value | | Effect of - 10%
Equity Price
Change | | Fair Value | | Effect of - 10%
Equity Price
Change | |
| | (in thousands) | |
Equity Investments: | | | | | | | | | |
Trading | | $ | 282,719 | | $ | (28,272 | ) | $ | 126,943 | | $ | (12,694 | ) |
Available-for-sale and other investments | | 115,656 | | (11,566 | ) | 94,470 | | (9,447 | ) |
| | | | | | | | | | | | | |
52
Debt—Fair Value
As of December 31, 2005 and 2004, the aggregate fair value of our debt was $409.7 and $422.2 million, respectively. The table below provides the potential fair value exposure with respect to our debt to an immediate 100 basis point decrease in interest rates at all maturities and a ten percent decrease in exchange rates from those prevailing as of December 31, 2005 and 2004:
| | As of December 31, | |
| | 2005 | | 2004 | |
| | Fair Value | | Effect of - 100 Basis Point Change | | Effect of - 10% Exchange Rate Change | | Fair Value | | Effect of - 100 Basis Point Change | | Effect of - 10% Exchange Rate Change | |
| | (in thousands) | |
Debt: | | | | | | | | | | | | | |
Non-trading | | $ | 409,676 | | $ | 18,190 | | $ | 760 | | $ | 422,147 | | $ | 17,392 | | $ | 829 | |
| | | | | | | | | | | | | | | | | | | |
53
Item 8. Financial Statements and Supplementary Data
ALLIANCEBERNSTEIN HOLDING L.P.
Statements of Financial Condition
(in thousands, except unit amounts)
| | December 31, | |
| | 2005 | | 2004 | |
ASSETS | | | | | |
Cash and cash equivalents | | $ | 89 | | $ | — | |
Investment in AllianceBernstein | | 1,376,503 | | 1,302,809 | |
Other assets | | 462 | | 637 | |
Total assets | | $ | 1,377,054 | | $ | 1,303,446 | |
LIABILITIES AND PARTNERS’ CAPITAL | | | | | |
Liabilities: | | | | | |
Payable to AllianceBernstein | | $ | 7,197 | | $ | 7,664 | |
Other liabilities | | 1,011 | | 112 | |
Total liabilities | | 8,208 | | 7,776 | |
Commitments and contingencies (See Note 6) | | | | | |
Partners’ capital: | | | | | |
General Partner: 100,000 general partnership units issued and outstanding | | 1,711 | | 1,687 | |
Limited partners: 82,131,027 and 80,386,556 limited partnership units issued and outstanding | | 1,359,472 | | 1,293,983 | |
Accumulated other comprehensive income | | 7,663 | | — | |
Total partners’ capital | | 1,368,846 | | 1,295,670 | |
Total liabilities and partners’ capital | | $ | 1,377,054 | | $ | 1,303,446 | |
See Accompanying Notes to Financial Statements.
54
ALLIANCEBERNSTEIN HOLDING L.P.
Statements of Income
(in thousands, except per unit amounts)
| | Years Ended December 31, | |
| | 2005 | | 2004 | | 2003 | |
| | | | | | | |
Equity in earnings of AllianceBernstein | | $ | 275,054 | | $ | 219,971 | | $ | 100,424 | |
Income taxes | | 26,990 | | 24,798 | | 21,819 | |
Net income | | $ | 248,064 | | $ | 195,173 | | $ | 78,605 | |
| | | | | | | |
Net income per unit: | | | | | | | |
Basic | | $ | 3.04 | | $ | 2.45 | | $ | 1.02 | |
Diluted | | $ | 3.02 | | $ | 2.43 | | $ | 1.01 | |
See Accompanying Notes to Financial Statements.
55
ALLIANCEBERNSTEIN HOLDING L.P.
Statements of Changes in Partners’ Capital and Comprehensive Income
(in thousands, except per unit amounts)
| | General
Partner’s
Capital | | Limited
Partners’
Capital | | Accumulated
Other Comprehensive Income | | Total
Partners’
Capital | |
| | | | | | | | | |
Balance as of December 31, 2002 | | $ | 1,657 | | $ | 1,228,886 | | $ | — | | $ | 1,230,543 | |
Comprehensive income: | | | | | | | | | |
Net income | | 103 | | 78,502 | | — | | 78,605 | |
Comprehensive income | | 103 | | 78,502 | | — | | 78,605 | |
Cash distributions to unitholders ($1.97 per unit) | | (197 | ) | (151,297 | ) | — | | (151,494 | ) |
Purchases of Holding Units by AllianceBernstein to fund deferred compensation plans, net | | — | | (67,080 | ) | — | | (67,080 | ) |
Awards of Holding Units made by AllianceBernstein under deferred compensation plans, net of forfeitures | | — | | 46,471 | | — | | 46,471 | |
Proceeds from exercise of options to acquire Holding Units | | — | | 21,561 | | — | | 21,561 | |
Balance as of December 31, 2003 | | 1,563 | | 1,157,043 | | — | | 1,158,606 | |
| | | | | | | | | |
Comprehensive income: | | | | | | | | | |
Net income | | 243 | | 194,930 | | — | | 195,173 | |
Comprehensive income | | 243 | | 194,930 | | — | | 195,173 | |
Cash distributions to unitholders ($1.19 per unit) | | (119 | ) | (95,326 | ) | — | | (95,445 | ) |
Purchases of Holding Units by AllianceBernstein to fund deferred compensation plans, net | | — | | (45,080 | ) | — | | (45,080 | ) |
Awards of Holding Units made by AllianceBernstein under deferred compensation plans, net of forfeitures | | — | | 35,711 | | — | | 35,711 | |
Proceeds from exercise of options to acquire Holding Units | | — | | 46,705 | | — | | 46,705 | |
Balance as of December 31, 2004 | | 1,687 | | 1,293,983 | | — | | 1,295,670 | |
| | | | | | | | | |
Comprehensive income: | | | | | | | | | |
Net income | | 304 | | 247,760 | | — | | 248,064 | |
Other comprehensive income: | | | | | | | | | |
Unrealized gain on investments, net | | — | | — | | 1,253 | | 1,253 | |
Foreign currency translation adjustment, net | | — | | — | | 6,410 | | 6,410 | |
Comprehensive income | | 304 | | 247,760 | | 7,663 | | 255,727 | |
Cash distributions to unitholders ($2.80 per unit) | | (280 | ) | (226,451 | ) | — | | (226,731 | ) |
Purchases of Holding Units by AllianceBernstein to fund deferred compensation plans, net | | — | | (33,253 | ) | — | | (33,253 | ) |
Awards of Holding Units made by AllianceBernstein under deferred compensation plans, net of forfeitures | | — | | 35,028 | | — | | 35,028 | |
Proceeds from exercise of options to acquire Holding Units | | — | | 42,405 | | — | | 42,405 | |
Balance as of December 31, 2005 | | $ | 1,711 | | $ | 1,359,472 | | $ | 7,663 | | $ | 1,368,846 | |
See Accompanying Notes to Financial Statements.
56
ALLIANCEBERNSTEIN HOLDING L.P.
Statements of Cash Flows
(in thousands)
| | Years Ended December 31, | |
| | 2005 | | 2004 | | 2003 | |
Cash flows from operating activities: | | | | | | | |
Net income | | $ | 248,064 | | $ | 195,173 | | $ | 78,605 | |
Adjustments to reconcile net income to net cash provided by operating activities: | | | | | | | |
Equity in earnings of AllianceBernstein | | (275,054 | ) | (219,971 | ) | (100,424 | ) |
Investment in AllianceBernstein with proceeds from exercises of options for Holding Units | | (42,405 | ) | (46,705 | ) | (21,561 | ) |
AllianceBernstein distributions received | | 253,203 | | 119,840 | | 172,516 | |
Changes in assets and liabilities: | | | | | | | |
Decrease in other assets | | 175 | | 118 | | 309 | |
(Decrease) increase in payable to AllianceBernstein | | (467 | ) | 959 | | (18 | ) |
Increase (decrease) in other liabilities | | 899 | | (674 | ) | 506 | |
Net cash provided by operating activities | | 184,415 | | 48,740 | | 129,933 | |
| | | | | | | |
Cash flows from financing activities: | | | | | | | |
Cash distributions to unitholders | | (226,731 | ) | (95,445 | ) | (151,494 | ) |
Proceeds from options for Holding Units exercised | | 42,405 | | 46,705 | | 21,561 | |
Net cash used in financing activities | | (184,326 | ) | (48,740 | ) | (129,933 | ) |
Net increase in cash and cash equivalents | | 89 | | — | | — | |
Cash and cash equivalents as of beginning of the year | | — | | — | | — | |
Cash and cash equivalents as of end of the year | | $ | 89 | | $ | — | | $ | — | |
| | | | | | | |
Cash paid: | | | | | | | |
Income taxes | | $ | 25,969 | | $ | 25,638 | | $ | 21,190 | |
See Accompanying Notes to Financial Statements.
57
ALLIANCEBERNSTEIN HOLDING L.P.
Notes to Financial Statements
Effective February 24, 2006, Alliance Capital Management Holding L.P. (“Holding”) and Alliance Capital Management L.P. (“Alliance Capital”) changed their names to AllianceBernstein Holding (“Holding”) and AllianceBernstein L.P. (“AllianceBernstein”), respectively.
The words “we” and “our” refer collectively to Holding, AllianceBernstein and its subsidiaries, or to their officers and employees. Similarly, the word “company” refers to both Holding and AllianceBernstein. Where the context requires distinguishing between Holding and AllianceBernstein, we identify which of them is being discussed. Cross-references are in bold text.
1. Organization and Business Description
Holding’s principal source of income and cash flow is attributable to its investment in AllianceBernstein.
AllianceBernstein provides diversified investment management and related services globally to a broad range of clients. Its principal services are:
• Institutional Investment Services – Servicing institutional investors, including unaffiliated corporate and public employee pension funds, endowment funds, domestic and foreign institutions and governments and affiliates such as AXA and certain of its insurance company subsidiaries, by means of separately managed accounts, sub-advisory relationships, structured products, group trusts, mutual funds, and other investment vehicles.
• Retail Services – Servicing individual investors, primarily by means of retail mutual funds sponsored by AllianceBernstein, our subsidiaries and affiliated joint venture companies, sub-advisory relationships in respect of mutual funds sponsored by third parties, separately managed account programs that are sponsored by registered broker-dealers (“Separately Managed Account Programs”), and other investment vehicles.
• Private Client Services – Servicing high-net-worth individuals, trusts and estates, charitable foundations, partnerships, private and family corporations, and other entities, by means of separately managed accounts, hedge funds, mutual funds, and other investment vehicles.
• Institutional Research Services – Servicing institutional investors desiring institutional research services including in-depth research, portfolio strategy, trading, and brokerage-related services.
AllianceBernstein also provides distribution, shareholder servicing, and administrative services to our sponsored mutual funds.
AllianceBernstein provides a broad range of investment services with expertise in:
• Growth and value equity, the two predominant equity strategies;
• Blend, combining growth and value components and systematic rebalancing between the two;
• Fixed income, including both taxable and tax-exempt securities;
• Balanced, combining equity and fixed income components; and
• Passive, including both index and enhanced index strategies.
AllianceBernstein manages these strategies using various investment disciplines, including market capitalization (e.g., large-, mid-, and small-cap equities), term (e.g., long-, intermediate-, and short-duration debt securities), and geographic location (e.g., U.S., international, global, and emerging markets), as well as local and regional disciplines in major markets around the world.
AllianceBernstein has a broad foundation in fundamental research, including comprehensive industry and company coverage from the differing perspectives of growth, value, and fixed income, as well as global economic and currency forecasting capabilities and quantitative research.
58
As of December 31, 2005, AXA, a société anonyme organized under the laws of France and the holding company for an international group of insurance and related financial services companies, AXA Financial, Inc. (an indirect wholly-owned subsidiary of AXA, “AXA Financial”), AXA Equitable Life Insurance Company (formerly known as The Equitable Life Assurance Society of the United States and a wholly-owned subsidiary of AXA Financial, “AXA Equitable”) and certain subsidiaries of AXA Equitable, collectively referred to as “AXA and its subsidiaries”, owned approximately 1.8% of the issued and outstanding Holding Units.
As of December 31, 2005, the ownership of AllianceBernstein, as a percentage of limited partnership interests, was as follows:
AXA, AXA Financial and its subsidiaries | | 60.1 | % |
Holding | | 32.2 | |
SCB Partners Inc. (a wholly-owned subsidiary of SCB Inc.; formerly known as Sanford C. Bernstein Inc.) | | 6.4 | |
Other | | 1.3 | |
| | 100.0 | % |
AllianceBernstein Corporation (formerly known as Alliance Capital Management Corporation, “General Partner”), an indirect wholly-owned subsidiary of AXA, is the general partner of both Holding and AllianceBernstein. AllianceBernstein Corporation owns 100,000 general partnership units (economically equivalent to limited partnership units) in Holding and a 1% general partnership interest in AllianceBernstein. Including the general partnership interests in AllianceBernstein and Holding, and their equity interest in Holding, as of December 31, 2005, AXA, AXA Financial, AXA Equitable and its subsidiaries had an approximate 61.1% economic interest in AllianceBernstein.
2. Summary of Significant Accounting Policies
Basis of Presentation
The financial statements have been prepared in accordance with accounting principles generally accepted in the United States of America. The preparation of the financial statements requires management to make certain estimates and assumptions that affect the reported amounts of assets and liabilities and disclosure of contingent assets and liabilities at the dates of the financial statements and the reported amounts of revenues and expenses during the reporting periods. Actual results could differ from those estimates.
The AllianceBernstein Holding financial statements and notes should be read in conjunction with the consolidated financial statements and notes of AllianceBernstein. AllianceBernstein’s consolidated financial statements and notes and management’s discussion and analysis of financial condition and results of operations are included in Holding’s Form 10-K.
Investment in AllianceBernstein
Holding records its investment in AllianceBernstein using the equity method of accounting. Holding’s investment will be increased to reflect its proportionate share of income of AllianceBernstein and decreased to reflect its proportionate share of losses of AllianceBernstein and cash distributions made by AllianceBernstein to its unitholders. In addition, Holding’s investment is adjusted to reflect certain capital transactions of AllianceBernstein.
Cash and Cash Equivalents
Cash and cash equivalents include cash on hand, demand deposits and highly liquid investments including money market accounts with average maturities of three months or less. Due to the short-term nature of these instruments, this recorded value has been determined to approximate fair value.
59
Cash Distributions
Holding is required to distribute all of its Available Cash Flow, as defined in the Amended and Restated Agreement of Limited Partnership of Holding (“Holding Partnership Agreement”), to its unitholders pro rata in accordance with their percentage interests in Holding. Cash distributions are recorded when declared.
Compensatory Unit Award and Option Plans
AllianceBernstein maintains certain option and incentive plans and uses the Black-Scholes option valuation model to determine the fair value of option awards. Under these plans, options on Holding Units may be granted to employees of AllianceBernstein and independent directors of the General Partner. Upon exercise of options, Holding exchanges the proceeds from exercises for AllianceBernstein Units, thus increasing Holding’s investment in AllianceBernstein. As of December 31, 2005, 7,450,204 options for Holding Units were outstanding, of which 6,366,700 were exercisable.
3. Net Income Per Unit
Basic net income per unit is derived by dividing net income by the basic weighted average number of units outstanding for each year. Diluted net income per unit is derived by adjusting net income for the assumed dilutive effect of compensatory options (“Net income—diluted”) and dividing Net income—diluted by the diluted weighted average number of units outstanding for each year.
| | Years Ended December 31, | |
| | 2005 | | 2004 | | 2003 | |
| | (in thousands, except per unit amounts) | |
| | | | | | | |
Net income—basic | | $ | 248,064 | | $ | 195,173 | | $ | 78,605 | |
Additional allocation of equity in earnings of AllianceBernstein resulting from assumed dilutive effect of compensatory options | | 3,326 | | 2,662 | | 1,830 | |
Net income-diluted | | $ | 251,390 | | $ | 197,835 | | $ | 80,435 | |
Weighted average units outstanding—basic | | 81,489 | | 79,727 | | 77,245 | |
Dilutive effect of compensatory options | | 1,714 | | 1,644 | | 2,391 | |
Weighted average units outstanding—diluted | | 83,203 | | 81,371 | | 79,636 | |
Basic net income per unit | | $ | 3.04 | | $ | 2.45 | | $ | 1.02 | |
Diluted net income per unit | | $ | 3.02 | | $ | 2.43 | | $ | 1.01 | |
As of December 31, 2005, 2004, and 2003, out-of-the-money options to acquire 3,950,100, 4,336,500 and 7,977,700 units, respectively, have been excluded from the diluted net income per unit computation due to their anti-dilutive effect.
60
4. Investment in AllianceBernstein
Holding’s investment in AllianceBernstein for the years ended December 31, 2005 and 2004 was as follows:
| | 2005 | | 2004 | |
| | (in thousands) | |
| | | | | |
Investment in AllianceBernstein as of January 1, | | $ | 1,302,809 | | $ | 1,165,342 | |
Equity in earnings of AllianceBernstein | | 275,054 | | 219,971 | |
Additional investment with proceeds resulting from exercises of compensatory options | | 42,405 | | 46,705 | |
Other comprehensive income | | 7,663 | | — | |
Cash distributions received from AllianceBernstein | | (253,203 | ) | (119,840 | ) |
Purchases of Holding Units by AllianceBernstein to fund deferred compensation plans, net | | (33,253 | ) | (45,080 | ) |
Awards of Holding Units made by AllianceBernstein under deferred compensation plans, net of forfeitures | | 35,028 | | 35,711 | |
Investment in AllianceBernstein as of December 31, | | $ | 1,376,503 | | $ | 1,302,809 | |
5. Income Taxes
Holding is a publicly traded partnership for federal tax purposes and, accordingly, is not subject to federal or state corporate income taxes. However, Holding is subject to the New York City unincorporated business tax (“UBT”) and to a 3.5% federal tax on partnership gross income from the active conduct of a trade or business. Holding’s partnership gross income is derived from its interest in AllianceBernstein.
The principal reasons for the difference between Holding’s effective tax rates and the UBT statutory tax rate of 4% are as follows:
| | Years Ended December 31, | |
| | 2005 | | 2004 | | 2003 | |
| | (in thousands) | |
| | | | | | | | | | | | | |
UBT statutory rate | | $ | 11,002 | | 4.0 | % | $ | 8,799 | | 4.0 | % | $ | 4,017 | | 4.0 | % |
Federal tax on partnership gross business income | | 26,990 | | 9.8 | | 24,798 | | 11.3 | | 21,819 | | 21.7 | |
Credit for UBT paid by AllianceBernstein | | (11,002 | ) | (4.0 | ) | (8,799 | ) | (4.0 | ) | (4,017 | ) | (4.0 | ) |
Income tax expense (all currently payable) and effective tax rate | | $ | 26,990 | | 9.8 | % | $ | 24,798 | | 11.3 | % | $ | 21,819 | | 21.7 | % |
6. Commitments and Contingencies
Matters described below pertain to AllianceBernstein and are included here due to their potential significance to Holding’s investment in AllianceBernstein.
Deferred Sales Commission Asset
Our mutual fund distribution system (“the System”) includes a multi-class share structure that permits our open-end mutual funds to offer investors various options for the purchase of mutual fund shares, including both front-end load shares and back-end load shares. For front-end load shares of mutual funds we sponsor that are registered as investment companies (“U.S. Funds”) under the Investment Company Act of 1940, as amended (“Investment Company Act”), AllianceBernstein Investments, Inc., a wholly-owned subsidiary of AllianceBernstein (“AllianceBernstein Investments”), pays sales commissions to financial intermediaries distributing the funds from the conventional front-end sales charge it receives from investors at the time of sale. For back-end load shares, AllianceBernstein Investments pays sales commissions to the financial intermediaries at the time of sale and also receives higher ongoing distribution services fees from the mutual funds. In addition, investors who
61
redeem before the expiration of the minimum holding period (which ranges from one year to four years) pay a contingent deferred sales charge (“CDSC”) to AllianceBernstein Investments.
Payments of sales commissions made by AllianceBernstein Investments to financial intermediaries in connection with the sale of back-end load shares under the System are capitalized as deferred sales commissions (“deferred sales commission asset”) and amortized over periods not exceeding five and one-half years, the periods of time during which the deferred sales commission asset is expected to be recovered. CDSC cash recoveries are recorded as reductions of unamortized deferred sales commissions when received. The amount recorded for the net deferred sales commission asset was $196.6 million and $254.5 million as of December 31, 2005 and 2004, respectively. Payments of sales commissions made by AllianceBernstein Investments to financial intermediaries in connection with the sale of back-end load shares under the System, net of CDSC received of $21.4 million, $32.9 million, and $37.5 million, respectively, totaled approximately $74.2 million, $44.6 million, and $94.9 million during 2005, 2004, and 2003, respectively.
Management tests the deferred sales commission asset for recoverability quarterly, or monthly when events or changes in circumstances occur that could significantly increase the risk of impairment of the asset. Significant assumptions utilized to estimate the company’s future average assets under management and undiscounted future cash flows from back-end load shares include expected future market levels and redemption rates. Market assumptions are selected using a long-term view of expected average market returns based on historical returns of broad market indices. As of December 31, 2005, management used average market return assumptions of 5% for fixed income and 8% for equity to estimate annual market returns. Higher actual average market returns would increase undiscounted future cash flows, while lower actual average market returns would decrease undiscounted future cash flows. Future redemption rate assumptions of 22%, 25%, and 25% were determined by reference to actual redemption experience over the five-year, three-year, and one-year periods ended December 31, 2005, respectively, calculated as a percentage of the company’s average assets under management represented by back-end load shares. An increase in the actual rate of redemptions would decrease undiscounted future cash flows, while a decrease in the actual rate of redemptions would increase undiscounted future cash flows. These assumptions are reviewed and updated quarterly, or monthly when events or changes in circumstances occur that could significantly increase the risk of impairment of the asset. Estimates of undiscounted future cash flows and the remaining life of the deferred sales commission asset are made from these assumptions and the aggregate undiscounted future cash flows are compared to the recorded value of the deferred sales commission asset. Management considers the results of these analyses performed at various dates. As of December 31, 2005, management determined that the deferred sales commission asset was not impaired. If management determines in the future that the deferred sales commission asset is not recoverable, an impairment condition would exist and a loss would be measured as the amount by which the recorded amount of the asset exceeds its estimated fair value. Estimated fair value is determined using management’s best estimate of future cash flows discounted to a present value amount.
During 2005, equity markets increased by approximately 5% as measured by the change in the Standard & Poor’s 500 Stock Index and fixed income markets increased by approximately 2% as measured by the change in the Lehman Brothers’ Aggregate Bond Index. The redemption rate for domestic back-end load shares, adjusted for the closing of certain funds in conjunction with the company’s fund rationalization program, was approximately 25.3% in 2005. Declines in financial markets or higher redemption levels, or both, as compared to the assumptions used to estimate undiscounted future cash flows, as described above, could result in the impairment of the deferred sales commission asset. Due to the volatility of the capital markets and changes in redemption rates, management is unable to predict whether or when a future impairment of the deferred sales commission asset might occur. Any impairment would reduce materially the recorded amount of the deferred sales commission asset with a corresponding charge to earnings. Holding’s proportionate share of AllianceBernstein’s charge to earnings would reduce materially Holding’s net income.
Legal Proceedings
With respect to all significant litigation matters, we conduct a probability assessment of the likelihood of a negative outcome. If the likelihood of a
62
negative outcome is probable, and the amount of the loss can be reasonably estimated, we record an estimated loss for the expected outcome of the litigation as required by Statement of Financial Accounting Standards No. 5 (“SFAS No. 5”), “Accounting for Contingencies”, and Financial Accounting Standards Board (“FASB”) Interpretation No. 14, “Reasonable Estimation of the Amount of a Loss –an interpretation of FASB Statement No. 5”. If the likelihood of a negative outcome is reasonably possible and we are able to indicate an estimate of the possible loss or range of loss, we disclose that fact together with the estimate of the possible loss or range of loss. However, it is difficult to predict the outcome or estimate a possible loss or range of loss because litigation is subject to significant uncertainties, particularly when plaintiffs allege substantial or indeterminate damages, or when the litigation is highly complex or broad in scope.
On April 8, 2002, in In re Enron Corporation Securities Litigation, a consolidated complaint (“Enron Complaint”) was filed in the United States District Court for the Southern District of Texas, Houston Division, against numerous defendants, including AllianceBernstein. The principal allegations of the Enron Complaint, as they pertain to AllianceBernstein, are that AllianceBernstein violated Sections 11 and 15 of the Securities Act of 1933, as amended (“Securities Act”) with respect to a registration statement filed by Enron Corp. (“Enron”) and effective with the U.S. Securities and Exchange Commission (“SEC”) on July 18, 2001, which was used to sell $1.9 billion Enron Zero Coupon Convertible Notes due 2021. Plaintiffs allege that the registration statement was materially misleading and that Frank Savage, a director of Enron, signed the registration statement at issue. Plaintiffs further allege that AllianceBernstein was a controlling person of Frank Savage, who was at that time an employee of AllianceBernstein and a director of the General Partner. Plaintiffs therefore assert that AllianceBernstein is itself liable for the allegedly misleading registration statement. Plaintiffs seek rescission or a rescissionary measure of damages. On June 3, 2002, AllianceBernstein moved to dismiss the Enron Complaint as the allegations therein pertain to it. On March 12, 2003, that motion was denied. A First Amended Consolidated Complaint (“Enron Amended Consolidated Complaint”), with substantially similar allegations as to AllianceBernstein, was filed on May 14, 2003. AllianceBernstein filed its answer on June 13, 2003. On May 28, 2003, plaintiffs filed an Amended Motion for Class Certification. On October 23, 2003, following the completion of class discovery, AllianceBernstein filed its opposition to class certification. That motion is pending. The case is currently in discovery.
We believe that plaintiffs’ allegations in the Enron Amended Consolidated Complaint as to us are without merit and intend to vigorously defend against these allegations. At the present time, we are unable to predict the outcome or estimate a possible loss or range of loss in respect of this matter because of the inherent uncertainty regarding the outcome of complex litigation, the fact that plaintiffs did not specify an amount of damages sought in their complaint, and the fact that, to date, we have not engaged in settlement negotiations.
On September 12, 2002, a complaint entitled Lawrence E. Jaffe Pension Plan, Lawrence E. Jaffe Trustee U/A 1198 v. Alliance Capital Management L.P., Alfred Harrison and Alliance Premier Growth Fund, Inc. (“Jaffe Complaint”) was filed in the United States District Court for the Southern District of New York against AllianceBernstein, Alfred Harrison (a former director) and the AllianceBernstein Premier Growth Fund (now known as the AllianceBernstein Large Cap Growth Fund, “Large Cap Growth Fund”) alleging violation of the Investment Company Act. Plaintiff seeks damages equal to Large Cap Growth Fund’s losses as a result of Large Cap Growth Fund’s investment in shares of Enron and a recovery of all fees paid by Large Cap Growth Fund to AllianceBernstein beginning November 1, 2000. On March 24, 2003, the court granted AllianceBernstein’s motion to transfer the Jaffe Complaint to the United States District Court for the District of New Jersey for coordination with the now dismissed Benak v. Alliance Capital Management L.P. and Alliance Premier Growth Fund action then pending. On December 5, 2003, plaintiff filed an amended complaint (“Amended Jaffe Complaint”) in the United States District Court for the District of New Jersey alleging violations of Section 36(a) of the Investment Company Act, common law negligence, and negligent misrepresentation. Specifically, the Amended Jaffe Complaint alleges that: (i) the defendants breached their fiduciary duties of loyalty, care and good faith to Large Cap Growth Fund by causing Large Cap Growth Fund to invest in securities of Enron, (ii) the defendants were negligent for investing in securities of Enron, and (iii) through prospectuses and other documents defendants misrepresented material facts related to Large Cap Growth Fund’s investment
63
objective and policies. On January 23, 2004, defendants moved to dismiss the Amended Jaffe Complaint. On May 23, 2005, the court granted defendant’s motion and dismissed the case on the ground that plaintiff failed to make a demand on the Large Cap Growth Fund’s Board of Directors (“LCG Board”) pursuant to Rule 23.1 of the Federal Rules of Civil Procedure. Plaintiff’s time to file an appeal has expired. On June 15, 2005, plaintiff made a demand on the LCG Board, requesting that the LCG Board take action against AllianceBernstein for the reasons set forth in the Amended Jaffe Complaint. In December 2005, the LCG Board rejected plaintiff’s demand.
AllianceBernstein, Large Cap Growth Fund, and Alfred Harrison believe that plaintiff’s allegations in the Amended Jaffe Complaint are without merit and intend to vigorously defend against these allegations. At the present time, we are unable to predict the outcome or estimate a possible loss or range of loss in respect of this matter because of the inherent uncertainty regarding the outcome of complex litigation and the fact that, to date, we have not engaged in settlement negotiations.
On December 13, 2002, a putative class action complaint entitled Patrick J. Goggins, et al. v. Alliance Capital Management L.P., et al. (“Goggins Complaint”) was filed in the United States District Court for the Southern District of New York against AllianceBernstein, Large Cap Growth Fund and individual directors and certain officers of Large Cap Growth Fund. On August 13, 2003, the court granted AllianceBernstein’s motion to transfer the Goggins Complaint to the United States District Court for the District of New Jersey. On December 5, 2003, plaintiffs filed an amended complaint (“Amended Goggins Complaint”) in the United States District Court for the District of New Jersey, which alleges that defendants violated Sections 11, 12(a)(2) and 15 of the Securities Act because Large Cap Growth Fund’s registration statements and prospectuses contained untrue statements of material fact and omitted material facts. More specifically, the Amended Goggins Complaint alleges that Large Cap Growth Fund’s investment in Enron was inconsistent with the Large Cap Growth Fund’s stated strategic objectives and investment strategies. Plaintiffs seek rescissionary relief or an unspecified amount of compensatory damages on behalf of a class of persons who purchased shares of Large Cap Growth Fund during the period October 31, 2000 through February 14, 2002. On January 23, 2004, AllianceBernstein moved to dismiss the Amended Goggins Complaint. On December 10, 2004, the court granted AllianceBernstein’s motion and dismissed the case. On January 5, 2005, plaintiffs appealed the court’s decision. On January 13, 2006, the U.S. Court of Appeals for the Third Circuit affirmed the dismissal. Plaintiffs’ time to seek further review of the court’s decision expires on April 13, 2006.
AllianceBernstein, Large Cap Growth Fund and the other defendants believe that plaintiffs’ allegations in the Amended Goggins Complaint are without merit and intend to vigorously defend against these allegations. At the present time, we are unable to predict the outcome or estimate a possible loss or range of loss in respect of this matter because of the inherent uncertainty regarding the outcome of complex litigation, the fact that plaintiffs did not specify an amount of damages sought in their complaint, and the fact that, to date, we have not engaged in settlement negotiations.
On October 1, 2003, a class action complaint entitled Erb, et al. v. Alliance Capital Management L.P. (“Erb Complaint”) was filed in the Circuit Court of St. Clair County, Illinois, against AllianceBernstein. The plaintiff, purportedly a shareholder in Large Cap Growth Fund, alleged that AllianceBernstein breached unidentified provisions of Large Cap Growth Fund’s prospectus and subscription and confirmation agreements that allegedly required that every security bought for Large Cap Growth Fund’s portfolio must be a “1-rated” stock, the highest rating that AllianceBernstein’s research analysts could assign. Plaintiff alleges that AllianceBernstein impermissibly purchased shares of stocks that were not 1-rated. On June 24, 2004, plaintiff filed an amended complaint (“Amended Erb Complaint”) in the Circuit Court of St. Clair County, Illinois. The Amended Erb Complaint allegations are substantially similar to those contained in the previous complaint, however, the Amended Erb Complaint adds a new plaintiff and seeks to allege claims on behalf of a purported class of persons or entities holding an interest in any portfolio managed by AllianceBernstein’s Large Cap Growth Team. The Amended Erb Complaint alleges that AllianceBernstein breached its contracts with these persons or entities by impermissibly purchasing shares of stocks that were not 1-rated. Plaintiffs seek rescission of all purchases of any non-1-rated stocks AllianceBernstein made for Large Cap Growth Fund and other Large Cap Growth Team clients’ portfolios over the past eight years, as well as an unspecified amount of damages. On July 13, 2004,
64
AllianceBernstein removed the Erb action to the United States District Court for the Southern District of Illinois on the basis that plaintiffs’ claims are preempted under the Securities Litigation Uniform Standards Act. On August 30, 2004, the District Court remanded the action to the Circuit Court. On September 15, 2004, AllianceBernstein filed a notice of appeal with respect to the District Court’s order. On December 23, 2004, plaintiffs moved to dismiss AllianceBernstein’s appeal. On September 2, 2005, AllianceBernstein’s appeal was denied.
We believe that plaintiffs’ allegations in the Amended Erb Complaint are without merit and intend to vigorously defend against these allegations. At the present time, we are unable to predict the outcome or estimate a possible loss or range of loss in respect of this matter because of the inherent uncertainty regarding the outcome of complex litigation and the fact that plaintiffs did not specify an amount of damages sought in their complaint.
Market Timing-related Matters
On October 2, 2003, a purported class action complaint entitled Hindo, et al. v. AllianceBernstein Growth & Income Fund, et al. (“Hindo Complaint”) was filed against AllianceBernstein, Holding, the General Partner, AXA Financial, the U.S. Funds, the registrants and issuers of those funds, certain officers of AllianceBernstein (“Alliance defendants”), and certain unaffiliated defendants, as well as unnamed Doe defendants. The Hindo Complaint was filed in the United States District Court for the Southern District of New York by alleged shareholders of two of the U.S. Funds. The Hindo Complaint alleges that certain of the Alliance defendants failed to disclose that they improperly allowed certain hedge funds and other unidentified parties to engage in “late trading” and “market timing” of U.S. Fund securities, violating Sections 11 and 15 of the Securities Act, Sections 10(b) and 20(a) of the Securities Exchange Act of 1934, as amended (“Exchange Act”), and Sections 206 and 215 of the Investment Advisers Act of 1940, as amended (“Advisers Act”). Plaintiffs seek an unspecified amount of compensatory damages and rescission of their contracts with AllianceBernstein, including recovery of all fees paid to AllianceBernstein pursuant to such contracts.
Since October 2, 2003, 43 additional lawsuits making factual allegations generally similar to those in the Hindo Complaint were filed in various federal and state courts against AllianceBernstein and certain other defendants, and others may be filed. The plaintiffs in such lawsuits have asserted a variety of theories for recovery including, but not limited to, violations of the Securities Act, the Exchange Act, the Advisers Act, the Investment Company Act, the Employee Retirement Income Security Act of 1974, as amended (“ERISA”), certain state securities laws, and common law. All state court actions against AllianceBernstein either were voluntarily dismissed or removed to federal court.
On February 20, 2004, the Judicial Panel on Multidistrict Litigation (“MDL Panel”) transferred all federal actions to the United States District Court for the District of Maryland (“Mutual Fund MDL”). All of the actions removed to federal court also were transferred to the Mutual Fund MDL. The plaintiffs in the removed actions have since moved for remand, and that motion is pending.
On September 29, 2004, plaintiffs filed consolidated amended complaints with respect to four claim types: mutual fund shareholder claims; mutual fund derivative claims; derivative claims brought on behalf of Holding; and claims brought under ERISA by participants in the Profit Sharing Plan for Employees of AllianceBernstein. All four complaints include substantially identical factual allegations, which appear to be based in large part on our agreement with the SEC (“SEC Order”) dated December 18, 2003 (amended and restated January 15, 2004), and our final agreement with the New York State Attorney General (“NYAG AoD”) dated September 1, 2004. The claims in the mutual fund derivative consolidated amended complaint are generally based on the theory that all fund advisory agreements, distribution agreements and 12b-1 plans between AllianceBernstein and the U.S. Funds should be invalidated, regardless of whether market timing occurred in each individual fund, because each was approved by fund trustees on the basis of materially misleading information with respect to the level of market timing permitted in funds managed by AllianceBernstein. The claims asserted in the other three consolidated amended complaints are similar to those that the respective plaintiffs asserted in their previous federal lawsuits. All of these lawsuits seek an unspecified amount of damages.
65
On February 10, 2004, we received (i) a subpoena duces tecum from the Office of the Attorney General of the State of West Virginia and (ii) a request for information from the Office of the State Auditor, Securities Commission, for the State of West Virginia (“WV Securities Commissioner”) (subpoena and request together, the “Information Requests”). Both Information Requests required us to produce documents concerning, among other things, any market timing or late trading in our sponsored mutual funds. We responded to the Information Requests and have been cooperating fully with the investigation.
On April 11, 2005, a complaint entitled The Attorney General of the State of West Virginia v. AIM Advisors, Inc., et al. (“WVAG Complaint”) was filed against AllianceBernstein, Holding, and various unaffiliated defendants. The WVAG Complaint was filed in the Circuit Court of Marshall County, West Virginia by the Attorney General of the State of West Virginia. The WVAG Complaint makes factual allegations generally similar to those in the Hindo Complaint. On May 31, 2005, defendants removed the WVAG Complaint to the United States District Court for the Northern District of West Virginia. On July 12, 2005, plaintiff moved to remand. On October 19, 2005, the WVAG Complaint was transferred to the Mutual Fund MDL.
On August 30, 2005, the WV Securities Commissioner signed a “Summary Order to Cease and Desist, and Notice of Right to Hearing” addressed to AllianceBernstein and Holding. The Summary Order claims that AllianceBernstein and Holding violated the West Virginia Uniform Securities Act and makes factual allegations generally similar to those in the SEC Order and NYAG AoD. On January 26, 2006, AllianceBernstein, Holding, and various unaffiliated defendants filed a Petition for Writ of Prohibition and Order Suspending Proceedings in West Virginia state court seeking to vacate the Summary Order and for other relief.
We intend to vigorously defend against the allegations in the WVAG Complaint. At the present time, we are unable to predict the outcome or estimate a possible loss or range of loss in respect of this matter because of the inherent uncertainty regarding the outcome of complex litigation, the fact that plaintiffs did not specify an amount of damages sought in their complaint, and the fact that, to date, we have not engaged in settlement negotiations.
We previously concluded that the likelihood of a negative outcome in the market timing-related matters (excluding the WVAG Complaint) is probable. As previously disclosed, AllianceBernstein recorded charges totaling $330 million during the second half of 2003, of which (i) $250 million was paid to the Restitution Fund (the $250 million was funded out of operating cash flow and paid to the SEC in January 2004), (ii) $30 million was used to settle a private civil mutual fund litigation unrelated to any regulatory agreements, and (iii) $50 million was reserved for estimated expenses related to our market-timing settlements with the SEC and the NYAG and our market timing-related liabilities (excluding WVAG Complaint-related expenses). AllianceBernstein paid $8 million during 2005 related to market timing and has cumulatively paid $310 million (excluding WVAG Complaint-related expenses). Including $10 million in charges taken in prior periods, we have reserves of approximately $30 million available for market timing-related liabilities in future periods.
We cannot determine at this time the eventual outcome, timing or impact of the market timing-related matters. Accordingly, it is possible that additional charges in the future may be required, the amount, timing, and impact of which we are unable to estimate at this time.
Revenue Sharing-related Matters
On June 22, 2004, a purported class action complaint entitled Aucoin, et al. v. Alliance Capital Management L.P., et al. (“Aucoin Complaint”) was filed against AllianceBernstein, Holding, the General Partner, AXA Financial, AllianceBernstein Investments, certain current and former directors of the U.S. Funds, and unnamed Doe defendants. The Aucoin Complaint names the U.S. Funds as nominal defendants. The Aucoin Complaint was filed in the United States District Court for the Southern District of New York by an alleged shareholder of the AllianceBernstein Growth & Income Fund. The Aucoin Complaint alleges, among other things, (i) that certain of the defendants improperly authorized the payment of excessive commissions and other fees from U.S. Fund assets to broker-dealers in exchange for preferential marketing services, (ii) that certain of the defendants misrepresented and omitted from registration statements and other reports material facts concerning such
66
payments, and (iii) that certain defendants caused such conduct as control persons of other defendants. The Aucoin Complaint asserts claims for violation of Sections 34(b), 36(b) and 48(a) of the Investment Company Act, Sections 206 and 215 of the Advisers Act, breach of common law fiduciary duties, and aiding and abetting breaches of common law fiduciary duties. Plaintiffs seek an unspecified amount of compensatory damages and punitive damages, rescission of their contracts with AllianceBernstein, including recovery of all fees paid to AllianceBernstein pursuant to such contracts, an accounting of all U.S. Fund-related fees, commissions and soft dollar payments, and restitution of all unlawfully or discriminatorily obtained fees and expenses.
Since June 22, 2004, nine additional lawsuits making factual allegations substantially similar to those in the Aucoin Complaint were filed against AllianceBernstein and certain other defendants. All nine of the lawsuits (i) were brought as class actions filed in the United States District Court for the Southern District of New York, (ii) assert claims substantially identical to the Aucoin Complaint, and (iii) are brought on behalf of shareholders of U.S. Funds.
On February 2, 2005, plaintiffs filed a consolidated amended class action complaint (“Aucoin Consolidated Amended Complaint”) that asserts claims substantially similar to the Aucoin Complaint and the nine additional lawsuits referenced above. On October 19, 2005, the District Court dismissed each of the claims set forth in the Aucoin Consolidated Amended Complaint, except for plaintiff’s claim under Section 36(b) of the Investment Company Act. On January 11, 2006, the District Court granted defendants’ motion for reconsideration and dismissed the remaining Section 36(b) claim. Plaintiffs have moved for leave to amend their consolidated complaint.
We believe that plaintiff’s allegations in the Aucoin Consolidated Amended Complaint are without merit and intend to vigorously defend against these allegations. At the present time, we are unable to predict the outcome or estimate a possible loss or range of loss in respect of this matter because of the inherent uncertainty regarding the outcome of complex litigation, the fact that plaintiffs did not specify an amount of damages sought in their complaint, and the fact that, to date, we have not engaged in settlement negotiations.
We are involved in various other inquiries, administrative proceedings, and litigation, some of which allege substantial damages. While any proceeding or litigation has the element of uncertainty, we believe that the outcome of any one of the other lawsuits or claims that is pending or threatened, or all of them combined, will not have a material adverse effect on our results of operations or financial condition.
7. Cash Distributions
Holding is required to distribute all of its Available Cash Flow, as defined in the Holding Partnership Agreement, to its unitholders and to the General Partner. Available Cash Flow can be summarized as the cash flow received by AllianceBernstein from operations minus such amounts as the General Partner determines, in its sole discretion, should be retained by AllianceBernstein for use in its business. Cash flow received from operations, or “operating cash flow”, is computed by the General Partner by determining the sum of:
• net cash provided by operation activities of AllianceBernstein,
• proceeds from borrowings and from sales or other dispositions of assets in the ordinary course of business, and
• income from investments in marketable securities, liquid investments, and other financial instruments that are acquired for investment purposes and that have a value that may be readily established,
and then subtracting from this amount the sum of :
• payments in respect of the principal of borrowings, and
• amounts expended for the purchase of assets in the ordinary course of business.
On January 25, 2006, the General Partner declared a distribution of $83.9 million, or $1.02 per unit, representing a distribution from Available Cash Flow for the three months ended December 31, 2005. The distribution was paid on February 16, 2006 to holders of record as of February 6, 2006.
67
8. Quarterly Financial Data (Unaudited)
| | Quarters Ended 2005 | |
| | December 31 | | September 30 | | June 30 | | March 31 | |
| | (in thousands, except per unit amounts) | |
| | | | | | | | | |
Equity in earnings of AllianceBernstein | | $ | 92,143 | | $ | 67,237 | | $ | 62,654 | | $ | 53,020 | |
Net income | | $ | 84,536 | | $ | 60,570 | | $ | 56,124 | | $ | 46,834 | |
Basic net income per unit | | $ | 1.03 | | $ | 0.74 | | $ | 0.69 | | $ | 0.58 | |
Diluted net income per unit | | $ | 1.02 | | $ | 0.74 | | $ | 0.68 | | $ | 0.58 | |
Cash distributions per unit(1) | | $ | 1.02 | | $ | 0.74 | | $ | 0.68 | | $ | 0.56 | |
Unit prices(2): | | | | | | | | | |
High | | $ | 58.46 | | $ | 48.39 | | $ | 47.75 | | $ | 49.90 | |
Low | | $ | 46.00 | | $ | 43.65 | | $ | 42.35 | | $ | 40.25 | |
| | Quarters Ended 2004 | |
| | December 31 | | September 30 | | June 30 | | March 31 | |
| | (in thousands, except per unit amounts) | |
| | | | | | | | | |
Equity in earnings of AllianceBernstein | | $ | 71,509 | | $ | 47,701 | | $ | 48,585 | | $ | 52,176 | |
Net income | | $ | 64,675 | | $ | 41,758 | | $ | 42,379 | | $ | 46,361 | |
Basic net income per unit | | $ | 0.81 | | $ | 0.52 | | $ | 0.53 | | $ | 0.59 | |
Diluted net income per unit | | $ | 0.80 | | $ | 0.52 | | $ | 0.53 | | $ | 0.58 | |
Cash distributions per unit(1) | | $ | 0.82 | | $ | 0.52 | | $ | 0.53 | | $ | 0.14 | |
Unit prices(2): | | | | | | | | | |
High | | $ | 42.30 | | $ | 36.03 | | $ | 37.60 | | $ | 39.00 | |
Low | | $ | 35.50 | | $ | 32.35 | | $ | 31.47 | | $ | 34.03 | |
(1) Declared and paid during the following quarter.
(2) High and low sales prices as reported by the NYSE.
68
Report of Independent Registered Public Accounting Firm
The General Partner and Unitholders
AllianceBernstein Holding L.P.:
We have audited the accompanying statements of financial condition of AllianceBernstein Holding L.P. (“AllianceBernstein Holding”), formerly Alliance Capital Management Holding L.P., as of December 31, 2005 and 2004, and the related statements of income, changes in partners’ capital and comprehensive income and cash flows for each of the years in the three-year period ended December 31, 2005. These financial statements are the responsibility of the management of the General Partner. Our responsibility is to express an opinion on these financial statements based on our audits.
We conducted our audits in accordance with the standards of the Public Company Accounting Oversight Board (United States). Those standards require that we plan and perform the audit to obtain reasonable assurance about whether the financial statements are free of material misstatement. An audit includes examining, on a test basis, evidence supporting the amounts and disclosures in the financial statements. An audit also includes assessing the accounting principles used and significant estimates made by management, as well as evaluating the overall financial statement presentation. We believe that our audits provide a reasonable basis for our opinion.
In our opinion, the financial statements referred to above present fairly, in all material respects, the financial position of AllianceBernstein Holding as of December 31, 2005 and 2004, and the results of its operations and its cash flows for each of the years in the three-year period ended December 31, 2005, in conformity with U.S. generally accepted accounting principles.
We also have audited, in accordance with the standards of the Public Company Accounting Oversight Board (United States), the effectiveness of AllianceBernstein Holding’s internal control over financial reporting as of December 31, 2005, based on criteria established in Internal Control—Integrated Framework issued by the Committee of Sponsoring Organizations of the Treadway Commission (COSO), and our report dated February 24, 2006 expressed an unqualified opinion on management’s assessment of, and the effective operation of, internal control over financial reporting.
/s/ KPMG LLP | |
New York, New York |
February 24, 2006 |
69
Report of Independent Registered Public Accounting Firm
The General Partner and Unitholders
AllianceBernstein Holding L.P.:
We have audited management’s assessment, included in the accompanying Management’s Report on Internal Controls Over Financial Reporting, that AllianceBernstein Holding L.P. (“AllianceBernstein Holding”), formerly Alliance Capital Management Holding L.P., maintained effective internal control over financial reporting as of December 31, 2005, based on criteria established in Internal Control-Integrated Framework issued by the Committee of Sponsoring Organizations of the Treadway Commission (COSO). Management of the General Partner is responsible for maintaining effective internal control over financial reporting and for its assessment of the effectiveness of internal control over financial reporting. Our responsibility is to express an opinion on management’s assessment and an opinion on the effectiveness of AllianceBernstein Holding’s internal control over financial reporting based on our audit.
We conducted our audit in accordance with the standards of the Public Company Accounting Oversight Board (United States). Those standards require that we plan and perform the audit to obtain reasonable assurance about whether effective internal control over financial reporting was maintained in all material respects. Our audit included obtaining an understanding of internal control over financial reporting, evaluating management’s assessment, testing and evaluating the design and operating effectiveness of internal control, and performing such other procedures as we considered necessary in the circumstances. We believe that our audit provides a reasonable basis for our opinion.
A company’s internal control over financial reporting is a process designed to provide reasonable assurance regarding the reliability of financial reporting and the preparation of financial statements for external purposes in accordance with generally accepted accounting principles. A company’s internal control over financial reporting includes those policies and procedures that (1) pertain to the maintenance of records that, in reasonable detail, accurately and fairly reflect the transactions and dispositions of the assets of the company; (2) provide reasonable assurance that transactions are recorded as necessary to permit preparation of financial statements in accordance with generally accepted accounting principles, and that receipts and expenditures of the company are being made only in accordance with authorizations of management and directors of the company; and (3) provide reasonable assurance regarding prevention or timely detection of unauthorized acquisition, use, or disposition of the company’s assets that could have a material effect on the financial statements.
Because of its inherent limitations, internal control over financial reporting may not prevent or detect misstatements. Also, projections of any evaluation of effectiveness to future periods are subject to the risk that controls may become inadequate because of changes in conditions, or that the degree of compliance with the policies or procedures may deteriorate.
In our opinion, management’s assessment that AllianceBernstein Holding maintained effective internal control over financial reporting as of December 31, 2005, is fairly stated, in all material respects, based on criteria established in Internal Control-Integrated Framework issued by the Committee of Sponsoring Organizations of the Treadway Commission (COSO). Also, in our opinion, AllianceBernstein Holding maintained, in all material respects, effective internal control over financial reporting as of December 31, 2005, based on criteria established in Internal Control-Integrated Framework issued by the Committee of Sponsoring Organizations of the Treadway Commission (COSO).
We also have audited, in accordance with the standards of the Public Company Accounting Oversight Board (United States), the statements of financial condition of AllianceBernstein Holding as of December 31, 2005 and 2004, and the related statements of income, changes in partners’ capital and comprehensive income and cash flows for each of the years in the three-year period ended December 31, 2005 and our report dated February 24, 2006 expressed an unqualified opinion on those financial statements.
/s/ KPMG LLP | |
New York, New York |
February 24, 2006 |
70
ALLIANCEBERNSTEIN L.P.
AND SUBSIDIARIES
Consolidated Statements of Financial Condition
(in thousands, except unit amounts)
| | December 31, | |
| | 2005 | | 2004 | |
ASSETS | | | | | |
Cash and cash equivalents | | $ | 654,168 | | $ | 1,061,523 | |
Cash and securities segregated, at market (cost $1,720,295 and $1,488,872) | | 1,720,809 | | 1,489,041 | |
Receivables, net: | | | | | |
Brokers and dealers | | 2,093,461 | | 1,487,601 | |
Brokerage clients | | 429,586 | | 352,108 | |
Fees, net | | 413,198 | | 354,517 | |
Investments | | 345,045 | | 192,167 | |
Furniture, equipment and leasehold improvements, net | | 236,309 | | 215,367 | |
Goodwill, net | | 2,876,657 | | 2,876,657 | |
Intangible assets, net | | 305,325 | | 326,025 | |
Deferred sales commissions, net | | 196,637 | | 254,456 | |
Other investments | | 86,369 | | 61,350 | |
Other assets | | 132,916 | | 108,518 | |
Total assets | | $ | 9,490,480 | | $ | 8,779,330 | |
LIABILITIES AND PARTNERS’ CAPITAL | | | | | |
Liabilities: | | | | | |
Payables: | | | | | |
Brokers and dealers | | $ | 1,057,274 | | $ | 786,544 | |
Brokerage clients | | 2,929,500 | | 2,663,952 | |
AllianceBernstein mutual funds | | 140,603 | | 125,899 | |
Accounts payable and accrued expenses | | 286,449 | | 275,264 | |
Accrued compensation and benefits | | 357,321 | | 326,219 | |
Debt | | 407,291 | | 407,517 | |
Minority interests in consolidated subsidiaries | | 9,368 | | 10,237 | |
Total liabilities | | 5,187,806 | | 4,595,632 | |
Commitments and contingencies (See Note 11) | | | | | |
Partners’ capital: | | | | | |
General Partner | | 44,065 | | 42,917 | |
Limited partners: 255,624,870 and 253,880,399 units issued and outstanding | | 4,334,207 | | 4,220,753 | |
| | 4,378,272 | | 4,263,670 | |
Capital contributions receivable from General Partner | | (31,775 | ) | (33,053 | ) |
Deferred compensation expense | | (67,895 | ) | (89,019 | ) |
Accumulated other comprehensive income | | 24,072 | | 42,100 | |
Total partners’ capital | | 4,302,674 | | 4,183,698 | |
Total liabilities and partners’ capital | | $ | 9,490,480 | | $ | 8,779,330 | |
See Accompanying Notes to Consolidated Financial Statements.
71
ALLIANCEBERNSTEIN L.P.
AND SUBSIDIARIES
Consolidated Statements of Income
(in thousands, except per unit amounts)
| | Years Ended December 31, | |
| | 2005 | | 2004 | | 2003 | |
Revenues: | | | | | | | |
Investment advisory and services fees | | $ | 2,290,867 | | $ | 2,113,351 | | $ | 1,882,399 | |
Distribution revenues | | 397,800 | | 447,283 | | 436,037 | |
Institutional research services | | 321,281 | | 303,609 | | 267,868 | |
Shareholder servicing fees | | 99,358 | | 115,979 | | 126,383 | |
Other revenues, net | | 141,374 | | 75,211 | | 52,241 | |
| | 3,250,680 | | 3,055,433 | | 2,764,928 | |
Expenses: | | | | | | | |
Employee compensation and benefits | | 1,263,456 | | 1,085,163 | | 914,529 | |
Promotion and servicing: | | | | | | | |
Distribution plan payments | | 291,953 | | 374,184 | | 370,575 | |
Amortization of deferred sales commissions | | 131,979 | | 177,356 | | 208,565 | |
Other | | 198,004 | | 202,327 | | 197,079 | |
General and administrative | | 386,590 | | 426,389 | | 339,706 | |
Interest | | 25,109 | | 24,232 | | 25,286 | |
Amortization of intangible assets | | 20,700 | | 20,700 | | 20,700 | |
Charge for mutual fund matters and legal proceedings (Note 11) | | — | | — | | 330,000 | |
| | 2,317,791 | | 2,310,351 | | 2,406,440 | |
Income before income taxes | | 932,889 | | 745,082 | | 358,488 | |
Income taxes | | 64,571 | | 39,932 | | 28,680 | |
Net income | | $ | 868,318 | | $ | 705,150 | | $ | 329,808 | |
Net income per unit: | | | | | | | |
Basic | | $ | 3.37 | | $ | 2.76 | | $ | 1.30 | |
Diluted | | $ | 3.35 | | $ | 2.74 | | $ | 1.29 | |
See Accompanying Notes to Consolidated Financial Statements.
72
ALLIANCEBERNSTEIN L.P.
AND SUBSIDIARIES
Consolidated Statements of Changes in Partners’ Capital and Comprehensive Income
(in thousands, except per unit amounts)
| | General
Partner’s
Capital | | Limited
Partners’
Capital | | Capital
Contributions
Receivable | | Deferred
Compensation
Expense | | Accumulated
Other
Comprehensive
Income | | Total
Partners’
Capital | |
| | | | | | | | | | | | | |
Balance as of December 31, 2002 | | $ | 41,335 | | $ | 4,082,433 | | $ | (35,137 | ) | $ | (129,045 | ) | $ | 3,865 | | $ | 3,963,451 | |
Comprehensive income: | | | | | | | | | | | | | |
Net income | | 3,298 | | 326,510 | | — | | — | | — | | 329,808 | |
Other comprehensive income: | | | | | | | | | | | | | |
Unrealized loss on investments, net | | — | | — | | — | | — | | 2,325 | | 2,325 | |
Foreign currency translation adjustment, net | | — | | — | | — | | — | | 21,378 | | 21,378 | |
Comprehensive income | | 3,298 | | 326,510 | | — | | — | | 23,703 | | 353,511 | |
Cash distributions to General Partner and unitholders ($2.24 per unit) | | (5,671 | ) | (560,927 | ) | — | | — | | — | | (566,598 | ) |
Capital contributions from General Partner | | — | | — | | 1,734 | | — | | — | | 1,734 | |
Purchases of Holding Units to fund deferred compensation plans, net | | — | | (15,690 | ) | — | | (51,390 | ) | — | | (67,080 | ) |
Compensatory Holding Unit options expense | | — | | 2,589 | | — | | — | | — | | 2,589 | |
Amortization of deferred compensation expense | | — | | — | | — | | 69,301 | | — | | 69,301 | |
Compensation plan accrual | | 23 | | 2,272 | | (2,295 | ) | — | | — | | — | |
Additional investment by Holding with proceeds from exercise of compensatory options | | 210 | | 21,351 | | — | | — | | — | | 21,561 | |
Balance as of December 31, 2003 | | 39,195 | | 3,858,538 | | (35,698 | ) | (111,134 | ) | 27,568 | | 3,778,469 | |
| | | | | | | | | | | | | |
Comprehensive income: | | | | | | | | | | | | | |
Net income | | 7,052 | | 698,098 | | — | | — | | — | | 705,150 | |
Other comprehensive income: | | | | | | | | | | | | | |
Unrealized gain on investments, net | | — | | — | | — | | — | | (236 | ) | (236 | ) |
Foreign currency translation adjustment, net | | — | | — | | — | | — | | 14,768 | | 14,768 | |
Comprehensive income | | 7,052 | | 698,098 | | — | | — | | 14,532 | | 719,682 | |
Cash distributions to General Partner and unitholders ($1.50 per unit) | | (3,838 | ) | (379,144 | ) | — | | — | | — | | (382,982 | ) |
Capital contributions from General Partner | | — | | — | | 5,901 | | — | | — | | 5,901 | |
Purchases of Holding Units to fund deferred compensation plans, net | | 9 | | (8,557 | ) | — | | (36,532 | ) | — | | (45,080 | ) |
Compensatory Holding Unit options expense | | — | | 2,356 | | — | | — | | — | | 2,356 | |
Amortization of deferred compensation expense | | — | | — | | — | | 58,647 | | — | | 58,647 | |
Compensation plan accrual | | 32 | | 3,224 | | (3,256 | ) | — | | — | | — | |
Additional investment by Holding with proceeds from exercise of compensatory options | | 467 | | 46,238 | | — | | — | | — | | 46,705 | |
Balance as of December 31, 2004 | | 42,917 | | 4,220,753 | | (33,053 | ) | (89,019 | ) | 42,100 | | 4,183,698 | |
| | | | | | | | | | | | | |
Comprehensive income: | | | | | | | | | | | | | |
Net income | | 8,683 | | 859,635 | | — | | — | | — | | 868,318 | |
Other comprehensive income (loss): | | | | | | | | | | | | | |
Unrealized loss on investments, net | | — | | — | | — | | — | | 1,985 | | 1,985 | |
Foreign currency translation adjustment, net | | — | | — | | — | | — | | (20,013 | ) | (20,013 | ) |
Comprehensive income (loss) | | 8,683 | | 859,635 | | — | | — | | (18,028 | ) | 850,290 | |
Cash distributions to General Partner and unitholders ($3.11 per unit) | | (8,005 | ) | (792,504 | ) | — | | — | | — | | (800,509 | ) |
Capital contributions from General Partner | | — | | — | | 4,191 | | — | | — | | 4,191 | |
Purchases of Holding Units to fund deferred compensation plans, net | | 16 | | (733 | ) | — | | (32,536 | ) | — | | (33,253 | ) |
Compensatory Holding Unit options expense | | — | | 2,192 | | — | | — | | — | | 2,192 | |
Amortization of deferred compensation expense | | — | | — | | — | | 53,660 | | — | | 53,660 | |
Compensation plan accrual | | 29 | | 2,884 | | (2,913 | ) | — | | — | | — | |
Additional investment by Holding with proceeds from exercise of compensatory options | | 425 | | 41,980 | | — | | — | | — | | 42,405 | |
Balance as of December 31, 2005 | | $ | 44,065 | | $ | 4,334,207 | | $ | (31,775 | ) | $ | (67,895 | ) | $ | 24,072 | | $ | 4,302,674 | |
See Accompanying Notes to Consolidated Financial Statements.
73
ALLIANCEBERNSTEIN L.P.
AND SUBSIDIARIES
Consolidated Statements of Cash Flows
(in thousands)
| | Years Ended December 31, | |
| | 2005 | | 2004 | | 2003 | |
Cash flows from operating activities: | | | | | | | |
Net income | | $ | 868,318 | | $ | 705,150 | | $ | 329,808 | |
Adjustments to reconcile net income to net cash provided by operating activities: | | | | | | | |
Amortization of deferred sales commissions | | 131,979 | | 177,356 | | 208,565 | |
Amortization of deferred compensation | | 85,437 | | 101,561 | | 116,357 | |
Depreciation and other amortization | | 67,980 | | 74,878 | | 77,583 | |
Other, net | | (14,774 | ) | 7,859 | | (13,057 | ) |
Changes in assets and liabilities: | | | | | | | |
(Increase) in segregated cash and securities | | (231,768 | ) | (203,240 | ) | (111,478 | ) |
(Increase) decrease in receivable from brokers and dealers | | (605,389 | ) | 137,052 | | (658,979 | ) |
(Increase) in receivable from brokerage clients | | (90,453 | ) | (21,154 | ) | (114,861 | ) |
(Increase) in fees receivable, net | | (65,861 | ) | (13,187 | ) | (57,322 | ) |
(Increase) in trading investments | | (135,121 | ) | (56,105 | ) | (12,273 | ) |
(Increase) in deferred sales commissions | | (74,161 | ) | (44,584 | ) | (94,886 | ) |
(Increase) other investments | | (23,045 | ) | (29,996 | ) | (9,591 | ) |
(Increase) in other assets | | (27,645 | ) | (2,142 | ) | (6,968 | ) |
Increase (decrease) in payable to brokers and dealers | | 279,926 | | (339,687 | ) | 537,619 | |
Increase in payable to brokerage clients | | 268,608 | | 761,098 | | 320,312 | |
Increase (decrease) in payable to AllianceBernstein mutual funds | | 14,966 | | 9,488 | | (5,101 | ) |
Increase (decrease) in accounts payable and accrued expenses | | 7,158 | | (267,879 | ) | 287,600 | |
Increase (decrease) in accrued compensation and benefits, less deferred compensation | | 3,927 | | (28,304 | ) | (35,372 | ) |
Net cash provided by operating activities | | 460,082 | | 968,164 | | 757,956 | |
| | | | | | | |
Cash flows from investing activities: | | | | | | | |
Purchases of investments | | (7,380 | ) | (27,407 | ) | (62,607 | ) |
Proceeds from sales of investments | | 12,717 | | 38,046 | | 36,514 | |
Additions to furniture, equipment and leasehold improvements, net | | (72,586 | ) | (57,313 | ) | (29,154 | ) |
Net cash used in investing activities | | (67,249 | ) | (46,674 | ) | (55,247 | ) |
| | | | | | | |
Cash flows from financing activities: | | | | | | | |
Repayment of commercial paper, net of proceeds from issuance | | (150 | ) | (92 | ) | (22,077 | ) |
Cash distributions to General Partner and unitholders | | (800,509 | ) | (382,982 | ) | (566,598 | ) |
Capital contributions from General Partner | | 4,191 | | 5,901 | | 1,734 | |
Additional investment by Holding with proceeds from exercise of compensatory options | | 42,405 | | 46,705 | | 21,561 | |
Purchases of Holding Units to fund deferred compensation plans, net | | (33,253 | ) | (45,080 | ) | (67,080 | ) |
Net cash used in financing activities | | (787,316 | ) | (375,548 | ) | (632,460 | ) |
| | | | | | | |
Effect of exchange rate changes on cash and cash equivalents | | (12,872 | ) | 12,723 | | 14,851 | |
| | | | | | | |
Net (decrease) increase in cash and cash equivalents | | (407,355 | ) | 558,665 | | 85,100 | |
Cash and cash equivalents as of beginning of the period | | 1,061,523 | | 502,858 | | 417,758 | |
Cash and cash equivalents as of end of the period | | $ | 654,168 | | $ | 1,061,523 | | $ | 502,858 | |
Cash paid: | | | | | | | |
Interest | | $ | 122,152 | | $ | 55,102 | | $ | 43,505 | |
Income taxes | | $ | 56,521 | | $ | 33,516 | | $ | 29,928 | |
See Accompanying Notes to Consolidated Financial Statements.
74
ALLIANCEBERNSTEIN L.P.
AND SUBSIDIARIES
Notes to Consolidated Financial Statements
Effective February 24, 2006, Alliance Capital Management Holding L.P. (“Holding”) and Alliance Capital Management L.P. (“Alliance Capital”) changed their names to AllianceBernstein Holding L.P. (“Holding”) and AllianceBernstein L.P. (“AllianceBernstein”), respectively.
The words “we” and “our” refer collectively to Holding, and AllianceBernstein and its subsidiaries, or to their officers and employees. Similarly, the word “company” refers to both Holding and AllianceBernstein. Where the context requires distinguishing between Holding and AllianceBernstein, we identify which of them is being discussed. Cross-references are in bold text.
1. Organization and Business Description
AllianceBernstein provides diversified investment management and related services globally to a broad range of clients. Its principal services are:
• Institutional Investment Services – Servicing institutional investors, including unaffiliated corporate and public employee pension funds, endowment funds, domestic and foreign institutions and governments, and affiliates such as AXA and certain of its insurance company subsidiaries, by means of separately managed accounts, sub-advisory relationships, structured products, group trusts, mutual funds, and other investment vehicles.
• Retail Services – Servicing individual investors, primarily by means of retail mutual funds sponsored by AllianceBernstein, our subsidiaries and affiliated joint venture companies, sub-advisory relationships in respect of mutual funds sponsored by third parties, separately managed account programs that are sponsored by registered broker-dealers (“Separately Managed Account Programs”), and other investment vehicles.
• Private Client Services – Servicing high-net-worth individuals, trusts and estates, charitable foundations, partnerships, private and family corporations, and other entities, by means of separately managed accounts, hedge funds, mutual funds, and other investment vehicles.
• Institutional Research Services – Servicing institutional investors desiring institutional research services including in-depth research, portfolio strategy, trading, and brokerage-related services.
We also provide distribution, shareholder servicing, and administrative services to our sponsored mutual funds.
We provide a broad range of investment services with expertise in:
• Growth and value equity, the two predominant equity strategies;
• Blend, combining growth and value components and systematic rebalancing between the two;
• Fixed income, including both taxable and tax-exempt securities;
• Balanced, combining equity and fixed income components; and
• Passive, including both index and enhanced index strategies.
We manage these strategies using various investment disciplines, including market capitalization (e.g., large-, mid-, and small-cap equities), term (e.g., long-, intermediate-, and short-duration debt securities), and geographic location (e.g., U.S., international, global, and emerging markets), as well as local and regional disciplines in major markets around the world.
We have a broad foundation in fundamental research, including comprehensive industry and company coverage from the differing perspectives of growth, value, and fixed income, as well as global economic and currency forecasting capabilities and quantitative research.
As of December 31, 2005, AXA, a société anonyme organized under the laws of France and the holding company for an international group of insurance and related financial services companies, AXA Financial, Inc.
75
(an indirect wholly-owned subsidiary of AXA, “AXA Financial”), AXA Equitable Life Insurance Company (formerly known as The Equitable Life Assurance Society of the United States and a wholly-owned subsidiary of AXA Financial, “AXA Equitable”) and certain subsidiaries of AXA Equitable, collectively referred to as “AXA and its subsidiaries”, owned approximately 1.8% of the issued and outstanding Holding Units.
As of December 31, 2005, the ownership of AllianceBernstein, as a percentage of limited partnership interests, was as follows:
AXA and its subsidiaries | | 60.1 | % |
Holding | | 32.2 | |
SCB Partners Inc. (a wholly-owned subsidiary of SCB Inc.; formerly known as
Sanford C. Bernstein Inc.) | | 6.4 | |
Other | | 1.3 | |
| | 100.0 | % |
AllianceBernstein Corporation (formerly known as Alliance Capital Management Corporation, “General Partner”), an indirect wholly-owned subsidiary of AXA, is the general partner of both Holding and AllianceBernstein. AllianceBernstein Corporation owns 100,000 general partnership units (economically equivalent to limited partnership units) in Holding and a 1% general partnership interest in AllianceBernstein. Including the general partnership interests in AllianceBernstein and Holding, and their equity interest in Holding, as of December 31, 2005, AXA and its subsidiaries had an approximate 61.1% economic interest in AllianceBernstein.
2. Summary of Significant Accounting Policies
Basis of Presentation
The consolidated financial statements have been prepared in accordance with accounting principles generally accepted in the United States of America. The preparation of the financial statements requires management to make certain estimates and assumptions that affect the reported amounts of assets and liabilities and disclosure of contingent assets and liabilities at the dates of the consolidated financial statements and the reported amounts of revenues and expenses during the reporting periods. Actual results could differ from those estimates.
Principles of Consolidation
The consolidated financial statements include AllianceBernstein, its majority-owned and/or controlled subsidiaries and company-sponsored mutual funds during their incubation periods. All significant inter-company transactions and balances among the consolidated entities have been eliminated.
The equity method of accounting is used for unconsolidated joint ventures and, in accordance with Emerging Issues Task Force D-46, “Accounting for Limited Partnership Investments”, for investments made primarily to seed limited partnership hedge funds that we sponsor and manage. The investments are included in “other investments” on the consolidated balance sheets and the related investment income and gains and losses are included in “other revenues” on the consolidated statements of income.
Cash and Cash Equivalents
Cash and cash equivalents include cash on hand, demand deposits and highly liquid investments including money market accounts with average maturities of three months or less. Due to the short-term nature of these instruments, this recorded value has been determined to approximate fair value.
76
Fees Receivable, Net
Fees receivable are shown net of allowances. An allowance for doubtful accounts related to investment advisory and services fees is determined through an analysis of the aging of receivables, assessments of collectibility based on historical trends and other qualitative and quantitative factors, including the following: our relationship with the client, the financial health (or ability to pay) of the client, current economic conditions and whether the account is closed or active.
Collateralized Securities Transactions
Customers’ securities transactions are reported on a settlement date basis, with related commission income and expenses reported on a trade date basis. Receivables from and payables to customers include amounts due on cash and margin transactions. Securities owned by customers are held as collateral for receivables; collateral is not reflected in the consolidated financial statements. Principal securities transactions and related expenses are recorded on a trade date basis.
Sanford C. Bernstein & Co., LLC (“SCB LLC”) and Sanford C. Bernstein Limited (“SCBL”), both wholly-owned subsidiaries, account for transfers of financial assets in accordance with Statement of Financial Accounting Standards No. 140, “Accounting for Transfers and Servicing of Financial Assets and Extinguishments of Liabilities”. Securities borrowed and securities loaned are recorded at the amount of cash collateral advanced or received in connection with the transaction and are included in receivables from and payables to brokers and dealers in the consolidated statements of financial condition. Securities borrowed transactions require SCB LLC and SCBL to deposit cash collateral with the lender. With respect to securities loaned, SCB LLC and SCBL receive cash collateral from the borrower. The initial collateral advanced or received approximates or is greater than the fair value of securities borrowed or loaned. SCB LLC and SCBL monitor the fair value of the securities borrowed and loaned on a daily basis and request additional collateral or return excess collateral, as appropriate. Income or expense is recognized over the life of the transactions.
Investments
Investments, principally investments in United States Treasury Bills, unconsolidated company-sponsored mutual funds and securities held by consolidated company-sponsored mutual funds, are classified as either trading or available-for-sale securities. The trading investments are stated at fair value with unrealized gains and losses reported in net income. Available-for-sale investments are stated at fair value with unrealized gains and losses reported as a separate component of accumulated other comprehensive income in partners’ capital. Realized gains and losses on the sale of investments are included in income in the current period.
Furniture, Equipment and Leasehold Improvements, Net
Furniture, equipment and leasehold improvements are stated at cost, less accumulated depreciation and amortization. Depreciation is recognized on a straight-line basis over the estimated useful lives of eight years for furniture and three to six years for equipment and software. Leasehold improvements are amortized on a straight-line basis over the lesser of their estimated useful lives or the terms of the related leases.
Goodwill, Net
On October 2, 2000, AllianceBernstein acquired the business and assets of SCB Inc., an investment research and management company formerly known as Sanford C. Bernstein Inc. (“Bernstein”), and assumed the liabilities of Bernstein (“Bernstein Transaction”). The purchase price consisted of a cash payment of approximately $1.5 billion and 40.8 million newly issued AllianceBernstein Units. AXA Financial purchased approximately 32.6 million newly issued AllianceBernstein Units for $1.6 billion on June 21, 2000, to fund the cash portion of the purchase price.
77
The Bernstein Transaction was accounted for under the purchase method with the results of Bernstein included in the consolidated financial statements from the acquisition date. The cost of the acquisition was allocated on the basis of the estimated fair value of the assets acquired and liabilities assumed. Portions of the purchase price were identified as net tangible assets of $0.1 billion and costs assigned to contracts acquired of $0.4 billion. Costs assigned to contracts acquired are being amortized over twenty years. The excess of the purchase price over the fair value of identifiable assets acquired resulted in the recognition of goodwill of approximately $3.0 billion.
Goodwill represents the excess of the purchase price over the fair value of identifiable assets of acquired companies, less accumulated amortization. Under Statement of Financial Accounting Standards No. 142 (“SFAS No. 142”), “Goodwill and Other Intangible Assets”, goodwill is tested annually, as of September 30, for impairment. Goodwill impairment is indicated if the net recorded value of AllianceBernstein’s assets and liabilities (including goodwill) exceeds estimated fair value, which would then require the measurement of AllianceBernstein’s assets and liabilities as if AllianceBernstein had been acquired. This measurement may or may not result in goodwill impairment. If impaired, the recorded amount is reduced to estimated fair value with a corresponding charge to earnings. As of September 30, 2005, the impairment test indicated that goodwill was not impaired. Also, as of December 31, 2005, management believes that goodwill was not impaired.
Intangible Assets, Net
Intangible assets consist of costs assigned to investment management contracts of SCB Inc. which was acquired in 2000, less accumulated amortization. In order to determine the fair market value and the remaining useful lives of these investment management contracts, we performed an analysis as of the acquisition date that considered the following factors:
• The nature and characteristics of the intangible assets, including:
• The historical and expected future economic benefits associated with the assets as of the valuation date,
• The historical and expected attrition associated with the assets, and
• Any special rights associated with the assets;
• The historical and then-current financial condition and operating results of SCB Inc.;
• Discussions with management of SCB Inc. and others to augment our understanding of the nature of the intangible assets; and
• Reviews of market data and other available information relating to SCB Inc. and the investment management industry.
As a result of the analysis, management determined that the intangible assets have an estimated useful life of approximately 20 years.
The gross carrying amount of intangible assets subject to amortization totaled $414.0 million as of December 31, 2005 and 2004, and accumulated amortization was $108.7 million as of December 31, 2005 and $88.0 million as of December 31, 2004, resulting in the net carrying amount of intangible assets subject to amortization of $305.3 million as of December 31, 2005 and $326.0 million as of December 31, 2004. Amortization expense was $20.7 million for each of the years ended December 31, 2005, 2004, and 2003, and estimated amortization expense for each of the next five years is approximately $20.7 million.
Management tests intangible assets for recoverability quarterly, or monthly when events or changes in circumstances occur that could significantly increase the risk of impairment of these assets. Estimated fair value is determined using management’s best estimate of future cash flows discounted to a present value amount. Estimated fair value is then compared to the recorded book value to determine if impairment is indicated. If management determines these assets are not recoverable, an impairment condition would exist and the
78
impairment loss would be measured as the amount by which the recorded amount of those assets exceeds their estimated fair value.
Deferred Sales Commissions, Net
Sales commissions paid to financial intermediaries in connection with the sale of shares of open-end company-sponsored mutual funds sold without a front-end sales charge are capitalized as deferred sales commissions and amortized over periods not exceeding five and one-half years, the periods of time during which deferred sales commissions are generally recovered from distribution services fees received from those funds and from contingent deferred sales charges (“CDSC”) received from shareholders of those funds upon the redemption of their shares. CDSC cash recoveries are recorded as reductions of unamortized deferred sales commissions when received.
Management tests the deferred sales commission asset for recoverability quarterly, or monthly when events or changes in circumstances occur that could significantly increase the risk of impairment of the asset. Significant assumptions utilized to estimate the company’s future average assets under management and undiscounted future cash flows from back-end load shares include expected future market levels and redemption rates. Estimates of undiscounted future cash flows and the remaining life of the deferred sales commission asset are made from these assumptions and the aggregate undiscounted future cash flows are compared to the recorded value of the deferred sales commission asset. Management considers the results of these analyses performed at various dates. If management determines in the future that the deferred sales commission asset is not recoverable, an impairment condition would exist and a loss would be measured as the amount by which the recorded amount of the asset exceeds its estimated fair value. Estimated fair value is determined using management’s best estimate of future cash flows discounted to a present value amount.
Loss Contingencies
With respect to all significant litigation matters, we conduct a probability assessment of the likelihood of a negative outcome. If the likelihood of a negative outcome is probable, and the amount of the loss can be reasonably estimated, we record an estimated loss for the expected outcome of the litigation as required by Statement of Financial Accounting Standards No. 5 (“SFAS No. 5”), “Accounting for Contingencies”, and Financial Accounting Standards Board (“FASB”) Interpretation No. 14 (“FIN No. 14”), “Reasonable Estimation of the Amount of a Loss –an interpretation of FASB Statement No. 5”. If the likelihood of a negative outcome is reasonably possible and we are able to indicate an estimate of the possible loss or range of loss, we disclose that fact together with the estimate of the possible loss or range of loss. However, it is difficult to predict the outcome or estimate a possible loss or range of loss because litigation is subject to significant uncertainties, particularly when plaintiffs allege substantial or indeterminate damages, or when the litigation is highly complex or broad in scope.
Revenue Recognition
Investment advisory and services base fees, generally calculated as a percentage (referred to as “basis points”) of assets under management for clients, are recorded as revenue as the related services are performed. Certain investment advisory contracts provide for a performance-based fee, in addition to or in lieu of a base fee, that is calculated as either a percentage of absolute investment results or a percentage of investment results in excess of a stated benchmark over a specified period of time. Performance-based fees are recorded as revenue at the end of each measurement period. Investment advisory and services fees include brokerage transaction charges received by SCB LLC for certain retail, private client and institutional investment client transactions. Institutional research services revenue consists of brokerage transaction charges received by SCB LLC and SCBL for in-depth research and other services provided to institutional investors. Brokerage transaction charges earned and related expenses are recorded on a trade date basis. Distribution revenues and shareholder servicing fees are accrued as earned.
79
Mutual Fund Underwriting Activities
Purchases and sales of shares of our mutual funds in connection with the underwriting activities of our subsidiaries, including related commission income, are recorded on trade date. Receivables from brokers and dealers for sale of shares of our mutual funds are generally realized within three business days from trade date, in conjunction with the settlement of the related payables to our mutual funds for share purchases. Distribution plan and other promotion and servicing payments are recognized as an expense when incurred.
Compensatory Option Plans
We utilize the fair value method of recording compensation expense including a straight-line amortization policy, relating to compensatory option awards of Holding Units granted subsequent to 2001, as permitted by Statement of Financial Accounting Standards No. 123 (“SFAS No. 123”), “Accounting for Stock-Based Compensation”, as amended by Statement of Financial Accounting Standards No. 148 (“SFAS No. 148”), “Accounting for Stock-Based Compensation—Transition and Disclosure”. Under the fair value method, compensation expense is measured at the grant date based on the estimated fair value of the award and is recognized over the vesting period. Fair value is determined using the Black-Scholes option valuation model. See Note 16 for a description of the compensatory option plans and the Black-Scholes option valuation model. Compensation expense, net of taxes, resulting from compensatory unit option awards granted after 2001 totaled approximately $2.0 million, $2.2 million, and $2.5 million for the years ended December 31, 2005, 2004, and 2003, respectively.
For compensatory option awards granted prior to 2002, we applied the provisions of Accounting Principles Board Opinion No. 25 (“APB No. 25”), “Accounting for Stock Issued to Employees”, under which compensation expense is recognized only if the market value of the underlying Holding Units exceeds the exercise price at the date of grant. We did not record compensation expense for compensatory option awards made prior to 2002 because those options were granted with exercise prices equal to the market value of the underlying Holding Units on the date of grant. Had we recorded compensation expense for those options based on their market value at grant date under SFAS No. 123, net income for 2005, 2004, and 2003 would have been reduced to the pro forma amounts indicated below:
| | Years Ended December 31, | |
| | 2005 | | 2004 | | 2003 | |
| | (in thousands, except per unit amounts) | |
SFAS No. 123 pro forma net income: | | | | | | | |
Net income as reported | | $ | 868,318 | | $ | 705,150 | | $ | 329,808 | |
Add: stock-based compensation expense included in net income, net of tax | | 2,040 | | 2,231 | | 2,460 | |
Deduct: total stock-based compensation expense determined under fair value method for all awards, net of tax | | (3,918 | ) | (7,132 | ) | (13,413 | ) |
SFAS No. 123 pro forma net income | | $ | 866,440 | | $ | 700,249 | | $ | 318,855 | |
Net income per unit: | | | | | | | |
Basic net income per unit as reported | | $ | 3.37 | | $ | 2.76 | | $ | 1.30 | |
Basic net income per unit pro forma | | $ | 3.37 | | $ | 2.74 | | $ | 1.26 | |
Diluted net income per unit as reported | | $ | 3.35 | | $ | 2.74 | | $ | 1.29 | |
Diluted net income per unit pro forma | | $ | 3.34 | | $ | 2.72 | | $ | 1.25 | |
See Note 21 for a discussion of the adoption of SFAS No. 123-R, effective January 1, 2006.
Foreign Currency Translation
Assets and liabilities of foreign subsidiaries are translated into United States dollars (“US$”) at exchange rates in effect at the balance sheet dates, and related revenues and expenses are translated into US$ at average
80
exchange rates in effect during each period. Net foreign currency gains and losses resulting from the translation of assets and liabilities of foreign operations into US$ are reported as a separate component of accumulated other comprehensive income in the consolidated statements of changes in partners’ capital and comprehensive income. Net recognized foreign currency transaction gains and (losses) were $(0.7) million, $(1.8) million, and $3.0 million for 2005, 2004, and 2003, respectively.
Cash Distributions
AllianceBernstein is required to distribute all of its Available Cash Flow, as defined in the Amended and Restated Agreement of Limited Partnership of AllianceBernstein (“AllianceBernstein Partnership Agreement”), to its unitholders and to the General Partner. Available Cash Flow can be summarized as the cash flow received by AllianceBernstein from operations minus such amounts as the General Partner determines, in its sole discretion, should be retained by AllianceBernstein for use in its business. Cash flow received from operations, or “operating cash flow”, is computed by the General Partner by determining the sum of:
• net cash provided by operation activities of AllianceBernstein,
• proceeds from borrowings and from sales or other dispositions of assets in the ordinary course of business, and
• income from investments in marketable securities, liquid investments, and other financial instruments that are acquired for investment purposes and that have a value that may be readily established,
and then subtracting from this amount the sum of :
• payments in respect of the principal of borrowings, and
• amounts expended for the purchase of assets in the ordinary course of business.
Comprehensive Income
Total comprehensive income is reported in the consolidated statements of changes in partners’ capital and comprehensive income and includes net income, unrealized gains and losses on investments classified as available-for-sale, and foreign currency translation adjustments. The accumulated balance of comprehensive income items is displayed separately in the partners’ capital section of the consolidated statements of financial condition.
Reclassifications
Certain prior period amounts have been reclassified to conform to current year presentation. These include the reclassification of certain sub-accounting payments and networking fees from other promotion and servicing expense to shareholder servicing fees and the reclassification of transaction charges earned from AllianceBernstein mutual funds from Institutional Investment Services and Private Client Services to Retail Services.
3. Cash and Securities Segregated Under Federal Regulations and Other Requirements
As of December 31, 2005 and 2004, $1.7 and $1.5 billion, respectively, of United States Treasury Bills were segregated in a special reserve bank custody account for the exclusive benefit of brokerage customers of SCB LLC under rule 15c3-3 of the Securities Exchange Act of 1934, as amended (“Exchange Act”).
4. Net Income Per Unit
Basic net income per unit is derived by reducing net income for the 1% general partnership interest and dividing the remaining 99% by the basic weighted average number of units outstanding for each year. Diluted net income per unit is derived by reducing net income for the 1% general partnership interest and dividing the
81
remaining 99% by the total of the basic weighted average number of units outstanding and the dilutive unit equivalents resulting from outstanding compensatory options as follows:
| | Years Ended December 31, | |
| | 2005 | | 2004 | | 2003 | |
| | (in thousands, except per unit amounts) | |
| | | | | | | |
Net income | | $ | 868,318 | | $ | 705,150 | | $ | 329,808 | |
Weighted average units outstanding—basic | | 254,883 | | 253,121 | | 250,639 | |
Dilutive effect of compensatory options | | 1,714 | | 1,644 | | 2,391 | |
Weighted average units outstanding—diluted | | 256,597 | | 254,765 | | 253,030 | |
| | | | | | | |
Basic net income per unit | | $ | 3.37 | | $ | 2.76 | | $ | 1.30 | |
Diluted net income per unit | | $ | 3.35 | | $ | 2.74 | | $ | 1.29 | |
| | | | | | | | | | | |
As of December 31, 2005, 2004, and 2003, out-of-the-money options to acquire 3,950,100, 4,336,500 and 7,997,700 Holding Units, respectively, have been excluded from the diluted net income per unit computation due to their anti-dilutive effect.
5. Receivables, Net
Receivables, Net are comprised of:
| | December 31, | |
| | 2005 | | 2004 | |
| | (in thousands) | |
| | | | | |
Brokers and dealers: | | | | | |
Deposits for securities borrowed | | $ | 1,966,000 | | $ | 1,364,990 | |
Other | | 127,461 | | 122,611 | |
Total brokers and dealers | | 2,093,461 | | 1,487,601 | |
Brokerage clients | | 429,586 | | 352,108 | |
Fees, net: | | | | | |
Alliance mutual funds | | 143,737 | | 141,435 | |
Unaffiliated clients (net of allowance of $939 in 2005 and $1,707 in 2004) | | 262,279 | | 206,550 | |
Affiliated clients | | 7,182 | | 6,532 | |
Total fees receivable, net | | 413,198 | | 354,517 | |
Total receivables, net | | $ | 2,936,245 | | $ | 2,194,226 | |
6. Investments
As of December 31, 2005 and 2004, investments consisted of investments available-for-sale, principally company-sponsored mutual funds, and trading investments, principally United States Treasury Bills and company-sponsored mutual funds. United States Treasury Bills with a fair market value of $16.9 million were on deposit with various clearing organizations as of December 31, 2005 and 2004.
82
The following is a summary of the cost and fair value of investments as of December 31, 2005 and 2004:
| | Amortized
Cost | | Gross
Unrealized
Gains | | Gross
Unrealized
Losses | | Fair
Value | |
| | (in thousands) | |
| | | | | | | | | |
December 31, 2005: | | | | | | | | | |
Available-for-sale: | | | | | | | | | |
Equity investments | | $ | 26,787 | | $ | 3,777 | | $ | (18 | ) | $ | 30,546 | |
Fixed income investments | | 1,102 | | 181 | | (5 | ) | 1,278 | |
| | 27,889 | | 3,958 | | (23 | ) | 31,824 | |
Trading: | | | | | | | | | |
Equity investments | | 262,153 | | 23,701 | | (3,135 | ) | 282,719 | |
Fixed income investments | | 30,503 | | 290 | | (291 | ) | 30,502 | |
| | 292,656 | | 23,991 | | (3,426 | ) | 313,221 | |
Total investments | | $ | 320,545 | | $ | 27,949 | | $ | (3,449 | ) | $ | 345,045 | |
December 31, 2004: | | | | | | | | | |
Available-for-sale: | | | | | | | | | |
Equity investments | | $ | 32,245 | | $ | 1,555 | | $ | (4 | ) | $ | 33,796 | |
Fixed income investments | | 1,042 | | 378 | | — | | 1,420 | |
| | 33,287 | | 1,933 | | (4 | ) | 35,216 | |
Trading: | | | | | | | | | |
Equity investments | | 116,977 | | 10,608 | | (642 | ) | 126,943 | |
Fixed income investments | | 29,619 | | 483 | | (94 | ) | 30,008 | |
| | 146,596 | | 11,091 | | (736 | ) | 156,951 | |
Total investments | | $ | 179,883 | | $ | 13,024 | | $ | (740 | ) | $ | 192,167 | |
Proceeds from sales of investments available-for-sale were approximately $12.7 million, $38.0 million, and $36.5 million in 2005, 2004, and 2003, respectively. Net realized gains from our sales of available-for-sale investments were $0.9 million, $2.4 million, and $1.3 million in 2005, 2004, and 2003, respectively.
We assess valuation declines to determine the extent to which such declines are fundamental to the underlying investment or attributable to market-related factors. Based on this assessment, we do not believe the declines are other than temporary.
7. Furniture, Equipment and Leasehold Improvements, Net
Furniture, equipment and leasehold improvements are comprised of:
| | December 31, | |
| | 2005 | | 2004 | |
| | (in thousands) | |
| | | | | |
Furniture and equipment | | $ | 369,092 | | $ | 342,267 | |
Leasehold improvements | | 217,137 | | 191,064 | |
| | 586,229 | | 533,331 | |
Less: Accumulated depreciation and amortization | | (349,920 | ) | (317,964 | ) |
Furniture, equipment and leasehold improvements, net | | $ | 236,309 | | $ | 215,367 | |
83
8. Deferred Sales Commissions, Net
The components of deferred sales commissions for the years ended December 31, 2005 and 2004 were as follows:
| | December 31, | |
| | 2005 | | 2004 | |
| | (in thousands) | |
| | | | | |
Gross carrying amount of deferred sales commissions | | $ | 692,148 | | $ | 959,930 | |
Less: Accumulated amortization | | (421,620 | ) | (554,970 | ) |
Cumulative CDSC received | | (73,891 | ) | (150,504 | ) |
Deferred sales commissions, net | | $ | 196,637 | | $ | 254,456 | |
Amortization expense was $132.0 million, $177.4 million, and $208.6 million for the years ended December 31, 2005, 2004, and 2003, respectively. Estimated future amortization expense related to the December 31, 2005 net asset balance is as follows (in thousands):
2006 | | $ | 84,932 | |
2007 | | 52,415 | |
2008 | | 34,295 | |
2009 | | 18,801 | |
2010 | | 5,517 | |
2011 | | 677 | |
| | $ | 196,637 | |
9. Other Investments
Other investments consists of investments made primarily to seed limited partnership hedge funds that we sponsor and manage, and unconsolidated joint ventures. The components of other investments as of December 31, 2005 and 2004 were as follows:
| | December 31, | |
| | 2005 | | 2004 | |
| | (in thousands) | |
| | | | | |
Investments in sponsored partnerships and other investments | | $ | 77,856 | | $ | 48,037 | |
Investments in unconsolidated affiliates | | 8,513 | | 13,313 | |
Other investments | | $ | 86,369 | | $ | 61,350 | |
84
10. Debt
Total available credit, debt outstanding, and weighted average interest rates as of December 31, 2005 and 2004 were as follows:
| | December 31, | |
| | 2005 | | 2004 | |
| | Credit
Available | | Debt
Outstanding | | Interest
Rate | | Credit
Available | | Debt
Outstanding | | Interest
Rate | |
| | (in millions) | |
| | | |
Senior notes | | $ | 600.0 | | $ | 399.7 | | 5.6 | % | $ | 600.0 | | $ | 399.2 | | 5.6 | % |
Commercial paper | | 425.0 | | — | | — | | 425.0 | | — | | — | |
Revolving credit facility | | 375.0 | | — | | — | | 375.0 | | — | | — | |
Extendible commercial notes | | 100.0 | | — | | — | | 100.0 | | — | | — | |
Other | | n/a | | 7.6 | | 4.6 | | n/a | | 8.3 | | 4.0 | |
Total | | $ | 1,500.0 | | $ | 407.3 | | 5.6 | % | $ | 1,500.0 | | $ | 407.5 | | 5.6 | % |
In August 2001, we issued $400 million of 5.625% Notes (“Senior Notes”) pursuant to a shelf registration statement under which we may issue up to $600 million in senior debt securities. The proceeds from the Senior Notes were used to reduce commercial paper and credit facility borrowings and for other general partnership purposes. The Senior Notes mature in August 2006 and are redeemable at any time. We intend to use cash flow from operations to retire the Senior Notes at maturity.
In September 2002, we entered into an $800 million five-year revolving credit facility with a group of commercial banks and other lenders. Of the $800 million total, $425 million is intended to provide back-up liquidity for our $425 million commercial paper program, with the balance available for general purposes. Under this revolving credit facility, the interest rate, at our option, is a floating rate generally based upon a defined prime rate, a rate related to the London Interbank Offered Rate (LIBOR) or the Federal Funds rate. The revolving credit facility contains covenants which, among other things, require us to meet certain financial ratios. We were in compliance with the covenants as of December 31, 2005. On February 17, 2006, we replaced the existing arrangement with a new $800 million five-year revolving credit facility with substantially the same terms.
As of December 31, 2005, we maintained a $100 million extendible commercial notes (“ECN”) program as a supplement to our $425 million commercial paper program. ECNs are short-term uncommitted debt instruments that do not require back-up liquidity support.
The fair value, based on market quotes, of the senior notes as of December 31, 2005 was $402.1 million, as compared with their carrying value of $399.7 million. The other notes, with a carrying value of $7.6 million, were issued in connection with a previous acquisition. Since these notes were part of a private transaction, their fair value is not practical to obtain.
85
11. Commitments and Contingencies
Operating Leases
We lease office space, furniture and office equipment under various operating leases. The future minimum payments under non-cancelable leases, sublease commitments, and payments, net of sublease commitments as of December 31, 2005 are as follows:
| | Payments | | Sublease | | Net
Payments | |
| | (in millions) | |
| | | | | | | |
2006 | | $ | 89.5 | | $ | 3.2 | | $ | 86.3 | |
2007 | | 87.7 | | 3.1 | | 84.6 | |
2008 | | 84.8 | | 2.8 | | 82.0 | |
2009 | | 77.6 | | 2.1 | | 75.5 | |
2010 | | 78.8 | | 2.1 | | 76.7 | |
2011 and thereafter | | 592.7 | | 15.4 | | 577.3 | |
Total future minimum payments | | $ | 1,011.1 | | $ | 28.7 | | $ | 982.4 | |
| | | | | | | | | | | |
Office leases contain escalation clauses that provide for the pass through of increases in operating expenses and real estate taxes. Rent expense, which is amortized on a straight-line basis over the life of the lease, was $76.0 million, $78.5 million, and $65.5 million, respectively, for the years ended December 31, 2005, 2004, and 2003, respectively, net of sublease income of $5.9 million, $5.3 million, and $3.9 million for the years ended December 31, 2005, 2004, and 2003, respectively.
Deferred Sales Commission Asset
Our mutual fund distribution system (“the “System”) includes a multi-class share structure that permits our open-end mutual funds to offer investors various options for the purchase of mutual fund shares, including both front-end load shares and back-end load shares. For front-end load shares of mutual funds we sponsor that are registered as investment companies (“U.S. Funds”) under the Investment Company Act of 1940, as amended (“Investment Company Act”), AllianceBernstein Investments, Inc., a wholly-owned subsidiary of AllianceBernstein (“AllianceBernstein Investments”), pays sales commissions to financial intermediaries distributing the funds from the front-end sales charge it receives from investors at the time of sale. For back-end load shares, AllianceBernstein Investments pays sales commissions to financial intermediaries at the time of sale and also receives higher ongoing distribution services fees from the mutual funds. In addition, investors who redeem back-end load shares before the expiration of the minimum holding period (which ranges from one year to four years) pay a CDSC to AllianceBernstein Investments.
Payments of sales commissions made by AllianceBernstein Investments to financial intermediaries in connection with the sale of back-end load shares under the System are capitalized as deferred sales commissions (“deferred sales commission asset”) and amortized over periods not exceeding five and one-half years, the periods of time during which the deferred sales commission asset is expected to be recovered. CDSC cash recoveries are recorded as reductions of unamortized deferred sales commissions when received. The amount recorded for the net deferred sales commission asset was $196.6 million and $254.5 million as of December 31, 2005 and 2004, respectively. Payments of sales commissions made by AllianceBernstein Investments to financial intermediaries in connection with the sale of back-end load shares under the System, net of CDSC received of $21.4 million, $32.9 million, and $37.5 million, respectively, totaled approximately $74.2 million, $44.6 million, and $94.9 million during 2005, 2004, and 2003, respectively.
Management tests the deferred sales commission asset for recoverability quarterly, or monthly when events or changes in circumstances occur that could significantly increase the risk of impairment of the asset. Significant assumptions utilized to estimate the company’s future average assets under management and undiscounted future cash flows from back-end load shares include expected future market levels and redemption rates. Market assumptions are selected using a long-term view of expected average market returns based on historical returns of
86
broad market indices. As of December 31, 2005, management used average market return assumptions of 5% for fixed income and 8% for equity to estimate annual market returns. Higher actual average market returns would increase undiscounted future cash flows, while lower actual average market returns would decrease undiscounted future cash flows. Future redemption rate assumptions of 22%, 25%, and 25% were determined by reference to actual redemption experience over the five-year, three-year, and one-year periods ended December 31, 2005, respectively, calculated as a percentage of the company’s average assets under management represented by back-end load shares. An increase in the actual rate of redemptions would decrease undiscounted future cash flows, while a decrease in the actual rate of redemptions would increase undiscounted future cash flows. These assumptions are reviewed and updated quarterly, or monthly when events or changes in circumstances occur that could significantly increase the risk of impairment of the asset. Estimates of undiscounted future cash flows and the remaining life of the deferred sales commission asset are made from these assumptions and the aggregate undiscounted future cash flows are compared to the recorded value of the deferred sales commission asset. Management considers the results of these analyses performed at various dates. As of December 31, 2005, management determined that the deferred sales commission asset was not impaired. If management determines in the future that the deferred sales commission asset is not recoverable, an impairment condition would exist and a loss would be measured as the amount by which the recorded amount of the asset exceeds its estimated fair value. Estimated fair value is determined using management’s best estimate of future cash flows discounted to a present value amount.
During 2005, equity markets increased by approximately 5% as measured by the change in the Standard & Poor’s 500 Stock Index and fixed income markets increased by approximately 2% as measured by the change in the Lehman Brothers’ Aggregate Bond Index. The redemption rate for domestic back-end load shares, adjusted for the closing of certain funds in conjunction with the company’s fund rationalization program, was approximately 25.3% in 2005. Declines in financial markets or higher redemption levels, or both, as compared to the assumptions used to estimate undiscounted future cash flows, as described above, could result in the impairment of the deferred sales commission asset. Due to the volatility of the capital markets and changes in redemption rates, management is unable to predict whether or when a future impairment of the deferred sales commission asset might occur. Any impairment would reduce materially the recorded amount of the deferred sales commission asset with a corresponding charge to earnings.
Legal Proceedings
With respect to all significant litigation matters, we conduct a probability assessment of the likelihood of a negative outcome. If the likelihood of a negative outcome is probable, and the amount of the loss can be reasonably estimated, we record an estimated loss for the expected outcome of the litigation as required by SFAS No. 5 and FIN No. 14. If the likelihood of a negative outcome is reasonably possible and we are able to indicate an estimate of the possible loss or range of loss, we disclose that fact together with the estimate of the possible loss or range of loss. However, it is difficult to predict the outcome or estimate a possible loss or range of loss because litigation is subject to significant uncertainties, particularly when plaintiffs allege substantial or indeterminate damages, or when the litigation is highly complex or broad in scope.
On April 8, 2002, in In re Enron Corporation Securities Litigation, a consolidated complaint (“Enron Complaint”) was filed in the United States District Court for the Southern District of Texas, Houston Division, against numerous defendants, including AllianceBernstein. The principal allegations of the Enron Complaint, as they pertain to AllianceBernstein, are that AllianceBernstein violated Sections 11 and 15 of the Securities Act of 1933, as amended (“Securities Act”) with respect to a registration statement filed by Enron Corp. (“Enron”) and effective with the U.S. Securities and Exchange Commission (“SEC”) on July 18, 2001, which was used to sell $1.9 billion Enron Zero Coupon Convertible Notes due 2021. Plaintiffs allege that the registration statement was materially misleading and that Frank Savage, a director of Enron, signed the registration statement at issue. Plaintiffs further allege that AllianceBernstein was a controlling person of Frank Savage, who was at that time an employee of AllianceBernstein and a director of the General Partner. Plaintiffs therefore assert that
87
AllianceBernstein is itself liable for the allegedly misleading registration statement. Plaintiffs seek rescission or a rescissionary measure of damages. On June 3, 2002, AllianceBernstein moved to dismiss the Enron Complaint as the allegations therein pertain to it. On March 12, 2003, that motion was denied. A First Amended Consolidated Complaint (“Enron Amended Consolidated Complaint”), with substantially similar allegations as to AllianceBernstein, was filed on May 14, 2003. AllianceBernstein filed its answer on June 13, 2003. On May 28, 2003, plaintiffs filed an Amended Motion for Class Certification. On October 23, 2003, following the completion of class discovery, AllianceBernstein filed its opposition to class certification. That motion is pending. The case is currently in discovery.
We believe that plaintiffs’ allegations in the Enron Amended Consolidated Complaint as to us are without merit and intend to vigorously defend against these allegations. At the present time, we are unable to predict the outcome or estimate a possible loss or range of loss in respect of this matter because of the inherent uncertainty regarding the outcome of complex litigation, the fact that plaintiffs did not specify an amount of damages sought in their complaint, and the fact that, to date, we have not engaged in settlement negotiations.
On September 12, 2002, a complaint entitled Lawrence E. Jaffe Pension Plan, Lawrence E. Jaffe Trustee U/A 1198 v. Alliance Capital Management L.P., Alfred Harrison and Alliance Premier Growth Fund, Inc. (“Jaffe Complaint”) was filed in the United States District Court for the Southern District of New York against AllianceBernstein, Alfred Harrison (a former director) and the AllianceBernstein Premier Growth Fund (now known as the AllianceBernstein Large Cap Growth Fund, “Large Cap Growth Fund”) alleging violation of the Investment Company Act. Plaintiff seeks damages equal to Large Cap Growth Fund’s losses as a result of Large Cap Growth Fund’s investment in shares of Enron and a recovery of all fees paid by Large Cap Growth Fund to AllianceBernstein beginning November 1, 2000. On March 24, 2003, the court granted AllianceBernstein’s motion to transfer the Jaffe Complaint to the United States District Court for the District of New Jersey for coordination with the now dismissed Benak v. Alliance Capital Management L.P. and Alliance Premier Growth Fund action then pending. On December 5, 2003, plaintiff filed an amended complaint (“Amended Jaffe Complaint”) in the United States District Court for the District of New Jersey alleging violations of Section 36(a) of the Investment Company Act, common law negligence, and negligent misrepresentation. Specifically, the Amended Jaffe Complaint alleges that: (i) the defendants breached their fiduciary duties of loyalty, care and good faith to Large Cap Growth Fund by causing Large Cap Growth Fund to invest in securities of Enron, (ii) the defendants were negligent for investing in securities of Enron, and (iii) through prospectuses and other documents defendants misrepresented material facts related to Large Cap Growth Fund’s investment objective and policies. On January 23, 2004, defendants moved to dismiss the Amended Jaffe Complaint. On May 23, 2005, the court granted defendant’s motion and dismissed the case on the ground that plaintiff failed to make a demand on the Large Cap Growth Fund’s Board of Directors (“LCG Board”) pursuant to Rule 23.1 of the Federal Rules of Civil Procedure. Plaintiff’s time to file an appeal has expired. On June 15, 2005, plaintiff made a demand on the LCG Board, requesting that the LCG Board take action against AllianceBernstein for the reasons set forth in the Amended Jaffe Complaint. In December 2005, the LCG Board rejected plaintiff’s demand.
AllianceBernstein, Large Cap Growth Fund, and Alfred Harrison believe that plaintiff’s allegations in the Amended Jaffe Complaint are without merit and intend to vigorously defend against these allegations. At the present time, we are unable to predict the outcome or estimate a possible loss or range of loss in respect of this matter because of the inherent uncertainty regarding the outcome of complex litigation and the fact that, to date, we have not engaged in settlement negotiations.
On December 13, 2002, a putative class action complaint entitled Patrick J. Goggins, et al. v. Alliance Capital Management L.P., et al. (“Goggins Complaint”) was filed in the United States District Court for the Southern District of New York against AllianceBernstein, Large Cap Growth Fund and individual directors and certain officers of Large Cap Growth Fund. On August 13, 2003, the court granted AllianceBernstein’s motion to transfer the Goggins Complaint to the United States District Court for the District of New Jersey. On December 5, 2003, plaintiffs filed an amended complaint (“Amended Goggins Complaint”) in the United States District Court for the District of New Jersey, which alleges that defendants violated Sections 11, 12(a)(2) and 15 of the Securities Act because Large Cap Growth Fund’s registration statements and prospectuses contained
88
untrue statements of material fact and omitted material facts. More specifically, the Amended Goggins Complaint alleges that Large Cap Growth Fund’s investment in Enron was inconsistent with the Large Cap Growth Fund’s stated strategic objectives and investment strategies. Plaintiffs seek rescissionary relief or an unspecified amount of compensatory damages on behalf of a class of persons who purchased shares of Large Cap Growth Fund during the period October 31, 2000 through February 14, 2002. On January 23, 2004, AllianceBernstein moved to dismiss the Amended Goggins Complaint. On December 10, 2004, the court granted AllianceBernstein’s motion and dismissed the case. On January 5, 2005, plaintiffs appealed the court’s decision. On January 13, 2006, the U.S. Court of Appeals for the Third Circuit affirmed the dismissal. Plaintiffs’ time to seek further review of the court’s decision expires on April 13, 2006.
AllianceBernstein, Large Cap Growth Fund and the other defendants believe that plaintiffs’ allegations in the Amended Goggins Complaint are without merit and intend to vigorously defend against these allegations. At the present time, we are unable to predict the outcome or estimate a possible loss or range of loss in respect of this matter because of the inherent uncertainty regarding the outcome of complex litigation, the fact that plaintiffs did not specify an amount of damages sought in their complaint, and the fact that, to date, we have not engaged in settlement negotiations.
On October 1, 2003, a class action complaint entitled Erb, et al. v. Alliance Capital Management L.P. (“Erb Complaint”) was filed in the Circuit Court of St. Clair County, Illinois, against AllianceBernstein. The plaintiff, purportedly a shareholder in Large Cap Growth Fund, alleged that AllianceBernstein breached unidentified provisions of Large Cap Growth Fund’s prospectus and subscription and confirmation agreements that allegedly required that every security bought for Large Cap Growth Fund’s portfolio must be a “1-rated” stock, the highest rating that AllianceBernstein’s research analysts could assign. Plaintiff alleges that AllianceBernstein impermissibly purchased shares of stocks that were not 1-rated. On June 24, 2004, plaintiff filed an amended complaint (“Amended Erb Complaint”) in the Circuit Court of St. Clair County, Illinois. The Amended Erb Complaint allegations are substantially similar to those contained in the previous complaint, however, the Amended Erb Complaint adds a new plaintiff and seeks to allege claims on behalf of a purported class of persons or entities holding an interest in any portfolio managed by AllianceBernstein’s Large Cap Growth Team. The Amended Erb Complaint alleges that AllianceBernstein breached its contracts with these persons or entities by impermissibly purchasing shares of stocks that were not 1-rated. Plaintiffs seek rescission of all purchases of any non-1-rated stocks AllianceBernstein made for Large Cap Growth Fund and other Large Cap Growth Team clients’ portfolios over the past eight years, as well as an unspecified amount of damages. On July 13, 2004, AllianceBernstein removed the Erb action to the United States District Court for the Southern District of Illinois on the basis that plaintiffs’ claims are preempted under the Securities Litigation Uniform Standards Act. On August 30, 2004, the District Court remanded the action to the Circuit Court. On September 15, 2004, AllianceBernstein filed a notice of appeal with respect to the District Court’s order. On December 23, 2004, plaintiffs moved to dismiss AllianceBernstein’s appeal. On September 2, 2005, AllianceBernstein’s appeal was denied.
We believe that plaintiffs’ allegations in the Amended Erb Complaint are without merit and intend to vigorously defend against these allegations. At the present time, we are unable to predict the outcome or estimate a possible loss or range of loss in respect of this matter because of the inherent uncertainty regarding the outcome of complex litigation and the fact that plaintiffs did not specify an amount of damages sought in their complaint.
Market Timing-related Matters
On October 2, 2003, a purported class action complaint entitled Hindo, et al. v. AllianceBernstein Growth & Income Fund, et al. (“Hindo Complaint”) was filed against AllianceBernstein, Holding, the General Partner, AXA Financial, the U.S. Funds, the registrants and issuers of those funds, certain officers of AllianceBernstein (“Alliance defendants”), and certain unaffiliated defendants, as well as unnamed Doe defendants. The Hindo Complaint was filed in the United States District Court for the Southern District of New York by alleged shareholders of two of the U.S. Funds. The Hindo Complaint alleges that certain of the Alliance defendants failed to disclose that they improperly allowed certain hedge funds and
89
other unidentified parties to engage in “late trading” and “market timing” of U.S. Fund securities, violating Sections 11 and 15 of the Securities Act, Sections 10(b) and 20(a) of the Exchange Act, and Sections 206 and 215 of the Investment Advisers Act of 1940, as amended (“Advisers Act”). Plaintiffs seek an unspecified amount of compensatory damages and rescission of their contracts with AllianceBernstein, including recovery of all fees paid to AllianceBernstein pursuant to such contracts.
Since October 2, 2003, 43 additional lawsuits making factual allegations generally similar to those in the Hindo Complaint were filed in various federal and state courts against AllianceBernstein and certain other defendants, and others may be filed. The plaintiffs in such lawsuits have asserted a variety of theories for recovery including, but not limited to, violations of the Securities Act, the Exchange Act, the Advisers Act, the Investment Company Act, the Employee Retirement Income Security Act of 1974, as amended (“ERISA”), certain state securities laws, and common law. All state court actions against AllianceBernstein either were voluntarily dismissed or removed to federal court.
On February 20, 2004, the Judicial Panel on Multidistrict Litigation (“MDL Panel”) transferred all federal actions to the United States District Court for the District of Maryland (“Mutual Fund MDL”). All of the actions removed to federal court also were transferred to the Mutual Fund MDL. The plaintiffs in the removed actions have since moved for remand, and that motion is pending.
On September 29, 2004, plaintiffs filed consolidated amended complaints with respect to four claim types: mutual fund shareholder claims; mutual fund derivative claims; derivative claims brought on behalf of Holding; and claims brought under ERISA by participants in the Profit Sharing Plan for Employees of AllianceBernstein. All four complaints include substantially identical factual allegations, which appear to be based in large part on our agreement with the SEC (“SEC Order”) dated December 18, 2003 (amended and restated January 15, 2004), and our final agreement with the New York State Attorney General (“NYAG AoD”) dated September 1, 2004. The claims in the mutual fund derivative consolidated amended complaint are generally based on the theory that all fund advisory agreements, distribution agreements and 12b-1 plans between AllianceBernstein and the U.S. Funds should be invalidated, regardless of whether market timing occurred in each individual fund, because each was approved by fund trustees on the basis of materially misleading information with respect to the level of market timing permitted in funds managed by AllianceBernstein. The claims asserted in the other three consolidated amended complaints are similar to those that the respective plaintiffs asserted in their previous federal lawsuits. All of these lawsuits seek an unspecified amount of damages.
On February 10, 2004, we received (i) a subpoena duces tecum from the Office of the Attorney General of the State of West Virginia and (ii) a request for information from the Office of the State Auditor, Securities Commission, for the State of West Virginia (“WV Securities Commissioner”) (subpoena and request together, the “Information Requests”). Both Information Requests required us to produce documents concerning, among other things, any market timing or late trading in our sponsored mutual funds. We responded to the Information Requests and have been cooperating fully with the investigation.
On April 11, 2005, a complaint entitled The Attorney General of the State of West Virginia v. AIM Advisors, Inc., et al. (“WVAG Complaint”) was filed against AllianceBernstein, Holding, and various unaffiliated defendants. The WVAG Complaint was filed in the Circuit Court of Marshall County, West Virginia by the Attorney General of the State of West Virginia. The WVAG Complaint makes factual allegations generally similar to those in the Hindo Complaint. On May 31, 2005, defendants removed the WVAG Complaint to the United States District Court for the Northern District of West Virginia. On July 12, 2005, plaintiff moved to remand. On October 19, 2005, the WVAG Complaint was transferred to the Mutual Fund MDL.
On August 30, 2005, the WV Securities Commissioner signed a “Summary Order to Cease and Desist, and Notice of Right to Hearing” addressed to AllianceBernstein and Holding. The Summary Order claims that AllianceBernstein and Holding violated the West Virginia Uniform Securities Act and makes factual allegations generally similar to those in the SEC Order and NYAG AoD. On January 26, 2006, AllianceBernstein, Holding, and various unaffiliated defendants filed a Petition for Writ of Prohibition and Order Suspending Proceedings in West Virginia state court seeking to vacate the Summary Order and for other relief.
90
We intend to vigorously defend against the allegations in the WVAG Complaint. At the present time, we are unable to predict the outcome or estimate a possible loss or range of loss in respect of this matter because of the inherent uncertainty regarding the outcome of complex litigation, the fact that plaintiffs did not specify an amount of damages sought in their complaint, and the fact that, to date, we have not engaged in settlement negotiations.
We previously concluded that the likelihood of a negative outcome in the market timing-related matters (excluding the WVAG Complaint) is probable. As previously disclosed, AllianceBernstein recorded charges totaling $330 million during the second half of 2003, of which (i) $250 million was paid to the Restitution Fund (the $250 million was funded out of operating cash flow and paid to the SEC in January 2004), (ii) $30 million was used to settle a private civil mutual fund litigation unrelated to any regulatory agreements, and (iii) $50 million was reserved for estimated expenses related to our market-timing settlements with the SEC and the NYAG and our market timing-related liabilities (excluding WVAG Complaint-related expenses). AllianceBernstein paid $8 million during 2005 related to market timing and has cumulatively paid $310 million (excluding WVAG Complaint-related expenses). Including $10 million in charges taken in prior periods, we have reserves of approximately $30 million available for market timing-related liabilities in future periods.
We cannot determine at this time the eventual outcome, timing or impact of the market timing-related matters. Accordingly, it is possible that additional charges in the future may be required, the amount, timing, and impact of which we are unable to estimate at this time.
Revenue Sharing-related Matters
On June 22, 2004, a purported class action complaint entitled Aucoin, et al. v. Alliance Capital Management L.P., et al. (“Aucoin Complaint”) was filed against AllianceBernstein, Holding, the General Partner, AXA Financial, AllianceBernstein Investments, certain current and former directors of the U.S. Funds, and unnamed Doe defendants. The Aucoin Complaint names the U.S. Funds as nominal defendants. The Aucoin Complaint was filed in the United States District Court for the Southern District of New York by an alleged shareholder of the AllianceBernstein Growth & Income Fund. The Aucoin Complaint alleges, among other things, (i) that certain of the defendants improperly authorized the payment of excessive commissions and other fees from U.S. Fund assets to broker-dealers in exchange for preferential marketing services, (ii) that certain of the defendants misrepresented and omitted from registration statements and other reports material facts concerning such payments, and (iii) that certain defendants caused such conduct as control persons of other defendants. The Aucoin Complaint asserts claims for violation of Sections 34(b), 36(b) and 48(a) of the Investment Company Act, Sections 206 and 215 of the Advisers Act, breach of common law fiduciary duties, and aiding and abetting breaches of common law fiduciary duties. Plaintiffs seek an unspecified amount of compensatory damages and punitive damages, rescission of their contracts with AllianceBernstein, including recovery of all fees paid to AllianceBernstein pursuant to such contracts, an accounting of all U.S. Fund-related fees, commissions and soft dollar payments, and restitution of all unlawfully or discriminatorily obtained fees and expenses.
Since June 22, 2004, nine additional lawsuits making factual allegations substantially similar to those in the Aucoin Complaint were filed against AllianceBernstein and certain other defendants. All nine of the lawsuits (i) were brought as class actions filed in the United States District Court for the Southern District of New York, (ii) assert claims substantially identical to the Aucoin Complaint, and (iii) are brought on behalf of shareholders of U.S. Funds.
On February 2, 2005, plaintiffs filed a consolidated amended class action complaint (“Aucoin Consolidated Amended Complaint”) that asserts claims substantially similar to the Aucoin Complaint and the nine additional lawsuits referenced above. On October 19, 2005, the District Court dismissed each of the claims set forth in the Aucoin Consolidated Amended Complaint, except for plaintiff’s claim under Section 36(b) of the Investment Company Act. On January 11, 2006, the District Court granted defendants’ motion for reconsideration and dismissed the remaining Section 36(b) claim. Plaintiffs have moved for leave to amend their consolidated complaint.
We believe that plaintiff’s allegations in the Aucoin Consolidated Amended Complaint are without merit
91
and intend to vigorously defend against these allegations. At the present time, we are unable to predict the outcome or estimate a possible loss or range of loss in respect of this matter because of the inherent uncertainty regarding the outcome of complex litigation, the fact that plaintiffs did not specify an amount of damages sought in their complaint, and the fact that, to date, we have not engaged in settlement negotiations.
We are involved in various other inquiries, administrative proceedings, and litigation, some of which allege substantial damages. While any proceeding or litigation has the element of uncertainty, we believe that the outcome of any one of the other lawsuits or claims that is pending or threatened, or all of them combined, will not have a material adverse effect on our results of operations or financial condition.
12. Net Capital
SCB LLC, a broker-dealer and member of the NYSE, is subject to Uniform Net Capital Rule 15c3-1 of the Exchange Act. SCB LLC computes its net capital under the alternative method permitted by the rule, which requires that minimum net capital, as defined, equal the greater of $1 million, or two percent of aggregate debit items arising from customer transactions, as defined, which as of December 31, 2005 amounted to $26.3 million. As of December 31, 2005, SCB LLC had net capital of $146.4 million, which was $120.1 million in excess of the minimum net capital requirement of $26.3 million. Advances, dividend payments and other equity withdrawals by SCB LLC are restricted by the regulations of the SEC, NYSE and other securities agencies. As of December 31, 2005, $65.7 million was not available for payment of cash dividends and advances.
SCBL is a member of the London Stock Exchange. As of December 31, 2005, SCBL was subject to financial resources requirements of $11.2 million imposed by the Financial Services Authority of the United Kingdom and had aggregate regulatory financial resources of $33.6 million, an excess of $22.4 million.
AllianceBernstein Investments serves as distributor and/or underwriter for certain company-sponsored mutual funds. AllianceBernstein Investments is registered as a broker-dealer under the Exchange Act and is subject to the minimum net capital requirements imposed by the SEC. AllianceBernstein Investments’ net capital as of December 31, 2005 was $47.9 million, which was $38.2 million in excess of its required net capital of $9.7 million.
13. Counterparty Risk
Customer Activities
In the normal course of business, brokerage activities involve the execution, settlement and financing of various customer securities trades, which may expose SCB LLC and SCBL to off-balance sheet risk by requiring SCB LLC and SCBL to purchase or sell securities at prevailing market prices in the event the customer is unable to fulfill its contracted obligations.
SCB LLC’s customer securities activities are transacted on either a cash or margin basis. In margin transactions, SCB LLC extends credit to the customer, subject to various regulatory and internal margin requirements. These transactions are collateralized by cash or securities in the customer’s account. In connection with these activities, SCB LLC may execute and clear customer transactions involving the sale of securities not yet purchased. SCB LLC seeks to control the risks associated with margin transactions by requiring customers to maintain collateral in compliance with the aforementioned regulatory and internal guidelines. SCB LLC monitors required margin levels daily and, pursuant to such guidelines, requires the customers to deposit additional collateral, or reduce positions, when necessary. A majority of SCB LLC’s customer margin accounts are managed on a discretionary basis whereby AllianceBernstein maintains control over the investment activity in the accounts. For these discretionary accounts, SCB LLC’s margin deficiency exposure is minimized through maintaining a diversified portfolio of securities and by virtue of AllianceBernstein’s discretionary authority and SCB LLC’s role as custodian.
SCB LLC may enter into forward foreign currency contracts on behalf of accounts for which SCB LLC acts as custodian. SCB LLC minimizes credit risk associated with these contracts by monitoring these positions on a daily basis, as well as by virtue of AllianceBernstein’s discretionary authority and SCB LLC’s role as custodian.
92
In accordance with industry practice, SCB LLC and SCBL record customer transactions on a settlement date basis, which is generally three business days after trade date. SCB LLC and SCBL are exposed to risk of loss on these transactions in the event of the customer’s or broker’s inability to meet the terms of their contracts, in which case SCB LLC and SCBL may have to purchase or sell financial instruments at prevailing market prices. The risks assumed by SCB LLC and SCBL in connection with these transactions are not expected to have a material effect upon AllianceBernstein’s, SCB LLC’s or SCBL’s financial condition or results of operations.
Other Counterparties
SCB LLC and SCBL are engaged in various brokerage activities in which counterparties primarily include broker-dealers, banks and other financial institutions. In the event counterparties do not fulfill their obligations, SCB LLC and SCBL may be exposed to risk. The risk of default depends on the creditworthiness of the counterparty or issuer of the instrument. It is SCB LLC’s and SCBL’s policy to review, as necessary, the credit standing of each counterparty.
In connection with SCB LLC’s security borrowing and lending arrangements, which constitute the majority of the receivables from and payable to brokers and dealers, SCB LLC enters into collateralized agreements which may result in credit exposure in the event the counterparty to a transaction is unable to fulfill its contractual obligations. Security borrowing arrangements require SCB LLC to deposit cash collateral with the lender. With respect to security lending arrangements, SCB LLC receives collateral in the form of cash in amounts generally in excess of the market value of the securities loaned. SCB LLC minimizes credit risk associated with these activities by establishing credit limits for each broker and monitoring these limits on a daily basis. Additionally, security borrowing and lending collateral is marked to market on a daily basis and additional collateral is deposited by or returned to SCB LLC as necessary.
14. Employee Benefit Plans
We maintain a qualified profit sharing plan (the “Profit Sharing Plan”) covering U.S. employees and certain foreign employees. Contributions are generally limited to the maximum amount deductible for federal income tax purposes. Aggregate contributions for 2005, 2004, and 2003 were $22.0 million, $21.1 million, and $13.8 million, respectively. We maintained a qualified 401(k) plan covering former employees of Bernstein until the plan was merged into the Profit Sharing Plan, effective January 1, 2004. Contributions were limited to the maximum amount deductible for federal income tax purposes. Aggregate contributions for 2003 were $4.9 million.
We maintain a qualified, noncontributory, defined benefit retirement plan covering current and former employees who were employed by the company in the United States prior to October 2, 2000. Benefits are based on years of credited service, average final base salary and primary Social Security benefits. Our policy is to satisfy our funding obligation for each year in an amount not less than the minimum required by ERISA and not greater than the maximum amount that can be deducted for federal income tax purposes.
93
The retirement plan’s projected benefit obligation, fair value of plan assets, funded status and amounts recognized in the consolidated statements of financial condition were as follows:
| | Years Ended December 31, | |
| | 2005 | | 2004 | |
| | (in thousands) | |
Change in projected benefit obligation: | | | | | |
Projected benefit obligation at beginning of year | | $ | 81,204 | | $ | 73,594 | |
Service cost | | 4,268 | | 4,925 | |
Interest cost | | 4,274 | | 4,109 | |
Actuarial gains | | (3,685 | ) | (67 | ) |
Benefits paid | | (2,246 | ) | (1,357 | ) |
Projected benefit obligation at end of year | | 83,815 | | 81,204 | |
Change in plan assets: | | | | | |
Plan assets at fair value at beginning of year | | 40,665 | | 37,328 | |
Actual return on plan assets | | 5,487 | | 3,245 | |
Employer contribution | | 3,500 | | 1,449 | |
Benefits paid | | (2,246 | ) | (1,357 | ) |
Plan assets at fair value at end of year | | 47,406 | | 40,665 | |
Projected benefit obligation in excess of plan assets | | (36,409 | ) | (40,539 | ) |
Amounts not recognized: | | | | | |
Unrecognized net loss from past experience different from that assumed and effects of changes and assumptions | | 13,728 | | 20,176 | |
Unrecognized prior service cost | | 307 | | 248 | |
Unrecognized net plan assets as of January 1, 1987 being recognized over 26.3 years | | (1,048 | ) | (1,191 | ) |
Accrued pension expense included in accrued compensation and benefits | | $ | (23,422 | ) | $ | (21,306 | ) |
The accumulated benefit obligation for the plan was $66.9 million and $59.3 million as of December 31, 2005 and 2004, respectively. We currently estimate we will contribute $3.0 million to the plan during 2006. Contribution estimates, which are subject to change, are based on regulatory requirements, future market conditions and assumptions used for actuarial computations of the plan’s obligations and assets. Management, at the present time, is unable to determine the amount, if any, of additional future contributions that may be required.
Actuarial computations used to determine benefit obligations as of December 31, 2005 and 2004 (measurement dates) were made utilizing the following weighted-average assumptions:
| | 2005 | | 2004 | |
| | | | | |
Discount rate on benefit obligations | | 5.65 | % | 5.75 | % |
Annual salary increases | | 5.14 | % | 5.14 | % |
The plan’s asset allocation percentages consisted of:
| | December 31, | |
| | 2005 | | 2004 | |
| | | | | |
Equity securities | | 80 | % | 78 | % |
Debt securities | | 19 | | 20 | |
Other | | 1 | | 2 | |
| | 100 | % | 100 | % |
94
The following benefit payments, which reflect expected future service, are expected to be paid as follows (in thousands):
2006 | | $ | 2,417 | |
2007 | | 3,558 | |
2008 | | 1,884 | |
2009 | | 2,592 | |
2010 | | 3,646 | |
2011-2015 | | 23,645 | |
Net expense under the retirement plan was comprised of:
| | Years Ended December 31, | |
| | 2005 | | 2004 | | 2003 | |
| | (in thousands) | |
| | | | | | | |
Service cost | | $ | 4,268 | | $ | 4,925 | | $ | 4,886 | |
Interest cost on projected benefit obligations | | 4,274 | | 4,109 | | 3,814 | |
Expected return on plan assets | | (3,225 | ) | (2,853 | ) | (1,766 | ) |
Amortization of prior service (credit) | | (59 | ) | (59 | ) | (59 | ) |
Amortization of transition (asset) | | (143 | ) | (143 | ) | (143 | ) |
Recognized actuarial loss | | 501 | | 438 | | 527 | |
Net pension charge | | $ | 5,616 | | $ | 6,417 | | $ | 7,259 | |
Actuarial computations used to determine net periodic costs were made utilizing the following weighted-average assumptions:
| | Years Ended December 31, | |
| | 2005 | | 2004 | | 2003 | |
| | | | | | | |
Discount rate on benefit obligations | | 5.75 | % | 6.25 | % | 6.75 | % |
Expected long-term rate of return on plan assets | | 8.00 | % | 8.00 | % | 8.00 | % |
Annual salary increases | | 5.14 | % | 5.14 | % | 5.14 | % |
In developing the expected long-term rate of return on plan assets of 8.0%, management considered the historical returns and future expectations for returns for each asset category, as well as the target asset allocation of the portfolio. The expected long-term rate of return on assets is based on weighted average expected returns for each asset class. Management has assumed a target allocation weighting of 70% to 80% for equity securities and 20% to 30% for debt securities. The plan’s equity investment strategy seeks to outperform the Russell 1000 Growth Index by approximately 200 basis points per year before fees on a consistent basis and to outperform the S&P 500 by a similar margin over full market cycles. The plan’s fixed income investment strategy is a defensive mixture invested in both U.S. Treasury Notes and corporate bonds in an effort to reduce interest rate risk.
Variances between actuarial assumptions and actual experience are amortized over the estimated average remaining service lives of employees participating in the retirement plan.
15. Deferred Compensation Plans
We maintain an unfunded, non-qualified deferred compensation plan known as the Capital Accumulation Plan and also have assumed obligations under contractual unfunded deferred compensation arrangements covering certain executives (“Contractual Arrangements”). The Capital Accumulation Plan was frozen on December 31, 1987 and no additional awards have been made. The Board may terminate the Capital Accumulation Plan at any time without cause, in which case our liability would be limited to benefits that have vested. Benefits owed to executives under the Contractual Arrangements vested on or before December 31, 1987.
95
Payment of vested benefits under both the Capital Accumulation Plan and the Contractual Arrangements will generally be made over a ten-year period commencing at retirement age. The general partner is obligated to make capital contributions to AllianceBernstein in amounts equal to benefits paid under the Capital Accumulation Plan and the Contractual Arrangements. Amounts included in employee compensation and benefits expense for the Capital Accumulation Plan and the Contractual Arrangements for the years ended December 31, 2005, 2004, and 2003 were $2.9 million, $3.3 million, and $2.3 million, respectively.
In connection with the acquisition of SCB, Inc. in 2000, we adopted an unfunded, non-qualified deferred compensation plan, known as the SCB Deferred Compensation Award Plan (“SCB Plan”), under which we agreed to invest $96 million per annum for three years to fund notional investments in Holding Units or a company-sponsored money market fund, to be awarded for the benefit of certain individuals who were stockholders or principals of Bernstein or who were hired to replace them. The awards vest ratably over three years and are amortized as employee compensation expense over the vesting period. Awards are payable to participants when fully vested, but participants may elect to defer receipt of vested awards to future dates. We made final awards under the SCB Plan, aggregating $8.6 million, in 2003. The amounts charged to employee compensation and benefits expense for the years ended December 31, 2005, 2004, and 2003 were $29.1 million, $61.3 million, and $85.1 million, respectively.
We maintain an unfunded, non-qualified deferred compensation plan known as the Amended and Restated Alliance Partners Compensation Plan (the “Partners Plan”) under which awards may be granted to eligible employees.
• Awards made in 1995 vest ratably over three years; annual awards made from 1996 through 1998 generally vest ratably over eight years.
• Until distributed, liability for the 1995 through 1998 awards increases or decreases based on our earnings growth rate through December 31, 2005.
• Prior to January 1, 2006, payment of vested 1995 through 1998 benefits will generally be made in cash over a five-year period commencing at retirement or termination of employment although, under certain circumstances, partial lump sum payments may be made.
• Effective January 1, 2006, participant accounts were notionally invested in Holding Units or a money market fund, or a combination of both, at the election of the participant, in lieu of being subject to the earnings-based calculation. The participant elects the distribution date, which could be no earlier than January 2007.
• Annual awards made for 1999 and 2000 are payable in Holding Units.
• A subsidiary of AllianceBernstein purchases Holding Units to fund the related benefits.
• The vesting periods for 1999 and 2000 awards range from immediate to eight years depending on the age of the participant.
• For 2001, participants were required to allocate at least 50% of their awards to notional investments in Holding Units and could allocate the remainder to notional investments in certain of our investment services.
• Beginning with 2002 awards, participants may elect to allocate their awards in a combination of notional investments in Holding Units and notional investments in certain of our investment services.
• Beginning with 2003 awards, participants may elect to allocate their awards in a combination of notional investments in Holding Units (up to 50%) and notional investments in certain of our investment services.
Beginning with 2001 awards, vesting periods for annual awards range from immediate to four years depending on the age of the participant. Upon vesting, awards are distributed to participants unless an election to defer receipt has been made. Quarterly cash distributions on unvested Holding Units for which a deferral election has not been made are paid currently to participants. Quarterly cash distributions on vested and unvested Holding
96
Units and income credited on cash or notional company-sponsored mutual funds awards for which a deferral election has been made are reinvested and distributed as elected by participants.
The Plan may be terminated at any time without cause, in which case our liability would be limited to vested benefits. We made awards in 2005, 2004, and 2003 aggregating $202.0 million, $181.8 million, and $138.0 million, respectively. The amounts charged to employee compensation and benefits expense for the years ended December 31, 2005, 2004, and 2003 were $133.1 million, $75.8 million, and $36.8 million, respectively.
We maintain an unfunded, non-qualified deferred compensation plan known as the Annual Elective Deferral Plan (the “Deferral Plan”) under which participants could elect to defer a portion of their 2000 and 2001 annual bonus or commission and invest it in Holding Units. No deferral elections are permitted after 2001. We contributed a supplemental amount equal to 20% of the deferred amounts to the Deferral Plan, which vest ratably over three years and are amortized as employee compensation expense.
During 2003, we established the Alliance Commission Substitution Plan (“Commission Substitution”), an unfunded, non-qualified incentive plan. Employees whose principal duties are to sell or market the products or services of AllianceBernstein and whose compensation is entirely or mostly commission-based, are eligible for an award under this plan. Participants designate the percentage of their awards to be allocated to notional investments in Holding Units or notional investments in certain of our investment services. Awards vest ratably over a three year period and are amortized as employee compensation expense. We made awards totaling $31.8 million in 2005, $29.6 million in 2004, and $19.4 million in 2003. The amounts charged to employee compensation and benefits expense for the years ended December 31, 2005 and 2004 were $15.8 million and $6.3 million, respectively.
In accordance with the terms of the employment agreement between Mr. Sanders, Chairman and CEO, and AllianceBernstein, he is entitled to receive a deferred compensation award of not less that 1% of AllianceBernstein’s consolidated operating income before incentive compensation for each calendar year during the employment term, beginning with 2004. Mr. Sanders must notionally invest his awards among certain of our investment services. The 2004 award of $12.0 million vests 40% in December 2005, 40% in December 2006, and 20% in June 2007. The 2005 award of $14.8 million vests 67% in December 2006 and 33% in June 2007. The 2006 award will 100% vest in June 2007, and subsequent awards will vest upon grant. In 2005, $4.8 million was charged to employee compensation and benefits expense.
Effective August 1, 2005, we established the Financial Advisor Wealth Accumulation Plan (“Wealth Accumulation Plan”), an unfunded, non-qualified deferred compensation plan. The Wealth Accumulation Plan was established in order to create a compensation program to attract and retain eligible employees expected to make significant contributions to the future growth and success of Bernstein Global Wealth Management, a unit of AllianceBernstein. Participants designate the percentage of their awards to be notionally invested in Holding Units or certain of our investment services. No more than 50% of the award may be notionally invested in Holding Units. All awards vest annually on a pro rata basis over the term of the award. We made awards totaling $14.1 million in 2005. The amount charged to employee compensation and benefits expense in 2005 was $0.5 million.
16. Compensatory Unit Award and Option Plans
In 1988, Holding established an employee unit option plan (the “Unit Option Plan”), under which options to acquire Holding Units were granted to certain key employees. Options were granted for terms of up to ten years and each option had an exercise price of not less than the fair market value of Holding Units on the date of grant. Options become exercisable at a rate of 20% of the Holding Units subject to such options on each of the first five anniversary dates of the date of grant. No options have been granted under the Unit Option Plan since it expired in 1999.
In 1993, Holding established the 1993 Unit Option Plan (“1993 Plan”), under which options to acquire Holding Units were granted to key employees and independent directors of the general partner for terms of up to ten years. Each option had an exercise price of not less than the fair market value of Holding Units on the date of grant. Options become exercisable at a rate of 20% of the Holding Units subject to such options on each of the
97
first five anniversary dates of the date of grant. The aggregate number of Holding Units that can be the subject of options granted under the 1993 Plan or that can be awarded under the Century Club Plan (as defined below) may not exceed 6,400,000 Holding Units. As of December 31, 2005, options to acquire 5,995,600 Holding Units, net of forfeitures, had been granted and 331,148 Holding Units were subject to other awards made under the 1993 Plan (see Century Club Plan below). The 1993 Plans expired during 2003. As a result, options to acquire 73,252 Holding Units ceased to be available for grant under the 1993 Plans.
In 1997, Holding established the 1997 Long-Term Incentive Plan (“1997 Plan”), under which options to acquire Holding Units, restricted Holding Units and phantom restricted Holding Units, performance awards, and other Holding Unit-based awards may be granted to key employees and independent directors of the general partner for terms established at the time of grant (generally ten years). Options generally become exercisable at a rate of 20% of the Holding Units subject to such options on each of the first five anniversary dates of the date of grant. The aggregate number of Holding Units that can be the subject of options granted or that can be awarded under the 1997 Plan may not exceed 41,000,000 Holding Units. As of December 31, 2005, options to acquire 10,860,204 Holding Units, net of forfeitures, had been granted and 165,110 Holding Units were subject to other awards made under the 1997 Plan (see Restricted Units and Century Club Plan below). Holding Unit-based awards (including options) in respect of 29,974,686 Holding Units were available for grant as of December 31, 2005.
During 2005, 2004, and 2003 options to acquire 17,604, 40,000, and 105,000 Holding Units, respectively, were granted to key employees and independent directors of the general partner, collectively, under the 1993 Plan and the 1997 Plan. The weighted average fair value of options to acquire Holding Units granted during 2005, 2004 and 2003 was $7.04, $8.00, and $5.96, respectively, on the date of grant, determined using the Black-Scholes option valuation model with the following assumptions:
| | 2005 | | 2004 | | 2003 | |
| | | | | | | |
Risk-free interest rate | | 3.7 | % | 4.0 | % | 3.0 | % |
Expected cash distribution yield | | 6.2 | % | 3.5 | % | 6.1 | % |
Volatility factor | | 31 | % | 32 | % | 32 | % |
Weighted average expected life | | 3 years | | 5 years | | 5 years | |
The Black-Scholes option valuation model was developed to estimate the fair value of traded options that have no vesting restrictions and are fully transferable. In addition, option valuation models require the input of highly subjective assumptions including the expected price volatility of an Holding Unit. Because compensatory options have characteristics significantly different from those of traded options, and because changes in the subjective input assumptions can materially affect the fair value estimate, in management’s opinion, the existing model does not necessarily provide a reliable measure of the fair value of compensatory options. See Note 2 for the SFAS No. 123 pro forma net income amounts determined using the Black-Scholes option valuation model. See Note 21 for discussion of the implementation of SFAS No. 123-R in 2006.
98
The following table summarizes the activity in options under the Unit Option Plan, the 1993 Plan, and the 1997 Plan:
| | Holding
Units | | Weighted Average
Exercise Price
Per Holding Unit | |
| | | | | |
Outstanding as of December 31, 2002 | | 16,441,400 | | $ | 34.92 | |
Granted | | 105,000 | | $ | 35.01 | |
Exercised | | (1,219,000 | ) | $ | 17.26 | |
Forfeited | | (1,534,300 | ) | $ | 43.27 | |
Outstanding as of December 31, 2003 | | 13,793,100 | | $ | 35.55 | |
Granted | | 40,000 | | $ | 33.00 | |
Exercised | | (2,468,380 | ) | $ | 18.43 | |
Forfeited | | (1,795,300 | ) | $ | 46.96 | |
Outstanding as of December 31, 2004 | | 9,569,420 | | $ | 37.82 | |
Granted | | 17,604 | | $ | 45.45 | |
Exercised | | (1,712,520 | ) | $ | 24.13 | |
Forfeited | | (424,300 | ) | $ | 47.10 | |
Outstanding as of December 31, 2005 | | 7,450,204 | | $ | 40.45 | |
Exercisable as of December 31, 2003 | | 9,130,200 | | | |
Exercisable as of December 31, 2004 | | 7,161,820 | | | |
Exercisable as of December 31, 2005 | | 6,366,700 | | | |
The following table summarizes information concerning outstanding and exercisable options as of December 31, 2005:
| | Options Outstanding | | Options Exercisable | |
Range of Exercise Prices: | | Number
Outstanding
as of
12/31/05 | | Weighted
Average
Remaining
Contractual
Life (Years) | | Weighted
Average
Exercise
Price | | Number
Exercisable
as of
12/31/05 | | Weighted
Average
Exercise
Price | |
| | | | | | | | | | | |
$ | 12.56 | - | $ | 18.47 | | | 632,900 | | 1.59 | | $ | 16.28 | | 632,900 | | $ | 16.28 | |
25.63 | - | 30.25 | | | 1,206,500 | | 3.54 | | 28.61 | | 1,202,500 | | 28.62 | |
32.52 | - | 48.50 | | | 2,810,704 | | 5.96 | | 39.62 | | 2,046,700 | | 41.85 | |
50.15 | - | 50.56 | | | 1,528,100 | | 5.92 | | 50.25 | | 1,220,000 | | 50.25 | |
51.10 | - | 58.50 | | | 1,272,000 | | 4.95 | | 53.77 | | 1,264,600 | | 53.77 | |
$ | 12.56 | - | $ | 58.50 | | | 7,450,204 | | 5.02 | | $ | 40.45 | | 6,366,700 | | $ | 40.79 | |
99
Restricted Units
In 2005, we awarded 2,644 restricted Holding Units (“Restricted Units”) to the independent directors of the general partner. The Restricted Units give the directors, in most instances, all the rights of other Unitholders subject to such restrictions on transfer as the Board of Directors may impose. The market value per Restricted Unit was $45.45 on the grant date. All Restricted Units vest in 2008. As of December 31, 2005, 1,983 Restricted Units, net of a distribution made due to vesting at retirement, were outstanding. The fair value of the Restricted Units is amortized to expense ratably over the restriction period. We recorded compensation expense of $48 thousand in 2005 related to Restricted Units.
Century Club Plan
In 1993, Holding established the Century Club Plan, under which employees whose primary responsibilities are to assist in the distribution of company-sponsored mutual funds and who meet certain sales targets are eligible to receive an award of Holding Units. Awards vest ratably over three years and are amortized as employee compensation expense. In 2005, awards totaling 33,800 Holding Units, with a market value on the date of award of $1.6 million, were granted under the Century Club Plan, and 4,493 previously awarded Holding Units were forfeited.
Awards under the Century Club Plan and those of Restricted Units reduce the number of options to acquire Holding Units available for grant under the 1997 Plan and forfeitures under the Century Club Plan and those of Restricted Units increase them.
17. Income Taxes
AllianceBernstein is a private partnership for federal income tax purposes and, accordingly, is not subject to federal and state corporate income taxes. However, AllianceBernstein is subject to a 4.0% New York City unincorporated business tax (“UBT”). Domestic corporate subsidiaries of AllianceBernstein, which are subject to federal, state and local income taxes, are generally included in the filing of a consolidated federal income tax return; separate state and local income tax returns are filed. Foreign corporate subsidiaries are generally subject to taxes in the foreign jurisdictions where they are located. Holding Income tax expense is comprised of:
| | Years Ended December 31, | |
| | 2005 | | 2004 | | 2003 | |
| | (in thousands) | |
| | | | | | | |
Partnership UBT | | $ | 16,365 | | $ | 14,240 | | $ | 16,508 | |
Corporate subsidiaries: | | | | | | | |
Federal | | 7,100 | | 3,687 | | 7,235 | |
State and local | | 1,236 | | 479 | | 2,251 | |
Foreign | | 35,676 | | 18,572 | | 7,186 | |
Current tax expense | | 60,377 | | 36,978 | | 33,180 | |
Deferred tax expense (benefit)—domestic | | 4,194 | | 2,954 | | (4,500 | ) |
Income tax expense | | $ | 64,571 | | $ | 39,932 | | $ | 28,680 | |
100
The principal reasons for the difference between the effective tax rates and the UBT statutory tax rate of 4% are as follows:
| | Years Ended December 31, | |
| | 2005 | | 2004 | | 2003 | |
| | (in thousands) | |
| | | | | | | | | | | | | |
UBT statutory rate | | $ | 37,315 | | 4.0 | % | $ | 29,803 | | 4.0 | % | $ | 14,339 | | 4.0 | % |
Corporate subsidiaries’ federal, state, local and foreign income taxes | | 37,114 | | 3.9 | | 20,648 | | 2.8 | | 15,417 | | 4.3 | |
Non-deductible items, primarily mutual fund matters settlement penalties in 2003 | | 320 | | 0.1 | | 578 | | 0.1 | | 3,272 | | 0.9 | |
Other permanent items, primarily income not taxable resulting from use of UBT business apportionment factors | | (10,178 | ) | (1.1 | ) | (11,097 | ) | (1.5 | ) | (4,348 | ) | (1.2 | ) |
Income tax expense and effective tax rate | | $ | 64,571 | | 6.9 | % | $ | 39,932 | | 5.4 | % | $ | 28,680 | | 8.0 | % |
Under Statement of Financial Accounting Standards No. 109 (“SFAS No. 109”), “Accounting for Income Taxes”, deferred income taxes reflect the net tax effect of temporary differences between the carrying amounts of assets and liabilities for financial reporting purposes and the amounts used for income tax purposes.
The tax effect of significant items comprising the net deferred tax asset is as follows:
| | December 31, | |
| | 2005 | | 2004 | |
| | (in thousands) | |
Deferred tax asset: | | | | | |
Differences between book and tax basis: | | | | | |
Deferred compensation plans | | $ | 9,850 | | $ | 9,151 | |
Intangible assets | | 631 | | 722 | |
Charge for mutual fund matters and legal proceedings | | 4,900 | | 4,919 | |
Other, primarily revenues taxed upon receipt and accrued expenses deductible when paid | | 827 | | 1,933 | |
| | 16,208 | | 16,725 | |
Valuation allowance | | (2,113 | ) | (2,713 | ) |
Deferred tax asset, net of valuation allowance | | 14,095 | | 14,012 | |
Deferred tax liability: | | | | | |
Differences between book and tax basis: | | | | | |
Furniture, equipment and leasehold improvements | | 142 | | 148 | |
Investment partnerships | | 573 | | 665 | |
Intangible assets | | 10,288 | | 7,833 | |
Other, primarily undistributed earnings on certain foreign subsidiaries | | 1,920 | | 682 | |
| | 12,923 | | 9,328 | |
Net deferred tax asset | | $ | 1,172 | | $ | 4,684 | |
The decrease in the valuation allowance for the year ended December 31, 2005 was $0.6 million. The valuation allowance primarily relates to uncertainties on the deductibility of certain compensation items. The deferred tax asset, net of valuation allowance, is included in other assets. Management has determined that realization of the recognized deferred tax asset of $14.1 million is more likely than not based on anticipated future taxable income.
The company provides income taxes on the undistributed earnings of non-U.S. corporate subsidiaries except to the extent that such earnings are permanently invested outside the United States. As of December 31, 2005, $78.5 million of accumulated undistributed earnings of non-U.S. corporate subsidiaries were permanently
101
invested. At the existing federal income tax rate, additional taxes of approximately $3.2 million would have to be provided if such earnings were remitted.
On October 22, 2004, the American Jobs Creation Act of 2004 (“Act”) was signed into law. The Act contains a one-time foreign dividend repatriation provision, which provides for a special deduction with respect to certain qualifying dividends from foreign subsidiaries until December 31, 2005. In December 2005, our foreign subsidiaries distributed $42.7 million of previously unremitted earnings which qualified for the special deduction under the Act. The company incurred income taxes of less than $0.5 million as a result of these distributions.
18. Business Segment Information
We adopted Statement of Financial Accounting Standards No. 131 (“SFAS No. 131”), “Disclosures about Segments of an Enterprise and Related Information”, in 1999. SFAS No. 131 establishes standards for the way a public enterprise reports information about operating segments in its annual and interim financial statements. It also establishes standards for related enterprise-wide disclosures about products and services, geographic areas and major customers. Generally, financial information is required to be reported consistent with the basis used by management to allocate resources and assess performance.
Management has assessed the requirements of SFAS No. 131 and determined that, because we utilize a consolidated approach to assess performance and allocate resources, we have only one operating segment. Enterprise-wide disclosures as of, and for the years ended, December 31, 2005, 2004, and 2003 were as follows:
Services
Total revenues derived from our investment management and research services were as follows:
| | Years Ended December 31, | |
| | 2005 | | 2004 | | 2003 | |
| | (in millions) | |
| | | | | | | |
Institutional investment | | $ | 905 | | $ | 755 | | $ | 644 | |
Retail | | 1,193 | | 1,294 | | 1,307 | |
Private client | | 691 | | 627 | | 494 | |
Institutional research services | | 321 | | 304 | | 268 | |
Other | | 141 | | 75 | | 52 | |
Total | | $ | 3,251 | | $ | 3,055 | | $ | 2,765 | |
Geographic Information
Total revenues and long-lived assets, related to our domestic and foreign operations, as of and for the years ended December 31, were:
| | 2005 | | 2004 | | 2003 | |
| | (in millions) | |
Total revenues: | | | | | | | |
United States | | $ | 2,395 | | $ | 2,398 | | $ | 2,260 | |
International | | 856 | | 657 | | 505 | |
Total | | $ | 3,251 | | $ | 3,055 | | $ | 2,765 | |
Long-lived assets: | | | | | | | |
United States | | $ | 3,597 | | $ | 3,649 | | $ | 3,815 | |
International | | 18 | | 24 | | 22 | |
Total | | $ | 3,615 | | $ | 3,673 | | $ | 3,837 | |
102
Major Customers
Our mutual funds are distributed to individual investors through broker-dealers, insurance sales representatives, banks, registered investment advisers, financial planners and other financial intermediaries. AXA Advisors, LLC (“AXA Advisors”), a wholly-owned subsidiary of AXA Financial that uses members of the AXA Equitable insurance agency sales force as its registered representatives, has entered into a selected dealer agreement with AllianceBernstein Investments and has been responsible for 3%, 4%, and 3% of our open-end mutual fund sales in 2005, 2004, and 2003, respectively. Subsidiaries of Merrill Lynch & Co., Inc. (“Merrill Lynch”) were responsible for approximately 5%, 6%, and 7% of our open-end mutual fund sales in 2005, 2004, and 2003, respectively. Citigroup, Inc. and its subsidiaries (“Citigroup”), was responsible for approximately 5%, 7%, and 9% of our open-end mutual fund sales in 2005, 2004, and 2003, respectively. AXA Advisors, Merrill Lynch and Citigroup are under no obligation to sell a specific amount of shares of our mutual funds, and each also sells shares of mutual funds that it sponsors and that are sponsored by unaffiliated organizations (in the case of Merrill Lynch and Citigroup).
AXA and the general and separate accounts of AXA Equitable (including investments by the separate accounts of AXA Equitable in the funding vehicle EQ Advisors Trust) accounted for approximately 5% of total revenues for each of the years ended December 31, 2005, 2004, and 2003. No single institutional client other than AXA and its subsidiaries accounted for more than 1% of total revenues for the years ended December 31, 2005, 2004, and 2003, respectively.
19. Related Party Transactions
Mutual Funds
Investment management, distribution, shareholder and administrative, and brokerage services are provided to individual investors by means of retail mutual funds sponsored by our company, our subsidiaries, and our affiliated joint venture companies. Substantially all of these services are provided under contracts that set forth the services to be provided and the fees to be charged. The contracts are subject to annual review and approval by each of the mutual funds’ boards of directors or trustees and, in certain circumstances, by the mutual funds’ shareholders. Revenues for services provided or related to the mutual funds are as follows:
| | Years Ended December 31, | |
| | 2005 | | 2004 | | 2003 | |
| | (in thousands) | |
| | | | | | | |
Investment advisory and services fees | | $ | 729,313 | | $ | 746,631 | | $ | 748,151 | |
Distribution revenues | | 397,800 | | 447,283 | | 436,037 | |
Shareholder servicing fees | | 99,358 | | 115,979 | | 126,383 | |
Other revenues | | 8,014 | | 8,770 | | 11,359 | |
Institutional research services | | 2,417 | | 4,183 | | 4,360 | |
| | | | | | | | | | |
103
AXA and its Subsidiaries
Investment management and administration services are provided to AXA and its subsidiaries. In addition, AXA and its subsidiaries distribute our mutual funds, for which they receive commissions and distribution payments. Sales of our mutual funds through AXA and its subsidiaries, excluding cash management products, aggregated approximately $0.5 billion, $0.4 billion, and $0.5 billion, for the years ended December 31, 2005, 2004, and 2003, respectively. Also, we are covered by various insurance policies maintained by AXA subsidiaries and we pay fees for other services and technology provided by AXA and its subsidiaries that are included in general and administrative expenses. Aggregate amounts included in the consolidated financial statements for transactions with AXA and its subsidiaries are as follows:
| | Years Ended December 31, | |
| | 2005 | | 2004 | | 2003 | |
| | (in thousands) | |
| | | | | | | |
Revenues: | | | | | | | |
Investment advisory and services fees | | $ | 169,220 | | $ | 156,600 | | $ | 131,955 | |
Other revenues | | 733 | | 3,231 | | 3,655 | |
| | $ | 169,953 | | $ | 159,831 | | $ | 135,610 | |
Expenses: | | | | | | | |
Commissions and distribution payments to financial intermediaries | | $ | 5,500 | | $ | 6,325 | | $ | 6,011 | |
General and administrative | | 7,523 | | 9,759 | | 6,115 | |
| | $ | 13,023 | | $ | 16,084 | | $ | 12,126 | |
Balance Sheet: | | | | | | | |
Institutional investment fees receivable | | $ | 7,182 | | $ | 6,532 | | $ | 5,335 | |
Other due from (to) AXA and its subsidiaries | | 1,362 | | (1,405 | ) | 440 | |
| | $ | 8,544 | | $ | 5,127 | | $ | 5,775 | |
During 2001, AllianceBernstein and AXA Asia Pacific Holdings Limited (“AXA Asia Pacific”) established two investment management companies and we include their financial results in our consolidated results of operations. Investment management fees earned by these companies were approximately $44.6 million, $33.3 million, and $25.0 million for the years ended December 31, 2005, 2004, and 2003, respectively, of which approximately $19.9 million, $17.6 million, and $14.0 million, respectively, were from AXA affiliates included in the table above. Minority interest recorded for these companies was $5.9 million, $3.7 million, and $2.4 million for the years ended December 31, 2005, 2004, and 2003, respectively.
Other Related Parties
The consolidated statements of financial condition include a net receivable from Holding and a net payable to our unconsolidated joint ventures as a result of cash transactions for fees and expense reimbursements. The net balances included in the consolidated statements of financial condition as of December 31, 2005, 2004, and 2003 are as follows:
| | December 31, | |
| | 2005 | | 2004 | | 2003 | |
| | (in thousands) | |
| | | | | | | |
Due from Holding, net | | $ | 7,197 | | $ | 7,664 | | $ | 6,706 | |
| | | | | | | |
Due to unconsolidated joint ventures, net | | $ | (2,678 | ) | $ | (1,287 | ) | $ | (520 | ) |
104
20. Dispositions
Cash Management Services
In June 2005, AllianceBernstein and Federated Investors, Inc. (“Federated”) completed a transaction pursuant to which Federated acquired our cash management services. In the transaction, $19.3 billion in assets under management from 22 of our third-party distributed money market funds were transitioned into Federated money market funds. There were no assets or liabilities recorded on the consolidated balance sheet that were transferred as part of this transaction.
The total sales price (much of which is contingent) is estimated to be approximately $95.0 million, which is composed of three parts: (1) an initial cash payment of $25.0 million that was received prior to June 30, 2005, (2) annual contingent purchase price payments payable over the next five years, which we estimate will total $60.0 million, and (3) a final contingent $10.0 million payment, which is based on comparing revenues generated by applicable assets during the fifth year following the closing of the transaction to the revenues generated by those assets prior to the closing of the transaction.
The annual contingent purchase price payments will be calculated as a percentage of revenues, less certain expenses, directly attributed to these assets and certain other assets of our former cash management clients transferred to Federated. Revenues will be recorded as earned. The contingent payments received from Federated in the five years following the closing of the transaction are expected to largely offset the loss of a profit contribution from managing the cash in money market fund customer accounts and, as a result, this transaction is not expected to have a material impact on future results of operations, cash flow or liquidity during that period.
During 2005, we recorded a $11.4 million net gain from this transaction in Other Revenues, Net in the consolidated statement of income. The gain consisted of the initial cash payment of $25.0 million received from Federated, offset by a gain contingency of $7.5 million and approximately $6.1 million of transaction expenses. In addition, $8.1 million of contingent payments were earned during 2005, which are also included in Other Revenues, Net in the consolidated statement of income. The gain contingency is a “clawback” provision that requires us to pay Federated up to $7.5 million if average daily transferred assets for the six-month period ended June 29, 2006 fall below a certain percentage of initial assets transferred at closing.
Indian Mutual Funds
In the third quarter of 2005, Alliance Capital Asset Management (India) Pvt. Ltd. (“ACAM India”), 75% owned by AllianceBernstein and 25% owned by a minority shareholder, whose principal activity is to act as an investment management advisor to AllianceBernstein sponsored mutual funds, transferred its rights to manage the mutual funds to Birla Sun Life. The transaction was subject to approval by the Securities Exchange Board of India, which was received in July 2005. There were no assets or liabilities recorded on the balance sheet that were transferred as part of this transaction.
During 2005, we recorded a gain of $11.7 million from this transaction in Other Revenues, Net in the consolidated statement of income. The transaction resulted in a net gain of $5.3 million after recording severance, incentive compensation, fixed asset writedowns, minority interest, and income tax expense.
South Africa
AllianceBernstein completed a transaction on December 31, 2005 pursuant to which Investec Asset Management (Proprietary) Ltd. (“Investec”) acquired AllianceBernstein’s interest in Alliance Capital Management (Proprietary) Ltd., the firm’s South African domestic investment management subsidiary, including Alliance Capital Management (Proprietary) Namibia Ltd, its wholly-owned Namibian subsidiary (collectively, “ACM South Africa Group”).
The proceeds of approximately $8.9 million consists of an initial cash payment of $7.4 million received in January 2006, for the entire issued share capital of ACM South Africa Group, and $1.5 million to be received
105
upon completion of an audit of ACM South Africa Group’s net assets at closing. In addition, a performance fee price adjustment will be made based on the impact of the positive or negative performance on selected institutional accounts being shared pro rata between AllianceBernstein and Investec. The measurement date of the performance fee adjustment is March 31, 2006.
In the fourth quarter of 2005, we recorded a gain of $7.0 million in Other Revenues, Net in the consolidated statement of income, net of transaction charges and payments to former minority shareholders. Fixed assets were excluded in the transaction, and were acquired by AllianceBernstein Investment Research (Proprietary) Ltd., a new AllianceBernstein research company located in South Africa that will provide research in support of AllianceBernstein’s global products.
This transaction is not expected to have a material impact on future results of operations, cash flow or liquidity.
21. Accounting Pronouncements
In December 2003, the FASB issued FASB Interpretation No. 46 (revised December 2003) (“FIN 46-R”), “Consolidation of Variable Interest Entities”, which addresses accounting and disclosure requirements for variable interest entities (“VIEs”). FIN 46-R defines a VIE as a corporation, partnership, limited liability company, trust, or any other legal structure used for business purposes that either (a) does not have equity investors with voting or similar rights sufficient to enable such investors to make decisions about an entity’s activities or (b) has equity investors that do not provide sufficient financial resources to support the entities’ activities without additional financial support from other parties. FIN 46-R requires a VIE to be consolidated by a company if the company is subject to, among other things, a majority of the risk or residual returns of the VIE. A company that consolidates a VIE is referred to as the primary beneficiary under FIN 46-R. In addition, FIN 46-R requires disclosure, but not consolidation, of those entities in which we are not the primary beneficiary but have a significant variable interest. The consolidation and disclosure provisions of FIN 46-R became effective for reporting periods ending after March 15, 2004.
Management has reviewed its investment management agreements and its investments in, and other financial arrangements with, certain entities that hold client assets under management to determine the entities that the company is required to consolidate under FIN 46-R. These include certain mutual fund products domiciled in Luxembourg, India, Japan, Singapore and Australia, hedge funds, structured products, group trusts and joint ventures.
As a result of this review, we consolidated an investment in a joint venture and its funds under management during 2004. As of December 31, 2004, we sold this investment and, accordingly, no longer consolidate this investment and its funds under management. During 2004, the consolidation had no material impact on results of operations or financial condition.
We derived no direct benefit from client assets under management of these entities other than investment management fees and cannot utilize those assets in our operations.
As of December 31, 2005, we have significant variable interests in certain other structured products and hedge funds with approximately $403.0 million in client assets under management. However, these VIEs do not require consolidation because management has determined that we are not the primary beneficiary. Our maximum exposure to loss in these entities is limited to our nominal investments in, and prospective investment management fees earned from, these entities.
In December 2003, the FASB issued Statement of Financial Accounting Standards No. 132 (revised 2003), (“SFAS No. 132-R”), “Employers’ Disclosures about Pensions and Other Postretirement Benefits”. SFAS No. 132-R requires additional disclosures about assets, obligations, cash flows, and net periodic benefit cost of defined benefit pension plans and other postretirement benefit plans. SFAS No. 132-R is effective for financial statements for fiscal years ending after December 15, 2003. The adoption of SFAS No. 132-R did not have a material effect on our results of operations, liquidity, or capital resources.
106
In December 2004, the FASB issued Statement of Financial Accounting Standards No. 123 (revised 2004), (“SFAS No. 123-R”), “Share Based Payment”. SFAS No. 123-R which superceded APB No. 25 and its related implementation guidance, requires that compensation cost related to share-based payments be recognized in financial statements. Compensation cost should be measured based on the fair value of the equity or liability instruments issued. We have adopted SFAS No. 123-R on a prospective basis, effective January 1, 2006. As discussed in Note 2, in 2002 we adopted the fair value method of recording compensation cost on a prospective basis, and use a straight-line amortization policy, relating to compensatory option awards of Holding Units. Accordingly, pre-tax impact resulting from the application of SFAS No. 123-R will be less than $1.0 million in 2006.
In May 2005, FASB issued Statement of Financial Accounting Standards No. 154 (“SFAS No. 154”), “Accounting Changes and Error Corrections”, which replaces APB Opinion No. 20, “Accounting Changes”, and FASB Statement No. 3, “Reporting Accounting Changes in Interim Financial Statements”, and changes the requirements for the accounting for and reporting of a change in accounting principle. SFAS No. 154 is effective for accounting changes and corrections of errors made in fiscal years beginning after December 15, 2005. Management does not believe the application of SFAS No. 154 will have a material effect on our future results of operations, liquidity, or capital resources.
22. Cash Distributions
AllianceBernstein is required to distribute all of its Available Cash Flow, as defined in the AllianceBernstein Partnership Agreement, to its unitholders and the General Partner. On January 25, 2006, the General Partner declared a distribution of $289.2 million, or $1.12 per AllianceBernstein Unit, representing a distribution from Available Cash Flow for the three months ended December 31, 2005. The distribution was paid on February 16, 2006 to holders of record as of February 6, 2006. See Note 2.
23. Quarterly Financial Data (Unaudited)
| | Quarters Ended 2005 | |
| | December 31 | | September 30 | | June 30 | | March 31 | |
| | (in thousands, except per unit amounts) | |
| | | | | | | | | |
Revenues | | $ | 920,814 | | $ | 811,051 | | $ | 768,570 | | $ | 750,245 | |
Net income | | $ | 289,886 | | $ | 211,928 | | $ | 197,997 | | $ | 168,507 | |
Basic net income per unit | | $ | 1.12 | | $ | 0.82 | | $ | 0.77 | | $ | 0.66 | |
Diluted net income per unit | | $ | 1.12 | | $ | 0.82 | | $ | 0.76 | | $ | 0.65 | |
Cash distributions per unit(1) | | $ | 1.12 | | $ | 0.82 | | $ | 0.76 | | $ | 0.63 | |
| | Quarters Ended 2004 | |
| | December 31 | | September 30 | | June 30 | | March 31 | |
| | (in thousands, except per unit amounts) | |
| | | | | | | | | |
Revenues | | $ | 832,533 | | $ | 726,096 | | $ | 744,497 | | $ | 752,307 | |
Net income | | $ | 228,205 | | $ | 152,668 | | $ | 155,823 | | $ | 168,454 | |
Basic net income per unit | | $ | 0.89 | | $ | 0.60 | | $ | 0.61 | | $ | 0.66 | |
Diluted net income per unit | | $ | 0.88 | | $ | 0.59 | | $ | 0.61 | | $ | 0.66 | |
Cash distributions per unit(1) | | $ | 0.90 | | $ | 0.59 | | $ | 0.61 | | $ | 0.30 | |
(1) Declared and paid during the following quarter.
107
Report of Independent Registered Public Accounting Firm
The General Partner and Unitholders
AllianceBernstein L.P.:
We have audited the accompanying consolidated statements of financial condition of AllianceBernstein L.P. and subsidiaries (“AllianceBernstein”), formerly Alliance Capital Management L.P., as of December 31, 2005 and 2004, and the related consolidated statements of income, changes in partners’ capital and comprehensive income and cash flows for each of the years in the three-year period ended December 31, 2005. These consolidated financial statements are the responsibility of the management of the General Partner. Our responsibility is to express an opinion on these consolidated financial statements based on our audits.
We conducted our audits in accordance with the standards of the Public Company Accounting Oversight Board (United States). Those standards require that we plan and perform the audit to obtain reasonable assurance about whether the financial statements are free of material misstatement. An audit includes examining, on a test basis, evidence supporting the amounts and disclosures in the financial statements. An audit also includes assessing the accounting principles used and significant estimates made by management, as well as evaluating the overall financial statement presentation. We believe that our audits provide a reasonable basis for our opinion.
In our opinion, the consolidated financial statements referred to above present fairly, in all material respects, the financial position of AllianceBernstein as of December 31, 2005 and 2004, and the results of their operations and their cash flows for each of the years in the three-year period ended December 31, 2005, in conformity with U.S. generally accepted accounting principles.
We also have audited, in accordance with the standards of the Public Company Accounting Oversight Board (United States), the effectiveness of AllianceBernstein’s internal control over financial reporting as of December 31, 2005, based on criteria established in Internal Control—Integrated Framework issued by the Committee of Sponsoring Organizations of the Treadway Commission (COSO), and our report dated February 24, 2006 expressed an unqualified opinion on management’s assessment of, and the effective operation of, internal control over financial reporting.
/s/ KPMG LLP | |
New York, New York |
February 24, 2006 |
108
Report of Independent Registered Public Accounting Firm
The General Partner and Unitholders
AllianceBernstein L.P.:
We have audited management’s assessment, included in the accompanying Management’s Report on Internal Controls Over Financial Reporting, that AllianceBernstein L.P. and subsidiaries (“AllianceBernstein”), formerly Alliance Capital Management L.P., maintained effective internal control over financial reporting as of December 31, 2005, based on criteria established in Internal Control-Integrated Framework issued by the Committee of Sponsoring Organizations of the Treadway Commission (COSO). Management of the General Partner is responsible for maintaining effective internal control over financial reporting and for its assessment of the effectiveness of internal control over financial reporting. Our responsibility is to express an opinion on management’s assessment and an opinion on the effectiveness of AllianceBernstein’s internal control over financial reporting based on our audit.
We conducted our audit in accordance with the standards of the Public Company Accounting Oversight Board (United States). Those standards require that we plan and perform the audit to obtain reasonable assurance about whether effective internal control over financial reporting was maintained in all material respects. Our audit included obtaining an understanding of internal control over financial reporting, evaluating management’s assessment, testing and evaluating the design and operating effectiveness of internal control, and performing such other procedures as we considered necessary in the circumstances. We believe that our audit provides a reasonable basis for our opinion.
A company’s internal control over financial reporting is a process designed to provide reasonable assurance regarding the reliability of financial reporting and the preparation of financial statements for external purposes in accordance with generally accepted accounting principles. A company’s internal control over financial reporting includes those policies and procedures that (1) pertain to the maintenance of records that, in reasonable detail, accurately and fairly reflect the transactions and dispositions of the assets of the company; (2) provide reasonable assurance that transactions are recorded as necessary to permit preparation of financial statements in accordance with generally accepted accounting principles, and that receipts and expenditures of the company are being made only in accordance with authorizations of management and directors of the company; and (3) provide reasonable assurance regarding prevention or timely detection of unauthorized acquisition, use, or disposition of the company’s assets that could have a material effect on the financial statements.
Because of its inherent limitations, internal control over financial reporting may not prevent or detect misstatements. Also, projections of any evaluation of effectiveness to future periods are subject to the risk that controls may become inadequate because of changes in conditions, or that the degree of compliance with the policies or procedures may deteriorate.
In our opinion, management’s assessment that AllianceBernstein maintained effective internal control over financial reporting as of December 31, 2005, is fairly stated, in all material respects, based on criteria established in Internal Control-Integrated Framework issued by the Committee of Sponsoring Organizations of the Treadway Commission (COSO). Also, in our opinion, AllianceBernstein maintained, in all material respects, effective internal control over financial reporting as of December 31, 2005, based on criteria established in Internal Control-Integrated Framework issued by the Committee of Sponsoring Organizations of the Treadway Commission (COSO).
We also have audited, in accordance with the standards of the Public Company Accounting Oversight Board (United States), the consolidated statements of financial condition of AllianceBernstein and subsidiaries as of December 31, 2005 and 2004, and the related consolidated statements of income, changes in partners’ capital and comprehensive income and cash flows for each of the years in the three-year period ended December 31, 2005 and our report dated February 24, 2006 expressed an unqualified opinion on those consolidated financial statements.
/s/ KPMG LLP | |
New York, New York |
February 24, 2006 |
109
Item 9. Changes in and Disagreements with Accountants on Accounting and Financial Disclosure
Neither AllianceBernstein nor Holding had any changes in or disagreements with accountants in respect of accounting or financial disclosure.
Item 9A. Controls and Procedures
Disclosure Controls and Procedures
Each of Holding and AllianceBernstein maintains a system of disclosure controls and procedures that is designed to ensure information required to be disclosed is accumulated and communicated to management, including the Chief Executive Officer and the Chief Financial Officer, in a timely manner.
As of the end of the period covered by this report, management carried out an assessment, under the supervision and with the participation of the Chief Executive Officer and the Chief Financial Officer, of the effectiveness of the design and operation of disclosure controls and procedures. Based on this assessment, the Chief Executive Officer and the Chief Financial Officer concluded that the disclosure controls and procedures are effective.
Management’s Report on Internal Control over Financial Reporting
Management acknowledges its responsibility for establishing and maintaining adequate internal control over financial reporting for each of Holding and AllianceBernstein.
Internal control over financial reporting is a process designed by, or under the supervision of, a company’s principal executive officer and principal financial officers, to provide reasonable assurance regarding the reliability of financial reporting and the preparation of financial statements for external purposes in accordance with U.S. generally accepted accounting principles (“GAAP”) and includes those policies and procedures that:
• Pertain to the maintenance of records that in reasonable detail accurately and fairly reflect the transactions and dispositions of the assets of the company;
• Provide reasonable assurance that transactions are recorded as necessary to permit preparation of financial statements in accordance with GAAP, and that receipts and expenditures of the company are being made only in accordance with authorizations of management and directors of the company; and
• Provide reasonable assurance regarding prevention or timely detection of unauthorized acquisition, use or disposition of the company’s assets that could have a material effect on the financial statements.
All internal control systems, no matter how well designed, have inherent limitations. Therefore, even those internal control systems determined to be effective can provide only reasonable assurance with respect to the reliability of financial statement preparation and presentation. Because of these inherent limitations, internal control over financial reporting may not prevent or detect misstatements. Projections of any evaluation of effectiveness of internal control to future periods are subject to the risk that controls may become inadequate because of changes in conditions, or that the degree of compliance with the policies or procedures may deteriorate.
Management assessed the effectiveness of each of Holding’s and AllianceBernstein’s internal control over financial reporting as of December 31, 2005. In making its assessment, management used the criteria set forth by the Committee of Sponsoring Organizations of the Treadway Commission in Internal Control-Integrated Framework (“COSO criteria”). Management did not identify any material weakness in either Holding’s or AllianceBernstein’s internal control over financial reporting.
Based on its assessment, management believes that, as of December 31, 2005, each of Holding and AllianceBernstein maintained effective internal control over financial reporting based on the COSO criteria.
110
KPMG LLP, the registered public accounting firm that audited the financial statements included in this Form 10-K, has issued an attestation report on management’s assessment of each of Holding’s and AllianceBernstein’s internal control over financial reporting. These reports can be found in Item 8.
Changes in Internal Control Over Financial Reporting
No change in our internal control over financial reporting occurred during the fourth quarter of 2005 that materially affected, or is reasonably likely to materially affect, our internal control over financial reporting. We believe that the documentation, testing, and remediation of internal controls that we undertook to make the assessment above has served generally to strengthen such internal control.
Item 9B. Other Information
Effective February 24, 2006, we changed the name of Alliance Capital Management L.P. to AllianceBernstein L.P., and also changed the names of Alliance Capital Management Holding L.P. and Alliance Capital Management Corporation to AllianceBernstein Holding L.P. and AllianceBernstein Corporation, respectively. Some of our subsidiaries underwent a similar change. We believe our new name better describes the character of our business and the shared mission, values, dedication to research and client focus of all of our employees, and is an affirmation of the success of the combination of Alliance Capital and Sanford Bernstein.
Holding Units currently trade under the ticker symbol “AC” but, beginning February 27, 2006, will trade under the ticker symbol “AB”.
111
PART III
Item 10. Directors and Executive Officers of the Registrant
General Partner
The Partnerships’ activities are managed and controlled by the General Partner; the Board of Directors of the General Partner (“Board”) acts as the Board of the Partnerships. The General Partner has agreed that it will conduct no active business other than managing the Partnerships, although it may make certain investments for its own account. Neither AllianceBernstein Unitholders nor Holding Unitholders have any rights to manage or control the Partnerships, or to elect directors of the General Partner. The General Partner is an indirect, wholly-owned subsidiary of AXA Equitable.
The General Partner does not receive any compensation from AllianceBernstein or Holding for services rendered to them as their general partner. The General Partner holds a 1% general partnership interest in AllianceBernstein and 100,000 units of general partnership interest in Holding. Each unit of general partnership interest in Holding has economic interests equivalent to the economic interests of a Holding Unit. As of January 31, 2006, AXA Financial, AXA Equitable, ACMC Inc., ECMC, LLC, MONY Life Insurance Company, and MONY Life Insurance Company of America, each of which is an affiliate of the General Partner, together held 153,580,309 AllianceBernstein Units and 1,544,356 Holding Units (including the 100,000 general partnership units).
The General Partner is reimbursed by AllianceBernstein for all expenses it incurs in carrying out its activities as general partner of the Partnerships, including compensation paid by the General Partner to its directors and officers (to the extent such persons are not compensated directly as employees of AllianceBernstein) and the cost of directors and officers liability insurance obtained by the General Partner. In 2005, the General Partner was reimbursed only for directors and officers/errors and omissions liability insurance premiums.
Directors and Executive Officers
The directors and executive officers of the General Partner are as follows (officers of the General Partner may also serve as officers of AllianceBernstein and Holding):
Name | | Age | | Position |
Lewis A. Sanders | | 59 | | Chairman of the Board and Chief Executive Officer |
Dominique Carrel-Billiard | | 39 | | Director |
Henri de Castries | | 51 | | Director |
Christopher M. Condron | | 58 | | Director |
Denis Duverne | | 52 | | Director |
Roger Hertog | | 64 | | Vice Chairman |
Weston M. Hicks | | 49 | | Director |
W. Edwin Jarmain | | 67 | | Director |
Gerald M. Lieberman | | 59 | | Director, President and Chief Operating Officer |
Nicolas Moreau | | 40 | | Director |
Lorie A. Slutsky | | 53 | | Director |
A.W. (Pete) Smith | | 62 | | Director |
Peter J. Tobin | | 61 | | Director |
Stanley B. Tulin | | 56 | | Director |
Lawrence H. Cohen | | 44 | | Executive Vice President |
Laurence E. Cranch | | 59 | | Executive Vice President and General Counsel |
Edward J. Farrell | | 45 | | Senior Vice President and Controller |
Sharon E. Fay | | 45 | | Executive Vice President |
Marilyn G. Fedak | | 59 | | Executive Vice President |
Mark R. Gordon | | 52 | | Executive Vice President |
112
Name | | Age | | Position |
Thomas S. Hexner | | 49 | | Executive Vice President |
Robert H. Joseph, Jr. | | 58 | | Senior Vice President and Chief Financial Officer |
Mark R. Manley | | 43 | | Senior Vice President, Deputy General Counsel and Chief Compliance Officer |
Seth J. Masters | | 46 | | Executive Vice President |
Marc O. Mayer | | 48 | | Executive Vice President |
Douglas J. Peebles | | 40 | | Executive Vice President |
Jeffrey S. Phlegar | | 39 | | Executive Vice President |
James G. Reilly | | 45 | | Executive Vice President |
Paul C. Rissman | | 49 | | Executive Vice President |
Lisa A. Shalett | | 42 | | Executive Vice President |
David A. Steyn | | 46 | | Executive Vice President |
Christopher M. Toub | | 46 | | Executive Vice President |
Biographies
Mr. Sanders was elected Chairman of the Board of the General Partner effective January 1, 2005 and Chief Executive Officer of AllianceBernstein effective July 1, 2003. He had served as Director, Vice Chairman and Chief Investment Officer since the Bernstein Transaction. Prior thereto, Mr. Sanders was Chairman and Chief Executive Officer of Bernstein, which he joined in 1968 as a research analyst. Mr. Sanders is the Chairman and Chief Executive Officer of SCB Inc.
Mr. Carrel-Billiard was elected a Director of the General Partner in July 2004. He is Senior Vice President-Business Support and Development of AXA in charge of AXA Financial, asset management activities, and reinsurance activities. He joined the AXA Group on June 1, 2004. Prior to joining AXA, Mr. Carrel-Billiard was a Partner of McKinsey and Company where he specialized in the financial services industry, working on a broad array of assignments related to insurance, asset gathering and management, and corporate and investment banking.
Mr. de Castries was elected a Director of the General Partner in October 1993. Since May 3, 2000, he has been Chairman of the Management Board of AXA. Prior thereto, he served AXA in various capacities, including Vice Chairman of the Management Board; Senior Executive Vice President-Financial Services and Life Insurance Activities in the United States, Germany, the United Kingdom and Benelux from 1996 to 2000; Executive Vice President-Financial Services and Life Insurance Activities from 1993 to 1996; General Secretary from 1991 to 1993; and Central Director of Finances from 1989 to 1991. He is also a director or officer of AXA Financial, AXA Equitable, and various other subsidiaries and affiliates of the AXA Group. Mr. de Castries was elected Vice Chairman of AXA Financial on February 14, 1996 and was elected Chairman of AXA Financial, effective April 1, 1998.
Mr. Condron was elected a Director of the General Partner in May 2001. He has been Director, President and Chief Executive Officer of AXA Financial since May 2001. He is Chairman of the Board and Chief Executive Officer of AXA Equitable and a member of the AXA Group Management Board. In addition, Mr. Condron is Chairman of the Board, President and Chief Executive Officer of MONY Life Insurance Company, which AXA Financial acquired in July 2004. Prior to joining AXA Financial, Mr. Condron served as both President and Chief Operating Officer of Mellon Financial Corporation (“Mellon”), from 1999, and as Chairman and Chief Executive Officer of The Dreyfus Corporation, a subsidiary of Mellon, from 1995.
Mr. Duverne was elected a Director of the General Partner in February 1996. He has been Chief Financial Officer of AXA since May 2003 and, from January 2000 to May 2003, served as Group Executive Vice President-Finance, Control and Strategy. Mr. Duverne joined AXA as Senior Vice President in 1995. He is a Director of AXA Financial, AXA Equitable and various other subsidiaries and affiliates of the AXA Group.
Mr. Hertog was elected Director and Vice Chairman of the General Partner in October 2000. Prior thereto, he was President and Chief Operating Officer of Bernstein, which he joined as a research analyst in 1968. Mr. Hertog is a Director and the President and Chief Operating Officer of SCB Inc.
113
Mr. Hicks was elected a Director of the General Partner in July 2005. He has been a Director and the President and Chief Executive Officer of Alleghany Corporation (“Alleghany”), an insurance and diversified financial services company since December 2004 and was Executive Vice President of Alleghany from October 2002 until December 2004. From March 2001 through October 2002, Mr. Hicks was Executive Vice President and Chief Financial Officer of The Chubb Corporation and from March 1999 through March 2001, he was a Managing Director of J.P. Morgan Securities.
Mr. Jarmain was elected a Director of the General Partner in May 2000. He has been President of Jarmain Group Inc., a private investment holding company, since 1979. Mr. Jarmain has been a Director of AXA Financial and AXA Equitable since July 1992 and is, or has been, a director of several other companies affiliated with AXA Equitable.
Mr. Lieberman became a Director of the General Partner and the Chief Operating Officer of AllianceBernstein in November 2003 and was elected President of AllianceBernstein in November 2004, when . he was also elected a member of AXA’s Executive Committee. Mr. Lieberman joined AllianceBernstein in October 2000 and served as Executive Vice President - Finance and Operations of AllianceBernstein from November 2000 to November 2003. Prior to the Bernstein Transaction, Mr. Lieberman served as a Senior Vice President, Finance and Administration of Bernstein, which he joined in 1998, and was a member of Bernstein’s Board of Directors. Mr. Lieberman is a Director of SCB Inc.
Mr. Moreau was elected a Director of the General Partner in May 2004. He has been Chief Executive Officer of AXA Investment Managers since April 2002, and, since January 2001, has been Chairman of AXA Investment Managers Private Equity and Vice Chairman of AXA Rosenberg. He joined AXA in 1991 as a Vice President in the Treasury Department, and in 1994 became the Head of the Corporate Finance and Treasury Department of the AXA Group. In 1997, he joined AXA Investment Managers and in January 1999, following the acquisition by AXA Investment Managers of a majority interest in the Rosenberg Group, Mr. Moreau became Chief Executive Officer of AXA Rosenberg Group LLC. In March 2000, Mr. Moreau became Chief Operating Officer and Managing Director of AXA Investment Managers. AXA Investment Managers, AXA Investment Managers Private Equity, and AXA Rosenberg Group LLC are subsidiaries of AXA.
Ms. Slutsky was elected a Director of the General Partner in July 2002. She has been President and Chief Executive Officer of The New York Community Trust, a $2 billion community foundation consisting of more than 1,800 charitable funds, since January 1990.
Mr. Smith was elected a Director of the General Partner in July 2005 He was President and Chief Executive Officer of the Private Sector Council, a non-profit public service organization dedicated to improving the efficiency, management and productivity of the federal government, from September 2000 until his retirement in May 2005. He is President of Smith Consulting.
Mr. Tobin was elected a Director of the General Partner in May 2000. From September 2003 to June 2005, he was Special Assistant to the President of St. John’s University. Prior thereto, Mr. Tobin served as Dean of the Tobin College of Business of St. John’s University from August 1998 to September 2003. As Dean, Mr. Tobin was the chief executive and academic leader of the College of Business. Mr. Tobin was Chief Financial Officer at The Chase Manhattan Corporation from 1996 to 1997. Prior thereto, he was Chief Financial Officer of Chemical Bank (which merged with Chase in 1996) from 1991 to 1996 and Chief Financial Officer of Manufacturers Hanover Trust (which merged with Chemical in 1991) from 1985 to 1991. Mr. Tobin is on the Boards of Directors of The H.W. Wilson Co. and CIT Group Inc. He has been a Director of AXA Financial since March 1999.
Mr. Tulin was elected a Director of the General Partner in July 1997. He is Vice Chairman and Chief Financial Officer of AXA Financial and Director, Vice Chairman and Chief Financial Officer of AXA Equitable. Since December 2000, he has also been Executive Vice President of AXA and a member of its Executive Committee.
Mr. Cohen has been Executive Vice President and Chief Technology Officer since joining AllianceBernstein in 2004. In this role, he is responsible for technology strategy, application development, and infrastructure
114
services throughout AllianceBernstein. Prior to joining AllianceBernstein, Mr. Cohen held executive IT positions at UBS, Goldman Sachs, Morgan Stanley and Fidelity Investments.
Mr. Cranch has been Executive Vice President and General Counsel since joining AllianceBernstein in 2004. Prior to joining AllianceBernstein, Mr. Cranch was a partner of Clifford Chance, an international law firm. Mr. Cranch joined Clifford Chance in 2000 when Rogers & Wells, a New York law firm of which he was Managing Partner, merged with Clifford Chance.
Mr. Farrell has been Senior Vice President and Controller since joining AllianceBernstein in 2003. He also serves as the Chief Financial Officer of SCB LLC. From 1994 through 2003, Mr. Farrell worked at Nomura Securities International, where he was a Managing Director and a member of the senior management committee. He also held various financial positions including Controller and Chief Financial Officer.
Ms. Fay joined Bernstein in 1990 as a research analyst in investment management, following the airlines, lodging, trucking, and retail industries, and has been Executive Vice President and Chief Investment Officer-Global Value Equities of AllianceBernstein since 2003, overseeing all portfolio management and research activities relating to cross-border and non-U.S. value investment portfolios and chairing the Global Value Investment Policy Group. Until January 2006, Ms. Fay was Co-Chief Investment Officer-European and U.K. Value Equities, a position she assumed with Bernstein in 1999. Between 1997 and 1999, she was Chief Investment Officer-Canadian Value Equities with Bernstein. Prior to that, she had been a senior portfolio manager of International Value Equities since 1995.
Ms. Fedak joined Bernstein in 1984 as a senior portfolio manager. An Executive Vice President of AllianceBernstein since 2000, she is Head of Global Value Equities and Chair of the U.S. Large Cap Value Equity Investment Policy Group. From 1993-2000, Ms. Fedak was Chief Investment Officer for U.S. Value Equities; in 2003, she named John Mahedy, a Senior Vice President of AllianceBernstein, her Co-CIO. Ms. Fedak is also a Director of SCB Inc.
Mr. Gordon joined Bernstein in 1983 and is presently Director of Global Quantitative Research of AllianceBernstein and Chief Investment Officer for the Global Diversified Funds. He was elected an Executive Vice President of AllianceBernstein in February 2004. Mr. Gordon previously served as Bernstein’s Head of Risk Management, Director of Product Development and Director of Quantitative Research.
Mr. Hexner joined Bernstein in 1986 as a financial advisor and has been an Executive Vice President of AllianceBernstein and the Head of Bernstein Global Wealth Management, overseeing the firm’s Private Client Services, since 2000. From 1996 to 2000, Mr. Hexner headed the private client business of Bernstein. From 1989 to 1996, he was Managing Director responsible for Bernstein’s West Coast investment management clients. Mr. Hexner was appointed National Director of Investment Planning in 1988. Mr. Hexner is a Director of SCB Inc.
Mr. Joseph joined AllianceBernstein in 1984 and held various financial positions until his election as Senior Vice President and Chief Financial Officer in 1994. Before joining AllianceBernstein, Mr. Joseph was a Senior Audit Manager with Price Waterhouse for thirteen years.
Mr. Manley joined AllianceBernstein in 1984 and currently serves as Senior Vice President, Deputy General Counsel and Chief Compliance Officer. Mr. Manley served as Acting General Counsel from July 2003 through July 2004 and has served as the company’s Chief Compliance Officer since 1988. From February 1998 through June 2003, Mr. Manley was Senior Vice President and Assistant General Counsel. From February 1992 through February 1998, he was Vice President and Counsel.
Mr. Masters joined Bernstein in 1991 as a research analyst covering banks, insurance companies, and other financial firms and has been Executive Vice President and Chief Investment Officer for style blend and core equity services since 2002. Between 1994 and 2002, Mr. Masters was Chief Investment Officer for Emerging Markets Value Equities. He was elected a Senior Vice President of AllianceBernstein in 2000.
Mr. Mayer joined Bernstein in 1989 as a research analyst and research director in the institutional research services group and has been an Executive Vice President of AllianceBernstein since 2000. He was elected Executive Managing Director of AllianceBernstein Investments in November 2003; he was Head of AllianceBernstein
115
Institutional Investments from 2001 until that time. Prior to 2001, Mr. Mayer was Head of SCB LLC. Mr. Mayer is a Director of SCB Inc.
Mr. Peebles joined AllianceBernstein in 1987 and has been an Executive Vice President of AllianceBernstein and Co-Chief Investment Officer of AllianceBernstein Fixed Income since 2004. He is also Director of Global Fixed Income, with investment responsibility for the institutional and retail global fixed income portfolios managed by AllianceBernstein and oversight responsibility for all global and non-U.S. regional fixed income teams. Mr. Peebles served as a Senior Vice President in Global Fixed Income from February 1998 until April 2004.
Mr. Phlegar joined AllianceBernstein in 1993 and has been an Executive Vice President of AllianceBernstein and Co-Chief Investment Officer of AllianceBernstein Fixed Income since 2004. He served as a Senior Vice President in U.S. Investment Grade Fixed Income from February 1998 until May 2004. Prior to joining AllianceBernstein, Mr. Phlegar managed high grade securities for regulated insurance entities at Equitable Capital Management Corporation, which AllianceBernstein acquired in 1993.
Mr. Reilly joined AllianceBernstein in 1985 as a Vice President and quantitative and fundamental research analyst covering airlines and railroads. He has been an Executive Vice President since 1999 and a portfolio manager with AllianceBernstein’s large cap growth team since 1988. Mr. Reilly was a Senior Vice President of AllianceBernstein from 1993 until 1999.
Mr. Rissman joined AllianceBernstein in 1989 as a quantitative analyst and has been an Executive Vice President and Director of Research—Global Growth Equities since 2000. Mr. Rissman led the Relative Value investment team from 1995 to June 2004 and, in May 2004, he assumed supervisory responsibility for all Growth Equity Services.
Ms. Shalett joined Bernstein in 1995 and has been an Executive Vice President of AllianceBernstein since November 2002 and Chair and Chief Executive Officer of SCB LLC since October 2002. Previously, Ms. Shalett served as Director of Global Research for U.S. and European companies and as senior research analyst covering capital goods and diversified industrials.
Mr. Steyn joined Bernstein in 1999, having been the founding co-CEO of Bernstein’s London office, and has been an Executive Vice President of AllianceBernstein and Head of AllianceBernstein Institutional Investments since November 2003. Mr. Steyn was elected a Senior Vice President of AllianceBernstein in 2000.
Mr. Toub joined AllianceBernstein in 1992 as a portfolio manager with the disciplined growth group. He has been an Executive Vice President of AllianceBernstein since 1999 and Head of Global/International Growth Equities since 1998. Mr. Toub became Chief Executive Officer of AllianceBernstein Limited, a London-based wholly-owned subsidiary of AllianceBernstein, in April 2005. He served as Director of Global Growth Equity Research from 1998 through 2000.
Board of Directors
All directors of the General Partner are elected by annual written consent of the sole stockholder of the General Partner and hold office until the next annual written consent of the sole stockholder or until their successors are duly elected and qualified in accordance with Article III of the By-Laws of the General Partner. All officers of AllianceBernstein serve at the discretion of the Board. Certain executive officers of AllianceBernstein are also directors or trustees and officers of the AllianceBernstein Funds and are directors and officers of our subsidiaries and affiliates.
The Board holds regularly-scheduled quarterly meetings, generally in February, May, July, and November of each year, and holds special meetings or takes action by unanimous written consent as events warrant.
The General Partner pays directors who the Board determines to be independent (as such term is defined in Section 303A.02 of the NYSE Listed Company Manual) and other directors who are not employed by AllianceBernstein or by any of its affiliates:
116
• an annual retainer of $40,000;
• a fee of $1,500 for participating in a meeting of the Board, the Executive Committee of the Board (“Executive Committee”), the Audit Committee of the Board (“Audit Committee”), the Corporate Governance Committee of the Board (“Governance Committee”), the Compensation Committee of the Board (“Compensation Committee”), or other duly constituted committee of the Board, whether he or she participates in person or by telephone;
• an annual retainer of $15,000 for acting as Chair of the Audit Committee;
• an annual retainer of $7,500 for acting as Chair of the Governance Committee; and
• an annual equity-based grant under our 1997 Long Term Incentive Plan consisting of:
• an option to purchase Holding Units with the number of Holding Units set so that the option has a value of $30,000 calculated using the Black-Scholes method, and
• restricted Holding Units having a value of $30,000 based on the closing price of Holding Units on the NYSE as of a grant date.
On May 19, 2005, 661 restricted Holding Units and options to purchase 4,401 Holding Units at $45.45 per Unit were granted to Mr. Jarmain, Ms. Slutsky, and Mr. Tobin. Such compensation was also granted to Benjamin D. Holloway, who resigned from the Board in July 2005.
Other directors (including any director who is employed by one of the Partnerships or one of their affiliates) are not entitled to any compensation from the General Partner for their services as directors.
The General Partner may reimburse any director for reasonable expenses incurred in participating in Board meetings. Holding and AllianceBernstein, in turn, reimburse the General Partner for expenses incurred by the General Partner on their behalf, including amounts in respect of directors’ fees and expenses. These reimbursements are subject to any relevant provisions of the Holding Partnership Agreement and AllianceBernstein Partnership Agreement.
Committees of the Board
The Executive Committee of the Board (“Executive Committee”) is composed of Messrs. Condron, Duverne, Lieberman, Sanders (Chair), and Tobin, and Ms. Slutsky. The Executive Committee exercises all of the powers and authority of the Board (with limited exceptions) when the Board is not in session, or when it is impractical to assemble the Board. The Executive Committee held five meetings in 2005.
The Audit Committee of the Board (“Audit Committee”) is composed of Messrs. Hicks, Jarmain, Smith, and Tobin (Chair). The primary purposes of the Audit Committee are to: (i) assist the Board in its oversight of (1) the integrity of the financial statements of the Partnerships, (2) the Partnerships’ status and system of compliance with legal and regulatory requirements and business conduct, (3) the independent auditor’s qualification and independence, and (4) the performance of the Partnerships’ internal audit function; and (ii) oversee the appointment, retention, compensation, evaluation and termination of the Partnerships’ independent auditor. Consistent with this function, the Audit Committee encourages continuous improvement of, and fosters adherence to, the Partnerships’ policies, procedures and practices at all levels. With respect to these matters, the Audit Committee provides an open avenue of communication among the independent auditor, senior management, the Internal Audit Department, and the Board. The Audit Committee held 11 meetings in 2005.
The Corporate Governance Committee of the Board (“Governance Committee”) is composed of Mr. Condron, Mr. Sanders, and Ms. Slutsky (Chair). The Governance Committee assists the Board in (i) identifying and evaluating qualified individuals to become Board members; (ii) determining the composition of the Board and its committees; (iii) developing and monitoring a process to assess Board effectiveness; (iv) developing and implementing our corporate governance guidelines; and (v) reviewing our policies and programs that relate to matters of corporate responsibility of the General Partner and the Partnerships. The Governance Committee held two meetings in 2005.
117
The Compensation Committee of the Board (“Compensation Committee”) is composed of Messrs. Condron (Chair), Sanders, and Smith, and Ms. Slutsky. The Compensation Committee has general oversight of compensation and compensation-related matters, including, but not limited to: (i) determining bonuses; (ii) determining contributions and awards under employee incentive plans or arrangements (whether qualified or nonqualified) for employees of AllianceBernstein and its subsidiaries, and amending or terminating such plans or arrangements or any welfare benefit plan or arrangement or making recommendations to the Board with respect to adopting any new incentive compensation plan, fringe benefit plan, welfare benefit plan or equity-based plan; and (iii) reviewing and approving corporate goals and objectives relevant to the compensation of Mr. Sanders (the Chief Executive Officer), evaluating his performance in light of those goals and objectives, and determining and approving his compensation level based on this evaluation (Mr. Sanders recuses himself from voting on his compensation). Historically, the Compensation Committee has focused on the cash bonus and deferred awards granted to management; Mr. Sanders has therefore played a key role in the activities undertaken by this committee. Mr. Sanders’s annual compensation is determined pursuant to his employment agreement (see Item 13), which was approved by the Compensation Committee on December 21, 2004. The Compensation Committee held two meetings in 2005.
The Board has other committees as well. The 1997 Option Committee, consisting of Mr. Condron and Ms. Slutsky, is responsible for granting options under our 1997 Long Term Incentive Plan. The Unit Option and Unit Bonus Committee, consisting of Mr. Condron and Ms. Slutsky, is responsible for granting awards under our Unit Bonus Plan. The Compensation Committee, Unit Option and Unit Bonus Committee, and 1997 Option Committee consult with Messrs. Sanders and Lieberman with respect to matters within their authority. The Century Club Plan Committee, consisting of Messrs. Lieberman and Mayer, is responsible for granting awards under our Century Club Plan. For additional information concerning the compensation plans discussed in this paragraph, see Notes 15 and 16 in AllianceBernstein’s consolidated financial statements in Item 8.
In 2003, the Board appointed a Special Committee, now consisting of Mr. Jarmain, Ms. Slutsky, and Mr. Tobin (Chair), to oversee a number of matters relating to regulatory investigations by the NYAG, the SEC and other regulators. In part, the Special Committee is responsible to direct and oversee AllianceBernstein’s internal investigation into these matters, to work with the regulators to resolve these matters, to oversee a broad review of compliance activities and to oversee the handling of related unitholder derivative suits. The members of the Special Committee do not receive any additional compensation for their service on the Special Committee, apart from the ordinary meeting fees described above. The Special Committee did not meet during 2005.
Audit Committee Financial Expert; Independence of Certain Directors
The Board determined, at its regularly-scheduled meeting in February 2006, that each of Weston M. Hicks and Peter J. Tobin is an “audit committee financial expert” within the meaning of Item 401(h) of Regulation S-K. The Board also determined at this meeting that each member of the Audit Committee (Messrs. Hicks, Jarmain, Smith, and Tobin) is financially literate and possesses accounting or related financial management expertise, as contemplated by Section 303A.07(a) of the NYSE Listed Company Manual.
Also at that meeting, the Governance Committee, after having reviewed management’s due diligence and conducted their own inquiries, as needed, recommended to the Board a determination that each of Mr. Hicks, Mr. Jarmain, Ms. Slutsky, Mr. Smith, and Mr. Tobin is “independent” within the meaning of Section 303A.02 of the NYSE Listed Company Manual. The Board considered immaterial relationships of Mr. Hicks (relating to Alleghany Corporation being a client of SCB LLC), Mr. Jarmain (regarding his son-in-law being employed by a firm that does a limited amount of business with an affiliate of AllianceBernstein), and Ms. Slutsky (relating to contributions made by AllianceBernstein to The New York Community Trust) and then determined that each of Mr. Hicks, Mr. Jarmain, Ms. Slutsky, Mr. Smith, and Mr. Tobin is independent within the meaning of the relevant rules.
Management Committees
The Management Executive Committee is composed of Messrs. Cohen, Cranch, Gordon, Hertog, Hexner, Lieberman, Manley, Masters, Mayer, Peebles, Phlegar, Reilly, Rissman, Sanders, Steyn, and Toub, and Mesdames Fay, Fedak, and Shalett, who together are the group of key executives responsible for managing AllianceBernstein, enacting strategic initiatives, and allocating resources to our company’s various departments.
118
Mr. Sanders is ex-officio the Chairman of the Management Executive Committee. The Management Executive Committee meets on a regular basis and at such other times as circumstances warrant.
The Code of Ethics Oversight Committee (“Ethics Committee”), composed of each member of the Management Executive Committee and certain other senior executives, oversees all matters relating to issues arising under the AllianceBernstein Code of Business Conduct and Ethics. During 2005, Ms. Fedak chaired the Ethics Committee at its first meeting and Mr. Steyn chaired the Ethics Committee for the rest of the year. During 2006, Mr. Steyn will chair the first meeting and a new chair will be appointed for rest of the year. The Ethics Committee, which was created pursuant to the SEC Order (see Item 1), meets on a quarterly basis and at such other times as circumstances warrant.
The Internal Compliance Controls Committee (“Compliance Committee”), also composed of each member of the Management Executive Committee and certain other senior executives, reviews compliance issues throughout our company, endeavors to develop solutions to those issues as they may arise from time to time, and oversees implementation of those solutions. The Compliance Committee is chaired by Mr. Manley. The Compliance Committee, which was created pursuant to the SEC Order, meets on a quarterly basis and at such other times as circumstances warrant.
Code of Ethics and Related Policies
All of our directors, officers and employees are subject to our Code of Business Conduct and Ethics. The code is intended to comply with Rule 17j-1 under the Investment Company Act and recommendations issued by the Investment Company Institute regarding, among other things, practices and standards with respect to securities transactions of investment professionals, as well as Rule 204A-1 under the Investment Advisers Act and Section 303A.10 of the NYSE Listed Company Manual. The Code of Business Conduct and Ethics establishes certain guiding principles for all of our employees, including sensitivity to our fiduciary obligations, and ensuring that we meet those obligations. Our Code of Business Conduct and Ethics may be found in the “Corporate Governance” portion of our Internet site (http://www.alliancebernstein.com).
We have adopted the Code of Ethics for the Chief Executive Officer and Senior Financial Officers, which is intended to comply with Section 406 of the Sarbanes-Oxley Act of 2002 (“Item 406 Code”). The Item 406 Code was adopted on October 28, 2004 by the Executive Committee. We intend to satisfy the disclosure requirements under Item 10 of Form 8-K regarding certain amendments to or waivers from provisions of the Item 406 Code that apply to the Chief Executive Officer, Chief Financial Officer and Controller by posting such information on our Internet site (http://www.alliancebernstein.com).
NYSE Governance Matters
The charters and memberships of the Executive Committee, Audit Committee, Corporate Governance Committee, and Compensation Committee may be found in the “Corporate Governance” portion of our Internet site (http://www.alliancebernstein.com).
Our Corporate Governance Guidelines (“Guidelines”) promote the effective functioning of the Board and its committees, promote the interests of the Partnerships’ respective unitholders, with appropriate regard to the Board’s duties to the sole stockholder of the General Partner, and set forth a common set of expectations as to how the Board, its various committees, individual directors, and management, should perform their functions. The Guidelines may be found in the “Corporate Governance” portion of our Internet site (http://www.alliancebernstein.com).
The Corporate Governance Committee is responsible for considering any request for a waiver under the Code of Business Conduct and Ethics, the Item 406 Code, the AXA Code of Business Conduct, and AXA Financial Policy Statement on Ethics from any director or executive officer of the General Partner. Any such waiver that has been granted is set forth in the “Corporate Governance” portion of our Internet site (http://www.alliancebernstein.com). No such waivers were granted during the fourth quarter of 2005.
119
Peter J. Tobin has been chosen to preside at all executive sessions of non-management and independent directors. Interested parties wishing to communicate directly with Mr. Tobin may send an e-mail, with “confidential” in the subject line, to corporate.secretary@alliancebernstein.com. Upon receipt, our Corporate Secretary will promptly forward all such e-mails to Mr. Tobin. Interested parties may also address mail to Mr. Tobin in care of Corporate Secretary, AllianceBernstein Corporation, 1345 Avenue of the Americas, New York, NY 10105, and the Corporate Secretary will promptly forward such mail to Mr. Tobin. We have posted this information in the “Corporate Governance” portion of our Internet site (http://www.alliancebernstein.com).
The 2005 Certification by the Chief Executive Officer of AllianceBernstein under NYSE Listed Company Manual Section 303A.12(a) was submitted to the NYSE on November 26, 2005.
Certifications by the Chief Executive Officer and Chief Financial Officer pursuant to Section 302 of the Sarbanes-Oxley Act of 2002 have been furnished as exhibits to this Form 10-K.
Holding and AllianceBernstein Unitholders may request a copy of any committee charter, the Guidelines, and the Code of Business Conduct and Ethics by contacting the corporate secretary of AllianceBernstein (corporate.secretary@alliancebernstein.com).
Section 16(a) Beneficial Ownership Reporting Compliance
Section 16(a) of the Exchange Act requires directors of the General Partner and executive officers of the Partnerships, and persons who own more than 10% of the Holding Units or AllianceBernstein Units, to file with the SEC initial reports of ownership and reports of changes in ownership of Holding Units or AllianceBernstein Units. To the best of management’s knowledge, during 2005: (i) all Section 16(a) filing requirements relating to Holding were complied with; and (ii) all Section 16(a) filing requirements relating to AllianceBernstein were complied with. You can find our Section 16 filings under “Investor Relations” / “Reports and Filings” on our Internet site (http://www.alliancebernstein.com).
120
Item 11. Executive Compensation
The following Summary Compensation Table sets forth all plan and non-plan compensation awarded to, earned by or paid to the Chief Executive Officer and each of the four most highly compensated executive officers of AllianceBernstein at the end of 2005 (“Named Executive Officers”):
| | | | | | | | | | Long Term Compensation | | | |
| | | | Annual Compensation | | Awards | | Payouts | | | |
(a) | | (b) | | (c) | | (d) | | (e) | | (f) | | (g) | | (h) | | (i) | |
Name and Principal Position | | Year | | Salary
($) | | Bonus
($)(1) | | Other
Annual
Compensation
($)(2) | | Restricted
Unit
Award(s)
($) | | Options
(# Units) | | LTIP
Payouts
($) | | All other
Compensation
($)(3) | |
Lewis A. Sanders | | 2005 | | 275,002 | | 0 | | 250,282 | | 0 | | 0 | | 0 | | 14,792,248 | |
Chairman of the Board and | | 2004 | | 275,002 | | 0 | | 405,497 | | 0 | | 0 | | 0 | | 12,056,274 | |
Chief Executive Officer | | 2003 | | 285,579 | | 1,055,384 | | 348,366 | | 0 | | 0 | | 0 | | 5,216,758 | |
Gerald M. Lieberman | | 2005 | | 200,000 | | 3,200,000 | | 430,089 | | 0 | | 0 | | 0 | | 5,120,000 | |
President and | | 2004 | | 200,000 | | 2,300,000 | | 258,282 | | 0 | | 0 | | 0 | | 4,020,000 | |
Chief Operating Officer | | 2003 | | 207,692 | | 1,000,000 | | 110,412 | | 0 | | 0 | | 0 | | 1,165,185 | |
Marilyn G. Fedak | | 2005 | | 150,000 | | 3,200,000 | | 156,754 | | 0 | | 0 | | 0 | | 4,915,000 | |
Executive Vice President | | 2004 | | 161,538 | | 2,350,000 | | 98,414 | | 0 | | 0 | | 0 | | 4,516,154 | |
| | 2003 | | 207,692 | | 300,000 | | 147,865 | | 0 | | 0 | | 0 | | 1,705,185 | |
Paul C. Rissman | | 2005 | | 200,000 | | 2,925,000 | | 271,664 | | 0 | | 0 | | 0 | | 2,896,710 | |
Executive Vice President | | 2004 | | 200,000 | | 2,300,000 | | 101,362 | | 0 | | 0 | | 0 | | 2,621,710 | |
| | 2003 | | 207,692 | | 1,165,760 | | 186,991 | | 0 | | 0 | | 0 | | 3,521,776 | |
Sharon E. Fay | | 2005 | | 150,000 | | 3,125,000 | | 304,379 | | 0 | | 0 | | 0 | | 4,540,180 | |
Executive Vice President | | 2004 | | 161,538 | | 2,350,000 | | 243,703 | | 0 | | 0 | | 0 | | 3,516,288 | |
| | 2003 | | 207,692 | | 1,200,000 | | 241,234 | | 0 | | 0 | | 0 | | 1,815,372 | |
(1) Column (d) includes for Mr. Sanders a cash payment of $755,384 for 2003 in respect of the performance of the Advanced Value Fund.
(2) During 2005, we owned fractional interests in three aircraft (although we never owned interests in more than two at one time) with an aggregate operating cost of $3,960,822 (including $1,151,729 in maintenance fees, $1,887,639 in usage fees, and $921,454 of amortization based on the original cost of fractional interests, less estimated residual value). The unamortized value of the fractional interests as of December 31, 2005 was $8,643,387.
Our aircraft facilitate business travel of senior executives. We also permit certain senior executives to use the aircraft for personal travel. Overall, personal travel constituted approximately 41.2% of our actual use of the aircraft in 2005.
Our methodology for determining the reported value of personal use of aircraft includes fees paid to the managers of the aircraft (fees take into account the aircraft type and weight, number of miles flown, flight time, number of passengers, and a variable fee), but excludes our fixed costs (original cash expenditure, amortization, and maintenance fees). We have used this methodology to calculate the aggregate incremental cost of personal use of company-owned aircraft in all years covered by the Summary Compensation Table. We included such amounts in column (e). Column (e) also includes the aggregate incremental cost to our company of providing cars and drivers to certain Named Executive Officers.
For 2005, column (e) includes:
for Mr. Sanders, $115,801 for personal use of aircraft and $134,481 for personal use of a car and driver.
for Mr. Lieberman, $52,617 for personal use of aircraft, $112,713 for personal use of a car and driver, $81,750 of cash distributions in respect of unvested Holding Unit elections under the Amended and Restated Alliance Partners Compensation Plan (“Partners Compensation Plan”), and $183,009 of interest payments in respect of investment elections under the SCB Deferred Compensation Award Plan (“SCB Plan”).
for Ms. Fedak, $33,194 for personal use of aircraft and $123,560 of interest payments in respect of investment elections under the SCB Plan.
for Mr. Rissman, $271,664 of cash distributions in respect of unvested Holding Unit elections under the Partners Compensation Plan.
for Ms. Fay, $43,846 of cash distributions in respect of undistributed Holding Unit elections under the SCB Plan, $48,203 of interest payments in respect of investment elections under the SCB Plan, and $212,330 in living expenses in connection with a move to London at our request.
As a result of recent changes in tax law, the Internal Revenue Service (“IRS”) issued guidance on limiting our deduction for costs associated with the personal use of company-owned aircraft by our executive officers. Using this guidance, the income for the taxable year ended October 31, 2005 for such personal use imputed to Mr. Sanders is $367,076, to Mr. Lieberman is $54,879, and to Ms. Fedak is $70,580.
121
For 2004, column (e) includes:
for Mr. Sanders, $269,559 for personal use of aircraft, $131,231 for personal use of a car and driver, and $4,707 of interest payments in respect of investment elections under the SCB Plan;
for Mr. Lieberman, $20,176 for personal use of aircraft, $106,343 for personal use of a car and driver, $31,781 of cash distributions in respect of unvested Holding Unit elections under the Partners Compensation Plan, and $99,982 of interest payments in respect of investment elections under the SCB Plan;
for Ms. Fedak, $98,414 of interest payments in respect of investment elections under the SCB Plan;
for Mr. Rissman, $101,362 of cash distributions in respect of unvested Holding Unit elections under the Partners Compensation Plan;
for Ms. Fay, $33,232 of cash distributions in respect of undistributed Holding Unit elections under the SCB Plan, $24,242 of interest payments in respect of investment elections under the SCB Plan, and $186,229 in living expenses in connection with a move to London at our request.
For 2003, Column (e) includes:
for Mr. Sanders, $246,430 for personal use of aircraft, and $101,936 for personal use of a car and driver;
for Mr. Lieberman, $5,498 of cash distributions in respect of unvested Holding Unit elections under the Partners Compensation Plan, and $104,914 of interest payments in respect of investment elections under the SCB Plan;
for Ms. Fedak, $147,865 of interest payments in respect of investment elections under the SCB Plan;
for Mr. Rissman, $186,991 of cash distributions in respect of unvested Holding Unit elections under the Partners Compensation Plan;
for Ms. Fay, $82,834 of cash distributions in respect of undistributed Holding Unit elections under the SCB Plan, and $158,400 in living expenses in connection with a move to London at our request.
(3) Column (i) includes the aggregate amounts awarded under the Partners Compensation Plan and SCB Plan, and aggregate deferred compensation resulting from association with the Advanced Value Hedge Fund in all years covered by the Summary Compensation Table. We adopted the SCB Plan in connection with the Bernstein Transaction and agreed to make awards of $96 million per year in 2001, 2002, and 2003 for the benefit of certain individuals who were stockholders or principals of SCB Inc. on the closing date, and their replacements.
Column (i) includes the following amounts:
Name | | Year | | Award under
Employment
Agreement
($)(1) | | Awards under
Partners
Compensation
Plan
($)(2) | | Awards under
SCB Plan
($)(3) | | Aggregate
Deferred
Compensation
resulting from
association
with the
Advanced Value
Hedge Fund
($) | | Profit Sharing
Plan
Contribution
($) | | Term Life
Insurance
Premiums
($) | |
Lewis A. Sanders | | 2005 | | 14,770,474 | | 0 | | 0 | | 0 | | 21,000 | | 774 | |
| | 2004 | | 12,035,000 | | 0 | | 0 | | 0 | | 20,500 | | 774 | |
| | 2003 | | 0 | | 506,797 | | 3,193,203 | | 1,510,769 | | 5,185 | | 804 | |
Gerald M. Lieberman | | 2005 | | 0 | | 5,100,000 | | 0 | | 0 | | 20,000 | | 0 | |
| | 2004 | | 0 | | 4,000,000 | | 0 | | 0 | | 20,000 | | 0 | |
| | 2003 | | 0 | | 1,160,000 | | 0 | | 0 | | 5,185 | | 0 | |
Marilyn G. Fedak | | 2005 | | 0 | | 4,900,000 | | 0 | | 0 | | 15,000 | | 0 | |
| | 2004 | | 0 | | 4,500,000 | | 0 | | 0 | | 16,154 | | 0 | |
| | 2003 | | 0 | | 1,700,000 | | 0 | | 0 | | 5,185 | | 0 | |
Paul C. Rissman | | 2005 | | 0 | | 2,875,000 | | 0 | | 0 | | 20,000 | | 1,710 | |
| | 2004 | | 0 | | 2,600,000 | | 0 | | 0 | | 20,000 | | 1,710 | |
| | 2003 | | 0 | | 3,500,000 | | 0 | | 0 | | 20,000 | | 1,776 | |
Sharon E. Fay | | 2005 | | 0 | | 4,525,000 | | 0 | | 0 | | 15,000 | | 180 | |
| | 2004 | | 0 | | 3,500,000 | | 0 | | 0 | | 16,154 | | 134 | |
| | 2003 | | 0 | | 1,810,000 | | 0 | | 0 | | 5,185 | | 187 | |
(1) In accordance with the terms of the employment agreement between Mr. Sanders and AllianceBernstein (“Sanders Agreement”), the 2004 award vests in three increments over two and one-half years—40% on December 1, 2005, 40% on December 1, 2006, and 20% on July 1, 2007. Unvested portions of the award are forfeitable under circumstances specified in the agreement.
In accordance with the Sanders Agreement, the 2005 award vests over one and one-half years—two thirds on December 1, 2006 and one third on July 1, 2007.
(2) 2005 awards vest in equal annual increments on each of December 1, 2006, 2007, 2008, and 2009. Unvested portions of awards are forfeitable upon the Named Executive Officer’s termination.
122
2004 awards vest in equal annual increments on each of December 1, 2005, 2006, 2007, and 2008. Unvested portions of awards are forfeitable upon the Named Executive Officer’s termination.
2003 awards vest in equal annual increments on each of December 1, 2004, 2005, 2006, and 2007. Unvested portions of awards are forfeitable upon the Named Executive Officer’s termination.
(3) 2003 awards vest in equal annual increments on each of December 1, 2004, 2005, and 2006. Unvested portions of awards are forfeitable upon the Named Executive Officer’s termination.
Option Grants in 2005
We did not grant options to acquire, or unit appreciation rights relating to, Holding Units to any of the Named Executive Officers during 2005.
Aggregated Option Exercises in 2005 and 2005 Year-End Option Values
The following table summarizes for each of the Named Executive Officers the number of options exercised during 2005, the aggregate dollar value realized upon exercise, the total number of Holding Units subject to unexercised options held as of December 31, 2005, and the aggregate dollar value of in-the-money, unexercised options held as of December 31, 2005. Value realized upon exercise would be the difference between the fair market value of the underlying Holding Units on the date of exercise and the exercise price of the option. The value of an unexercised, in-the-money option at fiscal year-end is the difference between its exercise price and the fair market value of the underlying Holding Units at the close of business on December 30, 2005 (the last business day in 2005), which was $56.49 per Holding Unit. These values have not been, and may never be, realized. The underlying options have not been, and may never be, exercised, and actual gains, if any, on exercise will depend on the value of Alliance Holding Units on the date of exercise.
Aggregated Option Exercises in 2005 and December 31, 2005 Option Values
Name | | Options
Exercised
(# Units) | | Value
Realized ($) | | Number of Holding
Units Underlying
Unexpired Options as of
December 31, 2005 | | Value of Unexercised
In-the-Money Options as of
December 31, 2005 ($)(1) | |
Exercisable | | Unexercisable | Exercisable | | Unexercisable |
Lewis A. Sanders | | 0 | | 0 | | 0 | | 0 | | 0 | | 0 | |
Gerald M. Lieberman | | 0 | | 0 | | 56,000 | | 24,000 | | 759,120 | | 422,880 | |
Marilyn G. Fedak | | 0 | | 0 | | 0 | | 0 | | 0 | | 0 | |
Paul C. Rissman | | 0 | | 0 | | 243,000 | | 28,000 | | 2,675,375 | | 447,840 | |
Sharon E. Fay | | 0 | | 0 | | 0 | | 0 | | 0 | | 0 | |
(1) In-the-money options are those where the fair market value of the underlying Holding Units exceeds the exercise price of the option. The Named Executive Officers hold no other options in respect of Holding Units or AllianceBernstein Units.
We may grant options to acquire Holding Units to our employees and to independent members of the Board. Upon exercise of options, Holding exchanges the proceeds from exercise for a number of AllianceBernstein Units equal to the number of Holding Units acquired pursuant to the option exercises, thus increasing Holding’s investment in AllianceBernstein.
Certain Employee Benefit Plans
Retirement Plan. We maintain a qualified, non-contributory, defined benefit retirement plan covering current and former employees who were employed in the United States prior to October 2, 2000. Our policy is to satisfy our funding obligation for each year in an amount not less than the minimum required under ERISA and not greater than the maximum amount that we can deduct for federal income tax purposes. Our contributions are determined by application of actuarial methods and assumptions to reflect the cost of benefits under the plan. Each participant’s benefits are determined under a formula which takes into account years of credited service, the participant’s average compensation over prescribed periods and Social Security covered compensation. The maximum annual benefit payable under the plan may not exceed the lesser of $100,000 or 100% of a participant’s average aggregate compensation for the three consecutive years in which he or she received the
123
highest aggregate compensation from us or such lower limit as may be imposed by the Internal Revenue Code on certain participants by reason of their coverage under another qualified plan we maintain. A participant is fully vested after the completion of five years of service. The plan generally provides for payments to or on behalf of each vested employee upon such employee’s retirement at the normal retirement age provided under the plan or later, although provision is made for payment of early retirement benefits on an actuarially reduced basis. Normal retirement age under the plan is 65. Death benefits are payable to the surviving spouse of an employee who dies with a vested benefit under the plan.
The table below sets forth with respect to the retirement plan the estimated annual straight life annuity benefits payable upon retirement at normal retirement age for employees with the remuneration and years of service indicated.
| | Estimated Annual Benefits | |
| | Years of Service at Retirement | |
Average Final Compensation | | 15 | | 20 | | 25 | | 30 | | 35 | | 40 | | 45 | |
$ | 100,000 | | | $ | 17,503 | | $ | 23,337 | | $ | 29,172 | | $ | 35,006 | | $ | 40,840 | | $ | 45,840 | | $ | 50,840 | |
150,000 | | | 28,753 | | 38,337 | | 47,922 | | 57,506 | | 67,090 | | 74,590 | | 82,090 | |
200,000 | | | 40,003 | | 53,337 | | 66,672 | | 80,006 | | 93,340 | | 100,000 | | 100,000 | |
250,000 | | | 51,253 | | 68,337 | | 85,422 | | 100,000 | | 100,000 | | 100,000 | | 100,000 | |
300,000 | | | 62,503 | | 83,337 | | 100,000 | | 100,000 | | 100,000 | | 100,000 | | 100,000 | |
| | | | | | | | | | | | | | | | | | | | | | | | |
Of the Named Executive Officers, only Mr. Rissman is eligible to participate in the retirement plan. Assuming we employ Mr. Rissman until age 65, he would be credited with 32 years of service under the plan. Compensation on which plan benefits are based includes base compensation and excludes bonuses, incentive compensation, profit-sharing plan contributions and deferred compensation. Mr. Rissman’s 2005 compensation for calculation of plan benefits is $200,000.
For a discussion of our other employee benefit plans, as well as its deferred compensation and unit option plans, see Notes 14, 15, and 16 of AllianceBernstein’s consolidated financial statements in Item 8.
124
Item 12. Security Ownership of Certain Beneficial Owners and Management and Related Stockholder Matters
Principal Security Holders
As of January 31, 2006, we had no information that any person beneficially owned more than 5% of the outstanding AllianceBernstein Units except (i) AXA, AXA Financial, AXA Equitable, ACMC Inc., and ECMC, LLC (AXA Financial, AXA Equitable, ACMC Inc. and ECMC, LLC are wholly-owned subsidiaries of AXA) as reported on Schedule 13D/A filed with the SEC on December 21, 2004 pursuant to the Exchange Act, and (ii) SCB Inc. and SCB Partners Inc. (SCB Partners Inc. is a wholly-owned subsidiary of SCB Inc.) as reported on Schedule 13D/A dated December 21, 2004 pursuant to the Exchange Act.
The table below and the notes following it have been prepared in reliance upon such filings for the nature of ownership and an explanation of overlapping ownership.
Name and Address of Beneficial Owner | | Amount and Nature of Beneficial
Ownership Reported on Schedule | | Percent of Class | |
AXA(1)(2)(3)(4)(6)
25 avenue Matignon 75008 Paris, France | | 153,580,309 | | 59.8 | % |
SCB Inc,(5)(6) SCB Partners Inc.(5)(6)
50 Main Street, Suite 1000 White Plains, NY 10606 | | 16,320,000 | | 6.4 | % |
(1) Based on information provided by AXA Financial, on December 31, 2005, AXA and certain of its subsidiaries beneficially owned all of AXA Financial’s outstanding common stock. For insurance regulatory purposes the shares of capital stock of AXA Financial beneficially owned by AXA and its subsidiaries have been deposited into a voting trust (“Voting Trust”), the term of which has been extended until May 12, 2012. The trustees of the Voting Trust (the “Voting Trustees”) are Claude Bébéar, Henri de Castries and Denis Duverne, each of whom serves either on the Management Board or on the Supervisory Board of AXA. The Voting Trustees have agreed to exercise their voting rights to protect the legitimate economic interests of AXA, but with a view to ensuring that certain minority shareholders of AXA do not exercise control over AXA Financial or certain of its insurance subsidiaries.
(2) Based on information provided by AXA and following the consummation of the merger of Finaxa with and into AXA on December 9, 2005, on December 31, 2005, 14.30% of the issued ordinary shares (representing 23.19% of the voting power) of AXA were owned directly and indirectly by three French mutual insurance companies (the “Mutuelles AXA”).
(3) The Voting Trustees and the Mutuelles AXA, as a group, may be deemed to be beneficial owners of all AllianceBernstein Units beneficially owned by AXA and its subsidiaries. By virtue of the provisions of the Voting Trust Agreement, AXA may be deemed to have shared voting power with respect to the AllianceBernstein Units. AXA and its subsidiaries have the power to dispose or direct the disposition of all shares of the capital stock of AXA Financial deposited in the Voting Trust. The Mutuelles AXA, as a group, may be deemed to share the power to vote or to direct the vote and to dispose or to direct the disposition of all the AllianceBernstein Units beneficially owned by AXA and its subsidiaries. The address of each of AXA and the Voting Trustees is 25 avenue Matignon, 75008 Paris, France. The address of the Mutuelles AXA is 26, rue Drouot, 75009 Paris, France.
(4) By reason of their relationships, AXA, the Voting Trustees, the Mutuelles AXA, AXA Financial, AXA Equitable, ACMC Inc., and ECMC, LLC may be deemed to share the power to vote or to direct the vote and to dispose or direct the disposition of all or a portion of the 153,580,309 AllianceBernstein Units.
(5) SCB Partners Inc. is a wholly-owned subsidiary of SCB Inc. Mr. Sanders is a Director and the Chairman and Chief Executive Officer of SCB Inc., and is the owner of a 22.25% equity interest in SCB Inc. Mr. Hertog is a Director and the President and Chief Operating Officer of SCB Inc., and is the owner of a 10.48% equity interest in SCB Inc. Mr. Lieberman is a Director and the Senior Vice President—Finance and Administration of SCB Inc., and is the owner of a less than 1% equity interest in SCB Inc. Ms. Fedak is a Director and Senior Vice President of SCB Inc., and is the owner of a 2.67% equity interest in SCB Inc. Ms. Fay is the owner of a less than 1% equity interest in SCB Inc. Mr. Sanders, Mr. Hertog, Mr. Lieberman, Ms. Fedak, and Ms. Fay disclaim beneficial ownership of the 16,320,000 AllianceBernstein Units owned by SCB Partners Inc., except to the extent of their pecuniary interests therein.
(6) In connection with the Bernstein Transaction, SCB Inc., AllianceBernstein and AXA Financial entered into a purchase agreement under which SCB Inc. has the right to sell or assign up to 2,800,000 AllianceBernstein Units issued in connection with the Bernstein Transaction at any time. SCB Inc. has the right (“Put”) to sell to AXA Financial or its designee up to 8,160,000 AllianceBernstein Units issued in connection with the Bernstein Transaction each year less any AllianceBernstein Units SCB Inc. may have otherwise sold or assigned that year. The Put rights expire on October 2, 2010. Generally, SCB Inc. may exercise its Put rights only once per year and SCB Inc. may not deliver an exercise notice regarding its Put rights until at least nine months after it delivered its immediately preceding exercise notice. On each of November 25, 2002, March 5, 2004, and December 21, 2004, AXA Financial or certain of its wholly-owned subsidiaries purchased 8,160,000 AllianceBernstein Units from SCB Partners Inc., a wholly-owned subsidiary of SCB Inc. pursuant to exercises of the Put rights by SCB Inc.
125
As of January 31, 2006, Holding owned 83,613,491 or 32.5% of the outstanding AllianceBernstein Units.
As of January 31, 2006, we had no information that any person beneficially owned more than 5% of the outstanding Holding Units.
Management
The following table sets forth, as of January 31, 2006, the beneficial ownership of Holding Units by each director and Named Executive Officer of the General Partner and by all directors and executive officers as a group:
Name of Beneficial Owner | | Number of Holding Units
and Nature of
Beneficial Ownership | | Percent of Class | |
Lewis A. Sanders(1) | | 0 | | * | |
Dominique Carrel-Billiard(1) | | 0 | | * | |
Henri de Castries(1) | | 2,000 | | * | |
Christopher M. Condron(1) | | 15,000 | | * | |
Denis Duverne(1) | | 2,000 | | * | |
Roger Hertog(1) | | 0 | | * | |
Weston M. Hicks | | 0 | | * | |
W. Edwin Jarmain(1,2) | | 22,661 | | * | |
Gerald M. Lieberman(1,3) | | 103,399 | | * | |
Nicolas Moreau(1) | | 0 | | * | |
Lorie A. Slutsky(4) | | 10,811 | | * | |
A.W. (Pete) Smith | | 0 | | * | |
Peter J. Tobin(1,5) | | 20,661 | | * | |
Stanley B. Tulin(1) | | 0 | | * | |
Marilyn G. Fedak(1) | | 0 | | * | |
Paul C. Rissman(1,6) | | 514,748 | | * | |
Sharon E. Fay(1) | | 21,846 | | * | |
All directors and executive officers of the General Partner as a group (32 persons)(7) | | 2,970,896 | | 3.6 | % |
* Number of Holding Units listed represents less than 1% of the Units outstanding.
(1) Excludes Holding Units beneficially owned by AXA and its subsidiaries. Messrs. Carrel-Billiard, de Castries, Condron, Duverne, Jarmain, Lieberman, Moreau, Tobin, and Tulin are directors and/or officers of AXA, AXA Financial, and/or AXA Equitable. Messrs. Sanders, Hertog, Lieberman, and Rissman, and Mesdames Fedak and Fay, are directors and/or officers of the General Partner.
(2) Includes 20,000 Holding Units Mr. Jarmain can acquire within 60 days under an AllianceBernstein option plan.
(3) Includes 56,000 Holding Units Mr. Lieberman can acquire within 60 days under an AllianceBernstein option plan.
(4) Includes 8,500 Holding Units Ms. Slutsky can acquire within 60 days under an AllianceBernstein option plan.
(5) Includes 20,000 Holding Units Mr. Tobin can acquire within 60 days under an AllianceBernstein option plan.
(6) Includes 243,000 Holding Units Mr. Rissman can acquire within 60 days under an AllianceBernstein option plan.
(7) Includes 1,166,500 Holding Units the directors and executive officers as a group can exercise within 60 days under AllianceBernstein option plans.
As of January 31, 2006, our directors and executive officers only beneficially owned AllianceBernstein Units to the extent of their respective indirect pecuniary interests in 16,320,000 AllianceBernstein Units beneficially owned by SCB Partners Inc. Based on their respective equity interests in SCB Inc. and/or notional interests in the AllianceBernstein Units through an SCB Partners Inc. profit sharing plan, the individuals named below may be deemed to own beneficially and indirectly the number of AllianceBernstein Units set forth opposite their respective names:
126
Name of Beneficial Owner | | Number of
AllianceBernstein Units
and Nature of
Beneficial Ownership | | Percent of Class | |
Lewis A. Sanders | | 3,169,021 | | 1.4 | % |
Roger Hertog | | 1,493,378 | | * | |
Gerald M. Lieberman | | 92,485 | | * | |
Sharon E. Fay | | 50,424 | | * | |
Marilyn G. Fedak | | 379,721 | | * | |
Mark R. Gordon | | 214,936 | | * | |
Thomas S. Hexner | | 165,193 | | * | |
Seth J. Masters | | 86,094 | | * | |
Marc O. Mayer | | 100,304 | | * | |
Lisa A. Shalett | | 28,330 | | * | |
David A. Steyn | | 1,825 | | * | |
All directors and executive officers of the General Partner as a group (32 persons) | | 5,781,711 | | 2.3 | % |
* Number of AllianceBernstein Units listed represents less than 1% of the outstanding AllianceBernstein Units.
The following table sets forth, as of January 31, 2006, the beneficial ownership of the common stock of AXA by each director and Named Executive Officer of the General Partner and by all directors and executive officers as a group:
AXA Common Stock(1)
Name of Beneficial Owner | | Number of Shares and Nature of
Beneficial Ownership | | Percent of Class | |
Lewis A. Sanders | | 0 | | * | |
Dominique Carrel-Billiard(2) | | 12,733 | | * | |
Henri de Castries(3) | | 4,910,250 | | * | |
Christopher M. Condron(4) | | 2,196,165 | | * | |
Denis Duverne(5) | | 1,457,985 | | * | |
Roger Hertog | | 0 | | * | |
Weston M. Hicks | | 0 | | * | |
W. Edwin Jarmain(6) | | 23,195 | | * | |
Gerald M. Lieberman | | 0 | | * | |
Nicolas Moreau(7) | | 247,573 | | * | |
Lorie A. Slutsky | | 0 | | * | |
A.W. (Pete) Smith | | 0 | | * | |
Peter J. Tobin(8) | | 13,723 | | * | |
Stanley B. Tulin(9) | | 1,732,655 | | * | |
Marilyn G. Fedak | | 0 | | * | |
Paul C. Rissman | | 0 | | * | |
Sharon E. Fay | | 0 | | * | |
All directors and executive officers of the General Partner as a group (32 persons)(10) | | 10,594,279 | | * | |
* Number of shares listed represents less than 1% of the outstanding AXA common stock.
(1) Holdings of AXA American Depositary Shares (“ADS”) are expressed as their equivalent in AXA common stock. Each AXA ADS represents the right to receive one AXA ordinary share.
(2) Includes 11,333 shares subject to options, which options Mr. Carrel-Billiard can exercise within 60 days.
(3) Includes 4,016,398 shares subject to options and 286,219 ADSs subject to options, which options Mr. de Castries can exercise within 60 days.
(4) Includes 1,431,119 ADSs subject to options, which options Mr. Condron can exercise within 60 days. Also includes 172,992 performance units, which are paid out when vested based on the price of ADSs at that time; payout will be 70% in cash and 30% in ADSs
(5) Includes 1,160,076 shares subject to options and 97,850 ADSs subject to options, which options Mr. Duverne can exercise within 60 days.
127
(6) Includes 11,800 ADSs owned by Jarmain Group Inc. Mr. Jarmain controls Jarmain Group Inc.
(7) Represents 247,573 shares subject to options, which options Mr. Moreau can exercise within 60 days.
(8) Includes 3,540 ADSs Mr. Tobin owns jointly with his spouse.
(9) Includes 111,571 shares subject to options and 1,371,657 ADSs subject to options, which options Mr. Tulin can exercise within 60 days. Also includes 105,350 performance units, which are paid out when vested based on the price of ADSs at that time; payout will be 70% in cash and 30% in ADSs
(10) Includes 5,546,951 shares and 3,186,845 ADSs subject to options, which options the directors and executive officers as a group can exercise within 60 days.
Partnership Matters
The General Partner makes all decisions relating to the management of AllianceBernstein and Holding. The General Partner has agreed that it will conduct no business other than managing AllianceBernstein and Holding, although it may make certain investments for its own account. Conflicts of interest, however, could arise between AllianceBernstein and Holding, the General Partner and the Unitholders of both Partnerships.
Section 17-403(b) of the Delaware Revised Uniform Limited Partnership Act (“Delaware Act”) states in substance that, except as provided in the Delaware Act or the applicable partnership agreement, a general partner of a limited partnership has the liabilities of a general partner in a general partnership governed by the Delaware Uniform Partnership Law (as in effect on July 11, 1999) to the partnership and to the other partners. Accordingly, while under Delaware law a general partner of a limited partnership is liable as a fiduciary to the other partners, those fiduciary obligations may be altered by the terms of the applicable partnership agreement. The AllianceBernstein Partnership Agreement and Holding Partnership Agreement both set forth limitations on the duties and liabilities of the General Partner. Each partnership agreement provides that the General Partner is not liable for monetary damages for errors in judgment or for breach of fiduciary duty (including breach of any duty of care or loyalty), unless it is established that the General Partner’s action or failure to act involved an act or omission undertaken with deliberate intent to cause injury, with reckless disregard for the best interests of the Partnerships or with actual bad faith on the part of the General Partner, or constituted actual fraud. Whenever the AllianceBernstein Partnership Agreement and the Holding Partnership Agreement provide that the General Partner is permitted or required to make a decision (i) in its “discretion,” the General Partner is entitled to consider only such interests and factors as it desires and has no duty or obligation to consider any interest of or other factors affecting the Partnerships or any Unitholder of AllianceBernstein or Holding or (ii) in its “good faith” or under another express standard, the General Partner will act under that express standard and will not be subject to any other or different standard imposed by the AllianceBernstein Partnership Agreement and the Holding Partnership Agreement or applicable law or in equity or otherwise. The partnership agreements further provide to the extent that, at law or in equity, the General Partner has duties (including fiduciary duties) and liabilities relating thereto to either Partnership or any partner, the General Partner acting under the AllianceBernstein Partnership Agreement or the Holding Partnership Agreement, as applicable, will not be liable to the Partnerships or any partner for its good faith reliance on the provisions of the partnership agreement.
In addition, the AllianceBernstein Partnership Agreement and the Holding Partnership Agreement grant broad rights of indemnification to the General Partner and its directors and affiliates and authorizes AllianceBernstein and Holding to enter into indemnification agreements with the directors, officers, partners, employees and agents of AllianceBernstein and its affiliates and Holding and its affiliates. The Partnerships have granted broad rights of indemnification to officers and employees of AllianceBernstein and Holding. The foregoing indemnification provisions are not exclusive, and the Partnerships are authorized to enter into additional indemnification arrangements. AllianceBernstein and Holding have obtained directors and officers/errors and omissions liability insurance.
The AllianceBernstein Partnership Agreement and the Holding Partnership Agreement also allow transactions between AllianceBernstein and Holding and the General Partner or its affiliates if the transactions are on terms determined by the General Partner to be comparable to (or more favorable to AllianceBernstein or Holding than) those that would prevail with an unaffiliated party. The partnership agreements provide that those transactions are deemed to meet that standard if such transactions are approved by a majority of those directors of the General Partner who are not directors, officers or employees of any affiliate of the General Partner (other than AllianceBernstein, and its subsidiaries or Holding) or, if in the reasonable and good faith judgment of the General
128
Partner, the transactions are on terms substantially comparable to (or more favorable to AllianceBernstein or Holding than) those that would prevail in a transaction with an unaffiliated party.
The AllianceBernstein Partnership Agreement and the Holding Partnership Agreement expressly permit all affiliates of the General Partner (including AXA Equitable and its other subsidiaries) to compete, directly or indirectly, with AllianceBernstein and Holding, to engage in any business or other activity and to exploit any opportunity, including those that may be available to AllianceBernstein and Holding. AXA, AXA Financial, AXA Equitable and certain of their subsidiaries currently compete with AllianceBernstein. See Item 13. The partnership agreements further provide that, except to the extent that a decision or action by the General Partner is taken with the specific intent of providing an improper benefit to an affiliate of the General Partner to the detriment of AllianceBernstein or Holding, there is no liability or obligation with respect to, and no challenge of, decisions or actions of the General Partner that would otherwise be subject to claims or other challenges as improperly benefiting affiliates of the General Partner to the detriment of the Partnerships or otherwise involving any conflict of interest or breach of a duty of loyalty or similar fiduciary obligation.
Section 17-1101(c) of the Delaware Act provides that it is the policy of the Delaware Act to give maximum effect to the principle of freedom of contract and to the enforceability of partnership agreements. Further, Section 17-1101(d) of the Delaware Act provides in part that to the extent a partner has duties (including fiduciary duties) and liabilities relating thereto to a limited partnership or to another partner, those duties and liabilities may be expanded, restricted, or eliminated by provisions in a partnership agreement (provided that a partnership agreement may not eliminate the implied contractual covenant of good faith and fair dealing). Decisions of the Delaware courts have recognized the right of parties, under the above provisions of the Delaware Act, to alter by the terms of a partnership agreement otherwise applicable fiduciary duties and liability for breach of duties. However, the Delaware Courts have required that a partnership agreement make clear the intent of the parties to displace otherwise applicable fiduciary duties (the otherwise applicable fiduciary duties often being referred to as “default” fiduciary duties). Judicial inquiry into whether a partnership agreement is sufficiently clear to displace default fiduciary duties is necessarily fact driven and is made on a case by case basis. Accordingly, the effectiveness of displacing default fiduciary obligations and liabilities of general partners continues to be a developing area of the law and it is not certain to what extent the foregoing provisions of the AllianceBernstein Partnership Agreement and the Holding Partnership Agreement are enforceable under Delaware law.
Item 13. Certain Relationships and Related Transactions
Competition
AXA, AXA Financial, AXA Equitable and certain of their direct and indirect subsidiaries provide financial services, some of which are competitive with those offered by AllianceBernstein. The AllianceBernstein Partnership Agreement specifically allows AXA Financial and its subsidiaries (other than the General Partner) to compete with AllianceBernstein and to exploit opportunities that may be available to AllianceBernstein. AXA, AXA Financial, AXA Equitable and certain of their subsidiaries have substantially greater financial resources than AllianceBernstein or the General Partner.
Financial Services
The AllianceBernstein Partnership Agreement and the Holding Partnership Agreement permit AXA and its affiliates to provide services to AllianceBernstein and Holding on terms comparable to (or more favorable to AllianceBernstein and Holding than) those that would prevail in a transaction with an unaffiliated third party. The General Partner believes that its arrangements with AXA Equitable and its affiliates are at least as favorable to AllianceBernstein and Holding as could be obtained from an unaffiliated third party, based on its knowledge of, and inquiry, with respect to comparable arrangements with or between unaffiliated third parties.
129
The following tables summarizes transactions between AllianceBernstein and related parties during 2005:
Parties(1) | | General Description of Relationship | | Amounts Received or
Accrued for in 2005 | |
EQAT, AXA Enterprise Trust and AXA Premier VIP Trust | | We serve as sub-adviser to these open-end mutual funds, each of which is sponsored by a subsidiary of AXA Financial | | $ | 74,688,000 | |
AXA Equitable(2) | | We provide investment management services and ancillary accounting, valuation, reporting, treasury and other services to the general and separate accounts of AXA Equitable and its insurance companies subsidiaries | | $ | 36,118,000 (of
which $583,000
relates to the ancillary services) | |
AXA Asia Pacific(2) | | We provide investment management services. | | $ | 34,340,000 | |
AXA Group Life Insurance | | We provide investment management services. | | $ | 10,393,000 | |
MONY Life Insurance Company and its subsidiaries(2)(3) | | We provide investment management services and ancillary accounting services. | | $ | 9,719,000 (of which $150,000 relates to the ancillary services) | |
AXA UK Group Pension Scheme | | We provide investment management services. | | $ | 1,981,000 | |
AXA Reinsurance Company(2) | | We provide investment management services. | | $ | 534,000 | |
AXA Corporate Solutions(2) | | We provide investment management services. | | $ | 559,000 | |
AXA (Canada)(2) | | We provide investment management services. | | $ | 616,000 | |
AXA Foundation, Inc., a subsidiary of AXA Financial | | We provide investment management services. | | $ | 172,000 | |
AXA Sun Life(2) | | We provide investment management services. | | $ | 782,000 | |
(1) AllianceBernstein is a party to each transaction.
(2) This entity is a subsidiary of AXA. AXA is an indirect parent of AllianceBernstein.
(3) Subsidiaries include MONY Life Insurance Company of America and U.S. Financial Life Insurance Company.
130
Parties(1)(2) | | General Description of Relationship | | Amounts Paid or
Accrued for in 2005 | |
AXA Advisors | | AXA Advisors distributes certain of our Retail Products. | | $ | 5,500,000 | |
AXA Equitable | | We are covered by various insurance policies maintained by AXA Equitable. | | $ | 2,717,000 | |
AXA Equitable | | AXA Equitable provides certain data processing services and functions. | | $ | 2,375,000 | |
AXA Advisors | | AXA Advisors sells shares of our mutual funds under Distribution Services and Educational Support agreements. | | $ | 858,000 | |
GIE Informatique AXA (“GIE”) | | GIE provides cooperative technology development and procurement services to us and to various other subsidiaries of AXA. | | $ | 878,000 | |
Various AXA subsidiaries | | They provide other miscellaneous general and administrative services. | | $ | 695,000 | |
(1) AllianceBernstein is a party to each transaction.
(2) This entity is a subsidiary of AXA. AXA is an indirect parent of AllianceBernstein.
(3) Subsidiaries include MONY Life Insurance Company of America and U.S. Financial Life Insurance Company.
Other Transactions
On February 1, 2001, AllianceBernstein and AXA Asia Pacific entered into a Subscription and Shareholders Agreement under which they established two investment management companies in Australia and New Zealand named AllianceBernstein Australia Limited and AllianceBernstein New Zealand Limited, respectively. AXA Asia Pacific and AllianceBernstein each own fifty percent (50%) of the equity of each company and have equal representation on the boards. These companies currently manage approximately $38.5 billion in client assets, and earned $44.6 million in management fees in 2005.
AXA Advisors was our fifth largest distributor of U.S. Funds in 2005, for which we paid AXA Advisors sales concessions on sales of $467 million. Various subsidiaries of AXA distribute certain of our Non-U.S. Funds, for which such entities received aggregate distribution payments of approximately $390,000 in 2005.
AXA Equitable and its affiliates are not obligated to provide funds to us, except for ACMC Inc.’s and the General Partner’s obligation to fund certain of our deferred compensation and employee benefit plan obligations. See Item 11. ACMC Inc. and the General Partner are obligated, subject to certain limitations, to make capital contributions to AllianceBernstein in an amount equal to the payments AllianceBernstein is required to make as deferred compensation under the employment agreements entered into in connection with AXA Equitable’s 1985 acquisition of Donaldson, Lufkin and Jenrette Securities Corporation (now part of Credit Suisse First Boston LLC) as well as obligations of AllianceBernstein to various employees and their beneficiaries under AllianceBernstein’s Capital Accumulation Plan. In 2005, ACMC Inc. made capital contributions to AllianceBernstein in the amount of approximately $4.2 million in respect of these obligations. ACMC Inc’s obligations to make these contributions are guaranteed by Equitable Holdings, LLC (a wholly-owned subsidiary of AXA Equitable), subject to certain limitations. All tax deductions with respect to these obligations, to the extent funded by ACMC Inc., the General Partner, or Equitable Holdings, LLC, will be allocated to ACMC Inc. or the General Partner.
On January 4, 2005, Lewis A. Sanders and AllianceBernstein entered into an employment agreement pursuant to which Mr. Sanders shall serve as Chairman and Chief Executive Officer of the General Partner through December 31, 2011 (“Employment Term”) unless the agreement is terminated in accordance with its terms. Mr. Sanders will be paid a minimum base salary of $275,000 per year during the Employment Term and, for calendar year 2004 and each subsequent calendar year during the Employment Term, he is entitled to receive a deferred compensation award of not less than one percent (1%) of AllianceBernstein’s consolidated operating income before incentive compensation (as defined with respect to the calculation of AllianceBernstein’s bonus
131
pool) for such calendar year. Mr. Sanders is entitled to perquisites on the same terms as other senior executives, including personal use of aircraft and a car and driver. For the amounts of Mr. Sanders’s deferred compensation awards, see the compensation tables in Item 11.
Two of our executive officers, one of whom is a director, have immediate family members whom we employ. We established the compensation of each such family member in accordance with our employment and compensation practices applicable to employees with equivalent qualifications and responsibilities who hold similar positions. These employees are three of our 4,312 employees.
Gerald M. Lieberman’s daughter, Andrea L. Feldman, is employed in AllianceBernstein Institutional Investments and received 2005 compensation of $110,000 (salary and bonus). Mr. Lieberman’s son-in-law, Jonathan H. Feldman, the spouse of Andrea L. Feldman, is employed in Institutional Research Services and received 2005 compensation of $195,000 (salary and bonus). Gerald M. Lieberman is Director of the General Partner and the President and Chief Operating Officer of AllianceBernstein.
James G. Reilly’s brother, Michael J. Reilly, is a U.S. Large Cap Growth portfolio manager and received 2005 compensation of $2,500,000 (salary, bonus, and deferred compensation). James G. Reilly is an Executive Vice President of AllianceBernstein and our U.S. Large Cap Growth team leader.
Item 14. Principal Accountant Fees and Services
The following table presents fees for professional audit services rendered by KPMG LLP for the audit of AllianceBernstein’s and Holding’s annual financial statements for 2005 and 2004, and fees for other services rendered by KPMG LLP ($ in thousands):
| | 2005 | | 2004 | |
| | Domestic | | International | | Total | | Domestic | | International | | Total | |
Audit Fees(1) | | $ | 6,222 | | $ | 1,051 | | $ | 7,273 | | $ | 4,719 | | $ | 982 | | $ | 5,701 | |
Audit Related Fees(2) | | 712 | | 588 | | 1,300 | | 2,842 | | 670 | | 3,512 | |
Tax Fees(3) | | 524 | | 326 | | 850 | | 519 | | 594 | | 1,113 | |
All Other Fees(4) | | 6 | | — | | 6 | | 3 | | — | | 3 | |
Total | | $ | 7,464 | | $ | 1,965 | | $ | 9,429 | | $ | 8,083 | | $ | 2,246 | | $ | 10,329 | |
(1) Includes $127,000 for 2005, and $162,000 for 2004, in respect of audit services for Holding.
(2) Audit related fees consist principally of fees for audits of financial statements of certain employee benefit plans, Sarbanes-Oxley Section 404 documentation assistance and internal control reviews.
(3) Tax fees consist of fees for tax consultation and tax compliance services.
(4) All other fees in 2005 and 2004 consisted of miscellaneous non-audit services.
On November 9, 2005, the Audit Committee adopted a policy to pre-approve audit and non-audit service engagements with the independent auditor. The independent auditor is to provide annually a comprehensive and detailed schedule of each proposed audit and non-audit service to be performed. The Audit Committee then affirmatively indicates its approval of the listed engagements. Engagements that are not listed, but that are of similar scope and size to those listed and approved, may be deemed to be approved, if the fee for such service is less than $100,000. In addition, the Audit Committee has delegated to its chairman the ability to approve any permissible non-audit engagement where the fees are expected to be less than $100,000.
132
PART IV
Item 15. Exhibits, Financial Statement Schedules
(a) There is no document filed as part of this Form 10-K.
Financial Statement Schedules.
Attached to this Form 10-K is a schedule describing Valuation and Qualifying Account-Allowance for Doubtful Accounts for the three years ended December 31, 2005, 2004, and 2003, and KPMG LLP’s report thereon.
(b) Exhibits.
The following exhibits required to be filed by Item 601 of Regulation S-K are filed herewith or incorporated by reference herein, as indicated:
Exhibit | | Description |
2.1 | | Agreement between Federated Investors, Inc. and Alliance Capital Management L.P. dated as of October 28, 2004 (incorporated by reference to Exhibit 2.1 to Form 10-Q for the quarterly period ended September 30, 2004, as filed November 8, 2004). |
| | |
2.2 | | Acquisition Agreement dated as of June 20, 2000 and Amended and Restated as of October 2, 2000 among Alliance Capital Management L.P., Alliance Capital Management Holding L.P., Alliance Capital Management LLC, SCB Inc., Bernstein Technologies Inc., SCB Partners Inc., Sanford C. Bernstein & Co., LLC and SCB LLC (incorporated by reference to Exhibit 2.1 to Form 10-K for the fiscal year ended December 31, 2000, as filed April 2, 2001). |
| | |
3.1 | | Amended and Restated Certificate of Limited Partnership dated February 24, 2006 of Holding (incorporated by reference to Exhibit 99.06 to Form 8-K, as filed February 24, 2006). |
| | |
3.2 | | Amendment No. 1 dated February 24, 2006 to Amended and Restated Agreement of Limited Partnership of Holding. |
| | |
3.3 | | Amended and Restated Agreement of Limited Partnership dated October 29, 1999 of Alliance Capital Management Holding L.P. (incorporated by reference to Exhibit 3.2 to Form 10-K for the fiscal year ended December 31, 2003, as filed March 10, 2004). |
| | |
3.4 | | Amended and Restated Certificate of Limited Partnership dated February 24, 2006 of AllianceBernstein (incorporated by reference to Exhibit 99.07 to Form 8-K, as filed February 24, 2006). |
| | |
3.5 | | Amendment No. 1 dated February 24, 2006 to Amended and Restated Agreement of Limited Partnership of AllianceBernstein. |
| | |
3.6 | | Amended and Restated Agreement of Limited Partnership dated October 29, 1999 of Alliance Capital Management L.P. (incorporated by reference to Exhibit 3.3 to Form 10-K for the fiscal year ended December 31, 2003, as filed March 10, 2004). |
| | |
3.7 | | Certificate of Amendment to the Certificate of Incorporation of AllianceBernstein Corporation (incorporated by reference to Exhibit 99.08 to Form 8-K, as filed February 24, 2006). |
| | |
3.8 | | AllianceBernstein Corporation By-Laws with amendments through February 24, 2006 (incorporated by reference to Exhibit 99.09 to Form 8-K, as filed February 24, 2006). |
| | |
4.1 | | Senior Indenture dated as of August 10, 2001, between Alliance Capital Management L.P. and The Bank of New York (incorporated by reference to Exhibit 4 to Form 10-Q for the quarterly period ended September 30, 2001, as filed November 14, 2001). |
| | |
10.1 | | Revolving Credit Facility dated as of February 17, 2006 among AllianceBernstein, as Borrower, Bank of America, N.A., as Administrative Agent, Banc of America Securities LLC, as Arranger, Citibank N.A. and The Bank of New York, as
Co-Syndication Agents, Deutsche Bank Securities Inc. and JPMorgan Chase Bank, N.A., as Co-Documentation Agents, and The Various Financial Institutions Whose Names Appear on the Signature Pages as “Banks”. |
| | |
10.2 | | Form of Award Agreement under the Amended and Restated Alliance Partners |
133
Exhibit | | Description |
| | Compensation Plan. |
| | |
10.3 | | Form of Award Agreement under the Alliance Commission Substitution Plan. |
| | |
10.4 | | Form of Award Agreement under the Alliance Capital Management L.P. Financial Advisor Wealth Accumulation Plan. |
| | |
10.5 | | Alliance Commission Substitution Plan, as amended and restated as of January 1, 2005. |
| | |
10.6 | | Amended and Restated Alliance Partners Compensation Plan, as amended and restated as of January 1, 2005. |
| | |
10.7 | | Alliance Capital Management L.P. Financial Advisor Wealth Accumulation Plan effective August 1, 2005 (incorporated by reference to Exhibit 99.3 to Form S-8, as filed August 5, 2005). |
| | |
10.8 | | Letter Agreement entered into by Lewis A. Sanders and Alliance Capital Management L.P. on January 4, 2005 (incorporated by reference to Exhibit 99.25(a) to Form 8-K/A, as filed January 6, 2005. |
| | |
10.9 | | Amendment to the Profit Sharing Plan for Employees of Alliance Capital Management L.P. dated as of December 28, 2005. |
| | |
10.10 | | Amendment to the Retirement Plan for Employees of Alliance Capital Management L.P., effective as of December 28, 2005. |
| | |
10.11 | | Guidelines for Transfer of Alliance Capital Management L.P. Units and Alliance Capital Management L.P. Policy Regarding Partners’ Requests for Consent to Transfer of Limited Partnership Interests to Third Parties. (incorporated by reference to Exhibit 10.3 to Form 10-K for the fiscal year ended December 31, 2004 as filed March 15, 2005). |
| | |
10.12 | | Investment Advisory and Management Agreement for MONY Life. (incorporated by reference to Exhibit 10.4 to Form
10-K for the fiscal year ended December 31, 2004 as filed March 15, 2005). |
| | |
10.13 | | Investment Advisory and Management Agreement for the General Account of AXA Equitable. (incorporated by reference to Exhibit 10.5 to Form 10-K for the fiscal year ended December 31, 2004 as filed March 15, 2005). |
| | |
10.14 | | Summary of Alliance Capital Management L.P.���s Lease at 1345 Avenue of the Americas, New York, New York 10105 (incorporated by reference to Exhibit 10.3 to Form 10-K for the fiscal year ended December 31, 2003, as filed March 10, 2004). |
| | |
10.15 | | Amendment and Complete Restatement of the Retirement Plan for Employees of Alliance Capital Management L.P. dated as of January 1, 2002 (incorporated by reference to Exhibit 10.4 to Form 10-K for the fiscal year ended December 31, 2003, as filed March 10, 2004). |
| | |
10.16 | | Amendment and Complete Restatement of the Profit Sharing Plan for Employees of Alliance Capital Management L.P. dated as of January 1, 2002 (incorporated by reference to Exhibit 10.5 to Form 10-K for the year ended December 31, 2003, as filed March 10, 2004). |
| | |
10.17 | | Amendment dated January 1, 2004 to the Profit Sharing Plan for Employees of Alliance Capital Management L.P. (incorporated by reference to Exhibit 10.7 to Form 10-K for the fiscal year ended December 31, 2003, as filed March 10, 2004). |
| | |
10.18 | | Amendment dated August 1, 2003 to the Retirement Plan for Employees of Alliance Capital Management L.P. (incorporated by reference to Exhibit 10.9 to Form 10-K for the fiscal year ended December 31, 2003, as filed March 10, 2004). |
| | |
10.19 | | Alliance Capital Management L.P. Partners Plan of Repurchase adopted as of February 20, 2003 (incorporated by reference to Exhibit 10.2 to Form 10-K for the fiscal year ended December 31, 2002, as filed March 27, 2003). |
| | |
10.20 | | Services Agreement dated as of April 22, 2001 between Alliance Capital Management L.P. and AXA Equitable (incorporated by reference to Exhibit 10.19 to Form 10-K for the fiscal year ended December 31, 2001, as filed March 28, 2002). |
134
Exhibit | | Description |
10.21 | | Registration Rights Agreement dated as of October 2, 2000 by and among Alliance Capital Management L.P., SCB Inc. and SCB Partners Inc. (incorporated by reference to Exhibit 10.17 to Form 10-K for the fiscal year ended December 31, 2000, as filed April 2, 2001). |
| | |
10.22 | | Purchase Agreement dated as of June 20, 2000 by and among Alliance Capital Management L.P., AXA Financial and SCB Inc. (incorporated by reference to Exhibit 10.18 to Form 10-K for the fiscal year ended December 31, 2000, as filed April 2, 2001). |
| | |
10.23 | | Alliance Capital Management L.P. Annual Elective Deferral Plan (incorporated by reference to Exhibit 99 to Form S-8, as filed November 6, 2000). |
| | |
10.24 | | Commercial Paper Dealer Agreement, dated as of December 14, 1999 (incorporated by reference to Exhibit 10.9 to Form 10-K for the fiscal year ended December 31, 1999, as filed March 28, 2000). |
| | |
10.25 | | Extendible Commercial Notes Dealer Agreement, dated as of December 14, 1999 (incorporated by reference to Exhibit 10.10 to the Form 10-K for the fiscal year ended December 31, 1999, as filed March 28, 2000). |
| | |
10.26 | | Amended and Restated Investment Advisory and Management Agreement dated January 1, 1999 among Alliance Capital Management Holding L.P., Alliance Corporate Finance Group Incorporated and AXA Equitable (incorporated by reference to Exhibit (a)(6) to Form 10-Q/A for the quarterly period ended September 30, 1999, as filed on September 28, 2000). |
| | |
10.27 | | Amended and Restated Accounting, Valuation, Reporting and Treasury Services Agreement dated January 1, 1999 between Alliance Capital Management Holding L.P., Alliance Corporate Finance Group Incorporated and AXA Equitable (incorporated by reference to Exhibit (a)(7) to the Form 10-Q/A for the quarterly period ended September 30, 1999, as filed September 28, 2000). |
| | |
10.28 | | Alliance Capital Management L.P. Century Club Plan (incorporated by reference to Exhibit 4.3 to Form S-8, as filed July 12, 1993). |
| | |
10.29 | | Alliance Capital Accumulation Plan (incorporated by reference to Exhibit 10.11 to Form 10-K for the fiscal year ended December 31, 1988, as filed March 31, 1989). |
| | |
10.30 | | Alliance Partners Plan (incorporated by reference to Exhibit 10.12 to Form 10-K for the fiscal year ended December 31, 1988, as filed March 31, 1989). |
| | |
12.1 | | AllianceBernstein Consolidated Ratio of Earnings to Fixed Charges in respect of the years ended December 31, 2005, 2004, and 2003. |
| | |
21.1 | | Subsidiaries of AllianceBernstein. |
| | |
23.1 | | Consents of KPMG LLP. |
| | |
24.1 | | Power of Attorney of Dominique Carrel-Billiard. |
| | |
24.2 | | Power of Attorney of Henri de Castries. |
| | |
24.3 | | Power of Attorney of Christopher M. Condron. |
| | |
24.4 | | Power of Attorney of Denis Duverne. |
| | |
24.5 | | Power of Attorney of Roger Hertog. |
| | |
24.6 | | Power of Attorney of Weston M. Hicks. |
| | |
24.7 | | Power of Attorney of W. Edwin Jarmain. |
| | |
24.8 | | Power of Attorney of Gerald M. Lieberman. |
| | |
24.9 | | Power of Attorney of Nicolas Moreau. |
| | |
24.10 | | Power of Attorney of Lorie A. Slutsky. |
| | |
24.11 | | Power of Attorney of A.W. (Pete) Smith. |
| | |
24.12 | | Power of Attorney of Peter J. Tobin. |
135
Exhibit | | Description |
24.13 | | Power of Attorney of Stanley B. Tulin. |
| | |
31.1 | | Certification of Mr. Sanders is being furnished pursuant to Section 302 of the Sarbanes-Oxley Act of 2002. |
| | |
31.2 | | Certification of Mr. Joseph is being furnished pursuant to Section 302 of the Sarbanes-Oxley Act of 2002. |
| | |
32.1 | | Certification of Mr. Sanders is being furnished pursuant to 18 U.S.C. Section 1350, as adopted pursuant to Section 906 of the Sarbanes-Oxley Act of 2002. |
| | |
32.2 | | Certification of Mr. Joseph is being furnished pursuant to 18 U.S.C. Section 1350, as adopted pursuant to Section 906 of the Sarbanes-Oxley Act of 2002. |
136
SIGNATURES
Pursuant to the requirements of Section 13 or 15(d) of the Exchange Act, the Registrant has duly caused this report to be signed on its behalf by the undersigned, thereunto duly authorized.
| ALLIANCEBERNSTEIN HOLDING L.P. |
| |
| |
Date: February 24, 2006 | By: | /s/ Lewis A. Sanders | |
| | Lewis A. Sanders | |
| | Chairman of the Board
and Chief Executive Officer | |
Pursuant to the requirements of the Exchange Act, this report has been signed by the following persons on behalf of the Registrant and in the capacities and on the dates indicated.
Date: February 24, 2006 | | /s/ Robert H. Joseph, Jr. | |
| | Robert H. Joseph, Jr. | |
| | Senior Vice President and
Chief Financial Officer | |
| | | |
| | /s/ Edward J. Farrell | |
Date: February 24, 2006 | | Edward J. Farrell | |
| | Senior Vice President and
Chief Accounting Officer | |
DIRECTORS
/s/ Lewis A. Sanders | | * | |
Lewis A. Sanders | | W. Edwin Jarmain | |
Chairman of the Board | | Director | |
| | | |
/s/ Dominique Carrel-Billiard | | /s/ Gerald M. Lieberman | |
Dominique Carrel-Billiard | | Gerald M. Lieberman | |
Director | | Director | |
| | | |
/s/ Christopher M. Condron | | * | |
Christopher M. Condron | | Nicolas Moreau | |
Director | | Director | |
| | | |
/s/ Henri de Castries | | /s/ Lorie A. Slutsky | |
Henri de Castries | | Lorie A. Slutsky | |
Director | | Director | |
| | | |
/s/ Denis Duverne | | * | |
Denis Duverne | | A.W. (Pete) Smith | |
Director | | Director | |
| | | |
/s/ Roger Hertog | | /s/ Peter J. Tobin | |
Roger Hertog | | Peter J. Tobin | |
Director | | Director | |
| | | |
/s/ Weston M. Hicks | | /s/ Stanley B. Tulin | |
Weston M. Hicks | | Stanley B. Tulin | |
Director | | Director | |
| | | |
/s/ Laurence E. Cranch | | | |
Laurence E. Cranch | | | |
(*Attorney-in-fact) | | | |
SCHEDULE II
AllianceBernstein L.P.
Valuation and Qualifying Account - Allowance for Doubtful Accounts
For the Three Years Ending December 31, 2005, 2004 and 2003
Description | | Balance at
Beginning of
Period | | Charged to
Costs and
Expenses | | Deductions | | Balance at End
of Period | |
| | (in thousands) | |
| | | | | | | | | |
For the year ended December 31, 2003 | | $ | 2,137 | | $ | 1,839 | | $ | 1,054 | (a) | $ | 2,922 | |
| | | | | | | | | |
For the year ended December 31, 2004 | | $ | 2,922 | | $ | — | | $ | 1,215 | (b) | $ | 1,707 | |
| | | | | | | | | |
For the year ended December 31, 2005 | | $ | 1,707 | | $ | 55 | | $ | 823 | (c) | $ | 939 | |
(a) Accounts written-off as uncollectible.
(b) Includes accounts written-off as uncollectible of $1,115 and reduction of allowance balance of $100.
(c) Includes accounts written-off as uncollectible of $123 and reduction of allowance balance of $700.