UNITED STATES SECURITIES AND EXCHANGE COMMISSION
WASHINGTON, D.C. 20549
Form 10-K
(Mark One)
| | þ | ANNUAL REPORT PURSUANT TO SECTION 13 OR 15(d)OF THE SECURITIES EXCHANGE ACT OF 1934 |
For the fiscal year ended December 31, 2008
OR
| | ¨ | TRANSITION REPORT PURSUANT TO SECTION 13 OR 15(d) OF THE SECURITIES EXCHANGE ACT OF 1934 |
For the transition period from to
Commission file number 000-17157
Novellus Systems, Inc.
(Exact name of Registrant as specified in its charter)
| | |
| California | | 77-0024666 |
(State or other jurisdiction of incorporation of organization) | | (I.R.S. Employer Identification Number) |
| |
4000 North First Street San Jose, California | | 95134 |
| (Address of principal executive offices) | | (Zip code) |
Registrant’s telephone number, including area code; (408) 943-9700
Securities registered pursuant to Section 12(b) of the Act
| | |
Title of Each Class | | Name of Each Exchange on Which Registered |
Common Stock, no par value | | The NASDAQ Stock Market LLC (NASDAQ Global Select Market) |
Securities registered pursuant to Section 12(g) of the Act:
None
Indicate by check mark if the Registrant is a well-known seasoned issuer, as defined in Rule 405 of the Securities Act. Yes þ No ¨
Indicate by check if the Registrant is not required to file reports pursuant to Section 13 or Section 15(d) of the Exchange Act. Yes ¨ No þ
Indicate by check mark whether the Registrant (1) has filed all reports required to be filed by Section 13 or 15(d) of the Securities Exchange Act of 1934 during the preceding 12 months (or for such shorter period that the Registrant was required to file such reports), and (2) has been subject to such filing requirements for the past 90 days. Yes þ No ¨
Indicate by check mark if disclosure of delinquent filers pursuant to Item 405 of Regulation S-K is not contained herein, and will not be contained, to the best of Registrant’s knowledge, in definitive proxy or information statements incorporated by reference in Part III of this Form 10-K or any amendment to this Form 10-K. ¨
Indicate by check mark whether the Registrant is a large accelerated filer, an accelerated filer, a non-accelerated filer, or a smaller reporting company. See the definitions of “large accelerated filer,” “accelerated filer” and “smaller reporting company” in Rule 12b-2 of the Exchange Act. (Check one):
| | | | | | | | |
| | Large accelerated filer þ | | Accelerated filer ¨ | | Non-accelerated filer ¨ | | Smaller reporting company ¨ |
| | | | | | (Do not check if a smaller reporting company) |
Indicate by check mark whether the Registrant is a shell company (as defined in Rule 12b-2 of the Exchange Act). Yes ¨ No þ
As of June 28, 2008 the aggregate market value of voting and non-voting stock held by non-affiliates of the Registrant was $1,650,341,387 based on the average of the high and low price of the Common Stock as reported on the NASDAQ National Market on such date.
The number of shares of the Registrant’s Common Stock outstanding on February 24, 2009 was 97,075,923.
DOCUMENTS INCORPORATED BY REFERENCE
Part III of this Annual Report on Form 10-K incorporates information by reference from the Registrant’s Proxy Statement for its 2009 Annual Meeting of Shareholders. Except as expressly incorporated by reference, the Registrant’s Proxy Statement shall not be deemed to be a part of this Annual Report on Form 10-K.
NOVELLUS SYSTEMS, INC.
2008 ANNUAL REPORT ON FORM 10-K
TABLE OF CONTENTS
PART I
The following information should be read in conjunction with the Consolidated Financial Statements and notes thereto included in this Annual Report on Form 10-K.
The Company
Novellus Systems, Inc. is a California corporation organized in 1984. Novellus primarily develops, manufactures, sells and supports equipment used in the fabrication of integrated circuits, commonly called chips or semiconductors. Customers for this equipment manufacture chips for sale or for incorporation in their own products, or provide chip-manufacturing services to third parties. Novellus also develops, manufactures, sells and supports grinding, lapping and polishing equipment for a broad spectrum of industrial applications.
Novellus operates in two reportable segments, the Semiconductor Group and the Industrial Applications Group. A summary of financial information for each operating segment is found in Note 15 of the Notes to Consolidated Financial Statements.
Semiconductor Group
The Semiconductor Group is a manufacturer and supplier of thin film deposition, surface preparation and chemical mechanical planarization (CMP) systems used in the fabrication of integrated circuits. Net sales for the Semiconductor Group operating segment constituted 83%, 89% and 93% of our consolidated net sales for the years ended December 31, 2008, 2007 and 2006, respectively.
For more than twenty years the semiconductor industry has grown rapidly as a result of increasing demand for personal computers, the expansion of the Internet and the telecommunications industry, and the emergence of new high technology products for the consumer. In recent years, growth has moderated and there are signs that the industry has matured. In 2009, unit demand for semiconductors is likely to fall for the first time since 2001, leading to a decline in semiconductor revenues and an increase in semiconductor inventories. This further increases the pressure on semiconductor manufacturers to carefully match capacity with demand which has lowered their spending on capital equipment in 2009. However, in keeping with the historical cyclical nature of the industry, chip unit growth is expected to resume in 2010 and beyond, and with it, spending on semiconductor equipment. Semiconductor equipment is a major factor in the cost structure of the semiconductor industry, and there is growing pressure on chip manufacturers to reduce manufacturing costs while increasing the performance of their products. The semiconductor industry has also been historically cyclical, with periods of rapid expansion followed by periods of over-capacity.
Several technological trends characterize integrated circuit manufacturing. Perhaps the most prominent of those trends is the increasing density of the integrated circuit. Moore’s Law, first postulated in the mid-1960s and still substantially accurate more than 40 years later, states that the density of the circuitry on an individual semiconductor chip doubles every 18 months. Today’s advanced devices are being manufactured with line widths as small as 32 nanometers, with up to eleven layers of interconnected circuitry. By increasing circuit density, manufacturers can layer more electronic components on a given surface area, and thereby provide higher performance at about the same cost.
Another trend worth noting is the transition to copper from aluminum wiring as the primary conductive material in semiconductor devices. Copper has a lower electrical resistance value than aluminum, and provides a number of performance advantages. Because of the superior properties of copper, a device made with copper typically requires fewer metal layers than one made with aluminum, providing a considerable reduction in manufacturing cost. In comparison to aluminum, copper wiring also allows a substantial improvement in device speed and a
2
significant reduction in device power consumption. Copper interconnects were initially implemented in logic devices, but have been migrating into memory devices over the past few years.
A similar transition is underway from traditional insulating films made of silicon oxide to insulators with a low dielectric constant, or “low-k.” Low-k dielectrics reduce the capacitance between metal lines in a device, increasing speed and lowering power consumption. However, low-k materials are more fragile than silicon oxide, and this poses a host of new challenges to the industry in integrating the new materials into existing manufacturing processes.
Another trend in the industry is to continue to increase the wafer size. Semiconductor device manufacturers have migrated to 300mm wafers because of the manufacturing cost advantages in comparison to 200 mm wafers. The 300mm wafers provide in excess of 2.25 times the number of chips per wafer and significant economies of scale in the manufacturing process. Approximately 82% of our 2008 net orders for wafer fabrication equipment were for 300mm wafer manufacturing.
These trends shape the equipment and process demands of our device-manufacturing customers. These customers generally measure the cost and performance of their production equipment in terms of “cost per wafer,” a ratio determined by factoring in the costs for acquisition and installation of a system, its operating costs, and net throughput rate. In a fixed period of time, a system with higher net throughput allows a manufacturer to recover the purchase price over a greater number of wafers, thereby reducing the cost of ownership of the system on a per-wafer basis. Yield and film qualities are also significant factors in selecting processing equipment. The increased cost of larger and more complex semiconductor wafers has made high yields extremely important to customers. To achieve higher yields, systems must be able to deposit high quality films repeatably, consistently and reliably. Systems that operate at desired throughput rates with wide process windows can achieve repeatability more easily than those with narrow process windows.
Semiconductor Business Strategy
It is Novellus’ business objective to increase our market share in semiconductor manufacturing process equipment sold to the semiconductor industry. The following are the key elements of our strategy:
Emphasize High-Productivity Systems — We established our current position in the industry by emphasizing high productivity as the principal benefit that our products and technologies deliver to customers. Our unique multi-station sequential processing architecture, which is incorporated in many of our products, is an example of our commitment to providing superior productivity and manufacturing repeatability. We intend to retain our historical focus on productivity by applying our multi-station sequential architecture in product enhancements and new product offerings.
Be Recognized for our Technology in our Served Available Markets — In the new era of nanoelectronics manufacturing, technology becomes critically important given the difficulties in manufacturing chips at ever smaller line widths. It is our strategy to anticipate the technologies that customers need, and design innovative products which will enhance their manufacturing capabilities.
Focus on Reducing Customer Costs — Cost is an important component when measuring overall productivity. We strive to provide products and technologies that reduce our customers’ overall cost of ownership by continuing to increase our systems throughput, improving our deposition quality and improving the reliability of our products.
Broaden our Interconnect Offerings — As semiconductor manufacturing technology becomes more complex, the interconnect structures on a device become more critical to overall performance. Beginning in 2001, we expanded beyond deposition technology and into dry photoresist removal and chemical-mechanical polish. In addition, in 2005 we introduced our ultraviolet thermal processing (UVTP) system for
3
post deposition treatment of films to control stress and improve mechanical integrity. Other areas may offer the opportunity for future product portfolio expansion.
Differentiate our Service— A vital element of success in the systems business is the service, repair and ongoing support of those systems. We operate a global network of customer support services that provide 24-hour access to technical experts, documentation, spare parts, and product upgrades. We provide training and support programs that are custom-tailored to the needs of individual customers, ranging from turnkey maintenance solutions to economical self-maintenance plans.
Expand Operational and Customer Support Presence in Asia — In the fourth quarter of 2006 we announced the establishment of Novellus International Systems, BV in Singapore as our new international headquarters for systems sales. This change more closely aligns our operational structure with our customer base. We have offices in the key locations necessary to compete, and are actively increasing our worldwide sourcing of materials to this region as well.
Leverage our Low-Cost Manufacturing Structure — We perform all system design, assembly and testing in-house, and outsource the manufacture of most subassemblies. Our manufacturing strategy allows us to minimize our overhead costs and capital expenditures and gives us flexibility to increase capacity as needed. Outsourcing also allows us to focus on product differentiation through system design and quality control, and helps to ensure that our subsystems incorporate the latest third-party technologies in robotics, gas panel designs and power supplies. We work closely with our suppliers to achieve cost reduction through joint development projects.
Semiconductor Products
The Semiconductor Group’s products include equipment used in the deposition of thin dielectric (insulating) and metal (conductive) films, as well as equipment used in complimentary manufacturing steps including surface preparation (photoresist strip), ultraviolet thermal processing (film annealing) and chemical-mechanical planarization (polishing). Integrated circuits are generally built on a silicon wafer substrate, and include a large number of different components such as transistors, capacitors and other electronic devices. These components are connected on the silicon wafer by multiple layers of wiring, called interconnects. To build an integrated circuit, transistors are first fabricated on the surface of the silicon wafer. Wiring and insulating structures are then added as alternating thin-film layers in a series of manufacturing process steps. Typically, a first layer of dielectric material is deposited on top of the transistors. If the conductive material used is aluminum, subsequent metal layers are deposited on top of this base layer, etched to create the conductive lines that carry the electricity, and then covered with dielectric material to create the necessary insulation between the lines. Following each deposition step, a planarization or polishing process is employed to achieve a flat surface for the manufacturing steps that follow. To construct copper wires, the manufacturing process used is a mirror image of that described for aluminum: the dielectric is etched and the copper wiring is deposited within the etched insulator. Building either copper or aluminum wiring requires these manufacturing steps to be repeated many times. Advanced chip designs may require more than 500 process steps.
Novellus semiconductor manufacturing products are used in a number of different process steps. Our advanced deposition systems use chemical vapor deposition (CVD), physical vapor deposition (PVD), and electrochemical deposition (ECD) processes to form the interconnects in an integrated circuit. Our High-Density Plasma CVD (HDP-CVD) and Plasma-Enhanced CVD (PECVD) systems employ chemical plasma to deposit dielectric material within the gaps formed by the etching of aluminum, or as a blanket film which can be etched with patterns for depositing conductive materials into the etched dielectric. Our CVD Tungsten systems are used to deposit small tungsten conductive lines or plugs between layers of metal. Our PVD systems deposit conductive aluminum and copper metal layers by sputtering metal atoms from the surface of a target source. Our Electrofill™ ECD systems deposit copper to form the conductive wiring on integrated circuits using copper interconnects.
4
Deposition Technologies
Our historical strength is rooted in deposition products. We currently offer products that address the needs of manufacturers across a number of different deposition technologies — CVD, PVD and ECD.
Since the introduction of our Concept One® dielectric platform in 1987, we have offered a range of processing systems for dielectric and metal deposition. In 1991, we introduced the Concept Two® platform — a modular, integrated production system capable of depositing both dielectric and conductive metal layers by combining one or more processing chambers with a common, automated wafer handler. The Concept Two enabled semiconductor device manufacturers to increase production throughput and system capability by adding process modules without having to replace existing equipment. In 1997, we introduced the Concept Three® platform, which built on the foundation of the Concept Two and offer greater throughput in 300mm wafer manufacturing applications.
CVD Products
In the CVD process, manufacturers place wafers in a reaction chamber, introduce a variety of pure and precisely metered gases into the chamber, and then add a form of energy to activate a chemical reaction that deposits a film on the wafers. The CVD process is the traditional method used to deposit dielectric films on wafers. Manufacturers also use CVD to deposit conductive metal layers, particularly tungsten, as it is difficult to deposit such layers on devices with very small features when using conventional PVD or other deposition technologies.
HDP CVD Products
SPEED® NExT — Introduced in 2004, the SPEED NExT system for 300mm wafers is designed specifically to address the challenges of dielectric gap fill at 65 nanometers and beyond.
SPEED Max —Introduced in 2008, SPEED Max offers significant processing flexibility and productivity advantages over the SPEED NExT system, and extends the HDP CVD application to the 45 and 32 nm technology nodes.
W-CVD Products
ALTUS® DirectFill — Introduced in 2004, the ALTUS DirectFill tungsten nitride/tungsten deposition system is designed for advanced contact and via-fill applications at 65 nanometers and below. ALTUS DirectFill simplifies the tungsten deposition process by replacing the standard multi-tool approach with a single three-module system.
ALTUS Max —Introduced in 2008, the ALTUS Max CVD tungsten deposition system delivers advanced contact and via fill technology in a high-productivity platform that delivers more than 120 wafers-per-hour throughput, an industry first.
PECVD Products
VECTOR® —Introduced in 2000, VECTOR is a PECVD system for depositing dielectric films on 300mm wafers. In 2007, we introduced three new versions of VECTOR: the VECTOR Express™, optimized for deposition of thin films of less than 1000 angstroms; the VECTOR Express AHM for ashable hard mask film deposition; and the VECTOR Extreme™, designed for the demands of high-volume memory “megafabs.” In 2008, we rounded out the VECTOR product family, introducing a new model of VECTOR Extreme to deposit AHM films.
5
UVTP Products
SOLA® — Introduced in 2005, SOLA is a UVTP system used for the low-temperature, post-deposition treatment of dielectric films. SOLA is designed for advanced materials such as high stress nitrides and porous low-k dielectrics that are used to deliver increased device speeds and lower power consumption in sub-90 nanometer chips.
PVD Products
PVD, also known as “sputtering,” is a process in which ions of an inert gas such as argon are electrically accelerated in a high vacuum toward a target of pure metal, such as tantalum or copper. Upon impact, the argon ions sputter off the target material, which is then deposited as a thin film on the silicon wafer. PVD processes are used to create the barrier and seed layers in copper damascene interconnect applications, as well as conductive aluminum wires in a subtractive aluminum manufacturing process. We entered the PVD marketplace in 1997 with the acquisition of Varian Associates’ Thin Film Systems Division.
INOVA® NExT — In 2005, we introduced the INOVA NExT, a 300mm metallization system designed to deposit highly conformal copper barrier-seed films at 45 nanometers and beyond. On the INOVA NExT the single target Hollow Cathode Magnetron (HCM) technology has been extended to the 45 nanometer node.
INOVA NExT HCM IONX — The latest variant of the INOVA platform, introduced in 2007, incorporates a copper resputtering technology called HCM IONX to improve copper seed conformality, eliminate low-k dielectric damage, and extend PVD technology for seed deposition applications at 32 nm.
ECD Products
Our Electrofill products are used to build the copper primary conductive wires in advanced integrated circuits. Electrofill uses a copper electrolytic solution to create lines and vias in a dielectric layer which has been etched with the pattern of the circuitry, in a process called copper damascene.
SABRE® NExT — Introduced in 2003, the SABRE NExT builds on the SABRE xT’s production track record, offering a proprietary chemistry, a new anode cell design and other hardware refinements to tackle the complex process requirements of 90 nanometer, 65 nanometer and 45 nanometer interconnect structures.
SABRE Extreme — In July 2006, we introduced the SABRE Extreme, an advanced Electrofill system that has been qualified at 45 nanometers and has demonstrated fill at 32 nanometers. The SABRE Extreme incorporates a number of technological innovations for advanced manufacturing applications, including advanced wafer entry control for thin seed layers (< 200A), tunable profile control for improved uniformities, and the capability to plate on materials other than copper.
Surface Preparation Technologies
Chip manufacturers use surface preparation products to remove photoresist from a wafer before proceeding with the next deposition step in the manufacturing process.
GAMMA® Express — The GAMMA Express, introduced in 2006, is a high productivity resist strip system designed to meet the technology requirements for 45 nanometer manufacturing. GAMMA Express performs high dose implant strip (HDIS) and incorporates non-oxidizing processes for advanced silicides and low-k dielectric films. The redesigned GAMMA Express platform offers a new direct-drive wafer handling subsystem, as well as a new high ash rate source.
G400® and GxT® — Introduced in 2008, the G400 and GxT are based on the production-proven, market-leading GAMMA platform. Targeted for bulk strip and high-dose implant strip (HDIS) applications, the G400 is the industry’s most productive ashing system, with throughputs of over 400 wafers-per-hour. The GxT, in turn, is designed for critical logic device manufacturing process steps that demand low silicon loss and ultra-low defectivity.
6
CMP Technologies
CMP systems polish the surface of a wafer after a deposition step in order to create a planar surface before moving on to subsequent manufacturing steps. Since copper films are more difficult to polish than the tungsten and oxide films used in previous-generation aluminum interconnects, and since low-k dielectrics are much more porous than their predecessors, CMP has been elevated to the forefront of the enabling technologies required in a copper damascene manufacturing process. In recognition of this trend, in 2002 Novellus acquired SpeedFam-IPEC; a global supplier of CMP systems used in the fabrication of advanced copper interconnects. We believe that the opportunity to understand the interactions between planarization, deposition and surface preparation steps and to optimize them for overall performance gives us an important advantage in extending copper and low-k processes to advanced semiconductor devices.
XCEDA® — Introduced in 2004, the XCEDA copper CMP system is an advanced 300mm platform designed to exceed both the technical and economic requirements of CMP at 65 nanometers and beyond. The XCEDA system incorporates four polishing modules and a through-the-pad slurry delivery system to reduce consumable costs.
Refurbished Systems
Novellus also provides the market with a comprehensive suite of refurbished process equipment that is sold and serviced through the existing Novellus channel. The market focus of our Refurbished Systems Business (RSB) is 200 mm factories manufacturing lower-cost products, typically at device geometries that are greater than 150 nm. To meet these needs, Novellus offers a number of older products, including legacy SPEED, ALTUS, SEQUEL® Express, INOVA, SABRE, GAMMA, and MOMENTUM® models. In comparison to buying a used system from an aftermarket vendor, purchasing a refurbished system from Novellus offers a number of benefits for our customers, including committed performance specifications, systems and service knowledge and expertise, and comprehensive spare parts knowledge and support.
Industrial Applications Group
Novellus entered into market sectors beyond semiconductor manufacturing in 2004 with the acquisition of Peter Wolters AG (Peter Wolters), a German company specializing in high-precision machines for grinding, deburring, lapping, honing and polishing the outer surfaces of parts made of metal, glass, ceramic, plastic, silicon or similar materials. In 2005, we acquired Voumard Machine Co. SA (Voumard), a manufacturer of high-precision machine tools based in Neuchatel, Switzerland. The Voumard acquisition expanded our Industrial Applications product offerings to include specialized, high-precision grinding equipment for precision machining of inner and outer diameter surfaces. Our customers for this segment are manufacturers in sectors such as automotive, aircraft, and electronic products, parts and components. Other customers are in the glass and ceramics industries as well as manufacturers of products such as pumps, transmissions, compressors and bearings. In all of these areas, the demand for close tolerances for finish quality, thickness, flatness and parallelism is high. Net sales for the Industrial Applications Group operating segment constituted 17%, 11% and 7% of our consolidated net sales for the years ended December 31, 2008, 2007 and 2006, respectively.
Our industrial product range includes single-side machines, double-side machines, which operate in batch process mode, and thru-feed grinding machines and deburring systems that feature a continuous feed of parts to be processed.
Marketing, Sales and Service
We rely on a direct sales force to sell our chip manufacturing products in the geographic regions where semiconductors are manufactured, including Europe, the United States, Korea, Japan, China, Taiwan, and Southeast Asia. Our Industrial Applications products are sold through a combination of a direct sales force and manufacturer’s representatives.
7
The ability to provide prompt and effective field service support is critical to our sales efforts, and we believe the support that we provide to our installed base has accelerated the penetration of certain key accounts. We also believe that our marketing efforts are enhanced by the technical expertise of our research and development personnel, who provide customer process applications support and participate in a number of industry forums, conferences and technical symposia.
Customers
Intel and Samsung each separately accounted for 15%, 11% and 13% of our consolidated net sales for the years ended December 31, 2008, 2007 and 2006, respectively. Sales to our ten largest customers in 2008, 2007, and 2006 accounted for 60%, 59%, and 63% of our net sales, respectively. We expect that sales of our products to relatively few customers, none of which has entered into long-term agreements requiring them to purchase our products, will continue to account for a high percentage of our net sales in the foreseeable future. Information on our net sales to unaffiliated customers and long-lived assets attributable to geographic regions is included in Note 15 of the Notes to Consolidated Financial Statements.
Backlog
As of December 31, 2008, our backlog was $188.3 million. Subsequent to year-end, we have had $4.9 million in customer cancellations in the period from January 1, 2009 to February 24, 2009. As of December 31, 2007, our backlog was $354.5 million. Our backlog includes systems, spares and services transactions for which we have accepted purchase orders and assigned shipment or delivery dates within twelve months. All orders are subject to cancellation or rescheduling by customers, with limited or no penalties. Some products are shipped in the same quarter in which the order was received. For this reason, and because of possible changes in delivery schedules, cancellations of orders and delays in shipments, our backlog as of any particular date is not necessarily a reliable indicator of actual shipments for any succeeding period.
Research and Development
The highly cyclical semiconductor manufacturing industry is subject to rapid technological change and continual new product introductions and enhancements. Our ability to remain competitive depends on our success in developing new and enhanced systems, and introducing them at competitive prices on a timely basis. For this reason, we devote a significant portion of our personnel and financial resources to research and development programs.
Our research and development efforts are directed at developing new systems and processes and improving the capabilities of existing systems. Research and development programs include advanced CVD, PVD and ECD systems, advanced gap fill technology, primary conductor metals, low-k dielectric materials, CMP systems and additional advanced deposition and surface preparation technologies for the next generation of smaller-geometry fabrication lines. All new systems under development are capable of processing 300mm wafers.
In the Industrial Applications Group, we focus our research activities on developing new products and improving existing products for the prime wafer industry (wafer lapping and grinding, double side polishing, haze-free polishing) as well as for the metal and ceramic industry (grinding, lapping, deburring). Continuous improvements of existing systems and processes enable us to further meet our customer’s requirements as specifications for work piece tolerances continue to tighten. With new mechatronic concepts we will be able to control the process conditions in our systems more accurately and achieve better results at lower costs. New products and processes are developed to provide solutions for further production steps beside those that are already covered by our systems. We are also investigating new technologies in high precision machining and surface finishing to extend our existing product portfolio and maintain our technical leadership.
8
Expenditures for research and development during 2008, 2007, and 2006 were $219.7 million, $241.0 million, and $244.2 million, respectively. These expenditures represented approximately 22% of our net sales in 2008 and 15% of our net sales in both 2007 and 2006. We believe that research and development expenditures will continue to represent a substantial percentage of our net sales in the future.
Manufacturing
In the Semiconductor Group we manufacture our systems in clean-room environments similar to those used by semiconductor manufacturers for semiconductor device fabrication, which helps to minimize the amount of particulates and other contaminants in the final assembled system and to improve product yields for our customers. Following assembly we package our completed systems in vacuum packaging to maintain clean-room standards for particulates and other contaminants during shipment. The Industrial Applications Group assembles their systems in a cleaner environment than conventional machine tools, as the precision requirements in our niche markets call for clean components with reduced particle levels.
Our manufacturing activities consist primarily of assembling and testing components and subassemblies that we acquire from third-party vendors and then integrate into a finished system. We outsource most subassemblies, and we perform all system design, assembly and testing in-house. Our outsourcing strategy enables us to minimize fixed costs and capital expenditures, and provides us with the flexibility to increase production capacity. This strategy also allows us to focus on product differentiation through system design and quality control. We believe that our use of outsourced product specialists enables our subsystems to incorporate the latest and most advanced technologies in robotics, gas panel designs and power supplies without the need for in-house expertise. We strive to work as closely as possible with all of our suppliers to achieve mutual cost reduction through joint development efforts. Certain raw materials we use in the manufacturing of our products are available from a limited number of suppliers. Shortages could occur in these essential materials due to an interruption of supply or solvency of our suppliers.
Competition
We believe that we compete favorably in both of our operating segments because of the fundamental advantages associated with our system performance and flexibility, low cost of ownership, high wafer yields and customer support. Significant competitive factors in the semiconductor equipment market include system performance and flexibility, cost, the size of each manufacturer’s installed customer base, customer support capabilities and the breadth of a company’s product line. However, we face substantial competition from both established competitors and potential new entrants in each of these markets. Installing and integrating capital equipment into a semiconductor production line represents a substantial investment. For this reason, once a manufacturer chooses a particular vendor’s capital equipment, experience has shown that the manufacturer will generally rely upon that equipment for the useful life of the specific application. As a result, all of today’s semiconductor equipment makers typically have difficulty in selling a product to a particular customer to replace or substitute for a competitor’s product previously chosen or qualified by that customer.
In the CVD, PECVD, HDP and PVD markets, our principal competitor is Applied Materials, Inc. (Applied), a major supplier of systems that has established a substantial base of installed equipment among today’s semiconductor manufacturers. In the PECVD market, we also compete against ASM International. In the ECD market, our principal competitors are Applied and Semitool, Inc. Our principal competitors in the surface preparation product arena are Mattson Technologies, Inc. and PSK, Inc. In the CMP market, our major competitors are Applied and Ebara Corporation.
The primary competitive factors in the market for machine tools are reliability, price, delivery time, service and technological characteristics. Manufacturers can be categorized by the size of material their products can machine and the precision level they can achieve. The Industrial Applications Group’s primary competition comes from several Japanese, German, Taiwanese and Korean manufacturers.
9
Patents and Proprietary Rights
We intend to continue to pursue patent and trade secret protection for our technology. We currently hold 713 patents. We have many pending patent applications, and we intend to file additional patent applications as appropriate. There can be no assurance that patents will be issued from any of these pending applications or future filings, or that any claims allowed from existing or pending patents or future patent applications will be sufficiently broad to protect our technology. While we intend to vigorously protect our intellectual property rights, there can be no assurance that any patents we hold will not be challenged, invalidated or circumvented, or that the patent rights granted will provide competitive advantages to us. See Part I, Item 3. “Legal Proceedings,” for further discussion.
We also rely on trade secrets and proprietary technology that we protect through confidentiality agreements with employees, consultants and other parties. There can be no assurance that these parties will not breach those agreements, that we will have adequate remedies for any breach, or that our trade secrets will not otherwise become known to or independently developed by others.
There has been substantial litigation regarding patent and other intellectual property rights in semiconductor-related industries. We are currently involved in such litigation. Except as set forth in Item 3. Legal Proceedings, we are not aware of any significant claim of infringement by our products of any patent or proprietary rights of others; however, we could become involved in additional litigation in the future. Although we do not believe the outcome of current litigation will have a material impact on our business, financial condition or results of operations, no assurances can be given that current or future litigation will not have such an impact. For further discussion, see Part I, Item 3. Legal Proceedings.
Our operations, including the further commercialization of our products, could provoke claims of infringement from third parties. In the future, litigation may be necessary to enforce patents issued to us, to protect trade secrets or know-how that we own, to defend ourselves against claimed infringement of the rights of others, or to determine the scope and validity of the proprietary rights of others. Any such litigation could result in substantial cost and diversion of efforts and could have a material adverse effect on our financial condition or operating results. In addition, adverse determinations in such litigation could result in loss of our proprietary rights, subject us to significant liabilities to third parties, and require us to seek licenses from third parties, or prevent us from manufacturing or selling our products. Any of these occurrences could have a material adverse effect on our business, financial condition or results of operations.
Employees
On December 31, 2008, we had 3,048 full-time and temporary employees. Certain employees outside of the United States in the Industrial Applications Group are represented by labor unions. We have never experienced a work stoppage, slowdown or strike. We consider our employee relations to be good. The success of our future operations depends in large part on our ability to recruit and retain senior management, engineers, sales and service professionals and other key personnel.
Environmental Matters
Neither compliance with federal, state and local provisions regulating discharge of materials into the environment, nor remedial agreements or other actions relating to the environment, has had, or is expected to have, a material effect on our capital expenditures, financial condition, and results of operations or competitive position.
10
Available Information
The headquarters of Novellus Systems, Inc. is located at 4000 North First Street, San Jose, California 95134. The main telephone number is (408) 943-9700.
Additional information about Novellus is available on our web site atwww.novellus.com.Annual Reports on Form 10-K, Quarterly Reports on Form 10-Q, and Current Reports on Form 8-K, as well as amendments to those reports, filed or furnished pursuant to Section 13(a) or 15(d) of the Securities Exchange Act of 1934, as amended (Exchange Act) are available on the web site free of charge. These reports are available as soon as reasonably practicable after we electronically file them with the Securities and Exchange Commission (SEC). Information contained on the web site is not part of this Annual Report on Form 10-K or of our other filings with the SEC.
Set forth below and elsewhere in this Annual Report on Form 10-K, and in other documents we file with the SEC, are risks and uncertainties that could cause actual results to differ materially from the results expressed or implied by the forward-looking statements contained in this Annual Report.
Recent deterioration in the global economy and credit markets has affected and may continue to adversely affect our results of operations.
Our operations have been adversely affected by the recent deterioration in the global economy causing our customers to delay or discontinue spending on our products. Continuation of the economic downturn may further negatively impact our operations by affecting the solvency of our customers, the solvency of our key suppliers, or the ability of our customers to obtain credit to finance purchases of our products. If the global economy and credit markets continue to deteriorate or do not improve and our future sales continue to decline, our financial condition and results of operations could be adversely impacted.
Downturns in the semiconductor industry negatively impact demand for our equipment.
Our business depends predominantly on the capital expenditures of semiconductor manufacturers, which in turn depend on current and anticipated market demand for integrated circuits and the products that use them. The semiconductor industry has historically been cyclical and has experienced periodic downturns that reduced the demand for semiconductor processing equipment, including equipment that we manufacture and market. During periods of reduced and declining demand, we must be able to quickly and effectively align our costs with prevailing market conditions, and at the same time motivate and retain key employees and maintain a stable management team. During periods of reduced demand, our inventory levels have at times been higher than optimal and our gross margins have at times been lower than optimal due to lower production volumes. We cannot provide any assurance that we will not be required to make inventory valuation adjustments in future periods. During periods of rapid growth, we must be able to acquire or develop sufficient manufacturing capacity, and hire and assimilate a sufficient number of qualified people to meet customer demand. Net orders, net sales and operating results may be adversely affected and result in additional workforce reductions if we fail to respond to changing industry conditions in a timely and effective manner. We experienced a decrease in bookings in each successive quarter during 2008. We could continue to experience decreases in bookings in the foreseeable future, and as a result, our net sales and operating results may be adversely affected. In the period from 2001 through 2006, we implemented restructuring plans to align our business with fluctuating conditions. In 2008 we implemented cost reduction actions to align our business with current economic conditions. Future restructurings or other cost reduction actions may be required.
11
Our financial results have fallen short and may continue to fall short of anticipated levels; forecasting net sales and profitability is complex and our forecasts may be inaccurate.
Our financial results in the first and fourth quarters of 2008 fell short of previously announced guidance for those quarters. The first quarter shortfall was the result of higher than anticipated manufacturing costs, higher write-downs of evaluation systems and a higher than anticipated effective tax rate. The fourth quarter shortfall was the result of customer delays in scheduled shipments and cancellations of systems orders due to the rapid decline in the economy during the quarter. Management typically provides quarterly financial forecasts. These forecasts, when made, are based on assumptions believed to be reasonable at the time. However, actual results may vary from forecasted results for a variety of reasons as evidenced by the first and fourth quarters of 2008. Our lengthy sales cycle, coupled with customers’ competing capital budget considerations, makes the timing of customer orders and product acceptances difficult to predict. In addition, our backlog at the beginning of a quarter typically does not include all orders required to achieve our sales objectives for that quarter and is not a reliable indicator of our future sales. As a result, our revenues and operating results for a quarter depend on our shipping orders as scheduled during that quarter, receiving customer acceptance during the quarter of previously shipped products, and obtaining new orders for products to be shipped in that same quarter. Any delay in, or cancellation of, scheduled shipments and customer acceptances or in shipments from new orders could materially and adversely affect our financial results. These factors have caused and may continue to cause our financial results to differ materially from prior periods and from financial forecasts we have previously provided.
Although we believe that these forecasts provide investors and analysts with a better understanding of management’s expectations for the future and are useful to our stockholders and potential stockholders, such forecasts are comprised of forward-looking statements subject to the risks and uncertainties described in this report and in our other public filings and public statements. If our operating or financial results for a particular period differ from our forecasts or the expectations of investment analysts, or if we change our forecasts for future periods, the market price of our common stock could decline.
Changes in tax rates, tax assets or liabilities have negatively impacted our results and could further negatively impact our future results.
We are subject to taxation in the United States and other countries. Our effective tax rate has fluctuated in the past and may fluctuate in the future. For example, the significant decrease in the provision for income taxes from 2007 to 2008 is primarily due to our current year pre-tax loss compared to the prior year pre-tax income and the geographical mix of those losses in the current year. Also impacting the typical relationship between pre-tax income (loss) and the provision for income taxes were (a) the minimal tax benefit in the current year related to the goodwill impairment charge within the Industrial Applications Group reporting unit and (b) the capital losses related to the other-than-temporary impairment charge in our auction rate securities portfolio.
Future effective tax rates could also be affected by changes in the composition of earnings in countries with differing tax rates, changes in the valuation of deferred tax assets and liabilities, or changes in the tax laws. We are also subject to regular examination of our tax returns by the Internal Revenue Service (IRS) and other tax authorities, including state revenue agencies and foreign governments. The IRS and other tax authorities have increasingly focused attention on intercompany transfer pricing with respect to sales of products and services and the use of intangible assets. We could face significant future challenges on these transfer pricing issues in one or more jurisdictions. We regularly assess the likelihood of favorable or unfavorable outcomes resulting from examinations by the IRS and other tax authorities to determine the adequacy of our provision for income taxes. Although we believe that our tax estimates are reasonable, there can be no assurance that any final determination will not be materially different from the treatment reflected in our historical income tax provisions and accruals. Factors that could cause estimates to be materially different include, but are not limited to:
| • | | Changes in the regulatory environment; |
| • | | Changes in accounting and tax standards or practices; |
12
| • | | Overall business conditions in the equipment industry; |
| • | | Changes in the composition of operating income by tax jurisdiction; and |
| • | | The Company’s operating results before taxes. |
Our liquidity can be affected by unanticipated events in the credit markets.
As of December 31, 2008, we held tax-exempt auction-rate securities with a fair value of $91.9 million, whose underlying assets are either student loans substantially backed by the federal government or closed-end municipal funds. Beginning in February 2008, these auction-rate securities became illiquid because their scheduled auctions failed to settle. An auction failure occurs when the parties wishing to sell securities at auction cannot. As a result, we have had and may continue to have limited or no opportunities to liquidate these investments and fully recover their stated value in the near term. These investments were classified as non-current and we have recognized a temporary unrealized loss of $13.0 million within other comprehensive income and an other-than-temporary loss of $3.5 million within other income, net as of December 31, 2008. If current market conditions do not improve, further temporary and other-than-temporary impairment charges could occur in future periods which would reduce the value of our investments and could negatively impact our results of operations. Based on our expected operating cash flows, and our other sources of cash, we do not anticipate the current illiquidity of these investments to adversely affect our operations.
We believe most of the impairment of these securities is temporary because we have the ability and intent to hold these securities to recovery and they have either been guaranteed by the federal government or, in the case of closed-end funds, they are backed by more than 200% collateral. Substantially all of our auction-rate securities are currently rated AAA, the highest rating by a rating agency. We evaluate our investments periodically for possible other-than-temporary impairment by reviewing factors such as the length of time and extent to which fair value has been below cost basis, the financial condition of the issuer and insurance guarantor, and our ability and intent to hold the investment for a period of time which may be sufficient for anticipated recovery of market value. We believe we will ultimately be able to liquidate these investments without significant loss through successful auctions, redemptions of securities by the issuers, or upon maturity. However, it might be necessary to hold these securities until the final maturity of the underlying notes to realize their full value.
Our quarterly operating results and stock price are unpredictable.
We have experienced and expect to continue to experience significant fluctuations in our quarterly operating results, which may adversely affect our stock price. Our future quarterly operating results and stock price may not align with past trends. The factors that have had and could continue to lead to fluctuations in our results include, but are not limited to:
| • | | Changing demand for and sales of lower-margin products relative to higher-margin products; |
| • | | Economic conditions in the electronics and semiconductor industry generally and the equipment industry specifically; |
| • | | Unpredictability of demand for and variability of mix of our products in our forecast, which can cause unexpected positive or negative inventory adjustments in a particular period; |
| • | | Emergence of new industry standards; |
| • | | Competitive pricing pressures; |
| • | | Failure to receive anticipated orders in time to permit shipment during the quarter; |
13
| • | | Timing and cancellation of customer orders and shipments, including deferring orders of our existing products due to new product announcements by us and/or our competitors; |
| • | | Building our systems according to forecast, instead of limited backlog information, which hinders our ability to plan production and inventory levels; |
| • | | The effect of revenue recognized upon acceptance with little or no associated costs; |
| • | | Bankruptcy of certain key customers; |
| • | | Foreign currency exchange rate fluctuations; |
| • | | Fluctuation in warranty costs; |
| • | | Variability in manufacturing yields; and |
| • | | Ability to fund capital requirements. |
We have incurred and may in the future incur impairments to goodwill or long-lived assets.
We review our long-lived assets, including goodwill and other intangible assets, for impairment annually in the fourth quarter or whenever events or changes in circumstances indicate that the carrying amount of these assets may not be recoverable. We recorded an impairment charge of $99.5 million in the fourth quarter of 2008 to reduce the carrying value of goodwill within our Industrial Applications Group. Our fourth quarter impairment assessment indicated that the Semiconductor Group’s anticipated cash flows would marginally cover the carrying value of the reporting unit, resulting in no impairment charges for this segment. As of December 31, 2008, the carrying amounts of goodwill on our Consolidated Balance Sheet subject to impairment are $108.4 million and $17.7 million for the Semiconductor Group and Industrial Applications Group, respectively.
Continued negative industry or economic trends, including the lack of recovery in the market price of our common stock, reduced estimates of future cash flows, disruptions to our business, slower growth rates or lack of growth in the Semiconductor Group or Industrial Applications Group could lead to additional impairment charges of our long-lived assets, including goodwill and other intangible assets. If, in any period, our stock price decreases to the point where the fair value of the Company, as determined by our market capitalization, is less than our book value, this too could indicate a potential impairment and we may be required to record an impairment charge in that period.
Our valuation methodology for assessing impairment requires management to make judgments and assumptions based on historical experience and to rely heavily on projections of future operating performance. We operate in highly competitive environments and projections of future operating results and cash flows may vary significantly from results. Additionally, if our analysis results in further impairment to our goodwill for the Semiconductor Group or Industrial Applications Group, we may be required to record additional charges to earnings in our financial statements during a period in which such impairment is determined to exist, which may negatively impact our results of operations.
We face risks related to concentration of net sales.
We sell to a limited number of customers, and we expect that sales to relatively few customers will continue to account for a high percentage of our net sales in the foreseeable future. Although the composition of the group comprising our largest customers varies from year to year, the loss of a significant customer or any reduction in orders from a significant customer, including reductions due to customer departures from recent buying patterns, as well as economic or competitive conditions in the semiconductor industry, could materially and adversely affect our business, financial condition or results of operations. Because products are configured to customer specifications, changing, rescheduling or canceling may result in significant non-recoverable costs.
14
Rapid technological change in the semiconductor industry requires substantial research and development expenditures and responsiveness to customer needs.
We devote a significant portion of our personnel and financial resources to R&D programs, and we seek to maintain close relationships with our customers in order to remain responsive to their product and manufacturing process needs. Our success depends in part on our ability to accurately predict evolving industry standards, to develop innovative solutions and improve existing technologies, to win market acceptance of our new and advanced technologies and to manufacture our products in a timely and cost-effective manner. Our products and processes must address changing customer needs in a range of materials, including copper and aluminum, at ever-smaller line widths and feature sizes, while maintaining our focus on manufacturing efficiency and product reliability. If we do not continue to gain market acceptance for our new technologies and products, or develop and introduce improvements in a timely manner in response to changing market conditions or customer requirements, or remain focused on R&D efforts that will translate into greater revenues, our business could be seriously harmed.
In the capital equipment market, technological innovations tend to have long development cycles. We have experienced delays and technical and manufacturing difficulties from time to time in the introduction of certain of our products and product enhancements. In addition, we may experience delays and technical and manufacturing difficulties in future introductions or volume production of our new systems or enhancements. The increased costs and reduced efficiencies that may be associated with the development, manufacture, sale and support of future products or product enhancements relative to our existing products may adversely affect our operating results.
Our success in developing, introducing and selling new and enhanced systems depends upon a variety of factors, including product selection; hiring, retaining and motivating highly qualified design and engineering personnel; timely and efficient completion of product design and development; implementation of manufacturing and assembly processes; achieving specified product performance in the field; and effective sales and marketing. There can be no assurance that we will be successful in selecting, developing, manufacturing and marketing new products, or in enhancing our existing products. There can be no assurance that revenue from future products or product enhancements will be sufficient to recover our investments in R&D. To ensure the functionality and reliability of our future product introductions or product improvements, we incur substantial R&D costs early in development cycles, before we can confirm the technical feasibility or commercial viability of a product or product improvement. If new products have reliability or quality problems, reduced orders, or higher manufacturing costs, delays in collecting accounts receivable and additional service may result and warranty expenses may rise, affecting our gross margins. Any of these events could materially and adversely affect our business, financial condition or results of operations.
The competitive and capital-intensive nature of the semiconductor industry increases the difficulty of maintaining gross margin and maintaining and capturing market share.
We face substantial competition in the industry, from both potential new market entrants and established competitors. Competitors may have greater financial, marketing, technical or other resources, and greater ability to respond to pricing pressures than we do. They may also have broader product lines, ability to reduce price through product bundling, greater experience with high-volume manufacturing, greater customer service capabilities, or larger and more established sales organizations and customer bases. To maintain or capture a position in the market, we must develop new and enhanced systems and introduce them at competitive prices on a timely basis, while managing our R&D, product, and warranty costs. Semiconductor manufacturers incur substantial costs to install and integrate capital equipment into their production lines. This increases the likelihood of continuing relationships with chosen equipment vendors, including our competitors, and the difficulty of penetrating new customer accounts. In addition, sales of our systems depend in significant part upon a prospective customer’s decision to increase or expand manufacturing capacity — which typically involves a significant capital commitment. From time to time, we have experienced delays in finalizing system sales
15
following initial system qualification. Due to these and other factors, our systems typically have a lengthy sales cycle, during which we may expend substantial funds and management effort. Heightened competition may also force price reductions that could adversely affect our results of operations.
We are exposed to risks associated with outsourcing activities, which could result in supply shortages that could affect our ability to meet customer demands.
We outsource the manufacture of most subassemblies, which enables us to focus on performing system design, assembly and testing in-house, thereby minimizing our fixed costs and capital expenditures. Although we make reasonable efforts to ensure that third party providers will perform to our standards, our reliance on suppliers and subcontractors limits our control over quality assurance and delivery schedules. Defects in workmanship, unacceptable yields, manufacturing disruptions and difficulties in obtaining export and import approvals may impair our ability to manage inventory and cause delays in shipments and cancellation of orders that may adversely affect our relationships with current and prospective customers and enable competitors to penetrate our customer accounts. In addition, third party providers may prioritize capacity for larger competitors or increase prices to us, which may adversely affect our profitability and our ability to respond to pricing pressures from competitors and customers.
Our growth and ability to meet customer demands depend in part on our ability to obtain from our suppliers timely deliveries of parts, components and subassemblies for the manufacture and support of our products. Although we make reasonable efforts to ensure that such parts are available from multiple suppliers, certain key parts may be obtained only from a single source or from limited sources. These suppliers are in some cases thinly capitalized, independent companies who derive a significant amount of their business from us or from a small group of companies in the semiconductor industry. As a result, our supply channels may be vulnerable to disruption. Any such disruption to or termination of our supplier relationships may result in a prolonged inability to secure adequate supplies at reasonable prices or of acceptable quality, and may adversely affect our ability to bring new products to market and deliver them to customers in a timely manner. As a result, our revenues and operations may be adversely affected.
The loss of key employees could harm our business and operations.
Our employees are extremely important to our success, and our key management, engineering and other employees may be difficult to replace. If we are unable to retain key personnel, or to attract, assimilate and retain additional highly qualified employees to meet our needs in the future, our business and operations could be harmed.
We are exposed to the risks of global operations.
We serve an increasingly global market. Substantial operations outside of the United States and export sales expose us to certain risks that may adversely affect our operating results and net sales, including, but not limited to:
| • | | Global or regional economic downturns; and |
| • | | Adverse conditions in credit markets; |
| • | | Potential adverse tax consequences, including withholding tax rules that may limit the repatriation of our earnings, and higher effective income tax rates in foreign countries where we conduct business; |
| • | | Tariffs and other trade barriers; |
| • | | Challenges in staffing and managing foreign operations and providing prompt and effective field support to our customers outside of the United States; |
16
| • | | Difficulties in managing foreign distributors; |
| • | | Governmental controls, either by the United States or other countries, that restrict our business overseas or the import or export of semiconductor products, or increase the cost of our operations; |
| • | | Longer payment cycles and difficulties in collecting accounts receivable outside of the United States; |
| • | | Inadequate protection or enforcement of our intellectual property and other legal rights in foreign jurisdictions; |
| • | | Political instability, natural disasters, acts of war or terrorism. |
We enter into foreign currency forward exchange contracts to hedge against the short-term impact of currency fluctuations, including forecasted sales transactions denominated in Japanese yen. There is no assurance that our hedging program will be effective. Exchange rate volatility may also increase the cost of our exported products for international customers and inhibit demand.
There can be no assurance that any of these factors will not have a material adverse effect on our business, financial condition or results of operations. In addition, each region in the global equipment market exhibits unique market characteristics that can cause capital equipment investment patterns to vary significantly from period to period. We derive a substantial portion of our revenues from customers in Asia. Any negative economic developments, legal or regulatory changes, terrorism in Asia or geo-political instability in Asia, including the possible outbreak of hostilities or epidemics involving Singapore, China, Taiwan, Korea or Japan, could result in the cancellation or delay by certain significant customers of orders for our products, which could adversely affect our business, financial condition or results of operations. Our continuing expansion in Asia renders us increasingly vulnerable to these risks.
We also maintain a program of insurance coverage for various types of property, casualty, and other risks. We place our insurance coverage with various carriers in numerous jurisdictions. The types and amounts of insurance that we obtain vary from time to time and from location to location, depending on availability, cost, and our decisions with respect to risk retention. The policies are subject to deductibles and exclusions that result in our retention of a level of risk on a self-insurance basis. Losses not covered by insurance may be substantial and may increase our expenses, which could negatively impact our results of operations.
We face risks related to intellectual property.
We intend to continue to seek legal protection, primarily through patents and trade secrets, for our proprietary technology. Seeking patent protection is a lengthy and costly process, and there can be no assurance that patents will be issued from any pending applications, or that any claims allowed from existing or pending patents will be sufficiently broad to protect our proprietary technology. There is also no guarantee that any patents we hold will not be challenged, invalidated or circumvented, or that the patent rights granted will provide competitive advantages to us. Our competitors have developed and may continue to develop and obtain patents for technologies that are similar or superior to our technologies. In addition, the laws of foreign jurisdictions in which we develop, manufacture or sell our products may not protect our intellectual property rights to the same extent as do the laws of the United States.
Adverse outcomes in current or future legal disputes regarding patent and intellectual property rights could result in the loss of our intellectual property rights, subject us to significant liabilities to third parties, require us to seek licenses from third parties on terms that may not be reasonable or favorable to us, prevent us from manufacturing or selling our products, or compel us to redesign our products to avoid incorporating third parties’ intellectual property. As a result, our product offerings may be delayed, and we may be unable to meet customers’ requirements in a timely way. Regardless of the merit of any legal disputes, we incur and may be required to incur in the future substantial costs to prosecute or defend our intellectual property rights. Even in the absence of
17
infringement by our products of third parties’ intellectual property rights, we have elected in the past and may in the future elect to seek licenses or enter into settlements to avoid the costs of protracted litigation and the diversion of resources and management attention. However, if the terms of settlements entered into with certain of our competitors are not observed or enforced, we may suffer further costs. Any of these circumstances could have a material adverse effect on our business, financial condition or results of operations.
Our ability to develop intellectual property depends on hiring, retaining and motivating highly qualified design and engineering staff with the knowledge and technical competence to advance our technology and productivity goals. To protect our trade secrets and proprietary information generally, we have entered into confidentiality or invention assignment agreements with our employees, as well as with consultants and other parties. If these agreements are breached, our remedies may not be sufficient to cover our losses.
We are subject to litigation proceedings that could adversely affect our business.
Intellectual Property Litigation
We have received certain claims of infringement of intellectual property rights and may receive other such claims in the future. In the future, such claims may evolve into legal proceedings or litigation against us. It is inherently difficult to assess the outcome of litigation, and there can be no assurance that we will prevail in any specific proceedings. Any such litigation could result in substantial cost to us, including diversion of the efforts of our technical and management personnel, and this could have a material adverse effect on our business, financial condition and operating results. If we are unable to successfully defend against such claims, we could be required to expend significant resources to develop or license alternative non-infringing technology or to obtain a license to the subject technology. There is no assurance that we will be successful with such development, or that a license will be available on terms acceptable to us, if at all. Without such a license, we could be enjoined from future sales of the infringing product or products, which could materially and adversely affect our business, financial condition and operating results.
Other Litigation
In addition to the litigation risks mentioned above, we are currently involved or may become subject to legal claims or proceedings related to securities, employment, customer or third party contracts, environmental regulations, product liability or other matters. If we are required to defend against a legal claim or deem it necessary or advisable to initiate a legal proceeding to protect our rights, the expense and distraction of such a claim or proceeding, whether or not resolved in our favor, could materially and adversely affect our business, financial condition and operating results. Further, if a claim or proceeding were resolved against us or if we were to settle any such dispute, we could be required to pay damages or refrain from certain activities, which could have a material adverse impact on our business, financial condition and operating results.
We are exposed to risks associated with our diversification strategy.
Our core business and expertise have historically been in the development, manufacture, sale and support of deposition technologies, wafer surface preparation and chemical mechanical planarization technologies. We lack experience in the high-precision machine manufacturing equipment market serviced by our Industrial Applications Group segment, compared with our knowledge of the semiconductor equipment industry, and cannot give any assurance that we can maintain or improve the quality of products, level of sales and gross margins, or relations with key employees and significant customers or suppliers that are necessary to compete in this market.
18
We are exposed to risks related to our indemnification of third parties.
From time to time, in the normal course of business, we indemnify third parties with whom we enter into contractual relationships, including customers and lessors, with respect to certain matters. We have agreed, under certain conditions, to hold these third parties harmless against specified losses, such as those arising from a breach of representations or covenants, other third party claims that our products when used for their intended purposes infringe the intellectual property rights of such other third parties, or other claims made against certain parties. We have been, and in the future may be, compelled to enter into or accrue for probable settlements of alleged indemnification obligations or subject to potential liability arising from our customer’s involvements in legal disputes. It is difficult to determine the maximum potential amount of liability under any indemnification obligations, whether or not asserted, due to our limited history of prior indemnification claims and the unique facts and circumstances that are likely to be involved in each particular claim. Our business, financial condition and results of operations in a reported fiscal period could be materially adversely affected if we expend significant amounts in defending or settling any purported claims, regardless of their merit or outcomes.
We face risks associated with acquisitions, divestitures, and other transactions.
We have made, and may in the future make, acquisitions of or significant investments in businesses with complementary products, services and/or technologies. Acquisitions involve numerous risks, including, but not limited to:
| • | | Difficulties in integrating the operations, technologies, products and personnel of acquired companies; |
| • | | Lack of synergies or the inability to realize expected synergies and cost-savings; |
| • | | Revenue and expense levels of acquired entities differing from those anticipated at the time of the acquisitions; |
| • | | Difficulties in managing geographically dispersed operations; |
| • | | The potential loss of key employees, customers and strategic partners of acquired companies; |
| • | | Claims by terminated employees, shareholders of acquired companies or other third parties related to the transaction; |
| • | | The issuance of dilutive securities, assumption or incurrence of additional debt obligations or expenses, or use of substantial portions of our cash; |
| • | | Diversion of management’s attention from normal daily operations of the business; and |
| • | | The impairment of acquired intangible assets as a result of technological advancements, or worse-than-expected performance of acquired companies. |
When we make a decision to sell assets or a business, we may encounter difficulty completing the transaction as a result of a range of possible factors such as new or changed demands from the buyer. These circumstances may cause us to incur additional time or expense or to accept less favorable terms, which may adversely affect the overall benefits of the transaction.
Acquisitions, divestitures, and other transactions are inherently risky, and we cannot provide any assurance that our previous or future transactions will be successful. The inability to effectively manage the risks associated with these transactions could materially and adversely affect our business, financial condition or results of operations.
19
From time to time we may enhance, modify or upgrade our enterprise resource planning and other key software applications, which could cause unexpected problems to occur and could cause disruption to the management of our business.
From time to time, we may enhance, modify or upgrade our enterprise resource planning (ERP) system used for our worldwide operations, as well as other key software applications used in our operations. Our ERP system is integral to our ability to accurately and efficiently maintain our books and records, record our transactions, provide critical information to our management and prepare our financial statements.
Enhancements may eventually become more costly, difficult and time-consuming to purchase and implement than we currently anticipate. We may encounter unexpected difficulties or costs or other challenges, any of which may disrupt our business or cause delays in the reporting of our financial results. Our existing systems, procedures or controls may not be adequate to support our operations and require us to change our internal business practices. Corrections and improvements may be required as we enhance, modify or upgrade our systems, procedures and controls, and could cause us to incur additional costs and require additional management attention, placing burdens on our internal resources. If we fail to manage these changes effectively, it could adversely affect our ability to manage our business and our operating results.
Compliance with current and future environmental regulations may be costly.
We may be subject to environmental and other regulations in certain states and countries where we produce or sell our products. We also face increasing complexity in our product design and procurement operations as we adjust to new and prospective requirements relating to the materials composition of our products, including the restrictions on lead and certain other substances in electronics that apply to specified electronics products put on the market in the European Union (EU). The EU also makes producers of electrical goods financially responsible for specified collection, recycling, treatment and disposal of past and future covered products. Other countries, such as the United States, China and Japan, have enacted or may enact similar laws or regulations similar to the EU. These and other future environmental regulations could require us to reengineer certain of our existing products.
| Item 1B. | Unresolved Staff Comments |
Not applicable.
20
Information regarding our principal properties as of December 31, 2008 is as follows:
| | | | | | | | |
Location | | Use | | # of Buildings | | Owned | | Leased |
| | | | | | | (Square Footage) |
Semiconductor Group | | | | |
| San Jose, CA | | Corporate Headquarters, Manufacturing, Research and Development, Engineering Applications, Demonstration Lab, Customer Support, Administration and Warehousing | | 8 | | 538,000 | | |
| Tualatin, OR | | Manufacturing, Research and Development, Engineering, Customer Support, Administration and Warehousing | | 4 | | 442,000 | | |
| Phoenix, AZ | | Manufacturing, Research and Development, Engineering, Customer Support, Administration and Warehousing | | 1 | | | | 32,000 |
| | |
Industrial Applications Group | | | | |
| Des Plaines, IL | | Manufacturing, Research and Development, Engineering, Customer Support, Administration and Warehousing | | 1 | | 41,000 | | |
| Plainville, MA | | Customer Support and Warehousing | | 1 | | 25,000 | | |
| Leicestershire, UK | | Manufacturing, Customer Support, Administration and Warehousing | | 1 | | 9,000 | | |
| Rendsburg, Germany | | Manufacturing, Research and Development, Engineering, Customer Support, Administration and Warehousing | | 1 | | 189,000 | | 51,000 |
| Hauterive, Switzerland | | Manufacturing, Research and Development, Customer Support and Administration | | 1 | | 128,000 | | |
| | | | | | | | |
| | Total | | | | 1,372,000 | | 83,000 |
In our Semiconductor Group, we also lease several domestic field offices totaling approximately 21,000 square feet of space and several sites outside the United States totaling approximately 176,000 square feet of space that we use as sales and customer service centers. Our facilities in Europe include approximately 22,000 square feet of leased space in various countries including Germany, France, Italy, Ireland, and Israel. Our facilities in Asia include approximately 154,000 square feet of leased space in various countries including China, India, Japan, Korea, Malaysia, Singapore, Taiwan and Vietnam. We also domestically own and lease approximately 522,000 square feet not utilized for our operations, of which 420,000 square feet is leased to others.
In our Industrial Applications Group, we also lease four field offices totaling approximately 28,000 square feet in Germany, Switzerland, China and Japan.
We believe that our facilities are sufficient to meet our requirements for the foreseeable future.
21
Linear Technology Corporation
In March 2002, Linear Technology Corporation (Linear) filed a complaint against Novellus, among other parties, in the Superior Court of the State of California for the County of Santa Clara. The complaint seeks damages (including punitive damages), declaratory relief and injunctions for causes of actions involving alleged breach of contract, fraud, unfair competition and breach of warranty. The Superior Court dismissed Linear’s claims for fraud and unfair competition on October 5, 2004. The Court of Appeal affirmed this dismissal on June 18, 2007. Trial on the remaining claims is currently set for September 8, 2009. At this time, we cannot predict the ultimate outcome of this case, nor can we estimate a range of potential loss, if any. However, we believe that the ultimate disposition of these matters will not have a material adverse effect on our business, financial condition or operating results.
Other Litigation
We are a defendant or plaintiff in various actions that have arisen in the normal course of business. We believe that the ultimate disposition of these matters will not have a material adverse effect on our business, financial condition or results of operations. However, due to the uncertainty surrounding litigation, we are unable at this time to estimate a range of loss, if any, that may result from any of these pending proceedings.
| Item 4. | Submission of Matters to a Vote of Security Holders |
Not applicable.
22
PART II
| Item 5. | Market for Registrant’s Common Equity, Related Shareholder Matters and Issuer Purchases of Equity Securities |
Stock Information
Novellus’ common stock is traded on The NASDAQ Stock Market and is quoted on the NASDAQ Global Select Market (formerly the Nasdaq National Market) under the symbol “NVLS.” The following table sets forth the closing high and low prices of our common stock as reported by the NASDAQ Global Select Market for the periods indicated:
| | | | | | |
| | | 2008 |
| | | High | | Low |
First Quarter | | $ | 26.63 | | $ | 20.99 |
Second Quarter | | | 23.89 | | | 20.29 |
Third Quarter | | | 23.01 | | | 19.16 |
Fourth Quarter | | | 19.64 | | | 10.46 |
| |
| | | 2007 |
| | | High | | Low |
First Quarter | | $ | 34.82 | | $ | 29.96 |
Second Quarter | | | 33.85 | | | 28.37 |
Third Quarter | | | 33.03 | | | 25.90 |
Fourth Quarter | | | 28.72 | | | 25.65 |
As of February 24, 2009, there were 741 holders of record of our common stock. We have not paid cash dividends on our common stock since inception, and our Board of Directors presently plans to use the cash generated from operations to reinvest in the business and to repurchase common shares. Accordingly, it is anticipated that no cash dividends will be paid to holders of common stock in the foreseeable future.
Repurchase of Company Securities
All shares repurchased below were pursuant to publicly announced plans. On February 24, 2004 we announced that our Board of Directors approved a stock repurchase plan that authorized the repurchase of up to $500.0 million of our outstanding common stock through February 13, 2007. On September 20, 2004 we announced that our Board of Directors authorized an additional $1.0 billion for repurchases of our outstanding common stock through September 14, 2009. On October 26, 2007 we announced that our Board of Directors authorized an additional $1.0 billion for repurchases of our outstanding common stock through October 26, 2011.
Following is a summary of our stock repurchases for the quarter ended December 31, 2008.
| | | | | | | | | | |
Period | | Total Number of
Shares Purchased | | Average Price Paid
Per Share | | Total Number of
Shares Purchased as
Part of Publicly
Announced Plans or
Programs | | Approximate Dollar
Value of Shares that
May yet be
Purchased Under the
Plans or Programs |
September 29, 2008 through November 1, 2008 | | 703,711 | | $ | 15.83 | | 703,711 | | $ | 834.8 million |
November 2, 2008 through November 29, 2008 | | 629,289 | | $ | 12.81 | | 629,289 | | $ | 826.7 million |
November 30, 2008 through December 31, 2008 | | — | | | — | | — | | $ | 826.7 million |
| | | | | | | | | | |
Total | | 1,333,000 | | $ | 14.41 | | 1,333,000 | | | |
| | | | | | | | | | |
In addition to shares repurchased above, to cover tax withholding obligations we withheld 143,141 shares through net share settlements during the three months ended December 31, 2008 upon the vesting of restricted stock awards.
23
Cumulative 5-year return
The following graph compares the cumulative 5-year total return attained by shareholders on our common stock relative to the cumulative total returns of the S&P 500 index and the RDG Technology Composite index. The graph tracks the performance of a $100 investment in our common stock and in each of the indices (with the reinvestment of all dividends) from December 31, 2003 to December 31, 2008.
COMPARISON OF 5 YEAR CUMULATIVE TOTAL RETURN*
Among Novellus Systems, Inc., The S&P 500 Index
And The RDG Technology Composite Index
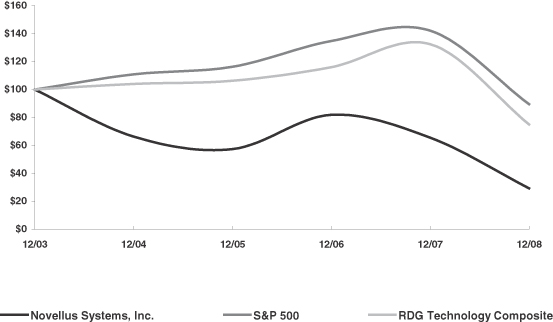
*$100 invested on 12/31/03 in stock & index-including reinvestment of dividends.
Fiscal year ending December 31.
Copyright© 2009 S&P, a division of The McGraw-Hill Companies Inc. All rights reserved.
| | | | | | | | | | | | | | | | | | |
| | | December 31, |
| | | 2003 | | 2004 | | 2005 | | 2006 | | 2007 | | 2008 |
Novellus Systems, Inc. | | $ | 100.00 | | $ | 66.33 | | $ | 57.36 | | $ | 81.85 | | $ | 65.56 | | $ | 29.35 |
S&P 500 | | $ | 100.00 | | $ | 110.88 | | $ | 116.33 | | $ | 134.70 | | $ | 142.10 | | $ | 89.53 |
RDG Technology Composite | | $ | 100.00 | | $ | 104.00 | | $ | 106.32 | | $ | 115.97 | | $ | 132.44 | | $ | 75.00 |
This graph is not “soliciting material,” is not deemed filed with the SEC and is not to be incorporated by reference in any filing by us under the Securities Act of 1933, as amended (the “Securities Act”), or the Exchange Act, whether made before or after the date hereof and irrespective of any general incorporation language in any such filing.
The stock price performance included in this graph is not necessarily indicative of future stock price performance.
24
| Item 6. | Selected Financial Data |
Set forth below is a summary of certain consolidated financial information with respect to Novellus as of the dates and for the periods indicated. The Consolidated Statements of Operations data set forth below for each of the five years in the period ended December 31, 2008 and the Consolidated Balance Sheet data at each respective year end have been derived from our Consolidated Financial Statements, which have been audited. We acquired Voumard Machine Co. SA (Voumard) on November 18, 2005 and Peter Wolters AG on June 28, 2004. The Selected Consolidated Financial Data includes the operating results and financial information of these companies from their respective dates of acquisition.
Selected Consolidated Financial Data
The following selected consolidated financial data has been derived from our historical Consolidated Financial Statements and should be read in conjunction with the Consolidated Financial Statements and the accompanying notes for the corresponding fiscal years:
| | | | | | | | | | | | | | | | | | | | |
| | | Years Ended December 31, | |
| | | 2008 | | | 2007 | | | 2006 | | | 2005 | | | 2004 | |
| | | (In thousands, except per share data) | |
Consolidated Statements of Operations Data: | | | | | | | | | | | | | | | | | | | | |
Net sales | | $ | 1,011,004 | | | $ | 1,570,049 | | | $ | 1,658,516 | | | $ | 1,340,471 | | | $ | 1,357,288 | |
Gross profit | | | 435,944 | | | | 769,189 | | | | 824,349 | (3) | | | 599,126 | (5,6) | | | 665,130 | (7) |
Income (loss) before cumulative effect of change in accounting principle | | | (115,710 | )(1) | | | 213,700 | (2) | | | 189,068 | (3,4) | | | 110,107 | (6) | | | 156,690 | (8) |
Cumulative effect of change in accounting principle, net of tax | | | — | | | | — | | | | 948 | | | | — | | | | — | |
Net income (loss) | | $ | (115,710 | )(1) | | $ | 213,700 | (2) | | $ | 190,016 | (3,4) | | $ | 110,107 | (6) | | $ | 156,690 | (8) |
Per common share: | | | | | | | | | | | | | | | | | | | | |
Income (loss) before cumulative effect of change in accounting principle | | | | | | | | | | | | | | | | | | | | |
Basic | | $ | (1.18 | ) | | $ | 1.78 | | | $ | 1.51 | | | $ | 0.80 | | | $ | 1.07 | |
Diluted | | $ | (1.18 | ) | | $ | 1.75 | | | $ | 1.49 | | | $ | 0.80 | | | $ | 1.06 | |
Cumulative effect of change in accounting principle, net of tax | | | | | | | | | | | | | | | | | | | | |
Basic | | $ | — | | | $ | — | | | $ | 0.01 | | | $ | — | | | $ | — | |
Diluted | | $ | — | | | $ | — | | | $ | 0.01 | | | $ | — | | | $ | — | |
Net income (loss) | | | | | | | | | | | | | | | | | | | | |
Basic | | $ | (1.18 | ) | | $ | 1.78 | | | $ | 1.52 | | | $ | 0.80 | | | $ | 1.07 | |
Diluted | | $ | (1.18 | ) | | $ | 1.75 | | | $ | 1.50 | | | $ | 0.80 | | | $ | 1.06 | |
Shares used in basic per share calculations | | | 98,083 | | | | 119,782 | | | | 125,286 | | | | 137,447 | | | | 145,956 | |
Shares used in diluted per share calculations | | | 98,083 | | | | 121,915 | | | | 126,483 | | | | 138,423 | | | | 147,937 | |
| |
| | | December 31, | |
| | | 2008 | | | 2007 | | | 2006 | | | 2005 | | | 2004 | |
Consolidated Balance Sheet Data: | | | | | | | | | | | | | | | | | | | | |
Cash, cash equivalents and short-term investments | | $ | 470,888 | | | $ | 596,766 | | | $ | 853,328 | | | $ | 654,983 | | | $ | 592,187 | |
Total assets | | $ | 1,637,527 | | | $ | 2,076,943 | | | $ | 2,362,492 | | | $ | 2,290,249 | | | $ | 2,401,832 | |
Long-term debt | | $ | — | | | $ | 143,267 | | | $ | 127,862 | | | $ | 124,858 | | | $ | 161,103 | |
Shareholders’ equity | | $ | 1,246,782 | | | $ | 1,529,087 | | | $ | 1,834,705 | | | $ | 1,779,283 | | | $ | 1,861,834 | |
25
| (1) | The fiscal year 2008 results included a non-cash goodwill impairment charge of $99.5 million and additional charges of $25.7 million, consisting of severance expense, inventory impairments, and the write-down of certain R&D assets to align our business with the current economic environment. Of these expenses, $10.9 million, $6.2 million, $8.6 million and $99.5 million were included in cost of sales, SG&A expenses, R&D expenses and impairment of goodwill, respectively. |
| (2) | The fiscal year 2007 results included a net restructuring and other benefit of $8.0 million, primarily from a gain on the sale of property and buildings in San Jose, California. |
| (3) | The fiscal year 2006 results included a $0.9 million benefit, net of tax, from the cumulative effect of a change in accounting principle due to the adoption of SFAS No. 123 (revised 2004), “Share-Based Payment” (SFAS 123R). Stock-based compensation recorded in cost of sales, SG&A and R&D expenses increased by $0.7 million, $20.2 million and $9.9 million, respectively, from amounts recorded in 2005, primarily as a result of adopting SFAS 123R. |
| (4) | The fiscal year 2006 results included a pre-tax net restructuring charge of $10.7 million, a pre-tax charge of $3.3 million for a legal settlement and a tax charge of $46.1 million related to the implementation of a new global business structure. The tax charge was partially offset by an $8.5 million tax benefit attributable to the settlement of an IRS audit. |
| (5) | The fiscal year 2005 results included a credit to cost of sales of approximately $15.1 million related to the sale of inventories previously written down. |
| (6) | The fiscal year 2005 results included net restructuring and other charges of $9.2 million and inventory write-downs due to restructuring of $5.3 million. |
| (7) | The fiscal year 2004 results included a credit to cost of sales of approximately $9.0 million related to the sale of inventories previously written down. |
| (8) | The fiscal year 2004 results included net restructuring and other charges of $1.5 million, acquired in-process research and development write-offs of $6.1 million, net recovery from legal settlements of $2.6 million and the reversal of previously accrued royalty payments of $8.1 million. |
26
| Item 7. | Management’s Discussion and Analysis of Financial Condition and Results of Operations |
Cautionary Note Regarding Forward-Looking Statements
This Annual Report on Form 10-K and certain information incorporated herein by reference contain forward-looking statements within the “safe harbor” provisions of the Private Securities Litigation Reform Act of 1995. All statements contained in this Annual Report on Form 10-K, other than statements that are purely historical, are forward-looking statements and are based upon management’s present expectations, objectives, anticipations, plans, hopes, beliefs, intentions or strategies regarding the future. As such, forward-looking statements are subject to risks and uncertainties that could cause actual results to differ materially from the results contemplated. We do not undertake, and expressly disclaim, any obligation to update this forward-looking information, except as required under applicable law.
The following information should be read in conjunction with “Part I, Item 1. Business,” “Part I, Item 6. Selected Financial Data” and “Part II, Item 8. Consolidated Financial Statements” and the notes thereto. Forward-looking statements in this Annual Report on Form 10-K may be identified by words such as “anticipates,” “estimates,” “expects,” “projects,” “intends,” “plans,” “believes” or similar expressions, and include, without limitation:
| • | | Statements about the growth of the semiconductor industry; market size, share and demand (particularly demand for corporate and consumer electronic devices); product performance; our expectations, objectives, anticipations, intentions and strategies regarding the future; expected operating results, revenues and earnings; and current and potential litigation, which statements are subject to various uncertainties, including, without limitation, those discussed in “Item 1A. Risk Factors”; |
| • | | The statements in “Item 1. Business — Semiconductor Group,” concerning (1) the likelihood that in 2009 unit demand for semiconductors will fall for the first time since 2001, leading to a decline in semiconductor inventories and (2) our expectation that chip unit growth and spending on semiconductor equipment will resume in 2010 and beyond, which statements are subject to certain risks and uncertainties, including, without limitation, fluctuations in market demand for semiconductors, inability to accurately predict chip unit growth and further cost cutting measures which prevent spending on semiconductor equipment in the through 2010; |
| • | | The statements in “Item 1. Business — Semiconductor Business Strategy,” concerning (1) our focus on reducing customer costs; (2) our intent to broaden our interconnect offerings; (3) our strategy to expand our market presence in Asia; (4) our strategy to anticipate the technologies that customers need and design innovative products to enhance their manufacturing capabilities and (5) our plan to leverage our low cost manufacturing structure, which statements are subject to various risks and uncertainties, including, without limitation, shifts in demand from expensive, high-performance products to lower priced, conventional products, resulting in reduced profit for semiconductor manufacturers, increases in the costs of material, labor or conducting a global business, or inability to enhance our systems’ productivity, which may preclude us from containing costs to customers; the current and other periodic downturns in the semiconductor industry and the global or domestic economy, political or economic instability in Asia; inability to allocate sufficient resources to R&D efforts; and fluctuations in interest and foreign currency exchange rates; |
| • | | The statements in “Item 1. Business — Semiconductor Products” of our beliefs in the performance and effectiveness of our products, including that we have an important advantage in extending copper/low-k processes to advanced semiconductor devices based on our understanding of interactions between planarization, deposition and surface preparation, which statements are subject to various risks and uncertainties, including, among others, the inaccuracy of our assessment of our products’ capabilities; technical difficulties which preclude our products from performing as expected; competitors’ greater financial, marketing, technical, customer service or other resources, broader product lines, and larger and more established sales organizations and customer bases; future competition from new market entrants, competitors’ design and performance product improvements that may offer superior price or performance features over our products, difficulties integrating, developing and commercializing SpeedFam-IPEC CMP systems, and difficulties in selecting, developing, manufacturing and marketing our new products or enhancing our existing products; |
27
| • | | The statements in “Item 1. Business — Marketing, Sales and Service” concerning (1) our strategy of supporting our installed base through customer support and R&D groups has accelerated penetration of certain key accounts and (2) our marketing efforts are enhanced by the technical expertise of our R&D personnel, which statements are subject to certain risks and uncertainties, including, without limitation, that during economic downturns, we may not be able to retain a sufficient number of qualified customer support and R&D personnel; |
| • | | The statements in “Item 1. Business — Customers” concerning our expectation that sales of our products to relatively few customers will account for a high percentage of our net sales in the foreseeable future, which statement is subject to certain risks and uncertainties, including unexpected loss of a major customer, inability to provide our customers with cost effective products and inability to predict the changing needs of our customers; |
| • | | The statement in “Item 1. Business — Research and Development” regarding our belief that R&D expenditures will continue to represent a substantial percentage of sales, which statement is subject to certain risks and uncertainties, including, among others, the risk that we may be unable to allocate substantial resources to R&D; |
| • | | The statements in “Item 1. Business — Manufacturing” regarding our belief that our outsourcing strategy enables us to minimize our fixed costs and capital expenditures while also providing the flexibility to increase capacity as needed and allows us to focus on product differentiation through system design and quality control, which statements are subject to various risks and uncertainties, including, without limitation, a prolonged inability to obtain certain components imperative to our operations and our failure to work efficiently with suppliers; |
| • | | The statement in “Item 1. Business — Competition” regarding our belief as to our ability to compete favorably in our market segments, which statement is subject to various risks and uncertainties, including, among others, the greater financial, marketing, technical or other resources, broader product lines, greater customer service capabilities and larger and more established sales organizations and customer bases that some of our competitors possess, future competition from new market entrants from overseas and domestic sources, our competitors’ improvement of the design and performance of their products that may offer superior price or performance features as compared to our products, and our success in selecting, developing, manufacturing and marketing our new products or enhancing our existing products; |
| • | | The statements in “Item 1. Business — Patents and Proprietary Rights” regarding (1) our intentions to vigorously protect our intellectual property rights, (2) our intention to file additional patent applications as appropriate, (3) our belief that the outcomes of current litigation will not have a material impact on our business, financial condition or results of operations; and (4) our belief that in the future, litigation may be necessary to enforce patents issued to us, to protect trade secrets or know-how owned by us or to defend us against claimed infringement of the rights of others and to determine the scope and validity of the intellectual property rights of others; which statements are subject to various risks and uncertainties, including, without limitation, the risk that patents will not be issued from any of our pending applications or that claims allowed from existing or pending patents will not be sufficiently broad to protect our technology, the risk that litigation could result in substantial cost and diversion of our effort and the risk that adverse litigation determinations could result in a loss of our intellectual property rights, subject us to significant liabilities to third parties, require us to seek licenses from third parties or prevent us from manufacturing or selling our products; |
| • | | The statement in “Item 1. Business — Environmental Matters” that federal, state and local provisions regulating discharge of materials into the environment and remedial agreements or other environmental actions are not expected to have a material effect on our capital expenditures, financial condition, results of operations or competitive position, which statement is subject to certain risks and uncertainties, including, among others, that we have inaccurately assessed the environmental impact of our activities or the compliance requirements of environmental provisions and agreements; |
| • | | The statement in “Item 2. Properties” that our facilities are sufficient to meet our needs for the foreseeable future, which statement is subject to certain risks and uncertainties, including, among others, inaccurate estimates related to our facility needs and an unexpected need to expand operations; |
28
| • | | The statements in “Item 3. Legal Proceedings” of our belief that the ultimate disposition of the Linear Technology Corporation action and other litigation matters will not have a material adverse effect on the impact on our business, financial condition or the overall trend in our results from operations, which statement is subject to various risks and uncertainties, including, without limitation, inherent uncertainty surrounding the litigation process and our ability to accurately predict the determination of complex issues of fact and law; |
| • | | The statement in “Item 7. Management’s Discussion and Analysis of Financial Condition and Results of Operations — Overview of Our Business and Industry” regarding (1) our close relationships with our customers and substantial investments in R&D positioning us for future growth, (2) the likelihood that in 2009 unit demand for semiconductors will fall for the first time since 2001, leading to a decline in semiconductor inventories, (3) our expectation that chip unit growth and spending on semiconductor equipment will resume in 2010 and beyond, (4) our anticipation that revenues in the near term will be generated from technology upgrades and maintenance on, or replacement, of currently deployed equipment, (5) our continued focus on operational execution to improve profitability, (6) our plan to continue managing both our variable and fixed cost structure with the objective of minimizing our net cash outflow during fiscal 2009, (7) our goal to align our cost structure to survive the unusually low capital expenditure requirements of our customers in the short-term while maintaining sufficient resources to adequately respond to our customers when the industry returns to a more normal steady state of capital expenditure, (8) our expectation that gross profit, as a percentage of net sales, will continue to be negatively impacted in 2009 due to lower facilities utilization on reduced shipment volumes, and (9) our expectation that net orders will continue to fluctuate; which statements are subject to numerous risks and uncertainties, including, without limitation, our inability to maintain our customer accounts, fluctuations in market demand for semiconductors, inability to accurately predict chip unit growth and further cost cutting measures which prevent spending on semiconductor equipment in the through 2010, instability in the semiconductor industry and inability to predict the origin of revenues, our inability to realize marketable products from our investment in R&D, our inability to reduce our cost structure and reduce expenses through business shutdowns and other cost reducing strategies, our inability to attain market acceptance for new product introductions and the cyclical nature of the semiconductor industry; |
| • | | The statements in “Item 7. Management’s Discussion and Analysis of Financial Condition — Critical Accounting Policies” regarding the calculation of allowances, reserves, and other estimates that are based on historical experience, and various other assumptions that are believed to be reasonable under the circumstances, the results of which form the basis for making judgments about the carrying values of assets and liabilities that are not readily apparent from other sources, and the significant judgments of management that underlie the preparation of our consolidated financial statements including, without limitation, (1) our belief that deferred tax assets will be realized due to future income and our ability to carry back losses to prior years and (2) the positive or negative impact on gross profit of possible revisions to estimated warranty liability, which statements are subject to certain risks and uncertainties, including, among others, the inaccuracy of our calculations, estimates, assumptions and judgments, regarding critical accounting policies; that actual and future product failure rates, material usage, installation costs, customer reserves or other estimates may differ from our historical experience, requiring revisions to our estimated doubtful account allowances, additional inventory write-downs, restructuring charges, litigation, warranty, and other reserves; the insufficiency of anticipated future income, whether due to a downturn in the semiconductor industry or increases in expenses; and the accuracy of our estimates and beliefs regarding warranty liability; |
| • | | The statements in “Item 7. Management’s Discussion and Analysis of Financial Condition and Results of Operations — Net Sales” of our strategies, beliefs, plans, expectations and anticipations including (1) our plans to continue to focus on expanding our market presence in Asia, (2) our belief that significant additional growth potential exists in this region over the long term, which statements are subject to numerous risks and uncertainties, including, without limitation, inability to predict our ability to acquire a substantial market share in Asia, political or economic instability in Asia, and fluctuations in interest and foreign currency exchange rates; |
| • | | The statements in “Item 7. Management’s Discussion and Analysis of Financial Condition and Results of Operations — Research and Development (R&D)” of our strategies, beliefs, plans, expectations and anticipations including, (1) continuation of our R&D commitment to improvement of new products and |
29
| | enhancement of our current product lines, and (2) significant investment in R&D in order to remain competitive, which statements are subject to numerous risks and uncertainties, including, without limitation, risks and uncertainties associated with technical and operational difficulties with our products that result in continued increases in warranty costs, and our inability to allocate substantial resources to R&D programs; |
| • | | The statements in “Item 7. Management’s Discussion and Analysis of Financial Condition and Results of Operations — “Income Taxes” regarding (1) our expectation to achieve tax rates lower than current federal rates due to the geographical mix of income at lower rates, foreign tax credit planning strategies and capital and foreign losses which may be carried forward from prior years and (2) our belief that we have adequate accruals for any potential adjustment resulting from foreign tax examinations, which statements are subject to certain risks and uncertainties including changes to our eligibility for foreign tax credits, shifts in our geographical mix of income and our inability to adequately estimate the amount of potential adjustments; |
| • | | The statement in “Item 7. Management’s Discussion and Analysis of Financial Condition and Results of Operations — Liquidity and Capital Resources” that (1) we expect to use any proceeds from our credit agreement for working capital and other corporation purposes and (2) our current cash positions, operating cash flow and available borrowings will be sufficient to meet our needs for the next 12 months to execute our business plan; which statements are subject to certain risks and uncertainties, including unanticipated limitations on the use of proceeds from certain credit agreements and inability to accurately predict cash outlays and an unanticipated need for additional liquid assets in the next 12 months to fund operations and repurchases of our Common Stock; |
| • | | The statement in “Item 7. Management’s Discussion and Analysis of Financial Condition and Results of Operations — Off-Balance Sheet Arrangements” that it is not probable that we will be required to pay any amounts under standby letters of credit arrangements or guarantee arrangements on behalf of our consolidated subsidiaries, which statement is subject to certain risks and uncertainties, including, without limitation, the inaccuracy of our assessment of our obligations under credit and guarantee arrangements; |
| • | | The statement in “Item 7. Management’s Discussion and Analysis of Financial Condition and Results of Operations — Contractual Obligations” that (1) we have made adequate provision for potential exposure related to inventory on order which may go unused, and (2) we expect to make payments of $0.5 million related to our pension and post-retirement benefit plans in fiscal 2009, which statements are subject to certain risks and uncertainties, including, without limitation, our inability to predict our exposure related to inventory on order which may go unused and inaccuracies related to the amount of payments to be made to the Company’s pension and post-retirement benefit plans; |
| • | | The statement in “Item 7. Management’s Discussion and Analysis of Financial Condition and Results of Operations — Purchase Commitments” that we made adequate provision for potential exposure related to inventory on order which may go unused, which statement is subject to certain risks and uncertainties, including, without limitation, an unanticipated decline in demand that would increase our inventory-related exposure; |
| • | | The statement in “Item 7. Management’s Discussion and Analysis of Financial Condition and Results of Operations — Recent Accounting Pronouncements” and “Item 8. Financial Statements and Supplementary Data — Notes to Consolidated Financial Statements — Note 2. Significant Accounting Policies – Recent Accounting Pronouncements” that (1) we do not anticipate that the amount of existing unrecognized tax benefits will significantly increase or decrease within the next twelve months and (2) we do not anticipate the adoption of FSP 157-2, SFAS 160 or FSP 142-3 will have a significant impact on our Consolidated Financial Statements, which statements are subject to certain risks and uncertainties, including, without limitation, inability to accurately assess the impact of recent accounting pronouncements on our Consolidated Financial Statements; |
| • | | The statement in “Item 7A. Quantitative and Qualitative Disclosures About Market Risk — Interest Rate Risk” that we believe that an immediate change to interest rates to variable short-term borrowings will not have a material effect on our results, which statement is subject to certain risks and uncertainties, including, without limitation, that we have inaccurately assessed our future borrowing needs; |
30
| • | | The statement in “Item 8. Financial Statements and Supplementary Data — Notes to Consolidated Financial Statements — Note 2. Significant Accounting Policies — Cash Flow Hedging” that we anticipate reclassifying net losses from OCI to earnings within 12 months, which statement is subject to certain risks and uncertainties, including, without limitation, inability to reclassify net losses from OCI to earnings within 12 months due to fluctuations in foreign currency forward exchange contracts and the inability to anticipate hedge effectiveness; |
| • | | The statement in “Item 8. Financial Statements and Supplementary Data — Notes to Consolidated Financial Statements — Note 2. Significant Accounting Policies — Concentration and Other Risks” regarding (1) our expectation that sales of our products to a few customers will account for a high percent of our total system sales in the foreseeable future and (2) our belief that there is no significant risk of nonperformance of payment obligations of counterparties, which statements are subject to certain risks and uncertainties, including, without limitation, our inability to retain current customers due to unforeseeable market changes, unexpected loss of a major customer that accounts for a high percent of our total sales, and inability to accurately predict the creditworthiness of large financial institutions; |
| • | | Our statement in “Item 8. Financial Statements and Supplementary Data—Notes to Consolidated Financial Statements — Note 3. Financial Instruments” that we believe the $13.0 million of impairment we recorded is temporary as we have both the ability and intent to hold these securities to recovery, which statement is subject to certain risks and uncertainties, including, without limitation, our assumption that we will continue to have the ability to hold the securities and that the value of these securities will be recovered without incurring significant losses; |
| • | | Our statement in “Item 8. Financial Statements and Supplementary Data — Notes to Consolidated Financial Statements — Note 5. Goodwill and Other Intangible Assets” of our future estimated amortization expense for the identifiable intangible assets, which statement is subject to certain risks and uncertainties, including, without limitation, the accuracy of our accounting judgments and estimates underlying the amortization expense amount; |
| • | | Our statement in “Item 8. Financial Statements and Supplementary Data — Notes to Consolidated Financial Statements — Note 7. Restructuring and Other Charges (Benefits)” that we estimate that future rent obligations will be paid in cash through 2017, which statement is subject to certain risks and uncertainties, including, without limitation unanticipated amendments to our leased facilities and inability to accurately predict the effectiveness of our restructuring plans; |
| • | | Our statement in “Item 8. Financial Statements and Supplementary Data — Notes to Consolidated Financial Statements — Note 8. Borrowing Arrangements” that (1) we expect to use the proceeds from our long-term senior unsecured revolving credit facility, if any, for working capital and other general corporate purposes, including the repurchase of our own common shares, and (2) we may utilize such line of credit to fund the repayment of our current outstanding debt due June 25, 2009, which statements are subject to certain risks and uncertainties, including, without limitation unanticipated need to use credit facility proceeds to pay expenses prior to the expiration of the long-term senior unsecured revolving credit facility in 2011 and an unexpected increase in expenses; and |
| • | | Our statement in “Item 8. Financial Statements and Supplementary Data — Notes to Consolidated Financial Statements — Note 12. Income Taxes” that we do not anticipate a reduction of our unrecognized tax benefits as a result of a lapse of the applicable statutes of limitations, which statement is subject to certain risks and uncertainties, including, without limitation our inability to predict our unrecognized tax benefits. |
Introduction
The following Management’s Discussion and Analysis of Financial Condition and Results of Operations (MD&A) is intended to provide readers with an understanding of Novellus. Our MD&A addresses the following topics:
| • | | Overview of Our Business and Industry; |
| • | | Financial Performance Overview; |
31
| • | | Critical Accounting Policies; |
| • | | Liquidity and Capital Resources; |
| • | | Off-Balance Sheet Arrangements; |
| • | | Contractual Obligations; and |
| • | | Recent Accounting Pronouncements. |
Overview of Our Business and Industry
Novellus Systems, Inc. is a California corporation organized in 1984. At Novellus, we primarily develop, manufacture, sell and support equipment used in the fabrication of integrated circuits, commonly called chips or semiconductors. Customers for these products manufacture chips for sale or for incorporation in their own products, or provide chip-manufacturing services to third parties. The segment of our business serving this area is the Semiconductor Group. In 2004, Novellus entered into market segments beyond semiconductor manufacturing with the acquisition of Peter Wolters AG, a German company specializing in lapping and polishing equipment for a number of industries. With the acquisition of Switzerland-based Voumard Machine Co. SA in 2005, we expanded our product offerings to include high-precision machine manufacturing tools. We call this segment the Industrial Applications Group (IAG).
In the Semiconductor Group our business depends on capital expenditures made by integrated circuit manufacturers, who in turn are dependent on corporate and consumer demand for integrated circuits and the electronic products which use them. Since the industry in which we operate is driven by spending for electronic products, our business is directly affected by growth or contraction in the global economy as well as by the adoption of new technologies. Demand for personal computers, the expansion of the Internet and telecommunications industries, and the emergence of new applications in consumer electronics have a direct impact on our business. In addition, the industry is characterized by intense competition and rapidly changing technology. We continue to work closely with our customers and make substantial investments in research and development in order to deliver innovative products which enhance productivity for our customers and utilize the latest technology. We believe these investments have positioned us for future growth.
In the Industrial Applications Group our business depends on capital expenditures made by manufacturers in sectors such as automotive, aircraft and electronic products, parts and components. At the broadest level, the demand for machine tools is highly sensitive to macroeconomic conditions, as our customer base includes some of the most cyclically sensitive industries in the economy. As a result, such variables as the outlook for overall economic growth, fixed investment and durable goods shipments directly affect the growth of our business. Our industrial business also depends on niche applications in addition to the general machine tool cycle. As we continue to expand our capabilities in this segment, our operations are increasingly impacted by the prime wafer industry which, similar to the semiconductor segment, is also characterized by intense competition and rapidly changing technology.
As a supplier to the global semiconductor and semiconductor-related industries, we are subject to business cycles and trends which are difficult to predict. As indicated above, our Semiconductor Group products are used to manufacture chips that are used throughout the electronics industry, including the personal computer, mobile phone, consumer electronics and portable media player markets. Our customers operate principally in the semiconductor memory and logic markets.
The demand for our products is affected by the profitability of our customers which is driven by capacity and market supply for their products. In fiscal 2006 and 2007, our memory customers grew capacity and those
32
additions outpaced the current rate of demand. The resulting overcapacity and weak pricing combined with tight liquidity in the credit markets caused memory customers to delay capital spending and, in some instances, constrain or retire some of their capacity output during 2008. These actions were expected to stabilize capacity and average selling prices. However, due to the continued rapid contraction in the world-wide economy combined with the general lack of capital availability, conditions worsened during the fourth quarter of 2008. As a result, we no longer expect to benefit in the short-term from capital spending typically made by our customers to increase capacity in response to the worldwide consumption of chips that has historically grown at an annual rate of 10%. In 2009, unit demand for semiconductors is likely to fall for the first time since 2001, leading to a decline in semiconductor revenues and an increase in semiconductor inventories. This further increases the pressure on semiconductor manufacturers to carefully match capacity with demand which has lowered their spending on capital equipment in 2009. However, in keeping with the historical cyclical nature of the industry, chip unit growth is expected to resume in 2010 and beyond, and with it, spending on semiconductor equipment. We anticipate that revenues in the near term will most likely be generated from technology upgrades and maintenance on, or replacement of, currently deployed equipment rather than capacity additions.
Given the significant downward pressure on revenues, we continue to focus on operational execution and our cost structure to improve operating results. Over the course of the year, we have reduced our combined SG&A and R&D operating expenses by $63.2 million compared to 2007. We plan to continue managing both our variable and fixed cost structure with the objective of minimizing our net cash outflow during fiscal 2009. Our goal is to align our cost structure to survive the unusually low capital expenditure requirements from our customers in the short-term while maintaining sufficient resources to adequately respond to our customers when the industry returns to a more normal steady state of capital expenditures. We expect gross profit, as a percentage of net sales, to continue to be negatively impacted in 2009 due to lower facilities utilization on reduced shipment volumes. If our current forecasts deteriorate, we may also be required to increase our inventory write-downs which would further negatively impact gross margin in 2009.
We focus on certain key quarterly financial data to manage our business. Net sales, gross profit, net income and net income per share are the primary measures we use to monitor performance. We also use certain non-GAAP measures, such as shipments and net orders, to assess business trends and performance. Shipments consist of products shipped to customers, without regard to net sales adjustments such as deferrals associated with customer acceptance. Net orders, which are also referred to as bookings, consist of current period orders less current period cancellations and other adjustments. Net orders reported for the fourth quarter of 2008 were reduced by $44.9 million due to customer order cancellations and backlog adjustments based upon our assessment that certain customers may not be in a financial position to take delivery within the next twelve months. Shipments and net orders are used to forecast and plan future operations. We do not report orders for systems with delivery dates more than 12 months from the latest balance sheet date.
The following table sets forth certain quarterly and annual financial information for the periods indicated (in thousands, except per share data):
| | | | | | | | | | | | | | | | | | | | |
| | | Quarterly Financial Data | | | Year Ended
December 31 | |
| | | First
Quarter | | | Second
Quarter | | | Third
Quarter | | | Fourth
Quarter | | |
2008: | | | | | | | | | | | | | | | | | | | | |
Net sales | | $ | 314,713 | | | $ | 257,740 | | | $ | 250,098 | | | $ | 188,453 | | | $ | 1,011,004 | |
Gross profit | | $ | 144,940 | | | $ | 110,963 | | | $ | 111,524 | | | $ | 68,517 | | | $ | 435,944 | |
Net income (loss) | | $ | 15,529 | | | $ | (2,385 | ) | | $ | 1,397 | | | $ | (130,251 | ) | | $ | (115,710 | ) |
Diluted net income (loss) per share | | $ | 0.15 | | | $ | (0.02 | ) | | $ | 0.01 | | | $ | (1.36 | ) | | $ | (1.18 | ) |
Shipments | | $ | 312,857 | | | $ | 240,319 | | | $ | 230,153 | | | $ | 175,635 | | | $ | 958,964 | |
Increase (decrease) in shipments from prior period | | | (14 | )% | | | (23 | )% | | | (4 | )% | | | (24 | )% | | | (39 | )% |
Net orders | | $ | 297,025 | | | $ | 234,628 | | | $ | 202,765 | | | $ | 82,695 | | | $ | 817,113 | |
Increase (decrease) in net orders from prior period | | | (13 | )% | | | (21 | )% | | | (14 | )% | | | (59 | )% | | | (41 | )% |
33
| | | | | | | | | | | | | | | | | | | | |
| | |
| | | Quarterly Financial Data | | | Year Ended
December 31 | |
| | | First
Quarter | | | Second
Quarter | | | Third
Quarter | | | Fourth
Quarter | | |
2007: | | | | | | | | | | | | | | | | | | | | |
Net sales | | $ | 396,974 | | | $ | 416,335 | | | $ | 393,277 | | | $ | 363,463 | | | $ | 1,570,049 | |
Gross profit | | $ | 194,909 | | | $ | 208,110 | | | $ | 194,307 | | | $ | 171,863 | | | $ | 769,189 | |
Net income | | $ | 53,783 | | | $ | 57,345 | | | $ | 49,711 | | | $ | 52,861 | | | $ | 213,700 | |
Diluted net income per share | | $ | 0.42 | | | $ | 0.45 | | | $ | 0.41 | | | $ | 0.47 | | | $ | 1.75 | |
Shipments | | $ | 389,052 | | | $ | 436,382 | | | $ | 387,817 | | | $ | 363,055 | | | $ | 1,576,306 | |
Increase (decrease) in shipments from prior period | | | (0 | )% | | | 12 | % | | | (11 | )% | | | (6 | )% | | | (2 | )% |
Net orders | | $ | 412,219 | | | $ | 332,201 | | | $ | 305,329 | | | $ | 343,086 | | | $ | 1,392,835 | |
Increase (decrease) in net orders from prior period | | | (7 | )% | | | (19 | )% | | | (8 | )% | | | 12 | % | | | (22 | )% |
Due to the cyclical nature of our business, we expect that net orders will continue to fluctuate. The receipt of net orders in a particular quarter affects revenue in subsequent quarters. Net orders result in revenue either at shipment and transfer of title or upon customer acceptance of the equipment. Our revenue recognition policy addresses the distinction between the revenue recognized upon shipment and transfer of title and the revenue recognized upon customer acceptance. Equipment generally ships within two to six months of receiving the related order and if applicable, customer acceptance is typically received one to six months after shipment. These time lines are general estimates and actual times may vary depending on specific customer circumstances.
Demand for our systems has varied significantly from period to period as a result of several factors, including but not limited to, downturns in the economy and semiconductor industry, supply of and demand for semiconductor devices, and competition in the semiconductor industry among suppliers of similar products. For these and other reasons, our results of operations for fiscal years 2008, 2007 and 2006 may not necessarily be indicative of future operating results.
Financial Performance Overview
The following is an overview of our financial performance for the year ended December 31, 2008 compared to the year ended December 31, 2007:
| • | | Net sales decreased 36% to $1.01 billion from $1.57 billion; |
| • | | Net income decreased by $329.4 million to a net loss of $115.7 million from net income of $213.7 million; |
| • | | Diluted net income (loss) per share decreased to $(1.18) from $1.75; |
| • | | Shipments decreased 39% to $959.0 million from $1.58 billion; and |
| • | | Net orders decreased 41% to $817.1 million from $1.39 billion. |
Critical Accounting Policies
The preparation of financial statements in conformity with U.S. generally accepted accounting principles requires that we make estimates and judgments that affect the reported amounts of assets, liabilities, revenues and expenses and the related disclosure of contingent assets and liabilities. On an ongoing basis, we evaluate our assumptions and estimates, including those related to recognition of revenue, valuation of inventory, valuation of goodwill and other intangible assets, valuation of deferred tax assets, adequacy of warranty obligations,
34
measurement of restructuring and impairment charges, compliance with hedge accounting for derivatives, measurement of stock-based compensation expense, valuation of investments, collectability and measurement of accounts receivable and litigation. We base our estimates on historical experience and on various assumptions that are believed to be reasonable under the circumstances, the results of which form the basis for making judgments about the carrying values of assets and liabilities that are not readily apparent from other sources. Actual results may differ from these estimates under different assumptions or conditions. We believe the following critical accounting policies affect the more significant judgments and estimates used in the preparation of our Consolidated Financial Statements.
Revenue Recognition
We recognize revenue when persuasive evidence of an arrangement exists, delivery has occurred or services have been rendered, the seller’s price is fixed or determinable, and collectability is reasonably assured. It is common for us to ship equipment and transfer title at the point of delivery to the buyer under the terms of our contractual relationship. When uncertainty exists as to customer acceptance due to customer-specific equipment performance conditions, we defer revenue recognition until acceptance and record the deferred revenue and associated costs of sales in deferred profit on our Consolidated Balance Sheet.
Our equipment sales generally have two elements: (a) the equipment and (b) installation of that equipment. While installation services are not essential to the functionality of the delivered equipment, final payment is not billable until customer acceptance for many of our sales contracts. Provided that we meet defined customer acceptance experience levels with both the customer and the specific type of equipment, we recognize revenue for the equipment element upon shipment and transfer of title. For those sales contracts where final payment is not billable until customer acceptance, the final payment (which typically exceeds the fair value of the installation services) is recognized upon customer acceptance. This practice creates variability in our gross margin, as revenue related to customer acceptance is recognized with little or no associated costs, which may not be indicative of our future operating performance.
We also enter into revenue arrangements that involve the sale of multiple pieces of equipment under a single arrangement. Revenue under these arrangements is allocated among the separate elements based on their relative fair values, provided the elements have value on a stand alone basis and there is objective and reliable evidence of fair value. Our sales arrangements do not include a general right of return. In cases where there is objective and reliable evidence of the fair value of the undelivered item(s) in an arrangement but no such evidence for the delivered item(s), the residual method is used to allocate the arrangement consideration.
Revenue related to sales of spare parts is recognized upon shipment. Revenue related to maintenance and service contracts is recognized ratably over the duration of the contracts. Unearned maintenance and service contract revenue is included in other accrued liabilities.
Inventory Valuation
We periodically assess the recoverability of all inventories, including raw materials, work-in-process, finished goods, evaluation systems and spare parts, to determine whether adjustments are required to present inventory at the lower of cost or market. Inventory that is obsolete, or that is in excess of our forecasted usage is written down to its estimated realizable value based on assumptions about future demand and market conditions. If actual demand is lower than our forecast, additional inventory write-downs may be required.
Goodwill and Other Intangible Assets
We review our long-lived assets, including goodwill and other intangible assets, for impairment at least annually or whenever events or changes in circumstances indicate that the carrying amount of these assets may not be recoverable. In accordance with our policy, we perform our goodwill impairment test in the fourth quarter of
35
each fiscal year separately for each of our reporting units. We define reporting units as the individual segments we operate. The first step of the test identifies if potential impairment may have occurred, while the second step measures the amount of the impairment, if any. Impairment is present when the carrying amount of net assets exceeds the fair value estimated during the first step of our annual goodwill impairment test. The estimation of the fair value of each reporting units is determined based upon data generated from a discounted cash flow model, known as the income approach, and a comparable market price model, known as the market approach. The income approach requires us to make a number of assumptions including future growth rates, expense trends and working capital turnover ratios for each reporting unit over an extended period of time. Although the assumptions we utilize are consistent with the assumptions used to generate our annual strategic plan, there is significant judgment in the timing and level of future cash flows attributable to each reporting unit.
In the first step of our impairment test, our estimation of fair value indicated potential impairment within our Industrial Applications Group. The fair value estimate of our Semiconductor Group exceeded the book value for this reporting unit by a narrow margin. As a result, measurement of impairment was only performed for our Industrial Applications Group and we recognized a non-cash charge of $99.5 million to reduce the carrying value of goodwill within this reporting unit. At that time we also reviewed our long-lived tangible and intangible assets within the Industrial Applications Group for potential impairment. We determined that the forecasted undiscounted cash flows related to the asset groups were in excess of their carrying values, and therefore these assets were not impaired.
If our future operating results do not meet current forecasts or if we have a sustained decline in our market capitalization that is determined to be indicative of a reduction in fair value of one or more of our reporting units, future impairment charges related to goodwill or long-lived assets for both of our reporting units may be required. As of December 31, 2008, the carrying amounts of goodwill on our Consolidated Balance Sheet subject to impairment are $108.4 million and $17.7 million for the Semiconductor Group and Industrial Applications Group, respectively. We amortize our intangible assets with definite lives on a straight-line basis over their estimated useful lives.
Income Taxes
As of December 31, 2008, we had approximately $105.7 million of net deferred tax assets. We believe deferred tax assets will be realized due to anticipated future income and our ability to carry back losses to prior years. We have considered all sources of taxable income and ongoing prudent and feasible tax planning strategies in assessing the need for the valuation allowance. If in the future we determine that we would not be able to realize all or part of our net deferred tax assets, a valuation allowance for deferred tax assets would decrease income in the period in which such determination is made. If market conditions change significantly within the next 12 months then it is reasonably possible that our valuation allowance will change.
Warranty Obligations
Our warranty policy generally states that we will provide warranty coverage for a predetermined amount of time on systems and modules for material and labor to repair and service the equipment. We record the estimated cost of warranty coverage to cost of sales when revenue is recognized. The estimated cost of warranty is determined by the warranty term, as well as the average historical labor and material costs for a specific product. Should actual product failure rates or material usage differ from our estimates, revisions to the estimated warranty liability may be required. These revisions have had, and in the future could have, a positive or negative impact on gross profit. We review the actual product failure rates and material usage rates on a quarterly basis and adjust our warranty liability as necessary.
Restructuring and Impairment Charges
Restructuring activities are recorded under the provisions of Statement of Financial Accounting Standard (SFAS) No. 146, “Accounting for Costs Associated with Exit or Disposal Activities” (SFAS 146). SFAS 146 requires
36
that a liability for costs associated with an exit or disposal activity be recognized when the liability is incurred, rather than when the exit or disposal plan is approved. Accordingly, restructuring accruals are recorded when management initiates an exit plan that will cause us to incur costs that have no future economic benefit. The restructuring accrual related to vacated facilities is calculated net of estimated sublease income. Sublease income is estimated based on estimated occupancy rates and current market rates for similar properties. If we are unable to sublet the vacated properties on a timely basis or if we are forced to sublet them at lower rates due to changes in market conditions, we will adjust the accruals accordingly.
Hedge Accounting for Derivatives
We utilize foreign currency forward exchange contracts to hedge certain anticipated foreign currency sales transactions. When specific criteria required by SFAS No. 133, “Accounting for Derivative and Hedging Activities,” (SFAS 133) have been met, changes in fair values of hedge contracts relating to anticipated transactions are recorded in other comprehensive income (OCI) rather than net income until the underlying hedged transaction affects net income. By their very nature, our estimates of anticipated transactions may fluctuate over time and may ultimately vary from actual transactions. When we determine that the transactions are no longer probable within a certain time frame, we are required to reclassify the cumulative changes in the fair values of the related hedge contracts from other comprehensive income to net income.
Stock-Based Compensation Expense
We account for stock-based compensation in accordance with the provisions of SFAS 123R. Under the fair value recognition provision of SFAS 123R, stock-based compensation cost is estimated at the grant date based on the fair value of the award and is recognized as expense ratably over the requisite service period of the award. Determining the appropriate fair value model and calculating the fair value of stock-based awards, which includes estimates of stock price volatility, forfeiture rates and expected lives, requires judgment that could materially impact our operating results. See Note 14 to our Consolidated Financial Statements for discussion of the impact of SFAS 123R on our Consolidated Financial Statements and significant estimates used.
Valuation of Investments
In valuing our investments we predominantly use market data or data derived from market sources. When market data is not available, such as when the investment is illiquid, we employ a cash-flow-based modeling technique to arrive at the recorded fair value. This process involves incorporating our assumptions about the anticipated term and the yield that a market participant would require to purchase the security in the marketplace. As of December 31, 2008 we have recognized an other-than-temporary impairment loss of $3.5 million in our results of operations and an unrealized temporary impairment loss of $13.0 million within OCI based upon our assessment of the fair value of our auction-rate securities. See Note 3 to our Consolidated Financial Statements.
Allowance for Doubtful Accounts
We evaluate our allowance for doubtful accounts based on a combination of factors. In circumstances where specific invoices are deemed to be uncollectible, we provide a specific allowance for bad debt against the amount due to reduce the net recognized receivable to the amount we reasonably believe will be collected. We also provide allowances based on our write-off history. We charge accounts receivable balances against our allowance for doubtful accounts once we have concluded our collection efforts are unsuccessful. Accounts receivable is considered past due when not paid in accordance with the contractual terms of each arrangement.
37
Litigation
The outcomes of legal proceedings and claims brought against us are subject to significant uncertainty. SFAS No. 5, “Accounting for Contingencies,” requires that an estimated loss from a loss contingency such as a legal proceeding or claim should be accrued by a charge to income if it is probable that an asset has been impaired or is required if there is at least a reasonable possibility that a loss has been incurred. In determining whether a loss should be accrued we evaluate, among other factors, the degree of probability of an unfavorable outcome and the ability to make a reasonable estimate of the amount of loss. Changes in these factors could materially impact our financial position or our results of operations.
Results of Operations
Net Sales
| | | | | | | | | | | | | | | |
| | | Years Ended December 31, | | % Change
in 2008 | | | % Change
in 2007 | |
| | | 2008 | | 2007 | | 2006 | | |
| | | (Dollars in thousands) | | | | | | |
Semiconductor Group | | $ | 837,651 | | $ | 1,395,703 | | $ | 1,547,540 | | (40 | )% | | (10 | )% |
Industrial Applications Group | | | 173,353 | | | 174,346 | | | 110,976 | | (1 | )% | | 57 | % |
| | | | | | | | | | | | | | | |
Net sales | | $ | 1,011,004 | | $ | 1,570,049 | | $ | 1,658,516 | | (36 | )% | | (5 | )% |
| | | | | | | | | | | | | | | |
Net sales are correlated to shipments in the current period, previously reported shipments and timing of customer acceptance. Semiconductor Group net sales decreased $558.1 million from 2007 to 2008 primarily as a result of the world-wide economic downturn and the related unavailability of credit to certain customers. Industrial Applications Group 2008 net sales remained relatively flat from 2007. Excluding the impact of favorable exchange rates, net sales decreased by $14.8 million, or 9%, in 2008 from 2007 due to the weakening demand for polishing systems from silicon wafer customers during the last half of 2008 and the overall decline in the general economy.
Net sales related to our Semiconductor Group decreased $151.8 million from 2006 to 2007 primarily as a result of weakening demand related to excess capacity for our DRAM and foundry customers. Net sales related to our Industrial Applications Group increased by $63.4 million from 2006 to 2007 due primarily to strong demand for polishing systems by silicon wafer manufacturers. Favorable changes in exchange rates increased net sales by 9% in the Industrial Applications Group from 2006 to 2007.
Geographical net sales as a percentage of total net sales based on the location of our customers’ facilities were as follows:
| | | | | | | | | |
| | | Years Ended
December 31, | |
| | | 2008 | | | 2007 | | | 2006 | |
Asia | | 57 | % | | 66 | % | | 63 | % |
North America | | 31 | % | | 26 | % | | 28 | % |
Europe | | 12 | % | | 8 | % | | 9 | % |
A significant portion of our net sales is generated in Asia, primarily because a substantial portion of the world’s semiconductor manufacturing capacity is located there. Our Asia region includes Korea, Japan, Singapore, Malaysia, China and Taiwan. We plan to continue to focus on expanding our market presence in Asia, as we believe that significant additional growth potential exists in this region over the long term.
38
Gross Profit
| | | | | | | | | | | | | | | | | | |
| | | Years Ended December 31, | | | %
Change
in 2008 | | | %
Change
in 2007 | |
| | | 2008 | | | 2007 | | | 2006 | | | |
| | | (Dollars in thousands) | | | | | | | |
Gross profit | | $ | 435,944 | | | $ | 769,189 | | | $ | 824,349 | | | (43 | )% | | (7 | )% |
% of net sales | | | 43 | % | | | 49 | % | | | 50 | % | | | | | | |
Gross profit, as a percentage of net sales, was 43% or a decrease of 6 percentage points from the prior year. During 2008 we were unable to reduce our manufacturing costs at the same rate as the decline in our shipment volumes. As a result we incurred current period costs related to net manufacturing absorption which were approximately $20.2 million higher than the comparable costs in 2007. This reduced our gross profit percentage by 2 percentage points when comparing 2008 to 2007. We also incurred approximately $11.4 million more in inventory write-downs in 2008 than in 2007, $8.6 million of which was related to internal decisions to focus on our core product lines. This impacted our gross profit percentage in 2008 by 1 percentage point. In addition, a higher percentage of net sales were from the Industrial Applications Group where margins are generally lower than in the Semiconductor Group.
The decrease in gross profit as a percentage of net sales in 2007 compared to 2006 is due primarily to changes in product mix and a higher percentage of net sales from the Industrial Applications Group where margins are generally lower than in the Semiconductor Group.
Our gross profit from period to period is affected by the timing of when revenue for certain product sales is recognized in accordance with our revenue recognition policy. See Note 2 to our Consolidated Financial Statements for further disclosure of our accounting policy.
Selling, General and Administrative (SG&A)
| | | | | | | | | | | | | | | | | | |
| | | Years Ended December 31, | | | %
Change
in 2008 | | | %
Change
in 2007 | |
| | | 2008 | | | 2007 | | | 2006 | | | |
| | | (Dollars in thousands) | | | | | | | |
SG&A expense | | $ | 224,233 | | | $ | 266,018 | | | $ | 261,389 | | | (16 | )% | | 2 | % |
% of net sales | | | 22 | % | | | 17 | % | | | 16 | % | | | | | | |
SG&A expense includes compensation and benefits for corporate, financial, marketing, sales and administrative personnel as well as travel expenses and professional service fees. Also included are expenses for rents, utilities, and depreciation and amortization related to the assets utilized by these functions.
SG&A expense in 2008 includes $6.3 million of charges incurred in the second and fourth quarters of 2008 related primarily to reductions in workforce to align our cost structure to the current economic environment. Excluding those charges, SG&A expense decreased $48.1 million in 2008 from the prior year. The majority of the decrease is attributable to lower employee compensation costs due to lower headcount as well as a reduction in variable and incentive compensation such as profit sharing and commissions. SG&A expense increased as a percentage of net sales as a result of the decline in net sales from the prior year.
SG&A expense increased $4.6 million in 2007 from 2006. This primarily relates to an overall increase in employee compensation costs. Merit pay increases during the year were partially offset by reductions in stock-based compensation expense and cost savings from additional business shutdowns. Stock-based compensation decreased by $4.8 million, primarily due to the reversal of 2006 expense for performance-based restricted stock awards where vesting was no longer probable and the increase in our estimated option forfeiture rate in 2007 from 2006. SG&A expense increased as a percentage of net sales as a result of the decline in net sales from the prior year.
39
Research and Development (R&D)
| | | | | | | | | | | | | | | | | | |
| | | Years Ended December 31, | | | % Change
in 2008 | | | % Change
in 2007 | |
| | | 2008 | | | 2007 | | | 2006 | | | |
| | | (Dollars in thousands) | | | | | | | |
R&D expense | | $ | 219,660 | | | $ | 241,025 | | | $ | 244,201 | | | (9 | )% | | (1 | )% |
% of net sales | | | 22 | % | | | 15 | % | | | 15 | % | | | | | | |
R&D expense includes compensation and benefits for research and development personnel, project materials, chemicals and other direct expenses incurred in product and technology development. Also included are expenses for depreciation, rents, utilities and equipment repairs and maintenance. Our significant investments in R&D over the past several years reflect our strong commitment to the continuous improvement of our current product lines and the development of new products and technologies. We continue to believe that significant investment in R&D is required to remain competitive, and we plan to continue to invest in new products and enhancement of our current product lines.
R&D expense in 2008 includes $8.6 million in charges incurred in the second and fourth quarters of 2008 related primarily to reductions in workforce and the impairment of certain R&D assets in order to focus on certain product lines. Excluding those charges, R&D expense decreased by $30.0 million in 2008 from 2007 generally due to lower headcount and lower profit sharing expense as a result of the operating loss in 2008. R&D expense increased as a percentage of net sales as a result of the decline in net sales from the prior year.
R&D expense decreased in absolute dollars in 2007 from 2006 generally due to lower stock-based compensation expense of $2.5 million, combined with reduced depreciation and related facility costs resulting from previous restructuring actions. As a result, R&D expense as a percentage of net sales remained consistent with the prior year.
Legal Settlement
| | | | | | | | | | | | |
| | | Years Ended December 31, | |
| | | 2008 | | | 2007 | | | 2006 | |
| | | (Dollars in thousands) | |
Legal settlement | | $ | — | | | $ | — | | | $ | 3,250 | |
% of net sales | | | 0 | % | | | 0 | % | | | less than 1 | % |
In 2006, we incurred a charge of $3.3 million to settle a customer indemnity claim. No such legal charges were incurred during the years ended December 31, 2008 and 2007.
Restructuring and Other Charges (Benefits), net
| | | | | | | | | | | | |
| | | Years Ended December 31, | |
| | | 2008 | | | 2007 | | | 2006 | |
| | | (Dollars in thousands) | |
Restructuring and other charges (benefits) | | $ | 4,545 | | | $ | (8,013 | ) | | $ | 10,735 | |
% of net sales | | | less than 1 | % | | | (1 | )% | | | 1 | % |
In 2008, we incurred $4.5 million in additional restructuring charges primarily related to changes in estimates of future sublease income for facility exit activities recorded in prior years.
In 2007, we completed the sale of certain facilities in San Jose, California, resulting in a gain of $9.1 million that is included in operating income as part of Restructuring and other charges (benefits), net. This sale substantially completes the actions contemplated under the restructuring plan implemented during the first quarter of 2006. Offsetting the gain on sale of assets was $1.1 million in additional expenses resulting from changes in estimates associated primarily with future estimated sublease income.
40
During the first quarter of 2006, we implemented a restructuring plan to dispose of certain owned facilities located in San Jose, California. We considered the change in planned use of the facilities as an indicator of impairment and determined that two of the facilities were impaired, resulting in impairment charges of $8.9 million to write these facilities down to their estimated fair value.
In 2006, we also recorded restructuring charges of $6.0 million related to future lease payments, $1.3 million related to accelerated depreciation of leasehold improvements and $0.2 million related to other charges, all in connection with a restructuring plan we implemented in 2005 to relocate certain operations from Chandler, Arizona to San Jose, California and Tualatin, Oregon. These charges were offset by the reversal of a previously recorded restructuring accrual of $5.5 million due to a change in future estimated sublease income.
See Note 7 to our Consolidated Financial Statements for further discussion of our restructuring activities.
Impairment of Goodwill
| | | | | | | | | | | | |
| | | Years Ended December 31, | |
| | | 2008 | | | 2007 | | | 2006 | |
| | | (Dollars in thousands) | |
Impairment of goodwill | | $ | 99,522 | | | $ | — | | | $ | — | |
% of net sales | | | 10 | % | | | 0 | % | | | 0 | % |
In 2008, we incurred a non-cash goodwill impairment charge of $99.5 million to reduce the carrying value of goodwill within our Industrial Applications Group reporting unit. Further discussion of this charge is included in our critical accounting policy section and Note 5 to our Consolidated Financial Statements.
Interest and Other Income, net
| | | | | | | | | | | | | | | | | | |
| | | Years Ended December 31, | | | % Change
in 2008 | | | % Change
in 2007 | |
| | | 2008 | | | 2007 | | | 2006 | | | |
| | | (Dollars in thousands) | |
Interest and other income, net | | $ | 4,920 | | | $ | 44,630 | | | $ | 34,145 | | | (89 | )% | | 31 | % |
% of net sales | | | Less than 1 | % | | | 3 | % | | | 2 | % | | | | | | |
Interest and other income, net includes interest income, interest expense and other non-operating items.
Interest and other income, net decreased $39.7 million in 2008 compared to 2007. This is due primarily to decreased interest income of $20.8 million associated with a combination of lower cash balances and lower interest rates during the year. We also incurred a loss of $3.5 million in 2008 compared to a gain of $4.5 million in 2007 related to foreign currency hedges. Additionally, we recorded a $3.5 million other-than-temporary impairment loss on certain investments in auction-rate securities during 2008.
Interest and Other income, net increased $10.5 million in 2007 compared to 2006. This is due primarily to increased interest income of $10.6 million associated with higher interest rates during the year.
Income Taxes
Our provisions for income taxes were $8.6 million, $101.1 million and $149.9 million in 2008, 2007 and 2006, respectively. The decrease in the provision for income taxes from 2007 to 2008 is primarily due to our current year pre-tax loss compared to the prior year pre-tax income and the geographical mix of those losses in the current year. Also impacting the typical relationship between pre-tax income (loss) and the provision for income taxes was the minimal benefit in the current year related to the goodwill impairment charge within the Industrial Applications Group reporting unit and the capital losses related to the other-than-temporary impairment charge in our auction rate securities portfolio.
41
The reduction in our effective tax rate from 44% in 2006 to 32% in 2007 is due to the inclusion of a non-recurring charge in 2006 of $46.1 million for foreign losses with no current tax benefit associated with the implementation of our new global business structure offset by an $8.0 million benefit in 2006 from the adjustment of tax reserves resulting from the conclusion of certain tax examinations. As a result of our global business structure, in periods of profitability we expect to achieve tax rates lower than current federal rates as we benefit from a geographical mix of income at lower rates, foreign tax credit planning strategies and capital and foreign losses which may be carried forward from prior years. Likewise, in periods of operating losses, those losses accumulate in lower tax jurisdictions which minimize our benefit.
Our future effective income tax rate depends on various factors, such as pre-tax income (loss), tax legislation, the geographic composition of pre-tax income (loss) and non-deductible expenses incurred in connection with acquisitions.
With certain exceptions, we are no longer subject to U.S. federal or state income tax examinations by tax authorities for years prior to 2004, although the utilization of tax loss and credit carry forwards from fiscal years 2001 through 2003 could be subject to examination. In addition, certain of our foreign subsidiaries are subject to examination by foreign taxing authorities. We believe that adequate accruals have been provided for any potential adjustments that may result from these examinations. The timing of the settlement of these examinations is uncertain.
Liquidity and Capital Resources
Cash, Cash Equivalents and Short-Term Investments
| | | | | | |
| | | December 31,
2008 | | December 31,
2007 |
| | | (Dollars in thousands) |
Cash and cash equivalents | | $ | 184,332 | | $ | 175,071 |
Short-term investments | | | 286,556 | | | 421,695 |
| | | | | | |
Total cash, cash equivalents and short-term investments | | $ | 470,888 | | $ | 596,766 |
| | | | | | |
We have historically financed our operating and capital resource requirements through cash flows from operations, sales of equity securities and borrowings. Our primary source of liquidity as of December 31, 2008 consisted of $470.9 million of cash, cash equivalents and short-term investments. This amount represents a decrease of $125.9 million from $596.8 million as of December 31, 2007, which is primarily due to the reclassification of auction-rate securities to long-term investments.
Restricted Cash, Cash Equivalents and Long-Term Investments
| | | | | | |
| | | December 31,
2008 | | December 31,
2007 |
| | | (Dollars in thousands) |
Restricted cash and cash equivalents | | $ | 119,702 | | $ | 161,050 |
Long-term investments | | | 91,873 | | | — |
| | | | | | |
Total restricted cash and long-term investments | | $ | 211,575 | | $ | 161,050 |
| | | | | | |
We held $211.6 million in restricted cash and long-term investments as of December 31, 2008, an increase of $50.5 million from $161.1 million as of December 31, 2007. The restricted cash and cash equivalents are primarily money market funds held to secure debt obligations.
Long-term investments relate to tax-exempt auction-rate securities, whose underlying assets are either student loans substantially backed by the federal government or closed-end municipal funds. Beginning in February
42
2008, these auction-rate securities became illiquid because their scheduled auctions failed to settle. An auction failure occurs when the parties wishing to sell securities at auction cannot. As a result, these investments were reclassified to long-term in our Consolidated Balance Sheet as we may have limited or no opportunities to liquidate these investments and fully recover their par value in the near term. We recorded a temporary unrealized loss of $13.0 million within other comprehensive income and an other-than-temporary loss of $3.5 million within other income (expense), net related to these investments in our Consolidated Financial Statements as of December 31, 2008. See Note 3 to our Consolidated Financial Statements.
Cash Flow Summary
| | | | | | | | | | | | |
| | | Years Ended December 31 | |
| | | 2008 | | | 2007 | | | 2006 | |
| | | (Dollars in thousands) | |
Net cash provided by (used in): | | | | | | | | | | | | |
Operating activities | | $ | 189,236 | | | $ | 305,689 | | | $ | 447,153 | |
Investing activities | | | 43,593 | | | | 364,107 | | | | (234,223 | ) |
Financing activities | | | (224,299 | ) | | | (553,862 | ) | | | (197,870 | ) |
Effects of exchange rate changes on cash and cash equivalents | | | 731 | | | | 674 | | | | 3,000 | |
| | | | | | | | | | | | |
Net increase in cash and cash equivalents | | $ | 9,261 | | | $ | 116,608 | | | $ | 18,060 | |
| | | | | | | | | | | | |
Operating
Net cash provided by operating activities for the year ended December 31, 2008 was $189.2 million. The primary source of cash from operating activities was related to the decline in accounts receivable, net, which is primarily due to reduced shipment volumes and strong collection efforts during 2008.
Net cash provided by operating activities for the year ended December 31, 2007 was $305.7 million. The primary sources of cash from operating activities were net income of $213.7 million, adjusted to exclude the effect of non-cash charges and benefits of $126.4 million, offset by increases in working capital levels of $34.4 million.
Net cash provided by operating activities for the year ended December 31, 2006 was $447.2 million. The primary sources of cash from operating activities were net income of $190.0 million, adjusted to exclude the effect of non-cash charges and benefits of $149.9 million, and decreases in working capital levels of $107.3 million.
Investing
Net cash provided by investing activities for the year ended December 31, 2008 was $43.6 million, consisting primarily of cash received from net purchases, sales and maturities of investments of $22.0 million and a decline in restricted cash and cash equivalents of $41.3 million. Net cash was reduced by $17.9 million for capital expenditures and $1.9 million for the purchase of Micron Machine Tools, Inc.
Net cash provided by investing activities for the year ended December 31, 2007 was $364.1 million, consisting primarily of cash received from net purchases, sales and maturities of investments of $367.8 million and proceeds on the sale of property and equipment of $47.2 million which are primarily related to the sale of property and buildings in San Jose. Net cash was reduced by capital expenditures of $33.2 million.
Net cash used in investing activities in the year ended December 31, 2006 was $234.2 million, consisting primarily of cash paid for capital expenditures of $39.4 million and net purchases, sales and maturities of investments of $176.1 million.
43
Financing
Net cash used in financing activities for the year ended December 31, 2008 was $224.3 million, due primarily to the repurchase of common stock for $208.1 million and payments on debt obligations of $26.9 million. These outflows were partially offset by proceeds from employee stock compensation plans of $10.7 million.
Net cash used in financing activities for the year ended December 31, 2007 was $553.9 million, due primarily to the repurchase of common stock for $578.5 million and payments on short-term lines of credit of $18.1 million. These outflows were partially offset by proceeds from employee stock compensation plans of $41.9 million.
Net cash used in financing activities for the year ended December 31, 2006 was $197.9 million, which was due primarily to the repurchase of common stock for $249.9 million and payments on long-term debt of $10.2 million, partially offset by proceeds from employee stock compensation plans of $42.4 million.
Credit Arrangements
We have short-term credit facilities with various financial institutions totaling $223.6 million. These credit facilities bear interest at various rates and expire on various dates through December 2009. As of December 31, 2008, $112.9 million of current obligations were outstanding at an average interest rate of 2.9%, $15.7 million was pledged against outstanding letters of credit and the remaining $95.0 million was unutilized. These facilities consist primarily of an obligation denominated in Euros that was initially used to fund the acquisition of Peter Wolters AG in 2004 and is also used for general corporate purposes. As of December 31, 2008, the agreement allowed for borrowings up to $121.6 million, of which $111.8 million was outstanding. Subsequent to December 31, 2008, we reduced the aggregate available borrowing amount to the amount outstanding, based on our assessment that we would have sufficient cash resources through June 25, 2009 when borrowings under this agreement become due and payable. The effective interest rate as of December 31, 2008 was 2.9% and amounts outstanding are secured by deposits in money market funds, which are included within restricted cash and cash equivalents, current, on our Consolidated Balance Sheet. This credit arrangement includes certain financial covenants, with which we were in compliance as of December 31, 2008. We are in the process of evaluating whether the amounts due under this arrangement will be repaid through existing cash resources, financed using our existing senior unsecured credit facility or refinanced under a new agreement.
We also have a long-term senior unsecured revolving credit facility at an interest rate of LIBOR plus 0.5%. There are currently no amounts outstanding under this agreement. The agreement, which expires in 2011, allows for borrowings up to $150.0 million. We expect to use the proceeds, if any, for working capital and other general corporate purposes, including the repurchase of our own common shares. We also may utilize this line to fund the repayment of our current outstanding debt due June 25, 2009. The agreement contains customary affirmative and negative covenants, financial covenants, representations and warranties and events of default, which are subject to various exceptions and qualifications. We were in compliance with these covenants as of December 31, 2008.
We believe that our current cash position, cash generated through operations and equity offerings, and available borrowings will be sufficient to meet our needs through the next 12 months.
Off-Balance Sheet Arrangements
Standby Letters of Credit
We provide standby letters of credit to certain parties as required for certain transactions we initiate during the ordinary course of business. As of December 31, 2008, the maximum potential amount of future payments that we could be required to make under these letters of credit was approximately $15.7 million. We have not recorded a liability in connection with these arrangements beyond that required to appropriately account for the
44
underlying transaction being guaranteed. We do not believe, based on historical experience and information currently available, that it is probable that any amounts will be required to be paid under these arrangements.
Guarantee Arrangements
We have guarantee arrangements on behalf of certain of our subsidiaries for line-of-credit borrowings and operating leases. In the event of default on these arrangements, we would have a maximum exposure of $144.2 million as of December 31, 2008.
Contractual Obligations
The following is a table summarizing our contractual obligations and purchase commitments under borrowing arrangements and future minimum lease payments under all non-cancelable operating leases as of December 31, 2008.
| | | | | | | | | | | | | | | | | | | | | | | | | |
| | | Years Ending December 31, | | Sublease
Income | | | Net Total |
| | | 2009 | | 2010 | | 2011 | | 2012 | | 2013 | | Thereafter | | |
| | | (Dollars in thousands) |
Non-cancelable operating leases | | $ | 10,898 | | $ | 9,982 | | $ | 9,149 | | $ | 5,812 | | $ | 5,412 | | $ | 15,920 | | $ | (20,654 | ) | | $ | 36,519 |
Purchase commitments | | | 18,236 | | | 2,403 | | | 2,403 | | | 2,408 | | | — | | | — | | | — | | | | 25,450 |
Debt obligations | | | 112,907 | | | — | | | — | | | — | | | — | | | — | | | — | | | | 112,907 |
| | | | | | | | | | | | | | | | | | | | | | | | | |
Total contractual obligations | | $ | 142,041 | | $ | 12,385 | | $ | 11,552 | | $ | 8,220 | | $ | 5,412 | | $ | 15,920 | | $ | (20,654 | ) | | $ | 174,876 |
| | | | | | | | | | | | | | | | | | | | | | | | | |
We have non-cancelable operating leases for various facilities. Rent expense for the years ended December 31, 2008, 2007 and 2006 was approximately $4.5 million, $3.8 million and $4.3 million, respectively, net of sublease income of $1.1 million, $1.0 million and $1.0 million, respectively. Certain of the operating leases contain provisions which permit us to renew the leases at the end of their respective lease terms.
We have firm purchase commitments with various suppliers to ensure the availability of components and services. Our minimum obligation as of December 31, 2008 under these arrangements was $25.5 million. Actual expenditures will vary based upon the volume of the transactions and length of contractual service provided. In addition, the amounts paid under these arrangements may be less in the event that the arrangements are renegotiated or cancelled. Certain agreements provide for potential cancellation penalties. Our policy with respect to all purchase commitments is to record losses, if any, when they are probable and reasonably estimable. We have made adequate provision for potential exposure related to inventory on order which may go unused.
Liabilities related to our pension and post-retirement benefit plans are reported in our Consolidated Balance Sheets but are not reflected in a contractual obligation table due to the absence of stated maturities. We have net obligations as of December 31, 2008 related to our pension plans and post-retirement medical plan of $7.4 million. We funded $0.6 million to these plans in fiscal 2008. We expect to fund an additional $0.5 million in fiscal 2009.
As of December 31, 2008, we have recorded unrecognized tax benefits of $27.6 million and interest and penalties of $4.0 million, both of which are classified as non-current liabilities in the Consolidated Balance Sheet. At this time, the Company is unable to make a reasonably reliable estimate of the timing of payments in individual years due to uncertainties in the timing of tax audit outcomes.
45
Recent Accounting Pronouncements
In September 2006, the Financial Accounting Standards Board (FASB) issued Statement of Financial Accounting Standards (SFAS) No. 157, “Fair Value Measurements” (SFAS 157), which establishes specific criteria for the fair value measurements of financial and nonfinancial assets and liabilities that are already subject to fair value under current accounting rules. SFAS 157 also requires expanded disclosures related to fair value measurements. See Note 3 to our Consolidated Financial Statements for information about fair value measurements. As allowed under FASB Staff Position (FSP) of Financial Accounting Standards (FAS) 157-2, “Effective Date of FASB Statement No. 157” (FSP 157-2), we adopted SFAS 157 for all financial instruments subject to fair value measurements on January 1, 2008 and deferred the adoption of SFAS 157 related to certain fair value measurements of non-financial instruments, such as goodwill, intangibles, property and equipment, and restructuring liabilities, except for those recognized or disclosed at fair value on at least an annual basis. The partial adoption of SFAS 157 was prospective and did not have a significant effect on our Consolidated Financial Statements. We do not expect that the adoption of FSP 157-2 will have a significant impact on our Consolidated Financial Statements. In October 2008, the FASB issued FSP FAS 157-3, “Determining the Fair Value of a Financial Asset When the Market for That Asset Is Not Active” (FSP 157-3), which clarifies the application of SFAS 157 in a market that is not active and provides an example to illustrate key considerations in determining the fair value of a financial asset when the market for that financial asset is not active. FSP 157-3 was effective upon issuance, including prior periods for which financial statements had not been issued. The adoption of FSP 157-3 did not have a significant impact on our Consolidated Financial Statements.
In February 2007, the FASB issued SFAS No. 159, “The Fair Value Option for Financial Assets and Financial Liabilities — Including an amendment of SFAS 115” (SFAS 159). SFAS 159 permits a company to voluntarily elect to use fair value, instead of historic or original cost, to account for certain financial assets and liabilities. The fair value option is designated on an item-by-item basis, is irrevocable and requires that changes in fair value in subsequent periods be recognized in earnings in the period of change. We adopted SFAS 159 on January 1, 2008. The adoption had no impact on our Consolidated Financial Statements as we did not make a fair value election for any of our existing financial assets and liabilities. Any election to use the fair value method for future eligible transactions will be made on a case-by-case and instrument-by-instrument basis. During the year ended December 31, 2008 we did not elect the fair value option for any acquired financial assets or liabilities.
In December 2007, the FASB issued SFAS No. 141 (revised 2007), “Business Combinations” (SFAS 141R). Under SFAS 141R, an entity is required to recognize the assets acquired, liabilities assumed, contractual contingencies, and contingent consideration at their fair value on the acquisition date. The standard also changes the recognition of contingent consideration, the accounting for pre-acquisition gain and loss contingencies, the recognition of capitalized in-process research and development, the accounting for acquisition-related restructuring cost accruals, the treatment of acquisition-related transaction costs and the recognition of changes in the acquirer’s income tax valuation allowance. In addition, acquired in-process research and development is capitalized as an intangible asset and amortized over its estimated useful life. The adoption of SFAS 141R will change our accounting treatment for business combinations on a prospective basis beginning in the first quarter of fiscal year 2009.
In December 2007, the FASB issued SFAS No. 160, “Non-controlling Interests in Consolidated Financial Statements — an amendment of Accounting Research Bulletin No. 51” (SFAS 160), which establishes accounting and reporting standards for ownership interests in subsidiaries held by parties other than the parent, the amount of consolidated net income attributable to the parent and to the non-controlling interest, changes in a parent’s ownership interest, and the valuation of retained non-controlling equity investments when a subsidiary is deconsolidated. SFAS 160 also establishes disclosure requirements that clearly identify and distinguish between the interests of the parent and the interests of the non-controlling owners. SFAS 160 is effective for fiscal years beginning after December 15, 2008. We do not expect that the adoption of SFAS 160 will have a significant impact on our Consolidated Financial Statements as all of our subsidiaries are currently wholly owned.
46
In March 2008, the FASB issued SFAS No. 161, “Disclosures about Derivative Instruments and Hedging Activities — an amendment of FASB Statement No. 133” (SFAS 161), which requires enhanced disclosures about an entity’s derivative and hedging activities and thereby improves the transparency of financial reporting. SFAS 161 is effective for fiscal years beginning after November 15, 2008. We are currently evaluating the impact of SFAS 161 on our Consolidated Financial Statements.
In April 2008, the FASB issued FSP FAS 142-3, “Determination of the Useful Life of Intangible Assets” (FSP 142-3). FSP 142-3 provides guidance with respect to estimating the useful lives of recognized intangible assets acquired on or after the effective date and requires additional disclosure related to the renewal or extension of the terms of recognized intangible assets. FSP 142-3 is effective for fiscal years and interim periods beginning after December 15, 2008. We do not expect that the adoption of FSP 142-3 will have a significant impact on our Consolidated Financial Statements.
| Item 7A. | Quantitative and Qualitative Disclosures about Market Risk |
Interest Rate Risk
Our exposure to market risk for changes in interest rates relates primarily to our investment portfolio and our debt obligations. We do not use derivative financial instruments in our investment portfolio. We place our investments with high credit-quality issuers and, by policy, limit the amount of credit exposure with any one issuer.
We mitigate default risk by investing in only high credit quality securities and by monitoring the credit rating of the underlying issuers. Excluding our investments in auction rate securities, our portfolio includes only short-term investments with active secondary or resale markets. We have no material cash flow exposure due to foreign currency rate changes for cash equivalents and investments.
The interest rates on the majority of our obligations are floating. Therefore, our results are only affected by the interest rate changes to variable-rate short-term borrowings. Due to the short-term nature of these borrowings, an immediate change to interest rates is not expected to have a material effect on our results.
The tables below present the amounts we recorded and related weighted average interest rates by year of contractual maturity for our investment portfolio and debt obligations as of December 31, 2008 and 2007. The amounts presented in the tables below approximate fair value.
| | | | | | | | | | | | | | | | | | | | | | | |
| | | Periods of Maturity | | | Total | |
December 31, 2008 | | Less than
1 Year | | | 1 to 3
Years | | | 3 to 5
Years | | 5 to 10
Years | | | Over 10
Years | | |
| | | (In thousands) | |
Assets: | | | | | | | | | | | | | | | | | | | | | | | |
Cash and cash equivalents | | $ | 184,332 | | | $ | — | | | $ | — | | $ | — | | | $ | — | | | $ | 184,332 | |
Average interest rate | | | 1.93 | % | | | — | | | | — | | | — | | | | — | | | | 1.93 | % |
Short-term investments | | $ | 58,194 | | | $ | 203,303 | | | $ | — | | $ | 5,421 | | | $ | 15,500 | | | $ | 282,418 | |
Average interest rate | | | 3.72 | % | | | 4.22 | % | | | — | | | 4.76 | % | | | 5.67 | % | | | 4.21 | % |
Long-term investments | | $ | — | | | $ | — | | | $ | — | | $ | 5,790 | | | $ | 86,083 | | | $ | 91,873 | |
Average interest rate | | | — | | | | — | | | | — | | | 1.83 | % | | | 2.38 | % | | | 2.35 | % |
Restricted cash and cash equivalents | | $ | 119,702 | | | $ | — | | | $ | — | | $ | — | | | $ | — | | | $ | 119,702 | |
Average interest rate | | | 1.79 | % | | | — | | | | — | | | — | | | | — | | | | 1.79 | % |
Liabilities: | | | | | | | | | | | | | | | | | | | | | | | |
Short-term borrowings | | $ | 112,907 | | | $ | — | | | $ | — | | $ | — | | | $ | — | | | $ | 112,907 | |
Average interest rate | | | 2.92 | % | | | — | | | | — | | | — | | | | — | | | | 2.92 | % |
47
| | | | | | | | | | | | | | | | | | | | | | | | |
| | | Periods of Maturity | | | Total | |
December 31, 2007 | | Less than
1 Year | | | 1 to 3
Years | | | 3 to 5
Years | | | 5 to 10
Years | | | Over 10
Years | | |
| | | (In thousands) | |
Assets: | | | | | | | | | | | | | | | | | | | | | | | | |
Cash and cash equivalents | | $ | 175,071 | | | $ | — | | | $ | — | | | $ | — | | | $ | — | | | $ | 175,071 | |
Average interest rate | | | 2.84 | % | | | — | | | | — | | | | — | | | | — | | | | 2.84 | % |
Short-term investments | | $ | 74,573 | | | $ | 15,739 | | | $ | 2,000 | | | $ | 16,800 | | | $ | 308,900 | | | $ | 418,012 | |
Average interest rate | | | 4.95 | % | | | 6.66 | % | | | 5.23 | % | | | 7.23 | % | | | 6.14 | % | | | 5.99 | % |
Restricted cash and cash equivalents | | $ | 161,050 | | | $ | — | | | $ | — | | | $ | — | | | $ | — | | | $ | 161,050 | |
Average interest rate | | | 4.80 | % | | | — | | | | — | | | | — | | | | — | | | | 4.80 | % |
Liabilities: | | | | | | | | | | | | | | | | | | | | | | | | |
Short-term borrowings | | $ | 1,509 | | | $ | — | | | $ | — | | | $ | — | | | $ | — | | | $ | 1,509 | |
Average interest rate | | | 1.33 | % | | | — | | | | — | | | | — | | | | — | | | | 1.33 | % |
Long-term borrowings | | $ | — | | | $ | 142,057 | | | $ | 86 | | | $ | 215 | | | $ | 909 | | | $ | 143,267 | |
Average interest rate | | | — | | | | 4.97 | % | | | 4.00 | % | | | 4.00 | % | | | 4.00 | % | | | 4.96 | % |
The “less than 1 year” category of short-term investments contains $10.6 million and $14.0 million as of December 31, 2008 and 2007, respectively, of other investments that do not have contractual maturities. The tables above exclude interest receivable of $4.1 million and $3.7 million as of December 31, 2008 and 2007, respectively, that is included in short-term investments on the Consolidated Balance Sheet.
As of December 31, 2008, we held tax-exempt auction-rate securities with an estimated fair value of $91.9 million, whose underlying assets are either student loans substantially backed by the federal government or closed-end municipal funds. Beginning in February 2008, these auction-rate securities became illiquid because their scheduled auctions failed to settle. An auction failure occurs when the parties wishing to sell securities at auction cannot. As a result, we may have limited or no opportunities to liquidate these investments and fully recover their stated value in the near term. These investments were classified as long-term in our Consolidated Balance Sheets. For the year ended December 31, 2008, we recorded a temporary unrealized loss of $13.0 million and an other-than-temporary loss of $3.5 million.
48
Foreign Currency Risk
We conduct business in various foreign countries located primarily in Europe and Asia. We are therefore primarily exposed to changes in exchange rates of currencies in those regions. We utilize foreign currency forward contracts to mitigate our exposure to changes in exchange rates by hedging intercompany balances denominated in currencies other than the U.S. dollar, hedging our U.S. dollar net investment in certain foreign subsidiaries and by designating certain forward contracts as cash flow hedges on transactions in which costs are denominated in U.S. dollars but the related revenues are generated in a foreign currency. The intent of our hedging program is to minimize the impact of foreign currency fluctuations on our results of operations. We do not use foreign currency forward exchange contracts for speculative or trading purposes. For further discussion of the accounting treatment of our derivative instruments see Note 2 to our Consolidated Financial Statements. The tables below present the notional amounts (at the contract exchange rates), the weighted-average contractual foreign currency exchange rates and the estimated fair value of our contracts outstanding as of December 31, 2008 and 2007.
| | | | | | | | | | |
| | | December 31, 2008 | |
| | | Notional
Sell (Buy) | | | Average
Contract Rate | | Estimated Fair
Value-Gain (Loss) | |
| | | (In thousands, except for average contract rate) | |
Foreign currency forward exchange contracts: | | | | | | | | | | |
Japanese yen | | $ | 24,780 | | | 95.53 | | $ | (1,867 | ) |
Euro | | | 14,893 | | | 0.71 | | | 41 | |
Israeli shekel | | | 2,114 | | | 3.69 | | | (4 | ) |
Swiss franc | | | 1,313 | | | 1.08 | | | 1 | |
Other | | | (14 | ) | | | | | (16 | ) |
| | | | | | | | | | |
| | $ | 43,086 | | | | | $ | (1,845 | ) |
| | | | | | | | | | |
| | | | | | | | | | |
| | | December 31, 2007 | |
| | | Notional
Sell (Buy) | | | Average
Contract Rate | | Estimated Fair
Value-Gain (Loss) | |
| | | (In thousands, except for average contract rate) | |
Foreign currency forward exchange contracts: | | | | | | | | | | |
Japanese yen | | $ | 127,602 | | | 113.40 | | $ | 1,554 | |
Israeli shekel | | | 1,460 | | | 3.94 | | | 0 | |
Swiss franc | | | 1,226 | | | 1.15 | | | 0 | |
Euro | | | 173 | | | 0.68 | | | (7 | ) |
Other | | | (4 | ) | | | | | (4 | ) |
| | | | | | | | | | |
| | $ | 130,457 | | | | | $ | 1,543 | |
| | | | | | | | | | |
49
| Item 8. | Financial Statements and Supplementary Data |
NOVELLUS SYSTEMS, INC.
CONSOLIDATED STATEMENTS OF OPERATIONS
| | | | | | | | | | | | |
| | | Years Ended December 31, | |
| | | 2008 | | | 2007 | | | 2006 | |
| | | (In thousands, except per share data) | |
Net sales | | $ | 1,011,004 | | | $ | 1,570,049 | | | $ | 1,658,516 | |
Cost of sales | | | 575,060 | | | | 800,860 | | | | 834,167 | |
| | | | | | | | | | | | |
Gross profit | | | 435,944 | | | | 769,189 | | | | 824,349 | |
Operating expenses: | | | | | | | | | | | | |
Selling, general and administrative | | | 224,233 | | | | 266,018 | | | | 261,389 | |
Research and development | | | 219,660 | | | | 241,025 | | | | 244,201 | |
Legal settlement | | | — | | | | — | | | | 3,250 | |
Restructuring and other charges (benefits), net | | | 4,545 | | | | (8,013 | ) | | | 10,735 | |
Impairment of goodwill | | | 99,522 | | | | — | | | | — | |
| | | | | | | | | | | | |
Total operating expenses | | | 547,960 | | | | 499,030 | | | | 519,575 | |
| | | | | | | | | | | | |
Operating income (loss) | | | (112,016 | ) | | | 270,159 | | | | 304,774 | |
Interest income | | | 17,600 | | | | 38,414 | | | | 27,782 | |
Interest expense | | | (7,021 | ) | | | (6,376 | ) | | | (4,290 | ) |
Other income (expense), net | | | (5,659 | ) | | | 12,592 | | | | 10,653 | |
| | | | | | | | | | | | |
Interest and other income, net | | | 4,920 | | | | 44,630 | | | | 34,145 | |
| | | | | | | | | | | | |
Income (loss) before provision for income taxes and cumulative effect of a change in accounting principle | | | (107,096 | ) | | | 314,789 | | | | 338,919 | |
Provision for income taxes | | | 8,614 | | | | 101,089 | | | | 149,851 | |
| | | | | | | | | | | | |
Income (loss) before cumulative effect of a change in accounting principle | | | (115,710 | ) | | | 213,700 | | | | 189,068 | |
Cumulative effect of a change in accounting principle, net of tax of $594 | | | — | | | | — | | | | 948 | |
| | | | | | | | | | | | |
Net income (loss) | | $ | (115,710 | ) | | $ | 213,700 | | | $ | 190,016 | |
| | | | | | | | | | | | |
Net income per share: | | | | | | | | | | | | |
Basic: | | | | | | | | | | | | |
Income (loss) before cumulative effect of a change in accounting principle | | $ | (1.18 | ) | | $ | 1.78 | | | $ | 1.51 | |
Cumulative effect of a change in accounting principle | | | — | | | | — | | | | 0.01 | |
| | | | | | | | | | | | |
Basic net income (loss) per share | | $ | (1.18 | ) | | $ | 1.78 | | | $ | 1.52 | |
| | | | | | | | | | | | |
Diluted: | | | | | | | | | | | | |
Income (loss) before cumulative effect of a change in accounting principle | | $ | (1.18 | ) | | $ | 1.75 | | | $ | 1.49 | |
Cumulative effect of a change in accounting principle | | | — | | | | — | | | | 0.01 | |
| | | | | | | | | | | | |
Diluted net income (loss) per share | | $ | (1.18 | ) | | $ | 1.75 | | | $ | 1.50 | |
| | | | | | | | | | | | |
Shares used in basic per share calculations | | | 98,083 | | | | 119,782 | | | | 125,286 | |
| | | | | | | | | | | | |
Shares used in diluted per share calculations | | | 98,083 | | | | 121,915 | | | | 126,483 | |
| | | | | | | | | | | | |
See accompanying Notes to Consolidated Financial Statements.
50
NOVELLUS SYSTEMS, INC.
CONSOLIDATED BALANCE SHEETS
| | | | | | | |
| | | December 31, |
| | | 2008 | | | 2007 |
| | | (In thousands) |
| ASSETS | | | | | | | |
Current assets: | | | | | | | |
Cash and cash equivalents | | $ | 184,332 | | | $ | 175,071 |
Short-term investments | | | 286,556 | | | | 421,695 |
Accounts receivable, net of allowance for doubtful accounts of $4,057 in 2008 and $1,988 in 2007 | | | 144,330 | | | | 343,296 |
Inventories | | | 213,305 | | | | 253,361 |
Deferred tax assets, net | | | 44,051 | | | | 48,965 |
Restricted cash and cash equivalents, current | | | 116,819 | | | | — |
Prepaid and other current assets | | | 53,209 | | | | 21,936 |
| | | | | | | |
Total current assets | | | 1,042,602 | | | | 1,264,324 |
Property and equipment, net | | | 271,866 | | | | 320,009 |
Restricted cash and cash equivalents | | | 2,883 | | | | 161,050 |
Investments | | | 91,873 | | | | — |
Goodwill | | | 126,073 | | | | 238,944 |
Intangibles and other assets | | | 102,230 | | | | 92,616 |
| | | | | | | |
Total assets | | $ | 1,637,527 | | | $ | 2,076,943 |
| | | | | | | |
| | |
| LIABILITIES AND SHAREHOLDERS’ EQUITY | | | | | | | |
Current liabilities: | | | | | | | |
Accounts payable | | $ | 50,832 | | | $ | 97,135 |
Accrued payroll and related expenses | | | 35,907 | | | | 73,273 |
Accrued warranty | | | 25,732 | | | | 44,864 |
Other accrued liabilities | | | 47,533 | | | | 48,172 |
Income taxes payable | | | 17,527 | | | | 2,011 |
Deferred profit | | | 14,784 | | | | 52,252 |
Current debt obligations | | | 112,907 | | | | 1,509 |
| | | | | | | |
Total current liabilities | | | 305,222 | | | | 319,216 |
Long-term debt | | | — | | | | 143,267 |
Long-term income taxes payable | | | 29,778 | | | | 27,408 |
Other non-current liabilities | | | 55,745 | | | | 57,965 |
| | | | | | | |
Total liabilities | | | 390,745 | | | | 547,856 |
Commitments and contingencies (Notes 10 and 11) | | | | | | | |
Shareholders’ equity: | | | | | | | |
Preferred stock, no par value; authorized shares — 10,000; issued and outstanding shares — none | | | — | | | | — |
Common stock, no par value; authorized shares — 240,000; issued and outstanding shares — 97,089 in 2008 and 105,344 in 2007 | | | 1,158,637 | | | | 1,219,533 |
Retained earnings | | | 99,981 | | | | 304,278 |
Accumulated other comprehensive income (loss) | | | (11,836 | ) | | | 5,276 |
| | | | | | | |
Total shareholders’ equity | | | 1,246,782 | | | | 1,529,087 |
| | | | | | | |
Total liabilities and shareholders’ equity | | $ | 1,637,527 | | | $ | 2,076,943 |
| | | | | | | |
See accompanying Notes to Consolidated Financial Statements.
51
NOVELLUS SYSTEMS, INC.
CONSOLIDATED STATEMENTS OF CASH FLOWS
| | | | | | | | | | | | |
| | | Years Ended December 31, | |
| | | 2008 | | | 2007 | | | 2006 | |
| | | (In thousands) | |
Cash flows from operating activities: | | | | | | | | | | | | |
Net income (loss) | | $ | (115,710 | ) | | $ | 213,700 | | | $ | 190,016 | |
Adjustments to reconcile net income (loss) to net cash provided by operating activities: | | | | | | | | | | | | |
Loss (gain) on disposal of property and equipment | | | 2,565 | | | | (9,168 | ) | | | 1,699 | |
Non-cash portion of restructuring and other charges | | | — | | | | — | | | | 10,199 | |
Impairment of goodwill | | | 99,522 | | | | — | | | | — | |
Depreciation and amortization | | | 63,317 | | | | 66,924 | | | | 69,729 | |
Deferred income taxes | | | (10,458 | ) | | | 31,855 | | | | 20,790 | |
Stock-based compensation | | | 32,563 | | | | 28,118 | | | | 34,941 | |
Tax benefit from stock-based compensation | | | 2,624 | | | | 4,464 | | | | 29,656 | |
Excess tax benefit from stock-based compensation | | | (98 | ) | | | (855 | ) | | | (15,612 | ) |
Other-than-temporary impairment of investments | | | 4,228 | | | | 1,763 | | | | — | |
Other non-cash charges, net | | | 6,507 | | | | 3,327 | | | | — | |
Cumulative effect of a change in accounting principle | | | — | | | | — | | | | (1,542 | ) |
Changes in operating assets and liabilities: | | | | | | | | | | | | |
Accounts receivable, net | | | 198,215 | | | | (32,857 | ) | | | 81,031 | |
Inventories | | | 45,797 | | | | (8,093 | ) | | | (15,419 | ) |
Prepaid and other assets | | | (28,892 | ) | | | 2,658 | | | | 31,838 | |
Accounts payable | | | (32,636 | ) | | | 3,904 | | | | (7,764 | ) |
Accrued payroll and related expenses | | | (34,304 | ) | | | (6,490 | ) | | | 27,306 | |
Accrued warranty | | | (24,397 | ) | | | (846 | ) | | | 501 | |
Other liabilities | | | (270 | ) | | | 7,413 | | | | (18,259 | ) |
Income taxes payable | | | 18,309 | | | | (10,412 | ) | | | 35,595 | |
Deferred profit | | | (37,646 | ) | | | 10,284 | | | | (27,552 | ) |
| | | | | | | | | | | | |
Net cash provided by operating activities | | | 189,236 | | | | 305,689 | | | | 447,153 | |
| | | | | | | | | | | | |
| | | |
Cash flows from investing activities: | | | | | | | | | | | | |
Proceeds from sales of investments | | | 390,595 | | | | 1,203,486 | | | | 672,263 | |
Proceeds from maturities of investments | | | 84,310 | | | | 206,665 | | | | 197,464 | |
Purchases of investments | | | (452,936 | ) | | | (1,042,393 | ) | | | (1,045,876 | ) |
Capital expenditures | | | (17,903 | ) | | | (33,216 | ) | | | (39,384 | ) |
Proceeds from sale of property and equipment | | | 92 | | | | 47,185 | | | | 2,235 | |
Decrease (increase) in restricted cash and cash equivalents | | | 41,348 | | | | (17,281 | ) | | | (3,557 | ) |
Business acquisitions, net of cash acquired | | | (1,913 | ) | | | (339 | ) | | | (765 | ) |
Other investing activities | | | — | | | | — | | | | (16,603 | ) |
| | | | | | | | | | | | |
Net cash provided by (used in) investing activities | | | 43,593 | | | | 364,107 | | | | (234,223 | ) |
| | | | | | | | | | | | |
| | | |
Cash flows from financing activities: | | | | | | | | | | | | |
Proceeds from employee stock compensation plans | | | 10,669 | | | | 41,917 | | | | 42,383 | |
Proceeds from (repayments of) lines of credit, net | | | (965 | ) | | | (18,117 | ) | | | 4,193 | |
Payments on long-term debt | | | (25,972 | ) | | | (43 | ) | | | (10,194 | ) |
Repurchases of common stock | | | (208,129 | ) | | | (578,474 | ) | | | (249,864 | ) |
Excess tax benefit from stock-based compensation | | | 98 | | | | 855 | | | | 15,612 | |
| | | | | | | | | | | | |
Net cash used in financing activities | | | (224,299 | ) | | | (553,862 | ) | | | (197,870 | ) |
| | | | | | | | | | | | |
Effects of exchange rate changes on cash and cash equivalents | | | 731 | | | | 674 | | | | 3,000 | |
Net change in cash and cash equivalents | | | 9,261 | | | | 116,608 | | | | 18,060 | |
| | | | | | | | | | | | |
Cash and cash equivalents at beginning of period | | | 175,071 | | | | 58,463 | | | | 40,403 | |
| | | | | | | | | | | | |
Cash and cash equivalents at end of period | | $ | 184,332 | | | $ | 175,071 | | | $ | 58,463 | |
| | | | | | | | | | | | |
Supplemental disclosures: | | | | | | | | | | | | |
Cash paid during the year for: | | | | | | | | | | | | |
Interest | | $ | 6,837 | | | $ | 7,070 | | | $ | 3,850 | |
Income taxes, net | | $ | 27,461 | | | $ | 72,488 | | | $ | 65,238 | |
See accompanying Notes to Consolidated Financial Statements.
52
NOVELLUS SYSTEMS, INC.
CONSOLIDATED STATEMENTS OF SHAREHOLDERS’ EQUITY
| | | | | | | | | | | | | | | | | | | | | | | |
| | | | | | Accumulated
Other
Comprehensive
Income
(Loss) | | | Total
Shareholders’
Equity | |
| | | Common Stock | | | Deferred
Compensation | | | Retained
Earnings | | | |
| | | Shares | | | Amount | | | | | |
| | | (In thousands) | |
Balance, December 31, 2005 | | 132,820 | | | $ | 1,418,747 | | | $ | (24,942 | ) | | $ | 388,015 | | | $ | (2,537 | ) | | $ | 1,779,283 | |
Components of comprehensive income: | | | | | | | | | | | | | | | | | | | | | | | |
Net income | | — | | | | — | | | | — | | | | 190,016 | | | | — | | | | 190,016 | |
Net change in unrealized loss on investments | | — | | | | — | | | | — | | | | — | | | | 2,114 | | | | 2,114 | |
Foreign currency translation adjustments, net of tax of $123 | | — | | | | — | | | | — | | | | — | | | | 4,225 | | | | 4,225 | |
Net change in unrealized loss on derivative instruments | | — | | | | — | | | | — | | | | — | | | | (329 | ) | | | (329 | ) |
Net change in unrealized loss on pension obligation, net of tax of $369 | | — | | | | — | | | | — | | | | — | | | | (878 | ) | | | (878 | ) |
| | | | | | | | | | | | | | | | | | | | | | | |
Comprehensive income | | | | | | | | | | | | | | | | | | | | | | 195,148 | |
| | | | | | | | | | | | | | | | | | | | | | | |
Reclassification of deferred compensation balance to common stock | | — | | | | (24,942 | ) | | | 24,942 | | | | — | | | | — | | | | — | |
Issuance of common stock under employee compensation plans, net | | 2,985 | | | | 46,560 | | | | — | | | | (238 | ) | | | — | | | | 46,322 | |
Income tax benefits realized from activity in employee stock plans | | — | | | | 29,656 | | | | — | | | | — | | | | — | | | | 29,656 | |
Stock based compensation | | — | | | | 34,160 | | | | — | | | | — | | | | — | | | | 34,160 | |
Repurchases of common stock | | (10,353 | ) | | | (110,267 | ) | | | — | | | | (139,597 | ) | | | — | | | | (249,864 | ) |
| | | | | | | | | | | | | | | | | | | | | | | |
Balance, December 31, 2006 | | 125,452 | | | | 1,393,914 | | | | — | | | | 438,196 | | | | 2,595 | | | | 1,834,705 | |
Adoption of EITF 06-2 “Accounting for Sabbatical Leave and Other Similar Benefits Pursuant to FASB Statement No. 43,” net of tax of $2,200 | | — | | | | — | | | | — | | | | (3,800 | ) | | | — | | | | (3,800 | ) |
Components of comprehensive income: | | | | | | | | | | | | | | | | | | | | | | | |
Net income | | — | | | | — | | | | — | | | | 213,700 | | | | — | | | | 213,700 | |
Net change in unrealized loss on investments, net of tax of $85 | | — | | | | — | | | | — | | | | — | | | | (237 | ) | | | (237 | ) |
Foreign currency translation adjustments, net of tax of $159 | | — | | | | — | | | | — | | | | — | | | | 4,486 | | | | 4,486 | |
Net change in unrealized loss on derivative instruments | | — | | | | — | | | | — | | | | — | | | | (2,249 | ) | | | (2,249 | ) |
Net change in unrealized loss on pension obligation, net of tax of $207 | | — | | | | — | | | | — | | | | — | | | | 681 | | | | 681 | |
| | | | | | | | | | | | | | | | | | | | | | | |
Comprehensive income | | | | | | | | | | | | | | | | | | | | | | 216,381 | |
| | | | | | | | | | | | | | | | | | | | | | | |
Issuance of common stock under employee compensation plans, net | | 1,626 | | | | 44,946 | | | | — | | | | — | | | | — | | | | 44,946 | |
Income tax benefits realized from activity in employee stock plans | | — | | | | 2,158 | | | | — | | | | — | | | | — | | | | 2,158 | |
Stock based compensation | | — | | | | 28,299 | | | | — | | | | — | | | | — | | | | 28,299 | |
Repurchases of common stock | | (21,734 | ) | | | (249,784 | ) | | | — | | | | (343,818 | ) | | | — | | | | (593,602 | ) |
| | | | | | | | | | | | | | | | | | | | | | | |
Balance, December 31, 2007 | | 105,344 | | | | 1,219,533 | | | | — | | | | 304,278 | | | | 5,276 | | | | 1,529,087 | |
Components of comprehensive income: | | | | | | | | | | | | | | | | | | | | | | | |
Net loss | | — | | | | — | | | | — | | | | (115,710 | ) | | | — | | | | (115,710 | ) |
Net change in unrealized loss on investments, net of tax of $(85) | | — | | | | — | | | | — | | | | — | | | | (10,647 | ) | | | (10,647 | ) |
Foreign currency translation adjustments, net of tax of $1,582 | | — | | | | — | | | | — | | | | — | | | | (7,059 | ) | | | (7,059 | ) |
Net change in unrealized loss on derivative instruments | | — | | | | — | | | | — | | | | — | | | | 1,441 | | | | 1,441 | |
Net change in unrealized loss on pension obligation | | — | | | | — | | | | — | | | | — | | | | (847 | ) | | | (847 | ) |
| | | | | | | | | | | | | | | | | | | | | | | |
Comprehensive loss | | | | | | | | | | | | | | | | | | | | | | (132,822 | ) |
| | | | | | | | | | | | | | | | | | | | | | | |
Issuance of common stock under employee compensation plans, net | | 721 | | | | 13,335 | | | | — | | | | (263 | ) | | | — | | | | 13,072 | |
Income tax provision for activity in employee stock plans | | — | | | | (2,620 | ) | | | — | | | | — | | | | — | | | | (2,620 | ) |
Stock based compensation | | — | | | | 33,074 | | | | — | | | | — | | | | — | | | | 33,074 | |
Repurchases of common stock | | (8,976 | ) | | | (104,685 | ) | | | — | | | | (88,324 | ) | | | — | | | | (193,009 | ) |
| | | | | | | | | | | | | | | | | | | | | | | |
Balance, December 31, 2008 | | 97,089 | | | $ | 1,158,637 | | | $ | — | | | $ | 99,981 | | | $ | (11,836 | ) | | $ | 1,246,782 | |
| | | | | | | | | | | | | | | | | | | | | | | |
See accompanying Notes to Consolidated Financial Statements.
53
NOVELLUS SYSTEMS, INC.
NOTES TO CONSOLIDATED FINANCIAL STATEMENTS
Note 1. Description of the Business
Novellus Systems, Inc., together with its subsidiaries, is primarily a supplier of semiconductor manufacturing equipment used in the fabrication of integrated circuits. We are focused on delivering innovative interconnect products and technologies that meet the increasingly complex and demanding needs of the world’s largest semiconductor manufacturers. The semiconductor manufacturing equipment that we build, market and service provides today’s semiconductor device manufacturers with high productivity and low total cost of ownership. The segment of our business serving this area is the Semiconductor Group. Novellus also develops, manufactures, sells and supports grinding, lapping and polishing equipment for a broad spectrum of industrial applications. The segment of our business serving this market is the Industrial Applications Group.
Note 2. Significant Accounting Policies
Principles of Consolidation and Basis of Presentation
The accompanying Consolidated Financial Statements include our accounts and the accounts of our subsidiaries after elimination of all significant intercompany account balances and transactions. Evaluation systems of $40.4 million have been reclassified from other non-current assets to inventory and warranty obligations of $10.0 million have been reclassified from accrued warranty to other non-current liabilities in the December 31, 2007 Consolidated Balance Sheet to conform to the 2008 financial statement presentation. These reclassifications did not affect any prior amounts of reported total assets, liabilities, shareholders’ equity, results of operations or cash flows. Certain other prior year amounts in the Consolidated Financial Statements and the notes thereto have been reclassified to conform to the current year presentation.
Our Consolidated Financial Statements have been prepared in accordance with U.S. generally accepted accounting principles (U.S. GAAP). The preparation of financial statements in conformity with U.S. GAAP requires us to make estimates and judgments that affect the reported amounts of assets, liabilities, revenues and expenses and the related disclosures of contingent assets and liabilities. We evaluate estimates on an ongoing basis, including those related to recognition of revenue, valuation of investments, adequacy of the allowance for doubtful accounts, valuation of inventory, valuation of deferred tax assets, valuation of goodwill and other intangible assets, adequacy of warranty obligations, measurement of restructuring and impairment charges, compliance with hedge accounting for derivatives, contingencies and litigation, and measurement of stock-based compensation. We base estimates on historical experience and on other market based assumptions that are believed to be reasonable under current circumstances, the results of which form the basis for making judgments about the carrying values of assets and liabilities that are not readily apparent from other sources. Our intent is to accurately state assets and liabilities given facts known at the time of measurement. Actual results may differ from these estimates.
Net Income (Loss) per Share
Basic net income (loss) per share is computed by dividing net income (loss) by the weighted-average number of common shares outstanding during the period. For purposes of computing basic net income (loss) per share, the weighted-average number of outstanding shares of common stock excludes unvested restricted stock awards, consisting of restricted stock and restricted stock units that may be settled in our common shares.
Diluted net income (loss) per share is computed by dividing net income (loss) by the weighted-average number of common and dilutive potential common shares outstanding during the period. Dilutive potential common shares consist primarily of stock options and restricted stock awards.
54
NOVELLUS SYSTEMS, INC.
NOTES TO CONSOLIDATED FINANCIAL STATEMENTS — (Continued)
The following table provides a reconciliation of the numerators and denominators of the basic and diluted per share computations:
| | | | | | | | | | |
| | | Years Ended December 31, |
| | | 2008 | | | 2007 | | 2006 |
| | | (In thousands, except per share amounts) |
Numerator: | | | | | | | | | | |
Net income (loss) | | $ | (115,710 | ) | | $ | 213,700 | | $ | 190,016 |
| | | | | | | | | | |
Denominator: | | | | | | | | | | |
Basic weighted-average shares outstanding | | | 98,083 | | | | 119,782 | | | 125,286 |
Dilutive potential common shares | | | — | | | | 2,133 | | | 1,197 |
| | | | | | | | | | |
Diluted weighted-average shares outstanding | | | 98,083 | | | | 121,915 | | | 126,483 |
| | | | | | | | | | |
Basic net income (loss) per share | | $ | (1.18 | ) | | $ | 1.78 | | $ | 1.52 |
Diluted net income (loss) per share | | $ | (1.18 | ) | | $ | 1.75 | | $ | 1.50 |
For the years ended December 31, 2008, 2007 and 2006, 21.7 million, 12.3 million and 9.2 million shares, respectively, were excluded from the calculation of diluted net income (loss) per share because their inclusion would have been anti-dilutive. Generally an option is considered anti-dilutive when the exercise price is greater than the average market value of our common shares during the period of measurement. Potentially dilutive securities are excluded from the computation of diluted net loss per share when a net loss is recorded for the period as their effect would be anti-dilutive. Restricted stock awards representing 0.9 million, 0.9 million and 0.8 million shares were excluded from the computation of diluted shares outstanding for the years ended December 31, 2008, 2007 and 2006, respectively, as the shares underlying these awards were subject to performance conditions that had not been met.
Revenue Recognition
We recognize revenue when persuasive evidence of an arrangement exists, delivery has occurred or services have been rendered, the seller’s price is fixed or determinable, and collectability is reasonably assured. It is common for us to ship equipment and transfer title at the point of delivery to the buyer under the terms of our contractual relationship. When uncertainty exists as to customer acceptance due to customer-specific performance conditions, we defer revenue recognition until acceptance and record the deferred revenue and associated costs of sales in deferred profit on our Consolidated Balance Sheet.
Our equipment sales generally have two elements: (a) the equipment and (b) installation of that equipment. While installation services are not essential to the functionality of the delivered equipment, final payment is not billable until customer acceptance for many of our sales contracts. Provided that we meet defined customer acceptance experience levels with both the customer and the specific type of equipment, we recognize revenue for the equipment element upon shipment and transfer of title. For those sales contracts where final payment is not billable until customer acceptance, the final payment (which typically exceeds the fair value of the installation services) is recognized upon customer acceptance.
We also enter into revenue arrangements that involve the sale of multiple pieces of equipment under a single arrangement. Revenue under these arrangements is allocated among the separate elements based on their relative fair values, provided the elements have value on a stand alone basis and there is objective and reliable evidence of fair value. Our sales arrangements do not include a general right of return. In cases where there is objective and reliable evidence of the fair value of the undelivered item(s) in an arrangement but no such evidence for the delivered item(s), the residual method is used to allocate the arrangement consideration.
55
NOVELLUS SYSTEMS, INC.
NOTES TO CONSOLIDATED FINANCIAL STATEMENTS — (Continued)
Revenue related to sales of spare parts is recognized upon shipment. Revenue related to maintenance and service contracts is recognized ratably over the duration of the contracts. Unearned maintenance and service contract revenue is included in other accrued liabilities.
Cash, Cash Equivalents and Short-Term Investments
We consider all highly liquid debt instruments with insignificant interest rate risk and original maturities of ninety days or less to be cash equivalents. Investments with original maturities greater than 90 days which are available for use in current operations are considered to be short-term investments. Our short-term investments are classified as available-for-sale securities and are reported at fair value, with unrealized gains and losses, net of tax, recorded in shareholders’ equity. The fair value of short-term investments is generally based on quoted market prices. When markets are not considered to be active we may use a) observable market prices in less active markets, b) non-binding market prices that are corroborated by observable market data, or c) quoted market prices for similar instruments. Unrealized gains and losses are recorded within other comprehensive income (loss) (OCI), while declines in fair value that are determined to be other than temporary are recorded in earnings. The cost of securities sold is based on the specific identification method.
Restricted Cash and Cash Equivalents
We maintain certain amounts of cash and cash equivalents on deposit which are restricted from general use. These amounts are used primarily to secure our Euro-based credit facility (see Note 8). The fair value of restricted cash and cash equivalents is determined in the same manner as cash and short-term investments.
Long-Term investments
Our long-term investments consist of auction-rate securities that are classified as available-for-sale securities and are reported at fair value. The fair value of our long-term investments is generally based on a cash-flow-based modeling technique using significant unobservable inputs as market data is not available. Temporary unrealized gains and losses, net of tax, are recorded within OCI. Realized gains and losses and declines in fair value that are determined to be other than temporary are recorded in earnings. The cost of securities sold or redeemed is based on the specific identification method.
Allowance for Doubtful Accounts
We evaluate our allowance for doubtful accounts based on a combination of factors. In circumstances where specific invoices are deemed to be uncollectible, we provide a specific allowance for bad debt against the amount due to reduce the net recognized receivable to the amount we reasonably believe will be collected. We also provide allowances based on our write-off history. We charge accounts receivable balances against our allowance for doubtful accounts once we have concluded our collection efforts are unsuccessful. Accounts receivable is considered past due when not paid in accordance with the contractual terms of each arrangement. Our provision for bad debt was $2.7 million, $0.9 million and $1.1 million for the years ended December 31, 2008, 2007 and 2006, respectively.
Inventories and Inventory Valuation
Inventories are stated at the lower of cost (first-in, first-out) or market. We periodically assess the recoverability of all inventories, including raw materials, work-in-process, finished goods, evaluation systems and spare parts,
56
NOVELLUS SYSTEMS, INC.
NOTES TO CONSOLIDATED FINANCIAL STATEMENTS — (Continued)
to determine whether adjustments for impairment are required. Inventory that is obsolete, or that is in excess of our forecasted usage, is written down to its estimated realizable value based on assumptions about future demand and market conditions.
Income Taxes
As of December 31, 2008, we had approximately $105.7 million of net deferred tax assets. We believe deferred tax assets will be realized due to anticipated future income and our ability to carry back losses to prior years. We have considered all sources of taxable income and ongoing prudent and feasible tax planning strategies in assessing the need for a valuation allowance. If in the future we determine that we would not be able to realize all or part of our net deferred tax assets, a valuation allowance for deferred tax assets would decrease income in the period in which such determination is made.
Property and Equipment
Property and equipment are stated at cost. Depreciation and amortization are computed on the straight-line method over the following estimated useful lives:
| | |
Manufacturing and engineering equipment | | 3—10 years |
Office furniture, fixtures and equipment | | 3— 7 years |
Buildings and leasehold improvements | | 3—39 years |
Goodwill and Other Intangible Assets
We review our long-lived assets, including goodwill and other intangible assets, for impairment at least annually or whenever events or changes in circumstances indicate that the carrying amount of these assets may not be recoverable. In accordance with our policy, we perform our goodwill impairment test in the fourth quarter of each fiscal year separately for each of our reporting units. We define our reporting units as the individual segments in which we operate. The first step of the test identifies if potential impairment may have occurred, while the second step measures the amount of the impairment, if any. Impairment may have occurred when the carrying amount of net assets exceeds the fair value estimated during the first step of the test. The estimation of the fair value of each reporting unit is determined based upon data generated from a discounted cash flow model, known as the income approach, and a comparable market price model, known as the market approach. The income approach requires us to make a number of assumptions including future growth rates, expense trends and working capital turnover ratios for each reporting unit over an extended period of time. Although the assumptions we utilize are consistent with the assumptions used to generate our annual strategic plan, there is significant judgment in the timing and level of future cash flows attributable to each reporting unit. If our future operating results do not meet current forecasts or if we have a sustained decline in our market capitalization that is determined to be indicative of a reduction in fair value of one or more of our reporting units, impairment charges for one or both of our reporting units may be required. We amortize our intangible assets with definite lives on a straight-line basis over their estimated useful lives.
Warranty
Our warranty policy generally states that we will provide warranty coverage for a predetermined amount of time on systems and modules for material and labor to repair and service the equipment. We record the estimated cost of warranty coverage to cost of sales when revenue is recognized. The estimated cost of warranty is determined
57
NOVELLUS SYSTEMS, INC.
NOTES TO CONSOLIDATED FINANCIAL STATEMENTS — (Continued)
by the warranty term as well as the average historical labor and material costs for a specific product. We review the actual product failure rates and material usage rates on a quarterly basis and adjust our warranty liability as necessary.
Restructuring and Impairment Charges
We record a liability for costs associated with an exit or disposal activity when the liability is incurred, rather than when the exit or disposal plan is approved. Accordingly, restructuring accruals are recorded when management initiates an exit plan that will cause us to incur costs that have no future economic benefit. The restructuring accrual related to vacated facilities is calculated net of estimated sublease income. Sublease income is estimated based on expected occupancy rates and current market rates for similar properties. If we are unable to sublet the vacated properties on a timely basis or if we are forced to sublet them at lower rates due to changes in market conditions, we will adjust the accruals accordingly.
Contingencies and Litigation
We assess the probability of adverse judgments in connection with current and threatened litigation. We accrue the cost of an adverse judgment if, in our estimation, the adverse outcome is probable and we can reasonably estimate the ultimate cost. We had no such accruals as of December 31, 2008 or 2007.
Foreign Currency Translation
We translate assets and liabilities of international non-U.S. functional currency subsidiaries into dollars at the rates of exchange in effect at the balance sheet date. Revenue and expenses are translated using rates that approximate those in effect during the period. Translation gains or losses related to these foreign subsidiaries are included as a component of accumulated OCI.
Derivatives
Our policy is to enter into foreign currency forward exchange contracts with maturities of less than 12 months to mitigate the impact of currency exchange fluctuations on (a) probable anticipated system sales denominated in Japanese yen (b) our net investment in certain foreign subsidiaries and (c) existing monetary asset and liability balances denominated in foreign currencies. All derivatives are recorded at fair value in either prepaid and other current assets or other accrued liabilities. We report cash flows from derivative instruments in cash flows from operating activities. We used the income approach to value our derivative instruments using observable inputs other than quoted prices, including interest rates and credit risk.
Cash Flow Hedging
We designate and document as cash flow hedges foreign currency forward exchange contracts on sales transactions in which costs are denominated in U.S. dollars and the related revenues are generated in Japanese yen. We evaluate and calculate the effectiveness of each hedge at least quarterly, using the dollar offset method, comparing the change in the forward contract’s fair value on a spot-to-spot basis to the spot-to-spot change in the anticipated transaction. The effective change is recorded in OCI until the sale is recognized. Ineffectiveness, along with the excluded time value of the forward contracts, is recorded in either net sales or cost of sales as designated at the inception of the forward contract. During the years ended December 31, 2008 and 2007, gains of $0.6 million and $2.6 million, respectively, were recorded in net sales due to hedge ineffectiveness. In the
58
NOVELLUS SYSTEMS, INC.
NOTES TO CONSOLIDATED FINANCIAL STATEMENTS — (Continued)
event it becomes probable that an anticipated hedged transaction will not occur as a result of the associated shipment date pushing outside of the forecasted range, the gains or losses on the related cash flow hedges are immediately reclassified from accumulated OCI to net sales in the Consolidated Statement of Operations. During the year ended December 31, 2008 and 2007 we reclassified losses of $0.7 million and $1.7 million, respectively, from OCI into net sales as a result of the discontinuance of hedged anticipated transactions.
The following table summarizes the pre-tax impact of cash flow hedges on OCI during the years ended December 31, 2008 and 2007.
| | | | | | | | |
| | | December 31,
2008 | | | December 31,
2007 | |
| | | (In thousands) | |
Accumulated losses, beginning of period | | $ | (2,578 | ) | | $ | (329 | ) |
Effective change of cash flow hedges | | | (1,772 | ) | | | (4,012 | ) |
Reclassification to cost of sales | | | — | | | | 329 | |
Reclassification to net sales | | | 3,213 | | | | 1,434 | |
| | | | | | | | |
Accumulated losses, end of period | | $ | (1,137 | ) | | $ | (2,578 | ) |
| | | | | | | | |
We anticipate reclassifying the accumulated losses recorded as of December 31, 2008 from accumulated OCI to net sales within 12 months.
Net Investment Hedging
We hedge our net investment in certain foreign subsidiaries to reduce economic currency risk. The foreign currency forward exchange contracts used to hedge this exposure are designated and documented as net investment hedges. Effectiveness is evaluated at least quarterly, excluding time value, and hedges are highly effective when currency pairs and notional amounts on the forward exchange contracts are properly aligned with the net investment in subsidiaries. Changes in the spot-to-spot value are recorded as foreign currency translation adjustments within OCI. Ineffectiveness, if any, along with the excluded time value of the forward contracts, is recorded in other income (expense), net. We recorded gains due to ineffectiveness of $0.8 million during each of the years ended December 31, 2008 and 2007, respectively. Losses of $3.3 million and $1.0 million were recorded in OCI for net investment hedges during the years ended December 31, 2008 and 2007, respectively.
Other Foreign Currency Hedges
We enter into foreign currency forward exchange contracts to hedge (a) intercompany balances that are denominated in non-functional currencies (b) certain third-party receivables denominated in Japanese yen and (c) anticipated sales denominated in foreign currency that do not qualify for special hedge accounting treatment under SFAS 133 due to uncertainty surrounding the timing of shipment. The maturities of these contracts are generally less than 12 months. Gains or losses arising from the remeasurement of these contracts to fair value each period are recorded in other income (expense), net. During the years ended December 31, 2008, 2007 and 2006 a loss of $9.3 million, a gain of $1.3 million and a gain of $2.7 million, respectively, were recorded in other income, net, related to these contracts.
Shipping and Handling Costs
Shipping and handling costs are included as a component of cost of sales.
59
NOVELLUS SYSTEMS, INC.
NOTES TO CONSOLIDATED FINANCIAL STATEMENTS — (Continued)
Advertising Expenses
We expense advertising costs as incurred. Advertising expenses for 2008, 2007 and 2006 were $1.1 million, $2.2 million and $1.4 million, respectively.
Concentrations and Other Risks
We use financial instruments that potentially subject us to concentrations of credit risk. Such instruments include cash equivalents, investments, accounts receivable and financial instruments used in hedging activities. We invest our cash in cash deposits, money market funds, commercial paper, certificates of deposit, readily marketable debt securities, or medium-term notes. We place our investments with high-credit quality financial institutions, which limits the credit exposure from any one financial institution or instrument. Excluding impairment charges relating to auction-rate securities, we have not historically realized significant losses on our short-term investments.
We sell a significant portion of our systems to a limited number of customers. Net sales to our ten largest customers in 2008, 2007 and 2006 accounted for 60%, 74% and 72% of our total net sales, respectively. Two customers accounted for 21% and 11% of receivables as of December 31, 2008. Two customers accounted for 15% and 12% of receivables as of December 31, 2007. We expect sales of our products to relatively few customers will continue to account for a high percentage of our net sales in the foreseeable future. None of our customers have entered into long-term purchase agreements that would require them to purchase our products.
We perform ongoing credit evaluations of our customers’ financial condition and generally require no collateral. Based on a customer’s financial strength we may require prepayment or an irrevocable letter of credit. We have an exposure to non-performance by counterparties on the foreign exchange contracts used in hedging activities. These counterparties are large international financial institutions, and to date no such counterparty has failed to meet its financial obligations to us. We do not believe there is a significant risk of non-performance by these counterparties because we continuously monitor our positions, the credit ratings of such counterparties, and the amount of contracts we enter into with any one party.
Certain raw materials we use in the manufacturing of our products are available from a limited number of suppliers. Shortages could occur in these essential materials due to an interruption of supply or solvency of our suppliers.
Stock-Based Compensation Expense
Stock-based compensation cost is estimated at the grant date based on the fair value of the award and is recognized as expense ratably over the requisite service period of the award. Determining the appropriate fair value model and calculating the fair value of stock-based awards, which includes estimates of stock price volatility, forfeiture rates and expected lives, requires judgment that could materially impact our operating results. See Note 14 for discussion of the impact of stock-based compensation expense on our Consolidated Financial Statements and significant estimates used.
Recent Accounting Pronouncements
In September 2006, the Financial Accounting Standards Board (FASB) issued Statement of Financial Accounting Standards (SFAS) No. 157, “Fair Value Measurements” (SFAS 157), which establishes specific criteria for the fair value measurements of financial and nonfinancial assets and liabilities that are already subject to fair value
60
NOVELLUS SYSTEMS, INC.
NOTES TO CONSOLIDATED FINANCIAL STATEMENTS — (Continued)
under current accounting rules. SFAS 157 also requires expanded disclosures related to fair value measurements. See Note 3 for information about fair value measurements. As allowed under FASB Staff Position (FSP) of Financial Accounting Standards (FAS) 157-2, “Effective Date of FASB Statement No. 157” (FSP 157-2), we adopted SFAS 157 for all financial instruments subject to fair value measurements on January 1, 2008 and deferred the adoption of SFAS 157 related to certain fair value measurements of non-financial instruments, such as goodwill, intangibles, property and equipment, and restructuring liabilities, except for those recognized or disclosed at fair value on at least an annual basis. The partial adoption of SFAS 157 was prospective and did not have a significant effect on our Consolidated Financial Statements and we do not expect that the adoption of FSP 157-2 will have a significant impact on our Consolidated Financial Statements. In October 2008, the FASB issued FSP FAS 157-3, “Determining the Fair Value of a Financial Asset When the Market for That Asset Is Not Active” (FSP 157-3), which clarifies the application of SFAS 157 in a market that is not active and provides an example to illustrate key considerations in determining the fair value of a financial asset when the market for that financial asset is not active. FSP 157-3 was effective upon issuance, including prior periods for which financial statements had not been issued. The adoption of FSP 157-3 did not have a significant impact on our Consolidated Financial Statements.
In February 2007, the FASB issued SFAS No. 159, “The Fair Value Option for Financial Assets and Financial Liabilities — Including an amendment of SFAS 115” (SFAS 159). SFAS 159 permits a company to voluntarily elect to use fair value, instead of historic or original cost, to account for certain financial assets and liabilities. The fair value option is designated on an item-by-item basis, is irrevocable and requires that changes in fair value in subsequent periods be recognized in earnings in the period of change. We adopted SFAS 159 on January 1, 2008. The adoption had no impact on our Consolidated Financial Statements as we did not make a fair value election for any of our existing financial assets and liabilities. Any election to use the fair value method for future eligible transactions will be made on a case-by-case and instrument-by-instrument basis. During the year ended December 31, 2008 we did not elect the fair value option for any acquired financial assets or liabilities.
In December 2007, the FASB issued SFAS No. 141 (revised 2007), “Business Combinations” (SFAS 141R). Under SFAS 141R, an entity is required to recognize the assets acquired, liabilities assumed, contractual contingencies, and contingent consideration at their fair value on the acquisition date. The standard also changes the recognition of contingent consideration, the accounting for pre-acquisition gain and loss contingencies, the recognition of capitalized in-process research and development, the accounting for acquisition-related restructuring cost accruals, the treatment of acquisition-related transaction costs and the recognition of changes in the acquirer’s income tax valuation allowance. In addition, acquired in-process research and development is capitalized as an intangible asset and amortized over its estimated useful life. The adoption of SFAS 141R will change our accounting treatment for business combinations on a prospective basis beginning in the first quarter of fiscal year 2009.
In December 2007, the FASB issued SFAS No. 160, “Non-controlling Interests in Consolidated Financial Statements — an amendment of Accounting Research Bulletin No. 51” (SFAS 160), which establishes accounting and reporting standards for ownership interests in subsidiaries held by parties other than the parent, the amount of consolidated net income attributable to the parent and to the non-controlling interest, changes in a parent’s ownership interest, and the valuation of retained non-controlling equity investments when a subsidiary is deconsolidated. SFAS 160 also establishes disclosure requirements that clearly identify and distinguish between the interests of the parent and the interests of the non-controlling owners. SFAS 160 is effective for fiscal years beginning after December 15, 2008. We do not expect that the adoption of SFAS 160 will have a significant impact on our Consolidated Financial Statements as all of our subsidiaries are currently wholly owned.
In March 2008, the FASB issued SFAS No. 161, “Disclosures about Derivative Instruments and Hedging Activities — an amendment of FASB Statement No. 133” (SFAS 161), which requires enhanced disclosures
61
NOVELLUS SYSTEMS, INC.
NOTES TO CONSOLIDATED FINANCIAL STATEMENTS — (Continued)
about an entity’s derivative and hedging activities and thereby improves the transparency of financial reporting. SFAS 161 is effective for fiscal years beginning after November 15, 2008. We are currently evaluating the impact of SFAS 161 on our Consolidated Financial Statement disclosures.
In April 2008, the FASB issued FSP FAS 142-3, “Determination of the Useful Life of Intangible Assets” (FSP 142-3). FSP 142-3 provides guidance with respect to estimating the useful lives of recognized intangible assets acquired on or after the effective date and requires additional disclosure related to the renewal or extension of the terms of recognized intangible assets. FSP 142-3 is effective for fiscal years and interim periods beginning after December 15, 2008. We do not expect that the adoption of FSP 142-3 will have a significant impact on our Consolidated Financial Statements.
Note 3. Financial Instruments
Short-Term and Long-Term Investments
We are invested in money market funds, municipal bonds, variable-rate demand notes and auction-rate securities.
Money Market Funds
Money market funds include $137.5 million classified as cash and cash equivalents and $116.8 million classified as restricted cash and cash equivalents, current on our Consolidated Balance Sheet as of December 31, 2008.
Municipal Bonds
Municipal bonds are bonds issued by state and local governments and other governmental entities such as authorities or special districts. These investments are classified as available-for-sale and include $253.3 million of short-term investments and $6.5 million of cash and cash equivalents on our Consolidated Balance Sheet as of December 31, 2008. We used the market approach to value municipal bonds. We classified these securities as Level 2 instruments due to either our use of observable market prices in less active markets or, when observable market prices were not available, our use of non-binding market prices that are corroborated by observable market data or quoted market prices for similar instruments.
Variable-Rate Demand Notes
Variable-rate demand notes are long-term, floating-rate obligations that are payable on demand. These are classified as available-for-sale within short-term investments on our Consolidated Balance Sheet. We used the market approach to value variable-rate demand notes. We classified these securities as Level 2 instruments due to either our use of observable market prices in less active markets or, when observable market prices were not available, our use of non-binding market prices that are corroborated by observable market data or quoted market prices for similar instruments.
Auction-Rate Securities
Auction-rate securities include auction-rate notes and auction-rate preferred shares of tax-exempt closed-end municipal funds. Our auction-rate notes consist of student loans that are substantially backed by the federal government. Beginning in February 2008, our auction-rate securities became illiquid as their scheduled auctions failed to settle. An auction failure occurs when the parties wishing to sell securities cannot. As a result, the
62
NOVELLUS SYSTEMS, INC.
NOTES TO CONSOLIDATED FINANCIAL STATEMENTS — (Continued)
affected securities begin to pay interest under their default interest rate features. We will not have access to these funds unless (a) future auctions are successful, (b) the securities are called by the issuer, (c) we sell the securities in a secondary market, or (d) the underlying notes mature. Currently, there are no active secondary markets. As of December 31, 2008 we recorded an other-than temporary impairment charge of $3.5 million within other income (expense), net on the Consolidated Statement of Operations due to the credit worthiness of the underlying issuer of certain auction-rate notes. In addition, we recorded a temporary unrealized impairment loss of $13.0 million within OCI based upon our assessment of the fair value of the remaining auction-rate securities. We believe the $13.0 million of impairment we recorded is temporary as we have both the ability and intent to hold these securities to recovery. Our valuation of these securities incorporates our assumptions about the anticipated term and yield that a market participant would require to purchase such a security in the marketplace. We have included auction-rate securities, all of which are classified as long-term investments on our Consolidated Balance Sheet as of December 31, 2008, in the Level 3 fair value category, as their valuation requires the use of significant unobservable inputs to our cash-flow-based valuation model.
The cost and estimated fair value of our short-term and long-term investments are as follows:
| | | | | | | | | | | | | |
| | | December 31, 2008 |
| | | Cost | | Gross
Unrealized
Gains | | Gross
Unrealized
Losses | | | Estimated
Fair Value |
| | | (In thousands) |
Tax-exempt securities, short-term | | $ | 269,520 | | $ | 2,734 | | $ | (432 | ) | | $ | 271,822 |
Tax-exempt securities, long-term | | $ | 104,834 | | $ | — | | $ | (12,961 | ) | | $ | 91,873 |
Other | | $ | 10,596 | | $ | — | | $ | — | | | $ | 10,596 |
| | | | | | | | | | | | | |
Total | | $ | 384,950 | | $ | 2,734 | | $ | (13,393 | ) | | $ | 374,291 |
| | | | | | | | | | | | | |
| |
| | | December 31, 2007 |
| | | Cost | | Gross
Unrealized
Gains | | Gross
Unrealized
Losses | | | Estimated
Fair Value |
| | | (In thousands) |
Tax-exempt securities, short-term | | $ | 404,008 | | $ | 58 | | $ | (9 | ) | | $ | 404,057 |
Other | | | 14,102 | | | — | | | (147 | ) | | | 13,955 |
| | | | | | | | | | | | | |
Total | | $ | 418,110 | | $ | 58 | | $ | (156 | ) | | $ | 418,012 |
| | | | | | | | | | | | | |
Also included in our short-term investments balance was interest receivable of $4.1 million and $3.7 million as of December 31, 2008 and 2007, respectively, that is not included in the tables above.
The maturities of our restricted cash and cash equivalents, short-term investments and long-term investments as of December 31, 2008 are as follows:
| | | |
| | | Amount |
| | | (In thousands) |
Due in less than one year | | $ | 177,896 |
Due in 1 to 3 years | | | 203,303 |
Due in 3 to 5 years | | | — |
Due in 5 to 10 years | | | 11,210 |
Due in greater than 10 years | | | 101,583 |
| | | |
Total | | $ | 493,992 |
| | | |
63
NOVELLUS SYSTEMS, INC.
NOTES TO CONSOLIDATED FINANCIAL STATEMENTS — (Continued)
Securities with contractual maturities more than five years primarily consist of auction rate securities and variable rate demand notes. The “due in less than one year” category contains $10.6 million of other investments that do not have contractual maturities.
The breakdown of investments with unrealized losses as of December 31, 2008 is as follows:
| | | | | | | | | | | | | | | | | | | | |
| | | In Loss Position for Less
Than 12 Months | | | In Loss Position for
12 Months or Greater | | Total | |
| | | Fair
Value | | Unrealized
Losses | | | Fair
Value | | Unrealized
Losses | | Fair
Value | | Unrealized
Losses | |
| | | (In thousands) | |
Tax-exempt securities, short-term | | $ | 25,139 | | $ | (432 | ) | | $ | — | | $ | — | | $ | 25,139 | | $ | (432 | ) |
Tax-exempt securities, long-term | | | 91,873 | | | (12,961 | ) | | | — | | | — | | | 91,873 | | | (12,961 | ) |
| | | | | | | | | | | | | | | | | | | | |
Total | | $ | 117,012 | | $ | (13,393 | ) | | $ | — | | $ | — | | $ | 117,012 | | $ | (13,393 | ) |
| | | | | | | | | | | | | | | | | | | | |
The gross unrealized losses related to short-term investments are primarily due to changes in interest rates and changes in quoted market prices. We view these unrealized losses as temporary in nature. The gross unrealized losses related to long-term investments are primarily due to our assumptions about the anticipated term and yield of these investments given the lack of an active market. We review our investment portfolio for possible impairment on a quarterly basis. Impairment is based on an analysis of factors that may have adverse affects on the fair value of the investment. Factors considered in determining whether a loss is temporary include the stability of the credit quality, the structure of the security and our ability and intent to hold the investment to recovery.
Fair Value of Financial Instruments
Assets and liabilities measured at fair value on a recurring basis are as follows as of December 31, 2008:
| | | | | | | | | | | | |
| | | Fair Value Measurement at Reporting Date Using | | Total |
| | | Quoted Prices in
Active Markets
for Identical
Assets
(Level 1) | | Significant Other
Observable Inputs
(Level 2) | | Significant
Unobservable
Inputs
(Level 3) | |
| | | (In thousands) |
Assets | | | | | | | | | | | | |
Money market funds | | $ | 254,323 | | $ | — | | $ | — | | $ | 254,323 |
Municipal bonds | | | — | | | 259,775 | | | — | | | 259,775 |
Variable-rate demand notes | | | — | | | 18,504 | | | — | | | 18,504 |
Auction-rate securities | | | — | | | — | | | 91,873 | | | 91,873 |
Derivative assets (1) | | | — | | | 2,204 | | | — | | | 2,204 |
| | | | | | | | | | | | |
Total | | $ | 254,323 | | $ | 280,483 | | $ | 91,873 | | $ | 626,679 |
| | | | | | | | | | | | |
| | | | |
Liabilities | | | | | | | | | | | | |
Derivative liabilities (1) | | $ | — | | $ | 4,049 | | $ | — | | $ | 4,049 |
| | | | | | | | | | | | |
Total | | $ | — | | $ | 4,049 | | $ | — | | $ | 4,049 |
| | | | | | | | | | | | |
64
NOVELLUS SYSTEMS, INC.
NOTES TO CONSOLIDATED FINANCIAL STATEMENTS — (Continued)
The table below presents a reconciliation of all financial instruments measured at fair value on a recurring basis using significant unobservable inputs (Level 3) for fiscal 2008. We classify financial instruments in Level 3 of the fair value hierarchy when there is reliance on at least one significant unobservable input to the valuation model. In addition to these unobservable inputs, the valuation models for Level 3 financial instruments typically also rely on a number of inputs that are readily observable either directly or indirectly. Thus, the gains and losses presented below include changes in the fair value related to both observable and unobservable inputs. All Level 3 financial instrument activities for fiscal 2008 are related to auction-rate securities.
| | | | |
| | | Fair Value Measurements
Using Significant
Unobservable Inputs
(Level 3) | |
| | | December 31,
2008 | |
| | | (In thousands) | |
Balance, beginning of period | | $ | — | |
Transfers into Level 3 | | | 123,420 | |
Settlements | | | (15,095 | ) |
Total net losses (realized and unrealized): | | | | |
Included in net income (loss) | | | (3,491 | ) |
Included in other comprehensive income (loss) | | | (12,961 | ) |
| | | | |
Balance, end of period | | $ | 91,873 | |
| | | | |
Fair Value of Other Financial Instruments
The carrying and estimated fair values of our other financial instruments are as follows:
| | | | | | | | | | | | |
| | | December 31, |
| | | 2008 | | 2007 |
| | | Carrying
Value | | Estimated Fair
Value | | Carrying
Value | | Estimated Fair
Value |
| | | (In thousands) |
Restricted cash and cash equivalents, non-current | | $ | 2,883 | | $ | 2,883 | | $ | 161,050 | | $ | 161,050 |
Current debt obligations | | $ | 112,907 | | $ | 112,254 | | $ | 1,509 | | $ | 1,509 |
Long-term debt obligations | | $ | — | | $ | — | | $ | 143,267 | | $ | 143,267 |
The investments included in non-current restricted cash are all cash and cash equivalents and the estimated fair values are based on quoted prices. Our debt obligations are not publicly traded and are primarily denominated in Euros. Judgment is required to estimate the fair value, using available market information and appropriate valuation methods. The estimated fair value of our debt obligations is based primarily on borrowing rates currently available to us for bank loans with similar terms and maturities.
We enter into forward foreign currency exchange contracts in order to manage foreign exchange risk. The notional amounts, net assets recorded and estimated fair values of our forward foreign currency exchange contracts are as follows:
| | | | | | | | | | | | | | | | | | | | |
| | | December 31, |
| | | 2008 | | | 2007 |
| | | Notional
Amount | | Net
Liabilities | | | Estimated
Fair Value | | | Notional
Amount | | Net
Assets | | Estimated
Fair Value |
| | | (In thousands) |
Sell (buy) foreign currencies | | $ | 43,086 | | $ | (1,845 | ) | | $ | (1,845 | ) | | $ | 130,457 | | $ | 1,543 | | $ | 1,543 |
65
NOVELLUS SYSTEMS, INC.
NOTES TO CONSOLIDATED FINANCIAL STATEMENTS — (Continued)
We used the income approach to value our derivative instruments using observable inputs other than quoted prices, including interest rates and credit risk.
Note 4. Balance Sheet Details
Inventories
| | | | | | |
| | | December 31, |
| | | 2008 | | 2007 |
| | | (In thousands) |
Purchased and spare parts | | $ | 139,635 | | $ | 147,475 |
Work-in-process | | | 31,101 | | | 39,105 |
Finished goods | | | 42,569 | | | 66,781 |
| | | | | | |
Total inventories | | $ | 213,305 | | $ | 253,361 |
| | | | | | |
Finished goods inventories include $13.7 million and $40.4 million as of December 31, 2008 and 2007, respectively, of evaluation systems at customer locations.
Property and equipment, net
| | | | | | | | |
| | | December 31, | |
| | | 2008 | | | 2007 | |
| | | (In thousands) | |
Manufacturing and engineering equipment | | $ | 462,188 | | | $ | 506,178 | |
Land, buildings and leasehold improvements | | | 258,594 | | | | 260,867 | |
Office furniture, fixtures and equipment | | | 133,241 | | | | 135,914 | |
| | | | | | | | |
| | | 854,023 | | | | 902,959 | |
Less accumulated depreciation | | | (582,157 | ) | | | (582,950 | ) |
| | | | | | | | |
Total property and equipment | | $ | 271,866 | | | $ | 320,009 | |
| | | | | | | | |
Depreciation expense for the years ended December 31, 2008, 2007 and 2006 was $56.3 million, $59.8 million and $63.4 million, respectively.
Accrued warranty
Changes in our accrued warranty liability are as follows:
| | | | | | | | |
| | | Years Ended December 31, | |
| | | 2008 | | | 2007 | |
| | | (In thousands) | |
Balance, beginning of period | | $ | 54,857 | | | $ | 55,349 | |
Warranties issued | | | 74,327 | | | | 80,899 | |
Settlements | | | (94,429 | ) | | | (74,618 | ) |
Changes in liability for pre-existing warranties, including expirations | | | (4,317 | ) | | | (6,773 | ) |
| | | | | | | | |
Balance, end of period | | $ | 30,438 | | | $ | 54,857 | |
| | | | | | | | |
Less: long-term portion | | | (4,706 | ) | | | (9,993 | ) |
| | | | | | | | |
Accrued warranty, current | | $ | 25,732 | | | $ | 44,864 | |
| | | | | | | | |
66
NOVELLUS SYSTEMS, INC.
NOTES TO CONSOLIDATED FINANCIAL STATEMENTS — (Continued)
Note 5. Goodwill and Other Intangible Assets
Goodwill
Changes in goodwill are as follows:
| | | | | | | | |
| | | Years Ended December 31, | |
| | | 2008 | | | 2007 | |
| | | (In thousands) | |
Balance, beginning of period | | $ | 238,944 | | | $ | 225,431 | |
Impairment of goodwill | | | (99,522 | ) | | | — | |
Deferred tax liability adjustment | | | — | | | | (1,954 | ) |
Acquisition of a business | | | 211 | | | | — | |
Foreign currency translation and other | | | (13,560 | ) | | | 15,467 | |
| | | | | | | | |
Balance, end of period | | $ | 126,073 | | | $ | 238,944 | |
| | | | | | | | |
As part of our annual goodwill impairment test performed in the fourth quarter 2008, we determined that potential impairment may have occurred within our Industrial Applications Group as the book value exceeded the fair value estimate for this reporting unit. The fair value estimate of our Semiconductor Group exceeded the book value by a narrow margin indicating that no impairment was present for this reporting unit. As a result, measurement of impairment was performed only for our Industrial Applications Group and we recognized a non-cash charge of $99.5 million to reduce the carrying value of goodwill within this reporting unit. At that time, we also reviewed our long-lived tangible and intangible assets within the Industrial Applications Group for potential impairment. We determined that the forecasted undiscounted cash flows related to the asset groups were in excess of their carrying values, and therefore, these assets were not impaired.
If our future operating results do not meet current forecasts or if we have a sustained decline in our market capitalization that is determined to be indicative of a reduction in fair value of one or both of our reporting units, additional impairment charges may be required. As of December 31, 2008, the carrying amounts of goodwill on our Consolidated Balance Sheet subject to impairment are $108.4 million and $17.7 million for the Semiconductor Group and Industrial Applications Group, respectively.
Intangible Assets
Our acquired intangible assets are as follows:
| | | | | | | | | | | | |
December 31, 2008 | | Weighted
Average
Amortization
Period | | Gross | | Accumulated
Amortization | | | Net |
| | | (Years) | | | | (In thousands) | | | |
Patents and other intangibles | | 12 | | $ | 16,656 | | $ | (3,110 | ) | | $ | 13,546 |
Developed technology | | 6 | | | 30,829 | | | (26,619 | ) | | | 4,210 |
Trademark | | 10 | | | 7,532 | | | (3,214 | ) | | | 4,318 |
| | | | | | | | | | | | |
Total | | 9 | | $ | 55,017 | | $ | (32,943 | ) | | $ | 22,074 |
| | | | | | | | | | | | |
67
NOVELLUS SYSTEMS, INC.
NOTES TO CONSOLIDATED FINANCIAL STATEMENTS — (Continued)
| | | | | | | | | | | | |
| | | | |
December 31, 2007 | | Weighted
Average
Amortization
Period | | Gross | | Accumulated
Amortization | | | Net |
| | | (Years) | | | | (In thousands) | | | |
Patents and other intangibles | | 12 | | $ | 16,661 | | $ | (1,679 | ) | | $ | 14,982 |
Developed technology | | 6 | | | 30,270 | | | (22,169 | ) | | | 8,101 |
Trademark | | 10 | | | 7,473 | | | (2,616 | ) | | | 4,857 |
| | | | | | | | | | | | |
Total | | 8 | | $ | 54,404 | | $ | (26,464 | ) | | $ | 27,940 |
| | | | | | | | | | | | |
The amortization expense for the identifiable intangible assets was approximately $7.0 million, $7.1 million and $6.3 million for the years ended December 31, 2008, 2007 and 2006, respectively. Our estimated amortization expense for the identifiable intangible assets for each of the next five fiscal years will be approximately $4.4 million for 2009, $3.3 million for 2010, $2.3 million for 2011, $2.3 million for 2012 and $2.3 million for 2013. In 2008 we acquired developed technology and a trademark intangibles with a fair value of $1.1 million and $0.4 million, respectively, and weighted average amortization periods of 6 and 10 years, respectively, related to our acquisition of Micron Machine Tools, Inc. As of December 31, 2008, we had no identifiable intangible assets with indefinite lives.
Note 6. Business Combinations
Micron Machine Tools, Inc.
In December 2008, our Industrial Applications Group acquired certain assets and liabilities of Micron Machine Tools, Inc. (Micron), a privately-held manufacturer of high-precision manufacturing tools based in Massachusetts, for $2.1 million. We funded $1.9 million of the acquisition with existing cash resources. The remaining $0.2 million is payable one year from the acquisition date. The acquisition was accounted for as a business combination, which requires the purchase price to be allocated to the assets acquired and liabilities assumed based on their estimated fair values at date of acquisition. The fair value of the net assets acquired was $1.9 million, resulting in $0.2 million of goodwill. Our Consolidated Financial Statements include the financial position, results of operations and cash flows of Micron from the date of acquisition.
Voumard Machine Co. SA
In November 2005, we acquired 90% of the outstanding stock of Voumard, a privately-held manufacturer of high-precision machine manufacturing tools based in Neuchâtel, Switzerland. We acquired the remainder of Voumard in November 2006. We funded the purchase price of the acquisition with existing cash resources.
The acquisition of Voumard was accounted for as a business combination, which requires the purchase price to be allocated to the assets acquired and liabilities assumed based on their estimated fair values at date of acquisition. After this allocation and after reducing certain non-monetary assets to zero, the fair value of net assets acquired exceeded the purchase price by $2.8 million, which was recorded as a gain in other income during 2006.
68
NOVELLUS SYSTEMS, INC.
NOTES TO CONSOLIDATED FINANCIAL STATEMENTS — (Continued)
The purchase price was allocated to the fair value of assets acquired and liabilities assumed as follows.
| | | | |
| | | (In thousands) | |
Cash consideration | | $ | 7,134 | |
Transaction costs | | | 486 | |
| | | | |
Total purchase price | | $ | 7,620 | |
| | | | |
Assets acquired | | $ | 18,548 | |
Liabilities assumed | | | (8,131 | ) |
| | | | |
Total net assets acquired | | $ | 10,417 | |
| | | | |
Gain | | $ | 2,797 | |
| | | | |
In August 2007, we purchased the remaining non-controlling interest in a subsidiary of Voumard for $0.3 million.
Note 7. Restructuring and Other Charges (Benefits)
In an effort to consolidate our operations, streamline product offerings and align our manufacturing operations with current business conditions, we have implemented various restructuring plans since 2001. All restructuring and other charges (benefits) presented below are related to the Semiconductor Group. As of December 31, 2008, substantially all actions under our restructuring plans had been completed, except for payments of future rent obligations, which we estimate will be paid in cash through 2017.
The following table summarizes our facilities restructuring activity:
| | | | | | | | |
| | | Years Ended December 31, | |
| | | 2008 | | | 2007 | |
| | | (In thousands) | |
Balance, beginning of period | | $ | 17,654 | | | $ | 19,798 | |
Cash payments | | | (4,021 | ) | | | (3,269 | ) |
Adjustment of prior restructuring cost | | | 4,545 | | | | 1,125 | |
| | | | | | | | |
Balance, end of period | | $ | 18,178 | | | $ | 17,654 | |
| | | | | | | | |
Restructuring charges (benefits) related to previously recorded facility exit costs were $4.5 million, $1.1 million, and $(5.5) million in 2008, 2007 and 2006, respectively. These adjustments are primarily due to changes in estimated sublease income over the remaining lease term related to facilities previously included in our restructuring liability.
In the fourth quarter of 2007, we completed the sale of certain facilities in San Jose, California resulting in a gain of $9.1 million that is included in operating income as part of restructuring and other charges (benefits), net. This sale substantially completes the actions contemplated under the restructuring plan implemented during 2006.
Note 8. Borrowing Arrangements
We have short-term credit facilities with various financial institutions totaling $223.6 million. These credit facilities bear interest at various rates and expire on various dates through December 2009. As of December 31, 2008, $112.9 million of current obligations were outstanding at an average interest rate of 2.9%,
69
NOVELLUS SYSTEMS, INC.
NOTES TO CONSOLIDATED FINANCIAL STATEMENTS — (Continued)
$15.7 million was pledged against outstanding letters of credit and the remaining $95.0 million was unutilized. These facilities consist primarily of an obligation denominated in Euros that was initially used to fund the acquisition of Peter Wolters AG in 2004 and is also used for general corporate purposes. As of December 31, 2008, the agreement allowed for borrowings up to $121.8 million, of which $111.8 million was outstanding. Subsequent to December 31, 2008, we reduced the aggregate available borrowing amount to the amount outstanding, based on our assessment that we would have sufficient cash resources through June 25, 2009 when borrowings under this agreement become due and payable. The effective interest rate as of December 31, 2008 was 2.9% and amounts outstanding are secured by deposits in money market funds, which are included within restricted cash and cash equivalents, current, on our Consolidated Balance Sheet. This credit arrangement includes certain financial covenants, with which we were in compliance as of December 31, 2008.
We also have a long-term senior unsecured revolving credit facility at an interest rate of LIBOR plus 0.5%. There are currently no amounts outstanding under this agreement. The agreement, which expires in 2011, allows for borrowings up to $150.0 million. We expect to use the proceeds, if any, for working capital and other general corporate purposes, including the repurchase of our own common shares. We also may utilize this line to fund the repayment of our current outstanding debt due June 25, 2009. The agreement contains customary affirmative and negative covenants, financial covenants, representations and warranties and events of default, which are subject to various exceptions and qualifications. We were in compliance with these covenants as of December 31, 2008.
All of our contractual obligations outstanding under borrowing arrangements are due within 12 months of December 31, 2008.
Note 9. Other Income (Expense), net
The components of other income (expense), net are as follows:
| | | | | | | | | | | | |
| | | Years Ended December 31, | |
| | | 2008 | | | 2007 | | | 2006 | |
| | | (In thousands) | |
Other income | | $ | 6,577 | | | $ | 9,669 | | | $ | 3,176 | |
Other expense | | | — | | | | (184 | ) | | | (1,772 | ) |
Foreign currency gain (loss), net | | | (3,544 | ) | | | 4,515 | | | | 4,808 | |
Other-than-temporary impairment of investments | | | (4,228 | ) | | | (1,763 | ) | | | — | |
Gain (loss) on other investments | | | (4,464 | ) | | | 355 | | | | 1,644 | |
Gain on acquisition of Voumard | | | — | | | | — | | | | 2,797 | |
| | | | | | | | | | | | |
Other income (expense), net | | $ | (5,659 | ) | | $ | 12,592 | | | $ | 10,653 | |
| | | | | | | | | | | | |
Note 10. Commitments and Guarantees
Standby Letters of Credit
We provide standby letters of credit to certain parties as required for certain transactions we initiate during the ordinary course of business. As of December 31, 2008, the maximum potential amount of future payments that we could be required to make under these letters of credit was approximately $15.7 million. We have not recorded any liability in connection with these arrangements beyond that required to appropriately account for the underlying transaction being guaranteed. We do not believe, based on historical experience and information currently available, that it is probable that any amounts will be required to be paid under these arrangements.
70
NOVELLUS SYSTEMS, INC.
NOTES TO CONSOLIDATED FINANCIAL STATEMENTS — (Continued)
Guarantee Arrangements
We have guarantee arrangements on behalf of certain of our consolidated subsidiaries for line-of-credit borrowings and operating leases. In the event of default on these arrangements, we would have a maximum exposure of $144.2 million as of December 31, 2008.
Lease Commitments
We have non-cancelable operating leases for various facilities and other assets. Rent expense for the years ended December 31, 2008, 2007 and 2006 was approximately $4.5 million, $3.8 million and $4.3 million, respectively, net of sublease income of $1.1 million, $1.0 million and $1.0 million, respectively. Certain of the operating leases contain provisions which permit us to renew the leases at the end of their respective lease terms.
The following is a table summarizing future minimum lease payments under all non-cancelable operating leases, with initial or remaining terms in excess of one year.
| | | | | | | | | | | | | | | | | | | | | | | | | |
| | | Years Ending December 31, | | Sublease
Income | | | Net
Total |
| | | 2009 | | 2010 | | 2011 | | 2012 | | 2013 | | Thereafter | | |
| | | (In thousands) |
Non-cancelable operating leases | | $ | 10,898 | | $ | 9,982 | | $ | 9,149 | | $ | 5,812 | | $ | 5,412 | | $ | 15,920 | | $ | (20,654 | ) | | $ | 36,519 |
Purchase Commitments
We have firm purchase commitments with various suppliers to ensure the availability of components and services. Our minimum obligation as of December 31, 2008 under these arrangements was $25.5 million. Actual expenditures will vary based upon the volume of the transactions and length of contractual service provided. In addition, the amounts paid under these arrangements may be less in the event that the arrangements are renegotiated or cancelled. Certain agreements provide for cancellation penalties. Our policy with respect to all purchase commitments is to record losses, if any, when they are probable and reasonably estimable. We have made adequate provision for potential exposure related to inventory on orders that may go unused.
Note 11. Litigation
Linear Technology Corporation
In March 2002, Linear Technology Corporation (Linear) filed a complaint against Novellus, among other parties, in the Superior Court of the State of California for the County of Santa Clara. The complaint seeks damages (including punitive damages), declaratory relief and injunctions for causes of actions involving alleged breach of contract, fraud, unfair competition and breach of warranty. The Superior Court dismissed Linear’s claims for fraud and unfair competition on October 5, 2004. The Court of Appeal affirmed this dismissal on June 18, 2007. Trial on the remaining claims is currently set for September 8, 2009. At this time, we cannot predict the ultimate outcome of this case, nor can we estimate a range of potential loss, if any. However, we believe that the ultimate disposition of these matters will not have a material adverse effect on our business, financial condition or operating results.
Other Litigation
During the year ended December 31, 2006, we reached an agreement to settle a customer indemnity claim, and the $3.3 million cost of this settlement was included in our results of operations.
71
NOVELLUS SYSTEMS, INC.
NOTES TO CONSOLIDATED FINANCIAL STATEMENTS — (Continued)
We are a defendant or plaintiff in various actions that have arisen in the normal course of business. We believe that the ultimate disposition of these matters will not have a material adverse effect on our business, financial condition or results of operations. Due to the uncertainty surrounding the litigation process, we are unable to estimate a range of loss, if any, at this time.
Note 12. Income Taxes
Income (loss) before income taxes and cumulative effect of a change in accounting principle consisted of the following:
| | | | | | | | | | | |
| | | Years Ended December 31, | |
| | | 2008 | | | 2007 | | 2006 | |
| | | (In thousands) | |
Domestic | | $ | (25,265 | ) | | $ | 221,329 | | $ | 433,658 | |
Foreign | | | (81,831 | ) | | | 93,460 | | | (94,739 | ) |
| | | | | | | | | | | |
Total | | $ | (107,096 | ) | | $ | 314,789 | | $ | 338,919 | |
| | | | | | | | | | | |
In 2006 we implemented a new global business structure. A key element of the structure involves the sharing of certain expenses. Our 2006, 2007 and 2008 geographic breakout of income before income taxes reflects intercompany expenses incurred by our foreign subsidiaries.
Significant components of the provision for income taxes are as follows:
| | | | | | | | | | | | |
| | | Years Ended December 31, | |
| | | 2008 | | | 2007 | | | 2006 | |
| | | (In thousands) | |
Current | | $ | 1,630 | | | $ | 30,350 | | | $ | 77,401 | |
Deferred | | | (6,876 | ) | | | 35,910 | | | | 45,090 | |
| | | | | | | | | | | | |
Federal | | | (5,246 | ) | | | 66,260 | | | | 122,491 | |
| | | |
Current | | | 3,241 | | | | 2,518 | | | | 8,482 | |
Deferred | | | (5,128 | ) | | | 4,226 | | | | 4,431 | |
| | | | | | | | | | | | |
State | | | (1,887 | ) | | | 6,744 | | | | 12,913 | |
| | | |
Current | | | 14,249 | | | | 32,656 | | | | 19,662 | |
Deferred | | | 1,498 | | | | (4,571 | ) | | | (5,215 | ) |
| | | | | | | | | | | | |
Foreign | | | 15,747 | | | | 28,085 | | | | 14,447 | |
| | | | | | | | | | | | |
Total provision for income taxes | | $ | 8,614 | | | $ | 101,089 | | | $ | 149,851 | |
| | | | | | | | | | | | |
Determining the consolidated provision for income tax expense, income tax liabilities and deferred tax assets and liabilities involves judgment. We calculate and provide for income taxes in each of the tax jurisdictions in which we operate, which involves estimating current tax exposures as well as making judgments regarding the recoverability of deferred tax assets in each such jurisdiction. The estimates used could differ from actual results, and this may have a significant impact on operating results in future periods.
72
NOVELLUS SYSTEMS, INC.
NOTES TO CONSOLIDATED FINANCIAL STATEMENTS — (Continued)
The provision for income taxes differs from the provision calculated by applying the federal statutory tax rate to income before income taxes and cumulative effect of a change in accounting principle as follows:
| | | | | | | | | | | | |
| | | Years Ended December 31, | |
| | | 2008 | | | 2007 | | | 2006 | |
| | | (In thousands) | |
Expected provision at 35% | | $ | (37,484 | ) | | $ | 110,176 | | | $ | 118,622 | |
State tax, net of federal benefit | | | (1,887 | ) | | | 6,743 | | | | 8,374 | |
Tax-exempt interest | | | (4,119 | ) | | | (9,275 | ) | | | (6,988 | ) |
Research and development credits | | | (3,399 | ) | | | (3,921 | ) | | | (1,886 | ) |
Domestic manufacturing/export sales incentive | | | (36 | ) | | | (825 | ) | | | (9,723 | ) |
Foreign income/losses taxed at different rates | | | 13,515 | | | | (2,575 | ) | | | 46,106 | |
Impairment of nondeductible goodwill | | | 34,833 | | | | — | | | | — | |
Adjustments of tax accounts | | | — | | | | — | | | | (8,529 | ) |
Stock-based compensation | | | 4,333 | | | | 4,759 | | | | 1,739 | |
Valuation allowance | | | 2,004 | | | | (1,313 | ) | | | — | |
Other | | | 854 | | | | (2,680 | ) | | | 2,136 | |
| | | | | | | | | | | | |
Total provision for income taxes | | $ | 8,614 | | | $ | 101,089 | | | $ | 149,851 | |
| | | | | | | | | | | | |
Deferred income taxes reflect the net tax effects of temporary differences between the carrying amounts of assets and liabilities for financial reporting purposes and the amounts used for income tax purposes. Significant components of deferred tax assets and liabilities are as follows:
| | | | | | | | |
| | | December 31, | |
| | | 2008 | | | 2007 | |
| | | (In thousands) | |
Deferred tax assets: | | | | | | | | |
Reserves and accruals | | $ | 42,899 | | | $ | 48,861 | |
Capitalized in-process research and development | | | 21,418 | | | | 26,438 | |
Stock-based compensation | | | 21,631 | | | | 18,595 | |
Deferred profit | | | 3,633 | | | | 6,015 | |
Net operating loss carry forwards | | | 34,654 | | | | 37,213 | |
Credits | | | 15,449 | | | | 6,333 | |
Other | | | 11,750 | | | | 9,218 | |
| | | | | | | | |
Total deferred tax assets | | | 151,434 | | | | 152,673 | |
Valuation allowance | | | (2,357 | ) | | | (353 | ) |
| | | | | | | | |
Deferred tax assets, net of valuation allowance | | | 149,077 | | | | 152,320 | |
Deferred tax liabilities: | | | | | | | | |
Depreciation | | | (35,112 | ) | | | (53,707 | ) |
Acquisition related items | | | (97 | ) | | | (129 | ) |
Other liabilities | | | (8,216 | ) | | | — | |
| | | | | | | | |
Total net deferred tax assets | | $ | 105,652 | | | $ | 98,484 | |
| | | | | | | | |
The net increase in valuation allowance was $2.0 million for the year ended December 31, 2008 compared to net decreases of $3.4 million and $64.2 million for the years ended December 31, 2007 and 2006, respectively. The change in valuation allowance in 2008 was due to an increase in our capital losses.
As of December 31, 2008, we had state tax credit carry forwards of approximately $13.9 million, net of federal impact.
73
NOVELLUS SYSTEMS, INC.
NOTES TO CONSOLIDATED FINANCIAL STATEMENTS — (Continued)
As of December 31, 2008, our federal and state net operating losses for tax return purposes were $96.8 million and $30.7 million, respectively. If not utilized, these carry forwards will begin to expire in 2014.
On January 1, 2007, we adopted the provisions of FIN 48, as amended. No cumulative adjustment to retained earnings was required upon adoption. Historically, interest and penalties and unrecognized tax benefits were classified as current liabilities. With the adoption of FIN 48, we classify interest and penalties and unrecognized tax benefits that are not expected to result in payment or receipt of cash within one year as non-current liabilities in the Consolidated Balance Sheets. The total amount of unrecognized tax benefits as of the date of adoption of FIN 48 was $11.3 million , including approximately $0.8 million of state research and development credits which were reflected in net deferred tax assets.
Our policy to include interest and penalties related to unrecognized tax benefits within the provision for income taxes did not change as a result of adopting FIN 48. On January 1, 2007, cumulative interest and penalties were $0.1 million. As of December 31, 2008 and 2007, the total amount of interest and penalties accrued was $4.0 million and $1.8 million, respectively, which was classified as a non-current liability in the Consolidated Balance Sheet. During the year ended December 31, 2008, interest and penalties expense was approximately $2.2 million. Of the total unrecognized tax benefits as of December 31, 2008, $26.9 million, if recognized, would affect our effective tax rate.
A reconciliation of the beginning and ending amount of unrecognized tax benefits is as follows:
| | | | | | | | |
| | | December 31, | |
| | | 2008 | | | 2007 | |
| | | (In thousands) | |
Balance, beginning of period | | $ | 26,635 | | | $ | 11,298 | |
Additions for tax positions taken in a prior year | | | 26 | | | | 3,710 | |
Additions for tax positions taken in the current year | | | 2,406 | | | | 14,542 | |
Reductions for tax positions taken in the prior year | | | (1,492 | ) | | | (2,915 | ) |
| | | | | | | | |
Balance, end of period | | $ | 27,575 | | | $ | 26,635 | |
| | | | | | | | |
With certain exceptions, we are no longer subject to U.S. federal or state income tax examinations by tax authorities for years prior to 2004, although the utilization of tax loss and credit carry forwards from fiscal years 2001 through 2003 could be subject to examination. We believe that adequate accruals have been provided for any potential adjustments that may result from current examinations by several state tax authorities. The timing of the settlement of these examinations is uncertain. We have not been notified of any additional examinations. However, given the number of remaining years subject to examination it is reasonably possible that the total unrecognized tax benefits could increase over the next twelve months. In addition, we do not anticipate a reduction of our unrecognized tax benefits as a result of a lapse of the applicable statutes of limitations.
74
NOVELLUS SYSTEMS, INC.
NOTES TO CONSOLIDATED FINANCIAL STATEMENTS — (Continued)
Note 13. Shareholders’ Equity
Accumulated Other Comprehensive Income (Loss)
The components of accumulated other comprehensive income (loss), net of related taxes are as follows:
| | | | | | | | |
| | | December 31, | |
| | | 2008 | | | 2007 | |
| | | (In thousands) | |
Foreign currency translation adjustments, net of tax of $152 in 2008
and $1,734 in 2007 | | $ | 1,005 | | | $ | 8,064 | |
Unrealized gain (loss) on investments, net of tax of $0 in 2008
and $85 in 2007 | | | (10,660 | ) | | | (13 | ) |
Unrealized loss on derivative instruments | | | (1,137 | ) | | | (2,578 | ) |
Unrealized loss on pension liability, net of tax of $162 in 2008
and $162 in 2007 | | | (1,044 | ) | | | (197 | ) |
| | | | | | | | |
Accumulated other comprehensive income (loss) | | $ | (11,836 | ) | | $ | 5,276 | |
| | | | | | | | |
Common Stock Repurchase Program
The Board of Directors has authorized the repurchase of our outstanding common stock, including approvals of $1.0 billion on September 14, 2004 and another $1.0 billion on October 26, 2007. As of December 31, 2008, we had a remaining authorization of $826.7 million available for stock repurchases under these authorizations. For the years ended December 31, 2008, 2007 and 2006, 9.0 million, 21.7 and 10.4 million shares, respectively, were repurchased under this plan for $193.0 million, $593.6 million and $249.9 million, respectively, at a weighted average purchase price of $21.50, $27.31 and $24.13, respectively.
Note 14. Stock-Based Compensation and Employee Benefit Plans
Stock-Based Compensation
Prior to 2007, we had several stock plans that provided for grants of equity instruments to our employees and non-employee directors. In February and May 2007, the Board of Directors and shareholders, respectively, approved the amended and restated 2001 Stock Incentive Plan (the “Plan”) to increase the number of shares available for grant and to consolidate all stock plans into a single plan. Awards under the Plan include incentive stock options, non-statutory stock options and restricted stock awards. Restricted stock awards include restricted stock and restricted stock units that are settled in common stock. Stock options generally vest ratably over a four-year period on the anniversary date of the grant and expire ten years after the grant date. Restricted stock awards generally vest over three, four, or five-year periods, excluding certain awards that vest upon the achievement of specific performance targets. There are 24.3 million shares authorized for grant under the Plan. As of December 31, 2008, there were 4.4 million shares available for future grant under the Plan.
We also have an Employee Stock Purchase Plan (ESPP) that allows qualified employees to purchase shares of common stock at 85% of the fair market value on specified dates. There are 6.9 million shares authorized for purchase under the ESPP. As of December 31, 2008 there were 0.5 million shares available for future purchase under the ESPP.
75
NOVELLUS SYSTEMS, INC.
NOTES TO CONSOLIDATED FINANCIAL STATEMENTS — (Continued)
The following table summarizes the stock-based compensation expense for stock options, restricted stock awards and ESPP in our results from continuing operations:
| | | | | | | | | |
| | | Years Ended December 31, |
| | | 2008 | | 2007 | | 2006 |
| | | (In thousands) |
| | | (1) | | (2) | | (3) |
Cost of sales | | $ | 2,505 | | $ | 1,869 | | $ | 1,425 |
Selling, general and administrative | | | 21,159 | | | 17,583 | | | 22,337 |
Research and development | | | 8,899 | | | 8,666 | | | 11,179 |
| | | | | | | | | |
Total stock-based compensation expense | | $ | 32,563 | | $ | 28,118 | | $ | 34,941 |
| | | | | | | | | |
| (1) | Amounts include amortization expense related to stock options of $16.8 million, employee stock purchase plan of $2.7 million, and restricted stock awards of $13.1 million. |
| (2) | Amounts include amortization expense related to stock options of $20.3 million, employee stock purchase plan of $2.9 million, and restricted stock awards of $4.9 million. |
| (3) | Amounts include amortization expense related to stock options of $25.1 million, employee stock purchase plan of $2.4 million, and restricted stock awards of $7.5 million. |
In the fourth quarter of 2007 we determined that certain performance conditions, primarily related to restricted stock awards, were no longer probable of being met. As a result, we reversed $2.4 million of expense previously recognized in 2006. Approximately $0.1 million was reversed from cost of sales, $1.8 million from selling, general and administrative and $0.5 million from research and development.
Total stock-based compensation cost capitalized in inventory and deferred profit, was $0.7 million and $0.2 million as of December 31, 2008 and 2007, respectively.
Valuation and Other Assumptions for Stock Options
Valuation and Amortization Method. We estimated the fair value of stock options granted before and after the adoption of SFAS 123R using the Black-Scholes option valuation model. For options granted before January 1, 2006, we estimated the fair value using the multiple option approach and are amortizing the fair value of options expected to vest on a graded vesting (or accelerated) basis. For options granted on or after January 1, 2006, we estimate the fair value using a single option approach and amortize the fair value on a straight-line basis for options expected to vest. All options are amortized over the requisite service periods of the awards, which are generally the vesting periods.
Expected Term. The expected term of options granted represents the period of time that they are expected to be outstanding. We estimate the expected term of options granted based on our historical experience of exercises including post-vesting exercises and termination.
Expected Volatility. We estimate the volatility of our stock options at the date of grant using a combination of historical and implied volatilities, consistent with SFAS 123R and Staff Accounting Bulletin 107, “Share-based payment.” Historical volatilities are calculated based on the historical prices of our common stock over a period at least equal to the expected term of our option grants, while implied volatilities are derived from publicly traded options of common stock. Prior to the adoption of SFAS 123R, we relied exclusively on the historical prices of our common stock in the calculation of expected volatility.
76
NOVELLUS SYSTEMS, INC.
NOTES TO CONSOLIDATED FINANCIAL STATEMENTS — (Continued)
Risk-Free Interest Rate. We base the risk-free interest rate used in the Black-Scholes option valuation model on the implied yield in effect at the time of option grant on U.S. Treasury zero-coupon issues with remaining terms equivalent to the expected term of our option grants.
Dividends. We have never paid any cash dividends on common stock and we do not anticipate paying any cash dividends in the foreseeable future.
Forfeitures. We use historical data to estimate pre-vesting option forfeitures. As required by SFAS 123R, we record stock-based compensation expense only for those awards that are expected to vest. The estimated annual forfeiture rate was 10.9% for the years ended December 31, 2008 and 2007, respectively, and 8.9% for the year ended December 31, 2006.
We used the following weighted-average valuation assumptions to estimate the fair value of options granted for the years ended December 31, 2008, 2007 and 2006, respectively:
| | | | | | |
| | | 2008 | | 2007 | | 2006 |
Risk-free interest rate | | 1.3% | | 3.8% | | 4.7% |
Expected volatility | | 63% | | 49% | | 49% |
Expected term | | 4.1 years | | 4.4 years | | 4.4 years |
Expected dividends | | None | | None | | None |
The weighted-average grant date fair value of options granted during the years ended December 31, 2008, 2007 and 2006 was $6.47, $12.13 and $14.30, respectively.
Stock Options
A summary of stock option activity follows:
| | | | | | | | | | | |
| | | Number of
Shares | | | Weighted-Average
Exercise Price | | Weighted-Average
Remaining
Contractual
Term (in Years) | | Aggregate
Intrinsic
Value |
| | | (In thousands) | | | | | | | (In thousands) |
Outstanding as of December 31, 2005 | | 24,137 | | | $ | 31.79 | | 6.67 | | $ | 13,383 |
Grants | | 2,855 | | | | 31.39 | | | | | |
Exercises | | (1,603 | ) | | | 22.41 | | | | | |
Forfeitures or expirations | | (2,490 | ) | | | 34.00 | | | | | |
| | | | | | | | | | | |
Outstanding as of December 31, 2006 | | 22,899 | | | $ | 32.16 | | 6.23 | | $ | 102,527 |
Grants | | 1,696 | | | | 27.44 | | | | | |
Exercises | | (1,247 | ) | | | 24.51 | | | | | |
Forfeitures or expirations | | (1,574 | ) | | | 35.52 | | | | | |
| | | | | | | | | | | |
Outstanding as of December 31, 2007 | | 21,774 | | | $ | 31.99 | | 5.62 | | $ | 17,187 |
Grants | | 2,027 | | | | 13.31 | | | | | |
Exercises | | (116 | ) | | | 14.31 | | | | | |
Forfeitures or expirations | | (2,758 | ) | | | 31.42 | | | | | |
| | | | | | | | | | | |
Outstanding as of December 31, 2008 | | 20,927 | | | $ | 30.35 | | 5.16 | | $ | 12 |
| | | | | | | | | | | |
Vested and expected to vest as of December 31, 2008 | | 20,070 | | | $ | 30.79 | | 4.98 | | $ | 10 |
Exercisable as of December 31, 2008 | | 16,402 | | | $ | 32.72 | | 4.13 | | $ | 1 |
77
NOVELLUS SYSTEMS, INC.
NOTES TO CONSOLIDATED FINANCIAL STATEMENTS — (Continued)
The aggregate intrinsic value of options outstanding is calculated as the difference between the exercise price of the underlying options and the market price of our common stock for the 0.1 million shares that had exercise prices lower than the market price of our common stock as of December 31, 2008. The total intrinsic value of the options exercised during the years ended December 31, 2008, 2007, and 2006 was $0.9 million, $9.2 million and $14.0 million, respectively, determined as of the date of exercise. The total cash received from employees as a result of stock option exercises during the year ended December 31, 2008, 2007 and 2006 was $1.7 million, $32.3 million and $34.2 million, respectively. In connection with these exercises and the disqualification of incentive stock options, we realized a tax benefit of $0.2 million, $2.6 million and $4.3 million for the years ended December 31, 2008, 2007 and 2006, respectively. We settle employee stock option exercises with newly issued common shares.
As of December 31, 2008 there was $33.5 million of unrecognized compensation cost related to unvested stock options, of which $15.4 million, $11.4 million, $4.8 million and $1.9 million is expected to be recognized in 2009, 2010, 2011, and 2012, respectively.
Restricted Stock Awards
The fair value of our restricted stock awards is calculated based upon the fair market value of the Company’s stock at the date of grant. The following table summarizes our restricted stock award activity:
| | | | | | |
| | | Number of
Shares | | | Weighted-Average
Grant Date
Fair Value |
| | | (In thousands) | | | |
Unvested restricted stock awards as of December 31, 2005 | | 1,197 | | | $ | 27.57 |
Granted | | 832 | | | | 32.14 |
Vested | | (77 | ) | | | 30.39 |
Forfeited | | (108 | ) | | | 27.12 |
| | | | | | |
Unvested restricted stock awards as of December 31, 2006 | | 1,844 | | | $ | 29.56 |
Granted | | 1,236 | | | | 26.81 |
Vested | | (142 | ) | | | 27.47 |
Forfeited | | (173 | ) | | | 29.61 |
| | | | | | |
Unvested restricted stock awards as of December 31, 2007 | | 2,765 | | | $ | 28.45 |
Granted | | 1,477 | | | | 14.43 |
Vested | | (485 | ) | | | 26.40 |
Forfeited | | (358 | ) | | | 28.06 |
| | | | | | |
Unvested restricted stock awards as of December 31, 2008 | | 3,399 | | | $ | 22.69 |
| | | | | | |
The unvested restricted stock awards as of December 31, 2008 and December 31, 2007 include 2.2 million and 1.1 million restricted stock units, respectively. Restricted stock units as of December 31, 2006 were not significant.
As of December 31, 2008, there are a total of 0.5 million restricted stock awards and 0.4 million restricted stock units subject to performance conditions that will result in forfeiture if the conditions are not realized. The restricted stock units have performance conditions that could result in the vesting of a maximum of 1.2 million restricted stock units. The performance conditions are based on our revenue, revenue growth and revenue growth relative to our peers.
78
NOVELLUS SYSTEMS, INC.
NOTES TO CONSOLIDATED FINANCIAL STATEMENTS — (Continued)
As of December 31, 2008 there was $30.1 million of unrecognized compensation cost related to restricted stock awards, including performance awards that are expected to vest, of which $12.7 million, $8.4 million, $6.8 million and $2.2 million is expected to be recognized in 2009, 2010, 2011 and 2012, respectively. The total fair value of restricted stock awards vested during the years ended December 31, 2008, 2007 and 2006 was $7.1 million, $4.0 million and $2.0 million, respectively. In connection with the issuance of restricted stock awards, we realized a tax benefit of $2.2 million, $1.5 million and $0.7 million for the years ended December 31, 2008, 2007 and 2006, respectively.
ESPP
ESPP awards are valued using the Black-Scholes model with expected volatility calculated using a six-month historical volatility. During the years ended December 31, 2008, 2007 and 2006, ESPP awards were valued using the following weighted-average assumptions:
| | | | | | |
| | | 2008 | | 2007 | | 2006 |
Risk-free interest rate | | 2.3% | | 4.9% | | 5.0% |
Expected volatility | | 41% | | 34% | | 33% |
Expected term | | 6 months | | 6 months | | 6 months |
Expected dividends | | None | | None | | None |
The weighted-average grant date fair value of shares was $6.22, $7.49 and $6.47 for the years ended December 31, 2008, 2007 and 2006, respectively. As of December 31, 2008, there was $0.9 million of total unrecognized compensation costs related to the ESPP, which is expected to be recognized during the next four months. In connection with the issuance of shares under our ESPP, we realized a tax benefit attributed to disqualifying dispositions of $0.2 million, $0.4 million and $0.6 million for the years ended December 31, 2008, 2007 and 2006, respectively.
Employee Savings and Retirement Plan
We maintain a 401(k) retirement savings plan for our full-time employees. Participants in the 401(k) plan may contribute up to 100% of their eligible pre-tax compensation, limited by the maximum dollar amount allowed by the Internal Revenue Code. Annually, we contribute a percentage of each participating employee’s salary deferral contributions up to a maximum of 3% of an employee’s eligible compensation. Our matching contributions are invested in Novellus common stock and become fully vested at the end of the employee’s third year of credited service. We recorded expense of $3.7 million, $4.1 million and $4.0 million in connection with matching contributions under the 401(k) plan for the years ended December 31, 2008, 2007 and 2006, respectively.
Deferred Compensation Plan
Under our deferred compensation plan, certain employees may elect to defer a portion of their earnings. Amounts payable under the deferred compensation plan totaled $7.0 million and $10.4 million as of December 31, 2008 and 2007, respectively.
Defined Benefit Pension Plans
We provide certain defined benefit pension plans to employees primarily located in countries outside of the U.S. We deposit funds for certain of these plans, consistent with the requirements of local law, with insurance companies or third-party trustees, and accrue for the unfunded portion of the obligation. The assumptions used in calculating the obligation for these plans depend on the local economic environment. The net liability recognized related to the funded status of the plans was approximately $5.1 million and $4.8 million as of December 31, 2008 and 2007, respectively. The projected benefit obligation was $22.8 million and $23.8 million as of December 31, 2008 and 2007, respectively. The related fair value of plan assets was $17.7 million and $19.0
79
NOVELLUS SYSTEMS, INC.
NOTES TO CONSOLIDATED FINANCIAL STATEMENTS — (Continued)
million as of December 31, 2008 and 2007, respectively. Our practice is to fund the pension plans in amounts at least sufficient to meet the minimum requirements of local laws and regulations. The assets of the plans are primarily invested in high quality fixed income investments. Our contributions were approximately $0.6 million, $0.6 million and $0.5 million in each of the years 2008, 2007 and 2006, respectively. Our estimated benefit payments for each of the next ten years will be approximately $1.8 million per year in 2009 through 2013, and an aggregate of $5.8 million for years 2014 through 2018.
Postretirement Healthcare Plan
We maintain a postretirement healthcare plan for certain retirees. Coverage continues through the duration of the lifetime of the retiree or the retiree’s spouse, whichever is longer. The benefit obligation was $2.3 million and $2.1 million as of December 31, 2008 and 2007, respectively.
Note 15. Operating Segments
We operate in two segments, the Semiconductor Group and the Industrial Applications Group. Our Semiconductor Group develops, manufactures, sells and supports equipment used in the fabrication of integrated circuits, commonly called chips or semiconductors. Our Industrial Applications Group is a supplier of lapping, grinding, polishing and deburring equipment for fine-surface optimization. The accounting policies of these segments are the same as those described in Note 2.
A summary of financial data by segment for the years ended December 31, 2008, 2007 and 2006 is as follows:
| | | | | | | | | | | | |
| | | Semiconductor
Group | | | Industrial
Applications
Group | | | Total | |
| | | (In thousands) | |
2008 | | | | | | | | | | | | |
Net sales | | $ | 837,651 | | | $ | 173,353 | | | $ | 1,011,004 | |
Operating loss | | $ | (29,183 | ) | | $ | (82,833 | ) | | $ | (112,016 | ) |
| | | |
Long-lived assets | | $ | 250,362 | | | $ | 21,504 | | | $ | 271,866 | |
All other identifiable assets | | | 1,256,420 | | | | 109,241 | | | | 1,365,661 | |
| | | | | | | | | | | | |
Total assets | | $ | 1,506,782 | | | $ | 130,745 | | | $ | 1,637,527 | |
| | | | | | | | | | | | |
| | | | | | | | | |
| | | Semiconductor
Group | | Industrial
Applications
Group | | Total |
| | | (In thousands) |
2007 | | | | | | | | | |
Net sales | | $ | 1,395,703 | | $ | 174,346 | | $ | 1,570,049 |
Operating income | | $ | 246,361 | | $ | 23,798 | | $ | 270,159 |
| | | |
Long-lived assets | | $ | 296,778 | | $ | 23,231 | | $ | 320,009 |
All other identifiable assets | | | 1,495,665 | | | 261,269 | | | 1,756,934 |
| | | | | | | | | |
Total assets | | $ | 1,792,443 | | $ | 284,500 | | $ | 2,076,943 |
| | | | | | | | | |
80
NOVELLUS SYSTEMS, INC.
NOTES TO CONSOLIDATED FINANCIAL STATEMENTS — (Continued)
| | | | | | | | | |
| | | Semiconductor
Group | | Industrial
Applications
Group | | Total |
| | | (In thousands) |
2006 | | | | | | | | | |
Net sales | | $ | 1,547,540 | | $ | 110,976 | | $ | 1,658,516 |
Operating income | | $ | 296,281 | | $ | 8,493 | | $ | 304,774 |
| | | |
Long-lived assets | | $ | 345,403 | | $ | 19,196 | | $ | 364,599 |
All other identifiable assets | | | 1,807,248 | | | 190,645 | | | 1,997,893 |
| | | | | | | | | |
Total assets | | $ | 2,152,651 | | $ | 209,841 | | $ | 2,362,492 |
| | | | | | | | | |
Two customers each separately accounted for 15%, 11% and 13% of our consolidated net sales for the years ended December 31, 2008, 2007 and 2006, respectively. All such customer concentration is contained exclusively within the Semiconductor Group. Net sales presented by operating segment are from unaffiliated customers.
For geographical reporting, revenues are attributed to the geographic area in which our subsidiaries are located. Long-lived property, plant and equipment, goodwill and other intangible assets are attributed to the geographic area in which the assets are located.
A summary of operations by geographic area for the years ended December 31, 2008, 2007 and 2006 is as follows:
| | | | | | | | | | | | | | | | | | | |
| | | North America | | | Europe | | | Asia | | Elimination | | | Consolidated | |
| | | (In thousands) | |
2008 | | | | | | | | | | | | | | | | | | | |
Sales to unaffiliated customers | | $ | 263,647 | | | $ | 151,928 | | | $ | 595,429 | | $ | — | | | $ | 1,011,004 | |
Transfers between geographic locations | | | 48,561 | | | | 37,765 | | | | 178,055 | | | (264,381 | ) | | $ | — | |
| | | | | | | | | | | | | | | | | | | |
Total net sales | | $ | 312,208 | | | $ | 189,693 | | | $ | 773,484 | | $ | (264,381 | ) | | $ | 1,011,004 | |
| | | | | | | | | | | | | | | | | | | |
| | | | | |
Operating income (loss) | | $ | (35,134 | ) | | $ | (78,762 | ) | | $ | 1,880 | | $ | — | | | $ | (112,016 | ) |
| | | | | |
Long-lived assets | | $ | 249,459 | | | $ | 19,598 | | | $ | 2,809 | | $ | — | | | $ | 271,866 | |
All other identifiable assets | | | 994,432 | | | | 103,516 | | | | 267,713 | | | — | | | | 1,365,661 | |
| | | | | | | | | | | | | | | | | | | |
Total assets | | $ | 1,243,891 | | | $ | 123,114 | | | $ | 270,522 | | $ | — | | | $ | 1,637,527 | |
| | | | | | | | | | | | | | | | | | | |
| | | | | | | | | | | | | | | | |
| | | North America | | Europe | | Asia | | Elimination | | | Consolidated |
| | | (In thousands) |
2007 | | | | | | | | | | | | | | | | |
Sales to unaffiliated customers | | $ | 488,438 | | $ | 151,439 | | $ | 930,172 | | $ | — | | | $ | 1,570,049 |
Transfers between geographic locations | | | 344,033 | | | 37,130 | | | 232,389 | | | (613,552 | ) | | $ | — |
| | | | | | | | | | | | | | | | |
Total net sales | | $ | 832,471 | | $ | 188,569 | | $ | 1,162,561 | | $ | (613,552 | ) | | $ | 1,570,049 |
| | | | | | | | | | | | | | | | |
| | | | | |
Operating income | | $ | 174,030 | | $ | 24,992 | | $ | 71,137 | | $ | — | | | $ | 270,159 |
| | | | | |
Long-lived assets | | $ | 295,806 | | $ | 21,262 | | $ | 2,941 | | $ | — | | | $ | 320,009 |
All other identifiable assets | | | 1,042,670 | | | 258,786 | | | 455,478 | | | — | | | | 1,756,934 |
| | | | | | | | | | | | | | | | |
Total assets | | $ | 1,338,476 | | $ | 280,048 | | $ | 458,419 | | $ | — | | | $ | 2,076,943 |
| | | | | | | | | | | | | | | | |
81
NOVELLUS SYSTEMS, INC.
NOTES TO CONSOLIDATED FINANCIAL STATEMENTS — (Continued)
| | | | | | | | | | | | | | | | | |
| | | North America | | Europe | | Asia | | | Elimination | | | Consolidated |
| | | (In thousands) |
2006 | | | | | | | | | | | | | | | | | |
Sales to unaffiliated customers | | $ | 1,245,003 | | $ | 97,834 | | $ | 315,679 | | | $ | — | | | $ | 1,658,516 |
Transfers between geographic locations | | | 312,230 | | | 27,902 | | | 53,753 | | | | (393,885 | ) | | $ | — |
| | | | | | | | | | | | | | | | | |
Total net sales | | $ | 1,557,233 | | $ | 125,736 | | $ | 369,432 | | | $ | (393,885 | ) | | $ | 1,658,516 |
| | | | | | | | | | | | | | | | | |
| | | | | |
Operating income (loss) | | $ | 394,414 | | $ | 11,461 | | $ | (101,101 | ) | | $ | — | | | $ | 304,774 |
| | | | | |
Long-lived assets | | $ | 344,868 | | $ | 16,951 | | $ | 2,780 | | | $ | — | | | $ | 364,599 |
All other identifiable assets | | | 1,711,893 | | | 188,202 | | | 97,798 | | | | — | | | | 1,997,893 |
| | | | | | | | | | | | | | | | | |
Total assets | | $ | 2,056,761 | | $ | 205,153 | | $ | 100,578 | | | $ | — | | | $ | 2,362,492 |
| | | | | | | | | | | | | | | | | |
Revenue for each geographic area is recognized from the locations within a designated geographic region in accordance with our revenue recognition policy. Transfers and commission arrangements between geographic areas are at prices sufficient to recover a reasonable profit. Due to the establishment of our international headquarters in Singapore, a significant portion of North America net sales shifted to Asia in 2007.
Note 16. Related Party Transactions
We lease an aircraft from NVLS I, LLC, a third-party entity wholly owned by Richard S. Hill, our Chairman and Chief Executive Officer. Under the aircraft lease agreement, we incurred lease expense of $0.8 million, $0.7 million and $0.8 million for the years ended December 31, 2008, 2007 and 2006, respectively.
During each of the years ended December 31, 2008, 2007 and 2006, Novellus employed, in non-executive positions, certain immediate family members of our executive officers. The aggregate compensation amounts recognized for these immediate family members during the years ended December 31, 2008, 2007 and 2006 were $0.6 million, $0.8 million and $2.1 million, respectively.
Current regulations prohibit company loans to “executive officers,” as defined by the SEC. We have outstanding loans to non-executive vice presidents and other key personnel. As of December 31, 2008 and 2007, the total outstanding balance of such loans was $0.9 million and $1.0 million, respectively. As of December 31, 2008, nearly all of the outstanding balance was secured by collateral. Loans typically bear interest, except for those made for employee relocation purposes. Bad debt expense related to loans to personnel has not historically been significant.
Note 17. Quarterly Financial Data (Unaudited)
| | | | | | | | | | | | | | |
| | | Quarter Ended | |
| | | March 29,
2008 | | June 28,
2008 | | | September 27,
2008 | | December 31,
2008 (1) | |
| | | (In thousands, except per share amounts) | |
Net sales | | $ | 314,713 | | $ | 257,740 | | | $ | 250,098 | | $ | 188,453 | |
Gross profit | | $ | 144,940 | | $ | 110,963 | | | $ | 111,524 | | $ | 68,517 | |
Net income (loss) | | $ | 15,529 | | $ | (2,385 | ) | | $ | 1,397 | | $ | (130,251 | ) |
Basic net income (loss) per share | | $ | 0.15 | | $ | (0.02 | ) | | $ | 0.01 | | $ | (1.36 | ) |
Diluted net income (loss) per share | | $ | 0.15 | | $ | (0.02 | ) | | $ | 0.01 | | $ | (1.36 | ) |
Shares used in basic per share calculations | | | 100,683 | | | 98,202 | | | | 97,581 | | | 96,016 | |
Shares used in diluted per share calculations | | | 101,375 | | | 98,202 | | | | 98,348 | | | 96,016 | |
82
NOVELLUS SYSTEMS, INC.
NOTES TO CONSOLIDATED FINANCIAL STATEMENTS — (Continued)
| | | | | | | | | | | | |
| | | Quarter Ended |
| | | March 31,
2007 | | June 30,
2007 | | September 29,
2007 | | December 31,
2007(2,3) |
| | | (In thousands, except per share amounts) |
Net sales | | $ | 396,974 | | $ | 416,335 | | $ | 393,277 | | $ | 363,463 |
Gross profit | | $ | 194,909 | | $ | 208,110 | | $ | 194,307 | | $ | 171,863 |
Net income | | $ | 53,783 | | $ | 57,345 | | $ | 49,711 | | $ | 52,861 |
Basic net income per share | | $ | 0.43 | | $ | 0.46 | | $ | 0.41 | | $ | 0.48 |
Diluted net income per share | | $ | 0.42 | | $ | 0.45 | | $ | 0.41 | | $ | 0.47 |
Shares used in basic per share calculations | | | 123,979 | | | 123,788 | | | 120,414 | | | 111,160 |
Shares used in diluted per share calculations | | | 127,137 | | | 126,630 | | | 121,902 | | | 112,395 |
| (1) | The fourth quarter of 2008 results include a non-cash impairment charge of $99.5 million to reduce the carrying value of goodwill within our Industrial Applications Group. |
| (2) | The fourth quarter of 2007 results include a net restructuring and other benefit of $8.0 million, primarily resulting from a gain on sale of property and buildings in San Jose, California. |
| (3) | In the fourth quarter of 2007, we determined that certain performance conditions impacting the vesting of a portion of our stock-based compensation to employees were no longer probable of being met. As a result, we reversed $8.4 million of previously recognized stock-based compensation expense, of which $2.4 million was initially recognized in 2006. |
83
REPORT OF INDEPENDENT REGISTERED PUBLIC ACCOUNTING FIRM
The Board of Directors and Shareholders of Novellus Systems, Inc.
We have audited the accompanying consolidated balance sheets of Novellus Systems, Inc. as of December 31, 2008 and 2007, and the related consolidated statements of operations, shareholders’ equity, and cash flows for each of the three years in the period ended December 31, 2008. Our audits also included the financial statement schedule listed in the Index at Item 15(a) (2). These financial statements and schedule are the responsibility of the Company’s management. Our responsibility is to express an opinion on these financial statements and schedule based on our audits.
We conducted our audits in accordance with the standards of the Public Company Accounting Oversight Board (United States). Those standards require that we plan and perform the audit to obtain reasonable assurance about whether the financial statements are free of material misstatement. An audit includes examining, on a test basis, evidence supporting the amounts and disclosures in the financial statements. An audit also includes assessing the accounting principles used and significant estimates made by management, as well as evaluating the overall financial statement presentation. We believe that our audits provide a reasonable basis for our opinion.
In our opinion, the financial statements referred to above present fairly, in all material respects, the consolidated financial position of Novellus Systems, Inc. at December 31, 2008 and 2007, and the consolidated results of its operations and its cash flows for each of the three years in the period ended December 31, 2008, in conformity with U.S. generally accepted accounting principles. Also, in our opinion, the related financial statement schedule, when considered in relation to the basic financial statements taken as a whole, presents fairly in all material respects the information set forth therein.
We also have audited, in accordance with the standards of the Public Company Accounting Oversight Board (United States), Novellus Systems, Inc.’s internal control over financial reporting as of December 31, 2008, based on criteria established in Internal Control — Integrated Framework issued by the Committee of Sponsoring Organizations of the Treadway Commission and our report dated February 26, 2009 expressed an unqualified opinion thereon.
/s/ Ernst & Young LLP
San Jose, California
February 26, 2009
84
| Item 9. | Changes in and Disagreements with Accountants on Accounting and Financial Disclosure |
Not applicable.
| Item 9A. | Controls and Procedures |
Attached as exhibits to this Annual Report on Form 10-K are certifications of our Chief Executive Officer (CEO) and Principal Financial Officer (PFO), which are required pursuant to Rule 13a-14 of the Exchange Act. This “Controls and Procedures” section of this Annual Report on Form 10-K includes information concerning management’s assessment of our internal control over financial reporting and the controls evaluation referenced in the certifications. The report of Ernst & Young LLP, our independent registered public accounting firm, is also included below. Ernst & Young LLP’s report addresses their audit of our internal control over financial reporting. This section of the Annual Report on Form 10-K should be read in conjunction with the certifications and the report of Ernst & Young LLP for a more complete understanding of the matters presented.
Evaluation of Disclosure Controls and Procedures
We evaluated the effectiveness of the design and operation of our disclosure controls and procedures as of the end of the period covered by this Annual Report on Form 10-K. This controls evaluation was performed under the supervision and with the participation of management, including our CEO and PFO. Disclosure controls are procedures that are designed to ensure that information required to be disclosed in our reports filed under the Exchange Act, such as this Annual Report on Form 10-K, is recorded, processed, summarized and reported within the time periods specified by the SEC. Disclosure controls are also designed to ensure that such information is accumulated and communicated to our management, including the CEO and PFO, as appropriate to allow timely decisions regarding required disclosure. Our quarterly evaluation of disclosure controls includes an evaluation of some components of our internal control over financial reporting. We also perform a separate annual evaluation of internal control over financial reporting for the purpose of providing the management report below.
The evaluation of our disclosure controls included a review of their objectives and design, our implementation of the controls and the effect of the controls on the information generated for use in this Annual Report on Form 10-K. In the course of the controls evaluation, we assessed all identified data errors or control problems and sought to confirm that appropriate corrective actions, including process improvements, were being undertaken. This type of evaluation is performed on a quarterly basis so that the conclusions of management, including the CEO and PFO, concerning the effectiveness of the disclosure controls can be reported in our periodic reports on Form 10-Q and Form 10-K. Many of the components of our disclosure controls are also evaluated on an ongoing basis by both our internal audit and finance organizations. The overall goals of these various activities are to monitor our disclosure controls and to modify them as necessary. We intend to maintain the disclosure controls as dynamic systems that we adjust as circumstances merit.
Based on the controls evaluation, our CEO and PFO have concluded that, as of the end of the period covered by this Form 10-K, our disclosure controls were effective to provide reasonable assurance that information required to be disclosed in our Exchange Act reports was recorded, processed, summarized and reported within the time periods specified by the SEC, and that material information relating to Novellus was made known to management, including the CEO and the PFO, particularly during the time when our periodic reports were being prepared.
85
Management Report on Internal Control over Financial Reporting
Our management is responsible for establishing and maintaining adequate internal control over financial reporting, as such term is defined in Exchange Act Rules 13a-15(f) and 15d-15(f). Under the supervision and with the participation of our management, including our CEO and PFO, we conducted an evaluation of the effectiveness of our internal control over financial reporting as of December 31, 2008 based on the guidelines established inInternal Control — Integrated Frameworkissued by the Committee of Sponsoring Organizations of the Treadway Commission (COSO). Based on the results of our evaluation, our management concluded that our internal control over financial reporting was effective as of December 31, 2008 to provide reasonable assurance regarding the reliability of financial reporting and the preparation of financial statements for external reporting purposes in accordance with Generally Accepted Accounting Principles applied in the United States.
86
Report of Independent Registered Public Accounting Firm
The Board of Directors and Shareholders of Novellus Systems, Inc.
We have audited Novellus Systems, Inc.’s internal control over financial reporting as of December 31, 2008, based on criteria established in Internal Control — Integrated Framework issued by the Committee of Sponsoring Organizations of the Treadway Commission (the COSO criteria). Novellus Systems, Inc.’s management is responsible for maintaining effective internal control over financial reporting, and for its assessment of the effectiveness of internal control over financial reporting included in the accompanying Management Report on Internal Control over Financial Reporting. Our responsibility is to express an opinion on the company’s internal control over financial reporting based on our audit.
We conducted our audit in accordance with the standards of the Public Company Accounting Oversight Board (United States). Those standards require that we plan and perform the audit to obtain reasonable assurance about whether effective internal control over financial reporting was maintained in all material respects. Our audit included obtaining an understanding of internal control over financial reporting, assessing the risk that a material weakness exists, testing and evaluating the design and operating effectiveness of internal control based on the assessed risk, and performing such other procedures as we considered necessary in the circumstances. We believe that our audit provides a reasonable basis for our opinion.
A company’s internal control over financial reporting is a process designed to provide reasonable assurance regarding the reliability of financial reporting and the preparation of financial statements for external purposes in accordance with generally accepted accounting principles. A company’s internal control over financial reporting includes those policies and procedures that (1) pertain to the maintenance of records that, in reasonable detail, accurately and fairly reflect the transactions and dispositions of the assets of the company; (2) provide reasonable assurance that transactions are recorded as necessary to permit preparation of financial statements in accordance with generally accepted accounting principles, and that receipts and expenditures of the company are being made only in accordance with authorizations of management and directors of the company; and (3) provide reasonable assurance regarding prevention or timely detection of unauthorized acquisition, use or disposition of the company’s assets that could have a material effect on the financial statements.
Because of its inherent limitations, internal control over financial reporting may not prevent or detect misstatements. Also, projections of any evaluation of effectiveness to future periods are subject to the risk that controls may become inadequate because of changes in conditions, or that the degree of compliance with the policies or procedures may deteriorate.
In our opinion, Novellus Systems, Inc. maintained, in all material respects, effective internal control over financial reporting as of December 31, 2008, based on the COSO criteria.
We have also audited, in accordance with the standards of the Public Company Accounting Oversight Board (United States), the consolidated balance sheets of Novellus Systems, Inc. as of December 31, 2008 and 2007, the related consolidated statements of operations, shareholders’ equity, and cash flows for each of the three years in the period ended December 31, 2008 of Novellus Systems, Inc., and the financial statement schedule listed in the index at Item 15(a)(2), and our report dated February 26, 2009 expressed an unqualified opinion thereon.
/s/ Ernst & Young LLP
San Jose, California
February 26, 2009
87
Limitations on Effectiveness of Controls
Our management, including the CEO and PFO, do not expect that our disclosure controls or our internal controls for financial reporting will prevent all error and all fraud. A control system, no matter how well conceived and operated, can provide only reasonable, not absolute, assurance that the objectives of the control system are met. Further, the design of a control system must reflect the fact that there are resource constraints, and the benefits of controls must be considered relative to their costs. Because of the inherent limitations in all control systems, no evaluation of controls can provide absolute assurance that all control issues and instances of fraud, if any, within Novellus have been detected. These inherent limitations include the realities that judgments in decision-making can be faulty, and that breakdowns can occur because of simple error or mistake. Controls can also be circumvented by the individual acts of some persons, by collusion of two or more people, or by management override of the controls. The design of any system of controls is based in part upon certain assumptions about the likelihood of future events, and there can be no assurance that any design will succeed in achieving its stated goals under all potential future conditions; over time, controls may become inadequate because of changes in conditions, or the degree of compliance with the policies or procedures may deteriorate. Because of the inherent limitations in a cost-effective control system, misstatements due to error or fraud may occur and not be detected.
| Item 9B. | Other Information |
Not applicable.
PART III
| Item 10. | Directors, Executive Officers and Corporate Governance |
The information required by this item is included under (i) “Proposal No. 1: Election of Directors” as it relates to members of our Board of Directors, including our Audit Committee and our Audit Committee financial experts, our code of ethics, any changes to procedures by which security holders may recommend nominees to our Board of Directors, (ii) “Other Information — Executive Officers” as it relates to our executive officers, and (iii) “Other Matters — Section 16(a) Beneficial Ownership Reporting Compliance” as it relates to information concerning Section 16(a) beneficial ownership reporting compliance, in our Proxy Statement, to be filed in connection with our 2009 Annual Meeting of Shareholders, and is incorporated herein by reference.
| Item 11. | Executive Compensation |
The information required by this item is included under (i) “Other Information — Compensation Discussion and Analysis” as it relates to compensation of our executive, (ii) “Proposal No. 1: Election of Directors” as it relates to our Compensation Committee disclosure pursuant to Item 407(e)(4), and (iii) “Compensation Committee Report” as it relates to disclosure pursuant to Item 407(e)(5) in our Proxy Statement, to be filed in connection with our 2009 Annual Meeting of Shareholders, and is incorporated herein by reference.
| Item 12. | Security Ownership of Certain Beneficial Owners and Management and Related Shareholder Matters |
The information required by this item is included under (i) “Other Information — Security Ownership of Certain Beneficial Owners and Management” as it relates to security ownership of certain beneficial owners and management, and (ii) “Other Information — Equity Compensation Plan Information” as it relates to our equity compensation plans, in our Proxy Statement, to be filed in connection with our 2009 Annual Meeting of Shareholders, and is incorporated herein by reference.
88
| Item 13. | Certain Relationships and Related Transactions, and Director Independence |
The information required by this item is included under “Proposal No. 1: Election of Directors” and “Other Information — Certain Relationships and Related Transactions” in our Proxy Statement, to be filed in connection with our 2009 Annual Meeting of Shareholders, and is incorporated herein by reference.
| Item 14. | Principal Accountant Fees and Services |
The information required by this item is included under “Proposal No. 4: Ratification of Appointment of Independent Registered Public Accounting Firm — Audit and Non-Audit Fees” in our Proxy Statement, to be filed in connection with our 2009 Annual Meeting of Shareholders, and is incorporated herein by reference.
PART IV
| Item 15. | Exhibits and Financial Statement Schedules |
(a) The following documents are filed as part of this report:
(1)Financial Statements and Reports of Independent Registered Public Accounting Firm
Consolidated Statements of Operations — Years Ended December 31, 2008, 2007, and 2006. Consolidated Balance Sheets as of December 31, 2008 and 2007. Consolidated Statements of Cash Flows — Years Ended December 31, 2008, 2007, and 2006. Consolidated Statement of Shareholders’ Equity — Years Ended December 31, 2008, 2007, and 2006. Notes to Consolidated Financial Statements. Reports of Independent Registered Public Accounting Firm.
(2)Financial Statement Schedules
The following financial statement schedule is filed as part of this Report on Form 10-K and should be read in conjunction with the financial statements:
Schedule II — Valuation and Qualifying Accounts.
All other schedules are omitted because they are not required or the required information is included in the financial statements or notes thereto.
(3)Exhibits (numbered in accordance with Item 601 of Regulation S-K)
| | |
3.1(1) | | Amended and Restated Articles of Incorporation of Novellus. |
| |
3.2(2) | | Amended and Restated Bylaws of Novellus. |
| |
10.1(3) | | Assignment and Assumption of Lessee’s Interest in Lease (Units 8 and 9, Palo Alto) and Covenants, Conditions and Restrictions on Leasehold Interests (Units 1-12, Palo Alto) by and between Varian Associates, Inc. and Novellus dated May 7, 1997. |
| |
10.2(4) | | Environmental Agreement by and between Varian Associates, Inc. and Novellus dated May 7, 1997. |
| |
*10.3(5) | | Novellus’ 1992 Stock Option Plan, together with forms of agreements thereunder. |
| |
*10.4(6) | | Amended and Restated 1992 Employee Stock Purchase Plan, as amended. |
89
| | |
| |
*10.5(7) | | Form of Directors and Officers Indemnification Agreement. |
| |
*10.6(8) | | GaSonics International Corporation 1994 Stock Option/Stock Issuance plan, together with forms of agreements thereunder, as assumed by Novellus. |
| |
*10.7(9) | | Gamma Precision Technology, Inc. 1998 Stock Option Plan, together with forms of agreements thereunder, as assumed by Novellus. |
| |
*10.8(10) | | GaSonics International Corporation Supplemental Stock Option Plan, as assumed by Novellus. |
| |
*10.9(11) | | Novellus 2001 Stock Incentive Plan, as amended, together with forms of agreement thereunder. |
| |
*10.10(12) | | SpeedFam-IPEC, Inc. Amended and Restated 1995 Stock Plan, as assumed by Novellus. |
| |
*10.11(13) | | SpeedFam-IPEC, Inc. 2001 Nonstatutory Stock Option Plan, together with forms of agreements thereunder, as assumed by Novellus. |
| |
*10.12(14) | | Integrated Process Equipment Corporation 1992 Stock Option Plan, as assumed by Novellus. |
| |
10.13(15) | | Lease Agreement between Seldin Properties and Integrated Process Equipment Corp. dated December 26, 1996. |
| |
10.14(16) | | Lease Guaranty between Novellus and Phoenix Industrial Investment Partners, L.P. dated January 21, 2003. |
| |
*10.15(17) | | Restricted Stock Purchase Agreement between Novellus and Richard S. Hill dated December 13, 2002. |
| |
10.16(18) | | Credit Agreement between Johanna 34 Vermogensverwaltungs GmbH, Novellus Systems BV, Novellus Systems, Inc. and JPMorgan Chase Bank, as Administrative Agent dated June 25, 2004. |
| |
10.17(19) | | Guarantee and Collateral Agreement made by Novellus Systems, Inc. in favor of JPMorgan Chase Bank, as Administrative Agent dated June 25, 2004. |
| |
10.18(20) | | Binding Memorandum of Understanding between Novellus, and Applied Materials, Inc., effective as of September 3, 2004. Portions of this exhibit have been omitted pursuant to a request for confidential treatment. |
| |
*10.19(21) | | Amended and Restated Employment Agreement between Novellus and Richard S. Hill effective as of July 24, 2008. |
| |
10.20(22) | | Form of Non-Employee Director Restricted Stock Bonus Agreement, as amended. |
| |
10.21(23) | | Form of Resale Restriction Agreement. |
| |
10.22(24) | | Credit Agreement among Novellus Systems, Inc., as Borrower, Bank of America, N.A., as Administrative Agent and Swing Line Lender, Deutche Bank AG New York Branch, as Syndication Agent, ABN Amro Bank, N.V. and Mizuho Corporate Bank Ltd, as Co-Documentation Agents, and the other lenders thereto, Banc of America Securities, LLC and Deutche Bank Securities, Inc, as Joint Lead Arrangers and Joint Book Managers, dated as of December 26, 2006, as amended by the First Amendment to the Credit Agreement dated April 23, 2008. |
| |
*10.23(25) | | Executive Employment Agreement between Novellus Systems, Inc. and Dr. Thomas Caulfield dated October 12, 2005. |
| |
*10.24(26) | | Offer Letter of Employment to Ginetto Addiego dated February 2, 2005. |
| |
*10.25(27) | | Offer Letter of Employment to Fusen Chen dated October 4, 2004. |
| |
*10.26(28) | | Amended Executive Voluntary Deferred Compensation Plan, as amended. |
| |
21.1 | | Subsidiaries of Novellus Systems, Inc. |
| |
23.1 | | Consent of Independent Registered Public Accounting Firm. |
90
| | |
| |
24.1 | | Power of Attorney (see page 93). |
| |
31.1 | | Certification of Richard S. Hill, Chairman of the Board of Directors and Chief Executive Officer of Novellus Systems, Inc. dated February 27, 2009 in accordance with Rules 13a-14(a) and 15d-14(a) of the Securities Exchange Act, as amended, as adopted pursuant to Section 302 of the Sarbanes-Oxley Act of 2002. |
| |
31.2 | | Certification of Jeffrey C. Benzing, Executive Vice President and Chief Administrative Officer of Novellus Systems, Inc. dated February 27, 2009 in accordance with Rules 13a-14(a) and 15d-14(a) of the Securities Exchange Act, as amended, as adopted pursuant to Section 302 of the Sarbanes-Oxley Act of 2002. |
| |
32.1 | | Certification of Richard S. Hill, Chairman of the Board of Directors and Chief Executive Officer of Novellus Systems, Inc. dated February 27, 2009 in accordance with 18 U.S.C. 1350, as adopted pursuant to Section 906 of the Sarbanes-Oxley Act of 2002. |
| |
32.2 | | Certification of Jeffrey C. Benzing, Executive Vice President and Chief Administrative Officer of Novellus Systems, Inc. dated February 27, 2009 in accordance with 18 U.S.C. 1350, as adopted pursuant to Section 906 of the Sarbanes-Oxley Act of 2002. |
| (1) | Incorporated by reference to the exhibit with the corresponding exhibit number in Novellus’ Report on Form 10-K filed with the Securities and Exchange Commission on March 30, 2000. |
| (2) | Incorporated by reference to Exhibit 3.2 to Novellus’ Report on Form 8-K filed with the Securities and Exchange Commission on July 31, 2008. |
| (3) | Incorporated by reference to Exhibit 2.3 to Novellus’ Report on Form 8-K filed with the Securities and Exchange Commission on July 7, 1997. |
| (4) | Incorporated by reference to Exhibit 2.6 to Novellus’ Report on Form 8-K filed with the Securities and Exchange Commission on July 7, 1997. |
| (5) | Incorporated by reference to Exhibit 10.30 filed with Novellus’ Report on Form 10-K filed with the Securities and Exchange Commission on February 26, 1993. |
| (6) | Incorporated by reference to Exhibit 10.4 filed with Novellus’ Report on Form 10-Q filed with the Securities and Exchange Commission on August 7, 2007. |
| (7) | Incorporated by reference to Exhibit 10.1 filed with Novellus’ Report on Form 10-Q filed with the Securities and Exchange Commission on August 13, 2002. |
| (8) | Incorporated by reference to Exhibit 10.31 to Novellus’ Report on Form 10-K filed with the Securities and Exchange Commission on March 23, 2001. |
| (9) | Incorporated by reference to Exhibit 10.32 to Novellus’ Report on Form 10-K filed with the Securities and Exchange Commission on March 23, 2001. |
| (10) | Incorporated by reference to Exhibit 10.33 to Novellus’ Report on Form 10-K filed with the Securities and Exchange Commission on March 23, 2001. |
| (11) | Incorporated by reference to Exhibit 10.9 to Novellus’ Report on Form 10-Q filed with the Securities and Exchange Commission on November 5, 2008. |
| (12) | Incorporated by reference to Exhibit 10.30 to Novellus’ Report on Form 10-K filed with the Securities and Exchange Commission on March 5, 2003. |
| (13) | Incorporated by reference to Exhibit 10.31 to Novellus’ Report on Form 10-K filed with the Securities and Exchange Commission on March 5, 2003. |
| (14) | Incorporated by reference to Exhibit 10.32 to Novellus’ Report on Form 10-K filed with the Securities and Exchange Commission on March 5, 2003. |
91
| (15) | Incorporated by reference to Exhibit 10.35 to Novellus’ Report on Form 10-K filed with the Securities and Exchange Commission on March 5, 2003. |
| (16) | Incorporated by reference to Exhibit 10.39 to Novellus’ Report on Form 10-K filed with the Securities and Exchange Commission on March 5, 2003. |
| (17) | Incorporated by reference to Exhibit 10.41 to Novellus’ Report on Form 10-K filed with the Securities and Exchange Commission on March 12, 2004. |
| (18) | Incorporated by reference to Exhibit 10.1 to Novellus’ Report on Form 8-K filed with the Securities and Exchange Commission on July 12, 2004. |
| (19) | Incorporated by reference to Exhibit 10.2 to Novellus’ Report on Form 8-K filed with the Securities and Exchange Commission on July 12, 2004. |
| (20) | Incorporated by reference to Exhibit 99.1 to Novellus’ Report on Form 8-K filed with the Securities and Exchange Commission on September 24, 2004. |
| (21) | Incorporated by reference to Exhibit 10.19 to Novellus’ Report on Form 10-Q filed with the Securities and Exchange Commission on August 7, 2008. |
| (22) | Incorporated by reference to Exhibit 10.3 to Novellus’ Report on Form 8-K filed with the Securities and Exchange Commission on May 5, 2005. |
| (23) | Incorporated by reference to Exhibit 10.34 to Novellus’ Report on Form 8-K filed with the Securities and Exchange Commission on November 15, 2005. |
| (24) | Incorporated by reference to Exhibit 10.22 to Novellus’ Report on Form 10-Q filed with the Securities and Exchange Commission on May 7, 2008. |
| (25) | Incorporated by reference to Exhibit 10.25 to Novellus’ Report on Form 10-K filed with the Securities and Exchange Commission on March 1, 2007. |
| (26) | Incorporated by reference to Exhibit 10.26 to Novellus’ Report on Form 10-K filed with the Securities and Exchange Commission on March 1, 2007. |
| (27) | Incorporated by reference to Exhibit 10.27 to Novellus’ Report on Form 10-Q filed with the Securities and Exchange Commission on May 7, 2008. |
| (28) | Incorporated by reference to Exhibit 10.28 to Novellus’ Report on Form 10-Q filed with the Securities and Exchange Commission on November 5, 2008. |
| * | Management contracts or compensatory plans or arrangements. |
92
SIGNATURES
Pursuant to the requirements of Section 13 or 15(d) of the Securities and Exchange Act of 1934, the Registrant has duly caused this Annual Report on Form 10-K to be signed on its behalf by the undersigned, thereunto duly authorized, in the City of San Jose, State of California on this 27th day of February, 2009.
| | |
| NOVELLUS SYSTEMS, INC. |
| |
| By: | | /s/ Richard S. Hill |
| | Richard S. Hill |
| | Chairman of the Board of Directors and |
| | Chief Executive Officer |
POWER OF ATTORNEY
KNOW ALL PERSONS BY THESE PRESENTS, that each person whose signature appears below constitutes and appoints Richard S. Hill and Jeffrey C. Benzing, and each of them, his attorneys-in-fact, each with the power of substitution, for him in any and all capacities, to sign any amendments to this Annual Report on Form 10-K and to file the same, with exhibits thereto and other documents in connection therewith, with the Securities and Exchange Commission, hereby ratifying and confirming all that each of said attorneys-in-fact, or his substitute or substitutes, may do or cause to be done by virtue hereof.
Pursuant to the requirements of the Securities Exchange Act of 1934, this Annual Report on Form 10-K has been signed by the following persons on behalf of the Registrant in the capacities and on the date indicated.
| | | | |
Signature | | Title | | Date |
| | |
/s/ Richard S. Hill Richard S. Hill | | Chairman of the Board of Directors and Chief Executive Officer (Principal Executive Officer) | | February 27, 2009 |
| | |
| | |
/s/ Jeffrey C. Benzing Jeffrey C. Benzing | | Executive Vice President and Chief Administrative Officer (Principal Financial Officer) | | February 27, 2009 |
| | |
| | |
/s/ John D. Hertz | | Vice President of Corporate Finance (Principal Accounting Officer) | | February 27, 2009 |
| John D. Hertz | | |
| | |
/s/ Neil R. Bonke | | Director | | February 27, 2009 |
| Neil R. Bonke | | |
| | |
/s/ Youssef A. El-Mansy | | Director | | February 27, 2009 |
| Youssef A. El-Mansy | | |
| | |
/s/ J. David Litster | | Director | | February 27, 2009 |
| J. David Litster | | |
| | |
| | Director | | |
| Yoshio Nishi | | |
| | |
/s/ Glen G. Possley | | Director | | February 27, 2009 |
| Glen G. Possley | | |
93
| | | | |
Signature | | Title | | Date |
| | |
/s/ Ann D. Rhoads | | Director | | February 27, 2009 |
| Ann D. Rhoads | | |
| | |
/s/ William R. Spivey | | Director | | February 27, 2009 |
| William R. Spivey | | |
| | |
/s/ Delbert A. Whitaker | | Director | | February 27, 2009 |
| Delbert A. Whitaker | | |
94
SCHEDULE II
VALUATION AND QUALIFYING ACCOUNTS
December 31, 2008, 2007 and 2006
| | | | | | | | | | | | | |
| | | Balance at
Beginning of
Year | | Additions | | Deductions | | | Balance at
End of Year |
| | | (In thousands) |
Allowance for doubtful accounts (1) | | | | | | | | | | | | | |
2008 | | $ | 1,988 | | $ | 2,686 | | $ | (617 | ) | | $ | 4,057 |
2007 | | $ | 1,753 | | $ | 879 | | $ | (644 | ) | | $ | 1,988 |
2006 | | $ | 987 | | $ | 1,119 | | $ | (353 | ) | | $ | 1,753 |
| (1) | Deductions represent uncollectible accounts written off, net of recoveries and other adjustments. |
95
EXHIBIT INDEX
| | |
| |
3.1(1) | | Amended and Restated Articles of Incorporation of Novellus. |
| |
3.2(2) | | Amended and Restated Bylaws of Novellus. |
| |
10.1(3) | | Assignment and Assumption of Lessee’s Interest in Lease (Units 8 and 9, Palo Alto) and Covenants, Conditions and Restrictions on Leasehold Interests (Units 1-12, Palo Alto) by and between Varian Associates, Inc. and Novellus dated May 7, 1997. |
| |
10.2(4) | | Environmental Agreement by and between Varian Associates, Inc. and Novellus dated May 7, 1997. |
| |
*10.3(5) | | Novellus’ 1992 Stock Option Plan, together with forms of agreements thereunder. |
| |
*10.4(6) | | Amended and Restated 1992 Employee Stock Purchase Plan, as amended. |
| |
*10.5(7) | | Form of Directors and Officers Indemnification Agreement. |
| |
*10.6(8) | | GaSonics International Corporation 1994 Stock Option/Stock Issuance plan, together with forms of agreements thereunder, as assumed by Novellus. |
| |
*10.7(9) | | Gamma Precision Technology, Inc. 1998 Stock Option Plan, together with forms of agreements thereunder, as assumed by Novellus. |
| |
*10.8(10) | | GaSonics International Corporation Supplemental Stock Option Plan, as assumed by Novellus. |
| |
*10.9(11) | | Novellus 2001 Stock Incentive Plan, as amended, together with forms of agreement thereunder. |
| |
*10.10(12) | | SpeedFam-IPEC, Inc. Amended and Restated 1995 Stock Plan, as assumed by Novellus. |
| |
*10.11(13) | | SpeedFam-IPEC, Inc. 2001 Nonstatutory Stock Option Plan, together with forms of agreements thereunder, as assumed by Novellus. |
| |
*10.12(14) | | Integrated Process Equipment Corporation 1992 Stock Option Plan, as assumed by Novellus. |
| |
10.13(15) | | Lease Agreement between Seldin Properties and Integrated Process Equipment Corp. dated December 26, 1996. |
| |
10.14(16) | | Lease Guaranty between Novellus and Phoenix Industrial Investment Partners, L.P. dated January 21, 2003. |
| |
*10.15(17) | | Restricted Stock Purchase Agreement between Novellus and Richard S. Hill dated December 13, 2002. |
| |
10.16(18) | | Credit Agreement between Johanna 34 Vermogensverwaltungs GmbH, Novellus Systems BV, Novellus Systems, Inc. and JPMorgan Chase Bank, as Administrative Agent dated June 25, 2004. |
| |
10.17(19) | | Guarantee and Collateral Agreement made by Novellus Systems, Inc. in favor of JPMorgan Chase Bank, as Administrative Agent dated June 25, 2004. |
| |
10.18(20) | | Binding Memorandum of Understanding between Novellus, and Applied Materials, Inc., effective as of September 3, 2004. Portions of this exhibit have been omitted pursuant to a request for confidential treatment. |
| |
*10.19(21) | | Amended and Restated Employment Agreement between Novellus and Richard S. Hill effective as of July 24, 2008. |
| |
10.20(22) | | Form of Non-Employee Director Restricted Stock Bonus Agreement, as amended. |
| |
10.21(23) | | Form of Resale Restriction Agreement. |
96
| | |
| |
10.22(24) | | Credit Agreement among Novellus Systems, Inc., as Borrower, Bank of America, N.A., as Administrative Agent and Swing Line Lender, Deutche Bank AG New York Branch, as Syndication Agent, ABN Amro Bank, N.V. and Mizuho Corporate Bank Ltd, as Co-Documentation Agents, and the other lenders thereto, Banc of America Securities, LLC and Deutche Bank Securities, Inc, as Joint Lead Arrangers and Joint Book Managers, dated as of December 26, 2006, as amended by the First Amendment to the Credit Agreement dated April 23, 2008. |
| |
*10.23(25) | | Executive Employment Agreement between Novellus Systems, Inc. and Dr. Thomas Caulfield dated October 12, 2005. |
| |
*10.24(26) | | Offer Letter of Employment to Ginetto Addiego dated February 2, 2005. |
| |
*10.25(27) | | Offer Letter of Employment to Fusen Chen dated October 4, 2004. |
| |
*10.26(28) | | Amended Executive Voluntary Deferred Compensation Plan, as amended. |
| |
21.1 | | Subsidiaries of Novellus Systems Inc. |
| |
23.1 | | Consent of Independent Registered Public Accounting Firm. |
| |
24.1 | | Power of Attorney (see page 93). |
| |
31.1 | | Certification of Richard S. Hill, Chairman of the Board of Directors and Chief Executive Officer of Novellus Systems, Inc. dated February 27, 2009 in accordance with Rules 13a-14(a) and 15d-14(a) of the Securities Exchange Act, as amended, as adopted pursuant to Section 302 of the Sarbanes-Oxley Act of 2002. |
| |
31.2 | | Certification of Jeffrey C. Benzing, Executive Vice President and Chief Administrative Officer of Novellus Systems, Inc. dated February 27, 2009 in accordance with Rules 13a-14(a) and 15d-14(a) of the Securities Exchange Act, as amended, as adopted pursuant to Section 302 of the Sarbanes-Oxley Act of 2002. |
| |
32.1 | | Certification of Richard S. Hill, Chairman of the Board of Directors and Chief Executive Officer of Novellus Systems, Inc. dated February 27, 2009 in accordance with 18 U.S.C. 1350, as adopted pursuant to Section 906 of the Sarbanes-Oxley Act of 2002. |
| |
32.2 | | Certification of Jeffrey C. Benzing, Executive Vice President and Chief Administrative Officer of Novellus Systems, Inc. dated February 27, 2009 in accordance with 18 U.S.C. 1350, as adopted pursuant to Section 906 of the Sarbanes-Oxley Act of 2002. |
| (1) | Incorporated by reference to the exhibit with the corresponding exhibit number in Novellus’ Report on Form 10-K filed with the Securities and Exchange Commission on March 30, 2000. |
| (2) | Incorporated by reference to Exhibit 3.2 to Novellus’ Report on Form 8-K filed with the Securities and Exchange Commission on July 31, 2008. |
| (3) | Incorporated by reference to Exhibit 2.3 to Novellus’ Report on Form 8-K filed with the Securities and Exchange Commission on July 7, 1997. |
| (4) | Incorporated by reference to Exhibit 2.6 to Novellus’ Report on Form 8-K filed with the Securities and Exchange Commission on July 7, 1997. |
| (5) | Incorporated by reference to Exhibit 10.30 filed with Novellus’ Report on Form 10-K filed with the Securities and Exchange Commission on February 26, 1993. |
| (6) | Incorporated by reference to Exhibit 10.4 filed with Novellus’ Report on Form 10-Q filed with the Securities and Exchange Commission on August 7, 2007. |
| (7) | Incorporated by reference to Exhibit 10.1 filed with Novellus’ Report on Form 10-Q filed with the Securities and Exchange Commission on August 13, 2002. |
| (8) | Incorporated by reference to Exhibit 10.31 to Novellus’ Report on Form 10-K filed with the Securities and Exchange Commission on March 23, 2001. |
| (9) | Incorporated by reference to Exhibit 10.32 to Novellus’ Report on Form 10-K filed with the Securities and Exchange Commission on March 23, 2001. |
97
| (10) | Incorporated by reference to Exhibit 10.33 to Novellus’ Report on Form 10-K filed with the Securities and Exchange Commission on March 23, 2001. |
| (11) | Incorporated by reference to Exhibit 10.9 to Novellus’ Report on Form 10-Q filed with the Securities and Exchange Commission on November 5, 2008. |
| (12) | Incorporated by reference to Exhibit 10.30 to Novellus’ Report on Form 10-K filed with the Securities and Exchange Commission on March 5, 2003. |
| (13) | Incorporated by reference to Exhibit 10.31 to Novellus’ Report on Form 10-K filed with the Securities and Exchange Commission on March 5, 2003. |
| (14) | Incorporated by reference to Exhibit 10.32 to Novellus’ Report on Form 10-K filed with the Securities and Exchange Commission on March 5, 2003. |
| (15) | Incorporated by reference to Exhibit 10.35 to Novellus’ Report on Form 10-K filed with the Securities and Exchange Commission on March 5, 2003. |
| (16) | Incorporated by reference to Exhibit 10.39 to Novellus’ Report on Form 10-K filed with the Securities and Exchange Commission on March 5, 2003. |
| (17) | Incorporated by reference to Exhibit 10.41 to Novellus’ Report on Form 10-K filed with the Securities and Exchange Commission on March 12, 2004. |
| (18) | Incorporated by reference to Exhibit 10.1 to Novellus’ Report on Form 8-K filed with the Securities and Exchange Commission on July 12, 2004. |
| (19) | Incorporated by reference to Exhibit 10.2 to Novellus’ Report on Form 8-K filed with the Securities and Exchange Commission on July 12, 2004. |
| (20) | Incorporated by reference to Exhibit 99.1 to Novellus’ Report on Form 8-K filed with the Securities and Exchange Commission on September 24, 2004. |
| (21) | Incorporated by reference to Exhibit 10.19 to Novellus’ Report on Form 10-Q filed with the Securities and Exchange Commission on August 7, 2008. |
| (22) | Incorporated by reference to Exhibit 10.3 to Novellus’ Report on Form 8-K filed with the Securities and Exchange Commission on May 5, 2005. |
| (23) | Incorporated by reference to Exhibit 10.34 to Novellus’ Report on Form 8-K filed with the Securities and Exchange Commission on November 15, 2005. |
| (24) | Incorporated by reference to Exhibit 10.22 to Novellus’ Report on Form 10-Q filed with the Securities and Exchange Commission on May 7, 2008. |
| (25) | Incorporated by reference to Exhibit 10.25 to Novellus’ Report on Form 10-K filed with the Securities and Exchange Commission on March 1, 2007. |
| (26) | Incorporated by reference to Exhibit 10.26 to Novellus’ Report on Form 10-K filed with the Securities and Exchange Commission on March 1, 2007. |
| (27) | Incorporated by reference to Exhibit 10.27 to Novellus’ Report on Form 10-Q filed with the Securities and Exchange Commission on May 7, 2008. |
| (28) | Incorporated by reference to Exhibit 10.28 to Novellus’ Report on Form 10-Q filed with the Securities and Exchange Commission on November 5, 2008. |
| * | Management contracts or compensatory plans or arrangements. |
98