UNITED STATES
SECURITIES AND EXCHANGE COMMISSION
WASHINGTON, DC 20549
FORM 10-K
(MARK ONE)
| x | ANNUAL REPORT PURSUANT TO SECTION 13 OR 15(d) OF THE SECURITIES EXCHANGE ACT OF 1934 |
FOR THE FISCAL YEAR ENDED DECEMBER 31, 2008
OR
| ¨ | TRANSITION REPORT PURSUANT TO SECTION 13 OR 15(d) OF THE SECURITIES EXCHANGE ACT OF 1934 |
FOR THE TRANSITION PERIOD FROM TO .
COMMISSION FILE NUMBER 000-17297
BTU INTERNATIONAL, INC.
(Exact name of Registrant as specified in its charter)
| | |
| DELAWARE | | 04-2781248 |
(State or Other Jurisdiction of Incorporation or Organization) | | (I.R.S. Employer Identification Number) |
| | |
| 23 ESQUIRE ROAD, NORTH BILLERICA, MASSACHUSETTS | | 01862-2596 |
| (Address of principal executive offices) | | (Zip Code) |
REGISTRANT’S TELEPHONE NUMBER, INCLUDING AREA CODE: (978) 667-4111
SECURITIES REGISTERED PURSUANT TO SECTION 12(b) OF THE ACT:
| | |
Title of Each Class | | Name of Each Exchange on which Registered |
Common Stock, $.01 Par Value | | Nasdaq Global Market |
SECURITIES REGISTERED PURSUANT TO SECTION 12(g) OF THE ACT:
Indicate by check mark whether the registrant: (1) has filed all reports required to be filed by Section 13 or 15(d) of the Securities Exchange Act of 1934 during the preceding 12 months (or for such shorter period that the registrant was required to file such reports), and (2) has been subject to such filing requirements for the past 90 days. Yesx No¨
Indicate by check mark if disclosure of delinquent filers pursuant to Item 405 of Regulation S-K is not contained herein, and will not be contained, to the best of the registrant’s knowledge, in definitive proxy or information statements incorporated by reference in Part III of this Form 10-K or any amendment to this Form 10-K.x
Indicate by check mark whether the registrant is a large accelerated filer, an accelerated filer, a non-accelerated filer or a smaller reporting company (as defined in Rule 12b-2 of the Exchange Act). Large Accelerated Filer¨ Accelerated Filerx Non-Accelerated Filer¨ Smaller Reporting Company¨
Indicate by check mark whether the registrant is a shell company (as defined in Rule 12b-2 of the Exchange Act). Yes ¨ No x
Indicate by check mark if the registrant is a well-known seasoned issuer (as defined in Rule 405 of the Securities Act). Yes ¨ No x
Indicate by check mark if the registrant is not required to file reports pursuant to Section 13 or Section 15(d) of the Act. Yes ¨ No x
The aggregate market value of the shares of Common Stock, $.01 par value, of the Company held by non-affiliates of the Company was $91,577,388 on June 30, 2008.
Indicate number of shares outstanding of the Registrant’s Common Stock, par value $.01 per share, as of the latest practicable date: As of March 10, 2009: 9,601,381 shares.
DOCUMENTS INCORPORATED HEREIN BY REFERENCE
The following documents are incorporated herein by reference: Part III—Portions of the Proxy Statement for the 2009 Annual Meeting of Stockholders, which is to be filed with the Securities and Exchange Commission.
BTU INTERNATIONAL, INC.
2008 FORM 10-K ANNUAL REPORT
Table Of Contents
PART I
Overview
BTU International, Inc., (“BTU” or the “company”) founded in 1950 and headquartered in Billerica, Massachusetts, is a market-leading, global supplier of primarily advanced thermal processing equipment to the alternative energy and electronics manufacturing markets. BTU equipment and processes are used in the production of solar cells, nuclear fuel and fuel cells, as well as in printed circuit board assembly and semiconductor packaging.
Our customers require high throughput, high yield and highly reliable thermal processing systems with tightly controlled temperature and atmospheric parameters. In the solar market, BTU offers processing equipment for both silicon and thin film photovoltaics. In thin film photovoltaics, BTU’s equipment is used for both the CIGS and CdTe processes. Silicon photovoltaic applications are served by BTU’s metallization furnaces and in-line diffusion systems. Also in alternative energy, our customers use our thermal systems for the processing of nuclear fuel and the manufacturing of fuel cells. Our convection solder reflow systems are used to attach electronic components to the printed circuit boards, primarily in the advanced, high-density, surface mount segments of this market. In the semiconductor market, we participate in both wafer level and die level packaging, where our thermal processing systems are used to connect and seal integrated circuits into a package.
Industry Background
Alternative Energy Markets
BTU’s alternative energy business addresses three distinct markets: the manufacturing of solar cells, nuclear fuels and solid oxide fuel cells. The bulk of the alternative energy business is in the solar cell market. BTU’s work in solid oxide fuel cells is related primarily to research and development at this time.
Photovoltaics. BTU offers solar processing equipment for both silicon and thin film photovoltaics. In thin film photovoltaics, BTU’s equipment is used for both the CIGS and CdTe processes. In the CdTe technology, BTU provides process solutions for activation and annealing in the 200° to 500° C temperature range. For CIGS applications, BTU systems are used for annealing and RTP processes. These thin film systems generally sell in the range of $800,000 to $1.7 million. Silicon photovoltaic applications are served by BTU’s metallization furnaces and in-line diffusion systems. The MERIDIAN™ system is used for phosphorous diffusion and integrates inline coating with thermal processing. This system is targeted for customers transitioning from batch to inline processing. The MERIDIAN™ sells in the range of $800,000 to $1.2 million.
BTU’s metallization products include the TRITAN™ and PVD systems. The TRITAN™ is the second generation product, featuring a unique multiple belt transport system with optimized wavelength thermal heating. The TRITAN™ is capable of processing dual lane wafers and sells in the range of $200,000-$400,000.
BTU’s solar cell metalization lines include printing technology from a third party supplier. The total line generally sells in a range from $1 million to $1.3 million.
Nuclear Fuel. Another application for BTU systems is for sintering nuclear fuel. These high temperature processes operate at approximately 1750°C in a hydrogen reduction atmosphere. Our market leading product for this application is our patented Walking Beam system, which is ideally suited for the high volume manufacture of nuclear fuels. It uses a walking beam transport system to eliminate friction associated with the conveyance of heavy loads through the process chamber. Walking Beam systems, which are used to sinter gadolinium and uranium pellets used for nuclear fuel generation, generally sell for up to $2.4 million.
1
Electronics Markets
Demand for increasingly sophisticated electronic devices continues, and we expect that new technologies such as wireless networks, next generation cellular phones and personal digital assistants will help to drive future growth. Electronic equipment continues to become more complex, yet end users are still demanding smaller, lighter and less expensive devices. This, in turn, requires increased performance and reduced cost, size, weight and power requirements of electronic assemblies, printed circuit boards and semiconductors. In response to these developments, manufacturers are increasingly employing more sophisticated production and assembly techniques requiring more advanced manufacturing equipment, such as that supplied by BTU.
Printed Circuit Board Assembly. In the printed circuit board assembly process, semiconductor and discrete-devices plus other components are attached to printed circuit boards. The attachment process, which creates a permanent physical and electrical bond, is called solder reflow or surface mount reflow. Manufacturers rely on high throughput, high reliability equipment to get the job done.
Wafer Level and Die Level Semiconductor Packaging. Semiconductor packaging processes include precision thermal processing steps. In advanced semiconductor packaging, processing takes place at both the wafer level and die level. At the wafer level, deposited solder must be thermally treated to form perfectly spherical “bumps.” At the die level, these bumps allow the integrated circuits to be bonded to the semiconductor package. Advancements in the semiconductor industry toward higher chip speeds, smaller form factors and reduced costs are driving the transition to wafer level packaging from the traditional wire bonding technique.
Across all markets, the need for more versatile, more reliable and more advanced capital equipment persists. In addition, the continued globalization of manufacturing and the shift to low cost regions such as China, particularly by electronics producers, has driven the demand for equipment with a lower cost of ownership. The recent global economic crisis has effected the electronics market, causing a reduction in demand for these products.
Technological Challenges
Continuous thermal processing systems present significant engineering challenges related to temperature control, atmosphere control, product handling, flux containment and disposal, and high system up time. Thermal processing systems must maintain accurate and uniform temperatures within their process chambers. The temperature within the process chamber is influenced by the rate at which components are moved through the system and the weight and density of the product. In addition, the thermal processing system’s heat convection rate must be varied and controlled as components and materials are processed. The chamber must also dispense heat uniformly across the product at precise temperatures to ensure maximum process uniformity. Also, products must be heated and cooled at closely preset rates in order to avoid damage caused by thermal stress.
Another technological challenge for continuous thermal processing systems is achieving precisely controlled atmospheric conditions within the process chamber. In order to facilitate thermal processing without contamination of or damage to the product, many thermal processing systems use a substantially oxygen-free atmosphere of nitrogen or hydrogen in their process chambers. If such gases are used, the entry of contaminating air must be minimized, even though the product enters and exits the system continuously from the ambient atmosphere. Maintaining a pure, safe and controlled atmosphere in the open process chamber, while minimizing the consumption of nitrogen or hydrogen gases in order to reduce operating costs, presents significant engineering challenges.
Handling products in thermal processing systems requires highly reliable conveyance systems that can easily be converted to process a wide variety of products having different specifications, sometimes on side-by-side tracks through the process chamber. The product handling system must also fully support a wide variety of product sizes.
2
The mechanical components in thermal processing systems must operate almost continuously in a demanding, elevated temperature environment with frequent thermal cycles. The use of materials that are resistant to high temperature and thermal stress is important to achieving high reliability.
In applications using flux, the volatile compounds that are vaporized during the thermal processing cycle must be contained and collected so that they do not condense in the system or damage the environment. The efficient containment, collection and disposal of the flux are important factors in achieving high system up time, high throughput and reliability.
Our Solution
We deliver a broad range of thermal processing systems to serve the needs of manufacturers that require high throughput, process yields and reliability with tightly controlled process parameters. Our processes and systems are designed to enable our customers to increase throughput and yield for solar cell processing, nuclear fuel sintering and electronics assembly by providing precise atmospheric and temperature control. In addition to the expected high performance of our products, we believe maintaining the quality standards of our organization and our worldwide service and support are important to our success with industry leading global manufacturers.
We believe our customers continue to choose our products because of the following factors:
Accurate and Uniform Temperature.Our systems use convection, radiation and infrared heating technologies. Our high rate convection and fully enclosed coil heating modules are designed to provide controlled heating capacities across many different applications, thereby enabling our customers to maximize process uniformity and throughput. In addition, our systems are designed to apply heat uniformly across the product load, which is critical to ensure optimum processing. Heat up and cool down profiles are also closely controlled for process consistency and the protection of product.
Atmosphere Uniformity and Control. Our thermal processing systems are designed to provide precision control over atmospheric conditions within their process chambers by integrating our gas and physical curtain technologies. Our systems are designed to be capable of excluding virtually all oxygen from the critical process steps to maintain the safety and integrity of the process chamber atmosphere. In addition, our systems are intended to minimize the consumption of nitrogen or hydrogen, thereby reducing the operating cost of maintaining the atmosphere.
Repeatability from System to System.We design our systems to provide a high degree of repeatability from system to system through our atmospheric and temperature controls and the expected reliability of our systems. This repeatability is achieved through our industry leading closed loop convection technology that is intended to ensure the same convection rate regardless of change in altitude or temperature. This is a critical attribute because our customers must achieve consistent, uniform manufacturing performance in plants located throughout the world.
Processing Flexibility.Major electronics and solar cell manufacturers process many sizes of products and often need rapid product changeover capabilities. Our systems can process printed circuit boards or solar cells of different sizes with minimal or no reconfiguration. Rapid changeover reduces down time and increases manufacturing volume. In addition, our solar cell processing equipment can be configured for multiple process applications allowing for versatility in materials manufacturing.
Reliability. Our customers place a high premium on reliability. Reliability is a major contributor to low cost of ownership because high up time can increase the productivity and efficiency of an entire production line. We believe our systems are the most reliable advanced thermal processing systems in the world.
3
Systems Integration. We provide fully integrated systems that include automated handling of our products, as well as full software integration with our customers’ factory management systems. This allows our customers to monitor and analyze the process in real time from a central location.
Worldwide Customer Support. Our goal is to provide our customers with global technical service support, in depth process engineering support and rapid delivery of our systems and parts. We provide our customer support through our on-site direct service organization and our independent sales and service representatives, supplemented with twenty-four hours a day, seven days a week telephonic support and extensive customer training programs.
Our Strategy
Our objective is to be the leading provider of thermal and other processing systems to the alternative energy and electronics assembly markets. To achieve this goal and maximize value for our shareholders, our strategy includes the following elements:
| | 1. | Continue to focus on expanding our alternative energy related business, especially solar. |
| | 2. | Deepen relationships with key partners to facilitate product development for next generation processes and technologies, particularly in the rapidly growing energy generation markets. |
| | 3. | Continue to focus on cost reduction initiatives, including the improvement of our global supply chain and reduction in materials costs; |
| | 4. | Further penetrate existing markets and customers by developing innovative processes and products with a low cost of ownership and by offering exceptional customer support; and |
| | 5. | Expand our low-cost manufacturing and engineering operations in China. |
Products
We supply a broad range of primarily thermal processing systems for the alternative energy and electronics assembly markets. Our products are used for such applications as solar cell manufacturing, nuclear fuel processing, printed circuit board assembly, and semiconductor packaging. Most of our products are used for thermal processing operations; most have a processing chamber that is open on both ends to facilitate the continuous flow of materials through the chamber via a transport mechanism—usually a conveyor belt of some type. A control system regulates a series of electric heaters to produce a consistent, even temperature profile, as required by the customers’ process. We also provide equipment that is used for printing and coating operations.
Alternative Energy Products
The processing of advanced materials used in non-fossil fuel power generation applications is a significant target market. The cost fluctuations of fossil fuels and environmental concerns have increased demand for “clean” power. For power generation applications, we serve the solar cell and nuclear fuel markets. We support our worldwide alternative energy customers through our global sales and service network.
Solar Cells. BTU offers solar processing equipment for both silicon and thin film photovoltaics. In thin film photovoltaics, BTU’s equipment is used for both the CIGS and CdTe processes. Silicon photovoltaic applications are served by BTU’s metallization process systems and in-line diffusion processes and systems. BTU’s solar cell processing equipment includes not only in-line thermal systems but coating and printing technology as well. Our MERIDIAN™ In-line Diffusion system, introduced in late 2008, features the MERIDIAN™ phosphorus coater, which includes key advances such as back-side and top-side coating and an integrated dryer. The system can be configured to achieve up to 1500 (156mm) wafers per hour. The in-line process offers reduced wafer handling and greater throughput than traditional batch processing. Reduced handling translates into lower breakage rates, improved yield and lower cost of ownership. The MERIDIAN™ system price starts at $800,000 and varies depending on configuration.
4
For the metallization process, BTU offers a complete line of Rapid Thermal Processing furnaces utilizing near infrared heating technology. Systems come in varying lengths and widths to suit specific throughput requirements. The product line has been specifically designed for the solar cell metallization process and is used for contact drying and firing. Specialized features include rapid heating via densely spaced tungsten lamps and rapid cooling rates obtained through proprietary water cooling technology. These systems generally range in price from $180,000 to $600,000. Metallization printing equipment is also available through BTU’s strategic partnership with a third party supplier.
In thin film photovoltaics, BTU leverages its experience with large-scale, custom, in-line thermal processing systems. These systems can be well over 100 feet in length and include specialized features like coating capability and novel atmospheres. The system design is scalable and systems are being sold for lab, pilot and production sized applications. These systems generally sell for in excess of $1M, although the price can vary widely based on size and features.
Nuclear Fuels. We offer both walking beam and pusher systems for sintering nuclear fuel. These processes operate at temperatures in the range of 1750°C in a hydrogen reduction atmosphere. Our most important product for this market is our patented Walking Beam system designed for high volume manufacture of nuclear fuels. It uses a walking beam transport system to eliminate friction associated with the conveyance of heavy loads. Walking Beam systems are used to sinter gadolinium and uranium pellets used for nuclear fuel generation. These systems generally sell for up to $2.4 million.
Electronics Products
Printed Circuit Board Assembly. We currently sell thermal processing systems used in the solder reflow and curing stages of printed circuit board assembly. Our printed circuit board assembly products are used primarily in the advanced, high-density segments of the market that utilize surface mount technology.
Our PYRAMAX™ family of convection reflow systems is designed on a single platform to be rapidly configurable, which is intended to reduce the product build cycle and allow us to meet customer demands for shorter delivery lead times. We believe PYRAMAX™ products offer our customers reduced capital cost, lower nitrogen consumption and reduced scheduled maintenance cycles.
PYRAMAX™ systems provide increased process flexibility due to their ability to process printed circuit boards up to 24 inches wide. Rated up to 400°C, these products are designed to be capable of operating in air or nitrogen atmospheres and to have increased convection flow for greater performance and lead free processes. PYRAMAX™ utilizes impingement technology to transfer heat to the substrate. These systems are offered in 6, 8, 10 and 12-zone heated lengths and are capable of processing lead free solder. They generally range in price from $40,000 to $150,000.
The market need for lead free solder reflow presents a unique challenge by requiring a process temperature that is critically close to the destruct temperature of the components that are being attached. PYRAMAX™ system’s unique closed loop convection control is designed to provide a repeatable tight temperature window that is optimized for lead free solder reflow.
The solder reflow process requires the thermal processing system to manage flux residues eliminated during the processing of the printed circuit boards. PYRAMAX™ systems are equipped with a patented flux management system that is structured to isolate the flux outside the main process chamber, thereby helping to maintain the integrity of the atmosphere and facilitate easy disposal.
Wafer Level and Die Level Semiconductor Packaging. We sell several systems for the thermal processes used in advanced semiconductor packaging.
5
Flip chip reflow provides the physical and electronic bond of the semiconductor device to its package. The PYRAMAX™ families of convection reflow systems, utilizing our closed loop convection technology, rate at up to 400°C and operate in air or nitrogen atmospheres. These products utilize impingement technology to transfer heat to the substrate. Using thermal power arrays of five-kilowatt heaters, they can process substrates in dual track configurations, thereby enabling our customers to double production without increasing the machine’s footprint. These products are available in four models based on the heated lengths of thermal processing chambers. Heated length is based on the required production rate and loading requirements. The products generally range in price from $70,000 to $180,000.
Our TCAS series of continuous belt thermal processing systems is rated up to 800°C and is designed for wafer bump reflow. They can operate in a variety of controlled atmospheres, including hydrogen, using patented gas barrier technology designed to achieve a safe and high purity hydrogen atmosphere within the processing chamber. Our TCAS systems generally range in price from $300,000 to $1.2 million for a fully integrated 300mm system.
Customers
Many of our principal customers are large-volume global manufacturers that use our products in multiple facilities worldwide. Out of our top revenue generating customers in 2008, the top two were solar customers, and six of the top ten were solar customers. In 2008, no customer accounted for more than 10% of our total net sales.
Sales, Marketing and Support
We market and sell our products primarily through our direct sales force and independent sales representatives throughout the world. Our sales and marketing team is responsible for evaluating the marketplace, generating leads and creating sales programs and sales support materials, such as literature. Our on-site direct service organization and our independent sales representatives provide ongoing support to customers using our products. These services include implementing continuous improvement tools related both to the cost of our products and to their technical performance. Our strong global support infrastructure allows us to market future sales within our current customer base and contributes to our competitive position. Our management and sales teams participate in periodic trade conventions, through which we market our products to potential customers.
Research, Development and Engineering
Our research, development and engineering efforts are directed toward enhancing existing products and developing our next generation of products as well as processes. Research, development and engineering expense in 2008 was focused on the development of new products and improved furnace applications for thermal solutions for alternative energy application processes; the introduction of the MERIDIAN™ In-Line Diffusion System was the primary focus. We introduced the product late in 2008. In addition, we are developing a new platform for solar cell metallization, the TRITAN™ to be introduced in the first quarter of 2009. We are also developing several new thin film and silicon process applications and related equipment.
In the electronics assembly markets we introduced two new PYRAMAX™ models in 2008; the six-zone PYRAMAX™ 75 and the twelve-zone PYRAMAX™ 150z12. These new PYRAMAX™ offerings were developed jointly by BTU engineers in China and the U.S. In addition, a development team is doing basic research on a different heating method using microwave energy, thermal plasma and rapid heating cycles that can be used in many different thermal processes. Our research, development and engineering costs for the years ended December 31, 2008, 2007 and 2006 can be found on our Consolidated Statements of Operations, contained herein.
6
We have a license agreement with Boston University that is focused on optimizing the solid oxide fuel cell (SOFC) manufacturing processes and materials used to manufacture SOFCs, and oxide coatings used in SOFC system assembly. This technology targets the challenges that affect planar SOFC manufacturing costs by addressing such issues as one-step co-firing, lower sintering temperatures and automated manufacturing to increase production volumes. We believe that this process development program, if successful, will help drive our thermal processing systems solutions for the SOFC market.
Close working relationships between our key customers and our product engineering teams enable us to incorporate our customers’ feedback and needs into our product development efforts. We have integrated our product design, manufacturing, engineering and after sales support documentation in support of the new product introduction process and lowered research, development and engineering costs.
Manufacturing and Suppliers
Our principal manufacturing operations consist of final assembly, systems integration and testing at our facilities in North Billerica, Massachusetts and Shanghai, China. We outsource the manufacture of many of our subsystems to a number of key suppliers and maintain close relationships with them while also maintaining qualified alternative suppliers. This maintains a cost down focus in the event we exceed the capacity of our key suppliers or otherwise lose access to these suppliers. In 2004, our manufacturing facility in Shanghai, China was established for our electronics assembly products and solar cell metallization products, as well as local sourcing of materials.
In the past few years, we have substantially improved our global supply chain and reduced our material costs. These efforts have resulted in a major improvement in gross margins in the PYRAMAX™ product line. We have upgraded and reorganized our operations organization in the U.S. In addition, we have broadened our supply base in China. We have leveraged our presence there to widen the supply base for our Shanghai manufactured electronics assembly and solar cell metallization products.
Continuous improvement in the supply chain is a key strategic imperative. We have established a global sourcing organization, based in China, to further develop high quality, cost effective suppliers throughout the world.
We continue to invest in software and capital equipment related to our information technology infrastructure and customer support. We have made a major investment in and have installed a new business operations and management system in Shanghai and at the Company’s headquarters in Billerica, MA.
We have outsourced the manufacture of most of our significant component systems thereby reducing cycle time and increasing our inventory turnover. We seek to adhere closely to the principles of total quality management and have been ISO 9001 certified since 1998 and converted to ISO9001:2000 in October 2003. Our customers, suppliers and employees are strongly encouraged to provide feedback and suggestions for improvements in products and services.
Intellectual Property
We seek to protect our intellectual property by filing patents on proprietary features of our advanced thermal processing systems and by challenging third parties that we believe infringe on our patents. We also protect our intellectual property rights, including our trademarks, trade secrets and copyrights, with nondisclosure and confidentiality agreements with employees, consultants and key customers. As a global supplier of equipment, we recognize that the laws of certain foreign countries may not protect our intellectual property to the same extent as the laws of the U.S. Our current portfolio includes 91 patents, 27 trademarks and over 120 pending applications.
7
We license software programs from third party developers and incorporate them into our products. Generally, these agreements grant us non-exclusive licenses to use the software and terminate only upon a material breach by us. We believe that such licenses are generally available on commercial terms from a number of licensors.
Backlog
Backlog as of December 31, 2008, was $15.9 million, compared to $11.5 million as of December 31, 2007. As of December 31, 2008, we expected to ship our year-end backlog within 50 weeks. Most of our backlog for solder reflow systems is expected to be shipped within 3 to 8 weeks. The backlog of our custom systems is expected to be shipped within 12 to 40 weeks. We include in backlog only those orders for which the customer has issued a purchase order. Due to possible changes in delivery schedules, lead time variations and order cancellations, our backlog at any particular date is not necessarily representative of sales for any subsequent period.
Competition
Several companies compete with us in selling thermal processing systems. Although price is a factor in buying decisions, we believe that technological leadership, process capability, throughput, environmental safeguards, uptime, mean time-to-repair, cost of ownership and after-sale support have become increasingly important factors. We compete primarily on the basis of these criteria, rather than on the basis of price.
Our systems for the alternative energy markets and other applications compete primarily against products offered by Centrotherm, Schmid, Despatch, SierraTherm and Harper. Our principal competitors for printed circuit board assembly equipment and advanced semiconductor packaging vary by product application. Our principal competitors for solder reflow systems are Vitronics-Soltec, Heller, Furakawa, ERSA, and Rehm. Our principal competitors for advanced semiconductor packaging are Sikama, and Heller. We also face competition from emerging low cost Asian manufacturers and other established European manufacturers.
Employees
As of December 31, 2008, we had 381 employees, of whom 77 are engaged in sales, marketing and service, 42 in research, development and engineering, 38 in finance and administration and 224 in operations. Of these 381 employees, 207 reside outside of the U.S. None of our employees are represented by a collective bargaining agreement, and we believe that we have satisfactory relations with our employees.
Environmental
One of our core values is protecting the environment in which we operate and the environment in which our equipment operates. Compliance with laws and regulations regarding the discharge of materials into the environment, or otherwise relating to the protection of the environment, has not had any material effects on our capital expenditures, earnings or competitive position. We do not anticipate any material capital expenditures for environmental control in our facilities in 2009.
Our Web Site
Our web site iswww.btu.com It provides information about us, and allows you to obtain, free of charge, a copy of our Annual Reports on Form 10-K, Quarterly Reports on Form 10-Q, Current Reports on Form 8-K, including exhibits, and any amendments to those reports filed or furnished with the Securities and Exchange Commission pursuant to Section 13(a) or 15(d) of the Securities Exchange Act of 1934, as amended. We make these reports available through our website as soon as reasonably practicable after our electronic filing of such materials with, or the furnishing of them to, the Securities and Exchange Commission. The information contained or incorporated on our web site is not a part of this Annual Report on Form 10-K.
8
Risks Relating to Our Business
We are subject to cyclical downturns in the electronics and semiconductor industries.
Our business depends partially on the capital expenditures of electronics semiconductor manufacturers, which in turn depend on current and anticipated market demand for printed circuit boards and integrated circuits and the products that use them. The electronics semiconductor industries have historically been cyclical and have experienced periodic downturns that have had a material adverse effect on the demand for electronic semiconductor equipment, including equipment that we manufacture and market. During periods of declining demand, we may have difficulty aligning our costs with prevailing market conditions, as well as motivating and retaining key employees. In particular, our inventory levels during periods of reduced demand may be higher than optimal, and we may be required to make inventory valuation adjustments in future periods. During periods of rapid growth, on the other hand, we may fail to acquire and/or develop sufficient manufacturing capacity to meet customer demand, and we may fail to hire and assimilate a sufficient number of qualified people. Our business may be adversely affected if we fail to respond to rapidly changing industry cycles in a timely and effective manner.
The recent, unprecedented decline in global market conditions has resulted, and may continue to result in, decreased demand in the electronics and semiconductor industries. Due to our participation in these industries, our results are particularly susceptible to such downturns.
We have shifted a significant and growing portion of our production capacity to a manufacturing facility in Shanghai, China. We may encounter manufacturing problems associated with managing these operations.
In 2004, we began manufacturing and material sourcing operations in a facility in Shanghai, China. The volume of our products produced in China is now approximately one half of our total production. The successful operation of our facility in China is important to our ability to remain profitable and competitive. We may encounter difficulty with the management, technical and administrative organization requirements of doing business in China. If we are not successful in managing our operation in China, our business and profitability will be adversely affected.
In the past few years, we have substantially improved our global supply chain and reduced our material costs. Failure to maintain these cost reductions would negatively affect our profit margins.
In the last few years, we have substantially improved our global supply chain and reduced our material costs. These efforts have resulted in a major improvement in gross margins in our Pyramax product line as well as reduced costs for our solar metallization line. While continuous improvement in the supply chain is a key strategic imperative, we may not be successful in achieving our cost reduction goals, in which case further increases in our gross margins would not be achieved. If our costs increase, our gross margin gains will erode. This could be caused by foreign exchange trends, supplier cost increases, increase in fuel costs and other factors. The recent volatility in the global markets makes it difficult to predict whether we will be able to continue to maintain these cost reductions in the future.
The Company has made substantial investments in its organization to develop new products for the alternative energy market. Sales of our products to the alternative energy generation markets are subject to substantial risks.
Solar Energy. The solar energy sector is partially dependent upon continuation of governmental subsidies that may not continue and the supply of materials that may be constrained. A decline in these subsidies would reduce our ability to grow our business in this market segment. The solar energy sector also depends on the availability of raw materials such as silicon. Limits in the supply of these raw materials will constrain growth in this sector and, therefore, limit our prospects for increasing sales in this area.
9
Nuclear Energy. The market for nuclear fuel pellets used in power generation is dependent upon further growth in nuclear power production. Consequently, without growth in the production of nuclear power, our opportunities to grow in this area will be limited. In addition, we may need export licenses to supply this type of equipment to several countries. Failure to maintain such licenses or obtain new required licenses will limit our ability to expand our revenue from this market.
Fuel Cells. The developing fuel cell sector of the energy market is in an early stage of product development, without any guarantees of commercial success. There is considerable risk that this technology may not succeed and our sales to this market may not develop. Given our limited experience in this segment of the energy generation market, we may encounter problems growing this part of our business.
The recent unprecedented decline in global market conditions has resulted and may continue to result in, decreased demand in the alternative energy markets. Due to participation in these markets, our results are particularly susceptible to such downturns.
Failure to realize the full value of the AtmoPlas acquisitions could negatively affect the Company’s profitability.
The AtmoPlas acquisition represents a development opportunity for the Company, yet at some risk. Should the Company fail to commercially actualize the potential developmental products and process applications, costs would have been and will be incurred by the Company without benefit.
If we are unable to increase sales and reduce costs, our profitability may be affected negatively.
We had an operating income of $0.3 million in 2008 versus $2.7 million in 2007. We attribute a large portion of the decrease in operating income in 2008 to increases in SG&A and RD&E expenses in support of our expanding alternative energy business. These increased costs are continuing in 2009. We may not experience the projected growth in our alternative energy business to offset the protected costs.
Our future success will depend on our ability to effectively develop and market our products against those of our competitors.
The industry in which we compete is extremely competitive. Some of our competitors have substantially greater financial, engineering, manufacturing and customer support capabilities and offer more extensive product offerings. If customers prefer products offered by our competitors, we will have difficulty maintaining or increasing our revenue. Our principal competitors for solder reflow systems are Vitronics-Soltec, Heller, Furakawa, ERSA, and Rehm. Our principal competitors for advanced semiconductor packaging are Sikama, SEMIgear and Heller. Our systems for the alternative energy markets and other applications compete primarily against products offered by Centrotherm, Schmid, Despatch, SierraTherm and Harper. We expect our competitors to continue to improve the design and performance of their current products and to introduce new products with improved performance capabilities. Our failure to introduce new products in a timely manner, or the introduction by our competitors of products with perceived or actual advantages, could result in reduced sales of, or lower margins on, our products. In future years, we expect to face increased competition based on price, particularly from companies in Asia. If we are unable to reduce the costs of our products or introduce new lower cost products, we may lose sales to these competitors.
Our international sales and operations are subject to the economic, political, legal and business environments of the countries in which we do business, and our failure to operate successfully or adapt to changes in these environments could cause our international sales and operations to be limited or disrupted.
Our international sales accounted for 77% of our consolidated revenue for 2008. We expect to continue to generate a significant percentage of our revenue outside the United States for the foreseeable future. In addition,
10
we have direct investments in a number of subsidiaries outside of the U.S., primarily in Asia and Europe. Our international operations could be limited or disrupted, and the value of our direct investments may be diminished, by any of the following:
| | • | | fluctuations in currency exchange rates; |
| | • | | the imposition of governmental controls; |
| | • | | import and export license requirements; |
| | • | | difficulties enforcing contractual and intellectual property rights; |
| | • | | terrorist activities and armed conflict; |
| | • | | restrictions on direct investments by foreign entities and trade restrictions; |
| | • | | changes in tax laws and tariffs; |
| | • | | costs and difficulties in staffing and managing international operations; and |
| | • | | longer customer payment cycles. |
Additionally, we are subject to the Foreign Corrupt Practices Act, which may place us at a competitive disadvantage to foreign companies that are not subject to similar regulations.
We conduct only a small portion of our sales in currencies other than the U.S. dollar. We recognize foreign currency gains or losses arising from our operations in the period in which we incur those gains or losses. As a result, currency fluctuations among the U.S. dollar and the other currencies in which we do business have caused foreign currency transaction gains and losses in the past and will likely do so in the future. Because of the number of currencies involved, the variability of currency exposures and the potential volatility of currency exchange rates, we may suffer foreign currency transaction losses in the future due to the effect of exchange rate fluctuations.
Over the past few years, a majority of our revenue has been generated from sales in the Asia Pacific region. Our operations are particularly vulnerable to instability in this region and competition from organizations based in this region.
During 2008, 56% of our revenue was generated from sales in the Asia Pacific region. Political or economic instability in any of the major Asia Pacific economies may adversely impact the demand for capital equipment, including equipment of the type we manufacture and market. In addition, we face competition from a number of suppliers based in the Asia Pacific region that have certain advantages over U.S. suppliers, including us. These advantages include, among other things, lower operating and regulatory costs, proximity to customers, favorable tariffs and affiliation with significantly larger organizations. In addition, changes in the amount or price of electronics or solar cells produced in the Asia Pacific region could negatively impact spending by our customers.
The cost of public company regulatory compliance in the United States places the Company at a competitive disadvantage in its primary geographical market.
The Company is incurring and will continue to incur substantial increased internal staffing, external consulting, tax and audit costs to comply with governmental regulations imposed on public companies in the United States. The Company’s primary geographical growth market of opportunity is Asia for both the Company’s Electronics and Alternative Energy products. The Company is competitively disadvantaged as our Asian competitors are not subject to these same regulatory costs.
In China our new business systems to manage our operations are still being improved. If they are not continually enhanced, it could have a material adverse effect on our business.
On January 1, 2007, we implemented new enterprise resource planning and material resource planning systems at our Shanghai manufacturing operations. In 2008, our Shanghai personnel expanded their use of the
11
system. As our Chinese operations grow, the risks increase that we will not fully utilize the advanced material resource planning system, which could disrupt our business.
In the U.S. our new business systems to manage our operation were activated on January 1, 2008. These systems are still being implemented. If they are not implemented effectively, it could have a material adverse effect on our business.
Over the past year, we have worked to insure a continual improvement in the implementation of the new operating system. However, much work lays ahead, and the risks associated with not fully utilizing our advanced enterprise resource planning and material resource planning systems could disrupt our business.
The Company may be subject to some portion of an environmental clean-up under Superfund legislation.
The Company is an equipment manufacturer that has some solid waste. Due to the fact that the Company utilized a waste disposal firm that disposed its solid waste at a site that the EPA has designated as a Superfund site, the Company has been named by the EPA as one of the entities potentially responsible for clean-up operations. Based on the EPA negotiated proportionment of responsibility, the Company has recorded its expected proportionment as a liability for a potential cash payment and settlement.
Being an equipment manufacturer, the Company only deals with extremely small amounts of chemicals. The Company’s chemical waste were disposed under a controlled process that meets strict EPA approved disposal procedures and were not disposed at the Superfund site.
If we fail to maintain positive relationships with key personnel, we may be unable to successfully grow our business.
Our future operating results depend substantially upon the continued service of our key personnel, some of whom are not bound by employment or non-competition agreements. Our future operating results also depend in significant part upon our ability to attract and retain qualified management, manufacturing, technical, engineering, marketing, sales and support personnel. Competition for qualified personnel, particularly those with technical skills, is intense, and we may fail to attract and retain qualified personnel. Our business, financial condition and results of operations could be materially adversely affected by the loss of any of our key employees, by the failure of any key employee to perform in his or her current position, or by our inability to attract and retain skilled employees.
The income tax percentage on the Company’s consolidated income before taxes is subject to variables beyond our control.
The Company’s net income and cash flow can be adversely affected by innumerable conditions affecting income taxes which are outside the Company’s scope of authority to control. To name but a few of the potential uncontrollable circumstances that could affect the consolidated tax rate:
| | • | | The Company sells and operates globally with manufacturing in both the United States and China. Disagreements could occur on the jurisdiction of income and taxation among different country governmental tax authorities. Potential area of disputes could include transfer pricing values, inter-company cross charges and inter-company balances. |
| | • | | The Company is presently benefiting from a partial “tax holiday” in its Shanghai manufacturing subsidiary. Recently the Chinese government tax authorities announced the passage of legislation to impose an equalization of income tax rates for both domestic and foreign companies at a rate of 25%. This new law supersedes and overrides the Company’s tax holiday agreements. The applicability of this new uniform income tax rate law will have an adverse effect on the Company’s net income and cash flow. |
| | • | | The Company is subject to a China withholding tax on certain non-tangible soft charges made under its transfer pricing agreements. The interpretation of what charges are subject to the tax and when the liability for the tax occurs has varied and could change in the future. |
12
| | • | | In the United States, new tax disclosure regulations, unfavorable interpretations and unforeseen enforcements by the government tax authorities of various provisions of the federal and state tax codes, could have an unfavorable impact on the amount and timing of the Company’s tax provision and cash flow. |
Failure of critical suppliers to deliver sufficient quantities of parts in a timely and cost-effective manner would adversely impact our operations.
Although we use numerous vendors to supply components for the manufacture of our products, not all are qualified suppliers for all of our parts. Some key parts may only be available from a single supplier. Accordingly, we may experience problems in obtaining adequate and reliable quantities of various components. In addition, suppliers may cease manufacturing certain components that are difficult to replace without significant reengineering of our products. Our results of operations will be materially adversely impacted if we are unable to obtain adequate supplies of components in a timely and cost effective manner.
The occurrence of natural disasters in the Asia Pacific region may adversely impact our operations and sales.
We have an expanding engineering and manufacturing facility in China, and the majority of our sales are made to destinations in the Asia Pacific region. This region is known for being vulnerable to natural disasters and other risks, such as earthquakes, floods and avian (bird) flu, which at times have disrupted the local economies. A significant earthquake or health crisis could materially affect our operating results. We are not insured for most losses and business interruptions of this kind, and we do not have redundant, multiple site capacity in the event of a natural disaster. In the event of such a disaster, our business would suffer.
Provisions in our organizational documents could prevent or frustrate attempts by stockholders to replace our current management and could make acquisitions more difficult.
Our certificate of incorporation and by-laws contain provisions that could make it more difficult for a third party to acquire us without the consent of our board of directors. Our certificate of incorporation provides that our stockholders may not take action by written consent. This provision may have the effect of preventing or hindering attempts by our stockholders to replace our current management. Furthermore, Delaware law prohibits a corporation from engaging in a business combination with any holder of 15% or more of its capital stock until the holder has held the stock for three years unless, among other possibilities, the corporation’s board of directors approves the transaction. Our board of directors may use this provision to prevent changes in our management. Also, our board of directors may adopt additional anti-takeover measures in the future.
Our officers and directors may be able to block proposals for a change in control.
Paul J. van der Wansem, our chairman and chief executive officer, beneficially owns approximately 17.0% of our outstanding common stock as of December 31, 2008. Due to this concentration of ownership, Mr. van der Wansem may be able to prevail on all matters requiring a stockholder vote, including:
| | • | | the election of directors; |
| | • | | the amendment of our organizational documents; or |
| | • | | the approval of a merger, sale of assets, or other major corporate transaction. |
| ITEM 1B. UNRESOLVED | SECURITIES AND EXCHANGE COMMISSION COMMENTS |
None.
13
Facilities
We maintain our headquarters in North Billerica, Massachusetts, where we own a 150,000 square foot facility. We also operate an approximately 45,000 square feet leased manufacturing, engineering, sales and service facility in Shanghai, China. We currently run our manufacturing facilities on a multi-shift basis. We believe that our plants in the U.S. and China provide sufficient manufacturing capacity through 2009.
In England, we lease a facility for our European and Near East sales and service operations. We also rent office space in Paris, France. In the Asia Pacific region, we lease sales and service offices in Singapore, Penang, Malaysia and Cavite, Philippines.
There were no material legal proceedings pending as of the time of this filing.
| ITEM 4. | SUBMISSION OF MATTERS TO A VOTE OF SECURITY HOLDERS |
There were no matters submitted to a vote of the Company’s security holders during the fourth quarter of 2008.
| ITEM 4A. EXECUTIVE | OFFICERS OF THE REGISTRANT |
The following table lists our executive officers and their ages:
| | | | |
Name | | Age | | Position |
| | |
Paul J. van der Wansem | | 69 | | Chairman and Chief Executive Officer |
| | |
Thomas P. Kealy | | 66 | | Vice President, Chief Accounting Officer and Corporate Controller |
| | |
James M. Griffin | | 51 | | Vice President Sales and Service, and Corporate Officer |
| | |
John J. McCaffrey, Jr | | 57 | | Vice President Operations and Engineering, and Corporate Officer |
Paul J. van der Wansem, the Chairman of our board of directors since 1979, returned as our Chief Executive Officer in October 2004 after a two-year hiatus. He previously served as our Chief Executive Officer from 1979 to July of 2002. From December 1977 to 1981, he served as Vice President of Holec, N.V., a Dutch electronics company, and from 1978 through 1981 he was President of Holec (USA), Inc. From 1973 to 1977, Mr. van der Wansem worked as a Management Consultant for the Boston Consulting Group, Inc., and from 1970 through 1973, Mr. van der Wansem worked as an Adjunct Director of First National City Bank in Amsterdam and New York. Mr. van der Wansem received an undergraduate degree in automotive engineering from Bromsgrove College, England, and holds an M.B.A. from IMD, Switzerland.
Thomas P. Kealyhas been our Vice President, Corporate Controller and Chief Accounting Officer since February 1991. He has also been our Corporate Controller since joining us in July 1985. Prior to 1985, Mr. Kealy served for 14 years in various financial management positions, including Division Controller for Polaroid Corporation. Earlier he was the Corporate Controller for Coro, Inc. and Lebanon, Inc. Mr. Kealy holds a B.S. in Finance and Accounting from Bentley College and an M.B.A. from Clark University.
14
James M. Griffinhas been our Vice President Sales and Service since April 2005. Previously, Mr. Griffin was our Vice President Sales-Americas, and has held a number of positions within our sales organization. He has been with us for 22 years. Mr. Griffin attended Worcester Polytechnic Institute in the mechanical engineering program.
John J. McCaffrey, Jr. joined BTU in early 2008 as Vice President Operations and Engineering. After graduating from the U.S. Naval Academy and serving as a nuclear engineer officer, he held a variety of positions at Polaroid. Jack joined Evergreen Solar as a startup in 1999, where he designed, built, and operated their U.S. pilot and initial manufacturing facilities, achieving required margin and revenue targets. He next worked with Q Cells to design the initial 30 megawatt EverQ factory in Germany. He then moved to Daystar Technologies, a CIGS thin film solar company, setting up their pilot line for foil, and led the initial design for their 25 megawatt glass manufacturing facility in California. Jack was also responsible for product development at both companies.
15
PART II
| ITEM 5. | MARKET FOR REGISTRANT’S COMMON EQUITY AND RELATED STOCKHOLDER MATTERS |
Price Range of Common Stock
Our common stock is quoted on the NASDAQ Global Market under the symbol “BTUI.” The following table sets forth, for the periods indicated, the high and low sale prices per share of our common stock as reported on the NASDAQ Global Market.
| | | | |
| | | High | | Low |
Year Ended December 31, 2007 | | | | |
First Quarter | | 12.15 | | 9.56 |
Second Quarter | | 14.10 | | 10.09 |
Third Quarter | | 15.62 | | 11.04 |
Fourth Quarter | | 15.04 | | 12.28 |
Year Ended December 31, 2008 | | | | |
First Quarter | | 14.40 | | 8.65 |
Second Quarter | | 12.96 | | 9.10 |
Third Quarter | | 12.43 | | 8.67 |
Fourth Quarter | | 10.22 | | 3.02 |
As of March 10, 2009, we had 429 record holders of our common stock.
Dividend Policy
Our policy is to retain earnings to provide funds for the operation and expansion of our business. We have not paid cash dividends on our common stock and do not anticipate that we will do so in the foreseeable future. The payment of dividends in the future will depend on our growth, profitability, financial condition and other factors that our board of directors may deem relevant.
Equity Compensation Plan Information
The following chart sets forth information for the year ended December 31, 2008, regarding equity based compensation plans of the Company.
| | | | | | | |
Plan Category | | Number of securities
to be issued upon
exercise of
outstanding options,
warrants and rights
(a) | | Weighted-average
exercise price of
outstanding
options, warrants
and rights (b) | | Number of securities
remaining available
for future issuance
under equity
compensation plans
(excluding securities
reflected in column
(a)) (c) |
Equity compensation plans approved by security holders | | 1,069,535 | | $ | 9.17 | | 615,364 |
Equity compensation plans not approved by security holders | | N/A | | | N/A | | N/A |
| | | | | | | |
Total | | 1,069,535 | | $ | 9.17 | | 615,364 |
| | | | | | | |
16
| ITEM 6. | SELECTED FINANCIAL DATA |
The selected consolidated statement of operations data for each of the fiscal years ended December 31, 2006, December 31, 2007 and December 31, 2008 and the selected consolidated balance sheet data as of December 31, 2007 and December 31, 2008 have been derived from our consolidated financial statements audited by independent registered public accountants, which are included elsewhere in this Form 10-K. The selected consolidated statement of operations data for the fiscal years ended December 31, 2004 and December 31, 2005 and the selected consolidated balance sheet data as of December 31, 2004, December 31, 2005 and December 31, 2006 have been derived from audited financial statements not included in this Form 10-K. This data should be read together with our consolidated financial statements and related notes and “Management’s Discussion and Analysis of Financial Condition and Results of Operations” appearing elsewhere in this Form 10-K.
The graph below matches the cumulative 5-year total return to shareholders on BTU International, Inc.’s common stock versus the cumulative total returns of the S & P 500 index and the S & P Information Technology index. The graph assumes that the value of the investment in the company’s common stock and in each of the indexes (including reinvestment of dividends) was $100 on 12/31/2003 and tracks it through 12/31/2008.
COMPARISON OF 5 YEAR CUMULATIVE TOTAL RETURN*
Among BTU International, Inc., The S&P 500 Index
And The S&P Information Technology Index
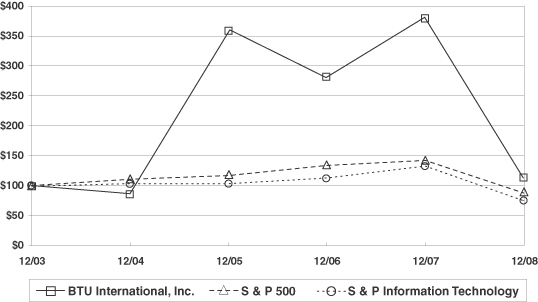
| * | $100 invested on 12/31/03 in stock or index-including reinvestment of dividends. |
Fiscal year ending December 31.
Copyright© 2009 S & P, a division of The McGraw-Hill Companies, Inc. All rights reserved.
www.researchdatagroup.com/S&P.htm
The stock price performance included in this graph is not necessarily indicative of future stock price performance.
17
| | | | | | | | | | | | | | | | | | | | |
| | | Fiscal Year Ended December 31, | |
| Consolidated Statement of Operations Data: | | 2008 | | | 2007 | | | 2006 | | | 2005 | | | 2004 | |
| | | (In thousands, except per share data) | |
Net sales | | $ | 72,266 | | | $ | 63,723 | | | $ | 78,289 | | | $ | 66,407 | | | $ | 54,639 | |
Cost of goods sold | | | 41,542 | | | | 36,337 | | | | 46,554 | | | | 42,575 | | | | 41,503 | |
| | | | | | | | | | | | | | | | | | | | |
Gross profit | | | 30,724 | | | | 27,386 | | | | 31,735 | | | | 23,832 | | | | 13,136 | |
Selling, general and administrative | | | 23,168 | | | | 19,009 | | | | 17,139 | | | | 15,343 | | | | 11,528 | |
Research, development and engineering | | | 7,273 | | | | 5,658 | | | | 5,065 | | | | 3,206 | | | | 3,691 | |
Restructuring charge and executive retirement | | | — | | | | — | | | | — | | | | — | | | | 1,648 | |
| | | | | | | | | | | | | | | | | | | | |
Operating income (loss) | | | 283 | | | | 2,719 | | | | 9,531 | | | | 5,283 | | | | (3,731 | ) |
Interest income | | | 354 | | | | 909 | | | | 667 | | | | 3 | | | | 18 | |
Interest expense | | | (697 | ) | | | (602 | ) | | | (562 | ) | | | (566 | ) | | | (470 | ) |
Foreign exchange gain/(loss) | | | 40 | | | | (478 | ) | | | (232 | ) | | | — | | | | — | |
Other income, net | | | 2 | | | | 106 | | | | 7 | | | | — | | | | 2 | |
| | | | | | | | | | | | | | | | | | | | |
Income (loss) before provision for income taxes | | | (19 | ) | | | 2,654 | | | | 9,411 | | | | 4,720 | | | | (4,181 | ) |
Provision for income taxes | | | 1,077 | | | | 706 | | | | 189 | | | | 101 | | | | — | |
| | | | | | | | | | | | | | | | | | | | |
Net income (loss) | | $ | (1,096 | ) | | $ | 1,948 | | | $ | 9,222 | | | $ | 4,619 | | | $ | (4,181 | ) |
| | | | | | | | | | | | | | | | | | | | |
Income (loss) per share: | | | | | | | | | | | | | | | | | | | | |
Basic | | $ | (0.12 | ) | | $ | 0.21 | | | $ | 1.01 | | | $ | 0.62 | | | $ | (0.58 | ) |
Diluted | | $ | (0.12 | ) | | $ | 0.20 | | | $ | 0.98 | | | $ | 0.60 | | | $ | (0.58 | ) |
Weighted average shares outstanding: | | | | | | | | | | | | | | | | | | | | |
Basic | | | 9,375 | | | | 9,297 | | | | 9,121 | | | | 7,421 | | | | 7,185 | |
Diluted | | | 9,375 | | | | 9,544 | | | | 9,440 | | | | 7,672 | | | | 7,185 | |
| |
| | | Fiscal Year Ended December 31, | |
| | | 2008 | | | 2007 | | | 2006 | | | 2005 | | | 2004 | |
| | | (In thousands) | |
Consolidated Balance Sheet Data: | | | | | | | | | | | | | | | | | | | | |
Cash and cash equivalents | | $ | 27,464 | | | $ | 25,065 | | | $ | 25,100 | | | $ | 15,460 | | | $ | 372 | |
Working capital | | | 50,120 | | | | 50,565 | | | | 48,531 | | | | 35,368 | | | | 12,936 | |
Total assets | | | 71,315 | | | | 69,512 | | | | 65,687 | | | | 48,905 | | | | 27,058 | |
Total liabilities | | | 21,735 | | | | 20,577 | | | | 20,755 | | | | 16,422 | | | | 16,407 | |
Stockholders’ equity | | | 49,580 | | | | 48,935 | | | | 44,932 | | | | 32,483 | | | | 10,651 | |
| ITEM 7. | MANAGEMENT’S DISCUSSION AND ANALYSIS OF FINANCIAL CONDITION AND RESULTS OF OPERATIONS |
Forward Looking Statements
This Annual Report on Form 10-K contains express or implied forward-looking statements. The words or phrases “will likely result,” “are expected to,” “will continue,” “is anticipated,” “may,” “intends,” “believes,” “estimate,” “project” or similar expressions are intended to identify “forward-looking statements” within the meaning of the Private Securities Litigation Reform Act of 1995. Such statements are neither promises nor guarantees but rather are subject to risks and uncertainties described in this report, which could cause actual results to differ materially from those described in the forward-looking statements. Such statements are made pursuant to the “safe harbor” provisions established by the federal securities laws, and are based on the assumptions and expectations of the company’s management at the time such statements are made. Important factors that could cause actual results to differ include, but are not limited to, the timely availability and acceptance of new products in the electronics, semiconductor and energy generation industries, manufacturing problems with our foreign operations in China, the impact of competitive products and pricing, particularly from companies in Asia, and other risks detailed above under “Risk Factors.” Actual results may vary materially.
18
Unless otherwise required by law, the company disclaims any obligation to revise or update this information in order to reflect future events or developments, whether or not anticipated. Accordingly, you should not place undue reliance on any forward-looking statements, which speak only as of the date made.
Overview
BTU International, Inc. founded in 1950 and headquartered in Billerica, Massachusetts, is a supplier of advanced thermal processing equipment to the electronics manufacturing and energy generation markets. We manufacture reflow furnaces for printed circuit board assembly as well as semiconductor wafer-level and die-level packaging equipment. In addition, we participate in the fast growing alternative energy market, for which we provide thermal process equipment for the manufacturing of solar cells, fuel cells and nuclear fuels.
Our customers require high throughput, high yield and highly reliable thermal processing systems with tightly controlled temperature and atmospheric parameters. Our convection solder reflow systems are used to attach electronic components to the printed circuit boards, primarily in the advanced high-density surface mount segments of this market. In the semiconductor market, we participate in both wafer level and die level packaging, where our thermal processing systems are used to connect and seal integrated circuits into a package. Our customers in the energy generation market use our thermal systems to process silicon, ceramics and metal alloys which are used in solar cell, fuel cell and nuclear fuel manufacturing applications.
In 2004, we began manufacturing and material sourcing operations in a leased facility in Shanghai, China. During 2005, we began construction of additional leased facilities in Shanghai, which became fully operational in the second quarter of 2006. These additional facilities were needed for further expansion into the Asia Pacific region. In addition, we expanded our product development capability to China, creating a global engineering team. This team has developed and commercially introduced our latest Pyramax product and continues to collaborate with our U.S. headquarters on additional product initiatives.
In the past few years, we have substantially improved our U.S. and global supply chain and reduced our materials costs. These efforts have resulted in a major improvement in gross margins primarily in our Pyramax product line, manufactured in both our U.S. and China factories.
Critical Accounting Policies
The following is a discussion of those accounting policies that we deem to be “critical” — that is, they are important to the portrayal of our financial condition and results of operations, and they reflect management’s reliance on estimates regarding matters that are inherently uncertain.
Revenue Recognition. We recognize revenue in accordance with the Securities and Exchange Commission (SEC) Staff Accounting Bulletin (SAB) No. 101, “Revenue Recognition in Financial Statements” as updated by SAB No. 104, “Revenue Recognition.” Under these guidelines, we recognize revenue when persuasive evidence of an arrangement exists, delivery has occurred or services rendered, the price is fixed or determinable and payment is reasonably assured. Under these requirements, we recognize revenue upon acceptance when the terms of sale include customer acceptance provisions and compliance with those provisions has not been previously demonstrated. Furthermore, we recognize revenue upon completion of installation for products that require installation for which the installation is essential to functionality or is not inconsequential or perfunctory. Revenue for products sold where installation is not essential to functionality and is deemed inconsequential or perfunctory are recognized upon shipment with estimated installation and warranty costs accrued.
Applying the requirements of SAB No. 101 and SAB No. 104 to future sales arrangements used in our equipment sales may result in the deferral of the revenue for some equipment sales.
We also have certain sales transactions for products which are not completed within the normal operating cycle of the business. It is our policy to account for these transactions using the percentage of completion method
19
for revenue recognition purposes when all of the following criteria exist: (1) we received the purchase order or entered into a legally binding contract, (2) the customer is credit worthy and collection is probable or customer prepayments are required at product completion milestones or specific dates, (3) the sales value of the product to be delivered is significant in amount when compared to our other products, and (4) the costs can be reasonably estimated, there is no major technological uncertainty and the total engineering, material procurement, product assembly and test cycle time extend over a period of six months or longer.
Under the percentage of completion method, revenue and gross margins to date are recognized based upon the ratio of costs incurred to date compared to the latest estimate of total costs to complete the product as a percentage of the total contract revenue for the product. Revisions in costs and gross margin percentage estimates are reflected in the period in which the facts causing the revision become known. Provisions for total estimated losses on uncompleted contracts, if any, are made in the period in which such losses are determined.
Inventory Valuation. Our inventories consist of material, labor and manufacturing overhead costs. We determine the cost of inventory based on the first-in, first-out method. We regularly review the quantity of inventories on hand and compare these quantities to the expected usage of each applicable product or product line. Our inventories are adjusted in value to the lower of costs and/or net realizable value. Since the value of our inventories depends in part on our estimates of each product’s net realizable value, adjustments may be needed to reflect changes in valuation. Any adjustments we are required to make to lower the value of the inventories are recorded as a charge to cost of sales.
Stock Based Compensation.Effective January 1, 2006, we adopted the provisions of Statement of Financial Accounting Standards (SFAS) No. 123R, “Share-Based Payment” (SFAS No. 123R). Under SFAS No. 123(R), we are required to record compensation cost for all share-based payments granted after the date of adoption based on the grant date fair value, estimated in accordance with the provisions of SFAS No. 123R, and for the unvested portion of all share-based payments previously granted that remain outstanding based on the grant date fair value, estimated in accordance with the original provisions of SFAS No. 123,“Accounting for Stock-Based Compensation”. We expense share-based compensation under the straight-line method.
The choice of a valuation technique, and the approach utilized to develop the underlying assumptions for that technique, involve significant judgments. These judgments reflect management’s assessment of the most accurate method of valuing the stock options we issue, based on our historical experience, knowledge of current conditions and beliefs of what could occur in the future given available information. Our judgments could change over time as additional information becomes available to us, or the facts underlying our assumptions change over time, and any change in our judgments could have a material effect on our financial statements. We believe that our estimates incorporate all relevant information and represent a reasonable approximation in light of the difficulties involved in valuing non-traded stock options.
Accounting for Income Taxes. We determine our annual income tax provision in each of the jurisdictions in which we operate. This involves determining our current and deferred income tax expense as well as accounting for differences between the financial statement carrying amounts of existing assets and liabilities and their respective tax bases. The future tax consequences attributable to these differences result in deferred tax assets and liabilities, which are included in our consolidated balance sheets. We assess the recoverability of the deferredtax assets by considering whether it is more likely than not that some portion or all of the deferred tax assets will not be realized. To the extent we believe that recovery does not meet this “more likely than not” standard as required in SFAS No. 109,“Accounting for Income Taxes”, we must establish a valuation allowance.
Management’s judgments and estimates are required in determining our income tax provision, deferred tax assets and liabilities and any valuation allowance recorded against deferred tax assets. We have established a valuation allowance attributable to all US federal deferred tax assets as of December 31, 2008 since they do not meet the “more likely than not” threshold of realization based on our ability to generate sufficient taxable
20
income in the carryback and carryforward periods based on the criteria set forth in SFAS No. 109. We review the recoverability of deferred tax assets during each reporting period by reviewing estimates of future taxable income, future reversals of existing taxable temporary differences, and tax planning strategies that would, if necessary, be implemented to realize the benefit of deferred tax assets before expiration.
We assess tax positions taken on tax returns, including recognition of potential interest and penalties, in accordance with the recognition thresholds and measurement attributes outlined in FASB Interpretation (FIN) No. 48, “Accounting for Uncertainty in Income Taxes – an interpretation of FAS 109”.
The Company adopted the provisions of FIN 48 on January 1, 2007. As a result of the implementation of FIN 48, the Company made a comprehensive review of its portfolio of uncertain tax positions in accordance with recognition standards established by FIN 48. In this regard, an uncertain tax position represents the Company’s expected treatment of a tax position taken in a filed tax return, or planned to be taken in a future tax return, that has not been reflected in measuring income tax expense for financial reporting purposes. The Company believes that it has appropriate support for the income tax positions taken and to be taken on its tax returns and that its accruals for tax liabilities are adequate for all open years based on an assessment of many factors, including past experience and interpretations of tax law applied to the facts of each matter. As a result of applying the provisions of FIN 48, there was no cumulative effect on retained earnings.
For the year ended December 31, 2008, there were no material changes to the total amount of unrecognized tax benefits. The Company does not expect any significant increases or decreases for uncertain tax positions during the next 12 months.
The Company’s policy is to recognize interest and penalties accrued on any unrecognized tax benefits as a component of income tax expense. There is no interest or penalties accrued at December 31, 2008.
The Company’s major tax jurisdictions include the United States and China. The Company is no longer subject to U.S. state or local and non-U.S. income tax examinations by tax authorities in its major jurisdictions for years before 2005, except to the extent of net operating loss and tax credit carryforwards from those years. The Company’s policy is to recognize interest and penalties accrued on any unrecognized tax benefits as a component of income tax expense. There is no interest or penalties accrued at December 31, 2008.
21
RESULTS OF OPERATIONS
The following table sets forth the percentage of net sales of certain items in our consolidated statements of operations for the periods indicated.
| | | | | | | | | |
| | | Fiscal Year Ended December 31, | |
| | | 2008 | | | 2007 | | | 2006 | |
Net sales | | 100.0 | % | | 100.0 | % | | 100.0 | % |
Cost of goods sold | | 57.5 | % | | 57.0 | % | | 59.5 | % |
| | | | | | | | | |
Gross profit | | 42.5 | % | | 43.0 | % | | 40.5 | % |
Operating expenses: | | | | | | | | | |
Selling, general and administrative | | 32.1 | % | | 29.8 | % | | 21.9 | % |
Research, development and engineering | | 10.1 | % | | 8.9 | % | | 6.4 | % |
| | | | | | | | | |
Operating income | | 0.3 | % | | 4.3 | % | | 12.2 | % |
Interest income | | 0.5 | % | | 1.4 | % | | 0.8 | % |
Interest expense | | (1.0 | )% | | (0.9 | )% | | (0.7 | )% |
Foreign exchange gain/(loss) | | 0.1 | % | | (0.8 | )% | | (0.3 | )% |
Other income, net | | 0.0 | % | | 0.2 | % | | 0.0 | % |
| | | | | | | | | |
Income (loss) before provision for income taxes | | (0.1 | )% | | 4.2 | % | | 12.0 | % |
Provision for income taxes | | 1.5 | % | | 1.1 | % | | 0.2 | % |
| | | | | | | | | |
Net income (loss) | | (1.4 | )% | | 3.1 | % | | 11.8 | % |
| | | | | | | | | |
FISCAL YEAR ENDED DECEMBER 31, 2008 AS COMPARED TO FISCAL YEAR ENDED DECEMBER 31, 2007
Net Sales. In the first three quarters of 2008 versus 2007, net sales increased but decreased in the fourth quarter of 2008 as the demand for our electronic market products declined sharply, due to the macro worldwide economic recession. Overall for the year 2008, net sales increased by $8.5 million or 13.4% versus 2007, from $63.7 million in 2007 to $72.3 million in 2008. For the full year 2008, the electronics assembly business increased slightly compared to 2007, despite the sharp drop in the fourth quarter. Meanwhile, there was strong successive quarterly growth in our alternative energy revenues in 2008.
As compared to 2007, the percentage of net sales attributable to our customers in the United States increased by 6% in 2008 primarily due to our thin film solar equipment sales. The percentage of net sales attributable to our customers in Europe decreased by 2%, the percentage of net sales attributable to our Asia Pacific customers remained the same, and the percentage of net sales attributable to our customers in the other Americas decreased by 4%.
Gross Profit. The gross profit percentage remained relatively unchanged at 43% for 2008 and 2007. However, the gross margin for the fourth quarter of 2008 decreased to 38% as the Company underutilized manufacturing capacity resulting from the decline in demand for its electronic market products, due to the macro worldwide economic recession.
Selling, General and Administrative. SG&A costs increased by 21.9% from $19.0 million to $23.2 million in 2008 versus 2007. The increase in selling, general and administrative expenses in 2008 versus 2007 is reflective of the Company’s announced intention to increase service, sales, marketing and administrative support for continued expansion in the alternative energy markets.
Research, Development and Engineering. RD&E costs increased by 28.5% from $5.7 million to $7.3 million in 2008 versus 2007. The added spending on RD&E in 2008 is reflective of the Company’s announced intention to increase its efforts for development of new products for our expanding alternative energy markets.
22
Operating Income. The decrease in operating income was the result of increases in SG&A and RD&E expenses in support of our expanding alternative energy markets.
Interest Income (Expense), Net. While interest expense remained relatively stable, interest income dropped precipitously as the percent of interest earned on cash balances decreased in 2008 versus 2007. The effect was a $0.6 million reduction in interest income in 2008 vs. 2007.
Foreign Exchange Gain (Loss).For the full year 2008, the foreign exchange gain was minimal versus a loss of $0.5 million in 2007.
Income Taxes. The provision for income taxes for both 2008 and 2007 are primarily the result of China taxes on profits earned from our operations in Shanghai and China withholding taxes on BTU USA royalty charges on sales from BTU Shanghai.
In the U.S., the Company has federal and state net operating loss carry forwards of approximately $7.6 million. The Company has recorded a full valuation allowance to offset the deferred tax asset arising as a result of these loss carry forwards because of uncertainty surrounding realization. Our statutory federal income tax rate is 34.0%.
FISCAL YEAR ENDED DECEMBER 31, 2007 AS COMPARED TO FISCAL YEAR ENDED DECEMBER 31, 2006
Net Sales. In 2007, net sales declined quarter to quarter for the first half of 2007 and increased in each of the quarters in the second half of 2007. Overall for the year 2007, net sales decreased by $14.6 million or 18.6% versus 2006, from $78.3 million in 2006 to $63.7 million in 2007. For 2007 the electronics assembly business was down by 30% compared to 2006 while there was strong growth in our alternative energy business in 2007. In the solar photovoltaic market for 2007, the Company was able to double our revenues for the year and bookings increased by more than two and a half times as compared to 2006.
As compared to 2006, the percentage of net sales attributable to our customers in the United States stayed the same in 2007, net sales attributable to our customers in Europe decreased by 5%, net sales attributable to our Asia Pacific customers increased by 7%, and net sales attributable to our customers in the other Americas decreased by 1%.
Gross Profit. The increase in the gross profit percentage to 43.0% for 2007 versus 40.5% for 2006 was principally the result of a favorable product mix, lower material costs in our U.S. operations and improvements in our China assembly and China material sourcing for global operations.
Selling, General and Administrative. SG&A costs increased by 10.9% from $17.1 million to $19.0 million in 2007 versus 2006. The increase in selling, general and administrative expenses in 2007 versus 2006 is reflective of the Company’s expansion in the alternative energy markets and the continuing increased costs associated with government regulations on United States public companies with global operations. The increased selling, general and administrative costs in 2007 versus 2006 are due to added sales, service and marketing expenses for our alternative energy products and added administrative costs associated with the expensing of stock options, Sarbanes-Oxley compliance, tax consulting and legal costs.
Research, Development and Engineering. In 2007 the Company increased its spending on RD&E versus 2006 primarily as a result of our development efforts towards new products for our alternative energy markets and enhancements to our electronics market products.
Operating Income. The decrease in operating income was primarily the result of decreased revenues and partially due to increases in SG&A and RD&E expenses, which were partially offset by improved gross margin percentages.
23
Interest Income (Expense), Net. The net interest income (interest income less interest expense) was $307,000 in 2007 versus $105,000 in 2006 due to higher quarterly cash balances in 2007 versus 2006.
Foreign Exchange (Loss).Foreign Exchange loss increased from a $232,000 loss in 2006 to a $478,000 loss in 2007 primarily due to the continued reduction in the valuation of the U.S. dollar against the Chinese RMB.
Income Taxes. In 2007 the government of China approved a tax equalization law for foreign and domestic companies that impacts BTU. 2007 was the first year that the Company was taxable in China. This event plus the recording of China withholding taxes on royalty charges are the primary elements of the 2007 tax provision. In the U.S., the Company has federal and state net operating loss carry forwards of approximately $6 million. The Company has recorded a full valuation allowance to offset the deferred tax asset arising as a result of these loss carry forwards because of uncertainty surrounding realization. Our statutory federal income tax rate is 34.0%.
LIQUIDITY AND CAPITAL RESOURCES
As of December 31, 2008, we had $27.5 million in cash and cash equivalents, an increase of $2.4 million versus $25.1 million at the end of 2007.
During 2008, we generated net cash of approximately $5.3 million from operating activities. This generation of cash was primarily the result of a decrease in accounts receivable of $3.5 million and non cash expenses for depreciation and amortization of $1.9 million.
On March 1, 2007, the Company entered into an amended revolving loan agreement with a bank that allows for unsecured aggregate borrowings, including letters of credit, up to a maximum of $15 million against a borrowing base of accounts receivable, inventory and fixed assets. The Company may elect to borrow at interest rates related to the bank’s prime rate or LIBOR. This loan agreement extends to December 31, 2010. At December 31, 2008, there were no borrowings outstanding under the loan agreement.
This loan agreement is subject to maintaining certain financial covenants of which the Company is, due to the Company’s reported losses in Q4 2008, not in compliance with the required rolling four quarters minimum debt coverage ratio in the loan agreement. The Company is working with the bank to receive a waiver which will likely require modifications, agreeable to both parties, to the provisions of the existing loan agreement.
On March 30, 2006, we entered into a new mortgage note that is secured by our real property in Billerica, MA, in the amount of $10 million. The mortgage note requires monthly payments of $76,280, which includes interest calculated at the rate of 6.84% per annum. This mortgage note payable has a balloon payment of $6.8 million due and payable at maturity on December 23, 2015. The mortgage note had an outstanding balance at December 31, 2008 of approximately $9.3 million.
We had no material commitments for capital expenditures as of December 31, 2008.
Our business forecasts project that our cash position and cash flow will be sufficient to meet our corporate, operating and capital requirements through 2009.
24
CONTRACTUAL OBLIGATIONS
The Company’s contractual obligations at December 31, 2008 were (in thousands):
| | | | | | | | | | | | | | | |
| | | Payments Due by Period |
Contractual Obligations | | Total | | Less
than 1
Year | | 1-3
Years | | 3-5
Years | | More
than 5
Years |
Long-term debt | | $ | 13,602 | | $ | 915 | | $ | 1,831 | | $ | 1,831 | | $ | 9,025 |
Capital leases | | | 1 | | | 1 | | | — | | | — | | | — |
Operating leases | | | 525 | | | 341 | | | 184 | | | — | | | — |
Open purchase orders | | | 3,744 | | | 3,744 | | | — | | | — | | | — |
Total | | $ | 17,872 | | $ | 5,001 | | $ | 2,015 | | $ | 1,831 | | $ | 9,025 |
RECENT ACCOUNTING PRONOUNCEMENTS
In April 2008, the FASB issued Staff Position No. FAS 142-3, or FSP FAS 142-3,“Determination of the Useful Life of Intangible Assets”, which amends the factors that should be considered in developing renewal or extension assumptions used to determine the useful life of a recognized intangible asset under FASB Statement No. 142,“Goodwill and Other Intangible Assets”.FSP FAS 142-3 allows an entity to use its own historical experience in renewing or extending similar arrangements, adjusted for specified entity-specific factors, in developing assumptions about renewal or extension used to determine the useful life of a recognized intangible asset and will be effective for fiscal years and interim periods beginning after December 15, 2008. Additional disclosures are required to enable financial statement users to assess the extent to which the expected future cash flows associated with the asset are affected by the entity’s intent and/or ability to renew or extend the arrangement. The guidance for determining the useful life of a recognized intangible asset is to be applied prospectively to intangible assets acquired after the effective date. The disclosure requirements are to be applied prospectively to all intangible assets recognized as of, and subsequent to, the effective date.
In March 2008, the FASB issued SFAS No. 161, “Disclosures about Derivative Instruments and Hedging Activities, anamendment of SFAS No. 133” (SFAS 161). SFAS 161 will require companies to disclose their objectives and strategies for using derivative instruments, whether or not their derivatives are designated as hedging instruments. The new pronouncement requires disclosure of the fair value of derivative instruments by primary underlying risk exposures (e.g., interest rate, credit, foreign exchange rate, combination of interest rate and foreign exchange rate, or overall price). It also requires detailed disclosures about the income statement impact of derivative instruments by designation as fair-value hedges, cash-flow hedges, or hedges of the foreign-currency exposure of a net investment in a foreign operation. SFAS 161 will also require disclosure of information that will enable financial statement users to understand the level of derivative activity entered into by a company. The principles of SFAS 161 may be applied on a prospective basis and are effective for financial statements issued for fiscal years and interim periods beginning after November 15, 2008. Early application is encouraged. For the Company, SFAS 161 will be effective at the beginning of its 2009 fiscal year. Management will comply with disclosure requirements subsequent to the effective date of the standard.
In December 2007, the FASB issued SFAS No. 160, “Non-controlling Interests in Consolidated Financial Statements, an amendment of Accounting Research Bulletin (ARB) No. 51,” which changes the accounting and reporting for minority interests. Minority interests will be re-characterized as non-controlling interests and will be reported as a component of equity separate from the parent’s equity, and purchases or sales of equity interests that do not result in a change in control will be accounted for as equity transactions. In addition, net income attributable to the non-controlling interest will be included in consolidated net income on the face of the income statement and, upon a loss of control, the interest sold, as well as any interest retained, will be recorded at fair value with any gain or loss recognized in earnings. SFAS No. 160 will apply prospectively, except for the presentation and disclosure requirements, which will apply retrospectively. SFAS No. 160 is effective for periods beginning on or after December 15, 2008 and will impact the accounting for non-controlling interests after the effective date.
25
In December 2007, the FASB issued SFAS No. 141 (revised 2007), “Business Combinations” (SFAS 141R). SFAS 141R will significantly change the accounting for business combinations in a number of areas including the treatment of contingent consideration, contingencies, acquisition costs, in-process research and development, and restructuring costs. In addition, under SFAS 141R, changes in deferred tax asset valuation allowances and acquired income tax uncertainties in a business combination after the measurement period will impact income taxes. SFAS 141R is effective for fiscal years beginning after December 15, 2008, which is the Company’s fiscal year beginning January 1, 2009, and will impact the accounting for any business combinations entered into after the effective date.
In February 2007, the FASB issued SFAS No. 159,“The Fair Value Option for Financial Assets and Financial Liabilities-including an amendment of SFAS No. 115”. The new statement allows entities to choose, at specified election dates, to measure eligible financial assets and liabilities at fair value that are not otherwise required to be measured at fair value. If a Company elects the fair value option for an eligible item, changes in that item’s fair value in subsequent reporting periods must be recognized in current earnings. SFAS No. 159 will be effective for fiscal years beginning after November 15, 2007. The Company does not believe the adoption of SFAS No. 159 had a material impact on the Company’s financial condition or results of operations.
In September 2006, the FASB issued SFAS No. 157, “Fair Value Measurements”(“SFAS 157”) which defines fair value, establishes a framework for measuring fair value in generally accepted accounting principles, and expands disclosures about fair value measurements. On February 12, 2008, the FASB issued FASB Staff Position (“FSP”) SFAS No. 157-2, Effective Date of SFAS No. 157. The FSP amends SFAS 157, to delay the effective date of SFAS 157 for all non-financial assets and non-financial liabilities, except those that are recognized or disclosed at fair value in the financial statements on a recurring basis (that is, at least annually) to fiscal years beginning after November 15, 2008. The adoption of FSP 157-2 is not expected to have a significant impact on our financial statements.
| ITEM 7A. | QUANTITATIVE AND QUALITATIVE DISCLOSURES ABOUT MARKET RISK |
MARKET RISK DISCLOSURE
Our primary market risk exposure is in the area of foreign currency exchange rate risk as we are exposed to currency exchange rate fluctuations as they pertain primarily to accounts receivable in U.S. dollars on our China subsidiary’s books.
As of December 31, 2008, all of our long-term debt and capital lease obligations are fixed rate financial instruments. Therefore we are not exposed to interest rate risk resulting from variable interest rate of our debt.
| ITEM 8. | FINANCIAL STATEMENTS AND SUPPLEMENTARY DATA |
The information required by item 8 of Form 10-K is presented here in the following order:
26
UNAUDITED QUARTERLY RESULTS OF OPERATIONS
The following table presents unaudited statement of operations data for each of the eight quarters in the period ended December 31, 2008, with such data expressed as a percentage of net sales for the period indicated. We believe that all necessary adjustments have been included to present fairly the quarterly information when read in conjunction with our consolidated financial statements. The operating results for any quarter are not necessarily indicative of the results for any subsequent period.
SELECTED CONSOLIDATED STATEMENT OF OPERATIONS DATA
| | | | | | | | | | | | | | | | | | | | | | | | | | | | | | | | |
| | | Quarter Ended | |
| | | Apr. 01,
2007 | | | July 01,
2007 | | | Sept. 30,
2007 | | | Dec. 31,
2007 | | | Mar. 30,
2008 | | | June 29,
2008 | | | Sept. 28,
2008 | | | Dec. 31,
2008 | |
| | | (in thousands, except per share data) | |
Net sales | | $ | 15,164 | | | $ | 13,770 | | | $ | 16,522 | | | $ | 18,267 | | | $ | 16,619 | | | $ | 20,384 | | | $ | 20,578 | | | $ | 14,685 | |
Cost of goods sold | | | 8,600 | | | | 7,833 | | | | 9,347 | | | | 10,557 | | | | 9,996 | | | | 11,064 | | | | 11,373 | | | | 9,109 | |
| | | | | | | | | | | | | | | | | | | | | | | | | | | | | | | | |
Gross profit | | | 6,564 | | | | 5,937 | | | | 7,175 | | | | 7,710 | | | | 6,623 | | | | 9,320 | | | | 9,205 | | | | 5,576 | |
Selling, general and administrative | | | 4,543 | | | | 4,121 | | | | 5,127 | | | | 5,218 | | | | 4,912 | | | | 6,401 | | | | 6,372 | | | | 5,483 | |
Research, development and engineering | | | 1,371 | | | | 1,524 | | | | 1,284 | | | | 1,479 | | | | 1,603 | | | | 1,787 | | | | 1,748 | | | | 2,136 | |
| | | | | | | | | | | | | | | | | | | | | | | | | | | | | | | | |
Income (loss) from operations | | | 650 | | | | 292 | | | | 764 | | | | 1,014 | | | | 108 | | | | 1,132 | | | | 1,085 | | | | (2,043 | ) |
Interest (income) expense, net | | | 100 | | | | 125 | | | | 58 | | | | 24 | | | | (80 | ) | | | (96 | ) | | | (61 | ) | | | (106 | ) |
Foreign exchange gain (loss) | | | (122 | ) | | | (194 | ) | | | (204 | ) | | | 42 | | | | 124 | | | | (395 | ) | | | (151 | ) | | | 462 | |
Other income (expense), net | | | 106 | | | | 4 | | | | (3 | ) | | | (3 | ) | | | — | | | | — | | | | 1 | | | | 1 | |
| | | | | | | | | | | | | | | | | | | | | | | | | | | | | | | | |
Income (loss) before provision for income taxes | | | 734 | | | | 227 | | | | 615 | | | | 1,077 | | | | 152 | | | | 641 | | | | 874 | | | | (1,686 | ) |
Provision for income tax | | | 75 | | | | 21 | | | | 92 | | | | 518 | | | | 53 | | | | 353 | | | | 197 | | | | 475 | |
| | | | | | | | | | | | | | | | | | | | | | | | | | | | | | | | |
Net income (loss) | | $ | 659 | | | $ | 206 | | | $ | 523 | | | $ | 559 | | | $ | 99 | | | $ | 288 | | | $ | 677 | | | $ | (2,161 | ) |
| | | | | | | | | | | | | | | | | | | | | | | | | | | | | | | | |
Income (loss) per share: | | | | | | | | | | | | | | | | | | | | | | | | | | | | | | | | |
Basic | | $ | 0.07 | | | $ | 0.02 | | | $ | 0.06 | | | $ | 0.06 | | | $ | 0.01 | | | $ | 0.03 | | | $ | 0.07 | | | ($ | 0.23 | ) |
Diluted | | $ | 0.07 | | | $ | 0.02 | | | $ | 0.06 | | | $ | 0.06 | | | $ | 0.01 | | | $ | 0.03 | | | $ | 0.07 | | | ($ | 0.23 | ) |
Weighted average number of shares outstanding: | | | | | | | | | | | | | | | | | | | | | | | | | | | | | | | | |
Basic | | | 9,218 | | | | 9,275 | | | | 9,275 | | | | 9,332 | | | | 9,355 | | | | 9,375 | | | | 9,389 | | | | 9,381 | |
Diluted | | | 9,413 | | | | 9,447 | | | | 9,450 | | | | 9,525 | | | | 9,520 | | | | 9,525 | | | | 9,531 | | | | 9,381 | |
| |
| | | QUARTER ENDED | |
| | | Apr. 01,
2007 | | | July 01,
2007 | | | Sept. 30,
2007 | | | Dec. 31,
2007 | | | Mar. 30,
2008 | | | June 29,
2008 | | | Sept. 28,
2008 | | | Dec. 31,
2008 | |
PERCENTAGE OF NET SALES: | | | | | | | | | | | | | | | | | | | | | | | | | | | | | | | | |
Net sales | | | 100.0 | % | | | 100.0 | % | | | 100.0 | % | | | 100.0 | % | | | 100.0 | % | | | 100.0 | % | | | 100.0 | % | | | 100.0 | % |
Cost of goods sold | | | 56.7 | % | | | 56.9 | % | | | 56.6 | % | | | 57.8 | % | | | 60.1 | % | | | 54.3 | % | | | 55.3 | % | | | 62.0 | % |
| | | | | | | | | | | | | | | | | | | | | | | | | | | | | | | | |
Gross profit | | | 43.3 | % | | | 43.1 | % | | | 43.4 | % | | | 42.2 | % | | | 39.9 | % | | | 45.7 | % | | | 44.7 | % | | | 38.0 | % |
Selling, general and administrative | | | 30.0 | % | | | 29.9 | % | | | 31.0 | % | | | 28.6 | % | | | 29.6 | % | | | 31.4 | % | | | 31.0 | % | | | 37.3 | % |
Research, development and engineering | | | 9.0 | % | | | 11.1 | % | | | 7.8 | % | | | 8.1 | % | | | 9.6 | % | | | 8.8 | % | | | 8.5 | % | | | 14.5 | % |
| | | | | | | | | | | | | | | | | | | | | | | | | | | | | | | | |
Income (loss) from operations | | | 4.3 | % | | | 2.1 | % | | | 4.6 | % | | | 5.6 | % | | | 0.6 | % | | | 5.6 | % | | | 5.3 | % | | | (13.9 | )% |
Interest income (expense), net | | | 0.7 | % | | | 0.8 | % | | | 0.4 | % | | | 0.2 | % | | | (0.5 | )% | | | (0.5 | )% | | | (0.3 | )% | | | (0.7 | )% |
Foreign exchange gain/(loss) | | | (0.8 | )% | | | (1.3 | )% | | | (1.3 | )% | | | 0.3 | % | | | 0.7 | % | | | (1.9 | )% | | | (0.7 | )% | | | 3.1 | % |
Other income (expense), net | | | 0.7 | % | | | 0.0 | % | | | (0.0 | )% | | | (0.0 | )% | | | 0.0 | % | | | 0.0 | % | | | 0.0 | % | | | 0.0 | % |
| | | | | | | | | | | | | | | | | | | | | | | | | | | | | | | | |
Income (loss) before provision for income taxes | | | 4.8 | % | | | 1.6 | % | | | 3.7 | % | | | 5.9 | % | | | 0.9 | % | | | 3.1 | % | | | 4.2 | % | | | (11.5 | )% |
Provision for income taxes | | | 0.5 | % | | | 0.1 | % | | | 0.5 | % | | | 2.8 | % | | | 0.3 | % | | | 1.7 | % | | | 1.0 | % | | | 3.2 | % |
| | | | | | | | | | | | | | | | | | | | | | | | | | | | | | | | |
Net income (loss) | | | 4.3 | % | | | 1.5 | % | | | 3.2 | % | | | 3.1 | % | | | 0.6 | % | | | 1.4 | % | | | 3.3 | % | | | (14.7 | )% |
| | | | | | | | | | | | | | | | | | | | | | | | | | | | | | | | |
27
During the eight quarters of 2007 and 2008, net sales increased from a low of $13.8 million in the second quarter of 2007 to a high of $20.6 million in Q3 2008 and decreased sharply to $14.7 million in the fourth quarter of 2008. The worldwide economic downturn in Q4 2008 reduced our sales dramatically to our electronic markets while the Company has continued to see sales increases for our Energy Generation products.
Gross profit as a percentage of net sales for six of the last eight quarters has been in the mid to low 40% range. The low point in gross margin percentage was in Q4 2008 at 38%, which resulted from underutilization of our manufacturing operations.
Selling, general and administrative costs during the last eight quarters in 2007 and 2008 increased from a low of $4.1 million to a high of $6.4 million. The increase in quarterly costs represents primarily the staffing and expense adjustments required to properly support and service our customers globally with our expanded initiatives in our alternative energy markets.
Research, development and engineering costs for the last eight quarters have increased from a low of $1.3 million to a high of $2.1 million. The major increases are related to the Company’s continuing development of products for the Alternative Energy market.
Income from operations in the last eight quarters increased and decreased quarter to quarter primarily as the net sales increased or decreased quarter to quarter. In addition, operating income has been adversely effected by the continued increased spending in SG&A and RD&E in support of our expanding alternative energy business.
The provision for income tax reflects the China taxes on profits earned from our operations in Shanghai and China withholding taxes on BTU USA royalty charges on sales from BTU Shanghai. In addition, income tax expense in the 4th quarter of 2008 includes an increase in the deferred tax valuation allowance of $206,000 which relates to a prior period.
28
BTU INTERNATIONAL, INC.
CONSOLIDATED BALANCE SHEETS
(in thousands, except share and per share data)
| | | | | | | | |
| | | As of December 31, | |
| Assets | | 2008 | | | 2007 | |
Current assets | | | | | | | | |
Cash and cash equivalents | | $ | 27,464 | | | $ | 25,065 | |
Accounts receivable, less allowance of $260 and $201 at December 31, 2008 and 2007 | | | 15,450 | | | | 18,832 | |
Inventories, net | | | 19,044 | | | | 16,891 | |
Other current assets | | | 909 | | | | 787 | |
| | | | | | | | |
Total current assets | | | 62,867 | | | | 61,575 | |
| | | | | | | | |
Property, plant and equipment, at cost | | | | | | | | |
Land | | | 210 | | | | 210 | |
Buildings and improvements | | | 9,437 | | | | 8,829 | |
Machinery, equipment and software | | | 14,050 | | | | 12,064 | |
Furniture and fixtures | | | 1,030 | | | | 963 | |
| | | | | | | | |
| | | 24,727 | | | | 22,066 | |
Less accumulated depreciation | | | (17,841 | ) | | | (16,530 | ) |
| | | | | | | | |
Net property, plant and equipment | | | 6,886 | | | | 5,536 | |
| | | | | | | | |
Other assets, net of accumulated amortization of $1,398 in 2008 and $876 in 2007 | | | 1,562 | | | | 2,401 | |
| | | | | | | | |
Total assets | | $ | 71,315 | | | $ | 69,512 | |
| | | | | | | | |
Liabilities and stockholders’ equity | | | | | | | | |
Current liabilities | | | | | | | | |
Current maturities of long-term debt and capital lease obligations | | $ | 290 | | | $ | 277 | |
Trade accounts payable | | | 5,058 | | | | 5,645 | |
Customer deposits | | | 1,635 | | | | 597 | |
Accrued expenses | | | 5,764 | | | | 4,492 | |
| | | | | | | | |
Total current liabilities | | | 12,747 | | | | 11,010 | |
Long-term debt and capital lease obligations less current maturities | | | 8,988 | | | | 9,267 | |
Other long-term liabilities | | | — | | | | 300 | |
| | | | | | | | |
Total liabilities | | | 21,735 | | | | 20,577 | |
| | | | | | | | |
Commitments and contingencies | | | | | | | | |
Stockholders’ equity | | | | | | | | |
Preferred stock, $1.00 par value—5,000,000 shares authorized; no shares issued or outstanding | | | — | | | | — | |
Common stock, $0.01 par value—25,000,000 shares authorized; 10,557,291 shares issued and 9,353,187 shares outstanding at December 31, 2008 and 10,502,311 shares issued and 9,353,301 shares outstanding at December 31, 2007 | | | 105 | | | | 105 | |
Additional paid in capital | | | 45,458 | | | | 44,046 | |
Retained earnings | | | 6,718 | | | | 7,814 | |
Less: treasury stock at cost, 1,204,104 shares at December 31, 2008 and 1,149,010 shares at December 31, 2007 | | | (4,391 | ) | | | (4,177 | ) |
Accumulated other comprehensive income | | | 1,690 | | | | 1,147 | |
| | | | | | | | |
Total stockholders’ equity | | | 49,580 | | | | 48,935 | |
| | | | | | | | |
Total liabilities and stockholders’ equity | | $ | 71,315 | | | $ | 69,512 | |
| | | | | | | | |
The accompanying notes are an integral part of these consolidated financial statements.
29
BTU INTERNATIONAL, INC.
CONSOLIDATED STATEMENTS OF OPERATIONS
(in thousands, except per share data)
| | | | | | | | | | | | |
| | | Years Ended December 31, | |
| | | 2008 | | | 2007 | | | 2006 | |
Net sales | | $ | 72,266 | | | $ | 63,723 | | | $ | 78,289 | |
Cost of goods sold | | | 41,542 | | | | 36,337 | | | | 46,554 | |
| | | | | | | | | | | | |
Gross profit | | | 30,724 | | | | 27,386 | | | | 31,735 | |
| | | | | | | | | | | | |
Selling, general and administrative | | | 23,168 | | | | 19,009 | | | | 17,139 | |
Research, development and engineering | | | 7,273 | | | | 5,658 | | | | 5,065 | |
| | | | | | | | | | | | |
Operating income | | | 283 | | | | 2,719 | | | | 9,531 | |
| | | | | | | | | | | | |
Interest income | | | 354 | | | | 909 | | | | 667 | |
Interest expense | | | (697 | ) | | | (602 | ) | | | (562 | ) |
Foreign exchange gain (loss) | | | 40 | | | | (478 | ) | | | (232 | ) |
Other income | | | 2 | | | | 106 | | | | 7 | |
| | | | | | | | | | | | |
Income (loss) before provision for income taxes | | | (19 | ) | | | 2,654 | | | | 9,411 | |
Provision for income taxes | | | 1,077 | | | | 706 | | | | 189 | |
| | | | | | | | | | | | |
Net income (loss) | | $ | (1,096 | ) | | $ | 1,948 | | | $ | 9,222 | |
| | | | | | | | | | | | |
Income (loss) per share: | | | | | | | | | | | | |
Basic | | $ | (0.12 | ) | | $ | 0.21 | | | $ | 1.01 | |
Diluted | | ($ | 0.12 | ) | | $ | 0.20 | | | $ | 0.98 | |
Weighted average number of shares outstanding: | | | | | | | | | | | | |
Basic shares | | | 9,375 | | | | 9,297 | | | | 9,121 | |
Diluted shares | | | 9,375 | | | | 9,544 | | | | 9,440 | |
The accompanying notes are an integral part of these consolidated financial statements.
30
BTU INTERNATIONAL, INC.
CONSOLIDATED STATEMENTS OF STOCKHOLDERS’ EQUITY AND
COMPREHENSIVE INCOME (LOSS)
(in thousands)
| | | | | | | | | | | | | | | | | | | | | | | | | | | | | |
| | | | | | | Additional
Paid-In
Capital | | Deferred
Comp. | | | Retained
Earnings
(Accum.
Deficit) | | | | | | | | Accumulated
Other
Comprehensive
Income | | Total | |
| | | Common
Stock | | | | | Treasury Stock | | | |
| | | # of
shares | | $ | | | | | # of
shares | | $ | | | |
Balance at December 31, 2005 | | 10,040 | | $ | 100 | | $ | 39,746 | | $ | (49 | ) | | $ | (3,356 | ) | | 1,149 | | $ | (4,177 | ) | | $ | 219 | | $ | 32,483 | |
Net income | | — | | | — | | | — | | | — | | | | 9,222 | | | — | | | — | | | | — | | | 9,222 | |
Exercise of stock options | | 135 | | | 1 | | | 461 | | | — | | | | — | | | — | | | — | | | | — | | | 462 | |
Issuance of common stock, net of issuance costs of $63 | | 158 | | | 2 | | | 2,069 | | | — | | | | — | | | — | | | — | | | | — | | | 2,071 | |
Translation adjustment | | — | | | — | | | — | | | — | | | | — | | | — | | | — | | | | 329 | | | 329 | |
Deferred compensation | | — | | | — | | | 316 | | | 49 | | | | — | | | — | | | — | | | | — | | | 365 | |
| | | | | | | | | | | | | | | | | | | | | | | | | | | | | |
Balance at December 31, 2006 | | 10,333 | | $ | 103 | | $ | 42,592 | | $ | — | | | $ | 5,866 | | | 1,149 | | $ | (4,177 | ) | | $ | 548 | | $ | 44,932 | |
Net income | | — | | | — | | | — | | | — | | | | 1,948 | | | — | | | — | | | | — | | | 1,948 | |
Exercise of stock options | | 135 | | | 2 | | | 343 | | | — | | | | — | | | — | | | — | | | | — | | | 345 | |
Issuance of common stock | | 34 | | | — | | | 367 | | | — | | | | — | | | — | | | — | | | | — | | | 367 | |
Translation adjustment | | — | | | — | | | — | | | — | | | | — | | | — | | | — | | | | 599 | | | 599 | |
Stock-based compensation | | — | | | — | | | 744 | | | — | | | | — | | | — | | | — | | | | — | | | 744 | |
| | | | | | | | | | | | | | | | | | | | | | | | | | | | | |
Balance at December 31, 2007 | | 10,502 | | $ | 105 | | $ | 44,046 | | $ | — | | | $ | 7,814 | | | 1,149 | | $ | (4,177 | ) | | $ | 1,147 | | $ | 48,935 | |
Net loss | | — | | | — | | | — | | | — | | | $ | (1,096 | ) | | — | | | — | | | | — | | | (1,096 | ) |
Exercise of stock options | | 35 | | | — | | | 116 | | | — | | | | — | | | — | | | — | | | | — | | | 116 | |
Purchase of treasury stock | | — | | | — | | | — | | | — | | | | — | | | 55 | | | (214 | ) | | | — | | | (214 | ) |
Issuance of common stock | | 20 | | | — | | | 99 | | | — | | | | — | | | — | | | — | | | | — | | | 99 | |
Translation adjustment | | — | | | — | | | — | | | — | | | | — | | | — | | | — | | | | 543 | | | 543 | |
Stock-based compensation | | — | | | — | | | 1,197 | | | — | | | | — | | | — | | | — | | | | — | | | 1,197 | |
| | | | | | | | | | | | | | | | | | | | | | | | | | | | | |
Balance at December 31, 2008 | | 10,557 | | $ | 105 | | $ | 45,458 | | $ | — | | | $ | 6,718 | | | 1,204 | | $ | (4,391 | ) | | $ | 1,690 | | $ | 49,580 | |
| | | | | | | | | | | | | | | | | | | | | | | | | | | | | |
| | | | | | | | | | |
| | | Years Ended December 31, |
| | | 2008 | | | 2007 | | 2006 |
| | | (In thousands) |
Comprehensive income (loss) is calculated as follows: | | | | | | | | | | |
Net income (loss) | | $ | (1,096 | ) | | $ | 1,948 | | $ | 9,222 |
Other comprehensive income | | | | | | | | | | |
Foreign currency translation adjustment | | | 543 | | | | 599 | | | 329 |
| | | | | | | | | | |
Comprehensive income (loss) | | $ | (553 | ) | | $ | 2,547 | | $ | 9,551 |
| | | | | | | | | | |
The accompanying notes are an integral part of these consolidated financial statements.
31
BTU INTERNATIONAL, INC.
CONSOLIDATED STATEMENTS OF CASH FLOWS
(in thousands)
| | | | | | | | | | | | |
| | | Years Ended December 31, | |
| | | 2008 | | | 2007 | | | 2006 | |
Cash flows from operating activities: | | | | | | | | | | | | |
Net income (loss) | | $ | (1,096 | ) | | $ | 1,948 | | | $ | 9,222 | |
Adjustments to reconcile net cash provided by operating activities: | | | | | | | | | | | | |
Depreciation and amortization | | | 1,857 | | | | 1,470 | | | | 1,162 | |
Provision for bad debts | | | 71 | | | | (23 | ) | | | (164 | ) |
Provision for inventory | | | 594 | | | | (299 | ) | | | (69 | ) |
Stock based compensation | | | 1,197 | | | | 744 | | | | 365 | |
Gain on foreign currency hedge | | | — | | | | (31 | ) | | | — | |
Loss on disposal of fixed assets | | | — | | | | 3 | | | | — | |
Deferred taxes | | | 155 | | | | — | | | | (206 | ) |
Net change in operating assets and liabilities: | | | | | | | | | | | | |
Accounts receivable | | | 3,487 | | | | (2,432 | ) | | | 723 | |
Inventories | | | (2,492 | ) | | | 1,100 | | | | (3,140 | ) |
Other current assets | | | (2 | ) | | | (292 | ) | | | (3 | ) |
Other assets | | | — | | | | (44 | ) | | | 152 | |
Accounts payable | | | (533 | ) | | | 410 | | | | (1,279 | ) |
Customer deposits | | | 1,038 | | | | (250 | ) | | | (186 | ) |
Accrued expenses | | | 982 | | | | (297 | ) | | | (313 | ) |
| | | | | | | | | | | | |
Net cash provided by operating activities | | | 5,258 | | | | 2,007 | | | | 6,264 | |
| | | | | | | | | | | | |
Cash flows from investing activities: | | | | | | | | | | | | |
Purchases of property, plant and equipment | | | (2,648 | ) | | | (2,314 | ) | | | (1,779 | ) |
Settlement of foreign currency hedge | | | 30 | | | | — | | | | — | |
Cash paid for acquisition | | | — | | | | — | | | | (975 | ) |
| | | | | | | | | | | | |
Net cash used in investing activities | | | (2,618 | ) | | | (2,314 | ) | | | (2,754 | ) |
| | | | | | | | | | | | |
Cash flows from financing activities: | | | | | | | | | | | | |
Proceeds from refinance of mortgage note | | | — | | | | — | | | | 4,686 | |
Purchase of treasury stock | | | (214 | ) | | | — | | | | — | |
Principal payments under long-term debt and capital lease agreements | | | (266 | ) | | | (276 | ) | | | (226 | ) |
Issuance of common stock | | | 99 | | | | 367 | | | | 1,070 | |
Proceeds from the exercise of stock options | | | 116 | | | | 345 | | | | 462 | |
| | | | | | | | | | | | |
Net cash provided by (used in) financing activities | | | (265 | ) | | | 436 | | | | 5,992 | |
| | | | | | | | | | | | |
Effects of exchange rates on cash | | | 24 | | | | (164 | ) | | | 138 | |
| | | | | | | | | | | | |
Net increase (decrease) in cash and cash equivalents | | | 2,399 | | | | (35 | ) | | | 9,640 | |
Cash and cash equivalents, beginning of period | | | 25,065 | | | | 25,100 | | | | 15,460 | |
| | | | | | | | | | | | |
Cash and cash equivalents, end of period | | $ | 27,464 | | | $ | 25,065 | | | $ | 25,100 | |
| | | | | | | | | | | | |
Supplemental disclosures of cash flow information: | | | | | | | | | | | | |
Cash paid during the periods for: | | | | | | | | | | | | |
Interest (received) paid, net | | $ | 354 | | | $ | (264 | ) | | $ | 538 | |
Income taxes | | $ | 254 | | | $ | 109 | | | $ | 28 | |
Non-cash disclosure: | | | | | | | | | | | | |
Acquisition of Radiant Technology Corporation | | | | | | | | | | | | |
Fair value of assets acquired | | $ | — | | | $ | — | | | $ | 1,591 | |
Fair value of common stock issued | | $ | — | | | $ | 283 | | | $ | (1,001 | ) |
Less fair value of liabilities assumed | | $ | — | | | $ | (283 | ) | | $ | (90 | ) |
| | | | | | | | | | | | |
Cash paid | | $ | — | | | $ | — | | | $ | 500 | |
Acquisition of AtmoPlas Technology and Research | | | | | | | | | | | | |
Fair value of assets acquired | | $ | — | | | $ | — | | | $ | 1,390 | |
Less fair value of liabilities assumed | | $ | — | | | $ | — | | | $ | (915 | ) |
| | | | | | | | | | | | |
Cash paid | | $ | — | | | $ | — | | | $ | 475 | |
The accompanying notes are an integral part of these consolidated financial statements.
32
BTU INTERNATIONAL, INC.
NOTES TO CONSOLIDATED FINANCIAL STATEMENTS
| (1) | SUMMARY OF SIGNIFICANT ACCOUNTING POLICIES |
NATURE OF OPERATIONS
BTU International, Inc. and its wholly owned subsidiaries (the Company) are primarily engaged in the design, manufacture, sale, and service of thermal processing systems, which are used as capital equipment in various manufacturing processes, primarily in the electronics and alternate energy industries.
COMPREHENSIVE INCOME (LOSS)
The Company follows Statement of Financial Accounting Standards (SFAS) No. 130, “Reporting Comprehensive Income”. SFAS No. 130 requires companies to report all changes in equity during a period, resulting from net income (loss) and transactions from non-owner sources, in a financial statement in the period in which they are recognized. The Company has chosen to disclose comprehensive income (loss), which encompasses net income (loss) and foreign currency translation adjustments in the consolidated statements of stockholders equity and comprehensive income (loss).
PRINCIPLES OF CONSOLIDATION AND THE USE OF ESTIMATES
The accompanying consolidated financial statements include the accounts of the Company. All material inter-company balances and transactions have been eliminated in consolidation. The preparation of financial statements in conformity with generally accepted accounting principles requires management to make estimates and assumptions that affect the reported amounts of assets and liabilities, disclosure of contingent assets and liabilities at the date of the financial statements, and the reported amounts of revenues and expenses during the reporting periods. The primary estimates used in the consolidated financial statements include percent complete revenue, inventory valuation, allowance for doubtful accounts, valuation of deferred income taxes, stock-based compensation and warranty reserves.
CASH AND CASH EQUIVALENTS
The Company has classified certain highly liquid financial instruments, with original maturities of three months or less, as cash equivalents.
ACCOUNTS RECEIVABLE
Accounts receivable are stated at the amount management expects to collect from outstanding balances. An allowance for doubtful accounts is provided for those accounts receivable considered to be uncollectible based upon historical experience and management’s evaluation of outstanding accounts receivable at the end of the year. Bad debts are written off against the allowance when identified. Bad debt expense was $59,000, $0 and $0 for 2008, 2007 and 2006, respectively.
INVENTORIES
Our inventories consist of material, labor and manufacturing overhead costs. We determine the cost of inventory based on the first-in, first-out method. We regularly review the quantity of inventories on hand and compare these quantities to the expected usage of each applicable product or product line. Our inventories are adjusted in value to the lower of costs and/or net realizable value. Since the value of our inventories depends in part on our estimates of each product’s net realizable value, adjustments may be needed to reflect changes in valuation. Any adjustments we are required to make to lower the value of the inventories are recorded as a charge to cost of sales.
33
BTU INTERNATIONAL, INC.
NOTES TO CONSOLIDATED FINANCIAL STATEMENTS—(Continued)
Inventories consist of the following (in thousands):
| | | | | | |
| | | Years Ended
December 31, |
| | | 2008 | | 2007 |
Raw materials and manufactured components | | $ | 8,961 | | $ | 11,439 |
Work-in-process | | | 7,021 | | | 3,718 |
Finished goods | | | 3,062 | | | 1,734 |
| | | | | | |
| | $ | 19,044 | | $ | 16,891 |
| | | | | | |
The Company periodically reviews quantities of inventory on hand and compares these amounts to expected usage of each particular product or product line. The Company also records, as a charge to cost of goods sold, any amounts required to reduce the carrying value of the finished goods inventory to net realizable value. The Company recorded inventory provisions or (recoveries) of $559,000, $(299,000) and $(69,000) in 2008, 2007, and 2006, respectively. The provisions recorded are net of sold inventory that had previously been reserved in the amounts of $534,000, $388,000 and $250,000 for the years ended 2008, 2007, and 2006, respectively.
PROPERTY, PLANT AND EQUIPMENT
The Company provides for depreciation using the straight-line method over the assets’ useful lives. The estimated useful lives for depreciation purposes are as follows:
| | |
Buildings and improvements | | 8-25 years |
Machinery and equipment | | 2-8 years |
Software | | 3-10 years |
Furniture and fixtures | | 3-8 years |
Leasehold improvements | | 3 years |
Depreciation expense was approximately $1,334,000, $974,000 and $783,000 for the years ended December 31, 2008, 2007 and 2006, respectively.
Maintenance and repairs are charged to operations as incurred. When equipment and improvements are sold or otherwise disposed of, the asset cost and accumulated depreciation are removed from the accounts, and the resulting gain or loss, if any, is included in the results of operations.
The Company evaluates long-lived assets such as intangible assets and property, plant and equipment under SFAS No. 144, “Accounting for the Impairment or Disposal of Long-Lived Assets” (SFAS 144). This statement requires that long-lived assets and certain identifiable intangibles are reviewed for impairment whenever events or changes in circumstances indicate that the carrying amount of an asset may not be recoverable. Recoverability of assets to be held and used is measured by a comparison of the carrying amount of an asset or asset group to future net cash flows expected to be generated by the asset or asset group. If such assets are considered to be impaired, the impairment to be recognized is measured by the amount by which the carrying amount of the assets or asset group exceeds the fair value of the assets. No impairments of long-lived assets have been identified during the years ended December 31, 2008, December 31, 2007 and December 31, 2006.
34
BTU INTERNATIONAL, INC.
NOTES TO CONSOLIDATED FINANCIAL STATEMENTS—(Continued)
OTHER ASSETS
Other assets consist of the following (in thousands):
| | | | | | |
| | | 2008 | | 2007 |
Deferred financing costs, net of amortization | | $ | 78 | | $ | 99 |
Other receivable | | | — | | | 206 |
Intellectual Property, net of amortization | | | 1,326 | | | 1,828 |
Other | | | 158 | | | 268 |
| | | | | | |
Total | | $ | 1,562 | | $ | 2,401 |
| | | | | | |
Deferred financing costs capitalized in 2006, are being amortized over ten years, the term of the mortgage note. Amortization on deferred financing costs was approximately $20,000, $17,000 and $61,000 in 2008, 2007 and 2006, respectively. Amortization on intellectual property was approximately $502,000, $479,000 and $318,000 in 2008, 2007 and 2006, respectively.
INCOME TAXES
Deferred tax assets and liabilities are recognized for the expected future tax consequences of events that have been included in the consolidated financial statements or tax returns. The amounts of deferred tax assets or liabilities are based on the difference between the financial statement and tax basis of assets and liabilities using enacted tax rates in effect for the year in which the differences are expected to reverse. The effect on deferred tax assets and liabilities of a change in tax rates is recognized in income in the period that includes the enactment date. A valuation allowance is provided if, based on the weight of the available evidence, it is more likely than not that some or all of the deferred tax asset will not be realized.
TRANSLATION OF FOREIGN CURRENCIES
Assets and liabilities of the Company’s foreign operations are translated from their functional currency into United States dollars at year end exchange rates. Revenue and expense items are translated at weighted average rates of exchange prevailing during the year. Gains and losses arising from translation are accumulated as a separate component of stockholders’ equity, as the functional currency of the subsidiaries is their local currency, and the reporting currency of the Company is the U.S. dollar. Exchange gains and losses arising from transactions denominated in foreign currencies are included in income as incurred.
PATENTS
The Company has patents in the United States and certain foreign countries for some of its products and processes. No value has been assigned to these patents in the accompanying consolidated financial statements.
REVENUE RECOGNITION
The Company recognizes revenue in accordance with the Securities and Exchange Commission (SEC) Staff Accounting Bulletin (SAB) No. 101, “Revenue Recognition in Financial Statements” as updated by SEC SAB No. 104, “Revenue Recognition.” Under these guidelines, revenue is recognized when persuasive evidence of an arrangement exists, delivery has occurred or services rendered, the price is fixed or determinable and payment is reasonably assured. Under these requirements, when the terms of sale include customer acceptance provisions,
35
BTU INTERNATIONAL, INC.
NOTES TO CONSOLIDATED FINANCIAL STATEMENTS—(Continued)
and compliance with those provisions has not been demonstrated, revenues are recognized upon acceptance. Furthermore, revenues for products that require installation for which the installation is essential to functionality or is not deemed inconsequential or perfunctory are recognized upon completion of installation. Revenues for products sold where installation is not essential to functionality and is deemed inconsequential or perfunctory are recognized upon shipment with estimated installation and warranty costs accrued.
Applying the requirements of SAB No. 101 and SAB No. 104 to future sales arrangements used in the Company’s equipment sales may result in the deferral of the revenue for some equipment sales.
The Company also has certain sales transactions for products, which are not completed within the normal operating cycle of the business. It is the Company’s policy to account for these transactions using the percentage of completion method for revenue recognition purposes when all of the following criteria exist. (1) The Company has received the Customer’s purchase order or entered into a legally binding contract. (2) The Customer is credit worthy and collection is probable or Customer prepayments are required at product completion milestones or specific dates. (3) The sales value of the product to be delivered is significant in amount when compared to the Company’s other products. (4) Product costs can be reasonably estimated; there is no major technological uncertainty and the total engineering, material procurement, product assembly and test cycle time extend over a period of six months or longer.
Under the percentage of completion method, revenues and gross margins to date are recognized based upon the ratio of costs incurred to date compared to the latest estimate of total costs to complete the product as a percentage of the total contract revenue for the product. Revisions in costs and gross margin percentage estimates are reflected in the period in which the facts causing the revision become known. Provisions for total estimated losses on uncompleted contracts, if any, are made in the period in which such losses are determined. For the years ended 2008, 2007 and 2006, $6,024,666, $1,637,179 and $1,211,000, respectively, were recognized as revenue using the percentage of completion method.
The Company accounts for shipping and handling costs billed to customers in accordance with the Emerging Issues Task Force (EITF) Issue 00-10 “Accounting for Shipping and Handling Fees and Cost.” Amounts billed to customers for shipping and handling costs are recorded as revenues with the associated costs reported as cost of goods sold.
RESEARCH, DEVELOPMENT AND ENGINEERING
Research, development and engineering costs are charged to expense as incurred.
EARNINGS PER SHARE INFORMATION
Basic EPS is computed by dividing income available to common stockholders by the weighted-average number of common shares outstanding during the period. Diluted EPS is computed using the weighted average number of common and dilutive potential common shares outstanding during the period, using the treasury stock method. Due to their antidilutive effect, approximately 887,501, 202,633 and 79,589 options to purchase common stock were excluded from the calculation of diluted earnings per share for the years ended December 31, 2008, 2007 and 2006, respectively. However, these options could become dilutive in future periods.
36
BTU INTERNATIONAL, INC.
NOTES TO CONSOLIDATED FINANCIAL STATEMENTS—(Continued)
The weighted average number of common shares used to compute basic and diluted earnings per share consists of the following classification:
| | | | | | |
| | | Years ended December 31, |
| | | 2008 | | 2007 | | 2006 |
| | | (in thousands) |
Basic | | 9,375 | | 9,297 | | 9,121 |
Effect of assumed conversion of employee and director stock options | | — | | 247 | | 319 |
| | | | | | |
Diluted | | 9,375 | | 9,544 | | 9,440 |
| | | | | | |
RECENT ACCOUNTING PRONOUCEMENTS
In April 2008, the Financial Accounting Standards Board (FASB) issued Staff Position No. FAS 142-3, or FSP FAS 142-3,“Determination of the Useful Life of Intangible Assets”, which amends the factors that should be considered in developing renewal or extension assumptions used to determine the useful life of a recognized intangible asset under FASB Statement No. 142,“Goodwill and Other Intangible Assets”.FSP FAS 142-3 allows an entity to use its own historical experience in renewing or extending similar arrangements, adjusted for specified entity-specific factors, in developing assumptions about renewal or extension used to determine the useful life of a recognized intangible asset and will be effective for fiscal years and interim periods beginning after December 15, 2008. Additional disclosures are required to enable financial statement users to assess the extent to which the expected future cash flows associated with the asset are affected by the entity’s intent and/or ability to renew or extend the arrangement. The guidance for determining the useful life of a recognized intangible asset is to be applied prospectively to intangible assets acquired after the effective date. The disclosure requirements are to be applied prospectively to all intangible assets recognized as of, and subsequent to, the effective date.
In March 2008, the FASB issued SFAS No. 161,“Disclosures about Derivative Instruments and Hedging Activities, an amendment of SFAS No. 133” (SFAS 161). SFAS 161 will require companies to disclose their objectives and strategies for using derivative instruments, whether or not their derivatives are designated as hedging instruments. The new pronouncement requires disclosure of the fair value of derivative instruments by primary underlying risk exposures (e.g., interest rate, credit, foreign exchange rate, combination of interest rate and foreign exchange rate, or overall price). It also requires detailed disclosures about the income statement impact of derivative instruments by designation as fair-value hedges, cash-flow hedges, or hedges of the foreign-currency exposure of a net investment in a foreign operation. SFAS 161 will also require disclosure of information that will enable financial statement users to understand the level of derivative activity entered into by a company. The principles of SFAS 161 may be applied on a prospective basis and are effective for financial statements issued for fiscal years and interim periods beginning after November 15, 2008. Early application is encouraged. For the Company, SFAS 161 will be effective at the beginning of its 2009 fiscal year. Management will comply with disclosure requirements subsequent to the effective date of the standard.
In December 2007, the FASB issued SFAS No. 141 (revised 2007), “Business Combinations” (SFAS 141R). SFAS 141R will significantly change the accounting for business combinations in a number of areas including the treatment of contingent consideration, contingencies, acquisition costs, in-process research and development, and restructuring costs. In addition, under SFAS 141R, changes in deferred tax asset valuation allowances and acquired income tax uncertainties in a business combination after the measurement period will impact income taxes. SFAS 141R is effective for fiscal years beginning after December 15, 2008, which is the Company’s fiscal year beginning January 1, 2009, and will impact the accounting for any business combinations entered into after the effective date.
37
BTU INTERNATIONAL, INC.
NOTES TO CONSOLIDATED FINANCIAL STATEMENTS—(Continued)
In December 2007, the FASB issued SFAS No. 160, “Non-controlling Interests in Consolidated Financial Statements, an amendment of Accounting Research Bulletin (ARB) No. 51,” which changes the accounting and reporting for minority interests. Minority interests will be re-characterized as non-controlling interests and will be reported as a component of equity separate from the parent’s equity, and purchases or sales of equity interests that do not result in a change in control will be accounted for as equity transactions. In addition, net income attributable to the non-controlling interest will be included in consolidated net income on the face of the income statement and, upon a loss of control, the interest sold, as well as any interest retained, will be recorded at fair value with any gain or loss recognized in earnings. SFAS No. 160 will apply prospectively, except for the presentation and disclosure requirements, which will apply retrospectively. SFAS No. 160 is effective for periods beginning on or after December 15, 2008 and will impact the accounting for non-controlling interests after the effective date, to the extent the company acquires the non-controlling interest.
In February 2007, the FASB issued SFAS No. 159,“The Fair Value Option for Financial Assets and Financial Liabilities-including an amendment of SFAS No. 115”. The new statement allows entities to choose, at specified election dates, to measure eligible financial assets and liabilities at fair value that are not otherwise required to be measured at fair value. If a Company elects the fair value option for an eligible item, changes in that item’s fair value in subsequent reporting periods must be recognized in current earnings. The Company is complying with SFAS No. 159. The Company does not believe the adoption of SFAS No. 159 had a material impact on the Company’s financial condition or results of operations.
In September 2006, the FASB issued SFAS No. 157, “Fair Value Measurements”(“SFAS 157”) which defines fair value, establishes a framework for measuring fair value in generally accepted accounting principles, and expands disclosures about fair value measurements. On February 12, 2008, the FASB issued FASB Staff Position (“FSP”) SFAS No. 157-2, Effective Date of SFAS No. 157. The FSP amends SFAS 157, to delay the effective date of SFAS 157 for all non-financial assets and non-financial liabilities, except those that are recognized or disclosed at fair value in the financial statements on a recurring basis (that is, at least annually) to fiscal years beginning after November 15, 2008. The adoption of FSP 157-2 is not expected to have a significant impact on our financial statements.
Reclassifications
Certain reclassifications to prior year balances have been made to conform to current year presentations.
38
BTU INTERNATIONAL, INC.
NOTES TO CONSOLIDATED FINANCIAL STATEMENTS—(Continued)
Accrued expenses at December 31, 2008 and 2007 consisted of the following (in thousands):
| | | | | | |
| | | 2008 | | 2007 |
Accrued commissions | | $ | 1,949 | | $ | 1,642 |
Accrued warranty | | | 683 | | | 638 |
Accrued income taxes | | | 607 | | | 438 |
Accrued audit | | | 361 | | | 472 |
Accrued legal | | | 280 | | | 112 |
Accrued bonus | | | 43 | | | 201 |
Accrued Atmoplas Costs | | | 600 | | | 300 |
Payroll and payroll taxes | | | 1,015 | | | 630 |
Accrued royalty | | | 178 | | | — |
Other | | | 48 | | | 59 |
| | | | | | |
| | $ | 5,764 | | $ | 4,492 |
| | | | | | |
Warranties
The Company provides standard warranty coverage for parts and labor for 12 months and special extended material only coverage on certain products. The Company estimates a reserve for anticipated warranty claims based on historical warranty claims as a percentage of revenue by product line. The reserve for warranty covers the estimated costs of material, labor and travel. Actual warranty claims incurred are charged against expense. Factors that affect the Company’s product warranty liability include, and are recorded at the time of sale, the number of installed units, the anticipated cost of warranty repairs, and historical and anticipated rates of warranty claims.
The following table reflects changes in the Company’s accrued warranty account during the fiscal years ended December 31, 2008 and 2007:
| | | | | | | | |
| | | 2008 | | | 2007 | |
| | | (In thousands) | |
Beginning balance | | $ | 638 | | | $ | 748 | |
Plus: accruals related to new sales | | | 958 | | | | 815 | |
Less: warranty claims incurred | | | (913 | ) | | | (925 | ) |
| | | | | | | | |
Ending balance | | $ | 683 | | | $ | 638 | |
| | | | | | | | |
| (3) | DEBT, CAPITAL LEASES, COMMITMENTS AND CONTINGENCIES |
On March 1, 2007, the Company entered into an amended revolving loan agreement with a bank that allows for unsecured aggregate borrowings, including letters of credit, up to a maximum of $15 million against a borrowing base of accounts receivable, inventory and fixed assets. The Company may elect to borrow at interest rates related to the bank’s prime rate or LIBOR. This loan agreement extends to December 31, 2010. At December 31, 2008, there were no borrowings outstanding under the loan agreement.
This loan agreement is subject to maintaining certain financial covenants of which the Company is, due to the Company’s reported losses in Q4 2008, not in compliance with the required rolling four quarters minimum debt coverage ratio in the loan agreement. The Company is working with the bank to receive a waiver which may require modifications, agreeable to both parties, to the provisions of the existing loan agreement.
39
BTU INTERNATIONAL, INC.
NOTES TO CONSOLIDATED FINANCIAL STATEMENTS—(Continued)
On March 30, 2006, the Company entered into a new mortgage note that is secured by our real property in Billerica, MA, in the amount of $10 million. The mortgage note requires monthly payments of $76,280, which includes interest calculated at the rate of 6.84% per annum. This mortgage note payable has a balloon payment of $6.8 million due and payable at maturity on December 23, 2015. The mortgage note had an outstanding balance at December 31, 2008 of approximately $9.3 million.
Long-Term Debt at December 31, 2008 and 2007 consisted of the following (in thousands):
| | | | | | |
| | | 2008 | | 2007 |
Mortgage note payable, interest rate of 6.84% | | $ | 9,277 | | $ | 9,538 |
Capital lease obligations, interest rate of 6.75% | | | 1 | | | 6 |
| | | | | | |
| | | 9,278 | | | 9,544 |
Less—current maturities | | | 290 | | | 277 |
| | | | | | |
| | $ | 8,988 | | $ | 9,267 |
| | | | | | |
The capital lease obligations relate to one equipment lease used in the operation of the business. Under the terms of the debt, the minimum repayments of long-term debt, capital and operating lease obligations by year are as follows (in thousands):
| | | | | | | | | | | | |
| | | Mortgage | | Capital
Leases | | Operating
Leases | | Total |
2009 | | $ | 289 | | $ | 1 | | $ | 341 | | $ | 631 |
2010 | | | 310 | | | — | | | 184 | | | 494 |
2011 | | | 332 | | | — | | | — | | | 332 |
2012 | | | 356 | | | — | | | — | | | 356 |
2013 | | | 381 | | | — | | | — | | | 381 |
Thereafter | | | 7,609 | | | — | | | — | | | 7,609 |
| | | | | | | | | | | | |
| | $ | 9,277 | | $ | 1 | | $ | 525 | | $ | 9,803 |
| | | | | | | | | | | | |
The Company has operating leases for its Shanghai manufacturing operations that allow extensions. Rent expense was approximately $218,000 in 2008 and $195,000 in 2007. As of December 31, 2008, the future minimum lease commitment for this facility is $22,000 through January 2009.
The Company conducts its UK operations in a facility that is under a long-term operating lease expiring in March 2010. Rent expense under this lease was approximately $181,000 in 2008, $248,000 in 2007, and $230,000 in 2006. As of December 31, 2008, the future minimum lease commitment for this facility is $227,000, payable as follows: $181,000 for 2009 and $46,000 for 2010.
The Company is a party to various claims arising in the normal course of business. Management believes the resolution of these matters will not have a material impact on the Company’s results of operations or financial condition.
40
BTU INTERNATIONAL, INC.
NOTES TO CONSOLIDATED FINANCIAL STATEMENTS—(Continued)
The following table shows the amounts (in thousands) and percentages of the Company’s revenues by geographic region, for the last three years:
| | | | | | | | | | | | | | | | | | |
| | | 2008 | | | | | 2007 | | | | | 2006 | | | |
United States | | $ | 16,375 | | 23 | % | | $ | 11,216 | | 17 | % | | $ | 13,714 | | 18 | % |
Europe and Near East | | | 12,408 | | 17 | % | | | 11,856 | | 19 | % | | | 19,152 | | 24 | % |
Asia Pacific | | | 40,401 | | 56 | % | | | 35,729 | | 56 | % | | | 38,083 | | 49 | % |
Other Americas | | | 3,082 | | 4 | % | | | 4,922 | | 8 | % | | | 7,340 | | 9 | % |
| | | | | | | | | | | | | | | | | | |
| | $ | 72,266 | | | | | $ | 63,723 | | | | | $ | 78,289 | | | |
| | | | | | | | | | | | | | | | | | |
The following table shows the amounts (in thousands) of the Company’s tangible long-lived assets by geographic region, at December 31, 2008 and 2007:
| | | | | | |
| | | December 31,
2008 | | December 31,
2007 |
United States | | $ | 6,132 | | $ | 5,001 |
Asia Pacific | | | 754 | | | 535 |
| | | | | | |
| | $ | 6,886 | | $ | 5,536 |
| | | | | | |
| (5) | CONCENTRATION OF CREDIT RISK AND SIGNIFICANT CUSTOMERS |
SFAS No. 105, “Disclosure of Information about Financial Instruments with Off-Balance-Sheet Risk and Financial Instruments with Concentrations of Credit Risk”, requires disclosure of any significant off-balance-sheet and credit risk concentrations. The Company maintains the majority of its cash and cash equivalent balances with one financial institution who invests the funds in U.S. Treasury Bills with terms not to exceed 90 days.
The principal financial instrument that potentially subjects the Company to concentrations of credit risk is accounts receivable. The Company’s revenues are primarily derived from customers in the electronics and alternative energy manufacturing industries who are not required to provide collateral for amounts owed to the Company. The Company’s customers are dispersed over a wide-geographic area and are subject to periodic review under the Company’s credit review process. The Company does not believe that it is subject to any unusual credit risks, other than the normal level of risk attendant to operating its business.
Concentration of credit risk with respect to accounts receivable is limited to certain customers to whom the Company makes substantial sales. To reduce its credit risk, the Company routinely assesses the financial strength of its customers. The Company maintains an allowance for potential credit losses, but historically has not experienced any losses in excess of the loss allowance related to individual customers or groups of customers in any particular industry or geographic area.
Two customers represented 5.1% of revenue in 2008, 8% of revenue in 2007 and 6% of revenue in 2006. As of December 31, 2008, there was one customer that individually accounted for 11.6% of accounts receivable. As of December 31, 2007, there was one customer that individually accounted for 18% of accounts receivable.
41
BTU INTERNATIONAL, INC.
NOTES TO CONSOLIDATED FINANCIAL STATEMENTS—(Continued)
The components of income (loss) before provision (benefit) for income taxes are as follows (in thousands):
| | | | | | | | | | | |
| | | Years Ended December 31, |
| | | 2008 | | | 2007 | | | 2006 |
Domestic | | $ | (3,050 | ) | | $ | (275 | ) | | $ | 3,588 |
Foreign | | | 3,031 | | | | 2,929 | | | | 5,823 |
| | | | | | | | | | | |
Total | | $ | (19 | ) | | $ | 2,654 | | | $ | 9,411 |
| | | | | | | | | | | |
For the years ended December 31, 2008, 2007 and 2006, the Company’s provision for income taxes were as shown below (in thousands):
| | | | | | | | | | | | | | | |
| | | Federal | | | State | | Foreign | | | Total | |
December 31, 2008 | | | | | | | | | | | | | | | |
Current | | $ | — | | | $ | — | | $ | 923 | | | $ | 923 | |
Deferred | | $ | 207 | | | $ | — | | $ | (53 | ) | | $ | 154 | |
| | | | | | | | | | | | | | | |
| | $ | 207 | | | $ | — | | $ | 870 | | | $ | 1,077 | |
| | | | | | | | | | | | | | | |
December 31, 2007 | | | | | | | | | | | | | | | |
Current | | $ | — | | | $ | — | | $ | 706 | | | $ | 706 | |
Deferred | | $ | — | | | $ | — | | $ | — | | | $ | — | |
| | | | | | | | | | | | | | | |
| | $ | — | | | $ | — | | $ | 706 | | | $ | 706 | |
| | | | | | | | | | | | | | | |
December 31, 2006 | | | | | | | | | | | | | | | |
Current | | $ | 174 | | | $ | — | | $ | 221 | | | $ | 395 | |
Deferred | | $ | (206 | ) | | $ | — | | $ | — | | | $ | (206 | ) |
| | | | | | | | | | | | | | | |
| | $ | (32 | ) | | $ | — | | $ | 221 | | | $ | 189 | |
| | | | | | | | | | | | | | | |
The differences between the statutory United States federal income tax rate of 34% and the Company’s effective tax rate are as follows (in thousands):
| | | | | | | | | | | | |
| | | Years Ended December 31, | |
| | | 2008 | | | 2007 | | | 2006 | |
Provision (benefit) at Statutory Rate | | $ | (6 | ) | | $ | 902 | | | $ | 3,200 | |
Foreign Tax Rate Differential | | | (656 | ) | | | (405 | ) | | | (1,442 | ) |
Change in Valuation Allowance | | | 1,859 | | | | 41 | | | | (1,356 | ) |
Non-deductible & Other | | | (120 | ) | | | 168 | | | | (213 | ) |
| | | | | | | | | | | | |
Net Provision | | $ | 1,077 | | | $ | 706 | | | $ | 189 | |
| | | | | | | | | | | | |
42
BTU INTERNATIONAL, INC.
NOTES TO CONSOLIDATED FINANCIAL STATEMENTS—(Continued)
The components of the deferred tax assets at December 31, 2008 and 2007 are as follows (in thousands):
| | | | | | |
| | | 2008 | | | 2007 | |
Depreciation | | 175 | | | 162 | |
Inventory Reserves | | 155 | | | 197 | |
Accruals and Other | | 2,012 | | | 855 | |
Intangible Assets | | 290 | | | 156 | |
Federal NOL | | 1,812 | | | 2,170 | |
State NOL | | 488 | | | 502 | |
Federal Credits | | 1,463 | | | 593 | |
| | | | | | |
Total Deferred Tax Assets | | 6,341 | | | 4,635 | |
Valuation Allowance | | (6,288 | ) | | (4,429 | ) |
| | | | | | |
Net Deferred Taxes | | 53 | | | 206 | |
The Company has federal and state net operating loss carry forwards of approximately $7,607,000 that expire between 2009 and 2024, of which $2,278,000 relates to excess tax deductions from share based payments, the tax benefit of which will be recorded as an increase in additional paid in capital when the deduction reduces current taxes payable. The ability of the Company to fully realize deferred tax assets in future years is contingent upon its success in generating sufficient levels of taxable income to use the deductions underlying the assets. After an assessment of all available evidence, including historical and projected operating trends, except for the deferred tax assets of $53,000 recognized at its foreign subsidiary, the company recorded a full valuation allowance to offset all of the Company’s deferred tax assets as it is currently considered more likely than not that the associated benefit will not be realized. Deferred tax assets at December 31, 2008 and 2007 are recorded in other assets.
Undistributed earnings of the Company’s foreign subsidiaries amounted to approximately $16,912,000 at December 31, 2008. The Company’s policy is that its undistributed foreign earnings are indefinitely reinvested and, accordingly, no related provision for U.S. federal and state income taxes has been provided. The amount of taxes attributable to these undistributed earnings is not practicably determinable.
The Company adopted the provisions of the FASB Interpretation No. 48 (FIN 48), “Accounting for Uncertainty in Income Taxes”, on January 1, 2007. In this regard, an uncertain tax position represents the Company’s expected treatment of a tax position taken in a filed tax return, or planned to be taken in a future tax return, that has not been reflected in measuring income tax expense for financial reporting purposes. As a result of applying the provisions of FIN 48, there was no cumulative effect on retained earnings.
The Company’s major tax jurisdictions include the United States and China. The Company is no longer subject to U.S. state or local and non-U.S. income tax examinations by tax authorities in its major jurisdictions for years before 2005, except to the extent of net operating loss and tax credit carryforwards from those years. The Company’s policy is to recognize interest and penalties accrued on any unrecognized tax benefits as a component of income tax expense. There is no interest or penalties accrued at December 31, 2008.
43
BTU INTERNATIONAL, INC.
NOTES TO CONSOLIDATED FINANCIAL STATEMENTS—(Continued)
The following table summarizes the activity related to the Company’s unrecognized tax benefits:
| | | |
| | | Liability for
unrecognized
tax benefits |
Balance at January 1, 2008 | | $ | 0 |
Increases related to current year tax positions | | | 75 |
Balance at December 31, 2008 | | $ | 75 |
The unrecognized tax benefits at December 31, 2008, if recognized, would reduce the Company’s annual effective tax rate. The Company does not expect any significant increases or decreases for uncertain tax positions during the next 12 months.
The Company has management incentive and profit sharing plans for its executives and all of its employees. These plans provide for bonuses upon the attainment of certain financial targets. Under these plans, $163,000, $261,000 and $668,000 was expensed in 2008, 2007 and 2006, respectively.
The Company has a deferred 401(k) contribution plan that is available to cover all domestic employees of the Company. Subject to non-discriminatory restrictions on highly compensated employees, participants can voluntarily contribute a percentage of their compensation up to the plan limits, and the Company, at its discretion, may match this contribution up to a stipulated percentage. The Company’s expense under the plan was $209,000, $184,000 and $194,000 for the years ended December 31, 2008, 2007 and 2006, respectively.
| (8) | STOCK OPTION AND PURCHASE PLANS |
On January 1, 2006, the Company adopted the provisions of SFAS No. 123R, “Share-Based Payment” (“SFAS 123R”). This statement establishes standards for accounting for transactions in which an entity exchanges its equity instruments for goods or services. The statement focuses primarily on accounting for transactions in which an entity obtains employee services in share-based payment transactions, such as the options issued under the Company’s Stock Option Plans. The statement provides for, and the Company has elected to adopt the standard, using the modified prospective application under which compensation cost is recognized on or after the required effective date for the fair value of all future share-based award grants and for the portion of outstanding awards at the date of adoption of this statement for which the requisite service has not been rendered, based on the grant-date fair value of those awards calculated under SFAS No. 123, “Accounting for Stock-Based Compensation”,for pro forma disclosures. The Company’s stock option compensation expense was $1,182,000 and $744,000 for the years ended December 31, 2008 and 2007, respectively. We expense share-based compensation under the straight-line method.
The fair value of each option is estimated on the date of grant using the Black-Scholes option-pricing model. This model incorporates certain assumptions for inputs including a risk-free market interest rate, expected dividend yield of the underlying common stock, expected option life and expected volatility in the market value of the underlying common stock. The Company is also required to estimate forfeitures at the time of grant and revise those estimates in subsequent periods if actual forfeitures differ from those estimates. Historical data was used to estimate pre-vesting forfeitures and record stock-based compensation expense only for those awards that are expected to vest. Accordingly, awards ultimately expected to vest have been reduced for annualized estimated
44
BTU INTERNATIONAL, INC.
NOTES TO CONSOLIDATED FINANCIAL STATEMENTS—(Continued)
forfeitures of 20%, 20% and 20% for the years ended December 31, 2008, 2007, and 2006 respectively. We used the following assumptions for options issued during the years ended December 31, 2008 and December 31, 2007 respectively:
| | | | | | |
| | | Twelve Months Ended | |
Calculation of Fair Values—Assumptions Used: | | Dec. 31, 2008 | | | Dec. 31, 2007 | |
Expected Volatility | | 65.5 | % | | 65.0 | % |
Expected Life | | 5 | | | 5 | |
Risk-Free Interest Rate | | 2.62 | % | | 4.79 | % |
Expected Dividend Yield | | None | | | None | |
Expected volatilities are based on the weighted average historical volatility of the Company’s common stock for the expected life of the option. The Company had significant historical data to help evaluate the expected lives of options in developing its assumption. The risk-free interest rate is based upon quoted market yields for United States Treasury debt securities. The expected dividend yield is based upon the Company’s history of having never issued a dividend and management’s current expectation of future action surrounding dividends.
The Company has two stock option plans for employees, the 1993 Equity Incentive Plan (1993 Plan), which expired in 2003 with 254,791 unissued options, and the 2003 Equity Incentive Plan (2003 Plan). These plans allow for the award of stock and stock options to employees, directors and consultants. Under the terms of the plans, other stock awards can also be granted at the discretion of the Company’s Board of Directors. The Company also has two stock option plans for non-employee directors, the 1989 Stock Plan for Directors (1989 Plan) and the 1998 Stock Option Plan for Non-Employee Directors (1998 Plan). Under each plan, the exercise price of the options is not less than the fair market value at the date of the grant. Options expire from a minimum of two years to a maximum of ten years from the date of the grant.
In May 2003, the shareholders approved the 2003 Plan, which allows up to 700,000 shares to be awarded (plus the addition of up to 300,000 options that were unissued or forfeited under the expired 1993 Plan). Also in May 2003, the shareholders approved an amendment to add 70,000 shares to the 1998 Plan.
In May 2008, the shareholders approved an amendment to add 450,000 shares to the 2003 Plan. Also in May 2008, the shareholders approved an amendment to add 50,000 shares to the 1998 Plan.
Shares available for future stock option grants, pursuant to these plans, were 615,364 at December 31, 2008, 462,989 at December 31, 2007, and 766,801 at December 31, 2006.
45
BTU INTERNATIONAL, INC.
NOTES TO CONSOLIDATED FINANCIAL STATEMENTS—(Continued)
A summary of all stock option activity for the years ended December 31, 2008, 2007 and 2006 is as follows:
| | | | | | | | | | | | | | | | | | |
| | | 2008 | | 2007 | | 2006 |
| | | Shares | | | Weighted-
Average
Exercise
Price | | Shares | | | Weighted-
Average
Exercise
Price | | Shares | | | Weighted-
Average
Exercise
Price |
Outstanding at beginning of year | | 756,466 | | | $ | 9.63 | | 588,237 | | | $ | 6.66 | | 525,378 | | | $ | 2.99 |
Granted | | 593,745 | | | $ | 8.86 | | 312,450 | | | $ | 12.10 | | 210,000 | | | $ | 13.34 |
Exercised | | (34,556 | ) | | $ | 3.37 | | (135,584 | ) | | $ | 2.56 | | (132,179 | ) | | $ | 2.91 |
Forfeited | | (246,120 | ) | | $ | 10.66 | | (8,638 | ) | | $ | 10.23 | | (14,962 | ) | | $ | 2.89 |
| | | | | | | | | | | | | | | | | | |
Outstanding at end of year | | 1,069,535 | | | $ | 9.17 | | 756,466 | | | $ | 9.63 | | 588,237 | | | $ | 6.66 |
| | | | | | | | | | | | | | | | | | |
Exercisable at end of year | | 324,685 | | | $ | 7.89 | | 212,391 | | | $ | 5.90 | | 219,887 | | | $ | 2.87 |
| | | | | | | | | | | | | | | | | | |
At December 31, 2008, the outstanding options have exercise prices ranging from $1.86 to $16.70 and a weighted average remaining contractual life of 5 years. The aggregate intrinsic value of options exercised during the year ended December 31, 2008 was $225,526. The total number of in-the-money options that were exercisable as of December 31, 2008 was 145,584.
The following table summarizes information for options outstanding and for options exercisable at December 31, 2008:
| | | | | | | | | | | | |
| | | | | Outstanding | | Exercisable |
Range of Prices | | Number | | Weighted
Remain
Life | | Weighted
Exercise
Price | | Number | | Weighted
Exercise
Price |
1.86 to 2.00 | | 30,087 | | 0.98 | | $ | 1.86 | | 30,087 | | $ | 1.86 |
2.53 to 3.60 | | 151,947 | | 2.64 | | $ | 3.21 | | 115,497 | | $ | 3.26 |
4.14 to 9.09 | | 162,601 | | 6.17 | | $ | 5.09 | | 22,101 | | $ | 5.56 |
9.45 to 12.61 | | 512,530 | | 5.86 | | $ | 11.93 | | 64,580 | | $ | 11.88 |
12.83 to 16.70 | | 212,370 | | 4.26 | | $ | 13.37 | | 92,420 | | $ | 13.40 |
| | | | | | | | | | | | |
| | 1,069,535 | | 4.99 | | $ | 9.17 | | 324,685 | | $ | 7.89 |
| | | | | | | | | | | | |
The aggregate intrinsic value of $184,424 of outstanding options included in the preceding table that are below the year end market price represents the total pre-tax intrinsic value, based on the Company’s closing stock price of $4.00 as of December 31, 2008 which would have been received by the option holders had all in the money option holders exercised their options as of that date. As of December 31, 2008, there was $3,128,718 of total unrecognized compensation cost related to non-vested options granted under all of the Company’s option plans. That cost is expected to be recognized over a weighted average period of 3 years. The total fair value of shares vested during the year ended December 31, 2008 was $942,813.
46
BTU INTERNATIONAL, INC.
NOTES TO CONSOLIDATED FINANCIAL STATEMENTS—(Continued)
A summary of the status of the Company’s non-vested options as of December 31, 2008 and December 31, 2007, is presented below:
| | | | | | | | | | | | |
| | | December 31, 2008 | | December 31, 2007 |
Nonvested Activity: | | Shares | | | Weighted
Fair
Value | | Shares | | | Weighted
Fair
Value |
Balance—Beginning | | 544,075 | | | $ | 6.33 | | 368,350 | | | $ | 4.96 |
Granted | | 593,745 | | | $ | 5.17 | | 312,450 | | | $ | 7.95 |
Vested | | (165,850 | ) | | $ | 5.68 | | (128,087 | ) | | $ | 4.13 |
Non-Vested Forfeited | | (227,120 | ) | | $ | 6.60 | | (8,638 | ) | | $ | 14.50 |
| | | | | | | | | | | | |
Nonvested | | 744,850 | | | $ | 5.49 | | 544,075 | | | $ | 6.33 |
| | | | | | | | | | | | |
During 2005, the Company granted 20,000 shares of restricted stock to various employees. The fair value of the shares at the date of the grant was $60,000 or $3.00 per share. This stock vests over a four-year term. The Company has recorded a compensation charge of $15,000, $15,000, and $15,000 in 2008, 2007 and 2006, respectively, related to this grant. As of December 31, 2008, there was $3,750 of unrecognized compensation costs related to restricted stock grants. These grants have a remaining life of 0.2 years.
A summary of the status of the Company’s non-vested restricted stock as of December 31, 2008 and December 31, 2007, is presented below:
| | | | | | |
Nonvested Restricted Stock: | | December 31,
2008 | | | December 31,
2007 | |
| | Shares | | | Shares | |
Balance—Beginning | | 10,000 | | | 15,000 | |
Granted | | 0 | | | 0 | |
Vested | | (5,000 | ) | | (5,000 | ) |
Forfeited | | (1,500 | ) | | 0 | |
| | | | | | |
Nonvested | | 3,500 | | | 10,000 | |
| | | | | | |
The Company has an Employee Stock Purchase Plan. Under the terms of the plan, employees are entitled to purchase shares of common stock at the lower of 85% of fair market value at either the beginning or the end of each six-month option period. A total of 500,000 shares have been reserved for issuance under this plan, of which 56,552 remain available at December 31, 2008. During 2008, a total of 20,051 shares were purchased at prices ranging from $3.40 to $10.05 per share.
| (9) | DISCLOSURES ABOUT THE FAIR VALUE OF FINANCIAL INSTRUMENTS |
The following methods and assumptions were used to estimate the fair value of each class of financial instrument for which it is practicable to estimate that value.
On January 1, 2008, the Company adopted SFAS No. 157, “Fair Value Measurements for Financial Assets and Liabilities”. SFAS No. 157 defines fair value, establishes a framework for measuring fair value, and expands disclosures about fair value measurements. SFAS No. 157 applies to reported balances that are required or permitted to be measured at fair value under existing accounting pronouncements; accordingly, the standard does not require any new fair value measurements of reported balances.
47
BTU INTERNATIONAL, INC.
NOTES TO CONSOLIDATED FINANCIAL STATEMENTS—(Continued)
SFAS No. 157 emphasizes that fair value is a market-based measurement, not an entity-specific measurement. Therefore, a fair value measurement should be determined based on the assumptions that market participants would use in pricing the asset or liability. As a basis for considering market participant assumptions in fair value measurements, SFAS No. 157 establishes a fair value hierarchy that distinguishes between market participant assumptions based on market data obtained from sources independent of the reporting entity (observable inputs that are classified within Levels 1 and 2 of the hierarchy) and the reporting entity’s own assumptions about market participant assumptions (unobservable inputs classified within Level 3 of the hierarchy). The following methods and assumptions were used to estimate the value of each class of financial instruments for which it is practical to estimate that value.
a. Cash and Cash Equivalents—The carrying amount of these assets on the Company’s Consolidated Balance Sheets approximates their fair value because of the short maturities of these instruments.
b. Receivables, Payables and Accruals—The recorded amounts of financial instruments, including accounts receivable, accounts payable, and accrued liabilities, approximate their fair value because of the short maturity of these instruments.
c. Long-term Debt and Capital Lease Obligations—The fair value of long-term indebtedness as of December 31, 2008 and 2007 was approximately $8,988,000 and $9,267,000, respectively, based on the prevailing cost of capital for the Company as of each date. The current market rate approximates the rate of the mortgage note payable of 6.84%. See footnote 3 for additional details on our long-term debt obligations
d. Foreign Currency Derivative Transactions—During the year ended December 31, 2007, the company began to manage its foreign exchange risk through the use of derivative financial instruments. These financial instruments serve to protect cash flow against the impact of the translation into Chinese RMB of foreign exchange denominated transactions. As of December 31, 2007, the company had a 90-day forward currency contract denominated in U.S. dollars with a notional value of $12.0 million. At December 31, 2007, the fair market value of the outstanding forward exchange contract was approximately $31,000, which was recorded as a foreign exchange gain on the Company’s consolidated statement of operations. At December 31, 2008, the Company did not have any exposure to Foreign Currency Derivative Transactions.
(10) SEGMENT REPORTING
Segments are defined as components of an enterprise about which separate financial information is available that is evaluated regularly by the chief operating decision-maker in deciding how to allocate resources and in assessing performance. The Company operates as a single business segment called thermal processing capital equipment.
The thermal processing capital equipment segment consists of the designing, manufacturing, selling and servicing of thermal processing equipment and related process controls for use in the electronics, alternative energy, automotive and other industries. This business segment includes the supply of solder reflow systems used for surface mount applications in printed circuit board assembly. Thermal processing equipment is used in: low temperature curing/encapsulation; hybrid integrated circuit manufacturing; integrated circuit packaging and sealing; and processing multi-chip modules. In addition, the thermal process equipment is used for solar cell processing, sintering nuclear fuel for commercial power generation, as well as brazing and the sintering of ceramics and powdered metals, and the deposition of precise thin film coatings. The business segment’s customers are multinational original equipment manufacturers and contract manufacturing companies.
48
(11) EXECUTIVE RETIREMENT
Executive Retirement
After returning from retirement to his former duties as the Company’s President and Chief Executive Officer, Mr. Paul J. van der Wansem, in 2005, entered into an agreement with the Company which settled the method and timing of payment for the outstanding compensation of $561,000 due Mr. van der Wansem by the Company under the consulting service provisions of his executive retirement agreement of 2002. The execution of this settlement cancels all the Company’s obligations under the consulting portion of the executive retirement agreement. In the 2005 contract, the agreed method of payment and timing was set at half of the value to be paid immediately in the form of the Company’s common stock at market value with the remaining half to be paid no later than June 2007. The second half of the amount due under the 2005 agreement was paid in 2007.
(12) ACQUISITIONS
On March 17, 2006, the Company acquired the product lines, trademarks and other related assets of Radiant Technology Corporation (RTC). The purchase price for this acquisition was as follows: 1) $500,000 in cash and 100,000 shares of the Company’s common stock, of which 30,000 shares were contingent upon RTC’s successful achievement of certain non-financial performance criteria; and 2) Royalty payments on any products using the RTC technology manufactured by the Company for a period of 4 years. In addition, the parties entered into a supply agreement under which RTC will continue to manufacture its products for distribution by the Company after the closing which is now terminated.
In the second quarter of 2007, it was determined that, of the additional 30,000 shares of stock that were contingent upon RTC’s successful achievement of certain non-financial performance criteria, 21,000 shares had been earned. On May 3, 2007, 18,000 shares were issued and the additional 3,000 shares were issued on July 16, 2007.
On May 31, 2006, the Company acquired the assets and intellectual property of AtmoPlas, a division of Dana Corporation. The purchase price was as follows: 1) $474,564 in cash; and 2) minimum royalty payments on any products using AtmoPlas technology manufactured by the Company and sold during the third through seventh years after the acquisition where the minimum royalties in years three and four are not less than $300,000 per year.
49
REPORT OF INDEPENDENT REGISTERED PUBLIC ACCOUNTING FIRM
To the Shareholders and Board of Directors of BTU International, Inc.:
We have audited the accompanying consolidated balance sheets of BTU International, Inc. and subsidiaries (the Company) as of December 31, 2008, and the related consolidated statements of operations, stockholders’ equity and comprehensive income (loss), and cash flows for the year then ended. In connection with our audit of the consolidated financial statements we also have audited the accompanying financial statement schedule. We have also audited the Company’s internal control over financial reporting as of December 31, 2008, based on criteria established in Internal Control—Integrated Framework issued by the Committee of Sponsoring Organizations of the Treadway Commission (COSO). The Company’s management is responsible for these consolidated financial statements and accompanying financial statement schedule, for maintaining effective internal control over financial reporting and for its assessment of the effectiveness of internal control over financial reporting, included in the accompanying Management’s Annual Report on Internal Control over Financial Reporting appearing under Item 9A2 of the Company’s December 31, 2008 annual report on Form 10-K. Our responsibility is to express an opinion on the Company’s consolidated financial statements and accompanying financial statement schedule and an opinion on the Company’s internal control over financial reporting based on our audit.
We conducted our audit in accordance with the standards of the Public Company Accounting Oversight Board (United States). Those standards require that we plan and perform the audit to obtain reasonable assurance about whether the financial statements are free of material misstatement and whether effective internal control over financial reporting was maintained in all material respects. Our audit of the consolidated financial statements included examining, on a test basis, evidence supporting the amounts and disclosures in the financial statements, assessing the accounting principles used and significant estimates made by management, and evaluating the overall financial statement presentation. Our audit of internal control over financial reporting included obtaining an understanding of internal control over financial reporting, assessing the risk that a material weakness exists, and testing and evaluating the design and operating effectiveness of internal control based on the assessed risk. Our audit also included performing such other procedures as we considered necessary in the circumstances. We believe that our audits provide a reasonable basis for our opinions.
A company’s internal control over financial reporting is a process designed to provide reasonable assurance regarding the reliability of financial reporting and the preparation of financial statements for external purposes in accordance with generally accepted accounting principles. A company’s internal control over financial reporting includes those policies and procedures that (1) pertain to the maintenance of records that, in reasonable detail, accurately and fairly reflect the transactions and dispositions of the assets of the company; (2) provide reasonable assurance that transactions are recorded as necessary to permit preparation of financial statements in accordance with generally accepted accounting principles, and that receipts and expenditures of the company are being made only in accordance with authorizations of management and directors of the company; and (3) provide reasonable assurance regarding prevention or timely detection of unauthorized acquisition, use, or disposition of the company’s assets that could have a material effect on the financial statements.
Because of its inherent limitations, internal control over financial reporting may not prevent or detect misstatements. Also, projections of any evaluation of effectiveness to future periods are subject to the risk that controls may become inadequate because of changes in conditions, or that the degree of compliance with the policies or procedures may deteriorate.
A material weakness is a deficiency, or a combination of deficiencies, in internal control over financial reporting, such that there is a reasonable possibility that a material misstatement of the company’s annual or interim financial statements will not be prevented or detected on a timely basis. Material weaknesses related to the Company having an insufficient number of accounting personnel with an appropriate level of accounting knowledge and experience, and the Company’s review of intercompany account reconciliations and of intercompany inventory receipts and coding of related invoices to the appropriate intercompany payable accounts were identified and included in management’s assessment.
50
These material weaknesses were considered in determining the nature, timing, and extent of audit tests applied in our audit of the 2008 consolidated financial statements.
In our opinion, the consolidated financial statements referred to above present fairly, in all material respects, the financial position of BTU International, Inc. and subsidiaries as of December 31, 2008, and the results of their operations and their cash flows for the year then ended, in conformity with U.S. generally accepted accounting principles. Also, in our opinion, the related financial statement schedule, when considered in relation to the basic consolidated financial statements taken as a whole, presents fairly, in all material respects, the information set forth therein.
Also in our opinion, because of the effect of the aforementioned material weaknesses on the achievement of the objectives of the control criteria, the Company has not maintained effective internal control over financial reporting as of December 31, 2008, based on criteria established in Internal Control—Integrated Framework issued by COSO.
/s/ KPMG LLP
Boston, Massachusetts
March 16, 2009
51
REPORT OF INDEPENDENT REGISTERED PUBLIC ACCOUNTING FIRM
To the Shareholders and Board of Directors of BTU International, Inc.:
We have audited the accompanying consolidated balance sheet of BTU International, Inc. (a Delaware Corporation) and subsidiaries (the Company) as of December 31, 2007, and the related consolidated statements of operations, stockholders’ equity, comprehensive income, and cash flows for the years ended December 31, 2007 and 2006. We also have audited the financial statement schedule listed in the accompanying index appearing under Item 15(a)(2). These consolidated financial statements are the responsibility of the Company’s management. Our responsibility is to express an opinion on these consolidated financial statements based on our audits.
We conducted our audits in accordance with the standards of the Public Company Accounting Oversight Board (United States). Those standards require that we plan and perform the audits to obtain reasonable assurance about whether the financial statements are free of material misstatement. Our audits of the financial statements included examining, on a test basis, evidence supporting the amounts and disclosures in the financial statements, assessing the accounting principles used and significant estimates made by management, and evaluating the overall financial statement presentation. We believe that our audits provide a reasonable basis for our opinion.
In our opinion, the consolidated financial statements referred to above present fairly, in all material respects, the consolidated financial position of the Company as of December 31, 2007, and the consolidated results of their operations and their cash flows for the years ended December 31, 2007 and 2006, in conformity with accounting principles generally accepted in the United States of America. In addition, in our opinion, the financial statement schedule listed in the accompanying index appearing under Item 15(a)(2) presents fairly, in all material respects, the information set forth therein when read in conjunction with the related consolidated financial statements.

VITALE, CATURANO & COMPANY, P.C.
March 14, 2008
Boston, Massachusetts
52
| ITEM 9. | CHANGES IN AND DISAGREEMENTS WITH ACCOUNTANTS ON ACCOUNTING AND FINANCIAL DISCLOSURE. |
None.
| ITEM 9A. | CONTROLS AND PROCEDURES |
1. Evaluation of Disclosure Controls and Procedures
The Company maintains disclosure controls and procedures that are designed to ensure that information required to be disclosed in the Company’s Exchange Act reports is recorded, processed, summarized and reported within the time periods specified in the SEC’s rules and forms, and that such information is accumulated and communicated to the Company’s management, including its Chief Executive Officer and Chief Accounting Officer, as appropriate, to allow timely decisions regarding required disclosure. In designing and evaluating the disclosure controls and procedures, management recognizes that any controls and procedures, no matter how well designed and operated, can provide only reasonable assurance of achieving the desired control objectives, and management necessarily is required to apply its judgment in evaluating the cost-benefit relationship of possible controls and procedures. As described below under “Management’s Annual Report on Internal Control over Financial Reporting,” material weaknesses were identified in our internal control over financial reporting related to the Company having an insufficient number of accounting personnel with an appropriate level of accounting knowledge and experience to prepare its financial statements in a timely and accurate manner, and the Company’s review of intercompany account reconciliations and of intercompany inventory receipts and coding of related invoices to the appropriate intercompany payable accounts was ineffective.
The Company’s Management carried out an evaluation, under the supervision and with the participation of the Chief Executive Officer and the Chief Accounting Officer, of the effectiveness of the design and operation of the Company’s disclosure controls and procedures (as such term is defined in Rules 13a-15(e) and 15d-15(e) promulgated under the Securities Exchange Act of 1934) as of December 31, 2008, pursuant to the evaluation of these controls and procedures required by Rule 13a-15 of the Securities Exchange Act of 1934.
Based upon that evaluation, Management concluded based on the aforementioned material weaknesses as of the end of the period covered by this Annual Report on Form 10-K that our disclosure controls and procedures did not operate effectively to ensure that information required to be disclosed by us in the reports we file or submit under the Exchange Act is recorded, processed, summarized and reported within the time periods specified in the Security and Exchange Commissions rules and forms. Notwithstanding the ineffectiveness of our disclosure controls and procedures, we believe the consolidated financial statements present fairly, in all material respects, our financial position, results of operations, and cash flows as of December 31, 2008 and 2007 and for the three years ended December 31, 2008, December 31, 2007 and December 31, 2006.
2. Management’s Annual Report on Internal Control over Financial Reporting
The Management of the Company is responsible for establishing and maintaining adequate internal control over its financial reporting. The Company’s internal control over financial reporting is a process designed under the supervision of the Company’s Chief Executive Officer and Chief Accounting Officer to provide reasonable assurance regarding the reliability of financial reporting and the preparation of the Company’s financial statements for external reporting purposes in accordance with U.S. generally accepted accounting principles.
A company’s internal control over financial reporting includes those policies and procedures that (i) pertain to the maintenance of records that, in reasonable detail, accurately and fairly reflect the transactions and dispositions of the assets of the company; (ii) provide reasonable assurance that transactions are recorded as necessary to permit preparation of consolidated financial statements in accordance with generally accepted accounting principles, and that receipts and expenditures of the company are being made only in accordance with authorizations of management and directors of the company; and (iii) provide reasonable assurance regarding
53
prevention or timely detection of unauthorized acquisition, use, or disposition of the company’s assets that could have a material effect on the consolidated financial statements.
Because of its inherent limitations, internal control over financial reporting may not prevent or detect misstatements. Also, projections of any evaluation of effectiveness to future periods are subject to the risk that controls may become inadequate because of changes in conditions, or that the degree of compliance with the policies or procedures may deteriorate.
A material weakness is a deficiency, or a combination of deficiencies, in internal control over financial reporting, such that there is a reasonable possibility that a material misstatement of the Company’s annual or interim financial statements will not be prevented or detected on a timely basis.
The Company’s Management assessed the effectiveness of the Company’s internal control over financial reporting as of December 31, 2008, based on the criteria set forth by the Committee of Sponsoring Organizations of the Treadway Commission (COSO) in “Internal Control—Integrated Framework.” Based on that evaluation, material weaknesses were identified in the Company’s internal control over financial reporting as follows:
| | • | | The Company had an insufficient number of accounting personnel with the appropriate level of accounting knowledge and experience to prepare its financial statements in a timely and accurate manner. This material weakness resulted in more than a remote likelihood that a material misstatement of the Company’s annual or interim financial statements would not be prevented or detected. |
| | • | | The Company’s review of intercompany account reconciliations and of intercompany inventory receipts and coding of related invoices to the appropriate intercompany payable accounts was ineffective. As a result, there were errors in the inventory balances and intercompany payable accounts in the preliminary financial statements that were corrected prior to issuance of the Company’s financial statements. |
As a result of the aforementioned material weaknesses, Management concluded that the Company’s internal control over financial reporting was not effective as of December 31, 2008 based on the criteria set forth in the COSO framework.
Our independent registered public accounting firm, KPMG LLP, has audited the Company’s consolidated financial statements and the effectiveness of the Company’s internal control over financial reporting as of December 31, 2008. Their report appears in this Annual Report on Form 10-K.
3. Changes in Internal Control over Financial Reporting
There were no changes in our internal control over financial reporting that occurred during the quarter ended December 31, 2008 that have materially affected, or are reasonably likely to materially affect, our internal control over financial reporting.
4. Management’s remediation initiatives
Our remediation initiatives summarized below are intended to address our material weaknesses in internal control over financial reporting.
| | • | | We will continue to enhance our resources in the area of financial reporting to improve the effectiveness and timeliness of the close process. |
| | • | | We will transfer process oversight of the intercompany account reconciliation from the business unit to an independent corporate function. Further, we will enhance our controls over the matching of intercompany receipts with intercompany shipment data. |
54
Throughout our remediation process, we continue to rely on extensive, temporary manual procedures and other measures as needed to assist us in ensuring our consolidated financial statements are presented fairly, in all material respects.
| ITEM 9B. | OTHER INFORMATION |
None.
55
PART III
| ITEM 10. | DIRECTORS AND EXECUTIVE OFFICERS OF THE REGISTRANT |
Information relating to the executive officers of the Company is included in Item 4A of Part I.
Information relating to the directors of the Company is included under the caption “Election of Directors” in the 2009 Proxy Statement for BTU International, Inc. and is incorporated herein by reference. Other information required by this Item 10 is also included in the 2009 Proxy Statement for BTU International, Inc. and is incorporated herein by reference.
Information related to compliance with Section 16(a) of the Exchange Act is included under the caption “Section 16(a) Beneficial Ownership Reporting Compliance” in the 2009 Proxy Statement for BTU International, Inc. and is incorporated herein by reference.
We have adopted a code of ethics that applies to all employees, as well as our principal executives, that is available on our website,www.btu.com. Any person may request to receive a copy of our code of ethics by contacting Tom Kealy at (978) 667-4111 or at 23 Esquire Road, North Billerica, MA. We will post any amendments or waivers to our code of ethics applicable to our principal executive officer, principal financial officer, principal accounting officer or people performing similar functions on our website.
| ITEM 11. | EXECUTIVE COMPENSATION |
Information relating to executive compensation is included under the caption “Executive Compensation” in the 2009 Proxy Statement for BTU International, Inc. and is incorporated herein by reference.
| ITEM 12. | SECURITY OWNERSHIP OF CERTAIN BENEFICIAL OWNERS AND MANAGEMENT |
Information relating to the security ownership of certain beneficial owners and management is included under the caption “Beneficial Ownership of Shares” and information relating to equity compensation plan information is included under the caption “Equity Plan Compensation Information” in the 2009 Proxy Statement for BTU International, Inc. and is incorporated herein by reference.
| ITEM 13. | CERTAIN RELATIONSHIPS AND RELATED TRANSACTIONS |
There were no transactions with related persons during 2008. Information relating to director independence is included under the caption “Election of Directors” in the 2009 Proxy Statement for BTU International, Inc. and is incorporated herein by reference.
| ITEM 14. | PRINCIPAL ACCOUNTING FEES AND SERVICES |
Information relating to the principal accounting fees and services is included under the caption “Principal Accounting Fees and Services” in the 2009 Proxy Statement for BTU International, Inc. and is incorporated herein by reference.
PART IV
| ITEM 15. | EXHIBITS AND FINANCIAL STATEMENT SCHEDULES |
| (a) 1. | Financial Statements. The financial statements listed in Item 8: FINANCIAL STATEMENTS AND SUPPLEMENTARY DATA, above are filed as part of this Annual Report on Form 10-K. |
| 2. | Financial Statement Schedule. The financial statement schedule II—VALUATION AND QUALIFYING ACCOUNTS is filed as part of this Annual Report on Form 10-K. |
56
EXHIBIT INDEX
The following designated exhibits are, as indicated below, either filed herewith or have heretofore been filed with the Securities and Exchange Commission under the Securities Act of 1933 and the Securities Exchange Act of 1934 and are referred to and incorporated herein by reference to the following SEC Filings: Registration Statement Filing on Form S-1 (“33-24882”), the annual report as reported on the 1994 Form 10-K (“1994 10-K”), the annual report as reported on the 1999 Form 10-K (“1999 10-K”), the annual report as reported on the 2002 Form 10-K (“2002 10-K”), the annual report as reported on the 2003 Form 10-K (“2003 10-K”), the annual report as reported on the 2004 Form 10K (“2004 10-K”), the annual report as reported on the 2005 Form 10K (“2005 10-K”), the quarterly report as reported on the 6-28-98 Form 10-Q (“6-28-98 10-Q”), the quarterly report as reported on the 7-1-01 Form 10-Q (“7-1-01 10-Q”), the quarterly report as reported on the 6-1-07 Form 10-Q (“6-1-07 10-Q”) or the proxy statement as reported on the 5-16-03 Schedule 14A (“2003 Proxy”). All exhibits incorporated by reference from the Company’s proxy statements or annual, quarterly or current reports are from File number 000-17297.
| | | | |
| | | Exhibit | | SEC Docket |
EXHIBIT 3. ARTICLES OF INCORPORATION AND BY-LAWS | | | | |
| | |
3.1 Amended and Restated Certificate of Incorporation. | | 3.1 | | 7-1-01 10-Q |
| | |
3.2 By-Laws. | | 3.2 | | 33-24882 |
| | |
EXHIBIT 4. INSTRUMENTS DEFINING THE RIGHTS OF SECURITY HOLDERS, INCLUDING DEBENTURES | | | | |
| | |
4.0 Specimen Common Stock Certificate. | | 4.0 | | 33-24882 |
| | |
EXHIBIT 10. MATERIAL CONTRACTS | | | | |
| | |
* 10.1 1988 Employee Stock Purchase Plan. | | 10.1 | | 1999 10-K |
| | |
* 10.2 Amendment No. 1 to 1988 Employee Stock Purchase Plan dated June 15, 1989 | | 10.2 | | 1999 10-K |
| | |
* 10.3 Amendment No. 2 to 1988 Employee Stock Purchase Plan dated February 20, 1991 | | 10.3 | | 1999 10-K |
| | |
* 10.4 1993 Equity Incentive Plan | | 10.4 | | 1999 10-K |
| | |
* 10.5 Amendment No. 1 to 1993 Equity Incentive Plan | | 10.5 | | 6-28-98 10-Q |
| | |
* 10.6 Amendment No. 2 to 1993 Equity Incentive Plan | | 10.6 | | 1999 10-K |
| | |
* 10.7 1998 Stock Option Plan for Non-Employee Directors | | 10.7 | | 1999 10-K |
| | |
* 10.8 Executive Retirement Agreement | | 10.8 | | 2002 10-K |
| | |
* 10.9 2003 Equity Incentive Plan | | 10.9 | | 2003 Proxy |
| | |
* 10.10 Employment contract between the Company and Paul J. van der Wansem | | 10.10 | | 2005 10-K |
| | |
* 10.11 Officers’ Retention Agreement | | 10.11 | | 2005 10-K |
| | |
10.12 BTU (UK) Limited and RD International (UK) Limited underlease, relating to Unit B15 Southwood Summit Centre | | 10.12 | | 1994 10-K |
| | |
10.13 Mortgage note with Salem Five dated December 23, 2003 | | 10.13 | | 2003 10-K |
| | |
10.14 Amended and Restated Loan Agreement dated as of December 31, 2006 with Sovereign Bank | | 10.14 | | 6-1-07 10-Q |
57
| | | | |
| | | Exhibit | | SEC
Docket |
| | |
EXHIBIT 21. SUBSIDIARIES OF THE REGISTRANT | | | | |
| | |
21.0 Subsidiaries of the Registrant. | | 21.0 | | 2004 10-K |
| | |
EXHIBIT 23. CONSENTS OF EXPERTS AND COUNSEL | | | | |
| | |
23.1 Consent of KPMG LLP | | 23.1 | | ** |
| | |
23.2 Consent of Vitale, Caturano & Company P.C. | | 23.2 | | ** |
| | |
EXHIBIT 31. CERTIFICATIONS | | | | |
| | |
31.1 Certification | | 31.1 | | ** |
| | |
31.2 Certification | | 31.2 | | ** |
| | |
32.1 Section 906 Certification | | 32.1 | | ** |
| | |
32.2 Section 906 Certification | | 32.2 | | ** |
* designates management contracts or compensatory plans or agreements
** filed herewith
58
Schedule II
BTU INTERNATIONAL, INC.
VALUATION AND QUALIFYING ACCOUNTS
(in thousands)
For the Year Ended December 31, 2008
| | | | | | | | | | | | | | | | |
| | | | | Additions | | | | | |
Description | | Balance
at
Beginning
of Period | | Charged
to Costs
and
Expenses | | Charged
to Other
Accounts | | Deductions-
(A) | | | Balance
At End
of Period |
Allowance for doubtful | | | | | | | | | | | | | | | | |
Accounts | | $ | 201 | | $ | 59 | | $ | — | | $ | — | | | $ | 260 |
|
| For the Year Ended December 31, 2007 |
| | | | |
| | | | | Additions | | | | | |
Description | | Balance
at
Beginning
of Period | | Charged
to Costs
and
Expenses | | Charged
to Other
Accounts | | Deductions-
(A) | | | Balance
at End
of Period |
Allowance for doubtful | | | | | | | | | | | | | | | | |
Accounts | | $ | 224 | | $ | — | | $ | — | | $ | (23 | ) | | $ | 201 |
|
| For the Year Ended December 31, 2006 |
| | | | |
| | | | | Additions | | | | | |
Description | | Balance
at
Beginning
of Period | | Charged
to Costs
and
Expenses | | Charged
to Other
Accounts | | Deductions-
(A) | | | Balance
at End
of Period |
Allowance for doubtful | | | | | | | | | | | | | | | | |
Accounts | | $ | 388 | | $ | — | | $ | — | | $ | (164 | ) | | $ | 224 |
| (A) | Amounts indicated as deductions are for amounts charged against these reserves in the ordinary course of business or the reduction of required reserves based on management’s evaluation of the accounts considered to be uncollectable. |
59
SIGNATURES
Pursuant to the requirements of Section 13 or 15(d) of the Securities Exchange Act of 1934, the Registrant has duly caused this report to be signed on its behalf by the undersigned, thereunto duly authorized.
Date: March 16, 2009
| | |
|
| |
| By: | | /S/ PAUL J. VAN DER WANSEM |
| | Paul J. van der Wansem, President, Chief Executive Officer (principal executive officer) and Chairman of the Board of Directors |
Date: March 16, 2009
| | |
|
| |
| By: | | /S/ THOMAS P. KEALY |
| | Thomas P. Kealy, Vice President, Corporate Controller and Chief Accounting Officer (principal financial and accounting officer) |
Date: March 16, 2009
| | |
|
| |
| By: | | /S/ JOSEPH F. WRINN |
| | Joseph F. Wrinn, Director |
Date: March 16, 2009
| | |
|
| |
| By: | | /S/ JOHN E. BEARD |
| | John E. Beard, Director |
Date: March 16, 2009
| | |
|
| |
| By: | | /S/ G. MEAD WYMAN |
| | G. Mead Wyman, Director |
Date: March 16, 2009
| | |
|
| |
| By: | | /S/ J. SAMUEL PARKHILL |
| | J. Samuel Parkhill, Director |
60