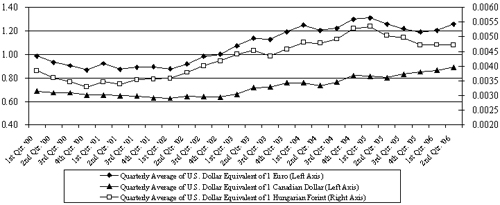
131.7 million pounds in 2005. Net sales, operating profit and volume changes for the first six months of 2006 compared with 2005 were primarily due to the factors noted above in the second quarter analysis. Film Products continues to expand capacity to support growth in new products. Capital expenditures were $21.7 million in the first six months of 2006 and are expected to be $45 million for the year. Approximately half of the forecasted capital expenditures relates to expanding the production capacity for surface protection films. Other planned capital expenditures include capacity additions for elastic materials and a new information system, which is currently being rolled out in U.S. locations. Depreciation expense was $15.7 million in the first six months of 2006 compared with $12.4 million in the first half of last year, and is projected to increase by approximately $5 million to $32 million for the year. Second-quarter net sales in Aluminum Extrusions were $153.9 million, up 22.1% from $126.0 million in the second quarter of 2005 primarily due to improved volume and higher selling prices. Operating profit from ongoing operations decreased to $5.7 million, down 20.8% from $7.2 million in the second quarter of 2005. The decrease in operating profit was mainly due to appreciation of the Canadian Dollar (adverse impact estimated of $1.3 million), margin compression caused by rapidly increasing aluminum costs (adverse impact estimated of $650,000) and a charge for a possible uncollectible account ($375,000). We believe margin compression from rapid movements in aluminum costs should be mitigated for extruded products in the future since pricing on normal customer orders has changed from the order date to the shipment date. Volume was up 9.5% to 69.4 million pounds versus 63.4 million pounds in the second quarter of 2005. Growth in shipments continued to be driven by demand for extrusions used in commercial construction and hurricane protection products. Net sales were $289.0 million in the first six months of 2006, up 22.5% versus $235.9 million in 2005. Operating profit from ongoing operations was $10.5 million in the first six months of 2006, up 2.9% compared to $10.2 million in 2005. Year-to-date volume increased to 133.0 million pounds, up 9.2% compared to 121.8 million pounds in 2005. Year-to-date net sales improved due to higher volume and higher selling prices. The increase in operating profit during the first six months was primarily due to higher volume and selling prices, partially offset by appreciation of the Canadian Dollar ($1.6 million), higher energy costs ($2 million), margin compression caused by rapidly increasing aluminum costs (adverse impact estimated of $1.3 million) and a charge for a possible uncollectible account ($375,000). Capital expenditures in Aluminum Extrusions in the first six months of 2006 were $3.2 million and are expected to be approximately $10 million for the year. Consolidated net pension expense was $1.4 million in the first six months of 2006, an increase of $2.9 million (5 cents per share after taxes) from the net pension income of $1.5 million recognized in the first six months of 2005. We expect net pension expense of $2.8 million in 2006, an unfavorable change of $5.4 million (9 cents per share after taxes) versus 2005. Most of this change relates to a pension plan that is reflected in “Corporate expenses, net” in the operating profit by segment table on page 22. We expect required contributions to our pension plans to be about $800,000 in 2006. During the first quarter of 2006, we adopted Statement of Financial Accounting Standards (“SFAS”) No. 123R,Share-Based Payment, which requires all stock-based compensation to be expensed and accounted for using a fair value-based method. The adoption of SFAS No. 123R and the granting of stock options on March 7, 2006 resulted in first- and second- quarter pretax charges for stock option-based compensation of $211,000 and $282,000, respectively. We expect to recognize stock option-based compensation costs under the new standard of approximately $1.1 million in 2006 (2 cents per share after taxes). Consolidated net capitalization and other credit measures are provided in the liquidity and capital resources section beginning on page 23. | 


