Some of the information contained in this quarterly report on Form 10-Q may constitute “forward-looking statements” within the meaning of the “safe-harbor” provisions of the Private Securities Litigation Reform Act of 1995. When we use words such as “believe,” “hope,” “expect,” “are likely,” “project” and similar expressions, we do so to identify forward-looking statements. Such statements are based on our then current expectations and are subject to a number of risks and uncertainties that could cause actual results to differ materially from those addressed in the forward-looking statements. Risk factors that may cause such a difference are summarized on pages 26-28 and are incorporated herein.
Second-quarter 2007 net income was $9.9 million (25 cents per share) compared with $9.3 million (24 cents per share) in the second quarter of 2006. The increase was primarily due to lower pension and interest costs, a lower effective income tax rate and higher profits in our films business, partially offset by significantly lower profits in our aluminum business. Gains on the sale of assets and other items and losses related to plant shutdowns, asset impairments and restructurings are described in Note 2 on page 6. The following tables present Tredegar’s net sales and operating profit by segment for the three and six months ended June 30, 2007 and 2006:
Net sales (sales less freight) and operating profit from ongoing operations are the measures of sales and operating profit used by the chief operating decision maker of each segment for purposes of assessing performance.
Film Products. Net sales and operating profit from ongoing operations in Film Products were up 7.3% and 3.8%, respectively, in the second quarter of 2007 versus 2006. Volume was 60.4 million pounds in the second quarter of 2007 compared with 61.9 million pounds in the second quarter of last year. Higher net sales were primarily due to increased sales of high-value elastic, apertured and surface protection materials, partially offset by lower sales of certain commodity barrier films that were dropped in conjunction with the shutdown in the second quarter of 2006 of the plant in LaGrange, Georgia. Volume declined as a result of exiting this market.
Profits increased in the second quarter of 2007 compared with the second quarter of 2006 due primarily to the appreciation of the U.S. Dollar equivalent value of functional currencies for operations outside of the U.S. and the improvement in the sales of high-value materials noted above. We estimate that the impact of the lag in the pass-through of changes in average resin costs was not significant in the second quarter of 2007 compared with a positive impact on operating profit of $500,000 in the second quarter of 2006. Film Products has index-based pass-through raw material cost agreements for the majority of its business. However, under certain agreements, changes in resin prices are not passed through for an average period of 90 days.
Net sales and operating profit from ongoing operations in Film Products were up 7.5% and 6.3%, respectively, in the first six months of 2007 versus 2006. Operating profit from ongoing operations excluding the estimated effects of resin pass-through lag was $30.1 million in the first six months of 2007, up 14.0% versus $26.4 million in the first six months of 2006. Volume decreased to 125.7 million pounds in the first six months of 2007 from 126.4 million pounds in the first six months of 2006. The growth in sales and operating profit and decline in volume during the first six months of 2007 versus 2006 were primarily due to the same factors discussed for the second quarter of 2007 versus 2006.
Since the second quarter of last year, excluding the effects of the lag in the passthrough of changes in resin costs, quarterly operating profit in films has had significant ups and downs. Future performance is likely to exhibit similar fluctuations.
Capital expenditures were $8.7 million in the first six months of 2007 and are projected to be approximately $20 million for the year. Depreciation expense was $16.5 million in the first six months of 2007 and is projected to be $33 million for the year.
Aluminum Extrusions.Net sales and operating profit from ongoing operations in Aluminum Extrusions were down 7.2% and 42.1%, respectively, in the second quarter of 2007 versus 2006. Volume decreased to 56.9 million pounds in the second quarter of 2007, down 18.0% from 69.4 million pounds in the second quarter of 2006.
Net sales and operating profit from ongoing operations in Aluminum Extrusions were down 2.4% and 35.2%, respectively, in the first six months of 2007 versus 2006. Volume decreased to 114.7 million pounds in the first six months of 2007, down 13.8% from 133.0 million pounds in the first six months of 2006.
The decreases in net sales and operating profit in the second quarter and first six months of 2007 versus 2006 were mainly due to lower volume partially offset by higher selling prices. Shipments declined in most markets, especially extrusions used in hurricane protection products and residential construction. Overall backlog at the end of the quarter was 16.6 million pounds, down from 29.5 million pounds at June 30, 2006.
13
Demand for extruded aluminum shapes is down significantly in most market segments. Our bookings and backlog are at historic lows for this time of year. The combination of poor demand and a much stronger Canadian Dollar, which impacts our costs, make the prospects for this unit look weak in the near future.
Capital expenditures were $3.4 million in the first six months of 2007 and are projected to be approximately $8 million for the year. Depreciation expense was $6.2 million in the first six months of 2007 and is projected to be $13 million for the year.
Other Items.Net pension income was $587,000 in the second quarter of 2007 and $1.2 million in the first six months of 2007, a favorable change of $1.3 million (2 cents per share after taxes) and $2.6 million (4 cents per share after taxes) from amounts recognized in the second quarter and first six months of 2006, respectively. Most of the favorable changes relate to a pension plan that is reflected in “Corporate expenses, net” in the operating profit by segment table on page 12. We contributed $1.1 million to our pension plans in 2006 and expect to contribute the same amount in 2007.
Interest expense was $557,000 in the second quarter of 2007 and $1.4 million in first six months of 2007, a decline of $911,000 (2 cent per share after taxes) and $1.5 million (3 cents per share after taxes) versus the second quarter and first six months of last year, respectively, due to lower average debt outstanding.
The effective tax rate was 30.0% in the second quarter of 2007 and 32.9% in the first six months of 2007, compared with 37.6% in the second quarter of 2006 and 38.6% in the first six months of 2006. The decrease in the effective tax rate, which had a favorable impact of approximately 3 cents and 4 cents per share in the second quarter and first six months of 2007 versus last year, respectively, was mainly due to an adjustment in the second quarter of 2007 of deferred income taxes for a reduction in statutory income tax rates in Canada of $682,000 (2 cents per share) (reflected as a credit to income tax expense) and differences in income taxes accrued on operations outside of the U.S.
On April 2, 2007, we invested $10 million in Harbinger Capital Partners Special Situations Fund, L.P. (“Harbinger”), a fund that seeks to achieve superior absolute returns by participating primarily in medium to long-term investments involving distressed/high yield debt securities, special situation equities and private loans and notes. The fund is a highly speculative investment subject to a two-year lock-up and additional limitations on withdrawal. There is no secondary market for interests in the fund. Our investment in Harbinger, which represents less than 2% of Harbinger’s total partnership capital, is accounted for under the cost method. At June 30, 2007, Harbinger reported our capital account value at $12.4 million reflecting $2.4 million of unrealized appreciation ($1.5 million or 4 cents per share after taxes) versus the carrying value in our balance sheet of $10 million (included in “Other assets and deferred charges”).
Net capitalization and other credit measures are provided in the liquidity and capital resources section beginning on page 18.
Critical Accounting Policies
In the ordinary course of business, we make a number of estimates and assumptions relating to the reporting of results of operations and financial position in the preparation of financial statements in conformity with generally accepted accounting principles. We believe the estimates, assumptions and judgments described in the section “Management’s Discussion and Analysis of Financial Condition and Results of Operations – Critical Accounting Policies” of our Annual Report on Form 10-K for the year ended December 31, 2006, have the greatest potential impact on our financial statements, so we consider these to be our critical accounting policies. These policies include our accounting for impairment of long-
14
lived assets and goodwill, pension benefits and income taxes. These policies require management to exercise judgments that are often difficult, subjective and complex due to the necessity of estimating the effect of matters that are inherently uncertain. Actual results could differ significantly from those estimates under different assumptions and conditions. We believe the consistent application of these policies enables us to provide readers of our financial statements with useful and reliable information about our operating results and financial condition. There have been no changes in these policies that have had a significant impact on results of operations or financial position. See Note 2 on page 6 for losses related to plant shutdowns, asset impairments and restructurings occurring during 2007 and the comparable period in 2006.
Results of Operations
Second Quarter 2007 Compared with Second Quarter 2006
Overall, sales in the second quarter of 2007 decreased by 1.0% compared with 2006. Net sales (sales less freight) increased 7.3% in Film Products primarily due to increased sales of high-value elastic, apertured and surface protection materials, partially offset by lower sales of certain commodity barrier films that were dropped in conjunction with the shutdown in the second quarter of 2006 of the plant in LaGrange, Georgia. Net sales decreased 7.2% in Aluminum Extrusions due to a decline in volume of 18.0% partially offset by higher selling prices. For more information on net sales and volume, see the executive summary beginning on page 12.
Consolidated gross profit (sales minus cost of goods sold and freight) as a percentage of sales decreased to 12.0% in the second quarter of 2007 from 12.6% in 2006. The gross profit margin increased in Film Products but decreased in Aluminum Extrusions primarily because of the changes in net sales noted above.
As a percentage of sales, selling, general and administrative and R&D expenses were 6.7% in the second quarter of 2007, up from 6.5% in the second quarter of last year. The increase is primarily due to higher costs associated with a new information system in Film Products.
Plant shutdowns, asset impairments and restructurings in the second quarter of 2007 shown in the segment operating profit table on page 12 include:
| |
• | A pretax charge of $99,000 for severance and other employee-related costs in connection with restructurings in Aluminum Extrusions; and |
| |
• | A pretax charge of $26,000 related to the shutdown of the films manufacturing facility in LaGrange, Georgia. |
| |
Plant shutdowns, asset impairments and restructurings in the second quarter of 2006 shown in the segment operating profit table on page 12 include: |
| |
• | A net pretax gain of $822,000 associated with the shutdown of the films manufacturing facility in LaGrange, Georgia, including a gain of $1.4 million for related LIFO inventory liquidations (included in “Cost of goods sold” in the consolidated statements of income), partially offset by severance and other costs of $567,000; and |
| |
• | Pretax charges of $459,000 for severance and other employee-related costs in connection with restructurings in Aluminum Extrusions ($405,000) and Film Products ($54,000). |
| |
| For more information on costs and expenses, see the executive summary beginning on page 12. |
15
Interest income, which is included in “Other income (expense), net” in the consolidated statements of income, was $283,000 in the second quarter of 2007 and $285,000 in 2006. Interest expense was $557,000 in the second quarter of 2007, a decline of $911,000 (2 cents per share after taxes) versus the second quarter of last year due to lower average debt outstanding. Average debt outstanding and interest rates were as follows:
| | | | | | | |
|
|
|
|
|
|
|
|
| | Three Months
Ended June 30 |
| |
|
|
(In Millions) | | 2007 | | 2006 | |
|
|
|
|
|
|
Floating-rate debt with interest charged on a rollover basis at one-month LIBOR: | | | | | | | |
Average outstanding debt balance | | $ | 39.6 | | $ | 101.5 | |
Average interest rate | | | 6.1 | % | | 5.9 | % |
Fixed-rate and other debt: | | | | | | | |
Average outstanding debt balance | | $ | 2.2 | | $ | 5.3 | |
Average interest rate | | | 3.3 | % | | 6.3 | % |
|
|
|
|
|
|
|
|
Total debt: | | | | | | | |
Average outstanding debt balance | | $ | 41.8 | | $ | 106.8 | |
Average interest rate | | | 6.0 | % | | 5.9 | % |
|
|
|
|
|
|
|
|
The effective tax rate was 30.0% in the second quarter of 2007 compared with 37.6% in the second quarter of 2006. The decrease in the effective tax rate, which had a favorable impact of approximately 3 cents per share in the second quarter of 2007 versus last year, was mainly due to an adjustment of deferred income taxes for a reduction in statutory income tax rates in Canada of $682,000 (2 cents per share) (reflected as a credit to income tax expense) and differences in income taxes accrued on operations outside of the U.S.
First Six Months of 2007 Compared with First Six Months of 2006
Overall, sales in the first six months of 2007 increased by 1.9% compared with 2006. Net sales (sales less freight) increased 7.5% in Film Products primarily due to increased sales of high-value elastic, apertured and surface protection materials, partially offset by lower sales of certain commodity barrier films that were dropped in conjunction with the shutdown in the second quarter of 2006 of the plant in LaGrange, Georgia. Net sales decreased 2.4% in Aluminum Extrusions due to a decline in volume of 13.8% partially offset by higher selling prices. For more information on net sales and volume, see the executive summary beginning on page 12.
Consolidated gross profit (sales minus cost of goods sold and freight) as a percentage of sales decreased to 12.6% in the first six months of 2007 from 12.8% in 2006. The gross profit margin increased in Film Products but decreased in Aluminum Extrusions primarily because of the changes in net sales noted above.
As a percentage of sales, selling, general and administrative and R&D expenses were 6.9% in the first six months of 2007, up from 6.6% in the first six months of last year. The increase is primarily due to higher costs associated with a new information system in Film Products.
Plant shutdowns, asset impairments and restructurings in the first six months of 2007 shown in the segment operating profit table on page 12 include:
16
| |
• | A pretax charge of $366,000 related to the estimated loss on the sub-lease of a portion of the AFBS, Inc. (formerly know as Therics, Inc.) facility in Princeton, New Jersey; |
|
• | A pretax charge of $338,000 for asset impairments relating to machinery and equipment in Film Products; |
| |
• | A pretax charge of $99,000 for severance and other employee-related costs in connection with restructurings in Aluminum Extrusions; and |
| |
• | A pretax charge of $55,000 related to the shutdown of the films manufacturing facility in LaGrange, Georgia. |
| |
Plant shutdowns, asset impairments and restructurings in the first six months of 2006 shown in the segment operating profit table on page 12 include: |
| |
• | A net pretax gain of $418,000 associated with the shutdown of the films manufacturing facility in LaGrange, Georgia, including a gain of $1.4 million for related LIFO inventory liquidations (included in “Cost of goods sold” in the consolidated statements of income), partially offset by severance and other costs of $841,000 and asset impairment charges of $130,000; |
| |
• | Pretax charges of $1 million for asset impairments in Film Products; and |
| |
• | Pretax charges of $727,000 for severance and other employee-related costs in connection with restructurings in Film Products ($213,000) and Aluminum Extrusions ($514,000). |
In the six months ended June 30, 2006, a pretax gain on the sale of public equity securities of $56,000 (proceeds also of $56,000) is included in “Other income (expense), net” in the consolidated statements of income and “Gain on the sale of corporate assets” in the operating profit by segment table on page 12. For more information on costs and expenses, see the executive summary beginning on page 12.
Interest income, which is included in “Other income (expense), net” in the consolidated statements of income, was $671,000 in the first six months of 2007 and $507,000 in 2006. Interest expense was $1.4 million in the first six months of 2007, a decline of $1.5 million (3 cent per share after taxes) versus the first six months of last year due to lower average debt outstanding. Average debt outstanding and interest rates were as follows:
| | | | | | | |
|
|
|
|
|
|
| | Six Months
Ended June 30 |
| |
|
|
(In Millions) | | 2007 | | 2006 | |
|
|
|
|
|
|
Floating-rate debt with interest charged on a rollover basis at one-month LIBOR: | | | | | | | |
Average outstanding debt balance | | $ | 45.4 | | $ | 105.5 | |
Average interest rate | | | 6.1 | % | | 5.6 | % |
Fixed-rate and other debt: | | | | | | | |
Average outstanding debt balance | | $ | 2.3 | | $ | 5.5 | |
Average interest rate | | | 4.1 | % | | 6.5 | % |
|
|
|
|
|
|
|
|
Total debt: | | | | | | | |
Average outstanding debt balance | | $ | 47.7 | | $ | 111.0 | |
Average interest rate | | | 6.0 | % | | 5.6 | % |
|
|
|
|
|
|
|
|
The effective tax rate was 32.9% in the first six months of 2007 compared with 38.6% in the first six months of 2006. The decrease in the effective tax rate, which had a favorable impact of approximately 4 cents per share in the first six months of 2007 versus last year, was mainly due to an adjustment in the second quarter of 2007 of deferred income taxes for a reduction in statutory income tax rates in Canada of $682,000 (2 cents per share) (reflected as a credit to income tax expense) and differences in income taxes accrued on operations outside of the U.S.
17
Liquidity and Capital Resources
Changes in operating assets and liabilities from December 31, 2006 to June 30, 2007 are summarized below:
| | |
• | Accounts receivable increased significantly by $27.8 million (22.8%). |
| |
| – | Accounts receivable in Film Products increased by $6.1 million due to higher sales in the second quarter of 2007 compared with the fourth quarter of 2006. Days sales outstanding (“DSO”) was 49 at June 30, 2007, which is within the range experienced over the last twelve months. |
| | |
| – | Accounts receivable in Aluminum Extrusions increased by $21.7 million due to higher sales in the second quarter of 2007 compared with the fourth quarter of 2006. DSO was approximately 45 at June 30, 2007, consistent with historical levels. |
| | |
• | Income taxes recoverable decreased by $5.7 million due to the timing of income and tax payments. |
| |
• | Inventories increased by less than $500,000 (less than 1%). |
| |
• | Net property, plant and equipment was down $8.3 million (2.5%) due primarily to depreciation of $22.8 million compared with capital expenditures of $12.1 million, $3.7 million received from a customer for reimbursement of certain machinery and equipment costs and asset impairments relating to machinery and equipment in Film Products of $338,000, partially offset by appreciation of foreign currencies relative to the U.S. Dollar (favorable impact of $6.6 million). |
| |
• | Other assets increased by $12.8 million (20.0%) due primarily to the $10 million investment in Harbinger (see page 14), an increase in prepaid pension assets of $2.1 million and investments in real estate in the second quarter of 2007 of $1.1 million. |
| |
• | Accounts payable increased significantly by $17.3 million (25.0%). |
| |
| – | Accounts payable days were 30 in Film Products at June 30, 2007, which is within the range experienced over the last twelve months. |
| | |
| – | Accounts payable days were 35 in Aluminum Extrusions at June 30, 2007, which is within the range experienced over the last twelve months. |
| | |
• | Accrued expenses decreased by $5.5 million (13.1%) due primarily to incentive compensation and bonus awards accrued for all of 2006 that were paid in 2007. |
Cash provided by operating activities was $37.0 million in the first six months of 2007 compared with $48.3 million in 2006. The change is primarily related to normal volatility of working capital components.
Cash used in investing activities was $19.3 million in the first six months of 2007, down from $25.3 million in 2006 due primarily to lower capital expenditures of $12.8 million and reimbursements received from a customer related to equipment purchases of $3.7 million, partially offset by an investment in Harbinger of $10 million (see page 14) and investments in real estate of $1.1 million.
Capital expenditures in the first six months of 2007 primarily included the normal replacement of machinery and equipment and continued expansion of capacity for surface protection films and elastic materials. Capital expenditures for all of 2007 are expected to be approximately $20 million in Film Products and about $8 million in Aluminum Extrusions.
Net cash flow used in financing activities was $27.1 million in the first six months of 2007, and related to repayments on our revolving credit facility with excess cash flow of $30 million and the payment of first and second quarter regular dividends aggregating $3.2 million (4 cents per share per quarter), partially offset by proceeds received from the exercise of stock options of $6.5 million.
18
�� Further information on cash flows for the first six months of 2007 and 2006 are provided in the consolidated statements of cash flows on page 4.
Net capitalization and indebtedness as defined under our revolving credit agreement as of June 30, 2007 are as follows:
| | | | |
| |
Net Capitalization and Indebtedness as of June 30, 2007
(In Thousands) | |
| |
Net capitalization: | | | | |
Cash and cash equivalents | | $ | 32,397 | |
Debt: | | | | |
$300 million revolving credit agreement maturing December 15, 2010 | | | 30,000 | |
Other debt | | | 2,179 | |
| |
|
| |
Total debt | | | 32,179 | |
| |
|
| |
Debt net of cash and cash equivalents | | | (218 | ) |
Shareholders’ equity | | | 549,690 | |
| |
|
| |
Net capitalization | | $ | 549,472 | |
| |
|
| |
Indebtedness as defined in revolving credit agreement: | | | | |
Total debt | | $ | 32,179 | |
Face value of letters of credit | | | 5,907 | |
Liabilities relating to derivative financial instruments | | | 42 | |
| |
|
| |
Indebtedness | | $ | 38,128 | |
|
|
|
| |
Under the revolving credit agreement, borrowings are permitted up to $300 million, and $269 million was available to borrow at June 30, 2007. The credit spread and commitment fees charged on the unused amount under the revolving credit agreement at various indebtedness-to-adjusted EBITDA levels are as follows:
| | | | | | | |
| |
Pricing Under Revolving Credit Agreement (Basis Points) | |
| |
Indebtedness-to-Adjusted
EBITDA Ratio | | Credit Spread
Over LIBOR | | Commitment
Fee | |
| |
> 2.50x but <= 3x | | 125 | | | 25 | | |
> 1.75x but <= 2.50x | | 100 | | | 20 | | |
> 1x but <=1.75x | | 87.5 | | | 17.5 | | |
<= 1x | | 75 | | | 15 | | |
|
|
|
|
|
|
| |
At June 30, 2007, the interest rate on debt under the revolving credit agreement was priced at one-month LIBOR plus the applicable credit spread of 75 basis points.
19
The computations of adjusted EBITDA, adjusted EBIT, the leverage ratio and interest coverage ratio as defined in the revolving credit agreement are presented below along with the related most restrictive covenants. Adjusted EBITDA and adjusted EBIT as defined in the revolving credit agreement are not intended to represent cash flow from operations as defined by GAAP and should not be considered as either an alternative to net income or to cash flow.
| | | | |
|
|
Computations of Adjusted EBITDA, Adjusted EBIT, Leverage Ratio and
Interest Coverage Ratio as Defined in Revolving Credit Agreement Along with Related Most
Restrictive Covenants
As of June 30, 2007 (In Thousands) | |
|
|
Computations of adjusted EBITDA and adjusted EBIT as defined in revolving credit agreement for the twelve months ended June 30, 2007: | | | | |
Net income | | $ | 41,004 | |
Plus: | | | | |
After-tax losses related to discontinued operations | | | — | |
Total income tax expense for continuing operations | | | 19,617 | |
Interest expense | | | 4,001 | |
Charges related to stock option grants and awards accounted for under the fair value-based method | | | 942 | |
Losses related to the application of the equity method of accounting | | | — | |
Depreciation and amortization expense for continuing operations | | | 45,309 | |
All non-cash losses and expenses, plus cash losses and expenses not to exceed $10,000, for continuing operations that are classified as unusual, extraordinary or which are related to plant shutdowns, asset impairments and/or restructurings (cash-related of $2,802) | | | 3,140 | |
Minus: | | | | |
After-tax income related to discontinued operations | | | — | |
Total income tax benefits for continuing operations | | | — | |
Interest income | | | (1,404 | ) |
All non-cash gains and income, plus cash gains and income not to exceed $10,000, for continuing operations that are classified as unusual, extraordinary or which are related to plant shutdowns, asset impairments and/or restructurings (cash-related of $261) | | | (1,761 | ) |
Plus or minus, as applicable, pro forma EBITDA adjustments associated with acquisitions and asset dispositions | | | — | |
| |
|
| |
Adjusted EBITDA as defined in revolving credit agreement | | | 110,848 | |
| | | | |
Less: Depreciation and amortization expense for continuing operations (including pro forma for acquisitions and asset dispositions) | | | (45,309 | ) |
| |
|
| |
Adjusted EBIT as defined in revolving credit agreement | | $ | 65,539 | |
| |
|
| |
Shareholders’ equity at June 30, 2007 | | $ | 549,690 | |
Computations of leverage and interest coverage ratios as defined in revolving credit agreement: | | | | |
Leverage ratio (indebtedness-to-adjusted EBITDA) | | | .34 | x |
Interest coverage ratio (adjusted EBIT-to-interest expense) | | | 16.38 | x |
Most restrictive covenants as defined in revolving credit agreement: | | | | |
Maximum permitted aggregate amount of dividends that can be paid by Tredegar during the term of the revolving credit agreement ($100,000 plus 50% of net income generated after October 1, 2005) | | $ | 129,680 | |
Minimum adjusted shareholders’ equity permitted ($351,918 plus 50% of net income generated after October 1, 2005) | | $ | 381,598 | |
Maximum leverage ratio permitted: | | | | |
Ongoing | | | 3.00 | x |
Pro forma for acquisitions | | | 2.50 | x |
Minimum interest coverage ratio permitted | | | 2.50 | x |
|
|
|
|
|
20
We believe that as of June 30, 2007, we were, and currently we are, in compliance with all of our debt covenants. Noncompliance with any one or more of the debt covenants may have an adverse effect on financial condition or liquidity in the event such noncompliance cannot be cured or should we be unable to obtain a waiver from the lenders. Renegotiation of a covenant through an amendment to the revolving credit agreement may effectively cure the noncompliance, but may have an effect on financial condition or liquidity depending upon how the covenant is renegotiated.
We believe that the borrowing availability under our revolving credit agreement, our current cash balances and our cash flow from operations will be sufficient to satisfy our working capital, capital expenditure and dividend requirements for the foreseeable future.
Item 3. Quantitative and Qualitative Disclosures About Market Risk.
Tredegar has exposure to the volatility of interest rates, polyethylene and polypropylene resin prices, aluminum ingot and scrap prices, energy prices, foreign currencies and emerging markets. See the section on liquidity and capital resources beginning on page 18 regarding the revolving credit agreement and interest rate exposures.
Changes in resin prices, and the timing of those changes, could have a significant impact on profit margins in Film Products. Profit margins in Aluminum Extrusions are sensitive to fluctuations in aluminum ingot and scrap prices as well as energy costs. With the exception of certain contractual arrangements, there is no assurance of our ability to pass through higher raw material and energy costs to our customers.
Average quarterly prices of low density polyethylene resin (a primary raw material for Film Products) are shown in the chart below.
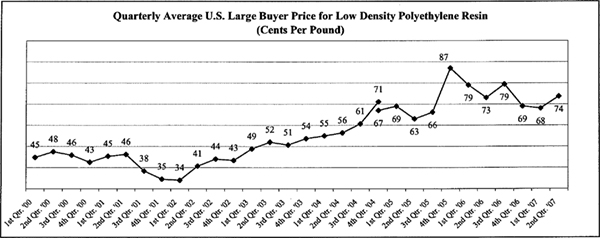
Source: Quarterly averages computed by Tredegar using monthly data provided by Chemical Data Inc. (“CDI”). In January 2005, CDI reflected a 4 cents per pound non-market adjustment based on their estimate of the growth of discounts over the 2000 to 2003 period. The 4th quarter 2004 average rate of 67 cents per pound is shown on a pro forma basis as if the non-market adjustment was made in October 2004.
Resin prices in Europe, Asia and South America have exhibited similar trends. The price of resin is driven by several factors including supply and demand and the prices of oil, ethylene and natural gas. To address fluctuating resin prices, we have indexed pass-through or cost-sharing agreements covering a majority of our sales, but many have a 90-day lag. Most new customer contracts contain resin pass-through arrangements.
21
In the normal course of business, we enter into fixed-price forward sales contracts with certain customers for the sale of fixed quantities of aluminum extrusions at scheduled intervals. In order to hedge our exposure to aluminum price volatility (see the chart below) under these fixed-price arrangements, which generally have a duration of not more than 12 months, we enter into a combination of forward purchase commitments and futures contracts to acquire or hedge aluminum, based on the scheduled deliveries.
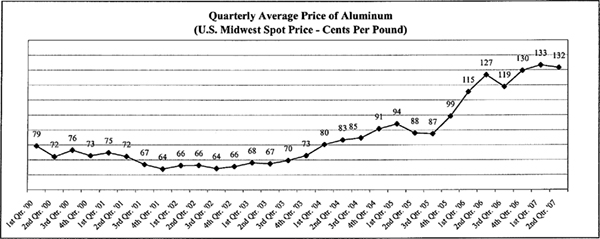
Source: Quarterly averages computed by Tredegar using daily closing data provided by Bloomberg.
In Aluminum Extrusions, we hedge from time-to-time a portion of our exposure to natural gas price volatility (see the chart below) by entering into fixed-price forward purchase contracts with our natural gas suppliers. As of June 30, 2007, we had fixed prices through our natural gas suppliers for a portion of our usage through the end of the year. We estimate that, in an unhedged situation, every $1 per mmBtu per month change in the market price of natural gas has a $150,000 impact on the monthly operating profit of Aluminum Extrusions.
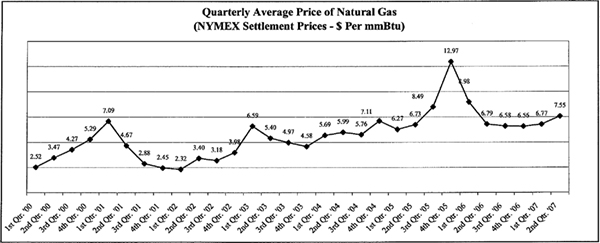
Source: Quarterly averages computed by Tredegar using monthly NYMEX settlement prices.
22
We sell to customers in foreign markets through our foreign operations and through exports from our U.S. plants. The percentage of sales from manufacturing operations related to foreign markets for the first six months of 2007 and 2006 are as follows:
| | | | | | | | | | | | | |
|
|
| |
Percentage of Net Sales from Manufacturing
Operations Related to Foreign Markets* | |
|
|
| |
| | Six Months Ended June 30 | |
| |
| |
| | 2007 | | 2006 | |
| |
| |
| |
| | Exports
From U.S. | | Foreign
Operations | | Exports
From U.S. | | Foreign
Operations | |
| |
| |
| |
| |
| |
Canada | | | 4 | % | | 14 | % | | 4 | % | | 16 | % |
Europe | | | 1 | | | 13 | | | 1 | �� | | 12 | |
Latin America | | | 0 | | | 2 | | | 1 | | | 2 | |
Asia | | | 4 | | | 5 | | | 4 | | | 3 | |
|
|
|
|
|
|
|
|
|
|
|
|
| |
Total | | | 9 | % | | 34 | % | | 10 | % | | 33 | % |
|
|
|
|
|
|
|
|
|
|
|
|
| |
|
* Based on consolidated net sales from manufacturing operations (excludes AFBS). |
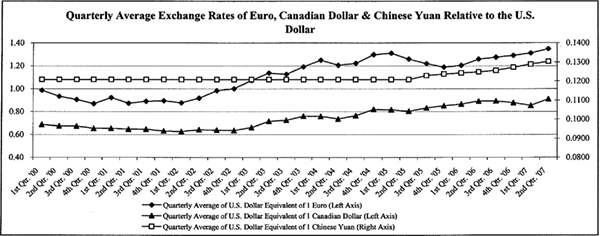
We attempt to match the pricing and cost of our products in the same currency (except in Canada where about 80% of our sales of aluminum extrusions are U.S. Dollar-based) and generally view the volatility of foreign currencies (see trends for the Euro, Canadian Dollar and Chinese Yuan in the chart on page 25) and emerging markets, and the corresponding impact on earnings and cash flow, as part of the overall risk of operating in a global environment. Exports from the U.S. are generally denominated in U.S. Dollars. Our foreign currency exposure on income from foreign operations relates to the Canadian Dollar, the Euro, the Chinese Yuan, the Hungarian Forint and the Brazilian Real.
The relatively high percentage of U.S. Dollar-priced sales in Canada causes a mismatch between the currency denomination of sales and costs resulting in lower U.S. Dollar translated profits when the Canadian Dollar appreciates since our costs are higher in U.S. Dollar equivalent terms while sales are mostly unaffected (the opposite effect occurs when the Canadian Dollar depreciates in value relative to the U.S. Dollar). Changes in the value of the Canadian Dollar relative to the U.S. Dollar had an adverse impact on operating profit in the first six months of 2007 of $700,000 compared with the first six months of 2006. In Film Products, where we have been able to better match the currency of our sales and costs, we estimate that the appreciation of foreign currencies (primarily the Euro and Hungarian Forint and to a lesser extent the Chinese Yuan and Brazilian Real) relative to the U.S. Dollar had a positive impact on operating profit of about $1.2 million in the first six months of 2007 compared with 2006.
23
We continue to review the loading of our aluminum extrusions plants in North America to optimize production mix and minimize cost in light of the increase in the U.S. Dollar equivalent cost structure of our plants in Canada. In addition, we have partially hedged our exposure to the Canadian Dollar and Euro as shown in the following tables (accounted for as cash flow hedges):