UNITED STATES SECURITIES AND EXCHANGE COMMISSION
Washington, D.C. 20549
Form 10-Q
| þ | QUARTERLY REPORT PURSUANT TO SECTION 13 OR 15(d) |
| | OF | THE SECURITIES EXCHANGE ACT OF 1934 |
For the Quarterly Period Ended September 30, 2011
OR
| ¨ | TRANSITION REPORT PURSUANT TO SECTION 13 OR 15(d) |
| | OF | THE SECURITIES EXCHANGE ACT OF 1934 |
Commission File Number 1-10351
Potash Corporation of Saskatchewan Inc.
(Exact name of registrant as specified in its charter)
| | |
| Canada | | N/A |
(State or other jurisdiction of incorporation or organization) | | (I.R.S. Employer Identification No.) |
| |
122 — 1st Avenue South Saskatoon, Saskatchewan, Canada | | S7K 7G3 (Zip Code) |
| (Address of principal executive offices) | | |
306-933-8500
(Registrant’s telephone number, including area code)
Indicate by check mark whether the registrant (1) has filed all reports required to be filed by Sections 13 or 15(d) of the Securities Exchange Act of 1934 during the preceding 12 months (or for such shorter period that the registrant was required to file such reports), and (2) has been subject to such filing requirements for the past 90 days.
Yes þ No ¨
Indicate by check mark whether the registrant has submitted electronically and posted on its corporate Web site, if any, every Interactive Data File required to be submitted and posted pursuant to Rule 405 of Regulation S-T during the preceding 12 months (or for such shorter period that the registrant was required to submit and post such files).
Yes ¨ No ¨
Indicate by check mark whether the registrant is a large accelerated filer, an accelerated filer, a non-accelerated filer, or a smaller reporting company. See the definitions of “large accelerated filer,” “accelerated filer” and “smaller reporting company” in Rule 12b-2 of the Exchange Act. (Check one):
| | | | | | |
| Large accelerated filer þ | | Accelerated filer ¨ | | Non-accelerated filer ¨ (Do not check if a smaller reporting company) | | Smaller reporting company ¨ |
Indicate by check mark whether the registrant is a shell company (as defined in Exchange Act Rule 12b-2).
Yes ¨ No þ
As at October 31, 2011, Potash Corporation of Saskatchewan Inc. had 856,478,084 Common Shares outstanding.
TABLE OF CONTENTS
Part I. Financial Information
Item 1. Financial Statements
Potash Corporation of Saskatchewan Inc.
Condensed Consolidated Statements of Financial Position
(in millions of US dollars)
(unaudited)
| | | | | | | | |
| | | September 30,
2011 | | | December 31,
2010 | |
Assets | | | | | | | | |
Current assets | | | | | | | | |
Cash and cash equivalents | | $ | 394 | | | $ | 412 | |
Receivables | | | 1,327 | | | | 1,059 | |
Inventories (Note 2) | | | 581 | | | | 570 | |
Prepaid expenses and other current assets | | | 38 | | | | 54 | |
| | | 2,340 | | | | 2,095 | |
Non-current assets | | | | | | | | |
Property, plant and equipment | | | 9,408 | | | | 8,141 | |
Investments in equity-accounted investees | | | 1,166 | | | | 1,051 | |
Available-for-sale investments (Note 3) | | | 2,491 | | | | 3,842 | |
Other assets | | | 302 | | | | 303 | |
Intangible assets | | | 115 | | | | 115 | |
Total Assets | | $ | 15,822 | | | $ | 15,547 | |
Liabilities | | | | | | | | |
Current liabilities | | | | | | | | |
Short-term debt and current portion of long-term debt (Note 4) | | $ | 882 | | | $ | 1,871 | |
Payables and accrued charges | | | 1,201 | | | | 1,198 | |
Current portion of derivative instrument liabilities | | | 82 | | | | 75 | |
| | | 2,165 | | | | 3,144 | |
Non-current liabilities | | | | | | | | |
Long-term debt (Note 4) | | | 3,704 | | | | 3,707 | |
Derivative instrument liabilities | | | 193 | | | | 204 | |
Deferred income tax liabilities | | | 1,064 | | | | 737 | |
Accrued pension and other post-retirement benefits (Note 5) | | | 530 | | | | 468 | |
Asset retirement obligations and accrued environmental costs | | | 614 | | | | 455 | |
Other non-current liabilities and deferred credits | | | 85 | | | | 147 | |
Total Liabilities | | | 8,355 | | | | 8,862 | |
Shareholders’ Equity | | | | | | | | |
Share capital (Note 6) | | | 1,468 | | | | 1,431 | |
Contributed surplus | | | 296 | | | | 308 | |
Accumulated other comprehensive income | | | 1,058 | | | | 2,394 | |
Retained earnings | | | 4,645 | | | | 2,552 | |
Total Shareholders’ Equity | | | 7,467 | | | | 6,685 | |
Total Liabilities and Shareholders’ Equity | | $ | 15,822 | | | $ | 15,547 | |
Contingencies (Note 12) | | | | | | | | |
(See Notes to the Condensed Consolidated Financial Statements)
| | |
| 1 | | PotashCorp 2011 Third Quarter Quarterly Report on Form 10-Q |
Potash Corporation of Saskatchewan Inc.
Condensed Consolidated Statements of Income
(in millions of US dollars except per-share amounts)
(unaudited)
| | | | | | | | | | | | | | | | |
| | | Three Months Ended September 30 | | | Nine Months Ended September 30 | |
| | | 2011 | | | 2010 | | | 2011 | | | 2010 | |
Sales(Note 7) | | $ | 2,321 | | | $ | 1,575 | | | $ | 6,850 | | | $ | 4,726 | |
Freight, transportation and distribution | | | (129 | ) | | | (119 | ) | | | (410 | ) | | | (373 | ) |
Cost of goods sold | | | (1,060 | ) | | | (906 | ) | | | (3,044 | ) | | | (2,489 | ) |
Gross Margin | | | 1,132 | | | | 550 | | | | 3,396 | | | | 1,864 | |
Selling and administrative expenses | | | (46 | ) | | | (71 | ) | | | (176 | ) | | | (164 | ) |
Provincial mining and other taxes | | | (53 | ) | | | (16 | ) | | | (147 | ) | | | (56 | ) |
Share of earnings of equity-accounted investees | | | 68 | | | | 51 | | | | 185 | | | | 122 | |
Dividend income | | | 41 | | | | 25 | | | | 94 | | | | 139 | |
Other expenses | | | — | | | | (22 | ) | | | (10 | ) | | | (43 | ) |
Operating Income | | | 1,142 | | | | 517 | | | | 3,342 | | | | 1,862 | |
Finance Costs | | | (37 | ) | | | (22 | ) | | | (125 | ) | | | (87 | ) |
Income Before Income Taxes | | | 1,105 | | | | 495 | | | | 3,217 | | | | 1,775 | |
Income Taxes(Note 9) | | | (279 | ) | | | (152 | ) | | | (819 | ) | | | (508 | ) |
Net Income | | $ | 826 | | | $ | 343 | | | $ | 2,398 | | | $ | 1,267 | |
| | | | |
Net Income Attributable to Common Shareholders | | $ | 826 | | | $ | 343 | | | $ | 2,398 | | | $ | 1,267 | |
| | | | |
Net Income per Share(Note 10) | | | | | | | | | | | | | | | | |
Basic | | $ | 0.96 | | | $ | 0.39 | | | $ | 2.80 | | | $ | 1.43 | |
Diluted | | $ | 0.94 | | | $ | 0.38 | | | $ | 2.73 | | | $ | 1.39 | |
Dividends per Share | | $ | 0.07 | | | $ | 0.03 | | | $ | 0.21 | | | $ | 0.10 | |
(See Notes to the Condensed Consolidated Financial Statements)
| | |
| PotashCorp 2011 Third Quarter Quarterly Report on Form 10-Q | | 2 |
Potash Corporation of Saskatchewan Inc.
Condensed Consolidated Statements of Comprehensive (Loss) Income
(in millions of US dollars)
(unaudited)
| | | | | | | | | | | | | | | | |
| | | Three Months Ended
September 30 | | | Nine Months Ended
September 30 | |
| (Net of related income taxes) | | 2011 | | | 2010 | | | 2011 | | | 2010 | |
Net Income | | $ | 826 | | | $ | 343 | | | $ | 2,398 | | | $ | 1,267 | |
Other comprehensive (loss) income | | | | | | | | | | | | | | | | |
Net (decrease) increase in net unrealized gains on available-for- sale investments(1) (Note 3) | | | (983 | ) | | | 924 | | | | (1,351 | ) | | | 202 | |
Net actuarial losses on defined benefit plans(2)(Note 5) | | | (125 | ) | | | — | | | | (125 | ) | | | — | |
Net losses on derivatives designated as cash flow hedges(3) | | | (18 | ) | | | (61 | ) | | | (18 | ) | | | (125 | ) |
Reclassification to income of net losses on cash flow hedges(4) | | | 10 | | | | 12 | | | | 38 | | | | 36 | |
Other | | | (5 | ) | | | 5 | | | | (5 | ) | | | 1 | |
Other Comprehensive (Loss) Income | | | (1,121 | ) | | | 880 | | | | (1,461 | ) | | | 114 | |
Comprehensive (Loss) Income | | $ | (295 | ) | | $ | 1,223 | | | $ | 937 | | | $ | 1,381 | |
| | | | |
Comprehensive (Loss) Income Attributable to Common Shareholders | | $ | (295 | ) | | $ | 1,223 | | | $ | 937 | | | $ | 1,381 | |
| (1) | Available-for-sale investments are comprised of shares in Israel Chemicals Ltd. and Sinofert Holdings Limited. |
| (2) | Net of income taxes of $(71) (2010 — $NIL) for the three and nine months ended September 30, 2011. |
| (3) | Cash flow hedges are comprised of natural gas derivative instruments, and are net of income taxes of $(11) (2010 — $(37)) for the three months ended September 30, 2011 and $(11) (2010 — $(76)) for the nine months ended September 30, 2011. |
| (4) | Net of income taxes of $7 (2010 — $8) for the three months ended September 30, 2011 and $23 (2010 — $22) for the nine months ended September 30, 2011. |
(See Notes to the Condensed Consolidated Financial Statements)
| | |
| 3 | | PotashCorp 2011 Third Quarter Quarterly Report on Form 10-Q |
Potash Corporation of Saskatchewan Inc.
Condensed Consolidated Statements of Changes in Equity
(in millions of US dollars)
(unaudited)
| | | | | | | | | | | | | | | | | | | | | | | | | | | | | | | | | | | | |
| | | Equity Attributable to Common Shareholders | |
| | | Share
Capital | | | Contributed
Surplus | | | Accumulated Other Comprehensive Income | | | Retained
Earnings | | | Total
Equity | |
| | | | Net
unrealized
gains on
available-for-
sale
investments | | | Net unrealized
losses on
derivatives
designated as
cash flow
hedges | | | Net actuarial
losses on
defined
benefit
plans
(Note 5) | | | Other | | | Total
Accumulated
Other
Comprehensive
Income | | | |
Balance — January 1, 2011 | | $ | 1,431 | | | $ | 308 | | | $ | 2,563 | | | $ | (177 | ) | | $ | — | (1) | | $ | 8 | | | $ | 2,394 | | | $ | 2,552 | | | $ | 6,685 | |
Net income | | | — | | | | — | | | | — | | | | — | | | | — | | | | — | | | | — | | | | 2,398 | | | | 2,398 | |
Other comprehensive (loss) income | | | — | | | | — | | | | (1,351 | ) | | | 20 | | | | (125 | ) | | | (5 | ) | | | (1,461 | ) | | | — | | | | (1,461 | ) |
Effect of share-based compensation | | | — | | | | (12 | ) | | | — | | | | — | | | | — | | | | — | | | | — | | | | — | | | | (12 | ) |
Dividends declared | | | — | | | | — | | | | — | | | | — | | | | — | | | | — | | | | — | | | | (180 | ) | | | (180 | ) |
Issuance of common shares | | | 37 | | | | — | | | | — | | | | — | | | | — | | | | — | | | | — | | | | — | | | | 37 | |
Transfer of actuarial losses on defined benefit plans | | | — | | | | — | | | | — | | | | — | | | | 125 | | | | — | | | | 125 | | | | (125 | ) | | | — | |
Balance — September 30, 2011 | | $ | 1,468 | | | $ | 296 | | | $ | 1,212 | | | $ | (157 | ) | | $ | — | (1) | | $ | 3 | | | $ | 1,058 | | | $ | 4,645 | | | $ | 7,467 | |
| (1) | Any amounts incurred during a period are cleared out to retained earnings at each period end. Therefore, no balance exists in the reserve at beginning or end of period. |
| | | | | | | | | | | | | | | | | | | | | | | | | | | | | | | | | | | | |
| | | Equity Attributable to Common Shareholders | |
| | | | | | | | | Accumulated Other Comprehensive Income | | | | | | | |
| | | Share
Capital | | | Contributed
Surplus | | | Unrealized
gains on
available-for-
sale
investments | | | Net unrealized
losses on
derivatives
designated as
cash flow
hedges | | | Net actuarial
losses on
defined
benefit
plans | | | Other | | | Total
Accumulated
Other
Comprehensive
Income | | | Retained
Earnings | | | Total
Equity | |
Balance — January 1, 2010 | | $ | 1,430 | | | $ | 273 | | | $ | 1,900 | | | $ | (111 | ) | | $ | — | (1) | | $ | 9 | | | $ | 1,798 | | | $ | 2,804 | | | $ | 6,305 | |
Net income | | | — | | | | — | | | | — | | | | — | | | | — | | | | — | | | | — | | | | 1,267 | | | | 1,267 | |
Other comprehensive income (loss) | | | — | | | | — | | | | 202 | | | | (89 | ) | | | — | | | | 1 | | | | 114 | | | | — | | | | 114 | |
Effect of share-based compensation | | | — | | | | 66 | | | | — | | | | — | | | | — | | | | — | | | | — | | | | — | | | | 66 | |
Dividends declared | | | — | | | | — | | | | — | | | | — | | | | — | | | | — | | | | — | | | | (89 | ) | | | (89 | ) |
Issuance of common shares | | | 52 | | | | — | | | | — | | | | — | | | | — | | | | — | | | | — | | | | — | | | | 52 | |
Balance — September 30, 2010 | | $ | 1,482 | | | $ | 339 | | | $ | 2,102 | | | $ | (200 | ) | | $ | — | (1) | | $ | 10 | | | $ | 1,912 | | | $ | 3,982 | | | $ | 7,715 | |
| (1) | Any amounts incurred during a period are cleared out to retained earnings at each period end. Therefore, no balance exists in the reserve at beginning or end of period. |
(See Notes to the Condensed Consolidated Financial Statements)
| | |
| PotashCorp 2011 Third Quarter Quarterly Report on Form 10-Q | | 4 |
Potash Corporation of Saskatchewan Inc.
Condensed Consolidated Statements of Cash Flow
(in millions of US dollars)
(unaudited)
| | | | | | | | | | | | | | | | |
| | | Three Months Ended
September 30 | | | Nine Months Ended
September 30 | |
| | | 2011 | | | 2010 | | | 2011 | | | 2010 | |
Operating Activities | | | | | | | | | | | | | | | | |
Net income | | $ | 826 | | | $ | 343 | | | $ | 2,398 | | | $ | 1,267 | |
Adjustments to reconcile net income to cash provided by operating activities | | | | | | | | | | | | | | | | |
Depreciation and amortization | | | 122 | | | | 106 | | | | 374 | | | | 325 | |
Share-based compensation | | | 3 | | | | 3 | | | | 22 | | | | 22 | |
Realized excess tax benefit related to share-based compensation | | | 6 | | | | 31 | | | | 29 | | | | 39 | |
Provision for deferred income tax | | | 189 | | | | 13 | | | | 342 | | | | 88 | |
Undistributed earnings of equity-accounted investees | | | (68 | ) | | | (50 | ) | | | (118 | ) | | | (78 | ) |
Pension and other post-retirement benefits | | | (145 | ) | | | (32 | ) | | | (131 | ) | | | (9 | ) |
Asset retirement obligations and accrued environmental costs | | | 22 | | | | 27 | | | | 40 | | | | 105 | |
Other | | | 9 | | | | 15 | | | | (23 | ) | | | 70 | |
Subtotal of adjustments | | | 138 | | | | 113 | | | | 535 | | | | 562 | |
Changes in non-cash operating working capital | | | | | | | | | | | | | | | | |
Receivables | | | (88 | ) | | | (64 | ) | | | (277 | ) | | | 326 | |
Inventories | | | 7 | | | | 147 | | | | (14 | ) | | | 117 | |
Prepaid expenses and other current assets | | | — | | | | 5 | | | | 12 | | | | (6 | ) |
Payables and accrued charges | | | (18 | ) | | | 43 | | | | (35 | ) | | | 128 | |
Subtotal of changes in non-cash operating working capital | | | (99 | ) | | | 131 | | | | (314 | ) | | | 565 | |
Cash provided by operating activities | | | 865 | | | | 587 | | | | 2,619 | | | | 2,394 | |
Investing Activities | | | | | | | | | | | | | | | | |
Additions to property, plant and equipment | | | (590 | ) | | | (562 | ) | | | (1,523 | ) | | | (1,517 | ) |
Purchase of long-term investments | | | — | | | | — | | | | — | | | | (422 | ) |
Other assets and intangible assets | | | (8 | ) | | | (28 | ) | | | (11 | ) | | | (99 | ) |
Cash used in investing activities | | | (598 | ) | | | (590 | ) | | | (1,534 | ) | | | (2,038 | ) |
Cash before financing activities | | | 267 | | | | (3 | ) | | | 1,085 | | | | 356 | |
Financing Activities | | | | | | | | | | | | | | | | |
Proceeds from long-term debt obligations | | | — | | | | — | | | | — | | | | 400 | |
Repayment of long-term debt obligations | | | — | | | | — | | | | (600 | ) | | | (400 | ) |
(Repayments of) proceeds from short-term debt obligations | | | (236 | ) | | | 1 | | | | (395 | ) | | | (332 | ) |
Dividends | | | (60 | ) | | | (30 | ) | | | (148 | ) | | | (89 | ) |
Issuance of common shares | | | 15 | | | | 25 | | | | 40 | | | | 40 | |
Cash used in financing activities | | | (281 | ) | | | (4 | ) | | | (1,103 | ) | | | (381 | ) |
Decrease in Cash and Cash Equivalents | | | (14 | ) | | | (7 | ) | | | (18 | ) | | | (25 | ) |
Cash and Cash Equivalents, Beginning of Period | | | 408 | | | | 367 | | | | 412 | | | | 385 | |
Cash and Cash Equivalents, End of Period | | $ | 394 | | | $ | 360 | | | $ | 394 | | | $ | 360 | |
Cash and cash equivalents comprised of: | | | | | | | | | | | | | | | | |
Cash | | $ | 78 | | | $ | 91 | | | $ | 78 | | | $ | 91 | |
Short-term investments | | | 316 | | | | 269 | | | | 316 | | | | 269 | |
| | | $ | 394 | | | $ | 360 | | | $ | 394 | | | $ | 360 | |
Supplemental cash flow disclosure | | | | | | | | | | | | | | | | |
Interest paid | | $ | 35 | | | $ | 38 | | | $ | 168 | | | $ | 143 | |
Income taxes paid (recovered) | | $ | 91 | | | $ | 64 | | | $ | 415 | | | $ | (76 | ) |
(See Notes to the Condensed Consolidated Financial Statements)
| | |
| 5 | | PotashCorp 2011 Third Quarter Quarterly Report on Form 10-Q |
Potash Corporation of Saskatchewan Inc.
Notes to the Condensed Consolidated Financial Statements
For the Three and Nine Months Ended September 30, 2011
(in millions of US dollars except share, per-share and percentage amounts)
(unaudited)
| 1. | Significant Accounting Policies |
Basis of Presentation
With its subsidiaries, Potash Corporation of Saskatchewan Inc. (“PCS”) — together known as “PotashCorp” or “the company” except to the extent the context otherwise requires — forms an integrated fertilizer and related industrial and feed products company.
The company previously prepared its financial statements in accordance with Canadian generally accepted accounting principles (“Canadian GAAP”) as set out in the Handbook of the Canadian Institute of Chartered Accountants (“CICA Handbook”). In 2010, the CICA Handbook was revised to incorporate International Financial Reporting Standards (“IFRS”), and required publicly accountable enterprises to apply such standards effective for years beginning on or after January 1, 2011, with early adoption permitted. Accordingly, these unaudited interim condensed consolidated financial statements are based on IFRS, as issued by the International Accounting Standards Board (“IASB”). In these unaudited interim condensed consolidated financial statements, the term “Canadian GAAP” refers to Canadian GAAP before the company’s adoption of IFRS.
These unaudited interim condensed consolidated financial statements have been prepared in accordance with International Accounting Standard (“IAS”) 34, “Interim Financial Reporting”, and IFRS 1, “First-Time Adoption of International Financial Reporting Standards” (“IFRS 1”). Subject to certain transition elections disclosed in Note 13 to the financial statements included in Part I Item 1 of the company’s 2011 First Quarter Quarterly Report on Form 10-Q, the company has consistently applied the same accounting policies throughout all periods presented. Note 13 referred to above describes the impact of the transition to IFRS on the company’s reported financial position and financial performance, including the nature and effect of significant changes in accounting policies from those used in its Canadian GAAP consolidated financial statements as at January 1, 2010 and December 31, 2010, and for the year ended December 31, 2010. Note 15 describes the impact of the transition to IFRS on the company’s reported financial position and financial performance as at and for the periods ended September 30, 2010. Except as disclosed in Note 14, these policies are consistent with accounting principles generally accepted in the United States (“US GAAP”) in all material respects.
These unaudited interim condensed consolidated financial statements were authorized by the Audit Committee of the Board of Directors for issue on November 4, 2011. The company will ultimately prepare its opening statement of financial position and financial statements for 2010 and 2011 by applying existing IFRS with an effective date of December 31, 2011 or prior. Accordingly, the financial statements for 2010 and 2011 may differ from these unaudited interim condensed consolidated financial statements.
These unaudited interim condensed consolidated financial statements include the accounts of PCS and its wholly owned subsidiaries; however, they do not include all disclosures normally provided in annual consolidated financial statements and should be read in conjunction with the 2010 annual consolidated financial statements and Part I Item 1, Notes 1 and 13 of the company’s 2011 First Quarter Quarterly Report on Form 10-Q. Certain information and note disclosures which are considered material to the understanding of the company’s unaudited interim condensed consolidated financial statements and which are normally included in annual consolidated financial statements prepared in accordance with IFRS were provided in Part I Item 1, Notes 1 and 13 of the company’s 2011 First Quarter Quarterly Report on Form 10-Q, along with reconciliations and descriptions of the effect of the transition from Canadian GAAP to IFRS on financial performance and financial position. In management’s opinion, the unaudited interim condensed consolidated financial statements include all adjustments (consisting solely of normal recurring adjustments) necessary to fairly present such information. Interim results are not necessarily indicative of the results expected for the fiscal year.
These unaudited interim condensed consolidated financial statements were prepared under the historical cost convention, except for certain items not carried at historical cost as discussed in Note 1 to the financial statements included in Part I Item 1 of the company’s 2011 First Quarter Quarterly Report on Form 10-Q.
| | |
| PotashCorp 2011 Third Quarter Quarterly Report on Form 10-Q | | 6 |
Recent Accounting Pronouncements
The following new standards and amendments or interpretations to existing standards have been published and are mandatory for periods beginning on or after January 1, 2011, or later:
IFRS 9, Financial Instruments
In November 2009, the IASB issued guidance relating to the classification and measurement of financial assets. Under IFRS 9, financial assets will generally be measured initially at fair value plus particular transaction costs, and subsequently at either amortized cost or fair value. In October 2010, the IASB issued additions to IFRS 9 relating to accounting for financial liabilities. Under the new requirements, an entity choosing to measure a financial liability at fair value will present the portion of any change in its fair value due to changes in the entity’s own credit risk in other comprehensive income (“OCI”), rather than within profit or loss. The standard is to be applied retrospectively and will be effective for periods commencing on or after January 1, 2013. The company is currently reviewing the standard to determine the potential impact, if any, on its consolidated financial statements.
Amendments to IFRIC 14, Prepayments of a Minimum Funding Requirement
In November 2009, the International Financial Reporting Interpretations Committee (“IFRIC”) issued amendments to IFRIC 14 relating to the prepayments of a minimum funding requirement for an employee defined benefit plan. The amendments apply when an entity is subject to minimum funding requirements and makes an early payment of contributions to cover those requirements. The amendments permit such an entity to treat the benefit of such an early payment as an asset. The amendment must be applied from the beginning of the first comparative period presented in the first financial statements in which the amendment is applied and became effective for periods commencing on or after January 1, 2011. The company has applied these amendments, which had no effect on these unaudited interim condensed consolidated financial statements.
Amendments to IFRS 7, Financial Instruments: Disclosures
In May 2010, the IASB issued amendments to IFRS 7 as part of its annual improvements process. The amendments addressed various requirements relating to the disclosure of financial instruments and are effective for annual periods commencing on or after January 1, 2011.
Amendments to IFRS 7, Disclosures — Transfers of Financial Assets
In October 2010, the IASB issued amendments to IFRS 7, “Financial Instruments: Disclosures”. The amendments require entities to provide additional disclosures to assist users of financial statements in evaluating the risk exposures relating to transfers of financial assets that are not derecognized or for which the entity has a continuing involvement in the transferred asset. The amendments became effective for annual periods beginning on or after July 1, 2011. The company does not typically retain any continuing involvement in financial assets once transferred. It has applied these amendments, which had no effect on these unaudited interim condensed consolidated financial statements.
IFRS 10, Consolidated Financial Statements
In May 2011, the IASB issued guidance establishing principles for the presentation and preparation of consolidated financial statements when an entity controls one or more other entities. IFRS 10 (which supersedes IAS 27 and Standing Interpretations Committee (“SIC”) 12) builds on existing principles by identifying the concept of control as the determining factor in whether an entity should be included within the consolidated financial statements of the parent company. The standard provides additional guidance to assist in the determination of control where this is difficult to assess. The standard is to be applied retrospectively, in most circumstances, and will be effective for annual periods commencing on or after January 1, 2013, with earlier application permitted. The company is currently reviewing the standard to determine the potential impact, if any, on its consolidated financial statements.
IFRS 11, Joint Arrangements
In May 2011, the IASB issued guidance establishing principles for financial reporting by parties to a joint arrangement. IFRS 11 (which supersedes IAS 31 and SIC 13) requires a party to a joint arrangement to determine the type of joint arrangement in which it is involved, either a joint operation or a joint venture, by assessing its rights and obligations arising from the arrangement. The existing policy choice of proportionate consolidation for jointly controlled entities has been eliminated and under IFRS 11, equity accounting is mandatory for participants in joint ventures. The standard is to be applied prospectively and will be effective for annual periods commencing on or after January 1, 2013, with earlier application permitted. The company is currently reviewing the standard to determine the potential impact, if any, on its consolidated financial statements.
| | |
| 7 | | PotashCorp 2011 Third Quarter Quarterly Report on Form 10-Q |
IFRS 12, Disclosure of Interest in Other Entities
In May 2011, the IASB issued guidance relating to the disclosure requirements of interests in other entities. IFRS 12 is a new and comprehensive standard on disclosure requirements for all forms of interest in other entities, including subsidiaries, joint arrangements, associates and unconsolidated structured entities. The standard is to be applied prospectively and is effective for annual periods commencing on or after January 1, 2013, with earlier application permitted. The company is currently reviewing the standard to determine the potential impact, if any, on its consolidated financial statements.
IFRS 13, Fair Value Measurement
In May 2011, the IASB issued guidance establishing a single source for fair value measurement. IFRS 13 defines fair value, sets out a framework for measuring fair value and introduces consistent requirements for disclosures on fair value measurements. It does not determine when an asset, a liability or an entity’s own equity instrument is measured at fair value. Rather, the measurement and disclosure requirements of IFRS 13 apply when another IFRS requires or permits the item to be measured at fair value, with limited exceptions. The standard is to be applied prospectively and will be effective for annual periods commencing on or after January 1, 2013, with earlier application permitted. The company is currently reviewing the standard to determine the potential impact, if any, on its consolidated financial statements.
Amendments to IAS 1, Presentation of Financial Statements
In June 2011, the IASB issued amendments to IAS 1 requiring items within OCI that may be reclassified to the profit or loss section of the income statement to be grouped together. The amendments are to be applied retrospectively and will be effective for annual periods commencing on or after July 1, 2012, with earlier application permitted. The company is currently reviewing these amendments to determine the potential impact on its consolidated financial statements.
Amendments to IAS 19, Employee Benefits
In June 2011, the IASB issued amendments to IAS 19 relating to the recognition and measurement of post-employment defined benefit expense and termination benefits, and to the disclosures for all employee benefits. The amendments are to be applied retrospectively, except for changes to the carrying value of assets that include capitalized employee benefit costs, which are to be applied prospectively. The amendments will be effective for annual periods commencing on or after January 1, 2013, with earlier application permitted. The company is currently reviewing these amendments to determine the potential impact on its consolidated financial statements.
IFRIC 20, Stripping Costs in the Production Phase of a Surface Mine
In October 2011, the IFRIC issued IFRIC 20 clarifying the requirements for accounting for stripping costs in the production phase of a surface mine. This interpretation clarifies when production stripping should lead to the recognition of an asset and how that asset should be measured, both initially and in subsequent periods. The interpretation will be effective for annual periods commencing on or after January 1, 2013, with earlier application permitted. The company is currently reviewing this interpretation to determine the potential impact, if any, on its consolidated financial statements.
| | | | | | | | |
| | | September 30,
2011 | | | December 31,
2010 | |
Finished products | | $ | 252 | | | $ | 255 | |
Intermediate products | | | 100 | | | | 127 | |
Raw materials | | | 88 | | | | 65 | |
Materials and supplies | | | 141 | | | | 123 | |
| | | $ | 581 | | | $ | 570 | |
| 3. | Available-for-Sale Investments |
The company assesses at the end of each reporting period whether there is objective evidence that a financial asset or group of financial assets is impaired. In the case of equity instruments classified as available-for-sale, for which unrealized gains and losses are generally recognized in OCI, a significant or prolonged decline in the fair value of the investment below its cost may be evidence that the assets are impaired. If objective evidence of impairment were to exist, the impaired amount (i.e., the unrealized loss) would be recognized in net income; any subsequent reversals would be recognized in OCI and would not flow back into net income.
At September 30, 2011, the company assessed whether there was objective evidence that its investment in Sinofert Holdings Limited (“Sinofert”) was impaired. The fair value of the investment, recorded in the consolidated statements of financial position, was $396 compared to the cost of $575. Factors considered in assessing impairment included the length of time and extent to which fair value had been below cost, and current financial and market conditions specific to Sinofert and the Chinese market.
The company concluded that objective evidence of impairment did not exist as at September 30, 2011 and, as a result, the unrealized holding loss of $179 was included in OCI. Impairment will be assessed again in future reporting periods if the fair value is below cost.
| | |
| PotashCorp 2011 Third Quarter Quarterly Report on Form 10-Q | | 8 |
On May 31, 2011, the company fully repaid $600 of 7.750 percent 10-year senior notes.
| 5. | Pension and Other Post-Retirement Benefits |
During the nine months ended September 30, 2011, the company contributed $156 to its defined benefit pension plans.
A remeasurement of the defined benefit plan assets and liabilities was performed at September 30, 2011. As a result of a loss on pension plan assets and a significant change in the discount rate, the company recorded net actuarial losses on defined benefit plans of $125 in OCI, which was recognized immediately in retained earnings at September 30, 2011. The company’s pension plan assets decreased by $33, defined benefit pension and other post-retirement benefit liabilities increased by $163 and deferred income tax liabilities decreased by $71 at September 30, 2011.
The discount rate used to determine the benefit obligation for the company’s significant plans at September 30, 2011 was 4.75 percent.
The benefit obligations and plan assets for the company’s pension and other post-retirement plans were as follows:
| | | | | | | | |
| | | September 30,
2011 | | | December 31,
2010 | |
Present value of defined benefit obligations | | $ | (1,379 | ) | | $ | (1,191 | ) |
Fair value of plan assets | | | 875 | | | | 753 | |
Funded status | | | (504 | ) | | | (438 | ) |
Past service costs not recognized in statements of financial position | | | (12 | ) | | | (13 | ) |
Accrued pension and other post-retirement benefit liabilities | | $ | (516 | ) | | $ | (451 | ) |
Amounts included in: | | | | | | | | |
Other assets | | $ | 23 | | | $ | 26 | |
Liabilities | | | | | | | | |
Current | | | (9 | ) | | | (9 | ) |
Long-term | | | (530 | ) | | | (468 | ) |
| | | $ | (516 | ) | | $ | (451 | ) |
Authorized
The company is authorized to issue an unlimited number of common shares without par value and an unlimited number of first preferred shares. The common shares are not redeemable or convertible. The first preferred shares may be issued in one or more series with rights and conditions to be determined by the Board of Directors. No first preferred shares have been issued.
Issued
| | | | | | | | |
| | | Number of
Common Shares | | | Consideration | |
Balance — December 31, 2010 | | | 853,122,693 | | | $ | 1,431 | |
Issued under option plans | | | 3,234,318 | | | | 35 | |
Issued for dividend reinvestment plan | | | 30,663 | | | | 2 | |
Balance — September 30, 2011 | | | 856,387,674 | | | $ | 1,468 | |
| | |
| 9 | | PotashCorp 2011 Third Quarter Quarterly Report on Form 10-Q |
The company’s operating segments have been determined based on reports reviewed by the Chief Executive Officer, its chief operating decision maker, that are used to make strategic decisions. The company has three reportable operating segments: potash, phosphate and nitrogen. These operating segments are differentiated by the chemical nutrient contained in the product that each produces. Inter-segment sales are made under terms that approximate market value. The accounting policies of the segments are the same as those described in Note 1.
| | | | | | | | | | | | | | | | | | | | |
| | | Three Months Ended September 30, 2011 | |
| | | Potash | | | Phosphate | | | Nitrogen | | | All Others | | | Consolidated | |
Sales | | $ | 1,035 | | | $ | 690 | | | $ | 596 | | | $ | — | | | $ | 2,321 | |
Freight, transportation and distribution | | | (59 | ) | | | (46 | ) | | | (24 | ) | | | — | | | | (129 | ) |
Net sales — third party | | | 976 | | | | 644 | | | | 572 | | | | — | | | | | |
Cost of goods sold | | | (276 | ) | | | (475 | ) | | | (309 | ) | | | — | | | | (1,060 | ) |
Gross margin | | | 700 | | | | 169 | | | | 263 | | | | — | | | | 1,132 | |
Depreciation and amortization | | | (33 | ) | | | (55 | ) | | | (32 | ) | | | (2 | ) | | | (122 | ) |
Inter-segment sales | | | — | | | | — | | | | 56 | | | | — | | | | — | |
| | | | | | | | | | | | | | | | | | | | |
| | | Three Months Ended September 30, 2010 | |
| | | Potash | | | Phosphate | | | Nitrogen | | | All Others | | | Consolidated | |
Sales | | $ | 637 | | | $ | 536 | | | $ | 402 | | | $ | — | | | $ | 1,575 | |
Freight, transportation and distribution | | | (55 | ) | | | (44 | ) | | | (20 | ) | | | — | | | | (119 | ) |
Net sales — third party | | | 582 | | | | 492 | | | | 382 | | | | — | | | | | |
Cost of goods sold | | | (243 | ) | | | (396 | ) | | | (267 | ) | | | — | | | | (906 | ) |
Gross margin | | | 339 | | | | 96 | | | | 115 | | | | — | | | | 550 | |
Depreciation and amortization | | | (28 | ) | | | (49 | ) | | | (27 | ) | | | (2 | ) | | | (106 | ) |
Inter-segment sales | | | — | | | | — | | | | 27 | | | | — | | | | — | |
| | | | | | | | | | | | | | | | | | | | |
| | | Nine Months Ended September 30, 2011 | |
| | | Potash | | | Phosphate | | | Nitrogen | | | All Others | | | Consolidated | |
Sales | | $ | 3,265 | | | $ | 1,872 | | | $ | 1,713 | | | $ | — | | | $ | 6,850 | |
Freight, transportation and distribution | | | (212 | ) | | | (129 | ) | | | (69 | ) | | | — | | | | (410 | ) |
Net sales — third party | | | 3,053 | | | | 1,743 | | | | 1,644 | | | | — | | | | | |
Cost of goods sold | | | (817 | ) | | | (1,258 | ) | | | (969 | ) | | | — | | | | (3,044 | ) |
Gross margin | | | 2,236 | | | | 485 | | | | 675 | | | | — | | | | 3,396 | |
Depreciation and amortization | | | (112 | ) | | | (159 | ) | | | (97 | ) | | | (6 | ) | | | (374 | ) |
Inter-segment sales | | | — | | | | — | | | | 133 | | | | — | | | | — | |
| | | | | | | | | | | | | | | | | | | | |
| | | Nine Months Ended September 30, 2010 | |
| | | Potash | | | Phosphate | | | Nitrogen | | | All Others | | | Consolidated | |
Sales | | $ | 2,170 | | | $ | 1,301 | | | $ | 1,255 | | | $ | — | | | $ | 4,726 | |
Freight, transportation and distribution | | | (202 | ) | | | (107 | ) | | | (64 | ) | | | — | | | | (373 | ) |
Net sales — third party | | | 1,968 | | | | 1,194 | | | | 1,191 | | | | — | | | | | |
Cost of goods sold | | | (688 | ) | | | (985 | ) | | | (816 | ) | | | — | | | | (2,489 | ) |
Gross margin | | | 1,280 | | | | 209 | | | | 375 | | | | — | | | | 1,864 | |
Depreciation and amortization | | | (87 | ) | | | (145 | ) | | | (87 | ) | | | (6 | ) | | | (325 | ) |
Inter-segment sales | | | — | | | | — | | | | 81 | | | | — | | | | — | |
| | |
| PotashCorp 2011 Third Quarter Quarterly Report on Form 10-Q | | 10 |
| | | | | | | | | | | | | | | | | | | | |
| Assets | | Potash | | | Phosphate | | | Nitrogen | | | All Others | | | Consolidated | |
Assets at September 30, 2011 | | $ | 7,143 | | | $ | 2,672 | | | $ | 1,891 | | | $ | 4,116 | | | $ | 15,822 | |
Assets at December 31, 2010 | | $ | 5,773 | | | $ | 2,395 | | | $ | 1,808 | | | $ | 5,571 | | | $ | 15,547 | |
Change in assets | | $ | 1,370 | | | $ | 277 | | | $ | 83 | | | $ | (1,455 | ) | | $ | 275 | |
Additions to property, plant and equipment
(nine months ended September 30, 2011) | | $ | 1,238 | | | $ | 133 | | | $ | 117 | | | $ | 35 | | | $ | 1,523 | |
| 8. | Share-Based Compensation |
On May 12, 2011, the company’s shareholders approved the 2011 Performance Option Plan under which the company may, after February 22, 2011 and before January 1, 2012, issue options to acquire up to 3,000,000 common shares. Under the plan, the exercise price shall not be less than the quoted market closing price of the company’s common shares on the last trading day immediately preceding the date of the grant, and an option’s maximum term is 10 years. In general, options will vest, if at all, according to a schedule based on the three-year average excess of the company’s consolidated cash flow return on investment over weighted average cost of capital. As of September 30, 2011, options to purchase a total of 1,144,100 common shares had been granted under the plan. The weighted average fair value of options granted was $23.64 per share, estimated as of the date of grant using the Black-Scholes-Merton option-pricing model with the following weighted average assumptions:
| | | | |
Expected dividend | | $ | 0.28 | |
Expected volatility | | | 52% | |
Risk-free interest rate | | | 2.29% | |
Expected life of options | | | 5.5 years | |
A separate estimated average annual effective tax rate is determined for each taxing jurisdiction and applied individually to the interim period pre-tax income of each jurisdiction.
For the three months ended September 30, 2011, the company’s income tax expense was $279 (2010 — $152). For the nine months ended September 30, 2011, its income tax expense was $819 (2010 — $508). The actual effective tax rate including discrete items for the three and nine months ended September 30, 2011 was 25 percent (2010 — 31 percent and 29 percent, respectively). Total discrete tax adjustments that impacted the rate in the three months ended September 30, 2011 resulted in an income tax recovery of $5 compared to an income tax expense of $17 in the same period last year. Total discrete tax adjustments that impacted the rate in the nine months ended September 30, 2011 resulted in an income tax recovery of $29 compared to an income tax expense of $42 in the same period last year. Significant items recorded included the following:
| Ÿ | | In first-quarter 2011, a current tax recovery of $21 for previously paid withholding taxes; |
| Ÿ | | In third-quarter 2011, a current tax recovery of $12 due to income tax losses in a foreign jurisdiction; |
| Ÿ | | In the first nine months of 2010, a tax expense of $34 to adjust the 2009 income tax provision to the income tax returns filed for that year. |
Income tax balances within the consolidated statements of financial position were comprised of the following:
| | | | | | | | | | |
| Income tax assets (liabilities) | | Statements of Financial Position Location | | September 30,
2011 | | | December 31,
2010 | |
Current income tax assets: | | | | | | | | | | |
Current | | Receivables | | $ | 28 | | | $ | 46 | |
Non-current | | Other assets | | | 114 | | | | 122 | |
Deferred income tax assets | | Other assets | | | 22 | | | | 38 | |
Total income tax assets | | | | $ | 164 | | | $ | 206 | |
Current income tax liabilities: | | | | | | | | | | |
Current | | Payables and accrued charges | | $ | (179 | ) | | $ | (167 | ) |
Non-current | | Other non-current liabilities and deferred credits | | | (80 | ) | | | (142 | ) |
Deferred income tax liabilities | | Deferred income tax liabilities | | | (1,064 | ) | | | (737 | ) |
Total income tax liabilities | | | | $ | (1,323 | ) | | $ | (1,046 | ) |
| | |
| 11 | | PotashCorp 2011 Third Quarter Quarterly Report on Form 10-Q |
Basic net income per share for the quarter is calculated on the weighted average number of shares issued and outstanding for the three months ended September 30, 2011 of 856,022,000 (2010 — 890,913,000). Basic net income per share for the nine months ended September 30, 2011 is calculated based on the weighted average number of shares issued and outstanding for the period of 855,024,000 (2010 — 889,475,000).
Diluted net income per share is calculated based on the weighted average number of shares issued and outstanding during the period. The denominator is: (1) increased by the total of the additional common shares that would have been issued assuming the exercise of all stock options with exercise prices at or below the average market price for the period; and (2) decreased by the number of shares that the company could have repurchased if it had used the assumed proceeds from the exercise of stock options to repurchase them on the open market at the average share price for the period. For performance-based stock option plans, the number of contingently issuable common shares included in the calculation is based on the number of shares, if any, that would be issuable if the end of the reporting period were the end of the performance period and the effect were dilutive. The weighted average number of shares outstanding for the diluted net income per share calculation for the three months ended September 30, 2011 was 876,959,000 (2010 — 915,694,000) and for the nine months ended September 30, 2011 was 876,844,000 (2010 — 914,448,000).
Excluded from the calculation of diluted net income per share were weighted average options outstanding of 1,392,450 relating to the 2008 Performance Option Plan, as the options’ exercise prices were greater than the average market price of common shares for the period.
The company’s sales of fertilizer can be seasonal. Typically, the second quarter of the year is when fertilizer sales will be highest, due to the North American spring planting season. However, planting conditions and the timing of customer purchases will vary each year and sales can be expected to shift from one quarter to another.
Canpotex
PCS is a shareholder in Canpotex Limited (“Canpotex”), which markets Saskatchewan potash offshore. Should any operating losses or other liabilities be incurred by Canpotex, the shareholders have contractually agreed to reimburse it for such losses or liabilities
in proportion to each shareholder’s productive capacity. Through September 30, 2011, there were no such operating losses or other liabilities.
Mining Risk
As is typical with other companies in the industry, the company is unable to acquire insurance for underground assets.
Legal and Other Matters
Significant environmental site assessment and/or remediation matters of note include the following:
| Ÿ | | The company, along with other parties, has been notified by the US Environmental Protection Agency (“USEPA”) of potential liability under the US Comprehensive Environmental Response, Compensation and Liability Act of 1980 (“CERCLA”) with respect to certain soil and groundwater conditions at a site in Lakeland, Florida that includes a former PCS Joint Venture fertilizer blending facility and certain surrounding properties. A Record of Decision (“ROD”) was issued in September 2007 and provides for a remedy that requires excavation of impacted soils and interim treatment of groundwater. The total remedy cost is estimated in the ROD to be $9. In September 2010, the USEPA approved the Remedial Design Report to address the soil contamination. While subject to final construction inspection by the USEPA, the soil remediation has been performed. |
| Ÿ | | The USEPA has identified PCS Nitrogen, Inc. (“PCS Nitrogen”) as a potentially responsible party with respect to a former fertilizer blending operation in Charleston, South Carolina known as the Planters Property or Columbia Nitrogen site, formerly owned by a company from which PCS Nitrogen acquired certain other assets. The USEPA has requested reimbursement of $3 of previously incurred response costs and the performance or financing of future site investigation and response activities from PCS Nitrogen and other named potentially responsible parties. In September 2005, Ashley II of Charleston, L.L.C. (“Ashley II”), the current owner of the Planters Property, filed a complaint in the United States District Court for the District of South Carolina seeking a declaratory judgment that PCS Nitrogen is liable to pay environmental response costs that Ashley II alleges it has incurred and will incur in connection with response activities at the site. After the Phase II trial, the district court allocated 30 percent of the liability for response costs at the site to PCS Nitrogen, as well as a proportional share of any costs that cannot be recovered from another responsible party. PCS Nitrogen and other responsible parties filed motions for amendment of the decision, and the Court ruled on those motions in May 2011. The Court’s amended judgment did not alter the 30 percent allocation of liability to PCS but did award relief to PCS under a contractual indemnification claim. PCS and another responsible party have |
| | |
| PotashCorp 2011 Third Quarter Quarterly Report on Form 10-Q | | 12 |
| | | since submitted post-judgment motions to the Court, which are pending, and PCS filed a notice of appeal to the United States Court of Appeals for the Fourth Circuit. The notice of appeal was subsequently stayed by the Fourth Circuit pending resolution of the post-judgment motions. The ultimate amount of liability for PCS Nitrogen, if any, depends upon the amount needed for remedial activities, the ability of other parties to pay and the availability of insurance. |
| Ÿ | | PCS Phosphate has agreed to participate, on a non-joint and several basis, with parties to an Administrative Settlement Agreement with the USEPA (“Settling Parties”) in the performance of a removal action and the payment of certain other costs associated with PCB soil contamination at the Ward Superfund Site in Raleigh, North Carolina (“Site”), including reimbursement of the USEPA’s past costs. The removal activities commenced at the Site in August 2007. The cost of performing the removal action at the Site is estimated at $75. The Settling Parties have initiated CERCLA contribution litigation against PCS Phosphate and more than 100 other entities. PCS Phosphate filed crossclaims and counterclaims seeking cost recovery. In addition to the removal action at the Site, the USEPA has investigated sediments downstream of the Site in what is called “Operable Unit 1”. In September 2008, the USEPA issued a final remedy for Operable Unit 1, with an estimated cost of $6. The USEPA issued a Unilateral Administrative Order (UAO) dated September 29, 2011 to a number of entities, requiring them to implement the remedy for Operable Unit 1. PCS Phosphate did not receive the UAO. At this time, the company is unable to evaluate the extent of any exposure that it may have for the matters addressed in the UAO. |
| Ÿ | | Pursuant to the 1996 Corrective Action Consent Order (the “Order”) executed between PCS Nitrogen Fertilizer, L.P., formerly known as Arcadian Fertilizer, L.P. (“PCS Nitrogen Fertilizer”) and Georgia Department of Natural Resources, Environmental Protection Division (“GEPD”) in conjunction with PCS Nitrogen Fertilizer’s purchase of real property located in Augusta, Georgia from the entity from which PCS Nitrogen Fertilizer previously leased such property, PCS Nitrogen Fertilizer agreed to perform certain activities to investigate and, if necessary, perform a corrective action for substances in soil and groundwater. The investigation has proceeded and various corrective measures for substances in groundwater have been proposed to GEPD. PCS Nitrogen Fertilizer expects that it will implement corrective measures for substances in groundwater, but until GEPD approves the investigation results and a final corrective action plan, PCS Nitrogen Fertilizer is unable to estimate with reasonable certainty the total cost of its corrective action obligations under the Order. |
| Ÿ | | In December 2009, during a routine inspection of a gypsum stack at the White Springs, Florida facility, a sinkhole was discovered that resulted in the loss of approximately 82 million gallons of water from the stack. The company is sampling production and monitoring wells on its property and drinking water wells on neighboring property to assess impacts. The company incurred costs of $17 to address the sinkhole between the time of discovery through completion of remediation in July 2011. In December 2010, the company entered into a consent order with the Florida Department of Environmental Protection pursuant to which the company agreed to, among other things, remediate the sinkhole and perform additional monitoring of the groundwater quality and hydrogeologic conditions related to the sinkhole collapse. The company also entered into an order on consent with the USEPA. In May 2011, the USEPA and the Board of Directors approved the company’s proposal to implement certain mitigation measures to meet the goals of the USEPA order on consent. The company remeasured the asset retirement obligation (“ARO”) for the White Springs gypsum stacks to account for the measures identified in the proposal. This remeasurement resulted in a $39 adjustment to the ARO, of which $33 was capitalized as an addition to the related long-lived asset and $6 was expensed in the first quarter of 2011. |
The company is also engaged in ongoing site assessment and/or remediation activities at a number of other facilities and sites. Based on current information, it does not believe that its future obligations with respect to these facilities and sites are reasonably likely to have a material adverse effect on its consolidated financial position or results of operations.
Other significant matters of note include the following:
| Ÿ | | The USEPA has an ongoing initiative to evaluate implementation within the phosphate industry of a particular exemption for mineral processing wastes under the hazardous waste program. In connection with this industry-wide initiative, the USEPA conducted inspections at numerous phosphate operations and notified the company of various alleged violations of the US Resource Conservation and Recovery Act (“RCRA”) at its plants in Aurora, North Carolina; Geismar, Louisiana; and White Springs, Florida. The company has entered into RCRA 3013 Administrative Orders on Consent and has performed certain site assessment activities at all three plants. At this time, the company does not know the scope of corrective action, if any, that may be required. The company continues to participate in settlement discussions with the USEPA but is uncertain if any resolution will be possible without litigation, or, if litigation occurs, what the outcome would be. At this time, the company is unable to evaluate the extent of any exposure that it may have in these matters. |
| | |
| 13 | | PotashCorp 2011 Third Quarter Quarterly Report on Form 10-Q |
| Ÿ | | The USEPA has also begun an initiative to evaluate compliance with the Clean Air Act at sulfuric acid and nitric acid plants. In connection with this industry-wide initiative, the USEPA has sent requests for information to numerous facilities, including the company’s plants in Augusta, Georgia; Aurora, North Carolina; Geismar, Louisiana; Lima, Ohio; and White Springs, Florida. The USEPA has notified the company of various alleged violations of the Clean Air Act at its Geismar, Louisiana plant. The government has demanded process changes and penalties that would cost a total of approximately $30, but the company denies that it has any liability for the Geismar, Louisiana matter. Although the company is proceeding with planning and permitting for the process changes demanded by the government, the company is uncertain if any resolution will be possible without litigation, or, if litigation occurs, what the outcome would be. In July 2010, without alleging any specific violation of the Clean Air Act, the USEPA requested that the company meet and demonstrate compliance with the Clean Air Act for specified projects undertaken at the White Springs, Florida sulfuric acid plants. The company participated in such meeting but, at this time, is unable to evaluate if it has any exposure. |
| Ÿ | | Significant portions of the company’s phosphate reserves in Aurora, North Carolina are located in wetlands. Under the Clean Water Act, the company must obtain a permit from the US Army Corps of Engineers (the “Corps”) before mining in the wetlands. In January 2009, the Division of Water Quality of the North Carolina Department of Natural Resources issued a certification under Section 401 of the Clean Water Act that mining of phosphate in excess of 30 years from lands owned or controlled by the company, including some wetlands, would not degrade water quality. Thereafter, in June 2009, the Corps issued the company a permit that will allow the company to mine the phosphate deposits identified in the Section 401 certification. The USEPA decided not to seek additional review of the permit. In March 2009, four environmental organizations (Pamlico-Tar River Foundation, North Carolina Coastal Federation, Environmental Defense Fund and Sierra Club) filed a Petition for a Contested Case Hearing before the North Carolina Office of Administrative Hearings (“OAH”) challenging the Section 401 certification. The company has intervened in this proceeding. Cross motions for summary judgment by the Petitioners and the company have been filed, briefed and argued. The OAH has not issued a decision on them. At this time, the company is unable to evaluate the extent of any exposure that it may have in this matter. |
| Ÿ | | In May 2009, the Canadian government announced that its new industrial greenhouse gas emissions policies will be coordinated with policies that may be implemented in the US. The Province of Saskatchewan is considering the adoption of greenhouse gas emission control requirements. Regulations pursuant to the Management and Reduction of Greenhouse Gases Act in |
| | | Saskatchewan, which impose a type of carbon tax to achieve a goal of a 20 percent reduction in greenhouse gas emissions by 2020 compared to 2006 levels, may become effective in 2012. There is no certainty as to the scope or timing of any final, effective provincial requirements. Although the US Congress has not passed any greenhouse gas emission control laws, the USEPA has adopted several rules to control greenhouse gas emissions using authority under existing environmental laws. In January 2011, the USEPA began phasing in requirements for all “stationary sources,” such as the company’s plants, to obtain permits incorporating the “best available control technology” for greenhouse gas emissions at a source if it is a new source that could emit 100,000 tons of greenhouse gases per year or if it is a modified source that increases such emissions by 75,000 tons per year. The company is not currently aware of any projects at its facilities that would be subject to these requirements. The company is monitoring these developments, and, except as indicated above, their effect on its operations cannot be determined with certainty at this time. |
| Ÿ | | In December 2010, the USEPA issued a final rule to restrict nutrient concentrations in surface waters in Florida to levels below those currently permitted at the company’s White Springs, Florida plant. The revised nutrient criteria will become part of Florida’s water quality standards in March 2012. Projected capital costs resulting from the rule could be in excess of $100 for the company’s White Springs, Florida plant, and there is no guarantee that controls can be implemented that are capable of achieving compliance with the revised nutrient standards under all flow conditions. This estimate assumes that the rule survives court challenges and that none of the site-specific mechanisms for relief from the revised nutrient criteria are available to the White Springs, Florida plant. Various judicial challenges to the rule have been filed, including one lawsuit by The Fertilizer Institute (“TFI”) and White Springs. On June 15, 2011, TFI, White Springs and additional parties filed a Motion for Summary Judgment seeking, among other things, to vacate the USEPA rule. On September 15, 2011, the USEPA filed its Motion for Summary Judgment seeking to uphold its rule. The prospects for a rule to be implemented as issued by the USEPA and the availability of the site-specific mechanisms are uncertain. |
| Ÿ | | The company, having been unable to agree with Mosaic Potash Esterhazy Limited Partnership (“Mosaic”) on the remaining amount of potash that the company is entitled to receive from Mosaic pursuant to the mining and processing agreement in respect of the company’s rights at the Esterhazy mine, issued a Statement of Claim in the Saskatchewan Court of Queen’s Bench (“Court”) against Mosaic on May 27, 2009 and the claim was amended on January 19, 2010. In the Amended Statement of Claim, the company has asserted that it has the right under the mining and processing agreement to receive potash from Mosaic |
| | |
| PotashCorp 2011 Third Quarter Quarterly Report on Form 10-Q | | 14 |
| | | until at least 2012 and potentially much later, and seeks an order from the Court declaring the amount of potash which the company has the right to receive. Mosaic, in its Statement of Defence, asserts that at a delivery rate of 1.24 million tons of product per year, the company’s entitlement to receive potash under the mining and processing agreement would terminate August 30, 2010. |
In addition, at the time of filing its Statement of Defence, Mosaic commenced a counterclaim against the company, asserting that the company has breached the mining and processing agreement due to its refusal to take delivery of potash product under the agreement based on an event of force majeure.
The company was notified on May 2, 2011 that Mosaic believes that it has satisfied its obligation to produce potash at the Esterhazy mine for the company under the mining and processing agreement and as such it has no further obligation to deliver potash to the company from the Esterhazy mine, other than the company’s remaining inventory. The company disagreed and sought relief from the Court. On June 30, 2011, an injunction order was issued by the Court requiring delivery pursuant to the terms of the mining and processing agreement pending trial or a further order of the Court (“Injunction Order”). The trial is currently scheduled to commence in January 2012. Like every applicant for injunctive relief, the company was required to provide an undertaking to pay any damages that may be occasioned to Mosaic as a result of the granting of the injunction should it later be shown that Mosaic had, by reason of the injunction, sustained any damages which the company ought to pay. The company does not believe that Mosaic will be entitled to any damages arising from the issuance of the Injunction Order. On July 18, 2011, Mosaic filed a Notice of Appeal with the Court of Appeal for Saskatchewan (“Court of Appeal”) appealing the Injunction Order and seeking to set it aside. On October 24, 2011, the Court of Appeal dismissed Mosaic’s appeal of the Injunction Order.
The company will continue to assert its position in this litigation vigorously and it denies liability to Mosaic in connection with its counterclaim.
| Ÿ | | Between September and October 2008, the company and PCS Sales (USA), Inc. were named as defendants in eight similar antitrust complaints filed in US federal courts. Other potash producers are also defendants in these cases. Each of the separate complaints alleges conspiracy to fix potash prices, to divide markets, to restrict supply and to fraudulently conceal the conspiracy, all in violation of Section 1 of the Sherman Act. On September 23, 2011, the United States Court of Appeals for the Seventh Circuit issued an opinion directing the trial court to dismiss certain of the plaintiffs’ claims. The plaintiffs have petitioned for rehearing en banc and proceedings are ongoing. |
| | | The company and PCS Sales (USA), Inc. believe each of these eight private antitrust lawsuits is without merit and intend to defend them vigorously. |
In addition, various other claims and lawsuits are pending against the company in the ordinary course of business. While it is not possible to determine the ultimate outcome of such actions at this time, and inherent uncertainties exist in predicting such outcomes, it is the company’s belief that the ultimate resolution of such actions is not reasonably likely to have a material adverse effect on its consolidated financial position or results of operations.
The breadth of the company’s operations and the global complexity of tax regulations require assessments of uncertainties and judgments in estimating the taxes it will ultimately pay. The final taxes paid are dependent upon many factors, including negotiations with taxing authorities in various jurisdictions, outcomes of tax litigation and resolution of disputes arising from federal, provincial, state and local tax audits. The resolution of these uncertainties and the associated final taxes may result in adjustments to the company’s tax assets and tax liabilities.
The company owns facilities that have been either permanently or indefinitely shut down. It expects to incur nominal annual expenditures for site security and other maintenance costs at certain of these facilities. Should the facilities be dismantled, certain other shutdown-related costs may be incurred. Such costs are not expected to have a material adverse effect on the company’s consolidated financial position or results of operations and would be recognized and recorded in the period in which they are incurred.
| 13. | Related Party Transactions |
The company sells potash from its Saskatchewan mines for use outside of North America exclusively to Canpotex, a potash export, sales and marketing company owned in equal shares by the three potash producers in the Province of Saskatchewan. Sales to Canpotex for the three months ended September 30, 2011 were $497 (2010 — $283) and nine months ended September 30, 2011 were $1,537 (2010 — $874). At September 30, 2011, $334 (December 31, 2010 — $298) was owing from Canpotex. Sales to Canpotex are at prevailing market prices and account balances resulting from the Canpotex transactions are settled on normal trade terms.
| | |
| 15 | | PotashCorp 2011 Third Quarter Quarterly Report on Form 10-Q |
| 14. | Reconciliation of IFRS and US GAAP |
IFRS vary in certain significant respects from US GAAP. As required by the United States Securities and Exchange Commission, the effect of these principal differences on the company’s unaudited interim condensed consolidated financial statements is described and quantified below.
(a) Inventories: Under IFRS, when the circumstances that previously caused inventories to be written down below cost no longer exist or when there is clear evidence of an increase in net realizable value because of changed economic circumstances, the amount of the writedown is reversed. The reversal is limited to the amount of the original writedown. Under US GAAP, the reversal of a writedown is not permitted unless the reversal relates to a writedown recorded in a prior interim period during the same fiscal year.
Under IFRS, interim price, efficiency, spending and volume variances of a manufacturing entity are recognized in income at interim reporting dates to the same extent that those variances are recognized in income at year-end. Deferral of variances that are expected to be absorbed by year-end is not appropriate because such deferrals could result in reporting inventory at the interim date at more or less than its portion of the actual cost of manufacture. Under US GAAP, variances that are planned and expected to be absorbed by the end of the year are ordinarily deferred at the end of an interim period.
(b) Long-term investments: Certain of the company’s investments in international entities are accounted for under the equity method. Accounting principles generally accepted in those foreign jurisdictions may vary in certain respects from US GAAP. The company’s share of earnings of these equity-accounted investees under IFRS has been adjusted for the significant effects of conforming to US GAAP.
(c) Property, plant and equipment: The net book value of property, plant and equipment under IFRS differs from that under US GAAP in certain respects, including the following:
Major repairs and maintenance, including turnarounds, are capitalized under IFRS and expensed under US GAAP unless costs represent a betterment, in which case capitalization under US GAAP is appropriate.
Borrowing costs under IFRS are capitalized to property, plant and equipment based on the weighted average interest rate on all of the company’s outstanding third-party debt; under US GAAP, only the weighted average interest rate on third-party long-term debt is used to determine the capitalized amount.
(d) Impairment of assets: Upon adopting IFRS, the company elected not to restate past business combinations, which resulted in the carrying amount of goodwill under IFRS being the same amount as it had been under previous Canadian GAAP at the date of transition to IFRS. Because past provisions for asset impairment were based on undiscounted cash flows from use under Canadian GAAP and on fair value under US GAAP, the carrying amount of goodwill is lower under US GAAP.
In respect of oil and gas assets, US GAAP requires that writedowns be based on discounted cash flows, a prescribed discount rate and the unweighted average first-day-of-the-month resource prices for the prior 12 months; IFRS requires discounted cash flows using estimated future resource prices based on the best information available to the company.
Assets, except goodwill, that were previously impaired can be reversed in subsequent periods, under IFRS, if the conditions that led to the original impairment reversed. Reversals of asset impairments are prohibited under US GAAP.
(e) Depreciation and amortization: Depreciation and amortization under IFRS differ from that under US GAAP, as a result of differences in the carrying amounts of property, plant and equipment under IFRS and US GAAP, as described above.
(f) Exploration costs: Under IFRS, capitalized exploration costs are classified as exploration and evaluation assets. For US GAAP, these costs are generally expensed until such time as a final feasibility study has confirmed the existence of a commercially mineable deposit.
(g) Pension and other post-retirement benefits: Under US GAAP, the company recognizes the difference between the benefit obligation and the fair value of plan assets in the consolidated statements of financial position with the offset to OCI. Amounts in OCI are amortized to net income. Under IFRS, actuarial gains and losses are recognized directly in OCI and cleared out to retained earnings without ever being amortized to net income. Unrecognized prior service costs are not recognized in OCI, but are amortized to net income over the average remaining vesting period.
(h) Offsetting of certain amounts: US GAAP requires an entity to adopt a policy of either offsetting or not offsetting fair value amounts recognized for derivative instruments and for the right to reclaim cash collateral or the obligation to return cash collateral against fair value amounts recognized for derivative instruments executed with the same counterparty under the same master netting arrangement. The company adopted a policy to offset such amounts. Under IFRS, offsetting of margin deposits is not permitted.
| | |
| PotashCorp 2011 Third Quarter Quarterly Report on Form 10-Q | | 16 |
(i) Share-based compensation: Under IFRS, stock options are recognized over the service period, which for PotashCorp is established by the option performance period. Under US GAAP, stock options are recognized over the requisite service period, which does not commence until the option plan is approved by the company’s shareholders and options are granted thereunder.
| | | | | | | | |
Performance Option Plan Year | | Service Period Commenced | |
| | IFRS | | | US GAAP | |
2008 | | | January 1, 2008 | | | | May 8, 2008 | |
2009 | | | January 1, 2009 | | | | May 7, 2009 | |
2010 | | | January 1, 2010 | | | | May 6, 2010 | |
2011 | | | January 1, 2011 | | | | May 12, 2011 | |
This difference impacts the share-based compensation cost recorded and may impact diluted earnings per share.
Further, under IFRS the company recognized an estimate of compensation cost in relation to performance options for which service commenced but which had not yet been granted. Specifically, an estimate of compensation cost was recognized at the end of the first quarter of 2011 in relation to the 2011 Performance Option Plan, which was approved by shareholders at the company’s annual meeting on May 12, 2011, for which service commenced but for which performance options had not yet been granted. The compensation cost recognized was reconciled in the second quarter once options were granted. Under US GAAP, no compensation cost is recognized until the option plans are approved.
(j) Stripping costs: Under IFRS, the company capitalizes and amortizes costs associated with the activity of removing overburden and other mine waste minerals in the production phase. US GAAP requires such stripping costs to be attributed to ore produced in that period as a component of inventory and recognized in cost of sales in the same period as related revenue.
(k) Provisions: Asset retirement obligations under IFRS are measured and remeasured each reporting period using a current risk-free discount rate. Under US GAAP, the obligation is initially measured using a credit-adjusted risk-free discount rate. Subsequent upward revisions are measured using the current discount rate while downward revisions are valued using the historical discount rate. Under IFRS, obligations incurred through the production of inventory are included in the cost of that inventory. Under US GAAP, obligations incurred through the production of inventory are added to the carrying amount of the related long-lived asset or charged to expense as incurred. Under IFRS, provisions for asset retirement obligations include constructive obligations. Under US GAAP, only legal obligations are recognized.
Under IFRS, a provision is recognized for either a legal or constructive obligation when the applicable criteria are otherwise met. Under US GAAP, constructive obligations are recognized only when required under a specific standard.
(l) Income taxes related to the above adjustments: The income tax adjustment reflects the impact on income taxes of the US GAAP adjustments described above. Accounting for income taxes under IFRS and US GAAP is similar, except that income tax rates of enacted or substantively enacted tax law must be used to calculate deferred income tax assets and liabilities under IFRS, whereas only income tax rates of enacted tax law can be used under US GAAP.
(m) Income taxes related to US GAAP effective income tax rate: As it relates to interim periods, under IFRS a separate estimated average annual effective income tax rate is determinedfor each taxing jurisdiction and applied individually to the interim period pre-tax income of each jurisdiction, whereas under US GAAP a weighted average of the annual rates expected across all jurisdictions is applied.
(n) Income tax consequences of share-based employee compensation: Under IFRS, the income tax benefit attributable to share-based compensation that is deductible in computing taxable income but is not recorded in the consolidated financial statements as an expense of any period includes the amount realized in the period (the “realized excess benefit”), as well as the amount of future tax deductions that the company expects to receive based on the current market price of the shares (the “unrealized excess benefit”). The unrealized excess benefit is recognized as a deferred income tax asset with the offset recorded in contributed surplus. Under US GAAP, only the realized excess benefit is recorded, in additional paid-in capital.
Under IFRS, the income tax benefit associated with share-based compensation that is recorded in the consolidated financial statements as an expense in the current or previous period is reviewed at each statement of financial position date and amended to the extent that it is no longer probable that the related tax benefit will be realized. Under US GAAP, this income tax benefit is calculated without estimating the income tax effects of anticipated share-based payment transactions.
| | |
| 17 | | PotashCorp 2011 Third Quarter Quarterly Report on Form 10-Q |
(o) Uncertain income tax positions: US GAAP prescribes a comprehensive model for how a company should recognize, measure, present and disclose in its consolidated financial statements uncertain income tax positions that it has taken or expects to take on a tax return (including a decision whether to file or not to file a return in a particular jurisdiction). IFRS have no similar requirements related to uncertain income tax positions. The company accounts for uncertain income tax positions under IFRS using the standards applicable to current income tax assets and liabilities, i.e., both liabilities and assets are recorded when probable at the company’s best estimate of the amount.
(p) Income taxes related to intragroup transactions: Under IFRS, unrealized profits resulting from intragroup transactions are eliminated from the carrying amount of assets, but no equivalent adjustment is made for tax purposes. The difference between the tax rates of the two entities will result in an impact on net income. This differs from US GAAP, where the current tax payable in relation to such profits is recorded as a current asset until the transaction is realized by the group.
(q) Classification of deferred income taxes: Under IFRS, deferred income taxes are classified as long-term. Under US GAAP, deferred income taxes are separated between current and long-term on the consolidated statements of financial position.
(r) Cash flow statements: US GAAP requires the disclosure of income taxes paid. IFRS require the disclosure of income tax cash flows, which would include any income taxes recovered during the period. For the three and nine months ended September 30, 2011, income taxes paid under US GAAP were $104 (2010 — $74) and $462 (2010 — $145), respectively. Under IFRS, interest paid is not reduced for the effects of capitalized interest whereas under US GAAP this amount is net of capitalized interest. Interest paid under US GAAP for the three and nine months ended September 30, 2011 was $14 (2010 — $1) and $105 (2010 — $55), respectively.
(s) Diluted weighted average shares outstanding: Under US GAAP, the year-to-date diluted earnings per share is based on the weighted average of each interim period’s dilutive incremental shares making up the year-to-date period. Under IFRS, diluted shares are determined independently on a year-to-date basis for the period.
| | |
| PotashCorp 2011 Third Quarter Quarterly Report on Form 10-Q | | 18 |
The application of US GAAP, as described above, would have had the following effects on net income, net income per share, total assets and shareholders’ equity.
| | | | | | | | | | | | | | | | |
| | | Three Months Ended
September 30 | | | Nine Months Ended September 30 | |
| | | 2011 | | | 2010 | | | 2011 | | | 2010 | |
Net income as reported — IFRS | | $ | 826 | | | $ | 343 | | | $ | 2,398 | | | $ | 1,267 | |
Items increasing (decreasing) reported net income | | | | | | | | | | | | | | | | |
Inventory valuation(a) | | | — | | | | — | | | | — | | | | 1 | |
Manufacturing cost variances(a) | | | 18 | | | | 49 | | | | 4 | | | | 34 | |
Share of earnings of equity-accounted investees(b) | | | — | | | | — | | | | (1 | ) | | | — | |
Major repairs and maintenance(c) | | | (7 | ) | | | (28 | ) | | | (19 | ) | | | (36 | ) |
Borrowing costs(c) | | | 4 | | | | 3 | | | | 11 | | | | 9 | |
Asset impairment, writedowns and recoveries(d) | | | — | | | | 6 | | | | (1 | ) | | | (26 | ) |
Depreciation and amortization(e) | | | 2 | | | | 2 | | | | 7 | | | | 6 | |
Exploration costs(f) | | | 1 | | | | — | | | | — | | | | (1 | ) |
Pension and other post-retirement benefits(g) | | | (6 | ) | | | (6 | ) | | | (16 | ) | | | (18 | ) |
Share-based compensation(i) | | | (2 | ) | | | (1 | ) | | | — | | | | — | |
Stripping costs(j) | | | (1 | ) | | | (1 | ) | | | 4 | | | | (16 | ) |
Asset retirement obligations(k) | | | 26 | | | | 8 | | | | 37 | | | | 33 | |
Constructive obligations(k) | | | — | | | | (1 | ) | | | — | | | | (1 | ) |
Deferred income taxes relating to the above adjustments(l) | | | (9 | ) | | | (8 | ) | | | (7 | ) | | | 2 | |
Income taxes related to US GAAP effective income tax rate(m) | | | 5 | | | | 3 | | | | 7 | | | | 5 | |
Income taxes related to share-based employee compensation(n) | | | 3 | | | | — | | | | 3 | | | | — | |
Uncertain income tax positions(o) | | | 1 | | | | (14 | ) | | | 7 | | | | (23 | ) |
Income taxes related to intragroup transactions(p) | | | 5 | | | | 8 | | | | 2 | | | | 26 | |
Net income — US GAAP | | $ | 866 | | | $ | 363 | | | $ | 2,436 | | | $ | 1,262 | |
Basic weighted average shares outstanding — US GAAP | | | 856,022,000 | | | | 890,913,000 | | | | 855,024,000 | | | | 889,475,000 | |
Diluted weighted average shares outstanding — US GAAP(I,s) | | | 876,948,000 | | | | 915,656,000 | | | | 876,624,000 | | | | 914,409,000 | |
Basic net income per share — US GAAP | | $ | 1.01 | | | $ | 0.41 | | | $ | 2.85 | | | $ | 1.42 | |
Diluted net income per share — US GAAP | | $ | 0.99 | | | $ | 0.40 | | | $ | 2.78 | | | $ | 1.38 | |
References relate to differences between IFRS and US GAAP described above. | | | | | | | | | | | | | |
| | | | | | | | | September 30,
2011 | | | December 31,
2010 | |
Total assets as reported — IFRS | | | | | | | | | | $ | 15,822 | | | $ | 15,547 | |
Items increasing (decreasing) reported total assets | | | | | | | | | | | | | | | | |
Investment in equity-accounted investees(b) | | | | | | | | | | | 42 | | | | 40 | |
Property, plant and equipment(d, e) | | | | | | | | | | | (102 | ) | | | (109 | ) |
Major repairs and maintenance(c) | | | | | | | | | | | (71 | ) | | | (52 | ) |
Borrowing costs(c) | | | | | | | | | | | 36 | | | | 25 | |
Goodwill(d) | | | | | | | | | | | (47 | ) | | | (47 | ) |
Asset impairment, writedowns and recoveries(d) | | | | | | | | | | | (6 | ) | | | (5 | ) |
Exploration costs(f) | | | | | | | | | | | (14 | ) | | | (14 | ) |
Margin deposits associated with derivative instruments(h) | | | | | | | | | | | (172 | ) | | | (198 | ) |
Stripping costs(j) | | | | | | | | | | | (58 | ) | | | (62 | ) |
Asset retirement obligations(k) | | | | | | | | | | | (117 | ) | | | (46 | ) |
Uncertain income tax positions(o) | | | | | | | | | | | (69 | ) | | | (122 | ) |
Income taxes related to intragroup transactions(p) | | | | | | | | | | | 12 | | | | 15 | |
Deferred income tax asset due to US GAAP adjustments | | | | | | | | | | | (13 | ) | | | (13 | ) |
Reclassification of deferred income taxes(q) | | | | | | | | | | | 21 | | | | 28 | |
Total assets — US GAAP | | | | | | | | | | $ | 15,264 | | | $ | 14,987 | |
References relate to differences between IFRS and US GAAP described above.
| | |
| 19 | | PotashCorp 2011 Third Quarter Quarterly Report on Form 10-Q |
| | | 0 | | | | 0 | |
| | | September 30,
2011 | | | December 31,
2010 | |
Total shareholders’ equity as reported — IFRS | | $ | 7,467 | | | $ | 6,685 | |
Items increasing (decreasing) reported shareholders’ equity | | | | | | | | |
Manufacturing cost variances(a) | | | 4 | | | | — | |
Share of earnings of equity-accounted investees(b) | | | 41 | | | | 42 | |
Major repairs and maintenance(c) | | | (71 | ) | | | (52 | ) |
Borrowing costs(c) | | | 36 | | | | 25 | |
Asset impairment, writedowns and recoveries(d) | | | (257 | ) | | | (256 | ) |
Depreciation and amortization(e) | | | 102 | | | | 95 | |
Exploration costs(f) | | | (14 | ) | | | (14 | ) |
Pension and other post-retirement benefits(g) | | | 14 | | | | 13 | |
Stripping costs(j) | | | (58 | ) | | | (62 | ) |
Asset retirement obligations(k) | | | 116 | | | | 79 | |
Constructive obligations(k) | | | 5 | | | | 5 | |
Deferred income taxes relating to the above adjustments(l) | | | 1 | | | | 12 | |
Income taxes related to US GAAP effective income tax rate(m) | | | (40 | ) | | | (47 | ) |
Deferred income taxes on share-based compensation(n) | | | (88 | ) | | | (148 | ) |
Uncertain income tax positions(o) | | | 40 | | | | 33 | |
Income taxes related to intragroup transactions(p) | | | 8 | | | | 6 | |
Shareholders’ equity — US GAAP | | $ | 7,306 | | | $ | 6,416 | |
References relate to differences between IFRS and US GAAP described above.
Supplemental US GAAP Disclosures
Disclosures About Derivative Instruments and Hedging Activities
Derivative financial instruments are used by the company to manage its exposure to commodity price, exchange rate and interest rate fluctuations. Further information, including strategies, is provided in Note 12 to the consolidated financial statements in the company’s 2010 Financial Review Annual Report.
Fair Values of Derivative Instruments in the Condensed Consolidated Statements of Financial Position
| | | | | | | | | | |
| Derivative Instrument Assets (Liabilities)(1) | | Statements of Financial Position Location | | September 30,
2011 | | | December 31,
2010 | |
Derivatives designated as hedging instruments: | | | | | | | | |
Natural gas derivatives | | Prepaid expenses and other current assets | | $ | 2 | | | $ | — | |
Natural gas derivatives | | Other assets | | | 2 | | | | — | |
Natural gas derivatives | | Current portion of derivative instrument liabilities | | | (58 | ) | | | (75 | ) |
Natural gas derivatives | | Derivative instrument liabilities | | | (193 | ) | | | (204 | ) |
Total derivatives designated as hedging instruments | | | (247 | ) | | | (279 | ) |
Derivatives not designated as hedging instruments: | | | | | | | | |
Natural gas derivatives | | Current portion of derivative instrument liabilities | | | (1 | ) | | | — | |
Foreign currency derivatives | | Prepaid expenses and other current assets | | | — | | | | 5 | |
Foreign currency derivatives | | Current portion of derivative instrument liabilities | | | (23 | ) | | | — | |
Total derivatives not designated as hedging instruments | | $ | (24 | ) | | $ | 5 | |
| (1) | All fair value amounts are gross and exclude netted cash collateral balances. |
| | |
| PotashCorp 2011 Third Quarter Quarterly Report on Form 10-Q | | 20 |
The Effect of Derivative Instruments on the Condensed Consolidated Statements of Income for the Three Months Ended September 30
| | | | | | | | | | | | | | | | | | | | | | | | | | | | |
Derivatives in Cash Flow Hedging Relationships | | Amount of Loss
Recognized in
OCI (Effective
Portion) | | | Location of
Loss Reclassified
from Accumulated
OCI into Income (Effective Portion) | | Amount of Loss
Reclassified
from
Accumulated
OCI into Income
(Effective
Portion) | | | Location of Loss
Recognized in Income
(Ineffective Portion
and Amount
Excluded from Effectiveness Testing) | | Amount of Loss
Recognized in
Income
(Ineffective
Portion and Amount
Excluded from
Effectiveness
Testing) | |
| | 2011 | | | 2010 | | | | 2011 | | | 2010 | | | | 2011 | | | 2010 | |
Natural gas derivatives | | $ | (29 | ) | | $ | (98 | ) | | Cost of goods sold | | $ | (17 | ) | | $ | (20 | ) | | Cost of goods sold | | $ | — | | | $ | — | |
| | | | | | | | | | |
| | | | | Amount of (Loss) Gain Recognized in Income | |
| Derivatives Not Designated as Hedging Instruments | | Location of (Loss) Gain Recognized in Income | | 2011 | | | 2010 | |
Natural gas derivatives | | Cost of goods sold | | $ | (1 | ) | | $ | — | |
Foreign currency derivatives | | Other expenses | | $ | (23 | ) | | $ | 10 | |
The Effect of Derivative Instruments on the Condensed Consolidated Statements of Income for the Nine Months Ended September 30
| | | | | | | | | | | | | | | | | | | | | | | | | | | | |
Derivatives in Cash Flow Hedging Relationships | | Amount of Loss
Recognized in
OCI (Effective
Portion) | | | Location of Loss Reclassified
from Accumulated
OCI into Income (Effective Portion) | | Amount of Loss
Reclassified
from
Accumulated
OCI into Income
(Effective
Portion) | | | Location of Loss
Recognized in Income
(Ineffective Portion
and Amount
Excluded from Effectiveness Testing) | | Amount of Loss
Recognized in
Income
(Ineffective
Portion and Amount
Excluded from
Effectiveness
Testing) | |
| | 2011 | | | 2010 | | | | 2011 | | | 2010 | | | | 2011 | | | 2010 | |
Natural gas derivatives | | $ | (29 | ) | | $ | (201 | ) | | Cost of goods sold | | $ | (61 | ) | | $ | (58 | ) | | Cost of goods sold | | $ | — | | | $ | — | |
| | | | | | | | | | |
| | | | | Amount of (Loss) Gain Recognized in Income | |
| Derivatives Not Designated as Hedging Instruments | | Location of (Loss) Gain Recognized in Income | | 2011 | | | 2010 | |
Natural gas derivatives | | Cost of goods sold | | $ | (1 | ) | | $ | — | |
Foreign currency derivatives | | Other expenses | | $ | (12 | ) | | $ | 1 | |
| | |
| 21 | | PotashCorp 2011 Third Quarter Quarterly Report on Form 10-Q |
Financial Instruments and Related Risk Management
Financial Risks
The company is exposed in varying degrees to a variety of financial risks from its use of financial instruments: credit risk, liquidity risk and market risk. The source of risk exposure and how each is managed is described in Note 25 to the consolidated financial statements in the company’s 2010 Financial Review Annual Report.
Credit Risk
The company is exposed to credit risk on its cash and cash equivalents, receivables and derivative instrument assets. The maximum exposure to credit risk is represented by the carrying amount of the financial assets.
The company sells potash from its Saskatchewan mines for use outside Canada and the US exclusively to Canpotex. Sales to Canpotex are at prevailing market prices and are settled on normal trade terms. There were no amounts past due or impaired relating to amounts owing to the company from Canpotex.
Liquidity Risk
Liquidity risk arises from the company’s general funding needs and in the management of its assets, liabilities and optimal capital structure. It manages its liquidity risk to maintain sufficient liquid financial resources to fund its operations and meet its commitments and obligations in a cost-effective manner. In managing its liquidity risk, the company has access to a range of funding options.
Certain derivative instruments of the company contain provisions that require its debt to maintain specified credit ratings from two major credit rating agencies. If the company’s debt were to fall below the specified ratings, it would be in violation of these provisions, and the counterparties to the derivative instruments could request immediate payment or demand immediate and
ongoing full overnight collateralization on derivative instruments in net liability positions. The aggregate fair value of all derivative instruments with credit risk-related contingent features that were in a liability position on September 30, 2011 was $252, for which the company has posted collateral of $172 in the normal course of business. If the credit risk-related contingent features underlying these agreements had been triggered on September 30, 2011, the company would have been required to post an additional $77 of collateral to its counterparties.
Market Risk
Market risk is the risk that financial instrument fair values will fluctuate due to changes in market prices. The significant market risks to which the company is exposed are foreign exchange risk and price risk (related to natural gas used in operations).
Foreign Exchange Risk
At September 30, 2011, the company had entered into foreign currency forward contracts to sell US dollars and receive Canadian dollars in the notional amount of $530 (December 31, 2010 — $170) at an average exchange rate of 1.0041 (December 31, 2010 — 1.0170) per US dollar with maturities in 2011. At September 30, 2011, the company had foreign currency swaps to sell US dollars and receive Canadian dollars in the notional amount of $NIL (December 31, 2010 — $69) at an average exchange rate of NIL (December 31, 2010 — 1.0174) per US dollar.
Price Risk
At September 30, 2011, the company had natural gas derivatives qualifying for hedge accounting in the form of swaps for which it has price risk exposure; derivatives represented a notional amount of 51 million MMBtu with maturities in 2011 through 2019. At December 31, 2010, the notional amount of swaps was 103 million MMBtu with maturities in 2011 through 2019.
| | |
| PotashCorp 2011 Third Quarter Quarterly Report on Form 10-Q | | 22 |
Fair Value
Fair value represents point-in-time estimates that may change in subsequent reporting periods due to market conditions or other factors.
Presented below is a comparison of the fair value of each financial instrument to its carrying value.
| | | | | | | | | | | | | | | | |
| | | September 30, 2011 | | | December 31, 2010 | |
| | | Carrying Amount
of Asset (Liability) | | | Fair Value
of Asset (Liability) | | | Carrying Amount
of Asset (Liability) | | | Fair Value
of Asset (Liability) | |
Derivative instrument assets | | | | | | | | | | | | | | | | |
Natural gas derivatives | | $ | 4 | | | $ | 4 | | | $ | — | | | $ | — | |
Foreign currency derivatives | | | — | | | | — | | | | 5 | | | | 5 | |
Investments in ICL and Sinofert | | | 2,491 | | | | 2,491 | | | | 3,842 | | | | 3,842 | |
Derivative instrument liabilities | | | | | | | | | | | | | | | | |
Natural gas derivatives | | | (252 | ) | | | (252 | ) | | | (279 | ) | | | (279 | ) |
Foreign currency derivatives | | | (23 | ) | | | (23 | ) | | | — | | | | — | |
Long-term debt | | | | | | | | | | | | | | | | |
Senior notes | | | (3,750 | ) | | | (4,194 | ) | | | (4,350 | ) | | | (4,525 | ) |
Other | | | (7 | ) | | | (7 | ) | | | (8 | ) | | | (8 | ) |
Due to their short-term nature, the fair value of cash and cash equivalents, receivables, short-term debt, and payables and accrued charges is assumed to approximate carrying value. The fair value of the company’s senior notes at September 30, 2011 reflected the yield valuation based on observed market prices. Yield on senior notes ranged from 1.04 percent to 4.61 percent (December 31, 2010 — 1.08 percent to 5.66 percent). The fair value of the company’s other long-term debt instruments approximated carrying value.
Interest rates used to discount estimated cash flows related to derivative instruments that were not traded in an active market at September 30, 2011 were between 0.48 percent and 5.73 percent (December 31, 2010 — between 0.47 percent and 4.31 percent) depending on the settlement date.
The following table presents the company’s fair value hierarchy for those financial assets and financial liabilities carried at fair value at September 30, 2011.
| | | | | | | | | | | | | | | | |
| | | | | | Fair Value Measurements at Reporting Date Using: | |
| Description | | Carrying Amount
of Asset (Liability) | | | Quoted Prices in
Active Markets for
Identical Assets
(Level 1) | | | Significant Other
Observable
Inputs (Level 2) | | | Significant
Unobservable
Inputs (Level 3) | |
September 30, 2011 | | | | | | | | | | | | | | | | |
Derivative instrument assets | | | | | | | | | | | | | | | | |
Natural gas derivatives | | $ | 4 | | | $ | — | | | $ | — | | | $ | 4 | (2) |
Investments in ICL and Sinofert | | | 2,491 | | | | 2,491 | (1) | | | — | | | | — | |
Derivative instrument liabilities | | | | | | | | | | | | | | | | |
Natural gas derivatives | | | (252 | ) | | | — | | | | (34 | )(2) | | | (218 | )(2) |
Foreign currency derivatives | | | (23 | ) | | | — | | | | (23 | )(1) | | | — | |
| | | | | | | | | | | | | | | | |
December 31, 2010 | | | | | | | | | | | | | | | | |
Derivative instrument assets | | | | | | | | | | | | | | | | |
Foreign currency derivatives | | $ | 5 | | | $ | — | | | $ | 5 | | | $ | — | |
Investments in ICL and Sinofert | | | 3,842 | | | | 3,842 | | | | — | | | | — | |
Derivative instrument liabilities | | | | | | | | | | | | | | | | |
Natural gas derivatives | | | (279 | ) | | | — | | | | (55 | ) | | | (224 | ) |
| (1) | During the period ending September 30, 2011, there were no transfers between Level 1 and Level 2. |
| (2) | During the period ending September 30, 2011, there were no transfers into Level 3 and $4 was transferred out of Level 3 into Level 2 as (due to the passage of time) the terms of certain natural gas derivatives now mature within 36 months. Company policy is to recognize transfers at the end of the reporting period. |
| | |
| 23 | | PotashCorp 2011 Third Quarter Quarterly Report on Form 10-Q |
Fair Value Measurements Using Significant Unobservable Inputs (Level 3)
| | | | | | | | |
| | | Natural Gas Hedging Derivatives | |
| | | Nine Months
Ended
September 30,
2011 | | | Twelve Months
Ended
December 31,
2010 | |
Balance, beginning of period | | $ | (224 | ) | | $ | (119 | ) |
Total losses (realized and unrealized) before income taxes | | | | | | | | |
Included in earnings (cost of goods sold) | | | (20 | ) | | | (36 | ) |
Included in other comprehensive income | | | (1 | ) | | | (126 | ) |
Settlements | | | 27 | | | | 46 | |
Transfers out of Level 3 | | | 4 | | | | 11 | |
Balance, end of period | | $ | (214 | ) | | $ | (224 | ) |
Pension and Other Post-Retirement Expenses
| | | | | | | | | | | | | | | | |
| | | Three Months Ended
September 30 | | | Nine Months Ended
September 30 | |
| Defined Benefit Pension Plans | | 2011 | | | 2010 | | | 2011 | | | 2010 | |
Service cost | | $ | 6 | | | $ | 5 | | | $ | 18 | | | $ | 15 | |
Interest cost | | | 13 | | | | 12 | | | | 37 | | | | 35 | |
Expected return on plan assets | | | (14 | ) | | | (12 | ) | | | (40 | ) | | | (35 | ) |
Net amortization | | | 6 | | | | 6 | | | | 18 | | | | 19 | |
Net expense | | $ | 11 | | | $ | 11 | | | $ | 33 | | | $ | 34 | |
| | | | | | | | | | | | | | | | |
| | | Three Months Ended
September 30 | | | Nine Months Ended
September 30 | |
| Other Post-Retirement Plans | | 2011 | | | 2010 | | | 2011 | | | 2010 | |
Service cost | | $ | 2 | | | $ | 1 | | | $ | 6 | | | $ | 5 | |
Interest cost | | | 4 | | | | 4 | | | | 12 | | | | 12 | |
Net amortization | | | (1 | ) | | | — | | | | (2 | ) | | | (1 | ) |
Net expense | | $ | 5 | | | $ | 5 | | | $ | 16 | | | $ | 16 | |
For the three months ended September 30, 2011, the company contributed $151 to its defined benefit pension plans, $9 to its defined contribution pension plans and $1 to its other post-retirement plans. Contributions for the nine months ended September 30, 2011 were $156 to its defined benefit pension plans, $25 to its defined contribution pension plans and $6 to its other post-retirement plans. Approximately $193 is expected to be contributed by the company to all pension and post-retirement plans during 2011.
Uncertainty in Income Taxes
During the three and nine months ended September 30, 2011, unrecognized income tax adjustments decreased $34 and $69, respectively. The company currently expects that a reduction in the range of $9 to $11 of unrecognized income tax adjustments may occur within 12 months as a result of projected resolutions of worldwide income tax disputes.
| | |
| PotashCorp 2011 Third Quarter Quarterly Report on Form 10-Q | | 24 |
Guarantees
In the normal course of operations, the company provides indemnifications, which are often standard contractual terms, to counterparties in transactions such as purchase and sale contracts, service agreements, director/officer contracts and leasing transactions. These indemnification agreements may require the company to compensate the counterparties for costs incurred as a result of various events, including environmental liabilities and changes in (or in the interpretation of) laws and regulations, or as a result of litigation claims or statutory sanctions that may be suffered by the counterparty as a consequence of the transaction. The terms of these indemnification agreements will vary based upon the contract, the nature of which prevents the company from making a reasonable estimate of the maximum potential amount that it could be required to pay to counterparties. Historically, the company has not made any significant payments under such indemnifications and no amounts have been accrued in the accompanying unaudited interim condensed consolidated financial statements with respect to these indemnification guarantees (apart from any appropriate accruals relating to the underlying potential liabilities).
The company enters into agreements in the normal course of business that may contain features which meet the definition of a guarantee. Various debt obligations (such as overdrafts, lines of credit with counterparties for derivatives and back-to-back loan arrangements) and other commitments (such as railcar leases) related to certain subsidiaries and investees have been directly guaranteed by the company under such agreements with third parties. The company would be required to perform on these guarantees in the event of default by the guaranteed parties. No material loss is anticipated by reason of such agreements and guarantees. At September 30, 2011, the maximum potential amount of future (undiscounted) payments under significant guarantees provided to third parties approximated $561. It is unlikely that these guarantees will be drawn upon, and since the maximum potential amount of future payments does not consider the possibility of recovery under recourse or collateral provisions, this amount is not indicative of future cash requirements or the company’s expected losses from these arrangements. At September 30, 2011, no subsidiary balances subject to guarantees were outstanding in connection with the company’s cash management facilities, and it had no liabilities recorded for other obligations other than subsidiary bank borrowings of approximately $6.
The company has guaranteed the gypsum stack capping, closure and post-closure obligations of White Springs and PCS Nitrogen in Florida and Louisiana, respectively, pursuant to the financial assurance regulatory requirements in those states. In addition, it has guaranteed the performance of certain remediation obligations of PCS Joint Venture and PCS Nitrogen at the Lakeland, Florida and Augusta, Georgia sites, respectively. The USEPA has announced that it plans to adopt rules requiring financial assurance from a variety of mining operations, including phosphate rock mining. It is too early in the rulemaking process to determine what the impact, if any, on the company’s facilities will be when these rules are issued.
The environmental regulations of the Province of Saskatchewan require each potash mine to have decommissioning and reclamation plans, along with financial assurances for these plans, approved by the responsible provincial minister. The Minister of the Environment for Saskatchewan (“MOE”) has approved the plans previously submitted by the company. The company had previously provided a CDN $2 irrevocable letter of credit and a payment of CDN $3 into the agreed-upon trust fund. Under the regulations, the decommissioning and reclamation plans and financial assurances are to be reviewed at least once every five years, or as required by the MOE. The next scheduled review for the decommissioning and reclamation plans and financial assurances was to be completed by June 30, 2011. The company submitted its decommissioning and reclamation plans and its financial assurances proposal in May 2011 and is awaiting a response. The MOE has advised that it considers the company in compliance with the regulations until the review is finalized and a response is provided. The MOE had previously indicated that it would be seeking an increase of the amount paid into the trust fund by the company for this submission. Based on current information, the company does not believe that its financial assurance requirements or future obligations with respect to this matter are reasonably likely to have a material impact on its consolidated financial position or results of operations.
The company has met its financial assurance responsibilities as of September 30, 2011. Costs associated with the retirement of long-lived tangible assets have been accrued in the accompanying unaudited interim condensed consolidated financial statements to the extent that a legal or constructive liability to retire such assets exists.
During the period, the company entered into various other commercial letters of credit in the normal course of operations. As at September 30, 2011, $50 of letters of credit were outstanding.
The company expects that it will be able to satisfy all applicable credit support requirements without disrupting normal business operations.
| | |
| 25 | | PotashCorp 2011 Third Quarter Quarterly Report on Form 10-Q |
Recent Accounting Pronouncements
Fair Value Measurements
In May 2011, the Financial Accounting Standards Board (“FASB”) issued amendments to its fair value measurement standard to substantially converge the guidance in US GAAP and IFRS on fair value measurements and disclosures. The amendments will be effective for interim and annual periods beginning after December 15, 2011. The company is currently reviewing the impact, if any, on its consolidated financial statements.
Comprehensive Income
In June 2011, the FASB amended the standard for Comprehensive Income whereby total comprehensive income, the components of net income and the components of other comprehensive income can either be presented in a single continuous statement or in two separate but consecutive statements. Regardless of which option is chosen, items that are reclassified from other comprehensive income to net income should be presented on the face of the financial statements. The amendments will be effective for fiscal years, and interim periods within those years, beginning after December 15, 2011. The company is currently reviewing the impact, if any, on its consolidated financial statements.
Goodwill Impairment
In September 2011, the FASB amended the guidance on testing for goodwill impairment whereby entities testing goodwill for impairment have the option of performing a qualitative assessment before calculating the fair value of a reporting unit in step 1 of the goodwill impairment test. If entities determine, on the basis of qualitative factors, that the fair value of a reporting unit is more likely than not less than the carrying amount, the two-step impairment test would be required. Otherwise, further testing would not be required. The amendments will be effective for annual and interim goodwill impairment tests performed for fiscal years beginning after December 15, 2011. The company is currently reviewing the impact, if any, on its consolidated financial statements.
The company adopted IFRS on January 1, 2011 with effect from January 1, 2010. Its financial statements for the year ending December 31, 2011 will be the first annual consolidated financial statements that comply with IFRS. These unaudited interim condensed consolidated financial statements were prepared as described in Note 1, including the application of IFRS 1. Accordingly, the company will make an unreserved statement of compliance with IFRS beginning with its 2011 annual consolidated financial statements.
Changes in Accounting Policies
The key areas where the company has identified that accounting policies will differ or where accounting policy decisions are necessary that may impact its consolidated financial statements and the impact of transition policy choices made under IFRS 1 are described in Note 13 to the financial statements in Part I Item 1 of the company’s 2011 First Quarter Quarterly Report on Form 10-Q. The following table outlines some of these key areas related to the reconciliations from Canadian GAAP to IFRS. Since accounting policies and standards may change in the period between these unaudited interim condensed consolidated financial statements and the company’s first annual consolidated financial statements that comply with IFRS, the table below reflects the differences between IFRS and previous Canadian GAAP that are expected to apply. See Note 13 to financial statements in Part I Item 1 of the company’s 2011 First Quarter Quarterly Report on Form 10-Q for further details.
| | |
Accounting
Policy Area | | Differences from Previous Canadian GAAP |
(a) Employee Benefits | | Actuarial gains and losses will be recognized directly in other comprehensive income rather than through profit or loss. IAS 19 requires the past service cost element of defined benefit plans to be expensed on an accelerated basis, with vested past service costs expensed immediately and unvested past service costs recognized on a straight-line basis until the benefits become vested. Under Canadian GAAP, past service costs were generally amortized on a straight-line basis over the average remaining service period of active employees expected under the plan. Under Canadian GAAP, certain gains and losses which were unrecognized at the time of adopting the current Canadian accounting standard were permitted to be amortized over a period under transitional provisions of the current standards. Those amounts must be recognized on transition to IFRS. |
| | |
| PotashCorp 2011 Third Quarter Quarterly Report on Form 10-Q | | 26 |
| | |
Accounting
Policy Area | | Differences from Previous Canadian GAAP |
(b) Provisions (including Asset Retirement Obligations) | | IAS 37, “Provisions, Contingent Liabilities and Contingent Assets”, requires a provision to be recognized when: there is a present obligation (legal or constructive) as a result of a past transaction or event; it is probable that an outflow of resources will be required to settle the obligation; and a reliable estimate can be made of the obligation. “Probable” in this context means more likely than not. Under Canadian GAAP, constructive obligations were recognized only if required by a specific standard, and the criterion for recognition in the financial statements was “likely”, which is a higher threshold than “probable”. Therefore, it is possible that there may be some contingent liabilities not recognized under Canadian GAAP which would require a provision under IFRS. Other differences between IFRS and Canadian GAAP exist in relation to the measurement of provisions, such as the methodology for determining the best estimate where there is a range of equally possible outcomes (IFRS uses the mid-point of the range whereas Canadian GAAP used the low end), and the requirement under IFRS for provisions to be discounted where material. In relation to asset retirement obligations, measurement under IFRS will be based on management’s best estimate, while measurement under Canadian GAAP was based on the fair value of the obligation (which takes market assumptions into account). Under IFRS, the full asset retirement obligation will be remeasured each period using the current discount rate. Under Canadian GAAP, cash flow estimates associated with asset retirement obligations were discounted using historical discount rates. Changes in the discount rate alone did not result in a remeasurement of the liability. Changes in estimates that decreased the liability were discounted using the discount rate applied upon initial recognition of the liability. When changes in estimates increased the liability, the additional liability was discounted using the current discount rate. IFRS require the company’s asset retirement obligations to be discounted using a risk-free rate. Under Canadian GAAP, asset retirement obligations were discounted using a credit-adjusted risk-free rate. Under IFRS, the increase in the measurement of an asset retirement obligation due to the passage of time (unwinding of the discount) will be classified as a finance expense. Under Canadian GAAP, this amount was classified as an operating expense. |
(c) Property, Plant and Equipment | | Under IFRS, where part of an item of property, plant and equipment has a cost that is significant in relation to the cost of the item as a whole, it must be depreciated separately from the remainder of the item. Canadian GAAP was similar in this respect; however, the componentization concept was not often applied to the same extent due to practicality and/or materiality. Under IFRS, the cost of major overhauls on items of property, plant and equipment will be capitalized as a component of the related item of property, plant and equipment and amortized over the period until the next major overhaul. Under Canadian GAAP, these costs were expensed in the year incurred. |
(d) Investments | | Under IFRS, jointly controlled entities will be accounted for using the equity method. Under Canadian GAAP, joint ventures were accounted for using proportionate consolidation. Certain of the company’s equity-accounted investees adopted IFRS earlier than PotashCorp, resulting in certain IFRS 1 elections being made, particularly related to use of fair value as deemed cost on certain items of property, plant and equipment and related to the use of the business combinations exemption. As a result, the company will recognize its share of such elections as an adjustment to its opening retained earnings and its investments in equity-accounted investees. |
(e) Inventories | | Under IFRS, at interim periods, price, efficiency, spending and volume variances of a manufacturing entity will be recognized in income to the same extent that those variances will be recognized in income at financial year-end. Under IFRS, deferral of variances that are expected to be absorbed by year-end is not appropriate because it could result in reporting inventory at the interim date at more or less than its portion of the actual cost of manufacture. Under Canadian GAAP, variances that were planned and expected to be absorbed by the end of the year were ordinarily deferred at the end of an interim period. Net income and equity for annual periods will not be affected. |
(f) Borrowing Costs | | Under IFRS, borrowing costs will be capitalized to assets which take a substantial time to develop or construct using a capitalization rate based on the weighted average interest rate on all of the company’s outstanding third-party debt. Under the company’s Canadian GAAP policy, the interest capitalization rate was based only on the weighted average interest rate on third-party long-term debt. |
| | |
| 27 | | PotashCorp 2011 Third Quarter Quarterly Report on Form 10-Q |
| | |
Accounting
Policy Area | | Differences from Previous Canadian GAAP |
(g) Share-Based Payments | | IFRS 2, “Share-Based Payments”, requires that cash-settled share-based payments to employees be measured (both initially and at each reporting date) based on fair value of the awards. Canadian GAAP required that such payments be measured based on the intrinsic value of the awards. This difference is expected to impact the accounting measurement of some of the company’s cash-settled employee incentive plans, such as its performance unit incentive plan. IFRS 2 requires an estimate of compensation cost to be recognized in relation to performance options for which service has commenced but which have not yet been granted. The compensation cost recognized would then be trued up once options have been granted. Under Canadian GAAP, compensation cost was first recognized when the options were granted. This will create a timing difference between IFRS and Canadian GAAP in terms of when compensation cost relating to employee service provided in the first quarter of the year is recognized. In relation to stock option costs in 2010, net income will decrease in the first quarter and increase in the second quarter by $13. Net income and equity for annual periods will not be affected. |
(h) Impairment of Assets | | IAS 36, “Impairment of Assets”, uses a one-step approach for both testing for and measurement of impairment, with asset carrying values compared directly with the higher of fair value less costs to sell and value in use (which uses discounted future cash flows). Canadian GAAP generally used a two-step approach to impairment testing, first comparing asset carrying values with undiscounted future cash flows to determine whether impairment exists, and then measuring any impairment by comparing asset carrying values with fair values. This difference may potentially result in more impairments where carrying values of assets were previously supported under Canadian GAAP on an undiscounted cash flow basis, but could not be supported on a discounted cash flow basis. In addition, IAS 36 requires the reversal of any previous impairment losses (to the amounts the assets would now be carried at had depreciation continued) where circumstances have changed such that the impairments have been reduced. Canadian GAAP prohibited reversal of impairment losses. |
(i) Income Taxes | | Under IFRS, the guidance in IAS 12, “Income Taxes”, will be used to determine the benefit to be received in relation to uncertain tax positions. This differs from the methodology used under Canadian GAAP. Under IFRS, deferred tax assets recognized in relation to share-based payment arrangements (for example, the company’s employee stock option plan in the US) will be adjusted each period to reflect the amount of future tax deductions that the company expects to receive in excess of stock-based compensation recorded in the consolidated financial statements based on the current market price of the shares. The benefit of such amounts will be recognized in contributed surplus and never impacts net income. Under the company’s Canadian GAAP policy, tax deductions for its employee stock option plan in the US were recognized as reductions to tax expense, within net income, in the period that the deduction was allowed. Under IFRS, deferred tax assets associated with share-based compensation recorded in the consolidated financial statements as an expense in the current or previous period should be reviewed at each statement of financial position date and amended to the extent that it is no longer probable that the related tax benefit will be realized. Under Canadian GAAP, this income tax benefit was calculated without estimating the income tax effects of anticipated share-based payment transactions. Under IFRS, adjustments relating to a change in tax rates will be recognized in the same category of comprehensive income in which the original amounts were recognized. Under Canadian GAAP, such adjustments were recognized in net income, regardless of the category in which the original amounts were recognized. In addition, adjustments to foreign exchange gains on deferred income tax liabilities originally recognized in other comprehensive income will be recorded in other comprehensive income under IFRS, but were recorded in net income under Canadian GAAP. Under IFRS, deferred income taxes will be classified as long-term. Under Canadian GAAP, future income taxes were separated between current and long-term on the statement of financial position. Under IFRS, unrealized profits resulting from intragroup transactions will be eliminated from the carrying amount of assets, but no equivalent adjustment will be made for tax purposes. The difference between the tax rates of the two entities will impact net income. This differs from Canadian GAAP, where the current tax payable in relation to such profits was recorded as a current asset until the transaction was realized by the group. |
| | |
| PotashCorp 2011 Third Quarter Quarterly Report on Form 10-Q | | 28 |
Reconciliations from Canadian GAAP to IFRS
Reconciliation of Net Income
| | | | | | | | |
| | | Three Months
Ended September 30,
2010 | | | Nine Months
Ended September 30,
2010 | |
Net Income — Canadian GAAP | | $ | 403 | | | $ | 1,324 | |
IFRS adjustments to net income: | | | | | | | | |
Policy choices | | | | | | | | |
Employee benefits — Actuarial gains and losses(a) | | | 7 | | | | 20 | |
Other | | | | | | | | |
Provisions — Changes in asset retirement obligations(b) | | | (8 | ) | | | (33 | ) |
Property, plant and equipment(c) | | | 28 | | | | 36 | |
Manufacturing cost variances at interim periods(e) | | | (48 | ) | | | (33 | ) |
Borrowing costs(f) | | | (3 | ) | | | (9 | ) |
Employee benefits — Past service costs(a) | | | (1 | ) | | | (2 | ) |
Share-based payments(g) | | | 3 | | | | 2 | |
Constructive obligations(b) | | | 1 | | | | 1 | |
Impairment of assets(h) | | | (6 | ) | | | (7 | ) |
Income taxes — Tax effect of above differences | | | 7 | | | | 8 | |
Income tax-related differences(i) | | | (40 | ) | | | (40 | ) |
Net Income — IFRS | | $ | 343 | | | $ | 1,267 | |
References relate to items described in the Changes in Accounting Policies table above.
Reconciliation of Shareholders’ Equity
| | | | |
| | | September 30,
2010 | |
Shareholders’ Equity — Canadian GAAP | | $ | 7,851 | |
IFRS adjustments to shareholders’ equity: | | | | |
Policy choices | | | | |
Employee benefits — Actuarial gains and losses(a) | | | (345 | ) |
Other | | | | |
Provisions — Changes in asset retirement obligations(b) | | | (99 | ) |
Property, plant and equipment(c) | | | 54 | |
Investments(d) | | | (45 | ) |
Manufacturing cost variances at interim periods(e) | | | (33 | ) |
Borrowing costs(f) | | | (23 | ) |
Employee benefits — Past service costs and Canadian GAAP transition amounts(a) | | | 11 | |
Share-based payments(g) | | | 5 | |
Constructive obligations(b) | | | (2 | ) |
Impairment of assets(h) | | | 1 | |
Income taxes — Tax effect of above differences | | | 160 | |
Income tax-related differences(i) | | | 180 | |
Shareholders’ Equity — IFRS | | $ | 7,715 | |
References relate to items described in the Changes in Accounting Policies table above.
| | |
| 29 | | PotashCorp 2011 Third Quarter Quarterly Report on Form 10-Q |
Reconciliation of Comprehensive Income
| | | | | | | | |
| | | Three Months
Ended September 30,
2010 | | | Nine Months
Ended
September 30,
2010 | |
Comprehensive Income — Canadian GAAP | | $ | 1,283 | | | $ | 1,438 | |
IFRS adjustments to comprehensive income: | | | | | | | | |
Differences in net income | | | (60 | ) | | | (57 | ) |
Comprehensive Income — IFRS | | $ | 1,223 | | | $ | 1,381 | |
References relate to items described in the Changes in Accounting Policies table above.
| | |
| PotashCorp 2011 Third Quarter Quarterly Report on Form 10-Q | | 30 |
Item 2. Management’s Discussion and Analysis of Financial Condition and Results of Operations
The following discussion and analysis are the responsibility of management and are as of November 4, 2011. The Board of Directors carries out its responsibility for review of this disclosure principally through its audit committee, comprised exclusively of independent directors. The audit committee reviews and, prior to its publication, approves this disclosure, pursuant to the authority delegated to it by the Board of Directors. The term “PCS” refers to Potash Corporation of Saskatchewan Inc. and the terms “we”, “us”, “our”, “PotashCorp” and “the company” refer to PCS and, as applicable, PCS and its direct and indirect subsidiaries as a group. Additional information relating to the company, including our Annual Report on Form 10-K, can be found on SEDAR at www.sedar.com and on EDGAR at www.sec.gov/edgar.shtml. The company is a foreign private issuer under the rules and regulations of the US Securities and Exchange Commission (the “SEC”); however, the company currently files voluntarily on the SEC’s domestic forms.
Adoption of International Financial Reporting Standards (“IFRS”)
The unaudited interim condensed consolidated financial statements included in Item 1 of this Quarterly Report on Form 10-Q (“financial statements in this 10-Q”) reflect the adoption of IFRS, with effect from January 1, 2010. Periods prior to January 1, 2010 have not been restated and were in accordance with Canadian GAAP which, as discussed in Item 1 of this Quarterly Report on Form 10-Q, was applied during the periods prior to the effective date of the company’s adoption of IFRS. As a foreign private issuer under the rules and regulations of the SEC, the company is permitted to use IFRS.
Our unaudited interim condensed consolidated financial statements included in Part I Item 1 of our 2011 First Quarter Quarterly Report on Form 10-Q contain a detailed description of our conversion to IFRS, including a reconciliation of key components of our financial statements previously prepared under Canadian GAAP to those under IFRS as at January 1 and December 31, 2010, and for the year ended December 31, 2010. Note 15 to the financial statements in this 10-Q contains a reconciliation of key components of our financial statements previously prepared under Canadian GAAP to those under IFRS as at and for the three months and nine months ended September 30, 2010.
Although the adoption of IFRS resulted in adjustments to our financial statements, it did not materially impact the underlying cash flows or profitability trends of our operating performance, debt covenants or compensation arrangements.
PotashCorp and Our Business Environment
PotashCorp is an integrated producer of fertilizer, industrial and animal feed products. We are the world’s largest fertilizer enterprise by capacity, producing the three primary plant nutrients: potash, phosphate and nitrogen. We sell fertilizer to North American retailers, cooperatives and distributors that provide storage and application services to farmers, the end users. Our offshore customers are government agencies and private importers that buy under contract and on the spot market; spot market sales are more prevalent in North America, South America and Southeast Asia. Fertilizers are sold primarily for spring and fall application in both Northern and Southern hemispheres.
Transportation is an important part of the final purchase price for fertilizer so producers usually sell to the closest customers. In North America, we sell mainly on a delivered basis via rail, barge, truck and pipeline. Offshore customers purchase product either at the port where it is loaded or delivered with freight included directly to a specified location.
Potash, phosphate and nitrogen are also used as inputs for the production of animal feed and industrial products. Most feed and industrial sales are by contract and are more evenly distributed throughout the year than fertilizer sales.
PotashCorp Strategy
To provide our stakeholders with long-term value, our strategy focuses on generating growth while striving to minimize fluctuations in an upward-trending earnings line. We apply this strategy by concentrating on our highest margin products. Such analysis dictates our Potash First strategy, focusing our capital — internally and through investments — on our world-class potash assets to meet the rising global demand for this vital nutrient. By investing in potash capacity while producing to meet market demand, we seek to create the opportunity for significant growth while limiting downside risk. We complement our potash operations with focused phosphate and nitrogen businesses that emphasize the production of higher-margin products with stable and sustainable earnings potential.
We strive to enhance our position as supplier of choice to our customers, delivering the highest quality products at market prices when they are needed. We seek to be the preferred supplier to high-volume, high-margin customers with the lowest credit risk. It is critical to our success that our customers recognize our ability to create value for them based on the price they pay for our products.
As we plan for our future, we carefully weigh our choices for use of our cash flow. We base investment decisions on cash flow return materially exceeding cost of capital, evaluating the best prospects for return on investment that match our Potash First strategy. Most of
| | |
| 31 | | PotashCorp 2011 Third Quarter Quarterly Report on Form 10-Q |
our recent capital expenditures have gone to investments in our own potash capacity; however, we also look to increase our existing offshore potash investments and seek other merger and acquisition opportunities related to this nutrient. In addition, we consider share repurchases and increased dividends as ways to maximize shareholder value over the long term.
Key Performance Drivers — Performance Compared to Goals
Each year we set targets to advance our long-term goals and drive results. Our long-term goals and 2011 targets are set out on pages 41 and 42 of our 2010 Financial Review Annual Report. A summary of our progress against selected goals and representative annual targets is set out below.
| | | | |
| Goal | | Representative 2011 Annual Target | | Performance to September 30, 2011 |
| Achieve no harm to people. | | Reduce total site severity injury rate by 35 percent from 2008 levels by the end of 2012. | | Total site severity injury rate was 42 percent below the 2008 annual level for the first nine months of 2011. It was 61 percent below the 2008 annual level for the first nine months of 2010 and 62 percent below the 2008 annual level by the end of 2010. |
| Achieve no damage to the environment. | | Reduce total reportable releases, permit excursions and spills by 10 percent from 2010 levels. | | Annualized total reportable releases, permit excursions and spills were down 33 percent during the first nine months of 2011 compared to 2010 annual levels. Compared to the first nine months of 2010, total reportable releases, permit excursions and spills during the same period of 2011 were down 23 percent. |
| Create superior long-term shareholder value. | | Exceed total shareholder return performance for our sector and the DAXglobal Agribusiness Index for 2011. | | PotashCorp’s total shareholder return was -16 percent in the first nine months of 2011 compared to our sector’s weighted average return (based on market capitalization) of -25 percent and the DAXglobal Agribusiness Index weighted average return (based on market capitalization) of -19 percent. |
Financial Overview
This discussion and analysis are based on the company’s unaudited interim condensed consolidated financial statements reported under IFRS, unless otherwise stated. These principles differ in certain significant respects from accounting principles generally accepted in the United States. These differences are described and quantified in Note 14 to the financial statements in this 10-Q. All references to per-share amounts pertain to diluted net income per share.
For an understanding of trends, events, uncertainties and the effect of critical accounting estimates on our results and financial condition, the entire document should be read carefully, together with our 2010 Financial Review Annual Report and our 2011 First Quarter Quarterly Report on Form 10-Q.
Earnings Guidance — Third Quarter 2011
| | | | | | | | |
| | | Company Guidance | | | Actual Results | |
Earnings per share | | $ | 0.80 – $1.00 | | | $ | 0.94 | |
| | |
| PotashCorp 2011 Third Quarter Quarterly Report on Form 10-Q | | 32 |
Overview of Actual Results
| | | | | | | | | | | | | | | | | | | | | | | | | | | | | | | | |
| | | Three Months Ended September 30 | | | Nine Months Ended September 30 | |
Dollars (millions) —
except per-share amounts | | 2011 | | | 2010 | | | Change | | | % Change | | | 2011 | | | 2010 | | | Change | | | % Change | |
Sales | | $ | 2,321 | | | $ | 1,575 | | | $ | 746 | | | | 47 | | | $ | 6,850 | | | $ | 4,726 | | | $ | 2,124 | | | | 45 | |
Gross Margin | | | 1,132 | | | | 550 | | | | 582 | | | | 106 | | | | 3,396 | | | | 1,864 | | | | 1,532 | | | | 82 | |
Operating Income | | | 1,142 | | | | 517 | | | | 625 | | | | 121 | | | | 3,342 | | | | 1,862 | | | | 1,480 | | | | 79 | |
Net Income | | | 826 | | | | 343 | | | | 483 | | | | 141 | | | | 2,398 | | | | 1,267 | | | | 1,131 | | | | 89 | |
Net Income per Share — Diluted | | | 0.94 | | | | 0.38 | | | | 0.56 | | | | 147 | | | | 2.73 | | | | 1.39 | | | | 1.34 | | | | 96 | |
Other Comprehensive (Loss) Income | | | (1,121 | ) | | | 880 | | | | (2,001 | ) | | | n/m | | | | (1,461 | ) | | | 114 | | | | (1,575 | ) | | | n/m | |
n/m = not meaningful
Earnings in the third quarter and first nine months of 2011 exceeded those in the same periods of 2010 due to higher sales prices for all nutrients and increased demand for potash, phosphate fertilizer and ammonia. Attractive economics for goods that use our products continued to increase our customers’ consumption of our products. Strong demand coupled with our low inventories put upward pressure on pricing for most products. Third-quarter potash gross margin represented 62 percent of total third-quarter gross margin (62 percent in 2010) and 66 percent of first nine months gross margin (69 percent in 2010). Sales prices for all phosphate and nitrogen products increased significantly during the third quarter and first nine months of 2011 compared to the same periods in 2010.
Despite macroeconomic concerns, the push to capitalize on strong crop economics continued to support demand for fertilizer products around the globe. Offshore potash demand remained robust during the third quarter and on pace to achieve record levels in 2011. Ongoing strength in key offshore spot markets offset limited shipments to India — a major buyer that was largely absent from the market since the first quarter until new contracts were signed in August. Domestic dealers moved late in the quarter to restock inventories to meet an anticipated strong fall application season. This supported healthy third-quarter domestic shipments from North American producers and raised the total for the first nine months to near-record levels. Even as North American producers achieved record third-quarter production, strong demand pulled physical inventories to their lowest levels for the year. Potash prices continued to rise during the quarter, reflecting tight supply/demand fundamentals.
In phosphate, robust agricultural demand supported healthy third-quarter domestic solid fertilizer shipments from US producers. While demand remained strong in offshore markets around the globe, movements from US producers slowed compared to third-quarter 2010, primarily due to timing of shipments under new six-month DAP contracts reached in the quarter with Indian customers. Rising sulfur and ammonia input costs, coupled with tight North American producer inventories, pushed up prices for most phosphate products. In nitrogen, the prospect of record US corn acreage in the upcoming planting season along with healthy industrial requirements drove record third-quarter US ammonia demand and helped raise US urea demand well above the same period last year. Numerous global ammonia supply outages — due to scheduled maintenance and to unexpected interruptions — along with robust demand moved prices higher for all nitrogen products.
Other significant factors that affected earnings in the third quarter and first nine months of 2011 compared to the same periods in 2010 were: (1) higher income taxes due to increased earnings before taxes; (2) increased provincial mining and other taxes as a result of improving potash sales revenue and profits; (3) elevated finance costs due to additional borrowings (year over year only) and lower capitalized interest; (4) more earnings from equity-accounted investees; and (5) lower selling and administrative expenses quarter over quarter due primarily to deferred share units (our share price fell in 2011 but rose in 2010). Other comprehensive loss for the third quarter and first nine months of 2011 was due to a decline in the fair value of our investments in Israel Chemicals Ltd (“ICL”) and Sinofert Holdings Limited (“Sinofert”) and net actuarial losses on our defined benefit plans as a result of a remeasurement during the third quarter of 2011. In 2010, other comprehensive income for the third quarter and first nine months was the result of increases in the fair values of our investments in both ICL and Sinofert and partly offset by the fair value of hedge-accounted natural gas derivatives, which declined due to falling natural gas prices.
| | |
| 33 | | PotashCorp 2011 Third Quarter Quarterly Report on Form 10-Q |
Balance Sheet
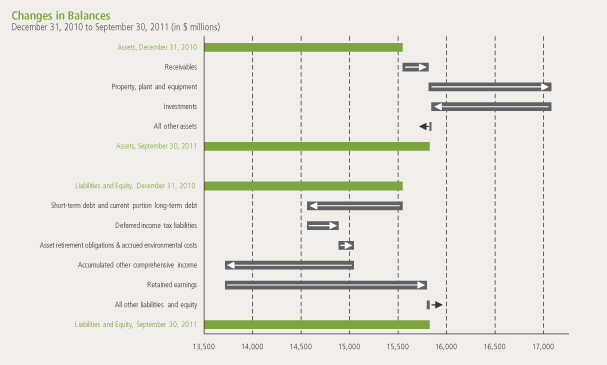
Property, plant and equipment increased primarily (81 percent) due to our previously announced potash capacity expansions and other potash projects. Available-for-sale investments declined due to the lower fair value of our investments in Sinofert (discussed further in Note 3 to the financial statements in this 10-Q) and ICL. Receivables were mainly impacted by higher trade receivables (consistent with higher sales) and partially offset by declines in hedge margin deposits on our natural gas derivatives. As at September 30, 2011, $327 million of our cash and cash equivalents were held in certain foreign subsidiaries. There are no current plans to repatriate these funds in a taxable manner.
Short-term debt and current portion of long-term debt decreased in the first nine months of 2011 as a result of repaying 10-year senior notes in the second quarter and commercial paper repayments exceeding issuances. Deferred income tax liabilities increased primarily due to tax depreciation exceeding accounting depreciation, reduced deferred tax assets on unexercised stock options and a partial offset from the tax impact on the remeasurement of our defined benefit plans (see Note 5 to the financial statements in this 10-Q). Asset retirement obligations and accrued environmental costs were impacted by the use of a lower risk-free interest rate.
Significant changes in equity were primarily the result of net income being offset, in part, by other comprehensive losses for the first nine months of 2011, as discussed in more detail above.
| | |
| PotashCorp 2011 Third Quarter Quarterly Report on Form 10-Q | | 34 |
Operating Segment Review
Note 7 to the financial statements in this 10-Q provides information pertaining to our operating segments. Management includes net sales in segment disclosures in the unaudited interim condensed consolidated financial statements pursuant to IFRS, which requires segmentation based upon our internal organization and reporting of revenue and profit measures derived from internal accounting methods. As a component of gross margin, net sales (and the related per-tonne amounts) are the primary revenue measures we use and review in making decisions about operating matters on a business segment basis. These decisions include assessments about potash, phosphate and nitrogen performance and the resources to be allocated to these segments. We also use net sales (and the related per-tonne amounts) for business planning and monthly forecasting. Net sales are calculated as sales revenues less freight, transportation and distribution expenses.
Our discussion of segment operating performance is set out below and includes nutrient product and/or market performance results where applicable to give further insight into these results.
Potash
| | | | | | | | | | | | | | | | | | | | | | | | | | | | | | | | | | | | |
| | | Three Months Ended September 30 | |
| | | Dollars (millions) | | | Tonnes (thousands) | | | Average per Tonne(1) | |
| | | 2011 | | | 2010 | | | % Change | | | 2011 | | | 2010 | | | % Change | | | 2011 | | | 2010 | | | % Change | |
Sales | | $ | 1,035 | | | $ | 637 | | | | 62 | | | | | | | | | | | | | | | | | | | | | | | | | |
Freight, transportation and distribution | | | (59 | ) | | | (55 | ) | | | 7 | | | | | | | | | | | | | | | | | | | | | | | | | |
Net sales | | $ | 976 | | | $ | 582 | | | | 68 | | | | | | | | | | | | | | | | | | | | | | | | | |
Manufactured product | | | | | | | | | | | | | | | | | | | | | | | | | | | | | | | | | | | | |
Net sales | | | | | | | | | | | | | | | | | | | | | | | | | | | | | | | | | | | | |
North America | | $ | 410 | | | $ | 251 | | | | 63 | | | | 769 | | | | 710 | | | | 8 | | | $ | 533 | | | $ | 354 | | | | 51 | |
Offshore | | | 563 | | | | 328 | | | | 72 | | | | 1,387 | | | | 1,187 | | | | 17 | | | $ | 406 | | | $ | 277 | | | | 47 | |
| | | 973 | | | | 579 | | | | 68 | | | | 2,156 | | | | 1,897 | | | | 14 | | | $ | 451 | | | $ | 306 | | | | 47 | |
Cost of goods sold | | | (274 | ) | | | (240 | ) | | | 14 | | | | | | | | | | | | | | | $ | (127 | ) | | $ | (127 | ) | | | — | |
Gross margin | | | 699 | | | | 339 | | | | 106 | | | | | | | | | | | | | | | $ | 324 | | | $ | 179 | | | | 81 | |
Other miscellaneous and purchased product | | | | | | | | | | | | | | | | | | | | | | | | | | | | | | | | | | | | |
Net sales | | | 3 | | | | 3 | | | | — | | | | | | | | | | | | | | | | | | | | | | | | | |
Cost of goods sold | | | (2 | ) | | | (3 | ) | | | (33 | ) | | | | | | | | | | | | | | | | | | | | | | | | |
Gross margin | | | 1 | | | | — | | | | n/m | | | | | | | | | | | | | | | | | | | | | | | | | |
Gross Margin | | $ | 700 | | | $ | 339 | | | | 106 | | | | | | | | | | | | | | | $ | 325 | | | $ | 179 | | | | 82 | |
| (1) | Rounding differences may occur due to the use of whole dollars in per-tonne calculations. |
n/m = not meaningful
| | |
| 35 | | PotashCorp 2011 Third Quarter Quarterly Report on Form 10-Q |
| | | | | | | | | | | | | | | | | | | | | | | | | | | | | | | | | | | | |
| | | Nine Months Ended September 30 | |
| | | Dollars (millions) | | | Tonnes (thousands) | | | Average per Tonne(1) | |
| | | 2011 | | | 2010 | | | % Change | | | 2011 | | | 2010 | | | % Change | | | 2011 | | | 2010 | | | % Change | |
Sales | | $ | 3,265 | | | $ | 2,170 | | | | 50 | | | | | | | | | | | | | | | | | | | | | | | | | |
Freight, transportation and distribution | | | (212 | ) | | | (202 | ) | | | 5 | | | | | | | | | | | | | | | | | | | | | | | | | |
Net sales | | $ | 3,053 | | | $ | 1,968 | | | | 55 | | | | | | | | | | | | | | | | | | | | | | | | | |
Manufactured product | | | | | | | | | | | | | | | | | | | | | | | | | | | | | | | | | | | | |
Net sales | | | | | | | | | | | | | | | | | | | | | | | | | | | | | | | | | | | | |
North America | | $ | 1,285 | | | $ | 914 | | | | 41 | | | | 2,692 | | | | 2,551 | | | | 6 | | | $ | 477 | | | $ | 358 | | | | 33 | |
Offshore | | | 1,758 | | | | 1,045 | | | | 68 | | | | 4,773 | | | | 3,714 | | | | 29 | | | $ | 368 | | | $ | 281 | | | | 31 | |
| | | 3,043 | | | | 1,959 | | | | 55 | | | | 7,465 | | | | 6,265 | | | | 19 | | | $ | 408 | | | $ | 313 | | | | 30 | |
Cost of goods sold | | | (810 | ) | | | (685 | ) | | | 18 | | | | | | | | | | | | | | | $ | (109 | ) | | $ | (110 | ) | | | (1 | ) |
Gross margin | | | 2,233 | | | | 1,274 | | | | 75 | | | | | | | | | | | | | | | $ | 299 | | | $ | 203 | | | | 47 | |
Other miscellaneous and purchased product | | | | | | | | | | | | | | | | | | | | | | | | | | | | | | | | | | | | |
Net sales | | | 10 | | | | 9 | | | | 11 | | | | | | | | | | | | | | | | | | | | | | | | | |
Cost of goods sold | | | (7 | ) | | | (3 | ) | | | 133 | | | | | | | | | | | | | | | | | | | | | | | | | |
Gross margin | | | 3 | | | | 6 | | | | (50 | ) | | | | | | | | | | | | | | | | | | | | | | | | |
Gross Margin | | $ | 2,236 | | | $ | 1,280 | | | | 75 | | | | | | | | | | | | | | | $ | 300 | | | $ | 204 | | | | 47 | |
| (1) | Rounding differences may occur due to the use of whole dollars in per-tonne calculations |
Potash gross margin variance attributable to:
| | | 1 | | | | 1 | | | | 1 | | | | 1 | | | | 1 | | | | 1 | | | | 1 | | | | 1 | |
| | | Three Months Ended September 30 2011 vs. 2010 | | | Nine Months Ended September 30 2011 vs. 2010 | |
| | | | | | Change in
Prices/Costs | | | | | | | | | Change in
Prices/Costs | | | | |
| Dollars (millions) | | Change in
Sales Volumes | | | Net
Sales | | | Cost of
Goods Sold | | | Total | | | Change in
Sales Volumes | | | Net
Sales | | | Cost of
Goods Sold | | | Total | |
Manufactured product | | | | | | | | | | | | | | | | | | | | | | | | | | | | | | | | |
North America | | | $17 | | | | $137 | | | | $ 2 | | | | $156 | | | | $ 41 | | | | $320 | | | | $ 13 | | | | $374 | |
Offshore | | | 41 | | | | 180 | | | | (18 | ) | | | 203 | | | | 227 | | | | 415 | | | | (57 | ) | | | 585 | |
Change in market mix | | | 3 | | | | (2 | ) | | | — | | | | 1 | | | | 30 | | | | (27 | ) | | | (3 | ) | | | — | |
Total manufactured product | | | $61 | | | | $315 | | | | $(16 | ) | | | $360 | | | | $298 | | | | $708 | | | | $(47 | ) | | | $959 | |
Other miscellaneous and purchased product | | | | | | | | | | | | | | | 1 | | | | | | | | | | | | | | | | (3 | ) |
Total | | | | | | | | | | | | | | | $361 | | | | | | | | | | | | | | | | $956 | |
| | |
| PotashCorp 2011 Third Quarter Quarterly Report on Form 10-Q | | 36 |
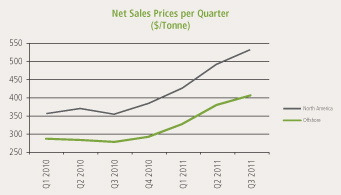
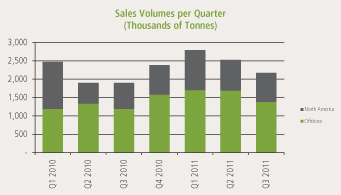
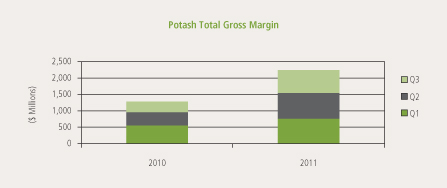
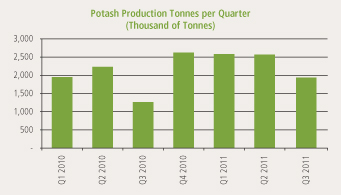
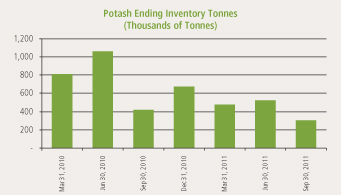
Canpotex Limited (“Canpotex”) sales to major markets, by percentage of sales volumes, were as follows:
| | | | | | | | | | | | | | | | | | | | | | | | | | | | | | | | |
| | | Three Months Ended September 30 | | | Nine Months Ended September 30 | |
| | | 2011 | | | 2010 | | | Change | | | % Change | | | 2011 | | | 2010 | | | Change | | | % Change | |
Asia (excluding China and India) | | | 40 | | | | 28 | | | | 12 | | | | 43 | | | | 45 | | | | 42 | | | | 3 | | | | 7 | |
Latin America | | | 26 | | | | 38 | | | | (12 | ) | | | (32 | ) | | | 28 | | | | 25 | | | | 3 | | | | 12 | |
China | | | 20 | | | | 10 | | | | 10 | | | | 100 | | | | 17 | | | | 12 | | | | 5 | | | | 42 | |
India | | | 9 | | | | 16 | | | | (7 | ) | | | (44 | ) | | | 5 | | | | 14 | | | | (9 | ) | | | (64 | ) |
Oceania, Europe and Other | | | 5 | | | | 8 | | | | (3 | ) | | | (38 | ) | | | 5 | | | | 7 | | | | (2 | ) | | | (29 | ) |
| | | | 100 | | | | 100 | | | | | | | | | | | | 100 | | | | 100 | | | | | | | | | |
| | |
| 37 | | PotashCorp 2011 Third Quarter Quarterly Report on Form 10-Q |
The most significant contributors to the change in total gross margin quarter over quarter were as follows(1):
| (1) | Direction of arrows refers to impact on gross margin. |
| | | | | | | | | | |
| | Net Sales Prices | | | | Sales Volumes | | | | Cost of Goods Sold |
| h | | Realized potash prices increased, reflecting the tight supply/demand fundamentals in all major spot and contract markets. | | h h | | Record sales were due to highly supportive agricultural economics around the world. Offshore shipments were supported by strong demand in Asia (excluding China and India) and improved demand in China. Shipments to Latin America were lower due to a record first half of 2011. Product movement to India was limited by supply availability and a late settlement of a new potash contract. | | h | | 28 shutdown weeks incurred in 2011 (43 weeks taken in 2010) as facilities operated at or near their full capabilities (2011 shutdown weeks were for planned annual maintenance and expansion-related activities). |
| | | | | i | | Offshore cost of goods sold variance was negative while North America variance was positive due to relatively more offshore product coming from our higher-cost mines. |
| | | h | | Strong demand from North American customers anticipating robust fall requirements helped push third-quarter sales volumes higher. | | | | |
The most significant contributors to the change in total gross margin year over year were as follows(1):
| (1) | Direction of arrows refers to impact on gross margin. |
| | | | | | | | | | |
| | Net Sales Prices | | | | Sales Volumes | | | | Cost of Goods Sold |
| h | | Higher average realized prices reflected the continued upward movement in pricing levels in late 2010 and 2011 in all major spot and contract markets. | | h | | Canpotex shipments to offshore markets were the result of strong demand for potash due to high crop commodity prices and lower customer inventories at the start of the year. | | h | | 28 shutdown weeks incurred in 2011 (61 weeks taken in 2010) as facilities operated at or near their full capabilities (2011 shutdown weeks were for planned annual maintenance and expansion-related activities). |
| | | | h | | Canpotex’s increased shipments to Latin America, Asia (excluding China and India) and China exceeded the decline in sales to India, which had been largely absent from the market since the first quarter of 2011 until new contracts were signed in August 2011. | | i h | | The Canadian dollar strengthened relative to the US dollar. North American cost of goods sold variance was positive as a relatively higher percentage of products produced at lower-cost mines, or using lower-cost processes, was sold. |
| | | | | |
| | | | | | | | i | | Offshore cost of goods sold variance was negative due to more of that product coming from our higher-cost mines as compared to last year. |
North American customers generally prefer premium priced granular product over standard product more typically consumed offshore.
The change in market mix produced a favorable variance of $30 million related to sales volumes and an unfavorable variance of $27 million in sales prices due to more lower-priced standard product being sold to the offshore market whereas last year, higher-priced granular sales to North America comprised a larger proportion of total sales.
| | |
| PotashCorp 2011 Third Quarter Quarterly Report on Form 10-Q | | 38 |
Phosphate
| | | | | | | | | | | | | | | | | | | | | | | | | | | | | | | | | | | | |
| | | Three Months Ended September 30 | |
| | | Dollars (millions) | | | Tonnes (thousands) | | | Average per Tonne(1) | |
| | | 2011 | | | 2010 | | | % Change | | | 2011 | | | 2010 | | | % Change | | | 2011 | | | 2010 | | | % Change | |
Sales | | $ | 690 | | | $ | 536 | | | | 29 | | | | | | | | | | | | | | | | | | | | | | | | | |
Freight, transportation and distribution | | | (46 | ) | | | (44 | ) | | | 5 | | | | | | | | | | | | | | | | | | | | | | | | | |
Net sales | | $ | 644 | | | $ | 492 | | | | 31 | | | | | | | | | | | | | | | | | | | | | | | | | |
Manufactured product | | | | | | | | | | | | | | | | | | | | | | | | | | | | | | | | | | | | |
Net sales | | | | | | | | | | | | | | | | | | | | | | | | | | | | | | | | | | | | |
Fertilizer — liquids | | $ | 196 | | | $ | 123 | | | | 59 | | | | 364 | | | | 324 | | | | 12 | | | $ | 537 | | | $ | 378 | | | | 42 | |
Fertilizer — solids | | | 258 | | | | 191 | | | | 35 | | | | 416 | | | | 437 | | | | (5 | ) | | $ | 621 | | | $ | 437 | | | | 42 | |
Feed | | | 70 | | | | 79 | | | | (11 | ) | | | 121 | | | | 170 | | | | (29 | ) | | $ | 584 | | | $ | 467 | | | | 25 | |
Industrial | | | 112 | | | | 92 | | | | 22 | | | | 157 | | | | 157 | | | | — | | | $ | 716 | | | $ | 586 | | | | 22 | |
| | | 636 | | | | 485 | | | | 31 | | | | 1,058 | | | | 1,088 | | | | (3 | ) | | $ | 602 | | | $ | 446 | | | | 35 | |
Cost of goods sold | | | (471 | ) | | | (394 | ) | | | 20 | | | | | | | | | | | | | | | $ | (446 | ) | | $ | (362 | ) | | | 23 | |
Gross margin | | | 165 | | | | 91 | | | | 81 | | | | | | | | | | | | | | | $ | 156 | | | $ | 84 | | | | 86 | |
Other miscellaneous and purchased product | | | | | | | | | | | | | | | | | | | | | | | | | | | | | | | | | | | | |
Net sales | | | 8 | | | | 7 | | | | 14 | | | | | | | | | | | | | | | | | | | | | | | | | |
Cost of goods sold | | | (4 | ) | | | (2 | ) | | | 100 | | | | | | | | | | | | | | | | | | | | | | | | | |
Gross margin | | | 4 | | | | 5 | | | | (20 | ) | | | | | | | | | | | | | | | | | | | | | | | | |
Gross Margin | | $ | 169 | | | $ | 96 | | | | 76 | | | | | | | | | | | | | | | $ | 160 | | | $ | 88 | | | | 82 | |
| (1) | Rounding differences may occur due to the use of whole dollars in per-tonne calculations. |
| | | | | | | | | | | | | | | | | | | | | | | | | | | | | | | | | | | | |
| | | Nine Months Ended September 30 | |
| | | Dollars (millions) | | | Tonnes (thousands) | | | Average per Tonne(1) | |
| | | 2011 | | | 2010 | | | % Change | | | 2011 | | | 2010 | | | % Change | | | 2011 | | | 2010 | | | % Change | |
Sales | | $ | 1,872 | | | $ | 1,301 | | | | 44 | | | | | | | | | | | | | | | | | | | | | | | | | |
Freight, transportation and distribution | | | (129 | ) | | | (107 | ) | | | 21 | | | | | | | | | | | | | | | | | | | | | | | | | |
Net sales | | $ | 1,743 | | | $ | 1,194 | | | | 46 | | | | | | | | | | | | | | | | | | | | | | | | | |
Manufactured product | | | | | | | | | | | | | | | | | | | | | | | | | | | | | | | | | | | | |
Net sales | | | | | | | | | | | | | | | | | | | | | | | | | | | | | | | | | | | | |
Fertilizer — liquids | | $ | 524 | | | $ | 285 | | | | 84 | | | | 1,011 | | | | 791 | | | | 28 | | | $ | 518 | | | $ | 361 | | | | 43 | |
Fertilizer — solids | | | 649 | | | | 415 | | | | 56 | | | | 1,069 | | | | 945 | | | | 13 | | | $ | 607 | | | $ | 439 | | | | 38 | |
Feed | | | 223 | | | | 218 | | | | 2 | | | | 409 | | | | 483 | | | | (15 | ) | | $ | 547 | | | $ | 452 | | | | 21 | |
Industrial | | | 325 | | | | 256 | | | | 27 | | | | 475 | | | | 448 | | | | 6 | | | $ | 684 | | | $ | 572 | | | | 20 | |
| | | 1,721 | | | | 1,174 | | | | 47 | | | | 2,964 | | | | 2,667 | | | | 11 | | | $ | 581 | | | $ | 440 | | | | 32 | |
Cost of goods sold | | | (1,247 | ) | | | (978 | ) | | | 28 | | | | | | | | | | | | | | | $ | (421 | ) | | $ | (367 | ) | | | 15 | |
Gross margin | | | 474 | | | | 196 | | | | 142 | | | | | | | | | | | | | | | $ | 160 | | | $ | 73 | | | | 119 | |
Other miscellaneous and purchased product | | | | | | | | | | | | | | | | | | | | | | | | | | | | | | | | | | | | |
Net sales | | | 22 | | | | 20 | | | | 10 | | | | | | | | | | | | | | | | | | | | | | | | | |
Cost of goods sold | | | (11 | ) | | | (7 | ) | | | 57 | | | | | | | | | | | | | | | | | | | | | | | | | |
Gross margin | | | 11 | | | | 13 | | | | (15 | ) | | | | | | | | | | | | | | | | | | | | | | | | |
Gross Margin | | $ | 485 | | | $ | 209 | | | | 132 | | | | | | | | | | | | | | | $ | 164 | | | $ | 78 | | | | 110 | |
| (1) | Rounding differences may occur due to the use of whole dollars in per-tonne calculations. |
| | |
| 39 | | PotashCorp 2011 Third Quarter Quarterly Report on Form 10-Q |
Phosphate gross margin variance attributable to:
| | | | | | | | | | | | | | | | | | | | | | | | | | | | | | | | |
| | | Three Months Ended September 30 2011 vs. 2010 | | | Nine Months Ended September 30 2011 vs. 2010 | |
Dollars (millions) | | Change in
Sales Volumes | | | Change in Prices/Costs | | | Total | | | Change in
Sales Volumes | | | Change in Prices/Costs | | | Total | |
| | | Net
Sales | | | Cost of
Goods Sold | | | | | Net
Sales | | | Cost of
Goods Sold | | |
Manufactured product | | | | | | | | | | | | | | | | | | | | | | | | | | | | | | | | |
Fertilizer — liquids | | $ | 12 | | | $ | 57 | | | $ | (37 | ) | | $ | 32 | | | $ | 49 | | | $ | 159 | | | $ | (96 | ) | | $ | 112 | |
Fertilizer — solids | | | (3 | ) | | | 76 | | | | (38 | ) | | | 35 | | | | 27 | | | | 180 | | | | (82 | ) | | | 125 | |
Feed | | | (15 | ) | | | 14 | | | | 6 | | | | 5 | | | | (20 | ) | | | 39 | | | | (1 | ) | | | 18 | |
Industrial | | | 1 | | | | 20 | | | | (19 | ) | | | 2 | | | | 12 | | | | 53 | | | | (42 | ) | | | 23 | |
Change in market mix | | | 3 | | | | (3 | ) | | | — | | | | — | | | | 15 | | | | (14 | ) | | | (1 | ) | | | — | |
Total manufactured product | | $ | (2 | ) | | $ | 164 | | | $ | (88 | ) | | $ | 74 | | | $ | 83 | | | $ | 417 | | | $ | (222 | ) | | $ | 278 | |
Other miscellaneous and purchased product | | | | | | | | | | | | | | | (1 | ) | | | | | | | | | | | | | | | (2 | ) |
Total | | | | | | | | | | | | | | $ | 73 | | | | | | | | | | | | | | | $ | 276 | |
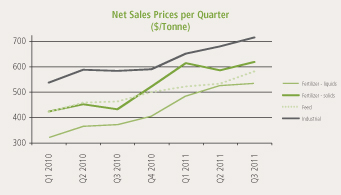
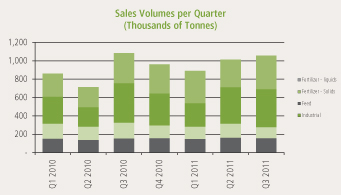
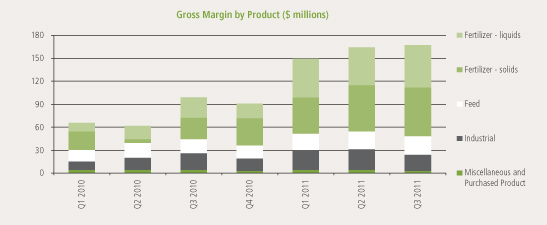
| | |
| PotashCorp 2011 Third Quarter Quarterly Report on Form 10-Q | | 40 |
The most significant contributors to the change in total gross margin quarter over quarter were as follows(1):
| (1) | Direction of arrows refers to impact on gross margin. |
| | | | | | | | | | |
| | Net Sales Prices | | | | Sales Volumes | | | | Cost of Goods Sold |
| h | | Reflecting strong agricultural demand and tight supply, average realized prices for liquid and solid fertilizer each rose over the same quarter in 2010. | | h | | Strong agricultural fundamentals drove higher demand for liquid fertilizer. | | i | | Costs were impacted by higher sulfur costs (up 57 percent). |
| | | | | |
| h | | Although a positive impact on gross margin, prices for feed have been slower to respond because of challenging livestock economics. | | i | | Feed product volumes were negatively impacted by the increased use of feed substitutes, reduced livestock and a hot US summer. | | i | | Solid fertilizer costs reflected higher ammonia costs (up 24 percent). |
| h | | Although a positive impact on gross margin, industrial prices continued to reflect a typical time lag in pricing for the segment. | | | | | | h | | The change in feed costs was positive due to a smaller allocation of fixed costs (a result of liquid fertilizer production volumes increasing more significantly than volumes for feed products). |
The most significant contributors to the change in total gross margin year over year were as follows(1):
| (1) | Direction of arrows refers to impact on gross margin. |
| | | | | | | | | | |
| | Net Sales Prices | | | | Sales Volumes | | | | Cost of Goods Sold |
| h | | Prices for phosphate products were
higher due to strong crop economics,
historically low inventories at the start
of 2011 and higher raw material
input prices. | | h | | Fertilizer volumes grew as we
allocated more production to capitalize
on the higher-margin opportunity in
these product lines. | | i | | Costs were impacted by higher
sulfur costs (up 64 percent). |
| | | | | |
h | | The largest price increases were evident in liquid and solid fertilizers, which rose on strong agricultural fundamentals and higher raw material input costs. | | i | | Demand for feed products was impacted by higher grain prices that increased the use of substitute feed ingredients and reduced livestock numbers. | | i | | Solid fertilizer costs reflected higher ammonia costs (up 31 percent). |
| | | | | | | | i | | The change in fertilizer costs was higher than in feed and industrial costs due to a higher allocation of fixed costs (a result of fertilizer production volumes increasing more significantly than volumes for the other products). |
| | |
| 41 | | PotashCorp 2011 Third Quarter Quarterly Report on Form 10-Q |
Nitrogen
| | | | | | | | | | | | | | | | | | | | | | | | | | | | | | | | | | | | |
| | | Three Months Ended September 30 | |
| | | Dollars (millions) | | | Tonnes (thousands) | | | Average per Tonne(1) | |
| | | 2011 | | | 2010 | | | % Change | | | 2011 | | | 2010 | | | % Change | | | 2011 | | | 2010 | | | % Change | |
Sales | | $ | 596 | | | $ | 402 | | | | 48 | | | | | | | | | | | | | | | | | | | | | | | | | |
Freight, transportation and distribution | | | (24 | ) | | | (20 | ) | | | 20 | | | | | | | | | | | | | | | | | | | | | | | | | |
Net sales | | $ | 572 | | | $ | 382 | | | | 50 | | | | | | | | | | | | | | | | | | | | | | | | | |
Manufactured product | | | | | | | | | | | | | | | | | | | | | | | | | | | | | | | | | | | | |
Net sales | | | | | | | | | | | | | | | | | | | | | | | | | | | | | | | | | | | | |
Ammonia | | $ | 250 | | | $ | 163 | | | | 53 | | | | 475 | | | | 459 | | | | 3 | | | $ | 526 | | | $ | 354 | | | | 49 | |
Urea | | | 174 | | | | 91 | | | | 91 | | | | 325 | | | | 302 | | | | 8 | | | $ | 534 | | | $ | 302 | | | | 77 | |
Nitrogen solutions/Nitric acid/Ammonium nitrate | | | 124 | | | | 96 | | | | 29 | | | | 492 | | | | 528 | | | | (7 | ) | | $ | 254 | | | $ | 182 | | | | 40 | |
| | | 548 | | | | 350 | | | | 57 | | | | 1,292 | | | | 1,289 | | | | — | | | $ | 424 | | | $ | 271 | | | | 56 | |
Cost of goods sold | | | (300 | ) | | | (243 | ) | | | 23 | | | | | | | | | | | | | | | $ | (232 | ) | | $ | (188 | ) | | | 23 | |
Gross margin | | | 248 | | | | 107 | | | | 132 | | | | | | | | | | | | | | | $ | 192 | | | $ | 83 | | | | 131 | |
Other miscellaneous and purchased product | | | | | | | | | | | | | | | | | | | | | | | | | | | | | | | | | | | | |
Net sales | | | 24 | | | | 32 | | | | (25 | ) | | | | | | | | | | | | | | | | | | | | | | | | |
Cost of goods sold | | | (9 | ) | | | (24 | ) | | | (63 | ) | | | | | | | | | | | | | | | | | | | | | | | | |
Gross margin | | | 15 | | | | 8 | | | | 88 | | | | | | | | | | | | | | | | | | | | | | | | | |
Gross Margin | | $ | 263 | | | $ | 115 | | | | 129 | | | | | | | | | | | | | | | $ | 204 | | | $ | 89 | | | | 129 | |
| (1) | Rounding differences may occur due to the use of whole dollars in per-tonne calculations. |
| | | | | | | | | | | | | | | | | | | | | | | | | | | | | | | | | | | | |
| | | Nine Months Ended September 30 | |
| | | Dollars (millions) | | | Tonnes (thousands) | | | Average per Tonne(1) | |
| | | 2011 | | | 2010 | | | % Change | | | 2011 | | | 2010 | | | % Change | | | 2011 | | | 2010 | | | % Change | |
Sales | | $ | 1,713 | | | $ | 1,255 | | | | 36 | | | | | | | | | | | | | | | | | | | | | | | | | |
Freight, transportation and distribution | | | (69 | ) | | | (64 | ) | | | 8 | | | | | | | | | | | | | | | | | | | | | | | | | |
Net sales | | $ | 1,644 | | | $ | 1,191 | | | | 38 | | | | | | | | | | | | | | | | | | | | | | | | | |
Manufactured product | | | | | | | | | | | | | | | | | | | | | | | | | | | | | | | | | | | | |
Net sales | | | | | | | | | | | | | | | | | | | | | | | | | | | | | | | | | | | | |
Ammonia | | $ | 774 | | | $ | 487 | | | | 59 | | | | 1,503 | | | | 1,350 | | | | 11 | | | $ | 515 | | | $ | 361 | | | | 43 | |
Urea | | | 442 | | | | 312 | | | | 42 | | | | 972 | | | | 970 | | | | — | | | $ | 455 | | | $ | 322 | | | | 41 | |
Nitrogen solutions/Nitric acid/Ammonium nitrate | | | 346 | | | | 296 | | | | 17 | | | | 1,456 | | | | 1,609 | | | | (10 | ) | | $ | 238 | | | $ | 184 | | | | 29 | |
| | | 1,562 | | | | 1,095 | | | | 43 | | | | 3,931 | | | | 3,929 | | | | — | | | $ | 397 | | | $ | 279 | | | | 42 | |
Cost of goods sold | | | (921 | ) | | | (740 | ) | | | 24 | | | | | | | | | | | | | | | $ | (234 | ) | | $ | (189 | ) | | | 24 | |
Gross margin | | | 641 | | | | 355 | | | | 81 | | | | | | | | | | | | | | | $ | 163 | | | $ | 90 | | | | 81 | |
Other miscellaneous and purchased product | | | | | | | | | | | | | | | | | | | | | | | | | | | | | | | | | | | | |
Net sales | | | 82 | | | | 96 | | | | (15 | ) | | | | | | | | | | | | | | | | | | | | | | | | |
Cost of goods sold | | | (48 | ) | | | (76 | ) | | | (37 | ) | | | | | | | | | | | | | | | | | | | | | | | | |
Gross margin | | | 34 | | | | 20 | | | | 70 | | | | | | | | | | | | | | | | | | | | | | | | | |
Gross Margin | | $ | 675 | | | $ | 375 | | | | 80 | | | | | | | | | | | | | | | $ | 172 | | | $ | 95 | | | | 81 | |
| (1) | Rounding differences may occur due to the use of whole dollars in per-tonne calculations. |
| | |
| PotashCorp 2011 Third Quarter Quarterly Report on Form 10-Q | | 42 |
Nitrogen gross margin variance attributable to:
| | | 1 | | | | 1 | | | | 1 | | | | 1 | | | | 1 | | | | 1 | | | | 1 | | | | 1 | |
| | | Three Months Ended September 30 2011 vs. 2010 | | | Nine Months Ended September 30 2011 vs. 2010 | |
| | | | | | Change in Prices/Costs | | | | | | | | | Change in Prices/Costs | | | Total | |
| Dollars (millions) | | Change in
Sales Volumes | | | Net
Sales | | | Cost of
Goods Sold | | | Total | | | Change in
Sales Volumes | | | Net
Sales | | | Cost of
Goods Sold | | |
Manufactured product | | | | | | | | | | | | | | | | | | | | | | | | | | | | | | | | |
Ammonia | | $ | 2 | | | $ | 82 | | | $ | (19 | ) | | $ | 65 | | | $ | 30 | | | $ | 232 | | | $ | (89 | ) | | $ | 173 | |
Urea | | | 4 | | | | 74 | | | | (18 | ) | | | 60 | | | | — | | | | 128 | | | | (37 | ) | | | 91 | |
Solutions, NA, AN | | | (2 | ) | | | 36 | | | | (21 | ) | | | 13 | | | | (5 | ) | | | 79 | | | | (47 | ) | | | 27 | |
Hedge | | | — | | | | — | | | | 3 | | | | 3 | | | | — | | | | — | | | | (5 | ) | | | (5 | ) |
Change in market mix | | | (5 | ) | | | 5 | | | | — | | | | — | | | | (27 | ) | | | 27 | | | | — | | | | — | |
Total manufactured product | | $ | (1 | ) | | $ | 197 | | | $ | (55 | ) | | $ | 141 | | | $ | (2 | ) | | $ | 466 | | | $ | (178 | ) | | $ | 286 | |
Other miscellaneous and purchased product | | | | | | | | | | | | | | | 7 | | | | | | | | | | | | | | | | 14 | |
Total | | | | | | | | | | | | | | $ | 148 | | | | | | | | | | | | | | | $ | 300 | |
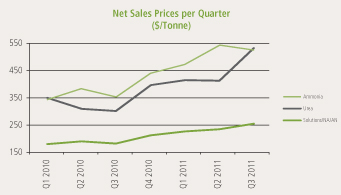
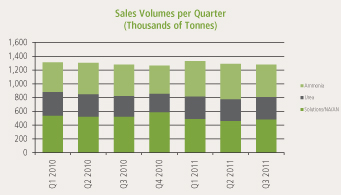
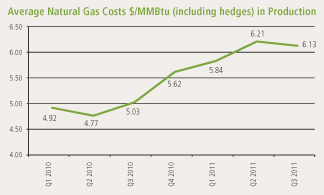
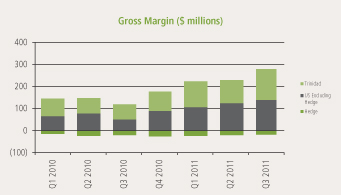
| | |
| 43 | | PotashCorp 2011 Third Quarter Quarterly Report on Form 10-Q |
| | | | | | | | | | | | | | | | | | | | | | | | | | | | | | | | |
| | | Three Months Ended September 30 | | | Nine Months Ended September 30 | |
| | | Sales Tonnes (thousands) | | | Price per Tonne | | | Sales Tonnes (thousands) | | | Price per Tonne | |
| | | 2011 | | | 2010 | | | 2011 | | | 2010 | | | 2011 | | | 2010 | | | 2011 | | | 2010 | |
Fertilizer | | | 445 | | | | 470 | | | $ | 469 | | | $ | 252 | | | | 1,281 | | | | 1,495 | | | $ | 425 | | | $ | 265 | |
Feed | | | 8 | | | | 6 | | | $ | 541 | | | $ | 371 | | | | 24 | | | | 20 | | | $ | 511 | | | $ | 393 | |
Industrial | | | 839 | | | | 813 | | | $ | 399 | | | $ | 282 | | | | 2,626 | | | | 2,414 | | | $ | 383 | | | $ | 286 | |
| | | | 1,292 | | | | 1,289 | | | $ | 424 | | | $ | 271 | | | | 3,931 | | | | 3,929 | | | $ | 397 | | | $ | 279 | |
The most significant contributors to the change in total gross margin quarter over quarter were as follows(1):
| (1) | Direction of arrows refers to impact on gross margin, while the • symbol signifies a neutral impact. |
| | | | | | | | | | |
| | Net Sales Prices | | | | Sales Volumes | | | | Cost of Goods Sold |
| h | | Strong demand and tight product supplies pushed up prices for all nitrogen products. | | • | | Volumes were relatively flat. | | i | | Average natural gas costs in production, including hedge, increased 22 percent. Natural gas costs in Trinidad production rose 55 percent (contract price indexed, in part, to Tampa ammonia prices) while our US spot costs for natural gas used in production decreased 7 percent. Including hedge losses, US gas prices declined 18 percent. |
The most significant contributors to the change in total gross margin year over year were as follows(1):
| (1) | Direction of arrows refers to impact on gross margin. |
| | | | | | | | | | |
| | Net Sales Prices | | | | Sales Volumes | | | | Cost of Goods Sold |
| | | | | |
h | | Realized prices increased as a result of tight global supplies, higher production costs in Ukraine and Western Europe and improved agricultural and industrial demand. | | h i | | Ammonia sales rose to meet strong industrial and agricultural demand. Nitrogen solutions were down due to a lack of carbon dioxide supply at our Geismar, Louisiana plant. | | i | | Average natural gas costs in production, including hedge, increased 23 percent. Natural gas costs in Trinidad production rose 51 percent while our US spot costs for natural gas used in production decreased 9 percent. Including hedge losses, US gas prices declined 8 percent. |
The $27 million change in market mix produced a favorable variance in sales prices and an unfavorable variance in sales volumes due to more higher-priced ammonia being sold in 2011 than in 2010.
| | |
| PotashCorp 2011 Third Quarter Quarterly Report on Form 10-Q | | 44 |
Expenses and Other Income
| | | | | | | | | | | | | | | | | | | | | | | | | | | | | | | | |
| | | Three Months Ended September 30 | | | Nine Months Ended September 30 | |
| Dollars (millions) | | 2011 | | | 2010 | | | Change | | | % Change | | | 2011 | | | 2010 | | | Change | | | % Change | |
Selling and administrative expenses | | $ | (46 | ) | | $ | (71 | ) | | $ | 25 | | | | (35 | ) | | $ | (176 | ) | | $ | (164 | ) | | $ | (12 | ) | | | 7 | |
Provincial mining and other taxes | | | (53 | ) | | | (16 | ) | | | (37 | ) | | | 231 | | | | (147 | ) | | | (56 | ) | | | (91 | ) | | | 163 | |
Share of earnings of equity-accounted investees | | | 68 | | | | 51 | | | | 17 | | | | 33 | | | | 185 | | | | 122 | | | | 63 | | | | 52 | |
Dividend income | | | 41 | | | | 25 | | | | 16 | | | | 64 | | | | 94 | | | | 139 | | | | (45 | ) | | | (32 | ) |
Other expenses | | | — | | | | (22 | ) | | | 22 | | | | (100 | ) | | | (10 | ) | | | (43 | ) | | | 33 | | | | (77 | ) |
Finance costs | | | (37 | ) | | | (22 | ) | | | (15 | ) | | | 68 | | | | (125 | ) | | | (87 | ) | | | (38 | ) | | | 44 | |
Income taxes | | | (279 | ) | | | (152 | ) | | | (127 | ) | | | 84 | | | | (819 | ) | | | (508 | ) | | | (311 | ) | | | 61 | |
Selling and administrative expenses were lower quarter over quarter due primarily to our medium-term incentive plan and deferred share units being affected by a decreasing share price in 2011 (share price increased in 2010). Year over year, selling and administrative expenses were mainly impacted by higher accruals for our medium-term incentive plan, increased community investments, higher salaries and benefits and a reduction in accrual for deferred share units.
Provincial mining and other taxes are comprised mainly of the Saskatchewan Potash Production Tax (“PPT”) and a resource surcharge. The PPT is comprised of a base tax per tonne of product sold and an additional tax based on mine profit, which is reduced by potash capital expenditures. The resource surcharge is a percentage of the value of the company’s Saskatchewan resource sales. The resource surcharge rose as a result of higher potash sales revenues in the third quarter and first nine months of 2011. The PPT expense in the third quarter and first nine months of 2011 increased as a result of higher potash profitability, but was partially offset by loss carryforwards. There was no PPT in the first nine months of 2010 due to lower profitability and loss carryforwards.
Share of earnings of equity-accounted investees, Arab Potash Company Ltd. and Sociedad Quimica y Minera de Chile S.A., was higher than last year due to increased earnings by these companies. More dividends were received from ICL quarter over quarter while year over year, fewer dividends were received in 2011 compared to 2010 when a special dividend was received.
Other expenses were lower in 2011 due, in part, to the absence of takeover response related costs that were incurred in 2010.
Finance costs were affected by senior notes being issued in the fourth quarter of 2010, the repayment of 10-year senior notes during the second quarter of 2011, higher average outstanding commercial paper balances in 2011 compared to the same periods in 2010, and lower capitalized interest in 2011 as expansion projects become available for use. Weighted average debt obligations outstanding and the associated interest rates were as follows:
| | | | | | | | | | | | | | | | | | | | | | | | | | | | | | | | |
| | | Three Months Ended September 30 | | | Nine Months Ended September 30 | |
Dollars (millions) — except percentage amounts | | 2011 | | | 2010 | | | Change | | | % Change | | | 2011 | | | 2010 | | | Change | | | % Change | |
Long-term debt obligations, including current portion | | | | | | | | | | | | | | | | | | | | | | | | | | | | | | | | |
Weighted average outstanding | | $ | 3,757 | | | $ | 3,358 | | | $ | 399 | | | | 12 | | | $ | 4,124 | | | $ | 3,437 | | | $ | 687 | | | | 20 | |
Weighted average effective interest rate | | | 5.2% | | | | 5.8% | | | | (0.6)% | | | | (10 | ) | | | 5.4% | | | | 5.7% | | | | (0.3)% | | | | (5 | ) |
Short-term debt obligations | | | | | | | | | | | | | | | | | | | | | | | | | | | | | | | | |
Weighted average outstanding | | $ | 1,003 | | | $ | 387 | | | $ | 616 | | | | 159 | | | $ | 1,020 | | | $ | 483 | | | $ | 537 | | | | 111 | |
Weighted average effective interest rate | | | 0.4% | | | | 0.6% | | | | (0.2)% | | | | (33 | ) | | | 0.4% | | | | 0.5% | | | | (0.1)% | | | | (20 | ) |
Total debt obligations | | | | | | | | | | | | | | | | | | | | | | | | | | | | | | | | |
Weighted average outstanding | | $ | 4,760 | | | $ | 3,745 | | | $ | 1,015 | | | | 27 | | | $ | 5,144 | | | $ | 3,920 | | | $ | 1,224 | | | | 31 | |
Weighted average effective interest rate | | | 4.2% | | | | 5.3% | | | | (1.1)% | | | | (21 | ) | | | 4.4% | | | | 5.1% | | | | (0.7)% | | | | (14 | ) |
Income taxes rose due to increased income before taxes. The effective tax rate including discrete items decreased to 25 percent from 31 percent for the quarter and decreased to 25 percent from 29 percent year over year. The income tax expense for the first nine months of 2011 was impacted by current tax recoveries of $21 million in the first quarter for previously paid withholding taxes and $12 million in the third
| | |
| 45 | | PotashCorp 2011 Third Quarter Quarterly Report on Form 10-Q |
quarter due to income tax losses in a foreign jurisdiction. The income tax expense for the first nine months of 2010 was impacted by a tax expense of $34 million (of which $7 million was recorded in the third quarter) to adjust the 2009 income tax provision to the income tax returns filed for that year. Excluding discrete items, for the first nine months of 2011, 64 percent of the effective tax rate pertained to current income taxes and 36 percent related to deferred income taxes. For the first nine months of 2010, the split was 73 percent current and 27 percent deferred. The decrease in the current portion was largely due to accelerated capital deductions.
Liquidity and Capital Resources
Cash Requirements
Contractual Obligations and Other Commitments
Our contractual obligations and other commitments detailed on pages 55 and 56 of our 2010 Financial Review Annual Report summarize our short- and long-term liquidity and capital resource requirements but exclude obligations with original maturities of less than one year and planned (but not legally committed) capital expenditures. The repayment of $600 million of 10-year senior notes during the second quarter of 2011 reduced the amount of long-term debt obligations as compared to those disclosed in our contractual obligations and other commitments table on page 64 in Part I Item 1 of our 2011 First Quarter Quarterly Report on Form 10-Q.
Capital Expenditures
Page 21 of our 2010 Financial Review Annual Report outlines key potash construction projects and their expected cost and capacity expansion/debottlenecking. During 2011, we expect to incur capital expenditures, including capitalized interest, of approximately $1,730 million for opportunity capital, approximately $330 million to sustain operations at existing levels, approximately $140 million for major repairs and maintenance (including plant turnarounds) and approximately $60 million for site improvements.
The most significant potash projects(1) on which funds are expected to be spent in 2011, excluding capitalized interest, are outlined in the table below:
| | | | | | | | | | | | | | | | | | |
| CDN Dollars (millions) | | 2011 Forecast | | | Total Forecast | | | Started | | | Expected Completion(2)
(Description) | | Forecasted
Remaining Spending
(after 2011) | |
Allan, Saskatchewan | | $ | 290 | | | $ | 550 | (3) | | | 2008 | | | 2012 (general expansion) | | $ | 20 | (3) |
Cory, Saskatchewan | | $ | 190 | | | $ | 1,630 | | | | 2007 | | | 2012 (general expansion) | | $ | 50 | |
Picadilly, New Brunswick | | $ | 350 | | | $ | 1,660 | | | | 2007 | | | 2013 (mine shaft and mill) | | $ | 320 | |
Rocanville, Saskatchewan | | $ | 650 | | | $ | 2,800 | | | | 2008 | | | 2014 (mine shaft and mill) | | $ | 1,330 | |
| (1) | The expansion at each of these projects is discussed in the technical report for such project filed on SEDAR in accordance with National Instrument 43-101 Standards of Disclosure for Mineral Projects. |
| (2) | Excludes ramp-up time. We expect these projects will be fully ramped up by the end of 2015, provided market conditions warrant. |
| (3) | Amounts are subject to change based on ongoing project reviews. |
We anticipate that all capital spending will be financed by internally generated cash flows supplemented, if and as necessary, by borrowing from existing financing sources.
Sources and Uses of Cash
The company’s cash flows from operating, investing and financing activities, as reflected in the unaudited interim Condensed Consolidated Statements of Cash Flow, are summarized in the following table:
| | | | | | | | | | | | | | | | | | | | | | | | | | | | | | | | |
| | | Three Months Ended September 30 | | | Nine Months Ended September 30 | |
| Dollars (millions) | | 2011 | | | 2010 | | | Change | | | % Change | | | 2011 | | | 2010 | | | Change | | | % Change | |
Cash provided by operating activities | | $ | 865 | | | $ | 587 | | | $ | 278 | | | | 47 | | | $ | 2,619 | | | $ | 2,394 | | | $ | 225 | | | | 9 | |
Cash used in investing activities | | | (598 | ) | | | (590 | ) | | | (8 | ) | | | 1 | | | | (1,534 | ) | | | (2,038 | ) | | | 504 | | | | (25 | ) |
Cash used in financing activities | | | (281 | ) | | | (4 | ) | | | (277 | ) | | | n/m | | | | (1,103 | ) | | | (381 | ) | | | (722 | ) | | | 190 | |
| | |
| PotashCorp 2011 Third Quarter Quarterly Report on Form 10-Q | | 46 |
The following table presents summarized working capital information as at September 30, 2011 compared to December 31, 2010:
| | | | | | | | | | | | | | | | |
| Dollars (millions) — except ratio amounts | | September 30,
2011 | | | December 31,
2010 | | | Change | | | % Change | |
Current assets | | $ | 2,340 | | | $ | 2,095 | | | $ | 245 | | | | 12 | |
Current liabilities | | $ | (2,165 | ) | | $ | (3,144 | ) | | $ | 979 | | | | (31 | ) |
Working capital | | $ | 175 | | | $ | (1,049 | ) | | $ | 1,224 | | | | n/m | |
Current ratio | | | 1.08 | | | | 0.67 | | | | 0.41 | | | | 61 | |
Liquidity needs can be met through a variety of sources, including: cash generated from operations, drawdowns under our long-term revolving credit facilities, issuance of commercial paper and short-term borrowings under our line of credit. Our primary uses of funds are operating expenses, sustaining and opportunity capital spending, intercorporate investments, dividends, interest and principal payments on our debt securities.
Cash provided by operating activities grew quarter over quarter due to the rise in net income. Changes in non-cash operating working capital reduced cash flows from operating activities in 2011 and increased them in 2010 (payables and accrued charges declined in 2011 and increased the year before, while inventories declined significantly in 2010). Cash provided by operating activities rose year over year due to higher net income and was partially offset by changes in non-cash operating working capital, which was impacted by increased receivables and inventories (both fell during 2010) and reduced payables and accrued charges (increased during 2010). Increases to provisions for deferred income tax resulted from a cumulative adjustment for revised accelerated capital deductions. Contributions to pension benefit plans were higher in 2011 than in 2010.
Cash used in investing activities was primarily for additions to property, plant and equipment, of which approximately 83 percent (2010 — 76 percent) in the third quarter and 81 percent (2010 — 77 percent) in the first nine months of 2011 related to the potash segment. Also in the first nine months of 2010, additional shares of ICL were purchased.
Cash used in financing activities in the first nine months of 2011 primarily reflected repayment of 10-year senior notes at maturity. We continued to issue commercial paper in the third quarter and first nine months of 2011 and repayments exceeded issuances as a result of strong net cash inflows. In the first nine months of 2010, cash used in financing activities to repay our long-term credit facility and short-term debt obligations exceeded draws on our credit facilities.
We believe that internally generated cash flow, supplemented by borrowing from existing financing sources, if necessary, will be sufficient to meet our anticipated capital expenditures and other cash requirements for at least the next 12 months, exclusive of any
acquisitions the company may consider from time to time. At this time, we do not reasonably expect any presently known trend or uncertainty to affect our ability to access our historical sources of cash.
Principal Debt Instruments
| | | | | | | | | | | | |
| | | | | | September 30, 2011 | | | | |
| Dollars (millions) | | Total
Amount | | | Amount Outstanding
and Committed | | | Amount
Available | |
Credit facilities(1) | | $ | 3,500 | | | $ | 879 | | | $ | 2,621 | |
Line of credit | | | 75 | | | | 23 | (2) | | | 52 | |
| (1) | In March 2011, the company established a commercial paper program in the US. The authorized amount under the company’s commercial paper programs in Canada and the US is $1,500 million in the aggregate. The amounts available under the commercial paper programs are limited to the availability of backup funds under the credit facilities. Included in the amount outstanding and committed is $879 million of commercial paper. Per the terms of the agreements, the commercial paper outstanding and committed, as applicable under the Canadian program, is based on the US dollar balance or equivalent thereof in lawful money of other currencies at the time of issue. Accordingly, subsequent changes in the exchange rate applicable to Canadian dollar-denominated commercial paper have no impact on this balance. |
| (2) | Letters of credit committed. |
We use a combination of short-term and long-term debt to finance our operations. We effectively pay floating rates of interest on our commercial paper and credit facilities, and fixed rates on our senior notes. As of September 30, 2011, interest rates ranged from 0.34 percent to 0.50 percent on outstanding commercial paper denominated in US dollars.
Our two syndicated credit facilities provide for unsecured advances up to the total facilities amount less direct borrowings and amounts committed in respect of commercial paper outstanding. The $2,750 million credit facility was increased from $2,500 million in September 2011, the maturity was extended from December 11, 2012 to December 11, 2016 and the following changes were made to the principal covenants: the tangible net worth requirement was eliminated in its entirety, a $300 million permitted lien basket was added, the limitation on debt of subsidiaries was increased to $1,000 million from $650 million and the size of facilities covered by the cross default clause was increased to CDN $100 million from
| | |
| 47 | | PotashCorp 2011 Third Quarter Quarterly Report on Form 10-Q |
CDN $40 million. The $750 million credit facility matures May 31, 2013. We also have a $75 million short-term line of credit that is available through August 2012 and an uncommitted $30 million letter of credit facility that is due on demand. Direct borrowings and outstanding letters of credit reduce the amounts available under these facilities. The line of credit and credit facilities have financial tests and other covenants (detailed in Note 10 to the 2010 audited annual consolidated financial statements except as noted above) with which we must comply at each quarter-end. Non-compliance with any of the covenants described above could result in accelerated payment of amounts borrowed and termination of lenders’ further funding obligations under the credit facilities and line of credit. We were in compliance with all covenants described above as of September 30, 2011.
Our ability to access reasonably priced debt in the capital markets is dependent, in part, on the quality of our credit ratings. We continue to maintain investment grade credit ratings for our long-term debt. A downgrade of the credit rating of our long-term debt by Standard & Poor’s would increase the interest rates applicable to borrowings under our syndicated credit facilities and our line of credit.
Commercial paper markets are normally a source of same-day cash for the company. Our access to the Canadian and US commercial paper markets primarily depends on maintaining our current short-term credit ratings as well as general conditions in the money markets.
| | | | | | | | |
| | | Long-Term Debt | | Short-Term Debt |
| Rating (outlook) | | Sep 30,
2011 | | Dec 31, 2010 | | Sep 30,
2011 | | Dec 31,
2010 |
Moody’s | | Baa1(positive) | | Baa1 (positive) | | P-2 | | n/a |
Standard & Poor’s | | A- (stable) | | A- (negative) | | A-2(1) | | A-2 |
DBRS | | n/a | | n/a | | R1 low | | R1 low |
| (1) | S&P assigned a global commercial paper rating of A-2, but rated our commercial paper A-1 (low) on a Canadian scale. |
n/a = not applicable
A security rating is not a recommendation to buy, sell or hold securities. Such rating may be subject to revision or withdrawal at any time by the respective credit rating agency and each rating should be evaluated independently of any other rating.
Our $3,750 million of outstanding senior notes were registered under US shelf registration statements.
As at September 30, 2011, our weighted average cost of capital was 9.9 percent (2010 — 10.0 percent), of which 90 percent represented equity (2010 — 90 percent).
Outstanding Share Data
We had 856,387,674 common shares issued and outstanding at September 30, 2011, compared to 853,122,693 at December 31, 2010. During the third quarter and first nine months of 2011, the company issued 848,763 and 3,264,981 common shares, respectively, pursuant to the exercise of stock options and under our dividend reinvestment plan. At September 30, 2011, 29,937,991 options to purchase common shares were outstanding under the company’s nine stock option plans, as compared to 32,121,309 under eight stock option plans at December 31, 2010.
Off-Balance Sheet Arrangements
In the normal course of operations, PotashCorp engages in a variety of transactions that, under IFRS, are either not recorded on our consolidated statements of financial position or are recorded there in amounts that differ from the full contract amounts. These principal off-balance sheet activities include operating leases, agreement to reimburse losses of Canpotex, issuance of guarantee contracts, certain derivative instruments and long-term contracts. We do not reasonably expect any presently known trend or uncertainty to affect our ability to continue using these arrangements. Refer to Notes 12 and 14 to the financial statements in this 10-Q for contingencies related to Canpotex and information on our guarantees, respectively. Refer to page 59 of our 2010 Financial Review Annual Report for information on derivative instruments. See “Cash Requirements” above and our 2010 Financial Review Annual Report for obligations related to operating leases and certain of our long-term raw materials agreements which contain fixed price components.
| | |
| PotashCorp 2011 Third Quarter Quarterly Report on Form 10-Q | | 48 |
Quarterly Financial Highlights
| | | | | | | | | | | | | | | | | | | | | | | | | | | | | | | | |
Dollars (millions) —
except per-share amounts | | September 30,
2011 | | | June 30,
2011 | | | March 31,
2011 | | | December 31,
2010 | | | September 30,
2010 | | | June 30,
2010 | | | March 31,
2010 | | | December 31,
2009(1) | |
Sales | | $ | 2,321 | | | $ | 2,325 | | | $ | 2,204 | | | $ | 1,813 | | | $ | 1,575 | | | $ | 1,437 | | | $ | 1,714 | | | $ | 1,099 | |
Gross margin | | | 1,132 | | | | 1,168 | | | | 1,096 | | | | 826 | | | | 550 | | | | 585 | | | | 729 | | | | 273 | |
Net income | | | 826 | | | | 840 | | | | 732 | | | | 508 | | | | 343 | | | | 480 | | | | 444 | | | | 239 | |
Net income per share — basic | | | 0.96 | | | | 0.98 | | | | 0.86 | | | | 0.58 | | | | 0.39 | | | | 0.54 | | | | 0.50 | | | | 0.27 | |
Net income per share — diluted | | | 0.94 | | | | 0.96 | | | | 0.84 | | | | 0.56 | | | | 0.38 | | | | 0.53 | | | | 0.49 | | | | 0.26 | |
| (1) | As we adopted IFRS with effect from January 1, 2010, our 2009 quarterly information is presented on a Canadian GAAP basis. Accordingly, our quarterly information for 2011 and 2010 may not be comparable to that for 2009. |
Net income per share for each quarter has been computed based on the weighted average number of shares issued and outstanding during the respective quarter, including the dilutive number of shares assumed for the diluted earnings per share computation; therefore, as the number of shares varies each period, quarterly amounts may not add to the annual total.
Certain aspects of our business can be impacted by seasonal factors. Fertilizers are sold primarily for spring and fall application in both Northern and Southern hemispheres. However, planting conditions and the timing of customer purchases will vary each year and fertilizer sales can be expected to shift from one quarter to another. Most feed and industrial sales are by contract and are more evenly distributed throughout the year.
Related Party Transactions
Refer to Note 13 to the financial statements in this 10-Q for information pertaining to transactions with related parties.
Critical Accounting Estimates
Our discussion and analysis of our financial condition and results of operations are based upon our unaudited interim condensed consolidated financial statements, which comply with IFRS. These principles differ in certain significant respects from accounting principles generally accepted in the United States. These differences are described and quantified in Note 14 to the financial statements in this 10-Q.
The accounting policies used in preparing the financial statements in this 10-Q are consistent with those described in Notes 1 and 13 to Part I Item 1 of our 2011 First Quarter Quarterly Report on Form 10-Q. Certain of these policies involve critical accounting estimates because they require us to make particularly subjective or complex judgments about matters that are inherently uncertain and because of the likelihood that materially different amounts could be reported under different conditions or using different assumptions. There have been no material changes to our critical accounting estimate policies in the first nine months of 2011.
We discussed the development, selection and application of our key accounting policies, and the critical accounting estimates and assumptions they involve, with the audit committee of the Board of Directors, and the committee reviewed the disclosures described in this section.
Recent Accounting Changes
Refer to Note 1 to the financial statements in this 10-Q for information pertaining to accounting changes effective in 2011, and Notes 1 and 14 to the financial statements in this 10-Q for information on issued accounting pronouncements that will be effective in future periods.
We applied IFRS as of January 1, 2010 and retrospectively applied all effective IFRS, meaning that the comparative financial information provided uses the same accounting policies throughout all periods. We also applied certain optional and mandatory exemptions as outlined in Note 13 in Part I Item 1 of our 2011 First Quarter Quarterly Report on Form 10-Q. The changes in our reported results were the result of our adoption of IFRS and not an underlying change in our business.
Risk Management
Execution of our corporate strategy requires an effective program to manage the associated risks. The PotashCorp Risk Management Framework (“the Framework”) is applied to identify and manage such risks. The Framework consists of a comprehensive risk universe, with six corporate risk categories, and corresponding identification of risk events. The major corporate categories of risks are: markets/business, distribution, operational, financial, compliance and organizational. Separately and in combination, these risks potentially threaten our strategies and could affect our ability to deliver long-term shareholder value.
The Framework establishes an entity-wide risk ranking methodology. Risk events are evaluated against the criteria of likelihood or frequency of occurrence and the consequential magnitude or severity of the event. Mitigation activities are
| | |
| 49 | | PotashCorp 2011 Third Quarter Quarterly Report on Form 10-Q |
identified that will reduce the likelihood and/or severity of the occurrence of a risk event. The residual risk that results from identified mitigation activities is also evaluated using the same criteria. Management identifies the most significant risks to our strategy and reports to the Board of Directors on the mitigation plans.
The company’s Risk Management Process of identification, management and reporting of risk is continuous and dynamic. Changes to corporate risk that result from changing internal and external factors are evaluated on a quarterly basis and significant changes in risks and corresponding mitigation activities are reported quarterly to the audit committee. Detailed discussion of the PotashCorp Risk Management Process can be found on pages 45 and 46 of our 2010 Financial Review Annual Report as well as in our 2010 Annual Report on Form 10-K. Risk management discussions specific to potash, phosphate and nitrogen operations can be found on pages 25, 31 and 37, respectively, of the 2010 Financial Review Annual Report.
The company recognizes damage to reputation as one of its most severe risk consequences, which is mitigated by ongoing and transparent communication with stakeholders, commitment to sustainability, and best practices in corporate governance. Moreover, significant investments and operations in a number of countries subject the company to business risks which could be exaggerated by differences in domestic culture, political and economic conditions, policies, laws and regulations. The company may also be adversely affected by changing anti-trust laws in operating jurisdictions worldwide.
The risks of greatest potential impact to potash reported in the 2010 Financial Review Annual Report include market supply imbalances which may result from fluctuations in global demand for product or from new competitor supply in the form of greenfield mines, inadequacy of the transportation and distribution infrastructure to timely accommodate volume delivery demands, and physical risks particular to underground mines (such as unexpected underground rock falls and water inflow from underground water-bearing strata). We mitigate the market imbalance risks by managing production to meet market demand. The company mitigates transportation and distribution risks both directly and through Canpotex by working with rail carriers and undertaking sufficient capital investment in transportation infrastructure and railcars. Underground mine risk mitigation activities include advanced geoseismic monitoring. At Lanigan, Saskatchewan, mitigation includes ground penetrating radar development and the installation of protective canopies on mining machines.
Similar risks of cyclicality and market imbalance exist in phosphate and nitrogen, largely due to competitive costs, availability of supply and government involvement. The company mitigates these risks by
focusing on less cyclical markets, maintaining a diversified sulfur supply portfolio and employing natural gas price risk hedging strategies where appropriate.
Outlook
Over the past quarter, investors reassessed risk in an environment of uncertainty surrounding potential European debt defaults and slower global economic growth. Equity and commodity markets quickly reflected these concerns, but our outlook for global fertilizer demand, and for our earnings, remains positive. While current economic issues cannot be ignored, we believe our business is built on fundamentals that differ from the quarter-to-quarter movements in global GDP estimates. The strength of fertilizer demand is tied to the global development story — a growing population demanding more and better food — and we believe the long-term drivers of our success continue to be strong.
Some investors have grown nervous as crop commodity prices have declined from previous highs and experienced heightened volatility in the midst of the macroeconomic uncertainty. While fertilizer demand is undeniably connected to the profitability of farmers around the world, the reality is that farmers’ planting and fertility decisions are not based on day-to-day movements in these markets but on the basics of soil science and the expectation of profit at the end of their growing season. With low global grain inventories continuing to support historically high crop prices, the prospect of strong farmer returns remains. We believe this will serve as a powerful motivator to improve fertilizer applications and, ultimately, food production.
Although fertilizer dealers around the world are acting prudently to minimize their risks and inventories, robust demand continues to pressure tight global potash supplies. We believe most producers have been operating at or near their full capabilities in an attempt to keep pace. We expect global shipments to be approximately 57 million tonnes for 2011 and reach a record 58-60 million tonnes in 2012. While we expect the industry’s global capacity to rise in the coming year, the majority of new capability is anticipated at our facilities. This year illustrated the difficult challenge of producing enough potash to meet demand in a tight supply market; however, we expect our capability to increase production will differentiate us from our competition.
We remain focused on the safe and successful execution of our potash expansion projects underway at Allan, Cory, New Brunswick and Rocanville. Combined with completed expansions at our other facilities, we expect to increase our operational capability in 2012. Our expansion efforts are preparing our company to better meet the world’s rising potash needs.
In North America, the combination of good harvest progress and the anticipation of above-average crop returns is expected to support ongoing strength in fertilizer demand. Strong shipments
| | |
| PotashCorp 2011 Third Quarter Quarterly Report on Form 10-Q | | 50 |
ahead of the fall application season have positioned dealers well to meet customer needs, and we anticipate post-harvest applications will support healthy fourth-quarter demand.
Latin American markets remain on pace for record fertilizer application in 2011, including record potash imports. Brazil’s burgeoning agricultural economy is creating increasing demand for potash as farmers capitalize on the opportunity to supply the soybeans, sugar cane, corn and other crops increasingly required by markets around the world. Despite robust potash shipments in advance of the primary planting season that is currently in full swing, we anticipate demand will remain seasonally strong for the fourth quarter, supported by purchasing for the Safrinha corn planting that typically begins in February.
India’s growing population has put significant strain on its food supply, and improving potash applications is critical to both its short-term and long-term crop production. With Canpotex’s settlement of new contracts with key Indian customers in August, sales have resumed to this important market. Shipments on remaining contract commitments will continue for the fourth quarter at a delivered price of $470 per tonne, before reflecting a $60 per tonne increase (to $530 per tonne) for volumes in first-quarter 2012. We anticipate rising demand in 2012.
Potash shipments to China are expected to continue throughout the fourth quarter as Canpotex fulfils its commitment on a six-month contract that runs to the end of December 2011. Given China’s growing food requirements, increasing crop production remains a top priority. With its limited ability to expand internal potash production capability and its significant nutrient requirements, we anticipate increased imports in 2012.
Potash consumption in other Asian markets remains strong, as farmers are generating solid returns for key crops grown in the region, including oil palm, rubber, sugar cane and rice. Each of these crops has major nutrient requirements that necessitate significant potash application. Despite shipments temporarily slowing in the fourth quarter, demand in this region is expected to continue to grow and consume record deliveries over the course of 2011.
In this environment, we now estimate our full-year 2011 potash segment gross margin will be in the range of $2.8-$3.1 billion. For the fourth quarter, we anticipate a larger allocation of sales to markets for standard product compared to typically higher-netback granular markets. Total shipments for 2011 are expected to approximate 9.5-9.7 million tonnes. Our ability to reach the top end of the previous sales guidance range has been impacted by weather-related downtime requirements at our Patience Lake solution mine as well as limited additional capability from our Cory operation as the ramping-up of our new red product mill continues. We expect per-tonne cost of goods sold for the fourth quarter will be slightly lower than in the third quarter but still higher than normal because of previously indicated maintenance-related
downtime at Rocanville (four weeks) and expansion-related downtime at Allan (six weeks).
We expect our combined phosphate and nitrogen gross margin for full-year 2011 to be in the range of $1.4-$1.7 billion.
We expect 2011 net income per share to be in the range of $3.40 to $3.80.
Forward-Looking Statements
Certain statements in this Quarterly Report on Form 10-Q, including those in the “Outlook” section of Management’s Discussion and Analysis of Financial Condition and Results of Operations relating to the period after September 30, 2011 are forward-looking statements or forward-looking information (“forward-looking statements”). These statements can be identified by expressions of belief, expectation or intention, as well as those statements that are not historical fact. These statements are based on certain factors and assumptions as set forth in this Form 10-Q, including with respect to: foreign exchange rates, expected growth, results of operations, performance, business prospects and opportunities; and effective tax rates. While the company considers these factors and assumptions to be reasonable based on information currently available, they may prove to be incorrect. Several factors could cause actual results to differ materially from those expressed in the forward-looking statements, including, but not limited to: fluctuations in supply and demand in the fertilizer, sulfur, transportation and petrochemical markets; changes in competitive pressures, including pricing pressures; adverse or uncertain economic conditions and changes in credit and financial markets; the results of sales contract negotiations with major markets; European sovereign debt crisis and the recent downgrade of US sovereign debt and political concern over related budgetary matters; timing and amount of capital expenditures; risks associated with natural gas and other hedging activities; changes in capital markets and corresponding effects on the company’s investments; changes in currency and exchange rates; unexpected geological or environmental conditions, including water inflow; potential adverse developments in new and pending legal proceedings or government investigations; strikes or other forms of work stoppage or slowdowns; changes in, and the effects of, government policies and regulations; and earnings, exchange rates and the decisions of taxing authorities, all of which could affect our effective tax rates. Additional risks and uncertainties can be found in our Form 10-K for the fiscal year ended December 31, 2010 under the captions “Forward-Looking Statements” and “Item 1A — Risk Factors” and in our other filings with the US Securities and Exchange Commission and the Canadian provincial securities commissions. Forward-looking statements are given only as at the date of this report and the company disclaims any obligation to update or revise the forward-looking statements, whether as a result of new information, future events or otherwise, except as required by law.
| | |
| 51 | | PotashCorp 2011 Third Quarter Quarterly Report on Form 10-Q |
Item 3. Quantitative and Qualitative Disclosures About Market Risk
Market risk is the potential for loss from adverse changes in the market value of financial instruments. The level of market risk to which we are exposed varies depending on the composition of our derivative instrument portfolio, as well as current and expected market conditions. A discussion of enterprise-wide risk management can be found in our 2010 Financial Review Annual Report, pages 45 and 46, and risk management discussion specific to potash, phosphate and nitrogen operations can be found on pages 25, 31 and 37, respectively, of that report. A discussion of commodity risk, foreign exchange risk, credit risk and liquidity risk can be found in Note 14 to the financial statements in this 10-Q.
Item 4. Controls and Procedures
As of September 30, 2011, we carried out an evaluation under the supervision and with the participation of our management, including our Chief Executive Officer and Chief Financial Officer, of the effectiveness of the design and operation of our disclosure controls and procedures. There are inherent limitations to the effectiveness of any system of disclosure controls and procedures, including the possibility of human error and the circumvention or overriding of the controls and procedures. Accordingly, even effective disclosure controls and procedures can only provide reasonable assurance of achieving their control objectives. Based upon that evaluation and as of September 30, 2011, the Chief Executive Officer and Chief Financial Officer concluded that the disclosure controls and procedures were effective to provide reasonable assurance that information required to be disclosed in the reports the company files and submits under theSecurities Exchange Act of 1934is recorded, processed, summarized and reported as and when required and that such information is accumulated and communicated to our management, including our Chief Executive Officer and Chief Financial Officer, as appropriate to allow timely decisions regarding required disclosure.
There has been no change in our internal control over financial reporting during the quarter ended September 30, 2011 that has materially affected, or is reasonably likely to materially affect, our internal control over financial reporting.
| | |
| PotashCorp 2011 Third Quarter Quarterly Report on Form 10-Q | | 52 |
Part II. Other Information
Item 1. Legal Proceedings
For a description of certain other legal and environmental proceedings, see Note 10 to the unaudited interim condensed consolidated financial statements included in Part I of this Quarterly Report on Form 10-Q.
Item 5. Other Information
Mine Safety Practices
Safety is the company’s top priority and we are committed to providing a healthy and safe work environment for our employees, contractors and all others at our sites to help meet our company-wide goal of achieving no harm to people.
The operations at the company’s Aurora, Weeping Water and White Springs facilities are subject to the Federal Mine Safety and Health Act of 1977, as amended by the Mine Improvement and New Emergency Response Act of 2006 (the “Act”), and the implementing regulations, which impose stringent health and safety standards on numerous aspects of mineral extraction and processing operations, including the training of personnel, operating procedures, operating equipment and other matters. Our Senior Safety Leadership Team is responsible for managing compliance with applicable government regulations, as well as implementing and overseeing the elements of our safety program as outlined in our Safety, Health and Environment Manual. The Weeping Water facility achieved a significant milestone on September 26, 2011, completing seven years without a Lost Time Incident.
Section 1503 of Dodd-Frank Wall Street Reform and Consumer Protection Act: Reporting Requirements Regarding Coal or Other Mine Safety
Section 1503(a) of the Dodd-Frank Wall Street Reform and Consumer Protection Act requires us to include certain safety information in the periodic reports we file with the United States Securities and Exchange Commission. The table below presents the following information for our Aurora,Weeping Water and White Springs facilities for the three months ended September 30, 2011:
| | | | | | | | | | | | | | |
| Three Months Ended September 30, 2011 | | Aurora,
North
Carolina | | | Weeping
Water,
Nebraska | | | White
Springs,
Florida | |
| (a) | | the total number of alleged violations of mandatory health or safety standards that could significantly or substantially contribute to the cause and effect of a coal or other mine safety or health hazard under Section 104 of the Mine Safety and Health Act of 1977 (“Act”) for which a citation was received from the Mine Safety and Health Administration (“MSHA”); | | | 0 | | | | 0 | | | | 0 | |
| (b) | | the total number of orders issued under section 104(b) of the Act; | | | 0 | | | | 0 | | | | 0 | |
| (c) | | the total number of citations received and orders issued under section 104(d) of the Act for alleged unwarrantable failures of the company to comply with mandatory health or safety standards; | | | 0 | | | | 0 | | | | 0 | |
| (d) | | the total number of alleged flagrant violations under section 110(b)(2) of the Act; | | | 0 | | | | 0 | | | | 0 | |
| (e) | | the total number of imminent danger orders issued under section 107(a) of the Act; | | | 0 | | | | 0 | | | | 0 | |
| (f) | | the total dollar value of proposed assessments from the MHSA under the Act; | | $ | 0 | * | | $ | 0 | * | | $ | 0 | ** |
| (g) | | the total number of mining-related fatalities; and | | | 0 | | | | 0 | | | | 0 | |
| (h) | | the total number of legal actions pending before the Federal Mine Safety and Health Review Commission as of September 30, 2011. | | | 0 | | | | 0 | | | | 0 | |
During the three months ended September 30, 2011, the company did not receive any written notice from the MSHA of (a) a pattern of violations of mandatory health or safety standards that are of such a nature as could have significantly and substantially contributed to the cause and effect of coal or other mine health or safety hazards under section 104(e) of the Act or (b) the potential to have such a pattern.
The table above does not include any citation, order or assessment that was both issued and vacated by the MSHA during the three months ended September 30, 2011.
| * | In the three months ended September 30, 2011, the Aurora and Weeping Water facilities paid $13,609 and $2,400 respectively to settle legal actions pending before the Federal Mine Safety and Health Review Commission. |
| ** | In the three months ended September 30, 2011, the White Springs facility paid $489 to resolve four citations. |
| | |
| 53 | | PotashCorp 2011 Third Quarter Quarterly Report on Form 10-Q |
Item 6. Exhibits
| | | | | | | | |
| | | | | Incorporated by Reference |
Exhibit
Number | | Description of Document | | Form | | Filing Date/Period
End Date | | Exhibit Number
(if different) |
| 3(a) | | Articles of Continuance of the registrant dated May 15, 2002. | | 10-Q | | 6/30/2002 | | |
| 3(b) | | Bylaws of the registrant effective May 15, 2002. | | 10-Q | | 6/30/2002 | | |
| 4(a) | | Term Credit Agreement between The Bank of Nova Scotia and other financial institutions and the registrant dated September 25, 2001. | | 10-Q | | 9/30/2001 | | |
| 4(b) | | Syndicated Term Credit Facility Amending Agreement between The Bank of Nova Scotia and other financial institutions and the registrant dated as of September 23, 2003. | | 10-Q | | 9/30/2003 | | |
| 4(c) | | Syndicated Term Credit Facility Second Amending Agreement between The Bank of Nova Scotia and other financial institutions and the registrant dated as of September 21, 2004. | | 8-K | | 9/24/2004 | | |
| 4(d) | | Syndicated Term Credit Facility Third Amending Agreement between The Bank of Nova Scotia and other financial institutions and the registrant dated as of September 20, 2005. | | 8-K | | 9/22/2005 | | 4(a) |
| 4(e) | | Syndicated Term Credit Facility Fourth Amending Agreement between The Bank of Nova Scotia and other financial institutions and the registrant dated as of September 27, 2006. | | 10-Q | | 9/30/2006 | | |
| 4(f) | | Syndicated Term Credit Facility Fifth Amending Agreement between the Bank of Nova Scotia and other financial institutions and the registrant dated as of October 19, 2007. | | 8-K | | 10/22/2007 | | 4(a) |
| 4(g) | | Indenture dated as of February 27, 2003, between the registrant and The Bank of Nova Scotia Trust Company of New York. | | 10-K | | 12/31/2002 | | 4(c) |
| 4(h) | | Form of Note relating to the registrant’s offering of $250,000,000 principal amount of 4.875% Notes due March 1, 2013. | | 8-K | | 2/28/2003 | | 4 |
| 4(i) | | Form of Note relating to the registrant’s offering of $500,000,000 principal amount of 5.875% Notes due December 1, 2036. | | 8-K | | 11/30/2006 | | 4(a) |
| 4(j) | | Form of Note relating to the registrant’s offering of $500,000,000 principal amount of 5.25% Notes due May 15, 2014. | | 8-K | | 5/1/2009 | | 4(a) |
| 4(k) | | Form of Note relating to the registrant’s offering of $500,000,000 principal amount of 6.50% Notes due May 15, 2019. | | 8-K | | 5/1/2009 | | 4(b) |
| 4(l) | | Form of Note relating to the registrant’s offering of $500,000,000 principal amount of 3.75% Notes due September 30, 2015. | | 8-K | | 9/25/2009 | | 4(a) |
| 4(m) | | Form of Note relating to the registrant’s offering of $500,000,000 principal amount of 4.875% Notes due March 30, 2020. | | 8-K | | 9/25/2009 | | 4(b) |
| 4(n) | | Revolving Term Credit Facility Agreement between the Bank of Nova Scotia and other financial institutions and the registrant dated December 11, 2009. | | 8-K | | 12/15/2009 | | 4(a) |
| 4(o) | | Revolving Term Credit Facility First Amending Agreement between the Bank of Nova Scotia and other financial institutions and the registrant dated as of September 23, 2011. | | 8-K | | 9/26/2011 | | 4(a) |
| 4(p) | | Form of Note relating to the registrant’s offering of $500,000,000 principal amount of 3.25% Notes due December 1, 2017. | | 8-K | | 11/29/2010 | | 4(a) |
| 4(q) | | Form of Note relating to the registrant’s offering of $500,000,000 principal amount of 5.625% Notes due December 1, 2040. | | 8-K | | 11/29/2010 | | 4(b) |
The registrant hereby undertakes to file with the Securities and Exchange Commission, upon request, copies of any constituent instruments defining the rights of holders of long-term debt of the registrant or its subsidiaries that have not been filed herewith because the amounts represented thereby are less than 10% of the total assets of the registrant and its subsidiaries on a consolidated basis.
| | |
| PotashCorp 2011 Third Quarter Quarterly Report on Form 10-Q | | 54 |
| | | | | | | | |
| | | | | Incorporated By Reference |
Exhibit
Number | | Description of Document | | Form | | Filing Date/Period
End Date | | Exhibit Number
(if different) |
| 10(a) | | Sixth Voting Agreement dated April 22, 1978, between Central Canada Potash, Division of Noranda, Inc., Cominco Ltd., International Minerals and Chemical Corporation (Canada) Limited, PCS Sales and Texasgulf Inc. | | F-1
(File No.
33-31303) | | 9/28/1989 | | 10(f) |
| 10(b) | | Canpotex Limited Shareholders Seventh Memorandum of Agreement effective April 21, 1978, between Central Canada Potash, Division of Noranda Inc., Cominco Ltd., International Minerals and Chemical Corporation (Canada) Limited, PCS Sales, Texasgulf Inc. and Canpotex Limited as amended by Canpotex S&P amending agreement dated November 4, 1987. | | F-1
(File No.
33-31303) | | 9/28/1989 | | 10(g) |
| 10(c) | | Producer Agreement dated April 21, 1978, between Canpotex Limited and PCS Sales. | | F-1
(File No.
33-31303) | | 9/28/1989 | | 10(h) |
| 10(d) | | Canpotex/PCS Amending Agreement, dated as of October 1, 1992. | | 10-K | | 12/31/1995 | | 10(f) |
| 10(e) | | Canpotex PCA Collateral Withdrawing/PCS Amending Agreement, dated as of October 7, 1993. | | 10-K | | 12/31/1995 | | 10(g) |
| 10(f) | | Canpotex Producer Agreement amending agreement dated as of July 1, 2002. | | 10-Q | | 6/30/2004 | | 10(g) |
| 10(g) | | Esterhazy Restated Mining and Processing Agreement dated January 31, 1978, between International Minerals & Chemical Corporation (Canada) Limited and the registrant’s predecessor. | | F-1
(File No.
33-31303) | | 9/28/1989 | | 10(e) |
| 10(h) | | Agreement dated December 21, 1990, between International Minerals & Chemical Corporation (Canada) Limited and the registrant, amending the Esterhazy Restated Mining and Processing Agreement dated January 31, 1978. | | 10-K | | 12/31/1990 | | 10(p) |
| 10(i) | | Agreement effective August 27, 1998, between International Minerals & Chemical (Canada) Global Limited and the registrant, amending the Esterhazy Restated Mining and Processing Agreement dated January 31, 1978 (as amended). | | 10-K | | 12/31/1998 | | 10(l) |
| 10(j) | | Agreement effective August 31, 1998, among International Minerals & Chemical (Canada) Global Limited, International Minerals & Chemical (Canada) Limited Partnership and the registrant assigning the interest in the Esterhazy Restated Mining and Processing Agreement dated January 31, 1978 (as amended) held by International Minerals & Chemical (Canada) Global Limited to International Minerals & Chemical (Canada) Limited Partnership. | | 10-K | | 12/31/1998 | | 10(m) |
| 10(k) | | Potash Corporation of Saskatchewan Inc. Stock Option Plan — Directors, as amended. | | 10-K | | 12/31/2006 | | 10(l) |
| 10(l) | | Potash Corporation of Saskatchewan Inc. Stock Option Plan — Officers and Employees, as amended. | | 10-K | | 12/31/2006 | | 10(m) |
| 10(m) | | Short-Term Incentive Plan of the registrant effective January 1, 2000, as amended. | | 10-Q | | 9/30/2009 | | |
| 10(n) | | Resolution and Forms of Agreement for Supplemental Executive Retirement Income Plan, for officers and key employees of the registrant. | | 10-K | | 12/31/1995 | | 10(o) |
| 10(o) | | Amending Resolution and revised forms of agreement regarding Supplemental Retirement Income Plan of the registrant. | | 10-Q | | 6/30/1996 | | 10(x) |
| 10(p) | | Amended and restated Supplemental Executive Retirement Income Plan of the registrant and text of amendment to existing supplemental income plan agreements. | | 10-Q | | 9/30/2000 | | 10(mm) |
| 10(q) | | Amendment, dated February 23, 2009, to the amended and restated Supplemental Executive Retirement Income Plan. | | 10-K | | 12/31/2008 | | 10(r) |
| 10(r) | | Amendment, dated December 29, 2010, to the amended and restated Supplemental Executive Retirement Income Plan. | | 10-K | | 12/31/2010 | | |
| | |
| 55 | | PotashCorp 2011 Third Quarter Quarterly Report on Form 10-Q |
| | | | | | | | |
| | | | | Incorporated By Reference |
Exhibit
Number | | Description of Document | | Form | | Filing Date/Period
End Date | | Exhibit Number
(if different) |
| 10(s) | | Form of Letter of amendment to existing supplemental income plan agreements of the registrant. | | 10-K | | 12/31/2002 | | 10(cc) |
| 10(t) | | Amended and restated agreement dated February 20, 2007, between the registrant and William J. Doyle concerning the Supplemental Executive Retirement Income Plan. | | 10-K | | 12/31/2006 | | 10(s) |
| 10(u) | | Amendment, dated December 24, 2008, to the amended and restated agreement, dated February 20, 2007, between the registrant and William J. Doyle concerning the Supplemental Executive Retirement Income Plan. | | 10-K | | 12/31/2008 | | |
| 10(v) | | Amendment, dated February 23, 2009, to the amended and restated agreement, dated February 20, 2007, between the registrant and William J. Doyle concerning the Supplemental Executive Retirement Income Plan. | | 10-K | | 12/31/2008 | | |
| 10(w) | | Amendment, dated February 23, 2009, to the amended and restated agreement dated August 2, 1996, between the registrant and Wayne R. Brownlee concerning the Supplemental Executive Retirement Income Plan. | | 10-K | | 12/31/2008 | | |
| 10(x) | | Amendment, dated February 23, 2009, to the amended and restated agreement, dated August 2, 1996, between the registrant and Garth W. Moore concerning the Supplemental Executive Retirement Income Plan. | | 10-K | | 12/31/2008 | | |
| 10(y) | | Amendment, dated December 29, 2010, to the amended and restated agreement, dated February 20, 2007, between the registrant and William J. Doyle concerning the Supplemental Executive Retirement Income Plan. | | 10-K | | 12/31/2010 | | |
| 10(z) | | Amendment, dated December 29, 2010, to the amended and restated agreement, dated August 2, 1996, between the registrant and Wayne R. Brownlee concerning the Supplemental Executive Retirement Income Plan. | | 10-K | | 12/31/2010 | | |
| 10(aa) | | Amendment, dated December 29, 2010, to the amended and restated agreement, dated August 2, 1996, between the registrant and Garth W. Moore concerning the Supplemental Executive Retirement Income Plan. | | 10-K | | 12/31/2010 | | |
| 10(bb) | | Supplemental Retirement Benefits Plan for U.S. Executives dated effective January 1, 1999. | | 10-Q | | 6/30/2002 | | 10(aa) |
| 10(cc) | | Amendment No. 1, dated December 24, 2008, to the Supplemental Retirement Plan for U.S. Executives. | | 10-K | | 12/31/2008 | | 10(z) |
| 10(dd) | | Amendment No. 2, dated February 23, 2009, to the Supplemental Retirement Plan for U.S. Executives. | | 10-K | | 12/31/2008 | | 10(aa) |
| 10(ee) | | Forms of Agreement dated December 30, 1994, between the registrant and certain officers of the registrant. | | 10-K | | 12/31/1995 | | 10(p) |
| 10(ff) | | Amendment, dated December 31, 2010, to the Agreement, dated December 30, 1994 between the registrant and William J. Doyle. | | 10-K | | 12/31/2010 | | |
| 10(gg) | | Form of Agreement of Indemnification dated August 8, 1995, between the registrant and certain officers and directors of the registrant. | | 10-K | | 12/31/1995 | | 10(q) |
| 10(hh) | | Resolution and Form of Agreement of Indemnification dated January 24, 2001. | | 10-K | | 12/31/2000 | | 10(ii) |
| 10(ii) | | Resolution and Form of Agreement of Indemnification — July 21, 2004. | | 10-Q | | 6/30/2004 | | |
| 10(jj) | | Chief Executive Officer Medical and Dental Benefits. | | 10-K | | 12/31/2010 | | |
| 10(kk) | | Deferred Share Unit Plan for Non-Employee Directors, as amended. | | 10-Q | | 3/31/2008 | | 10(bb) |
| 10(ll) | | U.S. Participant Addendum No. 1 to the Deferred Share Unit Plan for Non-Employee Directors. | | 10-K | | 12/31/2008 | | 10(jj) |
| 10(mm) | | Potash Corporation of Saskatchewan Inc. 2005 Performance Option Plan and Form of Option Agreement, as amended. | | 10-K | | 12/31/2006 | | 10(cc) |
| 10(nn) | | Potash Corporation of Saskatchewan Inc. 2006 Performance Option Plan and Form of Option Agreement, as amended. | | 10-K | | 12/31/2006 | | 10(dd) |
| | |
| PotashCorp 2011 Third Quarter Quarterly Report on Form 10-Q | | 56 |
| | | | | | | | |
| | | | | Incorporated By Reference |
Exhibit
Number | | Description of Document | | Form | | Filing Date/Period
End Date | | Exhibit Number
(if different) |
| 10(oo) | | Potash Corporation of Saskatchewan Inc. 2007 Performance Option Plan and Form of Option Agreement. | | 10-Q | | 3/31/2007 | | 10(ee) |
| 10(pp) | | Potash Corporation of Saskatchewan Inc. 2008 Performance Option Plan and Form of Option Agreement. | | 10-Q | | 3/31/2008 | | 10(ff) |
| 10(qq) | | Potash Corporation of Saskatchewan Inc. 2009 Performance Option Plan and Form of Option Agreement. | | 10-Q | | 3/31/2009 | | 10(mm) |
| 10(rr) | | Potash Corporation of Saskatchewan Inc. 2010 Performance Option Plan and Form of Option Agreement. | | 8-K | | 5/7/2010 | | 10.1 |
| 10(ss) | | Potash Corporation of Saskatchewan Inc. 2011 Performance Option Plan and Form of Option Agreement. | | 8-K | | 5/13/2011 | | 10(a) |
| 10(tt) | | Medium-Term Incentive Plan of the registrant effective January 1, 2009. | | 10-K | | 12/31/2008 | | 10(qq) |
| 11 | | Statement re Computation of Per Share Earnings. | | | | | | |
| 31(a) | | Certification pursuant to Section 302 of theSarbanes-Oxley Act of 2002. | | | | | | |
| 31(b) | | Certification pursuant to Section 302 of theSarbanes-Oxley Act of 2002. | | | | | | |
| 32 | | Certification pursuant to Section 906 of theSarbanes-Oxley Act of 2002. | | | | | | |
| | |
| 57 | | PotashCorp 2011 Third Quarter Quarterly Report on Form 10-Q |
Signatures
Pursuant to the requirements of the Securities Exchange Act of 1934, the registrant has duly caused this report to be signed on its behalf by the undersigned, thereunto duly authorized.
| | | | | | |
| | | | POTASH CORPORATION OF SASKATCHEWAN INC. |
| | | |
| November 4, 2011 | | | | By: | | /s/ JOSEPH PODWIKA |
| | | | | | Joseph Podwika |
| | | | | | Senior Vice President, General Counsel and Secretary |
| | | |
| November 4, 2011 | | | | By: | | /s/ WAYNE R. BROWNLEE |
| | | | | | Wayne R. Brownlee |
| | | | | | Executive Vice President, Treasurer and Chief Financial Officer (Principal Financial and Accounting Officer) |
| | |
| PotashCorp 2011 Third Quarter Quarterly Report on Form 10-Q | | 58 |
EXHIBIT INDEX
| | | | | | | | |
| | | | | Incorporated by Reference |
Exhibit
Number | | Description of Document | | Form | | Filing Date/Period
End Date | | Exhibit Number
(if different) |
| 3(a) | | Articles of Continuance of the registrant dated May 15, 2002. | | 10-Q | | 6/30/2002 | | |
| 3(b) | | Bylaws of the registrant effective May 15, 2002. | | 10-Q | | 6/30/2002 | | |
| 4(a) | | Term Credit Agreement between The Bank of Nova Scotia and other financial institutions and the registrant dated September 25, 2001. | | 10-Q | | 9/30/2001 | | |
| 4(b) | | Syndicated Term Credit Facility Amending Agreement between The Bank of Nova Scotia and other financial institutions and the registrant dated as of September 23, 2003. | | 10-Q | | 9/30/2003 | | |
| 4(c) | | Syndicated Term Credit Facility Second Amending Agreement between The Bank of Nova Scotia and other financial institutions and the registrant dated as of September 21, 2004. | | 8-K | | 9/24/2004 | | |
| 4(d) | | Syndicated Term Credit Facility Third Amending Agreement between The Bank of Nova Scotia and other financial institutions and the registrant dated as of September 20, 2005. | | 8-K | | 9/22/2005 | | 4(a) |
| 4(e) | | Syndicated Term Credit Facility Fourth Amending Agreement between The Bank of Nova Scotia and other financial institutions and the registrant dated as of September 27, 2006. | | 10-Q | | 9/30/2006 | | |
| 4(f) | | Syndicated Term Credit Facility Fifth Amending Agreement between the Bank of Nova Scotia and other financial institutions and the registrant dated as of October 19, 2007. | | 8-K | | 10/22/2007 | | 4(a) |
| 4(g) | | Indenture dated as of February 27, 2003, between the registrant and The Bank of Nova Scotia Trust Company of New York. | | 10-K | | 12/31/2002 | | 4(c) |
| 4(h) | | Form of Note relating to the registrant’s offering of $250,000,000 principal amount of 4.875% Notes due March 1, 2013. | | 8-K | | 2/28/2003 | | 4 |
| 4(i) | | Form of Note relating to the registrant’s offering of $500,000,000 principal amount of 5.875% Notes due December 1, 2036. | | 8-K | | 11/30/2006 | | 4(a) |
| 4(j) | | Form of Note relating to the registrant’s offering of $500,000,000 principal amount of 5.25% Notes due May 15, 2014. | | 8-K | | 5/1/2009 | | 4(a) |
| 4(k) | | Form of Note relating to the registrant’s offering of $500,000,000 principal amount of 6.50% Notes due May 15, 2019. | | 8-K | | 5/1/2009 | | 4(b) |
| 4(l) | | Form of Note relating to the registrant’s offering of $500,000,000 principal amount of 3.75% Notes due September 30, 2015. | | 8-K | | 9/25/2009 | | 4(a) |
| 4(m) | | Form of Note relating to the registrant’s offering of $500,000,000 principal amount of 4.875% Notes due March 30, 2020. | | 8-K | | 9/25/2009 | | 4(b) |
| 4(n) | | Revolving Term Credit Facility Agreement between the Bank of Nova Scotia and other financial institutions and the registrant dated December 11, 2009. | | 8-K | | 12/15/2009 | | 4(a) |
| 4(o) | | Revolving Term Credit Facility First Amending Agreement between the Bank of Nova Scotia and other financial institutions and the registrant dated as of September 23, 2011. | | 8-K | | 9/26/2011 | | 4(a) |
| 4(p) | | Form of Note relating to the registrant’s offering of $500,000,000 principal amount of 3.25% Notes due December 1, 2017. | | 8-K | | 11/29/2010 | | 4(a) |
| 4(q) | | Form of Note relating to the registrant’s offering of $500,000,000 principal amount of 5.625% Notes due December 1, 2040. | | 8-K | | 11/29/2010 | | 4(b) |
The registrant hereby undertakes to file with the Securities and Exchange Commission, upon request, copies of any constituent instruments defining the rights of holders of long-term debt of the registrant or its subsidiaries that have not been filed herewith because the amounts represented thereby are less than 10% of the total assets of the registrant and its subsidiaries on a consolidated basis.
| | | | | | | | | | |
| | | | | Incorporated By Reference |
Exhibit
Number | | Description of Document | | Form | | Filing Date/Period
End Date | | | Exhibit Number
(if different) |
| 10(a) | | Sixth Voting Agreement dated April 22, 1978, between Central Canada Potash, Division of Noranda, Inc., Cominco Ltd., International Minerals and Chemical Corporation (Canada) Limited, PCS Sales and Texasgulf Inc. | | F-1
(File No.
33-31303) | | | 9/28/1989 | | | 10(f) |
| 10(b) | | Canpotex Limited Shareholders Seventh Memorandum of Agreement effective April 21, 1978, between Central Canada Potash, Division of Noranda Inc., Cominco Ltd., International Minerals and Chemical Corporation (Canada) Limited, PCS Sales, Texasgulf Inc. and Canpotex Limited as amended by Canpotex S&P amending agreement dated November 4, 1987. | | F-1
(File No.
33-31303) | | | 9/28/1989 | | | 10(g) |
| 10(c) | | Producer Agreement dated April 21, 1978, between Canpotex Limited and PCS Sales. | | F-1
(File No.
33-31303) | | | 9/28/1989 | | | 10(h) |
| 10(d) | | Canpotex/PCS Amending Agreement, dated as of October 1, 1992. | | 10-K | | | 12/31/1995 | | | 10(f) |
| 10(e) | | Canpotex PCA Collateral Withdrawing/PCS Amending Agreement, dated as of October 7, 1993. | | 10-K | | | 12/31/1995 | | | 10(g) |
| 10(f) | | Canpotex Producer Agreement amending agreement dated as of July 1, 2002. | | 10-Q | | | 6/30/2004 | | | 10(g) |
| 10(g) | | Esterhazy Restated Mining and Processing Agreement dated January 31, 1978, between International Minerals & Chemical Corporation (Canada) Limited and the registrant’s predecessor. | | F-1
(File No.
33-31303) | | | 9/28/1989 | | | 10(e) |
| 10(h) | | Agreement dated December 21, 1990, between International Minerals & Chemical Corporation (Canada) Limited and the registrant, amending the Esterhazy Restated Mining and Processing Agreement dated January 31, 1978. | | 10-K | | | 12/31/1990 | | | 10(p) |
| 10(i) | | Agreement effective August 27, 1998, between International Minerals & Chemical (Canada) Global Limited and the registrant, amending the Esterhazy Restated Mining and Processing Agreement dated January 31, 1978 (as amended). | | 10-K | | | 12/31/1998 | | | 10(l) |
| 10(j) | | Agreement effective August 31, 1998, among International Minerals & Chemical (Canada) Global Limited, International Minerals & Chemical (Canada) Limited Partnership and the registrant assigning the interest in the Esterhazy Restated Mining and Processing Agreement dated January 31, 1978 (as amended) held by International Minerals & Chemical (Canada) Global Limited to International Minerals & Chemical (Canada) Limited Partnership. | | 10-K | | | 12/31/1998 | | | 10(m) |
| 10(k) | | Potash Corporation of Saskatchewan Inc. Stock Option Plan — Directors, as amended. | | 10-K | | | 12/31/2006 | | | 10(l) |
| 10(l) | | Potash Corporation of Saskatchewan Inc. Stock Option Plan — Officers and Employees, as amended. | | 10-K | | | 12/31/2006 | | | 10(m) |
| 10(m) | | Short-Term Incentive Plan of the registrant effective January 1, 2000, as amended. | | 10-Q | | | 9/30/2009 | | | |
| 10(n) | | Resolution and Forms of Agreement for Supplemental Executive Retirement Income Plan, for officers and key employees of the registrant. | | 10-K | | | 12/31/1995 | | | 10(o) |
| 10(o) | | Amending Resolution and revised forms of agreement regarding Supplemental Retirement Income Plan of the registrant. | | 10-Q | | | 6/30/1996 | | | 10(x) |
| 10(p) | | Amended and restated Supplemental Executive Retirement Income Plan of the registrant and text of amendment to existing supplemental income plan agreements. | | 10-Q | | | 9/30/2000 | | | 10(mm) |
| 10(q) | | Amendment, dated February 23, 2009, to the amended and restated Supplemental Executive Retirement Income Plan. | | 10-K | | | 12/31/2008 | | | 10(r) |
| 10(r) | | Amendment, dated December 29, 2010, to the amended and restated Supplemental Executive Retirement Income Plan. | | 10-K | | | 12/31/2010 | | | |
| | | | | | | | | | |
| | | | | Incorporated By Reference |
Exhibit
Number | | Description of Document | | Form | | Filing Date/Period
End Date | | | Exhibit Number
(if different) |
| 10(s) | | Form of Letter of amendment to existing supplemental income plan agreements of the registrant. | | 10-K | | | 12/31/2002 | | | 10(cc) |
| 10(t) | | Amended and restated agreement dated February 20, 2007, between the registrant and William J. Doyle concerning the Supplemental Executive Retirement Income Plan. | | 10-K | | | 12/31/2006 | | | 10(s) |
| 10(u) | | Amendment, dated December 24, 2008, to the amended and restated agreement, dated February 20, 2007, between the registrant and William J. Doyle concerning the Supplemental Executive Retirement Income Plan. | | 10-K | | | 12/31/2008 | | | |
| 10(v) | | Amendment, dated February 23, 2009, to the amended and restated agreement, dated February 20, 2007, between the registrant and William J. Doyle concerning the Supplemental Executive Retirement Income Plan. | | 10-K | | | 12/31/2008 | | | |
| 10(w) | | Amendment, dated February 23, 2009, to the amended and restated agreement dated August 2, 1996, between the registrant and Wayne R. Brownlee concerning the Supplemental Executive Retirement Income Plan. | | 10-K | | | 12/31/2008 | | | |
| 10(x) | | Amendment, dated February 23, 2009, to the amended and restated agreement, dated August 2, 1996, between the registrant and Garth W. Moore concerning the Supplemental Executive Retirement Income Plan. | | 10-K | | | 12/31/2008 | | | |
| 10(y) | | Amendment, dated December 29, 2010, to the amended and restated agreement, dated February 20, 2007, between the registrant and William J. Doyle concerning the Supplemental Executive Retirement Income Plan. | | 10-K | | | 12/31/2010 | | | |
| 10(z) | | Amendment, dated December 29, 2010, to the amended and restated agreement, dated August 2, 1996, between the registrant and Wayne R. Brownlee concerning the Supplemental Executive Retirement Income Plan. | | 10-K | | | 12/31/2010 | | | |
| 10(aa) | | Amendment, dated December 29, 2010, to the amended and restated agreement, dated August 2, 1996, between the registrant and Garth W. Moore concerning the Supplemental Executive Retirement Income Plan. | | 10-K | | | 12/31/2010 | | | |
| 10(bb) | | Supplemental Retirement Benefits Plan for U.S. Executives dated effective January 1, 1999. | | 10-Q | | | 6/30/2002 | | | 10(aa) |
| 10(cc) | | Amendment No. 1, dated December 24, 2008, to the Supplemental Retirement Plan for U.S. Executives. | | 10-K | | | 12/31/2008 | | | 10(z) |
| 10(dd) | | Amendment No. 2, dated February 23, 2009, to the Supplemental Retirement Plan for U.S. Executives. | | 10-K | | | 12/31/2008 | | | 10(aa) |
| 10(ee) | | Forms of Agreement dated December 30, 1994, between the registrant and certain officers of the registrant. | | 10-K | | | 12/31/1995 | | | 10(p) |
| 10(ff) | | Amendment, dated December 31, 2010, to the Agreement, dated December 30, 1994 between the registrant and William J. Doyle. | | 10-K | | | 12/31/2010 | | | |
| 10(gg) | | Form of Agreement of Indemnification dated August 8, 1995, between the registrant and certain officers and directors of the registrant. | | 10-K | | | 12/31/1995 | | | 10(q) |
| 10(hh) | | Resolution and Form of Agreement of Indemnification dated January 24, 2001. | | 10-K | | | 12/31/2000 | | | 10(ii) |
| 10(ii) | | Resolution and Form of Agreement of Indemnification — July 21, 2004. | | 10-Q | | | 6/30/2004 | | | |
| 10(jj) | | Chief Executive Officer Medical and Dental Benefits. | | 10-K | | | 12/31/2010 | | | |
| 10(kk) | | Deferred Share Unit Plan for Non-Employee Directors, as amended. | | 10-Q | | | 3/31/2008 | | | 10(bb) |
| 10(ll) | | U.S. Participant Addendum No. 1 to the Deferred Share Unit Plan for Non-Employee Directors. | | 10-K | | | 12/31/2008 | | | 10(jj) |
| 10(mm) | | Potash Corporation of Saskatchewan Inc. 2005 Performance Option Plan and Form of Option Agreement, as amended. | | 10-K | | | 12/31/2006 | | | 10(cc) |
| 10(nn) | | Potash Corporation of Saskatchewan Inc. 2006 Performance Option Plan and Form of Option Agreement, as amended. | | 10-K | | | 12/31/2006 | | | 10(dd) |
| | | | | | | | | | |
| | | | | Incorporated By Reference |
Exhibit
Number | | Description of Document | | Form | | Filing Date/Period
End Date | | | Exhibit Number
(if different) |
| 10(oo) | | Potash Corporation of Saskatchewan Inc. 2007 Performance Option Plan and Form of Option Agreement. | | 10-Q | | | 3/31/2007 | | | 10(ee) |
| 10(pp) | | Potash Corporation of Saskatchewan Inc. 2008 Performance Option Plan and Form of Option Agreement. | | 10-Q | | | 3/31/2008 | | | 10(ff) |
| 10(qq) | | Potash Corporation of Saskatchewan Inc. 2009 Performance Option Plan and Form of Option Agreement. | | 10-Q | | | 3/31/2009 | | | 10(mm) |
| 10(rr) | | Potash Corporation of Saskatchewan Inc. 2010 Performance Option Plan and Form of Option Agreement. | | 8-K | | | 5/7/2010 | | | 10.1 |
| 10(ss) | | Potash Corporation of Saskatchewan Inc. 2011 Performance Option Plan and Form of Option Agreement. | | 8-K | | | 5/13/2011 | | | 10(a) |
| 10(tt) | | Medium-Term Incentive Plan of the registrant effective January 1, 2009. | | 10-K | | | 12/31/2008 | | | 10(qq) |
| 11 | | Statement re Computation of Per Share Earnings. | | | | | | | | |
| 31(a) | | Certification pursuant to Section 302 of theSarbanes-Oxley Act of 2002. | | | | | | | | |
| 31(b) | | Certification pursuant to Section 302 of theSarbanes-Oxley Act of 2002. | | | | | | | | |
| 32 | | Certification pursuant to Section 906 of theSarbanes-Oxley Act of 2002. | | | | | | | | |