Third Quarter 2013 Investor Presentation United Community Banks, Inc. Jimmy C. Tallent President & Chief Executive Officer H. Lynn Harton Chief Operating Officer Rex S. Schuette Executive Vice President & Chief Financial Officer rex_schuette@ucbi.com (706) 781 - 2266 David P. Shearrow Executive Vice President & Chief Risk Officer
Cautionary Statement This investor presentation may contain forward - looking statements, as defined by federal securities laws, including statements about United’s financial outlook and business environment . These statements are based on current expectations and are provided to assist in the understanding of future financial performance . Such performance involves risks and uncertainties that may cause actual results to differ materially from those expressed or implied in any such statements . For a discussion of some of the risks and other factors that may cause such forward - looking statements to differ materially from actual results, please refer to United Community Banks, Inc . ’s filings with the Securities and Exchange Commission including its 2012 Annual Report on Form 10 - K under the sections entitled “Forward - Looking Statements” . Forward - looking statements speak only as of the date they are made, and we undertake no obligation to update or revise forward - looking statements . 2 Non - GAAP Measures This presentation also contains financial measures determined by methods other than in accordance with generally accepted accounting principles (“GAAP”) . Such non - GAAP financial measures include the following : core fee revenue, core operating expense, core earnings, tangible common equity to tangible assets, tangible equity to tangible assets and tangible common equity to risk - weighted assets . The most comparable GAAP measures to these measures are : fee revenue, operating expense, net income (loss), and equity to assets . Management uses these non - GAAP financial measures because we believe it is useful for evaluating our operations and performance over periods of time, as well as in managing and evaluating our business and in discussions about our operations and performance . Management believes these non - GAAP financial measures provide users of our financial information with a meaningful measure for assessing our financial results and credit trends, as well as for comparison to financial results for prior periods . These non - GAAP financial measures should not be considered as a substitute for financial measures determined in accordance with GAAP and may not be comparable to other similarly titled financial measures used by other companies . For a reconciliation of the differences between our non - GAAP financial measures and the most comparable GAAP measures, please refer to the ‘Non - GAAP Reconcilement Tables’ at the end of the Appendix to this presentation .
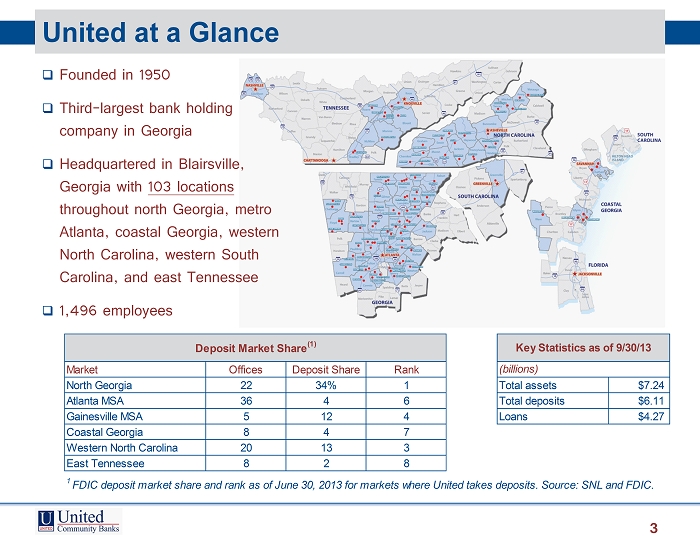
United at a Glance □ Founded in 1950 □ Third - largest bank holding company in Georgia □ Headquartered in Blairsville, Georgia with 103 locations throughout north Georgia, metro Atlanta, coastal Georgia, western North Carolina, western South Carolina, and east Tennessee □ 1,496 employees Market Offices Deposit Share Rank North Georgia 22 34% 1 Total assets $7.24 Atlanta MSA 36 4 6 Total deposits $6.11 Gainesville MSA 5 12 4 Loans $4.27 Coastal Georgia 8 4 7 Western North Carolina 20 13 3 East Tennessee 8 2 8 Deposit Market Share (1) Key Statistics as of 9/30/13 (billions) 1 FDIC deposit market share and rank as of June 30, 2013 for markets where United takes deposits. Source: SNL and FDIC. 3
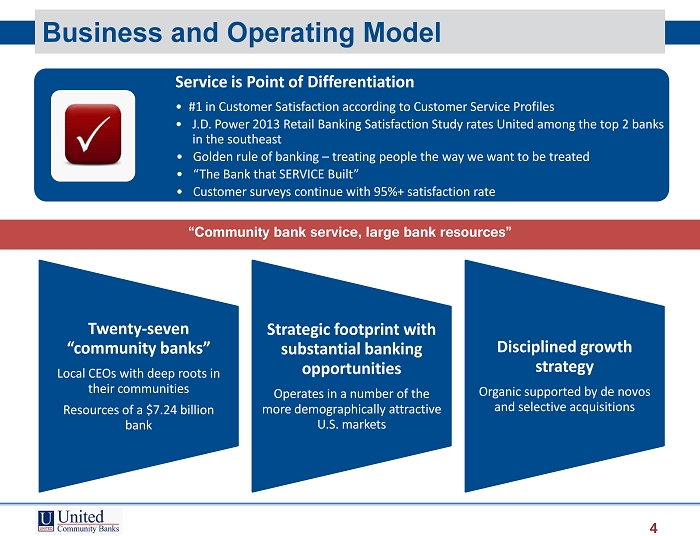
Business and Operating Model 4 Service is Point of Differentiation • #1 in Customer Satisfaction according to Customer Service Profiles • J.D. Power 2013 Retail Banking Satisfaction Study rates United among the top 2 banks in the southeast • Golden rule of banking – treating people the way we want to be treated • “The Bank that SERVICE Built” • Customer surveys continue with 95 %+ satisfaction rate “Community bank service, large bank resources” Twenty - seven “community banks” Local CEOs with deep roots in their communities Resources of a $7.24 billion bank Strategic footprint with substantial banking opportunities Operates in a number of the more demographically attractive U.S. markets Disciplined growth strategy Organic supported by de novos and selective acquisitions
KEY EVENTS & BACKGROUND United Community Banks, Inc. 5
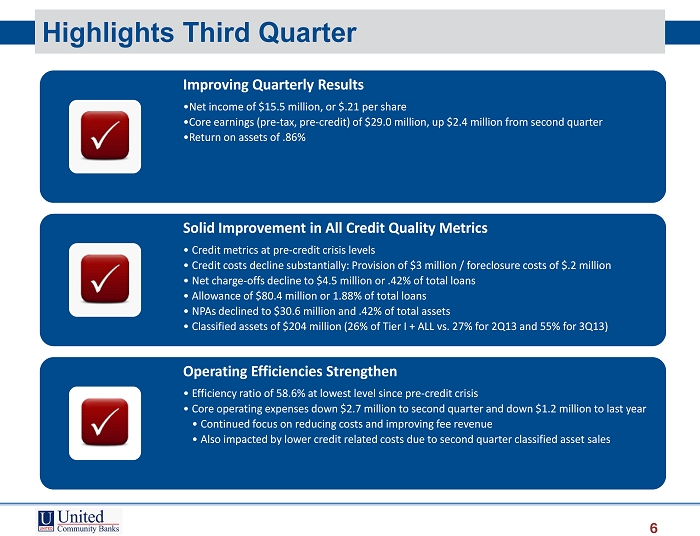
Highlights Third Quarter 6 Improving Quarterly Results • Net income of $15.5 million, or $.21 per share • Core earnings (pre - tax, pre - credit) of $29.0 million, up $2.4 million from second quarter • Return on assets of .86% Solid Improvement in All Credit Quality Metrics • Credit metrics at pre - credit crisis levels • Credit costs decline substantially: Provision of $3 million / foreclosure costs of $.2 million • Net charge - offs decline to $4.5 million or .42% of total loans • Allowance of $80.4 million or 1.88% of total loans • NPAs declined to $30.6 million and .42% of total assets • Classified assets of $204 million (26% of Tier I + ALL vs. 27% for 2Q13 and 55% for 3Q13) Operating Efficiencies Strengthen • Efficiency ratio of 58.6% at lowest level since pre - credit crisis • Core operating expenses down $2.7 million to second quarter and down $1.2 million to last year • Continued focus on reducing costs and improving fee revenue • Also impacted by lower credit related costs due to second quarter classified asset sales
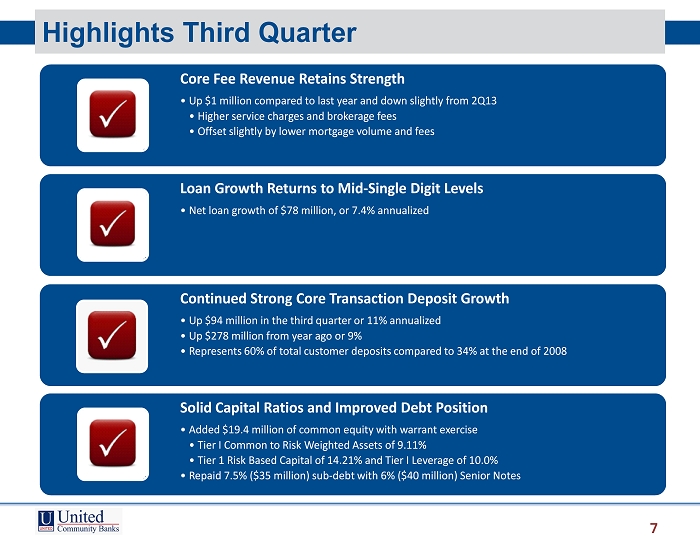
Highlights Third Quarter 7 Core Fee Revenue Retains Strength • Up $1 million compared to last year and down slightly from 2Q13 • Higher service charges and brokerage fees • Offset slightly by lower mortgage volume and fees Loan Growth Returns to Mid - Single Digit Levels • Net loan growth of $78 million, or 7.4% annualized Continued Strong Core Transaction Deposit Growth • Up $94 million in the third quarter or 11% annualized • Up $278 million from year ago or 9% • Represents 60% of total customer deposits compared to 34% at the end of 2008 Solid Capital Ratios and Improved Debt Position • Added $19.4 million of common equity with warrant exercise • Tier I Common to Risk Weighted Assets of 9.11% • Tier 1 Risk Based Capital of 14.21% and Tier I Leverage of 10.0% • Repaid 7.5% ($35 million) sub - debt with 6% ($40 million) Senior Notes
GOALS United Community Banks, Inc. 8
Goals 9 Our Goal: Leverage Our Strengths • Strong local leadership • Funding advantage in our legacy markets • Consistent and attractive culture • Class leading customer satisfaction • Low employee turnover To Grow Our Business The Right Way • Become better retail and small business bank • Grow sales: Better product design, merchandising, campaign execution • Streamline delivery process that focuses on how we serve our customer in the end • HELOC program success: $32 million growth in 3Q to $187 million • Smarter Mortgage added $45 million growth in 3Q to $149 million • Continue to invest in, and improve commercial and retail capabilities • Diversify portfolio – focus on C&I, owner occupied, and consumer lending • Momentum building across footprint • Invest in people: 25 strategic hires past year in the front and back office initiatives and position for long term growth • Enter new markets: LPO in Greenville, SC (4Q12); Nashville, TN (2Q13) with healthcare industry focus; expand territory and commercial loan potential • Positive net loan growth going forward • Customer derivative swap program – meeting customer needs while adding revenue
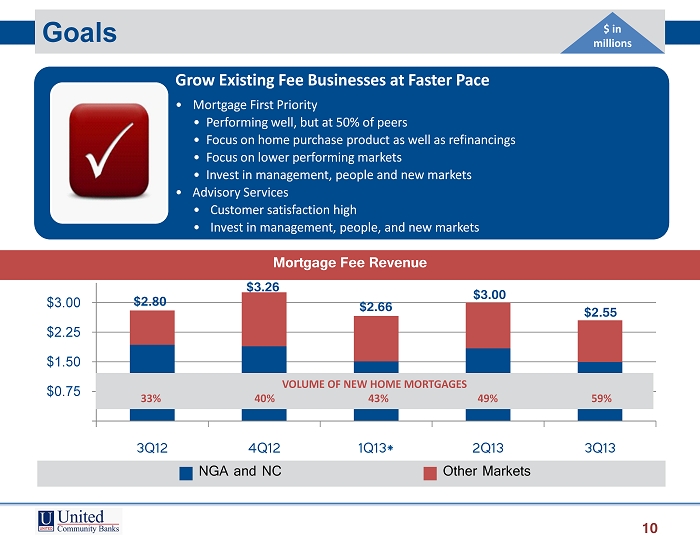
Goals 10 Grow Existing Fee Businesses at Faster Pace • Mortgage First Priority • Performing well, but at 50% of peers • Focus on home purchase product as well as refinancings • Focus on lower performing markets • Invest in management, people and new markets • Advisory Services • Customer satisfaction high • Invest in management, people, and new markets $2.80 $3.26 $2.66 $3.00 $2.55 $0.75 $1.50 $2.25 $3.00 3Q12 4Q12 1Q13* 2Q13 3Q13 NGA and NC Other Markets Mortgage Fee Revenue $ in millions VOLUME OF NEW HOME MORTGAGES 33% 40% 43% 49% 59%
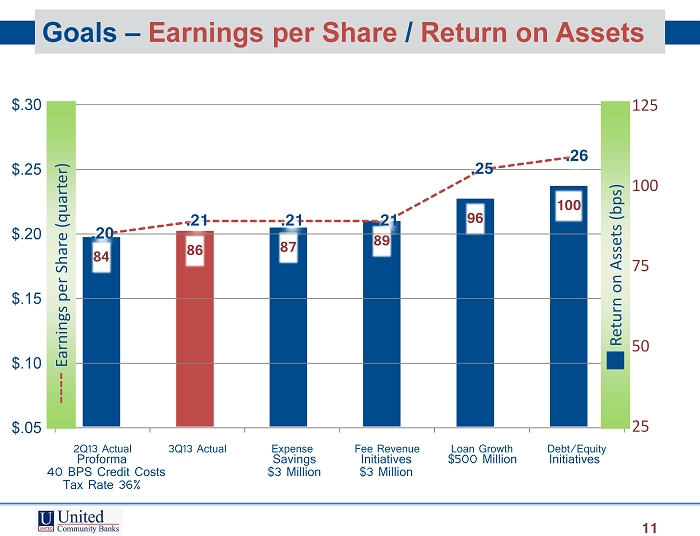
84 86 87 89 96 100 25 50 75 100 125 .20 .21 .21 .21 .25 .26 $.05 $.10 $.15 $.20 $.25 $.30 2Q13 Actual 3Q13 Actual Expense Fee Revenue Loan Growth Debt/Equity Goals – Earnings per Share / Return on Assets 11 Earnings per Share (quarter) Return on Assets (bps) Proforma Savings Initiatives $500 Million Initiatives 40 BPS Credit Costs $3 Million $3 Million Tax Rate 36%
FINANCIAL REVIEW United Community Banks, Inc. 12
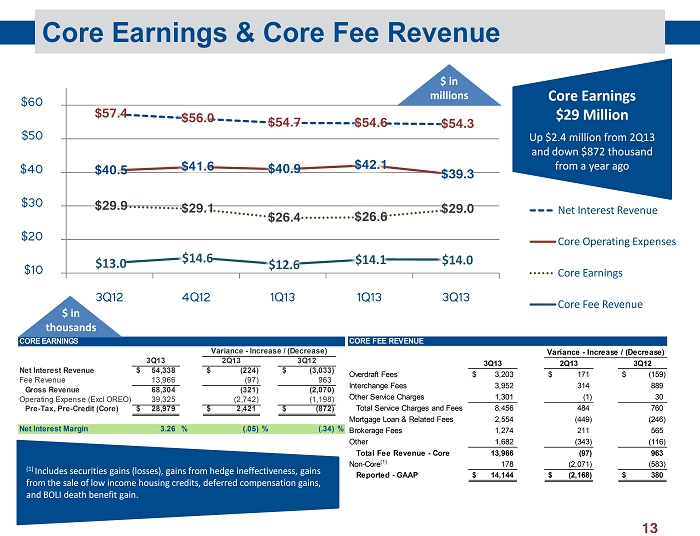
Core Earnings & Core Fee Revenue 13 CORE EARNINGS 3Q13 2Q13 3Q12 Net Interest Revenue 54,338$ (224)$ (3,033)$ Fee Revenue 13,966 (97) 963 Gross Revenue 68,304 (321) (2,070) Operating Expense (Excl OREO) 39,325 (2,742) (1,198) Pre-Tax, Pre-Credit (Core) 28,979$ 2,421$ (872)$ Net Interest Margin 3.26 % (.05)% (.34)% Variance - Increase / (Decrease) CORE FEE REVENUE 3Q13 2Q13 3Q12 Overdraft Fees 3,203$ 171$ (159)$ Interchange Fees 3,952 314 889 Other Service Charges 1,301 (1) 30 Total Service Charges and Fees 8,456 484 760 Mortgage Loan & Related Fees 2,554 (449) (246) Brokerage Fees 1,274 211 565 Other 1,682 (343) (116) Total Fee Revenue - Core 13,966 (97) 963 Non-Core (1) 178 (2,071) (583) Reported - GAAP 14,144$ (2,168)$ 380$ Variance - Increase / (Decrease) $ in thousands (1) Includes securities gains (losses), gains from hedge ineffectiveness, gains from the sale of low income housing credits, deferred compensation gains, and BOLI death benefit gain. $57.4 $56.0 $54.7 $54.6 $54.3 $40.5 $41.6 $40.9 $42.1 $39.3 $29.9 $29.1 $26.4 $26.6 $29.0 $13.0 $14.6 $12.6 $14.1 $14.0 $10 $20 $30 $40 $50 $60 3Q12 4Q12 1Q13 1Q13 3Q13 Net Interest Revenue Core Operating Expenses Core Earnings Core Fee Revenue $ in millions Core Earnings $29 Million Up $2.4 million from 2Q13 and down $872 thousand from a year ago
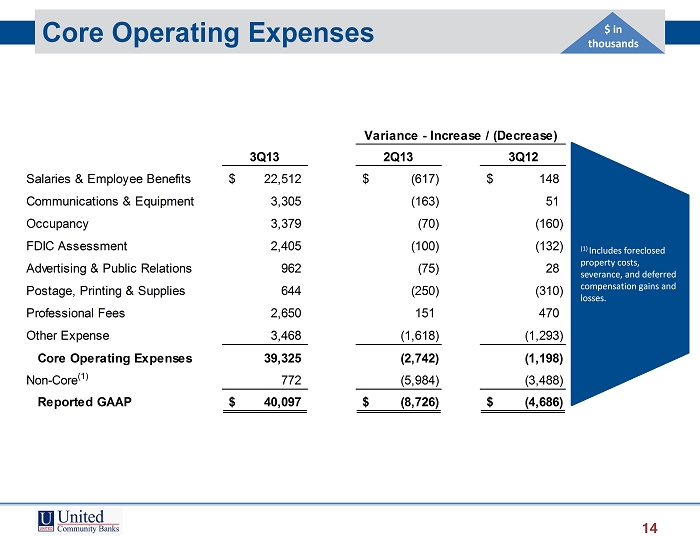
Core Operating Expenses 14 3Q13 2Q13 3Q12 Salaries & Employee Benefits 22,512$ (617)$ 148$ Communications & Equipment 3,305 (163) 51 Occupancy 3,379 (70) (160) FDIC Assessment 2,405 (100) (132) Advertising & Public Relations 962 (75) 28 Postage, Printing & Supplies 644 (250) (310) Professional Fees 2,650 151 470 Other Expense 3,468 (1,618) (1,293) Core Operating Expenses 39,325 (2,742) (1,198) Non-Core (1) 772 (5,984) (3,488) Reported GAAP 40,097$ (8,726)$ (4,686)$ Variance - Increase / (Decrease) $ in thousands (1) Includes foreclosed property costs, severance, and deferred compensation gains and losses.
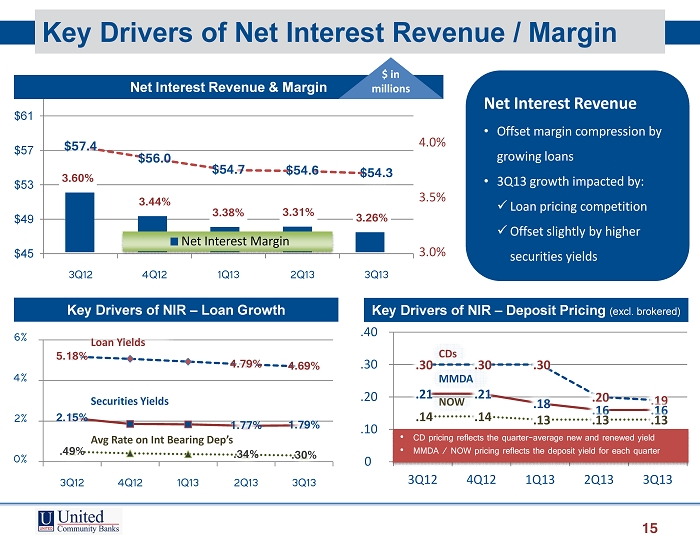
$57.4 $56.0 $54.7 $54.6 $54.3 $45 $49 $53 $57 $61 3Q12 4Q12 1Q13 2Q13 3Q13 3.60% 3.44% 3.38% 3.31% 3.26% 3.0% 3.5% 4.0% Net Interest Margin Key Drivers of Net Interest Revenue / Margin 15 5.18% 4.79% 4.69% 2.15% 1.77% 1.79% .49% .34% .30% 0% 2% 4% 6% 3Q12 4Q12 1Q13 2Q13 3Q13 Loan Yields Securities Yields Avg Rate on Int Bearing Dep’s Net Interest Revenue & Margin $ in millions Key Drivers of NIR – Loan Growth Net Interest Revenue • Offset margin compression by growing loans • 3Q13 growth impacted by : x Loan pricing competition x Offset slightly by higher securities yields .30 .30 .30 .20 .19 .21 .21 .18 .16 .16 .14 .14 .13 .13 .13 0 .10 .20 .30 .40 3Q12 4Q12 1Q13 2Q13 3Q13 CDs MMDA NOW Key Drivers of NIR – Deposit Pricing (excl. brokered) • CD pricing reflects the quarter - average new and renewed yield • MMDA / NOW pricing reflects the deposit yield for each quarter
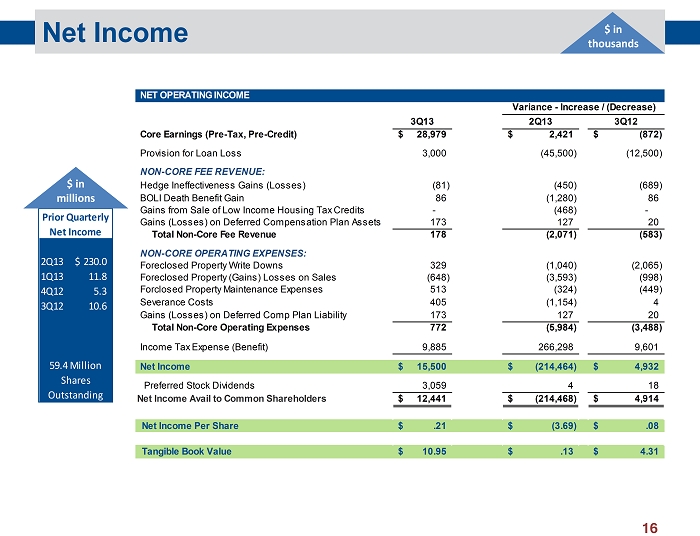
Net Income 16 $ in thousands NET OPERATING INCOME 3Q13 2Q13 3Q12 Core Earnings (Pre-Tax, Pre-Credit) 28,979$ 2,421$ (872)$ Provision for Loan Loss 3,000 (45,500) (12,500) NON-CORE FEE REVENUE: Hedge Ineffectiveness Gains (Losses) (81) (450) (689) BOLI Death Benefit Gain 86 (1,280) 86 Gains from Sale of Low Income Housing Tax Credits - (468) - Gains (Losses) on Deferred Compensation Plan Assets 173 127 20 Total Non-Core Fee Revenue 178 (2,071) (583) NON-CORE OPERATING EXPENSES: Foreclosed Property Write Downs 329 (1,040) (2,065) Foreclosed Property (Gains) Losses on Sales (648) (3,593) (998) Forclosed Property Maintenance Expenses 513 (324) (449) Severance Costs 405 (1,154) 4 Gains (Losses) on Deferred Comp Plan Liability 173 127 20 Total Non-Core Operating Expenses 772 (5,984) (3,488) Income Tax Expense (Benefit) 9,885 266,298 9,601 Net Income 15,500$ (214,464)$ 4,932$ Preferred Stock Dividends 3,059 4 18 Net Income Avail to Common Shareholders 12,441$ (214,468)$ 4,914$ Net Income Per Share .21$ (3.69)$ .08$ Tangible Book Value 10.95$ .13$ 4.31$ Variance - Increase / (Decrease) 2Q13 230.0$ 1Q13 11.8 4Q12 5.3 3Q12 10.6 Prior Quarterly Net Income 59.4 Million Shares Outstanding $ in millions
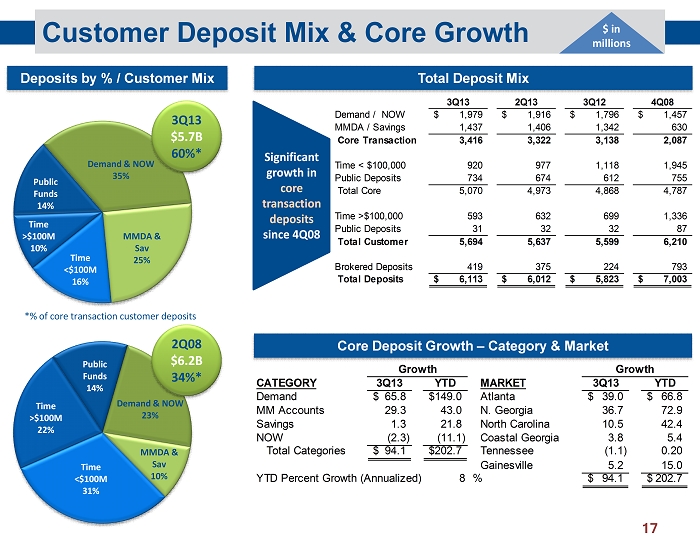
Customer Deposit Mix & Core Growth 17 Time >$100M 10% Demand & NOW 35% Deposits by % / Customer Mix Public Funds 14% Time <$100M 16% MMDA & Sav 25% Time >$100M 22% Demand & NOW 23% Public Funds 14% Time <$100M 31% MMDA & Sav 10% $ in millions 3Q13 $5.7B 60%* 2Q08 $6.2B 34%* 3Q13 2Q13 3Q12 4Q08 Demand / NOW 1,979$ 1,916$ 1,796$ 1,457$ MMDA / Savings 1,437 1,406 1,342 630 Core Transaction 3,416 3,322 3,138 2,087 Time < $100,000 920 977 1,118 1,945 Public Deposits 734 674 612 755 Total Core 5,070 4,973 4,868 4,787 Time >$100,000 593 632 699 1,336 Public Deposits 31 32 32 87 Total Customer 5,694 5,637 5,599 6,210 Brokered Deposits 419 375 224 793 Total Deposits 6,113$ 6,012$ 5,823$ 7,003$ Total Deposit Mix Significant growth in core transaction deposits since 4Q08 Core Deposit Growth – Category & Market CATEGORY 3Q13 YTD MARKET 3Q13 YTD Demand 65.8$ 149.0$ Atlanta 39.0$ 66.8$ MM Accounts 29.3 43.0 N. Georgia 36.7 72.9 Savings 1.3 21.8 North Carolina 10.5 42.4 NOW (2.3) (11.1) Coastal Georgia 3.8 5.4 Total Categories 94.1$ 202.7$ Tennessee (1.1) 0.20 Gainesville 5.2 15.0 YTD Percent Growth (Annualized) 8 % 94.1$ 202.7$ Growth Growth *% of core transaction customer deposits
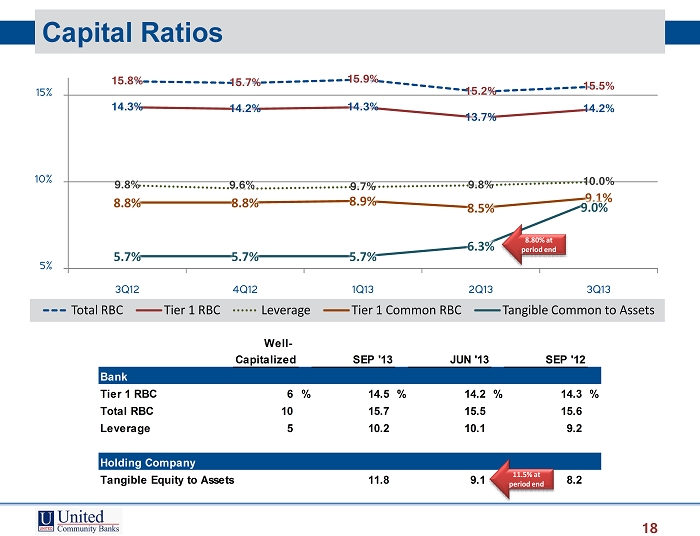
Capital Ratios 18 Well- Capitalized SEP '13 JUN '13 SEP '12 Bank Tier 1 RBC 6 % 14.5 % 14.2 % 14.3 % Total RBC 10 15.7 15.5 15.6 Leverage 5 10.2 10.1 9.2 Holding Company Tangible Equity to Assets 11.8 9.1 8.2 15.8% 15.7% 15.9% 15.2% 15.5% 14.3% 14.2% 14.3% 13.7% 14.2% 9.8% 9.6% 9.7% 9.8% 10.0% 8.8% 8.8% 8.9% 8.5% 9.1% 5.7% 5.7% 5.7% 6.3% 9.0% 5% 10% 15% 3Q12 4Q12 1Q13 2Q13 3Q13 Total RBC Tier 1 RBC Leverage Tier 1 Common RBC Tangible Common to Assets 8.80% at period end 11.5% at period end
LOAN PORTFOLIO & CREDIT QUALITY United Community Banks, Inc. 19
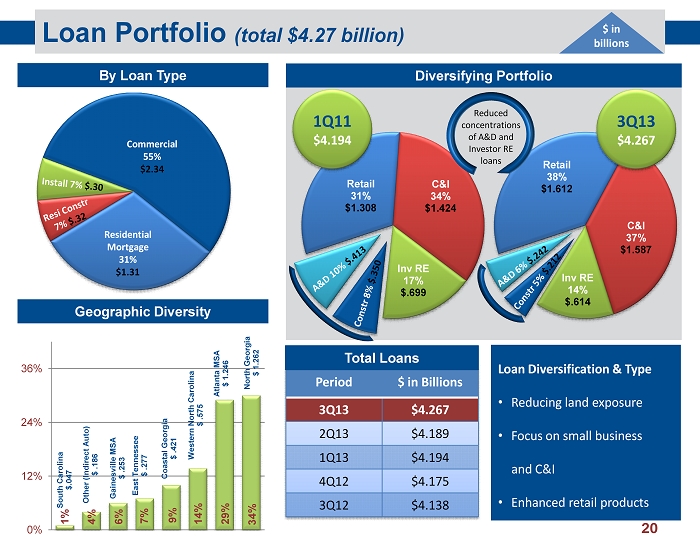
Retail 31% $1.308 C&I 34% $1.424 Inv RE 17% $.699 Diversifying Portfolio Retail 38% $1.612 C&I 37% $1.587 Inv RE 14% $.614 Loan Portfolio (total $4.27 billion) 20 20 Commercial 55% $2.34 Geographic Diversity Residential Mortgage 31% $1.31 Period $ in Billions 3Q13 $4.267 2Q13 $4.189 1Q13 $4.194 4Q12 $4.175 3Q12 $4.138 By Loan Type 1Q11 $4.194 3Q13 $4.267 $ in billions Reduced concentrations of A&D and Investor RE loans Other (Indirect Auto) $ .186 Gainesville MSA $ .253 East Tennessee $ .277 Coastal Georgia $ .421 Western North Carolina $ .575 Atlanta MSA $ 1.246 South Carolina $.047 North Georgia $ 1.262 0% 12% 24% 36% 6% 7% 9% 14% 29% 34% Loan Diversification & Type • Reducing land exposure • Focus on small business and C&I • Enhanced retail products Total Loans 1% 4%
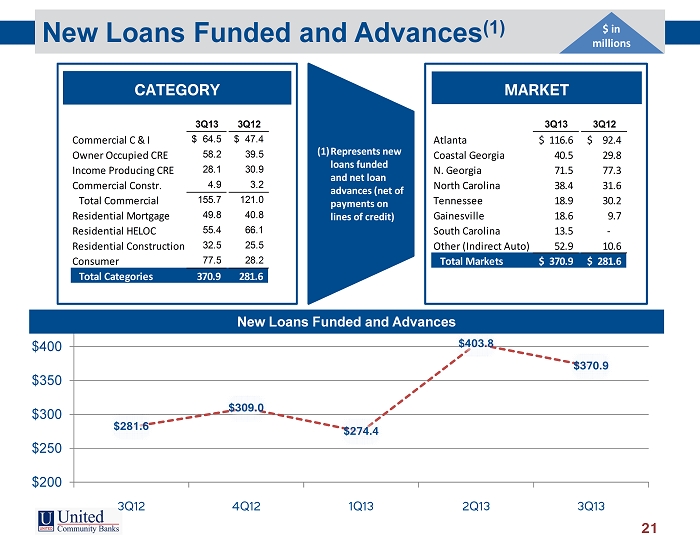
$281.6 $309.0 $274.4 $403.8 $370.9 $200 $250 $300 $350 $400 3Q12 4Q12 1Q13 2Q13 3Q13 New Loans Funded and Advances (1) 21 $ in m illions CATEGORY 3Q13 3Q12 3Q13 3Q12 Commercial C & I 64.5$ 47.4$ Atlanta 116.6$ 92.4$ Owner Occupied CRE 58.2 39.5 Coastal Georgia 40.5 29.8 Income Producing CRE 28.1 30.9 N. Georgia 71.5 77.3 Commercial Constr. 4.9 3.2 North Carolina 38.4 31.6 Total Commercial 155.7 121.0 Tennessee 18.9 30.2 Residential Mortgage 49.8 40.8 Gainesville 18.6 9.7 Residential HELOC 55.4 66.1 South Carolina 13.5 - Residential Construction 32.5 25.5 Other (Indirect Auto) 52.9 10.6 Consumer 77.5 28.2 Total Markets 370.9$ 281.6$ Total Categories 370.9 281.6 New Loans Funded and Advances MARKET (1) Represents new loans funded and net loan advances (net of payments on lines of credit)
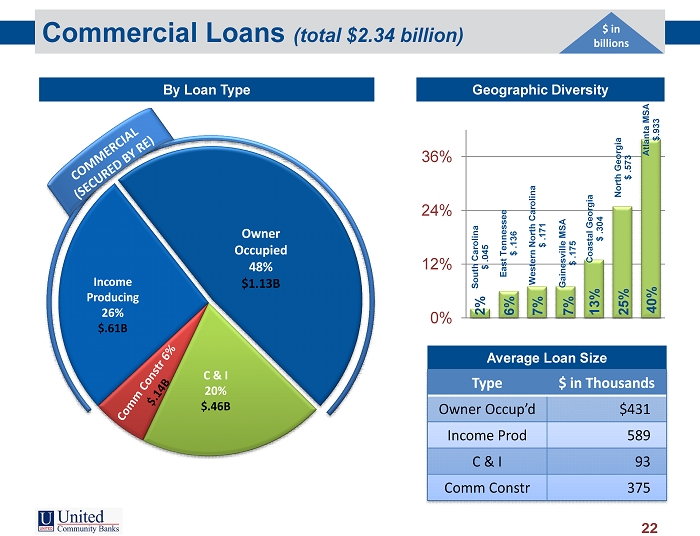
Commercial Loans (total $2.34 billion) 22 Owner Occupied 48% $1.13B Geographic Diversity Income Producing 26% $.61B C & I 20% $.46B $ in billions East Tennessee $ .136 Gainesville MSA $ .175 Western North Carolina $ .171 Coastal Georgia $ .304 North Georgia $ .573 South Carolina $ .045 Atlanta MSA $.933 0% 12% 24% 36% 6% 7% 7% 13% 25% 40% Average Loan Size Type $ in Thousands Owner Occup’d $431 Income Prod 589 C & I 93 Comm Constr 375 By Loan Type 2%
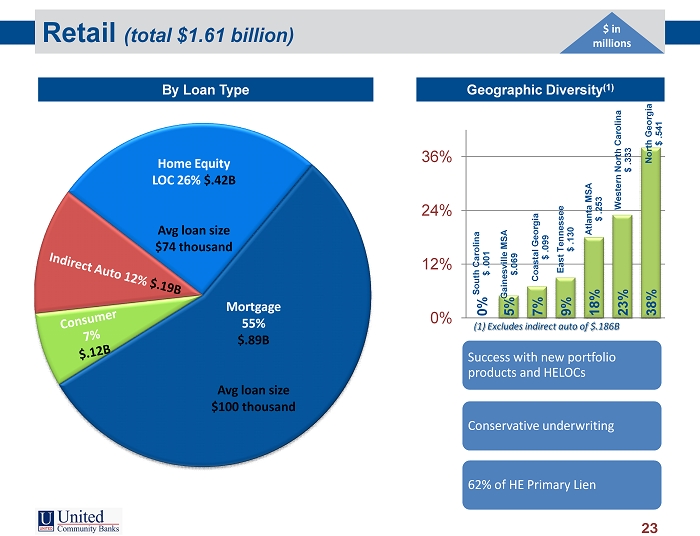
Retail (total $1.61 billion) 23 Geographic Diversity (1) Home Equity LOC 26% $.42B Avg loan size $74 thousand $ in millions South Carolina $ .001 Coastal Georgia $ .099 East Tennessee $ .130 Atlanta MSA $ .253 Western North Carolina $ .333 North Georgia $ .541 Gainesville MSA $.069 0% 12% 24% 36% 0% 7% 9% 18% 23% 38% By Loan Type Success with new portfolio products and HELOCs Conservative underwriting 62% of HE Primary Lien Mortgage 55% $.89B Avg loan size $100 thousand (1) Excludes indirect auto of $.186B 5%
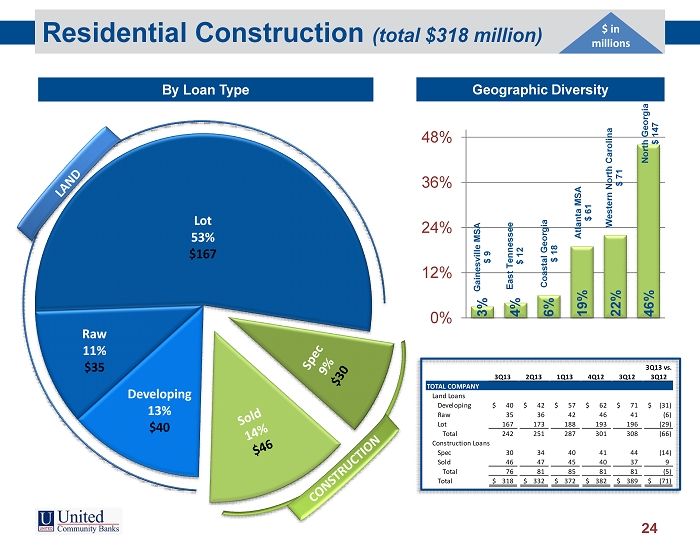
Residential Construction (total $318 million) 24 Geographic Diversity Raw 11% $35 Lot 53% $167 $ in millions East Tennessee $ 12 Gainesville MSA $ 9 Coastal Georgia $ 18 Atlanta MSA $ 61 Western North Carolina $ 71 North Georgia $ 147 0% 12% 24% 36% 48% 3% 4% 6% 19% 22% 46% By Loan Type Developing 13% $40 3Q13 2Q13 1Q13 4Q12 3Q12 3Q13 vs. 3Q12 TOTAL COMPANY Land Loans Developing 40$ 42$ 57$ 62$ 71$ (31)$ Raw 35 36 42 46 41 (6) Lot 167 173 188 193 196 (29) Total 242 251 287 301 308 (66) Construction Loans Spec 30 34 40 41 44 (14) Sold 46 47 45 40 37 9 Total 76 81 85 81 81 (5) Total 318$ 332$ 372$ 382$ 389$ (71)$
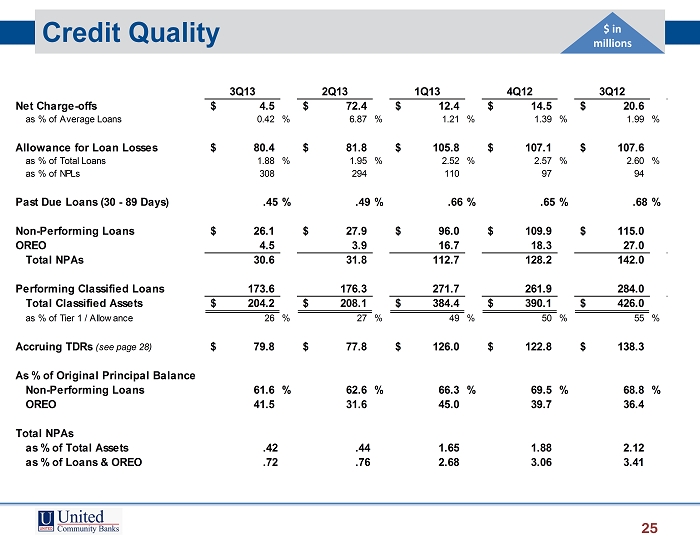
Credit Quality 25 $ in millions 3Q13 2Q13 1Q13 4Q12 3Q12 Net Charge-offs 4.5$ 72.4$ 12.4$ 14.5$ 20.6$ as % of Average Loans 0.42 % 6.87 % 1.21 % 1.39 % 1.99 % Allowance for Loan Losses 80.4$ 81.8$ 105.8$ 107.1$ 107.6$ as % of Total Loans 1.88 % 1.95 % 2.52 % 2.57 % 2.60 % as % of NPLs 308 294 110 97 94 Past Due Loans (30 - 89 Days) .45% .49% .66% .65% .68% Non-Performing Loans 26.1$ 27.9$ 96.0$ 109.9$ 115.0$ OREO 4.5 3.9 16.7 18.3 27.0 Total NPAs 30.6 31.8 112.7 128.2 142.0 Performing Classified Loans 173.6 176.3 271.7 261.9 284.0 Total Classified Assets 204.2$ 208.1$ 384.4$ 390.1$ 426.0$ as % of Tier 1 / Allowance 26 % 27 % 49 % 50 % 55 % Accruing TDRs (see page 28) 79.8$ 77.8$ 126.0$ 122.8$ 138.3$ As % of Original Principal Balance Non-Performing Loans 61.6 % 62.6 % 66.3 % 69.5 % 68.8 % OREO 41.5 31.6 45.0 39.7 36.4 Total NPAs as % of Total Assets .42 .44 1.65 1.88 2.12 as % of Loans & OREO .72 .76 2.68 3.06 3.41
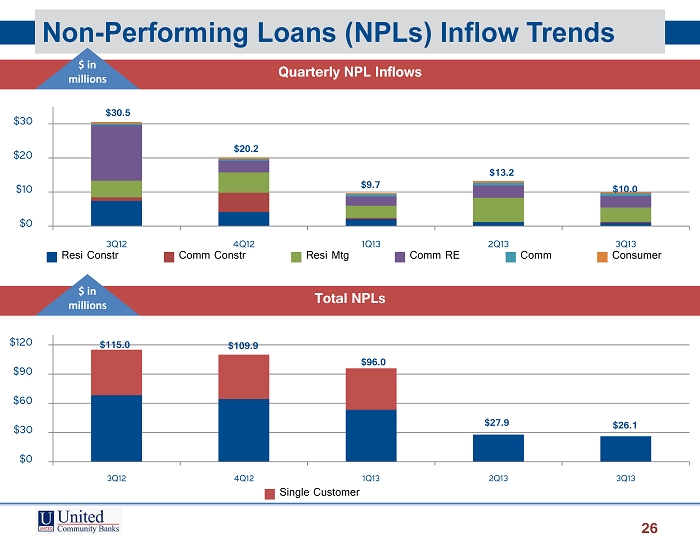
Non - Performing Loans (NPLs) Inflow Trends $30.5 $20.2 $9.7 $13.2 $10.0 $0 $10 $20 $30 3Q12 4Q12 1Q13 2Q13 3Q13 Resi Constr Comm Constr Resi Mtg Comm RE Comm Consumer 26 Quarterly NPL Inflows $ in millions Total NPLs $115.0 $109.9 $96.0 $27.9 $26.1 $0 $30 $60 $90 $120 3Q12 4Q12 1Q13 2Q13 3Q13 Single Customer $ in millions

Performing Classified Loans 27 $ in millions BY CATEGORY 3Q12 4Q12 1Q13 2Q13 3Q13 Commercial: Commercial & Industrial 19$ 18$ 20$ 11$ 10$ Owner Occupied 77 65 71 43 40 Total C & I 96 83 91 54 50 Income Producing CRE 49 53 57 36 36 Commercial Constr 27 19 18 16 17 Total Commercial 172 155 166 106 103 Residential Mortgage 73 65 64 51 53 Residential Construction 35 38 38 17 16 Consumer / Installment 3 4 3 2 2 Total Performing Classified 283$ 262$ 271$ 176$ 174$ Classified to Tier 1 + ALL 55% 50% 49% 27% 26% $282.5 $261.9 $271.7 $176.3 $173.6 $170 $220 $270 $320 3Q12 4Q12 1Q13 2Q13 3Q13
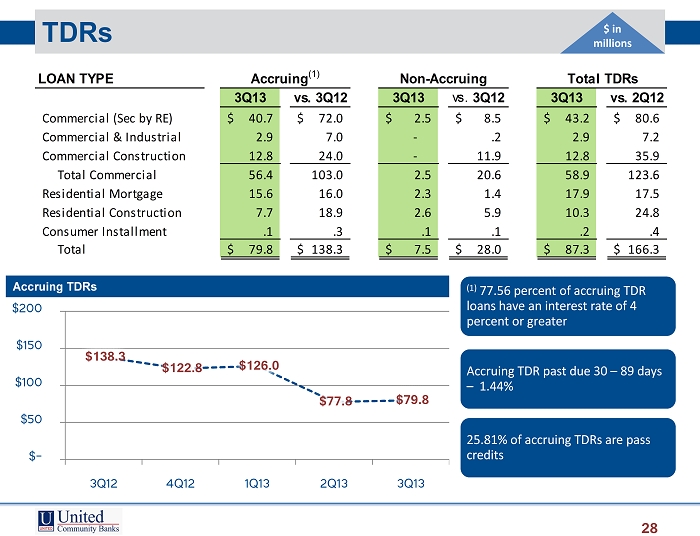
$138.3 $122.8 $126.0 $77.8 $79.8 $ - $50 $100 $150 $200 3Q12 4Q12 1Q13 2Q13 3Q13 TDRs 28 LOAN TYPE 3Q13 vs. 3Q12 3Q13 vs. 3Q12 3Q13 vs. 2Q12 Commercial (Sec by RE) 40.7$ 72.0$ 2.5$ 8.5$ 43.2$ 80.6$ Commercial & Industrial 2.9 7.0 - .2 2.9 7.2 Commercial Construction 12.8 24.0 - 11.9 12.8 35.9 Total Commercial 56.4 103.0 2.5 20.6 58.9 123.6 Residential Mortgage 15.6 16.0 2.3 1.4 17.9 17.5 Residential Construction 7.7 18.9 2.6 5.9 10.3 24.8 Consumer Installment .1 .3 .1 .1 .2 .4 Total 79.8$ 138.3$ 7.5$ 28.0$ 87.3$ 166.3$ Accruing (1) Non-Accruing Total TDRs $ in millions Accruing TDRs (1) 77.56 percent of accruing TDR loans have an interest rate of 4 percent or greater Accruing TDR past due 30 – 89 days – 1.44% 25.81% of accruing TDRs are pass credits
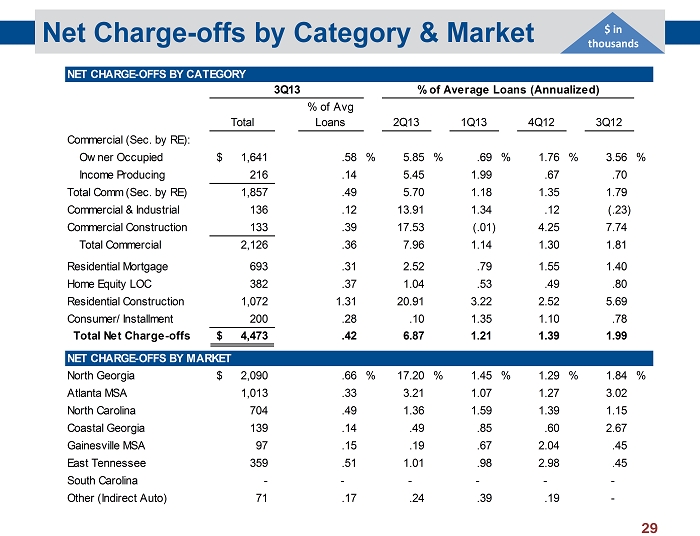
Net Charge - offs by Category & Market 29 $ in thousands NET CHARGE-OFFS BY CATEGORY Total % of Avg Loans 2Q13 1Q13 4Q12 3Q12 Commercial (Sec. by RE): Owner Occupied 1,641$ .58 % 5.85 % .69 % 1.76 % 3.56 % Income Producing 216 .14 5.45 1.99 .67 .70 Total Comm (Sec. by RE) 1,857 .49 5.70 1.18 1.35 1.79 Commercial & Industrial 136 .12 13.91 1.34 .12 (.23) Commercial Construction 133 .39 17.53 (.01) 4.25 7.74 Total Commercial 2,126 .36 7.96 1.14 1.30 1.81 2.52 Residential Mortgage 693 .31 2.52 .79 1.55 1.40 Home Equity LOC 382 .37 1.04 .53 .49 .80 Residential Construction 1,072 1.31 20.91 3.22 2.52 5.69 Consumer/ Installment 200 .28 .10 1.35 1.10 .78 Total Net Charge-offs 4,473$ .42 6.87 1.21 1.39 1.99 NET CHARGE-OFFS BY MARKET North Georgia 2,090$ .66 % 17.20 % 1.45 % 1.29 % 1.84 % Atlanta MSA 1,013 .33 3.21 1.07 1.27 3.02 North Carolina 704 .49 1.36 1.59 1.39 1.15 Coastal Georgia 139 .14 .49 .85 .60 2.67 Gainesville MSA 97 .15 .19 .67 2.04 .45 East Tennessee 359 .51 1.01 .98 2.98 .45 South Carolina - - - - - - Other (Indirect Auto) 71 .17 .24 .39 .19 - 3Q13 % of Average Loans (Annualized)

$142.0 $128.2 $112.7 $31.8 $30.6 $0 $50 $100 $150 3Q12 4Q12* 1Q13 2Q13 3Q13 Non - Performing Loans Foreclosed Properties (OREO) NPAs by Loan Category & Market 30 NPLs OREO Total NPAs NPLs OREO Total NPAs LOAN CATEGORY LOAN CATEGORY Commercial (sec. by RE): Commercial (sec. by RE): Owner Occupied 6,358$ 591$ 6,949$ Owner Occupied 14,140$ 7,170$ 21,310$ Income Producing 1,657 139 1,796 Income Producing 11,756 1,597 13,353 Commercial & Industrial 609 - 609 Commercial & Industrial 32,678 - 32,678 Commercial Construction 343 376 719 Commercial Construction 18,590 3,121 21,711 Total Commercial 8,967 1,106 10,073 Total Commercial 77,164 11,888 89,052 Residential Mortgage 11,335 1,679 13,014 Residential Mortgage 13,996 6,031 20,027 HELOC 1,169 475 1,644 Residential Construction 4,097 1,207 5,304 Residential Construction 22,935 9,039 31,974 Consumer/ Installment 520 - 520 Consumer/ Installment 906 - 906 Total 26,088$ 4,467$ 30,555$ Total 115,001$ 26,958$ 141,959$ MARKET MARKET Gainesville 1,036$ -$ 1,036$ Gainesville 840$ 1,328$ 2,168$ Coastal Georgia 995 928 1,923 Coastal Georgia 6,822 864 7,686 East Tennessee 1,629 25 1,654 East Tennessee 4,157 1,487 5,644 North Carolina 5,680 762 6,442 North Carolina 9,622 2,771 12,393 Atlanta MSA 3,096 1,026 4,122 Atlanta MSA 21,349 5,926 27,275 North Georgia 13,652 1,726 15,378 North Georgia 72,211 14,582 86,793 3Q13 3Q12 *NPAs to total assets – .42% / Allowance to loans at 1.88% Non Performing Assets $ in thousands $ in millions
APPENDIX United Community Banks, Inc. 31
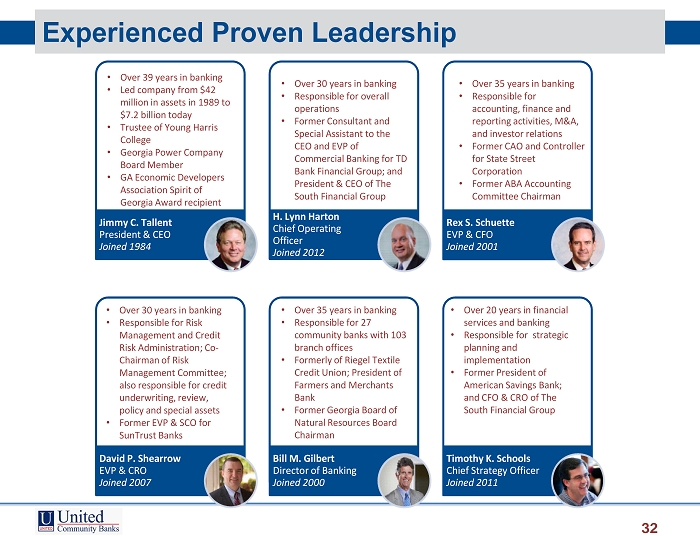
Experienced Proven Leadership 32 Jimmy C. Tallent President & CEO Joined 1984 H. Lynn Harton Chief Operating Officer Joined 2012 Rex S. Schuette EVP & CFO Joined 2001 David P. Shearrow EVP & CRO Joined 2007 Bill M. Gilbert Director of Banking Joined 2000 Timothy K. Schools Chief Strategy Officer Joined 2011 • Over 39 years in banking • Led company from $42 million in assets in 1989 to $7.2 billion today • Trustee of Young Harris College • Georgia Power Company Board Member • GA Economic Developers Association Spirit of Georgia Award recipient • Over 30 years in banking • Responsible for overall operations • Former Consultant and Special Assistant to the CEO and EVP of Commercial Banking for TD Bank Financial Group; and President & CEO of The South Financial Group • Over 35 years in banking • Responsible for accounting, finance and reporting activities, M&A, and investor relations • Former CAO and Controller for State Street Corporation • Former ABA Accounting Committee Chairman • Over 30 years in banking • Responsible for Risk Management and Credit Risk Administration; Co - Chairman of Risk Management Committee; also responsible for credit underwriting, review, policy and special assets • Former EVP & SCO for SunTrust Banks • Over 35 years in banking • Responsible for 27 community banks with 103 branch offices • Formerly of Riegel Textile Credit Union; President of Farmers and Merchants Bank • Former Georgia Board of Natural Resources Board Chairman • Over 20 years in financial services and banking • Responsible for strategic planning and implementation • Former President of American Savings Bank; and CFO & CRO of The South Financial Group
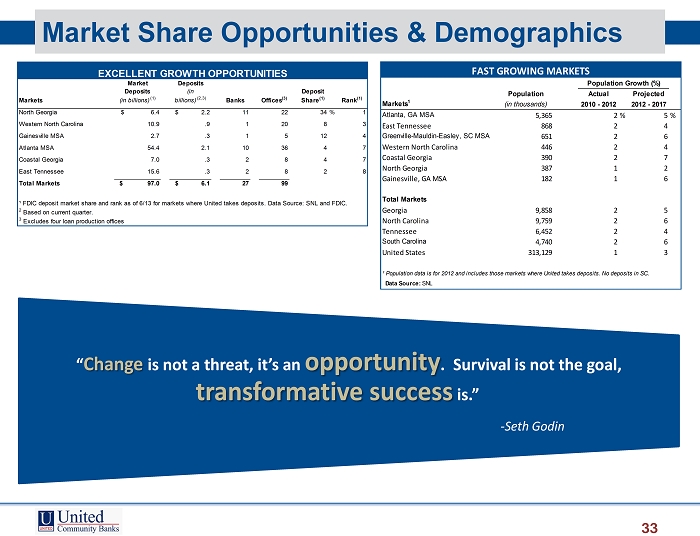
Market Share Opportunities & Demographics 33 Population Actual Projected Markets 1 (in thousands) 2010 - 2012 2012 - 2017 Atlanta, GA MSA 5,365 2% 5% East Tennessee 868 2 4 Greenville-Mauldin-Easley, SC MSA 651 2 6 Western North Carolina 446 2 4 Coastal Georgia 390 2 7 North Georgia 387 1 2 Gainesville, GA MSA 182 1 6 Total Markets Georgia 9,858 2 5 North Carolina 9,759 2 6 Tennessee 6,452 2 4 South Carolina 4,740 2 6 United States 313,129 1 3 ¹ Population data is for 2012 and includes those markets where United takes deposits. No deposits in SC. Data Source: SNL Population Growth (%) FAST GROWING MARKETS North Georgia $ 6.4 $ 2.2 11 22 34% 1 Western North Carolina 10.9 .9 1 20 8 3 Gainesville MSA 2.7 .3 1 5 12 4 Atlanta MSA 54.4 2.1 10 36 4 7 Coastal Georgia 7.0 .3 2 8 4 7 East Tennessee 15.6 .3 2 8 2 8 Total Markets $ 97.0 $ 6.1 27 99 ¹ FDIC deposit market share and rank as of 6/13 for markets where United takes deposits. Data Source: SNL and FDIC. 2 Based on current quarter. 3 Excludes four loan production offices EXCELLENT GROWTH OPPORTUNITIES Markets Banks Offices (3) Rank (1) Market Deposits (in billions) (1) United Deposits (in billions) (2,3) Deposit Share (1) “ Change is not a threat, it’s an opportunity . Survival is not the goal, transformative success is.” - Seth Godin
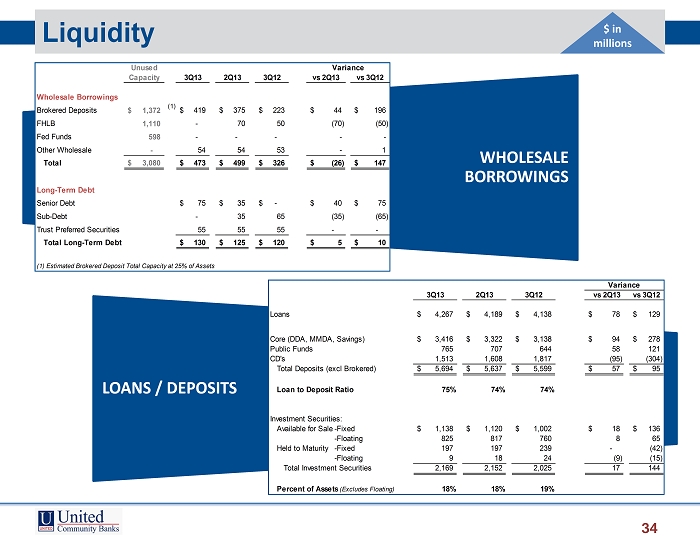
LOANS / DEPOSITS WHOLESALE BORROWINGS Liquidity 34 $ in millions 3Q13 2Q13 3Q12 vs 3Q12 Loans 4,267$ 4,189$ 4,138$ 78$ 129$ Core (DDA, MMDA, Savings) 3,416$ 3,322$ 3,138$ 94$ 278$ Public Funds 765 707 644 58 121 CD's 1,513 1,608 1,817 (95) (304) Total Deposits (excl Brokered) 5,694$ 5,637$ 5,599$ 57$ 95$ Loan to Deposit Ratio 75% 74% 74% Investment Securities: Available for Sale-Fixed 1,138$ 1,120$ 1,002$ 18$ 136$ -Floating 825 817 760 8 65 Held to Maturity -Fixed 197 197 239 - (42) -Floating 9 18 24 (9) (15) Total Investment Securities 2,169 2,152 2,025 17 144 Percent of Assets (Excludes Floating) 18% 18% 19% vs 2Q13 Variance Unused Capacity 3Q13 2Q13 3Q12 vs 2Q13 vs 3Q12 Wholesale Borrowings Brokered Deposits 1,372$ (1) 419$ 375$ 223$ 44$ 196$ FHLB 1,110 - 70 50 (70) (50) Fed Funds 598 - - - - - Other Wholesale - 54 54 53 - 1 Total 3,080$ 473$ 499$ 326$ (26)$ 147$ Long-Term Debt Senior Debt 75$ 35$ -$ 40$ 75$ Sub-Debt - 35 65 (35) (65) Trust Preferred Securities 55 55 55 - - Total Long-Term Debt 130$ 125$ 120$ 5$ 10$ (1) Estimated Brokered Deposit Total Capacity at 25% of Assets Variance

Business Mix – Deposits at quarter - end 35 $ in millions 3Q13 vs. DEPOSITS BY CATEGORY 3Q13 2Q13 1Q13 4Q12 3Q12 3Q12 Demand & Now 1,979$ 1,916$ 1,894$ 1,841$ 1,796$ 183$ MMDA & Savings 1,437 1,406 1,401 1,372 1,342 95 Core Transaction Deposits 3,416 3,322 3,295 3,213 3,138 278 Time < $100,000 920 977 1,014 1,050 1,118 (198) Time ≥ $100,000 < $250,000 473 512 528 547 598 (125) Public Deposits 734 674 700 739 612 122 Total Core Deposits 5,543 5,485 5,537 5,549 5,466 77 Time ≥ $250,000 120 120 125 127 101 19 Public Deposits 31 32 32 31 32 (1) Total Customer Deposits 5,694 5,637 5,694 5,707 5,599 95 Brokered Deposits 419 375 332 245 224 195 Total Deposits 6,113$ 6,012$ 6,026$ 5,952$ 5,823$ 290$
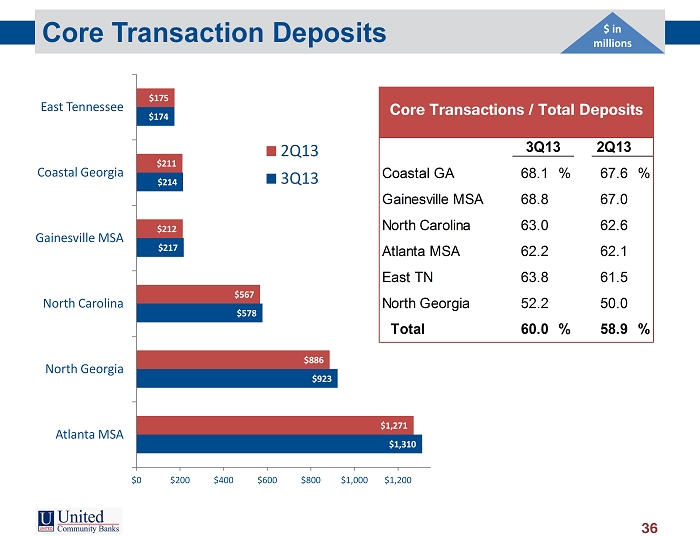
Core Transaction Deposits 36 $1,310 $923 $578 $217 $214 $174 $1,271 $886 $567 $212 $211 $175 $0 $200 $400 $600 $800 $1,000 $1,200 Atlanta MSA North Georgia North Carolina Gainesville MSA Coastal Georgia East Tennessee 2Q13 3Q13 Core Transactions / Total Deposits % 2Q13 Coastal GA 68.1 % 67.6 % Gainesville MSA 68.8 67.0 North Carolina 63.0 62.6 Atlanta MSA 62.2 62.1 East TN 63.8 61.5 North Georgia 52.2 50.0 Total 60.0 % 58.9 % 3Q13 $ in millions

Lending & Credit Environment 37 Regional Credit Review – Standard Underwriting • House Lending Limit 25 • Project Lending Limit 15 • Top 25 Relationships 351 PROACTIVELY ADDRESSING CREDIT ENVIRONMENT STRUCTURE PROCESS POLICY • Centralized underwriting and approval process • Segregated work - out teams • Highly skilled ORE disposition group • Seasoned regional credit professionals • Continuous external loan review • Internal loan review of new credit relationships • Intensive executive management involvement x Weekly past due meetings x Weekly NPA/ORE meetings x Quarterly criticized watch loan review meetings x Quarterly pass commercial and CRE portfolio review meetings • Ongoing enhancements to credit policy • Periodic updates to portfolio limits $ in millions
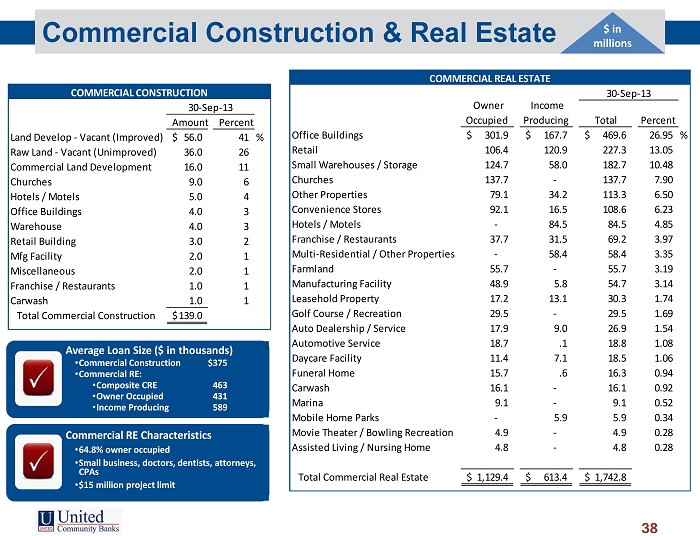
Commercial Construction & Real Estate 38 Amount Percent Land Develop - Vacant (Improved) 56.0$ 41 % Raw Land - Vacant (Unimproved) 36.0 26 Commercial Land Development 16.0 11 Churches 9.0 6 Hotels / Motels 5.0 4 Office Buildings 4.0 3 Warehouse 4.0 3 Retail Building 3.0 2 Mfg Facility 2.0 1 Miscellaneous 2.0 1 Franchise / Restaurants 1.0 1 Carwash 1.0 1 Total Commercial Construction 139.0$ 30-Sep-13 COMMERCIAL CONSTRUCTION $ in millions Owner Occupied Income Producing Total Percent Office Buildings 301.9$ 167.7$ 469.6$ 26.95 % Retail 106.4 120.9 227.3 13.05 Small Warehouses / Storage 124.7 58.0 182.7 10.48 Churches 137.7 - 137.7 7.90 Other Properties 79.1 34.2 113.3 6.50 Convenience Stores 92.1 16.5 108.6 6.23 Hotels / Motels - 84.5 84.5 4.85 Franchise / Restaurants 37.7 31.5 69.2 3.97 Multi-Residential / Other Properties - 58.4 58.4 3.35 Farmland 55.7 - 55.7 3.19 Manufacturing Facility 48.9 5.8 54.7 3.14 Leasehold Property 17.2 13.1 30.3 1.74 Golf Course / Recreation 29.5 - 29.5 1.69 Auto Dealership / Service 17.9 9.0 26.9 1.54 Automotive Service 18.7 .1 18.8 1.08 Daycare Facility 11.4 7.1 18.5 1.06 Funeral Home 15.7 .6 16.3 0.94 Carwash 16.1 - 16.1 0.92 Marina 9.1 - 9.1 0.52 Mobile Home Parks - 5.9 5.9 0.34 Movie Theater / Bowling Recreation 4.9 - 4.9 0.28 Assisted Living / Nursing Home 4.8 - 4.8 0.28 Total Commercial Real Estate 1,129.4$ 613.4$ 1,742.8$ 30-Sep-13 COMMERCIAL REAL ESTATE Average Loan Size ($ in thousands) • Commercial Construction $375 • Commercial RE: • Composite CRE 463 • Owner Occupied 431 • Income Producing 589 Commercial RE Characteristics • 64.8% owner occupied • Small business, doctors, dentists, attorneys, CPAs • $15 million project limit
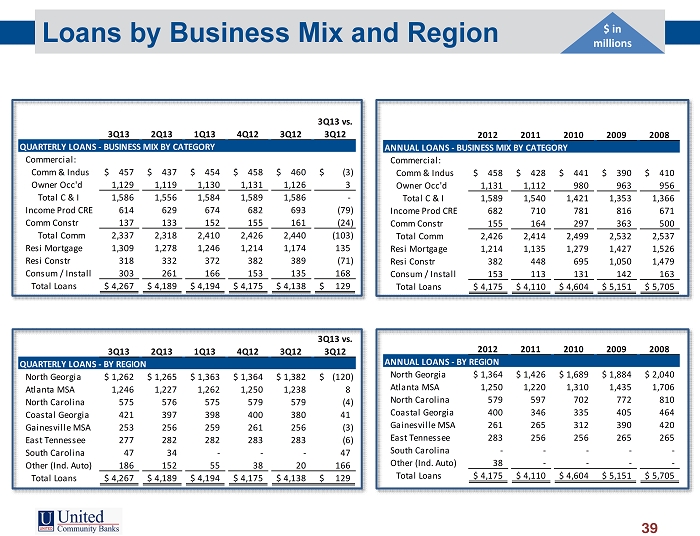
Loans by Business Mix and Region 39 $ in millions 3Q13 2Q13 1Q13 4Q12 3Q12 3Q13 vs. 3Q12 QUARTERLY LOANS - BUSINESS MIX BY CATEGORY Commercial: Comm & Indus 457$ 437$ 454$ 458$ 460$ (3)$ Owner Occ'd 1,129 1,119 1,130 1,131 1,126 3 Total C & I 1,586 1,556 1,584 1,589 1,586 - Income Prod CRE 614 629 674 682 693 (79) Comm Constr 137 133 152 155 161 (24) Total Comm 2,337 2,318 2,410 2,426 2,440 (103) Resi Mortgage 1,309 1,278 1,246 1,214 1,174 135 Resi Constr 318 332 372 382 389 (71) Consum / Install 303 261 166 153 135 168 Total Loans 4,267$ 4,189$ 4,194$ 4,175$ 4,138$ 129$ 3Q13 2Q13 1Q13 4Q12 3Q12 3Q13 vs. 3Q12 QUARTERLY LOANS - BY REGION North Georgia 1,262$ 1,265$ 1,363$ 1,364$ 1,382$ (120)$ Atlanta MSA 1,246 1,227 1,262 1,250 1,238 8 North Carolina 575 576 575 579 579 (4) Coastal Georgia 421 397 398 400 380 41 Gainesville MSA 253 256 259 261 256 (3) East Tennessee 277 282 282 283 283 (6) South Carolina 47 34 - - - 47 Other (Ind. Auto) 186 152 55 38 20 166 Total Loans 4,267$ 4,189$ 4,194$ 4,175$ 4,138$ 129$ 2012 2011 2010 2009 2008 ANNUAL LOANS - BUSINESS MIX BY CATEGORY Commercial: Comm & Indus 458$ 428$ 441$ 390$ 410$ Owner Occ'd 1,131 1,112 980 963 956 Total C & I 1,589 1,540 1,421 1,353 1,366 Income Prod CRE 682 710 781 816 671 Comm Constr 155 164 297 363 500 Total Comm 2,426 2,414 2,499 2,532 2,537 Resi Mortgage 1,214 1,135 1,279 1,427 1,526 Resi Constr 382 448 695 1,050 1,479 Consum / Install 153 113 131 142 163 Total Loans 4,175$ 4,110$ 4,604$ 5,151$ 5,705$ 2012 2011 2010 2009 2008 ANNUAL LOANS - BY REGION North Georgia 1,364$ 1,426$ 1,689$ 1,884$ 2,040$ Atlanta MSA 1,250 1,220 1,310 1,435 1,706 North Carolina 579 597 702 772 810 Coastal Georgia 400 346 335 405 464 Gainesville MSA 261 265 312 390 420 East Tennessee 283 256 256 265 265 South Carolina - - - - - Other (Ind. Auto) 38 - - - - Total Loans 4,175$ 4,110$ 4,604$ 5,151$ 5,705$
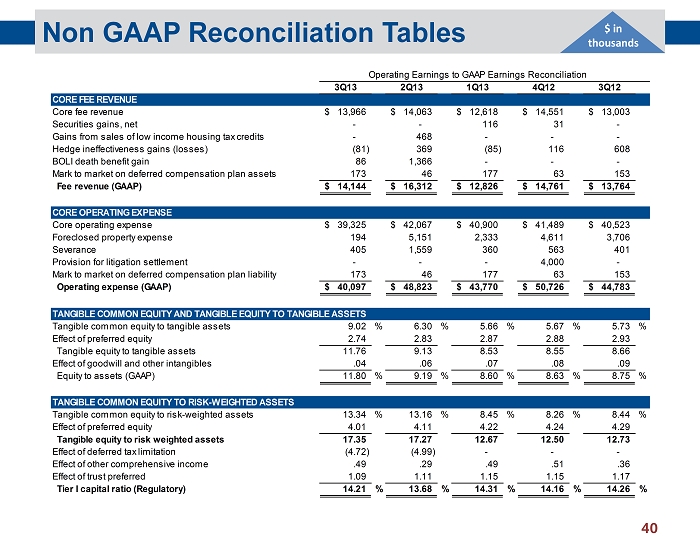
Non GAAP Reconciliation Tables 40 3Q13 2Q13 1Q13 4Q12 3Q12 CORE FEE REVENUE Core fee revenue 13,966$ 14,063$ 12,618$ 14,551$ 13,003$ Securities gains, net - - 116 31 - Gains from sales of low income housing tax credits - 468 - - - Hedge ineffectiveness gains (losses) (81) 369 (85) 116 608 BOLI death benefit gain 86 1,366 - - - Mark to market on deferred compensation plan assets 173 46 177 63 153 Fee revenue (GAAP) 14,144$ 16,312$ 12,826$ 14,761$ 13,764$ CORE OPERATING EXPENSE Core operating expense 39,325$ 42,067$ 40,900$ 41,489$ 40,523$ Foreclosed property expense 194 5,151 2,333 4,611 3,706 Severance 405 1,559 360 563 401 Provision for litigation settlement - - - 4,000 - Mark to market on deferred compensation plan liability 173 46 177 63 153 Operating expense (GAAP) 40,097$ 48,823$ 43,770$ 50,726$ 44,783$ TANGIBLE COMMON EQUITY AND TANGIBLE EQUITY TO TANGIBLE ASSETS Tangible common equity to tangible assets 9.02 % 6.30 % 5.66 % 5.67 % 5.73 % Effect of preferred equity 2.74 2.83 2.87 2.88 2.93 Tangible equity to tangible assets 11.76 9.13 8.53 8.55 8.66 Effect of goodwill and other intangibles .04 .06 .07 .08 .09 Equity to assets (GAAP) 11.80 % 9.19 % 8.60 % 8.63 % 8.75 % TANGIBLE COMMON EQUITY TO RISK-WEIGHTED ASSETS Tangible common equity to risk-weighted assets 13.34 % 13.16 % 8.45 % 8.26 % 8.44 % Effect of preferred equity 4.01 4.11 4.22 4.24 4.29 Tangible equity to risk weighted assets 17.35 17.27 12.67 12.50 12.73 Effect of deferred tax limitation (4.72) (4.99) - - - Effect of other comprehensive income .49 .29 .49 .51 .36 Effect of trust preferred 1.09 1.11 1.15 1.15 1.17 Tier I capital ratio (Regulatory) 14.21 % 13.68 % 14.31 % 14.16 % 14.26 % Operating Earnings to GAAP Earnings Reconciliation $ in thousands