Table of Contents
UNITED STATES
SECURITIES AND EXCHANGE COMMISSION
SECURITIES AND EXCHANGE COMMISSION
Washington, D.C. 20549
Form 10-K
Annual Report Pursuant to Section 13 or 15(d)
of the Securities Exchange Act of 1934
of the Securities Exchange Act of 1934
| For the fiscal year ended June 30, 2007 | Commission File Number 0-18927 |
TANDY BRANDS ACCESSORIES, INC.
(Exact name of registrant as specified in its charter)
| Delaware (State or other jurisdiction of incorporation or organization) | 75-2349915 (I.R.S. Employer Identification Number) |
690 East Lamar Boulevard, Suite 200, Arlington, TX 76011
(Address of principal executive offices and zip code)
(Address of principal executive offices and zip code)
817-548-0090
(Registrant’s telephone number, including area code)
(Registrant’s telephone number, including area code)
Securities registered pursuant to Section 12(b) of the Act:
Common Stock, Par Value $1.00 Per Share
(Title of class)
Common Stock, Par Value $1.00 Per Share
(Title of class)
Securities registered pursuant to Section 12(g) of the Act:
None
None
Indicate by check mark if the registrant is a well-known seasoned issuer, as defined in Rule 405 of the Securities Act.
o Yes þ No
Indicate by check mark if the registrant is not required to file reports pursuant to Section 13 or Section 15(d) of the Act.
o Yes þ No
Indicate by check mark whether the registrant (1) has filed all reports required to be filed by Section 13 or 15(d) of the Securities Exchange Act of 1934 during the preceding 12 months (or for such shorter period that the registrant was required to file such reports), and (2) has been subject to such filing requirements for the past 90 days.
þ Yes o No
Indicate by check mark if disclosure of delinquent filers pursuant to Item 405 of Regulation S-K is not contained herein, and will not be contained, to the best of registrant’s knowledge, in definitive proxy or information statements incorporated by reference in Part III of this Form 10-K or any amendment to this Form 10-K.
þ
Indicate by check mark whether the registrant is a large accelerated filer, an accelerated filer, or a non-accelerated filer. See definition of “accelerated filer and large accelerated filer” in Rule 12b-2 of the Exchange Act. (Check one):
Large accelerated filero Accelerated filero Non-accelerated filerþ
Indicate by check mark whether the registrant is a shell company (as defined in Rule 12b-2 of the Exchange Act).
o Yes þ No
The aggregate market value of the voting common equity held by non-affiliates based upon the closing price of the common stock on the NASDAQ Global Market System on December 29, 2006 was $71,767,174. Shares of common stock known to be held by executive officers, directors, and holders of more that 5% of the outstanding common stock have been excluded. This determination of affiliate status in not necessarily a conclusive determination for other purposes.
There were 6,892,428 shares of common stock, par value $1.00 per share, outstanding on September 19, 2007.
DOCUMENTS INCORPORATED BY REFERENCE
Portions of the definitive Proxy Statement to be delivered to stockholders in connection with the Annual Meeting of Stockholders to be held October 29, 2007 are incorporated by reference into Part III of this Form 10-K.
TABLE OF CONTENTS
| EXHIBIT INDEX 2002 Omnibus Plan Amendment No. 1 | Exhibit 10.37 | |||||||
| Fiscal 2008 Compensation Summaries | Exhibit 10.38 | |||||||
| List of Subsidiaries | Exhibit 21.1 | |||||||
| Consent of Ernst & Young LLP | Exhibit 23.1 | |||||||
| Certification Pursuant to Rule 13a-14(a)/15d-14(a) (Chief Executive Officer) | Exhibit 31.1 | |||||||
| Certification Pursuant to Rule 13a-14(a)/15d-14(a) (Chief Financial Officer) | Exhibit 31.2 | |||||||
| Section 1350 Certifications — CEO & CFO | Exhibit 32.1 | |||||||
| Amendment No. 1 to 2002 Omnibus Plan | ||||||||
| Fiscal 2008 Compensation Summaries | ||||||||
| List of Subsidiaries | ||||||||
| Consent of Ernst & Young LLP | ||||||||
| Certification Pursuant to Rule 13a-14(a)/15d-14(a) - CEO | ||||||||
| Certification Pursuant to Rule 13a-14(a)/15d-14(a) - CFO | ||||||||
| Section 1350 Certifications | ||||||||
2
Table of Contents
FORWARD-LOOKING STATEMENTS
This Annual Report onForm 10-K, including the “Management’s Discussion And Analysis Of Financial Condition And Results Of Operation,” contains forward-looking statements regarding future events and our future results that are subject to the safe harbors created under the Securities Act of 1933 and the Securities Exchange Act of 1934. Words such as “expects,” “anticipates,” “intends,” “plans,” “believes,” “seeks,” “estimates,” “continue,” “may,” variations of such words, and similar expressions are intended to identify forward-looking statements. In addition, any statements that refer to projections of our future financial performance, our anticipated growth and trends in our business, and other characterizations of future events or circumstances are forward-looking statements. We have based these forward looking statements on our current expectations about future events, estimates and projections about the industry in which we operate. These statements are not guarantees of future performance and involve risks, uncertainties and assumptions that are difficult to predict. Our actual results may differ materially from those suggested by these forward-looking statements for various reasons, including those identified under “Risk Factors” on page 11. Given these risks and uncertainties, you are cautioned not to place undue reliance on forward-lookingstatements. The forward-looking statements included in this report are made only as of the date hereof. Except as required under federal securities laws and the rules and regulations of the United States Securities and Exchange Commission, we do not undertake, and specifically decline, any obligation to update any of these statements or to publicly announce the results of any revisions to any forward-looking statements after the distribution of this report, whether as a result of new information, future events, changes in assumptions, or otherwise.
PART I
ITEM 1 — BUSINESS
What do we do?
We are a leading designer and marketer of branded men’s, women’s and children’s accessories, including belts, small leather goods, and gift accessories. Our product line also includes handbags, sporting goods, and neckwear. Our merchandise is marketed under a broad portfolio of nationally recognized licensed and proprietary brand names, including DOCKERS®, LEVI’S®, LEVI STRAUSS SIGNATURE™, JONES NEW YORK®, TOTES®, ROLFS®, HAGGAR®, WOOLRICH®, CANTERBURY®, PRINCE GARDNER®, PRINCESS GARDNER®, AMITY®, COLETTA®, STAGG®, ACCESSORY DESIGN GROUP®, TIGER®, ETON®, SURPLUS®, EILEEN WEST™, GOODYEAR™, GENO D’LUCCA™, as well as private brands for major retail customers. We sell our products through all major retail distribution channels throughout the United States and Canada, including mass merchants, national chain stores, department stores, men’s and women’s specialty stores, catalog retailers, grocery stores, drug stores, golf pro shops, sporting goods stores and the retail exchange operations of the United States military.
What are our product lines?
Our primary products consist of belts and small leather goods such as wallets. Our products and their percentages of fiscal 2007 total net sales were:
| Belts | 60.3 | % | ||
| Small leather goods | 20.5 | |||
| Gift accessories | 10.4 | |||
| Handbags | 1.6 | |||
| Other products | 7.2 | |||
| 100.0 | % | |||
We are organized along men’s and women’s product lines with two reportable segments: (1) men’s accessories and (2) women’s accessories. Men’s and boys’ products were 71.5% of our net sales in fiscal 2007 and women’s products were 28.5%. We also organize our customer relationship management functions along these same product lines.
3
Table of Contents
Belts
We, along with our predecessors, have manufactured and marketed belts for over 86 years, and belts remain our largest single product category representing 60.3%, 53.3%, and 53.8% of net sales in fiscal 2007, 2006, and 2005, respectively. We compete in all four categories of the belt market: casual, work, dress, and fashion. In fiscal 2007 we manufactured 34% of the men’s belts we distributed and imported the balance, including all women’s belts, from China, Guatemala, and other countries. Our Yoakum, Texas facility has been converted into a distribution center and, beginning in fiscal 2008, our belts will be manufactured by overseas partners, primarily in China and the Dominican Republic.
Men’s belt sales in 2007 increased $1.7 million and women’s belt sales declined $4.9 million, resulting in an overall $3.2 million, or 2.7%, decrease in total belt sales compared to fiscal 2006. Fiscal 2007 sales of men’s and boys’ belts totaled $90.6 million, which accounted for 76.8% of our $118 million in belt sales, and sales of women’s and girls’ belts were $27.4 million, or 23.2% of our belt sales. Total belt sales in fiscal 2006 and 2005 were $121.2 and $119.1 million, respectively.
Small Leather Goods
Our small leather goods consist primarily of men’s and women’s wallets sold under licensed, private, and proprietary brands. They are predominantly sourced from manufacturers in foreign countries, such as China, due to the labor-intensive nature of manufacturing small leather goods and the relatively low cost of labor in those countries. Sales of small leather goods were $40.1 million, or 20.5% of our net sales in fiscal 2007. Sales of small leather goods were 18.0% of our fiscal 2006 sales and 18.9% of fiscal 2005 sales.
In fiscal 2007, sales of men’s and boys’ small leather goods were $17.5 million, or 43.6% of our total small leather goods sales, and sales of women’s and girls’ small leather goods were $22.6 million, or 56.4% of the total.
Gift Accessories
We distribute a broad range of gift accessories under proprietary, licensed, and private brand names. These include products such as emergency kits, lights and radios, book lights, beverage mugs, tie racks, and a broad range of other items manufactured by foreign suppliers. Gift accessories sales increased 14.4% in fiscal 2007 to $20.5 million, or 10.4% of our total net sales, from 7.9% and 6.2% of our net sales in fiscal 2006 and 2005, respectively.
Other Products
Other products we market under proprietary, licensed, and private brands are women’s handbags, neckwear, and sporting goods accessories which complement our core belt and small leather goods products. These products are manufactured according to our design specifications by foreign and domestic suppliers. Other accessories, which accounted for 8.8%, 20.8%, and 21.2% of our net sales in fiscal 2007, 2006, and 2005, respectively, were (in millions):
| 2007 | 2006 | 2005 | ||||||||||
| Handbags and hats | $ | 3.1 | $ | 8.1 | $ | 10.6 | ||||||
| Socks | — | 14.0 | 12.1 | |||||||||
| Cold weather goods | — | 8.4 | 6.4 | |||||||||
| Other products | 14.1 | 16.7 | 17.7 | |||||||||
| $ | 17.2 | $ | 47.2 | $ | 46.8 | |||||||
What brands do we sell?
Our net sales by brand type in fiscal 2007 were (in millions):
| Private brands | $ | 106.1 | 54.1 | % | ||||
| Proprietary brands | 57.3 | 29.3 | ||||||
| Licensed brands | 32.4 | 16.6 | ||||||
| $ | 195.8 | |||||||
4
Table of Contents
Private Brand Products
In fiscal 2007 private brand products accounted for $106.1 million, or 54.1% of our net sales. In a private brand program we are responsible for designing and delivering unique products for select customers according to the customer’s individual requirements. These programs offer our customers exclusivity and pricing control over their products, both of which are important factors in the retail marketplace. We believe our flexible sourcing capabilities, advanced electronic inventory management and replenishment systems, and design, product development, and merchandising expertise provide retailers with a superior alternative to direct sourcing of their private brand products.
Our principal private brand programs include those for leading retailers such as Wal-Mart, Target, JCPenney, and Sears, as well as nationally recognized private brand names such as Faded Glory®, Meeting Street®, croft & barrow®, St. John’s Bay®, Mossimo®, Metro 7®, and Alan Flusser®.
License Agreements
We have been awarded exclusive license agreements for several well recognized brands, including Dockers®, Levi’s®, Levi Strauss Signature™, Jones New York®, Haggar®, Woolrich®, Eileen West™, and totes® gift accessories.
In fiscal 2008 we will begin delivering new products under the following brand names:
| • | Eileen West™ — a June 2006 license agreement grants us the exclusive right to design, manufacture, and sell women’s handbags, personal leather goods such as wallets, and belts in the United States and Canada beginning in the fall of 2007. | ||
| • | Geno™ and Geno D’Lucca™ — a June 2007 license agreement grants us the exclusive right to market high end belts, small leather goods, sandals, and other products in North America beginning in the fall of 2007. | ||
| • | Goodyear™ — a May 2007 license agreement gives us the nonexclusive right to market a gift line of The Goodyear Tire & Rubber Company in the United States, Canada, and Mexico beginning in the spring of 2008. |
Generally our license agreements cover specific products and require us to pay royalties ranging from 3% to 10% of net sales based on minimum sales quotas or sales. The terms of the agreements are typically four to ten years, with options to extend the terms, provided certain sales or royalty minimums are achieved. For fiscal 2007, sales of our licensed products accounted for $32.4 million, or 16.6% of our net sales. Sales of totes® gift accessories were $16.0 million, or 8.2% of our net sales, and the combined sales related to all of our Levi Strauss license agreements were $11.7 million, or 6% of our net sales. No sales associated with any other individual license agreement accounted for more than 5% of net sales.
Proprietary Brands
In addition to our licensed and private brands, we produce and market products under our own registered trademarks and trade names. We own leading and well recognized trademarks such as Rolfs®, Amity®, Canterbury®, Tiger®, Accessory Design Group®, Prince Gardner®, Princess Gardner®, and ETON®. We intend to build on the success of our proprietary brand portfolio by pursuing additional ownership opportunities and expanding the assortment of products we offer and the retail channels we serve with our proprietary brands. Net sales under our proprietary brands were $57.3 million, or 29.3% of our net sales in fiscal 2007.
Distribution Of Our Key Brands
Our key brands and each brand’s targeted distribution channels and primary products are:
| Brand | Distribution Channel | Products | ||
Dockers® | National chain stores Department stores Specialty stores | Belts Handbags Small leather goods | ||
Levi’s® | National chain stores Department stores Specialty stores | Belts Small leather goods |
5
Table of Contents
| Brand | Distribution Channel | Products | ||
Levi Strauss Signature™ | Mass merchants National chain stores | Belts Small leather goods Casual multipurpose bags | ||
Jones New York® | Department stores Specialty stores | Belts Small leather goods | ||
Rolfs® | National chain stores Department stores Specialty stores | Small leather goods | ||
Haggar® | National chain stores Department stores Catalogs | Belts Small leather goods | ||
Canterbury® | Specialty stores Golf pro shops | Belts Small leather goods | ||
Prince Gardner® | National chain stores Specialty stores | Small leather goods | ||
Princess Gardner® | National chain stores Specialty stores | Small leather goods | ||
Amity® | Mass merchants National chain stores | Small leather goods | ||
Coletta® | Mass merchants National chain stores | Handbags | ||
Accessory Design Group® | Mass merchants National chain stores | Belts Women’s accessories | ||
Tiger® | Mass merchants National chain stores | Belts | ||
Stagg® | Mass merchants National chain stores | Belts Small leather goods | ||
ETON® | Mass merchants National chain stores Department stores Specialty stores | Gift accessories | ||
totes® | National chain stores Department stores Specialty stores | Gift accessories | ||
Surplus® | National chain stores | Belts Small leather goods Gift accessories | ||
Eileen West™ | Department stores Specialty stores | Belts Small leather goods Handbags | ||
Geno D’Lucca™ | Department stores | Belts Small leather goods Sandals | ||
Goodyear™ | Automobile and tire stores Mass merchants | Gift accessories |
6
Table of Contents
What are our channels of distribution?
We sell our products to a variety of retail outlets, including:
| Department stores | E-commerce websites | |
| Specialty chains | National chain stores | |
| Mass merchants | Outlet stores | |
| United States military retail exchange operations | Sporting goods stores | |
| Golf pro shops | Individual specialty stores | |
| Supermarkets | Catalog retailers | |
| Uniform stores | Shoe stores | |
| TV shopping networks | Wholesale clubs | |
| Drug stores | Premium markets | |
| Office supply stores | Automobile and tire stores |
Who are our customers?
We maintain strong relationships with various major retailers in the United States and Canada, including:
| Department Stores | National Chains | Mass Merchants | ||
| Kohl’s | JCPenney (U.S. and Mexico) | Wal-Mart (U.S., Canada and Mexico) | ||
| Bon-Ton/Carson’s | Stein Mart | Target | ||
| Belk | Casual Male | Fred Meyer | ||
| Macy’s | AAFES | Shopko/Pamida | ||
| Stage | Goody’s | Zellers (Canada) | ||
| Dillard’s | Tractor Supply | Meijer | ||
| Boscov’s | Sears (U.S. and Canada) | K Mart | ||
| Gottschalk’s | Mervyn’s | |||
| The Bay (Canada) | Moore’s (Canada) | |||
| Nordstrom | Marshall’s | |||
| Men’s Wearhouse | ||||
| TJ Maxx |
Wal-Mart accounted for 45% and 39% of our net sales in fiscal 2007 and 2006, respectively. In fiscal 2006 Target accounted for 12% of our net sales. No other customer accounted for 10% or more of our total net sales. In fiscal 2007 our top ten customers accounted for 77% of net sales.
How do we maintain strong customer relations?
We believe our success is due in large part to our design expertise, strong customer relationships, strong sales and marketing organization, and superior customer service. Factors which help facilitate these characteristics include our “quick response” distribution, vendor inventory management services, electronic data interchange capabilities, and expertise in the communication of fashion and lifestyle concepts through product lines and innovative point-of-sale presentations. We develop and manage our accounts through the coordinated efforts of senior management, regional managers, account executives, and an organization of salespeople and independent sales representatives. Members of our senior management or senior account executives manage our relationships with certain of our national accounts such as Wal-Mart, JCPenney, Kohl’s, Target, Belk, Macy’s, Dillard’s, and the Sears Holdings companies.
We maintain in-store customer service relationships with various specialty stores, national chain stores, and major department stores. We have a team of more than 112 sales associates in the United States and 11 sales associates in Canada.
7
Table of Contents
These sales associates are organized on a regional basis and supervised by regional sales managers. Sales associates are responsible for overseeing accounts within a defined geographic territory, developing and maintaining business relationships with their respective customers, preparing and conducting line presentations, and assisting customers in the implementation of programs at the individual store level. In addition, sales associates may, depending on the needs of an individual customer, assist in the maintenance and presentation of merchandise on the selling floor. Our regional sales organization is supported by account executives. Sales personnel, other than senior managers, generally are compensated based on a combination of salary and commission.
Did we have firm backlog orders for fiscal 2008 and the prior fiscal year?
We had a backlog of firm orders at June 30, 2007 and 2006 totaling $20.9 million and $25.2 million, respectively. The current year decline is primarily due to fewer orders for women’s small leather goods and handbags. Whether we can fill our backlog orders generally is dependent on product availability. Historically the amount of unfilled backlog orders has been immaterial. The backlog at June 30, 2007 may not be indicative of future results.
How do we merchandise and develop our products?
Senior managers are responsible for generating profitable performance results by developing, planning, selling, and implementing merchandise programs for their accounts. Individual senior managers develop and maintain business relationships with customers’ buyers and merchandise managers. Senior managers also develop and propose comprehensive programs relating to product mix, pricing, and fixturing, and they assist customers’ buyers and merchandise managers in the implementation of these programs. We coordinate the implementation of marketing programs through the efforts of senior and regional managers. Senior and regional managers are compensated based on a combination of salary and bonus tied to various measures of profitability and sales performance.
Our product development and merchandising professionals work closely with our customers, suppliers, and licensors to interpret market trends, develop new products, and create and implement comprehensive merchandising programs which consist of packaging, point-of-sale, fixturing, and presentation materials. We believe our internal design ability represents a significant competitive advantage because retail customers have become increasingly reliant on the design and merchandising expertise of their suppliers.
What is our competitive position?
Competition in the fashion accessories industry is intense. The accessories market is highly fragmented and we believe we are one of the largest competitors in the accessories industry. Based on our analysis, we have found that the sectors of the accessories industry we serve have grown at an average annual rate of 3-5% in recent years. In our opinion this growth has resulted from:
| • | trends toward more casual attire which has increased demand for accessories outside the traditional dress category; | ||
| • | increased consumer awareness of branded accessories as a fashion and lifestyle statement; and | ||
| • | a desire for newness and change in accessories styles. |
As a result of consolidation in the retail industry, retailers have increasingly chosen to consolidate their suppliers to a core group of companies that have the resources and expertise to meet the retailers’ increasing demands. We believe we are well positioned to continue to capitalize on these market trends.
Our ability to remain competitive depends largely on our ability to maintain our customer relationships, create new designs and products, offer high quality merchandise at competitive prices, and maintain adequate inventory levels. Our primary competitors are:
| Product Segment | Primary Competitors | |
| Men’s and boys’ belts | Swank, Randa/Humphreys, Cipriani, and Fossil | |
| Men’s wallets | Buxton, Randa/Humphreys, Mundi, Fossil, Swank, and Cipriani | |
| Women’s and girls’ belts | Cipriani, Liz Claiborne, Circa, Accessory Network, and Fossil | |
| Women’s small leather goods | Buxton, Mundi, Fossil, Liz Claiborne, and Nine West | |
| Women’s handbags | Nine West, Liz Claiborne, Kenneth Cole, and Fossil |
8
Table of Contents
We compete on the basis of customer service, brand recognition, product quality and price. We believe our ability to compete successfully is based on our strong customer relationships, superior customer service, strong national brand portfolio, national distribution capabilities, proprietary inventory management systems, flexible sourcing, and product design and innovation.
How do we seek to grow our business?
We seek to increase our sales and earnings through a variety of means, including organic growth from increased sales by our current operating units, as well as growth through new license agreements and the acquisition of assets and similar businesses. Since our incorporation in Delaware on November 1, 1990, we have acquired numerous businesses. Our most recent acquisition was in July 2004 when we acquired Superior Merchandise Company (sometimes referred to as “Superior” or “ETON”) which markets and distributes men’s and women’s gift accessories under the ETON® and licensed totes® brands.
Where and how are our products produced?
We sourced finished products representing 84.5% of our fiscal 2007 net sales from both domestic and foreign manufacturers. We have strong relationships with a number of high-quality, low-cost foreign manufacturers who provide products manufactured to our specifications. At the end of the fourth quarter we converted our Yoakum, Texas manufacturing facility into a distribution center and, beginning in fiscal 2008, our belts will be purchased from third-party suppliers. Our manufacturing facilities in Yoakum, Texas and Scarborough, Ontario, Canada had the capacity to manufacture approximately 6.8 million belts per year and operated at 74% of capacity in fiscal 2007. Our Canadian subsidiary manufactured 38.4% of its sales in fiscal 2007.
Is our business seasonal?
Our quarterly sales and operating results have a seasonal increase in the fall (our first and second fiscal quarters). Quarterly net sales and income, as percentages of the totals for the year, were:
| First | Second | Third | Fourth | |||||||||||||
| Quarter | Quarter | Quarter | Quarter | |||||||||||||
| Net sales | ||||||||||||||||
| Fiscal 2007 | 29.2 | % | 32.9 | % | 19.3 | % | 18.6 | % | ||||||||
| Fiscal 2006 | 26.8 | 32.5 | 20.0 | 20.7 | ||||||||||||
| Net income (loss) | ||||||||||||||||
| Fiscal 2007 | 146.3 | % | 176.1 | % | (71.5 | )% | (150.9 | )% | ||||||||
| Fiscal 2006 | 42.4 | 58.8 | (171.0 | ) | (30.2 | ) | ||||||||||
What are the sources and availability of our products?
Beginning in fiscal 2008, most of our product offerings will be finished goods manufactured primarily by strategic partners in China, the Dominican Republic, and other countries. Because a number of other companies could manufacture our products, we do not believe we are exposed to any potentially significant disruption of product flow.
Are we subject to governmental regulations?
Most of our products will be manufactured outside of the United States beginning in fiscal 2008. Accordingly, foreign countries and the United States may from time to time modify existing quotas, duties, tariffs, or import restrictions, or otherwise regulate or restrict imports in a manner which could be material and adverse to us. In addition, economic and political disruptions in Asia and other parts of the world from which we import goods could have an adverse effect on our ability to maintain an uninterrupted flow of products to our major customers.
Due to the fact that we sell our products to the retail exchange operations of the United States military, and thus are a supplier to the federal government, we must comply with all applicable federal statutes. Historically we have not made any material modifications or accommodations as a result of government regulations.
9
Table of Contents
How many employees do we have?
We employed 952 people as of June 30, 2007. We believe employee relations are generally good.
What role does intellectual property play in our business?
We believe our trademarks, licenses to use certain trademarks, and our other proprietary rights in and to intellectual property are important to our success and our competitive position. We seek to protect our designs and intellectual property rights against infringement. We devote considerable resources to the establishment and protection of our intellectual property on a nationwide basis and in selected foreign markets. Our trademarks remain valid and enforceable as long as the marks are used in connection with our products and services and the required registration renewals are filed.
What are our working capital practices?
We do not enter into long-term agreements with any of our suppliers or customers. Instead we enter into a number of purchase order commitments for each of our lines every season. Due to the time required by our foreign suppliers to produce and ship goods to our distribution centers, we attempt, based on internal estimates, to carry on-hand inventory levels necessary for the timely shipment of initial and replenishment orders for men’s and women’s accessories. A decision by the customer’s buyer for a group of stores or any significant customer, whether motivated by competitive conditions, financial difficulties, or otherwise, to significantly change the amount of merchandise they purchase from us, or to change the manner of doing business with us, could have a significant effect on our financial condition and results of operations. However, this exposure is mitigated because we sell our products to a variety of retail partners throughout the United States and Canada.
What financial information about our business segments and geographic areas of operation is available?
Financial information about our segments’ operations and assets is incorporated herein by reference to Note 12 of the notes to consolidated financial statements included in Item 8 of this Annual Report.
Where can investors access additional information about Tandy Brands?
Our website address is www.tandybrands.com. Information about our corporate governance, including our Code of Business Conduct and Ethics, is on the website. Our annual reports on Form 10-K, quarterly reports on Form 10-Q, current reports on Form 8-K, Forms 3, 4, and 5 filed by our officers, directors, and stockholders holding 10% or more of our common stock, and all amendments to those reports are available free of charge through our website as soon as reasonably practicable after such material is electronically filed with, or furnished to, the Securities and Exchange Commission (“SEC”). You also may read and copy any reports, proxy statements, or other information that we file with the SEC at the SEC’s public reference room at 100 F Street N.W., Washington, D.C. 20549. Please call the SEC at 1-800-SEC-0330 for further information about the operation and location of the public reference room. Our SEC filings also are available to the public free of charge at the SEC’s website at www.sec.gov.
Recent Developments
On August 22, 2007 we announced our board of directors has undertaken an evaluation of a full range of strategic alternatives available to the Company for increasing stockholder value. These alternatives could include, among other things, adding new licenses, acquisitions, stock buybacks, increased dividends, going private, and selling the Company. We have retained Financo, Inc., an investment banking firm specializing in the apparel and accessories sector, to assist with the assessment process. There is no assurance as to what the outcome of the process may be and we do not intend to disclose developments until a specific course of action has been approved by our board of directors.
10
Table of Contents
ITEM 1A — RISK FACTORS
In evaluating our business you should carefully consider the risk factors discussed below in addition to the other information in this Annual Report. Any of these factors could materially and adversely affect our business, results of operations, and financial condition. These factors are provided for investors as permitted by the Private Securities Litigation Reform Act of 1995. It is not possible to identify or predict all such factors and, therefore, you should not consider theses risks to be a complete statement of all the uncertainties we face.
Risks Relating To Our Business
A significant portion of our sales is attributable to a few major customers.
Ten customers accounted for 77% of our fiscal 2007 net sales, including Wal-Mart which accounted for 45% of our net sales. A decision by Wal-Mart or any other major customer, whether motivated by competitive conditions, financial difficulties or otherwise, to decrease the amount of merchandise purchased from us, or to change their manner of doing business with us, could have a material adverse effect on our results of operations and financial position.
We do not maintain long-term contracts with our customers and are unable to control their purchasing decisions.
Like most companies in our industry, we do not enter into long-term contracts with our customers. As a result, we have no contractual leverage over their purchasing decisions. A determination by a major customer to decrease the amount of products it purchases or to discontinue carrying our products could have a material adverse effect on our operations.
Direct sales to customers by suppliers could negatively impact our sales.
Certain third-party manufacturers have increasingly marketed and sold products to retailers directly, instead of through companies such as ours. While we believe we provide significant value-added services through our design programs and our ability to tailor products for specific customers and demographic groups, if our customers decide to increase their level of purchases directly from third-party manufacturers, our sales could be negatively impacted.
We extend unsecured credit to our customers and are subject to potential financial difficulties they may face.
We extend credit to our department and retail store customers based on an evaluation of their financial condition and generally do not require collateral from our customers. If a customer experiences financial difficulties, we may need to curtail our sales to that customer or be subject to increased risk of nonpayment. If we are unable to collect our accounts receivable from a distressed customer, our operating results would be negatively impacted.
The loss of certain of our license agreements could result in the loss of significant sales.
Our fiscal 2007 net sales included $32.4 million of licensed brand name sales, including $16.0 million of totes® gift accessories and $11.7 million under Levi Strauss license agreements. If we fail to comply with the terms of our license agreements, or to protect against infringement, such failure could have a material adverse effect on our business. In addition, certain of our license agreements require minimum royalty payments, regardless of the level of sales of the licensed products. In the event royalty commitments under these agreements exceed the revenues generated by sales of the licensed products, our operating results would be negatively impacted.
Distribution problems could delay product shipments.
Our inventory management and product distribution processes are highly dependent on the computer hardware and software which support these functions. Extended electric power, telecommunication, or internet outages, or a catastrophic loss of the hardware and software, could preclude timely delivery of products to our customers and result in a loss of sales.
11
Table of Contents
The loss of, or problems with, third-party manufacturers could adversely impact our operations.
Most of our products will be produced by independent, third-party manufacturers, primarily in China and the Dominican Republic. We have no long-term contracts with these manufacturers and conduct business on a purchase-order basis. We compete with other companies for the production capacity and facilities of these manufacturers. Our future success depends on our ability to maintain relationships with our current suppliers and to identify other suppliers and develop relationships with those who can meet our quality standards. If our quality standards are compromised, our customer relationships could be negatively affected
Our business is dependent on our ability to maintain proper inventory levels.
In order to meet the demands of our customers, we must maintain certain levels of inventory of our products. If our inventory levels exceed customer demand, we may be required to write-down unsold inventory or sell the excess at discounted or close-out prices. Such actions could significantly impact our operating results and could result in the diminution of the value of our brands. If we underestimate consumer demand for our products or if we are not able to obtain products in a timely manner, we may experience inventory shortages. If we are unable to fill customer orders, our relationships with our customers could be damaged and our business could be adversely affected. See “Our business is highly subject to consumer preferences and fashion trends” below.
Price increases by our suppliers could negatively affect our operating results.
While we manufactured 34% of the men’s belts we sold in fiscal 2007, most of our products will be purchased from third-party suppliers beginning in fiscal 2008. If our suppliers increase their prices, and we are not able to increase our selling prices, our gross margin and operating results would be materially impacted.
Risks Relating To Our Industry
Our business is highly subject to consumer preferences and fashion trends.
Our industry is driven largely by fashion trends and consumer preferences and our success is dependent on our ability to anticipate and respond to these factors. While we devote considerable time and resources to gauging consumer, lifestyle, and fashion trends which affect the accessories market, any failure on our part to identify and respond to relevant trends could adversely affect acceptance of our products and brands and adversely impact our sales. If we fail to properly gauge fashion and consumer trends, we could be faced with a significant amount of inventory which might only be sold at distressed prices. See “Our business is dependent on our ability to maintain proper inventory levels” above.
Our industry is highly competitive and subject to pricing pressures that could adversely affect our financial position.
The accessories industry is highly fragmented and highly competitive. We compete with numerous manufacturers, importers, and distributors who may have greater resources and our results of operations and market position may be adversely affected by our competitors and their competitive pressures. In addition, from time to time, we must adjust our prices to respond to industry-wide pricing pressures. Our financial performance could be negatively impacted by these pricing pressures if we are forced to reduce prices and cannot also reduce procurement costs, or if our costs increase and we cannot increase our prices.
Our industry is highly subject to economic cycles and retail industry conditions.
Our business is highly subject to general economic cycles and retail industry conditions. When general economic conditions are lower, consumers are often hesitant to use discretionary income to purchase fashion accessories. Any significant declines in general economic conditions or uncertainties regarding future economic prospects that may affect consumer spending habits could adversely affect our business.
12
Table of Contents
Consolidation in the retail industry may negatively impact our operations.
There has been a significant amount of consolidation in the retail industry in recent years. This consolidation may result in factors which could negatively impact our business, such as:
| • | store closures; | ||
| • | increased customer leverage over suppliers, resulting in lower product prices or lower margins; | ||
| • | tighter inventory management on the part of the customer, resulting in lower inventory levels and decreased orders; and | ||
| • | a greater exposure to customer credit risk. |
Risks Relating To International Operations
We source most of our products from foreign countries.
Our transactions with our foreign manufacturers and suppliers are subject to the risks of doing business abroad, including potential political and economic disruptions. Imports into the United States could be affected by, among other things, the cost of transportation and imposition of import duties and restrictions. The United States, Canada, China, and other countries in which our products are manufactured could impose new quotas, tariffs, or other restrictions, or adjust presently prevailing quotas, duty, or tariff levels, which could affect our operations and our ability to import products at current or increased levels.
Fluctuations in foreign currencies could adversely impact our financial condition.
We generally purchase our products in transactions utilizing U.S. dollars. Because we acquire most of our products from foreign countries, the cost of those products may be impacted by changes in the value of the currency of the source country. Changes in the value of the Chinese Yuan, in particular, may have a material impact on our costs due to our reliance on Chinese manufacturing operations. Changes in the currency exchange rates may also affect the relative prices at which we and our foreign competitors sell products in the same market.
Risks Relating To Our Company
Our business depends on a limited number of key personnel with whom we do not have employment agreements. The loss of any one of these individuals could disrupt our business.
Our continued success is highly dependent upon the personal efforts and abilities of our senior management, including Britt Jenkins, our Chief Executive Officer. We do not have employment contracts with, or maintain key-person insurance on the lives of, any of these officers, and the loss of any one of them could disrupt our business.
We are dependent on the creative talent of our designers and the effectiveness of our sales personnel.
Sales of our products are highly dependent on their marketplace acceptance, which is driven by current styles and fashion trends, and our marketing abilities. If we were unable to hire and retain employees having exceptional creative talent and marketing skills, our sales would be adversely affected.
The failure to successfully integrate future acquisitions could negatively impact our business.
We have in the past, and may in the future, expand our business through the acquisition of other companies or product lines. The addition of new companies or product lines requires the integration of management philosophies and personnel, standardization of programs, realization of operating efficiencies, and effective coordination of sales and marketing and financial reporting efforts. In addition, acquisitions in general are subject to a number of special risks, including adverse short-term effects on our reported operating results, diversion of management’s attention, and unanticipated problems or legal liabilities. Acquired businesses also may not provide us with anticipated increased business opportunities or growth.
13
Table of Contents
The requirements of complying with the Exchange Act and the Sarbanes-Oxley Act may strain our resources.
We are subject to the reporting requirements of the Securities Exchange Act of 1934 (“Exchange Act”) and the Sarbanes-Oxley Act of 2002 (“Sarbanes-Oxley Act”). These requirements may place a strain on our resources. The Exchange Act requires that we file with the SEC annual, quarterly, and current reports about our business and its financial condition and results of operations. The Sarbanes-Oxley Act requires, among other things, that we maintain effective disclosure controls and procedures, corporate governance standards, and internal controls over financial reporting. Section 404 of the Sarbanes-Oxley Act requires that, in the future, management document and test our internal control over financial reporting and provide management’s conclusion based on the test.
ITEM 1B — UNRESOLVED STAFF COMMENTS
None.
ITEM 2 — PROPERTIES
We own and lease facilities in the United States and lease facilities in Canada and Hong Kong. We believe our properties are adequate and suitable for the particular uses involved. The following table summarizes our properties:
| Form of | ||||
| Facility Location | Use | Ownership | ||
| Yoakum, Texas (4 facilities) | Distribution of men’s accessories and specialty leather product manufacturing | Own | ||
| West Bend, Wisconsin | Distribution of small leather goods and handbags | Own | ||
| Scarborough, Ontario, Canada | Manufacture and distribution of leather goods | Lease | ||
| Dallas, Texas | Distribution of women’s accessories | Lease | ||
| Arlington, Texas | Corporate offices | Lease | ||
| New York, New York (2 facilities) | Office space and showroom | Lease | ||
| Birmingham, Alabama | Office space | Lease | ||
| New Orleans, Louisiana | Office space | Lease | ||
| Kowloon, Hong Kong | Office space | Lease |
The total space we owned, leased, and occupied as of June 30, 2007 was as follows:
| Square Feet | ||||||||||||
| Owned | Leased | Total | ||||||||||
| Warehouse and office | 566,000 | 260,000 | 826,000 | |||||||||
| Factory | — | 27,000 | 27,000 | |||||||||
| Total | 566,000 | 287,000 | 853,000 | |||||||||
ITEM 3 — LEGAL PROCEEDINGS
We are not involved in any material pending legal proceedings, other than ordinary routine litigation incidental to our business.
ITEM 4 — SUBMISSION OF MATTERS TO A VOTE OF SECURITY HOLDERS
No matters were submitted to a vote of security holders during the fourth quarter of fiscal 2007.
14
Table of Contents
PART II
ITEM 5 — MARKET FOR THE REGISTRANT’S COMMON EQUITY, RELATED STOCKHOLDER MATTERS AND ISSUER PURCHASES OF EQUITY SECURITIES
What is the principal market for our common stock?
The principal market for our common stock is The NASDAQ Global Market where it is listed under the symbol “TBAC.” The high and low sales prices for our common stock for each quarterly period within the two most recent fiscal years as reported on NASDAQ were:
| Fiscal 2007 | Fiscal 2006 | |||||||||||||||
| Quarter Ended | High | Low | High | Low | ||||||||||||
| September 30 | $ | 11.68 | $ | 9.27 | $ | 12.00 | $ | 10.23 | ||||||||
| December 31 | $ | 12.36 | $ | 9.73 | $ | 12.30 | $ | 10.77 | ||||||||
| March 31 | $ | 13.70 | $ | 11.21 | $ | 12.10 | $ | 9.93 | ||||||||
| June 30 | $ | 13.29 | $ | 10.63 | $ | 10.85 | $ | 9.78 | ||||||||
How many common stockholders do we have?
As of September 19, 2007 we had approximately 651 stockholders of record.
Did we declare any cash dividends in fiscal 2007 or the prior fiscal year?
We declared and paid the following dividends:
| Dividend | ||||||||
| Declaration Date | Record Date | Payable Date | Per Share | |||||
| Fiscal 2007 | ||||||||
| August 16, 2006 | September 30, 2006 | October 20, 2006 | $ | 0.0275 | ||||
| October 16, 2006 | December 29, 2006 | January 19, 2007 | $ | 0.0275 | ||||
| January 31, 2007 | March 30, 2007 | April 20, 2007 | $ | 0.04 | ||||
| April 17, 2007 | June 29, 2007 | July 20, 2007 | $ | 0.04 | ||||
| Fiscal 2006 | ||||||||
| August 16, 2005 | September 30, 2005 | October 20, 2005 | $ | 0.0275 | ||||
| October 18, 2005 | December 30, 2005 | January 20, 2006 | $ | 0.0275 | ||||
| January 12, 2006 | March 31, 2006 | April 20, 2006 | $ | 0.0275 | ||||
| April 18, 2006 | June 30, 2006 | July 20, 2006 | $ | 0.0275 | ||||
We expect quarterly dividends will continue to be paid in fiscal 2008. On August 15, 2007 our board of directors declared a dividend of $0.04 per share payable on October 19, 2007 to stockholders of record as of September 28, 2007. The payment of dividends in the future will be at the sole discretion of our board of directors and will depend on our profitability, financial condition, capital needs, future prospects, contractual restrictions, and other factors deemed relevant by our board of directors.
How many shares of common stock are authorized for issuance under our equity compensation plans?
The following table provides information regarding the number of shares of our common stock that may be issued on exercise of outstanding stock options or purchased by employees under our existing equity compensation plans as of June 30, 2007. These plans are:
1997 Employee Stock Option Plan
Nonqualified Formula Stock Option Plan for Non-Employee Directors
2002 Omnibus Plan
1995 Stock Deferral Plan for Non-Employee Directors
Stock Purchase Program
Nonqualified stock option agreements with certain nonemployee directors.
15
Table of Contents
| (A) | (B) | (C) | ||||||||||
| Number of Securities To Be | Number Of Securities Remaining Available | |||||||||||
| Issued upon Exercise Of | Weighted-Average Exercise | For Future Issuance Under Equity | ||||||||||
| Outstanding Options, Warrants | Price Of Outstanding | Compensation Plans (Excluding Securities | ||||||||||
| Plan Category | And Rights | Options, Warrants And Rights | Reflected In Column (A)) | |||||||||
| Equity Compensation Plans Approved by Stockholders | 629,019 | (1) | $ | 11.83 | (2) | 791,119 | (3) (5) | |||||
| Equity Compensation Plans Not Approved by Stockholders | 15,000 | (4) | $ | 6.09 | — | |||||||
| Total | 644,019 | $ | 11.69 | (2) | 791,119 | |||||||
| (1) | Includes options to purchase common stock: |
1997 Employee Stock Option Plan — 276,017 shares;
Nonqualified Formula Stock Option Plan for Non-Employee Directors — 57,617 shares;
2002 Omnibus Plan — 291,258 shares; and
1995 Stock Deferral Plan for Non-Employee Directors — 4,127 shares of common stock issuable upon settlement of phantom stock units.
Excludes up to 137,184 performance units which are not expected to vest, but would be payable in shares of our common stock following the end of the July 1, 2006 to June 30, 2009 performance cycle if we achieved 150% of the target return on noncash assets.
| (2) | Calculation of weighted-average exercise price does not include phantom stock units credited to participants’ accounts under the 1995 Stock Deferral Plan for Non-Employee Directors. | |
| (3) | Includes 24,248 shares of common stock issuable under the 1995 Stock Deferral Plan for Non-Employee Directors and 429,462 shares of common stock issuable under the 2002 Omnibus Plan, of which 137,184 shares would be issuable after June 30, 2009 for performance units if we achieve 150% of the target return on noncash assets. Upon adoption of the 2002 Omnibus Plan by our stockholders at our 2002 annual stockholders’ meeting, the number of shares authorized and reserved for issuance under our previously existing stock option plans were transferred to the 2002 Omnibus Plan and are presently authorized and reserved for issuance under that plan. All shares of common stock authorized and reserved for issuance on the exercise of outstanding stock options under our previous stock option plans and the 2002 Omnibus Plan will, on the cancellation or expiration of any such stock options, automatically be authorized and reserved for issuance under the 2002 Omnibus Plan. | |
| (4) | Options to purchase an aggregate of 15,000 shares of common stock under nonqualified stock option agreements for non-employee directors dated October 16, 2001 with Dr. James F. Gaertner (4,250), Gene Stallings (4,250), Roger R. Hemminghaus (2,500), and Colombe M. Nicholas (4,000). These options became fully vested six months after the grant date and expire on October 16, 2011. | |
| (5) | Includes 337,409 shares of common stock issuable under the Stock Purchase Program. The Stock Purchase Program is open to all full-time employees who have been employed at least six months, but less than one year, or who have been employed one year or more and are contributing to the Tandy Brands Accessories, Inc. Employees Investment Plan. Under the Stock Purchase Program participants may contribute 5% or 10% of their earnings and we match 25% or 50% of each participant’s contribution depending on their length of employment or other considerations. The Stock Purchase Program purchases treasury stock, if available, or unissued common stock directly from the Company at monthly average market prices. The participant’s shares are fully vested upon purchase and the participant may withdraw from the Stock Purchase Program at any time. The shares purchased under the Stock Purchase Program are distributed to participants annually. |
16
Table of Contents
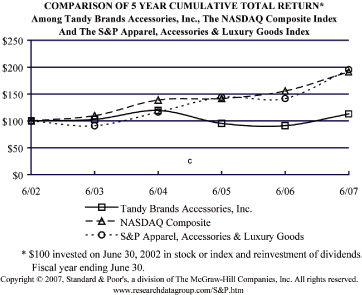
How did our common stock perform compared to certain indexes?
The line graph below compares the yearly percentage change in the cumulative total stockholder return on our common stock. The graph assumes reinvestment of dividends, if any, and the cumulative total return of The Nasdaq Stock Market (U.S.) Index and the S&P Apparel, Accessories & Luxury Goods Index for the period from June 30, 2002 through June 30, 2007. The returns shown on the graph are not necessarily indicative of future performance.
Did the company repurchase any shares of common stock during the fourth quarter of fiscal 2007?
The following table provides information about repurchases of shares of common stock made by us during the quarter ended June 30, 2007. The shares were purchased in the open market and are held in a rabbi trust established under our Benefit Restoration Plan.
| Total Number Of | Maximum Number | |||||||||||||||
| Total | Shares Purchased | Of Shares That May | ||||||||||||||
| Number | Average | As Part Of Publicly | Yet Be Purchased As | |||||||||||||
| Of Shares | Price Paid | Announced Plans | Part Of The Plans | |||||||||||||
| Period | Purchased | Per Share | Or Programs | Or Programs | ||||||||||||
| April 1, 2007 to April 30, 2007 | 249 | $ | 12.75 | N/A | N/A | |||||||||||
| May 1, 2007 to May 31, 2007 | 469 | $ | 12.19 | N/A | N/A | |||||||||||
| Total | 718 | $ | 12.38 | N/A | N/A | |||||||||||
17
Table of Contents
ITEM 6 — SELECTED FINANCIAL DATA
Selected Financial Data
(in thousands except per share amounts)
(in thousands except per share amounts)
| Year Ended June 30 | ||||||||||||||||||||
| 2007 | 2006(1) | 2005 | 2004 | 2003(2) | ||||||||||||||||
| Net sales | $ | 195,809 | $ | 227,323 | $ | 221,232 | $ | 215,420 | $ | 224,487 | ||||||||||
| Gross margin | 69,854 | 68,871 | 81,233 | 75,285 | 78,088 | |||||||||||||||
| Operating income (loss) | 3,935 | (2,405 | ) | 7,386 | 13,711 | 15,371 | ||||||||||||||
| Interest expense | 1,226 | 2,057 | 1,222 | 2,357 | 2,833 | |||||||||||||||
| Net income (loss) | 1,934 | (3,462 | ) | 3,987 | 6,952 | 7,011 | ||||||||||||||
| Earnings (loss) per common share | 0.29 | (0.52 | ) | 0.63 | 1.12 | 1.18 | ||||||||||||||
| Earnings (loss) per common share assuming dilution | 0.28 | (0.52 | ) | 0.61 | 1.09 | 1.16 | ||||||||||||||
| Cash dividends declared per common share | 0.135 | 0.11 | 0.11 | 0.10 | — | |||||||||||||||
| Working capital | 77,727 | 86,530 | 86,625 | 80,684 | 88,416 | |||||||||||||||
| Total assets | 140,663 | 138,944 | 150,762 | 134,623 | 147,120 | |||||||||||||||
| Notes Payable | 6,069 | 14,000 | 16,055 | 10,000 | 30,000 | |||||||||||||||
| Stockholders’ equity | 107,907 | 104,839 | 105,430 | 98,948 | 89,188 | |||||||||||||||
| (1) | Information about discontinued product line inventory, associated packaging costs, severance payments and a goodwill impairment charge, and their impact on fiscal 2006, is incorporated herein by reference to Notes 4 and 5 of the notes to consolidated financial statements included in Item 8 of this Annual Report | |
| (2) | Fiscal 2003 net income was reduced $581,000, or $0.10 per share, by the cumulative effect of the accounting change from adopting Statement of Financial Accounting Standards No. 142, “Goodwill and Other Intangible Assets.” |
ITEM 7 — MANAGEMENT’S DISCUSSION AND ANALYSIS OF FINANCIAL CONDITION AND RESULTS OF OPERATION
This Item 7 should be read in the context of the information included elsewhere in this Annual Report including our consolidated financial statements and accompanying notes in Item 8 of this Annual Report.
Overview
Our Company and our corresponding customer relationships are organized along men’s and women’s product lines. As a result we have two reportable segments: (1) men’s accessories, consisting of belts, wallets, gift accessories, small leather accessories, neckwear, and sporting goods; and, (2) women’s accessories, consisting of belts, wallets, handbags, and gift accessories. In fiscal 2006 it was concluded the women’s segment would focus on our core competencies of women’s and children’s belts, small leather goods, handbags, and gift accessories. All other product categories in the women’s segment, including socks, cold weather accessories, fashion scarves, evening bags, and children’s accessories (excluding belts), were discontinued.
18
Table of Contents
The table below presents sales and gross margin data for our reportable segments (in thousands of dollars). Other financial information about our segments is incorporated herein by reference to Note 12 of the notes to consolidated financial statements included in Item 8 of this Annual Report.
| Increase | Increase | |||||||||||||||||||
| 2007 | (Decrease) | 2006 | (Decrease) | 2005 | ||||||||||||||||
| Net sales: | ||||||||||||||||||||
| Men’s accessories | $ | 140,072 | 1.1 | % | $ | 138,515 | 2.9 | % | $ | 134,584 | ||||||||||
| Women’s accessories | 55,737 | (37.2 | ) | 88,808 | 2.5 | 86,648 | ||||||||||||||
| $ | 195,809 | (13.9 | ) | $ | 227,323 | 2.8 | $ | 221,232 | ||||||||||||
| Gross margin: | ||||||||||||||||||||
| Men’s accessories | $ | 50,835 | (0.6 | )% | $ | 51,157 | (5.2 | )% | $ | 53,941 | ||||||||||
| Women’s accessories | 19,019 | 7.4 | 17,714 | (35.1 | ) | 27,292 | ||||||||||||||
| $ | 69,854 | 1.4 | $ | 68,871 | (15.2 | ) | $ | 81,233 | ||||||||||||
| Gross margin percent of sales: | ||||||||||||||||||||
| Men’s accessories | 36.3 | % | 36.9 | % | 40.1 | % | ||||||||||||||
| Women’s accessories | 34.1 | 19.9 | 31.5 | |||||||||||||||||
| Total | 35.7 | 30.3 | 36.7 | |||||||||||||||||
Our sales are generally affected by changes in demand for our product categories (volume) as well as customer allowances and returns. Sales volume also can impact our gross margins in terms of product mix between mass merchant retailers, which typically sell product at lower price points than department stores, and specialty retailers. The components of our cost of goods sold and selling, general and administrative expense (“SG&A”) are described in Note 2 of the notes to consolidated financial statements included in Item 8 of this Annual Report and incorporated herein by reference. We include the costs related to our distribution network in SG&A while others may include all or a portion of such costs in their cost of goods sold. Consequently, our gross margins may not be comparable to others.
The following table presents product line net sales by each of our segments (in thousands of dollars).
| Men’s | Women’s | Total | ||||||||||||||||||||||||||
| 2007 | ||||||||||||||||||||||||||||
| Belts | $ | 90,605 | 64.7 | % | $ | 27,399 | 49.2 | % | $ | 118,004 | 60.3 | % | ||||||||||||||||
| Small leather goods | 17,473 | 12.5 | 22,608 | 40.6 | 40,081 | 20.5 | ||||||||||||||||||||||
| Gift accessories | 19,664 | 14.0 | 825 | 1.5 | 20,489 | 10.4 | ||||||||||||||||||||||
| Handbags | — | — | 3,087 | 5.5 | 3,087 | 1.6 | ||||||||||||||||||||||
| Other products | 12,330 | 8.8 | 1,818 | 3.2 | 14,148 | 7.2 | ||||||||||||||||||||||
| $ | 140,072 | $ | 55,737 | $ | 195,809 | |||||||||||||||||||||||
| 2006 | ||||||||||||||||||||||||||||
| Belts | $ | 88,879 | 64.2 | % | $ | 32,350 | 36.4 | % | $ | 121,229 | 53.3 | % | ||||||||||||||||
| Small leather goods | 18,500 | 13.4 | 22,502 | 25.4 | 41,002 | 18.0 | ||||||||||||||||||||||
| Gift accessories | 17,903 | 12.9 | — | — | 17,903 | 7.9 | ||||||||||||||||||||||
| Socks | — | — | 13,981 | 15.7 | 13,981 | 6.1 | ||||||||||||||||||||||
| Cold weather goods | — | — | 8,380 | 9.5 | 8,380 | 3.7 | ||||||||||||||||||||||
| Handbags and hats | — | — | 8,114 | 9.1 | 8,114 | 3.6 | ||||||||||||||||||||||
| Other products | 13,233 | 9.5 | 3,481 | 3.9 | 16,714 | 7.4 | ||||||||||||||||||||||
| $ | 138,515 | $ | 88,808 | $ | 227,323 | |||||||||||||||||||||||
| 2005 | ||||||||||||||||||||||||||||
| Belts | $ | 91,401 | 67.9 | % | $ | 27,682 | 32.0 | % | $ | 119,083 | 53.8 | % | ||||||||||||||||
| Small leather goods | 17,408 | 12.9 | 24,329 | 28.1 | 41,737 | 18.9 | ||||||||||||||||||||||
| Gift accessories | 13,655 | 10.2 | — | — | 13,655 | 6.2 | ||||||||||||||||||||||
| Socks | — | — | 12,077 | 13.9 | 12,077 | 5.5 | ||||||||||||||||||||||
| Cold weather goods | — | — | 6,441 | 7.4 | 6,441 | 2.8 | ||||||||||||||||||||||
| Handbags and hats | — | — | 10,561 | 12.2 | 10,561 | 4.8 | ||||||||||||||||||||||
| Other products | 12,120 | 9.0 | 5,558 | 6.4 | 17,678 | 8.0 | ||||||||||||||||||||||
| $ | 134,584 | $ | 86,648 | $ | 221,232 | |||||||||||||||||||||||
19
Table of Contents
The following table presents our segments’ selling, general and administrative, and depreciation and amortization expenses, and our interest expense (in thousands of dollars).
| Increase | Increase | |||||||||||||||||||
| 2007 | (Decrease) | 2006 | (Decrease) | 2005 | ||||||||||||||||
| Selling, general and administrative expense: | ||||||||||||||||||||
| Men’s accessories | $ | 42,293 | 5.6 | % | $ | 40,037 | 0.4 | % | $ | 39,866 | ||||||||||
| Women’s accessories | 18,911 | (24.9 | ) | 25,183 | (10.4 | ) | 28,109 | |||||||||||||
| $ | 61,204 | (6.2 | ) | $ | 65,220 | (4.1 | ) | $ | 67,975 | |||||||||||
| Depreciation and amortization: | ||||||||||||||||||||
| Men’s accessories | $ | 3,237 | (0.5 | )% | $ | 3,253 | 5.9 | % | $ | 3,073 | ||||||||||
| Women’s accessories | 1,478 | (20.8 | ) | 1,865 | (4.5 | ) | 1,952 | |||||||||||||
| $ | 4,715 | (7.9 | ) | $ | 5,118 | 1.9 | $ | 5,025 | ||||||||||||
| Interest expense | $ | 1,226 | (40.4 | )% | $ | 2,057 | 68.3 | % | $ | 1,222 | ||||||||||
Challenges And Opportunities
In fiscal 2007 we improved our overall efficiency and profitability with higher profit margins and lower SG&A expenses, particularly in our women’s accessories segment as the result of restructuring its operations in fiscal 2006. We continued to seek higher end products and new distribution channels which we expect will enhance future operating results and entered into license agreements for Geno D’Lucca™ belts, small leather goods, and sandals and The Goodyear Tire & Rubber Company gift line. In addition, we will be distributing the Eileen West™ women’s handbags, personal leather goods, and belts beginning in the fall of 2007.
A slowdown in replenishment orders from one of our largest customers impacted our fourth quarter results and will continue to affect our results in the near-term. Unfortunately we have no direct control of this issue. Our assessment of the situation is that the customer’s initiative is impacting other apparel and accessories categories and is not unique to us. We are confident our relationship with the customer continues to be strong, and once its inventory levels are adjusted, we believe we are poised to resume improved profitability.
In the fourth quarter we also experienced an unexpected return of some holiday gift merchandise which typically would have occurred earlier in the fiscal year as some of our retailers opted to continue to sell this merchandise through the spring and returned unsold product during the fourth quarter. We have taken the necessary steps to prevent this from happening in the future and we are adjusting initial shipments to certain retailers based on our sell-through analysis to minimize returns in the future.
The conversion of our men’s accessories segment operations in Yoakum, Texas to a receiving and distribution facility following the cessation of belt manufacturing on June 30, 2007 will result in a significant change in the way we conduct an important part of our business. We have had an excellent long-term relationship with the China-based company which is taking over our leather belt manufacturing, but it will be increasingly important to maintain our relationship and deal with longer production-to-delivery lead times.
On August 22, 2007 we announced our board of directors has undertaken an evaluation of a full range of strategic alternatives available to the Company for increasing stockholder value. These alternatives could include, among other things, adding new licenses, acquisitions, stock buybacks, increased dividends, going private, and selling the Company. We have retained Financo, Inc., an investment banking firm specializing in the apparel and accessories sector, to assist with the assessment process. There is no assurance as to what the outcome of the process may be and we do not intend to disclose developments until a specific course of action has been approved by our board of directors.
2007 COMPARED TO 2006
Net Sales And Gross Margins
Our fiscal 2007 net sales, compared to fiscal 2006, were 13.9% lower as the prior year included $22.4 million of sales of products by our women’s accessories segment which were discontinued as part of restructuring its operations. Belt sales were a greater percentage of our total net sales in fiscal 2007 even though holiday sales were slightly softer, as had been expected, and one of our largest customers curtailed replenishment orders in the fourth quarter.
Our fiscal 2007 net sales, compared to fiscal 2006, were 13.9% lower as the prior year included $22.4 million of sales of products by our women’s accessories segment which were discontinued as part of restructuring its operations. Belt sales were a greater percentage of our total net sales in fiscal 2007 even though holiday sales were slightly softer, as had been expected, and one of our largest customers curtailed replenishment orders in the fourth quarter.
20
Table of Contents
Fiscal 2007 net sales by our men’s accessories segment improved 1.1% over fiscal 2006 on increased sales of gift accessories ($1.8 million) and belts ($1.7 million). However, the segment’s small leather goods holiday sales were lower resulting in annual sales being $1.0 million below the fiscal 2006 level. In addition to the $22.4 million for discontinued products in fiscal 2006, belt and handbag sales by the women’s accessories segment were each almost $5 million lower in fiscal 2007 as the result of competitive market pressures related to the allocation of retail space to accessories and continued weakening of women’s fashion accessory trends.
Our overall gross margin for fiscal 2007 was 35.7% of net sales compared to 30.3% in 2006, which was negatively impacted by approximately 3 percentage points attributable to the women’s segment provision for discontinued product line inventory in fiscal 2006. The margins for our men’s accessories segment products, other than gift accessories, were slightly lower this year due to market pressures and more direct shipment sales. Compared to the margin for products other than those which were discontinued, the women’s accessories segment fiscal 2007 gross margin improved as the result of fewer sales of lower margin handbags and the fiscal 2006 gross margin was 3.8 percentage points lower from the effects of mass merchant sales at lower than normal margins in order to reduce excess inventory.
Direct shipments have lower gross margins because these goods are shipped from our suppliers to our customers and are not handled in our distribution centers, thereby reducing the general and administrative costs related to the sales. Any material changes in sales mix, such as higher mass merchant accessory sales or direct shipments, could lower our gross margin percentages during a particular season.
Operating Expenses
Fiscal 2007 SG&A expenses totaling $61.2 million, including $762,000 related to transitioning our Yoakum, Texas manufacturing operations to overseas partners and other severance costs, were $4.0 million less than fiscal 2006 due to consolidation of the women’s segment mass merchant and department store businesses and discontinuing product lines. Payroll costs, including the $762,000 and approximately $200,000 in fiscal 2006 related to restructuring our women’s accessories segment, were $1,740,000 lower while contract labor costs in our distribution centers increased $876,000. Other distribution costs were reduced $1,986,000 from the fiscal 2006 level. The $2,256,000 increase in our men’s accessories segment SG&A expenses was primarily attributable to increased distribution costs ($1,087,000), manufacturing transition costs, and technology support ($630,000) which were partly offset by lower product development expenses ($516,000). Lower payroll ($2,261,000), distribution ($2,197,000), travel ($391,000), product sample ($290,000), and rent ($274,000) costs were the main contributors to the $6,272,000 reduction in the women’s accessories segment fiscal 2007 SG&A expenses.
The fiscal 2007 compensation for our executive officers and directors did not increase as, based on the Company’s 2006 financial performance, our board of directors determined that (1) the salaries for fiscal 2007 for our President and Chief Executive Officer, Chief Financial Officer, and Vice President of Operations would remain at the levels established for fiscal 2006, (2) equity compensation awards would not be granted to such officers and no bonuses would be paid to our executive officers for fiscal 2006, and (3) the nonemployee directors would not be granted equity awards.
Interest expense for fiscal 2007 was $831,000 lower than the expense for fiscal 2006 due to lower average amounts borrowed ($10.4 million in fiscal 2007 vs. $25.3 million in fiscal 2006) even though average interest rates were higher (7.04% in fiscal 2007 vs. 5.98% in fiscal 2006). Royalty and other income for fiscal 2007 includes a $440,000 gain from the sale of the rights to use one of our trademarks within the Republic of Mexico.
Our fiscal 2007 effective income tax rate was 40.7% compared to the 34% federal statutory rate. The higher rate is attributable to state income taxes and expense deduction limitations which, net of federal tax benefit accounted for 3.8% and 2.9% of the difference, respectively. The differences between the federal statutory rate and the 19% tax benefit last year are described in the following comparison of fiscal 2006 to 2005.
Summary
While we had lower net sales in fiscal 2007, primarily due to the decision in fiscal 2006 to discontinue a number of our women’s accessories segment products, gross margins improved, SG&A expenses were reduced, and interest expense was lower. For the year, we had net income of $1.9 million, or $0.28 per diluted share, compared to a net loss of $3.5 million, or $0.52 per share, in fiscal 2006.
21
Table of Contents
2006 COMPARED TO 2005
Restructuring
In fiscal 2006 we took a hard look at how to improve overall efficiency and profitability, particularly in our women’s accessories segment, as the retail environment continued to change with increased competition, higher energy costs, and department store consolidations. We evaluated the level of contribution from each of our women’s product lines in order to improve operating performance and decided to exit from several women’s categories that were no longer profitable. It was concluded the women’s segment would focus on our core competencies of women’s and children’s belts, small leather goods, handbags, and gift accessories. All other product categories in the women’s segment, including socks, cold weather accessories, fashion scarves, evening bags, and children’s accessories (excluding belts), were discontinued. A $6.9 million provision was recorded in the quarter ended March 31, 2006 to write down inventory and packaging to our best estimate of the market value that we expected to realize and 33 positions in our women’s Dallas distribution facility were eliminated in the discontinued product areas resulting in one-time payroll costs of approximately $200,000 in the third quarter.
Net Sales And Gross Margins
The fiscal 2006 net sales of our men’s and women’s accessories segments increased 2.9% and 2.5%, respectively, over fiscal 2005’s level resulting in $6.1 million of consolidated sales, or 2.8%, more than fiscal 2005. For the men’s accessories segment, fiscal 2006 belt sales, which had increased significantly in the prior two years, were slightly less than the prior year. Most of the belt sales decline was offset by increased sales of small leather goods and other products, including men’s neckwear. Some of the expected growth in men’s accessories did not materialize because of a major customer’s decision to reduce its company-wide inventories. The ETON® gift accessories business sales increased by $4.2 million in fiscal 2006. Sales were dampened for our women’s accessories segment by competitive market pressures and weakened fashion accessory trends. While belt sales were up 16.9%, or $4.7 million, the gain was partly offset by the decline in sales of other products. Overall the women’s accessories segment sales gain for the year was derived from products which have been discontinued as we focused on products having higher profit margins.
Our overall gross margin for fiscal 2006 was 30.3% of net sales compared to 36.7% in 2005. Approximately 3 percentage points of this decline were attributable to the impact of the women’s segment provision for discontinued product line inventory and approximately 3.4 percentage points of the decline were attributable to product mix. The men’s accessories segment gross margin was off 3.2 percentage points as the result of more direct shipments of small leather goods which typically have lower margins as well as a $1.1 million inventory mark down provision in the fourth quarter. The women’s segment gross margin, excluding the effect of the discontinued inventory provision, was 3.8 percentage points lower from the effects of mass merchant sales at lower than normal margins in order to reduce excess inventory.
Operating Expenses
Fiscal 2006 SG&A expenses were $65.2 million compared to $68.0 million in 2005. The fiscal 2006 expenses were increased by share-based compensation of $470,000 due to our adoption of SFAS No. 123R on July 1, 2005 and payroll and inventory relocation expenses of $400,000 related to the restructuring of our women’s segment. The overall lower SG&A expenses were derived from reduced costs in our women’s segment due to consolidation of its mass merchant and department store businesses, as well as reductions in legal ($1,248,000), advertising ($599,000), and travel ($451,000) expenses. SG&A expenses for our men’s segment increased $171,000 as increases in distribution costs ($1,629,000), including a greater percentage of shared distribution center expenses, product development ($531,000), and royalties ($334,000) offset reductions in payroll ($773,000), advertising ($295,000), and other costs.
Depreciation expense in our men’s accessories segment increased primarily as a result of property and equipment additions at our Yoakum, Texas facility (see the following “Liquidity and Capital Resources” discussion) while the women’s accessories segment depreciation declined because of asset retirements.
The $938,000 goodwill impairment charge in fiscal 2006 was the result of assessing the fair value of our women’s accessories segment because of changing business conditions for women’s mass market merchant sales.
22
Table of Contents
Interest expense in fiscal 2006 was $835,000 more than fiscal 2005’s expense primarily due to our credit facility’s increasing interest rates, which ranged from 4.52% to 7.35% in fiscal 2006 compared to the range of 2.93% to 4.46% in fiscal 2005, and additional loan fees in connection with amendments to our credit facility effective September 30, 2005 adjusting certain financial covenant requirements and effective March 31, 2006, among other things, increasing applicable margins for LIBOR-based borrowings and amending the definitions of EBITDA and fixed charges.
The primary differences between the 34% federal statutory tax rate and the 19% benefit from the fiscal 2006 pretax loss are: 7.5% for the goodwill impairment charge that is not deductible for income tax purposes and 5.2% for state income taxes based on subsidiaries’ earnings that are not offset by losses incurred in the women’s accessories segment. The impaired goodwill arose from the stock purchase of Accessory Design Group in April 1992.
Summary
In fiscal 2006 the benefits of increased sales and reduced selling, general and administrative expenses were offset by the $7.3 million ($0.68 per share) charge related to our women’s segment discontinued product lines, associated packaging costs, and severance payments, and the $938,000 ($0.14 per share) goodwill impairment. The net loss for fiscal 2006 was $3.5 million, or $0.52 per share, compared to net income of $4.0 million, or $0.61 per diluted share, in fiscal 2005.
LIQUIDITY AND CAPITAL RESOURCES
Our operating activities provided cash of $9.1 million in fiscal 2007 and $6.2 million in 2006. Contributing to the positive cash flow this year were the receipt of an income tax refund ($2.4 million) and liquidation of a short-term investment ($1.1 million) included in other current assets at June 30, 2006. Accounts payable increased $6.9 million in fiscal 2007 and were $4.4 million lower in fiscal 2006 compared to 2005 due to the timing of inventory purchases for fall and the holiday season. Increases in accounts receivable and inventories used $6.6 million of our cash provided by operations in fiscal 2007 while a $4.1 million accounts receivable decrease contributed to our fiscal 2006 positive cash flow.
The income tax benefits from restricted stock vesting and stock option exercises exceeding the tax benefits of recognized share-based compensation expense are included in our statement of cash flows as a financing activity for 2007 ($30,000) and 2006 ($71,000) and operating activities for fiscal 2005 ($216,000) as the result of adopting SFAS No. 123R on July 1, 2005.
Fiscal 2007 capital expenditures of $2.2 million for property and equipment were primarily in support of inventory management, other computer related functions, and sales office remodeling. Our fiscal 2006 capital expenditures for property and equipment totaling almost $3 million were primarily for computer equipment and software, including the implementation of an additional software module for our enterprise software and additions to the distribution system in our Yoakum, Texas facility. In 2006 we also expended $227,000 for additional warehouse racking and forklifts needed to reconfigure our distribution facilities as part of the restructuring of our product lines. In fiscal 2005 the $3.5 million spent on property and equipment additions was for new distribution software and related computer hardware in Yoakum. Other capital expenditures that year were related to leasehold improvements in our corporate offices.
The property and equipment expenditures in fiscal 2007 were partly offset by $500,000 in proceeds from selling the rights to use one of our trademarks within the Republic of Mexico. In fiscal 2005 investing activities included $10 million for the purchase of Superior Merchandise Company described in Note 3 of the notes to consolidated financial statements included in Item 8 of this Annual Report.
Our primary sources of liquidity are cash flows from operating activities and our credit facility which we believe will provide adequate financial resources for our future working capital needs. Information about the credit facility is incorporated herein by reference to Note 6 of the notes to consolidated financial statements included in Item 8 of this Annual Report. The maximum amount borrowed under the credit facility in fiscal 2007 was $24 million in October 2006. The $9.1 million of positive operating cash flows allowed us to reduce our year end notes payable balance by $7.9 million in fiscal 2007. Financing activities provided an additional $1.4 million from the sale of common stock to employees through our stock purchase program and the exercise of stock options.
23
Table of Contents
We increased our quarterly dividend rate 45.5% beginning with the fiscal 2007 fourth quarter payment and, for the year, we paid a total of $838,000 in dividends.
We were in compliance with all the covenants of our credit facility during fiscal 2007. As our borrowings increase for the procurement of fall and holiday season inventory, it may be necessary to request a waiver or amendment for certain of those covenants as of the end of fiscal 2008’s first quarter due to tightened liquidity resulting from the 2007 fourth quarter curtailment of replenishment orders by one of our largest customers which continued in the first part of fiscal 2008.
OFF-BALANCE SHEET ARRANGEMENTS
We do not have any off-balance sheet arrangements.
CONTRACTUAL OBLIGATIONS
Our significant contractual cash obligations that existed as of June 30, 2007 (based on information appearing in the notes to our consolidated financial statements included in Item 8 of this Annual Report), except for purchase obligations, for the periods indicated were (in thousands):
| Less Than | More Than | |||||||||||||||||||
| Total | 1 Year | 1-3 Years | 3-5 Years | 5 Years | ||||||||||||||||
Notes payable(1) | $ | 6,069 | $ | — | $ | 6,069 | $ | — | $ | — | ||||||||||
Operating leases(2) | 6,840 | 2,191 | 3,347 | 1,051 | 251 | |||||||||||||||
License royalties(2) | 3,500 | 1,465 | 1,445 | 468 | 122 | |||||||||||||||
Supplemental executive retirement obligation(3) | 1,587 | — | — | — | 1,587 | |||||||||||||||
Purchase obligations(4) | 32,300 | 32,300 | — | — | — | |||||||||||||||
| $ | 50,296 | $ | 35,956 | $ | 10,861 | $ | 1,519 | $ | 1,960 | |||||||||||
| (1) | Consolidated financial statement Note 6 describes our credit facility. Interest is expensed and paid monthly and is not included in the obligation. Our interest rate at June 30, 2007 was 6.45%. | |
| (2) | Consolidated financial statement Note 7 describes our lease and license agreements. | |
| (3) | Consolidated financial statement Note 11 describes the supplemental executive retirement obligation. | |
| (4) | Purchase orders entered into in the ordinary course of business which may be cancelled without penalty, including $3.3 million of outstanding letters of credit in conjunction with purchase commitments which typically mature in two to six months. |
CRITICAL ACCOUNTING POLICIES
We consider an accounting estimate to be critical if: (1) the estimate requires us to make assumptions about matters that are highly uncertain at the time the estimate is made or (2) changes in the estimate are reasonably likely to occur from period to period, or use of different estimates that we reasonably could have used in the current period, would have a material impact on our financial condition or results of operations. We have discussed the development and selection of these critical accounting estimates with the Audit Committee of our board of directors. In addition there are other items within our financial statements that require estimation, but are not deemed critical as defined above. Changes in estimates could have a material impact on our operations and financial position.
We use estimates throughout our consolidated financial statements. The accounting policies and estimates we consider most critical, and a basic sensitivity analysis as to how each relate to our financial statements, are presented below.
Revenues And Accounts Receivable Allowances
We recognize revenue when merchandise is shipped and title to the goods has passed to the customer. We record allowances, including cash discounts, in-store customer allowances, cooperative advertising allowances, and customer returns, as a reduction of sales based upon historical experience, current trends in the retail industry, and
24
Table of Contents
individual customer and product experience. Actual returns and allowances may differ from our estimates and differences would affect the operating results of subsequent periods.
Sensitivity Analysis The following table presents the estimated effect of the indicated increase (decrease) in our sales, based on fiscal 2007 net sales of $195.8 million, on our allowance for doubtful accounts (in thousands except per share amounts). Changes in general economic conditions, trends and developments within our industry, or situations unique to specific customers could result in significant fluctuations in the actual effects of these estimates.
| Sales | Allowances | Earnings | ||||||
| Change | Reserves | Expense | Per Share | |||||
| Change in customer allowances and returns | +/- 0.5% | $979/$(979) | $979/$(979) | $(0.09)/$0.09 | ||||
| Change in allowance for doubtful accounts | +/-0.125 | 245/ (245) | 245/ (245) | (0.02)/ 0.02 |
Inventories
Our inventories are stated at the lower of cost (principally standard cost which approximates actual cost on a first-in, first-out basis) or market. Cost includes materials, direct and indirect labor, and factory overhead. Market, with respect to raw materials, is replacement cost and, with respect to work-in-process and finished goods, is net realizable value. In our assessment of the value of inventory, we monitor the accumulation of excess inventory at the end of each season. Our assessment is both a quantitative measurement (e.g., the use of metrics such as the number of months supply on hand) and qualitative measurement (e.g., the ability to utilize certain styles in current and future programs). In general we have relationships with off-price store customers that will purchase excess inventory at discounted prices and we have been able to realize values above cost. If circumstances arise in which the market value of items in inventory declines below cost, an inventory markdown would be estimated and charged to expense in the period identified. If we incorrectly anticipate these trends or unexpected events occur, our results of operations could be materially affected. We closely monitor fashion trend items and anticipate additional inventory markdowns if market indications in fashion trends justify further reserves. Historically such inventory markdowns have generally been within our expectations.
Sensitivity Analysis The effect of a 1% write down in the value of our June 30, 2007 inventory would be (in thousands except per share amounts):
| Percentage | Earnings | |||||||||||||||
| Of Inventory | Inventory | Expense | Per Share | |||||||||||||
| Change in inventory markdown | -1 | % | $ | (644 | ) | $ | 644 | $ | (0.06 | ) | ||||||
Goodwill
Goodwill impairment is measured annually as of June 30, and when events and circumstances indicate goodwill may not be recoverable, by comparing the fair value of a reporting unit that has goodwill to the unit’s carrying value. Goodwill is allocated to reporting unit groups within each of our business segments which focus on the design, procurement, and marketing of related products. We estimate the fair value of a reporting unit using a discounted cash flow analysis. If the fair value is determined to be less than the carrying value, the amount of goodwill impairment, if any, is computed by allocating the fair value of the reporting unit to its assets other than goodwill. The excess of the fair value of the reporting unit over the amounts allocated to the assets other than the goodwill is considered the implied fair value of the goodwill. The goodwill’s implied fair value is compared to its carrying value and any shortfall represents the impairment amount.
We continually evaluate whether events and circumstances have occurred that indicate the remaining balance of goodwill may not be recoverable. In evaluating impairment, we estimate the future cash flows expected to be derived from our goodwill. Such evaluations are significantly impacted by estimates of future revenues, costs and expenses, and other factors. A significant change in future cash flows or the cost of capital could result in a goodwill impairment.
Share-Based Compensation
When adopting Statement of Financial Accounting Standards No. 123 (revised 2004), “Share-Based Payment,” (“SFAS No. 123R”) effective July 1, 2005, we selected the “modified prospective” method instead of restating prior years’ balance sheets and statements of operations and cash flows as required by the “modified retrospective” method based on amounts previously recognized in the pro forma disclosures under SFAS No. 123. The fair values of restricted stock and performance unit grants are estimated to be the market price of our common stock on the grant dates and, for performance units, reduced by the present value of estimated future dividends. The assumptions
25
Table of Contents
we use to estimate the fair value of our stock options are based on historical information and current economic conditions. Our estimated fair values would be greater if the expected dividend yield was decreased and the other assumptions were increased. Neither the grant-date market values of our stock nor the resulting output of the Black-Scholes option-pricing model using our assumptions may be the value ultimately realized by our directors and employees or accurately measure the tax benefits the Company may realize.
IMPACT OF RECENTLY ISSUED ACCOUNTING STANDARDS
The information in Note 2 of the notes to consolidated financial statements included in Item 8 of this Annual Report is incorporated herein by reference.
INFLATION
Although our operations are affected by general economic trends, we do not believe that inflation has had a material effect on our operating results during the past three fiscal years.
ITEM 7A — QUANTITATIVE AND QUALITATIVE DISCLOSURES ABOUT MARKET RISK
We are subject to interest rate risk on our notes payable. The effect of a 1% increase or decrease in the interest rate on the amount outstanding at of June 30, 2007 could lower or increase our annual pretax operating results by $61,000. We do not expect the potential impact of market conditions on the fair value of our indebtedness to be material.
In addition to interest rate risk on our notes payable, we also are exposed to market risk with respect to changes in the global price level of certain commodities used in the production of our products. We purchase a substantial amount of leather items from third-party suppliers. An unanticipated material increase in the market price of leather could increase the cost of these products to us and, therefore, have a negative effect on our operating results.
Market risk related to foreign currency historically has not been material since generally we have negotiated and settled agreements for the products we purchase in U.S. dollars.
26
Table of Contents
ITEM 8 — FINANCIAL STATEMENTS AND SUPPLEMENTARY DATA
REPORT OF INDEPENDENT REGISTERED PUBLIC ACCOUNTING FIRM
To the Board of Directors and Stockholders of Tandy Brands Accessories, Inc.
We have audited the accompanying consolidated balance sheets of Tandy Brands Accessories, Inc. and subsidiaries as of June 30, 2007 and 2006, and the related consolidated statements of operations, cash flows, and stockholders’ equity for each of the three years in the period ended June 30, 2007. These financial statements are the responsibility of the Company’s management. Our responsibility is to express an opinion on these financial statements based on our audits.
We conducted our audits in accordance with the standards of the Public Company Accounting Oversight Board (United States). Those standards require that we plan and perform the audit to obtain reasonable assurance about whether the financial statements are free of material misstatement. We were not engaged to perform an audit of the Company’s internal control over financial reporting. Our audits included consideration of internal control over financial reporting as a basis for designing audit procedures that are appropriate in the circumstances, but not for the purpose of expressing an opinion on the effectiveness of the Company’s internal control over financial reporting. Accordingly, we express no such opinion. An audit includes examining, on a test basis, evidence supporting the amounts and disclosures in the financial statements, assessing the accounting principles used and significant estimates made by management, and evaluating the overall financial statement presentation. We believe that our audits provide a reasonable basis for our opinion.
In our opinion, the financial statements referred to above present fairly, in all material respects, the consolidated financial position of Tandy Brands Accessories, Inc. and subsidiaries at June 30, 2007 and 2006, and the consolidated results of their operations and their cash flows for each of the three years in the period ended June 30, 2007, in conformity with U.S. generally accepted accounting principles.
As described in Note 2 to the consolidated financial statements, effective July 1, 2005 the Company adopted Statement of Financial Accounting Standards No. 123 (revised 2004), “Share-Based Payment.”
/s/ Ernst & Young LLP
Fort Worth, Texas
September 18, 2007
September 18, 2007
27
Table of Contents
Tandy Brands Accessories, Inc. And Subsidiaries
Consolidated Balance Sheets
(in thousands of dollars)
Consolidated Balance Sheets
(in thousands of dollars)
| June 30 | ||||||||
| 2007 | 2006 | |||||||
Assets | ||||||||
| Current assets: | ||||||||
| Cash and cash equivalents | $ | 4,076 | $ | 4,182 | ||||
| Accounts receivable | 31,357 | 27,322 | ||||||
| Inventories | 64,372 | 61,770 | ||||||
| Deferred income taxes | 3,454 | 3,792 | ||||||
| Other current assets | 3,879 | 5,784 | ||||||
| Total current assets | 107,138 | 102,850 | ||||||
| Property and equipment | 10,548 | 12,430 | ||||||
| Other assets: | ||||||||
| Goodwill | 16,361 | 16,292 | ||||||
| Other intangibles | 4,882 | 5,653 | ||||||
| Other assets | 1,734 | 1,719 | ||||||
| Total other assets | 22,977 | 23,664 | ||||||
| $ | 140,663 | $ | 138,944 | |||||
Liabilities And Stockholders’ Equity | ||||||||
| Current liabilities: | ||||||||
| Accounts payable | $ | 16,903 | $ | 10,106 | ||||
| Accrued compensation | 2,420 | 2,583 | ||||||
| Accrued expenses | 4,019 | 3,631 | ||||||
| Notes payable | 6,069 | — | ||||||
| Total current liabilities | 29,411 | 16,320 | ||||||
| Other liabilities: | ||||||||
| Notes payable | — | 14,000 | ||||||
| Supplemental executive retirement obligation | 1,587 | 1,133 | ||||||
| Deferred income taxes | 389 | 1,640 | ||||||
| Other liabilities | 1,369 | 1,012 | ||||||
| Total other liabilities | 3,345 | 17,785 | ||||||
| Commitments | ||||||||
| Stockholders’ equity: | ||||||||
| Preferred stock, $1 par value, 1,000,000 shares authorized, none issued | — | — | ||||||
| Common stock, $1 par value, 10,000,000 shares authorized, 6,912,302 shares and 6,795,183 shares issued and outstanding | 6,912 | 6,795 | ||||||
| Additional paid-in capital | 33,616 | 31,911 | ||||||
| Retained earnings | 66,967 | 65,960 | ||||||
| Other comprehensive income | 1,326 | 988 | ||||||
| Shares held by Benefit Restoration Plan Trust | (914 | ) | (815 | ) | ||||
| Total stockholders’ equity | 107,907 | 104,839 | ||||||
| $ | 140,663 | $ | 138,944 | |||||
The accompanying notes are an integral part of these consolidated financial statements.
28
Table of Contents
Tandy Brands Accessories, Inc. And Subsidiaries
Consolidated Statements Of Operations
(in thousands except per share amounts)
Consolidated Statements Of Operations
(in thousands except per share amounts)
| Year Ended June 30 | ||||||||||||
| 2007 | 2006 | 2005 | ||||||||||
| Net sales | $ | 195,809 | $ | 227,323 | $ | 221,232 | ||||||
| Cost of goods sold | 125,955 | 151,552 | 139,999 | |||||||||
| Provision for discontinued product line inventory | — | 6,900 | — | |||||||||
| 125,955 | 158,452 | 139,999 | ||||||||||
| Gross margin | 69,854 | 68,871 | 81,233 | |||||||||
| Selling, general and administrative expenses | 61,204 | 65,220 | 67,975 | |||||||||
| Depreciation and amortization | 4,715 | 5,118 | 5,025 | |||||||||
| Goodwill impairment | — | 938 | 847 | |||||||||
| Total operating expenses | 65,919 | 71,276 | 73,847 | |||||||||
| Operating income (loss) | 3,935 | (2,405 | ) | 7,386 | ||||||||
| Interest expense | (1,226 | ) | (2,057 | ) | (1,222 | ) | ||||||
| Royalty and other income | 550 | 187 | 246 | |||||||||
| Income (loss) before income taxes | 3,259 | (4,275 | ) | 6,410 | ||||||||
| Income taxes (benefit) | 1,325 | (813 | ) | 2,423 | ||||||||
| Net income (loss) | $ | 1,934 | $ | (3,462 | ) | $ | 3,987 | |||||
| Earnings (loss) per common share | $ | 0.29 | $ | (0.52 | ) | $ | 0.63 | |||||
| Earnings (loss) per common share assuming dilution | $ | 0.28 | $ | (0.52 | ) | $ | 0.61 | |||||
| Cash dividends declared per common share | $ | 0.135 | $ | 0.11 | $ | 0.11 | ||||||
| Common shares outstanding | 6,720 | 6,598 | 6,349 | |||||||||
| Common shares outstanding assuming dilution | 6,891 | 6,598 | 6,588 | |||||||||
The accompanying notes are an integral part of these consolidated financial statements.
29
Table of Contents
Tandy Brands Accessories, Inc. And Subsidiaries
Consolidated Statements Of Cash Flows
(in thousands)
Consolidated Statements Of Cash Flows
(in thousands)
| Year Ended June 30 | ||||||||||||
| 2007 | 2006 | 2005 | ||||||||||
| Cash flows provided by operating activities: | ||||||||||||
| Net income (loss) | $ | 1,934 | $ | (3,462 | ) | $ | 3,987 | |||||
| Adjustments to reconcile net income (loss) to net cash provided by operating activities: | ||||||||||||
| Provision for discontinued product line inventory | — | 6,900 | — | |||||||||
| Depreciation and amortization | 4,879 | 5,295 | 5,190 | |||||||||
| Goodwill impairment | — | 938 | 847 | |||||||||
| Stock compensation expense | 447 | 860 | — | |||||||||
| Amortization of debt costs | 170 | 149 | 127 | |||||||||
| Excess income tax benefit from stock option exercises | (30 | ) | (71 | ) | 216 | |||||||
| Deferred income taxes | (913 | ) | (167 | ) | (1,930 | ) | ||||||
| Other | 289 | 286 | 229 | |||||||||
| Change in assets and liabilities: | ||||||||||||
| Accounts receivable | (4,035 | ) | 4,115 | 2,567 | ||||||||
| Inventories | (2,602 | ) | (689 | ) | (8,319 | ) | ||||||
| Other assets | 1,559 | (2,451 | ) | (1,476 | ) | |||||||
| Accounts payable | 6,946 | (4,426 | ) | 1,641 | ||||||||
| Accrued expenses | 457 | (1,060 | ) | 1,477 | ||||||||
| Net cash provided by operating activities | 9,101 | 6,217 | 4,556 | |||||||||
| Cash flows used for investing activities: | ||||||||||||
| Purchases of property and equipment | (2,204 | ) | (2,972 | ) | (3,513 | ) | ||||||
| Proceeds from trademark sale | 500 | — | — | |||||||||
| Purchase of Superior Merchandise Company | — | — | (10,000 | ) | ||||||||
| Purchase of SERP investments | — | — | (850 | ) | ||||||||
| Net cash used for investing activities | (1,704 | ) | (2,972 | ) | (14,363 | ) | ||||||
| Cash flows (used) provided by financing activities: | ||||||||||||
| Stock sold to stock purchase program | 1,059 | 1,235 | 1,500 | |||||||||
| Stock options exercised | 356 | 441 | 1,092 | |||||||||
| Dividends paid | (838 | ) | (737 | ) | (691 | ) | ||||||
| Change in cash overdrafts | (149 | ) | (1,376 | ) | — | |||||||
| Proceeds from borrowings | 32,143 | 69,148 | 81,626 | |||||||||
| Borrowing repayments | (40,074 | ) | (71,203 | ) | (76,377 | ) | ||||||
| Net cash (used) provided by financing activities | (7,503 | ) | (2,492 | ) | 7,150 | |||||||
| Net (decrease) increase in cash and cash equivalents | (106 | ) | 753 | (2,657 | ) | |||||||
| Cash and cash equivalents beginning of year | 4,182 | 3,429 | 6,086 | |||||||||
| Cash and cash equivalents end of year | $ | 4,076 | $ | 4,182 | $ | 3,429 | ||||||
| Supplemental cash flow information: | ||||||||||||
| Interest paid | $ | 1,153 | $ | 1,848 | $ | 1,065 | ||||||
| Income taxes paid | $ | 2,868 | $ | 1,841 | $ | 3,371 | ||||||
The accompanying notes are an integral part of these consolidated financial statements.
30
Table of Contents
Tandy Brands Accessories, Inc. And Subsidiaries
Consolidated Statements Of Stockholders’ Equity
(in thousands of dollars except per share amounts)
Consolidated Statements Of Stockholders’ Equity
(in thousands of dollars except per share amounts)
| Shares Held | ||||||||||||||||||||||||||||
| Additional | Other | By Benefit | Total | |||||||||||||||||||||||||
| Common Stock | Paid-In | Retained | Comprehensive | Restoration | Stockholders’ | |||||||||||||||||||||||
| Shares | Amount | Capital | Earnings | Income (Loss) | Plan Trust | Equity | ||||||||||||||||||||||
| Balance June 30, 2004 | 6,305,886 | $ | 6,306 | $ | 26,765 | $ | 66,892 | $ | (121 | ) | $ | (894 | ) | $ | 98,948 | |||||||||||||
| Comprehensive income: | ||||||||||||||||||||||||||||
| Net income | — | — | — | 3,987 | — | — | 3,987 | |||||||||||||||||||||
| Currency translation adjustments | — | — | — | — | 467 | — | 467 | |||||||||||||||||||||
| SERP minimum liability increase net of tax of $158 | — | — | — | — | (269 | ) | — | (269 | ) | |||||||||||||||||||
| 4,185 | ||||||||||||||||||||||||||||
| Cash dividends declared — $0.11 per share | — | — | — | (715 | ) | — | — | (715 | ) | |||||||||||||||||||
| Stock sold to Stock Purchase Program | 108,964 | 109 | 1,391 | — | — | — | 1,500 | |||||||||||||||||||||
| Stock options exercised | 133,738 | 133 | 1,175 | — | — | — | 1,308 | |||||||||||||||||||||
| Restricted stock issued | 20,970 | 21 | 274 | — | — | — | 295 | |||||||||||||||||||||
| Restricted stock unearned compensation | — | — | (38 | ) | — | — | — | (38 | ) | |||||||||||||||||||
| Directors stock deferral plan shares issued | 3,608 | 4 | 30 | — | — | — | 34 | |||||||||||||||||||||
| Benefit Restoration Plan Trust shares purchased | — | — | — | — | — | (87 | ) | (87 | ) | |||||||||||||||||||
| Balance June 30, 2005 | 6,573,166 | 6,573 | 29,597 | 70,164 | 77 | (981 | ) | 105,430 | ||||||||||||||||||||
| Comprehensive income (loss): | ||||||||||||||||||||||||||||
| Net (loss) | — | — | — | (3,462 | ) | — | — | (3,462 | ) | |||||||||||||||||||
| Currency translation adjustments | — | — | — | — | 642 | — | 642 | |||||||||||||||||||||
| SERP minimum liability decrease net of tax of $158 | — | — | — | — | 269 | — | 269 | |||||||||||||||||||||
| (2,551 | ) | |||||||||||||||||||||||||||
| Cash dividends declared — $0.11 per share | — | — | — | (742 | ) | — | — | (742 | ) | |||||||||||||||||||
| Stock sold to Stock Purchase Program | 112,876 | 113 | 1,122 | — | — | — | 1,235 | |||||||||||||||||||||
| Stock options exercised | 57,694 | 58 | 383 | — | — | — | 441 | |||||||||||||||||||||
| Share-based compensation | 51,447 | 51 | 809 | — | — | — | 860 | |||||||||||||||||||||
| Benefit Restoration Plan Trust net shares sold | — | — | — | — | — | 166 | 166 | |||||||||||||||||||||
| Balance June 30, 2006 | 6,795,183 | 6,795 | 31,911 | 65,960 | 988 | (815 | ) | 104,839 | ||||||||||||||||||||
| Comprehensive income: | ||||||||||||||||||||||||||||
| Net income | — | — | — | 1,934 | — | — | 1,934 | |||||||||||||||||||||
| Currency translation adjustments | — | — | — | — | 338 | — | 338 | |||||||||||||||||||||
| 2,272 | ||||||||||||||||||||||||||||
| Cash dividends declared — $0.135 per share | — | — | — | (928 | ) | — | — | (928 | ) | |||||||||||||||||||
| Stock sold to Stock Purchase Program | 90,436 | 90 | 969 | — | — | — | 1,059 | |||||||||||||||||||||
| Stock options exercised | 34,282 | 34 | 322 | — | — | — | 356 | |||||||||||||||||||||
| Share-based compensation | (7,599 | ) | (7 | ) | 414 | 1 | — | — | 408 | |||||||||||||||||||
| Benefit Restoration Plan Trust shares purchased | — | — | — | — | — | (99 | ) | (99 | ) | |||||||||||||||||||
| Balance June 30, 2007 | 6,912,302 | $ | 6,912 | $ | 33,616 | $ | 66,967 | $ | 1,326 | $ | (914 | ) | $ | 107,907 | ||||||||||||||
The accompanying notes are an integral part of these consolidated financial statements.
31
Table of Contents
NOTES TO CONSOLIDATED FINANCIAL STATEMENTS
Note 1 — Overview
The Company
Tandy Brands Accessories, Inc. (“Company”) designs and markets belts, small leather goods, gift accessories, and other fashion accessories for men, women, and children. We sell our products under national brand names and private labels through all major retail distribution channels in the United States and Canada, including mass merchants, national chain stores, department stores, men’s and women’s specialty stores, catalog retailers, grocery stores, drug stores, golf pro shops, sporting goods stores, and the United States military retail exchange operations.
Basis Of Presentation
The preparation of our consolidated financial statements in accordance with U.S. generally accepted accounting principles requires the use of estimates that affect the reported value of assets, liabilities, revenues, and expenses. These estimates are based on historical experience and various other factors that we believe to be reasonable under the circumstances, the results of which form the basis for our conclusions. We continually evaluate the information used to make these estimates as the business and economic environment changes. Actual results may differ from these estimates under different assumptions or conditions. Such differences could have a material impact on our future financial position, results of operations, and cash flows.
The consolidated financial statements include the accounts of the Company and its subsidiaries, all of which are wholly owned. Intercompany accounts and transactions have been eliminated in consolidation.
Foreign Currency Translation
The functional currency for our Canadian subsidiary is the Canadian dollar. Its assets and liabilities are translated into U.S. dollars at the exchange rates in effect at each balance sheet date, and resulting translation gains or losses are accumulated in other comprehensive income as a separate component of stockholders’ equity. Revenue and expenses are translated at year-to-date average exchange rates.
Financial Instrument Fair Values
Our financial instruments consist primarily of cash, trade receivables and payables, and our credit facility. The carrying values of cash and trade receivables and payables are considered to be representative of their respective fair values. Our credit facility bears interest at floating market interest rates; therefore, the fair value of amounts borrowed approximate their carrying value.
Note 2 — Summary Of Significant Accounting Policies
Cash And Cash Equivalents
We consider cash on hand, deposits in banks, and short-term investments with original maturities of less than three months as cash and cash equivalents. At June 30, 2006 $1,090,000 of short-term trading securities with maturities greater than three months, but less than one year, are included in other current assets.
Accounts Receivable And Allowances
We perform periodic credit evaluations of our customers’ financial condition and reserve against accounts deemed uncollectible based upon historical losses and customer specific events. After all collection efforts are exhausted and an account is deemed uncollectible, it is written off against the allowance for doubtful accounts. Credit losses have historically been within our expectations and we generally do not require collateral.
Allowance account transactions, including deductions for returns and uncollectible accounts written off net of recoveries, were (in thousands):
| Beginning | Charged To | Ending | ||||||||||||||
| Fiscal Year | Balance | Expense | Deductions | Balance | ||||||||||||
| 2007 | $ | 1,598 | $ | 8,138 | $ | 8,793 | $ | 943 | ||||||||
| 2006 | 1,483 | 7,278 | 7,163 | 1,598 | ||||||||||||
| 2005 | 1,142 | 7,843 | 7,502 | 1,483 | ||||||||||||
32
Table of Contents
Note 2 — Summary Of Significant Accounting Policies(continued)
Inventories
Inventories are stated at the lower of cost (principally standard cost which approximates actual cost on a first-in, first-out basis) or market. Cost includes materials, direct and indirect labor, and factory overhead. Market, with respect to raw materials, is replacement cost and, with respect to work-in-process and finished goods, is net realizable value. Inventories consist of (in thousands):
| 2007 | 2006 | |||||||
| Raw materials | $ | 3,288 | $ | 3,999 | ||||
| Work-in-process | 239 | 1,321 | ||||||
| Finished goods | 60,845 | 56,450 | ||||||
| $ | 64,372 | $ | 61,770 | |||||
Property And Equipment
Property and equipment are carried at cost less accumulated depreciation calculated using the straight-line method (in thousands):
| 2007 | 2006 | Depreciation Rates | ||||||||||
| Buildings | $ | 8,514 | $ | 8,343 | 3% | |||||||
| Leasehold improvements | 3,139 | 2,799 | Lesser of lease term or asset life | |||||||||
| Machinery and equipment | 27,275 | 25,977 | 10% to 50% | |||||||||
| 38,928 | 37,119 | |||||||||||
| Accumulated depreciation | (28,380 | ) | (24,689 | ) | ||||||||
| $ | 10,548 | $ | 12,430 | |||||||||
Depreciation expense: 2007 — $4,168; 2006 — $4,544; 2005 — $4,458
Maintenance and repairs are charged to expense as incurred. Renewals and betterments which materially prolong the useful lives of the assets are capitalized. The cost and related accumulated depreciation of assets retired or sold are removed from the accounts and gains or losses are recognized in operations.
Goodwill And Other Intangibles
In conformity with generally accepted accounting principles, we have not amortized goodwill since fiscal 2002. Finite-lived intangibles are amortized using the straight-line method over their estimated useful lives.
Impairment Of Long-Lived Assets And Goodwill
We review long-lived assets and certain identifiable intangibles for impairment whenever events or changes in circumstances indicate that the carrying amount of an asset might be impaired. Recoverability of assets to be held and used is measured by a comparison of the carrying amount of the assets to undiscounted future net cash flows they are expected to generate. If the undiscounted cash flows are less than the carrying amount, the impairment recognized is measured by the amount the carrying value of the assets exceeds their fair value determined primarily through the present value of estimated future net cash flows.
Goodwill impairment is measured annually as of June 30, and when events and circumstances indicate goodwill may not be recoverable, by comparing the fair value of a reporting unit that has goodwill to the unit’s carrying value. Goodwill is allocated to reporting unit groups within each of our business segments which focus on the design, procurement, and marketing of related products. We estimate the fair value of a reporting unit using a discounted cash flow analysis. If the fair value is determined to be less than the carrying value, the amount of goodwill impairment, if any, is computed by allocating the fair value of the reporting unit to its assets other than goodwill. The excess of the fair value of the reporting unit over the amounts allocated to the assets other than the goodwill is considered the implied fair value of the goodwill. The goodwill’s implied fair value is compared to its carrying value and any shortfall represents the impairment amount.
Derivative Instruments And Hedging Activities
Our risk management policy relating to derivative investments is to mitigate, subject to market conditions, against interest rate risk. We do not enter into any derivative investments for the purpose of speculative investment. Our overall risk management philosophy is re-evaluated as business conditions change.
33
Table of Contents
Note 2 — Summary Of Significant Accounting Policies(continued)
Sales
Sales are recognized when merchandise is shipped and title to the goods has passed to the customer. We record allowances, including cash discounts, in-store customer allowances, cooperative advertising allowances, and customer returns, as a reduction of sales based upon historical experience, current trends in the retail industry, and individual customer and product experience. Actual returns and allowances may differ from our estimates and differences would affect the operating results of subsequent periods.
Costs And Expenses
Cost of goods sold includes our costs associated with the procurement and manufacture of inventory, such as the cost of inventory and raw materials purchased from overseas, costs of shipping from our suppliers, ticketing and labeling of product and, where applicable, labor and overhead related to our product manufacturing facilities. Selling, general and administrative expenses include our costs related to activities incurred in the normal course of business which are not associated with the procurement or production of inventory. They also include costs associated with our distribution centers (2007 — $15,128,000; 2006 — $17,007,000; 2005 — $16,586,000). Those amounts include shipping and handling expenses (2007 — $3,120,000; 2006 — $3,327,000; 2005 — $3,237,000).
Advertising Costs
Advertising costs, consisting primarily of shows and conventions as well as display and print advertising, are expensed as they are incurred (2007 $2,205,000; 2006 — $2,378,000; 2005 — $2,842,000).
Share-Based Compensation
Share-based compensation accounting required by Financial Accounting Standards Board (“FASB”) Statement of Financial Accounting Standards No. 123 (revised 2004), “Share-Based Payment,” (“SFAS No. 123R”) was adopted effective July 1, 2005 using the “modified prospective” method. Accordingly we began recording compensation expense for the fair value of all share-based payments expected to vest on the straight-line basis over the requisite service period of each grant. Compensation expense for stock options granted prior to, but not yet vested as of July 1, 2005, is based on the grant-date fair value estimated in accordance with the provisions of SFAS No. 123, “Accounting for Stock-Based Compensation,” and, for previous restricted stock grants and all share-based grants awarded subsequent to June 30, 2005, compensation expense is based on the grant-date fair value estimated in accordance with the provisions of SFAS No. 123R. Previously we accounted for stock option grants using the intrinsic value method in accordance with APB Opinion No. 25, “Accounting for Stock Issued to Employees” and expense was recognized for restricted stock grants, but we did not recognize compensation expense for stock options as the exercise prices equaled the market prices of the shares on the grant dates. The adoption of SFAS No. 123R in fiscal 2006 increased our loss before income taxes by $470,000 and our net loss for that year by $296,000 ($0.04 per share).
As required by SFAS No. 123R, the benefits of tax deductions in excess of recognized compensation expense are now reported in the statement of cash flows as a financing cash flow (2007 — $30,000; 2006 — $71,000) rather than an operating cash flow as previously reported. Fiscal 2005 financial statements have not been restated.
The following table presents the pro forma impact on fiscal 2005 net income if we had applied the fair value recognition provisions of SFAS No. 123 to stock-based employee compensation (in thousands except per share amounts).
| Net income: | ||||
| As reported | $ | 3,987 | ||
| Add share-based compensation expense net of tax | 160 | |||
| As adjusted | 4,147 | |||
| Less compensation expense per SFAS No. 123 net of tax | (711 | ) | ||
| Pro forma | $ | 3,436 | ||
| Earnings per share: | ||||
| As reported | $ | 0.63 | ||
| Pro forma | $ | 0.54 | ||
| Earnings per share assuming dilution: | ||||
| As reported | $ | 0.61 | ||
| Pro forma | $ | 0.52 | ||
34
Table of Contents
Note 2 — Summary Of Significant Accounting Policies (continued)
Impact Of Recently Issued Accounting Standards
In June 2006 the FASB issued Interpretation No. 48, “Accounting for Uncertainty in Income Taxes,” (“FIN No. 48”) which becomes effective for fiscal years beginning after December 15, 2006. We do not believe the impact on our financial statements of adopting the interpretation in fiscal 2008 will be material. FIN No. 48 clarifies the accounting in accordance with SFAS No. 109, “Accounting for Income Taxes,” by prescribing a recognition threshold and measurement attribute for the financial statement recognition and measurement of a tax position taken or to be taken in a tax return. It also provides guidance on derecognition, classification, interest and penalties, accounting in interim periods, disclosure, and transition.
Note 3 — Manufacturing Facility Conversion, Severance Costs, Trademark Sale, And Acquisition
Our men’s accessories segment operations in Yoakum, Texas are being converted to a receiving and distribution facility following the cessation of belt manufacturing on June 30, 2007. Inventory raw materials (approximately $1,000,000) and manufacturing equipment ($400,000 net book value) are expected to be sold to one of our suppliers without incurring a loss; however, amounts actually realized may differ from our estimates.
Selling, general and administrative expenses include pretax charges of $762,000 in fiscal 2007 related to transitioning manufacturing operations to overseas partners and other severance costs.
In fiscal 2007 we recognized a $440,000 pretax gain from the sale of the rights to use one of our trademarks within the Republic of Mexico.
We acquired Superior Merchandise Company which markets and distributes men’s and women’s gift accessories under the ETON® and licensed totes® brands on July 1, 2004 for $10 million in cash.
Note 4 — Discontinued Product Lines
In fiscal 2006 as the result of a study of our women’s accessories segment, we concluded the segment’s product offerings should be focused on its core competencies: women’s and children’s belts, small leather goods, handbags, and gift accessories. Consequently, other products, including socks, cold weather accessories, fashion scarves, evening bags, and children’s accessories (excluding belts), and packaging were written down to our best estimate of the market value that we expected would be realized based on our experiences in selling through inventory liquidation channels and discussions with potential purchasers; however, amounts actually realized may differ from our estimates and such differences could have a material impact on our future operating results. The $7.3 million in restructuring charges included a $6.9 million provision for discontinued product line inventory, $300,000 of additional general and administrative payroll expenses, and $100,000 for relocating inventories.
Note 5 — Goodwill And Intangibles
The following tables present information about the cost we have allocated to finite-lived intangible assets we acquired as part of business acquisitions (in thousands).
| 2007 | 2006 | |||||||
| Gross carrying amount | $ | 9,330 | $ | 9,561 | ||||
| Accumulated amortization | (4,448 | ) | (3,908 | ) | ||||
| $ | 4,882 | $ | 5,653 | |||||
| 2007 | Weighted-Average Life | |||||||||||||||
| Balance | Expense | Total | Remaining | |||||||||||||
| Trade names | $ | 3,366 | $ | 327 | 20.7 | 10.7 | ||||||||||
| Customer lists | 1,428 | 357 | 7.0 | 4.0 | ||||||||||||
| Other | 88 | 27 | 9.3 | 3.2 | ||||||||||||
| $ | 4,882 | $ | 711 | 16.8 | 7.0 | |||||||||||
Amortization expense: 2007 — $711; 2006 — $751; 2005 — $ 732
Estimated annual amortization expense: next four years — $695; fifth year — $306
Estimated annual amortization expense: next four years — $695; fifth year — $306
35
Table of Contents
Note 5 — Goodwill And Intangibles(continued)
Changes in the carrying amount of goodwill by reportable segment were (in thousands):
| Men’s | Women’s | |||||||||||
| Accessories | Accessories | Total | ||||||||||
| June 30, 2005 | $ | 16,164 | $ | 937 | $ | 17,101 | ||||||
| Impairment | — | (937 | ) | (937 | ) | |||||||
| Currency translation adjustment | 128 | — | 128 | |||||||||
| June 30, 2006 | 16,292 | — | 16,292 | |||||||||
| Currency translation adjustment | 69 | — | 69 | |||||||||
| June 30, 2007 | $ | 16,361 | $ | — | $ | 16,361 | ||||||
Accumulated amortization: 2007 — $6,670; 2006 — $6,594
The fiscal 2006 impairment was the result of assessing the segment’s fair value which was determined to be less than its carrying value. The assessment was triggered by changing business conditions for women’s mass merchant sales.
Note 6 — Credit Arrangements
Our $75 million unsecured revolving credit facility expires June 30, 2009. A $10 million sub-limit of the facility (“swing line”) may be used for same day advances provided by the facility’s administrative agent, a financial institution of the credit facility. The facility bears interest at LIBOR plus 0.75% to 1.75% based on various debt to equity ratios. It also requires us to pay commitment fees based on certain financial performance objectives ranging from 20 to 37.5 basis points on the unused balance. The facility contains an accordion feature allowing us to increase it by up to an additional $25 million including, if necessary, adding an additional financial institution in the future.
At June 30, 2007 we had outstanding borrowings under the credit facility of $6.1 million bearing interest at a 6.45% weighted-average rate and outstanding letters of credit used in conjunction with merchandise procurement totaling $3.3 million. Principal payments are due on the facility’s expiration date; however, the outstanding borrowings have been classified as a current liability because they are expected to be repaid within the succeeding twelve months. The effect of a 1% increase or decrease in the interest rate on the amount of our notes payable outstanding at of June 30, 2007 could lower or increase our annual pretax operating results by $61,000.
The credit facility is guaranteed by all of our subsidiaries, except our Canadian subsidiary, and requires the maintenance of certain financial covenants, which, if not met, could adversely impact our liquidity. It permits the payment of dividends and does not require us to enter into an interest rate swap agreement against our borrowings under the credit facility.
We were in compliance with all the covenants of our credit facility during fiscal 2007. As our borrowings increase for the procurement of fall and holiday season inventory, it may be necessary to request a waiver or amendment for certain of those covenants as of the end of fiscal 2008’s first quarter.
We also have a Canadian line of credit for $940,000 secured by a letter of credit from a U.S. bank. At June 30, 2007 and 2006 there were no borrowings under this line of credit. At June 30, 2007 we had credit availability under our credit facility and our Canadian line of credit as follows (in thousands):
| Total credit facilities | $ | 75,940 | ||
| Less: | ||||
| Debt outstanding | 6,069 | |||
| Letters of credit outstanding | 3,323 | |||
| Canadian standby letter of credit | 940 | |||
| Credit available | $ | 65,608 | ||
We are expensing (2007 — $170,000; 2006 — $149,000; 2005 — $127,000) the debt origination costs incurred in connection with our credit facilities over the periods of the facilities. At June 30, 2007 the remaining amount to be amortized was $264,000.
36
Table of Contents
Note 7 — Commitments
We lease office, warehouse, and manufacturing facilities under noncancelable operating leases expiring through the year 2013 with varying renewal and escalation clauses. Our rental expense in fiscal 2007, 2006, and 2005 totaled $2,577,000, $2,520,000, and $2,694,000, respectively.
We have licensing agreements with other companies to use their trademarks on our products. Royalty expense in fiscal 2007, 2006, and 2005 related to these agreements totaled $2,702,000, $3,027,000, and $2,669,000, respectively.
As of June 30, 2007 future payments under our leases, including additional rents under escalation clauses, and minimum royalty commitments were (in thousands):
| Fiscal Year | Rent | Royalty | ||||||
| 2008 | $ | 2,191 | $ | 1,465 | ||||
| 2009 | 2,178 | 956 | ||||||
| 2010 | 1,169 | 489 | ||||||
| 2011 | 587 | 225 | ||||||
| 2012 | 464 | 243 | ||||||
| Thereafter | 251 | 122 | ||||||
| $ | 6,840 | $ | 3,500 | |||||
Note 8 — Preferred Stock And Preferred Share Purchase Rights
Preferred Stock
Without any further action by the holders of our common stock, our board of directors is authorized to approve and determine the issuance of preferred stock, as well as the dividend rights, dividend rate, conversion or exchange rights, voting rights, rights and terms of redemption, liquidation preferences and sinking fund terms of any series of preferred stock, the number of shares constituting any series of preferred stock and the designation thereof. No shares of preferred stock have been issued. In connection with the adoption of our Preferred Share Purchase Rights Plan (“Rights Plan”), we have designated and reserved for issuance upon exercise of such rights 150,000 shares of Series A Junior Participating Cumulative Preferred Stock.
Should the board of directors elect to exercise its authority to issue any additional series of preferred stock, the rights, preferences, and privileges of holders of our common stock would be made subject to the rights, preferences, and privileges of such additional series.
Preferred Share Purchase Rights
The Rights Plan originally authorized by the board of directors prior to the spin-off of the Company in 1990 was amended and restated in 1999 and again amended in 2007 to expire October 19, 2007. Under the Rights Plan each share of our common stock has one preferred share purchase right (collectively, the “Rights”), entitling the registered holder to purchase from the Company one one-hundredth (1/100) of a share of Series A Junior Participating Cumulative Preferred Stock at a price of $70 per one one-hundredth (1/100) of a share, subject to adjustment. The description and terms of the Rights are set forth in a Rights Agreement between the Company and Bank Boston N.A., as Rights Agent, and an amendment between the Company and Computershare Trust Company, N.A., as successor to Bank Boston, N.A. The Rights will cause substantial dilution to a person or group that attempts to acquire the Company on terms not approved by our board of directors, except pursuant to an offer conditioned upon a substantial number of Rights being acquired.
37
Table of Contents
Note 9 — Share-Based Compensation
Omnibus Plan
The purpose of the 2002 Omnibus Plan (“Omnibus Plan”) approved by our stockholders on October 16, 2002 is to attract and retain the services of key management employees and members of our board of directors through the granting of incentive stock options (other than to directors), nonqualified stock options, performance units, stock appreciation rights, or restricted stock. Restricted stock and stock option awards under the Omnibus Plan and prior stock option plans have a maximum contractual life of ten years and specific vesting terms and performance goals are addressed in each equity award grant. All shares available for grant under our prior plans have been transferred to the Omnibus Plan and are authorized and reserved for issuance under the Omnibus Plan. All shares of common stock presently authorized and reserved for issuance on the exercise of stock options or vesting of restricted stock will automatically be authorized and reserved for issuance under the Omnibus Plan on their cancellation, forfeiture, or expiration. At June 30, 2007 there were 429,462 shares of common stock available for future grants, including 137,184 shares issuable if the maximum performance unit goal is achieved.
The Omnibus Plan, as amended in 2007, provides that, when a nonemployee is first elected or appointed to our board of directors, the director will be awarded 4,060 shares of restricted stock. The Omnibus Plan also provides that on or about the beginning of each fiscal year, each continuing nonemployee director will be awarded shares of restricted stock (Chairman of the Board — 4,200 shares; each other director — 3,000 shares). If the board so elects, an alternative form of award with a substantially equivalent value, other than an incentive stock option, may be granted in lieu of restricted stock. Prior to amendment in 2007, the Omnibus Plan provided for the granting of nonqualified stock options to continuing nonemployee directors concurrently with each regular annual election of directors.
A committee of nonemployee members of our board of directors may grant awards to directors and employees. Shares issued to satisfy awards may be from authorized but unissued common stock, treasury stock, or shares purchased on the open market. Currently we issue new shares.
Awards Granted
Restricted stock awards are not transferable, but bear rights of ownership including voting and dividend rights. One-third of those granted to our nonemployee directors vest on each grant-date anniversary. However, upon the death, disability, resignation, or termination of a director, that director’s shares become fully vested. Consequently, there is no requisite service period and the fair value of the grants is expensed on the award date. Restricted stock granted to employees cliff vests on the three-year anniversary of the award and has a requisite service period of three years. Although there are no performance requirements related to the vesting of restricted stock grants to employees, they must be continually employed through the vesting date. We estimate the fair value of restricted stock grants to be the market price of our common stock on the grant date.
Stock options granted to our nonemployee directors are nonqualified and become fully vested six months after the grant date, the requisite service period. Options granted to employees are exercisable annually at a rate of one-third per year, beginning one year after the grant date, and have a three-year requisite service period. Other than incentive stock option grants to certain executive officers prior to 1999, employees have been granted nonqualified options.
The exercise prices of our stock options are the grant-date market values of our common stock. The fair value of our stock options is estimated using the Black-Scholes valuation model. That model is used to estimate the fair value of traded options that have no vesting restrictions and are fully transferable. Option valuation models require the input of highly subjective assumptions. Because our stock options have characteristics significantly different from those of traded options, and because changes in the subjective input assumptions can materially affect fair value estimates, in our opinion, the existing models do not necessarily provide a reliable single measure of the fair value of our stock options.
Performance units granted to employees are payable in shares of our common stock following the end of the July 1, 2006 to June 30, 2009 performance cycle based on the Company’s return on noncash assets varying from 0% to 150% of the 6.73% return on noncash assets target payout. Employees vest in the portion of units earned equal to the months employed during the cycle upon death, disability, or normal (age 65) or early (age 55 and 15 years service) retirement; otherwise, units cliff vest at the end of the cycle. Unit fair values are estimated based on the market price of the Company’s stock on the grant date reduced by the present value of estimated future dividends.
38
Table of Contents
Note 9 — Share-Based Compensation(continued)
The following tables present the assumptions we used to estimate the fair value of our share-based compensation awards to be recognized as expense beginning in fiscal 2006 and the pro forma impact of SFAS123 on fiscal 2005 net income, as well as other information related to our stock options, restricted stock, and performance unit awards.
| 2007 | 2006 | 2005 | ||||||||||
Common Fair Value Assumptions | ||||||||||||
| Risk-free interest rate | 4.62% and 4.77% | 4% and 4.59% | 3.25 | % | ||||||||
| Dividend yield | 1.0% and 1.3% | 1.0 | % | 1.0 | % | |||||||
| Weighted-average | 1.1 | % | ||||||||||
Stock Option Fair Value Assumptions | ||||||||||||
| Stock price volatility | — | 0.390 | % | 0.388 | % | |||||||
| Expected holding period | — | 5 years | 5 years | |||||||||
Weighted-Average Estimated Fair Value Of Grants | ||||||||||||
| Restricted stock | — | $ | 10.74 | $ | 13.55 | |||||||
| Stock options | — | $ | 3.95 | $ | 4.74 | |||||||
| Performance Units | $ | 11.46 | — | — | ||||||||
Fair Value Of Restricted Stock Vested | $ | 244,000 | $ | 48,000 | $ | 24,000 | ||||||
Options Exercised | ||||||||||||
| Total intrinsic value | $ | 86,000 | $ | 255,000 | $ | 769,000 | ||||||
| Cash received | $ | 326,000 | $ | 371,000 | $ | 1,092,000 | ||||||
| Tax benefit realized | $ | 32,000 | $ | 71,000 | $ | 216,000 | ||||||
Compensation Expense | ||||||||||||
| Recognized | $ | 381,000 | $ | 860,000 | $ | 257,000 | ||||||
| Income tax benefit | $ | 141,000 | $ | 318,000 | $ | 97,000 | ||||||
| Unrecognized | $ | 197,000 | ||||||||||
| Weighted-average future recognition period | 1 year | |||||||||||
Volatility was calculated using the historical volatility of our common stock over the past five years. Expected holding periods, and the number of stock options and performance units expected to vest in determining compensation expense to be recognized, were estimated based on employment termination, option forfeiture patterns, and actual and estimated returns on noncash assets.
Stock Options
| Weighted-Average | Aggregate | |||||||||||||||
| Remaining | Intrinsic | |||||||||||||||
| Number | Exercise | Contractual | Value | |||||||||||||
| Of Shares | Price | Term | ($000) | |||||||||||||
| Outstanding June 30, 2006 | 727,740 | $ | 11.73 | |||||||||||||
| Exercised | (34,282 | ) | $ | 9.52 | ||||||||||||
| Forfeited and cancelled | (53,566 | ) | $ | 13.60 | ||||||||||||
| Outstanding June 30, 2007 | 639,892 | $ | 11.69 | |||||||||||||
| Vested and expected to vest | 625,168 | $ | 11.72 | 4.7 Years | $ | 1,150 | ||||||||||
| Exercisable | 566,730 | $ | 11.69 | 4.4 Years | $ | 1,091 | ||||||||||
39
Table of Contents
Note 9 — Share-Based Compensation(continued)
Restricted Stock
| Weighted-Average | ||||||||
| Number | Grant-Date | |||||||
| Of Shares | Fair Value | |||||||
| Nonvested June 30, 2006 | 93,119 | $ | 11.74 | |||||
| Vested | (23,914 | ) | $ | 12.46 | ||||
| Forfeited | (7,599 | ) | $ | 10.57 | ||||
| Nonvested June 30, 2007 | 61,606 | $ | 11.60 | |||||
Performance Units(1)
| Weighted-Average | ||||||||
| Number | Grant-Date | |||||||
| Of Shares | Fair Value | |||||||
| Granted | 141,984 | $ | 11.46 | |||||
| Forfeited | (4,800 | ) | $ | 12.11 | ||||
| Outstanding June 30, 2007 | 137,184 | $ | 11.44 | |||||
| Vested and expected to vest | — | — | ||||||
| (1) | Units, other than those vested and expected to vest, based on 150% of target payout. |
Note 10 — Director Stock Deferral Plan
The 1995 Stock Deferral Plan for Non-Employee Directors (“Deferral Plan”) provides nonemployee directors with an election to defer receipt of their fees until a future date determined by each director. The payment of deferred fees will ultimately be settled in shares of our common stock, or at the Company’s option as provided in a fiscal 2007 amendment, in cash based on the then current market price of our stock. All amounts deferred are credited to an account we maintain in phantom stock units which are equivalent in value to our common stock. The number of units is calculated by dividing the deferred cash amount by the average closing price of our common stock for each day of the period during which such cash amount would otherwise have been paid. We record compensation expense for the amount of the deferred fees (2007 — $27,000 for 2,482 units; 2006 — $52,000 for 4,751 units; 2005 — $40,000 for 2,945 units), dividend equivalents on the phantom stock units, and changes in the market value of our common stock (2007 — $66,000; 2006 and 2005 — $0). At June 30, 2007 there were 24,248 shares of common stock available for settlement of future deferrals.
Note 11 — Employee Benefit Plans
Our Employees Investment Plan (“401(k) Plan”) is open to substantially all of our full-time employees who have completed one year of service. Eligible employees may contribute up to 25% (10% prior to January 2006) of their annual compensation to the 401(k) Plan on a pretax basis. We, at our discretion, match 100% of employee contributions up to 5% of compensation. The 401(k) Plan allows participants to direct the investment of both employee and matching employer contributions from a variety of investment alternatives, one of which is our common stock.
The Stock Purchase Program (“Program”) sponsored by the Company is open to all full-time employees who have been employed at least six months, but less than one year, or who have been employed one year or more and are contributing to the 401(k) Plan. Under the Program participants may contribute either 5% or 10% of their earnings and we match 25% or 50% of each participant’s contribution depending on their length of employment or other considerations. Participants immediately vest in all contributions to their accounts. The Program purchases treasury stock, if available, or unissued common stock directly from the Company at monthly average market prices. Excluding the right to assign, alienate, pledge, or otherwise encumber their accounts, participants have full rights of ownership of the common stock held for their accounts, including voting and dividend rights. The shares purchased under the Program are distributed to participants annually.
40
Table of Contents
Note 11 — Employee Benefit Plans(continued)
The Benefit Restoration Plan (“BRP”) is a nonqualified deferred compensation plan to restore retirement benefits for a select group of our management and highly compensated employees who are eligible to make contributions to the 401(k) Plan, but whose contributions to the 401(k) Plan are reduced due to limitations imposed by Sections 401(a)(17) and 402(g) of the Internal Revenue Code of 1986, as amended. For any plan year, participants may elect to defer, on a pretax basis, between 1% and 10% of their annual compensation, reduced by their total contributions to the 401(k) Plan during the year. Participants may direct the investment of their contributions in various investment alternatives, including our common stock. We make quarterly matching cash contributions to the BRP on the participant’s behalf equal to 150% of the amount the participant deferred during the quarter, up to a maximum of 5% of the participant’s annual compensation, reduced by the Company’s contributions on the participant’s behalf to the 401(k) Plan. Our matching contributions are required to be invested in our common stock, or as we otherwise determine. All benefit payments from the BRP are made in cash either in a lump sum or monthly installments over a period not exceeding ten years. Our liability associated with the BRP is included in other liabilities (2007 — $1,023,000; 2006 — $738,000).
Our total contributions to these plans were $971,400, $1,028,000, and $1,350,000 in fiscal 2007, 2006, and 2005, respectively.
On August 19, 2005 the board of directors entered into an Acknowledgment and Release Agreement (“Agreement”), a defined contribution agreement, with the officer who was the only actively employed participant in the Tandy Brands Accessories, Inc. Supplemental Executive Retirement Plan (“SERP”) which was terminated effective September 2, 2005. Under the Agreement, the officer waived his right to any benefits which he had accrued under the SERP in return for (1) after payment of obligations under the SERP to other participants, the balance of the funds remaining in the rabbi trust ( “Trust”) established by the Company for the purpose of setting aside amounts to assist the Company in satisfying its obligations under the SERP, plus (2) beginning with fiscal 2006 and continuing until June 30, 2008, an additional $331,000 for each year which will be accrued on the books of the Company, or at the Company’s discretion, contributed to the Trust provided the officer remains employed with the Company and is employed with the Company on the last day of each fiscal year. The restricted cash and other investments in the Trust are carried at market value ($903,000 and $802,000 at June 30, 2007 and 2006, respectively). These funds, together with any additional contributions made by the Company, will continue to be invested under the terms of the Trust. Any amounts not contributed to the Trust, but accrued on the books of the Company, accrue interest at a rate per annum equal to the Company’s cost of borrowing. Our liability under the Agreement at June 30, 2007 and 2006 was $1,587,000 and $1,133,000, respectively. The officer may elect payment of benefits after retirement either in a lump sum or in a designated number of annual payments.
The terminated SERP had provided for retirement benefits for a select group of our executive officers. The components of our fiscal 2005 periodic benefit cost were: service cost — $19,000; interest cost — $171,000; prior service cost amortization — $140,000.
Note 12 — Disclosures About Segments Of Our Business And Related Information
We and our corresponding customer relationships are organized along men’s and women’s product lines. As a result we have two reportable segments: (1) men’s accessories, consisting of belts, gifts, wallets and other small leather goods, neckwear, suspenders, and sporting goods; and (2) women’s accessories, consisting of belts, small leather goods, handbags, and gifts. General corporate expenses and depreciation and amortization related to assets recorded in our corporate accounting records are allocated to each segment based on the respective segment’s asset base. Management measures each segment based upon income or loss before income taxes utilizing accounting policies consistent in all material respects with those described in Note 2. No inter-segment revenue is recorded.
41
Table of Contents
Note 12 — Disclosures About Segments Of Our Business And Related Information(continued)
The following table presents operating and asset information by reportable segment (in thousands).
| 2007 | 2006 | 2005 | ||||||||||
| Net sales to external customers: | ||||||||||||
| Men’s accessories | $ | 140,072 | $ | 138,515 | $ | 134,584 | ||||||
| Women’s accessories | 55,737 | 88,808 | 86,648 | |||||||||
| $ | 195,809 | $ | 227,323 | $ | 221,232 | |||||||
Operating income (loss):(1) | ||||||||||||
| Men’s accessories | $ | 5,305 | $ | 7,867 | $ | 11,002 | ||||||
Women’s accessories(2) | (1,370 | ) | (10,272 | ) | (3,616 | ) | ||||||
| 3,935 | (2,405 | ) | 7,386 | |||||||||
| Interest expense | (1,226 | ) | (2,057 | ) | (1,222 | ) | ||||||
Other income(3) | 550 | 187 | 246 | |||||||||
| Income (loss) before income taxes | $ | 3,259 | $ | (4,275 | ) | $ | 6,410 | |||||
| Depreciation and amortization: | ||||||||||||
| Men’s accessories | $ | 3,237 | $ | 3,253 | $ | 3,073 | ||||||
| Women’s accessories | 1,478 | 1,865 | 1,952 | |||||||||
| $ | 4,715 | $ | 5,118 | $ | 5,025 | |||||||
| Capital expenditures: | ||||||||||||
| Men’s accessories | $ | 770 | $ | 579 | $ | 559 | ||||||
| Women’s accessories | 77 | 524 | 354 | |||||||||
| Corporate | 1,357 | 1,869 | 2,600 | |||||||||
| $ | 2,204 | $ | 2,972 | $ | 3,513 | |||||||
| Total assets: | ||||||||||||
| Men’s accessories | $ | 96,731 | $ | 83,539 | $ | 88,451 | ||||||
| Women’s accessories | 29,085 | 36,227 | 44,929 | |||||||||
| Corporate | 14,847 | 19,178 | 17,382 | |||||||||
| $ | 140,663 | $ | 138,944 | $ | 150,762 | |||||||
| (1) | Operating income (loss) consists of net sales less cost of goods sold and specifically identifiable and allocated selling, general and administrative expenses. | |
| (2) | Women’s accessories 2006 operating loss includes a $7.1 million charge for discontinued product line inventory, associated packaging costs, and severance payments and a $938,000 charge for goodwill impairment. In 2005 women’s accessories incurred an $847,000 goodwill impairment charge. | |
| (3) | Other income includes a $440,000 gain from the sale of a trademark in fiscal 2007 and royalty income from corporate trade names and other income not specifically identifiable with a segment. |
Customers accounting for 10% or more of our total net sales were: Wal-Mart Stores, Inc. (2007 - 45%; 2006 — 39%; 2005 — 38%) and Target Corporation (2006 — 12%; 2005 — 13%). Our annual purchases of finished products and leather for belt manufacturing over the last three years from one company ranged from $41.4 million to $42.5 million. Currently we are negotiating to sell our Yoakum, Texas manufacturing equipment to that supplier.
42
Table of Contents
Note 12 — Disclosures About Segments Of Our Business And Related Information(continued)
Our net sales, income (loss) before income taxes, property and equipment, and total assets by geographic location were (in thousands):
| 2007 | 2006 | 2005 | ||||||||||
| Net sales: | ||||||||||||
| United States | $ | 186,428 | $ | 218,255 | $ | 213,368 | ||||||
| Canada | 9,381 | 9,068 | 7,864 | |||||||||
| $ | 195,809 | $ | 227,323 | $ | 221,232 | |||||||
| Income (loss) before income taxes: | ||||||||||||
| United States | $ | 2,671 | $ | (4,779 | ) | $ | 5,976 | |||||
| Canada | 588 | 504 | 434 | |||||||||
| $ | 3,259 | $ | (4,275 | ) | $ | 6,410 | ||||||
| Property and equipment: | ||||||||||||
| United States | $ | 38,207 | $ | 36,430 | $ | 37,150 | ||||||
| Canada | 721 | 689 | 592 | |||||||||
| $ | 38,928 | $ | 37,119 | $ | 37,742 | |||||||
| Total assets: | ||||||||||||
| United States | $ | 131,518 | $ | 131,361 | $ | 143,586 | ||||||
| Canada | 9,145 | 7,583 | 7,176 | |||||||||
| $ | 140,663 | $ | 138,944 | $ | 150,762 | |||||||
Our Canadian subsidiary is part of our men’s accessories segment. Its sales and income are converted to U.S. dollars at the average currency exchange rate for each year. Property and equipment and total assets are converted at each fiscal year end exchange rate.
Note 13 — Earnings (Loss) Per Share
Our basic and diluted earnings (loss) per share are computed as follows (in thousands except per share amounts):
| 2007 | 2006 | 2005 | ||||||||||
| Numerator for basic and diluted earnings (loss) per share: | ||||||||||||
| Net income (loss) | $ | 1,934 | $ | (3,462 | ) | $ | 3,987 | |||||
| Denominator: | ||||||||||||
| Weighted-average shares outstanding | 6,716 | 6,575 | 6,327 | |||||||||
| Contingently issuable shares | 4 | 23 | 22 | |||||||||
| Denominator for basic earnings (loss) per share | 6,720 | 6,598 | 6,349 | |||||||||
| Effect of dilutive share-based compensation | 171 | — | 239 | |||||||||
| Denominator for diluted earnings (loss) per share | 6,891 | 6,598 | 6,588 | |||||||||
| Earnings (loss) per common share | $ | 0.29 | $ | (0.52 | ) | $ | 0.63 | |||||
| Earnings (loss) per common share assuming dilution | $ | 0.28 | $ | (0.52 | ) | $ | 0.61 | |||||
Antidilutive stock options for 336,994 shares of our common stock (exercise prices $12.07 to $17.56 per share) in fiscal 2007 and 216,635 shares (exercise prices $14.25 to $17.75 per share) in fiscal 2005 are excluded from our earnings per share calculations. Potentially dilutive securities at June 30, 2006 consisting of 727,740 stock options (exercise prices $5.63 to $17.56 per share), 78,147 nonvested restricted stock shares not contingently issuable, and the 71,266 shares held by the Benefit Restoration Plan Trust would have had an antidilutive effect on our loss per share for fiscal 2006.
43
Table of Contents
Note 14 — Income Taxes
Significant components of our net deferred tax assets were (in thousands):
| 2007 | 2006 | |||||||
| Deferred tax assets: | ||||||||
| Accounts receivable valuation | $ | 187 | $ | 344 | ||||
| Inventory valuation | 2,787 | 2,584 | ||||||
| Compensation plans | 1,662 | 1,305 | ||||||
| Depreciation | 506 | |||||||
| Other net | — | 65 | ||||||
| 5,142 | 4,298 | |||||||
| Deferred tax liabilities: | ||||||||
| Goodwill and other intangibles | (2,061 | ) | (1,992 | ) | ||||
| Depreciation | — | (154 | ) | |||||
| Other net | (16 | ) | — | |||||
| (2,077 | ) | (2,146 | ) | |||||
| Net deferred tax asset | $ | 3,065 | $ | 2,152 | ||||
Significant components of our income tax provisions (benefit) were (in thousands):
| 2007 | 2006 | 2005 | ||||||||||
| Current: | ||||||||||||
| Federal | $ | 1,748 | $ | (1,023 | ) | $ | 3,586 | |||||
| State and local | 304 | 275 | 407 | |||||||||
| Foreign | 186 | 244 | 202 | |||||||||
| 2,238 | (504 | ) | 4,195 | |||||||||
| Deferred: | ||||||||||||
| Federal | (850 | ) | (265 | ) | (1,577 | ) | ||||||
| State and local | (63 | ) | (44 | ) | (195 | ) | ||||||
| (913 | ) | (309 | ) | (1,772 | ) | |||||||
| $ | 1,325 | $ | (813 | ) | $ | 2,423 | ||||||
The federal statutory income tax rate reconciles to our effective income tax rate as follows:
| 2007 | 2006 | 2005 | ||||||||||
| Statutory rate | 34.0 | % | (34.0 | )% | 34.0 | % | ||||||
| State, foreign and local taxes net of federal tax benefit | 3.8 | 5.2 | 2.3 | |||||||||
| Goodwill impairment | — | 7.5 | — | |||||||||
| Other net | 2.9 | 2.3 | 1.5 | |||||||||
| 40.7 | % | (19.0 | )% | 37.8 | % | |||||||
Note 15 — Selected Unaudited Quarterly Financial Data
Our quarterly operating results were (in thousands):
| First | Second | Third | Fourth | |||||||||||||
| Fiscal 2007 | Quarter | Quarter | Quarter | Quarter | ||||||||||||
| Net sales | $ | 57,199 | $ | 64,340 | $ | 37,905 | $ | 36,365 | ||||||||
| Gross margin | 21,027 | 24,190 | 13,602 | 11,035 | ||||||||||||
| Income (loss) before income taxes | 4,630 | 5,575 | (2,317 | ) | (4,629 | ) | ||||||||||
| Net income (loss) | 2,829 | 3,406 | (1,383 | ) | (2,918 | ) | ||||||||||
| Earnings (loss) per common share | $ | 0.42 | $ | 0.51 | $ | (0.21 | ) | $ | (0.43 | ) | ||||||
| Earnings (loss) per common share assuming dilution | $ | 0.41 | $ | 0.50 | $ | (0.21 | ) | $ | (0.43 | ) | ||||||
The third quarter includes a $440,000 pretax gain from the sale of the rights to one of our trademarks and the fourth quarter includes pretax charges of $762,000 related to transitioning manufacturing operations to overseas partners and other severance costs and approximately $1 million for unexpected holiday gift accessories typically returned in the third quarter.
44
Table of Contents
Note 15 — Selected Unaudited Quarterly Financial Data(continued)
| First | Second | Third | Fourth | |||||||||||||
| Fiscal 2006 | Quarter | Quarter | Quarter | Quarter | ||||||||||||
| Net sales | $ | 60,948 | $ | 73,866 | $ | 45,414 | $ | 47,095 | ||||||||
| Gross margin | 20,280 | 24,955 | 7,901 | 15,735 | ||||||||||||
| Income (loss) before income taxes | 2,439 | 3,938 | (9,466 | ) | (1,186 | ) | ||||||||||
| Net income (loss) | 1,467 | 2,036 | (5,921 | ) | (1,044 | ) | ||||||||||
| Earnings (loss) per common share | $ | 0.22 | $ | 0.31 | $ | (0.89 | ) | $ | (0.16 | ) | ||||||
| Earnings (loss) per common share assuming dilution | $ | 0.22 | $ | 0.30 | $ | (0.89 | ) | $ | (0.16 | ) | ||||||
The second quarter includes a $938,000 goodwill impairment charge, the third quarter includes a pretax $7.1 million charge for discontinued product line inventory, associated packaging costs and severance payments, and the fourth quarter includes a pretax $1.1 million inventory mark down provision.
ITEM 9 — CHANGES IN AND DISAGREEMENTS WITH ACCOUNTANTS ON ACCOUNTING AND FINANCIAL DISCLOSURE
None.
ITEM 9A — CONTROLS AND PROCEDURES
Under the supervision and with the participation of our management, including our Chief Executive Officer and Chief Financial Officer, we have evaluated the effectiveness of our disclosure controls and procedures pursuant to Exchange Act Rule 13a-15(b) as of the end of the period covered by this report. Based on that evaluation, our Chief Executive Officer and Chief Financial Officer have concluded that these disclosure controls and procedures are effective. There has been no change in our internal control over financial reporting during the fourth quarter of fiscal 2007 that has materially affected, or is reasonably likely to materially affect, our internal control over financial reporting.
ITEM 9A(T) — CONTROLS AND PROCEDURES
Information is not required for fiscal years ending before December 15, 2007.
ITEM 9B — OTHER INFORMATION
None.
45
Table of Contents
PART III
The information required by Items 10 through 14 is included in our definitive Proxy Statement relating to our 2007 Annual Meeting of Stockholders and is incorporated herein by reference. Such information and its location in the Proxy Statement are as follows:
| Caption In The | Page Number In The | |||||
| Tandy Brands Accessories, Inc. | Tandy Brands Accessories, Inc. | |||||
| Item | 2007 Proxy Statement | 2007 Proxy Statement | ||||
| “Proposal One: Election of Directors — Biographical and Other Information Regarding Our Nominees for Re-Election to Our Board of Directors — Biographical and Other Information Regarding Our Continuing Directors” | 7 — 8 | |||||
| “Executive Officers” | 17 | |||||
| “Section 16(a) Beneficial Ownership Reporting Compliance” | 20 | |||||
| “Corporate Governance Information — Code of Ethics” | 11 | |||||
| “Corporate Governance Information — Nominations and Corporate Governance Committee” | 9 — 10 | |||||
| “Corporate Governance Information — Audit Committee” | 8 | |||||
| “Director Compensation Information” | 12 — 14 | |||||
| “Compensation Discussion and Analysis” | 20 — 33 | |||||
| “Security Ownership of Certain Beneficial Owners” | 18 — 20 | |||||
| “Corporate Governance Information — Review, Approval or Ratification of Transactions with Related Persons” | 11 — 12 | |||||
| “Corporate Governance Information | ||||||
| — Director Independence | ||||||
| — Board Meetings and Attendance | ||||||
| — Committees | ||||||
| — Compensation Committee Interlocks and Insider Participation” | 8 — 10 | |||||
| “Compensation Committee Report” | 26 | |||||
| “Communicating with Directors” | 10 | |||||
46
Table of Contents
| Caption In The | Page Number In The | |||||
| Tandy Brands Accessories, Inc. | Tandy Brands Accessories, Inc. | |||||
| Item | 2007 Proxy Statement | 2007 Proxy Statement | ||||
| “Proposal Three: Ratification of Independent Auditor — Background” | 16 | |||||
PART IV
ITEM 15 — EXHIBITS AND FINANCIAL STATEMENT SCHEDULES
Financial Statements
The following financial statements are included in Item 8 of this Annual Report:
| • | Consolidated Balance Sheets as of June 30, 2007 and 2006 | ||
| • | Consolidated Statements of Operations for the years ended June 30, 2007, 2006, and 2005 | ||
| • | Consolidated Statements of Cash Flows for the years ended June 30, 2007, 2006, and 2005 | ||
| • | Consolidated Statements of Stockholders’ Equity for the years ended June 30, 2007, 2006, and 2005 |
Financial Statement Schedules
Financial statement schedules have been omitted because they either are not applicable or the required information is included in the consolidated financial statements or notes thereto.
Exhibits
The Exhibit Index immediately preceding the exhibits required to be filed is incorporated herein by reference.
47
Table of Contents
SIGNATURES
Pursuant to the requirements of Section 13 or 15(d) of the Securities Exchange Act of 1934, the registrant has duly caused this report to be signed on its behalf by the undersigned, thereunto duly authorized.
| TANDY BRANDS ACCESSORIES, INC. (Registrant) | ||||
| /s/ J.S.B. Jenkins | ||||
| J.S.B. Jenkins | ||||
| President and Chief Executive Officer | ||||
Date: September 21, 2007
Pursuant to the requirements of the Securities Exchange Act of 1934, this report has been signed below by the following persons on behalf of the registrant and in the capacities and on the dates indicated.
| Name | Position | Date | ||
| /s/ Dr. James F. Gaertner | Director and Chairman of the Board | September 21, 2007 | ||
| /s/ J.S.B. Jenkins | Director, President and Chief Executive Officer (principal executive officer) | September 21, 2007 | ||
| /s/ Roger R. Hemminghaus | Director | September 21, 2007 | ||
| /s/ Gene Stallings | Director | September 21, 2007 | ||
| /s/ Colombe M. Nicholas | Director | September 21, 2007 | ||
| /s/ George C. Lake | Director | September 21, 2007 | ||
| /s/ W. Grady Rosier | Director | September 21, 2007 | ||
| /s/ Mark J. Flaherty | Chief Financial Officer (principal financial and accounting officer) | September 21, 2007 |
48
Table of Contents
TANDY BRANDS ACCESSORIES, INC. AND SUBSIDIARIES
EXHIBIT INDEX
EXHIBIT INDEX
| Incorporated by Reference | ||||||||||||||||
| (if applicable) | ||||||||||||||||
| Exhibit Number and Description | Form | Date | File No. | Exhibit | ||||||||||||
| (3) Articles of Incorporation and Bylaws | ||||||||||||||||
| 3.1 Certificate of Incorporation of Tandy Brands Accessories, Inc. | S-1 | 11/02/90 | 33-37588 | 3.1 | ||||||||||||
| 3.2 Amended and Restated Bylaws of Tandy Brands Accessories, Inc., effective July 2007 | 8-K | 7/13/07 | 0-18927 | 3.01 | ||||||||||||
| (4) Instruments defining the rights of security holders, including indentures | ||||||||||||||||
| 4.1 Certificate of Designations, Powers, Preferences, and Rights of Series A Junior Participating Cumulative Preferred Stock of Tandy Brands Accessories, Inc. | S-1 | 12/17/90 | 33-37588 | 4.1 | ||||||||||||
| 4.2 Form of Common Stock Certificate of Tandy Brands Accessories, Inc. | S-1 | 12/17/90 | 33-37588 | 4.2 | ||||||||||||
| 4.3 Form of Preferred Share Purchase Rights Certificate of Tandy Brands Accessories, Inc. | S-1 | 12/17/90 | 33-37588 | 4.3 | ||||||||||||
| 4.4 Form of Rights Certificate of Tandy Brands Accessories, Inc. | 8-K | 11/02/99 | 0-18927 | 4 | ||||||||||||
| 4.5 Amended and Restated Rights Agreement, dated October 19, 1999, between Tandy Brands Accessories, Inc. and Bank Boston, N.A. | 8-K | 11/02/99 | 0-18927 | 4 | ||||||||||||
| 4.6 Amendment to Rights Agreement, dated October 19, 1999, between Tandy Brands Accessories, Inc. and Fleet National Bank (f.k.a. Bank Boston, N.A.) | 10-Q | 5/10/02 | 0-18927 | 4.7 | ||||||||||||
| 4.7 Amended and Restated Credit Agreement among Tandy Brands Accessories, Inc. as the Borrower, Wells Fargo HSBC Trade Bank, N.A. as Administrative Agent and as a Lender, and Certain Financial Institutions, as Lenders and Wells Fargo Bank, N.A. as Arranger as of September 7, 2006 | 10-K | 9/22/06 | 0-18927 | 4.7 | ||||||||||||
| 4.8 Amendment to Amended and Restated Rights Agreement | 8-K | 5/16/07 | 0-18927 | 4.1 | ||||||||||||
| (10) Material Contracts | ||||||||||||||||
| 10.1 Tandy Brands Accessories, Inc. Benefit Restoration Plan and related Trust Agreement and Amendments Nos. 1 and 2 thereto* | 10-K | 9/25/97 | 0-18927 | 10.14 | ||||||||||||
| 10.2 Amendment No. 3 to the Tandy Brands Accessories, Inc. Benefit Restoration Plan, effective as of July 1, 2003* | 10-K | 9/23/03 | 0-18927 | 10.32 | ||||||||||||
1
Table of Contents
TANDY BRANDS ACCESSORIES, INC. AND SUBSIDIARIES
EXHIBIT INDEX
EXHIBIT INDEX
| Incorporated by Reference | ||||||||||||||||
| (if applicable) | ||||||||||||||||
| Exhibit Number and Description | Form | Date | File No. | Exhibit | ||||||||||||
| 10.3 Succession Agreement, dated July 1, 2001, between Tandy Brands Accessories, Inc. and Chase Texas, N.A. (the Former Trustee) and Comerica Bank — Texas (the Trustee), relating to the Tandy Brands Accessories, Inc. Benefit Restoration Plan* | 10-K | 9/23/03 | 0-18927 | 10.34 | ||||||||||||
| 10.4 Form of Indemnification Agreement between Tandy Brands Accessories, Inc. and each of its Directors | S-1 | 12/17/90 | 33-37588 | 10.16 | ||||||||||||
| 10.5 Form of Indemnification Agreement between Tandy Brands Accessories, Inc. and each of its Officers | S-1 | 12/17/90 | 33-37588 | 10.17 | ||||||||||||
| 10.6 Tandy Brands Accessories, Inc. Non-Qualified Formula Stock Option Plan for Non-Employee Directors* | S-8 | 2/10/94 | 33-75114 | 28.1 | ||||||||||||
| 10.7 Amendment No. 4 to the Tandy Brands Accessories, Inc. Nonqualified Formula Stock Option Plan For Non-Employee Directors* | 10-Q | 5/10/02 | 0-18927 | 10.39 | ||||||||||||
| 10.8 Tandy Brands Accessories, Inc. Non-Qualified Stock Option Plan for Non-Employee Directors* | S-8 | 2/10/94 | 33-75114 | 28.3 | ||||||||||||
| 10.9 Tandy Brands Accessories, Inc. 1995 Stock Deferral Plan for Non-Employee Directors* | S-8 | 6/03/96 | 33-08579 | 99.1 | ||||||||||||
| 10.10 Tandy Brands Accessories, Inc. 1997 Employee Stock Option Plan* | S-8 | 12/12/97 | 333-42211 | 99.1 | ||||||||||||
| 10.11 Amendment No. 2 to the Tandy Brands Accessories, Inc. 1997 Employee Stock Option Plan* | 10-Q | 5/10/02 | 0-18927 | 10.38 | ||||||||||||
| 10.12 Tandy Brands Accessories, Inc. Employees Investment Plan, as Amended and Restated effective July 1, 2000* | 10-K | 9/26/00 | 0-18927 | 10.39 | ||||||||||||
| 10.13 Mid-Market Trust Agreement, dated August 19, 2001, between Tandy Brands Accessories, Inc. and State Street Bank and Trust Company, relating to the Tandy Brands Accessories, Inc. Employees Investment Plan* | 10-K | 9/23/03 | 0-18927 | 10.28 | ||||||||||||
| 10.14 Amendments Nos. 1-3 to the Tandy Brands Accessories, Inc. Employees Investment Plan, as Amended and Restated effective July 1, 2000* | 10-K | 9/23/03 | 0-18927 | 10.31 | ||||||||||||
2
Table of Contents
TANDY BRANDS ACCESSORIES, INC. AND SUBSIDIARIES
EXHIBIT INDEX
EXHIBIT INDEX
| Incorporated by Reference | ||||||||||||||||
| (if applicable) | ||||||||||||||||
| Exhibit Number and Description | Form | Date | File No. | Exhibit | ||||||||||||
| 10.15 Succession Agreement, dated June 20, 2002, between Tandy Brands Accessories, Inc. and Comerica Bank — Texas, (the Trustee), relating to the Tandy Brands Accessories, Inc. Employees Investment Plan* | 10-K | 9/23/03 | 0-18927 | 10.35 | ||||||||||||
| 10.16 Amendment No. 4 to the Tandy Brands Accessories, Inc. Employees Investment Plan, dated December 22, 2003* | 10-Q | 2/12/04 | 0-18927 | 10.38 | ||||||||||||
| 10.17 Nonqualified Stock Option Agreement for Non-Employee Directors, dated October 16, 2001, by and between Tandy Brands Accessories, Inc. and Dr. James F. Gaertner* | S-8 | 5/15/02 | 33-88276 | 10.2 | ||||||||||||
| 10.18 Nonqualified Stock Option Agreement for Non-Employee Directors, dated October 16, 2001, by and between Tandy Brands Accessories, Inc. and Gene Stallings* | S-8 | 5/15/02 | 33-88276 | 10.4 | ||||||||||||
| 10.19 Nonqualified Stock Option Agreement for Non-Employee Directors, dated October 16, 2001, by and between Tandy Brands Accessories, Inc. and Roger R. Hemminghaus* | S-8 | 5/15/02 | 33-88276 | 10.5 | ||||||||||||
| 10.20 Nonqualified Stock Option Agreement for Non-Employee Directors, dated October 16, 2001, by and between Tandy Brands Accessories, Inc. and Colombe M. Nicholas* | S-8 | 5/15/02 | 33-88276 | 10.6 | ||||||||||||
| 10.21 Tandy Brands Accessories, Inc. 2002 Omnibus Plan* | 10-Q | 11/12/02 | 0-18927 | 10.24 | ||||||||||||
| 10.22 Form of Non-Employee Director Nonqualified Stock Option Agreement pursuant to the Tandy Brands Accessories, Inc. 2002 Omnibus Plan* | 10-K | 9/23/04 | 0-18927 | 10.39 | ||||||||||||
| 10.23 Form of Employee Nonqualified Stock Option Agreement pursuant to the Tandy Brands Accessories, Inc. 2002 Omnibus Plan* | 10-K | 9/23/04 | 0-18927 | 10.40 | ||||||||||||
| 10.24 Form of Non-Employee Director Restricted Stock Award Agreement pursuant to the Tandy Brands Accessories, Inc. 2002 Omnibus Plan* | 10-K | 9/23/04 | 0-18927 | 10.41 | ||||||||||||
| 10.25 Form of Employee Restricted Stock Award Agreement pursuant to the Tandy Brands Accessories, Inc. 2002 Omnibus Plan* | 10-K | 9/23/04 | 0-18927 | 10.42 | ||||||||||||
3
Table of Contents
TANDY BRANDS ACCESSORIES, INC. AND SUBSIDIARIES
EXHIBIT INDEX
EXHIBIT INDEX
| Incorporated by Reference | ||||||||||||||||
| (if applicable) | ||||||||||||||||
| Exhibit Number and Description | Form | Date | File No. | Exhibit | ||||||||||||
| 10.26 Form of Severance Agreement between Tandy Brands Accessories, Inc. for Executive and Senior Officers* | 10-K | 9/23/03 | 0-18927 | 10.33 | ||||||||||||
| 10.27 Office Lease Agreement, dated January 31, 2004, between Koll Bren Fund VI, LP and Tandy Brands Accessories, Inc. relating to the corporate office | 10-Q | 2/12/04 | 0-18927 | 10.36 | ||||||||||||
| 10.28 Acknowledgement and Release Agreement between Tandy Brands Accessories, Inc. and J.S.B. Jenkins relating to the termination of the Supplemental Executive Retirement Plan* | 8-K | 8/22/05 | 0-18927 | 10.45 | ||||||||||||
| 10.29 Tandy Brands Accessories, Inc. Stock Purchase Program (As Amended And Restated Effective December 1, 2005)* | 10-Q | 2/10/06 | 0-18927 | 10.46 | ||||||||||||
| 10.30 Amendments Nos. 5-6 to the Tandy Brands Accessories, Inc. Employees Investment Plan, as Amended and Restated effective July 1, 2000* | 10-Q | 5/11/06 | 0-18927 | 10.44 | ||||||||||||
| 10.31 Amendment No. 2 to the Tandy Brands Accessories, Inc. 1995 Stock Deferral Plan for Non-Employee Directors* | 10-K | 9/22/06 | 0-18927 | 10.35 | ||||||||||||
| 10.32 Amended and Restated Credit Agreement among Tandy Brands Accessories, Inc. as the Borrower, Wells Fargo HSBC Trade Bank, N.A. as Administrative Agent and as a Lender, and Certain Financial Institutions, as Lenders and Wells Fargo Bank, N.A. as Arranger as of September 7, 2006 | 10-K | 9/22/06 | 0-18927 | 10.36 | ||||||||||||
| 10.33 Amendment No. 4 to the Tandy Brands Accessories, Inc. Benefit Restoration Plan, dated July 1, 2001* | 10-Q | 11/14/06 | 0-18927 | 10.37 | ||||||||||||
| 10.34 Form of 2006 Performance Unit Award Agreement pursuant to the Tandy Brands Accessories, Inc. 2002 Omnibus Plan* | 10-Q | 2/14/07 | 0-18927 | 10.37 | ||||||||||||
| 10.35 Amendment No. 7 to the Tandy Brands Accessories, Inc. Employees Investment Plan, effective as of January 1, 2006* | 10-Q | 2/14/07 | 0-18927 | 10.38 | ||||||||||||
| 10.36 Tandy Brands Accessories, Inc. Summary of Incentive Bonus Plan for Executive Officers* | 8-K | 6/12/07 | 0-18927 | 5.1 | ||||||||||||
| 10.37 Amendment No. 1 to the Tandy Brands Accessories, Inc. 2002 Omnibus Plan* ** | N/A | N/A | N/A | N/A | ||||||||||||
4
Table of Contents
TANDY BRANDS ACCESSORIES, INC. AND SUBSIDIARIES
EXHIBIT INDEX
EXHIBIT INDEX
| Incorporated by Reference | ||||||||||||||||
| (if applicable) | ||||||||||||||||
| Exhibit Number and Description | Form | Date | File No. | Exhibit | ||||||||||||
| 10.38 Fiscal 2008 Compensation Summaries* ** | N/A | N/A | N/A | N/A | ||||||||||||
| (21) Subsidiaries of the registrant | ||||||||||||||||
| 21.1 List of subsidiaries** | N/A | N/A | N/A | N/A | ||||||||||||
| (23) Consents of experts and counsel | ||||||||||||||||
| 23.1 Consent of Ernst & Young LLP** | N/A | N/A | N/A | N/A | ||||||||||||
| (31) Rule 13a-14(a)/15d-14(a) Certifications | ||||||||||||||||
| 31.1 Certification pursuant to Rule 13a-14(a)/15d-14(a) (Chief Executive Officer)** | N/A | N/A | N/A | N/A | ||||||||||||
| 31.2 Certification pursuant to Rule 13a-14(a)/15d-14(a) (Chief Financial Officer)** | N/A | N/A | N/A | N/A | ||||||||||||
| (32) Section 1350 Certifications | ||||||||||||||||
| 32.1 Section 1350 Certifications (Chief Executive Officer and Chief Financial Officer)** | N/A | N/A | N/A | N/A | ||||||||||||
| * | Management contract or compensatory plan | |
| ** | Filed herewith |
5