UNITED STATES
SECURITIES AND EXCHANGE COMMISSION
Washington, D.C. 20549
FORM N-CSR
CERTIFIED SHAREHOLDER REPORT OF REGISTERED MANAGEMENT INVESTMENT COMPANIES
Investment Company Act file number 811- 01136
Security Equity Fund
(Exact name of registrant as specified in charter)
805 King Farm Boulevard, Suite 600
Rockville, Maryland 20850
(Address of principal executive offices) (Zip code)
Donald C. Cacciapaglia, President
Security Equity Fund
805 King Farm Boulevard, Suite 600
Rockville, Maryland 20850
(Name and address of agent for service)
Registrant's telephone number, including area code: 1-301-296-5100
Date of fiscal year end: September 30
Date of reporting period: September 30, 2013
Form N-CSR is to be used by management investment companies to file reports with the Commission not later than 10 days after the transmission to stockholders of any report that is required to be transmitted to stockholders under Rule 30e-1 under the Investment Company Act of 1940 (17 CFR 270.30e-1). The Commission may use the information provided on Form N-CSR in its regulatory, disclosure review, inspection, and policymaking roles.
A registrant is required to disclose the information specified by Form N-CSR, and the Commission will make this information public. A registrant is not required to respond to the collection of information contained in Form N-CSR unless the Form displays a currently valid Office of Management and Budget (“OMB”) control number. Please direct comments concerning the accuracy of the information collection burden estimate and any suggestions for reducing the burden to Secretary, Securities and Exchange Commission, 450 Fifth Street, NW, Washington, DC 20549-0609. The OMB has reviewed this collection of information under the clearance requirements of 44 U.S.C. §3507.
| Item 1. | Reports to Stockholders. |
FUNDAMENTAL ALPHA
STYLEPLUS LARGE CORE FUND
(Formerly, Large Cap Core Fund)
MID CAP VALUE FUND
MID CAP VALUE INSTITUTIONAL FUND
SMALL CAP VALUE FUND
ENHANCED WORLD EQUITY FUND
WORLD EQUITY INCOME FUND
(Formerly, MSCI EAFE Equal Weight Fund)
OPPORTUNISTIC
ALPHA OPPORTUNITY FUND
SBE-ANN
GO GREEN!
ELIMINATE MAILBOX CLUTTER
Go paperless with Guggenheim Investments eDelivery—a service giving you full online access to account information and documents. Save time, cut down on mailbox clutter and be a friend to the environment with eDelivery.
With Guggenheim Investments eDelivery you can:
| · | View online confirmations and statements at your convenience. |
| · | Receive email notifications when your most recent confirmations, statements and other account documents are available for review. |
| · | Access prospectuses, annual reports and semiannual reports online. |

If you have questions about Guggenheim Investments
eDelivery services, contact one of our Shareholder Service
Representatives at 800.820.0888.

This report and the financial statements contained herein are submitted for the general information of our shareholders. The report is not authorized for distribution to prospective investors unless preceded or accompanied by an effective prospectus.
Distributed by Guggenheim Distributors, LLC.
TABLE OF CONTENTS
THE GUGGENHEIM FUNDS ANNUAL REPORT | 1
September 30, 2013
Dear Shareholder:
Security Investors, LLC (the “Investment Adviser”) is pleased to present the annual shareholder report for one or more of our Funds (the “Funds”) for the year ended September 30, 2013.
The Investment Adviser is part of Guggenheim Investments, which represents the investment management businesses of Guggenheim Partners, LLC, a global, diversified financial services firm.
Guggenheim Distributors, LLC is the distributor of the Funds. Guggenheim Distributors, LLC is affiliated with Guggenheim Partners, LLC and Security Investors, LLC.
We encourage you to read the Economic and Market Overview section of the report, which follows this letter, and then the Managers’ Commentary for each Fund.
We are committed to providing innovative investment solutions and appreciate the trust you place in us.
Sincerely,

Donald C. Cacciapaglia
President
October 31, 2013
Read a prospectus and summary prospectus (if available) carefully before investing. It contains the investment objectives, risks, charges, expenses and other information, which should be considered carefully before investing. Obtain a prospectus and summary prospectus (if available) at guggenheiminvestments.com or call 800.820.0888.
StylePlus Large Core Fund may not be suitable for all investors. • Investments in large capitalization stocks may underperform other segments of the equity market or the equity market as a whole. • Growth stocks may be more volatile than other stocks because they are more sensitive to investor perceptions regarding the growth potential of the issuing companies. Value stocks are subject to the risk that the intrinsic value of the stock may never be realized by the market, or that the price goes down. • The Fund may invest in derivative instruments, which may be more volatile and less liquid, increasing the risk of loss when compared to traditional securities. Certain of the derivative instruments are also subject to the risks of counterparty default and adverse tax treatment. • The Fund’s use of leverage, through borrowings or instruments such as derivatives, may cause the Fund to be more volatile than if it had not been leveraged. • The Fund’s investments in other investment vehicles subject the Fund to those risks and expenses affecting the investment vehicle. • The Fund may invest in foreign securities which carry additional risks when compared to U.S. securities, due to the impact of diplomatic, political or economic developments in the country in question (investments in emerging markets securities are generally subject to an even greater level of risks). • The Fund may invest in fixed income securities whose market value will change in response to interest rate changes and market conditions, among other factors. In general, bond prices rise when interest rates fall and vice versa. • The Fund’s exposure to high yield securities may subject the Fund to greater volatility. • The Fund may invest in bank loans and asset-backed securities, including mortgage backed, which involve special types of risks. • The Fund may invest in restricted securities which may involve financial and liquidity risk. • You may have a gain or loss when you sell your shares. • It is important to note that the Fund is not guaranteed by the U.S. government.
2 | THE GUGGENHEIM FUNDS ANNUAL REPORT
September 30, 2013
Mid Cap Value Fund and Mid Cap Value Institutional Fund may not be suitable for all investors. • An investment in the fund will fluctuate and is subject to investment risks, which means investors could lose money. • The intrinsic value of the underlying stocks may never be realized, or the stock may decline in value. • Investments in small to mid- sized company securities may present additional risks such as less predictable earnings, higher volatility and less liquidity than larger, more established companies.
Small Cap Value Fund may not be suitable for all investors. • An investment in the fund will fluctuate and is subject to investment risks, which means investors could lose money. • The intrinsic value of the underlying stocks may never be realized, or the stock may decline in value. • Investments in small-sized company securities may present additional risks such as less predictable earnings, higher volatility and less liquidity than larger, more established companies.
Enhanced World Equity Fund may not be suitable for all investors. • Investments in securities in general are subject to market risks that may cause their prices to fluctuate over time. • The Fund’s investments in foreign securities carry additional risks when compared to U.S. securities, due to the impact of diplomatic, political or economic developments in the country in question (investments in emerging markets securities are generally subject to an even greater level of risks). Additionally, the Fund’s exposure to foreign currencies subjects the Fund to the risk that those currencies will decline in value relative to the U.S. dollar. • The Fund may invest in derivative instruments, which may be more volatile and less liquid, increasing the risk of loss when compared to traditional securities. Certain of the derivative instruments are also subject to the risks of counterparty default and adverse tax treatment. • The Fund’s investments in other investment vehicles subject the Fund to those risks and expenses affecting the investment vehicle. • The Fund’s investment in fixed income securities will change in value in response to interest rate changes and other factors. In general, bond prices rise when interest rates fall and vice versa. • The Fund’s exposure to high yield securities may subject the Fund to greater volatility. • The Fund may invest in bank loans and asset-backed securities, including mortgage backed, which involve special types of risks. • The Funds may invest in restricted securities which may involve financial and liquidity risk. • The Fund’s use of leverage, through borrowings or instruments such as derivatives, may cause the Fund to be more volatile and riskier than if it had not been leveraged. • You may have a gain or loss when you sell your shares. • See the prospectus for more information on these and other risks.
World Equity Income Fund may not be suitable for all investors. • Investments in securities in general are subject to market risks that may cause their prices to fluctuate over time. • The Fund’s investments in foreign securities carry additional risks when compared to U.S. securities, due to the impact of diplomatic, political or economic developments in the country in question (investments in emerging markets are generally subject to an even greater level of risks). Additionally, the Fund’s exposure to foreign currencies subjects the Fund to the risk that those currencies will decline in value relative to the U.S. dollar. • The Fund’s investments in derivatives may pose risks in addition to those associated with investing directly in securities or other investments, including illiquidity of the derivatives, imperfect correlations with underlying investments or the Fund’s other portfolio holdings, lack of availability and counterparty risk. • The Fund’s use of leverage, through instruments such as derivatives, may cause the fund to be more volatile than if it had not been leveraged. • The Fund’s investments in other investment vehicles subject the Fund to those risks and expenses affecting the investment vehicle. • The Fund may have significant exposure to securities in a particular capitalization range, e.g., large-, mid- or small-cap securities. As a result, the Fund may be subject to the risk that the predominant capitalization range may underperform other segments of the equity market or the equity market as a whole.
Alpha Opportunity Fund may not be suitable for all investors. • Value stocks are subject to the risk that the intrinsic value of the stock may never be realized by the market, or that the stock’s price will decline in value. • Growth stocks may be more volatile than other stocks because they are more sensitive to investor perceptions regarding the growth potential of the issuing company.
THE GUGGENHEIM FUNDS ANNUAL REPORT | 3
| ECONOMIC AND MARKET OVERVIEW | September 30, 2013 |
For much of the 12-month period ended September 30, 2013, the U.S. economy and investment markets benefited from continued monetary accommodation from the world’s central banks and an improving picture for housing and employment.
Volatility rose in the final weeks of the period, however, as markets braced for a government shutdown over a budget impasse and suspected that the U.S. economy is not expanding quickly enough. In addition, confusion clouded the expected start of the end of quantitative easing (QE), speculation over which began rattling investors as far back as May. In refraining from tapering in September, the Fed made it clear that it does not currently see enough economic growth potential to remove extreme monetary accommodation.
The pace of job creation in this economic expansion continues to be subpar. Although the unemployment rate mid-year fell to a four and a half year low, its decline was more a function of a declining labor force participation rate than exuberant hiring. Additionally, solid job gains in the private sector over the period were overshadowed by sluggish growth in aggregate earnings, owing to a rising share of part-time employment which puts downward pressure on consumption growth.
Economic data continue to confirm that housing has been the key pillar supporting the ongoing U.S. expansion, generating 50% of growth in the first half of 2013. Concerns about tapering mid-year drove interest rates higher, with mortgage rates rising by over 100 basis points from May through August. This is having a severe impact on housing, even though it may not show up in the economic data until later in the year.
Markets also have had to deal with substantial uncertainty overseas. Fears of a Chinese credit crunch stoked investor anxiety, and measures implemented to address structural problems in China’s economy appear to be temporary rather than long-term solutions. The devaluation of the Japanese yen is putting pressure on all the economies in the region, making the global economy vulnerable to an unexpected economic shock. Europe, meanwhile, is bouncing along a bottom, and the growth outlook, while improving, remains weak.
From a policy standpoint, the Fed appears to be concerned about the impact higher interest rates are having on the economy and the housing sector in particular, and it seems to be guiding long-term rates closer to the rate of inflation to stimulate growth. The Federal Open Market Committee has been very clear that the Fed will not allow interest rates to rise significantly until output and the crucial real estate market have reaccelerated.
For the year ended September 30, 2013, the return of the Standard & Poor’s 500® Index* (“S&P 500”) was 19.34%. The Barclays U.S. Aggregate Bond Index* returned -1.68% for the period, while the Bank of America Merrill Lynch 3-Month U.S. Treasury Bill Index* returned 0.10%. The MSCI World Index* returned 20.23%, while the MSCI Emerging Markets Index* returned 0.98%.
The opinions and forecasts expressed may not actually come to pass. This information is subject to change at any time, based on market and other conditions, and should not be construed as a recommendation of any specific security or strategy.
*Index Definitions:
The following indices are referenced throughout this report. Indices are unmanaged and not available for direct investment. Index performance does not reflect transaction costs, fees, or expenses.
Bank of America Merrill Lynch 3-Month U.S. Treasury Bill Index is an unmanaged market index of U.S. Treasury securities maturing in 90 days that assumes reinvestment of all income.
Barclays U.S. Aggregate Bond Index is a broad-based benchmark that measures the investment grade, U.S. dollar-denominated, fixed-rate taxable bond market, including U.S. Treasuries, government-related and corporate securities, MBS (agency fixed-rate and hybrid ARM pass-throughs), ABS and CMBS.
MSCI Emerging Markets Index is a free float-adjusted market capitalization weighted index that is designed to measure equity market performance in the global emerging markets.
MSCI World Index is a free float-adjusted market capitalization weighted index that is designed to measure the equity market performance of developed markets.
S&P 500® Index is a capitalization-weighted index of 500 stocks designed to measure the performance of the broad economy, representing all major industries and is considered a representation of the U.S. stock market.
Russell 2500® Value Index measures the performance of the small- to mid-cap value segment of the U.S. equity universe. It includes those Russell 2500 companies with lower price-to-book ratios and lower forecasted growth values.
Russell 2000® Value Index measures the performance of the small-cap value segment of the U.S. equity universe. It includes those Russell 2000 companies with lower price-to-book ratios and lower forecasted growth values.
Russell 1000® Value Index: A measure of the performance for the large-cap value segment of the U.S. equity universe. It includes those Russell 1000 companies with lower price-to-book ratios and lower expected growth values.
MSCI All-Country World Index (ACWI) is a free float-adjusted market capitalization weighted index that is designed to measure the equity market performance of developed and emerging markets.
4 | THE GUGGENHEIM FUNDS ANNUAL REPORT
ABOUT SHAREHOLDERS’ FUND EXPENSES (Unaudited)
All mutual funds have operating expenses and it is important for our shareholders to understand the impact of costs on their investments. Shareholders of a Fund incur two types of costs: (i) transaction costs, including sales charges (loads) on purchase payments, reinvested dividends, or other distributions; and exchange fees; and (ii) ongoing costs, including management fees, administrative services, and shareholder reports, among others. These ongoing costs, or operating expenses, are deducted from a fund’s gross income and reduce the investment return of the fund.
A fund’s expenses are expressed as a percentage of its average net assets, which is known as the expense ratio. The following examples are intended to help investors understand the ongoing costs (in dollars) of investing in a Fund and to compare these costs with the ongoing costs of investing in other mutual funds.
The examples are based on an investment of $1,000 made at the beginning of the period and held for the entire six-month period beginning March 31, 2013 and ending September 30, 2013.
The following tables illustrate a Fund’s costs in two ways:
Table 1. Based on actual Fund return. This section helps investors estimate the actual expenses paid over the period. The “Ending Account Value” shown is derived from the Fund’s actual return, and the fourth column shows the dollar amount that would have been paid by an investor who started with $1,000 in the Fund. Investors may use the information here, together with the amount invested, to estimate the expenses paid over the period. Simply divide the Fund’s account value by $1,000 (for example, an $8,600 account value divided by $1,000 = 8.6), then multiply the result by the number provided under the heading “Expenses Paid During Period.”
Table 2. Based on hypothetical 5% return. This section is intended to help investors compare a Fund’s cost with those of other mutual funds. The table provides information about hypothetical account values and hypothetical expenses based on the Fund’s actual expense ratio and an assumed rate of return of 5% per year before expenses, which is not the Fund’s actual return. The hypothetical account values and expenses may not be used to estimate the actual ending account balance or expenses paid during the period. The example is useful in making comparisons because the U.S. Securities and Exchange Commission (the “SEC”) requires all mutual funds to calculate expenses based on the 5% return. Investors can assess a Fund’s costs by comparing this hypothetical example with the hypothetical examples that appear in shareholder reports of other funds.
The calculations illustrated above assume no shares were bought or sold during the period. Actual costs may have been higher or lower, depending on the amount of investment and the timing of any purchases or redemptions.
Please note that the expenses shown in the table are meant to highlight your ongoing costs only and do not reflect any transactional costs, such as sales charges (loads) on purchase payments, and contingent deferred sales charges (“CDSC”) on redemptions, if any. Therefore, the second table is useful in comparing ongoing costs only, and will not help you determine the relative total costs of owning different funds. In addition, if these transactional costs were included, your costs would have been higher.
More information about a Fund’s expenses, including annual expense ratios for the past five years, can be found in the Financial Highlights section of this report. For additional information on operating expenses and other shareholder costs, please refer to the appropriate Fund prospectus.
THE GUGGENHEIM FUNDS ANNUAL REPORT | 5
ABOUT SHAREHOLDERS’ FUND EXPENSES (Unaudited) (continued)
| | | | | | | | | Beginning | | | Ending | | | Expenses | |
| | | Expense | | | Fund | | | Account Value | | | Account Value | | | Paid During | |
| | | Ratio1 | | | Return | | | March 31, 2013 | | | September 30, 2013 | | | Period2 | |
| Table 1. Based on actual Fund return3 | | | | | | | | | | | | | | | | | | | | |
| | | | | | | | | | | | | | | | | | | | | |
| StylePlus Large Core Fund | | | | | | | | | | | | | | | | | | | | |
| A-Class | | | 1.40 | % | | | 6.08 | % | | | $1,000.00 | | | | $1,060.80 | | | | $ 7.23 | |
| B-Class | | | 2.71 | % | | | 5.32 | % | | | 1,000.00 | | | | 1,053.20 | | | | 13.95 | |
| C-Class | | | 2.37 | % | | | 5.55 | % | | | 1,000.00 | | | | 1,055.50 | | | | 12.21 | |
| Institutional Class | | | 1.24 | % | | | 6.13 | % | | | 1,000.00 | | | | 1,061.30 | | | | 6.41 | |
| | | | | | | | | | | | | | | | | | | | | |
| Mid Cap Value Fund | | | | | | | | | | | | | | | | | | | | |
| A-Class | | | 1.39 | % | | | 7.80 | % | | | 1,000.00 | | | | 1,078.00 | | | | 7.24 | |
| B-Class | | | 2.16 | % | | | 7.39 | % | | | 1,000.00 | | | | 1,073.90 | | | | 11.23 | |
| C-Class | | | 2.16 | % | | | 7.39 | % | | | 1,000.00 | | | | 1,073.90 | | | | 11.23 | |
| | | | | | | | | | | | | | | | | | | | | |
| Mid Cap Value Institutional Fund | | | 1.04 | % | | | 7.74 | % | | | 1,000.00 | | | | 1,077.40 | | | | 5.42 | |
| | | | | | | | | | | | | | | | | | | | | |
| Small Cap Value Fund | | | | | | | | | | | | | | | | | | | | |
| A-Class | | | 1.30 | % | | | 10.62 | % | | | 1,000.00 | | | | 1,106.20 | | | | 6.86 | |
| C-Class | | | 2.05 | % | | | 10.14 | % | | | 1,000.00 | | | | 1,101.40 | | | | 10.80 | |
| Institutional Class | | | 1.05 | % | | | 10.74 | % | | | 1,000.00 | | | | 1,107.40 | | | | 5.55 | |
| | | | | | | | | | | | | | | | | | | | | |
| Enhanced World Equity Fund5 | | | | | | | | | | | | | | | | | | | | |
| A-Class | | | 1.25 | % | | | 4.32 | % | | | 1,000.00 | | | | 1,043.20 | | | | 3.60 | |
| C-Class | | | 2.00 | % | | | 4.00 | % | | | 1,000.00 | | | | 1,040.00 | | | | 5.76 | |
| Institutional Class | | | 1.00 | % | | | 4.40 | % | | | 1,000.00 | | | | 1,044.00 | | | | 2.88 | |
| | | | | | | | | | | | | | | | | | | | | |
| World Equity Income Fund | | | | | | | | | | | | | | | | | | | | |
| A-Class | | | 1.52 | % | | | 9.24 | % | | | 1,000.00 | | | | 1,092.40 | | | | 7.97 | |
| B-Class4 | | | 1.28 | % | | | 9.36 | % | | | 1,000.00 | | | | 1,093.60 | | | | 6.72 | |
| C-Class | | | 2.27 | % | | | 8.72 | % | | | 1,000.00 | | | | 1,087.20 | | | | 11.88 | |
| Institutional Class | | | 1.27 | % | | | 9.57 | % | | | 1,000.00 | | | | 1,095.70 | | | | 6.67 | |
| | | | | | | | | | | | | | | | | | | | | |
| Alpha Opportunity Fund | | | | | | | | | | | | | | | | | | | | |
| A-Class | | | 2.14 | % | | | 10.90 | % | | | 1,000.00 | | | | 1,109.00 | | | | 11.31 | |
| B-Class | | | 2.87 | % | | | 10.44 | % | | | 1,000.00 | | | | 1,104.40 | | | | 15.14 | |
| C-Class | | | 2.88 | % | | | 10.52 | % | | | 1,000.00 | | | | 1,105.20 | | | | 15.20 | |
| Institutional Class | | | 1.90 | % | | | 11.05 | % | | | 1,000.00 | | | | 1,110.50 | | | | 10.05 | |
6 | THE GUGGENHEIM FUNDS ANNUAL REPORT
ABOUT SHAREHOLDERS’ FUND EXPENSES (Unaudited) (concluded)
| | | | | | | | | Beginning | | | Ending | | | Expenses | |
| | | Expense | | | Fund | | | Account Value | | | Account Value | | | Paid During | |
| | | Ratio1 | | | Return | | | March 31, 2013 | | | September 30, 2013 | | | Period2 | |
| Table 2. Based on hypothetical 5% return (before expenses) | | | | | | | | | | | | |
| | | | | | | | | | | | | | | | | | | | | |
| StylePlus Large Core Fund | | | | | | | | | | | | | | | | | | | | |
| A-Class | | | 1.40 | % | | | 5.00 | % | | $ | 1,000.00 | | | $ | 1,018.05 | | | $ | 7.08 | |
| B-Class | | | 2.71 | % | | | 5.00 | % | | | 1,000.00 | | | | 1,011.48 | | | | 13.67 | |
| C-Class | | | 2.37 | % | | | 5.00 | % | | | 1,000.00 | | | | 1,013.19 | | | | 11.96 | |
| Institutional Class | | | 1.24 | % | | | 5.00 | % | | | 1,000.00 | | | | 1,018.85 | | | | 6.28 | |
| | | | | | | | | | | | | | | | | | | | | |
| Mid Cap Value Fund | | | | | | | | | | | | | | | | | | | | |
| A-Class | | | 1.39 | % | | | 5.00 | % | | | 1,000.00 | | | | 1,018.10 | | | | 7.03 | |
| B-Class | | | 2.16 | % | | | 5.00 | % | | | 1,000.00 | | | | 1,014.24 | | | | 10.91 | |
| C-Class | | | 2.16 | % | | | 5.00 | % | | | 1,000.00 | | | | 1,014.24 | | | | 10.91 | |
| | | | | | | | | | | | | | | | | | | | | |
| Mid Cap Value Institutional Fund | | | 1.04 | % | | | 5.00 | % | | | 1,000.00 | | | | 1,019.85 | | | | 5.27 | |
| | | | | | | | | | | | | | | | | | | | | |
| Small Cap Value Fund | | | | | | | | | | | | | | | | | | | | |
| A-Class | | | 1.30 | % | | | 5.00 | % | | | 1,000.00 | | | | 1,018.55 | | | | 6.58 | |
| C-Class | | | 2.05 | % | | | 5.00 | % | | | 1,000.00 | | | | 1,014.79 | | | | 10.35 | |
| Institutional Class | | | 1.05 | % | | | 5.00 | % | | | 1,000.00 | | | | 1,019.80 | | | | 5.32 | |
| | | | | | | | | | | | | | | | | | | | | |
| Enhanced World Equity Fund | | | | | | | | | | | | | | | | | | | | |
| A-Class | | | 1.25 | % | | | 5.00 | % | | | 1,000.00 | | | | 1,018.80 | | | | 6.33 | |
| C-Class | | | 2.00 | % | | | 5.00 | % | | | 1,000.00 | | | | 1,015.04 | | | | 10.10 | |
| Institutional Class | | | 1.00 | % | | | 5.00 | % | | | 1,000.00 | | | | 1,020.05 | | | | 5.06 | |
| | | | | | | | | | | | | | | | | | | | | |
| World Equity Income Fund | | | | | | | | | | | | | | | | | | | | |
| A-Class | | | 1.52 | % | | | 5.00 | % | | | 1,000.00 | | | | 1,017.45 | | | | 7.69 | |
| B-Class4 | | | 1.28 | % | | | 5.00 | % | | | 1,000.00 | | | | 1,018.65 | | | | 6.48 | |
| C-Class | | | 2.27 | % | | | 5.00 | % | | | 1,000.00 | | | | 1,013.69 | | | | 11.46 | |
| Institutional Class | | | 1.27 | % | | | 5.00 | % | | | 1,000.00 | | | | 1,018.70 | | | | 6.43 | |
| | | | | | | | | | | | | | | | | | | | | |
| Alpha Opportunity Fund | | | | | | | | | | | | | | | | | | | | |
| A-Class | | | 2.14 | % | | | 5.00 | % | | | 1,000.00 | | | | 1,014.34 | | | | 10.81 | |
| B-Class | | | 2.87 | % | | | 5.00 | % | | | 1,000.00 | | | | 1,010.68 | | | | 14.47 | |
| C-Class | | | 2.88 | % | | | 5.00 | % | | | 1,000.00 | | | | 1,010.63 | | | | 14.52 | |
| Institutional Class | | | 1.90 | % | | | 5.00 | % | | | 1,000.00 | | | | 1,015.54 | | | | 9.60 | |
| 1 | Annualized and excludes expenses of the underlying funds in which the Funds invest. This ratio represents net expenses, which includes dividends on short sales and interest expenses. Excluding these expenses, the operating expense ratio of the Alpha Opportunity Fund would be 2.10%, 2.85%, 2.86% and 1.87% for the A-Class, B-Class, C-Class and Institutional Class, respectively. |
| 2 | Expenses are equal to the Fund’s annualized expense ratio, net of any applicable fee waivers, multiplied by the average account value over the period, multiplied by 183/365 (to reflect the one-half year period). |
| 3 | Actual cumulative return at net asset value for the period March 31, 2013 to September 30, 2013. |
| 4 | B-Class shares did not charge 12b-1 fees during the period. |
| 5 | Since commencement of operations: June 18, 2013. |
THE GUGGENHEIM FUNDS ANNUAL REPORT | 7
| MANAGERS’ COMMENTARY (Unaudited) | September 30, 2013 |
To Our Shareholders:
Guggenheim StylePlus Large Core Fund (the “Fund”) is managed by a team of seasoned professionals, including B. Scott Minerd, Global Chief Investment Officer; Farhan Sharaff, Senior Managing Director and Assistant Chief Investment Officer, Equities; Jayson Flowers, Senior Managing Director and Head of Equity and Derivative Strategies; and Scott Hammond, Managing Director and Portfolio Manager. In the following paragraphs, the investment team discusses performance and changes to the Fund that occurred in the fiscal year ended September 30, 2013.
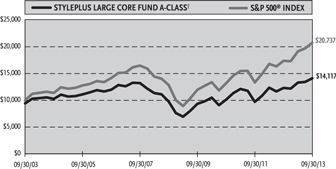
For the year ended September 30, 2013, the Guggenheim StylePlus Large Core Fund returned 14.64%1, compared with the 19.34% return of its benchmark, the S&P 500 Index.
The Fund’s Board of Directors approved the following changes, which became effective on April 30, 2013: a new Fund name, new principal investment strategies and new portfolio management team.
The Fund’s -investment objective is to deliver long-term growth of capital in excess of that produced by the total return of the S&P 500 Index. The Fund seeks to add alpha above the target index by leveraging Guggenheim’s competencies in fixed income and systematic stock selection. To accomplish this, the StylePlus strategy allocates to quantitative selection models when stock picking opportunities in the market are high. When stock selection opportunities are less attractive, the Fund invests in derivatives based on the target index, backed by a diversified portfolio of fixed income instruments. In this way, the Fund believes it will deliver the target index return plus an alpha component commensurate with the yield achieved on the active fixed income portfolio.
The Fund’s underperformance for the 12 months came predominantly during the seven months it was being managed according to the legacy strategy. Specifically—from October 1, 2012 through April 30, 2013—the Fund underperformed the benchmark by almost five percentage points, largely due to poor stock selection in the Information Technology and Financials sectors—the latter being the largest and best-performing sector in the benchmark. The Fund’s cash position was also a drag on performance. A sector overweight and stock selection in Consumer Discretionary contributed most to the Fund’s performance.
For the time the Fund was being managed according to the new strategy, the five months from April 30, 2013 through September 30, 2013, the Fund performed in-line with the benchmark. During this period, the Fund maintained an approximate allocation of 20% to systematic equity selection, 80% allocated to the passive equity position, which was maintained with a swap and futures contracts, and 46% allocated to fixed income investments (excluding short-term). The equity sleeve was additive, delivering the strongest returns during the month of May and June. The fixed income allocation was a net detractor to performance, with the greatest impact occurring during the substantial debt selloff that began at the end of May and lasted in to June.
Performance displayed represents past performance which is no guarantee of future results.
1 Performance figures are based on A-Class shares and do not reflect deduction of the sales charges or taxes that a shareholder would pay on distributions or the redemption of shares.
The opinions and forecast expressed may not actually come to pass. This information is subject to change at any time, based on market and other conditions, and should not be construed as a recommendation of any specific security or strategy.
8 | THE GUGGENHEIM FUNDS ANNUAL REPORT
| PERFORMANCE REPORT AND FUND PROFILE (Unaudited) | September 30, 2013 |
STYLEPLUS LARGE CORE FUND
OBJECTIVE: Seeks long-term growth of capital.
Cumulative Fund Performance*
Average Annual Returns*
Periods Ended 09/30/13
| | | 1 Year | | | 5 Year | | | 10 Year | |
| A-Class Shares | | | 14.64 | % | | | 7.64 | % | | | 4.12 | % |
| A-Class Shares with sales charge† | | | 9.19 | % | | | 6.37 | % | | | 3.51 | % |
| B-Class Shares | | | 13.19 | % | | | 6.64 | % | | | 3.50 | % |
| B-Class Shares with CDSC‡ | | | 8.19 | % | | | 6.33 | % | | | 3.50 | % |
| C-Class Shares | | | 13.55 | % | | | 6.83 | % | | | 3.33 | % |
| C-Class Shares with CDSC§ | | | 12.55 | % | | | 6.83 | % | | | 3.33 | % |
| S&P 500 Index | | | 19.34 | % | | | 10.02 | % | | | 7.57 | % |
| | | | | | Since Inception | |
| | | 1 Year | | | (03/01/12) | |
| Institutional Class Shares | | | 14.79 | % | | | 10.55 | % |
| S&P 500 Index | | | 19.34 | % | | | 16.12 | % |
Holdings Diversification (Market Exposure as % of Net Assets)
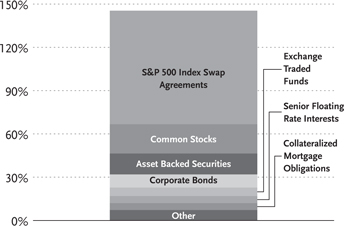
“Holdings Diversification (Market Exposure as % of Net Assets)” excludes any temporary cash investments.
| Inception Dates: | |
| A-Class | September 10, 1962 |
| B-Class | October 19, 1993 |
| C-Class | January 29, 1999 |
| Institutional Class | March 1, 2012 |
| * | The performance data above represents past performance that is not predictive of future results. The investment return and principal value of an investment in the Fund will fluctuate so that an investor’s shares, when redeemed, may be worth more or less than their original cost. Returns are historical and include changes in principal and reinvested dividends and capital gains and do not reflect the effect of taxes. The S&P 500 Index is an unmanaged index and, unlike the Fund, has no management fees or operating expenses to reduce its reported return. |
| † | Effective February 22, 2011, the maximum sales charge decreased from 5.75% to 4.75%. A 5.75% maximum sales charge is used in the calculation of the 5 Year and 10 Year average annual returns (based on subscriptions made prior to February 22, 2011), and a 4.75% maximum sales charge will be used to calculate performance for periods based on subscriptions made on or after February 22, 2011. |
| ‡ | Fund returns include a CDSC of up to 5% if redeemed within 5 years of purchase. |
| § | Fund returns include a CDSC of 1% if redeemed within 12 months of purchase. |
THE GUGGENHEIM FUNDS ANNUAL REPORT | 9
| PERFORMANCE AND FUND PROFILE (Unaudited)(concluded) | September 30, 2013 |
| Ten Largest Holdings (% of Total Net Assets) | | | | |
| Dreyfus Treasury Prime Cash Management Fund | | | 18.3 | % |
| Geer Mountain Financing Ltd. — 2007-1A | | | 2.2 | % |
| Guggenheim Enhanced Short Duration ETF | | | 2.2 | % |
| Floating Rate Strategies Fund Institutional Class | | | 1.8 | % |
| Macro Opportunities Fund Institutional Class | | | 1.8 | % |
| New York City Water & Sewer System Revenue Bonds | | | 1.4 | % |
| Duane Street CLO IV Ltd. — 2007-4A | | | 1.4 | % |
| Apidos CDO VIII — 2011-8A | | | 1.3 | % |
| Wachovia Bank Commercial Mortgage Trust Series 2007-WHALE 2007-WHL8 | | | 1.3 | % |
| Guggenheim BulletShares 2014 High Yield Corporate Bond ETF | | | 1.2 | % |
| Top Ten Total | | | 32.9 | % |
Portfolio Composition by Quality Rating*
| Fixed Income Instruments | | | | |
| AAA | | | 21.7 | % |
| AA | | | 3.3 | % |
| A | | | 6.2 | % |
| BBB | | | 12.7 | % |
| BB | | | 3.6 | % |
| B | | | 3.5 | % |
| CCC | | | 0.4 | % |
| NR | | | 0.6 | % |
| Other Instruments | | | | |
| Common Stock | | | 20.2 | % |
| Short Term Investments | | | 18.3 | % |
| Exchanged Traded Funds | | | 5.9 | % |
| Mutual Funds | | | 3.6 | % |
| Total Investments | | | 100.0 | % |
The table above reflects percentages of the value of total investments.
| * | Source: Factset. Credit quality ratings are measured on a scale that generally ranges from AAA (highest) to D (lowest). All securities have been rated by Moody’s, Standard & Poor’s (“S&P”), or Fitch, which are all a Nationally Recognized Statistical Rating Organization (“NRSRO”). For purposes of this presentation, when ratings are available from more than one agency, the highest rating is used. Guggenheim Investments has converted Moody’s and Fitch ratings to the equivalent S&P rating. Unrated securities do not necessarily indicate low credit quality. Security ratings are determined at the time of purchase and may change thereafter. |
10 | THE GUGGENHEIM FUNDS ANNUAL REPORT
| SCHEDULE OF INVESTMENTS | September 30, 2013 |
| STYLEPLUS LARGE CORE FUND |
| | | Shares | | | Value | |
| | | | | | | |
| COMMON STOCKS† - 20.2% | | | | | | | | |
| | | | | | | | | |
| INFORMATION TECHNOLOGY - 3.8% | | | | | | | | |
| Apple, Inc. | | | 2,258 | | | $ | 1,076,501 | |
| International Business Machines Corp. | | | 3,528 | | | | 653,315 | |
| Cisco Systems, Inc. | | | 23,842 | | | | 558,380 | |
| Hewlett-Packard Co. | | | 25,642 | | | | 537,969 | |
| Microsoft Corp. | | | 15,294 | | | | 509,443 | |
| Intel Corp. | | | 19,074 | | | | 437,176 | |
| Corning, Inc. | | | 28,147 | | | | 410,665 | |
| Oracle Corp. | | | 11,865 | | | | 393,562 | |
| QUALCOMM, Inc. | | | 5,539 | | | | 373,107 | |
| Google, Inc. — Class A* | | | 413 | | | | 361,751 | |
| Applied Materials, Inc. | | | 17,932 | | | | 314,527 | |
| EMC Corp. | | | 12,118 | | | | 309,736 | |
| Symantec Corp. | | | 11,972 | | | | 296,307 | |
| TE Connectivity Ltd. | | | 5,612 | | | | 290,589 | |
| Visa, Inc. — Class A | | | 669 | | | | 127,846 | |
| Accenture plc — Class A | | | 1,611 | | | | 118,634 | |
| Automatic Data Processing, Inc. | | | 1,484 | | | | 107,412 | |
| Total Information Technology | | | | | | | 6,876,920 | |
| HEALTH CARE - 3.5% | | | | | | | | |
| Pfizer, Inc. | | | 31,082 | | | | 892,365 | |
| Johnson & Johnson | | | 8,089 | | | | 701,235 | |
| Merck & Company, Inc. | | | 13,878 | | | | 660,732 | |
| Abbott Laboratories | | | 17,020 | | | | 564,893 | |
| Express Scripts Holding Co.* | | | 9,010 | | | | 556,638 | |
| McKesson Corp. | | | 4,197 | | | | 538,475 | |
| Becton Dickinson and Co. | | | 4,191 | | | | 419,183 | |
| UnitedHealth Group, Inc. | | | 5,700 | | | | 408,177 | |
| Bristol-Myers Squibb Co. | | | 8,554 | | | | 395,879 | |
| Medtronic, Inc. | | | 6,990 | | | | 372,218 | |
| Covidien plc | | | 4,340 | | | | 264,480 | |
| Eli Lilly & Co. | | | 4,309 | | | | 216,872 | |
| AbbVie, Inc. | | | 3,951 | | | | 176,728 | |
| Intuitive Surgical, Inc.* | | | 277 | | | | 104,227 | |
| Baxter International, Inc. | | | 1,559 | | | | 102,411 | |
| Total Health Care | | | | | | | 6,374,513 | |
| INDUSTRIALS - 3.5% | | | | | | | | |
| General Electric Co. | | | 38,349 | | | | 916,158 | |
| General Dynamics Corp. | | | 6,223 | | | | 544,636 | |
| Boeing Co. | | | 4,439 | | | | 521,583 | |
| Waste Management, Inc. | | | 12,013 | | | | 495,416 | |
| Caterpillar, Inc. | | | 5,524 | | | | 460,536 | |
| CSX Corp. | | | 17,206 | | | | 442,883 | |
| United Parcel Service, Inc. — Class B | | | 4,548 | | | | 415,550 | |
| Raytheon Co. | | | 4,560 | | | | 351,439 | |
| Emerson Electric Co. | | | 4,961 | | | | 320,977 | |
| FedEx Corp. | | | 2,796 | | | | 319,052 | |
| Northrop Grumman Corp. | | | 3,176 | | | | 302,546 | |
| Union Pacific Corp. | | | 1,889 | | | | 293,437 | |
| Lockheed Martin Corp. | | | 1,878 | | | | 239,539 | |
| Norfolk Southern Corp. | | | 2,966 | | | | 229,420 | |
| Deere & Co. | | | 1,860 | | | | 151,385 | |
| Ingersoll-Rand plc | | | 2,107 | | | | 136,829 | |
| United Technologies Corp. | | | 1,071 | | | | 115,475 | |
| Illinois Tool Works, Inc. | | | 1,497 | | | | 114,176 | |
| Total Industrials | | | | | | | 6,371,037 | |
| CONSUMER STAPLES - 3.3% | | | | | | | | |
| Wal-Mart Stores, Inc. | | | 9,418 | | | | 696,555 | |
| CVS Caremark Corp. | | | 10,771 | | | | 611,254 | |
| Walgreen Co. | | | 10,921 | | | | 587,550 | |
| Procter & Gamble Co. | | | 6,760 | | | | 510,989 | |
| PepsiCo, Inc. | | | 6,185 | | | | 491,707 | |
| Kroger Co. | | | 10,344 | | | | 417,277 | |
| Archer-Daniels-Midland Co. | | | 11,117 | | | | 409,550 | |
| Philip Morris International, Inc. | | | 4,222 | | | | 365,582 | |
| Kimberly-Clark Corp. | | | 3,829 | | | | 360,768 | |
| Altria Group, Inc. | | | 10,213 | | | | 350,817 | |
| Mondelez International, Inc. — Class A | | | 9,911 | | | | 311,404 | |
| Sysco Corp. | | | 9,585 | | | | 305,091 | |
| General Mills, Inc. | | | 5,613 | | | | 268,975 | |
| Coca-Cola Co. | | | 4,367 | | | | 165,422 | |
| Costco Wholesale Corp. | | | 1,082 | | | | 124,560 | |
| Reynolds American, Inc. | | | 2,232 | | | | 108,877 | |
| Total Consumer Staples | | | | | | | 6,086,378 | |
| ENERGY - 2.4% | | | | | | | | |
| Exxon Mobil Corp. | | | 12,876 | | | | 1,107,850 | |
| Chevron Corp. | | | 4,519 | | | | 549,058 | |
| ConocoPhillips | | | 7,222 | | | | 502,001 | |
| Valero Energy Corp. | | | 13,976 | | | | 477,281 | |
| Anadarko Petroleum Corp. | | | 3,815 | | | | 354,757 | |
| Baker Hughes, Inc. | | | 6,335 | | | | 311,049 | |
| Occidental Petroleum Corp. | | | 3,075 | | | | 287,636 | |
| Phillips 66 | | | 4,103 | | | | 237,235 | |
| Marathon Oil Corp. | | | 5,858 | | | | 204,327 | |
| Apache Corp. | | | 2,029 | | | | 172,749 | |
| Devon Energy Corp. | | | 1,880 | | | | 108,589 | |
| Total Energy | | | | | | | 4,312,532 | |
| FINANCIALS - 1.5% | | | | | | | | |
| JPMorgan Chase & Co. | | | 11,813 | | | | 610,615 | |
| Wells Fargo & Co. | | | 10,151 | | | | 419,439 | |
| Citigroup, Inc. | | | 8,042 | | | | 390,117 | |
| MetLife, Inc. | | | 6,510 | | | | 305,645 | |
| Legg Mason, Inc. | | | 8,457 | | | | 282,802 | |
| American International Group, Inc. | | | 4,111 | | | | 199,918 | |
| Allstate Corp. | | | 2,875 | | | | 145,331 | |
| Bank of America Corp. | | | 8,782 | | | | 121,192 | |
| Aflac, Inc. | | | 1,854 | | | | 114,929 | |
| Capital One Financial Corp. | | | 1,665 | | | | 114,452 | |
| Total Financials | | | | | | | 2,704,440 | |
| SEE NOTES TO FINANCIAL STATEMENTS. | THE GUGGENHEIM FUNDS ANNUAL REPORT | 11 |
| SCHEDULE OF INVESTMENTS (continued) | September 30, 2013 |
| STYLEPLUS LARGE CORE FUND | |
| | | Shares | | | Value | |
| | | | | | | |
| CONSUMER DISCRETIONARY - 1.2% | | | | | | | | |
| Comcast Corp. — Class A | | | 15,547 | | | $ | 701,948 | |
| Time Warner, Inc. | | | 6,775 | | | | 445,863 | |
| Target Corp. | | | 4,648 | | | | 297,379 | |
| Time Warner Cable, Inc. | | | 2,290 | | | | 255,564 | |
| Ford Motor Co. | | | 11,802 | | | | 199,099 | |
| Walt Disney Co. | | | 2,160 | | | | 139,298 | |
| General Motors Co.* | | | 3,179 | | | | 114,349 | |
| Total Consumer Discretionary | | | | | | | 2,153,500 | |
| UTILITIES - 0.6% | | | | | | | | |
| NextEra Energy, Inc. | | | 2,756 | | | | 220,920 | |
| DTE Energy Co. | | | 3,332 | | | | 219,846 | |
| American Electric Power Company, Inc. | | | 5,063 | | | | 219,481 | |
| Southern Co. | | | 5,320 | | | | 219,078 | |
| CenterPoint Energy, Inc. | | | 7,762 | | | | 186,055 | |
| Total Utilities | | | | | | | 1,065,380 | |
| TELECOMMUNICATION SERVICES - 0.3% | | | | | | | | |
| Verizon Communications, Inc. | | | 8,387 | | | | 391,338 | |
| CenturyLink, Inc. | | | 4,980 | | | | 156,272 | |
| Total Telecommunication Services | | | | | | | 547,610 | |
| MATERIALS - 0.1% | | | | | | | | |
| Mosaic Co. | | | 4,337 | | | | 186,578 | |
| Freeport-McMoRan Copper & Gold, Inc. | | | 3,500 | | | | 115,780 | |
| Total Materials | | | | | | | 302,358 | |
| Total Common Stocks | | | | | | | | |
| (Cost $35,054,971) | | | | | | | 36,794,668 | |
| EXCHANGE TRADED FUNDS†,5 - 5.9% | | | | | | | | |
| Guggenheim Enhanced Short Duration ETF | | | 78,942 | | | | 3,961,310 | |
| Guggenheim BulletShares 2014 | | | | | | | | |
| High Yield Corporate Bond ETF | | | 84,100 | | | | 2,244,797 | |
| Guggenheim BulletShares 2015 | | | | | | | | |
| High Yield Corporate Bond ETF | | | 84,000 | | | | 2,243,640 | |
| Guggenheim BulletShares 2016 | | | | | | | | |
| High Yield Corporate Bond ETF | | | 84,100 | | | | 2,242,106 | |
| Total Exchange Traded Funds | | | | | | | | |
| (Cost $10,701,818) | | | | | | | 10,691,853 | |
| MUTUAL FUNDS†,1 - 3.6% | | | | | | | | |
| Floating Rate Strategies Fund | | | | | | | | |
| Institutional Class | | | 125,103 | | | | 3,332,741 | |
| Macro Opportunities Fund | | | | | | | | |
| Institutional Class | | | 121,470 | | | | 3,199,526 | |
| Total Mutual Funds | | | | | | | | |
| (Cost $6,760,169) | | | | | | | 6,532,267 | |
| SHORT TERM INVESTMENTS† - 18.3% | | | | | | | | |
| Dreyfus Treasury Prime Cash | | | | | | | | |
| Management Fund | | | 33,228,393 | | | | 33,228,393 | |
| Total Short Term Investments | | | | | | | | |
| (Cost $33,228,393) | | | | | | | 33,228,393 | |
| | | | | | | |
| | | Face | | | | |
| | | Amount | | | | |
| | | | | | | | | |
| ASSET BACKED SECURITIES†† - 14.4% | | | | | | | | |
| Geer Mountain Financing Ltd. | | | | | | | | |
| 2007-1A, 0.57% due 04/01/142,3 | | $ | 4,000,000 | | | | 3,969,999 | |
| Duane Street CLO IV Ltd. | | | | | | | | |
| 2007-4A, 0.49% due 11/14/212,3 | | | 2,574,818 | | | | 2,504,010 | |
| Apidos CDO VIII | | | | | | | | |
| 2011-8A, 3.37% due 10/17/212,3 | | | 2,400,000 | | | | 2,400,010 | |
| Newcastle CDO Ltd. | | | | | | | | |
| 2007-9A, 0.43% due 05/25/52 | | | 2,160,965 | | | | 2,097,980 | |
| Garrison Funding Ltd. | | | | | | | | |
| 2013-2A, 2.05% due 09/25/232,3 | | | 1,980,000 | | | | 1,973,548 | |
| Brentwood CLO Corp. | | | | | | | | |
| 2006-1A, 0.54% due 02/01/222,3 | | | 1,263,398 | | | | 1,225,344 | |
| 2006-1A, 1.09% due 02/01/222,3 | | | 500,000 | | | | 444,844 | |
| Foothill CLO Ltd. | | | | | | | | |
| 2007-1A, 0.51% due 02/22/212,3 | | | 1,561,927 | | | | 1,526,335 | |
| Salus CLO Ltd. | | | | | | | | |
| 2013-1AN, 2.50% due 03/05/212,3 | | | 1,400,000 | | | | 1,407,742 | |
| N-Star REL CDO VIII Ltd. | | | | | | | | |
| 2006-8A, 0.47% due 02/01/412,3 | | | 1,315,492 | | | | 1,185,950 | |
| Bristol Bay Funding Ltd. | | | | | | | | |
| 2004-1A, 1.02% due 02/01/162,3 | | | 1,101,990 | | | | 1,099,235 | |
| KKR Financial CLO 2007-1 Corp. | | | | | | | | |
| 2007-1A, 2.51% due 05/15/212,3 | | | 1,150,000 | | | | 1,094,793 | |
| FM Leveraged Capital Fund II | | | | | | | | |
| 2006-2A, 1.86% due 11/15/202,3 | | | 1,000,000 | | | | 988,363 | |
| GreenPoint Mortgage | | | | | | | | |
| Funding Trust 2005-HE4 | | | | | | | | |
| 2005-HE4, 0.88% due 07/25/302 | | | 1,100,000 | | | | 962,609 | |
| TICC CLO LLC | | | | | | | | |
| 2011-1A, 2.52% due 07/25/21†††,2,3 | | | 850,000 | | | | 847,036 | |
| Northwoods Capital VII Ltd. | | | | | | | | |
| 2006-7A, 1.82% due 10/22/212,3 | | | 810,000 | | | | 743,490 | |
| NewStar Commercial Loan Trust 2007-1 | | | | | | | | |
| 2007-1A, 1.56% due 09/30/222,3 | | | 500,000 | | | | 461,354 | |
| Race Point IV CLO Ltd. | | | | | | | | |
| 2007-4A, 1.02% due 08/01/212,3 | | | 450,000 | | | | 417,454 | |
| Accredited Mortgage Loan Trust 2007-1 | | | | | | | | |
| 2007-1, 0.31% due 02/25/372 | | | 422,789 | | | | 381,122 | |
| Legg Mason Real Estate CDO I Ltd. | | | | | | | | |
| 2006-1A, 0.46% due 03/25/382,3 | | | 319,412 | | | | 305,950 | |
| NewStar Trust 2005-1 | | | | | | | | |
| 2005-1A, 0.77% due 07/25/182,3 | | | 240,717 | | | | 240,609 | |
| Total Asset Backed Securities | | | | | | | | |
| (Cost $26,352,763) | | | | | | | 26,277,777 | |
| U.S. TREASURY BILLS† - 12.8% | | | | | | | | |
| U.S. Treasury Bills6 | | | | | | | | |
| due 10/10/13 | | | 14,200,000 | | | | 14,199,943 | |
| due 10/03/13 | | | 5,000,000 | | | | 4,999,995 | |
| due 10/31/13 | | | 4,000,000 | | | | 3,999,884 | |
| Total U.S. Treasury Bills | | | | | | | | |
| (Cost $23,199,977) | | | | | | | 23,199,822 | |
| 12 | THE GUGGENHEIM FUNDS ANNUAL REPORT | SEE NOTES TO FINANCIAL STATEMENTS. |
| SCHEDULE OF INVESTMENTS (continued) | September 30, 2013 |
| STYLEPLUS LARGE CORE FUND |
| | | Face | | | | |
| | | Amount | | | Value | |
| | | | | | | |
| CORPORATE BONDS†† - 9.1% | | | | | | | | |
| FINANCIALS - 3.7% | | | | | | | | |
| Ford Motor Credit Company LLC | | | | | | | | |
| 7.00% due 04/15/15 | | $ | 1,370,000 | | | $ | 1,486,544 | |
| Aspen Insurance Holdings Ltd. | | | | | | | | |
| 6.00% due 08/15/14 | | | 1,300,000 | | | | 1,353,564 | |
| Citigroup, Inc. | | | | | | | | |
| 1.23% due 07/25/162 | | | 1,270,000 | | | | 1,281,279 | |
| Icahn Enterprises Limited Partnership / | | | | | | | | |
| Icahn Enterprises Finance Corp. | | | | | | | | |
| 7.75% due 01/15/16 | | | 520,000 | | | | 536,900 | |
| 8.00% due 01/15/18 | | | 230,000 | | | | 240,925 | |
| Nationstar Mortgage LLC / | | | | | | | | |
| Nationstar Capital Corp. | | | | | | | | |
| 6.50% due 08/01/18 | | | 570,000 | | | | 572,850 | |
| Mack-Cali Realty, LP | | | | | | | | |
| 5.13% due 02/15/14 | | | 560,000 | | | | 567,853 | |
| WEA Finance LLC / | | | | | | | | |
| WT Finance Aust Pty Ltd. | | | | | | | | |
| 5.75% due 09/02/153 | | | 380,000 | | | | 413,335 | |
| Emigrant Bancorp, Inc. | | | | | | | | |
| 6.25% due 06/15/143 | | | 320,000 | | | | 318,800 | |
| Total Financials | | | | | | | 6,772,050 | |
| MATERIALS - 2.1% | | | | | | | | |
| Glencore Funding LLC | | | | | | | | |
| 1.42% due 05/27/162,3 | | | 1,880,000 | | | | 1,840,975 | |
| Rio Tinto Finance USA plc | | | | | | | | |
| 1.09% due 06/17/162 | | | 1,300,000 | | | | 1,306,306 | |
| Anglo American Capital plc | | | | | | | | |
| 9.38% due 04/08/143 | | | 590,000 | | | | 614,656 | |
| Total Materials | | | | | | | 3,761,937 | |
| ENERGY - 1.3% | | | | | | | | |
| Ras Laffan Liquefied Natural Gas | | | | | | | | |
| Company Limited III | | | | | | | | |
| 5.83% due 09/30/163 | | | 1,785,819 | | | | 1,892,968 | |
| Petroleos Mexicanos | | | | | | | | |
| 2.29% due 07/18/182 | | | 550,000 | | | | 566,500 | |
| Total Energy | | | | | | | 2,459,468 | |
| INDUSTRIALS - 0.6% | | | | | | | | |
| International Lease Finance Corp. | | | | | | | | |
| 2.20% due 06/15/162 | | | 900,000 | | | | 895,500 | |
| Victor Technologies Group, Inc. | | | | | | | | |
| 9.00% due 12/15/17 | | | 160,000 | | | | 172,400 | |
| Total Industrials | | | | | | | 1,067,900 | |
| TELECOMMUNICATION SERVICES - 0.6% | | | | | | | | |
| WPP Finance UK | | | | | | | | |
| 8.00% due 09/15/14 | | | 1,000,000 | | | | 1,065,992 | |
| CONSUMER STAPLES - 0.3% | | | | | | | | |
| Harbinger Group, Inc. | | | | | | | | |
| 7.88% due 07/15/193 | | | 500,000 | | | | 517,500 | |
| CONSUMER DISCRETIONARY - 0.3% | | | | | | | | |
| ServiceMaster Co. | | | | | | | | |
| 7.00% due 08/15/20 | | | 270,000 | | | | 255,150 | |
| Sabre, Inc. | | | | | | | | |
| 8.50% due 05/15/193 | | | 210,000 | | | | 227,063 | |
| Total Consumer Discretionary | | | | | | | 482,213 | |
| INFORMATION TECHNOLOGY - 0.2% | | | | | | | | |
| iGATE Corp. | | | | | | | | |
| 9.00% due 05/01/16 | | | 290,000 | | | | 311,025 | |
| Total Corporate Bonds | | | | | | | | |
| (Cost $16,532,276) | | | | | | | 16,438,085 | |
| SENIOR FLOATING RATE INTERESTS†† - 4.9% | | | | | | | | |
| FINANCIALS - 1.5% | | | | | | | | |
| National Financial Partners | | | | | | | | |
| 5.25% due 07/01/20 | | | 1,276,800 | | | | 1,285,315 | |
| Knight/Getco | | | | | | | | |
| 5.75% due 11/30/17 | | | 1,170,000 | | | | 1,166,350 | |
| First Data Corp. | | | | | | | | |
| 4.18% due 03/23/18 | | | 150,000 | | | | 148,387 | |
| Cunningham Lindsey U.S., Inc. | | | | | | | | |
| 5.00% due 12/10/19 | | | 109,449 | | | | 108,628 | |
| Total Financials | | | | | | | 2,708,680 | |
| INFORMATION TECHNOLOGY - 1.4% | | | | | | | | |
| Travelport Holdings Ltd. | | | | | | | | |
| 6.25% due 06/26/19 | | | 1,566,075 | | | | 1,582,722 | |
| Blue Coat Systems, Inc. | | | | | | | | |
| 4.50% due 05/31/19 | | | 746,250 | | | | 748,116 | |
| Go Daddy Operating Company LLC | | | | | | | | |
| 4.25% due 12/17/18 | | | 177,259 | | | | 176,853 | |
| Total Information Technology | | | | | | | 2,507,691 | |
| CONSUMER DISCRETIONARY - 0.7% | | | | | | | | |
| Pinnacle Entertainment, Inc. | | | | | | | | |
| 3.75% due 08/15/16 | | | 1,114,750 | | | | 1,117,816 | |
| Sears Holdings Corp. | | | | | | | | |
| 5.50% due 06/30/18 | | | 200,000 | | | | 198,376 | |
| Total Consumer Discretionary | | | | | | | 1,316,192 | |
| ENERGY - 0.7% | | | | | | | | |
| Pacific Drilling | | | | | | | | |
| 4.50% due 05/18/18 | | | 668,325 | | | | 670,497 | |
| Ocean Rig ASA | | | | | | | | |
| 5.50% due 07/15/16 | | | 600,000 | | | | 606,378 | |
| Total Energy | | | | | | | 1,276,875 | |
| INDUSTRIALS - 0.4% | | | | | | | | |
| Thermasys Corp. | | | | | | | | |
| 5.25% due 05/03/19 | | | 650,000 | | | | 646,750 | |
| Laureate Education, Inc. | | | | | | | | |
| 5.25% due 06/15/18 | | | 124,366 | | | | 124,445 | |
| Total Industrials | | | | | | | 771,195 | |
| SEE NOTES TO FINANCIAL STATEMENTS. | THE GUGGENHEIM FUNDS ANNUAL REPORT | 13 |
| SCHEDULE OF INVESTMENTS (concluded) | September 30, 2013 |
| STYLEPLUS LARGE CORE FUND |
| | | Face | | | | |
| | | Amount | | | Value | |
| | | | | | | |
| TELECOMMUNICATION SERVICES - 0.1% | | | | | | | | |
| Level 3 Financing, Inc. | | | | | | | | |
| 4.75% due 08/01/19 | | $ | 230,000 | | | $ | 229,568 | |
| HEALTH CARE - 0.1% | | | | | | | | |
| Apria Healthcare Group, Inc. | | | | | | | | |
| 6.75% due 04/01/20 | | | 149,625 | | | | 150,620 | |
| Total Senior Floating Rate Interests | | | | | | | | |
| (Cost $8,876,600) | | | | | | | 8,960,821 | |
| COLLATERALIZED MORTGAGE OBLIGATIONS†† - 4.8% | | | | | | | | |
| Wachovia Bank Commercial Mortgage | | | | | | | | |
| Trust Series 2007-WHALE 8 | | | | | | | | |
| 2007-WHL8, 0.26% due 06/15/202,3 | | | 2,386,029 | | | | 2,355,118 | |
| Boca Hotel Portfolio Trust 2013-BOCA | | | | | | | | |
| 2013-BOCA, 3.23% due 08/15/262,3 | | | 1,550,000 | | | | 1,550,000 | |
| SRERS Funding Ltd. | | | | | | | | |
| 2011-RS, 0.43% due 05/09/462,3 | | | 1,326,565 | | | | 1,153,265 | |
| COMM 2007-FL14 Mortgage Trust | | | | | | | | |
| 2007-FL14, 0.93% due 06/15/222,3 | | | 1,096,136 | | | | 1,074,476 | |
| Banc of America Merrill Lynch | | | | | | | | |
| Commercial Mortgage, Inc. | | | | | | | | |
| 2005-6, 6.33% due 09/10/472,3 | | | 900,500 | | | | 931,266 | |
| Banc of America Large | | | | | | | | |
| Loan Trust 2007-BMB1 | | | | | | | | |
| 2007-BMB1, 1.28% due 08/15/292,3 | | | 800,000 | | | | 792,191 | |
| GCCFC Commercial Mortgage Trust | | | | | | | | |
| 2006-FL4A, 0.41% due 11/05/21 | | | 800,000 | | | | 784,606 | |
| Total Collateralized Mortgage Obligations | | | | | | | | |
| (Cost $8,647,502) | | | | | | | 8,640,922 | |
| MUNICIPAL BONDS†† - 2.9% | | | | | | | | |
| NEW YORK - 2.7% | | | | | | | | |
| New York City Water & Sewer | | | | | | | | |
| System Revenue Bonds | | | | | | | | |
| 0.36% due 06/15/332 | | | 2,630,000 | | | | 2,630,000 | |
| City of New York New York | | | | | | | | |
| General Obligation Unlimited | | | | | | | | |
| 0.38% due 04/01/352 | | | 1,300,000 | | | | 1,300,000 | |
| 0.36% due 11/01/262 | | | 1,040,000 | | | | 1,040,000 | |
| Total New York | | | | | | | 4,970,000 | |
| MICHIGAN - 0.2% | | | | | | | | |
| Michigan Finance Authority | | | | | | | | |
| Revenue Notes | | | | | | | | |
| 4.38% due 08/20/14 | | | 300,000 | | | | 301,914 | |
| Total Municipal Bonds | | | | | | | | |
| (Cost $5,270,000) | | | | | | | 5,271,914 | |
| COMMERCIAL PAPER†† - 3.9% | | | | | | | | |
| American Water Capital Corp. | | | | | | | | |
| 0.26% due 10/01/13 | | | 1,400,000 | | | | 1,400,000 | |
| BAT International Finance plc | | | | | | | | |
| 0.21% due 10/02/133 | | | 1,400,000 | | | | 1,399,991 | |
| Nissan Motor Acceptance Corp. | | | | | | | | |
| 0.24% due 10/02/133 | | | 1,400,000 | | | | 1,399,990 | |
| VW Credit Canada, Inc. | | | | | | | | |
| 0.22% due 10/09/13 | | | 1,400,000 | | | | 1,399,932 | |
| Aon Corp. | | | | | | | | |
| 0.22% due 10/15/13 | | | 1,400,000 | | | | 1,399,880 | |
| Total Commercial Paper | | | | | | | | |
| (Cost $6,999,793) | | | | | | | 6,999,793 | |
| Total Investments - 100.8% | | | | | | | | |
| (Cost $181,624,262) | | | | | | $ | 183,036,315 | |
| Other Assets & Liabilities, net - (0.8)% | | | | | | | (1,517,952 | ) |
| Total Net Assets - 100.0% | | | | | | $ | 181,518,363 | |
| | | | | | | |
| | | | | | Unrealized | |
| | | Contracts | | | Gain (Loss) | |
| | | | | | | |
| EQUITY FUTURES CONTRACTS PURCHASED† | | | | | | | | |
| December 2013 S&P 500 Index | | | | | | | | |
| Mini Futures Contracts | | | | | | | | |
| (Aggregate Value of | | | | | | | | |
| Contracts $1,341,200) | | | 16 | | | $ | (11,851 | ) |
| | | | | | | |
| | | Units | | | | |
| EQUITY INDEX SWAP AGREEMENTS†† | | | | | | | | |
| Morgan Stanley Capital Services, Inc. | | | | | | | | |
| October 2013 S&P 500 Index | | | | | | | | |
| Swap, Terminating 10/05/134 | | | | | | | | |
| (Notional Value $142,825,812) | | | 84,937 | | | $ | 4,297,408 | |
| * | Non-income producing security. |
| † | Value determined based on Level 1 inputs — See Note 4. |
| †† | Value determined based on Level 2 inputs, unless otherwise noted — See Note 4. |
| ††† | Value determined based on Level 3 inputs — See Note 4. |
| 2 | Variable rate security. Rate indicated is rate effective at September 30, 2013. |
| 3 | Security is a 144A or Section 4(a)(2) security. The total market value of 144A or Section 4(a)(2) securities is $39,317,660 (cost $39,519,563), or 21.7% of total net assets. |
| 4 | Total Return based on S&P 500 Index +/- financing at a variable rate. |
| 5 | Investment in a product that pays a management fee to a party related to the advisor. |
| 6 | Zero coupon rate security. |
plc — Public Limited Company
| 14 | THE GUGGENHEIM FUNDS ANNUAL REPORT | SEE NOTES TO FINANCIAL STATEMENTS. |
| STYLEPLUS LARGE CORE FUND |
STATEMENT OF ASSETS
AND LIABILITIES
September 30, 2013
| Assets: | | | | |
| Investments in unaffiliated issuers, at value | | | | |
| (cost $174,864,093) | | $ | 176,504,048 | |
| Investments in affiliated issuers, at value | | | | |
| (cost $6,760,169) | | | 6,532,267 | |
| Total investments | | | | |
| (cost $181,624,262) | | | 183,036,315 | |
| Unrealized appreciation on swap agreements | | | 4,297,408 | |
| Cash | | | 5,424,322 | |
| Segregrated cash with broker | | | 56,000 | |
| Prepaid expenses | | | 22,882 | |
| Receivables: | | | | |
| Securities sold | | | 3,972,213 | |
| Interest | | | 277,501 | |
| Dividends | | | 78,338 | |
| Fund shares sold | | | 9,072 | |
| Total assets | | | 197,174,051 | |
| Liabilities: | | | | |
| Segregated cash from broker | | | 5,161,567 | |
| Payable for: | | | | |
| Securities purchased | | | 10,121,563 | |
| Fund shares redeemed | | | 124,437 | |
| Management fees | | | 112,491 | |
| Distribution and service fees | | | 41,235 | |
| Transfer agent/maintenance fees | | | 21,858 | |
| Fund accounting/administration fees | | | 14,249 | |
| Variation margin | | | 7,920 | |
| Directors’ fees* | | | 1,338 | |
| Miscellaneous | | | 49,030 | |
| Total liabilities | | | 15,655,688 | |
| Net assets | | $ | 181,518,363 | |
| Net assets consist of: | | | | |
| Paid in capital | | $ | 147,978,486 | |
| Undistributed net investment income | | | 94,876 | |
| Accumulated net realized gain on investments | | | 27,747,391 | |
| Net unrealized appreciation on investments | | | 5,697,610 | |
| Net assets | | $ | 181,518,363 | |
| A-Class: | | | | |
| Net assets | | $ | 175,600,751 | |
| Capital shares outstanding | | | 7,236,013 | |
| Net asset value per share | | $ | 24.27 | |
| Maximum offering price per share | | | | |
| (Net asset value divided by 95.25%) | | $ | 25.48 | |
| B-Class: | | | | |
| Net assets | | $ | 3,616,953 | |
| Capital shares outstanding | | | 186,515 | |
| Net asset value per share | | $ | 19.39 | |
| C-Class: | | | | |
| Net assets | | $ | 2,274,567 | |
| Capital shares outstanding | | | 107,720 | |
| Net asset value per share | | $ | 21.12 | |
| Institutional Class: | | | | |
| Net assets | | $ | 26,092 | |
| Capital shares outstanding | | | 1,076 | |
| Net asset value per share | | $ | 24.25 | |
STATEMENT OF
OPERATIONS
Year Ended September 30, 2013
| Investment Income: | | | | |
| Dividends from securities of unaffiliated issuers | | $ | 2,305,587 | |
| Dividends from securities of affiliated issuers | | | 135,197 | |
| Interest | | | 449,746 | |
| Total investment income | | | 2,890,530 | |
| | | | | |
| Expenses: | | | | |
| Management fees | | | 1,330,661 | |
| Transfer agent/maintenance fees: | | | | |
| A-Class | | | 270,382 | |
| B-Class | | | 26,127 | |
| C-Class | | | 7,210 | |
| Institutional Class | | | 51 | |
| Distribution and service fees: | | | | |
| A-Class | | | 428,291 | |
| B-Class | | | 41,610 | |
| C-Class | | | 19,253 | |
| Fund accounting/administration fees | | | 168,548 | |
| Directors’ fees* | | | 14,474 | |
| Tax expense | | | 8,201 | |
| Custodian fees | | | 7,390 | |
| Miscellaneous | | | 180,456 | |
| Total expenses | | | 2,502,654 | |
| Net investment income | | | 387,876 | |
| | | | | |
| Net Realized and Unrealized Gain (Loss): | | | | |
| Net realized gain (loss) on: | | | | |
| Investments in unaffiliated issuers | | | 38,190,991 | |
| Swap agreements | | | 3,715,099 | |
| Futures contracts | | | 71,206 | |
| Net realized gain | | | 41,977,296 | |
| Net change in unrealized appreciation (depreciation) on: | | | | |
| Investments in unaffiliated issuers | | | (22,375,412 | ) |
| Investments in affiliated issuers | | | (227,902 | ) |
| Swap agreements | | | 4,297,408 | |
| Futures contracts | | | (11,851 | ) |
| Net change in unrealized appreciation (depreciation) | | | (18,317,757 | ) |
| Net realized and unrealized gain | | | 23,659,539 | |
| Net increase in net assets resulting from operations | | $ | 24,047,415 | |
* Relates to Directors not deemed “interested persons” within the meaning of Section 2(a)(19) of the 1940 Act.
| SEE NOTES TO FINANCIAL STATEMENTS. | THE GUGGENHEIM FUNDS ANNUAL REPORT | 15 |
| STYLEPLUS LARGE CORE FUND |
STATEMENTS OF CHANGES IN NET ASSETS
| | | Year Ended | | | Year Ended | |
| | | September 30, | | | September 30, | |
| | | 2013 | | | 2012 | |
| | | | | | | |
| Increase (Decrease) In Net Assets From Operations: | | | | | | | | |
| Net investment income | | $ | 387,876 | | | $ | 502,602 | |
| Net realized gain on investments | | | 41,977,296 | | | | 5,641,857 | |
| Net change in unrealized appreciation (depreciation) on investments | | | (18,317,757 | ) | | | 36,158,986 | |
| Net increase in net assets resulting from operations | | | 24,047,415 | | | | 42,303,445 | |
| | | | | | | | | |
| Distributions to shareholders from: | | | | | | | | |
| Net investment income | | | | | | | | |
| A-Class | | | (616,535 | ) | | | (200,274 | ) |
| Institutional Class | | | (73 | ) | | | — | 1 |
| Total distributions to shareholders | | | (616,608 | ) | | | (200,274 | ) |
| | | | | | | | | |
| Capital share transactions: | | | | | | | | |
| Proceeds from sale of shares | | | | | | | | |
| A-Class | | | 3,891,702 | | | | 3,926,067 | |
| B-Class | | | 216,333 | | | | 147,411 | |
| C-Class | | | 827,015 | | | | 118,320 | |
| Institutional Class | | | 12,929 | | | | 10,0001 | |
| Distributions reinvested | | | | | | | | |
| A-Class | | | 571,200 | | | | 187,685 | |
| Institutional Class | | | 73 | | | | — | 1 |
| Cost of shares redeemed | | | | | | | | |
| A-Class | | | (23,445,161 | ) | | | (28,967,385 | ) |
| B-Class | | | (1,828,228 | ) | | | (1,734,071 | ) |
| C-Class | | | (459,100 | ) | | | (443,550 | ) |
| Institutional Class | | | — | | | | — | 1 |
| Net decrease from capital share transactions | | | (20,213,237 | ) | | | (26,755,523 | ) |
| Net increase in net assets | | | 3,217,570 | | | | 15,347,648 | |
| | | | | | | | | |
| Net assets: | | | | | | | | |
| Beginning of year | | | 178,300,793 | | | | 162,953,145 | |
| End of year | | $ | 181,518,363 | | | $ | 178,300,793 | |
| Undistributed net investment income at end of year | | $ | 94,876 | | | $ | 317,574 | |
| | | | | | | | | |
| Capital share activity: | | | | | | | | |
| Shares sold | | | | | | | | |
| A-Class | | | 171,925 | | | | 200,433 | |
| B-Class | | | 12,018 | | | | 9,082 | |
| C-Class | | | 41,241 | | | | 7,018 | |
| Institutional Class | | | 592 | | | | 480 | 1 |
| Shares issued from reinvestment of distributions | | | | | | | | |
| A-Class | | | 27,448 | | | | 10,201 | |
| Institutional Class | | | 4 | | | | — | 1 |
| Shares redeemed | | | | | | | | |
| A-Class | | | (1,051,893 | ) | | | (1,425,434 | ) |
| B-Class | | | (100,705 | ) | | | (108,033 | ) |
| C-Class | | | (23,259 | ) | | | (25,344 | ) |
| Institutional Class | | | — | | | | — | 1 |
| Net decrease in shares | | | (922,629 | ) | | | (1,331,597 | ) |
1 Since the commencement of operations: March 1, 2012.
| 16 | THE GUGGENHEIM FUNDS ANNUAL REPORT | SEE NOTES TO FINANCIAL STATEMENTS. |
| STYLEPLUS LARGE CORE FUND |
FINANCIAL HIGHLIGHTS
This table is presented to show selected data for a share outstanding throughout each period and to assist shareholders in evaluating a Fund’s performance for the periods presented.
| | | Year Ended | | | Year Ended | | | Year Ended | | | Year Ended | | | Year Ended | |
| | | September 30, | | | September 30, | | | September 30, | | | September 30, | | | September 30, | |
| A-Class | | 2013 | | | 2012 | | | 2011e | | | 2010e | | | 2009e | |
| Per Share Data | | | | | | | | | | | | | | | | | | | | |
| Net asset value, beginning of period | | $ | 21.25 | | | $ | 16.79 | | | $ | 17.56 | | | $ | 16.20 | | | $ | 17.04 | |
| Income (loss) from investment operations: | | | | | | | | | | | | | | | | | | | | |
| Net investment incomea | | | .06 | | | | .06 | | | | .01 | | | | .04 | | | | .04 | |
| Net gain (loss) on investments (realized and unrealized) | | | 3.04 | | | | 4.42 | | | | (.74 | ) | | | 1.32 | | | | (.80 | ) |
| Total from investment operations | | | 3.10 | | | | 4.48 | | | | (.73 | ) | | | 1.36 | | | | (.76 | ) |
| Less distributions from: | | | | | | | | | | | | | | | | | | | | |
| Net investment income | | | (.08 | ) | | | (.02 | ) | | | (.04 | ) | | | — | | | | (.04 | ) |
| Return of capital | | | — | | | | — | | | | — | | | | — | | | | (.04 | ) |
| Total distributions | | | (.08 | ) | | | (.02 | ) | | | (.04 | ) | | | — | | | | (.08 | ) |
| Net asset value, end of period | | $ | 24.27 | | | $ | 21.25 | | | $ | 16.79 | | | $ | 17.56 | | | $ | 16.20 | |
| | | | | | | | | | | | | | | | | | | | | |
| Total Returnb | | | 14.64 | % | | | 26.71 | % | | | (4.11 | %) | | | 8.40 | % | | | (4.32 | %) |
| Ratios/Supplemental Data | | | | | | | | | | | | | | | | | | | | |
| Net assets, end of period (in thousands) | | $ | 175,601 | | | $ | 171,907 | | | $ | 156,232 | | | $ | 174,371 | | | $ | 175,404 | |
| Ratios to average net assets: | | | | | | | | | | | | | | | | | | | | |
| Net investment income | | | 0.26 | % | | | 0.32 | % | | | 0.06 | % | | | 0.31 | % | | | 0.28 | % |
| Total expensesc | | | 1.37 | % | | | 1.36 | % | | | 1.35 | % | | | 1.43 | % | | | 1.49 | % |
| Portfolio turnover rate | | | 217 | % | | | 101 | % | | | 92 | % | | | 100 | % | | | 69 | % |
| | | | | | | | | | | | | | | | |
| | | Year Ended | | | Year Ended | | | Year Ended | | | Year Ended | | | Year Ended | |
| | | September 30, | | | September 30, | | | September 30, | | | September 30, | | | September 30, | |
| B-Class | | 2013 | | | 2012 | | | 2011e | | | 2010e | | | 2009e | |
| Per Share Data | | | | | | | | | | | | | | | | | | | | |
| Net asset value, beginning of period | | $ | 17.13 | | | $ | 13.69 | | | $ | 14.40 | | | $ | 13.36 | | | $ | 14.12 | |
| Income (loss) from investment operations: | | | | | | | | | | | | | | | | | | | | |
| Net investment lossa | | | (.17 | ) | | | (.15 | ) | | | (.11 | ) | | | (.08 | ) | | | (.04 | ) |
| Net gain (loss) on investments (realized and unrealized) | | | 2.43 | | | | 3.59 | | | | (.60 | ) | | | 1.12 | | | | (.68 | ) |
| Total from investment operations | | | 2.26 | | | | 3.44 | | | | (.71 | ) | | | 1.04 | | | | (.72 | ) |
| Less distributions from: | | | | | | | | | | | | | | | | | | | | |
| Return of capital | | | — | | | | — | | | | — | | | | — | | | | (.04 | ) |
| Total distributions | | | — | | | | — | | | | — | | | | — | | | | (.04 | ) |
| Net asset value, end of period | | $ | 19.39 | | | $ | 17.13 | | | $ | 13.69 | | | $ | 14.40 | | | $ | 13.36 | |
| | | | | | | | | | | | | | | | | | | | | |
| Total Returnb | | | 13.19 | % | | | 25.13 | % | | | (4.93 | %) | | | 7.78 | % | | | (4.96 | %) |
| Ratios/Supplemental Data | | | | | | | | | | | | | | | | | | | | |
| Net assets, end of period (in thousands) | | $ | 3,617 | | | $ | 4,714 | | | $ | 5,121 | | | $ | 6,817 | | | $ | 7,784 | |
| Ratios to average net assets: | | | | | | | | | | | | | | | | | | | | |
| Net investment loss | | | (0.94 | %) | | | (0.92 | %) | | | (0.70 | %) | | | (0.48 | %) | | | (0.46 | %) |
| Total expensesc | | | 2.59 | % | | | 2.59 | % | | | 2.10 | % | | | 2.17 | % | | | 2.24 | % |
| Portfolio turnover rate | | | 217 | % | | | 101 | % | | | 92 | % | | | 100 | % | | | 69 | % |
| SEE NOTES TO FINANCIAL STATEMENTS. | THE GUGGENHEIM FUNDS ANNUAL REPORT | 17 |
| STYLEPLUS LARGE CORE FUND |
FINANCIAL HIGHLIGHTS (concluded)
This table is presented to show selected data for a share outstanding throughout each period and to assist shareholders in evaluating a Fund’s performance for the periods presented.
| | | Year Ended | | | Year Ended | | | Year Ended | | | Year Ended | | | Year Ended | |
| | | September 30, | | | September 30, | | | September 30, | | | September 30, | | | September 30, | |
| C-Class | | 2013 | | | 2012 | | | 2011e | | | 2010e | | | 2009e | |
| Per Share Data | | | | | | | | | | | | | | | | | | | | |
| Net asset value, beginning of period | | $ | 18.60 | | | $ | 14.81 | | | $ | 15.56 | | | $ | 14.48 | | | $ | 15.24 | |
| Income (loss) from investment operations: | | | | | | | | | | | | | | | | | | | | |
| Net investment lossa | | | (.15 | ) | | | (.10 | ) | | | (.12 | ) | | | (.08 | ) | | | (.04 | ) |
| Net gain (loss) on investments (realized and unrealized) | | | 2.67 | | | | 3.89 | | | | (.63 | ) | | | 1.16 | | | | (.68 | ) |
| Total from investment operations | | | 2.52 | | | | 3.79 | | | | (.75 | ) | | | 1.08 | | | | (.72 | ) |
| Less distributions from: | | | | | | | | | | | | | | | | | | | | |
| Return of capital | | | — | | | | — | | | | — | | | | — | | | | (.04 | ) |
| Total distributions | | | — | | | | — | | | | — | | | | — | | | | (.04 | ) |
| Net asset value, end of period | | $ | 21.12 | | | $ | 18.60 | | | $ | 14.81 | | | $ | 15.56 | | | $ | 14.48 | |
| | | | | | | | | | | | | | | | | | | | | |
| Total Returnb | | | 13.55 | % | | | 25.59 | % | | | (4.82 | %) | | | 7.46 | % | | | (4.60 | %) |
| Ratios/Supplemental Data | | | | | | | | | | | | | | | | | | | | |
| Net assets, end of period (in thousands) | | $ | 2,275 | | | $ | 1,669 | | | $ | 1,600 | | | $ | 2,158 | | | $ | 2,244 | |
| Ratios to average net assets: | | | | | | | | | | | | | | | | | | | | |
| Net investment loss | | | (0.77 | %) | | | (0.55 | %) | | | (0.70 | %) | | | (0.44 | %) | | | (0.47 | %) |
| Total expensesc | | | 2.34 | % | | | 2.22 | % | | | 2.10 | % | | | 2.18 | % | | | 2.24 | % |
| Portfolio turnover rate | | | 217 | % | | | 101 | % | | | 92 | % | | | 100 | % | | | 69 | % |
| | | | | | | |
| | | Year Ended | | | Period Ended | |
| | | September 30, | | | September 30, | |
| Institutional Class | | 2013 | | | 2012d | |
| Per Share Data | | | | | | | | |
| Net asset value, beginning of period | | $ | 21.28 | | | $ | 20.84 | |
| Income (loss) from investment operations: | | | | | | | | |
| Net investment incomea | | | .06 | | | | .07 | |
| Net gain on investments (realized and unrealized) | | | 3.06 | | | | .37 | |
| Total from investment operations | | | 3.12 | | | | .44 | |
| Less distributions from: | | | | | | | | |
| Net investment income | | | (.15 | ) | | | — | |
| Total distributions | | | (.15 | ) | | | — | |
| Net asset value, end of period | | $ | 24.25 | | | $ | 21.28 | |
| | | | | | | | | |
| Total Returnb | | | 14.79 | % | | | 2.11 | % |
| Ratios/Supplemental Data | | | | | | | | |
| Net assets, end of period (in thousands) | | $ | 26 | | | $ | 10 | |
| Ratios to average net assets: | | | | | | | | |
| Net investment income | | | 0.26 | % | | | 0.59 | % |
| Total expensesc | | | 1.25 | % | | | 1.12 | % |
| Portfolio turnover rate | | | 217 | % | | | 101 | % |
| a | Net investment income (loss) per share was computed using average shares outstanding throughout the period. |
| b | Total return does not reflect the impact of any applicable sales charges and has not been annualized. |
| c | Does not include expenses of the underlying funds in which the Fund invests. |
| d | Since commencement of operations: March 1, 2012. Percentage amounts for the period, except total return and portfolio turnover rate, have been annualized. The portfolio turnover rate stated is for the entire fiscal year of the Fund, not since commencement of operations of the Class. |
| e | Reverse share split—Per share amounts for period September 30, 2009 through April 8, 2011 have been restated to reflect a 1:4 reverse share split effective April 8, 2011. |
| 18 | THE GUGGENHEIM FUNDS ANNUAL REPORT | SEE NOTES TO FINANCIAL STATEMENTS. |
| MANAGERS’ COMMENTARY (Unaudited) | September 30, 2013 |
To Our Shareholders:
Guggenheim Mid Cap Value Fund (the “Fund”) is managed by a team of seasoned professionals led by James Schier, CFA, Portfolio Manager. In the following paragraphs, he discusses performance of the Fund for the fiscal year ended September 30, 2013.
For the year ended September 30, 2013, the Guggenheim Mid Cap Value Fund returned 28.93%1, compared with the 27.58% return of its benchmark, the Russell 2500 Value Index.
The strategy is to select securities of companies that appear undervalued by the overall market relative to assets, earnings, growth potential or cash flows. The investment approach is a defined and disciplined process with three key philosophical tenets that drive investment decisions: a valuation focus, a long-term investment horizon and an opportunistic approach.
The portfolio’s performance for the period was helped most by stock selection in the Financials and Information Technology sectors. The largest detractor from performance was stock selection in the Materials and Consumer Discretionary sectors.
The holdings contributing most to portfolio performance over the period were Cree, Inc., a maker of LED lighting; Ocwen Financial Corp., a mortgage servicer with a large presence in the subprime mortgage market; and Computer Sciences Corp., a business information technology company. Stock price gains for Cree and Computer Sciences were the main driver of the Information Technology sector performance for the period.
The main detractors were two precious metals mining companies, Allied Nevada Gold Corp. and Coeur Mining, Inc., which underperformed due to the selloff in gold earlier in 2013; and SandRidge Energy, Inc., an independent oil and natural gas company.
Sector positioning in the Fund is largely a result of stock selection decisions where the Fund believes it is finding the most attractive investment opportunities. The largest changes in positioning from a year ago were an increase in the Financials sector exposure and a decrease in the Industrials sector exposure.
As of September 30, 2013, the Fund had its largest overweight relative to the benchmark in Industrials, primarily in the engineering and construction industry. Investment opportunities appear attractive in maintaining U.S. infrastructure and grids for distributing oil, gas and electricity.
The Financials sector was the largest in both the Fund and the benchmark. However, the Fund is most underweight in this sector relative to its benchmark. This is mostly due to a zero weight in the REIT industry, which is a significant part of the Financials sector. REITs appear expensive, prices having been driven up by yield-hungry investors searching for bond substitutes. The Fund instead continues to favor the insurance industry, which is non-interest-sensitive, and the mortgage servicing industry. After Financials, the Fund was most underweight relative to the benchmark in Utilities, where current high valuations make this sector unattractive.
The Fund continues to focus on searching for companies with good long-term fundamental prospects and attractive valuations that are more likely to generate strong performance relative to the broader market, regardless of macroeconomic events.
Performance displayed represents past performance which is no guarantee of future results.
1 Performance figures are based on A-Class shares and do not reflect deduction of the sales charges or taxes that a shareholder would pay on distributions or the redemption of shares.
The opinions and forecast expressed may not actually come to pass. This information is subject to change at any time, based on market and other conditions, and should not be construed as a recommendation of any specific security or strategy.
| THE GUGGENHEIM FUNDS ANNUAL REPORT | 19 |
| PERFORMANCE REPORT AND FUND PROFILE (Unaudited) | September 30, 2013 |
MID CAP VALUE FUND
OBJECTIVE: Seeks long-term growth of capital.
Cumulative Fund Performance*
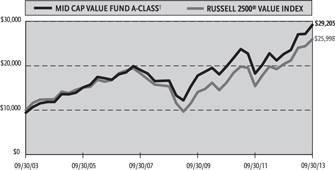
Average Annual Returns*
Periods Ended 09/30/13
| | | 1 Year | | | 5 Year | | | 10 Year | |
| A-Class Shares | | | 28.93 | % | | | 11.88 | % | | | 11.97 | % |
| A-Class Shares with sales charge† | | | 22.80 | % | | | 10.56 | % | | | 11.31 | % |
| B-Class Shares | | | 27.93 | % | | | 11.02 | % | | | 11.31 | % |
| B-Class Shares with CDSC‡ | | | 22.93 | % | | | 10.75 | % | | | 11.31 | % |
| C-Class Shares | | | 27.98 | % | | | 11.06 | % | | | 11.15 | % |
| C-Class Shares with CDSC§ | | | 26.98 | % | | | 11.06 | % | | | 11.15 | % |
| Russell 2500 Value Index | | | 27.58 | % | | | 11.07 | % | | | 10.03 | % |
Holdings Diversification (Market Exposure as % of Net Assets)
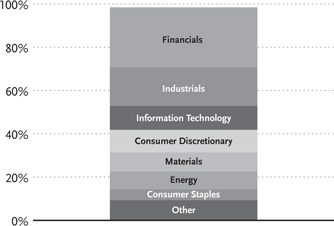
“Holdings Diversification (Market Exposure as % of Net Assets)” excludes any temporary cash investments.
| Inception Dates: |
| A-Class | May 1, 1997 |
| B-Class | May 1, 1997 |
| C-Class | January 29, 1999 |
| Ten Largest Holdings (% of Total Net Assets) |
| Hanover Insurance Group, Inc. | | | 4.7 | % |
| Computer Sciences Corp. | | | 3.2 | % |
| Owens-Illinois, Inc. | | | 2.7 | % |
| Reinsurance Group of America, Inc. — Class A | | | 2.4 | % |
| Covanta Holding Corp. | | | 2.4 | % |
| Dreyfus Treasury Prime Cash Management Fund | | | 2.3 | % |
| Bunge Ltd. | | | 2.2 | % |
| WR Berkley Corp. | | | 2.2 | % |
| American Financial Group, Inc. | | | 2.2 | % |
| URS Corp. | | | 2.1 | % |
| Top Ten Total | | | 26.4 | % |
| * | The performance data above represents past performance that is not predictive of future results. The investment return and principal value of an investment in the Fund will fluctuate so that an investor’s shares, when redeemed, may be worth more or less than their original cost. Returns are historical and include changes in principal and reinvested dividends and capital gains and do not reflect the effect of taxes. The Russell 2500 Value Index is an unmanaged index and, unlike the Fund, has no management fees or operating expenses to reduce its reported return. |
| † | Effective February 22, 2011, the maximum sales charge decreased from 5.75% to 4.75%. A 5.75% maximum sales charge is used in the calculation of the 5 Year and 10 Year average annual returns (based on subscriptions made prior to February 22, 2011), and a 4.75% maximum sales charge will be used to calculate performance for periods based on subscriptions made on or after February 22, 2011. |
| ‡ | Fund returns include a CDSC of up to 5% if redeemed within 5 years of purchase. |
| § | Fund returns include a CDSC of 1% if redeemed within 12 months of purchase. |
| 20 | THE GUGGENHEIM FUNDS ANNUAL REPORT |
| SCHEDULE OF INVESTMENTS | September 30, 2013 |
| MID CAP VALUE FUND | |
| | | Shares | | | Value | |
| | | | | | | |
| COMMON STOCKS† - 97.8% | | | | | | | | |
| | | | | | | | | |
| FINANCIALS - 27.8% | | | | | | | | |
| Hanover Insurance Group, Inc. | | | 1,078,640 | | | $ | 59,670,364 | |
| Reinsurance Group of America, Inc. — Class A | | | 454,574 | | | | 30,451,912 | |
| WR Berkley Corp. | | | 666,110 | | | | 28,549,475 | |
| American Financial Group, Inc. | | | 526,320 | | | | 28,452,859 | |
| Alleghany Corp.* | | | 56,390 | | | | 23,100,164 | |
| Northern Trust Corp. | | | 352,130 | | | | 19,152,351 | |
| Endurance Specialty Holdings Ltd. | | | 309,400 | | | | 16,620,968 | |
| Alexandria Real Estate Equities, Inc. | | | 205,230 | | | | 13,103,936 | |
| Ocwen Financial Corp.*,1 | | | 230,694 | | | | 12,865,805 | |
| BioMed Realty Trust, Inc. | | | 688,600 | | | | 12,801,074 | |
| Huntington Bancshares, Inc. | | | 1,539,620 | | | | 12,717,262 | |
| Employers Holdings, Inc. | | | 391,750 | | | | 11,650,645 | |
| Lexington Realty Trust | | | 1,019,270 | | | | 11,446,402 | |
| Wintrust Financial Corp. | | | 231,110 | | | | 9,491,688 | |
| Home Loan Servicing Solutions Ltd. | | | 423,227 | | | | 9,315,226 | |
| SVB Financial Group* | | | 94,420 | | | | 8,155,055 | |
| FirstMerit Corp. | | | 372,872 | | | | 8,095,051 | |
| Zions Bancorporation | | | 288,250 | | | | 7,903,815 | |
| City National Corp. | | | 111,290 | | | | 7,418,591 | |
| First Niagara Financial Group, Inc. | | | 612,990 | | | | 6,356,706 | |
| First Midwest Bancorp, Inc. | | | 412,938 | | | | 6,239,493 | |
| Redwood Trust, Inc. | | | 263,753 | | | | 5,193,297 | |
| Investors Real Estate Trust | | | 562,530 | | | | 4,640,873 | |
| Campus Crest Communities, Inc. | | | 261,320 | | | | 2,822,256 | |
| Total Financials | | | | | | | 356,215,268 | |
| INDUSTRIALS - 17.2% | | | | | | | | |
| Covanta Holding Corp. | | | 1,412,060 | | | | 30,189,843 | |
| URS Corp. | | | 510,500 | | | | 27,439,374 | |
| Quanta Services, Inc.* | | | 871,720 | | | | 23,981,017 | |
| Navigant Consulting, Inc.* | | | 1,528,150 | | | | 23,625,198 | |
| Aegion Corp. — Class A* | | | 915,096 | | | | 21,715,228 | |
| Orbital Sciences Corp.* | | | 984,140 | | | | 20,844,085 | |
| General Cable Corp. | | | 494,721 | | | | 15,707,392 | |
| ICF International, Inc.* | | | 422,370 | | | | 14,956,122 | |
| Saia, Inc.* | | | 280,121 | | | | 8,734,173 | |
| Towers Watson & Co. — Class A | | | 79,511 | | | | 8,504,497 | |
| DigitalGlobe, Inc.* | | | 235,553 | | | | 7,448,186 | |
| Babcock & Wilcox Co. | | | 211,950 | | | | 7,146,954 | |
| United Stationers, Inc. | | | 160,822 | | | | 6,995,757 | |
| AZZ, Inc. | | | 85,650 | | | | 3,585,309 | |
| Thermoenergy Corp.* | | | 2,701,839 | | | | 108,074 | |
| Total Industrials | | | | | | | 220,981,209 | |
| INFORMATION TECHNOLOGY - 11.0% | | | | | | | | |
| Computer Sciences Corp. | | | 801,860 | | | | 41,488,236 | |
| IXYS Corp.2 | | | 2,136,329 | | | | 20,615,574 | |
| Cree, Inc.* | | | 281,140 | | | | 16,921,817 | |
| Maxwell Technologies, Inc.*,2 | | | 1,704,971 | | | | 15,481,137 | |
| RF Micro Devices, Inc.* | | | 2,464,500 | | | | 13,899,780 | |
| Global Payments, Inc. | | | 257,220 | | | | 13,138,798 | |
| Semtech Corp.* | | | 222,670 | | | | 6,677,873 | |
| Symmetricom, Inc.* | | | 933,275 | | | | 4,498,386 | |
| Euronet Worldwide, Inc.* | | | 105,635 | | | | 4,204,273 | |
| OmniVision Technologies, Inc.* | | | 214,270 | | | | 3,280,474 | |
| Total Information Technology | | | | | | | 140,206,348 | |
| CONSUMER DISCRETIONARY - 10.4% | | | | | | | | |
| Brown Shoe Company, Inc. | | | 992,755 | | | | 23,299,959 | |
| Chico’s FAS, Inc. | | | 956,500 | | | | 15,935,290 | |
| Maidenform Brands, Inc.* | | | 631,550 | | | | 14,835,109 | |
| Cabela’s, Inc.* | | | 211,150 | | | | 13,308,785 | |
| Jack in the Box, Inc.* | | | 311,780 | | | | 12,471,200 | |
| DeVry, Inc. | | | 394,150 | | | | 12,045,224 | |
| Jones Group, Inc. | | | 797,811 | | | | 11,975,143 | |
| Scholastic Corp. | | | 361,060 | | | | 10,344,369 | |
| Guess?, Inc. | | | 343,808 | | | | 10,262,669 | |
| Gentex Corp. | | | 313,640 | | | | 8,026,048 | |
| Total Consumer Discretionary | | | | | | | 132,503,796 | |
| MATERIALS - 8.8% | | | | | | | | |
| Owens-Illinois, Inc.* | | | 1,148,180 | | | | 34,468,363 | |
| Sonoco Products Co. | | | 576,950 | | | | 22,466,433 | |
| Zoltek Companies, Inc.* | | | 955,626 | | | | 15,949,398 | |
| Coeur Mining, Inc.* | | | 1,225,220 | | | | 14,763,901 | |
| Landec Corp.* | | | 867,563 | | | | 10,584,269 | |
| Globe Specialty Metals, Inc. | | | 467,501 | | | | 7,204,190 | |
| Allied Nevada Gold Corp.* | | | 1,616,510 | | | | 6,757,012 | |
| Total Materials | | | | | | | 112,193,566 | |
| ENERGY - 8.3% | | | | | | | | |
| Cameco Corp. | | | 1,306,930 | | | | 23,616,225 | |
| Whiting Petroleum Corp.* | | | 374,012 | | | | 22,384,619 | |
| Oasis Petroleum, Inc.* | | | 324,610 | | | | 15,948,089 | |
| Superior Energy Services, Inc.* | | | 631,050 | | | | 15,801,492 | |
| Resolute Energy Corp.* | | | 1,159,390 | | | | 9,692,500 | |
| Sanchez Energy Corp.* | | | 334,524 | | | | 8,834,779 | |
| C&J Energy Services, Inc.* | | | 319,620 | | | | 6,417,970 | |
| Energy XXI Bermuda Ltd. | | | 127,051 | | | | 3,836,940 | |
| Total Energy | | | | | | | 106,532,614 | |
| CONSUMER STAPLES - 5.0% | | | | | | | | |
| Bunge Ltd. | | | 378,470 | | | | 28,729,658 | |
| Hormel Foods Corp. | | | 392,400 | | | | 16,527,888 | |
| Darling International, Inc.* | | | 575,424 | | | | 12,175,972 | |
| JM Smucker Co. | | | 61,580 | | | | 6,468,363 | |
| Total Consumer Staples | | | | | | | 63,901,881 | |
| UTILITIES - 4.7% | | | | | | | | |
| Black Hills Corp. | | | 363,140 | | | | 18,106,160 | |
| UGI Corp. | | | 345,592 | | | | 13,523,015 | |
| Pepco Holdings, Inc. | | | 592,020 | | | | 10,928,690 | |
| Great Plains Energy, Inc. | | | 406,127 | | | | 9,016,019 | |
| MDU Resources Group, Inc. | | | 283,058 | | | | 7,917,132 | |
| Total Utilities | | | | | | | 59,491,016 | |
| SEE NOTES TO FINANCIAL STATEMENTS. | THE GUGGENHEIM FUNDS ANNUAL REPORT | 21 |
| SCHEDULE OF INVESTMENTS (concluded) | September 30, 2013 |
| MID CAP VALUE FUND | |
| | | Shares | | | Value | |
| | | | | | | |
| HEALTH CARE - 4.6% | | | | | | | | |
| Universal Health Services, Inc. — Class B | | | 194,520 | | | $ | 14,587,055 | |
| MEDNAX, Inc.* | | | 134,271 | | | | 13,480,808 | |
| Hologic, Inc.* | | | 592,511 | | | | 12,235,352 | |
| Kindred Healthcare, Inc. | | | 782,716 | | | | 10,511,876 | |
| Alere, Inc.* | | | 271,274 | | | | 8,292,846 | |
| Total Health Care | | | | | | | 59,107,937 | |
| Total Common Stocks | | | | | | | | |
| (Cost $949,539,870) | | | | | | | 1,251,133,635 | |
| CONVERTIBLE PREFERRED STOCK††† - 0.0% | | | | | | | | |
| Thermoenergy Corp.*,3,4 | | | 858,334 | | | | 100,253 | |
| Total Convertible Preferred Stock | | | | | | | | |
| (Cost $819,654) | | | | | | | 100,253 | |
| SHORT TERM INVESTMENTS† - 2.3% | | | | | | | | |
| Dreyfus Treasury Prime Cash | | | | | | | | |
| Management Fund | | | 29,760,616 | | | | 29,760,616 | |
| Total Short Term Investments | | | | | | | | |
| (Cost $29,760,616) | | | | | | | 29,760,616 | |
| | | | | | | |
| | | Face | | | | |
| | | Amount | | | | |
| | | | | | | |
| CONVERTIBLE BONDS†† - 0.6% | | | | | | | | |
| INDUSTRIALS - 0.6% | | | | | | | | |
| DryShips, Inc. | | | | | | | | |
| 5.00% due 12/01/14 | | $ | 7,525,000 | | | | 7,350,984 | |
| Total Convertible Bonds | | | | | | | | |
| (Cost $6,660,291) | | | | | | | 7,350,984 | |
| Total Investments - 100.7% | | | | | | | | |
| (Cost $986,780,431) | | | | | | $ | 1,288,345,488 | |
| | | | | | | | | |
| | | | Contracts | | | | | |
| OPTIONS WRITTEN† - 0.0% | | | | | | | | |
| Call options on: | | | | | | | | |
| Ocwen Financial Corp. | | | | | | | | |
| Expiring January 2014 | | | | | | | | |
| with strike price of $60.00 | | | 1,154 | | | | (305,810 | ) |
| Total Options Written | | | | | | | | |
| (Premiums received $390,057) | | | | | | | (305,810 | ) |
| Other Assets & Liabilities, net - (0.7)% | | | | | | | (8,998,086 | ) |
| Total Net Assets - 100.0% | | | | | | $ | 1,279,041,592 | |
| * | Non-income producing security. |
| † | Value determined based on Level 1 inputs — See Note 4. |
| †† | Value determined based on Level 2 inputs — See Note 4. |
| ††† | Value determined based on Level 3 inputs — See Note 4. |
| 1 | All or a portion of this security is pledged as collateral for open options written contracts at September 30, 2013. |
| 2 | Affiliated issuers — See Note 10. |
| 3 | PIPE (Private Investment in Public Equity) — Stock issued by a company in the secondary market as a means of raising capital more quickly and less expensively than through registration of a secondary public offering. |
| 22 | the GUGGENHEIM FUNDS annual report | See Notes to Financial STATEMENTS. |
| STATEMENT OF ASSETS | | | |
| AND LIABILITIES | | | |
September 30, 2013 | | | | |
| Assets: | | | | |
| Investments in unaffiliated issuers, at value | | | | |
| (cost $949,078,048) | | $ | 1,252,248,777 | |
| Investments in affiliated issuers, at value | | | | |
| (cost $37,702,383) | | | 36,096,711 | |
| Total investments | | | | |
| (cost $986,780,431) | | | 1,288,345,488 | |
| Prepaid expenses | | | 76,425 | |
| Cash | | | 9,998 | |
| Receivables: | | | | |
| Dividends | | | 1,753,390 | |
| Fund shares sold | | | 1,214,794 | |
| Securities sold | | | 691,044 | |
| Interest | | | 125,417 | |
| Total assets | | | 1,292,216,556 | |
| Liabilities: | | | | |
| Options written, at value | | | | |
| (premiums received $390,057) | | | 305,810 | |
| Payable for: | | | | |
| Fund shares redeemed | | | 8,789,072 | |
| Securities purchased | | | 2,062,494 | |
| Management fees | | | 827,176 | |
| Distribution and service fees | | | 409,208 | |
| Transfer agent/maintenance fees | | | 114,504 | |
| Fund accounting/administration fees | | | 99,569 | |
| Directors’ fees* | | | 14,567 | |
| Miscellaneous | | | 552,564 | |
| Total liabilities | | | 13,174,964 | |
| Net assets | | $ | 1,279,041,592 | |
| Net assets consist of: | | | | |
| Paid in capital | | $ | 916,939,480 | |
| Accumulated net investment loss | | | (752,180 | ) |
| Accumulated net realized gain on investments | | | 61,204,988 | |
| Net unrealized appreciation on investments | | | 301,649,304 | |
| Net assets | | $ | 1,279,041,592 | |
| A-Class: | | | | |
| Net assets | | $ | 1,038,762,172 | |
| Capital shares outstanding | | | 27,225,497 | |
| Net asset value per share | | $ | 38.15 | |
| Maximum offering price per share | | | | |
| (Net asset value divided by 95.25%) | | $ | 40.05 | |
| B-Class: | | | | |
| Net assets | | $ | 20,584,072 | |
| Capital shares outstanding | | | 665,118 | |
| Net asset value per share | | $ | 30.95 | |
| C-Class: | | | | |
| Net assets | | $ | 219,695,348 | |
| Capital shares outstanding | | | 6,838,595 | |
| Net asset value per share | | $ | 32.13 | |
| STATEMENT OF | | | |
| OPERATIONS | | | |
Year Ended September 30, 2013 | | | | |
| Investment Income: | | | | |
| Dividends from securities of unaffiliated issuers | | | | |
| (net of foreign withholding tax of $36,338) | | $ | 16,218,842 | |
| Dividends from securities of affiliated issuers | | | 256,359 | |
| Interest | | | 1,234,975 | |
| Total investment income | | | 17,710,176 | |
| | | | | |
| Expenses: | | | | |
| Management fees | | | 9,349,329 | |
| Transfer agent/maintenance fees: | | | | |
| A-Class | | | 1,792,464 | |
| B-Class | | | 46,726 | |
| C-Class | | | 341,840 | |
| Distribution and service fees: | | | | |
| A-Class | | | 2,392,284 | |
| B-Class | | | 220,453 | |
| C-Class | | | 2,009,981 | |
| Fund accounting/administration fees | | | 1,120,945 | |
| Directors’ fees* | | | 110,797 | |
| Custodian fees | | | 39,718 | |
| Tax expense | | | 32 | |
| Miscellaneous | | | 616,701 | |
| Total expenses | | | 18,041,270 | |
| Net investment loss | | | (331,094 | ) |
| | | | | |
| Net Realized and Unrealized Gain (Loss): | | | | |
| Net realized gain (loss) on: | | | | |
| Investments in unaffiliated issuers | | | 96,702,861 | |
| Options written | | | 838,918 | |
| Net realized gain | | | 97,541,779 | |
| Net change in unrealized appreciation (depreciation) on: | | | | |
| Investments in unaffiliated issuers | | | 196,114,452 | |
| Investments in affiliated issuers | | | 1,168,151 | |
| Options written | | | 147,973 | |
| Net change in unrealized appreciation (depreciation) | | | 197,430,576 | |
| Net realized and unrealized gain | | | 294,972,355 | |
| Net increase in net assets resulting from operations | | $ | 294,641,261 | |
* Relates to Directors not deemed “interested persons” within the meaning of Section 2(a)(19) of the 1940 Act.
| SEE NOTES TO FINANCIAL STATEMENTS. | THE GUGGENHEIM FUNDS ANNUAL REPORT | 23 |
| MID CAP VALUE FUND |
| |
| STATEMENTS OF CHANGES IN NET ASSETS |
| | | Year Ended | | | Year Ended | |
| | | September 30, | | | September 30, | |
| | | 2013 | | | 2012 | |
| | | | | | | |
| Increase (Decrease) In Net Assets From Operations: | | | | | | | | |
| Net investment loss | | $ | (331,094 | ) | | $ | (4,309,556 | ) |
| Net realized gain on investments | | | 97,541,779 | | | | 111,200,171 | |
| Net change in unrealized appreciation (depreciation) on investments | | | 197,430,576 | | | | 158,502,504 | |
| Net increase in net assets resulting from operations | | | 294,641,261 | | | | 265,393,119 | |
| | | | | | | | | |
| Distributions to shareholders from: | | | | | | | | |
| Net realized gains | | | | | | | | |
| A-Class | | | (92,674,750 | ) | | | (19,357,542 | ) |
| B-Class | | | (2,844,203 | ) | | | (613,604 | ) |
| C-Class | | | (22,741,115 | ) | | | (4,226,845 | ) |
| Total distributions to shareholders | | | (118,260,068 | ) | | | (24,197,991 | ) |
| | | | | | | | | |
| Capital share transactions: | | | | | | | | |
| Proceeds from sale of shares | | | | | | | | |
| A-Class | | | 196,756,789 | | | | 171,642,951 | |
| B-Class | | | 437,407 | | | | 205,712 | |
| C-Class | | | 29,825,646 | | | | 16,672,547 | |
| Distributions reinvested | | | | | | | | |
| A-Class | | | 83,496,316 | | | | 16,566,240 | |
| B-Class | | | 2,720,726 | | | | 589,906 | |
| C-Class | | | 16,692,864 | | | | 3,099,583 | |
| Cost of shares redeemed | | | | | | | | |
| A-Class | | | (292,306,316 | ) | | | (457,393,244 | ) |
| B-Class | | | (8,971,838 | ) | | | (10,129,746 | ) |
| C-Class | | | (44,208,482 | ) | | | (54,403,876 | ) |
| Net decrease from capital share transactions | | | (15,556,888 | ) | | | (313,149,927 | ) |
| Net increase (decrease) in net assets | | | 160,824,305 | | | | (71,954,799 | ) |
| | | | | | | | | |
| Net assets: | | | | | | | | |
| Beginning of year | | | 1,118,217,287 | | | | 1,190,172,086 | |
| End of year | | $ | 1,279,041,592 | | | $ | 1,118,217,287 | |
| Accumulated net investment loss at end of year | | $ | (752,180 | ) | | $ | (3,209,568 | ) |
| | | | | | | | | |
| Capital share activity: | | | | | | | | |
| Shares sold | | | | | | | | |
| A-Class | | | 5,636,342 | | | | 5,549,566 | |
| B-Class | | | 15,688 | | | | 7,545 | |
| C-Class | | | 1,023,309 | | | | 619,563 | |
| Shares issued from reinvestment of distributions | | | | | | | | |
| A-Class | | | 2,764,774 | | | | 573,427 | |
| B-Class | | | 110,419 | | | | 24,226 | |
| C-Class | | | 652,575 | | | | 123,440 | |
| Shares redeemed | | | | | | | | |
| A-Class | | | (8,501,344 | ) | | | (14,678,321 | ) |
| B-Class | | | (319,547 | ) | | | (389,584 | ) |
| C-Class | | | (1,532,165 | ) | | | (2,017,676 | ) |
| Net decrease in shares | | | (149,949 | ) | | | (10,187,814 | ) |
| 24 | the GUGGENHEIM FUNDS annual report | See Notes to Financial Statements. |
| MID CAP VALUE FUND |
| |
| FINANCIAL HIGHLIGHTS |
This table is presented to show selected data for a share outstanding throughout each period and to assist shareholders in evaluating a Fund’s performance for the periods presented.
| | | Year Ended | | | Year Ended | | | Year Ended | | | Year Ended | | | Year Ended | |
| | | September 30, | | | September 30, | | | September 30, | | | September 30, | | | September 30, | |
| A-Class | | 2013 | | | 2012 | | | 2011 | | | 2010 | | | 2009 | |
| Per Share Data | | | | | | | | | | | | | | | |
| Net asset value, beginning of period | | $ | 33.05 | | | $ | 27.13 | | | $ | 29.55 | | | $ | 26.58 | | | $ | 28.41 | |
| Income (loss) from investment operations: | | | | | | | | | | | | | | | | | | | | |
| Net investment income (loss)a | | | .04 | | | | (.07 | ) | | | (.03 | ) | | | .11 | | | | .08 | |
| Net gain (loss) on investments (realized and unrealized) | | | 8.59 | | | | 6.54 | | | | (2.31 | ) | | | 2.90 | | | | .82 | |
| Total from investment operations | | | 8.63 | | | | 6.47 | | | | (2.34 | ) | | | 3.01 | | | | .90 | |
| Less distributions from: | | | | | | | | | | | | | | | | | | | | |
| Net investment income | | | — | | | | — | | | | (.08 | ) | | | (.04 | ) | | | (.14 | ) |
| Net realized gains | | | (3.53 | ) | | | (.55 | ) | | | — | | | | — | | | | (2.59 | ) |
| Total distributions | | | (3.53 | ) | | | (.55 | ) | | | (.08 | ) | | | (.04 | ) | | | (2.73 | ) |
| Net asset value, end of period | | $ | 38.15 | | | $ | 33.05 | | | $ | 27.13 | | | $ | 29.55 | | | $ | 26.58 | |
| | | | | | | | | | | | | | | | | | | | | |
| Total Returnb | | | 28.93 | % | | | 24.13 | % | | | (7.98 | %) | | | 11.32 | % | | | 6.90 | % |
| Ratios/Supplemental Data | | | | | | | | | | | | | | | | | | | | |
| Net assets, end of period (in thousands) | | $ | 1,038,762 | | | $ | 903,221 | | | $ | 973,467 | | | $ | 1,056,655 | | | $ | 781,883 | |
| Ratios to average net assets: | | | | | | | | | | | | | | | | | | | | |
| Net investment income (loss) | | | 0.11 | % | | | (0.22 | %) | | | (0.10 | %) | | | 0.38 | % | | | 0.40 | % |
| Total expenses | | | 1.39 | % | | | 1.46 | % | | | 1.32 | % | | | 1.37 | % | | | 1.48 | % |
| Portfolio turnover rate | | | 23 | % | | | 19 | % | | | 28 | % | | | 23 | % | | | 31 | % |
| | | | | | | | | | | | | | | | | | | | | |
| | | | Year Ended | | | | Year Ended | | | | Year Ended | | | | Year Ended | | | | Year Ended | |
| | | | September 30, | | | | September 30, | | | | September 30, | | | | September 30, | | | | September 30, | |
| B-Class | | | 2013 | | | | 2012 | | | | 2011 | | | | 2010 | | | | 2009 | |
| Per Share Data | | | | | | | | | | | | | | | | | | | | |
| Net asset value, beginning of period | | $ | 27.66 | | | $ | 22.99 | | | $ | 25.17 | | | $ | 22.78 | | | $ | 24.83 | |
| Income (loss) from investment operations: | | | | | | | | | | | | | | | | | | | | |
| Net investment lossa | | | (.19 | ) | | | (.29 | ) | | | (.24 | ) | | | (.09 | ) | | | (.06 | ) |
| Net gain (loss) on investments (realized and unrealized) | | | 7.01 | | | | 5.51 | | | | (1.94 | ) | | | 2.48 | | | | .60 | |
| Total from investment operations | | | 6.82 | | | | 5.22 | | | | (2.18 | ) | | | 2.39 | | | | .54 | |
| Less distributions from: | | | | | | | | | | | | | | | | | | | | |
| Net realized gains | | | (3.53 | ) | | | (.55 | ) | | | — | | | | — | | | | (2.59 | ) |
| Total distributions | | | (3.53 | ) | | | (.55 | ) | | | — | | | | — | | | | (2.59 | ) |
| Net asset value, end of period | | $ | 30.95 | | | $ | 27.66 | | | $ | 22.99 | | | $ | 25.17 | | | $ | 22.78 | |
| | | | | | | | | | | | | | | | | | | | | |
| Total Returnb | | | 27.93 | % | | | 23.02 | % | | | (8.66 | %) | | | 10.49 | % | | | 6.17 | % |
| Ratios/Supplemental Data | | | | | | | | | | | | | | | | | | | | |
| Net assets, end of period (in thousands) | | $ | 20,584 | | | $ | 23,747 | | | $ | 27,960 | | | $ | 42,321 | | | $ | 58,221 | |
| Ratios to average net assets: | | | | | | | | | | | | | | | | | | | | |
| Net investment loss | | | (0.67 | %) | | | (1.09 | %) | | | (0.86 | %) | | | (0.40 | %) | | | (0.34 | %) |
| Total expenses | | | 2.16 | % | | | 2.33 | % | | | 2.07 | % | | | 2.12 | % | | | 2.23 | % |
| Portfolio turnover rate | | | 23 | % | | | 19 | % | | | 28 | % | | | 23 | % | | | 31 | % |
| SEE NOTES TO FINANCIAL STATEMENTS. | THE GUGGENHEIM FUNDS ANNUAL REPORT | 25 |
| MID CAP VALUE FUND |
| |
| FINANCIAL HIGHLIGHTS (concluded) |
This table is presented to show selected data for a share outstanding throughout each period and to assist shareholders in evaluating a Fund’s performance for the periods presented.
| | | Year Ended | | | Year Ended | | | Year Ended | | | Year Ended | | | Year Ended | |
| | | September 30, | | | September 30, | | | September 30, | | | September 30, | | | September 30, | |
| C-Class | | 2013 | | | 2012 | | | 2011 | | | 2010 | | | 2009 | |
| Per Share Data | | | | | | | | | | | | | | | | | | | | |
| Net asset value, beginning of period | | $ | 28.57 | | | $ | 23.68 | | | $ | 25.93 | | | $ | 23.47 | | | $ | 25.49 | |
| Income (loss) from investment operations: | | | | | | | | | | | | | | | | | | | | |
| Net investment lossa | | | (.18 | ) | | | (.25 | ) | | | (.24 | ) | | | (.09 | ) | | | (.07 | ) |
| Net gain (loss) on investments (realized and unrealized) | | | 7.27 | | | | 5.69 | | | | (2.01 | ) | | | 2.55 | | | | .64 | |
| Total from investment operations | | | 7.09 | | | | 5.44 | | | | (2.25 | ) | | | 2.46 | | | | .57 | |
| Less distributions from: | | | | | | | | | | | | | | | | | | | | |
| Net realized gains | | | (3.53 | ) | | | (.55 | ) | | | — | | | | — | | | | (2.59 | ) |
| Total distributions | | | (3.53 | ) | | | (.55 | ) | | | — | | | | — | | | | (2.59 | ) |
| Net asset value, end of period | | $ | 32.13 | | | $ | 28.57 | | | $ | 23.68 | | | $ | 25.93 | | | $ | 23.47 | |
| | | | | | | | | | | | | | | | | | | | | |
| Total Returnb | | | 27.98 | % | | | 23.28 | % | | | (8.68 | %) | | | 10.48 | % | | | 6.13 | % |
| Ratios/Supplemental Data | | | | | | | | | | | | | | | | | | | | |
| Net assets, end of period (in thousands) | | $ | 219,695 | | | $ | 191,249 | | | $ | 188,745 | | | $ | 193,986 | | | $ | 139,121 | |
| Ratios to average net assets: | | | | | | | | | | | | | | | | | | | | |
| Net investment loss | | | (0.62 | %) | | | (0.92 | %) | | | (0.85 | %) | | | (0.37 | %) | | | (0.35 | %) |
| Total expenses | | | 2.12 | % | | | 2.17 | % | | | 2.07 | % | | | 2.12 | % | | | 2.22 | % |
| Portfolio turnover rate | | | 23 | % | | | 19 | % | | | 28 | % | | | 23 | % | | | 31 | % |
| a | Net investment income (loss) per share was computed using average shares outstanding throughout the period. |
| b | Total return does not reflect the impact of any applicable sales charges. |
| 26 | the GUGGENHEIM FUNDS annual report | See Notes to Financial Statements. |
| MANAGERS’ COMMENTARY (Unaudited) | September 30, 2013 |
To Our Shareholders:
Guggenheim Mid Cap Value Institutional Fund (the “Fund”) is managed by a team of seasoned professionals led by James Schier, CFA, Portfolio Manager. In the following paragraphs, he discusses performance of the Fund for the fiscal year ended September 30, 2013.
For the year ended September 30, 2013, the Guggenheim Mid Cap Value Institutional Fund returned 28.89%1, compared with the 27.58% return of its benchmark, the Russell 2500 Value Index.
The strategy is to select securities of companies that appear undervalued by the overall market relative to assets, earnings, growth potential or cash flows. The investment approach is a defined and disciplined process with three key philosophical tenets that drive investment decisions: a valuation focus, a long-term investment horizon and an opportunistic approach.
The portfolio’s performance for the period was helped most by stock selection in the Financials and Information Technology sectors. The largest detractor from performance was stock selection in the Materials and Consumer Discretionary sectors.
The holdings contributing most to portfolio performance over the period were Cree, Inc., a maker of LED lighting; Ocwen Financial Corp., a mortgage servicer with a large presence in the subprime mortgage market; and Computer Sciences Corp., a business information technology company. Stock price gains for Cree and Computer Sciences were the main driver of the Information Technology sector performance for the period.
The main detractors were two precious metals mining companies, Allied Nevada Gold Corp. and Coeur Mining, Inc., which underperformed due to the selloff in gold earlier in 2013; and SandRidge Energy, Inc., an independent oil and natural gas company.
Sector positioning in the Fund is largely a result of stock selection decisions where the Fund believes it is finding the most attractive investment opportunities. The largest changes in positioning from a year ago were an increase in the Financials sector exposure and a decrease in the Industrials sector exposure.
As of September 30, 2013, the Fund had its largest overweight relative to the benchmark in Industrials, primarily in the engineering and construction industry. Investment opportunities appear attractive in maintaining U.S. infrastructure and grids for distributing oil, gas and electricity.
The Financials sector was the largest in both the Fund and the benchmark. However, the Fund is most underweight in this sector relative to its benchmark. This is mostly due to a zero weight in the REIT industry, which is a significant part of the Financials sector. REITs appear expensive, prices having been driven up by yield-hungry investors searching for bond substitutes. The Fund instead continues to favor the insurance industry, which is non-interest-sensitive, and the mortgage servicing industry. After Financials, the Fund was most underweight relative to the benchmark in Utilities, where current high valuations make this sector unattractive.
The Fund continues to focus on searching for companies with good long-term fundamental prospects and attractive valuations that are more likely to generate strong performance relative to the broader market, regardless of macroeconomic events.
Performance displayed represents past performance which is no guarantee of future results.
1 Performance figures do not reflect deduction of taxes that a shareholder would pay on distributions or the redemption of shares.
The opinions and forecast expressed may not actually come to pass. This information is subject to change at any time, based on market and other conditions, and should not be construed as a recommendation of any specific security or strategy.
| THE GUGGENHEIM FUNDS ANNUAL REPORT | 27 |
| PERFORMANCE REPORT AND FUND PROFILE (Unaudited) | September 30, 2013 |
MID CAP VALUE INSTITUTIONAL FUND
OBJECTIVE: Seeks long-term growth of capital.
Cumulative Fund Performance*
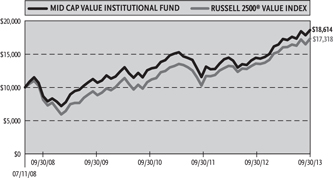
Average Annual Returns*
Periods Ended 09/30/13
| | | | | | | | | Since Inception | |
| | | 1 Year | | | 5 Year | | | (07/11/08) | |
| Mid Cap Value Institutional Fund | | | 28.89 | % | | | 11.75 | % | | | 12.64 | % |
| Russell 2500 Value Index | | | 27.58 | % | | | 11.07 | % | | | 11.09 | % |
Holdings Diversification (Market Exposure as % of Net Assets)
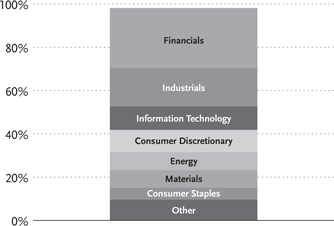
“Holdings Diversification (Market Exposure as % of Net Assets)” excludes any temporary cash investments.
| Inception Date: |
| July 11, 2008 |
| Ten Largest Holdings (% of Total Net Assets) | | | |
| Hanover Insurance Group, Inc. | | | 4.6 | % |
| Computer Sciences Corp. | | | 3.2 | % |
| Owens-Illinois, Inc. | | | 2.7 | % |
| Covanta Holding Corp. | | | 2.4 | % |
| Reinsurance Group of America, Inc. — Class A | | | 2.4 | % |
| American Financial Group, Inc. | | | 2.3 | % |
| Bunge Ltd. | | | 2.2 | % |
| Dreyfus Treasury Prime Cash Management Fund | | | 2.2 | % |
| WR Berkley Corp. | | | 2.2 | % |
| URS Corp. | | | 2.1 | % |
| Top Ten Total | | | 26.3 | % |
| * | The performance data above represents past performance that is not predictive of future results. The investment return and principal value of an investment in the Fund will fluctuate so that an investor’s shares, when redeemed, may be worth more or less than their original cost. Returns are historical and include changes in principal and reinvested dividends and capital gains and do not reflect the effect of taxes. The Russell 2500 Value Index is an unmanaged index and, unlike the Fund, has no management fees or operating expenses to reduce its reported return. |
| 28 | THE GUGGENHEIM FUNDS ANNUAL REPORT |
| SCHEDULE OF INVESTMENTS | September 30, 2013 |
| MID CAP VALUE INSTITUTIONAL FUND |
| | | Shares | | | Value | |
| | | | | | | |
| COMMON STOCKS† - 97.4% | | | | | | | | |
| | | | | | | | | |
| FINANCIALS - 27.7% | | | | | | | | |
| Hanover Insurance Group, Inc. | | | 472,263 | | | $ | 26,125,590 | |
| Reinsurance Group of America, Inc. — Class A | | | 201,193 | | | | 13,477,918 | |
| American Financial Group, Inc. | | | 245,510 | | | | 13,272,271 | |
| WR Berkley Corp. | | | 289,530 | | | | 12,409,256 | |
| Alleghany Corp.* | | | 26,538 | | | | 10,871,292 | |
| Northern Trust Corp. | | | 155,120 | | | | 8,436,977 | |
| Endurance Specialty Holdings Ltd. | | | 137,230 | | | | 7,371,996 | |
| Alexandria Real Estate Equities, Inc. | | | 91,900 | | | | 5,867,815 | |
| Ocwen Financial Corp.*,1 | | | 103,478 | | | | 5,770,968 | |
| BioMed Realty Trust, Inc. | | | 308,370 | | | | 5,732,598 | |
| Huntington Bancshares, Inc. | | | 690,090 | | | | 5,700,142 | |
| Lexington Realty Trust | | | 473,740 | | | | 5,320,100 | |
| Employers Holdings, Inc. | | | 153,794 | | | | 4,573,834 | |
| Wintrust Financial Corp. | | | 102,750 | | | | 4,219,943 | |
| Home Loan Servicing Solutions Ltd. | | | 186,220 | | | | 4,098,702 | |
| SVB Financial Group* | | | 41,590 | | | | 3,592,128 | |
| FirstMerit Corp. | | | 164,235 | | | | 3,565,542 | |
| Zions Bancorporation | | | 126,980 | | | | 3,481,792 | |
| City National Corp. | | | 49,030 | | | | 3,268,340 | |
| First Midwest Bancorp, Inc. | | | 202,729 | | | | 3,063,235 | |
| First Niagara Financial Group, Inc. | | | 272,040 | | | | 2,821,055 | |
| Redwood Trust, Inc. | | | 103,436 | | | | 2,036,654 | |
| Investors Real Estate Trust | | | 224,810 | | | | 1,854,683 | |
| Campus Crest Communities, Inc. | | | 115,900 | | | | 1,251,720 | |
| Bimini Capital Management, Inc. — Class A* | | | 164,371 | | | | 30,409 | |
| Total Financials | | | | | | | 158,214,960 | |
| INDUSTRIALS - 17.1% | | | | | | | | |
| Covanta Holding Corp. | | | 632,910 | | | | 13,531,616 | |
| URS Corp. | | | 226,467 | | | | 12,172,600 | |
| Quanta Services, Inc.* | | | 403,680 | | | | 11,105,237 | |
| Navigant Consulting, Inc.* | | | 677,970 | | | | 10,481,415 | |
| Aegion Corp. — Class A* | | | 410,115 | | | | 9,732,029 | |
| Orbital Sciences Corp.* | | | 425,898 | | | | 9,020,520 | |
| General Cable Corp. | | | 223,614 | | | | 7,099,745 | |
| ICF International, Inc.* | | | 169,633 | | | | 6,006,705 | |
| Saia, Inc.* | | | 124,715 | | | | 3,888,614 | |
| Towers Watson & Co. — Class A | | | 35,761 | | | | 3,824,997 | |
| DigitalGlobe, Inc.* | | | 102,541 | | | | 3,242,346 | |
| Babcock & Wilcox Co. | | | 95,158 | | | | 3,208,728 | |
| United Stationers, Inc. | | | 68,416 | | | | 2,976,096 | |
| AZZ, Inc. | | | 38,080 | | | | 1,594,029 | |
| Total Industrials | | | | | | | 97,884,677 | |
| INFORMATION TECHNOLOGY - 10.8% | | | | | | | | |
| Computer Sciences Corp. | | | 353,830 | | | | 18,307,164 | |
| IXYS Corp. | | | 938,399 | | | | 9,055,550 | |
| Cree, Inc.* | | | 124,840 | | | | 7,514,120 | |
| Maxwell Technologies, Inc.* | | | 769,411 | | | | 6,986,252 | |
| RF Micro Devices, Inc.* | | | 1,093,730 | | | | 6,168,637 | |
| Global Payments, Inc. | | | 111,700 | | | | 5,705,636 | |
| Semtech Corp.* | | | 97,250 | | | | 2,916,528 | |
| Symmetricom, Inc.* | | | 414,447 | | | | 1,997,635 | |
| Euronet Worldwide, Inc.* | | | 45,610 | | | | 1,815,278 | |
| OmniVision Technologies, Inc.* | | | 96,630 | | | | 1,479,405 | |
| Total Information Technology | | | | | | | 61,946,205 | |
| CONSUMER DISCRETIONARY - 10.3% | | | | | | | | |
| Brown Shoe Company, Inc. | | | 465,048 | | | | 10,914,676 | |
| Chico’s FAS, Inc. | | | 442,290 | | | | 7,368,551 | |
| Maidenform Brands, Inc.* | | | 269,927 | | | | 6,340,585 | |
| Cabela’s, Inc.* | | | 94,040 | | | | 5,927,341 | |
| Jack in the Box, Inc.* | | | 139,660 | | | | 5,586,400 | |
| DeVry, Inc. | | | 174,273 | | | | 5,325,783 | |
| Jones Group, Inc. | | | 353,062 | | | | 5,299,461 | |
| Guess?, Inc. | | | 150,891 | | | | 4,504,096 | |
| Scholastic Corp. | | | 151,870 | | | | 4,351,076 | |
| Gentex Corp. | | | 136,330 | | | | 3,488,685 | |
| HydroGen Corp.*,2 | | | 1,265,700 | | | | 8,860 | |
| Total Consumer Discretionary | | | | | | | 59,115,514 | |
| ENERGY - 8.3% | | | | | | | | |
| Cameco Corp. | | | 584,450 | | | | 10,561,012 | |
| Whiting Petroleum Corp.* | | | 165,501 | | | | 9,905,235 | |
| Oasis Petroleum, Inc.* | | | 143,640 | | | | 7,057,033 | |
| Superior Energy Services, Inc.* | | | 280,970 | | | | 7,035,489 | |
| Resolute Energy Corp.* | | | 505,020 | | | | 4,221,967 | |
| Sanchez Energy Corp.* | | | 147,367 | | | | 3,891,962 | |
| C&J Energy Services, Inc.* | | | 142,950 | | | | 2,870,436 | |
| Energy XXI Bermuda Ltd. | | | 56,101 | | | | 1,694,250 | |
| Total Energy | | | | | | | 47,237,384 | |
| MATERIALS - 8.2% | | | | | | | | |
| Owens-Illinois, Inc.* | | | 509,260 | | | | 15,287,985 | |
| Sonoco Products Co. | | | 197,286 | | | | 7,682,317 | |
| Coeur Mining, Inc.* | | | 552,750 | | | | 6,660,638 | |
| Zoltek Companies, Inc.* | | | 392,264 | | | | 6,546,886 | |
| Landec Corp.* | | | 370,000 | | | | 4,514,000 | |
| Globe Specialty Metals, Inc. | | | 199,577 | | | | 3,075,482 | |
| Allied Nevada Gold Corp.* | | | 728,630 | | | | 3,045,673 | |
| Total Materials | | | | | | | 46,812,981 | |
| CONSUMER STAPLES - 5.4% | | | | | | | | |
| Bunge Ltd. | | | 167,250 | | | | 12,695,947 | |
| Hormel Foods Corp. | | | 208,720 | | | | 8,791,286 | |
| Darling International, Inc.* | | | 255,592 | | | | 5,408,327 | |
| JM Smucker Co. | | | 39,570 | | | | 4,156,433 | |
| Total Consumer Staples | | | | | | | 31,051,993 | |
| UTILITIES - 5.0% | | | | | | | | |
| Black Hills Corp. | | | 162,769 | | | | 8,115,662 | |
| Great Plains Energy, Inc. | | | 291,565 | | | | 6,472,743 | |
| UGI Corp. | | | 147,660 | | | | 5,777,936 | |
| Pepco Holdings, Inc. | | | 259,690 | | | | 4,793,877 | |
| MDU Resources Group, Inc. | | | 124,307 | | | | 3,476,867 | |
| Total Utilities | | | | | | | 28,637,085 | |
| SEE NOTES TO FINANCIAL STATEMENTS. | THE GUGGENHEIM FUNDS ANNUAL REPORT | 29 |
| SCHEDULE OF INVESTMENTS (concluded) | September 30, 2013 |
| MID CAP VALUE INSTITUTIONAL FUND | |
| | | Shares | | | Value | |
| | | | | | | |
| Health Care - 4.6% | | | | | | | | |
| Universal Health Services, | | | | | | | | |
| Inc. — Class B | | | 96,770 | | | $ | 7,256,783 | |
| MEDNAX, Inc.* | | | 59,583 | | | | 5,982,133 | |
| Hologic, Inc.* | | | 244,402 | | | | 5,046,901 | |
| Kindred Healthcare, Inc. | | | 304,621 | | | | 4,091,060 | |
| Alere, Inc.* | | | 117,799 | | | | 3,601,115 | |
| Total Health Care | | | | | | | 25,977,992 | |
| Total Common Stocks | | | | | | | | |
| (Cost $432,157,621) | | | | | | | 556,878,791 | |
| CONVERTIBLE PREFERRED STOCK††† - 0.0% | | | | | | | | |
| Thermoenergy Corp.*,3,4 | | | 793,750 | | | | 92,710 | |
| Total Convertible Preferred Stock | | | | | | | | |
| (Cost $757,980) | | | | | | | 92,710 | |
| SHORT TERM INVESTMENTS† - 2.2% | | | | | | | | |
| Dreyfus Treasury Prime Cash | | | | | | | | |
| Management Fund | | | 12,582,756 | | | | 12,582,756 | |
| Total Short Term Investments | | | | | | | | |
| (Cost $12,582,756) | | | | | | | 12,582,756 | |
| | | Face | | | | |
| | | Amount | | | | |
| | | | | | | |
| CONVERTIBLE BONDS†† - 0.7% | | | | | | | | |
| INDUSTRIALS - 0.7% | | | | | | | | |
| DryShips, Inc. | | | | | | | | |
| 5.00% due 12/01/14 | | $ | 4,225,000 | | | | 4,127,297 | |
| Total Convertible Bonds | | | | | | | | |
| (Cost $3,714,877) | | | | | | | 4,127,297 | |
| Total Investments - 100.3% | | | | | | | | |
| (Cost $449,213,234) | | | | | | $ | 573,681,554 | |
| | | | Contracts | | | | | |
| OPTIONS WRITTEN† - 0.0% | | | | | | | | |
| Call options on: | | | | | | | | |
| Ocwen Financial Corp. | | | | | | | | |
| Expiring January 2014 | | | | | | | | |
| with strike price of $60.00 | | | 517 | | | | (137,005 | ) |
| Total Options Written | | | | | | | | |
| (Premiums received $174,748) | | | | | | | (137,005 | ) |
| Other Assets & Liabilities, net - (0.3)% | | | | | | | (2,079,506 | ) |
| Total Net Assets - 100.0% | | | | | | $ | 571,465,043 | |
| * | Non-income producing security. |
| † | Value determined based on Level 1 inputs — See Note 4. |
| †† | Value determined based on Level 2 inputs — See Note 4. |
| ††† | Value determined based on Level 3 inputs — See Note 4. |
| 1 | All or a portion of this security is pledged as collateral for open options written contracts at September 30, 2013. |
| 2 | Affiliated issuers — See Note 10. |
| 3 | PIPE (Private Investment in Public Equity) — Stock issued by a company in the secondary market as a means of raising capital more quickly and less expensively than through registration of a secondary public offering. |
| 30 | the GUGGENHEIM FUNDS annual report | See Notes to Financial STATEMENTS. |
| MID CAP VALUE INSTITUTIONAL FUND |
| |
| STATEMENT OF ASSETS |
| AND LIABILITIES |
|
| September 30, 2013 |
| Assets: | | | | |
| Investments in unaffiliated issuers, at value | | | | |
| (cost $449,210,703) | | $ | 573,672,694 | |
| Investments in affiliated issuers, at value | | | | |
| (cost $2,531) | | | 8,860 | |
| Total investments | | | | |
| (cost $449,213,234) | | | 573,681,554 | |
| Prepaid expenses | | | 36,738 | |
| Cash | | | 4,414 | |
| Receivables: | | | | |
| Dividends | | | 779,676 | |
| Fund shares sold | | | 375,517 | |
| Interest | | | 70,417 | |
| Securities sold | | | 13,258 | |
| Total assets | | | 574,961,574 | |
| Liabilities: | | | | |
| Options written, at value | | | | |
| (premiums received $174,748) | | | 137,005 | |
| Payable for: | | | | |
| Fund shares redeemed | | | 1,767,806 | |
| Securities purchased | | | 1,119,191 | |
| Management fees | | | 352,175 | |
| Fund accounting/administration fees | | | 44,608 | |
| Transfer agent/maintenance fees | | | 23,854 | |
| Directors’ fees* | | | 1,142 | |
| Miscellaneous | | | 50,750 | |
| Total liabilities | | | 3,496,531 | |
| Net assets | | $ | 571,465,043 | |
| Net assets consist of: | | | | |
| Paid in capital | | $ | 417,187,971 | |
| Undistributed net investment income | | | 3,072,708 | |
| Accumulated net realized gain on investments | | | 26,698,301 | |
| Net unrealized appreciation on investments | | | 124,506,063 | |
| Net assets | | $ | 571,465,043 | |
| Capital shares outstanding | | | 43,655,020 | |
| Net asset value per share | | $ | 13.09 | |
| STATEMENT OF |
| OPERATIONS |
| Year Ended September 30, 2013 |
| Investment Income: | | | | |
| Dividends (net of foreign withholding tax of $16,155) | | $ | 7,259,373 | |
| Interest | | | 755,933 | |
| Total investment income | | | 8,015,306 | |
| | | | | |
| Expenses: | | | | |
| Management fees | | | 3,938,050 | |
| Transfer agent/maintenance fees | | | 541,854 | |
| Fund accounting/administration fees | | | 498,813 | |
| Directors’ fees* | | | 43,793 | |
| Custodian fees | | | 24,624 | |
| Tax expense | | | 14 | |
| Miscellaneous | | | 274,995 | |
| Total expenses | | | 5,322,143 | |
| Net investment income | | | 2,693,163 | |
| | | | | |
| Net Realized and Unrealized Gain (Loss): | | | | |
| Net realized gain (loss) on: | | | | |
| Investments in unaffiliated issuers | | | 40,736,728 | |
| Options written | | | 385,021 | |
| Net realized gain | | | 41,121,749 | |
| Net change in unrealized appreciation (depreciation) on: | | | | |
| Investments in unaffiliated issuers | | | 88,403,399 | |
| Investments in affiliated issuers | | | (6,328 | ) |
| Options written | | | 68,507 | |
| Net change in unrealized appreciation (depreciation) | | | 88,465,578 | |
| Net realized and unrealized gain | | | 129,587,327 | |
| Net increase in net assets resulting from operations | | $ | 132,280,490 | |
* Relates to Directors not deemed “interested persons” within the meaning of Section 2(a)(19) of the 1940 Act.
| SEE NOTES TO FINANCIAL STATEMENTS. | THE GUGGENHEIM FUNDS ANNUAL REPORT | 31 |
| MID CAP VALUE INSTITUTIONAL FUND |
| |
| STATEMENTS OF CHANGES IN NET ASSETS |
| | | Year Ended | | | Year Ended | |
| | | September 30, | | | September 30, | |
| | | 2013 | | | 2012 | |
| | | | | | | |
| Increase (Decrease) In Net Assets From Operations: | | | | | | | | |
| Net investment income | | $ | 2,693,163 | | | $ | 1,542,702 | |
| Net realized gain on investments | | | 41,121,749 | | | | 40,470,116 | |
| Net change in unrealized appreciation (depreciation) on investments | | | 88,465,578 | | | | 72,481,047 | |
| Net increase in net assets resulting from operations | | | 132,280,490 | | | | 114,493,865 | |
| | | | | | | | | |
| Distributions to shareholders from: | | | | | | | | |
| Net investment income | | | (1,542,680 | ) | | | (1,977,527 | ) |
| Net realized gains | | | (46,688,296 | ) | | | (44,425,740 | ) |
| Total distributions to shareholders | | | (48,230,976 | ) | | | (46,403,267 | ) |
| | | | | | | | | |
| Capital share transactions: | | | | | | | | |
| Proceeds from sale of shares | | | 136,201,875 | | | | 168,213,889 | |
| Distributions reinvested | | | 27,245,300 | | | | 20,469,550 | |
| Cost of shares redeemed | | | (166,772,360 | ) | | | (238,299,328 | ) |
| Net decrease from capital share transactions | | | (3,325,185 | ) | | | (49,615,889 | ) |
| Net increase in net assets | | | 80,724,329 | | | | 18,474,709 | |
| | | | | | | | | |
| Net assets: | | | | | | | | |
| Beginning of year | | | 490,740,714 | | | | 472,266,005 | |
| End of year | | $ | 571,465,043 | | | $ | 490,740,714 | |
| Undistributed net investment income at end of year | | $ | 3,072,708 | | | $ | 1,542,680 | |
| | | | | | | | | |
| Capital share activity: | | | | | | | | |
| Shares sold | | | 11,673,620 | | | | 16,021,148 | |
| Shares issued from reinvestment of distributions | | | 2,629,855 | | | | 2,088,722 | |
| Shares redeemed | | | (14,131,954 | ) | | | (21,974,810 | ) |
| Net increase (decrease) in shares | | | 171,521 | | | | (3,864,940 | ) |
| 32 | the GUGGENHEIM FUNDS annual report | See Notes to Financial STATEMENTS. |
| MID CAP VALUE INSTITUTIONAL FUND |
| |
| FINANCIAL HIGHLIGHTS |
This table is presented to show selected data for a share outstanding throughout each period and to assist shareholders in evaluating a Fund’s performance for the periods presented.
| | | Year Ended | | | Year Ended | | | Year Ended | | | Year Ended | | | Year Ended | |
| | | September 30, | | | September 30, | | | September 30, | | | September 30, | | | September 30, | |
| Institutional Class | | 2013 | | | 2012 | | | 2011 | | | 2010 | | | 2009 | |
| Per Share Data | | | | | | | | | | | | | | | | | | | | |
| Net asset value, beginning of period | | $ | 11.29 | | | $ | 9.97 | | | $ | 11.34 | | | $ | 10.49 | | | $ | 10.68 | |
| Income (loss) from investment operations: | | | | | | | | | | | | | | | | | | | | |
| Net investment incomea | | | .06 | | | | .03 | | | | .04 | | | | .08 | | | | .08 | |
| Net gain (loss) on | | | | | | | | | | | | | | | | | | | | |
| investments (realized and unrealized) | | | 2.90 | | | | 2.30 | | | | (.87 | ) | | | 1.13 | | | | .27 | |
| Total from investment operations | | | 2.96 | | | | 2.33 | | | | (.83 | ) | | | 1.21 | | | | .35 | |
| Less distributions from: | | | | | | | | | | | | | | | | | | | | |
| Net investment income | | | (.04 | ) | | | (.04 | ) | | | (.06 | ) | | | (.01 | ) | | | (.06 | ) |
| Net realized gains | | | (1.12 | ) | | | (.97 | ) | | | (.48 | ) | | | (.35 | ) | | | (.48 | ) |
| Total distributions | | | (1.16 | ) | | | (1.01 | ) | | | (.54 | ) | | | (.36 | ) | | | (.54 | ) |
| Net asset value, end of period | | $ | 13.09 | | | $ | 11.29 | | | $ | 9.97 | | | $ | 11.34 | | | $ | 10.49 | |
| | | | | | | | | | | | | | | | | | | | | |
| Total Return | | | 28.89 | % | | | 24.96 | % | | | (8.05 | %) | | | 11.76 | % | | | 5.30 | % |
| Ratios/Supplemental Data | | | | | | | | | | | | | | | | | | | | |
| Net assets, end of period (in thousands) | | $ | 571,465 | | | $ | 490,741 | | | $ | 472,266 | | | $ | 514,447 | | | $ | 317,455 | |
| Ratios to average net assets: | | | | | | | | | | | | | | | | | | | | |
| Net investment income | | | 0.51 | % | | | 0.30 | % | | | 0.34 | % | | | 0.78 | % | | | 0.82 | % |
| Total expenses | | | 1.01 | % | | | 1.01 | % | | | 0.98 | % | | | 0.95 | % | | | 0.98 | % |
| Net expenses | | | 1.01 | % | | | 0.98 | %b | | | 0.90 | %b | | | 0.90 | %b | | | 0.91 | %b |
| Portfolio turnover rate | | | 24 | % | | | 33 | % | | | 38 | % | | | 20 | % | | | 76 | % |
| a | Net investment income per share was computed using average shares outstanding throughout the period. |
| b | Net expense information reflects the expense ratios after expense waivers and reimbursements, as applicable. |
| SEE NOTES TO FINANCIAL STATEMENTS. | THE GUGGENHEIM FUNDS ANNUAL REPORT | 33 |
| MANAGERS’ COMMENTARY (Unaudited) | September 30, 2013 |
To Our Shareholders:
Guggenheim Small Cap Value Fund (the “Fund”) is managed by a team of seasoned professionals led by James Schier, CFA, Portfolio Manager. In the following paragraphs, he discusses performance of the Fund for the fiscal year ended September 30, 2013.
For the year ended September 30, 2013, the Guggenheim Small Cap Value Fund returned 29.39%1, compared with the 27.04% return of its benchmark, the Russell 2000 Value Index.
The strategy is to select securities of companies that appear undervalued by the overall market relative to assets, earnings, growth potential or cash flows. The investment approach is a defined and disciplined process with three key philosophical tenets that drive investment decisions: a valuation focus, a long-term investment horizon and an opportunistic approach.
The portfolio’s performance for the period was helped most by stock selection in the Financials sector and both an overweight and stock selection in the Industrials sector. The largest detractor from performance was stock selection in the Consumer Discretionary and Materials sectors.
The holdings contributing most to portfolio performance over the period were Cree, Inc., a maker of LED lighting; Saia, Inc., a shipping and logistics company; and Ocwen Financial Corp., a mortgage servicer with a large presence in the subprime mortgage market.
The first and third largest detractors were two precious metals mining companies, Allied Nevada Gold Corp. and Coeur Mining, Inc., which underperformed due to the selloff in gold earlier in 2013; between them was Central Garden and Pet, a marketer of products for lawns and pet supplies.
Sector positioning in the Fund is largely a result of stock selection decisions where the Fund believes it is finding the most attractive investment opportunities. The largest changes in positioning from a year ago were an increase in the Financials sector exposure and a decrease in the Materials sector exposure.
As of September 30, 2013, the Fund had its largest overweight relative to the benchmark in Industrials, primarily in the engineering and construction industry. Investment opportunities appear attractive in maintaining U.S. infrastructure and grids for distributing oil, gas and electricity.
The Financials sector was the largest in both the Fund and the benchmark. However, the Fund is most underweight in this sector relative to its benchmark. This is mostly due to a zero weight in the REIT industry, which is a significant part of the Financials sector. REITs appear expensive, prices having been driven up by yield-hungry investors searching for bond substitutes. The Fund instead continues to favor the insurance industry, which is non-interest-sensitive, and the mortgage servicing industry.
The Fund continues to focus on searching for companies with good long-term fundamental prospects and attractive valuations that are more likely to generate strong performance relative to the broader market, regardless of macroeconomic events.
Performance displayed represents past performance which is no guarantee of future results.
| 1 | Performance figures are based on A-Class shares and do not reflect deduction of the sales charges or taxes that a shareholder would pay on distributions or the redemption of shares. Fee waivers and/or reimbursements reduce Fund expenses, and, in the absence of such waivers, the performance quoted would be reduced. |
The opinions and forecast expressed may not actually come to pass. This information is subject to change at any time, based on market and other conditions, and should not be construed as a recommendation of any specific security or strategy.
| 34 | THE GUGGENHEIM FUNDS ANNUAL REPORT |
| PERFORMANCE REPORT AND FUND PROFILE (Unaudited) | September 30, 2013 |
SMALL CAP VALUE FUND
OBJECTIVE: Seeks long-term capital appreciation.
Cumulative Fund Performance*
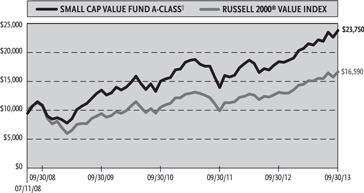
Average Annual Returns*
Periods Ended 09/30/13
| | | | | | | | | Since Inception | |
| | | 1 Year | | | 5 Year | | | (07/11/08) | |
| A-Class Shares | | | 29.39 | % | | | 17.03 | % | | | 19.36 | % |
| A-Class Shares with sales charge† | | | 23.24 | % | | | 15.65 | % | | | 18.02 | % |
| C-Class Shares | | | 28.34 | % | | | 16.19 | % | | | 18.50 | % |
| C-Class Shares with CDSC‡ | | | 27.34 | % | | | 16.19 | % | | | 18.50 | % |
| Institutional Class Shares | | | 29.74 | % | | | 17.30 | % | | | 19.65 | % |
| Russell 2000 Value Index | | | 27.04 | % | | | 9.13 | % | | | 10.18 | % |
Holdings Diversification (Market Exposure as % of Net Assets)
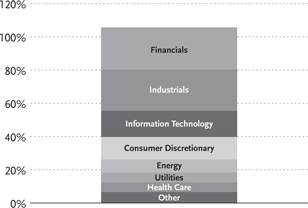
“Holdings Diversification (Market Exposure as % of Net Assets)” excludes any temporary cash investments.
| Inception Dates: | |
| A-Class | July 11, 2008 |
| C-Class | July 11, 2008 |
| Institutional Class | July 11, 2008 |
| Ten Largest Holdings (% of Total Net Assets) | | | |
| Dreyfus Treasury Prime Cash Management Fund | | | 5.2 | % |
| Hanover Insurance Group, Inc. | | | 4.3 | % |
| Reinsurance Group of America, Inc. — Class A | | | 2.4 | % |
| Covanta Holding Corp. | | | 2.2 | % |
| Brown Shoe Company, Inc. | | | 1.9 | % |
| Home Loan Servicing Solutions Ltd. | | | 1.9 | % |
| Global Cash Access Holdings, Inc. | | | 1.9 | % |
| Endurance Specialty Holdings Ltd. | | | 1.9 | % |
| ICF International, Inc. | | | 1.7 | % |
| Horace Mann Educators Corp. | | | 1.7 | % |
| Top Ten Total | | | 25.1 | % |
| * | The performance data above represents past performance that is not predictive of future results. The investment return and principal value of an investment in the Fund will fluctuate so that an investor’s shares, when redeemed, may be worth more or less than their original cost. Returns are historical and include changes in principal and reinvested dividends and capital gains and do not reflect the effect of taxes. The Russell 2000 Value Index is an unmanaged index and, unlike the Fund, has no management fees or operating expenses to reduce its reported return. |
| † | Effective February 22, 2011, the maximum sales charge decreased from 5.75% to 4.75%. A 5.75% maximum sales charge is used in the calculation of the 5 Year and 10 Year average annual returns (based on subscriptions made prior to February 22, 2011), and a 4.75% maximum sales charge will be used to calculate performance for periods based on subscriptions made on or after February 22, 2011. |
| ‡ | Fund returns include a CDSC of 1% if redeemed within 12 months of purchase. |
| THE GUGGENHEIM FUNDS ANNUAL REPORT | 35 |
| SCHEDULE OF INVESTMENTS | September 30, 2013 |
| SMALL CAP VALUE FUND | |
| | | Shares | | | Value | |
| | | | | | | |
| COMMON STOCKS† - 105.2% | | | | | | | | |
| | | | | | | | | |
| Financials - 25.3% | | | | | | | | |
| Hanover Insurance Group, Inc. | | | 34,740 | | | $ | 1,921,817 | |
| Reinsurance Group of America, Inc. — Class A | | | 15,990 | | | | 1,071,170 | |
| Home Loan Servicing Solutions Ltd. | | | 38,990 | | | | 858,170 | |
| Endurance Specialty Holdings Ltd. | | | 15,404 | | | | 827,503 | |
| Horace Mann Educators Corp. | | | 27,280 | | | | 774,206 | |
| Bancorp, Inc.* | | | 35,490 | | | | 628,883 | |
| Campus Crest Communities, Inc. | | | 57,350 | | | | 619,380 | |
| 1st Source Corp. | | | 21,580 | | | | 580,934 | |
| Ocwen Financial Corp.*,1 | | | 8,651 | | | | 482,466 | |
| Safeguard Scientifics, Inc.* | | | 28,230 | | | | 442,929 | |
| PrivateBancorp, Inc. — Class A | | | 20,586 | | | | 440,540 | |
| Berkshire Hills Bancorp, Inc. | | | 16,520 | | | | 414,817 | |
| BancFirst Corp. | | | 7,455 | | | | 403,092 | |
| Employers Holdings, Inc. | | | 13,346 | | | | 396,910 | |
| AMERISAFE, Inc. | | | 8,835 | | | | 313,731 | |
| Solar Senior Capital Ltd. | | | 16,428 | | | | 297,018 | |
| Lexington Realty Trust | | | 26,397 | | | | 296,438 | |
| Navigators Group, Inc.* | | | 4,800 | | | | 277,296 | |
| Redwood Trust, Inc. | | | 13,066 | | | | 257,270 | |
| Total Financials | | | | | | | 11,304,570 | |
| Industrials - 24.3% | | | | | | | | |
| Covanta Holding Corp.1 | | | 46,580 | | | | 995,880 | |
| ICF International, Inc.* | | | 21,947 | | | | 777,143 | |
| Celadon Group, Inc. | | | 37,722 | | | | 704,269 | |
| Energy Recovery, Inc.* | | | 96,450 | | | | 699,263 | |
| Curtiss-Wright Corp. | | | 14,490 | | | | 680,451 | |
| PMFG, Inc.* | | | 88,715 | | | | 656,491 | |
| Aegion Corp. — Class A* | | | 24,753 | | | | 587,389 | |
| Navigant Consulting, Inc.* | | | 37,500 | | | | 579,750 | |
| KEYW Holding Corp.* | | | 42,835 | | | | 576,131 | |
| General Cable Corp. | | | 17,936 | | | | 569,468 | |
| Orbital Sciences Corp.* | | | 26,774 | | | | 567,073 | |
| Dynamic Materials Corp. | | | 23,612 | | | | 547,326 | |
| Powell Industries, Inc.* | | | 8,107 | | | | 496,878 | |
| Sterling Construction Company, Inc.* | | | 50,988 | | | | 471,639 | |
| Great Lakes Dredge & Dock Corp. | | | 62,676 | | | | 465,056 | |
| Saia, Inc.* | | | 10,375 | | | | 323,493 | |
| Global Power Equipment Group, Inc. | | | 12,600 | | | | 253,386 | |
| Marten Transport Ltd. | | | 13,860 | | | | 237,699 | |
| DigitalGlobe, Inc.* | | | 7,129 | | | | 225,419 | |
| Rand Logistics, Inc.* | | | 39,190 | | | | 191,247 | |
| MiX Telematics Ltd. ADR* | | | 9,519 | | | | 140,881 | |
| AZZ, Inc. | | | 3,160 | | | | 132,278 | |
| Total Industrials | | | | | | | 10,878,610 | |
| Information Technology - 15.9% | | | | | | | | |
| Global Cash Access Holdings, Inc.* | | | 106,790 | | | | 834,030 | |
| Maxwell Technologies, Inc.* | | | 76,089 | | | | 690,888 | |
| Cree, Inc.* | | | 10,420 | | | | 627,180 | |
| Insight Enterprises, Inc.* | | | 30,994 | | | | 586,406 | |
| IXYS Corp. | | | 48,650 | | | | 469,473 | |
| Digi International, Inc.* | | | 46,751 | | | | 467,977 | |
| RF Micro Devices, Inc.* | | | 78,810 | | | | 444,488 | |
| Carbonite, Inc.* | | | 29,570 | | | | 443,550 | |
| Global Payments, Inc. | | | 8,030 | | | | 410,172 | |
| Silicon Graphics International Corp.* | | | 23,680 | | | | 384,800 | |
| Newport Corp.* | | | 24,280 | | | | 379,496 | |
| Semtech Corp.* | | | 8,550 | | | | 256,415 | |
| Multi-Fineline Electronix, Inc.* | | | 14,240 | | | | 230,973 | |
| Spansion, Inc. — Class A* | | | 22,860 | | | | 230,657 | |
| Higher One Holdings, Inc.* | | | 27,810 | | | | 213,303 | |
| Mercury Systems, Inc.* | | | 17,830 | | | | 178,122 | |
| Symmetricom, Inc.* | | | 24,280 | | | | 117,030 | |
| OmniVision Technologies, Inc.* | | | 7,500 | | | | 114,825 | |
| Total Information Technology | | | | | | | 7,079,785 | |
| Consumer Discretionary - 13.6% | | | | | | | | |
| Brown Shoe Company, Inc. | | | 36,674 | | | | 860,739 | |
| International Speedway Corp. — Class A | | | 23,171 | | | | 748,423 | |
| Maidenform Brands, Inc.* | | | 31,570 | | | | 741,580 | |
| iRobot Corp.*,1 | | | 18,718 | | | | 705,107 | |
| Chico’s FAS, Inc. | | | 36,440 | | | | 607,090 | |
| DeVry, Inc. | | | 18,180 | | | | 555,581 | |
| Cabela’s, Inc.* | | | 6,530 | | | | 411,586 | |
| Scholastic Corp. | | | 13,472 | | | | 385,973 | |
| Guess?, Inc. | | | 12,559 | | | | 374,886 | |
| Jones Group, Inc. | | | 23,942 | | | | 359,369 | |
| Gentex Corp. | | | 12,470 | | | | 319,107 | |
| Total Consumer Discretionary | | | | | | | 6,069,441 | |
| Energy - 7.8% | | | | | | | | |
| Clayton Williams Energy, Inc.* | | | 14,677 | | | | 770,102 | |
| Resolute Energy Corp.* | | | 87,640 | | | | 732,670 | |
| Abraxas Petroleum Corp.* | | | 239,310 | | | | 615,027 | |
| Oasis Petroleum, Inc.* | | | 12,410 | | | | 609,703 | |
| Sanchez Energy Corp.* | | | 12,148 | | | | 320,829 | |
| C&J Energy Services, Inc.* | | | 11,450 | | | | 229,916 | |
| Energy XXI Bermuda Ltd. | | | 4,627 | | | | 139,735 | |
| Emerald Oil, Inc.* | | | 8,840 | | | | 63,560 | |
| Total Energy | | | | | | | 3,481,542 | |
| Utilities - 5.9% | | | | | | | | |
| UGI Corp. | | | 18,700 | | | | 731,732 | |
| Laclede Group, Inc. | | | 15,906 | | | | 715,770 | |
| Black Hills Corp. | | | 11,301 | | | | 563,467 | |
| South Jersey Industries, Inc. | | | 6,790 | | | | 397,758 | |
| MDU Resources Group, Inc. | | | 8,613 | | | | 240,906 | |
| Total Utilities | | | | | | | 2,649,633 | |
| Health Care - 5.8% | | | | | | | | |
| Invacare Corp. | | | 37,880 | | | | 654,188 | |
| Emergent Biosolutions, Inc.* | | | 33,290 | | | | 634,174 | |
| Greatbatch, Inc.* | | | 15,388 | | | | 523,654 | |
| Kindred Healthcare, Inc. | | | 20,736 | | | | 278,484 | |
| Alere, Inc.* | | | 8,464 | | | | 258,744 | |
| Discovery Laboratories, Inc.* | | | 122,660 | | | | 240,414 | |
| Total Health Care | | | | | | | 2,589,658 | |
| 36 | the GUGGENHEIM FUNDS annual report | See Notes to Financial STATEMENTS. |
| SCHEDULE OF INVESTMENTS (concluded) | September 30, 2013 |
| SMALL CAP VALUE FUND | |
| | | Shares | | | Value | |
| | | | | | | |
| Materials - 5.6% | | | | | | | | |
| Zoltek Companies, Inc.* | | | 45,880 | | | $ | 765,738 | |
| Coeur Mining, Inc.* | | | 44,750 | | | | 539,238 | |
| Allied Nevada Gold Corp.* | | | 126,180 | | | | 527,432 | |
| Landec Corp.* | | | 35,816 | | | | 436,955 | |
| Globe Specialty Metals, Inc. | | | 14,620 | | | | 225,294 | |
| Total Materials | | | | | | | 2,494,657 | |
| Consumer Staples - 1.0% | | | | | | | | |
| Darling International, Inc.* | | | 20,177 | | | | 426,945 | |
| Total Common Stocks | | | | | | | | |
| (Cost $37,538,256) | | | | | | | 46,974,841 | |
| CONVERTIBLE PREFERRED STOCK††† - 0.0% | | | | | | | | |
| Thermoenergy Corp.*,2,3 | | | 6,250 | | | | 730 | |
| Total Convertible Preferred Stock | | | | | | | | |
| (Cost $5,968) | | | | | | | 730 | |
| WARRANTS†† - 0.0% | | | | | | | | |
| Horizon Pharma, Inc. | | | | | | | | |
| $4.58, 09/20/17* | | | 28,500 | | | | 12,825 | |
| Total Warrants | | | | | | | | |
| (Cost $—) | | | | | | | 12,825 | |
| SHORT TERM INVESTMENTS† - 5.2% | | | | | | | | |
| Dreyfus Treasury Prime Cash | | | | | | | | |
| Management Fund | | | 2,330,676 | | | | 2,330,676 | |
| Total Short Term Investments | | | | | | | | |
| (Cost $2,330,676) | | | | | | | 2,330,676 | |
| | | | | | | |
| | | Face | | | | |
| | | Amount | | | | |
| | | | | | | |
| CONVERTIBLE BONDS†† - 0.4% | | | | | | | | |
| Industrials - 0.4% | | | | | | | | |
| DryShips, Inc. | | | | | | | | |
| 5.00% due 12/01/14 | | $ | 200,000 | | | | 195,375 | |
| Total Convertible Bonds | | | | | | | | |
| (Cost $175,814) | | | | | | | 195,375 | |
| Total Investments - 110.8% | | | | | | | | |
| (Cost $40,050,714) | | | | | | $ | 49,514,447 | |
| | | | | | | | | |
| | | | Contracts | | | | | |
| OPTIONS WRITTEN† - (0.1)% | | | | | | | | |
| Call options on: | | | | | | | | |
| Ocwen Financial Corp. | | | | | | | | |
| Expiring January 2014 with | | | | | | | | |
| strike price of $60.00 | | | 44 | | | | (11,660 | ) |
| iRobot Corp. | | | | | | | | |
| Expiring December 2013 with | | | | | | | | |
| strike price of $40.00 | | | 63 | | | | (13,860 | ) |
| Total Call options | | | | | | | (25,520 | ) |
| Put options on: | | | | | | | | |
| Staar Surgical Co. | | | | | | | | |
| Expiring December 2013 with | | | | | | | | |
| strike price of $12.50 | | | 200 | | | | (13,000 | ) |
| Total Options Written | | | | | | | | |
| (Premiums received $44,093) | | | | | | | (38,520 | ) |
| Other Assets & Liabilities, net - (10.7)% | | | | | | | (4,788,980 | ) |
| Total Net Assets - 100.0% | | | | | | $ | 44,686,947 | |
| * | Non-income producing security. |
| † | Value determined based on Level 1 inputs — See Note 4. |
| †† | Value determined based on Level 2 inputs — See Note 4. |
| ††† | Value determined based on Level 3 inputs — See Note 4. |
| 1 | All or a portion of this security is pledged as collateral for open options written contracts at September 30, 2013. |
| 2 | PIPE (Private Investment in Public Equity) — Stock issued by a company in the secondary market as a means of raising capital more quickly and less expensively than through registration of a secondary public offering. |
| | ADR — American Depositary Receipt |
| SEE NOTES TO FINANCIAL STATEMENTS. | THE GUGGENHEIM FUNDS ANNUAL REPORT | 37 |
| STATEMENT OF ASSETS |
| AND LIABILITIES |
| September 30, 2013 |
| Assets: | | | | |
| Investments, at value | | | | |
| (cost $40,050,714) | | $ | 49,514,447 | |
| Prepaid expenses | | | 21,348 | |
| Receivables: | | | | |
| Fund shares sold | | | 92,730 | |
| Securities sold | | | 73,734 | |
| Dividends | | | 51,108 | |
| Investment advisor | | | 26,049 | |
| Interest | | | 3,333 | |
| Total assets | | | 49,782,749 | |
| Liabilities: | | | | |
| Options written, at value | | | | |
| (premiums received $44,093) | | | 38,520 | |
| Payable for: | | | | |
| Fund shares redeemed | | | 4,681,531 | |
| Securities purchased | | | 299,349 | |
| Management fees | | | 39,334 | |
| Distribution and service fees | | | 8,710 | |
| Transfer agent/maintenance fees | | | 5,330 | |
| Fund accounting/administration fees | | | 3,737 | |
| Directors’ fees* | | | 190 | |
| Miscellaneous | | | 19,101 | |
| Total liabilities | | | 5,095,802 | |
| Net assets | | $ | 44,686,947 | |
| Net assets consist of: | | | | |
| Paid in capital | | $ | 33,149,659 | |
| Accumulated net investment loss | | | (87,199 | ) |
| Accumulated net realized gain on investments | | | 2,155,181 | |
| Net unrealized appreciation on investments | | | 9,469,306 | |
| Net assets | | $ | 44,686,947 | |
| A-Class: | | | | |
| Net assets | | $ | 16,486,949 | |
| Capital shares outstanding | | | 925,717 | |
| Net asset value per share | | $ | 17.81 | |
| Maximum offering price per share | | | | |
| (Net asset value divided by 95.25%) | | $ | 18.70 | |
| C-Class: | | | | |
| Net assets | | $ | 5,885,341 | |
| Capital shares outstanding | | | 345,142 | |
| Net asset value per share | | $ | 17.05 | |
| Institutional Class: | | | | |
| Net assets | | $ | 22,314,657 | |
| Capital shares outstanding | | | 1,236,889 | |
| Net asset value per share | | $ | 18.04 | |
| STATEMENT OF |
| OPERATIONS |
| Year Ended September 30, 2013 |
| Investment Income: | | | | |
| Dividends | | $ | 482,085 | |
| Interest | | | 27,471 | |
| Total investment income | | | 509,556 | |
| | | | | |
| Expenses: | | | | |
| Management fees | | | 398,041 | |
| Transfer agent/maintenance fees: | | | | |
| A-Class | | | 51,388 | |
| C-Class | | | 9,672 | |
| Institutional Class | | | 946 | |
| Distribution and service fees: | | | | |
| A-Class | | | 40,102 | |
| C-Class | | | 40,062 | |
| Fund accounting/administration fees | | | 37,813 | |
| Registration fees | | | 41,880 | |
| Directors’ fees* | | | 5,207 | |
| Custodian fees | | | 3,940 | |
| Tax expense | | | 63 | |
| Miscellaneous | | | 44,628 | |
| Total expenses | | | 673,742 | |
| Less: | | | | |
| Expenses waived/reimbursed by Advisor | | | (175,376 | ) |
| Net expenses | | | 498,366 | |
| Net investment income | | | 11,190 | |
| | | | | |
| Net Realized and Unrealized Gain (Loss): | | | | |
| Net realized gain (loss) on: | | | | |
| Investments | | | 3,135,462 | |
| Options written | | | 25,454 | |
| Net realized gain | | | 3,160,916 | |
| Net change in unrealized appreciation (depreciation) on: | | | | |
| Investments | | | 7,020,810 | |
| Options written | | | 7,386 | |
| Net change in unrealized appreciation (depreciation) | | | 7,028,196 | |
| Net realized and unrealized gain | | | 10,189,112 | |
| Net increase in net assets resulting from operations | | $ | 10,200,302 | |
* Relates to Directors not deemed “interested persons” within the meaning of Section 2(a)(19) of the 1940 Act.
| 38 | the GUGGENHEIM FUNDS annual report | See Notes to Financial STATEMENTS. |
| SMALL CAP VALUE FUND |
| |
| STATEMENTS OF CHANGES IN NET ASSETS |
| | | Year Ended | | | Year Ended | |
| | | September 30, | | | September 30, | |
| | | 2013 | | | 2012 | |
| | | | | | | |
| Increase (Decrease) In Net Assets From Operations: | | | | | | | | |
| Net investment income (loss) | | $ | 11,190 | | | $ | (57,421 | ) |
| Net realized gain on investments | | | 3,160,916 | | | | 2,514,919 | |
| Net change in unrealized appreciation (depreciation) on investments | | | 7,028,196 | | | | 4,495,278 | |
| Net increase in net assets resulting from operations | | | 10,200,302 | | | | 6,952,776 | |
| | | | | | | | | |
| Distributions to shareholders from: | | | | | | | | |
| Net investment income | | | | | | | | |
| A-Class | | | (11,056 | ) | | | — | |
| Institutional Class | | | (53,908 | ) | | | — | |
| Net realized gains | | | | | | | | |
| A-Class | | | (1,047,645 | ) | | | (235,223 | ) |
| C-Class | | | (266,068 | ) | | | (65,832 | ) |
| Institutional Class | | | (1,552,279 | ) | | | (390,818 | ) |
| Total distributions to shareholders | | | (2,930,956 | ) | | | (691,873 | ) |
| | | | | | | | | |
| Capital share transactions: | | | | | | | | |
| Proceeds from sale of shares | | | | | | | | |
| A-Class | | | 10,521,756 | | | | 11,420,543 | |
| C-Class | | | 2,264,197 | | | | 2,813,053 | |
| Institutional Class | | | 331,808 | | | | 15,208,102 | |
| Distributions reinvested | | | | | | | | |
| A-Class | | | 1,042,444 | | | | 230,460 | |
| C-Class | | | 248,604 | | | | 60,332 | |
| Institutional Class | | | 4,422 | | | | 386,253 | |
| Cost of shares redeemed | | | | | | | | |
| A-Class | | | (10,445,396 | ) | | | (9,398,528 | ) |
| C-Class | | | (372,708 | ) | | | (2,852,765 | ) |
| Institutional Class | | | (88,984 | ) | | | (751,336 | ) |
| Net increase from capital share transactions | | | 3,506,143 | | | | 17,116,114 | |
| Net increase in net assets | | | 10,775,489 | | | | 23,377,017 | |
| | | | | | | | | |
| Net assets: | | | | | | | | |
| Beginning of year | | | 33,911,458 | | | | 10,534,441 | |
| End of year | | $ | 44,686,947 | | | $ | 33,911,458 | |
| Accumulated net investment loss at end of year | | $ | (87,199 | ) | | $ | (35,292 | ) |
| | | | | | | | | |
| Capital share activity: | | | | | | | | |
| Shares sold | | | | | | | | |
| A-Class | | | 653,325 | | | | 802,469 | |
| C-Class | | | 142,887 | | | | 205,879 | |
| Institutional Class | | | 20,199 | | | | 1,187,572 | |
| Shares issued from reinvestment of distributions | | | | | | | | |
| A-Class | | | 75,267 | | | | 17,977 | |
| C-Class | | | 18,636 | | | | 4,838 | |
| Institutional Class | | | 316 | | | | 29,827 | |
| Shares redeemed | | | | | | | | |
| A-Class | | | (620,391 | ) | | | (654,086 | ) |
| C-Class | | | (24,580 | ) | | | (205,339 | ) |
| Institutional Class | | | (5,715 | ) | | | (49,544 | ) |
| Net increase in shares | | | 259,944 | | | | 1,339,593 | |
| SEE NOTES TO FINANCIAL STATEMENTS. | THE GUGGENHEIM FUNDS ANNUAL REPORT | 39 |
| SMALL CAP VALUE FUND |
| |
| FINANCIAL HIGHLIGHTS |
This table is presented to show selected data for a share outstanding throughout each period and to assist shareholders in evaluating a Fund’s performance for the periods presented.
| | | Year Ended | | | Year Ended | | | Year Ended | | | Year Ended | | | Year Ended | |
| | | September 30, | | | September 30, | | | September 30, | | | September 30, | | | September 30, | |
| A-Class | | 2013 | | | 2012 | | | 2011 | | | 2010 | | | 2009 | |
| Per Share Data | | | | | | | | | | | | | | | | | | | | |
| Net asset value, beginning of period | | $ | 15.04 | | | $ | 11.66 | | | $ | 14.35 | | | $ | 13.24 | | | $ | 11.48 | |
| Income (loss) from investment operations: | | | | | | | | | | | | | | | | | | | | |
| Net investment lossa | | | (— | )d | | | (.03 | ) | | | (.07 | ) | | | (.05 | ) | | | (.05 | ) |
| Net gain (loss) on investments (realized and unrealized) | | | 4.05 | | | | 3.73 | | | | (.63 | ) | | | 1.54 | | | | 2.44 | |
| Total from investment operations | | | 4.05 | | | | 3.70 | | | | (.70 | ) | | | 1.49 | | | | 2.39 | |
| Less distributions from: | | | | | | | | | | | | | | | | | | | | |
| Net investment income | | | (.01 | ) | | | — | | | | — | | | | — | | | | — | |
| Net realized gains | | | (1.27 | ) | | | (.32 | ) | | | (1.99 | ) | | | (.38 | ) | | | (.63 | ) |
| Total distributions | | | (1.28 | ) | | | (.32 | ) | | | (1.99 | ) | | | (.38 | ) | | | (.63 | ) |
| Net asset value, end of period | | $ | 17.81 | | | $ | 15.04 | | | $ | 11.66 | | | $ | 14.35 | | | $ | 13.24 | |
| | | | | | | | | | | | | | | | | | | | | |
| Total Returnb | | | 29.39 | % | | | 32.19 | % | | | (7.31 | %) | | | 11.53 | % | | | 24.15 | % |
| Ratios/Supplemental Data | | | | | | | | | | | | | | | | | | | | |
| Net assets, end of period (in thousands) | | $ | 16,487 | | | $ | 12,294 | | | $ | 7,592 | | | $ | 6,209 | | | $ | 3,245 | |
| Ratios to average net assets: | | | | | | | | | | | | | | | | | | | | |
| Net investment loss | | | (0.02 | %) | | | (0.24 | %) | | | (0.52 | %) | | | (0.34 | %) | | | (0.46 | %) |
| Total expenses | | | 1.91 | % | | | 2.14 | % | | | 2.33 | % | | | 2.45 | % | | | 4.92 | % |
| Net expensesc | | | 1.30 | % | | | 1.30 | % | | | 1.30 | % | | | 1.30 | % | | | 1.55 | % |
| Portfolio turnover rate | | | 34 | % | | | 62 | % | | | 70 | % | | | 140 | % | | | 58 | % |
| | | Year Ended | | | Year Ended | | | Year Ended | | | Year Ended | | | Year Ended | |
| | | September 30, | | | September 30, | | | September 30, | | | September 30, | | | September 30, | |
| C-Class | | 2013 | | | 2012 | | | 2011 | | | 2010 | | | 2009 | |
| Per Share Data | | | | | | | | | | | | | | | | | | | | |
| Net asset value, beginning of period | | $ | 14.54 | | | $ | 11.36 | | | $ | 14.13 | | | $ | 13.11 | | | $ | 11.46 | |
| Income (loss) from investment operations: | | | | | | | | | | | | | | | | | | | | |
| Net investment lossa | | | (.12 | ) | | | (.14 | ) | | | (.18 | ) | | | (.15 | ) | | | (.11 | ) |
| Net gain (loss) on investments (realized and unrealized) | | | 3.90 | | | | 3.64 | | | | (.60 | ) | | | 1.55 | | | | 2.39 | |
| Total from investment operations | | | 3.78 | | | | 3.50 | | | | (.78 | ) | | | 1.40 | | | | 2.28 | |
| Less distributions from: | | | | | | | | | | | | | | | | | | | | |
| Net realized gains | | | (1.27 | ) | | | (.32 | ) | | | (1.99 | ) | | | (.38 | ) | | | (.63 | ) |
| Total distributions | | | (1.27 | ) | | | (.32 | ) | | | (1.99 | ) | | | (.38 | ) | | | (.63 | ) |
| Net asset value, end of period | | $ | 17.05 | | | $ | 14.54 | | | $ | 11.36 | | | $ | 14.13 | | | $ | 13.11 | |
| | | | | | | | | | | | | | | | | | | | | |
| Total Returnb | | | 28.34 | % | | | 31.35 | % | | | (8.07 | %) | | | 10.94 | % | | | 23.16 | % |
| Ratios/Supplemental Data | | | | | | | | | | | | | | | | | | | | |
| Net assets, end of period (in thousands) | | $ | 5,885 | | | $ | 3,026 | | | $ | 2,305 | | | $ | 1,353 | | | $ | 709 | |
| Ratios to average net assets: | | | | | | | | | | | | | | | | | | | | |
| Net investment loss | | | (0.75 | %) | | | (1.00 | %) | | | (1.26 | %) | | | (1.09 | %) | | | (1.15 | %) |
| Total expenses | | | 2.58 | % | | | 2.70 | % | | | 3.07 | % | | | 3.22 | % | | | 6.40 | % |
| Net expensesc | | | 2.05 | % | | | 2.05 | % | | | 2.05 | % | | | 2.05 | % | | | 2.30 | % |
| Portfolio turnover rate | | | 34 | % | | | 62 | % | | | 70 | % | | | 140 | % | | | 58 | % |
| 40 | THE GUGGENHEIM FUNDS ANNUAL REPORT | SEE NOTES TO FINANCIAL STATEMENTS. |
| SMALL CAP VALUE FUND |
| |
| FINANCIAL HIGHLIGHTS (concluded) |
This table is presented to show selected data for a share outstanding throughout each period and to assist shareholders in evaluating a Fund’s performance for the periods presented.
| | | Year Ended | | | Year Ended | | | Year Ended | | | Year Ended | | | Year Ended | |
| | | September 30, | | | September 30, | | | September 30, | | | September 30, | | | September 30, | |
| Institutional Class | | 2013 | | | 2012 | | | 2011 | | | 2010 | | | 2009 | |
| Per Share Data | | | | | | | | | | | | | | | |
| Net asset value, beginning of period | | $ | 15.21 | | | $ | 11.76 | | | $ | 14.43 | | | $ | 13.28 | | | $ | 11.49 | |
| Income (loss) from investment operations: | | | | | | | | | | | | | | | | | | | | |
| Net investment income (loss)a | | | .04 | | | | — | d | | | (.04 | ) | | | (.01 | ) | | | (.01 | ) |
| Net gain (loss) on investments (realized and unrealized) | | | 4.10 | | | | 3.77 | | | | (.64 | ) | | | 1.54 | | | | 2.43 | |
| Total from investment operations | | | 4.14 | | | | 3.77 | | | | (.68 | ) | | | 1.53 | | | | 2.42 | |
| Less distributions from: | | | | | | | | | | | | | | | | | | | | |
| Net investment income | | | (.04 | ) | | | — | | | | — | | | | — | | | | — | |
| Net realized gains | | | (1.27 | ) | | | (.32 | ) | | | (1.99 | ) | | | (.38 | ) | | | (.63 | ) |
| Total distributions | | | (1.31 | ) | | | (.32 | ) | | | (1.99 | ) | | | (.38 | ) | | | (.63 | ) |
| Net asset value, end of period | | $ | 18.04 | | | $ | 15.21 | | | $ | 11.76 | | | $ | 14.43 | | | $ | 13.28 | |
| | | | | | | | | | | | | | | | | | | | | |
| Total Returnb | | | 29.74 | % | | | 32.51 | % | | | (7.11 | %) | | | 11.80 | % | | | 24.40 | % |
| Ratios/Supplemental Data | | | | | | | | | | | | | | | | | | | | |
| Net assets, end of period (in thousands) | | $ | 22,315 | | | $ | 18,591 | | | $ | 638 | | | $ | 734 | | | $ | 630 | |
| Ratios to average net assets: | | | | | | | | | | | | | | | | | | | | |
| Net investment income (loss) | | | 0.23 | % | | | 0.02 | % | | | (0.30 | %) | | | (0.08 | %) | | | (0.14 | %) |
| Total expenses | | | 1.34 | % | | | 1.44 | % | | | 2.09 | % | | | 2.21 | % | | | 5.44 | % |
| Net expensesc | | | 1.05 | % | | | 1.05 | % | | | 1.05 | % | | | 1.05 | % | | | 1.30 | % |
| Portfolio turnover rate | | | 34 | % | | | 62 | % | | | 70 | % | | | 140 | % | | | 58 | % |
| a | Net investment income (loss) per share was computed using average shares outstanding throughout the period. |
| b | Total return does not reflect the impact of any applicable sales charges. |
| c | Net expense information reflects the expense ratios after expense waivers and reimbursements, as applicable. |
| d | Net investment income (loss) is less than $0.01 per share. |
| SEE NOTES TO FINANCIAL STATEMENTS. | THE GUGGENHEIM FUNDS ANNUAL REPORT | 41 |
| MANAGERS’ COMMENTARY (Unaudited) | September 30, 2013 |
To Our Shareholders:
Guggenheim Enhanced World Equity Fund (the “Fund”) is managed by a team of seasoned professionals, including Jayson Flowers, Senior Managing Director and Head of Equity and Derivative Strategies, and Jamal Pesaran, Managing Director and Portfolio Manager. In the following paragraphs, the investment team discusses positioning of the Fund and performance for the abbreviated fiscal year ended September 30, 2013.
For the abbreviated annual fiscal period from the Fund’s inception date of June 18, 2013 through September 30, 2013, the Guggenheim Enhanced World Equity Fund returned 4.32%1, compared with the 4.74% return of its benchmark, the MSCI All-Country World Index (ACWI).
The investment objective of the Fund is to achieve total return, comprised of capital appreciation and current income. The Fund invests in a broadly diversified portfolio of equity securities, typically exchange traded funds, selected to gain exposure to the global equity markets. In addition, the Fund seeks to generate current income and reduce portfolio volatility through the use of derivative strategies. This includes the purchase or sale of call options, which generates income to enhance the Fund’s return or helps to manage the Fund’s volatility.
The Fund will invest, under normal circumstances, at least 80% of its assets in equity or equity-like securities, including individual securities, exchange traded funds (“ETFs”) and derivatives giving exposure to the equity markets, to gain access to targeted geographic regions, countries and sectors.
The Fund’s holdings will be determined through a process that includes both quantitative and qualitative inputs designed to represent a global equity allocation. The Fund is not limited in the percentage of assets it may invest in securities listed, traded or dealt in any one country, region or geographic area, and it will invest in a number of countries throughout the world, including emerging markets. The Fund can invest in securities of companies that represent a broad range of market capitalizations and will not be constrained by capitalization limits. The composition of the portfolio will vary over time.
The Fund tries to deliver outperformance primarily through its region selection and its writing (selling) of calls. The Fund dynamically adjusts regional exposures based on the opportunities available expressed in underlying valuations and volatility premiums, in addition to qualitative views from Guggenheim Investments. Once the investment team decides on the regions and allocation ranges it favors, it uses a proprietary, rules-based quantitative framework with qualitative management for portfolio construction.
When the risk premiums paid for call options is attractive, the Fund writes calls more aggressively, in which case the premiums help protect the portfolio’s underlying holdings on the downside; where the risk premiums paid are less attractive, the Fund takes in a smaller total premium, but captures more of the upside movement in the underlying holdings. By implementing this consistently well, the collection of the call premiums becomes a potential source of alpha.
Over the abbreviated fiscal period, the Fund performed as expected: it rivaled performance of the benchmark, but with less risk, based on standard deviation. The Fund has a harder time outperforming when it has to write covered calls during strong upside market moves or when implied volatility is low and option premiums are low, both of which circumstances prevailed during much of the period. The derivatives used during the period benefited performance.
The inception date of the Fund came at an auspicious moment—the bond market was selling off in reaction to speculation about the end of the U.S. Federal Reserve’s quantitative easing, which also weighed down global equity markets. The Fund was overweight U.S. and emerging markets and underweight Europe and Japan.
At the end of the period, the overweight U.S. exposure remained but the portfolio managers started to allocate away from emerging markets to Europe.
The shift in the U.S. is due to its relative attractiveness as a market. The U.S. allocation is benefiting from continued strong corporate earnings, which is helping support global markets. Likewise, the over weight to Europe is based on Guggenheim’s view that the outlook there is improving, with economic growth increasing and unemployment no longer rising.
| 42 | THE GUGGENHEIM FUNDS ANNUAL REPORT |
| MANAGERS’ COMMENTARY (Unaudited) (concluded) |
Emerging markets, overweight earlier in the period, is now a slight underweight, although the view for China remains positive. Pockets of volatility and less-than-favorable economic data from other non-U.S. markets seem likely to continue for the near term.
Another way the Fund manages its risk is by dynamically adjusting the overall level of calls written on the portfolio’s equity holdings—the hedge ratio. It is typically closer to 100% when underlying equity valuations are deemed expensive with less upside potential, and implied volatility is rich with attractive option premiums. It is typically closer to 0% when underlying equities are seen as cheap, with more upside potential and implied volatility is deemed too low to compensate for the market upside, which is capped by the selling of options.
The Fund was 75% hedged in early June, and then reduced when markets dropped during the bond market-triggered selloff. It remained near 50% for much of the rest of the period, but through buybacks of options that had been previously sold. The hedge ratio fell to below 25% by the options expiration in late September.
Performance displayed represents past performance which is no guarantee of future results.
1 Performance figures are based on A-Class shares and do not reflect deduction of the sales charges or taxes that a shareholder would pay on distributions or the redemption of shares. Fee waivers and/or reimbursements reduce Fund expenses, and, in the absence of such waivers, the performance quoted would be reduced.
The opinions and forecast expressed may not actually come to pass. This information is subject to change at any time, based on market and other conditions, and should not be construed as a recommendation of any specific security or strategy.
| THE GUGGENHEIM FUNDS ANNUAL REPORT | 43 |
| PERFORMANCE REPORT AND FUND PROFILE (Unaudited) | September 30, 2013 |
ENHANCED WORLD EQUITY FUND
OBJECTIVE: Seeks to achieve total return, comprised of capital appreciation and current income.
Cumulative Fund Performance*
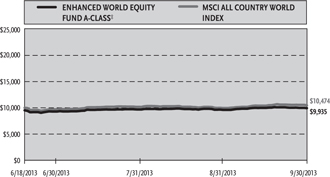
Total Returns*
Periods Ended 09/30/13
| | | Since Inception | |
| | | (06/18/13) | |
| A-Class Shares | | | 4.32 | % |
| A-Class Shares with sales charge‡ | | | -0.65 | % |
| C-Class Shares | | | 4.00 | % |
| C-Class Shares with CDSC† | | | 3.00 | % |
| Institutional Class Shares | | | 4.40 | % |
| MSCI All Country World Index | | | 4.74 | % |
Holdings Diversification (Market Exposure as % of Net Assets)
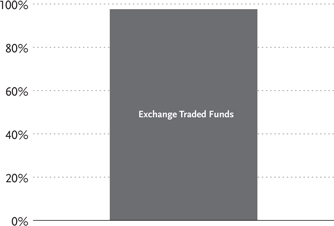
“Holdings Diversification (Market Exposure as % of Net Assets)” excludes any temporary cash investments.
| Inception Dates: | | | | |
| A-Class | | | June 18, 2013 | |
| C-Class | | | June 18, 2013 | |
| Institutional Class | | | June 18, 2013 | |
| Ten Largest Holdings (% of Total Net Assets) | | | |
| SPDR S&P 500 ETF Trust | | | 49.0 | % |
| iShares China Large-Capital ETF | | | 14.4 | % |
| Powershares QQQ Trust Series 1 | | | 5.0 | % |
| iShares MSCI Germany ETF | | | 5.0 | % |
| iShares MSCI Italy Capped ETF | | | 4.9 | % |
| iShares MSCI EAFE ETF | | | 4.9 | % |
| Vanguard FTSE Emerging Markets ETF | | | 4.7 | % |
| Energy Select Sector SPDR Fund | | | 2.5 | % |
| Financial Select Sector SPDR Fund | | | 2.4 | % |
| iShares MSCI Taiwan ETF | | | 2.4 | % |
| Top Ten Total | | | 95.2 | % |
| * | The performance data above represents past performance that is not predictive of future results. The investment return and principal value of an investment in the Fund will fluctuate so that an investor’s shares, when redeemed, may be worth more or less than their original cost. Returns are historical and include changes in principal and reinvested dividends and capital gains and do not reflect the effect of taxes. The MSCI All Country World Index is an unmanaged index and, unlike the Fund, has no management fees or operating expenses to reduce its reported return. |
| ‡ | Fund returns are calculated using the maximum sales charge of 4.75%. |
| † | Fund returns include a CDSC of 1% if redeemed within 12 months of purchase. |
| 44 | THE GUGGENHEIM FUNDS ANNUAL REPORT |
| SCHEDULE OF INVESTMENTS | September 30, 2013 |
| ENHANCED WORLD EQUITY FUND | |
| | | Shares | | | Value | |
| | | | | | | |
| EXCHANGE TRADED FUNDS† - 97.6% | | | | | | | | |
| SPDR S&P 500 ETF Trust1 | | | 16,600 | | | $ | 2,790,460 | |
| iShares China Large-Capital ETF1 | | | 22,100 | | | | 819,468 | |
| Powershares QQQ Trust Series1 | | | 3,600 | | | | 283,860 | |
| iShares MSCI Germany ETF1 | | | 10,200 | | | | 283,662 | |
| iShares MSCI Italy Capped ETF1 | | | 19,900 | | | | 280,988 | |
| iShares MSCI EAFE ETF1 | | | 4,400 | | | | 280,676 | |
| Vanguard FTSE Emerging Markets ETF1 | | | 6,700 | | | | 268,737 | |
| Energy Select Sector SPDR Fund1 | | | 1,700 | | | | 140,896 | |
| Financial Select Sector SPDR Fund1 | | | 7,000 | | | | 139,440 | |
| iShares MSCI Taiwan ETF1 | | | 9,900 | | | | 137,808 | |
| iShares MSCI South Korea Capped ETF1 | | | 2,200 | | | | 135,366 | |
| Total Exchange Traded Funds | | | | | | | | |
| (Cost $5,641,232) | | | | | | | 5,561,361 | |
| SHORT TERM INVESTMENTS† - 2.0% | | | | | | | | |
| Dreyfus Treasury Prime Cash | | | | | | | | |
| Management Fund | | | 112,284 | | | | 112,284 | |
| Total Short Term Investments | | | | | | | | |
| (Cost $112,284) | | | | | | | 112,284 | |
| Total Investments - 99.6% | | | | | | | | |
| (Cost $5,753,516) | | | | | | $ | 5,673,645 | |
| | | Contracts | | | | |
| | | | | | | |
| OPTIONS WRITTEN† - (0.3)% | | | | | | | | |
| Call options on: | | | | | | | | |
| Energy Select Sector SPDR Fund | | | | | | | | |
| Expiring October 2013 | | | | | | | | |
| with strike price of $85.00 | | | 9 | | | | (378 | ) |
| iShares MSCI South Korea | | | | | | | | |
| Capped ETF | | | | | | | | |
| Expiring October 2013 | | | | | | | | |
| with strike price of $63.00 | | | 17 | | | | (935 | ) |
| iShares MSCI Taiwan ETF | | | | | | | | |
| Expiring October 2013 | | | | | | | | |
| with strike price of $14.00 | | | 74 | | | | (1,332 | ) |
| iShares MSCI EAFE ETF | | | | | | | | |
| Expiring October 2013 | | | | | | | | |
| with strike price of $65.00 | | | 33 | | | | (1,419 | ) |
| Financial Select Sector SPDR Fund | | | | | | | | |
| Expiring October 2013 | | | | | | | | |
| with strike price of $20.00 | | | 53 | | | | (1,484 | ) |
| Powershares QQQ Trust Series 1 | | | | | | | | |
| Expiring October 2013 | | | | | | | | |
| with strike price of $79.00 | | | 27 | | | | (2,835 | ) |
| iShares MSCI Germany ETF | | | | | | | | |
| Expiring October 2013 | | | | | | | | |
| with strike price of $28.00 | | | 102 | | | | (3,162 | ) |
| SPDR S&P 500 ETF Trust | | | | | | | | |
| Expiring October 2013 | | | | | | | | |
| with strike price of $171.00 | | | 55 | | | | (5,005 | ) |
| Total Options Written | | | | | | | | |
| (Premiums received $34,151) | | | | | | | (16,550 | ) |
| Other Assets & Liabilities, net - 0.7% | | | | | | | 42,073 | |
| Total Net Assets - 100.0% | | | | | | $ | 5,699,168 | |
| † | Value determined based on Level 1 inputs — See Note 4. |
| 1 | All or a portion of this security is pledged as collateral for open options written contracts at September 30, 2013. |
| SEE NOTES TO FINANCIAL STATEMENTS. | THE GUGGENHEIM FUNDS ANNUAL REPORT | 45 |
| ENHANCED WORLD EQUITY FUND |
| |
| STATEMENT OF ASSETS |
| AND LIABILITIES |
| September 30, 2013 | | | |
| | | | |
| Assets: | | | | |
| Investments, at value | | | | |
| (cost $5,753,516) | | $ | 5,673,645 | |
| Prepaid expenses | | | 37,177 | |
| Cash | | | 21,735 | |
| Receivables: | | | | |
| Investment advisor | | | 30,821 | |
| Total assets | | | 5,763,378 | |
| Liabilities: | | | | |
| Options written, at value | | | | |
| (premiums received $34,151) | | | 16,550 | |
| Payable for: | | | | |
| Professional fees | | | 24,399 | |
| Securities purchased | | | 9,436 | |
| Management fees | | | 3,157 | |
| Fund accounting/administration fees | | | 2,055 | |
| Dividends | | | 660 | |
| Directors’ fees* | | | 520 | |
| Distribution and service fees | | | 156 | |
| Transfer agent/maintenance fees | | | 111 | |
| Miscellaneous | | | 7,166 | |
| Total liabilities | | | 64,210 | |
| Net assets | | $ | 5,699,168 | |
| Net assets consist of: | | | | |
| Paid in capital | | $ | 5,492,570 | |
| Undistributed net investment income | | | 28,029 | |
| Accumulated net realized gain on investments | | | 240,839 | |
| Net unrealized depreciation on investments | | | (62,270 | ) |
| Net assets | | $ | 5,699,168 | |
| A-Class: | | | | |
| Net assets | | $ | 104,556 | |
| Capital shares outstanding | | | 4,016 | |
| Net asset value per share | | $ | 26.03 | |
| Maximum offering price per share | | | | |
| (Net asset value divided by 95.25%) | | $ | 27.33 | |
| C-Class: | | | | |
| Net assets | | $ | 377,218 | |
| Capital shares outstanding | | | 14,532 | |
| Net asset value per share | | $ | 25.96 | |
| Institutional Class: | | | | |
| Net assets | | $ | 5,217,394 | |
| Capital shares outstanding | | | 200,246 | |
| Net asset value per share | | $ | 26.05 | |
| Period Ended September 30, 2013** | | | |
| | | | |
| Investment Income: | | | | |
| Dividends | | $ | 42,948 | |
| Total investment income | | | 42,948 | |
| | | | | |
| Expenses: | | | | |
| Management fees | | | 10,294 | |
| Transfer agent/maintenance fees: | | | | |
| A-Class | | | 37 | |
| C-Class | | | 116 | |
| Institutional Class | | | 26 | |
| Distribution and service fees: | | | | |
| A-Class | | | 38 | |
| C-Class | | | 175 | |
| Fund accounting/administration fees | | | 6,163 | |
| Professional fees | | | 27,732 | |
| Printing expenses | | | 14,552 | |
| Registration fees | | | 11,247 | |
| Custodian fees | | | 2,340 | |
| Directors’ fees* | | | 621 | |
| Miscellaneous | | | 2,891 | |
| Total expenses | | | 76,232 | |
| Less: | | | | |
| Expenses waived/reimbursed by Advisor | | | (61,313 | ) |
| Net expenses | | | 14,919 | |
| Net investment income | | | 28,029 | |
| | | | | |
| Net Realized and Unrealized Gain (Loss): | | | | |
| Net realized gain (loss) on: | | | | |
| Investments | | | 227,547 | |
| Options written | | | 13,879 | |
| Net realized gain | | | 241,426 | |
| Net change in unrealized appreciation (depreciation) on: | | | | |
| Investments | | | (79,871 | ) |
| Options written | | | 17,601 | |
| Net change in unrealized appreciation (depreciation) | | | (62,270 | ) |
| Net realized and unrealized gain | | | 179,156 | |
| Net increase in net assets resulting from operations | | $ | 207,185 | |
| * | Relates to Directors not deemed “interested persons” within the meaning of Section 2(a)(19) of the 1940 Act. |
| ** | Since commencement of operations: June 18, 2013. |
| 46 | the GUGGENHEIM FUNDS annual report | SEE NOTES TO FINANCIAL STATEMENTS. |
| ENHANCED WORLD EQUITY FUND |
| |
| STATEMENT OF CHANGES IN NET ASSETS |
| | | Period Ended | |
| | | September 30, | |
| | | 2013a | |
| | | | |
| Increase (Decrease) In Net Assets From Operations: | | | | |
| Net investment income | | $ | 28,029 | |
| Net realized gain on investments | | | 241,426 | |
| Net change in unrealized appreciation (depreciation) on investments | | | (62,270 | ) |
| Net increase in net assets resulting from operations | | | 207,185 | |
| | | | | |
| Capital share transactions: | | | | |
| Proceeds from sale of shares | | | | |
| A-Class | | | 102,365 | |
| C-Class | | | 410,855 | |
| Institutional Class | | | 5,006,074 | |
| Cost of shares redeemed | | | | |
| C-Class | | | (27,311 | ) |
| Net increase from capital share transactions | | | 5,491,983 | |
| Net increase in net assets | | | 5,699,168 | |
| | | | | |
| Net assets: | | | | |
| Beginning of period | | | — | |
| End of period | | $ | 5,699,168 | |
| Undistributed net investment income at end of period | | $ | 28,029 | |
| | | | | |
| Capital share activity: | | | | |
| Shares sold | | | | |
| A-Class | | | 4,016 | |
| C-Class | | | 15,611 | |
| Institutional Class | | | 200,246 | |
| Shares redeemed | | | | |
| C-Class | | | (1,079 | ) |
| Net increase in shares | | | 218,794 | |
| a | Since commencement of operations: June 18, 2013. |
| SEE NOTES TO FINANCIAL STATEMENTS. | THE GUGGENHEIM FUNDS ANNUAL REPORT | 47 |
| ENHANCED WORLD EQUITY FUND |
| |
| FINANCIAL HIGHLIGHTS |
This table is presented to show selected data for a share outstanding throughout each period and to assist shareholders in evaluating a Fund’s performance for the periods presented.
| | | Period Ended | |
| | | September 30, | |
| A-Class | | 2013a | |
| Per Share Data | | | | |
| Net asset value, beginning of period | | $ | 25.00 | |
| Income (loss) from investment operations: | | | | |
| Net investment lossb | | | (.03 | ) |
| Net gain on investments (realized and unrealized) | | | 1.06 | |
| Total from investment operations | | | 1.03 | |
| Net asset value, end of period | | $ | 26.03 | |
| | | | | |
| Total Returnc | | | 4.32 | % |
| Ratios/Supplemental Data | | | | |
| Net assets, end of period (in thousands) | | $ | 105 | |
| Ratios to average net assets: | | | | |
| Net investment loss | | | (0.36 | %) |
| Total expensesd,f | | | 7.21 | % |
| Net expensese | | | 1.25 | % |
| Portfolio turnover rate | | | 174 | % |
| | | Period Ended | |
| | | September 30, | |
| C-Class | | 2013a | |
| Per Share Data | | | | |
| Net asset value, beginning of period | | $ | 25.00 | |
| Income (loss) from investment operations: | | | | |
| Net investment lossb | | | (.03 | ) |
| Net gain on investments (realized and unrealized) | | | .99 | |
| Total from investment operations | | | .96 | |
| Net asset value, end of period | | $ | 25.96 | |
| | | | | |
| Total Returnc | | | 4.00 | % |
| Ratios/Supplemental Data | | | | |
| Net assets, end of period (in thousands) | | $ | 377 | |
| Ratios to average net assets: | | | | |
| Net investment loss | | | (0.43 | %) |
| Total expensesd,f | | | 9.26 | % |
| Net expensese | | | 2.00 | % |
| Portfolio turnover rate | | | 174 | % |
| 48 | THE GUGGENHEIM FUNDS ANNUAL REPORT | SEE NOTES TO FINANCIAL STATEMENTS. |
| ENHANCED WORLD EQUITY FUND |
| |
| FINANCIAL HIGHLIGHTS (concluded) |
This table is presented to show selected data for a share outstanding throughout each period and to assist shareholders in evaluating a Fund’s performance for the periods presented.
| | | Period Ended | |
| | | September 30, | |
| Institutional Class | | 2013a | |
| Per Share Data | | | | |
| Net asset value, beginning of period | | $ | 25.00 | |
| Income (loss) from investment operations: | | | | |
| Net investment incomeb | | | .14 | |
| Net gain on investments (realized and unrealized) | | | .91 | |
| Total from investment operations | | | 1.05 | |
| Net asset value, end of period | | $ | 26.05 | |
| | | | | |
| Total Returnc | | | 4.40 | % |
| Ratios/Supplemental Data | | | | |
| Net assets, end of period (in thousands) | | $ | 5,217 | |
| Ratios to average net assets: | | | | |
| Net investment income | | | 1.96 | % |
| Total expensesd,f | | | 5.11 | % |
| Net expensese | | | 1.00 | % |
| Portfolio turnover rate | | | 174 | % |
| a | Since commencement of operations: June 18, 2013. Percentage amounts for the period, except total return and portfolio turnover rate, have been annualized. |
| b | Net investment income (loss) per share was computed using average shares outstanding throughout the period. |
| c | Total return does not reflect the impact of any applicable sales charges and has not been annualized. |
| d | Does not include expenses of the underlying funds in which the Fund invests. |
| e | Net expense information reflects the expense ratios after expense waivers and reimbursements, as applicable. |
| f | Due to limited length of Fund operations, ratios for this period are not indicative of future performance. |
| | |
| SEE NOTES TO FINANCIAL STATEMENTS. | THE GUGGENHEIM FUNDS ANNUAL REPORT | 49 |
| MANAGERS’ COMMENTARY (Unaudited) | September 30, 2013 |
To Our Shareholders
Guggenheim World Equity Income Fund (the “Fund”) is managed by a team of seasoned professionals, including Farhan Sharaff, Senior Managing Director and Assistant Chief Investment Officer, Equities; Nardin Baker, CFA, Managing Director and Portfolio Manager; Ole Jakob Wold, Managing Director and Portfolio Manager; and Scott Hammond, Managing Director and Portfolio Manager. In the following paragraphs, the investment team discusses changes to the Fund that occurred late in the fiscal year ended September 30, 2013.
For the one year period ended September 30, 2013, the Guggenheim World Equity Income Fund returned 22.58%1, compared with the 20.23% return of its benchmark, the MSCI World Index. However, the Fund was managed for all but seven weeks of the period to the MSCI Equal Weighted Index, the prior benchmark, which returned 25.95% for the period.
Several changes, approved by the Fund’s Board of Directors, occurred on August 15, 2013: a new Fund name, new investment objective, new principal investment strategies and new portfolio management team. The changes were designed to provide an actively managed, differentiated strategy that seeks to provide lower downside risk with the opportunity to outperform the strategy’s capitalization-weighted benchmark over time while delivering attractive income.
Prior to these changes, the Fund’s name was the MSCI EAFE Equal Weight Fund, which sought performance that corresponded, before fees and expenses, to the price and yield performance of the MSCI EAFE Equal Weighted Index, the Fund’s benchmark between May 2, 2011 and August 15, 2013.
Fund performance for the 12 months can be broken down into the period during which the Fund was being managed according to the legacy strategy and the period during which it was being managed according to the new strategy.
For the period beginning October 1, 2012, and ending August 14, 2013, the Fund performed in line with its benchmark. The sectors contributing most to return for that period were the Consumer Discretionary and Consumer Staples sectors. No sector detracted, but Utilities contributed least, followed by the Telecommunications Services sector.
For the period beginning August 15, 2013, and ending September 30, 2013, the Fund slightly outperformed its benchmark. For that period, Financials and Telecommunications Services sectors contributed most, and Materials was the only sector detracting from return, detracting slightly.
Beginning with the changes to the Fund’s investment objective and investment strategies, the new management team repositioned the portfolio to align with the new investment philosophy and process. This included purchasing stocks that have historically demonstrated low volatility and appear likely to continue doing so. To make these purchases, the Fund liquidated those holdings in the MSCI EAFE Equal Weight portfolio that did not meet the team’s minimum-volatility standards.
The portfolio was constructed to take advantage of empirical evidence that supports an inverse relationship between risk and reward, as low-volatility stocks have historically provided better returns over time than their high-volatility counterparts. This is in contrast to the Capital Asset Pricing Model that guides much modern finance, which holds that an asset’s expected return should increase as it becomes riskier. This inefficiency is referred to as the “minimum volatility effect,” and Portfolio Manager Nardin Baker was among the first people to demonstrate its existence in a 1991 research paper.
The team relies on its comprehensive data library of historical information on 30,000 global equities and uses sophisticated statistical techniques to forecast the near-term volatility of these stocks. The team also maintains a covariance matrix to analyze how the stocks are correlated with each other and how these correlations could impact the overall volatility of the portfolio. Incorporating these tools and techniques, the team then uses proprietary optimization technology to construct a portfolio of approximately 120 to 160 well-diversified, low-volatility stocks.
Generally, the strategy invests in lower-risk and higher-yielding equity securities throughout the world. The Fund is permitted to invest at least 80% of its assets in equity securities. There are no limits or requirements on the percentage of the portfolio invested in U.S. or foreign issuers. The Fund will focus on developed markets but may invest in emerging markets. As of the end of the period, its top holdings were 53% North America, 14% Europe, 13% Asia ex-Japan and 12% Japan.
| 50 | THE GUGGENHEIM FUNDS ANNUAL REPORT |
| MANAGERS’ COMMENTARY (Unaudited) (concluded) |
Portfolio characteristics include a lower-than-market standard deviation of returns (volatility) and higher dividend yield. The Fund’s weighted average dividend yield as of the end of the period was 4.8%, compared with 2.5% for the benchmark. Its weighted average standard deviation was 5.5%, compared with 6.7% for the benchmark.
Reflecting the Fund’s greater emphasis on income, the Fund changed its dividend declaration frequency from annual to quarterly. The Fund paid its annual dividend in December 2012 and made its first quarterly distribution in September 2013.
While the Fund does not expect to hold a significant portion of its assets in derivatives, it may invest in them in order to maintain exposure to the securities and currency markets when it is unable to purchase corresponding securities or currencies directly, or believes that it is more appropriate to use derivatives to gain the desired exposure to underlying assets. The Fund may also hedge a portion of its foreign currency exposure using derivatives. Use of derivatives is not expected to materially contribute or detract from portfolio performance.
The Fund expects to slightly underperform traditional equity strategies during periods of excessive optimism in broader stock markets and to experience far lower losses during sell-offs. This combination of performance in different market environments helps the strategy achieve a smoother pattern of returns that, over time, is similar to or slightly better than a capitalization-weighted benchmark.
Performance displayed represents past performance which is no guarantee of future results.
1 Performance figures are based on A-Class shares and do not reflect deduction of the sales charges or taxes that a shareholder would pay on distributions or the redemption of shares. Fee waivers and/or reimbursements reduce Fund expenses, and, in the absence of such waivers, the performance quoted would be reduced.
The opinions and forecast expressed may not actually come to pass. This information is subject to change at any time, based on market and other conditions, and should not be construed as a recommendation of any specific security or strategy.
| THE GUGGENHEIM FUNDS ANNUAL REPORT | 51 |
| PERFORMANCE REPORT AND FUND PROFILE (Unaudited) | September 30, 2013 |
WORLD EQUITY INCOME FUND
OBJECTIVE: To provide total return, comprised of capital appreciation and income.
Cumulative Fund Performance*
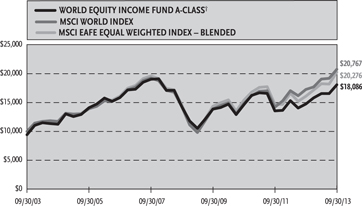
Effective August 15, 2013, the Fund changed its principal investment strategy. As a result of the investment strategy change, the Fund’s new benchmark is the MSCI World Index. The Fund’s performance was previously compared to the MSCI EAFE Equal Weighted Index. The MSCI EAFE Equal Weighted Index-Blended uses performance data for the MSCI World Index from 09/30/03 to 05/01/11, and the MSCI EAFE Equal Weighted Index from 05/02/11 to 09/30/13.
Average Annual Returns*
Periods Ended 09/30/13
| | | 1 Year | | | 5 Year | | | 10 Year | |
| A-Class Shares | | | 22.58 | % | | | 4.88 | % | | | 6.73 | % |
| A-Class Shares with sales charge† | | | 16.71 | % | | | 3.65 | % | | | 6.10 | % |
| B-Class Shares | | | 22.95 | % | | | 5.14 | % | | | 6.74 | % |
| B-Class Shares with CDSC‡ | | | 17.95 | % | | | 4.81 | % | | | 6.74 | % |
| C-Class Shares | | | 21.57 | % | | | 4.09 | % | | | 5.93 | % |
| C-Class Shares with CDSC§ | | | 20.57 | % | | | 4.09 | % | | | 5.93 | % |
| MSCI World Index | | | 20.23 | % | | | 7.84 | % | | | 7.58 | % |
| MSCI Equal Weighted Index | | | 25.95 | % | | | 8.89 | % | | | N/A | |
| MSCI EAFE Equal Weighted Index-Blended | | | 26.05 | % | | | 6.79 | % | | | 7.32 | % |
| | | | | | Since Inception | |
| | | 1 Year | | | (05/02/11) | |
| Institutional Class Shares | | | 23.17 | % | | | 1.83 | % |
| MSCI World Index | | | 20.23 | % | | | 6.79 | % |
| MSCI EAFE Equal Weighted Index-Blended | | | 26.05 | % | | | 3.74 | % |
Holdings Diversification (Market Exposure as % of Net Assets)
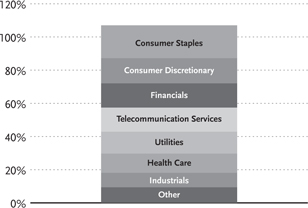
“Holdings Diversification (Market Exposure as % of Net Assets)” excludes any temporary cash investments.
| Inception Dates: | | | | |
| A-Class | | | October 1, 1993 | |
| B-Class | | | October 19, 1993 | |
| C-Class | | | January 29, 1999 | |
| Institutional Class | | | May 2, 2011 | |
| Ten Largest Holdings (% of Total Net Assets) | | | |
| Lockheed Martin Corp. | | | 3.2 | % |
| Deutsche Telekom AG | | | 3.0 | % |
| Altria Group, Inc. | | | 2.9 | % |
| Wal-Mart Stores, Inc. | | | 2.6 | % |
| General Mills, Inc. | | | 2.6 | % |
| Kimberly-Clark Corp. | | | 2.5 | % |
| GDF Suez | | | 2.5 | % |
| Bristol-Myers Squibb Co. | | | 2.4 | % |
| AstraZeneca plc | | | 2.3 | % |
| Telstra Corporation Ltd. | | | 2.0 | % |
| Top Ten Total | | | 26.0 | % |
| * | The performance data above represents past performance that is not predictive of future results. The investment return and principal value of an investment in the Fund will fluctuate so that an investor’s shares, when redeemed, may be worth more or less than their original cost. Returns are historical and include changes in principal and reinvested dividends and capital gains and do not reflect the effect of taxes. The MSCI World Index and MSCI EAFE Equal Weighted Index are unmanaged indices and, unlike the Fund, have no management fees or operating expenses to reduce their reported returns. |
| † | Effective February 22, 2011, the maximum sales charge decreased from 5.75% to 4.75%. A 5.75% maximum sales charge is used in the calculation of the 5 Year and 10 Year average annual returns (based on subscriptions made prior to February 22, 2011), and a 4.75% maximum sales charge will be used to calculate performance for periods based on subscriptions made on or after February 22, 2011. |
| ‡ | Fund returns include a CDSC of up to 5% if redeemed within 5 years of purchase. |
| § | Fund returns include a CDSC of 1% if redeemed within 12 months of purchase. |
| 52 | THE GUGGENHEIM FUNDS ANNUAL REPORT |
| SCHEDULE OF INVESTMENTS | September 30, 2013 |
| WORLD EQUITY INCOME FUND | |
| | | Shares | | | Value | |
| | | | | | | |
| COMMON STOCKS† - 107.0% | | | | | | | | |
| | | | | | | | | |
| CONSUMER STAPLES - 19.9% | | | | | | | | |
| Altria Group, Inc. | | | 60,300 | | | $ | 2,071,305 | |
| Wal-Mart Stores, Inc. | | | 25,400 | | | | 1,878,584 | |
| General Mills, Inc. | | | 38,600 | | | | 1,849,712 | |
| Kimberly-Clark Corp. | | | 19,100 | | | | 1,799,602 | |
| Safeway, Inc. | | | 28,900 | | | | 924,511 | |
| Costco Wholesale Corp. | | | 8,000 | | | | 920,960 | |
| Lawson, Inc. | | | 9,600 | | | | 751,007 | |
| Dr Pepper Snapple Group, Inc. | | | 16,100 | | | | 721,602 | |
| Metcash Ltd. | | | 204,900 | | | | 611,670 | |
| Campbell Soup Co. | | | 13,200 | | | | 537,372 | |
| PepsiCo, Inc. | | | 5,000 | | | | 397,500 | |
| Archer-Daniels-Midland Co. | | | 10,200 | | | | 375,768 | |
| Lorillard, Inc. | | | 8,000 | | | | 358,240 | |
| Hershey Co. | | | 3,000 | | | | 277,500 | |
| George Weston Ltd. | | | 3,000 | | | | 235,931 | |
| Green Mountain Coffee Roasters, Inc.* | | | 2,400 | | | | 180,792 | |
| Kellogg Co. | | | 3,000 | | | | 176,190 | |
| Tyson Foods, Inc. — Class A | | | 5,000 | | | | 141,400 | |
| Monster Beverage Corp.* | | | 2,000 | | | | 104,500 | |
| Total Consumer Staples | | | | | | | 14,314,146 | |
| Consumer Discretionary - 15.2% | | | | | | | | |
| Target Corp. | | | 17,200 | | | | 1,100,456 | |
| McDonald’s Corp. | | | 9,800 | | | | 942,857 | |
| Family Dollar Stores, Inc. | | | 10,700 | | | | 770,614 | |
| Kohl’s Corp. | | | 14,800 | | | | 765,900 | |
| Darden Restaurants, Inc. | | | 14,800 | | | | 685,092 | |
| Shaw Communications, Inc. — Class B | | | 28,800 | | | | 668,773 | |
| Garmin Ltd. | | | 14,100 | | | | 637,179 | |
| Sankyo Company Ltd. | | | 12,300 | | | | 599,985 | |
| Singapore Press Holdings Ltd. | | | 169,400 | | | | 555,016 | |
| Magna International, Inc. | | | 6,400 | | | | 527,798 | |
| Advance Auto Parts, Inc. | | | 5,000 | | | | 413,400 | |
| Next plc | | | 4,000 | | | | 333,792 | |
| Tabcorp Holdings Ltd. | | | 100,900 | | | | 308,738 | |
| PetSmart, Inc. | | | 4,000 | | | | 305,040 | |
| InterContinental Hotels Group plc | | | 10,000 | | | | 291,542 | |
| British Sky Broadcasting Group plc | | | 20,000 | | | | 281,667 | |
| McDonald’s Holdings Company Japan Ltd. | | | 9,800 | | | | 269,974 | |
| Nikon Corp. | | | 15,200 | | | | 264,879 | |
| Telenet Group Holding N.V. | | | 5,000 | | | | 248,935 | |
| NOK Corp. | | | 15,700 | | | | 244,045 | |
| Whitbread plc | | | 4,100 | | | | 196,654 | |
| Marks & Spencer Group plc | | | 20,300 | | | | 163,156 | |
| Compass Group plc | | | 10,000 | | | | 137,596 | |
| TJX Companies, Inc. | | | 2,000 | | | | 112,780 | |
| ProSiebenSat.1 Media AG | | | 1,983 | | | | 84,229 | |
| Total Consumer Discretionary | | | | | | | 10,910,097 | |
| Financials - 14.6% | | | | | | | | |
| Banco Santander S.A. | | | 146,400 | | | | 1,193,776 | |
| Annaly Capital Management, Inc. | | | 77,400 | | | | 896,292 | |
| American Capital Agency Corp. | | | 39,000 | | | | 880,230 | |
| Daito Trust Construction Company Ltd. | | | 8,500 | | | | 848,271 | |
| National Australia Bank Ltd. | | | 25,500 | | | | 816,419 | |
| Stockland | | | 210,800 | | | | 761,039 | |
| Hannover Rueck SE | | | 10,200 | | | | 750,047 | |
| ICAP plc | | | 121,700 | | | | 737,194 | |
| Insurance Australia Group Ltd. | | | 121,400 | | | | 664,786 | |
| CFS Retail Property Trust Group | | | 302,700 | | | | 564,765 | |
| Progressive Corp. | | | 20,400 | | | | 555,492 | |
| Intact Financial Corp. | | | 9,200 | | | | 551,773 | |
| Zurich Insurance Group AG | | | 1,500 | | | | 386,282 | |
| RSA Insurance Group plc | | | 170,500 | | | | 333,410 | |
| Bendigo and Adelaide Bank Ltd. | | | 30,300 | | | | 283,228 | |
| WR Berkley Corp. | | | 4,000 | | | | 171,440 | |
| Aeon Mall Company Ltd. | | | 3,100 | | | | 91,896 | |
| Delta Lloyd N.V. | | | 125 | | | | 2,660 | |
| Aegon N.V. | | | 242 | | | | 1,791 | |
| Total Financials | | | | | | | 10,490,791 | |
| Telecommunication Services - 14.5% | | | | | | | | |
| Deutsche Telekom AG | | | 147,000 | | | | 2,130,681 | |
| Telstra Corporation Ltd. | | | 304,700 | | | | 1,412,714 | |
| NTT DOCOMO, Inc. | | | 70,000 | | | | 1,133,672 | |
| BCE, Inc. | | | 20,200 | | | | 863,229 | |
| Bezeq The Israeli Telecommunication | | | | | | | | |
| Corporation Ltd. | | | 419,600 | | | | 771,700 | |
| Belgacom S.A. | | | 28,412 | | | | 755,219 | |
| Telecom Corporation of New Zealand Ltd. | | | 362,500 | | | | 699,923 | |
| Windstream Holdings, Inc. | | | 81,700 | | | | 653,600 | |
| Frontier Communications Corp. | | | 132,800 | | | | 553,776 | |
| Nippon Telegraph & Telephone Corp. | | | 9,400 | | | | 485,778 | |
| Elisa Oyj | | | 20,300 | | | | 483,850 | |
| Orange S.A. | | | 30,300 | | | | 379,913 | |
| Vodafone Group plc | | | 27,176 | | | | 95,023 | |
| Total Telecommunication Services | | | | | | | 10,419,078 | |
| Utilities - 13.2% | | | | | | | | |
| GDF Suez | | | 70,400 | | | | 1,768,452 | |
| Consolidated Edison, Inc. | | | 21,400 | | | | 1,179,996 | |
| Southern Co. | | | 24,200 | | | | 996,556 | |
| CLP Holdings Ltd. | | | 96,300 | | | | 784,095 | |
| Power Assets Holdings Ltd. | | | 85,600 | | | | 765,953 | |
| Cheung Kong Infrastructure Holdings Ltd. | | | 95,500 | | | | 661,837 | |
| TransAlta Corp. | | | 50,500 | | | | 655,952 | |
| Entergy Corp. | | | 10,000 | | | | 631,900 | |
| Pepco Holdings, Inc. | | | 25,300 | | | | 467,038 | |
| Osaka Gas Company Ltd. | | | 106,300 | | | | 452,018 | |
| National Grid plc | | | 35,100 | | | | 414,779 | |
| Tokyo Gas Company Ltd. | | | 74,800 | | | | 409,384 | |
| SP AusNet | | | 303,300 | | | | 339,531 | |
| Total Utilities | | | | | | | 9,527,491 | |
| Health Care - 11.5% | | | | | | | | |
| Bristol-Myers Squibb Co. | | | 37,300 | | | | 1,726,245 | |
| AstraZeneca plc | | | 32,300 | | | | 1,681,273 | |
| Cardinal Health, Inc. | | | 25,300 | | | | 1,319,395 | |
| WellPoint, Inc. | | | 13,500 | | | | 1,128,735 | |
| HCA Holdings, Inc. | | | 18,900 | | | | 807,975 | |
| Coloplast A/S — Class B | | | 8,200 | | | | 466,869 | |
| UnitedHealth Group, Inc. | | | 6,100 | | | | 436,821 | |
| Eli Lilly & Co. | | | 6,000 | | | | 301,980 | |
| SEE NOTES TO FINANCIAL STATEMENTS. | THE GUGGENHEIM FUNDS ANNUAL REPORT | 53 |
| SCHEDULE OF INVESTMENTS (concluded) | September 30, 2013 |
| WORLD EQUITY INCOME FUND | |
| | | Shares | | | Value | |
| | | | | | | |
| Takeda Pharmaceutical Company Ltd. | | | 6,000 | | | $ | 282,909 | |
| Eisai Company Ltd. | | | 4,000 | | | | 162,360 | |
| Total Health Care | | | | | | | 8,314,562 | |
| Industrials - 8.7% | | | | | | | | |
| Lockheed Martin Corp. | | | 18,100 | | | | 2,308,656 | |
| Bouygues S.A. | | | 21,400 | | | | 780,879 | |
| ANA Holdings, Inc. | | | 248,000 | | | | 539,898 | |
| Sumitomo Corp. | | | 37,200 | | | | 500,289 | |
| ITOCHU Corp. | | | 39,300 | | | | 480,555 | |
| TransDigm Group, Inc. | | | 3,000 | | | | 416,100 | |
| Hopewell Holdings Ltd. | | | 124,200 | | | | 415,554 | |
| ACS Actividades de Construccion y | | | | | | | | |
| Servicios S.A. | | | 10,000 | | | | 317,890 | |
| ALS Ltd. | | | 25,200 | | | | 246,840 | |
| Bureau Veritas S.A. | | | 4,000 | | | | 126,074 | |
| AP Moeller - Maersk A/S — Class B | | | 8 | | | | 73,350 | |
| AP Moeller - Maersk A/S — Class A | | | 3 | | | | 25,945 | |
| TNT Express N.V. | | | 35 | | | | 319 | |
| Total Industrials | | | | | | | 6,232,349 | |
| Information Technology - 4.8% | | | | | | | | |
| Canon, Inc. | | | 42,600 | | | | 1,356,439 | |
| ASML Holding N.V. | | | 4,900 | | | | 483,869 | |
| Apple, Inc. | | | 1,000 | | | | 476,750 | |
| Leidos Holdings, Inc.* | | | 8,100 | | | | 368,712 | |
| Intel Corp. | | | 15,200 | | | | 348,384 | |
| AAC Technologies Holdings, Inc. | | | 62,300 | | | | 283,150 | |
| Science Applications International Corp.* | | | 4,629 | | | | 156,214 | |
| Total Information Technology | | | | | | | 3,473,518 | |
| Energy - 3.8% | | | | | | | | |
| Seadrill Ltd. | | | 25,400 | | | | 1,139,571 | |
| Canadian Oil Sands Ltd. | | | 25,200 | | | | 488,299 | |
| Total S.A. | | | 8,300 | | | | 481,608 | |
| Bonavista Energy Corp. | | | 30,200 | | | | 379,080 | |
| TonenGeneral Sekiyu K.K. | | | 30,300 | | | | 279,574 | |
| Total Energy | | | | | | | 2,768,132 | |
| Materials - 0.8% | | | | | | | | |
| Barrick Gold Corp. | | | 20,100 | | | | 374,257 | |
| Agnico Eagle Mines Ltd. | | | 7,800 | | | | 206,568 | |
| Total Materials | | | | | | | 580,825 | |
| Total Common Stocks | | | | | | | | |
| (Cost $75,876,098) | | | | | | | 77,030,989 | |
| SHORT TERM INVESTMENTS† - 0.8% | | | | | | | | |
| Goldman Sachs Financial Square | | | | | | | | |
| Funds - Treasury Instruments Fund | | | 556,160 | | | | 556,160 | |
| Total Short Term Investments | | | | | | | | |
| (Cost $556,160) | | | | | | | 556,160 | |
| Total Investments - 107.8% | | | | | | | | |
| (Cost $76,432,258) | | | | | | $ | 77,587,149 | |
| Other Assets & Liabilities, net - (7.8)% | | | | | | | (5,614,046 | ) |
| Total Net Assets - 100.0% | | | | | | $ | 71,973,103 | |
INVESTMENT CONCENTRATION
At September 30, 2013, the investment diversification of the Fund by country was as follows:
| Country | | % of Net Assets | | | Value | |
| United States | | | 48.8 | % | | $ | 35,150,122 | |
| Japan | | | 12.7 | % | | | 9,152,934 | |
| Australia | | | 8.3 | % | | | 6,009,731 | |
| Canada | | | 6.9 | % | | | 4,951,661 | |
| Britain | | | 6.5 | % | | | 4,666,086 | |
| France | | | 4.9 | % | | | 3,536,926 | |
| Germany | | | 4.1 | % | | | 2,964,955 | |
| Hong Kong | | | 3.6 | % | | | 2,627,439 | |
| Spain | | | 2.1 | % | | | 1,511,666 | |
| Bermuda | | | 1.6 | % | | | 1,139,572 | |
| Switzerland | | | 1.4 | % | | | 1,023,461 | |
| Belgium | | | 1.4 | % | | | 1,004,154 | |
| Israel | | | 1.1 | % | | | 771,700 | |
| New Zealand | | | 1.0 | % | | | 699,923 | |
| Other | | | 3.4 | % | | | 2,376,819 | |
| Total Investments | | | 107.8 | % | | $ | 77,587,149 | |
| * | Non-income producing security. |
| † | Value determined based on Level 1 inputs — See Note 4.
plc — Public Limited Company |
| 54 | THE GUGGENHEIM FUNDS ANNUAL REPORT | SEE NOTES TO FINANCIAL STATEMENTS. |
| WORLD EQUITY INCOME FUND |
| |
| STATEMENT OF ASSETS |
| AND LIABILITIES |
| September 30, 2013 | | | |
| | | | |
| Assets: | | | | |
| Investments, at value | | | | |
| (cost $76,432,258) | | $ | 77,587,149 | |
| Foreign currency, at value | | | | |
| (cost $100,668) | | | 101,819 | |
| Cash | | | 32,544 | |
| Prepaid expenses | | | 22,879 | |
| Receivables: | | | | |
| Dividends | | | 327,917 | |
| Foreign taxes reclaim | | | 99,660 | |
| Securities sold | | | 84,430 | |
| Fund shares sold | | | 58,222 | |
| Investment advisor | | | 27,256 | |
| Total assets | | | 78,341,876 | |
| LIABILITIES: | | | | |
| Payable for: | | | | |
| Fund shares redeemed | | | 6,181,065 | |
| Management fees | | | 44,039 | |
| Distribution and service fees | | | 17,232 | |
| Transfer agent/maintenance fees | | | 10,770 | |
| Fund accounting/administration fees | | | 9,437 | |
| Directors’ fees* | | | 609 | |
| Miscellaneous | | | 105,621 | |
| Total liabilities | | | 6,368,773 | |
| Net assets | | $ | 71,973,103 | |
| Net assets consist of: | | | | |
| Paid in capital | | $ | 94,214,757 | |
| Undistributed net investment income | | | 391,872 | |
| Accumulated net realized loss on investments | | | (23,792,743 | ) |
| Net unrealized appreciation on investments and foreign currency | | | 1,159,217 | |
| Net assets | | $ | 71,973,103 | |
| A-Class: | | | | |
| Net assets | | $ | 65,965,921 | |
| Capital shares outstanding | | | 5,233,977 | |
| Net asset value per share | | $ | 12.60 | |
| Maximum offering price per share | | | | |
| (Net asset value divided by 95.25%) | | $ | 13.23 | |
| B-Class: | | | | |
| Net assets | | $ | 2,377,678 | |
| Capital shares outstanding | | | 215,887 | |
| Net asset value per share | | $ | 11.01 | |
| C-Class: | | | | |
| Net assets | | $ | 3,377,490 | |
| Capital shares outstanding | | | 312,921 | |
| Net asset value per share | | $ | 10.79 | |
| Institutional Class: | | | | |
| Net assets | | $ | 252,014 | |
| Capital shares outstanding | | | 20,120 | |
| Net asset value per share | | $ | 12.53 | |
| Year Ended September 30, 2013 | | | |
| | | | |
| Investment Income: | | | | |
| Dividends (net of foreign withholding tax of $243,137) | | $ | 2,291,649 | |
| Interest | | | 50 | |
| Total investment income | | | 2,291,699 | |
| | | | | |
| Expenses: | | | | |
| Management fees | | | 504,600 | |
| Transfer agent/maintenance fees: | | | | |
| A-Class | | | 108,562 | |
| B-Class | | | 23,802 | |
| C-Class | | | 12,224 | |
| Institutional Class | | | 404 | |
| Distribution and service fees: | | | | |
| A-Class | | | 165,184 | |
| C-Class | | | 32,286 | |
| Fund accounting/administration fees | | | 108,129 | |
| Custodian fees | | | 170,415 | |
| Pricing fees | | | 90,214 | |
| Directors’ fees* | | | 4,204 | |
| Tax expense | | | 3,272 | |
| Miscellaneous | | | 211,461 | |
| Total expenses | | | 1,434,757 | |
| Less: | | | | |
| Expenses waived/reimbursed by Advisor | | | (269,453 | ) |
| Net expenses | | | 1,165,304 | |
| Net investment income | | | 1,126,395 | |
| | | | | |
| Net Realized and Unrealized Gain (Loss): | | | | |
| Net realized gain (loss) on: | | | | |
| Investments | | | 6,146,712 | |
| Foreign currency | | | (39,208 | ) |
| Securities sold short | | | (10 | ) |
| Net realized gain | | | 6,107,494 | |
| Net change in unrealized appreciation (depreciation) on: | | | | |
| Investments | | | 7,235,601 | |
| Foreign currency | | | 7,880 | |
| Net change in unrealized appreciation (depreciation) | | | 7,243,481 | |
| Net realized and unrealized gain | | | 13,350,975 | |
| Net increase in net assets resulting from operations | | $ | 14,477,370 | |
| * | Relates to Directors not deemed “interested persons” within the meaning of Section 2(a)(19) of the 1940 Act. |
| SEE NOTES TO FINANCIAL STATEMENTS. | THE GUGGENHEIM FUNDS ANNUAL REPORT | 55 |
| WORLD EQUITY INCOME FUND |
| |
| STATEMENTS OF CHANGES IN NET ASSETS |
| | | Year Ended | | | Year Ended | |
| | | September 30, | | | September 30, | |
| | | 2013 | | | 2012 | |
| | | | | | | |
| Increase (Decrease) In Net Assets From Operations: | | | | | | | | |
| Net investment income | | $ | 1,126,395 | | | $ | 989,291 | |
| Net realized gain (loss) on investments and foreign currency | | | 6,107,494 | | | | (5,918,358 | ) |
| Net change in unrealized appreciation (depreciation) on investments and foreign currency | | | 7,243,481 | | | | 10,876,566 | |
| Net increase in net assets resulting from operations | | | 14,477,370 | | | | 5,947,499 | |
| | | | | | | | | |
| Distributions to shareholders from: | | | | | | | | |
| Net investment income | | | | | | | | |
| A-Class | | | (1,672,199 | ) | | | (30,502 | ) |
| B-Class | | | (73,946 | ) | | | (2,983 | ) |
| C-Class | | | (47,041 | ) | | | — | |
| Institutional Class | | | (4,606 | ) | | | (73 | ) |
| Total distributions to shareholders | | | (1,797,792 | ) | | | (33,558 | ) |
| | | | | | | | | |
| Capital share transactions: | | | | | | | | |
| Proceeds from sale of shares | | | | | | | | |
| A-Class | | | 15,420,639 | | | | 11,310,005 | |
| B-Class | | | 425,854 | | | | 64,990 | |
| C-Class | | | 688,147 | | | | 309,208 | |
| Institutional Class | | | 378,957 | | | | 4,955,291 | |
| Distributions reinvested | | | | | | | | |
| A-Class | | | 1,659,730 | | | | 30,250 | |
| B-Class | | | 73,635 | | | | 2,968 | |
| C-Class | | | 46,791 | | | | — | |
| Institutional Class | | | 4,606 | | | | 73 | |
| Cost of shares redeemed | | | | | | | | |
| A-Class | | | (24,573,617 | ) | | | (20,478,100 | ) |
| B-Class | | | (1,387,459 | ) | | | (1,700,356 | ) |
| C-Class | | | (952,484 | ) | | | (970,947 | ) |
| Institutional Class | | | (254,172 | ) | | | (5,107,255 | ) |
| Net decrease from capital share transactions | | | (8,469,373 | ) | | | (11,583,873 | ) |
| Net increase (decrease) in net assets | | | 4,210,205 | | | | (5,669,932 | ) |
| | | | | | | | | |
| Net assets: | | | | | | | | |
| Beginning of year | | | 67,762,898 | | | | 73,432,830 | |
| End of year | | $ | 71,973,103 | | | $ | 67,762,898 | |
| Undistributed net investment income at end of year | | $ | 391,872 | | | $ | 749,719 | |
| | | | | | | | | |
| Capital share activity: | | | | | | | | |
| Shares sold | | | | | | | | |
| A-Class | | | 1,314,259 | | | | 1,101,870 | |
| B-Class | | | 41,564 | | | | 7,266 | |
| C-Class | | | 68,601 | | | | 35,518 | |
| Institutional Class | | | 33,315 | | | | 484,691 | |
| Shares issued from reinvestment of distributions | | | | | | | | |
| A-Class | | | 148,443 | | | | 3,109 | |
| B-Class | | | 7,438 | | | | 350 | |
| C-Class | | | 5,072 | | | | — | |
| Institutional Class | | | 398 | | | | 8 | |
| Shares redeemed | | | | | | | | |
| A-Class | | | (2,089,282 | ) | | | (2,007,132 | ) |
| B-Class | | | (138,796 | ) | | | (192,408 | ) |
| C-Class | | | (95,590 | ) | | | (111,863 | ) |
| Institutional Class | | | (22,190 | ) | | | (505,528 | ) |
| Net decrease in shares | | | (726,768 | ) | | | (1,184,119 | ) |
| 56 | THE GUGGENHEIM FUNDS ANNUAL REPORT | SEE NOTES TO FINANCIAL STATEMENTS. |
| WORLD EQUITY INCOME FUND |
| |
| FINANCIAL HIGHLIGHTS |
This table is presented to show selected data for a share outstanding throughout each period and to assist shareholders in evaluating a Fund’s performance for the periods presented.
| | | Year Ended | | | Year Ended | | | Year Ended | | | Year Ended | | | Year Ended | |
| | | September 30, | | | September 30, | | | September 30, | | | September 30, | | | September 30, | |
| A-Class | | 2013 | | | 2012 | | | 2011 | | | 2010 | | | 2009 | |
| Per Share Data | | | | | | | | | | | | | | | | | | | | |
| Net asset value, beginning of period | | $ | 10.55 | | | $ | 9.70 | | | $ | 10.52 | | | $ | 9.97 | | | $ | 10.35 | |
| Income (loss) from investment operations: | | | | | | | | | | | | | | | | | | | | |
| Net investment incomea | | | .18 | | | | .15 | | | | .05 | | | | .02 | | | | .05 | |
Net gain (loss) on investments (realized and unrealized) | | | 2.16 | | | | .70 | | | | (.81 | ) | | | .53 | | | | (.35 | ) |
| Total from investment operations | | | 2.34 | | | | .85 | | | | (.76 | ) | | | .55 | | | | (.30 | ) |
| Less distributions from: | | | | | | | | | | | | | | | | | | | | |
| Net investment income | | | (.29 | ) | | | (— | )b | | | (.06 | ) | | | — | | | | (.02 | ) |
| Return of capital | | | — | | | | — | | | | — | | | | — | | | | (.06 | ) |
| Total distributions | | | (.29 | ) | | | (— | )b | | | (.06 | ) | | | — | | | | (.08 | ) |
| Net asset value, end of period | | $ | 12.60 | | | $ | 10.55 | | | $ | 9.70 | | | $ | 10.52 | | | $ | 9.97 | |
| | | | | | | | | | | | | | | | | | | | | |
| Total Returnc | | | 22.58 | % | | | 8.82 | % | | | (7.32 | %) | | | 5.52 | % | | | (2.71 | %) |
| Ratios/Supplemental Data | | | | | | | | | | | | | | | | | | | | |
| Net assets, end of period (in thousands) | | $ | 65,966 | | | $ | 61,838 | | | $ | 65,573 | | | $ | 78,201 | | | $ | 97,205 | |
| Ratios to average net assets: | | | | | | | | | | | | | | | | | | | | |
| Net investment income | | | 1.59 | % | | | 1.45 | % | | | 0.40 | % | | | 0.24 | % | | | 0.63 | % |
| Total expenses | | | 1.93 | % | | | 2.05 | % | | | 1.85 | % | | | 1.86 | % | | | 1.89 | % |
| Net expensesd | | | 1.59 | % | | | 1.63 | % | | | 1.82 | % | | | 1.86 | % | | | 1.89 | % |
| Portfolio turnover rate | | | 154 | % | | | 41 | % | | | 206 | % | | | 288 | % | | | 368 | % |
| | | Year Ended | | | Year Ended | | | Year Ended | | | Year Ended | | | Year Ended | |
| | | September 30, | | | September 30, | | | September 30, | | | September 30, | | | September 30, | |
| B-Class | | 2013f | | | 2012f | | | 2011f | | | 2010f | | | 2009f | |
| Per Share Data | | | | | | | | | | | | | | | | | | | | |
| Net asset value, beginning of period | | $ | 9.22 | | | $ | 8.46 | | | $ | 9.19 | | | $ | 8.69 | | | $ | 9.05 | |
| Income (loss) from investment operations: | | | | | | | | | | | | | | | | | | | | |
| Net investment incomea | | | .18 | | | | .14 | | | | .05 | | | | .04 | | | | .07 | |
Net gain (loss) on investments (realized and unrealized) | | | 1.90 | | | | .63 | | | | (.69 | ) | | | .46 | | | | (.32 | ) |
| Total from investment operations | | | 2.08 | | | | .77 | | | | (.64 | ) | | | .50 | | | | (.25 | ) |
| Less distributions from: | | | | | | | | | | | | | | | | | | | | |
| Net investment income | | | (.29 | ) | | | (.01 | ) | | | (.09 | ) | | | — | | | | (.04 | ) |
| Return of capital | | | — | | | | — | | | | — | | | | — | | | | (.07 | ) |
| Total distributions | | | (.29 | ) | | | (.01 | ) | | | (.09 | ) | | | — | | | | (.11 | ) |
| Net asset value, end of period | | $ | 11.01 | | | $ | 9.22 | | | $ | 8.46 | | | $ | 9.19 | | | $ | 8.69 | |
| | | | | | | | | | | | | | | | | | | | | |
| Total Returnc | | | 22.95 | % | | | 9.07 | % | | | (7.13 | %) | | | 5.75 | % | | | (2.45 | %) |
| Ratios/Supplemental Data | | | | | | | | | | | | | | | | | | | | |
| Net assets, end of period (in thousands) | | $ | 2,378 | | | $ | 2,820 | | | $ | 4,148 | | | $ | 6,769 | | | $ | 11,155 | |
| Ratios to average net assets: | | | | | | | | | | | | | | | | | | | | |
| Net investment income | | | 1.77 | % | | | 1.60 | % | | | 0.53 | % | | | 0.45 | % | | | 0.90 | % |
| Total expenses | | | 2.43 | % | | | 2.34 | % | | | 1.61 | % | | | 1.61 | % | | | 1.65 | % |
| Net expensesd | | | 1.31 | % | | | 1.38 | % | | | 1.59 | % | | | 1.61 | % | | | 1.65 | % |
| Portfolio turnover rate | | | 154 | % | | | 41 | % | | | 206 | % | | | 288 | % | | | 368 | % |
| SEE NOTES TO FINANCIAL STATEMENTS. | THE GUGGENHEIM FUNDS ANNUAL REPORT | 57 |
| WORLD EQUITY INCOME FUND |
| |
| FINANCIAL HIGHLIGHTS (concluded) |
This table is presented to show selected data for a share outstanding throughout each period and to assist shareholders in evaluating a Fund’s performance for the periods presented.
| | | Year Ended | | | Year Ended | | | Year Ended | | | Year Ended | | | Year Ended | |
| | | September 30, | | | September 30, | | | September 30, | | | September 30, | | | September 30, | |
| C-Class | | 2013 | | | 2012 | | | 2011 | | | 2010 | | | 2009 | |
| Per Share Data | | | | | | | | | | | | | | | | | | | | |
| Net asset value, beginning of period | | $ | 9.01 | | | $ | 8.33 | | | $ | 9.06 | | | $ | 8.66 | | | $ | 9.04 | |
| Income (loss) from investment operations: | | | | | | | | | | | | | | | | | | | | |
| Net investment income (loss)a | | | .08 | | | | .06 | | | | (.04 | ) | | | (.04 | ) | | | (.01 | ) |
| Net gain (loss) on investments (realized and unrealized) | | | 1.84 | | | | .62 | | | | (.69 | ) | | | .44 | | | | (.31 | ) |
| Total from investment operations | | | 1.92 | | | | .68 | | | | (.73 | ) | | | .40 | | | | (.32 | ) |
| Less distributions from: | | | | | | | | | | | | | | | | | | | | |
| Net investment income | | | (.14 | ) | | | — | | | | — | | | | — | | | | — | |
| Return of capital | | | — | | | | — | | | | — | | | | — | | | | (.06 | ) |
| Total distributions | | | (.14 | ) | | | — | | | | — | | | | — | | | | (.06 | ) |
| Net asset value, end of period | | $ | 10.79 | | | $ | 9.01 | | | $ | 8.33 | | | $ | 9.06 | | | $ | 8.66 | |
| | | | | | | | | | | | | | | | | | | | | |
| Total Returnc | | | 21.57 | % | | | 8.16 | % | | | (8.06 | %) | | | 4.62 | % | | | (3.39 | %) |
| Ratios/Supplemental Data | | | | | | | | | | | | | | | | | | | | |
| Net assets, end of period (in thousands) | | $ | 3,377 | | | $ | 3,015 | | | $ | 3,426 | | | $ | 4,295 | | | $ | 4,838 | |
| Ratios to average net assets: | | | | | | | | | | | | | | | | | | | | |
| Net investment income (loss) | | | 0.80 | % | | | 0.68 | % | | | (0.37 | %) | | | (0.50 | %) | | | (0.11 | %) |
| Total expenses | | | 2.89 | % | | | 2.88 | % | | | 2.60 | % | | | 2.62 | % | | | 2.65 | % |
| Net expensesd | | | 2.35 | % | | | 2.38 | % | | | 2.58 | % | | | 2.62 | % | | | 2.65 | % |
| Portfolio turnover rate | | | 154 | % | | | 41 | % | | | 206 | % | | | 288 | % | | | 368 | % |
| | | Year Ended | | | Year Ended | | | Period Ended | |
| | | September 30, | | | September 30, | | | September 30, | |
| Institutional Class | | 2013 | | | 2012 | | | 2011e | |
| Per Share Data | | | | | | | | | | | | |
| Net asset value, beginning of period | | $ | 10.50 | | | $ | 9.70 | | | $ | 12.37 | |
| Income (loss) from investment operations: | | | | | | | | | | | | |
| Net investment incomea | | | .28 | | | | .28 | | | | .13 | |
| Net gain (loss) on investments (realized and unrealized) | | | 2.10 | | | | .52 | | | | (2.80 | ) |
| Total from investment operations | | | 2.38 | | | | .80 | | | | (2.67 | ) |
| Less distributions from: | | | | | | | | | | | | |
| Net investment income | | | (.35 | ) | | | (— | )b | | | — | |
| Total distributions | | | (.35 | ) | | | (— | )b | | | — | |
| Net asset value, end of period | | $ | 12.53 | | | $ | 10.50 | | | $ | 9.70 | |
| | | | | | | | | | | | | |
| Total Returnc | | | 23.17 | % | | | 8.17 | % | | | (21.58 | %) |
| Ratios/Supplemental Data | | | | | | | | | | | | |
| Net assets, end of period (in thousands) | | $ | 252 | | | $ | 90 | | | $ | 285 | |
| Ratios to average net assets: | | | | | | | | | | | | |
| Net investment income | | | 2.42 | % | | | 2.70 | % | | | 2.99 | % |
| Total expenses | | | 1.73 | % | | | 1.90 | % | | | 2.27 | % |
| Net expensesd | | | 1.26 | % | | | 1.32 | % | | | 1.36 | % |
| Portfolio turnover rate | | | 154 | % | | | 41 | % | | | 206 | % |
| a | Net investment income (loss) per share was computed using average shares outstanding throughout the period. |
| b | Distributions from net investment income are less than $0.01 per share. |
| c | Total return does not reflect the impact of any applicable sales charges and has not been annualized. |
| d | Net expense information reflects the expense ratios after expense waivers and reimbursements, as applicable. |
| e | Since commencement of operations: May 2, 2011. Percentage amounts for the period, except total return and portfolio turnover rate, have been annualized. The portfolio turnover rate stated is for the entire fiscal year of the Fund, not since commencement of operations of the Class. |
| f | Effective August 25, 2005, B-Class shares ceased charging 12b-1 fees in accordance with FINRA sales cap regulations. Per share informations reflects this change. This fee will be reinstated when sales exceed the sales cap limit. |
| 58 | THE GUGGENHEIM FUNDS ANNUAL REPORT | SEE NOTES TO FINANCIAL STATEMENTS. |
| MANAGERS’ COMMENTARY (Unaudited) | September 30, 2013 |
To Our Shareholders:
Guggenheim Alpha Opportunity Fund (the “Fund”) is managed by a team of seasoned professionals, including Michael P. Byrum, CFA, Portfolio Manager; Michael Dellapa, CFA, CAIA, Portfolio Manager; and Ryan Harder, CFA, Portfolio Manager. In the following paragraphs, the team discusses changes to the Fund and performance of the Fund for the fiscal year ended September 30, 2013.
For the year ended September 30, 2013, the Alpha Opportunity Fund gained 21.38%1, compared with its benchmark, the S&P 500 Index, which gained 19.34%. The Fund is closed to new investors because it remains subject to proceedings associated with the bankruptcy filing of Lehman Brothers, Inc., in 2008, which has made certain assets illiquid.
During the period, Mainstream Investment Advisors, LLC, the Fund sub-adviser for Domestic Long/Short Sub-Portfolio, resigned effective September 30, 2013. The Fund’s Board of Directors approved certain changes to the Fund’s investment program as a result of the resignation.
The first change was that the Fund’s current investment manager, Security Investors, LLC, an affiliate of Guggenheim Investments, assumed investment management responsibility for the Domestic Long/Short Sub-Portfolio as of September 30, 2013.
The second change was, in conjunction with the adviser change in the Domestic Long/Short Sub-Portfolio, new principal investment strategies. The Fund’s strategies now are to pursue its objective by investing, under normal market conditions, approximately 37.5% of its total assets according to a long/short strategy with an emphasis on securities of non-U.S. issuers (the “Global Long/Short Sub-Portfolio”); approximately 37.5% of its total assets according to a long/short strategy with an emphasis on securities of domestic issuers (the “Domestic Long/Short Sub-Portfolio”); and 25% of its total assets in a portfolio of equity securities, equity derivatives and fixed income securities (the “Indexed Sub-Portfolio”) that is intended to closely track the performance of the S&P 500 Index.
Global Long/Short Sub-Portfolio
This sleeve has exposure to Lehman Brothers International Europe (LBIE) through a collateral account held by the Fund’s custodian that consists of short-sale proceeds and long positions in U.S. securities. While Guggenheim Investments seeks to resolve certain outstanding short-sale transactions with LBIE, the collateral remains illiquid.
Release of the collateral requires the consent of LBIE and Lehman Brothers, Inc., which is currently in bankruptcy. Due to the valuations assigned to the short positions, which are based on certain assumptions, resolution could ultimately result in the Fund’s realizing values that are materially different from those indicated in this report, which would materially affect the Fund’s net asset value. Guggenheim Investments is uncertain when the issues surrounding the collateral account will be resolved.
As of September 30, 2013, approximately 73% of the Fund’s assets were in this allocation. It has exceeded the size indicated in the principal investment strategies because of appreciation of the securities held and the fact that the Fund has been unable to sell any positions.
The long positions in U.S. securities contributed positive performance to the Fund over the past year.
Domestic Long/Short Sub-Portfolio
As of September 30, 2013, approximately 18% of the Fund’s assets were in this allocation. Effective September 30, 2013, Mainstream Investment Advisers, LLC was no longer sub-adviser to the domestic long/short strategy allocation.
During September 2013, Mainstream began to liquidate its allocation in anticipation of its resignation and completed the liquidation by the close of September 25. As the allocation was converted to cash, the new investment manager, Security Investors, LLC, began investing it in equity futures in order to gain exposure to the U.S. equity market.
The new Investment Manager’s strategy is to seek to respond to the dynamically changing economy by moving its investments among different industries and styles, making its allocation according to several measures of momentum. Companies associated with industries and/or styles demonstrating positive momentum are favored while those experiencing negative momentum are disfavored. The Fund may hold both long and short positions.
| THE GUGGENHEIM FUNDS ANNUAL REPORT | 59 |
| MANAGERS’ COMMENTARY (Unaudited) (concluded) |
Equity positions are determined based on their associated industry and style momentum, risk characteristics and liquidity. The Fund invests in domestic equity securities, including small-, mid- and large-capitalization securities, such as U.S. traded common stocks and ADRs, but also may invest in derivative instruments which primarily consist of equity index swaps, futures contracts and options on securities, futures contracts and stock indices giving exposure to the U.S. markets.
The Fund may invest in derivatives to hedge or gain leveraged exposure to a particular sector, industry or company depending on market conditions. The Fund also may enter into short sales of broad-based stock indices for hedging purposes in an effort to reduce the Fund’s risk or volatility.
While the Fund anticipates investing in these instruments to seek to achieve its investment objective, the extent of the Fund’s investment in these instruments may vary day to day depending on a number of different factors, including price, availability and general market conditions. The Sub-Portfolio may focus its investments in a limited number of issuers, even though the Fund as a whole operates as a diversified fund.
For the part of the period during which Mainstream managed the allocation, it used a domestic long/short strategy which applied fundamental and technical methods of analysis to identify quality securities trading at attractive valuations. This strategy used a top-down perspective to formulate long-term themes and a bottom-up approach to identify individual securities.
Favorable stock selection in the Industrials and Energy sectors was offset by the hedged allocation (primarily cash, which averaged near 26% as the sub-adviser transitioned the portfolio to cash near the end of the period). Leaders in the strategy over the period were U.S. Airways Group Inc., Axiall Corp. and Texas Industries, Inc., Apple Inc., NVR Inc. and Ellie Mae, Inc. were the largest detractors from results.
Indexed Sub-Portfolio
The investment manager for this portion of the portfolio, which represents approximately 8% of the Fund’s assets as of September 30, 2013, seeks investment returns that are similar to those of the S&P 500 Index by primarily investing in equity derivatives, such as futures contracts, options on futures contracts and equity options. The results of derivatives use during the period were within expectations and contributed to the Fund’s performance.
The Fund primarily used S&P 500 e-mini futures for the portion of Fund assets that is intended to track the S&P 500 Index. Equity markets rallied strongly throughout the past 12 months in response to continued central bank accommodation. The S&P 500 Index reached an all-time high during the period.
Performance displayed represents past performance which is no guarantee of future results.
1 Performance figures are based on A-Class shares and do not reflect deduction of the sales charges or taxes that a shareholder would pay on distributions or the redemption of shares. Fee waivers and/or reimbursements reduce Fund expenses, and, in the absence of such waivers, the performance quoted would be reduced.
The opinions and forecast expressed may not actually come to pass. This information is subject to change at any time, based on market and other conditions, and should not be construed as a recommendation of any specific security or strategy.
| 60 | the GUGGENHEIM FUNDS annual report |
| PERFORMANCE REPORT AND FUND PROFILE (Unaudited) | September 30, 2013 |
ALPHA OPPORTUNITY FUND
OBJECTIVE: Seeks long-term growth of capital.
Cumulative Fund Performance*
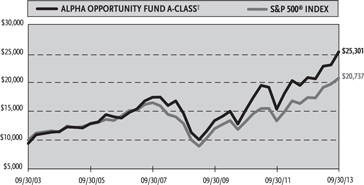
Average Annual Returns*
Periods Ended 09/30/13
| | | 1 Year | | | 5 Year | | | 10 Year | |
| A-Class Shares | | | 21.38 | % | | | 11.57 | % | | | 10.38 | % |
| A-Class Shares with sales charge† | | | 15.65 | % | | | 10.26 | % | | | 9.73 | % |
| B-Class Shares | | | 20.39 | % | | | 10.68 | % | | | 9.70 | % |
| B-Class Shares with CDSC‡ | | | 15.39 | % | | | 10.41 | % | | | 9.70 | % |
| C-Class Shares | | | 20.48 | % | | | 10.67 | % | | | 9.52 | % |
| C-Class Shares with CDSC§ | | | 19.48 | % | | | 10.67 | % | | | 9.52 | % |
| S&P 500 Index | | | 19.34 | % | | | 10.02 | % | | | 7.57 | % |
| | | | | | Since Inception | |
| | | 1 Year | | | (11/07/08) | |
| Institutional Class Shares | | | 21.60 | % | | | 18.04 | % |
| S&P 500 Index | | | 19.34 | % | | | 15.36 | % |
Holdings Diversification (Market Exposure as % of Net Assets)
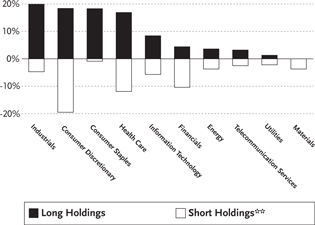
** All of the short holdings were fair valued by the Valuation Committee at September 30, 2013 due to exposure to LBIE — See Note 11. The total market value of fair valued securities amounts to (65%) of total net assets.
“Holdings Diversification (Market Exposure as % of Net Assets)” excludes any temporary cash investments.
| Inception Dates: | | |
| A-Class | | July 7, 2003 |
| B-Class | | July 7, 2003 |
| C-Class | | July 7, 2003 |
| Institutional Class | November 7, 2008 |
| Ten Largest Holdings (% of Total Net Assets) |
| Philip Morris International, Inc. | | | 7.5 | % |
| Altria Group, Inc. | | | 5.1 | % |
| Lockheed Martin Corp. | | | 4.2 | % |
| Trinity Industries, Inc. | | | 4.1 | % |
| Johnson & Johnson | | | 3.8 | % |
| CA, Inc. | | | 3.7 | % |
| TJX Companies, Inc. | | | 3.6 | % |
| ViroPharma, Inc. | | | 3.5 | % |
| AO Smith Corp. | | | 3.4 | % |
| AT&T, Inc. | | | 3.2 | % |
| Top Ten Total | | | 42.1 | % |
| * | The performance data above represents past performance that is not predictive of future results. The investment return and principal value of an investment in the Fund will fluctuate so that an investor’s shares, when redeemed, may be worth more or less than their original cost. Returns are historical and include changes in principal and reinvested dividends and capital gains and do not reflect the effect of taxes. The S&P 500 Index is an unmanaged index and, unlike the Fund, has no management fees or operating expenses to reduce its reported return. |
| † | Effective February 22, 2011, the maximum sales charge decreased from 5.75% to 4.75%. A 5.75% maximum sales charge is used in the calculation of the 5 Year and 10 Year average annual returns (based on subscriptions made prior to February 22, 2011), and a 4.75% maximum sales charge will be used to calculate performance for periods based on subscriptions made on or after February 22, 2011. |
| ‡ | Fund returns include a CDSC of up to 5% if redeemed within 5 years of purchase. |
| § | Fund returns include a CDSC of 1% if redeemed within 12 months of purchase. |
| the GUGGENHEIM FUNDS annual report | 61 |
| SCHEDULE OF INVESTMENTS | September 30, 2013 |
| ALPHA OPPORTUNITY FUND | |
| | | Shares | | | Value | |
| | | | | | | |
| COMMON STOCKS† - 94.0% | | | | | | | | |
| | | | | | | | | |
| INDUSTRIALS - 19.8% | | | | | | | | |
| Lockheed Martin Corp.1,2 | | | 3,753 | | | $ | 478,695 | |
| Trinity Industries, Inc.1,2 | | | 10,200 | | | | 462,570 | |
| AO Smith Corp.1,2 | | | 8,400 | | | | 379,680 | |
| Towers Watson & Co. — Class A1,2 | | | 2,200 | | | | 235,312 | |
| Joy Global, Inc.1,2 | | | 4,500 | | | | 229,680 | |
| Watts Water Technologies, | | | | | | | | |
| Inc. — Class A1,2 | | | 2,800 | | | | 157,836 | |
| Northrop Grumman Corp.1,2 | | | 1,100 | | | | 104,786 | |
| General Electric Co.1,2 | | | 4,200 | | | | 100,338 | |
| Con-way, Inc.1,2 | | | 1,700 | | | | 73,253 | |
| Huntington Ingalls Industries, Inc.1,2 | | | 183 | | | | 12,334 | |
| Total Industrials | | | | | | | 2,234,484 | |
| CONSUMER DISCRETIONARY - 18.3% | | | | | | | | |
| TJX Companies, Inc.1,2 | | | 7,200 | | | | 406,007 | |
| L Brands, Inc.1,2 | | | 5,100 | | | | 311,610 | |
| Ross Stores, Inc.1,2 | | | 4,200 | | | | 305,760 | |
| Family Dollar Stores, Inc.1,2 | | | 3,700 | | | | 266,474 | |
| Walt Disney Co.1,2 | | | 4,024 | | | | 259,508 | |
| The Gap, Inc.1,2 | | | 6,000 | | | | 241,680 | |
| Jack in the Box, Inc.*,1,2 | | | 4,000 | | | | 160,000 | |
| PVH Corp.1,2 | | | 800 | | | | 94,952 | |
| RadioShack Corp.*,1,2 | | | 5,100 | | | | 17,391 | |
| Total Consumer Discretionary | | | | | | | 2,063,382 | |
| CONSUMER STAPLES - 18.3% | | | | | | | | |
| Philip Morris International, Inc.1,2 | | | 9,800 | | | | 848,582 | |
| Altria Group, Inc.1,2 | | | 16,700 | | | | 573,645 | |
| Herbalife Ltd.1,2 | | | 5,000 | | | | 348,851 | |
| Wal-Mart Stores, Inc.1,2 | | | 2,200 | | | | 162,712 | |
| Safeway, Inc.1,2 | | | 3,900 | | | | 124,761 | |
| Total Consumer Staples | | | | | | | 2,058,551 | |
| HEALTH CARE - 16.8% | | | | | | | | |
| Johnson & Johnson1,2 | | | 5,000 | | | | 433,450 | |
| ViroPharma, Inc.*,1,2 | | | 9,900 | | | | 389,070 | |
| Life Technologies Corp.*,1,2 | | | 2,800 | | | | 209,524 | |
| Amgen, Inc.1,2 | | | 1,800 | | | | 201,492 | |
| WellCare Health Plans, Inc.*,1,2 | | | 2,300 | | | | 160,402 | |
| Forest Laboratories, Inc.*,1,2 | | | 3,400 | | | | 145,486 | |
| Baxter International, Inc.1,2 | | | 1,800 | | | | 118,242 | |
| Owens & Minor, Inc.1,2 | | | 2,700 | | | | 93,393 | |
| Charles River Laboratories | | | | | | | | |
| International, Inc.*,1,2 | | | 2,000 | | | | 92,520 | |
| Kindred Healthcare, Inc.1,2 | | | 3,900 | | | | 52,377 | |
| Total Health Care | | | | | | | 1,895,956 | |
| INFORMATION TECHNOLOGY - 8.4% | | | | | | | | |
| CA, Inc.1,2 | | | 14,000 | | | | 415,380 | |
| Symantec Corp.1,2 | | | 5,900 | | | | 146,025 | |
| Avnet, Inc.1,2 | | | 3,100 | | | | 129,301 | |
| Arrow Electronics, Inc.*,1,2 | | | 2,600 | | | | 126,178 | |
| Harmonic, Inc.*,1,2 | | | 11,000 | | | | 84,590 | |
| Amkor Technology, Inc.*,1,2 | | | 9,200 | | | | 39,468 | |
| Total Information Technology | | | | | | | 940,942 | |
| FINANCIALS - 4.4% | | | | | | | | |
| Amtrust Financial Services, Inc.1,2 | | | 7,260 | | | | 283,576 | |
| Endurance Specialty Holdings Ltd.1,2 | | | 3,000 | | | | 161,160 | |
| Genworth Financial, Inc. — Class A*,1,2 | | | 4,000 | | | | 51,160 | |
| Total Financials | | | | | | | 495,896 | |
| ENERGY - 3.6% | | | | | | | | |
| Anadarko Petroleum Corp.1,2 | | | 2,755 | | | | 256,187 | |
| ConocoPhillips1,2 | | | 1,500 | | | | 104,265 | |
| Phillips 661,2 | | | 750 | | | | 43,365 | |
| Total Energy | | | | | | | 403,817 | |
| TELECOMMUNICATION SERVICES - 3.2% | | | | | | | | |
| AT&T, Inc.1,2 | | | 10,600 | | | | 358,492 | |
| Utilities - 1.2% | | | | | | | | |
| Exelon Corp.1,2 | | | 4,743 | | | | 140,583 | |
| Total Common Stocks | | | | | | | | |
| (Cost $7,135,003) | | | | | | | 10,592,103 | |
| SHORT TERM INVESTMENTS† - 0.2% | | | | | | | | |
| State Street General Account | | | | | | | | |
| U.S. Government Fund | | | 24,622 | | | | 24,622 | |
| Total Short Term Investments | | | | | | | | |
| (Cost $24,622) | | | | | | | 24,622 | |
| | | | | | | | | |
| | | | Face | | | | | |
| | | | Amount | | | | | |
| FEDERAL AGENCY DISCOUNT NOTES†† - 4.4% | | | | | | | | |
| Federal Home Loan Bank3 | | | | | | | | |
| 0.06% due 11/29/13 | | $ | 200,000 | | | | 199,993 | |
| 0.09% due 11/29/13 | | | 100,000 | | | | 99,997 | |
| Total Federal Home Loan Bank | | | | | | | 299,990 | |
| Fannie Mae4 | | | | | | | | |
| 0.08% due 01/02/14 | | | 200,000 | | | | 199,990 | |
| Total Federal Agency Discount Notes | | | | | | | | |
| (Cost $499,925) | | | | | | | 499,980 | |
| REPURCHASE AGREEMENT††,5 - 20.5% | | | | | | | | |
| State Street | | | | | | | | |
| issued 09/30/13 at 0.00% | | | | | | | | |
| due 10/01/13 | | | 2,307,998 | | | | 2,307,998 | |
| Total Repurchase Agreement | | | | | | | | |
| (Cost $2,307,998) | | | | | | | 2,307,998 | |
| Total Investments - 119.1% | | | | | | | | |
| (Cost $9,967,548) | | | | | | $ | 13,424,703 | |
| | | | | | | |
| | | Shares | | | | |
| COMMON STOCKS SOLD SHORT††† - (65.1)% | | | | | | | | |
| CONSUMER STAPLES - (0.9)% | | | | | | | | |
| Monster Beverage Corp.*,6,7 | | | 3,250 | | | | (96,233 | ) |
| UTILITIES - (2.2)% | | | | | | | | |
| Korea Electric Power Corp. ADR*,6,7 | | | 18,310 | | | | (247,735 | ) |
| TELECOMMUNICATION SERVICES - (2.4)% | | | | | | | | |
| Clearwire Corp. — Class A*,6,7 | | | 2,530 | | | | (28,665 | ) |
| Global Crossing Ltd.*,6,7 | | | 1,800 | | | | (28,746 | ) |
| Leap Wireless International, Inc.*,6,7 | | | 1,500 | | | | (65,100 | ) |
| 62 | the GUGGENHEIM FUNDS annual report | See Notes to Financial Statements. |
| SCHEDULE OF INVESTMENTS (continued) | September 30, 2013 |
| ALPHA OPPORTUNITY FUND | |
| | | Shares | | | Value | |
| | | | | | | |
| SBA Communications | | | | | | | | |
| Corp. — Class A*,6,7 | | | 2,400 | | | $ | (69,096 | ) |
| Savvis, Inc.*,6,7 | | | 5,700 | | | | (84,018 | ) |
| Total Telecommunication Services | | | | | | | (275,625 | ) |
| MATERIALS - (3.7)% | | | | | | | | |
| China National Building Material | | | | | | | | |
| Company Ltd. — Class H6,7 | | | 14,700 | | | | (19,910 | ) |
| Anhui Conch Cement Company Ltd. — | | | | | | | | |
| Class H6,7 | | | 4,500 | | | | (20,259 | ) |
| Shougang Fushan Resources | | | | | | | | |
| Group Ltd.6,7 | | | 66,000 | | | | (23,727 | ) |
| Sino Gold Mining Ltd.*,6,7 | | | 8,600 | | | | (35,368 | ) |
| Turquoise Hill Resources Ltd.*,6,7 | | | 4,440 | | | | (37,030 | ) |
| Western Areas Ltd.6,7 | | | 6,200 | | | | (44,456 | ) |
| Zoltek Companies, Inc.*,6,7 | | | 2,700 | | | | (49,221 | ) |
| Silver Wheaton Corp.6,7 | | | 6,100 | | | | (64,046 | ) |
| Agnico Eagle Mines Ltd.6,7 | | | 1,800 | | | | (119,001 | ) |
| Total Materials | | | | | | | (413,018 | ) |
| ENERGY - (3.7)% | | | | | | | | |
| Aquila Resources Ltd.*,6,7 | | | 2,750 | | | | (21,907 | ) |
| Arrow Energy Holdings Pty Ltd.*,6,7 | | | 8,900 | | | | (22,965 | ) |
| Modec, Inc.6,7 | | | 900 | | | | (23,195 | ) |
| Sevan Marine ASA*,6,7 | | | 5,900 | | | | (30,951 | ) |
| Trican Well Service Ltd.6,7 | | | 2,000 | | | | (34,043 | ) |
| QGC Pty Ltd.*,6,7 | | | 12,800 | | | | (49,787 | ) |
| Rio Tinto Coal Mozambique*,6,7 | | | 6,700 | | | | (50,985 | ) |
| Imperial Energy Corporation plc*,6,7 | | | 3,900 | | | | (77,681 | ) |
| BPZ Resources, Inc.*,6,7 | | | 5,700 | | | | (107,160 | ) |
| Total Energy | | | | | | | (418,674 | ) |
| INDUSTRIALS - (4.7)% | | | | | | | | |
| China Merchants Holdings | | | | | | | | |
| International Company Ltd.6,7 | | | 3,100 | | | | (11,047 | ) |
| China Communications Construction | | | | | | | | |
| Company Ltd. — Class H6,7 | | | 15,000 | | | | (15,536 | ) |
| China National Materials | | | | | | | | |
| Company Ltd. — Class H6,7 | | | 34,400 | | | | (17,537 | ) |
| Japan Steel Works Ltd.6,7 | | | 1,500 | | | | (20,809 | ) |
| Ausenco Ltd.6,7 | | | 2,100 | | | | (22,658 | ) |
| Toyo Tanso Company Ltd.6,7 | | | 500 | | | | (27,007 | ) |
| Ryanair Holdings plc6,7 | | | 9,600 | | | | (35,971 | ) |
| Meyer Burger Technology AG*,6,7 | | | 200 | | | | (49,879 | ) |
| USG Corp.*,6,7 | | | 4,940 | | | | (141,877 | ) |
| Beijing Capital International Airport | | | | | | | | |
| Company Ltd. — Class H6,7 | | | 218,000 | | | | (188,550 | ) |
| Total Industrials | | | | | | | (530,871 | ) |
| INFORMATION TECHNOLOGY - (5.7)% | | | | | | | | |
| VeriSign, Inc.*,6,7 | | | 1,200 | | | | (30,756 | ) |
| Access Company Ltd.*,6,7 | | | 17 | | | | (32,755 | ) |
| Varian Semiconductor Equipment | | | | | | | | |
| Associates, Inc.*,6,7 | | | 1,260 | | | | (33,037 | ) |
| Electronic Arts, Inc.*,6,7 | | | 900 | | | | (36,720 | ) |
| Riverbed Technology, Inc.*,6,7 | | | 3,280 | | | | (43,624 | ) |
| Red Hat, Inc.*,6,7 | | | 2,610 | | | | (46,589 | ) |
| Baidu, Inc. ADR*,6,7 | | | 200 | | | | (53,726 | ) |
| Intermec, Inc.*,6,7 | | | 2,740 | | | | (54,307 | ) |
| Rambus, Inc.*,6,7 | | | 3,600 | | | | (55,224 | ) |
| VMware, Inc. — Class A*,6,7 | | | 2,400 | | | | (68,592 | ) |
| Equinix, Inc.*,6,7 | | | 1,000 | | | | (79,940 | ) |
| Cree, Inc.*,6,7 | | | 4,000 | | | | (109,840 | ) |
| Total Information Technology | | | | | | | (645,110 | ) |
| FINANCIALS - (10.4)% | | | | | | | | |
| C C Land Holdings Ltd.6,7 | | | 50,000 | | | | (13,945 | ) |
| Franshion Properties China Ltd.6,7 | | | 79,400 | | | | (22,104 | ) |
| Mizuho Trust & Banking | | | | | | | | |
| Company Ltd.*,6,7 | | | 17,700 | | | | (24,682 | ) |
| Aozora Bank Ltd.6,7 | | | 16,300 | | | | (26,250 | ) |
| Monex Group, Inc.6,7 | | | 78 | | | | (27,384 | ) |
| Mizuho Financial Group, Inc.6,7 | | | 11,000 | | | | (45,461 | ) |
| Aeon Mall Company Ltd.6,7 | | | 1,700 | | | | (52,093 | ) |
| PrivateBancorp, Inc. — Class A6,7 | | | 2,390 | | | | (102,770 | ) |
| Erste Group Bank AG6,7 | | | 5,200 | | | | (319,536 | ) |
| Wells Fargo & Co.6,7 | | | 12,384 | | | | (539,689 | ) |
| Total Financials | | | | | | | (1,173,914 | ) |
| HEALTH CARE - (11.9)% | | | | | | | | |
| Sepracor, Inc.*,6,7 | | | 1,400 | | | | (24,500 | ) |
| Exelixis, Inc.*,6,7 | | | 4,500 | | | | (28,845 | ) |
| Savient Pharmaceuticals, Inc.*,6,7 | | | 2,420 | | | | (48,013 | ) |
| Zeltia S.A.*,6,7 | | | 8,000 | | | | (54,559 | ) |
| Intuitive Surgical, Inc.*,6,7 | | | 200 | | | | (56,100 | ) |
| Auxilium Pharmaceuticals, Inc.*,6,7 | | | 1,540 | | | | (56,703 | ) |
| XenoPort, Inc.*,6,7 | | | 1,376 | | | | (63,062 | ) |
| Luminex Corp.*,6,7 | | | 2,500 | | | | (63,725 | ) |
| Regeneron Pharmaceuticals, Inc.*,6,7 | | | 3,180 | | | | (69,038 | ) |
| Vertex Pharmaceuticals, Inc.*,6,7 | | | 2,600 | | | | (71,942 | ) |
| Align Technology, Inc.*,6,7 | | | 6,100 | | | | (74,420 | ) |
| Intercell AG*,6,7 | | | 1,900 | | | | (74,840 | ) |
| Acorda Therapeutics, Inc.*,6,7 | | | 2,800 | | | | (74,900 | ) |
| Rigel Pharmaceuticals, Inc.*,6,7 | | | 3,050 | | | | (78,324 | ) |
| Sequenom, Inc.*,6,7 | | | 3,810 | | | | (78,524 | ) |
| Cepheid, Inc.*,6,7 | | | 5,300 | | | | (81,620 | ) |
| AMAG Pharmaceuticals, Inc.*,6,7 | | | 1,900 | | | | (82,954 | ) |
| Basilea Pharmaceutica6,7 | | | 500 | | | | (83,364 | ) |
| Alnylam Pharmaceuticals, Inc.*,6,7 | | | 2,900 | | | | (85,289 | ) |
| athenahealth, Inc.*,6,7 | | | 2,500 | | | | (89,625 | ) |
| Total Health Care | | | | | | | (1,340,347 | ) |
| CONSUMER DISCRETIONARY - (19.5)% | | | | | | | | |
| Tokyo Broadcasting System | | | | | | | | |
| Holdings, Inc.6,7 | | | 1,300 | | | | (21,836 | ) |
| Genting Singapore plc6,7 | | | 124,900 | | | | (41,123 | ) |
| bwin Interactive Entertainment | | | | | | | | |
| AG*,6,7 | | | 1,600 | | | | (45,582 | ) |
| Bwin.Party Digital Entertainment | | | | | | | | |
| plc*,6,7 | | | 15,200 | | | | (57,210 | ) |
| Focus Media Holding Ltd. | | | | | | | | |
| ADR*,6,7 | | | 2,130 | | | | (63,900 | ) |
| Sky Deutschland AG*,6,7 | | | 4,000 | | | | (65,668 | ) |
| Marui Group Company Ltd.6,7 | | | 29,100 | | | | (219,527 | ) |
| See Notes to Financial Statements. | the GUGGENHEIM FUNDS annual report | 63 |
| SCHEDULE OF INVESTMENTS (concluded) | September 30, 2013 |
| ALPHA OPPORTUNITY FUND | |
| | | Shares | | | Value | |
| | | | | | | |
| Pool Corp.6,7 | | | 11,639 | | | $ | (288,065 | ) |
| Electrolux AB6,7 | | | 30,100 | | | | (395,761 | ) |
| Brisa Auto-Estradas de Portugal | | | | | | | | |
| S.A.*,6,7 | | | 44,400 | | | | (461,804 | ) |
| Volkswagen AG6,7 | | | 1,300 | | | | (539,374 | ) |
| Total Consumer Discretionary | | | | | | | (2,199,850 | ) |
| Total Common Stock Sold Short | | | | | | | | |
| (Proceeds $7,164,435) | | | | | | | (7,341,377 | ) |
| Total Securities Sold Short - (65.1)% | | | | | | | | |
| (Proceeds $7,164,435) | | | | | | $ | (7,341,377 | ) |
| Other Assets & Liabilities, net - 46.0% | | | | | | | 5,186,871 | |
| Total Net Assets - 100.0% | | | | | | $ | 11,270,197 | |
| | | | | | | | | |
| | | | | | | | Unrealized | |
| | | | Contracts | | | | Gain | |
| EQUITY FUTURES CONTRACTS SOLD SHORT† | | | | | | | | |
| December 2013 S&P 500 Index | | | | | | | | |
| Mini Futures Contracts | | | | | | | | |
| (Aggregate Value of | | | | | | | | |
| Contracts $1,257,375) | | | 15 | | | $ | 27,021 | |
| * | Non-income producing security. |
| † | Value determined based on Level 1 inputs — See Note 4. |
| †† | Value determined based on Level 2 inputs — See Note 4. |
| ††† | Value determined based on Level 3 inputs — See Note 4. |
| 1 | All or a portion of this security is pledged as short security collateral at September 30, 2013. |
| 2 | All or a portion of the security is deemed illiquid due to the Fund’s exposure to Lehman Brothers International Europe (“LBIE”) prime brokerage services. The total market value of illiquid securities is $10,592,103 (cost $7,135,003), or 94.0% of total net assets. The security was deemed liquid at the time of purchase. |
| 3 | The issuer operates under a Congressional charter; its securities are neither issued nor guaranteed by the U.S. Government. |
| 4 | On September 7, 2008, the issuer was placed in conservatorship by the Federal Housing Finance Agency (FHFA). As conservator, the FHFA has full powers to control the assets and operations of the firm. |
| 5 | Repurchase Agreement — See Note 5. |
| 6 | All or a portion of this security was fair valued by the Valuation Committee at September 30, 2013. The total market value of fair valued securities amounts to $(7,341,377) (proceeds $7,164,435), or (65.1%) of total net assets. |
ADR — American Depositary Receipt
plc — Public Limited Company
| 64 | the GUGGENHEIM FUNDS annual report | See Notes to Financial Statements. |
STATEMENT OF ASSETS
AND LIABILITIES
September 30, 2013
| Assets: | | | | |
| Investments, at value | | | | |
| (cost $7,659,550) | | $ | 11,116,705 | |
| Repurchase agreements, at value | | | | |
| (cost $2,307,998) | | | 2,307,998 | |
| Total investments | | | | |
| (cost $9,967,548) | | | 13,424,703 | |
| Restricted cash denominated in a foreign currency, at value | | | | |
| (cost $3,407,293)† | | | 3,509,013 | |
| Restricted cash† | | | 1,960,582 | |
| Segregated cash with broker | | | 52,500 | |
| Prepaid expenses | | | 6,125 | |
| Receivables: | | | | |
| Dividends | | | 22,066 | |
| Investment advisor | | | 12,801 | |
| Variation margin | | | 7,425 | |
| Foreign taxes reclaim | | | 216 | |
| Total assets | | | 18,995,431 | |
| Liabilities: | | | | |
| Securities sold short, at value | | | | |
| (proceeds $7,164,435)† | | | 7,341,377 | |
| Accrued Lehman settlement costs† | | | 274,670 | |
| Overdraft due to custodian bank | | | 26,878 | |
| Payable for: | | | | |
| Management fees | | | 11,619 | |
| Distribution and service fees | | | 3,068 | |
| Transfer agent/maintenance fees | | | 2,845 | |
| Fund accounting/administration fees | | | 2,055 | |
| Fund shares redeemed | | | 295 | |
| Directors’ fees* | | | 187 | |
| Miscellaneous | | | 62,240 | |
| Total liabilities | | | 7,725,234 | |
| Net assets | | $ | 11,270,197 | |
| Net assets consist of: | | | | |
| Paid in capital | | $ | 18,260,879 | |
| Undistributed net investment income | | | 34,046 | |
| Accumulated net realized loss on investments | | | (10,159,012 | ) |
| Net unrealized appreciation on investments and foreign currency | | | 3,134,284 | |
| Net assets | | $ | 11,270,197 | |
| A-Class: | | | | |
| Net assets | | $ | 7,749,128 | |
| Capital shares outstanding | | | 477,854 | |
| Net asset value per share | | $ | 16.22 | |
| Maximum offering price per share | | | | |
| (Net asset value divided by 95.25%) | | $ | 17.03 | |
| B-Class: | | | | |
| Net assets | | $ | 575,613 | |
| Capital shares outstanding | | | 39,060 | |
| Net asset value per share | | $ | 14.74 | |
| C-Class: | | | | |
| Net assets | | $ | 1,205,722 | |
| Capital shares outstanding | | | 81,785 | |
| Net asset value per share | | $ | 14.74 | |
| Institutional Class: | | | | |
| Net assets | | $ | 1,739,734 | |
| Capital shares outstanding | | | 77,063 | |
| Net asset value per share | | $ | 22.58 | |
STATEMENT OF
OPERATIONS
Year Ended September 30, 2013
| Investment Income: | | | | |
| Dividends (net of foreign withholding tax of $8) | | $ | 253,779 | |
| Interest | | | 674 | |
| Total investment income | | | 254,453 | |
| | | | | |
| Expenses: | | | | |
| Management fees | | | 136,449 | |
| Transfer agent/maintenance fees: | | | | |
| A-Class | | | 19,081 | |
| B-Class | | | 3,813 | |
| C-Class | | | 5,067 | |
| Institutional Class | | | 2,773 | |
| Distribution and service fees: | | | | |
| A-Class | | | 18,361 | |
| B-Class | | | 6,194 | |
| C-Class | | | 13,449 | |
| Fund accounting/administration fees | | | 25,056 | |
| Legal fees | | | 82,867 | |
| Custodian fees | | | 51,101 | |
| Registration fees | | | 28,711 | |
| Professional fees | | | 23,486 | |
| Prime broker interest expense | | | 2,186 | |
| Short sales dividend expense | | | 997 | |
| Directors’ fees* | | | 898 | |
| Tax expense | | | 216 | |
| Miscellaneous | | | 27,889 | |
| Total expenses | | | 448,594 | |
| Less: | | | | |
| Expenses waived/reimbursed by Advisor | | | (204,142 | ) |
| Net expenses | | | 244,452 | |
| Net investment income | | | 10,001 | |
| | | | | |
| Net Realized and Unrealized Gain (Loss): | | | | |
| Net realized gain (loss) on: | | | | |
| Investments | | | 962,380 | |
| Futures contracts | | | 136,934 | |
| Foreign currency | | | 26,295 | |
| Securities sold short | | | (674,235 | ) |
| Net realized gain | | | 451,374 | |
| Net change in unrealized appreciation (depreciation) on: | | | | |
| Investments | | | 2,027,269 | |
| Securities sold short | | | (272,556 | ) |
| Futures contracts | | | 34,281 | |
| Foreign currency | | | (118,479 | ) |
| Net change in unrealized appreciation (depreciation) | | | 1,670,515 | |
| Net realized and unrealized gain | | | 2,121,889 | |
| Net increase in net assets resulting from operations | | $ | 2,131,890 | |
| † | This amount represents values related to Lehman Brothers International Europe prime brokerage services — See Note 11. |
| * | Relates to Directors not deemed “interested persons” within the meaning of Section 2(a)(19) of the 1940 Act. |
| See Notes to Financial Statements. | the GUGGENHEIM FUNDS annual report | 65 |
| ALPHA OPPORTUNITY FUND |
| |
| STATEMENTS OF CHANGES IN NET ASSETS |
| | | Year Ended | | | Year Ended | |
| | | September 30, | | | September 30, | |
| | | 2013 | | | 2012 | |
| | | | | | | | | |
| Increase (Decrease) In Net Assets From Operations: | | | | | | | | |
| Net investment income (loss) | | $ | 10,001 | | | $ | (14,498 | ) |
| Net realized gain on investments and foreign currency | | | 451,374 | | | | 1,104,297 | |
| Net change in unrealized appreciation (depreciation) on investments and foreign currency | | | 1,670,515 | | | | 2,273,155 | |
| Net increase from payments by affiliates | | | — | | | | 32,436 | |
| Net increase in net assets resulting from operations | | | 2,131,890 | | | | 3,395,390 | |
| | | | | | | | | |
| Capital share transactions: | | | | | | | | |
| Proceeds from sale of shares | | | | | | | | |
| A-Class* | | | 135,514 | �� | | | 117,674 | |
| Cost of shares redeemed | | | | | | | | |
| A-Class | | | (1,083,609 | ) | | | (1,836,212 | ) |
| B-Class | | | (267,677 | ) | | | (184,593 | ) |
| C-Class | | | (541,551 | ) | | | (233,428 | ) |
| Institutional Class | | | (101,940 | ) | | | (280,860 | ) |
| Net decrease from capital share transactions | | | (1,859,263 | ) | | | (2,417,419 | ) |
| Net increase in net assets | | | 272,627 | | | | 977,971 | |
| | | | | | | | | |
| Net assets: | | | | | | | | |
| Beginning of year | | | 10,997,570 | | | | 10,019,599 | |
| End of year | | $ | 11,270,197 | | | $ | 10,997,570 | |
| Undistributed (Accumulated) net investment income (loss) at end of year | | $ | 34,046 | | | $ | (8,549 | ) |
| | | | | | | | | |
| Capital share activity: | | | | | | | | |
| Shares sold | | | | | | | | |
| A-Class* | | | 9,453 | | | | 9,664 | |
| Shares redeemed | | | | | | | | |
| A-Class | | | (75,328 | ) | | | (148,801 | ) |
| B-Class | | | (20,963 | ) | | | (16,395 | ) |
| C-Class | | | (40,755 | ) | | | (19,960 | ) |
| Institutional Class | | | (4,934 | ) | | | (16,012 | ) |
| Net decrease in shares | | | (132,527 | ) | | | (191,504 | ) |
* Represents conversion of B-Class to A-Class shares.
| 66 | the GUGGENHEIM FUNDS annual report | See Notes to Financial Statements. |
| ALPHA OPPORTUNITY FUND |
| |
| FINANCIAL HIGHLIGHTS |
This table is presented to show selected data for a share outstanding throughout each period and to assist shareholders in evaluating a Fund’s performance for the periods presented.
| | | Year Ended | | | Year Ended | | | Year Ended | | | Year Ended | | | Year Ended | |
| | | September 30, | | | September 30, | | | September 30, | | | September 30, | | | September 30, | |
| A-Class | | | 2013 | | | | 2012 | | | | 2011 | | | | 2010 | | | | 2009 | |
| Per Share Data | | | | | | | | | | | | | | | | | | | | |
| Net asset value, beginning of period | | $ | 13.33 | | | $ | 9.82 | | | $ | 9.70 | | | $ | 8.56 | | | $ | 9.37 | |
| Income (loss) from investment operations: | | | | | | | | | | | | | | | | | | | | |
| Net investment income (loss)a | | | .03 | | | | (— | )b | | | (.04 | ) | | | (.06 | ) | | | (.04 | ) |
| Net gain (loss) on investments (realized and unrealized) | | | 2.86 | | | | 3.48 | | | | .16 | | | | 1.20 | | | | (.77 | ) |
| Net increase from payments by affiliates | | | — | | | | 0.03 | f | | | — | | | | — | | | | — | |
| Total from investment operations | | | 2.89 | | | | 3.51 | | | | .12 | | | | 1.14 | | | | (.81 | ) |
| Net asset value, end of period | | $ | 16.22 | | | $ | 13.33 | | | $ | 9.82 | | | $ | 9.70 | | | $ | 8.56 | |
| | | | | | | | | | | | | | | | | | | | | |
| Total Returnc | | | 21.38 | % | | | 35.74 | % | | | 1.13 | % | | | 13.43 | % | | | (8.64 | %) |
| Ratios/Supplemental Data | | | | | | | | | | | | | | | | | | | | |
| Net assets, end of period (in thousands) | | $ | 7,749 | | | $ | 7,250 | | | $ | 6,708 | | | $ | 8,138 | | | $ | 9,752 | |
| Ratios to average net assets: | | | | | | | | | | | | | | | | | | | | |
| Net investment income (loss) | | | 0.19 | % | | | (0.01 | %) | | | (0.33 | %) | | | (0.71 | %) | | | (0.50 | %) |
| Total expenses | | | 3.99 | % | | | 2.99 | % | | | 3.39 | % | | | 3.51 | % | | | 3.82 | % |
| Net expensesd,g | | | 2.14 | % | | | 2.21 | % | | | 2.15 | % | | | 2.21 | % | | | 2.00 | % |
| Portfolio turnover rate | | | 488 | % | | | 707 | % | | | 868 | % | | | 954 | % | | | 422 | % |
| | | Year Ended | | | Year Ended | | | Year Ended | | | Year Ended | | | Year Ended | |
| | | September 30, | | | September 30, | | | September 30, | | | September 30, | | | September 30, | |
| B-Class | | 2013 | | | 2012 | | | 2011 | | | 2010 | | | 2009 | |
| Per Share Data | | | | | | | | | | | | | | | | | | | | |
| Net asset value, beginning of period | | $ | 12.21 | | | $ | 9.07 | | | $ | 9.03 | | | $ | 8.04 | | | $ | 8.87 | |
| Income (loss) from investment operations: | | | | | | | | | | | | | | | | | | | | |
| Net investment lossa | | | (.07 | ) | | | (.09 | ) | | | (.12 | ) | | | (.12 | ) | | | (.09 | ) |
| Net gain (loss) on investments (realized and unrealized) | | | 2.60 | | | | 3.21 | | | | .16 | | | | 1.11 | | | | (.74 | ) |
| Net increase from payments by affiliates | | | — | | | | 0.02 | f | | | — | | | | — | | | | — | |
| Total from investment operations | | | 2.53 | | | | 3.14 | | | | .04 | | | | .99 | | | | (.83 | ) |
| Net asset value, end of period | | $ | 14.74 | | | $ | 12.21 | | | $ | 9.07 | | | $ | 9.03 | | | $ | 8.04 | |
| | | | | | | | | | | | | | | | | | | | | |
| Total Returnc | | | 20.39 | % | | | 34.62 | % | | | 0.44 | % | | | 12.31 | % | | | (9.36 | %) |
| Ratios/Supplemental Data | | | | | | | | | | | | | | | | | | | | |
| Net assets, end of period (in thousands) | | $ | 576 | | | $ | 733 | | | $ | 693 | | | $ | 1,161 | | | $ | 1,635 | |
| Ratios to average net assets: | | | | | | | | | | | | | | | | | | | | |
| Net investment loss | | | (0.55 | %) | | | (0.77 | %) | | | (1.09 | %) | | | (1.47 | %) | | | (1.24 | %) |
| Total expenses | | | 5.06 | % | | | 3.87 | % | | | 4.19 | % | | | 4.27 | % | | | 4.57 | % |
| Net expensesd,g | | | 2.88 | % | | | 2.96 | % | | | 2.90 | % | | | 2.96 | % | | | 2.75 | % |
| Portfolio turnover rate | | | 488 | % | | | 707 | % | | | 868 | % | | | 954 | % | | | 422 | % |
| See Notes to Financial Statements. | the GUGGENHEIM FUNDS annual report | 67 |
| ALPHA OPPORTUNITY FUND |
| |
| FINANCIAL HIGHLIGHTS (concluded) |
This table is presented to show selected data for a share outstanding throughout each period and to assist shareholders in evaluating a Fund’s performance for the periods presented.
| | | Year Ended | | | Year Ended | | | Year Ended | | | Year Ended | | | Year Ended | |
| | | September 30, | | | September 30, | | | September 30, | | | September 30, | | | September 30, | |
| C-Class | | 2013 | | | 2012 | | | 2011 | | | 2010 | | | 2009 | |
| Per Share Data | | | | | | | | | | | | | | | | | | | | |
| Net asset value, beginning of period | | $ | 12.21 | | | $ | 9.07 | | | $ | 9.03 | | | $ | 8.02 | | | $ | 8.87 | |
| Income (loss) from investment operations: | | | | | | | | | | | | | | | | | | | | |
| Net investment lossa | | | (.07 | ) | | | (.09 | ) | | | (.11 | ) | | | (.12 | ) | | | (.09 | ) |
| Net gain (loss) on investments (realized and unrealized) | | | 2.60 | | | | 3.21 | | | | .15 | | | | 1.13 | | | | (.76 | ) |
| Net increase fro m payments by affiliates | | | — | | | | 0.02 | f | | | — | | | | — | | | | — | |
| Total from investment operations | | | 2.53 | | | | 3.14 | | | | .04 | | | | 1.01 | | | | (.85 | ) |
| Net asset value, end of period | | $ | 14.74 | | | $ | 12.21 | | | $ | 9.07 | | | $ | 9.03 | | | $ | 8.02 | |
| | | | | | | | | | | | | | | | | | | | | |
| Total Returnc | | | 20.48 | % | | | 34.62 | % | | | 0.44 | % | | | 12.59 | % | | | (9.58 | %) |
| Ratios/Supplemental Data | | | | | | | | | | | | | | | | | | | | |
| Net assets, end of period (in thousands) | | $ | 1,206 | | | $ | 1,497 | | | $ | 1,292 | | | $ | 1,490 | | | $ | 1,996 | |
| Ratios to average net assets: | | | | | | | | | | | | | | | | | | | | |
| Net investment loss | | | (0.56 | %) | | | (0.76 | %) | | | (1.08 | %) | | | (1.46 | %) | | | (1.24 | %) |
| Total expenses | | | 4.84 | % | | | 3.80 | % | | | 4.14 | % | | | 4.28 | % | | | 4.67 | % |
| Net expensesd,g | | | 2.89 | % | | | 2.96 | % | | | 2.90 | % | | | 2.95 | % | | | 2.75 | % |
| Portfolio turnover rate | | | 488 | % | | | 707 | % | | | 868 | % | | | 954 | % | | | 422 | % |
| | | Year Ended | | | Year Ended | | | Year Ended | | | Year Ended | | | Period Ended | |
| | | September 30, | | | September 30, | | | September 30, | | | September 30, | | | September 30, | |
| Institutional Class | | 2013 | | | 2012 | | | 2011 | | | 2010 | | | 2009e | |
| Per Share Data | | | | | | | | | | | | | | | | | | | | |
| Net asset value, beginning of period | | $ | 18.52 | | | $ | 13.53 | | | $ | 13.33 | | | $ | 11.73 | | | $ | 10.00 | |
| Income (loss) from investment operations: | | | | | | | | | | | | | | | | | | | | |
| Net investment income (loss)a | | | .09 | | | | .04 | | | | (.01 | ) | | | (.06 | ) | | | (.01 | ) |
| Net gain on investments (realized and unrealized) | | | 3.97 | | | | 4.82 | | | | .21 | | | | 1.66 | | | | 1.74 | |
| Net increase from payments by affiliates | | | — | | | | 0.13 | f | | | — | | | | — | | | | — | |
| Total from investment operations | | | 4.06 | | | | 4.99 | | | | .20 | | | | 1.60 | | | | 1.73 | |
| Net asset value, end of period | | $ | 22.58 | | | $ | 18.52 | | | $ | 13.53 | | | $ | 13.33 | | | $ | 11.73 | |
| | | | | | | | | | | | | | | | | | | | | |
| Total Returnc | | | 21.60 | % | | | 36.88 | % | | | 1.50 | % | | | 13.64 | % | | | 17.30 | % |
| Ratios/Supplemental Data | | | | | | | | | | | | | | | | | | | | |
| Net assets, end of period (in thousands) | | $ | 1,740 | | | $ | 1,518 | | | $ | 1,326 | | | $ | 1,444 | | | $ | 2,155 | |
| Ratios to average net assets: | | | | | | | | | | | | | | | | | | | | |
| Net investment income (loss) | | | 0.43 | % | | | 0.24 | % | | | (0.08 | %) | | | (0.48 | %) | | | (0.07 | %) |
| Total expenses | | | 3.67 | % | | | 2.68 | % | | | 3.12 | % | | | 3.28 | % | | | 3.94 | % |
| Net expensesd,g | | | 1.90 | % | | | 1.96 | % | | | 1.90 | % | | | 1.96 | % | | | 1.76 | % |
| Portfolio turnover rate | | | 488 | % | | | 707 | % | | | 868 | % | | | 954 | % | | | 422 | % |
| a | Net investment income (loss) per share was computed using average shares outstanding throughout the period. |
| b | Net investment income is less than $0.01 per share. |
| c | Total return does not reflect the impact of any applicable sales charges and has not been annualized. |
| d | Net expense information reflects the expense ratios after expense waivers and may include interest or dividend expense. |
| e | Since commencement of operations: November 7, 2008. Percentage amounts for the period, except total return and portfolio turnover rate, have been annualized. |
| f | For the year ended September 30, 2012, 0.30%, 0.22%, 0.22% and 0.96% of the Fund’s A-Class, B-Class, C-Class and Institutional Class, respectively, total return consisted of a voluntary reimbursement by the advisor for losses incurred during fund trading. Excluding this item, total return would have been 35.44%, 34.40%, 34.40% and 35.92% for the Fund’s A-Class, B-Class, C-Class and Institutional Class, respectively. |
| g | Excluding interest and dividend expense, the operating expense ratios for the years presented would be: |
| | | 09/30/13 | | | 09/30/12 | | | 09/30/11 | | | 09/30/10 | | | 09/30/09 | |
| A-Class | | | 2.11 | % | | | 2.11 | % | | | 2.11 | % | | | 2.05 | % | | | 1.95 | % |
| B-Class | | | 2.85 | % | | | 2.86 | % | | | 2.86 | % | | | 2.80 | % | | | 2.69 | % |
| C-Class | | | 2.86 | % | | | 2.86 | % | | | 2.86 | % | | | 2.80 | % | | | 2.69 | % |
| Institutional Class | | | 1.86 | % | | | 1.86 | % | | | 1.86 | % | | | 1.80 | % | | | 1.70 | % |
| 68 | the GUGGENHEIM FUNDS annual report | See Notes to Financial Statements. |
| NOTES TO FINANCIAL STATEMENTS |
1. Organization and Significant Accounting Policies
Organization
Security Equity Fund (the “Trust”), is registered with the SEC under the Investment Company Act of 1940 (“1940 Act”), as a non-diversified, open-ended investment company of the series type. Each series, in effect, is representing a separate Fund. The Trust is authorized to issue an unlimited number of shares. The Trust accounts for the assets of each Fund separately.
The Trust offers a combination of four separate classes of shares, A-Class shares, B-Class shares, C-Class shares and Institutional Class shares. Sales of shares of each Class are made without a front-end sales charge at the net asset value per share (“NAV”), with the exception of A-Class shares. A-Class shares are sold at the NAV, plus the applicable front-end sales charge. The sales charge varies depending on the amount purchased, but will not exceed 4.75%. Prior to February 22, 2011, the maximum sales charge was 5.75%. A-Class share purchases of $1 million or more are exempt from the front-end sales charge but have a 1% contingent deferred sales charge (“CDSC”), if shares are redeemed within 12 months of purchase. B-Class shares were offered without a front-end sales charge, but were subject to a CDSC of up to 5% for five years and convert to A-Class shares after eight years. Effective January 4, 2010, subscriptions for B-Class shares are no longer accepted. C-Class shares have a 1% CDSC if shares are redeemed within 12 months of purchase. Institutional Class shares are offered primarily for direct investment by institutions such as pension and profit sharing plans, endowments, foundations and corporations. Institutional Class shares have a minimum initial investment of $2 million and a minimum account balance of $1 million. Institutional Class shares are offered without a front-end sales charge or a CDSC.
At September 30, 2013, the Trust consisted of seven separate funds (the “Funds”).
Guggenheim Investments (“GI”) provides advisory services to the Funds. Rydex Fund Services, LLC (“RFS”) acts as the transfer agent and provides administrative and accounting services to the Funds. Guggenheim Distributors, LLC (“GDL”) acts as principal underwriter to the Funds. GI, RFS and GDL are affiliated entities.
Prior to September 30, 2013, Mainstream Investment Advisers, LLC (“Mainstream”) acted as sub-adviser to Alpha Opportunity Fund. Pursuant to an investment sub-advisory agreement, Mainstream furnished investment advisory services, supervised and arranged for the purchase and sale of securities on behalf of a portion of the assets of Alpha Opportunity Fund and provided for the compilation and maintenance of records pertaining to such investment advisory services, subject to the control and supervision of the Fund’s Board of Directors and the Investment Manager. For such services, the Investment Manager paid Mainstream an annual fee equal to 1.45% of that portion of Alpha Opportunity Fund’s average daily net assets managed by Mainstream. Effective September 30, 2013, Mainstream resigned as sub-adviser to Alpha Opportunity Fund and the Investment Manager assumed all advisory obligations and responsibilities.
Significant Accounting Policies
The following significant accounting policies are in conformity with U.S. generally accepted accounting principles (“U.S. GAAP”) and are consistently followed by the Trust. This requires management to make estimates and assumptions that affect the reported amount of assets and liabilities and disclosure of contingent assets and liabilities at the date of the financial statements and the reported amounts of revenues and expenses during the reporting period. Actual results could differ from these estimates. All time references are based on Eastern Time.
A. Valuations of the Funds’ securities are supplied primarily by pricing services approved by the Board of Directors. The Trust’s officers, through the Valuation Committee under the general supervision of the Board of Directors, regularly review procedures used by, and valuations provided by, the pricing services.
Equity securities listed on an exchange (New York Stock Exchange (“NYSE”) or American Stock Exchange) are valued at the last quoted sales price as of the close of business on the NYSE, usually 4:00 p.m. on the valuation date. Equity securities listed on the NASDAQ market system are valued at the NASDAQ Official Closing Price on the valuation date, which may not necessarily represent the last sale price. If there has been no sale on such exchange or NASDAQ on such day, the security is valued at the closing bid price on such day.
Open-end investment companies (“Mutual Funds”) are valued at their NAV as of the close of business on the valuation date. Exchange Traded Funds (“ETFs”) and closed-end investment companies are valued at the last quoted sales price.
Debt securities with a maturity of greater than 60 days at acquisition are valued at prices that reflect broker/dealer supplied valuations or are obtained from independent pricing services, which may consider the trade activity, treasury spreads, yields or price of bonds of comparable quality, coupon, maturity, and type, as well as prices quoted by dealers who make markets in such securities. Short-term debt securities with a maturity of 60 days or less at acquisition and repurchase agreements are valued at amortized cost, which approximates market value.
| THE GUGGENHEIM FUNDS ANNUAL REPORT | 69 |
| NOTES TO FINANCIAL STATEMENTS (continued) |
Listed options are valued at the Official Settlement Price listed by the exchange, usually as of 4:00 p.m. Long options are valued using the bid price and short options are valued using the ask price. In the event that a settlement price is not available, fair valuation is enacted. Over-the-counter options are valued using the average bid price (for long options), or average ask price (for short options) obtained from one or more security dealers.
Premiums received from options written are entered in the Fund’s accounting records as an asset and equivalent liability. The amount of the liability is subsequently marked-to-market to reflect the current value of the option written. When an option written expires, or if a Fund enters into a closing purchase transaction, it realizes a gain (or loss if the cost of a closing purchase transaction exceeds the premium received when the option was sold).
The senior floating rate interests (loans) in which certain Funds invest are not listed on any securities exchange or board of trade. Accordingly, determinations of the value of loans may be based on infrequent and dated trades. Typically loans are valued using information provided by an independent third party pricing service which uses broker quotes in a non-active market, or price derived from significant observable inputs and is also compared to broker quote (matrixed). If the pricing service cannot or does not provide a valuation for a particular loan or such valuation is deemed unreliable, such loan is fair valued by the Valuation Committee. In determining fair value, consideration is given to several factors, which may include, among others, one or more of the following: the fundamental business data relating to the issuer or borrower; an evaluation of the forces which influence the market in which these loans are purchased and sold; type of holding; financial statements of the borrower; cost at date of purchase; size of holding; credit worthiness and cash flow of issuer; information as to any transactions in, or offers for, the holding; price and extent of public trading in similar securities (or equity securities) of the issuer/borrower, or comparable companies; coupon payments; quality, value and salability of collateral securing the loan; business prospects of the issuer/borrower, including any ability to obtain money or resources from a parent or affiliate; the portfolio manager’s and/or the market’s assessment of the borrower’s management; prospects for the borrower’s industry, and multiples (of earnings and/or cash flow) being paid for similar businesses in that industry; borrower’s competitive position within the industry; borrower’s ability to access additional liquidity through public and/or private markets; and other relevant factors.
The value of futures contracts is accounted for using the unrealized gain or loss on the contracts that is determined by marking the contracts to their current realized settlement prices. Financial futures contracts are valued at the 4:00 p.m. price on the valuation date. In the event that the exchange for a specific futures contract closes earlier than 4:00 p.m., the futures contract is valued at the Official Settlement Price of the exchange. However, the underlying securities from which the futures contract value is derived are monitored until 4:00 p.m. to determine if fair valuation would provide a more accurate valuation.
The value of equity index swap agreements entered into by a Fund is accounted for using the unrealized gain or loss on the agreements that is determined using the last quoted value of the index that the swap pertains to at the close of the NYSE, adjusted to include dividends accrued, and financing charges and/or interest associated with the swap agreements.
Generally, trading in foreign securities markets is substantially completed each day at various times prior to the close of the NYSE. The values of foreign securities are determined as of the close of such foreign markets or the close of the NYSE, if earlier. All investments quoted in foreign currency are valued in U.S. dollars on the basis of the foreign currency exchange rates prevailing at the close of business. Investments in foreign securities may involve risks not present in domestic investments. The Valuation Committee will determine the current value of such foreign securities by taking into consideration certain factors which may include those discussed above, as well as the following factors, among others: the value of the securities traded on other foreign markets, ADR trading, closed-end fund trading, foreign currency exchange activity, and the trading prices of financial products that are tied to foreign securities such as World Equity Benchmark Securities. In addition, the Board of Directors has authorized the Valuation Committee and GI to use prices and other information supplied by a third party pricing vendor in valuing foreign securities.
Investments for which market quotations are not readily available are fair valued as determined in good faith by GI under the direction of the Board of Directors using methods established or ratified by the Board of Directors. These methods include, but are not limited to: (i) obtaining general information as to how these securities and assets trade; (ii) in connection with futures contracts and options thereupon, and other derivative investments, obtaining information as to how (a) these contracts and other derivative investments trade in the futures or other derivative markets, respectively, and (b) the securities underlying these contracts and other derivative investments trade in the cash market; and (iii) obtaining other information and considerations, including current values in related markets.
| 70 | THE GUGGENHEIM FUNDS ANNUAL REPORT |
| NOTES TO FINANCIAL STATEMENTS (continued) |
B. Senior loans in which the Funds invest generally pay interest rates which are periodically adjusted by reference to a base short-term, floating rate plus a premium. These base lending rates are generally (I) the lending rate offered by one or more major European banks, such as the London Inter-Bank Offered Rate (LIBOR), (ii) the prime rate offered by one or more major United States banks, or (iii) the bank’s certificate of deposit rate. Senior floating rate interests often require prepayments from excess cash flows or permit the borrower to repay at its election. The rate at which the borrower repays cannot be predicted with accuracy. As a result, the actual remaining maturity may be substantially less than the stated maturities shown. The interest rate indicated is the rate in effect at September 30, 2013.
C. Security transactions are recorded on the trade date for financial reporting purposes. Realized gains and losses from securities transactions are recorded using the identified cost basis. Proceeds from lawsuits related to investment holdings are recorded as realized gains in the respective Fund. Dividend income is recorded on the ex-dividend date, net of applicable taxes withheld by foreign countries. Taxable non-cash dividends are recorded as dividend income. Interest income, including amortization of premiums and accretion of discounts, is accrued on a daily basis. Distributions received from investments in REITs are recorded as dividend income on the ex-dividend date, subject to reclassification upon notice of the character of such distribution by the issuer. Interest income also includes paydown gains and losses on mortgage-backed and asset-backed securities and senior and subordinated loans. Amendment fees are earned as compensation for evaluating and accepting changes to the original loan agreement and are recognized when received.
D. The Funds may purchase and sell interests in securities on a when-issued and delayed delivery basis, with payment and delivery scheduled for a future date. No income accrues to the Fund on such interests or securities in connection with such transactions prior to the date the Funds actually take delivery of such interests or securities. These transactions are subject to market fluctuations and are subject to the risk that the value at delivery may be more or less than the trade date purchase price. Although the Funds will generally purchase these securities with the intention of acquiring such securities, they may sell such securities before the settlement date.
E. The accounting records of the Fund are maintained in U.S. dollars. All assets and liabilities initially expressed in foreign currencies are converted into U.S. dollars at prevailing exchange rates. Purchases and sales of investment securities, dividend and interest income, and certain expenses are translated at the rates of exchange prevailing on the respective dates of such transactions. Changes in the relationship of these foreign currencies to the U.S. dollar can significantly affect the value of the investments and earnings of the Funds. Foreign investments may also subject the Funds to foreign government exchange restrictions, expropriation, taxation or other political, social or economic developments, all of which could affect the market and/or credit risk of the investments.
The Funds do not isolate that portion of the results of operations resulting from changes in the foreign exchange rates on investments from the fluctuations arising from changes in the market prices of securities held. Such fluctuations are included with the net realized and unrealized gain or loss on investments.
Reported net realized foreign exchange gains and losses arise from sales of foreign currencies and currency gains or losses realized between the trade and settlement dates on investment transactions. Net unrealized exchange gains and losses arise from changes in the fair values of assets and liabilities other than investments in securities at the fiscal period end, resulting from changes in exchange rates.
F. Dividends from net investment income are declared quarterly in the World Equity Income Fund. Distributions of net investment income in the remaining Funds and distributions of net realized gains, if any, are declared at least annually and recorded on the ex-dividend date and are determined in accordance with income tax regulations which may differ from U.S. GAAP. Dividends are reinvested in additional shares unless shareholders request payment in cash.
G. When a Fund engages in a short sale of a security, an amount equal to the proceeds is reflected as an asset and an equivalent liability. The amount of the liability is subsequently marked-to-market to reflect the market value of the short sale. The Fund maintains a segregated account of cash and/or securities as collateral for short sales.
Fees, if any, paid to brokers to borrow securities in connection with short sales are recorded as interest expense. In addition, the Fund must pay out the dividend rate of the equity or coupon rate of the treasury obligation to the lender and record this as an expense. Short dividend or interest expense is a cost associated with the investment objective of short sales transactions, rather than an operational cost associated with the day-to-day management of any mutual fund. The Funds may also receive rebate income from the broker resulting from the investment of the proceeds from securities sold short.
| THE GUGGENHEIM FUNDS ANNUAL REPORT | 71 |
| NOTES TO FINANCIAL STATEMENTS (continued) |
H. Upon entering into a futures contract, a Fund deposits and maintains as collateral such initial margin as required by the exchange on which the transaction is affected. Pursuant to the contract, the Fund agrees to receive from or pay to the broker an amount of cash equal to the daily fluctuation in value of the contract. Such receipts or payments are known as variation margin and are recorded by the Fund as unrealized gains or losses. When the contract is closed, the Fund records a realized gain or loss equal to the difference between the value of the contract at the time it was opened and the value at the time it was closed.
I. Swap agreements are marked-to-market daily and the change, if any, is recorded as unrealized gain or loss. Payments received or made as a result of an agreement or termination of the agreement are recognized as realized gains or losses.
J. Interest and dividend income, most expenses, all realized gains and losses, and all unrealized gains and losses are allocated to the classes based upon the value of the outstanding shares in each class. Certain costs, such as distribution and service fees relating to A-Class shares, B-Class shares and C-Class shares and transfer agent fees related to each class, are charged directly to specific classes. In addition, other expenses common to various funds within the fund complex are generally allocated amongst such funds on the basis of average net assets.
K. Under the fee arrangement with the custodian, the Funds may earn credits based on overnight custody cash balances. These credits are utilized to reduce related custodial expenses. The custodian fees disclosed in the Statements of Operations are before the reduction in expense from the related earnings credits, if any. For the year ended September 30, 2013, there were no earnings credits received.
L. The Funds may leave cash overnight in their cash account with the custodian. Periodically, a Fund may have cash due to the custodian bank as an overdraft balance. A fee is incurred on this overdraft, calculated by multiplying the overdraft by a rate based on the federal funds rate. Segregated cash with the broker is held as collateral for investments in derivative instruments such as futures contracts or swap agreements.
M. Under the Funds’ organizational documents, its officers and directors are indemnified against certain liabilities arising out of the performance of their duties to the Trust. In addition, throughout the normal course of business, the Funds enter into contracts that contain a variety of representations and warranties which provide general indemnifications. The Funds’ maximum exposure under these arrangements is unknown, as this would involve future claims that may be made against the Funds and/or their affiliates that have not yet occurred. However, based on experience, the Funds expect the risk of loss to be remote.
2. Financial Instruments
As part of their investment strategy, certain Funds utilize short sales and a variety of derivative instruments including futures, options and swap agreements. These investments involve, to varying degrees, elements of market risk and risks in excess of the amounts recognized in the Statements of Assets and Liabilities.
Alpha Opportunity Fund may make short sales “against the box,” in which the Fund enters into a short sale of a security it owns. At no time will more than 15% of the value of the Fund’s net assets be in deposits on short sales against the box. When a Fund makes a short sale, the Fund does not immediately deliver the securities sold from its own account, or receive the proceeds from the sale. To complete the sale, the Fund must borrow the security (generally from the broker through which the short sale is made) in order to make delivery to the buyer. The Fund must replace the security borrowed by purchasing it at the market price at the time of replacement or delivering the security from its own portfolio. The Fund is said to have a “short position” in securities sold until it delivers them to the broker, at which time it receives the proceeds of the sale. Certain Funds may make short sales that are not “against the box,” which create opportunities to increase the Funds’ return but, at the same time, involve specific risk considerations and may be considered a speculative technique. Such short sales theoretically involve unlimited loss potential, as the market price of securities sold short may continually increase, although a Fund may mitigate such losses by replacing the securities sold short before the market price has increased significantly. Subsequent fluctuations in the market prices of securities sold, but not yet purchased, may require purchasing the securities at prices which differ from the market value reflected on the Statements of Assets and Liabilities. The Funds are liable for any dividends or interest payable on securities while those securities are in a short position. As collateral for its short positions, the Fund is required under the 1940 Act to maintain segregated assets consisting of cash, cash equivalents or liquid securities. These segregated assets are valued consistent with Note 1A and are required to be adjusted daily to reflect changes in the market value of the securities sold short.
The Alpha Opportunity Fund and StylePlus Large Core Fund utilized futures contracts to obtain broad index exposure. A futures contract is an agreement to purchase (long) or sell (short) an agreed amount of securities or other instruments at a set price
| 72 | THE GUGGENHEIM FUNDS ANNUAL REPORT |
| NOTES TO FINANCIAL STATEMENTS (continued) |
for delivery at a future date. There are significant risks associated with a Fund’s or an underlying fund’s use of futures contracts and related options, including (i) there may be an imperfect or no correlation between the changes in market value of the underlying asset and the prices of futures contracts; (ii) there may not be a liquid secondary market for a futures contract; (iii) trading restrictions or limitations may be imposed by an exchange; and (iv) government regulations may restrict trading in futures contracts. When investing in futures, there is minimal counterparty credit risk to the Fund because futures are exchange-traded and the exchange’s clearinghouse, as counterparty to all exchange-traded futures, guarantees against default. Cash deposits are shown as restricted cash on the Statement of Assets and Liabilities; securities held as collateral are noted on the Schedule of Investments.
Certain Funds wrote call options on a covered basis and put options on securities that are traded on recognized securities exchanges and over-the-counter markets. Call and put options on securities give the writer the obligation to sell or purchase a security at a specified price, until a certain date. Options were used minimally to hedge the Funds’ portfolio, to increase returns, to maintain exposure to the equity markets, and create liquidity. The risk in writing a covered call option is that a Fund may forego the opportunity for profit if the market price of the underlying security increases and the option is exercised. The risk in writing a covered put option is that a Fund may incur a loss if the market price of the underlying security decreases and the option is exercised. In addition, there is the risk that a Fund may not be able to enter into a closing transaction because of an illiquid secondary market or, for over-the-counter options, because of the counterparty’s inability to perform.
A swap is an agreement that obligates two parties to exchange a series of cash flows at specified intervals based upon or calculated by reference to changes in specified prices or rates for a specified amount of an underlying asset. A Fund bears the risk of loss of the amount expected to be received under a swap agreement in the event of the default or bankruptcy of a swap agreement counterparty. Additionally, there is no guarantee that a Fund could eliminate its exposure under an outstanding swap agreement by entering into an offsetting swap agreement with the same or another party.
In conjunction with the use of short sales, futures, options and swap agreements, the Funds are required to maintain collateral in various forms. The Funds use, where appropriate, depending on the financial instrument utilized and the broker involved, margin deposits at the broker, cash and/or securities segregated at the custodian bank, discount notes, or the repurchase agreements allocated to each Fund.
The Trust has established counterparty credit guidelines and enters into transactions only with financial institutions of investment grade or better. The Trust monitors the counterparty credit risk.
3. Fees and Other Transactions with Affiliates
Management fees are paid monthly to GI, based on the following annual rates. GI pays the sub-advisor out of the advisory fees it receives.
| | | Management Fees | |
| Fund | | (as a % of net assets) | |
| StylePlus Large Core Fund | | | 0.75 | % |
| Mid Cap Value Fund | | | 0.79 | %1 |
| Mid Cap Value Institutional Fund | | | 0.75 | % |
| Small Cap Value Fund | | | 1.00 | % |
| Enhanced World Equity Fund | | | 0.70 | % |
| World Equity Income Fund | | | 0.70 | % |
| Alpha Opportunity Fund | | | 1.25 | % |
1 Management fees are payable at an annual rate of 1.00% of the average daily net assets of $200 million or less, and 0.75% of the average daily net assets of the Mid Cap Value Fund in excess of $200 million.
RFS acts as the administrative agent for the Funds, and as such performs administrative functions and the bookkeeping, accounting and pricing functions for each Fund. For these services, RFS receives the following:
| | | Fund Accounting/ | |
| | | Administrative Fees | |
| Fund | | (as a % of net assets) | |
| StylePlus Large Core Fund | | | 0.095% | |
| Mid Cap Value Fund | | | 0.095% | |
| Mid Cap Value Institutional Fund | | | 0.095% | |
| Small Cap Value Fund | | | 0.095% | |
| Enhanced World Equity Fund | | | 0.095% | |
| World Equity Income Fund | | | greater of 0.15% or $60,000 | |
| Alpha Opportunity Fund | | | 0.15% | |
| Minimum charge per Fund1 | | | $25,000 | |
| Certain out-of-pocket charges | | | varies | |
RFS is paid the following for providing transfer agent services to the Funds. Effective February 1, 2012, transfer agent fees are assessed to the applicable Class of each Fund in which they were incurred. Prior to February 1, 2012, transfer agent fees were aggregated by the Fund and allocated based on daily net assets of each Class of Fund.
| Annual charge per account | $5.00 – $8.00 |
| Transaction fee | $0.60 – $1.10 |
| Minimum annual charge per Fund1 | $25,000 |
| Certain out-of-pocket charges | varies |
1 Minimum waived for Enhanced World Equity Fund for the first 12 months the Fund is open.
The investment advisory contracts for the following Funds provide that the total expenses be limited to a percentage of average net
| THE GUGGENHEIM FUNDS ANNUAL REPORT | 73 |
| NOTES TO FINANCIAL STATEMENTS (continued) |
assets for each class of shares, exclusive of brokerage costs, dividends on securities sold short, expenses of other investment companies in which a Fund invests, interest, taxes, litigation, indemnification and extraordinary expenses (as determined under U.S. GAAP). The limits are listed below:
| | | | | | Effective | | Contract | |
| Fund | | Limit | | | Date | | End Date | |
| Small Cap Value Fund – A-Class | | | 1.30 | % | | 11/30/12 | | 02/01/14 | |
| Small Cap Value Fund – C-Class | | | 2.05 | % | | 11/30/12 | | 02/01/14 | |
| Small Cap Value Fund – Institutional Class | | | 1.05 | % | | 11/30/12 | | 02/01/14 | |
| Enhanced World Equity Fund – A-Class | | | 1.25 | % | | 06/05/13 | | 07/01/14 | |
| Enhanced World Equity Fund – C-Class | | | 2.00 | % | | 06/05/13 | | 07/01/14 | |
| Enhanced World Equity Fund – Institutional Class | | | 1.00 | % | | 06/05/13 | | 07/01/14 | |
| World Equity Income Fund – A-Class | | | 1.46 | %* | | 08/15/13 | | 09/01/14 | |
| World Equity Income Fund – B-Class | | | 2.21 | %* | | 08/15/13 | | 09/01/14 | |
| World Equity Income Fund – C-Class | | | 2.21 | %* | | 08/15/13 | | 09/01/14 | |
| World Equity Income Fund – Institutional Class | | | 1.21 | %* | | 08/15/13 | | 09/01/14 | |
| Alpha Opportunity Fund – A-Class | | | 2.11 | % | | 11/30/12 | | 02/01/14 | |
| Alpha Opportunity Fund – B-Class | | | 2.86 | % | | 11/30/12 | | 02/01/14 | |
| Alpha Opportunity Fund – C-Class | | | 2.86 | % | | 11/30/12 | | 02/01/14 | |
| Alpha Opportunity Fund – Institutional Class | | | 1.86 | % | | 11/30/12 | | 02/01/14 | |
* Expense Limitation Agreement prior to 08/15/13 for A-Class, B-Class, C-Class and Institutional Class was 1.61%, 2.36%, 2.36% and 1.36%, respectively.
GI is entitled to reimbursement by the Funds for fees waived or expenses reimbursed during any of the previous 36 months, beginning on the date of the expense limitation agreement, if on any day the estimated operating expenses are less than the indicated percentages. At September 30, 2013, the amount of fees waived or expenses reimbursed that are subject to recoupment are presented in the following table:
| | | Expires | | | Expires | | | Expires | | | Fund | |
| Fund | | 2014 | | | 2015 | | | 2016 | | | Total | |
| Mid Cap Value Institutional Fund* | | $ | 443,419 | | | $ | 194,357 | | | $ | — | | | $ | 637,776 | |
| Small Cap Value Fund | | | 118,145 | | | | 175,113 | | | | 175,376 | | | | 468,634 | |
| Enhanced World Equity Fund | | | — | | | | — | | | | 61,313 | | | | 61,313 | |
| World Equity Income Fund | | | 26,732 | | | | 314,425 | | | | 269,453 | | | | 610,610 | |
| Alpha Opportunity Fund | | | 157,924 | | | | 88,316 | | | | 204,142 | | | | 450,382 | |
* Expense Limitation Agreement with a limit of 0.90% has not been renewed for this Fund after 03/31/12.
For the year ended September 30, 2013, no amounts were recouped by GI.
The Funds have adopted Distribution Plans related to the offering of A-Class, B-Class and C-Class shares pursuant to Rule 12b-1 under the 1940 Act. The plans provide for payments at an annual rate of 0.25% of the average daily net assets of each Fund’s A-Class shares and 1.00% of the average daily net assets of each Fund’s B-Class and C-Class shares. Effective August 25, 2005, the World Equity Income Fund ceased charging 12b-1 fees on B-Class shares in accordance with the FINRA sales cap regulations. These fees may be reinstated at any time.
During the year ended September 30, 2013, GDL retained sales charges of $189,463 relating to sales of A-Class shares of the Funds.
Certain officers and directors of the Trust are also officers of GI, RFS and GDL.
| 74 | THE GUGGENHEIM FUNDS ANNUAL REPORT |
| NOTES TO FINANCIAL STATEMENTS (continued) |
4. Fair Value Measurement
In accordance with U.S. GAAP, fair value is defined as the price that the Fund would receive to sell an investment or pay to transfer a liability in an orderly transaction with an independent buyer in the principal market, or in the absence of a principal market the most advantageous market for the investment or liability. A three-tier hierarchy is utilized to distinguish between (1) inputs that reflect the assumptions market participants would use in pricing an asset or liability developed based on market data obtained from sources independent of the reporting entity (observable inputs) and (2) inputs that reflect the reporting entity’s own assumptions about the assumptions market participants would use in pricing an asset or liability developed based on the best information available in the circumstances (unobservable inputs) and to establish classification of fair value measurements for disclosure purposes. Various inputs are used in determining the value of the Funds’ investments. The inputs are summarized in the three broad levels listed below:
Level 1 — quoted prices in active markets for identical securities.
Level 2 — other significant observable inputs (including quoted prices for similar securities, interest rates, prepayment speeds, credit risk, etc.).
Level 3 — significant unobservable inputs (including the fund’s own assumptions used to determine the fair value of investments).
The inputs or methodologies used for valuing securities are not necessarily an indication of the risk associated with investing in those securities.
The following table summarizes the inputs used to value the Funds’ net assets at September 30, 2013:
| | | Level 1 | | | Level 1 | | | Level 2 | | | Level 2 | | | Level 3 | | | | |
| | | Investments | | | Other Financial | | | Investments | | | Other Financial | | | Investments | | | | |
| | | In Securities | | | Instruments* | | | In Securities | | | Instruments* | | | In Securities | | | Total | |
| Assets | | | | | | | | | | | | | | | | | | | | | | | | |
| StylePlus Large Core Fund | | $ | 110,447,003 | | | $ | — | | | $ | 71,742,276 | | | $ | 4,297,408 | | | $ | 847,036 | | | $ | 187,333,723 | |
| Mid Cap Value Fund | | | 1,280,894,251 | | | | — | | | | 7,350,984 | | | | — | | | | 100,253 | | | | 1,288,345,488 | |
| Mid Cap Value Institutional Fund | | | 569,461,547 | | | | — | | | | 4,127,297 | | | | — | | | | 92,710 | | | | 573,681,554 | |
| Small Cap Value Fund | | | 49,305,517 | | | | — | | | | 208,200 | | | | — | | | | 730 | | | | 49,514,447 | |
| Enhanced World Equity Fund | | | 5,673,645 | | | | — | | | | — | | | | — | | | | — | | | | 5,673,645 | |
| World Equity Income Fund | | | 77,587,149 | | | | — | | | | — | | | | — | | | | — | | | | 77,587,149 | |
| Alpha Opportunity Fund | | | 10,616,725 | | | | 27,021 | | | | 2,807,978 | | | | — | | | | — | | | | 13,451,724 | |
| | | | | | | | | | | | | | | | | | | | | | | | | |
| Liabilities | | | | | | | | | | | | | | | | | | | | | | | | |
| StylePlus Large Core Fund | | $ | — | | | $ | 11,851 | | | $ | — | | | $ | — | | | $ | — | | | $ | 11,851 | |
| Mid Cap Value Fund | | | — | | | | 305,810 | | | | — | | | | — | | | | — | | | | 305,810 | |
| Mid Cap Value Institutional Fund | | | — | | | | 137,005 | | | | — | | | | — | | | | — | | | | 137,005 | |
| Small Cap Value Fund | | | — | | | | 38,520 | | | | — | | | | — | | | | — | | | | 38,520 | |
| Enhanced World Equity Fund | | | — | | | | 16,550 | | | | — | | | | — | | | | — | | | | 16,550 | |
| Alpha Opportunity Fund | | | — | | | | — | | | | — | | | | — | | | | 7,341,377 | | | | 7,341,377 | |
* Other financial instruments may include futures contracts and swaps, which are reported as unrealized gain/loss at period end.
Financial assets and liabilities categorized as Level 2 for certain funds consist primarily of fixed income investments. Fixed income investments generally have bid and ask prices that can be observed in the marketplace. Bid prices reflect the highest price that market participants are willing to pay for an asset. Ask prices represent the lowest price that market participants are willing to accept for an asset. For financial assets and liabilities whose inputs are based on bid-ask prices obtained from third party pricing services, fair value may not always be a predetermined point in the bid-ask range. The Funds’ policy is to allow for mid-market pricing and adjusting to the point within the bid-ask range that meets the Funds’ best estimate of fair value.
| THE GUGGENHEIM FUNDS ANNUAL REPORT | 75 |
| NOTES TO FINANCIAL STATEMENTS (continued) |
Transfers between investment levels may occur as the markets fluctuate and/or the availability of data used in the investment’s valuation changes. The Funds recognize transfers between the levels as of the beginning of the period.
For the year ended September 30, 2013, there were no transfers between levels.
Summary of Fair Value Level 3 Activity
Following is a reconciliation of Level 3 assets for which significant unobservable inputs were used to determine fair value for the year ended
September 30, 2013:
LEVEL 3 – Fair value measurement using significant unobservable inputs
| Fund | | Total | |
| Alpha Opportunity Fund* | | | | |
| Liabilities: | | | | |
| Beginning Balance | | $ | 7,341,377 | |
| Ending Balance | | $ | 7,341,377 | |
* See Note 11
5. Repurchase Agreements
In connection with transactions in repurchase agreements, it is the Funds’ policy that their custodian takes possession of the underlying collateral. The collateral is in the possession of the Funds’ custodian and is evaluated to ensure that its market value exceeds, at a minimum, 102% of the original face amount of the repurchase agreements.
At September 30, 2013, the collateral for the repurchase agreements was as follows:
| | | Counterparty and | | | | | | | | | | | | | | |
| Fund | | Terms of Agreement | | Face Value | | | Repurchase Price | | | Collateral | | Par Value | | | Fair Value | |
| Alpha Opportunity Fund | | State Street | | | | | | | | | | Fannie Mae | | | | | | | | |
| | | 0.00% | | | | | | | | | | 2.12% | | | | | | | | |
| | | Due 10/01/13 | | $ | 2,307,998 | | | $ | 2,307,998 | | | 11/07/22 | | $ | 2,540,000 | | | $ | 2,358,012 | |
In the event of counterparty default, the Funds have the right to collect the collateral to offset losses incurred. There is potential loss to the Funds in the event the Funds are delayed or prevented from exercising their rights to dispose of the collateral securities, including the risk of a possible decline in the value of the underlying securities during the period while the Funds seek to assert their rights. The Funds’ investment advisor, acting under the supervision of the Board of Directors, reviews the value of the collateral and the creditworthiness of those banks and dealers with which the Funds enter into repurchase agreements to evaluate potential risks.
6. Derivative Investment Holdings Categorized by Risk Exposure
U.S. GAAP requires disclosures to enable investors to better understand how and why the Funds use derivative instruments, how these derivative instruments are accounted for and their effects on the Funds’ financial position and results of operations.
Certain Funds utilized options to minimally hedge the Fund’s portfolio to increase returns, to maintain exposure to the equity markets, and create liquidity.
Alpha Opportunity Fund utilized futures contracts to obtain broad index exposure.
StylePlus Large Core Fund utilized swap agreements and futures contracts to obtain index exposure and create liquidity for purposes of creating leverage, respectively.
The following table represents the notional amount of derivative instruments outstanding, as an approximate percentage of the Funds’ net assets on a daily basis.
| | | | | Approximate percentage | |
| | | | | of Fund’s net assets on | |
| | | | | a daily basis | |
| Fund | Long | | | Short | |
| StylePlus Large Core Fund | 80 | %* | | — | |
| Alpha Opportunity Fund | 5 | % | | — | ** |
* Effective April 30, 2013, changes to the Fund's principal investment strategies includes derivative instruments.
** Less than 5%.
| 76 | THE GUGGENHEIM FUNDS ANNUAL REPORT |
| NOTES TO FINANCIAL STATEMENTS (continued) |
The following is a summary of the location of derivative investments on the Funds’ Statements of Assets and Liabilities as of September 30, 2013:
| Derivative Investment Type | Asset Derivatives | Liability Derivatives |
| Equity contracts | Variation margin | Variation margin |
| | Investments | options written, at value |
| | Unrealized appreciation on swap agreements | Unrealized depreciation on swap agreements |
The following table sets forth the fair value of the Funds’ derivative investments categorized by primary risk exposure at September 30, 2013:
| Asset Derivative Investments Value |
| | | Futures | | | Swaps | | | Options | | | | |
| | | Equity | | | Equity | | | Written Equity | | | Total Value at | |
| Fund | | Contracts* | | | Contracts | | | Contracts | | | September 30, 2013 | |
| StylePlus Large Core Fund | | $ | — | | | $ | 4,297,408 | | | $ | — | | | $ | 4,297,408 | |
| Alpha Opportunity Fund | | | 27,021 | | | | — | | | | — | | | | 27,021 | |
| Liability Derivative Investments Value |
| | | Futures | | | Swaps | | | Options | | | | |
| | | Equity | | | Equity | | | Written Equity | | | Total Value at | |
| Fund | | Contracts* | | | Contracts | | | Contracts | | | September 30, 2013 | |
| StylePlus Large Core Fund | | $ | 11,851 | | | $ | — | | | $ | — | | | $ | 11,851 | |
| Mid Cap Value Fund | | | — | | | | — | | | | 305,810 | | | | 305,810 | |
| Mid Cap Value Institutional Fund | | | — | | | | — | | | | 137,005 | | | | 137,005 | |
| Small Cap Value Fund | | | — | | | | — | | | | 38,520 | | | | 38,520 | |
| Enhanced World Equity Fund | | | — | | | | — | | | | 16,550 | | | | 16,550 | |
* Includes cumulative appreciation (depreciation) of futures contracts as reported on the Schedules of Investments. Only current day’s variation margin is reported within the Statements of Assets and Liabilities.
The following is a summary of the location of derivative investments on the Funds’ Statements of Operations for the year ended September 30, 2013:
| Derivative Investment Type | Location of Gain (Loss) on Derivatives |
| Equity contracts | Net realized gain (loss) on swap agreements |
| | Net realized gain (loss) on futures contracts |
| | Net realized gain (loss) on options written |
| | Net change in unrealized appreciation (depreciation) on swap agreements |
| | Net change in unrealized appreciation (depreciation) on futures contracts |
| | Net change in unrealized appreciation (depreciation) on options written |
The following is a summary of the Funds’ realized gain (loss) and change in unrealized appreciation (depreciation) on derivative investments recognized on the Statements of Operations categorized by primary risk exposure for the year ended September 30, 2013:
| Realized Gain (Loss) on Derivative Investments Recognized on the Statements of Operations |
| | | Futures | | | Swaps | | | Options | | | | |
| | | Equity | | | Equity | | | Written Equity | | | | |
| Fund | | Contracts | | | Contracts | | | Contracts | | | Total | |
| StylePlus Large Core Fund | | $ | 71,206 | | | $ | 3,715,099 | | | $ | — | | | $ | 3,786,305 | |
| Mid Cap Value Fund | | | — | | | | — | | | | 838,918 | | | | 838,918 | |
| Mid Cap Value Institutional Fund | | | — | | | | — | | | | 385,021 | | | | 385,021 | |
| Small Cap Value Fund | | | — | | | | — | | | | 25,454 | | | | 25,454 | |
| Enhanced World Equity Fund | | | — | | | | — | | | | 13,879 | | | | 13,879 | |
| Alpha Opportunity Fund | | | 136,934 | | | | — | | | | — | | | | 136,934 | |
| Change in Unrealized Appreciation (Depreciation) on Derivative Investments Recognized on the Statements of Operations |
| | | Futures | | | Swaps | | | Options | | | | |
| | | Equity | | | Equity | | | Written Equity | | | | |
| Fund | | Contracts | | | Contracts | | | Contracts | | | Total | |
| StylePlus Large Core Fund | | $ | (11,851 | ) | | $ | 4,297,408 | | | $ | — | | | $ | 4,285,557 | |
| Mid Cap Value Fund | | | — | | | | — | | | | 147,973 | | | | 147,973 | |
| Mid Cap Value Institutional Fund | | | — | | | | — | | | | 68,507 | | | | 68,507 | |
| Small Cap Value Fund | | | — | | | | — | | | | 7,386 | | | | 7,386 | |
| Enhanced World Equity Fund | | | — | | | | — | | | | 17,601 | | | | 17,601 | |
| Alpha Opportunity Fund | | | 34,281 | | | | — | | | | — | | | | 34,281 | |
| THE GUGGENHEIM FUNDS ANNUAL REPORT | 77 |
| NOTES TO FINANCIAL STATEMENTS (continued) |
7. Options Written
Transactions in options written during the year ended September 30, 2013 were as follows:
Call Options Written
| | | | | | | | | Mid Cap Value | | | | | | Enhanced World | |
| | | Mid Cap Value Fund | | | Institutional Fund | | | Small Cap Value Fund | | | Equity Fund | |
| | | Number of | | | Premium | | | Number of | | | Premium | | | Number of | | | Premium | | | Number of | | | Premium | |
| | | Contracts | | | Amount | | | Contracts | | | Amount | | | Contracts | | | Amount | | | Contracts | | | Amount | |
| Balance at September 30, 2012 | | | 1,160 | | | $ | 330,674 | | | | 560 | | | $ | 159,636 | | | | 33 | | | $ | 9,407 | | | | — | | | $ | — | |
| Options Written | | | 3,976 | | | | 957,437 | | | | 1,778 | | | | 428,618 | | | | 192 | | | | 48,447 | | | | 3,081 | | | | 257,159 | |
| Options terminated in closing purchase transactions | | | — | | | | — | | | | — | | | | — | | | | — | | | | — | | | | (2,338 | ) | | | (183,598 | ) |
| Options expired | | | (2,477 | ) | | | (590,486 | ) | | | (1,146 | ) | | | (275,556 | ) | | | (75 | ) | | | (17,783 | ) | | | (56 | ) | | | (2,460 | ) |
| Options exercised | | | (1,505 | ) | | | (307,568 | ) | | | (675 | ) | | | (137,950 | ) | | | (43 | ) | | | (8,788 | ) | | | (317 | ) | | | (36,950 | ) |
| Balance at September 30, 2013 | | | 1,154 | | | $ | 390,057 | | | | 517 | | | $ | 174,748 | | | | 107 | | | $ | 31,283 | | | | 370 | | | $ | 34,151 | |
Put Options Written
| | | | | | | | | Mid Cap Value | | | | |
| | | Mid Cap Value Fund | | | Institutional Fund | | | Small Cap Value Fund | |
| | | Number of | | | Premium | | | Number of | | | Premium | | | Number of | | | Premium | |
| | | Contracts | | | Amount | | | Contracts | | | Amount | | | Contracts | | | Amount | |
| Balance at September 30, 2012 | | | — | | | $ | — | | | | — | | | $ | — | | | | — | | | $ | — | |
| Options Written | | | 3,016 | | | | 376,599 | | | | 1,349 | | | | 167,122 | | | | 297 | | | | 24,671 | |
| Options terminated in closing purchase transactions | | | — | | | | — | | | | — | | | | — | | | | — | | | | — | |
| Options expired | | | (842 | ) | | | (248,431 | ) | | | (371 | ) | | | (109,464 | ) | | | (26 | ) | | | (7,671 | ) |
| Options exercised | | | (2,174 | ) | | | (128,168 | ) | | | (978 | ) | | | (57,658 | ) | | | (71 | ) | | | (4,190 | ) |
| Balance at September 30, 2013 | | | — | | | $ | — | | | | — | | | $ | — | | | | 200 | | | $ | 12,810 | |
8. Federal Income Tax Information
The Funds intend to comply with the provisions of Subchapter M of the Internal Revenue Code applicable to regulated investment companies and will distribute substantially all taxable net investment income and capital gains sufficient to relieve the Funds from all, or substantially all, federal income, excise and state income taxes. Therefore, no provision for federal or state income tax is required.
Tax positions taken or expected to be taken in the course of preparing the Funds’ tax returns are evaluated to determine whether the tax positions are “more-likely-than-not” of being sustained by the applicable tax authority. Tax positions not deemed to meet the more-likely-than-not threshold would be recorded as a tax benefit or expense in the current year. Management has analyzed the Funds’ tax positions taken, or to be taken, on Federal income tax returns for all open tax years, and has concluded that no provision for income tax is required in the Funds’ financial statements. A fund’s federal tax returns are subject to examination by the Internal Revenue Service for a period of three fiscal years after they are filed.
The RIC Modernization Act of 2010 was signed into law on December 22, 2010 and sought to simplify some of the tax provisions applicable to regulated investment companies and the tax reporting to their shareholders, and to improve the tax efficiency of certain fund structures. The greatest impact to the disclosure in the financial reports for the Funds was on the treatment of net capital losses, effective for tax years beginning after December 22, 2010.
One of the more prominent changes addresses capital loss carryforwards. Funds are permitted to carry forward capital losses incurred in taxable years beginning after December 22, 2010 for an unlimited period. However, any losses incurred during those future taxable years will be required to be utilized prior to the losses incurred in pre-enactment taxable years. Under pre-enactment law, capital losses could be carried forward for eight years, and carried forward as short-term capital, irrespective of the character of the original loss. As a result of this ordering rule, pre-enactment capital loss carryforwards may potentially expire unused. Additionally, post-enactment capital losses that are carried forward will retain their character as either short-term or long-term capital losses rather than being considered all short-term as under previous law.
| 78 | THE GUGGENHEIM FUNDS ANNUAL REPORT |
| NOTES TO FINANCIAL STATEMENTS (continued) |
The tax character of distributions paid during the year ended September 30, 2013 was as follows:
| | | Ordinary | | | Long-Term | | | Total | |
| Fund | | Income | | | Capital Gain | | | Distributions | |
| StylePlus Large Core Fund | | $ | 616,608 | | | $ | — | | | $ | 616,608 | |
| Mid Cap Value Fund | | | — | | | | 118,260,068 | | | | 118,260,068 | |
| Mid Cap Value Institutional Fund | | | 2,656,847 | | | | 45,574,129 | | | | 48,230,976 | |
| Small Cap Value Fund | | | 2,056,835 | | | | 874,121 | | | | 2,930,956 | |
| Enhanced World Equity Fund | | | — | | | | — | | | | — | |
| World Equity Income Fund | | | 1,797,792 | | | | — | | | | 1,797,792 | |
| Alpha Opportunity Fund | | | — | | | | — | | | | — | |
The tax character of distributions paid during the year ended September 30, 2012 was as follows:
| | | Ordinary | | | Long-Term | | | Total | |
| Fund | | Income | | | Capital Gain | | | Distributions | |
| StylePlus Large Core Fund | | $ | 200,274 | | | $ | — | | | $ | 200,274 | |
| Mid Cap Value Fund | | | — | | | | 24,197,991 | | | | 24,197,991 | |
| Mid Cap Value Institutional Fund | | | 10,427,545 | | | | 35,975,722 | | | | 46,403,267 | |
| Small Cap Value Fund | | | 490,519 | | | | 201,354 | | | | 691,873 | |
| World Equity Income Fund | | | 33,558 | | | | — | | | | 33,558 | |
| Alpha Opportunity Fund | | | — | | | | — | | | | — | |
Note: For federal income tax purposes, short term capital gain distributions are treated as ordinary income distributions.
The tax character of distributable earnings/(accumulated losses) at September 30, 2013 was as follows:
| | | Undistributed | | | Undistributed | | | Accumulated | | | Net Unrealized | | | Total | |
| | | Ordinary | | | Long-Term | | | Capital and | | | Appreciation/ | | | Accumulated | |
| Fund | | Income | | | Capital Gain | | | Other Losses* | | | (Depreciation)** | | | Earnings/(Deficit) | |
| StylePlus Large Core Fund | | $ | 1,285,248 | | | $ | 26,574,113 | | | $ | — | | | $ | 5,680,516 | | | $ | 33,539,877 | |
| Mid Cap Value Fund | | | — | | | | 61,764,121 | | | | (706,718 | ) | | | 301,044,709 | | | | 362,102,112 | |
| Mid Cap Value Institutional Fund | | | 5,416,932 | | | | 24,532,414 | | | | — | | | | 124,327,726 | | | | 154,277,072 | |
| Small Cap Value Fund | | | 717,032 | | | | 1,780,512 | | | | — | | | | 9,039,744 | | | | 11,537,288 | |
| Enhanced World Equity Fund | | | 287,015 | | | | — | | | | (15,330 | ) | | | (65,087 | ) | | | 206,598 | |
| World Equity Income Fund | | | 426,770 | | | | — | | | | (23,559,394 | ) | | | 890,970 | | | | (22,241,654 | ) |
| Alpha Opportunity Fund | | | — | | | | — | | | | (10,167,156 | ) | | | 3,185,078 | | | | (6,982,078 | ) |
* The Fund had net capital loss carryovers and deferred losses as identified elsewhere in the Notes to the Financial Statements.
** Any differences between book-basis and tax-basis unrealized appreciation (depreciation) are attributable primarily to the tax deferral of wash sale losses and the differences between book and tax basis of passive foreign investment companies
For the year ended September 30, 2013, the capital loss carryovers utilized or expired and the accumulated net realized loss on sales of investments for federal income tax purposes which are available to offset future taxable gains are shown in the table below:
| | | Capital Loss | | | Capital Loss | | | | | | | | | | | | Remaining | |
| | | Carryovers | | | Carryovers | | | Expires in | | | Expires in | | | Unlimited | | | Capital Loss | |
| Fund | | Utilized | | | Expired | | | 2017 | | | 2018 | | | Short Term | | | Long Term | | | Carryforward | |
| StylePlus Large Core Fund | | $ | (12,483,320 | ) | | $ | — | | | $ | — | | | $ | — | | | $ | — | | | $ | — | | | $ | — | |
| Mid Cap Value Fund | | | — | | | | — | | | | — | | | | — | | | | — | | | | — | | | | — | |
| Mid Cap Value Institutional Fund | | | — | | | | — | | | | — | | | | — | | | | — | | | | — | | | | — | |
| Small Cap Value Fund | | | — | | | | — | | | | — | | | | — | | | | — | | | | — | | | | — | |
| Enhanced World Equity Fund | | | — | | | | — | | | | — | | | | — | | | | — | | | | — | | | | — | |
| World Equity Income Fund | | | (764,399 | ) | | | — | | | | (18,201,890 | ) | | | (5,357,504 | ) | | | — | | | | — | | | | (23,559,394 | ) |
| Alpha Opportunity Fund | | | (447,633 | ) | | | — | | | | (5,760,769 | ) | | | (4,341,927 | ) | | | — | | | | — | | | | (10,102,696 | ) |
Net investment income and net realized gains (losses) may differ for financial statement and tax purposes because of temporary or permanent book/tax differences. These differences are primarily due to deferred ordinary and capital losses, losses due to wash sales, foreign currency gains and losses, and the “mark-to -market” of certain passive foreign investment companies (PFICs) for tax purposes. To the extent these differences are permanent, reclassifications are made to the appropriate equity accounts in the period that the differences arise.
| THE GUGGENHEIM FUNDS ANNUAL REPORT | 79 |
| NOTES TO FINANCIAL STATEMENTS (continued) |
On the Statements of Assets and Liabilities, the following adjustments were made for permanent book/tax differences:
| | | | | | Undistributed | | | Accumulated Net | |
| | | | | | Net Investment | | | Realized | |
| Fund | | Paid-In Capital | | | Income | | | Gain/(Loss) | |
| StylePlus Large Core Fund | | $ | 1,101,270 | | | $ | 6,034 | | | $ | (1,107,304 | ) |
| Mid Cap Value Fund | | | 9,085,934 | | | | 2,788,482 | | | | (11,874,416 | ) |
| Mid Cap Value Institutional Fund | | | 5,966,619 | | | | 379,545 | | | | (6,346,164 | ) |
| Small Cap Value Fund | | | 182,126 | | | | 1,867 | | | | (183,993 | ) |
| Enhanced World Equity Fund | | | 587 | | | | — | | | | (587 | ) |
| World Equity Income Fund | | | — | | | | 313,550 | | | | (313,550 | ) |
| Alpha Opportunity Fund | | | 32,334 | | | | 32,594 | | | | (64,928 | ) |
At September 30, 2013, the cost of securities for Federal income tax purposes, the aggregate gross unrealized gain for all securities for which there was an excess of value over tax cost and the aggregate gross unrealized loss for all securities for which there was an excess of tax cost over value, were as follows:
| | | | | | Tax | | | Tax | | | Net | |
| | | Tax | | | Unrealized | | | Unrealized | | | Unrealized | |
| Fund | | Cost | | | Gain | | | Loss | | | Gain/(Loss) | |
| StylePlus Large Core Fund | | $ | 181,653,208 | | | $ | 2,910,396 | | | $ | (1,527,288 | ) | | $ | 1,383,108 | |
| Mid Cap Value Fund | | | 987,385,026 | | | | 356,389,156 | | | | (55,428,694 | ) | | | 300,960,462 | |
| Mid Cap Value Institutional Fund | | | 449,391,571 | | | | 147,820,281 | | | | (23,530,298 | ) | | | 124,289,983 | |
| Small Cap Value Fund | | | 40,480,276 | | | | 11,372,446 | | | | (2,338,275 | ) | | | 9,034,171 | |
| Enhanced World Equity Fund | | | 5,756,333 | | | | 47,494 | | | | (130,182 | ) | | | (82,688 | ) |
| World Equity Income Fund | | | 76,700,505 | | | | 2,228,963 | | | | (1,342,319 | ) | | | 886,644 | |
| Alpha Opportunity Fund | | | 9,889,733 | | | | 4,016,044 | | | | (481,074 | ) | | | 3,534,970 | |
Pursuant to Federal income tax regulations applicable to investment companies, the Funds have elected to treat net capital losses and certain ordinary losses realized between November 1 and September 30 of each year as occurring on the first day of the following tax year. The Funds have also elected to treat certain ordinary losses realized between January 1 and September 30 of each year as occurring on the first day of the following tax year. For the year ended September 30, 2013, the following losses reflected in the accompanying financial statements were deferred for Federal income tax purposes until October 1, 2013:
| Fund | | Ordinary | | | Capital | |
| Mid Cap Value Fund | | $ | (706,718 | ) | | $ | — | |
| Alpha Opportunity Fund | | | (63,808 | ) | | | — | |
9. Securities Transactions
For the year ended September 30, 2013, the cost of purchases and proceeds from sales of investment securities, excluding government securities and short-term investments, were as follows:
| Fund | | Purchases | | | Sales | |
| StylePlus Large Core Fund | | $ | 298,775,980 | | | $ | 383,221,145 | |
| Mid Cap Value Fund | | | 271,277,470 | | | | 415,259,178 | |
| Mid Cap Value Institutional Fund | | | 122,919,004 | | | | 175,461,579 | |
| Small Cap Value Fund | | | 16,739,146 | | | | 13,210,627 | |
| Enhanced World Equity Fund | | | 14,394,078 | | | | 8,943,443 | |
| World Equity Income Fund | | | 109,867,372 | | | | 113,633,914 | |
| Alpha Opportunity Fund | | | 19,430,528 | | | | 22,544,174 | |
| 80 | THE GUGGENHEIM FUNDS ANNUAL REPORT |
| NOTES TO FINANCIAL STATEMENTS (continued) |
10. Affiliated Transactions
Investments representing 5% or more of the outstanding voting shares of a portfolio company of a fund, or control of or by, or common control under GI, result in that portfolio company being considered an affiliated company of such fund, as defined in the 1940 Act. Transactions during the year ended September 30, 2013 in which the portfolio company is an “affiliated person” are as follows:
| | | | | Value | | | | | | | | | Value | | | Shares | | | Investment | |
| Fund | | Security | | 09/30/12 | | | Additions | | | Reductions | | | 09/30/13 | | | 09/30/13 | | | Income | |
| Mid Cap Value Fund | | Common Stock: | | | | | | | | | | | | | | | | | | | | | | | | |
| | | IXYS Corp. | | $ | 21,192,383 | | | $ | — | | | $ | — | | | $ | 20,615,574 | | | | 2,136,329 | | | $ | 256,359 | |
| | | Maxwell Technologies, Inc. | | | 13,276,517 | | | | 459,659 | | | | — | | | | 15,481,137 | | | | 1,704,971 | | | | — | |
| | | Total | | | 34,468,900 | | | | 459,659 | | | | — | | | | 36,096,711 | | | | 3,841,300 | | | | 256,359 | |
| | | | | | | | | | | | | | | | | | | | | | | | | | | |
| Mid Cap Value Institutional Fund | | Common Stock:
HydroGen Corp. | | $ | 15,188 | | | $ | — | | | $ | — | | | $ | 8,860 | | | | 1,265,700 | | | $ | — | |
| | | Total | | | 15,188 | | | | — | | | | — | | | | 8,860 | | | | 1,265,700 | | | | — | |
11. Alpha Opportunity Fund
The Fund contracted with Lehman Brothers International Europe (“LBIE”) to provide prime brokerage services related to the Fund’s short selling. On September 15, 2008, LBIE was placed into administration and a third party administrator was named (the “Administrator”). The Fund’s exposure to LBIE consists of short sale proceeds held by LBIE, and restricted long positions held at the Fund’s custodian, as collateral for said short sales. The Fund delivered a Notice of Termination of Loans to LBIE and the Administrator. The Fund has worked to resolve these issues with LBIE and the Administrator. As of September 30, 2013, included in the Statement of Assets and Liabilities are the value of restricted long positions of $10,592,103 cash collateral of $1,332,130, restricted cash representing the value of short sale proceeds of $4,137,465 and liabilities for short sales of $7,341,377, representing the value of securities sold short at the date the short sales were deemed by the Fund to have been terminated. If these short sales had not been terminated, the value of the liability related to these securities sold short would have been $9,423,578 as of September 30, 2013 resulting in a decrease in net assets of $2,082,201 or (18.5)%. Until such time as the liability for short sales is settled and all restrictions are removed by LBIE and LBI, the Fund cannot sell such restricted long positions and/or utilize the restricted cash balances to achieve the Fund’s investment objectives and/or meet Fund redemption or other Fund obligations. During the year ended September 30, 2013, the Fund accrued $274,670 of estimated settlement costs. Based on the ultimate terms of such settlement, the value assigned to these positions may ultimately differ from the fair valuations assigned to them by the Fund and there is no guaranty that the Fund will ultimately recover the full value of the assets that are subject to restrictions. Accordingly, a settlement could ultimately result in the Fund realizing values that are materially different from those indicated herein, which would materially impact the Fund’s net asset value. As of the close of business on October 3, 2008, and until further notice, the Fund is not accepting subscriptions for shares from either new or existing shareholders.
Effective as of August 1, 2011, Security Investors, LLC has agreed to purchase shares of the Fund from time to time to provide the Fund with liquidity if needed to meet redemptions. The intent of the agreement is to provide liquidity to the Fund in the event that shareholders seek to redeem shares of the Fund at a time that there are not sufficient unrestricted assets.
12. Other Liabilities
Mid Cap Value Fund, Mid Cap Value Institutional Fund and StylePlus Large Core Fund each wrote put option contracts through LBI that were exercised prior to the option contracts’ expiration and prior to the bankruptcy filing by LBI, during September, 2008. However, these transactions have not settled and the securities have not been delivered to the Funds as of September 30, 2013.
Although the ultimate resolution of these transactions is uncertain, the Funds have recorded a liability on their respective books equaI to the difference between the strike price on the put options and the market price of the underlying security on the exercise date. The amount of the liability recorded by the Funds as of September 30, 2013, was $473,594 for Mid Cap Value Fund, $15,940 for Mid Cap Value Institutional Fund, and $18,615 for StylePlus Large Core Fund.
| THE GUGGENHEIM FUNDS ANNUAL REPORT | 81 |
| NOTES TO FINANCIAL STATEMENTS (concluded) |
13. New Accounting Pronouncement
In December 2011, the Financial Accounting Standards Board (“FASB”) issued Accounting Standards Update (“ASU”) No. 2011-11 regarding “Disclosures about Offsetting Assets and Liabilities”. The ASU requires an entity to disclose information about offsetting and related arrangements for assets and liabilities, financial instruments and derivatives that are either currently offset in accordance with current requirements or are subject to enforceable master netting arrangements or similar agreements. In January 2013, the FASB issued ASU No. 2013-01, Clarifying the Scope of Disclosures about Offsetting Assets and Liabilities, which limits the scope of the new balance sheet offsetting disclosures to derivatives, repurchase agreements and securities lending. The new disclosure is effective for annual or interim periods beginning on or after January 1, 2013. Management is evaluating the impact of this update on its current disclosures.
14. Fund Name and Strategy Change
The changes have been approved to the investment program of the following Funds:
MSCI EAFE Equal Weight Fund
| • | a change of the Fund’s name to World Equity Income Fund; |
| • | changes to the Fund’s investment objective; |
| • | changes to the Fund’s principal investment strategies, including the removal of the non-fundamental 80% policy to, under normal circumstances, invest at least 80% of its assets (net assets, plus the amount of any borrowing for investment purposes) in equity securities included in the MSCI EAFE Equal Weighted Index; |
| • | a change to the Fund’s Expense Limitation Agreement; |
| • | a replacement of the Fund’s portfolio manager(s) with a new portfolio management team; |
| • | a change to the Fund’s primary index; and |
| • | the removal of the non-fundamental operating policies, with the exception of the non-fundamental operating policy relating to liquidity. |
These changes to the Fund became effective August 15, 2013.
Large Cap Core Fund
| • | a change to the Fund’s name to Guggenheim StylePlus Large Core Fund; |
| • | changes to the Fund’s principal investment strategies, including the removal of the Funds non-fundamental 80% policy adopted pursuant to Rule 35d-1 under the Investment Company Act of 1940; |
| • | replacement of the Fund’s portfolio managers with a new portfolio management team; and |
| • | removal of the non-fundamental policies relating to options and short sales. |
The changes to the Fund became effective on April 30, 2013.
| 82 | THE GUGGENHEIM FUNDS ANNUAL REPORT |
| REPORT OF INDEPENDENT REGISTERED PUBLIC ACCOUNTING FIRM |
The Board of Directors and Shareholders
of Security Equity Fund
We have audited the accompanying statements of assets and liabilities, including the schedules of investments, of Security Equity Fund (comprised of Guggenheim StylePlus Large Core Fund, Mid Cap Value Fund, Mid Cap Value Institutional Fund, Small Cap Value Fund, World Equity Income Fund, Enhanced World Equity Fund and Alpha Opportunity Fund) (the “Funds”) as of September 30, 2013, and the related statements of operations, statements of changes in net assets, and the financial highlights for each of the years or periods indicated therein. These financial statements and financial highlights are the responsibility of the Funds’ management. Our responsibility is to express an opinion on these financial statements and financial highlights based on our audits.
We conducted our audits in accordance with the standards of the Public Company Accounting Oversight Board (United States). Those standards require that we plan and perform the audit to obtain reasonable assurance about whether the financial statements and financial highlights are free of material misstatement. We were not engaged to perform an audit of the Funds’ internal control over financial reporting. Our audits included consideration of internal control over financial reporting as a basis for designing audit procedures that are appropriate in the circumstances, but not for the purpose of expressing an opinion on the effectiveness of the Funds’ internal control over financial reporting. Accordingly, we express no such opinion. An audit also includes examining, on a test basis, evidence supporting the amounts and disclosures in the financial statements and financial highlights, assessing the accounting principles used and significant estimates made by management, and evaluating the overall financial statement presentation. Our procedures included confirmation of securities owned as of September 30, 2013, by correspondence with the custodian, agent banks and brokers or by other appropriate auditing procedures where replies from agent banks or brokers were not received. We believe that our audits provide a reasonable basis for our opinion.
As more fully discussed in Note 11 to the financial statements, the Alpha Opportunity Fund has ongoing exposure to Lehman Brothers International Europe (“LBIE”), which was placed into administration in September 2008. Significant uncertainty exists regarding the ultimate timing and manner of settlement of this exposure and the difference between amounts currently recorded and that which may ultimately be settled may be material.
In our opinion, the financial statements and financial highlights referred to above present fairly, in all material respects, the financial position of each of the respective portfolios constituting the Security Equity Fund at September 30, 2013, and the results of their operations, the changes in their net assets, and their financial highlights for each of the years or periods indicated therein, in conformity with U.S. generally accepted accounting principles.
| |  |
| | |
| McLean, Virginia | |
| November 27, 2013 | |
| THE GUGGENHEIM FUNDS ANNUAL REPORT | 83 |
| OTHER INFORMATION (Unaudited) |
Tax Information
This information is being provided as required by the Internal Revenue Code. Amounts shown may differ from those elsewhere in the report because of differences in tax and financial reporting practice.
Of the taxable ordinary income distributions paid during the fiscal year ending September 30, 2013, the following funds had the corresponding percentages qualify for the dividends received deduction for corporations:
| Fund | | % Qualifying |
| StylePlus Large Core Fund | | | 100.00% |
| Mid Cap Value Institutional Fund | | | 75.19% |
| Small Cap Value Fund | | | 19.40% |
| World Equity Income Fund | | | 100.00% |
| | | | | |
Additionally, the following amounts of taxable ordinary income dividends paid during the fiscal year qualified for the lower income tax rate available to individuals under the Jobs and Growth Tax Relief Reconciliation Act of 2003:
| Fund | | % Qualifying |
| StylePlus Large Core Fund | | | 100.00% |
| Mid Cap Value Institutional Fund | | | 74.74% |
| Small Cap Value Fund | | | 19.80% |
| World Equity Income Fund | | | 10.64% |
| | | | | |
With respect to the taxable year ended September 30, 2013, the Funds hereby designates as capital gain dividends the amounts listed below, or, if subsequently determined to be different, the net capital gain of such year:
| | | StylePlus | | | | | | Mid Cap Value | | | | |
| | | Large Core | | | Mid Cap | | | Institutional | | | Small Cap | |
| | | Fund | | | Value Fund | | | Fund | | | Value Fund | |
| From long-term capital gains, subject to the 15% rate gains category: | | $ | — | | | $ | 118,260,068 | | | $ | 45,574,129 | | | $ | 874,121 | |
| From long-term capital gains, using proceeds from shareholder redemptions: | | | 1,107,304 | | | | 11,003,477 | | | | 5,966,619 | | | | 182,127 | |
For the fiscal year ended September 30, 2013 the World Equity Income Fund earned gross income derived from foreign sources totaling $2,211,554. The World Equity Income Fund paid foreign taxes totaling $183,085 for the fiscal year and may pass these taxes through to shareholders, who may be able to claim them as a foreign tax credit. A final determination will be made at the end of the calendar year. The funds will notify shareholders of amounts for use in preparing their 2013 income tax forms in January 2014.
Proxy Voting Information
A description of the policies and procedures that the Trust uses to determine how to vote proxies relating to securities held in the Funds’ portfolios is available, without charge and upon request, by calling 1.800.820.0888. This information is also available from the EDGAR database on the SEC’s website at http://www.sec.gov.
Information regarding how the Funds voted proxies relating to portfolio securities during the most recent 12-month period ended June 30 is available without charge, upon request, by calling 1.800.820.0888. The proxy statement information is also available from the EDGAR database on the SEC’s website at http://www.sec.gov.
Quarterly Portfolio Schedules Information
The Trust files its complete schedule of portfolio holdings with the SEC for the first and third quarters of each fiscal year on Form N-Q; which are available on the SEC’s website at http://www.sec.gov. The Funds’ Forms N-Q may be reviewed and copied at the SEC’s Public Reference Room in Washington, DC, and that information on the operation of the Public Reference Room may be obtained by calling 1-800-SEC-0330. Copies of the portfolio holdings are also available to shareholders, without charge and upon request, by calling 1.800.820.0888.
| 84 | THE GUGGENHEIM FUNDS ANNUAL REPORT |
| OTHER INFORMATION (Unaudited) (continued) |
Office Locations
The offices of Guggenheim Investments can be found in the following locations:
40 East 52nd Street
16th Floor
New York, NY 10022
(Headquarters)
Four Irvington Centre
805 King Farm Boulevard
Suite 600
Rockville, MD 20850
9401 Indian Creek Parkway
40 Corporate Woods
Suite 850
Overland Park, KS 66210
Board Considerations in Approving the Investment Advisory Agreements
Security Equity Fund (the “Company”) was organized as a Kansas corporation on November 27, 1961 and is registered as an open-end management investment company under the Investment Company Act of 1940, as amended (the “1940 Act”). The Company consists of seven series, each representing a separate fund and offered to eligible investors as follows: Guggenheim StylePlus – Large Core Fund (formerly, Guggenheim Large Cap Core Fund), Guggenheim Alpha Opportunity Fund, Guggenheim World Equity Income Fund (formerly, Guggenheim MSCI EAFE Equal Weight Fund), Guggenheim Mid Cap Value Fund, Guggenheim Mid Cap Value Institutional Fund, Guggenheim Small Cap Value Fund and Guggenheim Enhanced World Equity Fund1 (each, a “Fund” and collectively, the “Funds”). Security Investors, LLC, also known as Guggenheim Investments (“Security Investors” or the “Investment Manager”), serves as each Fund’s investment manager pursuant to an investment management agreement between the Company and Security Investors. Under the terms of the investment management agreement, Security Investors also is responsible for overseeing the activities of Mainstream Investments, LLC (“Mainstream” or the “Sub-Adviser”) which performs portfolio management and related services for Alpha Opportunity Fund, with respect to its active value sleeve, pursuant to an investment sub-advisory agreement between Security Investors and Mainstream. Under the supervision of the Company’s Board of Directors (the “Board” and the members of the Board individually, the “Directors”), Security Investors regularly provides (or oversees the provision of) investment research, advice and supervision, a continuous investment program and the purchase and sale of securities and other investments for each Fund’s portfolio.
On September 20, 2011, Guggenheim Capital, LLC (“Guggenheim Capital”) agreed to purchase Security Benefit Asset Management Holdings, LLC, the indirect holding company of the Investment Manager and certain affiliated businesses (the “Transaction”). Guggenheim Capital’s subsidiary, Guggenheim Partners, LLC (referred to herein with its affiliates and subsidiaries as “Guggenheim”), is a global, independent, privately-held, diversified financial services firm. The Transaction did not result in any material changes to the day-to-day management and operation of the Funds or any increase in fees. In anticipation of the change in corporate ownership structure of the Investment Manager in connection with the Transaction, the Board, including the Directors who are not “interested persons,” as defined by the 1940 Act, of the Company (the “Independent Directors”), met on August 16, 2011 to approve a new investment management between the Company and Security Investors and a new investment sub-advisory agreement between Security Investors and Mainstream, each for an initial term of two years, subject to shareholder approval. This approval was necessary because, under the 1940 Act, the Transaction could result in the termination of the Funds’ investment management agreement with the Investment Manager and the investment sub-advisory agreement with respect to Alpha Opportunity Fund. At a special meeting of shareholders held on December 13, 2011, the Funds’ shareholders approved the new investment management agreement, which became effective March 1, 2012 (the “Investment Management Agreement”) immediately following the close of the Transaction on February 29, 2012. The shareholders of Alpha Opportunity Fund also approved the new investment sub-advisory agreement by and among the Fund, Security Investors and Mainstream, which also became effective March 1, 2012 (the “Investment Sub-Advisory Agreement” and together with the Investment Management Agreement, the “Management Agreements”). Thus, the Management Agreements would not expire (absent action by the Board and the Independent Directors) until March 2014. However, in order to align the consideration
1 The Investment Management Agreement for Guggenheim Enhanced World Equity Fund (the “New Fund”) was approved by the Board of Directors of the Company for an initial term of two years at an in-person meeting of the Board held on February 13, 2013. References herein to the “Funds” should be understood as referring to all series of the Company, excluding the New Fund.
| THE GUGGENHEIM FUNDS ANNUAL REPORT | 85 |
| OTHER INFORMATION (Unaudited) (continued) |
of the Management Agreements with the consideration of other investment advisory agreements for registered investment companies for which Guggenheim Investments serves as investment adviser (collectively, “Guggenheim Funds”) on a consistent contract review schedule with greater uniformity throughout the Guggenheim organization, the Directors determined to consider the continuance of the Investment Management Agreement and the Investment Sub-Advisory Agreement at the June 4, 2013 Board meeting (and, as discussed below, at the August 22, 2013 Board meeting, with respect to Mid Cap Value Fund).
Accordingly, at meetings held in person on May 6, 2013 (the “May Meeting”) and on June 4, 2013 (the “June Meeting”), the members of the Contracts Review Committee of the Board (the “Committee”), consisting solely of the Independent Directors, met independently of Fund management to consider the renewal of the Management Agreements. The members of the Committee also met in person, independently of Fund management, at a meeting held on August 22, 2013 (the “August Meeting”) to consider additional information requested by the Committee in connection with the renewal of the Investment Management Agreement for Mid Cap Value Fund. As part of its review process, the Committee was represented by independent legal counsel to the Independent Directors (“Independent Legal Counsel”). Independent Legal Counsel reviewed with the Committee various factors relevant to the consideration of advisory agreements and the legal responsibilities of the Directors related to such consideration. The Committee took into account various materials received from the Investment Manager, Mainstream, Guggenheim and Independent Legal Counsel. The Committee also considered the variety of written materials, reports and oral presentations it received (and received by the full Board) throughout the year regarding performance and operating results of the Funds.
In connection with the contract review process, Guggenheim engaged FUSE Research Network LLC (“FUSE”), an independent, third party research provider, to prepare advisory contract renewal reports for various boards of directors/trustees in the Guggenheim fund complex, designed specifically to help the boards of directors/trustees fulfill their advisory contract renewal responsibilities. The objective of the reports is to present the subject funds’ relative position regarding fees, expenses and total return performance, with peer group and universe comparisons. Guggenheim management determined to engage FUSE for this purpose in connection with other initiatives designed to improve efficiencies and implement a uniform, streamlined and enhanced 15(c) reporting process across its various product lines. Further to this end, Guggenheim management had multiple discussions with, and sought input from, Independent Legal Counsel and the Committee Chair, in preparing a comprehensive presentation and delivery of information in connection with the contract review process. In addition, the Investment Manager provided information in response to a request for certain additional information following the May Meeting and, with respect to Mid Cap Value Fund, following the June Meeting (collectively with the foregoing reports and materials, the “Contract Materials”).
Among other things, the Investment Manager and the Sub-Adviser provided organizational presentations, staffing reports and biographies of those key personnel of the Investment Manager and, as applicable, the Sub-Adviser providing services to the Funds to assist the Committee in assessing the nature and quality of services provided by the Investment Manager and the Sub-Adviser, respectively, information comparing the investment performance, advisory fees and total expenses of the Funds to other funds (including such information presented in the FUSE reports as well as supplemental information prepared by management), information about the profitability of the Funds to the Investment Manager and revenues received by the Sub-Adviser in connection with the Investment Sub-Advisory Agreement, and information about the compliance and risk management programs of the Investment Manager and the Sub-Adviser.
Following an analysis and discussion of the factors identified below, the Committee concluded that it was in the best interests of the Funds to recommend that the Board approve the renewal of both of the Management Agreements for an additional one year term.
Investment Management Agreement
Nature, Extent and Quality of Services Provided by the Investment Manager: With respect to the nature, extent and quality of services currently provided by the Investment Manager, the Committee noted its various discussions with management concerning the experience and qualifications of the Investment Manager’s personnel responsible for services provided to the Funds, including those personnel providing compliance oversight. In this connection, the Committee also considered the information provided by management describing the education, experience, professional affiliations, area of responsibility and duties of all key personnel performing services for the Funds, as well as management’s report on recent additions and departures in personnel who work on matters relating to the Funds or are significant to the operations of the Investment Manager. The Independent Directors also took into account the various legal, compliance and risk management oversight and staffing initiatives undertaken by management, including, among other things, enhancements to risk management processes and restructuring of the legal and compliance departments in 2012, which management stated was designed to create a cohesive legal and compliance program with increased collaboration among compliance and legal professionals and with other departments across the Guggenheim organization. The
| 86 | THE GUGGENHEIM FUNDS ANNUAL REPORT |
| OTHER INFORMATION (Unaudited) (continued) |
Committee also considered management’s other initiatives intended to achieve greater enhancements and efficiencies in Guggenheim’s ability to provide services to the Guggenheim Funds (including the Funds), such as efforts to streamline and simplify the organizational structure of Guggenheim’s advisory business, as reflected by internal reorganizations of various management entities. Moreover, in connection with the Committee’s evaluation of the overall package of services provided by the Investment Manager, the Committee considered the Investment Manager’s role in monitoring and coordinating compliance responsibilities with the fund administration agent, transfer agent, distributor, custodians and other service providers to the Funds.
Further with respect to the Investment Manager’s resources and its ability to carry out its responsibilities under the Investment Management Agreement, the Committee considered its review of the Investment Manager’s balance sheet and income statement, as well as its discussions with the Investment Manager’s Chief Financial Officer.
The Committee also considered the acceptability of the terms of the Investment Management Agreement. Based on the foregoing, and based on other information received (both oral and written) at the May Meeting and at the June Meeting (and at the August Meeting, with respect to Mid Cap Value Fund), as well as other considerations, the Committee concluded that the Investment Manager and its personnel were qualified to serve the Funds in such capacity.
Investment Performance: The Committee received for each Fund investment returns for the three-month, one-year, three-year and five-year periods ended December 31, 2012 as applicable. In addition, the Committee received a comparison of each Fund’s performance to the performance of a peer group and a broader universe of funds identified by FUSE. The Committee considered a description of the methodology employed by FUSE for identifying each Fund’s peer group and universe for performance and expense comparisons.
With respect to Mid Cap Value Fund, the Committee took into account management’s view that a peer group consisting of small-mid cap value funds rather than mid cap value funds only (as initially identified by FUSE), more appropriately reflected the Fund’s investment strategies and portfolio holdings. In this connection, the Committee considered the methodology employed by FUSE to identify funds that invest in smaller mid-cap equities, small-cap and mid-cap companies, or that have exhibited consistent movement over time between small- and mid-cap companies, as reflected in new comparative peer group and universe data prepared by FUSE and presented at the August Meeting.
In seeking to evaluate performance over a full market cycle, the Committee focused its attention on three- and five-year performance rankings as compared to the relevant universe of funds and noted that relative performance varied among the Funds. For instance, the Committee noted that the Class A shares of each of Alpha Opportunity Fund and World Equity Income Fund ranked above the median of its respective performance universe in both the three-year and five-year periods with Alpha Opportunity ranked in the 1st and 18th percentile for the three-year and five-year periods, respectively, and World Equity Income Fund ranked in the 1st percentile for both periods. The Committee also noted the changes to the name, 80% investment policy, investment objective, principal investment strategies and portfolio management team for World Equity Income Fund recommended by management and approved by the Board at the June Meeting.
With respect to Mid Cap Value Fund, the Committee observed that although the Class A shares of the Fund ranked in the 96th percentile of its performance universe for the three-year period, the shares ranked in the 31st percentile for the five-year period. In the case of Guggenheim StylePlus – Large Core Fund Class A shares, whose performance was below the median of its performance universe in both the three-year and five-year periods (76th and 68th percentile, respectively), the Committee concluded that other factors relevant to performance were sufficient to warrant continuation of the Investment Management Agreement with respect to such Fund, including that the Investment Manager had taken steps designed to help improve the Fund’s investment performance by replacing portfolio managers and modifying the Fund’s investment strategies. For each of Mid Cap Value Institutional Fund and Small Cap Value Fund, the Committee noted that the Funds had been in existence or less than five years. For the Small Cap Value Fund, the Committee noted that the Class A shares performance was competitive at the 63rd percentile. For the Mid Cap Value Institutional Fund, the Committee noted that although performance for the three-year period ranked below median (84th percentile), the one-year performance ranked above median (38th percentile).
With respect to Alpha Opportunity Fund and its active value sleeve, the Committee considered that the Investment Manager does not directly manage the investment portfolio but had delegated such duties to the Sub-Adviser. The Committee also considered the circumstances affecting the management of Alpha Opportunity Fund and, in this regard, noted the information received from the Investment Manager concerning the Fund’s collateral with Lehman Brothers International Europe (“LBIE”) and Lehman Brothers, Inc. (“LBI”) and the prospects for release of the collateral by LBI in conjunction with the potential settlement of LBIE’s claim. In addition, the Committee took into account information received
| THE GUGGENHEIM FUNDS ANNUAL REPORT | 87 |
| OTHER INFORMATION (Unaudited) (continued) |
from the Investment Manager and Sub-Adviser regarding the minimum assets required to manage the Fund’s assets consistent with the Fund’s investment objectives. Based on the information provided, the Committee concluded that the Investment Manager had appropriately reviewed and monitored the Sub-Adviser’s investment performance.
In light of all of the foregoing, the Committee determined that the Funds’ performance was acceptable.
Comparative Fees, Costs of Services Provided and the Profits Realized by the Investment Manager from its Relationship with the Funds: The Committee compared each Fund’s contractual advisory fee and total net expense ratio to the applicable peer group and compared each Fund’s total net expense ratio to its universe of funds for the various classes. The Committee also reviewed the median advisory fees and expense ratios, including expense ratio components (e.g., transfer agency fees, administration fees, other operating expenses, distribution fees and fee waivers/reimbursements) of the peer group of funds. In addition, the Committee considered each Fund’s advisory fee as compared to the advisory fee charged by the Investment Manager to another fund with a similar investment objective and strategies, as applicable, noting that, in certain instances, the Investment Manager charges a lower advisory fee to other clients for which it provides comparable services. In this regard, the Committee considered the Investment Manager’s view that lower fees are imposed in certain instances due to numerous factors, including the scope of contract, types of investors, applicable regulation and legal structures, tax status, and for historical pricing reasons.
In further considering the comparative fee and expense data presented in the Contract Materials and addressed by management, the Committee made the following observations:
| • | Small Cap Value Fund: The Fund’s contractual advisory fee of 1.0%, although higher by 0.05% then that of Series Q (Small Cap Value Series), is within a reasonable range. Although the average advisory fee ranks at the 81st percentile of its peer group, the asset weighted total net expense ratio ranks at the 27th percentile as a result of substantial waivers by the Investment Manager. The amount waived is 0.84% for Class A shares, 0.65% for Class C shares and 0.39% for Institutional class shares. |
| • | Mid Cap Value Fund: The Fund’s contractual advisory fee of 0.79%, although higher by 0.04% than that of Mid Cap Value Institutional Fund and Series V (Mid Cap Value), is within a reasonable range. The contractual advisory fee for each of Class A, B and C of the Fund is at or below the median of its peer group, while the total net expense ratio is in the 71st percentile for Class A and in the 83rd percentile for each of Class B and C. |
| • | Mid Cap Value Institutional Fund: The Fund’s advisory fee is within the 3rd quartile (60th percentile) and the total net expense ratio is at the 80th percentile. |
| • | StylePlus - Large Core Fund: The Fund, with an investment advisory fee of 0.75%, employs a more complex strategy than that of the value portfolios managed by the Investment Manager with an investment advisory fee of 0.65%. The Fund historically has invested in a portfolio of both value and growth securities. In addition, changes to this Fund have recently been approved. The average advisory fees of the Fund are in the third quartile against its peers (73rd percentile), with the asset weighted total net expense ratio at the 100th percentile. With changes being made to the Fund, the Investment Manager believes performance can be enhanced and asset levels increased in the Fund. Higher assets and resulting economies of scale may help reduce other fees associated with the Fund. |
| • | World Equity Income Fund: There are very few funds in the Fund’s peer group (7, including the Fund), which may skew the results of the analysis. This peer group is limited to passive foreign large blend funds, with the Fund ranking in the 100th percentile for average advisory fees and 82nd percentile for asset weighted total net expense ratio. The Investment Manager recommended and the Board approved changes to the Fund’s name, 80% investment policy, investment objective, principal investment strategies and portfolio management team, which management stated were designed to improve performance, increase asset flows and reduce total expense ratio. |
| • | Alpha Opportunity Fund: The Fund’s average advisory fee ranks in 65th percentile of its peer group and the asset weighted total expense ratio is at the 72nd percentile. In addition, the Fund has an expense limitation agreement in place, which may reduce the amount received by Security Investors. In this connection, the Committee considered that although the waiver amount was 0.78% as of September 30, 2012 (as reflected in the FUSE report), management reported that as of March 31, 2013, the waiver amount was 2.11%, resulting in a negative net advisory fee. Thus, the Committee concluded that the fee received by Security Investors was not |
| 88 | THE GUGGENHEIM FUNDS ANNUAL REPORT |
| OTHER INFORMATION (Unaudited) (continued) |
excessive, taking into account the level of assets being actively managed by the Investment Manager as a result of the frozen assets resulting from the Fund’s collateral with LBIE and LBI and the related bankruptcy proceedings.
With respect to the costs of services provided and profits realized by the Investment Manager from its relationship with the Funds, the Committee reviewed information regarding the revenues the Investment Manager received under the Investment Management Agreement as well as the estimated allocated direct and indirect costs the Investment Manager incurred in providing services to the Funds, each Fund’s average assets for 2012 and assets as of December 31, 2012 and the Investment Manager’s pre-tax operating margin with respect to each Fund.
The Committee considered other benefits available to the Investment Manager because of its relationship with the Funds and noted that Security Investors may be deemed to benefit from arrangements whereby the Investment Manager and its affiliate, Rydex Fund Services, LLC, provide accounting and administration services and transfer agency services to certain Guggenheim Funds. The Committee reviewed the compensation arrangements for the provision of the foregoing services. The Committee also noted the Investment Manager’s statement that it may benefit from marketing synergies arising from offering a broad spectrum of products, including the Funds. Based on all of the information provided, the Committee determined that the Investment Manager’s profitability from its relationship with the Funds was not unreasonable.
Economies of Scale to be Realized: The Committee considered management’s view that although Guggenheim may be realizing economies of scale and efficiencies due to its growth in general, it is concurrently realizing new costs and expenses associated with this expansion of its services and continues to add resources required to develop its infrastructure. In addition, the Committee considered the size of the Funds and the competitiveness of the current advisory fee for each Fund.
Sub-Advisory Agreement
Nature, Extent and Quality of Services Provided by the Sub-Adviser : With respect to the nature, extent and quality of services provided by the Sub-Adviser, the Committee considered the qualifications, experience and skills of the Sub-Adviser’s portfolio management and other key personnel and information from the Sub-Adviser describing the scope of its services to the Alpha Opportunity Fund. The Committee also considered the information provided by the Sub-Adviser concerning the Sub-Adviser’s investment practices and techniques, risk management processes, compliance policies and procedures, brokerage allocation, best execution, trade allocation and soft dollar arrangements, among other things. With respect to the Sub-Adviser’s resources and its ability to carry out its responsibilities under the Sub-Advisory Agreement, the Committee reviewed the Sub-Adviser’s balance sheets for 2010 and 2011 and its statement that Mainstream continues to be a viable, going concern.
The Committee also considered the acceptability of the terms of the Sub-Advisory Agreement. Based on the foregoing, and based on other information received (both oral and written) at the May Meeting and at the June Meeting, the Committee concluded that the Sub-Adviser was qualified to provide the services under the Sub-Advisory Agreement.
Investment Performance: The Committee received information regarding the investment performance of the assets managed by the Sub-Adviser for the one-year, three-year, five-year and since inception periods ended December 31, 2012. The Committee compared the Fund’s performance to the performance of the S&P 500 Index. In addition, the Committee considered the Sub-Adviser’s efforts in pursuing the Fund’s investment objective of seeking long-term growth of capital. The Committee noted that although the Fund’s return underperformed the index for the one-year and five-year periods, the Fund outperformed the index for the three-year and since inception periods. The Committee also took into account the information from the Sub-Adviser concerning the minimum assets required to manage the Fund in accordance with its objective.
Comparative Fees, Costs of Services Provided and the Profits Realized by the Sub-Adviser from its Relationship with the Fund: The Committee also reviewed the level of sub-advisory fees payable to Mainstream, noting that the fees would be paid by Security Investors and do not impact the fees paid by the Fund. The Committee compared the sub-advisory fee paid by the Investment Manager to the Sub-Adviser to the fees charged by the Sub-Adviser to other clients including other registered investment companies. The Committee noted the Sub-Adviser’s statements that the Fund’s current fee schedule reflects a discount to both industry and Mainstream’s fee schedule and that Mainstream has no other clients for which it charges a lower advisory fee for comparable services.
Economies of Scale to be Realized: The Committee recognized that, because the Sub-Adviser’s fees would be paid by the Investment Manager and not the Fund, the analysis of economies of scale was more appropriate in the context of the Committee’s consideration of the
| THE GUGGENHEIM FUNDS ANNUAL REPORT | 89 |
| OTHER INFORMATION (Unaudited) (continued) |
Investment Management Agreement, which was separately considered. (See “Investment Management Agreement – Economies of Scale to be Realized” above.)
Overall Conclusions
Based on the foregoing, the Committee determined that the investment advisory fees are fair and reasonable in light of the extent and quality of the services provided and other benefits received and that the continuation of the Management Agreements is in the best interests of the Funds. In reaching this conclusion, no single factor was determinative. The Committee, constituting all of the Independent Directors, recommended the renewal of each of the Investment Management and Sub-Advisory Agreements for an additional annual term.
Guggenheim Enhanced World Equity Fund
Security Equity Fund (the “Company”) was organized as a Kansas corporation on November 27, 1961 and is registered as an open-end management investment company under the Investment Company Act of 1940, as amended (the “1940 Act”). The Company consists of seven series, each representing a separate fund and offered to eligible investors as follows: Guggenheim StylePlus – Large Core Fund (formerly, Guggenheim Large Cap Core Fund), Guggenheim Alpha Opportunity Fund, Guggenheim World Equity Income Fund (formerly, Guggenheim MSCI EAFE Equal Weight Fund), Guggenheim Mid Cap Value Fund, Guggenheim Mid Cap Value Institutional Fund, Guggenheim Small Cap Value Fund and a recently launched fund, Guggenheim Enhanced World Equity Fund (the “New Fund” and collectively with the other series, the “Funds” and each, a “Fund”). Security Investors, LLC, also known as Guggenheim Investments (“Security Investors”), serves as investment adviser to the Company with respect to each Fund, with the exception of the New Fund, pursuant to an investment management agreement between the Company and Security Investors (the “Management Agreement”). Guggenheim Partners Investment Management, LLC (“GPIM” or the “Adviser”) serves as investment adviser to the Company with respect to the New Fund pursuant to an investment advisory agreement between the Company and GPIM (the “Advisory Agreement”). Under the supervision of the Company’s Board of Directors (the “Board” and the members of the Board individually, the “Directors”), Security Investors or GPIM regularly provides (or oversees the provision of) investment research, advice and supervision, a continuous investment program and the purchase and sale of securities and other investments for each Fund’s portfolio, as applicable.
At a meeting held in-person on February 13, 2013 (the “February Meeting”), each of the Directors who is not an “interested person,” as defined by the 1940 Act, of the Company (collectively, the “Independent Directors”), met independently of Fund management to consider the approval of the proposed Advisory Agreement with respect to the New Fund. As part of its review process, the Independent Directors were represented by independent legal counsel (“Independent Legal Counsel”). Independent Legal Counsel reviewed with the Independent Directors various factors relevant to the consideration of advisory agreements and the legal responsibilities of the Directors related to such consideration and assisted the Independent Directors in their deliberations.
The Board, including the Independent Directors, discussed the proposed Advisory Agreement in light of the regulatory requirements and criteria in a memorandum of law included in the meeting materials and assessed information concerning the New Fund’s fees and expenses, investment objectives and policies, investment strategies and models, portfolio construction process, strategy performance and portfolio management team, among other things. The Board also considered the variety of written materials, reports and oral presentations it received throughout the year regarding performance and operating results of the Funds and other registered investment companies for which GPIM serves as investment adviser or sub-adviser.
Following an analysis and discussion of the factors identified below, the Board concluded that it was in the best interests of the New Fund to approve the Advisory Agreement for an initial term of two years.
Nature, Extent and Quality of Services to be Provided by the Adviser: With respect to the nature, extent and quality of services to be provided by the Adviser, the Independent Directors considered the functions to be performed by the Adviser for the New Fund and reviewed information describing the background and experience of the persons to be responsible for the day-to-day management of the New Fund. In this connection, the Independent Directors took into account the nature and quality of services provided by GPIM in the past, the firm’s management capabilities, the professional qualifications and experience of its portfolio managers, and its investment and management oversight processes.
| 90 | THE GUGGENHEIM FUNDS ANNUAL REPORT |
| OTHER INFORMATION (Unaudited) (concluded) |
The Board also considered the acceptability of the terms of the Advisory Agreement, noting that the terms were consistent with the terms of the Management Agreement with respect to the other Funds. Based on the foregoing, and based on other information received (both oral and written) at the February Meeting, as well as other considerations, the Board concluded that the Adviser and its personnel were capable of providing high quality services to the New Fund.
Investment Performance: With respect to performance, the Board noted that the New Fund had no performance history and, instead, considered that the proposed strategy’s back-tested performance generated positive excess returns, net of fees, relative to the MSCI World Index in 38 out of 39 rolling three-year periods, lagging only in the three-years ending March 2012 by 1.8% cumulative. The Board also considered management’s explanation that the investment strategy for the New Fund targets the global equity exposure of the MSCI World Index and employs GPIM’s dynamic, rules-based volatility income model that seeks to turn equity market volatility into income and deliver an enhanced equity exposure. The Board noted that the New Fund’s investment objective is to seek to achieve total return, comprised of capital appreciation and current income. In this connection, the Board noted that New Fund will seek to achieve its investment objective primarily through a two-part strategy. The Fund will invest, under normal circumstances, at least 80% of its assets in a basket of exchange-traded funds (“ETFs”) that represent exposure to segments of the global equity markets. In addition, the Fund will utilize a call option writing strategy that seeks to generate current income that exceeds the dividend yields of equity securities while also mitigating overall portfolio maturity. The Board also noted that the ETF portfolio will be quantitatively constructed and qualitatively managed. The Board determined that GPIM’s performance was expected to be acceptable.
Comparative Fees, Costs of Services Provided and the Profits to be Realized by the Adviser from its Relationship with the New Fund: The Board evaluated the New Fund’s proposed investment advisory fee and total expense ratio. The Board considered that the New Fund’s proposed annual advisory fee of 0.70% was below both the average advisory fee of its Morningstar peer group of 0.76% and the median of 0.80%. The Board also took into account that the New Fund’s total expense ratio, after expense reimbursement, of 1.50% was above the peer group median of 1.40% and average of 1.47%. The Board considered the competitiveness of the advisory fee and total expense ratio of the New Fund in light of the average investment advisory fee and expense ratio for comparable funds in its Morningstar peer group. In this connection, the Board took into account that GPIM proposed a fee waiver/expense limitation agreement with respect to the New Fund limiting ordinary operating expenses to 1.50% for Class A shares, 2.25% for Class C shares and 1.25% for Institutional Class shares.
With respect to the costs of advisory services to be provided and estimated level of profitability, on the basis of the Directors’ review of the fees to be charged by GPIM for investment advisory and related services, the Board concluded that it was too early to predict profitability from the New Fund, but noted that this matter would be considered in connection with the contract renewal process.
With respect to other benefits available to the Adviser and its affiliates because of their relationship with the New Fund, the Board considered fees charged by GPIM and its affiliates for related services, benefits such as any soft dollar usage by GPIM, and any intangible benefits, and concluded that the proposed advisory fee appropriately reflected such benefits.
Economies of Scale to be Realized: With respect to economies of scale, the Board considered that the Fund was in its start-up phase and concluded that the advisory fee schedule reflected an appropriate level of sharing of any economies of scale. The Directors considered management’s view that the New Fund’s proposed advisory fee of 0.70% annually of average daily net assets, payable to GPIM, appropriately reflected the current economic environment and the competitive nature of the mutual fund market. The Directors also noted that they would have the opportunity in the future to periodically re-examine whether the Funds had achieved economies of scale and the appropriateness of the advisory fees payable by the New Fund to GPIM.
Overall Conclusions
Based on the foregoing, the Independent Directors determined that the proposed investment advisory fees for the New Fund are fair and reasonable in light of the extent and quality of the services to be provided and other benefits to be received and that the approval of the Advisory Agreement is in the best interests of the New Fund. In reaching this conclusion, no single factor was determinative. The Board, including all of the Independent Directors, approved the Advisory Agreement for an initial term of two years with respect to the New Fund.
| THE GUGGENHEIM FUNDS ANNUAL REPORT | 91 |
| INFORMATION ON BOARD OF DIRECTORS AND OFFICERS (Unaudited) |
DIRECTORS
All Directors and Officers may be reached c/o Guggenheim Investments, 805 King Farm Boulevard, Suite 600, Rockville, MD 20850.
| Name | | |
| (Date of Birth) | Principal Occupations | Other Directorships |
| Year Elected*** | During Past Five Years | Held by Director |
| | | |
| Donald A. Chubb, Jr.** | Current: Business broker and manager of commercial real estate, | None |
| (12-14-46) | Griffith & Blair, Inc. Realtors | |
| 1994 | | |
| | | |
| Harry W. Craig, Jr.** | Current: Chairman, CEO, & Director, The Craig Group, Inc.; | None |
| (05-11-39) | Managing Member of Craig Family Investments, LLC | |
| 2004 | | |
| | Previous: Prior to November 2009, Chairman, CEO, | |
| | Secretary and Director, Martin Tractor Company | |
| | | |
| Jerry B. Farley** | Current: President, Washburn University | Director, Westar Energy, Inc. |
| (09-20-46) | | |
| 2005 | | |
| | | |
| Penny A. Lumpkin** | Current: Partner, Vivian’s Gift Shop (Corporate Retail); | None |
| (08-20-39) | Vice President, Palmer Companies, Inc. | |
| 1993 | (Small Business and Shopping Center Development); | |
| | PLB (Real Estate Equipment Leasing) | |
| | | |
| Maynard F. Oliverius** | Retired: Formerly, President and Chief Executive Officer, | None |
| (12-18-43) | Stormont-Vail HealthCare until 2012. | |
| 1998 | | |
| | | |
| Donald C. Cacciapaglia* | Current: Guggenheim Investments: President and | None |
| (07-01-51) | Chief Administrative Officer from February 2010 to present | |
| 2012 (President) | | |
| | Previous: Channel Capital Group, Inc.; Chairman and | |
| | CEO from April 2002 to February 2010 | |
| * | This Director is deemed to be an “interested person” of the Funds under the 1940 Act, as amended, by reason of his position with the Funds’ Investment Manager and/or the parent of the Investment Manager. This Director is also an officer of the Funds. |
| ** | These Directors serve on the Fund’s joint audit committee, the purpose of which is to meet with the independent registered public accounting firm, to review the work of the independent registered public accounting firm, and to oversee the handling by Security Investors of the accounting and financial reporting functions for the Funds. |
| *** | Each Director oversees 31 portfolios in the fund complex (211 funds are overseen by Mr. Cacciapaglia) and serves until the next annual meeting, or until a successor has been duly elected and qualified. |
| 92 | THE GUGGENHEIM FUNDS ANNUAL REPORT |
| INFORMATION ON BOARD OF DIRECTORS AND OFFICERS (Unaudited) (concluded) |
OFFICERS*
Name (Date of Birth) Title – Year Elected | Principal Occupations
During Past Five Years |
| | |
Elisabeth Miller (06-06-68) Chief Compliance Officer - 2012 | Current: Chief Compliance Officer, Rydex Series Funds, Rydex ETF Trust, Rydex Dynamic Funds, and Rydex Variable Trust; Chief Compliance Officer, Security Equity Fund, Security Income Fund, Security Large Cap Value Fund, Security Mid Cap Growth Fund, and SBL Fund; Chief Compliance Officer, Security Investors, LLC; and Chief Compliance Officer, Guggenheim Distributors, LLC (f/k/a Rydex Distributors, LLC) |
| | |
| | Previous: Senior Manager, Security Investors, LLC and Guggenheim Distributors, LLC (f/k/a Rydex Distributors, LLC) (2004–2009). |
| | |
Nikolaos Bonos (05-30-63)
Treasurer - 2010 | Current: Senior Vice President, Security Investors, LLC; Chief Executive Officer & Manager, Rydex Specialized Products, LLC; Chief Executive Officer & President, Rydex Fund Services, LLC; Vice President, Rydex Holdings, LLC; Vice President & Treasurer, Rydex Series Funds; Rydex ETF Trust; Rydex Dynamic Funds; and Rydex Variable Trust; and Vice President, Security Benefit Asset Management Holdings, LLC |
| | |
| | Previous: Senior Vice President, Security Global Investors, LLC (2010–2011); and Senior Vice President, Rydex Advisors, LLC (f/k/a PADCO Advisors, Inc.) and Rydex Advisors II, LLC (f/k/a PADCO Advisors II, Inc.) |
| | |
Joseph M. Arruda (09-05-66) Assistant Treasurer - 2010 | Current: Vice President, Security Investors, LLC; Chief Financial Officer & Manager, Rydex Specialized Products, LLC; and Assistant Treasurer, Rydex Series Funds; Rydex Dynamic Funds; Rydex ETF Trust; and Rydex Variable Trust |
| | |
| | Previous: Vice President, Security Global Investors, LLC (2010–2011); and Vice President, Rydex Advisors, LLC (f/k/a PADCO Advisors, Inc.) and Rydex Advisors II, LLC (f/k/a PADCO Advisors II, Inc.) (2010) |
| | |
Amy J. Lee (06-05-61) Vice President – 2007 Secretary - 1987 | Current: Senior Vice President & Secretary, Security Investors, LLC; Secretary & Chief Compliance Officer, Security Distributors, Inc.; Vice President, Associate General Counsel & Assistant Secretary, Security Benefit Life Insurance Company and Security Benefit Corporation; Associate General Counsel, First Security Benefit Life Insurance and Annuity of New York; Vice President & Assistant Secretary, Rydex Series Funds, Rydex ETF Trust, Rydex Dynamic Funds, and Rydex Variable Trust; Vice President & Secretary, Rydex Holdings, LLC, Secretary, Advisor Research Center, Inc., Rydex Specialized Products, LLC, Guggenheim Distributors, LLC (f/k/a Rydex Distributors, LLC) and Rydex Fund Services, LLC; and Assistant Secretary, Security Benefit Clinic and Hospital |
| | |
| | Previous: Senior Vice President & Secretary, Security Global Investors, LLC (2007–2011); Senior Vice President & Secretary, Rydex Advisors, LLC (f/k/a PADCO Advisors, Inc.) and Rydex Advisors II, LLC (f/k/a PADCO Advisors II, Inc.) (2010); and Director, Brecek & Young Advisors, Inc. (2004–2008) |
| | |
Mark A. Mitchell (08-24-64) | Current: Portfolio Manager, Security Investors, LLC |
| Vice President - 2003 | Previous: Vice President and Portfolio Manager, Security Benefit Life Insurance Company (2003–2010) |
| | |
James P. Schier (12-28-57) | Current: Senior Portfolio Manager, Security Investors, LLC |
| Vice President - 1998 | Previous: Vice President and Senior Portfolio Manager, Security Benefit Life Insurance Company (1998–2010) |
* Officers serve until the next annual meeting or until a successor has been duly elected and qualified.
| THE GUGGENHEIM FUNDS ANNUAL REPORT | 93 |
| GUGGENHEIM INVESTMENTS PRIVACY POLICIES |
Rydex Funds, Guggenheim Funds, Rydex Investments, Guggenheim Distributors, LLC, Security Investors, LLC, Security Distributors, Inc. and Rydex Advisory Services (Collectively “Guggenheim Investments”).
Our Commitment to You
When you become a Guggenheim Investments investor, you entrust us with not only your hard-earned money but also with personal and financial information about you. We recognize that your relationship with us is based on trust and that you expect us to act responsibly and in your best interests. Because we have access to this private information about you, we hold ourselves to the highest standards in its safekeeping and use. This means, most importantly, that we do not sell client information to anyone—whether it is your personal information or if you are a current or former Guggenheim Investments client.
The Information We Collect About You
In the course of doing business with shareholders and investors, we collect nonpublic personal information about you. You typically provide personal information when you complete a Guggenheim Investments account application or when you request a transaction that involves Rydex and Guggenheim Investments funds or one of the Guggenheim Investments affiliated companies. “Nonpublic personal information” is personally identifiable private information about you. For example, it includes information regarding your name and address, Social Security or taxpayer identification number, assets, income, account balance, bank account information and investment activity (e.g., purchase and redemption history).
How We Handle Your Personal Information
As emphasized above, we do not sell information about current or former clients or their accounts to third parties. Nor do we share such information, except when necessary to complete transactions at your request or to make you aware of related investment products and services that we offer. Additional details about how we handle your personal information are provided below. To complete certain transactions or account changes that you direct, it may be necessary to provide identifying information to companies, individuals or groups that are not affiliated with Guggenheim Investments. For example, if you ask to transfer assets from another financial institution to Guggenheim Investments, we will need to provide certain information about you to that company to complete the transaction. To alert you to other Guggenheim Investments investment products and services, we may share your information within the Guggenheim Investments family of affiliated companies. This would include, for example, sharing your information within Guggenheim Investments so we can make you aware of new Rydex and Guggenheim Investments funds or the services offered through another Guggenheim Investments affiliated company. In certain instances, we may contract with nonaffiliated companies to perform services for us. Where necessary, we will disclose information we have about you to these third parties. In all such cases, we provide the third party with only the information necessary to carry out its assigned responsibilities and only for that purpose. And we require these third parties to treat your private information with the same high degree of confidentiality that we do. In certain instances, we may share information with other financial institutions regarding individuals and entities in response to the U.S.A. Patriot Act. Finally, we will release information about you if you direct us to do so, if we are compelled by law to do so or in other circumstances permitted by law.
Opt Out Provisions
We do not sell your personal information to anyone. The law allows you to “opt out” of only certain kinds of information sharing with third parties. The firm does not share personal information about you with any third parties that triggers this opt-out right. This means YOU ARE ALREADY OPTED OUT.
How We Protect Privacy Online
Our concern for the privacy of our shareholders also extends to those who use our web site, guggenheiminvestments.com. Our web site uses some of the most secure forms of online communication available, including encryption technology, Secure Socket Layer (SSL) protocol, firewalls and user names and passwords. These technologies provide a high level of security and privacy when you access your account information or initiate online transactions. The Guggenheim Investments web site offers customized features that require our use of “http cookies”—tiny pieces of information that we ask your browser to store. However, we make very limited use of these cookies. We only use cookies for session management and security features on the Guggenheim Investments web site. We do not use them to pull data from your hard drive, to learn your email address, or to view data in cookies created by other web sites. We will not share the information in our cookies or give others access to it. See the legal information area on our web site for more details about web site security and privacy features.
| 94 | THE GUGGENHEIM FUNDS ANNUAL REPORT |
| GUGGENHEIM INVESTMENTS PRIVACY POLICIES (concluded) |
How We Safeguard Your Personal Information
We restrict access to nonpublic personal information about shareholders to our employees and in some cases to third parties (for example, the service providers described above) as permitted by law. We maintain strict physical, electronic and procedural safeguards that comply with federal standards to guard your nonpublic personal information.
We’ll Keep You Informed
As required by federal law, we will notify shareholders of our privacy policy annually. We reserve the right to modify this policy at any time, but rest assured that if we do change it, we will tell you promptly. You will also be able to access our privacy policy from our web site at guggenheiminvestments.com. Should you have any questions regarding our privacy policy, contact us at 800.820.0888 or 301.296.5100.
| THE GUGGENHEIM FUNDS ANNUAL REPORT | 95 |
| This page intentionally left blank. |
| This page intentionally left blank. |
| This page intentionally left blank. |
| This page intentionally left blank. |
| This page intentionally left blank. |
| This page intentionally left blank. |
The registrant’s Board of Directors has adopted a code of ethics that applies to the registrant’s principal executive officer and principal financial officer. No substantive amendments were approved or waivers were granted to the Code during the period covered by this report. The Code is filed as an exhibit to this Form N-CSR.
| Item 3. | Audit Committee Financial Expert. |
The Registrant’s Board of Directors has determined that Maynard Oliverius, a member of the Audit Committee of the Board, is an audit committee financial expert. Mr. Oliverius is “independent” for purposes of this item.
| Item 4. | Principal Accountant Fees and Services. |
| (a) | Audit Fees. The aggregate fees billed for each of the last two fiscal years (the “Reporting Periods”) for professional services rendered by the Registrant’s principal accountant (the “Auditor”) for the audit of the Registrant’s annual financial statements, or services that are normally provided by the Auditor in connection with the statutory and regulatory filings or engagements for the Reporting Periods, were $136,031 in 2012 and $131,800 in 2013. |
| (b) | Audit-Related Fees. The aggregate fees billed in the Reporting Periods for assurance and related services by the Auditor that are reasonably related to the performance of the audit of the Registrant’s financial statements and are not reported under paragraph (a) of this Item 4 were $0 in 2012 and $0 in 2013. These services consisted of financial reporting advisory services. |
| | The aggregate fees billed in the Reporting Periods for assurance and related services by the Auditor to the Registrant’s investment adviser (not including any sub-investment adviser whose role is primarily portfolio management and is subcontracted with or overseen by another investment adviser), and any entity controlling, controlled by or under common control with the investment adviser that provides ongoing services to the Registrant (“Service Affiliates”) which required pre-approval by the Audit Committee were $35,000 in 2012 and $35,000 in 2013, which related to the review of the transfer agent function. |
| (c) | Tax Fees. The aggregate fees billed to the Registrant in the Reporting Periods for professional services rendered by the Auditor for tax compliance, tax advice and tax planning (“Tax Services”) were $41,230 in 2012 and $49,450 in 2013. These services consisted of (i) preparation of U.S. federal, state and excise tax returns; (ii) U.S. federal and state tax planning, advice and assistance regarding statutory, regulatory or administrative developments, (iii) tax advice regarding tax qualification matters and/or treatment of various financial instruments held or proposed to be acquired and (iv) review of U.S. federal excise distribution calculations. |
| | The aggregate fees billed in the Reporting Periods for Tax Services by the Auditor to Service Affiliates which required pre-approval by the Audit Committee were $0 in 2012 and $0 in 2013. |
| (d) | All Other Fees. The aggregate fees billed to the Registrant in the Reporting Periods for products and services provided by the Auditor, other than the services reported in paragraphs (a) through (c) of this Item, were $0 in 2012 and $0 in 2013. |
| | The aggregate fees billed in the Reporting Periods for Non-Audit Services by the Auditor to Service Affiliates, other than the services reported in paragraphs (b) through (d) of this Item, which required pre-approval by the Audit Committee were $0 in 2012 and $0 in 2013. |
| (e) | (1) | Audit Committee Pre-Approval Policies and Procedures. The Registrant’s Audit Committee has established policies and procedures for pre-approval of the auditor’s engagements for audit and non-audit services to the Registrant. Pre-approval considerations include whether the proposed services are compatible with maintaining the auditor’s independence as specified in applicable rules. |
| | | |
| (e) | (2) | Percentage of Non-Audit Services Approved under (c)(7)(i)(C). The percentage of the services described in each of (b) through (d) of this Item 4 (only those that relate to the Registrant) that were approved by the Audit Committee pursuant to paragraph (c)(7)(i)(C) of Rule 2-01 of Regulation S-X was 0%, 0% and 0%, respectively. |
| (g) | Non-Audit Fees. The aggregate non-audit fees were for audit-related and tax services rendered to the Registrant, and rendered to Service Affiliates, for the Reporting Periods were $76,230 in 2012 and $84,450 in 2013. |
| (h) | Auditor Independence. The Registrant’s Audit Committee was provided with information relating to the provision of non-audit services by Ernst & Young, LLP to the Registrant’s investment adviser (not including any subadviser whose role is primarily portfolio management and is subcontracted with or overseen by another investment adviser), and any entity controlling, controlled by, or under common control with the investment adviser that provides ongoing services to the registrant that were not pre-approved by the Audit Committee so that a determination could be made whether the provision of such services is compatible with maintaining Ernst & Young, LLP’s independence. |
| Item 5. | Audit Committee of Listed Registrants. |
Not applicable.
The Schedule of Investments is included under Item 1 of this form.
| Item 7. | Disclosure of Proxy Voting Policies and Procedures for Closed-End Management Investment Companies. |
Not applicable.
| Item 8. | Portfolio Mangers of Closed-end Management Investment Companies |
Not applicable
| Item 9. | Purchases of Equity Securities by Closed-End Management Investment Company and Affiliated Purchasers. |
Not applicable.
| Item 10. | Submission of Matters to a Vote of Security Holders. |
The registrant does not currently have in place procedures by which shareholders may recommend nominees to the registrant’s board.
There have been no changes to the procedures by which shareholders may recommend nominees to the registrant’s board.
| Item 11. | Controls and Procedures. |
| (a) | The registrant’s President (principal executive officer) and Treasurer (principal financial officer) have evaluated the registrant’s disclosure controls and procedures within 90 days of this filing and have concluded that the registrant’s disclosure controls and procedures were effective as of that date in ensuring that information required to be disclosed by the registrant in this Form N-CSR was recorded, processed, summarized, and reported timely. |
| (b) | The registrant’s principal executive officer and principal financial officer are aware of no change in the registrant’s internal control over financial reporting that occurred during the registrant’s second fiscal quarter covered by this report that has materially affected, or is reasonably likely to materially affect, the registrant’s internal control over financial reporting. |
| (a)(1) | The registrant’s code of ethics pursuant to Item 2 of Form N-CSR is attached. |
| (a)(2) | Separate certifications by the President (principal executive officer) and Treasurer (principal financial officer) of the registrant as required by Rule 30a-2(a) under the Act (17 CFR 270.30a-2(a)) are attached. |
| (b) | A certification by the registrant’s President (principal executive officer) and Treasurer (principal financial officer) as required by Rule 30a-2(b) under the Act (17 CFR 270.30a-2(b)) is attached. |
SIGNATURES
Pursuant to the requirements of the Securities Exchange Act of 1934 and the Investment Company Act of 1940, the registrant has duly caused this report to be signed on its behalf by the undersigned, thereunto duly authorized.
| (Registrant) | Security Equity Fund | |
| By (Signature and Title)* | /s/ Donald C. Cacciapaglia | |
| | Donald C. Cacciapaglia, President | |
Pursuant to the requirements of the Securities Exchange Act of 1934 and the Investment Company Act of 1940, this report has been signed below by the following persons on behalf of the registrant and in the capacities and on the dates indicated.
| By (Signature and Title)* | /s/ Donald C. Cacciapaglia | |
| | Donald C. Cacciapaglia, President | |
| By (Signature and Title)* | /s/ Nikolaos Bonos | |
| | Nikolaos Bonos, Treasurer | |
* Print the name and title of each signing officer under his or her signature.