Item 1: Report to Shareholders| Mid-Cap Growth Fund | December 31, 2006 |
The views and opinions in this report were current as of December 31, 2006. They are not guarantees of performance or investment results and should not be taken as investment advice. Investment decisions reflect a variety of factors, and the managers reserve the right to change their views about individual stocks, sectors, and the markets at any time. As a result, the views expressed should not be relied upon as a forecast of the fund’s future investment intent. The report is certified under the Sarbanes-Oxley Act, which requires mutual funds and other public companies to affirm that, to the best of their knowledge, the information in their financial reports is fairly and accurately stated in all material respects.
REPORTS ON THE WEB
Sign up for our E-mail Program, and you can begin to receive updated fund reports and prospectuses online rather than through the mail. Log in to your account at troweprice.com for more information.
Fellow Shareholders
Investors enjoyed another good year in 2006 as stocks benefited from strong profit growth, a durable economic expansion, and, most notably, massive pools of liquidity coursing through the world financial system. The latter had some unusual effects on the character of the market’s advance, however. Many companies became the subject of takeover speculation, which sent their shares jumping, and others felt the impact of volatile commodity prices, which soared and then plunged as speculators moved in and out of the markets. In our opinion, these factors took the spotlight off the highest-quality firms, which promise to enrich investors slowly through long-term profit growth. Our fund enjoyed a gain in this environment, but mid-cap growth stocks lagged other classes, and our results lagged our benchmarks.

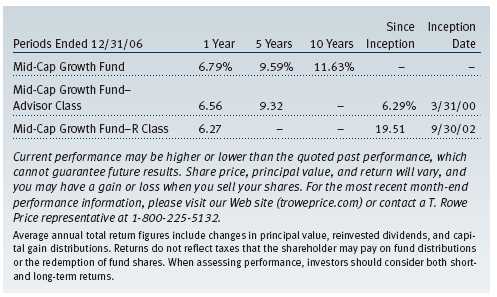
The Mid-Cap Growth Fund returned 5.49% during the past six months and 6.79% for the year. (Returns for Advisor and R Class shares were lower due to their different fee structure.) Our performance relative to the benchmarks reflected our emphasis on traditional growth sectors, such as technology and health care. These fared poorly in relation to traditional value sectors, such as utilities, materials, and real estate investment trusts (REITs). The latter played an important role in boosting index returns, even in the growth benchmarks.
We prefer never to underperform, of course, but we are not surprised to do so in environments that do not favor our approach. Our goal is to beat our benchmarks over longer periods, and in this we remain successful. The fund ranked in the top 19% of its category for the three-year period ended December 31, within the top 12% for the five-year period, and within the top 7% for the 10-year period. (Based on cumulative total return, Lipper ranked the Mid-Cap Growth Fund 392 out of 621, 92 out of 489, 46 out of 385, and 10 out of 153 funds in the category for the 1-, 3-, 5-, and 10-year periods ended December 31, 2006, respectively. Past performance cannot guarantee future results.)
HIGHLIGHTS
• Investors enjoyed another good year in 2006 as stocks benefited from strong profit growth, a durable economic expansion, and, most notably, massive pools of liquidity coursing through the world financial system.
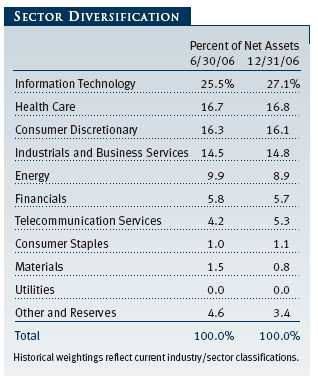
• The information technology sector offered the fund some of its best and worst results over the past six months. We think the sector is teeming with companies with excellent prospects, solid balance sheets, and much more shareholder-oriented managements than they had only a few years ago.
• We have large and diversified holdings in the industrials and business services sector based partly on our past success in identifying capable, shareholder-friendly managements.
• As we research firms and meet with their leaders, we are finding many very strong companies that appear quite reasonably priced even after four years of market gains.
MARKET ENVIRONMENT
Signs earlier in the year that the economy was slowing proved to be accurate. Gross domestic product slowed from an annualized growth rate of 5.6% in the first quarter to 2.6% in the second and 2.0% in the third. The primary culprit in the slowdown was the ailing housing sector, which had two sets of effects on the broader economy. First, declining home construction weakened an important labor market and fed directly into worsening conditions for building products suppliers and other firms. Second, falling or stagnant home prices left homeowners less able to draw down their home equity through home equity loans or other means.
Several factors mitigated the drag of the housing slowdown on the economy. After raising interest rates consistently for two years, the Federal Reserve interrupted its restrictive monetary policy in August, “pausing” to determine if more hikes were needed. While the Fed remained concerned about inflation—and price gauges remained uncomfortably elevated throughout the fall—it indicated its willingness to wait to see if the “cumulative effects” of its prior increases would wring it out of the system.
Second, better conditions for the American consumer helped keep the expansion aloft. Employers continued to add to payrolls throughout the year. While monthly employment gains were generally modest, they were enough to bring the unemployment rate down to 4.4% in October, its lowest level in over five years. Another factor boosting moods and wallets was the drop in gasoline prices beginning in the summer. Oil prices slipped from above $70 to below $60 per barrel, and a relatively quiet hurricane season eased some of the refining constraints that had caused prices at the pump to vault late in 2005.
Finally, the American economy threw off some of the burden of driving the world economy. The U.S. stood aside in 2006 as European economies began to show new vigor, and China, India, and other developing nations continued to grow rapidly. Partially in response to healthier growth overseas, the U.S. dollar declined against the euro and other major currencies, helping boost U.S. exports. The flagging Japanese recovery was the sole significant weak point in the world economy, and the dollar rose against the yen for much of the year.
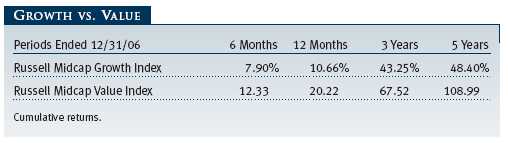
Decent conditions at home and improving ones overseas helped U.S. corporations continue to record strong profits, which in turn fueled further market gains. All major indices moved higher, but mid-cap shares lagged both large- and small-caps. While mid-cap returns might usually be expected to fall in the middle of their larger and smaller brethren, the results also balanced out mid-caps’ domination of the other two classes in 2005. As measured by various Russell indexes, value stocks outperformed growth across all market capitalizations, and more value-oriented shares fared better within the Russell Midcap Growth Index.
PORTFOLIO REVIEW
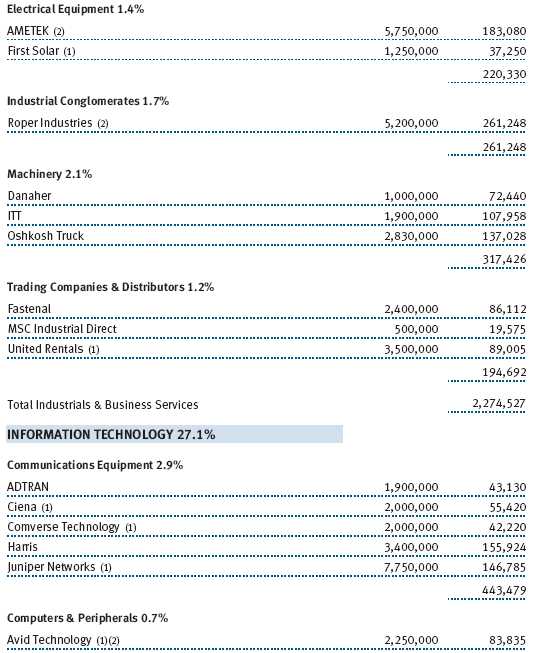
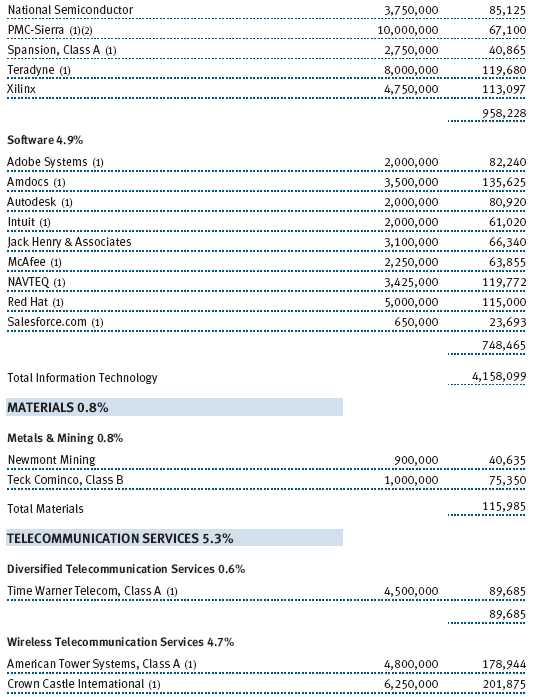
Somewhat paradoxically, the information technology sector offered the fund both its best and its worst results over the past six months. On the positive side, the sector as a whole contributed the most to the fund’s absolute returns over the period. Indeed, two of our best contributors for the period were electronic instrument firms Symbol Technologies and FLIR Systems. Shares of Symbol, which makes hand-held devices that scan bar codes and store inventory data, benefited from the takeover wave which arrived in the form of an acquisition by Motorola. FLIR Systems, a maker of thermal imaging equipment, bounced back after poor performance earlier in the year. Communications and software holdings were also generally good performers.
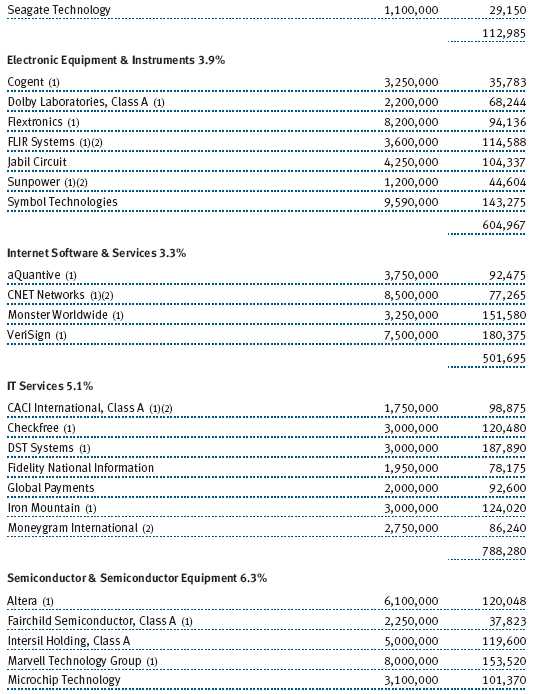
We owned several technology companies that detracted significantly from results, however. A particularly poor performer was NAVTEQ, a provider of digital map information for mobile navigation devices and the Internet. The company suffered from difficulties calibrating its expenses in a market that is becoming more seasonal in nature. Although it operates in a duopoly competitive structure, its primary competitor, with less market share than NAVTEQ, sought to close the gap. Several semiconductor holdings, most notably Marvell Technology Group, were also poor performers. Our relative results suffered from our avoidance of lower-quality companies, which benefited from takeover speculation. This was particularly true of IT services firms, which performed well as a group.
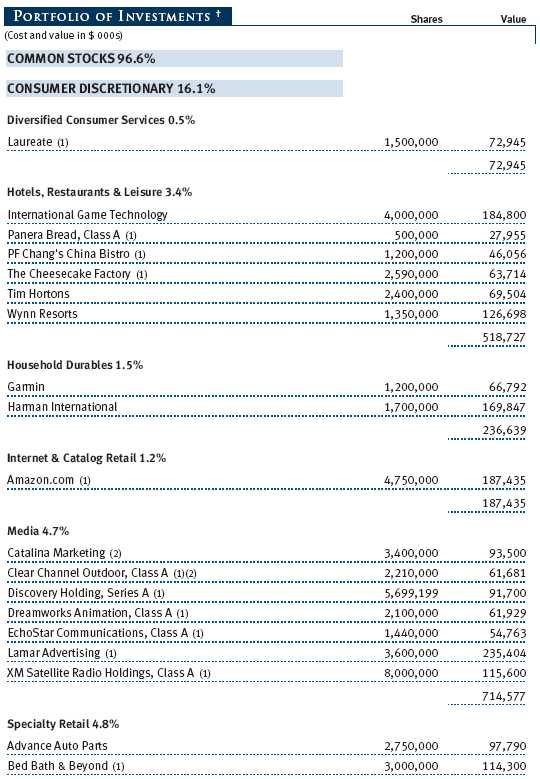
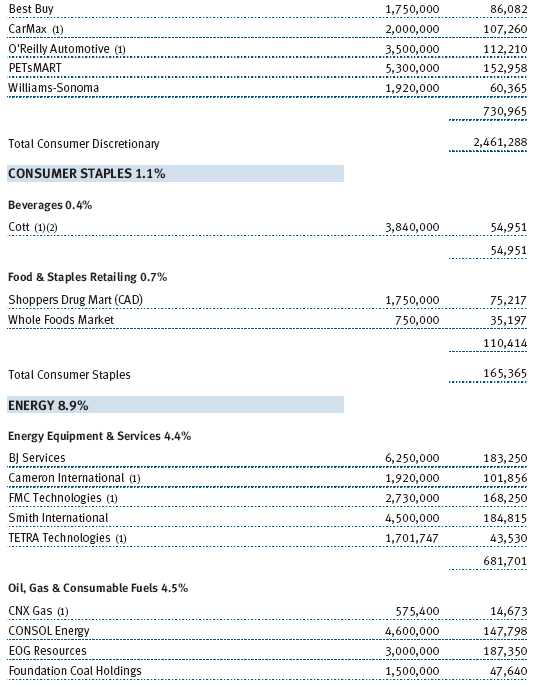
We generated better returns in the consumer sector. Lamar Advertising, a large outdoor billboard firm, continued to enjoy high demand for its unique electronic billboards. We think used-car retailer CarMax has simply invented a better mousetrap through its online sales system, and other investors apparently agreed, making the company our fourth-best performing holding over the past six months. Investors were also enthusiastic about International Game Technology, the leading producer of computerized gaming equipment, which is benefiting from the proliferation of gaming around the globe.
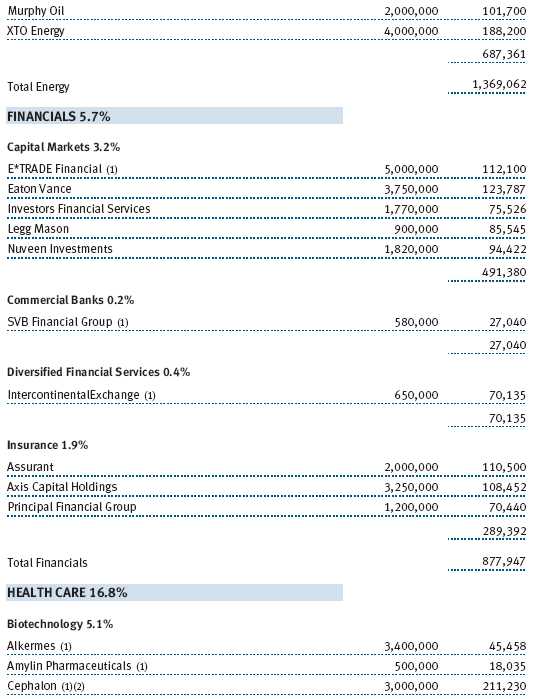
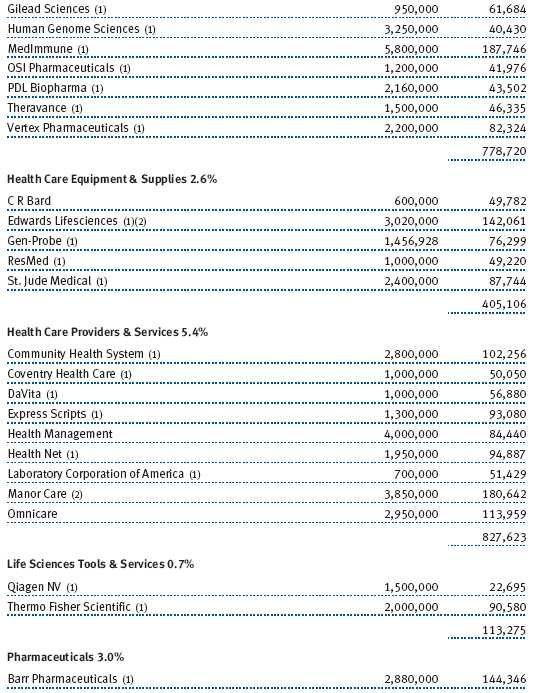
Our biotechnology holdings are typically a mixed bag, with some soaring in response to promising new drugs and others tumbling in reaction to poor clinical results or other factors. Our goal is simply to have more of the former than the latter, which was the case in the second half of 2006. Myogen, Cephalon, and MedImmune were among our top contributors, while Amylin Pharmaceuticals and Alkermes weighed on performance.
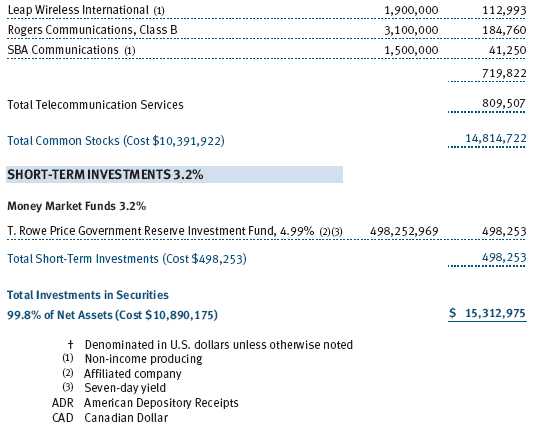
Telecommunications is a more predictable business, but our holdings in this area were mixed as well. Our leading contributor in the past six months was cable and wireless firm Rogers Communications, which had excellent results in both segments. Another solid performer was Leap Wireless, which targets lower-income customers through the use of no-strings service plans. Still, Leap is the type of holding we keep an especially close eye on, given the potential for a larger carrier to enter the discount market—a foolish move, we think, but one that would be detrimental to Leap. On the other hand, shares of cellular tower operator Crown Castle International fell in response to worries over the company’s acquisition of a smaller rival. We continue to believe that Crown’s cell phone tower space is some of the most valuable real estate in America.
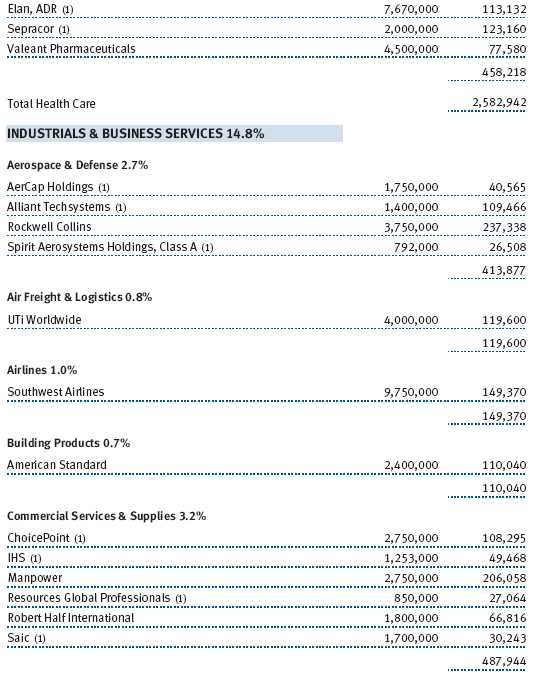
We have large and diversified holdings in the industrials and business services sector based partly on our past success in identifying capable, shareholder-friendly managements. Temporary services contractor Manpower is an example of a company whose management we find particularly impressive. The company continues to focus on profitable growth, and its prospects are especially good in the improving European job market. We are particularly drawn to the defense sector, which we believe will expand in response to a multiyear build-out of the armed services as part of the global war on terror. While defense spending as a proportion of GDP has risen in the last six years from 3.0% to 3.8%, it is still far below its 7.6% average during the 1950s through the 1980s. Rockwell Collins benefited from both its defense business and a healthy commercial aerospace market.
Finally, the vast amount of liquidity sloshing around in the market has meant that what goes up very quickly can come down equally fast, and this proved to be the case with our energy holdings in the past six months—the sole sector to detract substantially from our absolute returns. As oil and natural gas prices fell sharply, five of the 10 worst-performing holdings for the fund in the period were energy stocks: CONSOL Energy, BJ Services, EOG Resources, Foundation Coal Holdings, and FMC Technologies; in only two cases, however, were the losses substantial enough to place in the bottom 10 for the one-year period (BJ Services and CONSOL Energy). Even though the energy boom appears to have dissipated for the moment, we are maintaining investments in companies with good business models that best position them to profit from the world’s insatiable energy needs. EOG Resources, for example, owns valuable natural gas deposits in North America—a resource where production is not growing despite heightened investment.
We suspect that energy independence may be emerging as a major imperative in the U.S. It will be interesting to see which major political party seizes the initiative on the issue as both are beginning to talk about it—a likely sign more federal spending will be on its way to the sector. A nascent theme in our portfolio is clean power. Sunpower and First Solar are two small holdings that have promising technology potential.
INVESTMENT STRATEGY AND OUTLOOK
As we enter 2007, we see an economic backdrop characterized by significant structural imbalances and financial markets that are somewhat complacent after almost four years without a significant correction in stock prices. We also believe that the Federal Reserve, mindful of the ramifications of the easy money policy of the early 2000s, will be very reluctant to give Wall Street back its proverbial punch bowl by cutting rates unless the economy slows materially or a financial crisis arises. Still, equities appear attractive relative to other asset classes, growth appears cheap relative to value, and mid-cap prospects are quite reasonable.
The world economy has become somewhat imbalanced in recent years due to prolific spending by U.S. consumers. Americans have been able to spend beyond their incomes in part because other nations, particularly China, have been willing to finance growing levels of debt. Since the primary way Americans have assumed more debt has been by borrowing against their homes, the recent slump in house prices weakens a key pillar of support for consumer spending. However, we do not think this dynamic is likely to precipitate a recession unless other depressants also dampen growth.
Another key dynamic bearing on today’s markets is the surfeit of liquidity in the global financial system. The sources of this are severalfold. For many management teams, the lesson of Enron’s collapse and the deflation of the equity bubble was to manage their companies more conservatively. As a result, the balance sheets of public companies have record cash balances and modest debt in aggregate. Large current account surpluses in countries such as Saudi Arabia and China—resulting from high oil prices and the migration of U.S. manufacturing overseas—are two more sources of liquidity. Finally, there is the continued movement by institutions and wealthy individuals from equities to alternative investments such as hedge funds and private equity. Alternative investments often incorporate significant leverage that further augments liquidity.
While all of these sources of liquidity affect our economy and this portfolio, our most immediate concern, as we have written in past letters, is private equity. We believe that many debt market participants are underpricing risk, making borrowing artificially cheap and allowing private equity players to substitute debt for equity on corporate balance sheets. In effect, private equity is arbitraging the disparity between reasonable equity valuations and expensive (low interest rate) debt markets.
Private equity players are also preying on the weaknesses of our financial system. Public markets today are dominated not by shareholders who are focused on long-term values but by traders who are motivated by short-term factors and inclined to sell companies for quick and modest premiums. Managements of target companies are often motivated by the allure of not having to answer to the short-term vicissitudes of the public markets and the significant equity stakes they are offered by private equity in the going-private process. The investment bankers in some cases are rewarded for advising on the transaction, writing fairness opinions, arranging debt financing, and providing equity—sometimes all in the same deal. Many companies remain private for very short periods, and many engage primarily in balance sheet manipulation or tax arbitrage as a means of adding value before returning to public markets at valuations comparable to or higher than their prior public values, in spite of their vastly increased debt levels.
In some instances, we believe private equity firms are buying companies from us at very moderate valuations that often do not reflect the long-term value of the businesses. As we wrote in our midyear shareholder report, we opposed two going-private transactions in early 2006 that we felt provided inadequate compensation for our shareholders. In each case, Fairmont Hotels and Education Management, we were not able to change the outcome, as few other holders shared our belief at the time. However, we see evidence that other public market participants are beginning to awaken to the inequities in some of these transactions, and we believe that future management buyouts will encounter greater scrutiny than we witnessed in 2006.
It is important to emphasize that we view the private equity stampede as a temporary factor in our marketplace. While investment in private equity by long-term investors will likely be a fixture for many years to come, the liquidity in today’s capital markets has vaulted this structure to center stage. In time, conditions will change, and so will the prominence of private equity and its impact on our companies.
We are also mindful that, on one level, the very factor currently driving private equity deals bodes well for public shareholders: With equity priced so cheaply relative to debt, stocks appear poised to outperform other asset classes. We believe this is particularly true of growth stocks, which remain compellingly valued relative to their value counterparts. Indeed, this valuation differential stretched even further in 2006, the sixth of seven calendar years this decade in which mid-cap value stocks outpaced mid-cap growth shares (mid-cap growth fared modestly better in 2003). Mid-cap stocks also remain reasonably valued relative to their larger and smaller counterparts. While mid-caps are somewhat more expensive than large-caps when comparing price-to-earnings ratios, we believe this small premium is more than justified by mid-caps’ generally superior fundamentals and better growth prospects.
Most importantly, we still see plenty of good opportunities for our shareholders when looking at the markets from the ground up. As we research firms and meet with their leaders, we are finding many very strong companies that appear quite reasonably priced even after four years of market gains. In particular, the primary hunting ground for growth investors, the technology sector, is teeming with companies with excellent prospects, solid balance sheets, and much more shareholder-oriented managements than they had only a few years ago. We look forward to reporting to you on our search for these firms in six months.
We appreciate your continued confidence in T. Rowe Price.
Respectfully submitted,

Brian W.H. Berghuis
President of the fund and chairman of its Investment Advisory Committee

John F. Wakeman
Executive vice president of the fund
January 19, 2007
The committee chairman has day-to-day responsibility for managing the portfolio and works with committee members in developing and executing the fund’s investment program.
RISKS OF STOCK INVESTING
As with all stock and bond mutual funds, the fund’s share price can fall because of weakness in the stock or bond markets, a particular industry, or specific holdings. The financial markets can decline for many reasons, including adverse political or economic developments, changes in investor psychology, or heavy institutional selling. The prospects for an industry or company may deteriorate because of a variety of factors, including disappointing earnings or changes in the competitive environment. In addition, the investment manager’s assessment of companies held in a fund may prove incorrect, resulting in losses or poor performance even in rising markets. The stocks of mid-cap companies entail greater risk and are usually more volatile than the shares of larger companies. In addition, growth stocks can be volatile for several reasons. Since they usually reinvest a high proportion of earnings in their own businesses, they may lack the dividends usually associated with value stocks that can cushion their decline in a falling market. Also, since investors buy these stocks because of their expected superior earnings growth, earnings disappointments often result in sharp price declines.
GLOSSARY
Lipper indexes: Fund benchmarks that consist of a small number of the largest mutual funds in a particular category as tracked by Lipper Inc.
Russell Midcap Growth Index: An unmanaged index that measures the performance of those Russell Midcap companies with higher price-to-book ratios and higher forecasted growth values.
Russell Midcap Value Index: An unmanaged index that measures the performance of those Russell Midcap companies with lower price-to-book ratios and lower forecasted growth values.
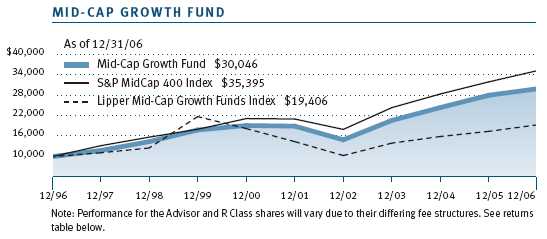
S&P 500 Stock Index: An unmanaged index that tracks the stocks of 500 primarily large-cap U.S. companies.
S&P MidCap 400 Index: An unmanaged index that tracks the stocks of 400 U.S. mid-cap companies.

This chart shows the value of a hypothetical $10,000 investment in the fund over the past 10 fiscal year periods or since inception (for funds lacking 10-year records). The result is compared with benchmarks, which may include a broad-based market index and a peer group average or index. Market indexes do not include expenses, which are deducted from fund returns as well as mutual fund averages and indexes.
| AVERAGE ANNUAL COMPOUND TOTAL RETURN |
This table shows how the fund would have performed each year if its actual (or cumulative) returns had been earned at a constant rate.
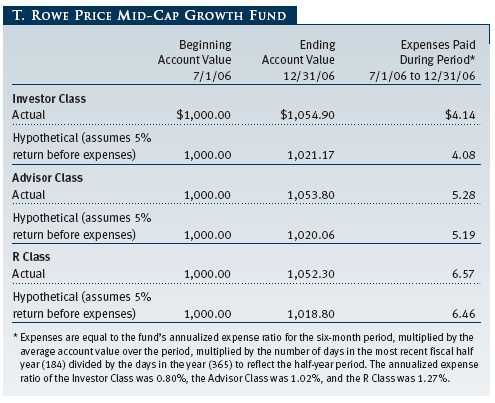
As a mutual fund shareholder, you may incur two types of costs: (1) transaction costs, such as redemption fees or sales loads, and (2) ongoing costs, including management fees, distribution and service (12b-1) fees, and other fund expenses. The following example is intended to help you understand your ongoing costs (in dollars) of investing in the fund and to compare these costs with the ongoing costs of investing in other mutual funds. The example is based on an investment of $1,000 invested at the beginning of the most recent six-month period and held for the entire period.
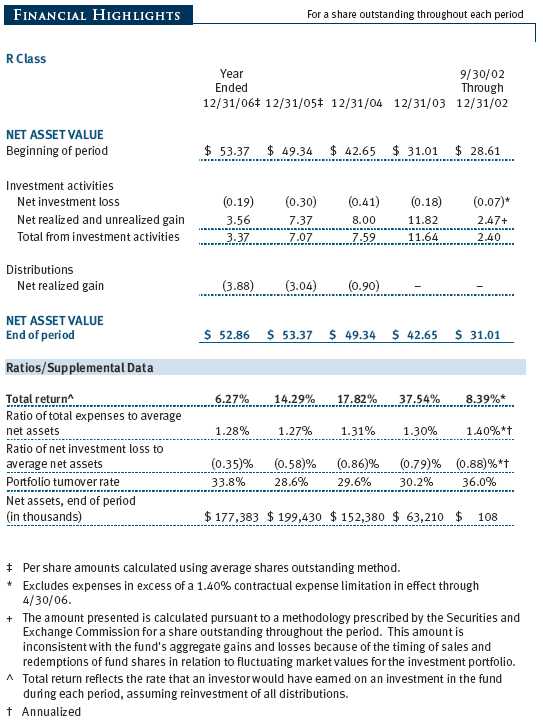
Please note that the fund has three share classes: The original share class (“investor class”) charges no distribution and service (12b-1) fee; Advisor Class shares are offered only through unaffiliated brokers and other financial intermediaries and charge a 0.25% 12b-1 fee; R Class shares are available to retirement plans serviced by intermediaries and charge a 0.50% 12b-1 fee. Each share class is presented separately in the table.
Actual Expenses
The first line of the following table (“Actual”) provides information about actual account values and expenses based on the fund’s actual returns. You may use the information in this line, together with your account balance, to estimate the expenses that you paid over the period. Simply divide your account value by $1,000 (for example, an $8,600 account value divided by $1,000 = 8.6), then multiply the result by the number in the first line under the heading “Expenses Paid During Period” to estimate the expenses you paid on your account during this period.
Hypothetical Example for Comparison Purposes
The information on the second line of the table (“Hypothetical”) is based on hypothetical account values and expenses derived from the fund’s actual expense ratio and an assumed 5% per year rate of return before expenses (not the fund’s actual return). You may compare the ongoing costs of investing in the fund with other funds by contrasting this 5% hypothetical example and the 5% hypothetical examples that appear in the shareholder reports of the other funds. The hypothetical account values and expenses may not be used to estimate the actual ending account balance or expenses you paid for the period.
Note: T. Rowe Price charges an annual small-account maintenance fee of $10, generally for accounts with less than $2,000 ($500 for UGMA/UTMA). The fee is waived for any investor whose T. Rowe Price mutual fund accounts total $25,000 or more, accounts employing automatic investing, and IRAs and other retirement plan accounts that utilize a prototype plan sponsored by T. Rowe Price (although a separate custodial or administrative fee may apply to such accounts). This fee is not included in the accompanying table. If you are subject to the fee, keep it in mind when you are estimating the ongoing expenses of investing in the fund and when comparing the expenses of this fund with other funds.
You should also be aware that the expenses shown in the table highlight only your ongoing costs and do not reflect any transaction costs, such as redemption fees or sales loads. Therefore, the second line of the table is useful in comparing ongoing costs only and will not help you determine the relative total costs of owning different funds. To the extent a fund charges transaction costs, however, the total cost of owning that fund is higher.
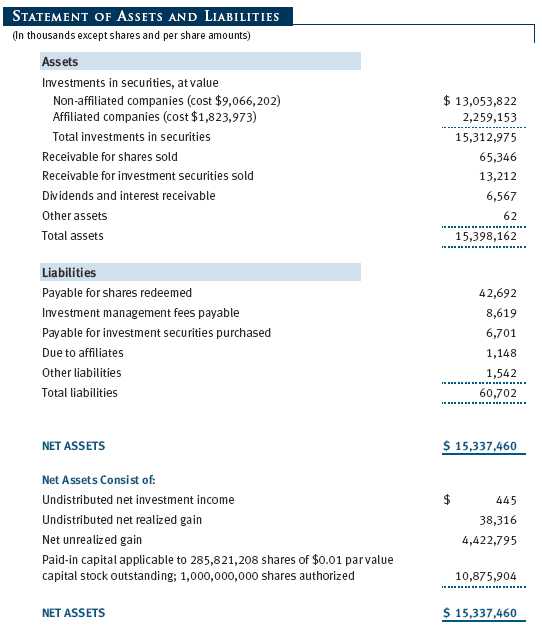
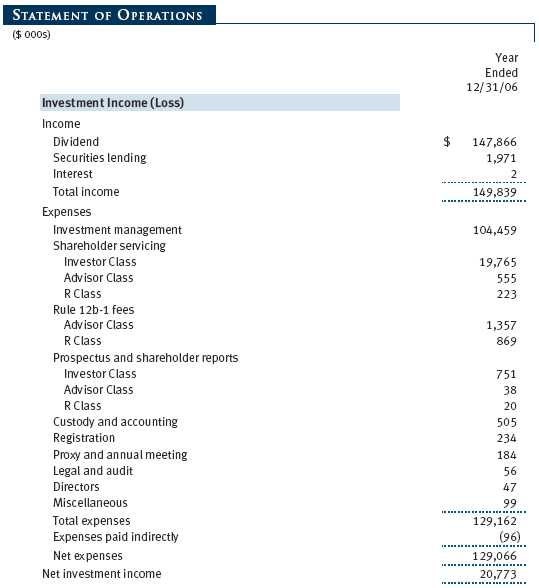
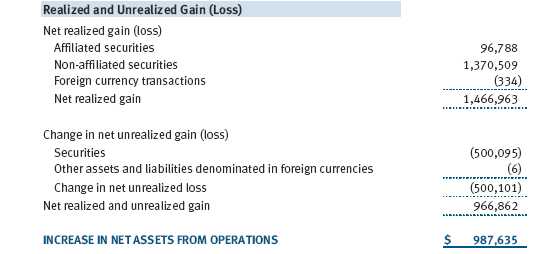
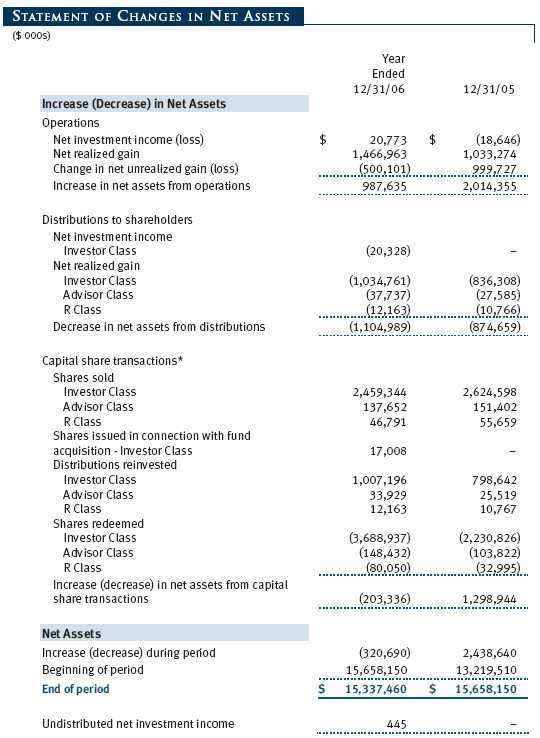
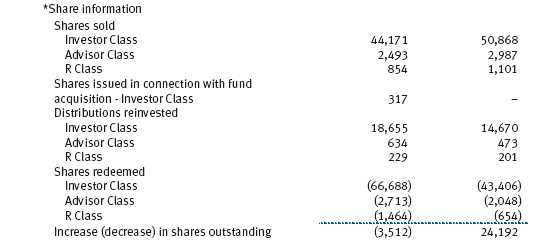
The accompanying notes are an integral part of these financial statements.
The accompanying notes are an integral part of these financial statements.
The accompanying notes are an integral part of these financial statements.
The accompanying notes are an integral part of these financial statements.
The accompanying notes are an integral part of these financial statements.
The accompanying notes are an integral part of these financial statements.
The accompanying notes are an integral part of these financial statements.
| NOTES TO FINANCIAL STATEMENTS |
NOTE 1 - SIGNIFICANT ACCOUNTING POLICIES
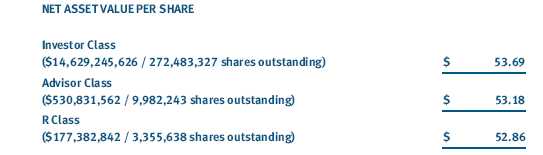
T. Rowe Price Mid-Cap Growth Fund, Inc. (the fund), is registered under the Investment Company Act of 1940 (the 1940 Act) as a diversified, open-end management investment company. The fund seeks to provide long-term capital appreciation by investing in mid-cap stocks with potential for above-average earnings growth. The fund has three classes of shares: the Mid-Cap Growth Fund original share class, referred to in this report as the Investor Class, offered since June 30, 1992; the Mid-Cap Growth Fund—Advisor Class (Advisor Class), offered since March 31, 2000; and the Mid-Cap Growth Fund—R Class (R Class), offered since September 30, 2002. Advisor Class shares are sold only through unaffiliated brokers and other unaffiliated financial intermediaries, and R Class shares are available to retirement plans serviced by intermediaries. The Advisor Class and R Class each operate under separate Board-approved Rule 12b-1 plans, pursuant to which each class compensates financial intermediaries for distribution, shareholder servicing, and/or certain administrative services. Each class has exclusive voting rights on matters related solely to that class, separate voting rights on matters that relate to all classes, and, in all other respects, the same rights and obligations as the other classes.
The accompanying financial statements were prepared in accordance with accounting principles generally accepted in the United States of America, which require the use of estimates made by fund management. Fund management believes that estimates and security valuations are appropriate; however, actual results may differ from those estimates, and the security valuations reflected in the financial statements may differ from the value the fund ultimately realizes upon sale of the securities.
Valuation The fund values its investments and computes its net asset value per share at the close of the New York Stock Exchange (NYSE), normally 4 p.m. ET, each day that the NYSE is open for business. Equity securities listed or regularly traded on a securities exchange or in the over-the-counter (OTC) market are valued at the last quoted sale price or, for certain markets, the official closing price at the time the valuations are made, except for OTC Bulletin Board securities, which are valued at the mean of the latest bid and asked prices. A security that is listed or traded on more than one exchange is valued at the quotation on the exchange determined to be the primary market for such security. Listed securities not traded on a particular day are valued at the mean of the latest bid and asked prices for domestic securities and the last quoted sale price for international securities.
Investments in mutual funds are valued at the mutual fund’s closing net asset value per share on the day of valuation.
Other investments, including restricted securities, and those for which the above valuation procedures are inappropriate or are deemed not to reflect fair value are stated at fair value as determined in good faith by the T. Rowe Price Valuation Committee, established by the fund’s Board of Directors.
Most foreign markets close before the close of trading on the NYSE. If the fund determines that developments between the close of a foreign market and the close of the NYSE will, in its judgment, materially affect the value of some or all of its portfolio securities, which in turn will affect the fund’s share price, the fund will adjust the previous closing prices to reflect the fair value of the securities as of the close of the NYSE, as determined in good faith by the T. Rowe Price Valuation Committee, established by the fund’s Board of Directors. A fund may also fair value securities in other situations, such as when a particular foreign market is closed but the fund is open. In deciding whether to make fair value adjustments, the fund reviews a variety of factors, including developments in foreign markets, the performance of U.S. securities markets, and the performance of instruments trading in U.S. markets that represent foreign securities and baskets of foreign securities. The fund uses outside pricing services to provide it with closing market prices and information used for adjusting those prices. The fund cannot predict when and how often it will use closing prices and when it will adjust those prices to reflect fair value. As a means of evaluating its fair value process, the fund routinely compares closing market prices, the next day’s opening prices in the same markets, and adjusted prices.
Currency Translation Assets, including investments, and liabilities denominated in foreign currencies are translated into U.S. dollar values each day at the prevailing exchange rate, using the mean of the bid and asked prices of such currencies against U.S. dollars as quoted by a major bank. Purchases and sales of securities, income, and expenses are translated into U.S. dollars at the prevailing exchange rate on the date of the transaction. The effect of changes in foreign currency exchange rates on realized and unrealized security gains and losses is reflected as a component of security gains and losses.
Class Accounting The Advisor Class and R Class each pay distribution, shareholder servicing, and/or certain administrative expenses in the form of Rule 12b-1 fees, in an amount not exceeding 0.25% and 0.50%, respectively, of the class’s average daily net assets. Shareholder servicing, prospectus, and shareholder report expenses incurred by each class are charged directly to the class to which they relate. Expenses common to all classes, investment income, and realized and unrealized gains and losses are allocated to the classes based upon the relative daily net assets of each class.
Rebates and Credits Subject to best execution, the fund may direct certain security trades to brokers who have agreed to rebate a portion of the related brokerage commission to the fund in cash. Commission rebates are reflected as realized gain on securities in the accompanying financial statements and totaled $705,000 for the year ended December 31, 2006. Additionally, the fund earns credits on temporarily uninvested cash balances at the custodian that reduce the fund’s custody charges. Custody expense in the accompanying financial statements is presented before reduction for credits, which are reflected as expenses paid indirectly.
In-Kind Redemptions In accordance with guidelines described in the fund’s prospectus, the fund may distribute portfolio securities rather than cash as payment for a redemption of fund shares (in-kind redemption). For financial reporting purposes, the fund recognizes a gain on in-kind redemptions to the extent the value of the distributed securities on the date of redemption exceeds the cost of those securities. Gains and losses realized on in-kind redemptions are not recognized for tax purposes and are reclassified from undistributed realized gain (loss) to paid-in capital. During the year ended December 31, 2006, the fund realized $262,572,000 of net gain on $623,132,000 of in-kind redemptions.
Investment Transactions, Investment Income, and Distributions Income and expenses are recorded on the accrual basis. Dividends received from mutual fund investments are reflected as dividend income; capital gain distributions are reflected as realized gain/loss. Dividend income and capital gain distributions are recorded on the ex-dividend date. Investment transactions are accounted for on the trade date. Realized gains and losses are reported on the identified cost basis. Distributions to shareholders are recorded on the ex-dividend date. Income distributions are declared and paid by each class on an annual basis. Capital gain distributions, if any, are declared and paid by the fund, typically on an annual basis.
New Accounting Pronouncements In June 2006, the Financial Accounting Standards Board (“FASB”) issued FASB Interpretation No. 48 (“FIN 48”), Accounting for Uncertainty in Income Taxes, a clarification of FASB Statement No. 109, Accounting for Income Taxes. FIN 48 establishes financial reporting rules regarding recognition and measurement of tax positions taken or expected to be taken on a tax return. Management is evaluating the anticipated impact, if any, that FIN 48 will have on the fund upon adoption, which, pursuant to a delay granted by the U.S. Securities and Exchange Commission, is expected to be on the last business day of the fund’s semi-annual period, June 29, 2007.
In September 2006, the FASB released the Statement of Financial Accounting Standard No. 157 (“FAS 157”), Fair Value Measurements. FAS 157 clarifies the definition of fair value and establishes the framework for measuring fair value, as well as proper disclosure of this methodology in the financial statements. It will be effective for the fund’s fiscal year beginning January 1, 2008. Management is evaluating the effects of FAS 157; however, it is not expected to have a material impact on the fund’s net assets or results of operations.
NOTE 2 - INVESTMENT TRANSACTIONS
Consistent with its investment objective, the fund engages in the following practices to manage exposure to certain risks or to enhance performance. The investment objective, policies, program, and risk factors of the fund are described more fully in the fund’s prospectus and Statement of Additional Information.
Restricted Securities The fund may invest in securities that are subject to legal or contractual restrictions on resale. Although certain of these securities may be readily sold, for example, under Rule 144A, others may be illiquid, their sale may involve substantial delays and additional costs, and prompt sale at an acceptable price may be difficult.
Securities Lending The fund lends its securities to approved brokers to earn additional income. It receives as collateral cash and U.S. government securities valued at 102% to 105% of the value of the securities on loan. Cash collateral is invested in a money market pooled trust managed by the fund’s lending agent in accordance with investment guidelines approved by fund management. Collateral is maintained over the life of the loan in an amount not less than the value of loaned securities, as determined at the close of fund business each day; any additional collateral required due to changes in security values is delivered to the fund the next business day. Although risk is mitigated by the collateral, the fund could experience a delay in recovering its securities and a possible loss of income or value if the borrower fails to return the securities. Securities lending revenue recognized by the fund consists of earnings on invested collateral and borrowing fees, net of any rebates to the borrower and compensation to the lending agent. At December 31, 2006, there were no securities on loan.
Other Purchases and sales of portfolio securities, other than short-term securities, aggregated $5,190,731,000 and $6,634,600,000, respectively, for the year ended December 31, 2006.
NOTE 3 - FEDERAL INCOME TAXES
No provision for federal income taxes is required since the fund intends to continue to qualify as a regulated investment company under Subchapter M of the Internal Revenue Code and distribute to shareholders all of its taxable income and gains. Federal income tax regulations differ from generally accepted accounting principles; therefore, distributions determined in accordance with tax regulations may differ significantly in amount or character from net investment income and realized gains for financial reporting purposes. Financial reporting records are adjusted for permanent book/tax differences to reflect tax character. Financial records are not adjusted for temporary differences.
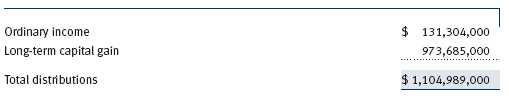
Distributions during the year ended December 31, 2006, were characterized as follows for tax purposes:
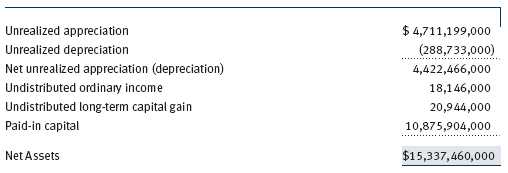
At December 31, 2006, the tax-basis components of net assets were as follows:
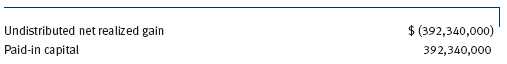
For the year ended December 31, 2006, the fund recorded the following permanent reclassifications to reflect tax character. Reclassifications to paid-in capital relate primarily to redemptions in kind and a tax practice that treats a portion of the proceeds from each redemption of capital shares as a distribution of taxable net investment income and/or realized capital gain. Results of operations and net assets were not affected by these reclassifications.
At December 31, 2006, the cost of investments for federal income tax purposes was $10,890,503,000.
NOTE 4 - ACQUISITION
On June 19, 2006, the fund acquired substantially all of the assets of the Preferred Mid-Cap Growth Fund (the acquired fund), pursuant to the Agreement and Plan of Reorganization dated February 15, 2006, and approved by shareholders of the acquired fund on June 9, 2006. The acquisition was accomplished by a tax-free exchange of 317,307 shares of the fund (with a value of $17,008,000) for the 1,615,268 shares of the acquired fund outstanding on June 16, 2006. The net assets of the acquired fund at that date included $995,000 of unrealized depreciation. Net assets of the acquired fund were combined with those of the fund, resulting in aggregate net assets of $14,974,367,000 immediately after the acquisition.
NOTE 5 - RELATED PARTY TRANSACTIONS
The fund is managed by T. Rowe Price Associates, Inc. (the manager or Price Associates), a wholly owned subsidiary of T. Rowe Price Group, Inc. The investment management agreement between the fund and the manager provides for an annual investment management fee, which is computed daily and paid monthly. The fee consists of an individual fund fee and a group fee. The individual fund fee is equal to 0.35% of the fund’s average daily net assets up to $15 billion and 0.30% of the fund’s average daily net assets in excess of $15 billion; previously, through April 30, 2005, the individual fund fee had been a flat rate of 0.35% of the fund’s average daily net assets. The group fee rate is calculated based on the combined net assets of certain mutual funds sponsored by Price Associates (the group) applied to a graduated fee schedule, with rates ranging from 0.48% for the first $1 billion of assets to 0.29% for assets in excess of $160 billion. The fund’s group fee is determined by applying the group fee rate to the fund’s average daily net assets. At December 31, 2006, the effective annual group fee rate was 0.31%.
In addition, the fund has entered into service agreements with Price Associates and two wholly owned subsidiaries of Price Associates (collectively, Price). Price Associates computes the daily share prices and provides certain other administrative services to the fund. T. Rowe Price Services, Inc., provides shareholder and administrative services in its capacity as the fund’s transfer and dividend disbursing agent. T. Rowe Price Retirement Plan Services, Inc., provides subaccounting and recordkeeping services for certain retirement accounts invested in the Investor Class and R Class. For the year ended December 31, 2006, expenses incurred pursuant to these service agreements were $87,000 for Price Associates, $3,168,000 for T. Rowe Price Services, Inc., and $8,069,000 for T. Rowe Price Retirement Plan Services, Inc. The total amount payable at period-end pursuant to these service agreements is reflected as Due to Affiliates in the accompanying financial statements.
Additionally, the fund is one of several mutual funds in which certain college savings plans managed by Price Associates may invest. As approved by the fund’s Board of Directors, shareholder servicing costs associated with each college savings plan are borne by the fund in proportion to the average daily value of its shares owned by the college savings plan. For the year ended December 31, 2006, the fund was charged $112,000 for shareholder servicing costs related to the college savings plans, of which $93,000 was for services provided by Price. The amount payable at period-end pursuant to this agreement is reflected as Due to Affiliates in the accompanying financial statements. At December 31, 2006, approximately 1% of the outstanding shares of the Investor Class were held by college savings plans.
The fund is also one of several mutual funds sponsored by Price Associates (underlying Price funds) in which the T. Rowe Price Retirement Funds (Retirement Funds) may invest. The Retirement Funds do not invest in the underlying Price funds for the purpose of exercising management or control. Pursuant to a special servicing agreement, expenses associated with the operation of the Retirement Funds are borne by each underlying Price fund to the extent of estimated savings to it and in proportion to the average daily value of its shares owned by the Retirement Funds. Expenses allocated under this agreement are reflected as shareholder servicing expense in the accompanying financial statements. For the year ended December 31, 2006, the fund was allocated $1,320,000 of Retirement Funds’ expenses, of which $1,042,000 related to services provided by Price. The amount payable at period-end pursuant to this agreement is reflected as Due to Affiliates in the accompanying financial statements. At December 31, 2006, approximately 5% of the outstanding shares of the Investor Class were held by the Retirement Funds.
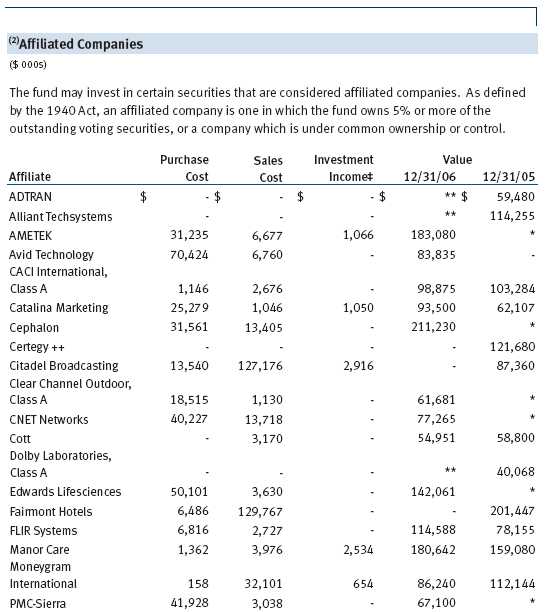
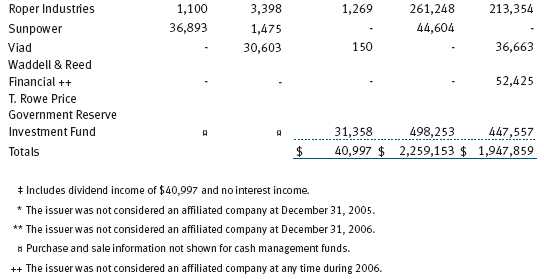
The fund may invest in the T. Rowe Price Reserve Investment Fund and the T. Rowe Price Government Reserve Investment Fund (collectively, the T. Rowe Price Reserve Funds), open-end management investment companies managed by Price Associates and affiliates of the fund. The T. Rowe Price Reserve Funds are offered as cash management options to mutual funds, trusts, and other accounts managed by Price Associates and/or its affiliates, and are not available for direct purchase by members of the public. The T. Rowe Price Reserve Funds pay no investment management fees.
As of December 31, 2006, T. Rowe Price Group, Inc., and/or its wholly owned subsidiaries owned 62,712 shares of the Investor Class, representing less than 1% of the fund’s net assets.
| REPORT OF INDEPENDENT REGISTERED PUBLIC ACCOUNTING FIRM |
To the Board of Directors and Shareholders of T. Rowe Price Mid-Cap Growth Fund, Inc.
In our opinion, the accompanying statement of assets and liabilities, including the portfolio of investments, and the related statements of operations and of changes in net assets and the financial highlights present fairly, in all material respects, the financial position of T. Rowe Price Mid-Cap Growth Fund, Inc. (the “Fund”) at December 31, 2006, the results of its operations for the year then ended, the changes in its net assets for each of the two years in the period then ended and the financial highlights for each of the fiscal periods presented, in conformity with accounting principles generally accepted in the United States of America. These financial statements and financial highlights (hereafter referred to as “financial statements”) are the responsibility of the Fund’s management; our responsibility is to express an opinion on these financial statements based on our audits. We conducted our audits of these financial statements in accordance with the auditing standards of the Public Company Accounting Oversight Board (United States). Those standards require that we plan and perform the audit to obtain reasonable assurance about whether the financial statements are free of material misstatement. An audit includes examining, on a test basis, evidence supporting the amounts and disclosures in the financial statements, assessing the accounting principles used and significant estimates made by management, and evaluating the overall financial statement presentation. We believe that our audits, which included confirmation of securities at December 31, 2006 by correspondence with the custodian and by agreement to the underlying ownership records for T. Rowe Price Government Reserve Investment Fund, provide a reasonable basis for our opinion.
PricewaterhouseCoopers LLP
Baltimore, Maryland
February 12, 2007
| TAX INFORMATION (UNAUDITED) FOR THE TAX YEAR ENDED 12/31/06 |
We are providing this information as required by the Internal Revenue Code. The amounts shown may differ from those elsewhere in this report because of differences between tax and financial reporting requirements.
The fund’s distributions to shareholders included:
• $124,723,000 from short-term capital gains,
• $1,089,706,000 from long-term capital gains, subject to the 15% rate gains category
For taxable non-corporate shareholders, $114,707,000 of the fund’s income represents qualified dividend income subject to the 15% rate category.
For corporate shareholders, $107,790,000 of the fund’s income qualifies for the dividends-received deduction.
| INFORMATION ON PROXY VOTING POLICIES, PROCEDURES, AND RECORDS |
A description of the policies and procedures used by T. Rowe Price funds and portfolios to determine how to vote proxies relating to portfolio securities is available in each fund’s Statement of Additional Information, which you may request by calling 1-800-225-5132 or by accessing the SEC’s Web site, www.sec.gov. The description of our proxy voting policies and procedures is also available on our Web site, www.troweprice.com. To access it, click on the words “Company Info” at the top of our homepage for individual investors. Then, in the window that appears, click on the “Proxy Voting Policy” navigation button in the top left corner.
Each fund’s most recent annual proxy voting record is available on our Web site and through the SEC’s Web site. To access it through our Web site, follow the directions above, then click on the words “Proxy Voting Record” at the bottom of the Proxy Voting Policy page.
| HOW TO OBTAIN QUARTERLY PORTFOLIO HOLDINGS |
The fund files a complete schedule of portfolio holdings with the Securities and Exchange Commission for the first and third quarters of each fiscal year on Form N-Q. The fund’s Form N-Q is available electronically on the SEC’s Web site (www.sec.gov); hard copies may be reviewed and copied at the SEC’s Public Reference Room, 450 Fifth St. N.W., Washington, DC 20549. For more information on the Public Reference Room, call 1-800-SEC-0330.
| ABOUT THE FUND’S DIRECTORS AND OFFICERS |
Your fund is governed by a Board of Directors that meets regularly to review a wide variety of matters affecting the fund, including performance, investment programs, compliance matters, advisory fees and expenses, service providers, and other business affairs. The Board of Directors elects the fund’s officers, who are listed in the final table. At least 75% of Board members are independent of T. Rowe Price Associates, Inc. (T. Rowe Price), and T. Rowe Price International, Inc. (T. Rowe Price International); “inside” or “interested” directors are officers of T. Rowe Price. The business address of each director and officer is 100 East Pratt Street, Baltimore, Maryland 21202. The Statement of Additional Information includes additional information about the fund directors and is available without charge by calling a T. Rowe Price representative at 1-800-225-5132.
| Independent Directors | |
| |
| Name | |
| (Year of Birth) | Principal Occupation(s) During Past 5 Years and Directorships of |
| Year Elected * | Other Public Companies |
| |
| Jeremiah E. Casey | Director, Allfirst Financial Inc. (previously First Maryland Bankcorp) |
| (1940) | (1983 to 2002); Director, National Life Insurance (2001 to 2005); |
| 2005 | Director, The Rouse Company, real estate developers (1990 to 2004) |
| |
| Anthony W. Deering | Chairman, Exeter Capital, LLC, a private investment firm (2004 to |
| (1945) | present); Director, Vornado Real Estate Investment Trust (3/04 to |
| 2001 | present); Director, Mercantile Bankshares (4/03 to present); Member, |
| | Advisory Board, Deutsche Bank North America (2004 to present); |
| | Director, Chairman of the Board, and Chief Executive Officer, The |
| | Rouse Company, real estate developers (1997 to 2004) |
| |
| Donald W. Dick, Jr. | Principal, EuroCapital Advisors, LLC, an acquisition and management |
| (1943) | advisory firm; Chairman, President, and Chief Executive Officer, |
| 1992 | The Haven Group, a custom manufacturer of modular homes |
| | (1/04 to present) |
| |
| David K. Fagin | Chairman and President, Nye Corporation (6/88 to present); Director, |
| (1938) | Canyon Resources Corp., Golden Star Resources Ltd. (5/92 to pres- |
| 1992 | ent), and Pacific Rim Mining Corp. (2/02 to present) |
| |
| Karen N. Horn | Director, Federal National Mortgage Association (9/06 to present); |
| (1943) | Managing Director and President, Global Private Client Services, |
| 2003 | Marsh Inc. (1999 to 2003); Director, Georgia Pacific (5/04 to |
| | 12/05), Eli Lilly and Company, and Simon Property Group |
| |
| Theo C. Rodgers | President, A&R Development Corporation |
| (1941) | |
| 2005 | |
| John G. Schreiber | Owner/President, Centaur Capital Partners, Inc., a real estate invest- |
| (1946) | ment company; Partner, Blackstone Real Estate Advisors, L.P. |
| 2001 | |
| * Each independent director oversees 115 T. Rowe Price portfolios and serves until retirement, resignation, or |
| election of a successor. |
| Inside Directors | |
| |
| Name | |
| (Year of Birth) | |
| Year Elected * | |
| [Number of T. Rowe Price | Principal Occupation(s) During Past 5 Years and Directorships of |
| Portfolios Overseen] | Other Public Companies |
| |
| Edward C. Bernard | Director and Vice President, T. Rowe Price and T. Rowe Price Group, |
| (1956) | Inc.; Chairman of the Board, Director, and President, T. Rowe Price |
| 2006 | Investment Services, Inc.; Chairman of the Board and Director, |
| [115] | T. Rowe Price International, Inc., T. Rowe Price Retirement Plan |
| | Services, Inc., T. Rowe Price Services, Inc., and T. Rowe Price Savings |
| | Bank; Director, T. Rowe Price Global Asset Management Limited and |
| | T. Rowe Price Global Investment Services Limited; Chief Executive |
| | Officer, Chairman of the Board, Director, and President, T. Rowe |
| | Price Trust Company; Chairman of the Board, all funds |
| |
| Brian C. Rogers, CFA, CIC | Chief Investment Officer, Director, and Vice President, T. Rowe |
| (1955) | Price and T. Rowe Price Group, Inc.; Vice President, T. Rowe Price |
| 2006 | Trust Company |
| [62] | |
| |
| * Each inside director serves until retirement, resignation, or election of a successor. |
| Officers | |
| |
| Name (Year of Birth) | |
| Title and Fund(s) Served | Principal Occupation(s) |
| |
| Kennard W. Allen (1977) | Vice President, T. Rowe Price and T. Rowe Price |
| Vice President, Mid-Cap Growth Fund | Group, Inc. |
| |
| P. Robert Bartolo, CPA (1972) | Vice President, T. Rowe Price and T. Rowe Price |
| Vice President, Mid-Cap Growth Fund | Group, Inc. |
| |
| Timothy F. Bei, CFA (1973) | Vice President, T. Rowe Price and T. Rowe Price |
| Vice President, Mid-Cap Growth Fund | Group, Inc.; formerly student, University of |
| | Virginia (to 2003) |
| |
| R. Scott Berg (1972) | Vice President, T. Rowe Price and T. Rowe Price |
| Vice President, Mid-Cap Growth Fund | Group, Inc.; formerly student, Stanford |
| | Graduate School of Business (to 2002) |
| |
| Brian W.H. Berghuis, CFA (1958) | Vice President, T. Rowe Price and T. Rowe Price |
| President, Mid-Cap Growth Fund | Group, Inc. |
| |
| Joseph A. Carrier, CPA (1960) | Vice President, T. Rowe Price, T. Rowe Price |
| Treasurer, Mid-Cap Growth Fund | Group, Inc., T. Rowe Price Investment Services, |
| | Inc., and T. Rowe Price Trust Company |
| |
| Henry M. Ellenbogen (1971) | Vice President, T. Rowe Price and T. Rowe Price |
| Vice President, Mid-Cap Growth Fund | Group, Inc. |
| |
| Roger L. Fiery III, CPA (1959) | Vice President, T. Rowe Price, T. Rowe Price |
| Vice President, Mid-Cap Growth Fund | Group, Inc., T. Rowe Price International, Inc., |
| | and T. Rowe Price Trust Company |
| |
| John R. Gilner (1961) | Chief Compliance Officer and Vice President, |
| Chief Compliance Officer, Mid-Cap Growth Fund | T. Rowe Price; Vice President, T. Rowe Price |
| | Group, Inc., and T. Rowe Price Investment |
| | Services, Inc. |
| |
| Gregory S. Golczewski (1966) | Vice President, T. Rowe Price and T. Rowe Price |
| Vice President, Mid-Cap Growth Fund | Trust Company |
| |
| Henry H. Hopkins (1942) | Director and Vice President, T. Rowe Price |
| Vice President, Mid-Cap Growth Fund | Investment Services, Inc., T. Rowe Price |
| | Services, Inc., and T. Rowe Price Trust |
| | Company; Vice President, T. Rowe Price, |
| | T. Rowe Price Group, Inc., T. Rowe Price |
| | International, Inc., and T. Rowe Price |
| | Retirement Plan Services, Inc. |
| Kris H. Jenner, M.D., D. Phil. (1962) | Vice President, T. Rowe Price and T. Rowe Price |
| Vice President, Mid-Cap Growth Fund | Group, Inc. |
| |
| Patricia B. Lippert (1953) | Assistant Vice President, T. Rowe Price and |
| Secretary, Mid-Cap Growth Fund | T. Rowe Price Investment Services, Inc. |
| |
| Robert J. Marcotte (1962) | Vice President, T. Rowe Price and T. Rowe Price |
| Vice President, Mid-Cap Growth Fund | Group, Inc. |
| |
| Joseph M. Milano, CFA (1972) | Vice President, T. Rowe Price and T. Rowe Price |
| Vice President, Mid-Cap Growth Fund | Group, Inc. |
| |
| Jeffrey Rottinghaus, CPA (1970) | Vice President, T. Rowe Price and T. Rowe Price |
| Vice President, Mid-Cap Growth Fund | Group, Inc. |
| |
| Taymour R. Tamaddon, CFA (1976) | Vice President, T. Rowe Price; formerly intern, |
| Vice President, Mid-Cap Growth Fund | T. Rowe Price (to 2004) |
| |
| John F. Wakeman (1962) | Vice President, T. Rowe Price and T. Rowe Price |
| Executive Vice President, Mid-Cap Growth Fund | Group, Inc. |
| |
| Julie L. Waples (1970) | Vice President, T. Rowe Price |
| Vice President, Mid-Cap Growth Fund | |
| |
| Unless otherwise noted, officers have been employees of T. Rowe Price or T. Rowe Price International for at |
| least five years. | |
Item 2. Code of Ethics.
The registrant has adopted a code of ethics, as defined in Item 2 of Form N-CSR, applicable to its principal executive officer, principal financial officer, principal accounting officer or controller, or persons performing similar functions. A copy of this code of ethics is filed as an exhibit to this Form N-CSR. No substantive amendments were approved or waivers were granted to this code of ethics during the period covered by this report.
Item 3. Audit Committee Financial Expert.
The registrant’s Board of Directors/Trustees has determined that Mr. Donald W. Dick Jr. qualifies as an audit committee financial expert, as defined in Item 3 of Form N-CSR. Mr. Dick is considered independent for purposes of Item 3 of Form N-CSR.
Item 4. Principal Accountant Fees and Services.
(a) – (d) Aggregate fees billed to the registrant for the last two fiscal years for professional services rendered by the registrant’s principal accountant were as follows:
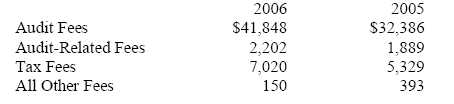
Audit fees include amounts related to the audit of the registrant’s annual financial statements and services normally provided by the accountant in connection with statutory and regulatory filings. Audit-related fees include amounts reasonably related to the performance of the audit of the registrant’s financial statements and specifically include the issuance of a report on internal controls and, if applicable for 2006, agreed-upon procedures related to fund acquisitions. Tax fees include amounts related to services for tax compliance, tax planning, and tax advice. The nature of these services specifically includes the review of distribution calculations and the preparation of Federal, state, and excise tax returns. Reclassification from tax fees to audit fees of fiscal 2005 amounts related to the auditing of tax disclosures within the registrant’s annual financial statements has been made in order to conform to fiscal 2006 presentation. All other fees include the registrant’s pro-rata share of amounts for agreed-upon procedures in conjunction with service contract approvals by the registrant’s Board of Directors/Trustees.
(e)(1) The registrant’s audit committee has adopted a policy whereby audit and non-audit services performed by the registrant’s principal accountant for the registrant, its investment adviser, and any entity controlling, controlled by, or under common control with the investment adviser that provides ongoing services to the registrant require pre-approval in advance at regularly scheduled audit committee meetings. If such a service is required between regularly scheduled audit committee meetings, pre-approval may be authorized by one audit committee member with ratification at the next scheduled audit committee meeting. Waiver of pre-approval for audit or non-audit services requiring fees of a de minimis amount is not permitted.
(2) No services included in (b) – (d) above were approved pursuant to paragraph (c)(7)(i)(C) of Rule 2-01 of Regulation S-X.
(f) Less than 50 percent of the hours expended on the principal accountant’s engagement to audit the registrant’s financial statements for the most recent fiscal year were attributed to work performed by persons other than the principal accountant’s full-time, permanent employees.
(g) The aggregate fees billed for the most recent fiscal year and the preceding fiscal year by the registrant’s principal accountant for non-audit services rendered to the registrant, its investment adviser, and any entity controlling, controlled by, or under common control with the investment adviser that provides ongoing services to the registrant were $1,401,000 and $883,000, respectively, and were less than the aggregate fees billed for those same periods by the registrant’s principal accountant for audit services rendered to the T. Rowe Price Funds. Preceding fiscal year amount reflects the reclassification of tax fees described in (a) – (d) above.
(h) All non-audit services rendered in (g) above were pre-approved by the registrant’s audit committee. Accordingly, these services were considered by the registrant’s audit committee in maintaining the principal accountant’s independence.
Item 5. Audit Committee of Listed Registrants.
Not applicable.
Item 6. Schedule of Investments.
Not applicable. The complete schedule of investments is included in Item 1 of this Form N-CSR.
Item 7. Disclosure of Proxy Voting Policies and Procedures for Closed-End Management Investment Companies.
Not applicable.
Item 8. Portfolio Managers of Closed-End Management Investment Companies.
Not applicable.
Item 9. Purchases of Equity Securities by Closed-End Management Investment Company and Affiliated Purchasers.
Not applicable.
Item 10. Submission of Matters to a Vote of Security Holders.
Not applicable.
Item 11. Controls and Procedures.
(a) The registrant’s principal executive officer and principal financial officer have evaluated the registrant’s disclosure controls and procedures within 90 days of this filing and have concluded that the registrant’s disclosure controls and procedures were effective, as of that date, in ensuring that information required to be disclosed by the registrant in this Form N-CSR was recorded, processed, summarized, and reported timely.
(b) The registrant’s principal executive officer and principal financial officer are aware of no change in the registrant’s internal control over financial reporting that occurred during the registrant’s second fiscal quarter covered by this report that has materially affected, or is reasonably likely to materially affect, the registrant’s internal control over financial reporting.
Item 12. Exhibits.
(a)(1) The registrant’s code of ethics pursuant to Item 2 of Form N-CSR is attached.
(2) Separate certifications by the registrant's principal executive officer and principal financial officer, pursuant to Section 302 of the Sarbanes-Oxley Act of 2002 and required by Rule 30a-2(a) under the Investment Company Act of 1940, are attached.
(3) Written solicitation to repurchase securities issued by closed-end companies: not applicable.
(b) A certification by the registrant's principal executive officer and principal financial officer, pursuant to Section 906 of the Sarbanes-Oxley Act of 2002 and required by Rule 30a-2(b) under the Investment Company Act of 1940, is attached.
| | |
SIGNATURES |
| |
| | Pursuant to the requirements of the Securities Exchange Act of 1934 and the Investment |
| Company Act of 1940, the registrant has duly caused this report to be signed on its behalf by the |
| undersigned, thereunto duly authorized. |
| |
| T. Rowe Price Mid-Cap Growth Fund, Inc. |
| |
| |
| |
| By | /s/ Edward C. Bernard |
| | Edward C. Bernard |
| | Principal Executive Officer |
| |
| Date | February 16, 2007 |
| |
| |
| | Pursuant to the requirements of the Securities Exchange Act of 1934 and the Investment |
| Company Act of 1940, this report has been signed below by the following persons on behalf of |
| the registrant and in the capacities and on the dates indicated. |
| |
| |
| By | /s/ Edward C. Bernard |
| | Edward C. Bernard |
| | Principal Executive Officer |
| |
| Date | February 16, 2007 |
| |
| |
| |
| By | /s/ Joseph A. Carrier |
| | Joseph A. Carrier |
| | Principal Financial Officer |
| |
| Date | February 16, 2007 |