U.S. Securities and Exchange Commission
Washington, D.C. 20549
Form 10-K
| x | ANNUAL REPORT UNDER SECTION 13 OR 15(d) OF THE SECURITIES EXCHANGE ACT OF 1934 |
For fiscal year ended April 30, 2008
Commission File Number 0-20424
Hi-Tech Pharmacal Co., Inc.
(Exact name of Registrant as specified in its charter)
| | |
| Delaware | | 11-2638720 |
(State or other jurisdiction of incorporation or organization) | | (I.R.S. Employer Identification Number) |
369 Bayview Avenue, Amityville, New York 11701
(Address of principal executive offices, including zip code)
Registrant’s telephone number, including area code: (631) 789-8228
Securities registered pursuant to Section 12(b) of the Act: None
Securities registered pursuant to Section 12(g) of the Act:
Common Stock, $.01 par value
(Title of Class)
Indicate by check mark if the registrant is a well-known seasoned issuer, as defined in Rule 405 of the Securities Act. ¨ Yes x No
Indicate by check mark if the registrant is not required to file reports pursuant to Section 13 or Section 15(d) of the Act. ¨ Yes x No
Indicate by check mark whether the Registrant (1) has filed all reports required to be filed by Section 13 or 15(d) of the Securities Exchange Act of 1934 during the preceding 12 months (or for such shorter period that the Registrant was required to file such reports), and (2) has been subject to such filing requirements for the past 90 days. Yes x No ¨
Indicate by check mark if disclosure of delinquent filers pursuant to Item 405 of Regulation S-K is not contained herein, and will not be contained, to the best of the Registrant’s knowledge, in definitive proxy or information statements incorporated by reference in Part III of this Form 10-K or any amendment to this Form 10-K. x
Indicate by check mark whether the registrant is a large accelerated filer, an accelerated filer, or a non-accelerated filer. See definition of “accelerated filer and large accelerated filer” in Rule 12b-2 of the Exchange Act. (Check one):
Large accelerated filer ¨ Accelerated filer x Non-accelerated filer ¨ Smaller reporting company ¨
(Do not check if a smaller reporting company)
Indicate by check mark whether the registrant is a shell company (as defined in Rule 12b-2 of the Act). ¨ Yes x No
The aggregate market value of the voting stock held by non-affiliates of the registrant as of October 31, 2007, the last business day of the registrant’s most recently completed second fiscal quarter, was $73,986,000, based upon the closing price of the common stock on that date, as reported by NASDAQ. Shares of common stock known to be owned by directors and executive officers of the registrant subject to Section 16 of the Securities Exchange Act of 1934 are not included in the computation. No determination has been made that such persons are “affiliates” within the meaning of Rule 12b-2 under the Exchange Act.
The number of shares of common stock of the registrant outstanding as of July 10, 2008 was 11,424,000.
DOCUMENTS INCORPORATED BY REFERENCE: None
HI-TECH PHARMACAL CO., INC.
INDEX TO FORM 10-K
FOR THE YEAR ENDED APRIL 30, 2008
FORWARD LOOKING STATEMENTS
This Annual Report on Form 10-K and certain information incorporated herein by reference contains forward-looking statements which are not historical facts made pursuant to the “safe harbor” provisions of the Private Securities Litigation Reform Act of 1995. Forward-looking statements are not promises or guarantees and investors are cautioned that all forward looking statements involve risks and uncertainties, including but not limited to the impact of competitive products and pricing, product demand and market acceptance, new product development, the regulatory environment, including without limitation, reliance on key strategic alliances, availability of raw materials, fluctuations in operating results and other risks detailed from time to time in the Company’s filings with the Securities and Exchange Commission. These statements are based on management’s current expectations and are naturally subject to uncertainty and changes in circumstances. We caution you not to place undue reliance upon any such forward-looking statements which speak only as of the date made. Hi-Tech is under no obligation to, and expressly disclaims any such obligation to, update or alter its forward-looking statements, whether as a result of new information, future events or otherwise.
2
PART I
General
Hi-Tech Pharmacal Co., Inc. (“Hi-Tech” or the “Company”, which may be referred to as “we”, “us” or “our”), a Delaware corporation, incorporated in April 1982, is a specialty manufacturer and marketer of prescription, over-the-counter and nutritional products.
We develop, manufacture and market products in two categories – generics and over the counter (OTC) brands. We produce a wide range of products for various disease states, including asthma, bronchial disorders, dermatological disorders, allergies, pain, stomach, oral care, neurological disorders and other conditions.
The Company’s generic products are primarily prescription items and include oral solutions and suspensions, topical creams and ointments as well as nasal sprays. We also specialize in the manufacture of products in our state of the art sterile facility capable of producing liquid ophthalmic, otic and inhalation products. Additionally, in December 2007, the Company purchased the assets of Midlothian Laboratories, a generic pharmaceutical company specializing in cough and cold products and prescription vitamins. The generic product category includes a small amount of contract manufacturing sales for both the prescription and OTC markets.
Our Health Care Products Division markets a line of OTC branded products primarily for people with diabetes, including Diabetic Tussin®, DiabetiDerm®, Multi-betic®, DiabetiSweet®. The division also sells Zostrix® brand of capsaisin products for pain and arthritis.
Our customers include chain drug stores, drug wholesalers, managed care purchasing organizations, certain Federal government agencies, generic distributors, mass merchandisers, and mail-order pharmacies. Some of our key customers include McKesson Corporation, AmeriSourceBergen Corporation, Cardinal Health, Inc., CVS, Wal-Mart and Walgreens.
For the fiscal year ended April 30, 2008 sales of generic pharmaceuticals including the Company’s Midlothian division represented 81% of total sales and sales of the Health Care Products line of OTC products accounted for 19% of total sales.
Generic Products
Our top 5 selling generic products in fiscal 2008 were:
| | • | | Sulfamethoxazole & Trimethoprim (the generic equivalent of Bactrim® from Roche) |
| | • | | Promethazine products including Plain, Codeine and Dextromethorphan varieties (the generic equivalent of Phenergan® products from Wyeth) |
| | • | | Chlorhexadine Gluconate (the generic equivalent of Periogard® from Colgate and Peridex® from Zila) |
| | • | | Pediatric multivitamins (the generic equivalent of various brands) |
| | • | | Urea based products including creams, lotion, gels and nail sticks (the generic equivalent of Carmol 40® and Keralac™ from Nycomed and Vanamide™ from Dermik) |
Generic Approvals and Product Launches
We have 37 prescription products approved for marketing by the Food and Drug Administration (“FDA”) and 3 products with tentative approvals. In addition, we have 12 products submitted to the FDA and pending approval, and approximately 20 products in various stages of development.
We received tentative Abbreviated New Drug Application (“ANDA”) approval for the following product in fiscal 2008:
| | • | | Dorzolamide Hydrochloride with Timolol Maleate Ophthalmic Solution (the generic equivalent of Merck’s Cosopt® Ophthalmic solution, indicated for the treatment of glaucoma) |
In our fiscal 2008, we launched four products upon receiving the FDA’s final approval for the Company’s ANDAs:
| | • | | Ciclopirox topical solution, 8% (the generic equivalent of Dermik Laboratories’ Penlac® topical solution, indicated for the treatment of nail fungus) |
| | • | | Fluticasone proprionate nasal spray, 50 mcg (the generic equivalent of GlaxoSmithKline’s Flonase®, indicated for the management of the nasal symptoms of seasonal and perennial allergic and non-allergic rhinitis) |
3
| | • | | Hydrocodone Bitartrate and Homatropine Methylbromide Syrup (the generic equivalent of Endo Pharmaceuticals’ Hycodan® , indicated for the symptomatic relief of cough) |
| | • | | Oflaxacin Otic solution, 0.3% (the generic equivalent of Daiichi’s Floxin® otic solution, 0.3%, indicated for the treatment of bacterial infections of the ear) |
Health Care Products Division
Our Health Care Products Division (“HCP”) is a leading marketer of branded products that include over-the-counter, nutritional lines, and prescription products, primarily for people with diabetes. HCP also has several lines that fall outside the diabetic area. The Health Care Products Division is composed of several products lines which account for a majority of its sales.
The top five product lines, in order of sales, are:
| | • | | Diabetic Tussin® cough products |
| | • | | Zostrix® pain relief products |
| | • | | Multibetic® multi-vitamins |
| | • | | DiabetiDerm® dermatological and footcare products |
| | • | | DiabetiSweet® sugar substitutes |
The Diabetic Tussin® line accounted for approximately half of Health Care Products sales.
HCP launched the following products this year:
| | • | | Diabetic Tussin® Mucous Relief Tablets and Liquid |
| | • | | Diabetic Tussin® Cold and Flu Tablets |
| | • | | Diabetic Tussin® Allergy Tablets |
| | • | | DiabetiDerm® Antifungal Cream |
| | • | | Zostrix® Neuropathy Cream |
| | • | | Nasal Ease® Allergy and Flu Blockers |
Growth Strategy
Management believes that growth in the generic pharmaceutical industry is driven by several factors which should continue in the coming years. These factors include:
| | • | | The increasing number of branded pharmaceutical products that have lost or will lose patent protection |
| | • | | Efforts by federal and state governments, employers, third-party payers and consumers to control health care costs |
| | • | | The aging of the U.S. population |
| | • | | Increased acceptance of generic products by physicians, pharmacists and consumers |
Management hopes to exploit these macroeconomic trends by making strategic decisions which will result in the Company’s growth. Our growth strategy is based on the following:
| | • | | Increase the number of new product introductions by expanding our research and development efforts and increasing our ANDA submissions |
| | • | | Increase market share for our core prescription generic products by adding new customers and introducing products to existing customers |
| | • | | Continue to develop and license branded products with a focus on niche markets, such as diabetes care and related areas, such as podiatry |
| | • | | Acquire products and businesses that management believes can contribute to the Company’s growth strategy |
| | • | | Leverage our manufacturing capabilities primarily focusing on the development of liquid and semi-solid dosage forms and products requiring sterile manufacturing |
4
Product Development Strategy
We have identified over $9 billion of brand name drugs in the liquid, sterile, inhalation, nasal spray and semi-solid dosage forms in our target market. These products either have patents which expire in the next five years or have patents which the Company believes that it can successfully challenge. We are currently developing drugs with total branded sales of over $2 billion and plan to take advantage of this opportunity.
Our product development strategy focuses on products in the following areas:
| | • | | Products that will have limited competition due to smaller market size but can generate long term revenues |
| | • | | Products with significant volume and high annual sales |
| | • | | Products that are difficult to bring to market and more likely to face limited competition, enabling us to earn higher margins for a longer period of time. These opportunities include nasal sprays and sterile products, including ophthalmics and inhalation products |
| | • | | Products with patents that we believe we can successfully challenge through the patent challenge process of the Hatch-Waxman Act |
Research and Development
The Company obtains new generic pharmaceutical products primarily through internal product development and from strategic arrangements with other pharmaceutical companies. These strategic arrangements include both development contracts where Hi-Tech pays a third party to develop a new product and licensing arrangements where Hi-Tech sells a product and pays a royalty to the owner of the ANDA or NDA.
For the fiscal years ended April 30, 2008, 2007 and 2006 total R&D expenditures were $6,208,000, $4,733,000 and $3,334,000, respectively. The increase is the result of expenditures on both internal and external development projects. The Company’s largest expenditure on a single project was for a product line that is being jointly developed with two other generic drug companies. The Company spent $1,591,000 and $409,000 in FY 2008 and FY 2007, respectively, on this project including expenditures on a clinical trial. The clinical trial for this product is ongoing, and the Company believes that it will file ANDAs for the products in this product line in late FY 2009 and in FY 2010.
We have 12 ANDA applications pending at the FDA that address over $0.5 billion in annual brand and generic product sales in the United States in 2007 according to IMS Health. Additionally, the Company has approximately 20 products targeting over $2 billion in branded revenue in development. The Company does not know when any of these products will be approved.
Customers and Marketing
We market our products to chain drug stores, drug wholesalers, managed care purchasing organizations, certain Federal government agencies, generic distributors, mass merchandisers and mail order pharmacies. We sell our generic products to over 100 active accounts located throughout the United States. For the fiscal year ended April 30, 2008, McKesson Corporation, AmerisourceBergen, and Cardinal Health accounted for net sales of approximately 15%, 10%, and 10%, respectively. These customers represented approximately 58% of the outstanding accounts receivable at April 30, 2008. Our top five customers accounted for approximately 49% and 47% of the Company’s total sales for the fiscal years ended April 30, 2008 and 2007, respectively. If any of our top five customers discontinues or substantially reduces its purchases from the Company, it may have a material adverse effect on our business and financial condition. We believe, however, that we have good relationships with our customers.
We utilize our state of the art manufacturing facilities and laboratories to offer contract manufacturing services to our existing as well as potential customers.
We market HCP brands using various marketing strategies which include professional and consumer sampling programs, telemarketing, coupon promotions, contemporary packaging, print media, national radio, direct response advertising and in store promotions. We also have placed a significant emphasis on the use of the internet as a vehicle to promote our brands and emphasize our Company’s goal of helping people with diabetes live a healthier life. We view the internet as an effective vehicle to educate people with diabetes about making good decisions in helping manage their condition. Our websites are registered under the domain names of diabeticproducts.com, Nasaleaseblocker.com and Zostrix.com, which are linked to most search engines and diabetic based websites.
Health Care Products currently employs 10 full time employees in sales, marketing and administration, and 12 independent commission sales representative organizations.
5
We are focused on growth and will continue to develop new branded and generic products as well as devise new marketing strategies to penetrate our markets. We are seeking to complement this internal effort by acquiring products for future marketing, as well as licensing rights to proprietary products and technologies for development and commercialization. We will place increasing emphasis on establishing co-development and co-marketing agreements with strategic partners.
Manufacturing
Our manufacturing facilities are designed to be flexible in order to allow for the low cost production of a variety of products of different dosages, sizes, packaging and quantities while maintaining a high level of quality and customer service. This flexible production capability allows us to adjust on-line production in order to meet customer requirements.
Facilities
We operate from six buildings owned by the Company on one site in Amityville, New York, totaling approximately 197,000 square feet. Additionally, the Company leases a 15,000 square foot facility which houses the Midlothian division acquired in December 2007.
Raw Materials/Active Pharmaceutical Ingredients
The active compounds for our products, also called active pharmaceutical ingredients or APIs, are purchased from specialized manufacturers and are essential to our business and success. API manufacturers are required to file a Drug Master File with the FDA. Each individual API must be approved by the FDA as part of the ANDA approval process. API manufacturers are also regularly inspected by the FDA.
In some cases, the raw materials used to manufacture pharmaceutical products are only available from a single FDA-approved supplier. Even when more than one supplier exists, the Company may elect to list, and in most cases has only listed, one supplier in its applications with the FDA. Any change in a supplier not previously approved must then be submitted through a formal approval process with the FDA.
It is crucial for the business to select suppliers that meet Current Good Manufacturing Practices (“cGMP”) requirements and that are reliable and offer competitive prices. We are proactive in maintaining good relationships with our API suppliers because we believe that these relationships allow us to save crucial time and be cost competitive. For new products in development, the timely selection of the right API suppliers who have access to cutting-edge chemical and process technologies, and in some cases offer proprietary and patented methods for chemical synthesis and manufacturing processes, can potentially give us a significant advantage over our competitors.
We believe we have good, cooperative working relationships with our suppliers and are not experiencing any difficulty in obtaining raw materials. If a supplier were unable to supply us, we believe we could locate an alternative supplier. However, any change in suppliers of a raw material could cause significant delays and cost increases in the manufacture of products. To mitigate this risk, the Company is currently beginning the process of certifying alternative suppliers for several key APIs.
Competition
The market for generic pharmaceuticals is highly competitive. Our direct competition consists of numerous generic drug manufacturers, many of which have greater financial and other resources than we do. If one or more other generic pharmaceutical manufacturers significantly reduce their prices in an effort to gain market share, our profitability or market position could be adversely affected. Such competitive pressures caused our decline in sales and profitability over the last two years. Competition is based principally on price, quality of products, customer service levels, reputation and marketing support.
Seasonality
We experience seasonal variations in the demand for our cough and cold products. Therefore, no one quarter’s performance can be used to indicate a full year results. Our revenues are typically lower during the first and fourth quarters of our fiscal year. We expect this seasonality to continue in the future.
Government Regulation
FDA Oversight
Our products and facilities are subject to regulation by a number of Federal and state governmental agencies. The FDA, in particular, maintains oversight of our manufacturing process as well as the distribution of our products. Facilities, procedures, operations and/or testing of products are subject to periodic inspection by the FDA, the Drug Enforcement Administration and other authorities. In
6
addition, the FDA conducts pre-approval and post-approval reviews and plant inspections to determine whether our systems and processes are in compliance with cGMP and other FDA regulations. Certain of our suppliers are subject to similar regulations and periodic inspections. We have had several FDA inspections including our most recent which took place in the third quarter of fiscal 2008. We believe the issues cited during the inspection have been adequately addressed by the Company.
A sponsor of a New Drug Application (“NDA”) is required to identify in its application any patent that claims the drug or a use of the drug, which is the subject of the application. Upon NDA approval, the FDA lists the approved drug product and these patents in the Orange Book.
In addition to patent exclusivity, the holder of the NDA for the listed drug may be entitled to a period of non-patent, market exclusivity, during which the FDA cannot approve an application for a bioequivalent product. If the listed drug is a new chemical entity, the FDA may not accept an ANDA for a bioequivalent product for up to five years following approval of the NDA for the new chemical entity. If it is not a new chemical entity but the holder of the NDA conducted clinical trials essential to approval of the NDA or a supplement thereto, the FDA may not approve an ANDA for a bioequivalent product before expiration of three years. Certain other periods of exclusivity may be available if the listed drug is indicated for treatment of a rare disease or is studied for pediatric indications.
The FDA has extensive enforcement powers, including the power to seize noncomplying products, to seek court action to prohibit their sale and to seek criminal penalties for noncomplying manufacturers. Although it has no statutory power to force the recall of products, the FDA usually accomplishes a recall as a result of the threat of judicially imposed seizure, injunction and/or criminal penalties.
ANDA Process
Although many of the products we currently manufacture and market do not require prior specific approval of the FDA, certain products which we currently market and intend to market under our product development program require prior FDA approval using the ANDA procedure prior to being marketed. We currently have 37 approved products, 3 tentatively approved products, 12 products pending FDA approval, and 20 products in active development, of which the majority will require ANDA submissions.
The ANDA approval process is generally less time-consuming and complex than the NDA approval process. It generally does not require new preclincal and clinical studies because it relies on the studies establishing safety and efficacy conducted for the drug previously approved through the NDA process. The ANDA process does, however, occasionally, require one or more bioequivalency studies to show that the ANDA drug is bioequivalent to the previously approved drug. Bioequivalence compares the bioavailability of one drug product with that of referenced brand formulation containing the same active ingredient. When established, bioequivalency confirms that the rate of absorption and levels of concentration in the bloodstream of a formulation of the previously approved drug and the generic drug are equivalent. Bioavailability indicates the rate and extent of absorption and levels of concentration of a drug product in the bloodstream needed to produce the same therapeutic effect. Such studies are not generally required to be performed for solutions (oral, ophthalmic, or solutions for inhalation). Suspensions and certain types of topical products do require bioequivalency testing. Topical creams and ointments require clinical testing. Fluticasone propionate required a large and expensive clinical trial. In certain cases, such as nasal spray suspensions, clinical studies are required in addition to bioequivalency studies to show efficacy compared to the branded product. Such studies, though not as extensive as corresponding studies conducted by innovator companies as part of their NDA process, could require substantial funding.
7
The completion of a prospective product’s formulation, testing and FDA approval generally takes several years. Development activities could begin several years in advance of the patent expiration date, and may include bioequivalency and clinical studies. Consequently, we are presently selecting and will continue to select and develop drugs we expect to market several years in the future.
The timing of final FDA approval of ANDA applications depends on a variety of factors, including whether the applicant challenges any listed patents for the drug and/or its use and whether the brand-name manufacturer is entitled to one or more statutory exclusivity periods. Pending the resolution of any such issues the FDA is prohibited from granting final approval to generic products. In certain circumstances, a regulatory exclusivity period can extend beyond the life of a patent, and thus block ANDAs from being approved on the patent expiration date. For example, the FDA may now extend the exclusivity of a product by six months past the date of patent expiry if the manufacturer undertakes studies on the effect of their product in children (“pediatric extension”). See “Patent Challenge Process.”
Before approving a product, the FDA also requires that a company’s procedures and operations conform to cGMP regulations, as defined in the U.S. Code of Federal Regulations. The Company must follow the cGMP regulations at all times during the manufacture of its products.
If the FDA concludes that all substantive ANDA requirements (chemistry, bioequivalency, labeling and manufacturing) have been satisfied, but a final ANDA approval cannot be granted because of patent or exclusivity-related considerations, the FDA may issue a tentative approval.
Patent Challenge Process
The Hatch-Waxman Act provides incentives for generic pharmaceutical manufacturers to challenge patents on branded pharmaceutical products, their methods of use and specific formulations, as well as to develop non-infringing forms of the patented subject matter. The purpose of the Hatch-Waxman Act is to stimulate competition by providing incentives to generic companies to introduce their products early, and at the same time to ensure that such suits are not frivolous.
If there is a patent listed in the FDA’s Orange Book at the time of filing an ANDA with the FDA and the generic drug company intends to market the generic equivalent prior to the expiration of that patent, the generic company files with its ANDA a certification asserting that the patent is invalid, unenforceable and/or not infringed (“Paragraph IV certification”). After receiving notice from the FDA that its application is acceptable for filing, the generic company sends the patent holder and the holder of the New Drug Application (“NDA”) for the brand-name drug a notice explaining why it believes that the patents in question are invalid, unenforceable or not infringed. Upon receipt of the notice from the generic company, the patent holder has 45 days during which to bring a patent infringement suit in federal district court against the generic company. The discovery, trial and appeals process in such suits can take several years and have high legal costs.
If a suit is commenced by the patent holder, the Hatch-Waxman Act provides for an automatic stay on the FDA’s ability to grant final approval of the ANDA for the generic product. The period during which the FDA may not approve the ANDA and the patent challenger therefore may not market the generic product is 30 months, or such shorter or longer period as may be ordered by the court. The 30-month period may or may not, and often does not, coincide with the timing of the resolution of the lawsuit or the expiration of a patent, but if the patent challenge is successful or the challenged patent expires during the 30-month period, the FDA may approve the generic drug for marketing, assuming there are no other obstacles to approval such as exclusivities given to the NDA holder.
Under the Hatch-Waxman Act, the developer of a proposed generic drug which is the first to have its ANDA accepted for filing by the FDA, and whose filing includes a Paragraph IV certification, may be eligible to receive a 180-day period of generic market exclusivity. This period of market exclusivity may provide the patent challenger with the opportunity to earn a return on the risks taken and its legal and development costs and to build its market share before competitors can enter the market.
Medicaid and Medicare
Medicaid, Medicare and other reimbursement legislation or programs govern reimbursement levels and require all pharmaceutical manufacturers to rebate a percentage of their revenues arising from Medicaid-reimbursed drug sales to individual states. The required rebate is currently 11% of the average manufacturer’s price for sales of Medicaid-reimbursed products marketed under ANDAs. We believe that Federal or state governments may continue to enact measures aimed at reducing the cost of drugs to the public. For example, Congress passed the Medicare Prescription Drug, Improvement, and Modernization Act of 2003, which provides a comprehensive pharmacy benefit for Medicare recipients.
8
DEA
Because the Company sells and develops products containing controlled substances, it must meet the requirements and regulations of the Controlled Substances Act which are administered by the Drug Enforcement Agency (“DEA”). These regulations include stringent requirements for manufacturing controls and security to prevent diversion of or unauthorized access to the drugs in each stage of the production and distribution process. We have the approval of the DEA to sell certain generic pharmaceutical products containing narcotics. We are currently manufacturing 7 preparations containing narcotics and are developing other products that contain narcotics. In order to manufacture and sell products containing narcotics, we have implemented stringent security precautions to insure that the narcotics are accounted for and properly stored. We believe that the Company is currently in compliance with all applicable DEA requirements.
Environment
We believe that our operations comply in all material respects with applicable laws and regulations concerning the environment. While it is impossible to predict accurately the future costs associated with environmental compliance and potential remediation activities, compliance with environmental laws is not expected to require significant capital expenditures and has not had, and is not expected to have, a material adverse effect on our earnings or competitive position.
Product Liability
The sale of pharmaceutical products can expose the manufacturer of such products to product liability claims by consumers. A product liability claim, if successful and in excess of our insurance coverage, could have a material adverse effect on our financial condition. We maintain product liability insurance policies which provide coverage in the amount $10,000,000 per claim and in the aggregate.
Employees
As of April 30, 2008, we employed 258 full-time persons and 18 part-time persons, of whom 30 were engaged in executive, financial and administrative capacities; 25 in marketing, sales and service; 121 full-time employees and 18 part-time employees in production, warehousing and distribution; and 82 in research and development and quality control functions. We are not a party to a collective bargaining agreement. The management of the Company considers its relations with its employees to be satisfactory.
Website Access to Filings with the Securities and Exchange Commission
Additional information about the Company is available on our website at www.hitechpharm.com. All of our electronic filings with the SEC including Annual Reports on Form 10-K, Quarterly Reports on Form 10-Q, Current Reports on Form 8-K and any amendments to these reports filed or furnished pursuant to Section 13(a) or 15(d) of the Securities Exchange Act of 1934, are available on our website free of charge as soon as reasonably practicable after they are electronically filed with and furnished to the SEC. The SEC’s internet site contains reports, proxy and information statements and other information regarding issuers that file electronically with the SEC. Our SEC filings are also available through the SEC’s website at http://www.sec.gov. You may read and copy any material we file with the SEC at the SEC’s Public Reference Room at 100 F Street, N.W., Washington, D.C. 20549. You may obtain information on the operation of the Public Room by calling the SEC at 1-800-SEC-0330. Information contained on our website is not incorporated by reference in the Annual Report on Form 10-K and shall not be deemed “filed” under the Securities Exchange Act of 1934.
The following risk factors could have a material adverse effect on the Company’s business, financial position or results of operations. These risk factors may not include all of the important factors that could affect our business or our industry or that could cause our future financial results to differ materially from historic or expected results or cause the market price of our common stock to fluctuate or decline.
9
Delays in New Product Introductions
Our future revenue growth and profitability are dependent upon our ability to develop and introduce new products on a timely basis in relation to our competitors’ product introductions. Our failure to do so successfully could have a material adverse effect on our financial position and results of operations.
Many products require FDA approval prior to being marketed. The process of obtaining FDA approval to manufacture and market new and generic pharmaceutical products is rigorous, time-consuming, costly and largely unpredictable. We may be unable to obtain requisite FDA approvals on a timely basis for new generic products that we may develop. The timing and cost of obtaining FDA approvals could adversely affect our product introduction plans, financial position and results of operations.
10
The ANDA process often results in the FDA granting final approval to a number of ANDAs for a given product. We may face immediate competition when we introduce a generic product into the market. These circumstances could result in significantly lower prices, as well as reduced margins, for generic products compared to brand products. New generic market entrants generally cause continued price and margin erosion over the generic product life cycle.
Approved Products May Not Achieve Expected Levels of Market Acceptance
Our approved products may not achieve expected levels of market acceptance, which could have a material adverse effect on our profitability, financial position and results of operations. Even if we were able to obtain regulatory approvals of our new pharmaceutical products, generic or brand, the success of those products is dependent upon market acceptance. Levels of market acceptance for new products could be impacted by several factors, including:
| | • | | the availability of alternative products from our competitors |
| | • | | the price of our products relative to that of our competitors |
| | • | | the availability of authorized generics |
| | • | | the timing of our market entry |
| | • | | the ability of our customers to market our products effectively to the retail level |
| | • | | the acceptance of our products by government and private formularies |
Some of these factors are not within our control.
Unapproved Products
The Company sells several products which do not have ANDAs. These products either fall under the grandfathered or Drug Efficacy Study Implementation (“DESI”) classification. Grandfathered drugs are drugs that were on the market prior to the passage of the Food, Drug and Cosmetic Act of 1938. It was not until the passage of the Food, Drug and Cosmetic Act of 1938 that a New Drug Application (NDA) was required for marketing a drug product as the regulatory mechanism for insuring that all new drugs were cleared for safety prior to distribution. The requirement for pre-clearance for effectiveness was added by the 1962 amendment.
Following enactment of the 1938 law, drugs on the market prior to that time were exempted or “grandfathered” and manufacturers were not required to file an NDA. The premise was that all pre-1938 drugs were considered safe, and if the manufacturer did not change the product formulation or indication, then an NDA was not required.
DESI drugs are drugs that were approved solely on the basis of their safety prior to 1962. Thereafter, Congress required drugs to be shown to be effective as well. The FDA initiated the DESI program to evaluate the effectiveness of those drugs that had been previously approved on safety grounds alone. These drugs, and those identical, related, and similar to them, may continue to be marketed until the administrative proceedings evaluating their effectiveness have been concluded, at which point continued marketing is only permitted if an NDA is approved for such drugs. The vast majority of the DESI proceedings have been concluded, but a few are still pending.
Continuing studies of the proper utilization, safety and efficacy of pharmaceutical products are being conducted by the industry, government agencies and others. Such studies, which increasingly employ sophisticated methods and techniques, can call into question the utilization, safety and efficacy of currently marketed products. In some cases, these studies have resulted, and may in the future result, in the discontinuance of product marketing. These situations, should they occur, could have a material adverse effect on our profitability, financial position and results of operations.
Industry is Highly Competitive
We face competition from other pharmaceutical manufacturers that threatens the commercial acceptance and pricing of our products, which could have a material adverse effect on our business, financial position and results of operations.
Our competitors may be able to develop products and processes competitive with or superior to our own for many reasons, including that they may have:
| | • | | proprietary processes or delivery systems |
| | • | | larger research and development staffs |
| | • | | larger sales and marketing staffs |
11
| | • | | larger production capabilities |
| | • | | more experience in developing new drugs and greater financial resources |
Each of these factors and others could have a material adverse effect on our business, financial position and results of operations.
Government Regulation
Because the pharmaceutical industry is heavily regulated, we face significant costs and uncertainties associated with our efforts to comply with applicable regulations. Should we fail to comply, we could experience material adverse effects on our business, financial position and results of operations.
The pharmaceutical industry is subject to regulation by various Federal and state governmental authorities. For instance, we must comply with FDA requirements with respect to the manufacture, labeling, sale, distribution, marketing, advertising, promotion and development of pharmaceutical products. Failure to comply with FDA and other governmental regulations can result in fines, disgorgement, unanticipated compliance expenditures, recall or seizure of products, total or partial suspension of production and/or distribution, suspension of FDA’s review of ANDAs, enforcement actions, injunctions and criminal prosecution. Under certain circumstances, the FDA also has the authority to revoke previously granted drug approvals. Although we have internal regulatory compliance programs and policies and have had a favorable compliance history, there is no guarantee that we may not be deemed to be deficient in some manner in the future. If we were deemed to be deficient in any significant way, it could have a material adverse effect on our business, financial position and results of operations.
In addition to the new drug approval process, the FDA also regulates the facilities and operational procedures that we use to manufacture our products. We must register our facilities with the FDA. All products manufactured in those facilities must be made in a manner consistent with current Good Manufacturing Practices (“cGMP”). Compliance with cGMP regulations requires substantial expenditures of time, money and effort in such areas as production and quality control to ensure full technical compliance. Failure to comply with cGMP regulations could result in an enforcement action brought by the FDA, which periodically inspects our manufacturing facilities for compliance, which could include withholding the approval of ANDAs or other product applications of a facility if deficiencies are found at that facility. FDA approval to manufacture a drug is site-specific. If the FDA would cause our manufacturing facilities to cease or limit production, our business could be adversely affected. Delay and cost in obtaining FDA approval to manufacture at a different facility also could have a material adverse effect on our business, financial position and results of operations.
We are subject, as are generally all manufacturers, to various Federal, state and local laws of general applicability, such as laws regulating working conditions, as well as environmental protection laws and regulations, including those governing the discharge of materials into the environment. Although we have not incurred significant costs associated with complying with such environmental provisions in the past, if changes to such environmental provisions are made in the future that require significant changes in our operations or if we engage in the development and manufacturing of new products requiring new or different environmental controls, we may be required to expend significant funds. Such changes could have a material adverse effect on our business, financial position and results of operations.
Limited Number of Major Customers
Our top 5 customers, based on sales, accounted for 49% of our total sales for fiscal 2008. Any significant reduction of business with any of our top 5 customers could have a material adverse effect on our business, financial position and results of operations.
Third Party Suppliers
Active pharmaceutical ingredients, packaging components, and other materials and supplies that we use in our pharmaceutical manufacturing operations, as well as certain finished products, are generally available and purchased from many different foreign and domestic suppliers. Additionally, we maintain sufficient raw materials inventory, and in certain cases where we have listed only one supplier in our applications with the FDA, we have received FDA approval to use alternative suppliers should the need arise. However, there is no guarantee that we will always have timely and sufficient access to a critical raw material or finished product. A prolonged interruption in the supply of a single-sourced active ingredient or finished product could cause our financial position and results of operations to be materially adversely affected.
12
Limited Number of Manufacturing Facilities
Our generic products and some of our branded products are produced at our two manufacturing facilities located at one site. A significant disruption at these facilities, even on a short-term basis, could impair our ability to produce and ship products to the market on a timely basis, which could have a material adverse effect on our business, financial position and results of operations.
Consolidation of Customers
Significant amounts of our sales are made to a relatively small number of drug wholesalers, retail drug chains, managed care purchasing organizations, mail order pharmacies and hospitals. These customers represent an essential part of the distribution chain of generic pharmaceutical products. These customers have undergone, and are continuing to undergo, significant consolidation. This consolidation may result in these groups gaining additional purchasing leverage and consequently increasing the product pricing pressures facing our business. Additionally, the emergence of large buying groups representing independent retail pharmacies and the prevalence and influence of managed care organizations and similar institutions potentially enable those groups to attempt to extract price discounts on our products. The result of these developments may have a material adverse effect on our business, financial position and results of operations.
Indemnification Obligations
In the normal course of business, we periodically enter into employment, legal settlements, and other agreements which incorporate indemnification provisions. We maintain insurance coverage which we believe will effectively mitigate our obligations under these indemnification provisions. However, should our obligation under an indemnification provision exceed our coverage or should coverage be denied, it could have a material adverse effect on our business, financial position and results of operations.
Uncertainties of Estimates and Assumptions
There are inherent uncertainties involved in estimates, judgments and assumptions used in the preparation of financial statements in accordance with accounting principles generally accepted in the United States of America (“GAAP”). Any changes in estimates, judgments and assumptions used could have a material adverse effect on our business, financial position and results of operations.
The financial statements included in the periodic reports we file with the Securities and Exchange Commission (“SEC”) are prepared in accordance with GAAP. The preparation of financial statements in accordance with GAAP involves making estimates of expenses and income. This includes, but is not limited to, estimates, judgments and assumptions used in the adoption of the provisions of SFAS No. 144, Accounting for the Impairment or Disposal of Long-Lived Assets and SFAS No. 123, revised 2004, Accounting for Stock-Based Compensation. Estimates, judgments and assumptions are inherently subject to change in the future, and any such changes could result in corresponding changes to the amounts of assets, liabilities, revenues, expenses and income. Any such changes could have a material adverse effect on our business, financial position and results of operations.
| ITEM 1B. | UNRESOLVED STAFF COMMENTS. |
None
Our executive offices and manufacturing facilities are owned by the Company and are located in Amityville, New York, comprise six buildings with approximately 197,000 square feet. These include:
| | • | | A 42,000 square foot facility dedicated to liquid and semi-solid production |
| | • | | A 28,000 square foot facility housing a sterile manufacturing facility, DEA manufacturing, chemistry and microbiology laboratories |
| | • | | A 62,500 square foot facility used for the warehousing of finished goods which also houses our Health Care Products Division |
| | • | | A 21,500 square foot facility with 3,500 square feet of research and development space and 18,000 square feet of warehouse space |
| | • | | An 8,000 square foot office building which is utilized for administrative functions |
| | • | | A 35,000 square foot facility acquired in April 2006 with mixed office, laboratory and manufacturing space which was partially renovated in FY2007 |
13
Additionally, the Company leases a 15,000 square foot facility located in Montgomery, Alabama which houses our Midlothian division. The lease on this facility expires in February 2009 and is renewable.
We believe that our properties are adequately covered by insurance and are suitable and adequate for our needs for several years.
| ITEM 3. | LEGAL PROCEEDINGS. |
The disclosure under Note M, Commitments, Contingencies and Other Matters, Legal Proceedings included in Part II Item 8 of this report is incorporated in this Part I Item 3 by reference.
| ITEM 4. | SUBMISSION OF MATTERS TO A VOTE OF SECURITY HOLDERS. |
No matters were submitted to a vote of security holders during the quarter ended April 30, 2008.
14
PART II
| ITEM 5. | MARKET FOR THE REGISTRANT’S COMMON EQUITY, RELATED STOCKHOLDER MATTERS AND ISSUER PURCHASES OF EQUITY SECURITIES. |
Market Information
The Company’s common stock is traded on the National Global Market System of the National Association of Securities Dealers Automated Quotation System (“NASDAQ”) under the symbol HITK.
The following table sets forth the high and low closing sales prices per share of the Company’s common stock for the periods indicated on the NASDAQ National Global Market System. The quotations are inter-dealer prices, without retail mark-up, mark-down or commissions paid, and may not necessarily reflect actual transactions.
| | | | |
Quarter Ended | | High | | Low |
Fiscal 2007 | | | | |
July 31, 2006 | | 24.63 | | 15.71 |
October 31, 2006 | | 18.81 | | 12.10 |
January 31, 2007 | | 15.52 | | 10.78 |
April 30, 2007 | | 13.41 | | 10.19 |
Fiscal 2008 | | | | |
July 31, 2007 | | 13.36 | | 9.62 |
October 31, 2007 | | 11.95 | | 9.90 |
January 31, 2008 | | 12.40 | | 8.72 |
April 30, 2008 | | 12.38 | | 8.60 |
As of July 10, 2008 the closing price of the Common Stock on the Nasdaq Global Market System was $ 10.39.
Equity Compensation Plan Information
The table below sets forth, as of the end of the fiscal year ended April 30, 2008, for the Hi-Tech Pharmacal Co., Inc. Employee Stock Option Plan and Director Stock Option Plan (“Plan”) the number of securities to be issued upon the exercise of outstanding options, warrants and rights; the weighted-average exercise price of the outstanding options warrants and rights; and the number of securities remaining for future issuance under the Plan:
| | | | | | | |
Plan Category | | Number of securities to
be issued upon exercise of
outstanding options,
warrants and rights | | Weighted-average
exercise price of
outstanding options,
warrants and rights | | Number of securities
remaining available
for future issuance
under equity
compensation plans
(excluding securities
reflected in column
(a)) |
| | | (a) | | (b) | | (c) |
Equity compensation plans approved by security holders | | 2,770,000 | | $ | 11.06 | | 755,000 |
Equity compensation plans not approved by security holders | | — | | | — | | — |
| | | | | | | |
Total | | 2,770,000 | | $ | 11.06 | | 755,000 |
| | | | | | | |
There are no Company equity compensation plans not approved by the Company’s stockholders.
15
UNREGISTERED SALES OF EQUITY SECURITIES, USE OF PROCEEDS AND ISSUER PURCHASES OF EQUITY SECURITIES
Recent Sales of Unregistered Shares
| | | | | | | | | | |
Period | | Total Number of
Shares Purchased | | Average Price
per Share | | Total Number of Shares
Purchased as Part of Publicly
Announced Plans | | Approximate
Dollar Value
of Shares
that May Yet
Be
Purchased
Under the
Plans (1) |
02/01/08 – 02/28/08 | | 0 | | $ | 0.00 | | 0 | | $ | 1,993,000 |
03/01/08 – 03/31/08 | | 39,000 | | $ | 8.92 | | 39,000 | | $ | 1,649,000 |
04/01/08 – 04/30/08 | | 0 | | $ | 0.00 | | 0 | | $ | 1,649,000 |
| (1) | During the three months ended April 30, 2008 the Company repurchased approximately 39,000 shares of the Company’s common stock for a purchase price of $344,000. The Company’s Board of Directors has authorized $23,000,000 to repurchase the Company’s common stock. Pursuant to the terms of a Rule 10b5-1 stock repurchase plan, these repurchases may be made from time to time in the open market or in private transactions as market conditions dictate. As of April 30, 2008 the Company has purchased 2,202,000 shares for $21,351,000. |
Common Stock Holders
The Company believes there are approximately 3,800 holders of Common Stock, not including shares held in street name by brokers and nominees as of July 10, 2008.
Dividends
The Company has never declared or paid any cash dividends, and it does not anticipate that it will pay cash dividends in the foreseeable future. The declaration of dividends by the Company in the future is subject to the sole discretion of the Company’s Board of Directors and will depend upon the operating results, capital requirements and financial position of the Company, general economic conditions and other pertinent conditions or restrictions relating to any financing. The Company’s loan agreement prohibits the payment of cash dividends by the Company.
16
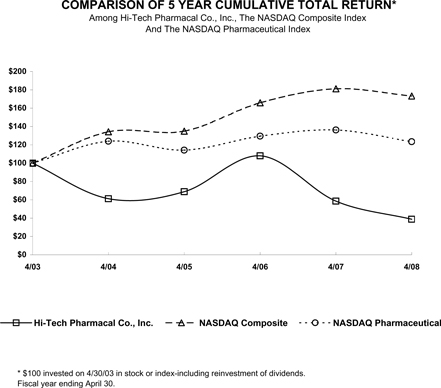
Performance Graph
This performance graph shall not be deemed “filed” for purposed of Section 18 of the Securities Exchange Act of 1934, as amended (the “Exchange Act”) or otherwise subject to the liabilities under that Section and shall not be deemed to be incorporated by reference into any filing of the Company under the Securities Act of 1933, as amended or the Exchange Act.
The following graph compares, for the five year period ended April 30, 2008, the cumulative total stockholder return for our common stock, the Nasdaq Stock Market (U.S. companies) Index (the “Nasdaq Composite”) and the Nasdaq Pharmaceutical Index (the “Nasdaq Pharmaceutical”). The graph assumes that $100 was invested on May 1, 2003 in the common stock of the Company, and in the Nasdaq Composite and the Nasdaq Pharmaceutical and assumes reinvestment of any dividends. The stock price performance on the following graph is not necessarily indicative of future stock price performance.
17
| ITEM 6. | SELECTED FINANCIAL DATA |
The selected financial data presented below for the five years ended April 30, 2008 are derived from the audited financial statements of the Company. This data is qualified in its entirety by reference to, and should be read in conjunction with, Management’s Discussion and Analysis of Financial Condition and Results of Operations and the Company’s financial statements and related notes thereto for the years ended April 30, 2008, 2007 and 2006.
| | | | | | | | | | | | | | | | | | | | |
YEAR ENDED APRIL 30, | | 2008 | | | 2007 | | | 2006 | | | 2005 | | | 2004 | |
Statement of operations data | | | | | | | | | | | | | | | | | | | | |
Net sales | | $ | 62,017,000 | | | | 58,898,000 | | | $ | 78,020,000 | | | $ | 67,683,000 | | | $ | 56,366,000 | |
Costs and expenses: | | | | | | | | | | | | | | | | | | | | |
Costs of goods sold | | | 40,505,000 | | | | 35,704,000 | | | | 35,833,000 | | | | 31,360,000 | | | | 26,207,000 | |
Research and development | | | 6,208,000 | | | | 4,733,000 | | | | 3,334,000 | | | | 4,373,000 | | | | 3,820,000 | |
Selling, general and administrative | | | 22,625,000 | | | | 23,914,000 | | | | 23,210,000 | | | | 19,574,000 | | | | 16,758,000 | |
Contract research (income) | | | — | | | | (123,000 | ) | | | (27,000 | ) | | | (50,000 | ) | | | (504,000 | ) |
Interest expense | | | 27 ,000 | | | | 18,000 | | | | 12,000 | | | | 24,000 | | | | 24,000 | |
Interest (income) and other | | | (480,000 | ) | | | (1,314,000 | ) | | | (1,937,000 | ) | | | (655,000 | ) | | | (281,000 | ) |
| | | | | | | | | | | | | | | | | | | | |
Total | | $ | 68,885,000 | | | | 62,932,000 | | | $ | 60,425,000 | | | $ | 54,626,000 | | | $ | 46,024,000 | |
| | | | | | | | | | | | | | | | | | | | |
Income (loss) before (benefit) provision for income taxes | | | (6,868,000 | ) | | | (4,034,000 | ) | | | 17,595,000 | | | | 13,057,000 | | | | 10,342,000 | |
(Benefit) provision for income taxes | | | (1,770,000 | ) | | | (1,998,000 | ) | | | 6,142,000 | | | | 4,769,000 | | | | 3,750,000 | |
| | | | | | | | | | | | | | | | | | | | |
Net income (loss) | | | (5,098,000 | ) | | | (2,036,000 | ) | | $ | 11,453,000 | | | $ | 8,288,000 | | | $ | 6,592,000 | |
| | | | | | | | | | | | | | | | | | | | |
Basic earnings (loss) per share | | $ | (0.45 | ) | | $ | (0.17 | ) | | $ | 0.96 | | | $ | 0.70 | | | $ | 0.56 | |
| | | | | | | | | | | | | | | | | | | | |
Diluted earnings (loss) per share | | $ | (0.45 | ) | | $ | (0.17 | ) | | $ | 0.85 | | | $ | 0.64 | | | $ | 0.50 | |
| | | | | | | | | | | | | | | | | | | | |
Weighted average common shares outstanding: | | | | | | | | | | | | | | | | | | | | |
Basic earnings (loss) per share | | | 11,353,000 | | | | 11,884,000 | | | | 11,939,000 | | | | 11,858,000 | | | | 11,809,000 | |
Effect of potential common shares | | | — | | | | — | | | | 1,465,000 | | | | 1,130,000 | | | | 1,478,000 | |
| | | | | | | | | | | | | | | | | | | | |
Diluted earnings (loss) per share | | | 11,353,000 | | | | 11,884,000 | | | | 13,404,000 | | | | 12,988,000 | | | | 13,287,000 | |
| | | | | | | | | | | | | | | | | | | | |
| | | | | |
APRIL 30, | | 2008 | | | 2007 | | | 2006 | | | 2005 | | | 2004 | |
Balance sheet data: | | | | | | | | | | | | | | | | | | | | |
Working capital | | $ | 45,875,000 | | | $ | 55,540,000 | | | $ | 65,234,000 | | | $ | 54,021,000 | | | $ | 55,772,000 | |
Total assets | | $ | 85,012,000 | | | $ | 97,742,000 | | | $ | 100,379,000 | | | $ | 81,612,000 | | | $ | 75,552,000 | |
Long-term debt | | | 0 | | | | 0 | | | | 0 | | | | 0 | | | | 0 | |
Stockholders’ equity | | $ | 75,165,000 | | | $ | 82,985,000 | | | $ | 88,442,000 | | | $ | 69,665,000 | | | $ | 66,788,000 | |
18
| ITEM 7. | MANAGEMENT’S DISCUSSION AND ANALYSIS OF FINANCIAL CONDITION AND RESULTS OF OPERATIONS |
GENERAL
The following discussion and analysis should be read in conjunction with the Financial Statements and Notes thereto appearing elsewhere in this Report.
The following table sets forth, for all periods indicated, the percentage relationship that items in the Company’s Statements of Operations bear to net sales.
| | | | | | | | | |
| | | YEAR ENDED APRIL 30, | |
| | | 2008 | | | 2007 | | | 2006 | |
Net Sales | | 100.0 | % | | 100.0 | % | | 100.0 | % |
Cost of Sales | | 65.3 | % | | 60.6 | % | | 45.9 | % |
| | | | | | | | | |
Gross profit | | 34.7 | % | | 39.4 | % | | 54.1 | % |
| | | | | | | | | |
Selling, general & administrative expense | | 36.5 | % | | 40.6 | % | | 29.7 | % |
Research & development costs | | 10.0 | % | | 8.0 | % | | 4.3 | % |
Contract research (income) | | 0.0 | % | | -0.2 | % | | 0.0 | % |
Interest expense | | 0.0 | % | | 0.0 | % | | 0.0 | % |
Interest (income) and other | | -0.8 | % | | -2.2 | % | | -2.5 | % |
| | | | | | | | | |
Total expenses | | 45.7 | % | | 46.2 | % | | 31.5 | % |
| | | | | | | | | |
Income (loss) before tax provision | | -11.0 | % | | -6.8 | % | | 22.6 | % |
Income (benefit) tax provision | | 2.8 | % | | 3.4 | % | | 7.9 | % |
| | | | | | | | | |
Net income (loss) | | -8.2 | % | | -3.4 | % | | 14.7 | % |
| | | | | | | | | |
RESULTS OF OPERATIONS FOR YEARS ENDED APRIL 30, 2008 AND 2007
Revenue
| | | | | | | | | | | | | |
| | | 2008 | | 2007 | | Change | | | % Change | |
Hi-Tech Generics | | $ | 46,256,000 | | $ | 46,361,000 | | $ | (105,000 | ) | | 0 | % |
Health Care Products | | | 10,846,000 | | | 10,845,000 | | | 1,000 | | | 0 | % |
Midlothian | | | 4,216,000 | | | — | | | 4,216,000 | | | N/A | |
Naprelan® | | | 699,000 | | | 1,692,000 | | | (993,000 | ) | | -59 | % |
| | | | | | | | | | | | | |
Total | | $ | 62,017,000 | | $ | 58,898,000 | | $ | 3,119,000 | | | 5 | % |
| | | | | | | | | | | | | |
Net sales of Hi-Tech generic pharmaceutical products, which includes some private label contract manufacturing, decreased due to continued pricing pressure on many of the Company’s core products offset by new product launches including Ciclopirox topical solution, 8%, Fluticasone proprionate nasal spray, 50 mcg, Hydrocodone Bitartrate and Homatropine Methylbromide Syrup and Oflaxacin Otic solution, 0.3%. These increases were partially offset by decreases in sales of cough and flu products as well as urea based products.
The Health Care Products division, which markets the Company’s branded products, had lower sales of Diabetic Tussin® due to the discontinuation of Children’s Diabetic Tussin® at certain retail chains. These decreases were offset by increases in sales of Multibetic® and Zostrix®, including the newly launched Zostrix® Neuropathy product.
In December 2007, Hi-Tech acquired the assets of Midlothian Laboratories, a company which markets and distributes generic products in the cough and cold and prescription vitamin markets. In April 2007, Hi-Tech divested Naprelan®. Sales of Naprelan® in the current year represent inventory sold as part of the divestiture.
19
Cost of Sales
| | | | | | | | | | |
| | | 2008 | | | 2007 | |
| | | $ | | % of sales | | | $ | | % of sales | |
Cost of Sales | | 40,505,000 | | 65 | % | | 35,704,000 | | 61 | % |
The increase in cost of sales as a percentage of net sales is due to decreased unit sales of higher margin branded products, increased unit sales of lower margin products, increased raw material prices and pricing pressure which lowered margins on several generic products. Additionally, raw material and component prices have increased due to the price of oil increasing the costs for plastic bottles, increases in the price of corn and other sweeteners, and the decline of the U.S. dollar which is driving price increases from certain foreign raw material suppliers. These trends were partially offset by the acquisition of Midlothian Laboratories, since, on average, this division has higher gross margins than Hi-Tech’s core generic business.
Expense Items
| | | | | | | | | | | | | | | |
| | | 2008 | | | 2007 | | | Change | | | % Change | |
Selling, general and administrative expense | | $ | 22,625,000 | | | $ | 23,914,000 | | | $ | (1,289,000 | ) | | -5 | % |
Research and product development costs | | $ | 6,208,000 | | | $ | 4,733,000 | | | $ | 1,475,000 | | | 31 | % |
Contract research (income) | | | — | | | $ | (123,000 | ) | | $ | (123,000 | ) | | N/A | |
Interest expense | | $ | 27,000 | | | $ | 18,000 | | | $ | 9,000 | | | 50 | % |
Interest (income) and other | | $ | (480,000 | ) | | $ | (1,314,000 | ) | | $ | (834,000 | ) | | -63 | % |
Provision for income tax (benefit)/expense | | $ | (1,770,000 | ) | | $ | (1,998,000 | ) | | $ | (228,000 | ) | | -11 | % |
Decreases in selling, general and administrative expenses are related to lower legal fees and cost reduction efforts by management.
The increase in expenditures for research and development were driven by increased expenditures on externally developed projects. The Company’s largest expenditure on a single project was for a product line that is being jointly developing with two other generic drug companies. The Company spent $1,591,000 and $409,000 in fiscal year 2008 and fiscal year 2007, respectively, on this project including expenditures on a clinical trial. The clinical trial for this product is ongoing, and the Company believes that it will file ANDAs for these products in late fiscal year 2009 and fiscal year 2010.
The Company did not have any projects that resulted in contract research income in 2008.
Interest income decreased in 2008, because the Company had lower average cash and investment balances. Also, included in other (income) expense is the other than temporary write down in the value of adjustable rate securities of $500,000.
Income Analysis
| | | | | | | | | | | | | | | |
| | | 2008 | | | 2007 | | | Change | | | % Change | |
Net Income (Loss) | | $ | (5,098,000 | ) | | $ | (2,036,000 | ) | | $ | (3,062,000 | ) | | 150 | % |
Basic Earnings (Loss) Per Share | | $ | (0.45 | ) | | $ | (0.17 | ) | | $ | (0.28 | ) | | 165 | % |
Diluted Earnings (Loss) Per Share | | $ | (0.45 | ) | | $ | (0.17 | ) | | $ | (0.28 | ) | | 165 | % |
Weighted Average Common Shares Outstanding, Basic | | | 11,353,000 | | | | 11,884,000 | | | | (531,000 | ) | | -4 | % |
Effect of Potential Common Shares | | | — | | | | — | | | | | | | | |
Weighted Average Common Shares Outstanding, Diluted | | | 11,353,000 | | | | 11,884,000 | | | | (531,000 | ) | | -4 | % |
The reduced share count in 2008 reflects the Company’s activity in repurchasing shares, which was partially offset by option exercises.
20
RESULTS OF OPERATIONS FOR YEARS ENDED APRIL 30, 2007 AND 2006
Revenue
| | | | | | | | | | | | | |
| | | 2007 | | 2006 | | Change | | | % Change | |
Hi-Tech Generics | | $ | 46,361,000 | | $ | 65,471,000 | | $ | (19,110,000 | ) | | -29 | % |
Health Care Products | | | 10,845,000 | | | 9,767,000 | | | 1,078,000 | | | 11 | % |
Midlothian | | | — | | | — | | | — | | | N/A | |
Naprelan® | | | 1,692,000 | | | 2,782,000 | | | (1,090,000 | ) | | -39 | % |
| | | | | | | | | | | | | |
Total | | $ | 58,898,000 | | $ | 78,020,000 | | $ | (19,122,000 | ) | | -25 | % |
| | | | | | | | | | | | | |
The decrease of Hi-Tech generic sales is primarily due to pricing declines on our existing product line and a decrease in unit volume due to a weaker than normal cold and flu season in the spring and fall of 2006. The Company’s leading generic product for the fiscal year ended April 30, 2007, Sulfamethoxazole with Trimethoprim, faced two new competitors resulting in lower sales volumes and lower prices.
The Health Care Products division increased sales primarily as the result of increased sales of the Zostrix® line of products, acquired in July of 2005, and increased sales of Diabetic Tussin® due to product line extensions. Diabetic Tussin® accounted for net sales of approximately $6,000,000 for the twelve months ended April 30, 2007 and $5,200,000 for the twelve months ended April 30, 2006.
The Company divested the Naprelan® brand on April 30, 2007. A portion of 2007 sales were to the purchaser at cost.
Cost of Sales
| | | | | | | | | | |
| | | 2007 | | | 2006 | |
| | | $ | | % of sales | | | $ | | % of sales | |
Cost of Sales | | 35,704,000 | | 61 | % | | 35,833,000 | | 46 | % |
This increase in cost of sales as a percentage of sales was due to price reductions on higher margin products and the implementation of FAS 123(R) which resulted in $584,000 of cost related to the expensing of stock options. Additionally, as part of the sale of the Naprelan® brand, some Naprelan® product sales to the purchaser were at cost, increasing the cost of sales percentage of the Company.
Expense Items
| | | | | | | | | | | | | | | |
| | | 2007 | | | 2006 | | | Change | | | % Change | |
Selling, general and administrative expense | | $ | 23,914,000 | | | $ | 23,210,000 | | | $ | 704,000 | | | 3 | % |
Research and product development costs | | $ | 4,733,000 | | | $ | 3,334,000 | | | $ | 1,399,000 | | | 42 | % |
Contract research (income) | | $ | (123,000 | ) | | $ | (27,000 | ) | | $ | (96,000 | ) | | 356 | % |
Interest expense | | $ | 18,000 | | | $ | 12,000 | | | $ | 6,000 | | | 50 | % |
Interest (income) and other | | $ | (1,314,000 | ) | | $ | (1,937,000 | ) | | $ | 623,000 | | | -32 | % |
Provision for income tax (benefit)/expense | | $ | (1,998,000 | ) | | $ | 6,142,000 | | | $ | (8,140,000 | ) | | -133 | % |
Selling, general and administrative expenses increased due to increased stock-based compensation related to stock options of $2,027,000 and increases in amortization expense offset by decreased legal fees and selling expenses.
Research and product development costs for fiscal 2007 increased primarily due to external development spending, increased salary expense and expense related to stock options of $219,000.
The Company incurred a one time expense of $1,800,000 in fiscal 2007 as it settled a lawsuit with MedPointe Pharmaceuticals. Additionally, the Company realized a $1,848,000 gain on the sale of the Naprelan® brand. These items are included on the income statement in interest (income) and other.
21
The Company incurred a $2,830,000 expense, net of tax benefit, due to the implementation of FAS 123(R) in the year ended April 30, 2007.
| | | | | | | | | | | | | | |
| | | 2007 | | | 2006 | | Change | | | % Change | |
Net Income (Loss) | | $ | (2,036,000 | ) | | $ | 11,453,000 | | $ | (13,489,000 | ) | | -118 | % |
Basic Earnings (Loss) Per Share | | $ | (0.17 | ) | | $ | 0.96 | | $ | (1.13 | ) | | -118 | % |
Diluted Earnings (Loss) Per Share | | $ | (0.17 | ) | | $ | 0.85 | | $ | (1.02 | ) | | -120 | % |
Weighted Average Common Shares Outstanding, Basic | | | 11,884,000 | | | | 11,939,000 | | | (55,000 | ) | | 0 | % |
Effect of Potential Common Shares | | | — | | | | 1,465,000 | | | (1,465,000 | ) | | -100 | % |
Weighted Average Common Shares Outstanding, Diluted | | | 11,884,000 | | | | 13,404,000 | | | (1,520,000 | ) | | -11 | % |
The Company’s loss of $.17 per basic and fully diluted share for the year ended April 30, 2007 includes approximately $.15 per share of costs relating to the expensing of stock options for the period ending April 30, 2007. Expense related to stock options was not included in prior periods.
LIQUIDITY AND CAPITAL RESOURCES
The Company’s operations are historically financed principally by cash flow from operations. At April 30, 2008 and April 30, 2007, working capital was approximately $45,875,000 and $55,540,000, respectively. The decrease of $9,665,000 was primarily due to cash used to fund the current year loss, the purchase of treasury stock and capital expenditures.
Cash flows used in operating activities were approximately $9,448,000, which was primarily the result of a net loss and an increase in accounts receivable offset by depreciation and amortization of $2,923,000, stock based compensation expense of $3,151,000, and increases and decreases in other operating assets and liabilities.
Cash flows provided by investing activities were approximately $13,036,000 and were principally proceeds from the sale of marketable securities offset by investments in fixed assets and the purchase of the assets of Midlothian Laboratories, LLC. Cash flows used in financing activities were $1,064,000 which was primarily due to purchases of treasury stock offset by the net proceeds of the exercise of stock options.
In May 2006, the Company amended the revolving credit facility and increased the borrowing limit to $10,000,000. Under the agreement the revolving credit facility bears interest at a rate elected by the Company equal to the Prime Rate or LIBOR plus 0.75%. Loans are collateralized by inventory, accounts receivable and other assets. The agreement contains covenants with respect to working capital, net worth and certain ratios, as well as other covenants and prohibits the payment of cash dividends. In April 2008, the Company amended the revolving credit facility and the lender waived the Company’s non-compliance with certain covenants. The Company’s ability to borrow is limited by the amendment until the Company returns to profitability. No borrowings have been made through April 30, 2008 under the credit facility.
The Company believes that its financial resources consisting of current working capital, anticipated future operating revenue and its credit line will be sufficient to enable it to meet its working capital requirements for at least the next twelve months.
In May 1997, the Company announced a stock buy-back program under which the Board of Directors authorized the purchase of up to $1,000,000 of its common stock. In November 2003, the Company increased the stock buy-back program to an aggregate of $3,000,000. The Company’s Board of Directors authorized the repurchase of up to an additional $10,000,000 of the Company’s common stock in August 2004 and again in September 2006. As of April 30, 2008, the Company had the ability to purchase up to $23,000,000 under the stock buy-back program. As of April 30, 2008, the Company has purchased 2,202,000 shares at a cost of $21,351,000. In the fiscal year ended 2008 the Company purchased 205,000 shares for $1,961,000.
RECENT ACCOUNTING PRONOUNCEMENTS
In May 2008, FASB issued Statement 163, “Accounting for Financial Guarantee Insurance Contracts”. This new standard clarifies how FAS Statement No. 60,Accounting and Reporting by Insurance Enterprises, applies to financial guarantee insurance contracts issued by insurance enterprises, including the recognition and measurement of premium revenue and claim liabilities. It also requires expanded disclosures about financial guarantee insurance contracts. The Statement is effective for financial statements issued for fiscal years beginning after December 15, 2008. The Company does not expect the adoption of SFAS 163 to have any impact on its financial position or results of operations.
22
In March 2008, the FASB issued Statement 161, “Disclosures about Derivative Instruments and Hedging Activities.” Due to the use and complexity of derivative instruments, there were concerns regarding the existing disclosure requirements in FASB 133. Accordingly, this Statement requires enhanced disclosures about an entity’s derivative and hedging activities. Entities will be required to provide enhanced disclosures about (i) how and why an entity uses derivative instruments, (ii) how derivative instruments and related hedging items are accounted for under Statement 133 and its related interpretations, and (iii) how derivative instruments and related hedging items affect an entity’s financial position, financial performance, and cash flows. This Statement is effective for financial statements issued for fiscal years after November 15, 2008. No impact is expected for the Company as it does not hold any financial instruments for which FAS 133 is applicable.
On December 4, 2007, the FASB issued SFAS No. 141 (revised 2007), “Business Combinations” which replaces SFAS 141 but retains the fundamental concept of purchase method of accounting in a business combination and improves reporting by creating greater consistency in the accounting and financial reporting of business combinations, resulting in more complete, comparable, and relevant information for investors and other users of financial statements. To achieve this goal, the new standard requires the acquiring entity in a business combination to recognize all the assets acquired and liabilities assumed in the transaction and any noncontrolling interest at the acquisition date measured at their fair value as of that date. This statement requires measuring a noncontrolling interest in the acquiree at fair value which will result in recognizing the goodwill attributable to the noncontrolling interest in addition to that attributable to the acquirer. This statement also requires the recognition of assets acquired and liabilities assumed arising from contractual contingencies as of the acquisition date, measured at their acquisition fair values. SFAS No. 141(R) is effective for fiscal years beginning after December 15, 2008. The Company is currently evaluating the impact of SFAS No. 141(R) on its financial position and results of operations.
On December 4, 2007, the FASB issued SFAS No. 160, “Noncontrolling Interests in Consolidated Financial Statements” an amendment of ARB No. 51, which will affect only those entities that have an outstanding noncontrolling interest in one or more subsidiaries or that deconsolidate a subsidiary by requiring all entities to report noncontrolling (minority) interests in subsidiaries in the same way as equity in the consolidated financial statements. In addition, SFAS No. 160 eliminates the diversity that currently exists in accounting for transactions between an entity and noncontrolling interests by requiring they be treated as equity transactions. SFAS No. 160 is effective for fiscal years beginning after December 15, 2008. The Company is currently evaluating the impact of SFAS No. 160 on its financial position and results of operations.
In December 2007, the EITF issued EITF Issue No. 07-1 (“EITF 07-1”),Accounting for Collaborative Arrangements.EITF 07-1 affects entities that participate in collaborative arrangements for the development and commercialization of intellectual property. The EITF affirmed the tentative conclusions reached on (1) what constitutes a collaborative arrangement, (2) how the parties should present costs and revenues in their respective income statements, (3) how the parties should present cost-sharing payments, profit-sharing payments, or both in their respective income statements, and (4) disclosure in the annual financial statements of the partners. EITF 07-1 should be applied as a change in accounting principle through retrospective application to all periods presented for collaborative arrangements existing as of the date of adoption. EITF 07-1 is effective for financial statements issued for fiscal years beginning after December 15, 2007.
In June 2007, the FASB ratified the consensus reached by the Emerging Issues Task Force on Issue No. 07-3, Accounting for Advance Payments for Goods or Services Received for Use in Future Research and Development Activities (“Issue 07-3”), which is effective for fiscal years beginning after December 15, 2007 and is applied prospectively for new contracts entered into on or after the effective date. Issue 07-3 addresses nonrefundable advance payments for goods or services for use in future research and development activities. Issue 07-3 will require that these payments that will be used or rendered for future research and development activities be deferred and capitalized and recognized as an expense as the related goods are delivered or the related services are performed. If an entity does not expect the goods to be delivered or the services to be rendered the capitalized advance payments should be expensed. The Company is assessing the effects of the adoption of Issue 07-03 on its financial position and results of operations.
In February 2007, the FASB issued SFAS No. 159 (“SFAS 159”), “The Fair Value Option for Financial Assets and Financial Liabilities,” providing companies with an option to report selected financial assets and liabilities at fair value. The Standard’s objective is to reduce both complexity in accounting for financial instruments and the volatility in earnings caused by measuring related assets and liabilities differently. Generally accepted accounting principles have required different measurement attributes for different assets and liabilities that can create artificial volatility in earnings. SFAS 159 helps to mitigate this type of accounting-induced volatility by enabling companies to report related assets and liabilities at fair value, which would likely reduce the need for companies to comply with detailed rules for hedge accounting. SFAS 159 also establishes presentation and disclosure requirements designed to facilitate comparisons between companies that choose different measurement attributes for similar types of assets and liabilities. The Standard requires companies to provide additional information that will help investors and other users of financial
23
statements to more easily understand the effect of the company’s choice to use fair value on its earnings. It also requires entities to display the fair value of those assets and liabilities for which they have chosen to use fair value on the face of the balance sheet. SFAS 159 is effective for fiscal years beginning after November 15, 2007. The Company does not expect the adoption of SFAS No. 159 to have a significant effect on its financial position or results of operations.
In September 2006, the Financial Accounting Standards Board issued Statement of Financial Accounting Standards No. 157, “Fair Value Measurements”, which defines fair value, establishes a framework for measuring fair value in generally accepted accounting principles (GAAP), and expands disclosures about fair value measurements. Where applicable, SFAS No. 157 simplifies and codifies related guidance within GAAP and does not require any new fair value measurements. SFAS No. 157 is effective for financial statements issued for fiscal years beginning after November 15, 2007, and interim periods within those fiscal years. Earlier adoption is encouraged. The Company does not expect the adoption of SFAS No. 157 to have a significant effect on its financial position or results of operation.
CRITICAL ACCOUNTING POLICIES
In preparing financial statements in conformity with generally accepted accounting principles in the United States of America, we are required to make estimates and assumptions that affect reported amounts of assets and liabilities and the disclosure of contingent assets and liabilities at the date of the financial statements and revenues and expenses for the reporting period covered thereby. As a result, these estimates are subject to an inherent degree of uncertainty. We base our estimates and judgments on our historical experience, the terms of existing contracts, our observance of trends in the industry, information that we obtain from our customers and outside sources, and on various assumptions that we believe to be reasonable and appropriate under the circumstances, the results of which form the basis for making judgments which impact our reported operating results and the carrying values of assets and liabilities. These assumptions include but are not limited to the percentage of new products which may have chargebacks and the percentage of items which will be subject to price decreases. Actual results may differ from these estimates. Our significant accounting policies are more fully described in Note A to our financial statements.
Revenue recognition and accounts receivable, adjustments for returns and price adjustments, allowance for doubtful accounts and carrying value of inventory represent significant estimates made by management.
Revenue Recognition and Accounts Receivable: Revenue is recognized for product sales upon shipment and when risk is passed to the customer and when estimates of discounts, rebates, promotional adjustments, price adjustments, returns, chargebacks, and other potential adjustments are reasonably determinable, collection is reasonably assured and the Company has no further performance obligations. These estimates are presented in the financial statements as reductions to net revenues and accounts receivable. Estimated sales returns, allowances and discounts are provided for in determining net sales. Contract research income is recognized as work is completed and billable costs are incurred. In certain cases, contract research income is based on attainment of designated milestones.
Adjustments for Returns and Price Adjustments: Our product revenues are typically subject to agreements with customers allowing chargebacks, rebates, rights of return, pricing adjustments and other allowances. Based on our agreements and contracts with our customers, we calculate adjustments for these items when we recognize revenue and we book the adjustments against accounts receivable and revenue. Chargebacks, primarily from wholesalers, are the most significant of these items. Chargebacks result from arrangements we have with end users establishing prices for products for which the end user independently selects a wholesaler from which to purchase. A chargeback represents the difference between our invoice price to the wholesaler, which is typically stated at wholesale acquisition cost, and the end customer’s contract price, which is lower. We credit the wholesaler for purchases by end customers at the lower price. Therefore, we record these chargebacks at the time we recognize revenue in connection with our sales to wholesalers.
The reserve for chargebacks is computed in the following manner. The Company obtains wholesaler inventory data for the wholesalers which represent approximately 95% of our chargeback activity. This inventory is multiplied by the historical percentage of units that are charged back and by the price adjustment per unit to arrive at the chargeback accrual. This calculation is performed by product by customer. The calculated amount of chargebacks could be affected by other factors such as:
| | • | | A change in retail customer mix |
| | • | | A change in negotiated terms with retailers |
| | • | | Product sales mix at the wholesaler |
| | • | | Retail inventory levels |
| | • | | Changes in Wholesale Acquisition Cost (WAC) |
24
The Company continually monitors the chargeback activity and adjusts the provisions for chargebacks when we believe that the actual chargebacks will differ from our original provisions.
Consistent with industry practice, the Company maintains a return policy that allows our customers to return product within a specified period. The Company’s estimate for returns is based upon its historical experience with actual returns. While such experience has allowed for reasonable estimation in the past, history may not always be an accurate indicator of future returns. The Company continually monitors its estimates for returns and makes adjustments when it believes that actual product returns may differ from the established accruals.
Included in the adjustment for sales allowances and returns is a reserve for credits taken by our customers for rebates, return authorizations and other discounts.
Sales discounts are granted for prompt payment. The reserve for sales discounts is based on invoices outstanding and assumes that 100% of available discounts will be taken.
Price adjustments, including shelf stock adjustments, are credits issued from time to time to reflect decreases in the selling prices of our products which our customer has remaining in its inventory at the time of the price reduction. Decreases in our selling prices are discretionary decisions made by us to reflect market conditions. Amounts recorded for estimated price adjustments are based upon specified terms with direct customers, estimated launch dates of competing products, estimated declines in market price and inventory held by the customer. The Company analyzes this on a case by case basis and makes adjustments to reserves as necessary.
The Company adequately reserves for chargebacks, discounts, allowances and returns in the period in which the sales takes place. No material amounts included in the provision for chargebacks and the provision for sales discounts recorded in the current period relate to sales made in the prior periods. The provision for sales allowances and returns includes reserves for items sold in the current and prior periods. The Company has substantially and consistently used the same estimating methods. We have refined the methods as new data became available. There have been no material differences between the estimates applied and actual results.
The Company determines amounts that are material to the financial statements in consideration of all relevant circumstances including quantitative and qualitative factors. Among the items considered is the impact on individual financial statement classification, operating income and footnote disclosures and the degree of precision that is attainable in estimating judgmental items.
The following table presents the roll forward of each significant estimate as of April 30, 2008, 2007 and 2006 and for the years then ended, respectively.
| | | | | | | | | | | | | |
| | | Beginning
Balance
May 1 | | Current
Provision | | Actual Credits
in Current
Period | | | Ending
Balance
April 30 |
For the year ended April 30, 2008 | | | | | | | | | |
Chargebacks | | $ | 3,509,000 | | $ | 24,980,000 | | $ | (25,821,000 | ) | | $ | 2,668,000 |
Sales Discounts | | | 257,000 | | | 2,233,000 | | | (2,050,000 | ) | | | 440,000 |
Sales Allowances & Returns | | | 5,520,000 | | | 13,346,000 | | | (13,509,000 | ) | | | 5,357,000 |
| | | | | | | | | | | | | |
Total Adjustment for Returns & Price Allowances | | $ | 9,286,000 | | $ | 40,559,000 | | $ | (41,380,000 | ) | | $ | 8,465,000 |
| | | | | | | | | | | | | |
For the year ended April 30, 2007 | | | | | | | | | |
Chargebacks | | $ | 3,359,000 | | $ | 23,126,000 | | $ | (22,976,000 | ) | | $ | 3,509,000 |
Sales Discounts | | | 303,000 | | | 2,126,000 | | | (2,172,000 | ) | | | 257,000 |
Sales Allowances & Returns | | | 3,741,000 | | | 14,754,000 | | | (12,975,000 | ) | | | 5,520,000 |
| | | | | | | | | | | | | |
Total Adjustment for Returns & Price Allowances | | $ | 7,403,000 | | $ | 40,006,000 | | $ | (38,123,000 | ) | | $ | 9,286,000 |
| | | | | | | | | | | | | |
For the year ended April 30, 2006 | | | | | | | | | |
Chargebacks | | $ | 3,189,000 | | $ | 19,986,000 | | $ | (19,816,000 | ) | | $ | 3,359,000 |
Sales Discounts | | | 380,000 | | | 2,258,000 | | | (2,335,000 | ) | | | 303,000 |
Sales Allowances & Returns | | | 5,508,000 | | | 9,866,000 | | | (11,633,000 | ) | | | 3,741,000 |
| | | | | | | | | | | | | |
Total Adjustment for Returns & Price Allowances | | $ | 9,077,000 | | $ | 32,110,000 | | $ | (33,784,000 | ) | | $ | 7,403,000 |
| | | | | | | | | | | | | |
25
Allowance for Doubtful Accounts: We have historically provided credit terms to customers in accordance with what management views as industry norms. Financial terms, for credit-approved customers, are generally on either a net 30 or 60 day basis, though most customers are entitled to a prompt payment discount. Management periodically and regularly reviews customer account activity in order to assess the adequacy of allowances for doubtful accounts, considering factors such as economic conditions and each customer’s payment history and creditworthiness. If the financial condition of our customers were to deteriorate, or if they were otherwise unable to make payments in accordance with management’s expectations, we would have to increase our allowance for doubtful accounts.
Inventories: We state inventories at the lower of average cost or market, with cost being determined based upon the average method. In evaluating the inventory, management considers such factors as the amount of inventory on hand, estimated time required to sell existing inventory and expected market conditions, including levels of competition. We establish reserves for slow-moving and obsolete inventories based upon our historical experience, product expiration dates and management’s assessment of current product demand.
CONTRACTUAL OBLIGATIONS AND OFF-BALANCE SHEET ARRANGEMENTS
As part of our ongoing business, we do not participate in transactions that generate relationships with unconsolidated entities or financial partnerships which would have been established for the purpose of facilitating off-balance sheet arrangements or other contractually narrow or limited purposes. As of April 30, 2008 we were not involved in any contractual obligations, unconsolidated transactions or off-balance sheet arrangements.
| ITEM 7A. | QUANTITATIVE AND QUALITATIVE DISCLOSURES ABOUT MARKET RISK. |
The Company’s existing credit facility bears interest at a rate selected by the Company equal to the Prime Rate or LIBOR plus 0.75%. This facility is exposed to market rate fluctuations and may impact the interest paid on any borrowings under the credit facility. Currently, the Company has no borrowings under this facility; however, an increase in interest rates would impact interest expense on future borrowings.
The Company invests in U.S. treasury notes, money market accounts and municipal securities, all of which are exposed to interest rate fluctuations. The interest earned on these investments may vary based on fluctuations in the interest rate.
The Company has invested in auction rate securities (ARS) consisting of municipal securities that are held as investments available-for-sale. After the initial issuance of these securities, the interest rate is reset periodically. The Company invests in ARS that reset as to interest rate every 7 to 35 days and are carried at fair value. The Company has determined that auction rate securities should be classified as investments because the “stated” or “contractual” maturities are generally 20 to 30 years. The securities are priced and traded as current and non-current investments because of the interest reset feature. Classification of marketable securities as current or non-current is dependent upon management’s intended holding period, the security’s maturity date and liquidity considerations based on market conditions. If management intends to hold the securities for longer than one year as of the balance sheet date, they are classified as non-current. During the fiscal year, two of the auction rate securities failed to auction due to sell orders exceeding buy orders. Liquidity for these auction-rate securities is typically provided by an auction process that resets the applicable interest rate at pre-determined intervals. These ARS have been classified as non-current. The funds associated with failed auctions will not be accessible until a successful auction occurs or a buyer is found outside of the auction process. The Company hired an independent valuation company to help determine the value of the securities. The valuation indicated that one of the securities should be valued at approximately 50% of par value. Therefore, the Company wrote down the security in the amount of $500,000 due to an other than temporary reduction in the value. The effect of the loss on the value of the ARS securities is included in other income on the statement of operations. If the credit rating of the security issuers of ARS deteriorates, the Company may be required to adjust the carrying value of these investments through an additional impairment charge.
26
| ITEM 8. | FINANCIAL STATEMENTS AND SUPPLEMENTARY DATA |
F-1
REPORT OF INDEPENDENT REGISTERED PUBLIC ACCOUNTING FIRM
Board of Directors and Stockholders
Hi-Tech Pharmacal Co., Inc.
We have audited the accompanying balance sheets of Hi-Tech Pharmacal Co., Inc. (the “Company”) as of April 30, 2008 and 2007, and the related statements of operations, changes in stockholders’ equity and cash flows for each of the years in the three-year period ended April 31, 2008. These financial statements are the responsibility of the Company’s management. Our responsibility is to express an opinion on these financial statements based on our audits.
We conducted our audits in accordance with the standards of the Public Company Accounting Oversight Board (United States). Those standards require that we plan and perform the audit to obtain reasonable assurance about whether the financial statements are free of material misstatement. An audit includes examining, on a test basis, evidence supporting the amounts and disclosures in the financial statements. An audit also includes assessing the accounting principles used and significant estimates made by management, as well as evaluating the overall financial statement presentation. We believe that our audits provide a reasonable basis for our opinion.
In our opinion, the financial statements referred to above present fairly, in all material respects, the financial position of Hi-Tech Pharmacal Co., Inc. as of April 30, 2008 and 2007, and the results of its operations and its cash flows for each of the years in the three-year period ended April 30, 2008, in conformity with accounting principles generally accepted in the United States of America.
As described in Note A[4] and A[15] to the consolidated financial statements, the Company adopted Financial Accounting Standards Board (“FASB”) Interpretation No. 48,“Accounting for Uncertainty in Income Taxes — an interpretation of FASB No. 109,” effective May 1, 2007 and Statement of Financial Accounting Standards No. 123(R),“Share Based Payment,” effective May 1, 2006.
We also have audited, in accordance with the standards of the Public Company Accounting Oversight Board (United States), Hi-Tech Pharmacal Co., Inc.’s internal control over financial reporting as of April 30, 2008, based on criteria established in Internal Control-Integrated Framework issued by the Committee of Sponsoring Organizations of the Treadway Commission (COSO), and our report dated July 11, 2008 expressed an unqualified opinion on the Company’s internal control over financial reporting.
Eisner LLP
New York, New York
July 11, 2008
F-2
REPORT OF INDEPENDENT REGISTERED PUBLIC ACCOUNTING FIRM
Board of Directors and Stockholders
Hi-Tech Pharmacal Co., Inc.
We have audited Hi-Tech Pharmacal Co., Inc.’s (the “Company”) internal control over financial reporting as of April 30, 2008, based on criteria established in Internal Control-Integrated Framework issued by the Committee of Sponsoring Organizations of the Treadway Commission (“COSO”). The Company’s management is responsible for maintaining effective internal control over financial reporting and for its assessment of the effectiveness of internal control over financial reporting included in the accompanying Management Report on Internal Control Over Financial Reporting. Our responsibility is to express an opinion on the Company’s internal control over financial reporting based on our audit.
We conducted our audit in accordance with the standards of the Public Company Accounting Oversight Board (United States). Those standards require that we plan and perform the audit to obtain reasonable assurance about whether effective internal control over financial reporting was maintained in all material respects. Our audit included obtaining an understanding of internal control over financial reporting, assessing the risk that a material weakness exists, and testing and evaluating the design and operating effectiveness of internal control based on the assessed risk. Our audit also included performing such other procedures as we considered necessary in the circumstances. We believe that our audit provides a reasonable basis for our opinion.
A company’s internal control over financial reporting is a process designed to provide reasonable assurance regarding the reliability of financial reporting and the preparation of financial statements for external purposes in accordance with generally accepted accounting principles. A company’s internal control over financial reporting includes those policies and procedures that (i) pertain to the maintenance of records that, in reasonable detail, accurately and fairly reflect the transactions and dispositions of the assets of the company; (ii) provide reasonable assurance that transactions are recorded as necessary to permit preparation of financial statements in accordance with generally accepted accounting principles, and that receipts and expenditures of the company are being made only in accordance with authorizations of management and directors of the company; and (iii) provide reasonable assurance regarding prevention or timely detection of unauthorized acquisition, use, or disposition of the company’s assets that could have a material effect on the financial statements.
Because of its inherent limitations, internal control over financial reporting may not prevent or detect misstatements. Also, projections of any evaluation of effectiveness to future periods are subject to the risk that controls may become inadequate because of changes in conditions, or that the degree of compliance with the policies or procedures may deteriorate.
In our opinion, the Company maintained, in all material respects, effective internal control over financial reporting as of April 30, 2008, based on the criteria established in Internal Control - Integrated Framework issued by the Committee of Sponsoring Organizations of the Treadway Commission.
We have also audited in accordance with the standards of the Public Company Accounting Oversight Board (United States), the balance sheets of Hi-Tech Pharmacal Co., Inc. as of April 30, 2008 and 2007 and the related statements of operations, changes in stockholders’ equity and cash flows for each of the years in the three-year period ended April 30, 2008 and our report dated July 11, 2008 expressed an unqualified opinion on those financial statements, and includes an explanatory paragraph regarding the adoption of Financial Accounting Standards Board (“FASB”) Interpretation No. 48,“Accounting for Uncertainty in Income Taxes - an interpretation of FASB No. 109,” effective May 1, 2007 and Statement of Financial Accounting Standards No. 123(R),“Share Based Payment,” effective May 1, 2006.
Eisner LLP
New York, New York
July 11, 2008
F-3
HI-TECH PHARMACAL CO., INC.
BALANCE SHEETS
| | | | | | | | |
| | | April 30, | |
| | | 2008 | | | 2007 | |
ASSETS | | | | | | | | |
CURRENT ASSETS: | | | | | | | | |
Cash and cash equivalents | | $ | 11,722,000 | | | $ | 9,198,000 | |
Investments in marketable securities – available for sale | | | — | | | | 24,070,000 | |
Accounts receivable (less allowances for doubtful accounts of $200,000 and $350,000 at April 30, 2008 and 2007, respectively) | | | 17,604,000 | | | | 9,331,000 | |
Inventory | | | 18,024,000 | | | | 14,485,000 | |
Prepaid income taxes | | | 2,566,000 | | | | 2,772,000 | |
Deferred income taxes | | | 2,607,000 | | | | 3,226,000 | |
Other current assets | | | 2,569,000 | | | | 3,961,000 | |
| | | | | | | | |
TOTAL CURRENT ASSETS | | $ | 55,092,000 | | | $ | 67,043,000 | |
Property and equipment, net | | | 17,048,000 | | | | 16,597,000 | |
Investment in marketable securities, non-current | | | 2,545,000 | | | | — | |
Other assets | | | 419,000 | | | | 420,000 | |
Investment in Neuro-Hitech-available for sale (See note F) | | | 248,000 | | | | 7,589,000 | |
Intangible assets, net | | | 9,660,000 | | | | 6,093,000 | |
| | | | | | | | |
TOTAL | | $ | 85,012,000 | | | $ | 97,742,000 | |
| | | | | | | | |
LIABILITIES | | | | | | | | |
CURRENT LIABILITIES: | | | | | | | | |
Accounts payable | | $ | 4,773,000 | | | $ | 3,237,000 | |
Accrued expenses | | | 4,444,000 | | | | 8,266,000 | |
| | | | | | | | |
TOTAL CURRENT LIABILITIES | | $ | 9,217,000 | | | $ | 11,503,000 | |
Deferred income taxes | | | 630,000 | | | | 3,254,000 | |
| | | | | | | | |
TOTAL LIABILITIES | | $ | 9,847,000 | | | $ | 14,757,000 | |
| | | | | | | | |
COMMITMENTS AND CONTINGENCIES | | | | | | | | |
| | |
STOCKHOLDERS’ EQUITY | | | | | | | | |
Preferred stock, par value $.01 per share; authorized 3,000,000 shares, none issued | | | | | | | | |
Common stock, par value $.01; authorized 50,000,000 shares, 13,603,000 and 13,424,000 shares issued at April 30, 2008 and 2007, respectively | | | 136,000 | | | | 134,000 | |
Additional paid-in capital | | | 54,829,000 | | | | 50,783,000 | |
Retained earnings | | | 41,487,000 | | | | 46,585,000 | |
Accumulated other comprehensive income, net of tax | | | 64,000 | | | | 4,873,000 | |
Treasury stock, 2,202,000 and 1,997,000 shares of common stock, at cost at April 30, 2008 and 2007, respectively. | | | (21,351,000 | ) | | | (19,390,000 | ) |
| | | | | | | | |
TOTAL STOCKHOLDERS’ EQUITY | | $ | 75,165,000 | | | $ | 82,985,000 | |
| | | | | | | | |
TOTAL | | $ | 85,012,000 | | | $ | 97,742,000 | |
| | | | | | | | |
See notes to Financial Statements
F-4
HI-TECH PHARMACAL CO., INC.
STATEMENTS OF OPERATIONS
| | | | | | | | | | | | |
| | | Year Ended April 30, | |
| | | 2008 | | | 2007 | | | 2006 | |
NET SALES | | $ | 62,017,000 | | | $ | 58,898,000 | | | $ | 78,020,000 | |
Cost of goods sold | | | 40,505,000 | | | | 35,704,000 | | | | 35,833,000 | |
| | | | | | | | | | | | |
GROSS PROFIT | | | 21,512,000 | | | | 23,194,000 | | | | 42,187,000 | |
COST AND EXPENSES: | | | | | | | | | | | | |
Selling, general and administrative expense | | | 22,625,000 | | | | 23,914,000 | | | | 23,210,000 | |
Research and product development costs | | | 6,208,000 | | | | 4,733,000 | | | | 3,334,000 | |
Contract research (income) | | | — | | | | (123,000 | ) | | | (27,000 | ) |
Interest expense | | | 27,000 | | | | 18,000 | | | | 12,000 | |
Interest (income) and other | | | (480,000 | ) | | | (1,314,000 | ) | | | (1,937,000 | ) |
| | | | | | | | | | | | |
TOTAL | | $ | 28,380,000 | | | $ | 27,228,000 | | | $ | 24,592,000 | |
| | | | | | | | | | | | |
Income (loss) before provision for income taxes | | | (6,868,000 | ) | | | (4,034,000 | ) | | | 17,595,000 | |
Provision for income tax (benefit)/expense | | | (1,770,000 | ) | | | (1,998,000 | ) | | | 6,142,000 | |
| | | | | | | | | | | | |
NET INCOME (LOSS) | | $ | (5,098,000 | ) | | $ | (2,036,000 | ) | | $ | 11,453,000 | |
| | | | | | | | | | | | |
BASIC EARNINGS (LOSS) PER SHARE | | $ | (0.45 | ) | | $ | (0.17 | ) | | $ | 0.96 | |
| | | | | | | | | | | | |
DILUTED EARNINGS (LOSS) PER SHARE | | $ | (0.45 | ) | | $ | (0.17 | ) | | $ | 0.85 | |
| | | | | | | | | | | | |
WEIGHTED AVERAGE COMMON SHARES OUTSTANDING, BASIC | | | 11,353,000 | | | | 11,884,000 | | | | 11,939,000 | |
EFFECT OF POTENTIAL COMMON SHARES | | | — | | | | — | | | | 1,465,000 | |
| | | | | | | | | | | | |
WEIGHTED AVERAGE COMMON SHARES OUTSTANDING, DILUTED | | | 11,353,000 | | | | 11,884,000 | | | | 13,404,000 | |
| | | | | | | | | | | | |
See notes to Financial Statements
F-5
HI-TECH PHARMACAL CO., INC.
STATEMENTS OF CHANGES IN STOCKHOLDERS’ EQUITY
| | | | | | | | | | | | | | | | | | | | | | | | | | | | |
| | | | | | | | | | Accumulated | | | | | | | | | | |
| | | Common Stock | | Additional | | | | | Other | | | | | | Total | | | | |
| | | Shares | | Amount | | Paid in
Capital | | Retained
Earnings | | | Comprehensive
Income | | | Treasury Stock at
Cost | | | Stockholders’
Equity | | | Comprehensive
Income | |
BALANCE—APRIL 30, 2005 | | 12,771,000 | | $ | 128,000 | | $ | 40,315,000 | | $ | 37,168,000 | | | | — | | | $ | (7,946,000 | ) | | $ | 69,665,000 | | | | | |
Net income | | | | | | | | | | | 11,453,000 | | | | | | | | | | | | 11,453,000 | | | $ | 11,453,000 | |
Exercise of options | | 518,000 | | | 5,000 | | | 3,005,000 | | | | | | | | | | | | | | | 3,010,000 | | | | | |
Issuance of options for consulting | | | | | | | | 319,000 | | | | | | | | | | | | | | | 319,000 | | | | | |
Tax benefit from exercise of options | | | | | | | | 3,556,000 | | | | | | | | | | | | | | | 3,556,000 | | | | | |
Accumulated other comprehensive income, net of tax | | | | | | | | | | | | | | $ | 439,000 | | | | | | | | 439,000 | | | | 439,000 | |
| | | | | | | | | | | | | | | | | | | | | | | | | | | | |
Total Comprehensive Income | | | | | | | | | | | | | | | | | | | | | | | | | | $ | 11,892,000 | |
| | | | | | | | | | | | | | | | | | | | | | | | | | | | |
BALANCE—APRIL 30, 2006 | | 13,289,000 | | $ | 133,000 | | $ | 47,195,000 | | $ | 48,621,000 | | | $ | 439,000 | | | $ | (7,946,000 | ) | | $ | 88,442,000 | | | | | |
Net (loss) | | | | | | | | | | | (2,036,000 | ) | | | | | | | | | | | (2,036,000 | ) | | $ | (2,036,000 | ) |
Exercise of options | | 135,000 | | | 1,000 | | | 251,000 | | | | | | | | | | | | | | | 252,000 | | | | | |
Purchase of Treasury Stock | | | | | | | | | | | | | | | | | | | (11,444,000 | ) | | | (11,444,000 | ) | | | | |
Stock-based compensation expense | | | | | | | | 2,830,000 | | | | | | | | | | | | | | | 2,830,000 | | | | | |
Tax benefit from exercise of options | | | | | | | | 507,000 | | | | | | | | | | | | | | | 507,000 | | | | | |
Accumulated other comprehensive income, net of tax | | | | | | | | | | | | | | $ | 4,434,000 | | | | | | | | 4,434,000 | | | | 4,434,000 | |
| | | | | | | | | | | | | | | | | | | | | | | | | | | | |
Total Comprehensive Income | | | | | | | | | | | | | | | | | | | | | | | | | | | 2,398,000 | |
| | | | | | | | | | | | | | | | | | | | | | | | | | | | |
BALANCE—APRIL 30, 2007 | | 13,424,000 | | $ | 134,000 | | $ | 50,783,000 | | $ | 46,585,000 | | | $ | 4,873,000 | | | $ | (19,390,000 | ) | | $ | 82,985,000 | | | | | |
Net (loss) | | | | | | | | | | | (5,098,000 | ) | | | | | | | | | | | (5,098,000 | ) | | | (5,098,000 | ) |
Exercise of options | | 179,000 | | | 2,000 | | | 425,000 | | | | | | | | | | | | | | | 427,000 | | | | | |
Purchase of Treasury Stock | | | | | | | | | | | | | | | | | | | (1,961,000 | ) | | | (1,961,000 | ) | | | | |
Stock-based compensation expense | | | | | | | | 3,151,000 | | | | | | | | | | | | | | | 3,151,000 | | | | | |
Tax benefit from exercise of options | | | | | | | | 470,000 | | | | | | | | | | | | | | | 470,000 | | | | | |
Accumulated other comprehensive income(loss), net of tax | | | | | | | | | | | | | | | (4,809,000 | ) | | | | | | | (4,809,000 | ) | | | (4,809,000 | ) |
| | | | | | | | | | | | | | | | | | | | | | | | | | | | |
Total Comprehensive Income | | | | | | | | | | | | | | | | | | | | | | | | | | $ | (9,907,000 | ) |
| | | | | | | | | | | | | | | | | | | | | | | | | | | | |
Balance – April 30, 2008 | | 13,603,000 | | $ | 136,000 | | $ | 54,829,000 | | $ | 41,487,000 | | | $ | 64,000 | | | $ | (21,351,000 | ) | | $ | 75,165,000 | | | | | |
| | | | | | | | | | | | | | | | | | | | | | | | | | | | |
See notes to Financial Statements
F-6
HI-TECH PHARMACAL CO., INC.
STATEMENTS OF CASH FLOWS
| | | | | | | | | | | | |
| | | Year ended April 30, | |
| | | 2008 | | | 2007 | | | 2006 | |
CASH FLOWS FROM OPERATING ACTIVITIES: | | | | | | | | | | | | |
Net income (loss) | | $ | (5,098,000 | ) | | $ | (2,036,000 | ) | | $ | 11,453,000 | |
Adjustments to reconcile net income to net cash (used in) provided by operating Activities: | | | | | | | | | | | | |
Depreciation and amortization | | | 2,923,000 | | | | 2,835,000 | | | | 2,616,000 | |
Issuance of options for consulting expense | | | — | | | | — | | | | 237,000 | |
Deferred income taxes | | | 527,000 | | | | (1,490,000 | ) | | | 6,000 | |
Tax benefit from exercise of options | | | — | | | | — | | | | 3,556,000 | |
Stock based compensation expense | | | 3,151,000 | | | | 2,830,000 | | | | — | |
Loss (gain) on sale of intangible asset | | | 90,000 | | | | (1,848,000 | ) | | | — | |
Other than temporary write down of marketable securities | | | 500,000 | | | | | | | | | |
CHANGES IN OPERATING ASSETS AND LIABILITIES: | | | | | | | | | | | | |
Accounts receivable | | | (8,273,000 | ) | | | 7,388,000 | | | | (1,115,000 | ) |
Inventory | | | (2,617,000 | ) | | | (5,843,000 | ) | | | (281,000 | ) |
Prepaid taxes / taxes payable | | | 206,000 | | | | (742,000 | ) | | | (2,220,000 | ) |
Other current assets | | | 178,000 | | | | (47,000 | ) | | | (84,000 | ) |
Other assets | | | 1,000 | | | | 300,000 | | | | (548,000 | ) |
Accounts payable | | | 1,536,000 | | | | (2,095,000 | ) | | | (78,000 | ) |
Accrued expenses | | | (2,572,000 | ) | | | 1,899,000 | | | | (463,000 | ) |
| | | | | | | | | | | | |
NET CASH (USED IN) PROVIDED BY OPERATING ACTIVITIES | | $ | (9,448,000 | ) | | $ | 1,151,000 | | | $ | 13,079,000 | |
| | | | | | | | | | | | |
CASH FLOWS FROM INVESTING ACTIVITIES: | | | | | | | | | | | | |
Investment in marketable securities, net | | $ | 21,025,000 | | | | 930,000 | | | | (15,000,000 | ) |
Purchase of fixed assets | | | (2,563,000 | ) | | | (2,847,000 | ) | | | (4,150,000 | ) |
Purchase of intangible assets | | | (955,000 | ) | | | (150,000 | ) | | | (5,554,000 | ) |
Proceeds from sale of intangible asset, net | | | 1,491,000 | | | | 2,287,000 | | | | — | |
Purchase of Midlothian Laboratories, LLC assets | | | (5,962,000 | ) | | | — | | | | — | |
| | | | | | | | | | | | |
NET CASH PROVIDED BY (USED IN) INVESTING ACTIVITIES | | $ | 13,036,000 | | | $ | 220,000 | | | $ | (24,704,000 | ) |
| | | | | | | | | | | | |
CASH FLOWS FROM FINANCING ACTIVITIES: | | | | | | | | | | | | |
Proceeds from the exercise of options | | | 427,000 | | | | 252,000 | | | | 3,010,000 | |
Tax benefit of stock incentives | | | 470,000 | | | | 507,000 | | | | — | |
Purchase of treasury stock | | | (1,961,000 | ) | | | (11,444,000 | ) | | | — | |
| | | | | | | | | | | | |
NET CASH (USED IN) PROVIDED BY FINANCING ACTIVITIES | | $ | (1,064,000 | ) | | $ | (10,685,000 | ) | | $ | 3,010,000 | |
| | | | | | | | | | | | |
NET INCREASE (DECREASE) IN CASH AND CASH EQUIVALENTS | | | 2,524,000 | | | | (9,314,000 | ) | | | (8,615,000 | ) |
Cash and cash equivalents at beginning of year | | | 9,198,000 | | | | 18,512,000 | | | | 27,127,000 | |
| | | | | | | | | | | | |
CASH AND CASH EQUIVALENTS AT END OF YEAR | | $ | 11,722,000 | | | $ | 9,198,000 | | | $ | 18,512,000 | |
| | | | | | | | | | | | |
Supplemental disclosure of cash flow information | | | | | | | | | | | | |
Cash paid for: Interest | | $ | 27,000 | | | $ | 18,000 | | | $ | 12,000 | |
Income taxes | | | 32,000 | | | | — | | | $ | 5,282,000 | |
Non-cash transactions: | | | | | | | | | | | | |
Acquisition of intangible assets included in accrued expenses | | | | | | | 1,250,000 | | | | — | |
Notes receivable from the sale of intangible asset | | | | | | | 2,816,000 | | | | — | |
See notes to Financial Statements
F-7
HI-TECH PHARMACAL CO., INC.
NOTES TO CONSOLIDATED FINANCIAL STATEMENTS
(NOTE A) The Company and Summary of Significant Accounting Policies:
[1]Business:
Hi-Tech Pharmacal Co., Inc. (the “Company” or “Hi-Tech”) manufactures and sells prescription and over-the-counter generic drugs, in liquid and semi-solid dosage forms including higher margin prescription products. The Company markets its products in the United States through distributors, retail drug and mass-merchandise chains and mail order companies. Revenue is seasonal and usually peaks between September and March of each year, since a significant portion of the Company’s products are pharmaceutical preparations acting on the human respiratory system.
The following table presents sales data for the Company by division.
| | | | | | | | | |
Revenue | | 2008 | | 2007 | | 2006 |
Hi-Tech Generics | | $ | 46,256,000 | | $ | 46,361,000 | | $ | 65,471,000 |
Health Care Products | | | 10,846,000 | | | 10,845,000 | | | 9,767,000 |
Midlothian | | | 4,216,000 | | | — | | | — |
Naprelan® | | | 699,000 | | | 1,692,000 | | | 2,782,000 |
| | | | | | | | | |
Total | | $ | 62,017,000 | | $ | 58,898,000 | | $ | 78,020,000 |
| | | | | | | | | |
[2]Inventory:
Inventories are valued at the lower of cost (first-in first-out or average cost) or market.
[3]Property and equipment:
Property and equipment is stated at cost less accumulated depreciation and amortization. Estimated depreciation and amortization of the respective assets is computed using the straight line method over their estimated useful lives.
[4]Income taxes:
The Company uses the liability method to account for deferred income taxes in accordance with Statement of Financial Accounting Standards (“SFAS”) No. 109. The liability method measures deferred income taxes by applying enacted statutory rates in effect at the balance sheet date to the differences between the tax bases of assets and liabilities and their reported amounts in the financial statements. The resulting asset or liability is adjusted to reflect changes in the tax law as they occur.
On May 1, 2007, the Company adopted FASB Interpretation No. 48, Accounting for Uncertainty in Income Taxes—an Interpretation of FASB Statement 109 (“FIN 48”), which clarifies the accounting for uncertainty in tax positions. This Interpretation provides that the tax effects from an uncertain tax position can be recognized in our financial statements, only if the position is more likely than not of being sustained on audit, based on the technical merits of the position.
[5]Revenue recognition:
Revenue is recognized for product sales upon shipment and passing of risk to the customer and when estimates of discounts, rebates, promotional adjustments, price adjustments, returns, chargebacks, and other potential adjustments are reasonably determinable, collection is reasonably assured and the Company has no further performance obligations. These estimates are presented in the financial statements as reductions to net revenues and accounts receivable. Contract research income is recognized as work is completed and as billable costs are incurred. In certain cases, contract research income is based on attainment of designated milestones.
[6]Advertising Expense:
Advertising costs are expensed when incurred. Advertising expense for the years ended April 30, 2008, 2007 and 2006 amounted to $2,923,000, $3,059,000, and $3,161,000, respectively.
[7]Freight Expense:
Freight costs are included in selling, general, and administrative expense.
[8]Research and Development Costs:
Research and product development costs are charged to expense as incurred.
F-8
[9]Cash and cash equivalents:
The Company considers U.S. Treasury bills and government agency obligations with a maturity of three months or less when purchased to be cash equivalents.
[10]Earnings (loss) per share:
Basic earnings (loss) per common share is computed based on the weighted average number of common shares outstanding. Diluted earnings per common share gives effect to all dilutive potential common shares outstanding during the year. The dilutive effect of the outstanding options and warrants was computed using the treasury stock method. The number of potentially dilutive securities excluded from the computation of diluted income per share was approximately 1,881,000, 1,295,000 and 299,000 at April 30, 2008, 2007 and 2006, respectively. These securities were excluded since their effect would have been antidilutive.
[11]Long-lived assets:
The Company evaluates and records impairment losses on long-lived assets used in operations, including intangible assets, when events and circumstances indicate that the assets might be impaired using the undiscounted cash flows estimated to be generated by those assets. Long-lived assets to be disposed of are reported at the lower of their carrying amounts or fair values less disposal costs. No such losses were incurred in the three years ended April 30, 2008.
[12]Fair Value of Financial Instruments:
The carrying value of certain financial instruments such as cash and cash equivalents, accounts receivable and accounts payable approximate their fair values due to their short-term nature or their underlying terms. The fair values of the financial instruments and investments are determined by reference to market data and other valuation techniques, as appropriate.
[13]Use of estimates:
The preparation of financial statements in conformity with accounting principles generally accepted in the United States of America requires management to make estimates and assumptions that affect the reported amounts of assets and liabilities and disclosure of contingent assets and liabilities at the date of the financial statements and the reported amounts of revenues and expenses during the reporting period. Actual results could differ from those estimates. The Company makes significant estimates in many areas of its accounting, including but not limited to the following: sales returns, chargebacks, allowances and discounts, inventory obsolescence, the useful lives of property and equipment and its impairment, stock-based compensation, accruals, impact of legal matters and the realization of deferred tax assets. Actual results may differ from those estimates.
[14]Comprehensive Income:
The Company has adopted SFAS No. 130, “Reporting Comprehensive Income,” which requires companies to report as comprehensive income all changes in equity during a period, except those resulting from investment by owners and distribution to owners, for the period in which they are recognized. Comprehensive income is the total of net income and all other non-owner changes in equity (or other comprehensive income) such as unrealized gains/losses on securities classified as available for sale.
[15]Stock-Based Compensation:
Effective May 1, 2006, the Company adopted the provisions of Financial Accounting Standards Board (“FASB”) Statement of Financial Accounting Standards (“SFAS”) No. 123(R), “Share-Based Payments,” which establishes the accounting for employee stock-based awards. Under the provisions of SFAS No. 123(R), stock-based compensation is measured at the grant date, based on the calculated fair value of the award, and is recognized as an expense over the requisite employee service period (generally the vesting period of the grant). The Company adopted SFAS No. 123(R) using the modified prospective method and, as a result, periods prior to May 1, 2006 have not been restated.
F-9
As a result of the adoption of SFAS No. 123(R) the Company recognized stock-based compensation for awards issued under the Company’s Stock Option Plans in the following line items in the Statement of Operations:
| | | | |
| | | Year ended
April 30, 2008 | | Year ended
April 30, 2007 |
Cost of sales | | 663,000 | | 584,000 |
Selling, general and administrative expenses | | 2,243,000 | | 2,027,000 |
Research and development expenses | | 245,000 | | 219,000 |
| | | | |
Stock-based compensation expense before income tax benefit | | 3,151,000 | | 2,830,000 |
| | | | |
During the year ended April 30, 2006 the Company recorded compensation expense for employee stock options based upon their intrinsic value on the date of grant pursuant to Accounting Principles Board (“APB”) Opinion No. 25, “Accounting for Stock Issued to Employees.” Since the exercise price for such options was equal to the fair market value of the Company’s stock at the date of grant, the stock options had no intrinsic value upon grant and, therefore, no expense was recorded in the Statements of Operations.
Stock based compensation expense, net of related income tax benefit, resulted in an increase in basic and diluted loss per share of $0.24 for the twelve months ended April 30, 2007 and 2008 as a result of the adoption of SFAS 123(R).
Had the compensation cost of the Company’s employee stock award plans for the twelve months ended April 30, 2006 been determined in accordance with SFAS No. 123, the Company’s pro forma net income and net income per share would have been:
| | | | |
| | | Year ended
April 30, 2006 | |
Net income, as reported | | $ | 11,453,000 | |
Less: Total stock-based compensation expense determined under fair value based method for all awards, net of related tax effects | | | (1,351,000 | ) |
| | | | |
Pro forma net income | | $ | 10,102,000 | |
| | | | |
Net income per share: | | | | |
As reported | | | | |
Basic | | $ | 0.96 | |
Diluted | | $ | 0.85 | |
Pro forma | | | | |
Basic | | $ | 0.85 | |
Diluted | | $ | 0.75 | |
Under the modified prospective method, SFAS No. 123(R) applies to new awards and to awards outstanding on the effective date that are subsequently modified or cancelled. Compensation expense for outstanding awards for which the requisite service had not been rendered as of May 1, 2006 is being recognized over the remaining service period using the compensation cost calculated for pro forma disclosure purposes under SFAS No. 123. The Company amortizes the fair value of all awards on a straight-line basis over the requisite service period. Cumulative compensation expense recognized at any date will at least equal the grant date fair value of the vested portion of the award at that time.
SFAS No. 123(R) requires the use of a valuation model to calculate the fair value of stock-based awards. The Company has elected to use the Black-Scholes option-pricing model, which incorporates various assumptions including volatility, expected life and interest rate. The expected volatility is based on the historical volatility of the Company’s common stock. The expected life of an award is based on the expected life pursuant to Staff Accounting Bulletin No. 107, “Share Based Payments”. The interest rates for periods within the contractual life of the award are based on the U.S. Treasury yield on the date of each option grant.
F-10
The following weighted average assumptions were used for stock options granted during the years ended April 30, 2008, 2007 and 2006:
| | | | | | | | | | | | |
| | | Year Ended April 30, | |
| | | 2008 | | | 2007 | | | 2006 | |
Dividend yield | | | None | | | | None | | | | None | |
Expected volatility | | | 52 | % | | | 52 | % | | | 61 | % |
Risk-free interest rate | | | 3.37 | % | | | 4.69 | % | | | 4.45 | % |
Expected term | | | 5.0 | | | | 5.0 | | | | 5.0 | |
Weighted average fair value per share at grant date | | $ | 5.05 | | | $ | 6.16 | | | $ | 12.85 | |
All options granted through April 30, 2008 had exercise prices equal to the fair market value of the stock on the date of grant, a contractual term of ten years and generally a vesting period of four years. In accordance with SFAS No. 123(R), the Company adjusts stock-based compensation on a quarterly basis for changes to the estimate of expected equity award forfeitures based on actual forfeiture experience. The effect of adjusting the forfeiture rate for all expense amortization after May 1, 2006 is recognized in the period the forfeiture estimate is changed. As of April 30, 2008, the forfeiture rate was 8% and the effect of forfeiture adjustments in the year April 30, 2008 was insignificant.
Prior to the adoption of SFAS No. 123(R), the Company presented all tax benefits related to stock-based compensation as an operating cash inflow. SFAS No. 123(R) requires the cash flows resulting from tax deductions in excess of compensation cost recognized for those options (excess tax benefits) to be classified as financing cash flows. The actual income tax benefits realized for tax deductions related to option exercises of share-based payments was $507,000, $3,556,000 and $697,000 for the year ended April 30, 2008, 2007 and 2006, respectively.
STOCK OPTION PLAN ACTIVITY
Employee Stock Option Plan:
A summary of the stock options activity and related information for the 1992 Stock Option Plan (“Employee Plan”) for the year ended April 30, 2008 is as follows:
| | | | | | | | | | |
1992 Stock Option Plan | | Shares | | | Weighted-Average
Exercise Price | | Weighted-Average
Remaining
Contractual Term | | Aggregate Intrinsic
Value |
Outstanding at May 1, 2007 | | 2,247,000 | | | 10.29 | | | | | |
Grants | | 268,000 | | | 10.68 | | | | | |
Exercised | | (171,000 | ) | | 2.38 | | | | | |
Forfeitures or expirations | | (43,000 | ) | | 14.50 | | | | | |
| | | | | | | | | | |
Outstanding at April 30, 2008 | | 2,301,000 | | | 10.85 | | 5.9 | | $ | 3,617,000 |
| | | | | | | | | | |
Vested and expected to vest at April 30, 2008 | | 2,247,000 | | | 10.79 | | 5.8 | | $ | 3,617,000 |
Exercisable at April 30, 2008 | | 1,616,000 | | | 9.75 | | 4.7 | | $ | 3,617,000 |
| | | | | | | | | | |
Directors Stock Option Plan
A summary of the stock option activity and related information for the 1994 Director Stock Option Plan for the year ended April 30, 2008 is as follows:
| | | | | | | | | | | |
1994 Directors Stock Option Plan | | Shares | | | Weighted-Average
Exercise Price | | Weighted-Average
Remaining
Contractual Term | | Aggregate Intrinsic
Value |
Outstanding at May 1, 2007 | | 406,000 | | | $ | 12.35 | | | | | |
Grants | | 71,000 | | | $ | 9.65 | | | | | |
Exercised | | (8,000 | ) | | $ | 2.39 | | | | | |
| | | | | | | | | | | |
Outstanding at April 30, 2008 | | 469,000 | | | $ | 12.11 | | 6.4 | | $ | 485,000 |
| | | | | | | | | | | |
Vested and expected to vest at April 30, 2008 | | 469,000 | | | | 11.71 | | 6.4 | | $ | 485,000 |
Exercisable at April 30, 2008 | | 289,000 | | | | 10.67 | | 5.2 | | $ | 485,000 |
F-11
The aggregate intrinsic values in the preceding tables represent the total pretax intrinsic value, based on options with an exercise price less than the Company’s closing stock price of $8.75 as of April 30, 2008, which would have been received by the option holders had those option holders exercised their options as of that date.
Total intrinsic values of options exercised for the 1992 Stock Option Plan and the 1994 Directors Stock Option Plan were $1,363,000 and $1,342,000 for the years ended April 30, 2008 and 2007, respectively. As of April 30, 2008, $5,406,000 of total unrecognized compensation cost related to stock options for both plans is expected to be recognized over a weighted-average period of 2.0 years.
[16] Recent Accounting Pronouncements:
On December 4, 2007, the FASB issued SFAS No. 141 (revised 2007), “Business Combinations” which replaces SFAS 141 but retains the fundamental concept of purchase method of accounting in a business combination and improves reporting by creating greater consistency in the accounting and financial reporting of business combinations, resulting in more complete, comparable, and relevant information for investors and other users of financial statements. To achieve this goal, the new standard requires the acquiring entity in a business combination to recognize all the assets acquired and liabilities assumed in the transaction and any noncontrolling interest at the acquisition date measured at their fair value as of that date. This statement requires measuring a noncontrolling interest in the acquiree at fair value which will result in recognizing the goodwill attributable to the noncontrolling interest in addition to that attributable to the acquirer. This statement also requires the recognition of assets acquired and liabilities assumed arising from contractual contingencies as of the acquisition date, measured at their acquisition fair values. SFAS No. 141(R) is effective for fiscal years beginning after December 15, 2008. The Company is currently evaluating the impact of SFAS No. 141(R) on its financial position and results of operations.
On December 4, 2007, the FASB issued SFAS No. 160, “Noncontrolling Interests in Consolidated Financial Statements”, an amendment of ARB No. 51, which will affect only those entities that have an outstanding noncontrolling interest in one or more subsidiaries or that deconsolidate a subsidiary by requiring all entities to report noncontrolling (minority) interests in subsidiaries in the same way as equity in the consolidated financial statements. In addition, SFAS No. 160 eliminates the diversity that currently exists in accounting for transactions between an entity and noncontrolling interests by requiring they be treated as equity transactions. SFAS No. 160 is effective for fiscal years beginning after December 15, 2008. The Company is currently evaluating the impact of SFAS No. 160 on its financial position and results of operations.
In December 2007, the EITF issued EITF Issue No. 07-1 (“EITF 07-1”),Accounting for Collaborative Arrangements.EITF 07-1 affects entities that participate in collaborative arrangements for the development and commercialization of intellectual property. The EITF affirmed the tentative conclusions reached on (1) what constitutes a collaborative arrangement, (2) how the parties should present costs and revenues in their respective income statements, (3) how the parties should present cost-sharing payments, profit-sharing payments, or both in their respective income statements, and (4) disclosure in the annual financial statements of the partners. EITF 07-1 should be applied as a change in accounting principle through retrospective application to all periods presented for collaborative arrangements existing as of the date of adoption. EITF 07-1 is effective for financial statements issued for fiscal years beginning after December 15, 2007. The Company is currently evaluating the impact of the adoption of this statement on its consolidated financial statements.
In June 2007, the FASB ratified the consensus reached by the Emerging Issues Task Force on Issue No. 07-3, Accounting for Advance Payments for Goods or Services Received for Use in Future Research and Development Activities (“Issue 07-3”), which is effective for fiscal years beginning after December 15, 2007 and is applied prospectively for new contracts entered into on or after the effective date. Issue 07-3 addresses nonrefundable advance payments for goods or services for use in future research and development activities. Issue 07-3 will require that these payments that will be used or rendered for future research and development activities be deferred and capitalized and recognized as an expense as the related goods are delivered or the related services are performed. If an entity does not expect the goods to be delivered or the services to be rendered the capitalized advance payments should be expensed. The Company is currently evaluating the impact of this statement on its financial position and results of operations.
In February 2007, the FASB issued SFAS No. 159 (“SFAS 159”), “The Fair Value Option for Financial Assets and Financial Liabilities,” providing companies with an option to report selected financial assets and liabilities at fair value. The Standard’s objective is to reduce both complexity in accounting for financial instruments and the volatility in earnings caused by measuring related assets and liabilities differently. Generally accepted accounting principles have required different measurement attributes for different assets and liabilities that can create artificial volatility in earnings. SFAS 159 helps to mitigate this type of accounting-induced volatility by enabling companies to report related assets and liabilities at fair value, which would likely reduce the need for companies to comply with detailed rules for hedge accounting. SFAS 159 also establishes presentation and disclosure requirements designed to facilitate comparisons between companies that choose different measurement attributes for similar types of assets and liabilities. The Standard requires companies to provide additional information that will help investors and other users of financial statements to more easily understand the effect of the Company’s choice to use fair value on its earnings. It also requires entities to
F-12
display the fair value of those assets and liabilities for which they have chosen to use fair value on the face of the balance sheet. SFAS 159 is effective for fiscal years beginning after November 15, 2007. The Company does not expect the adoption of SFAS No. 159 to have a significant effect on its financial position or results of operations.
In September 2006, the Financial Accounting Standards Board issued Statement of Financial Accounting Standards No. 157, “Fair Value Measurements”, which defines fair value, establishes a framework for measuring fair value in generally accepted accounting principles (GAAP), and expands disclosures about fair value measurements. Where applicable, SFAS No. 157 simplifies and codifies related guidance within GAAP and does not require any new fair value measurements. SFAS No. 157 is effective for financial statements issued for fiscal years beginning after November 15, 2007, and interim periods within those fiscal years. Earlier adoption is encouraged. The Company does not expect the adoption of SFAS No. 157 to have a significant effect on its financial position or results of operation.
(NOTE B) Marketable Securities:
The Company has invested in auction rate securities (ARS) consisting of municipal securities that are held as investments available-for-sale. After the initial issuance of these securities, the interest rate is reset periodically. The Company invests in ARS that reset as to interest rate every 7 to 35 days and are carried at fair value. The Company has determined that auction rate securities should be classified as investments because the “stated” or “contractual” maturities are generally 20 to 30 years. The securities are priced and traded as current and non-current investments because of the interest reset feature. Classification of marketable securities as current or non-current is dependent upon management’s intended holding period, the security’s maturity date and liquidity considerations based on market conditions. If management intends to hold the securities for longer than one year as of the balance sheet date, they are classified as non-current. During the fiscal year, two of the auction rate securities failed to auction due to sell orders exceeding buy orders. Liquidity for these auction-rate securities is typically provided by an auction process that resets the applicable interest rate at pre-determined intervals. These ARS have been classified as non-current. The funds associated with failed auctions will not be accessible until a successful auction occurs or a buyer is found outside of the auction process. The Company hired an independent valuation company to help determine the value of the securities. The valuation indicated that one of the securities should be valued at approximately 50% of par value. Therefore, the Company wrote down the security in the amount of $500,000 due to an other than temporary reduction in the value. The effect of the loss on the value of the ARS securities is included in other income on the statement of operations.
The balance sheet classification and schedule of maturities (current and non-current) is as follows:
| | | | | | | | |
| | | April 30,
2008 | | April 30,
2007 | | Maturity
Date |
Auction rate securities - current | | | — | | $ | 24,070,000 | | 2023-2042 |
| | | | | | | | |
Current marketable securities | | | — | | | 24,070,000 | | |
| | | |
Auction rate securities - non-current | | $ | 2,545,000 | | | | | 2037-2042 |
| | | | | | | | |
Total marketable securities | | $ | 2,545,000 | | $ | 24,070,000 | | 2023-2042 |
| | | | | | | | |
(NOTE C) Accounts Receivable:
At April 30, 2008 and 2007, accounts receivable balances net of returns and allowances and allowance for doubtful accounts are as follows:
| | | | | | | | |
| | | April 30, | |
| | | 2008 | | | 2007 | |
Accounts receivable, gross | | $ | 26,269,000 | | | $ | 18,967,000 | |
Adjustment for returns and price allowances (a) | | | (8,465,000 | ) | | | (9,286,000 | ) |
Allowance for doubtful accounts | | | (200,000 | ) | | | (350,000 | ) |
| | | | | | | | |
Accounts receivable, net | | $ | 17,604,000 | | | $ | 9,331,000 | |
| | | | | | | | |
| (a) | directly reduces gross revenue |
F-13
(NOTE D) Inventory:
The components of inventory consist of the following:
| | | | | | |
| | | April 30, |
| | | 2008 | | 2007 |
Finished goods and work in process | | $ | 5,898,000 | | $ | 5,484,000 |
Raw materials | | | 12,126,000 | | | 9,001,000 |
| | | | | | |
Total | | $ | 18,024,000 | | $ | 14,485,000 |
| | | | | | |
(NOTE E) Property and Equipment:
The components of net property and equipment consist of the following:
| | | | | | | | |
| | | April 30, | | |
| | | 2008 | | 2007 | | Useful Lives |
Land and building and improvements | | $ | 13,478,000 | | $ | 12,534,000 | | 27.5 Yrs. |
Machinery and equipment | | | 20,368,000 | | | 19,040,000 | | 7 and 10 Yrs. |
Transportation equipment | | | 37,000 | | | 50,000 | | 7 Yrs. |
Computer equipment | | | 2,528,000 | | | 2,352,000 | | 3 and 7 Yrs. |
Furniture and fixtures | | | 1,090,000 | | | 1,026,000 | | 7 Yrs. |
| | | | | | | | |
| | | 37,501,000 | | $ | 35,002,000 | | |
Accumulated depreciation and amortization | | | 20,453,000 | | | 18,405,000 | | |
| | | | | | | | |
Total property and equipment—net | | $ | 17,048,000 | | $ | 16,597,000 | | |
| | | | | | | | |
The Company incurred depreciation expense of $2,190,000, $1,988,000 and $1,956,000 for the years ended April 30, 2008, 2007, and 2006, respectively.
(NOTE F) Investment in Neuro-Hitech:
The valuation of our investment in Neuro-Hitech, Inc., a marketable security valued pursuant to SFAS 115, is classified as available for sale and measured at fair value with the adjustment to fair value and changes therein to be retained by the Company recorded in accumulated other comprehensive income. At April 30, 2008, the Company owned 1,126,922 shares of Neuro-Hitech with a fair value of $0.22 per share, with a total value of $248,000 which resulted in a decrease of unrealized gain of $4,809,000, net of deferred tax of $2,532,000, being included in accumulated other comprehensive income(loss) as of such date.
At April 30, 2007, the Company owned 1,125,610 shares of Neuro-Hitech with a fair value of $6.70 per share, with a total value of $7,589,000 which resulted in an unrealized gain of $4,873,000, net of deferred tax of $2,566,000, being included in accumulated other comprehensive income as of such date.
(NOTE G) Other Assets:
Included in other assets is the Company’s investment in a limited liability company for the marketing, development and distribution of nutritional supplements, Marco Hi-Tech JV LLC (“Marco Hi-Tech”). The investment in Marco Hi-Tech is recorded using the equity method. During fiscal year ended April 30, 2008 income of $58,000 attributable to the investment in Marco Hi-Tech is included in other income. At April 30, 2008 the carrying value of this investment was $359,000.
During fiscal year ended April 30, 2007, a loss of $249,000 attributed to the investment in Marco Hi-Tech is included in other income. At April 30, 2007, the carrying value of this investment was $344,000.
(NOTE H) Intangible Assets:
Intangible assets are stated at cost and amortized using the straight line method over the expected useful lives of the product rights. Amortization expense of the intangible assets for the year ended April 30, 2008, 2007 and 2006 was $733,000, $847,000, and $660,000, respectively. Amortization is included in selling, general and administrative expenses for all periods presented. The Company tests for impairment of intangible assets annually and when events or circumstances indicate that the carrying value of the assets may not be recoverable.
F-14
Business acquisition:
On December 28, 2007, the Company acquired the assets of Midlothian Laboratories, LLC for $5.0 million in an all-cash transaction. Additionally, Hi-Tech paid approximately $0.9 million for inventory and will pay potentially up to $1.0 million in performance incentives tied to future Midlothian product sales, and the approval of an ANDA. Under the terms of the acquisition Hi-Tech received rights to Midlothian’s current product line, consisting of prescription nutritional supplements including pre-natal vitamins and several cough and cold formulations, and future ANDA and non-ANDA products that are in development.
Intangible assets with a preliminary estimated fair value of $4,596,000 were also recognized in the acquisition of certain assets of Midlothian Laboratories, LLC. These assets, consisting of licenses and a covenant not to compete, have estimated lives of approximately 3 to 10 years. Any excess purchase price over the assets acquired is recorded as goodwill. The acquisition of Midlothian Laboratories, LLC has been recorded based on preliminary estimates as of the date of acquisition. The Company is conducting an appraisal of the fair value of the intangible assets acquired and changes to the preliminary estimates during the allocation period will be reflected as an adjustment to intangibles or goodwill. Any increase in total consideration will be recorded pursuant to paragraph 26 of SFAS 141, “Business Combinations.”
Assets acquired in connection with the purchase of the assets of Midlothian Laboratories, LLC are:
| | | |
Trademarks and formulas | | $ | 4,159,000 |
Covenant not to compete | | | 174,000 |
Goodwill | | | 263,000 |
Inventory | | | 922,000 |
Other Assets | | | 367,000 |
Furniture and Fixtures | | | 77,000 |
| | | |
Total Purchase Price | | $ | 5,962,000 |
| | | |
Acquired intangible assets consist of:
| | | | | | | | | | | | | | | | |
| | | April 30, 2008 | | | April 30, 2007 | | | |
| | | Gross Carrying
Amount | | Accumulated
Amortization | | | Gross Carrying
Amount | | Accumulated
Amortization | | | Amortization Period |
Zostrix® intangible assets | | $ | 5,354,000 | | $ | (1,296,000 | ) | | $ | 5,354,000 | | $ | (794,000 | ) | | 3-11.5 years |
Midlothian intangible assets | | | 4,596,000 | | | (158,000 | ) | | | | | | | | | 3-10 years |
Vosol® and Vosol® HC intangible assets | | | 700,000 | | | (18,000 | ) | | | 700,000 | | | — | | | 10 years |
Other intangible assets | | | 604,000 | | | (122,000 | ) | | | 900,000 | | | (67,000 | ) | | 10 years |
| | | | | | | | | | | | | | | | |
| | $ | 11,254,000 | | $ | (1,594,000 | ) | | $ | 6,954,000 | | $ | (861,000 | ) | | |
| | | | | | | | | | | | | | | | |
The Company acquired exclusive rights to market and distribute Naprelan® (naproxen sodium) controlled release tablets in the United States, its territories, and Puerto Rico in June 2004. As consideration for the acquisition, Hi-Tech paid $3,400,000 in cash for the license and inventory, and approximately $170,000 for related acquisition costs. The Company incurred amortization expense of $0, $323,000, and $323,000 for the years ended April 30, 2008, 2007, and 2006, respectively, in connection with Naprelan® license. On April 30, 2007, the Company sold its rights to the Naprelan® brand to Victory Pharma, Inc for approximately $6,200,000. Hi-Tech co-owned the product in connection with Stat-Trade, Inc.
The financial statements as of April 30, 2007 include a gain on the sale of the Naprelan® license agreement of $1,848,000, net of expenses.
On July 12, 2005, the Company acquired an interest in Zostrix® brand products for $5,054,000 including $491,000 of closing costs. $4,000,000 was paid at the closing and $400,000 was payable in four equal quarterly installments commencing October 1, 2005. Such amount was paid by the fiscal year ended April 30, 2008. The Company incurred amortization expense of $490,000, $474,000 and $320,000 for the years ended April 30, 2008, 2007 and 2006, respectively, in connection with the purchase of Zostrix® brand.
On February 19, 2007 the Company purchased the rights to a Capsaisin and Lidocaine combination product from Rodlen Laboratories, Inc. The purchase price for the formula was $300,000 of which $150,000 was paid upon signing and $150,000 is included in accrued expenses on April 30, 2007 and was paid on June 19, 2007. The agreement with Rodlen includes a royalty payable to Rodlen based on future net sales. The Capsaisin and Lidocaine product is sold under the Zostrix® brand name. The Company incurred amortization expense of $13,000 for the year ended April 30, 2008.
Other intangible assets include assets related to the Choice® DM and Tanafed® acquisitions.
| | | |
Estimated Amortization Expense For the year ending April 30, | | |
2009 | | $ | 1,102,000 |
2010 | | | 1,095,000 |
2011 | | | 1,038,000 |
2012 | | | 987,000 |
2013 | | | 987,000 |
Thereafter | | | 4,451,000 |
| | | |
Total | | $ | 9,660,000 |
| | | |
F-15
(NOTE I) Accrued Expenses and Other Current Liabilities:
The following summarizes accrued expenses and other current liabilities:
| | | | | | |
| | | April 30, |
| | | 2008 | | 2007 |
Accrued litigation settlement | | $ | 0 | | $ | 2,500,000 |
Accrued rebates and advertising | | | 1,967,000 | | | 2,279,000 |
Contractual obligations | | | 0 | | | 1,038,000 |
Accrued commissions and royalty payments | | | 982,000 | | | 932,000 |
Accrued payroll and bonuses | | | 919,000 | | | 746,000 |
Accrued professional and legal fees | | | 425,000 | | | 650,000 |
Other | | | 151,000 | | | 121,000 |
| | | | | | |
| | $ | 4,444,000 | | $ | 8,266,000 |
| | | | | | |
(NOTE J) Customer Deposits and Contract Research Income:
Contract research income is recognized as work is completed and as billable costs are incurred. In certain cases, contract research income is based on attainment of designated milestones. Advance payments may be received to fund certain development costs.
(NOTE K) Credit Facility:
In May 2006, the Company amended the revolving credit facility obtained in 2002 for $8,000,000, and increased the borrowing limit to $10,000,000. Under the agreement the revolving credit facility bears interest at a rate elected by the Company equal to the Prime Rate or LIBOR plus 0.75%. Loans are collateralized by inventory, accounts receivable and other assets. The agreement contains covenants with respect to working capital, net worth and certain ratios, as well as other covenants and prohibits the payment of cash dividends. In April 2008, the Company amended the revolving credit facility and the lender waived the Company’s non-compliance with certain covenants. The Company’s ability to borrow is limited by the amendment until the Company returns to profitability. No borrowings have been made through April 30, 2008 under the credit facility.
(NOTE L) Related Party Transactions:
Bernard Seltzer resigned as Chairman of the Board in September 2004 and served as Chairman of the Board Emeritus until his death in May 2007. The Company had an employment agreement with the Chairman of the Board Emeritus which expired April 30, 2008. Mr. Bernard Seltzer’s employment agreement required the Company to pay the estate or designated beneficiary through the April 30, 2008 term of the agreement. Compensation under the agreement for all years ended April 30, 2008, 2007 and 2006 was $285,000 for each year. Under the current employment agreement, a discretionary bonus may be authorized by the board of directors. No annual bonuses were paid under the agreement for the years ended April 30, 2008, 2007 and 2006, respectively.
On March 28, 2007, Hi-Tech Pharmacal Co., Inc. (the “Company”) entered into an amended and restated executive employment agreement with David S. Seltzer pursuant to which Mr. Seltzer is to serve as President and Chief Executive Officer, effective May 1, 2007 through April 30, 2010. Mr. Seltzer is to receive an annual base salary of $421,375 for the period May 1, 2007 through April 30, 2008 (“Base Salary”) and for each fiscal year thereafter during the term of the employment agreement, Mr. Seltzer will be paid a base salary equal to the sum of (a) the Base Salary for the immediately preceding fiscal year and (b) an amount determined by
F-16
multiplying the Base Salary in effect for the immediately preceding fiscal year by five percent (5%). Mr. Seltzer may also receive a bonus during each year of employment which shall be determined in accordance with an Executive Bonus Plan to be adopted by management and approved by the Company’s compensation committee. Such Executive Bonus Plan may be based on the Company meeting certain fiscal goals and also taking into account, among other things, progress towards strategic objectives not fully measured by pre-tax net income. Mr. Seltzer shall be eligible to receive options to purchase a minimum amount of 50,000 shares of the Company’s common stock. Compensation under the agreement for the years ended April 30, 2008, 2007, and 2006 was $421,000, $401,000 and $382,000, respectively. Annual bonuses under the agreement were $0, $314,000, and $277,000 paid in the years ended April 30, 2008, 2007 and 2006, respectively.
The Company utilizes the services of Mr. Reuben Seltzer, an attorney, stockholder and a director, and brother of the President. He provided legal and new business development services throughout the year. For each of the fiscal years 2008, 2007 and 2006, he received fees, auto allowance and health insurance benefits totaling $254,000, $205,000, and $236,000, respectively. Mr. Reuben Seltzer was previously the CEO of Neuro-Hitech and also has an interest in the joint venture of Marco Hi-Tech as described in Note F.
In addition, in each of fiscal years 2002 and 2001 the Company granted Mr. Reuben Seltzer an option to purchase 37,500 shares of the Company’s common stock at an exercise price of $5.76 and $2.67, respectively, which vest at 25% per annum and are exercisable through 2012 and 2011, respectively. During the years ended April 30, 2008, 2007 and 2006, the Company valued this option at $0, $0, and $237,000, respectively, which was charged to operations.
The Company is jointly developing a generic product outside of its area of expertise with EMET Pharmaceuticals, LLC (“EMET”), previously known as XCell Pharmaceuticals, and another company. Reuben Seltzer is a principal of EMET. During the fiscal years 2008 and 2007, the Company spent approximately $1,591,000 and $409,000, respectively, on this project, which was included in research and development expense.
Tashlik, Kreutzer, Goldwyn and Crandell P.C. received $256,000, $217,000, and $213,000 in legal fees in each of the years ended April 30, 2008, 2007 and 2006, respectively, for services performed for the Company. Mr. Martin M. Goldwyn, a member of such firm, is a director of the Company.
(NOTE M) Commitments, Contingencies and Other Matters:
[1]Government regulation:
The Company’s products and facilities are subject to regulation by a number of Federal and state governmental agencies. The Food and Drug Administration (“FDA”), in particular, maintains oversight of the formulation, manufacture, distribution, packaging and labeling of all of the Company’s products.
[2]Legal Proceedings:
On May 8, 2008, Pamlab, L.L.C. and Metabolite Laboratories, Inc. (collectively “Pamlab”) filed a complaint against the Company in the United States District Court for the District of Colorado, case 1:08-cv-00967-REB-BNB. In the first count of the complaint, Pamlab alleges that the Company’s marketing and distribution of its Folamin dietary supplement infringes U.S. Patent No. 6,528,496 (the “496 patent”). In the second count of the complaint, Pamlab alleges that the Company has committed false advertising under Section 43 of the Lanham Act in connection with its marketing of Folamin and Folic Acid / B-6 / B-12 Rx Combination dietary supplements. On June 11, 2008, the Company filed an answer disputing the allegations in the complaint and denying any liability to Pamlab. In addition, the Company filed a counterclaim against Pamlab alleging that Pamlab’s marketing of its Foltx products constitutes false advertising in violation of Section 43 of the Lanham Act. The Company believes Pamlab’s complaint is without merit.
On April 9, 2008, Nycomed US, Inc. filed a complaint against the Company and Weldon Crow, bearing Index No. 08-13512, in the Supreme Court of the State of New York, Suffolk County alleging misappropriation and use of trade secrets and confidential and proprietary information in connection with the generic equivalent of Dovonex®. The Company filed an answer to the complaint on May 5, 2008 denying the above allegations. Discovery has commenced. The Company believes the matter is without merit and is vigorously contesting the claims.
On January 30, 2007, Michael Chittenden and Marcy L. Chittenden filed a complaint against Arnold H. Zukow, M.D. et al and the Company, Case No. BC346212, in the Los Angeles Superior Court in the state of California, alleging wrongful death of the plaintiff’s daughter as a result of her being negligently and improperly treated and prescribed the prescription drug, Phenergan (Promethazine HCI) with Phenylepherine and codeine, which the Company does not manufacture. The complaint was later amended when the
F-17
Company was added as a new defendant based on a prescription being filled for Promethazine with Codeine immediately prior to the daughter’s death. The Company’s defense costs, after its deductible, are being covered under its product liability policy which has a $10 million limit for defense costs and liability. The Company filed an answer to the complaint on February 28, 2007. The Company believes it has meritorious defenses to the allegations in the Complaint. The Company filed a motion for summary judgment on the grounds that its medication was not administered to the child, which was denied in November 2007, leaving it for a jury to ultimately decide which defendant company manufactured the drug given to the decedent. The Company also filed a separate motion for summary adjudication on the grounds that the failure to warn claims are preempted by federal law. This motion was denied. The Company re-filed the product identification summary judgment motion based on new facts and the federal preemption motion which are set for hearing on August 19, 2008. A mediation has been set for September 12, 2008. Non-expert discovery is ongoing. Trial is scheduled for January 12, 2009.
On September 28, 2007, Walmed Pharmaceuticals, Ltd., LLC filed a complaint against the Company, Case No. 1:07CV810, in the United States District Court, District of Ohio, Western Division, alleging that the Company breached its brokerage agreement with plaintiff. The Company filed an answer to the complaint denying all liability on December 7, 2007. Discovery is in the early stages. Trial by jury is scheduled to commence on July 20, 2009. The Company intends to vigorously defend against Walmed’s complaint. The Company believes it has meritorious defenses to the allegations in the complaint.
In Coria Laboratories, Ltd. v. Hi-Tech Pharmacal Co., Inc., C.A. 07-CV-0734 (XR) (W.D. Tex.), filed on September 10, 2007, plaintiff Coria has asserted claims for false advertising, unfair competition and common law misappropriation against defendant Hi-Tech, based on Hi-Tech’s marketing and sale of Salicylic Acid 6% Cream and Salicylic Acid 6% Lotion. Coria seeks both compensatory and punitive damages and requests an injunction to preclude Hi-Tech from marketing its salicylic acid products in the manner objected to by Coria. Hi-Tech denies all liability under any of Coria’s claims, and has asserted a counterclaim for a declaratory judgment that its marketing and sale of salicylic acid products has not and does not constitute false advertising, unfair competition or misappropriation. Coria has moved to dismiss Hi-Tech’s counterclaim and its motion is pending. The parties have conducted limited discovery and the Court has set a February 2009 trial date. Hi-Tech has no estimate at this time of its potential exposure in the event of a finding of liability in this matter. The Company believes it has meritorious defenses to the allegations in the complaint.
(NOTE N) Income Taxes:
[1] The provision (benefit) for income taxes is comprised of the following:
| | | | | | | | | | | |
| | | Year Ended April 30, |
| | | 2008 | | | 2007 | | | 2006 |
Current: | | | | | | | | | | | |
Federal | | $ | (2,225,000 | ) | | $ | (295,000 | ) | | $ | 5,582,000 |
State | | | 0 | | | | (207,000 | ) | | | 554,000 |
Deferred: | | | | | | | | | | | |
Federal | | | 479,000 | | | | (1,474,000 | ) | | | 5,000 |
State | | | (24,000 | ) | | | (22,000 | ) | | | 1,000 |
| | | | | | | | | | | |
Total | | $ | (1,770,000 | ) | | $ | (1,998,000 | ) | | $ | 6,142,000 |
| | | | | | | | | | | |
[2] Expected tax expense based on the statutory rate is reconciled with actual tax expense as follows:
| | | | | | | | | |
| | | Year Ended April 30, | |
| | | 2008 | | | 2007 | | | 2006 | |
Statutory rate | | (34.0 | )% | | (34.0 | )% | | 35.0 | % |
State income tax, net of federal income tax benefit | | (0.5 | )% | | (6.6 | )% | | 4.2 | % |
Research and development tax benefit | | (2.9 | )% | | (6.6 | )% | | (2.7 | )% |
IRS Section 199 tax credit | | — | | | — | | | (0.9 | )% |
Tax Exempt Interest | | (3.9 | )% | | (9.8 | )% | | (1.4 | )% |
Share-based compensation expense from incentive stock options as a result of SFAS 123R | | 10.3 | % | | 25.6 | % | | — | |
Effect of a change in state tax rate | | — | | | 5.4 | % | | — | |
Adjustment to reconcile book and tax basis of assets | | 2.9 | % | | (17.7 | )% | | — | |
NYS investment tax credit | | — | | | (5.6 | )% | | — | |
Other | | 2.3 | % | | (0.2 | )% | | 0.7 | % |
| | | | | | | | | |
Effective tax rate | | (25.8 | )% | | (49.5 | )% | | 34.9 | % |
| | | | | | | | | |
F-18
The Company included in the tax benefit for the year ended April 30, 2007, the adjustment to reconcile differences in the book and tax basis relating to fixed assets and the IRS section 263A adjustment.
For the years ended April 30, 2008, April 30, 2007, and April 30, 2006, the Company’s state effective tax rate was reduced due to the utilization of state investment tax credits and change in New York law. Future state income tax rates may be affected by the availability of state investment tax credits.
[3] Deferred tax assets and liabilities are composed of the following:
| | | | | | | | |
| | | April 30, | |
| | | 2008 | | | 2007 | |
Current deferred tax assets: | | | | | | | | |
Allowances and write-offs not currently deductible for accounts receivable and doubtful accounts | | $ | 1,282,000 | | | $ | 2,656,000 | |
Expenses not currently deductible and tax credits | | | 1,325,000 | | | | 570,000 | |
| | | | | | | | |
| | | 2,607,000 | | | | 3,226,000 | |
| | | | | | | | |
Non-current deferred tax liability: | | | | | | | | |
Depreciation, amortization and unrealized gain on investments | | $ | (630,000 | ) | | $ | (3,254,000 | ) |
| | | | | | | | |
On May 1, 2007, the Company adopted FASB Interpretation No. 48, Accounting for Uncertainty in Income Taxes—an Interpretation of FASB Statement 109 (“FIN 48”), which clarifies the accounting for uncertainty in tax positions. This Interpretation provides that the tax effects from an uncertain tax position can be recognized in our financial statements, only if the position is more likely than not of being sustained on audit, based on the technical merits of the position.
FASB Interpretation 48,Accounting for Uncertainty in Income Taxes (“FIN 48”) was issued to clarify the requirements of SFAS No. 109,Accounting for Income Taxes, relating to the recognition of income tax benefits. FIN 48 provides a two-step approach to recognizing and measuring tax benefits when the benefits’ realization is uncertain. The first step is to determine whether the benefit is to be recognized; the second step is to determine the amount to be recognized:
| | • | | Income tax benefits should be recognized when, based on the technical merits of a tax position, the company believes that if a dispute arose with the taxing authority and were taken to a court of last resort, it is more likely than not (i.e., a probability of greater than 50 percent) that the tax position would be sustained as filed; and |
| | • | | If a position is determined to be more likely than not of being sustained, the reporting company should recognize the largest amount of tax benefit that is greater than 50 percent likely of being realized upon ultimate settlement with the taxing authority. |
In connection with the adoption of FIN 48, the Company recorded a liability for uncertain tax positions related to research and developments credits taken by the Company in the amount of $162,000.
The Company is currently under audit by the Internal Revenue Service for the tax years ended April 30, 2007, 2006, 2005 and 2004. The Company does not expect such audits to result in amounts that would cause a significant change to its effective tax rate. All tax years prior to April 30, 2002 are closed to IRS audit.
At April 30, 2008 the Company has New York State investment tax credits in the amount of $90,000 and $50,000 expiring April 30, 2023, and April 30, 2024, respectively. The Company also has federal research and development credits in the amount of $122,000, $98,000 and $98,000 expiring April 30, 2027, April 30, 2028, and April 30, 2029, respectively and federal alternative minimum tax credits in the amount of $100,000 which do not expire.
(NOTE O) Significant Customers and Concentration of Credit Risk:
For the year ended April 30, 2008, three customers accounted for net sales of approximately 15%, 10%, and 10%, respectively. These customers represented approximately 58% of the accounts receivable at April 30, 2008. For the year ended April 30, 2007, two customers accounted for approximately 15% and 10% of net sales and approximately 44% of the accounts receivable at April 30, 2007.
Cash in excess of Federal Deposit Insurance Company limitations is held in certain banks.
(NOTE P) Savings Plan:
The Company has a defined contribution plan that qualifies under Section 401(k) of the Internal Revenue Code for the benefit of substantially all full time eligible employees. Employees may contribute between 1% and 15% of their salary up to the dollar maximum allowed by the Internal Revenue Service. Company contributions are voluntary and are made at the discretion of the Board of Directors. The Company contributed $243,000, $206,000 and $176,000, for fiscal years 2008, 2007, and 2006, respectively.
F-19
(Note Q) Quarterly Financial Results (unaudited):
| | | | | | | | | | | | | | | | | | | | |
| | | Quarter | | | | |
| | | 1 | | | 2 | | | 3 | | | 4 | | | Year | |
| Fiscal 2008 | | | | | | | | | | | | | | | | | | | | |
Net Sales | | $ | 10,098,000 | | | $ | 15,874,000 | | | $ | 15,075,000 | | | $ | 20,970,000 | | | $ | 62,017,000 | |
Gross profit | | $ | 2,065,000 | | | $ | 5,702,000 | | | $ | 5,018,000 | | | | 8,727,000 | | | | 21,512,000 | |
Net income (loss) | | $ | (2,878,000 | ) | | $ | (953,000 | ) | | $ | (1,544,000 | ) | | | 277,000 | | | | (5,098,000 | ) |
Earnings (loss) per share—Basic | | $ | (0.25 | ) | | $ | (0.08 | ) | | $ | (0.14 | ) | | $ | 0.02 | | | $ | (0.45 | ) |
Earnings (loss) per share—Diluted | | $ | (0.25 | ) | | $ | (0.08 | ) | | $ | (0.14 | ) | | $ | 0.02 | | | $ | (0.45 | ) |
| Fiscal 2007 | | | | | | | | | | | | | | | | | | | | |
Net Sales | | $ | 11,318,000 | | | $ | 16,261,000 | | | $ | 17,985,000 | | | $ | 13,334,000 | | | $ | 58,898,000 | |
Gross profit | | $ | 4,157,000 | | | $ | 7,178,000 | | | $ | 8,471,000 | | | $ | 3,388,000 | | | $ | 23,194,000 | |
Net income (loss) | | $ | (959,000 | ) | | $ | 409,000 | | | $ | 726,000 | | | $ | (2,212,000 | ) | | $ | (2,036,000 | ) |
Earnings (loss) per share—Basic | | $ | (0.08 | ) | | $ | 0.03 | | | $ | 0.06 | | | $ | (0.19 | ) | | $ | (0.17 | ) |
Earnings (loss) per share—Diluted | | $ | (0.08 | ) | | $ | 0.03 | | | $ | 0.06 | | | $ | (0.19 | ) | | $ | (0.17 | ) |
| Fiscal 2006 | | | | | | | | | | | | | | | | | | | | |
Net Sales | | $ | 15,427,000 | | | $ | 21,619,000 | | | $ | 22,897,000 | | | $ | 18,077,000 | | | $ | 78,020,000 | |
Gross profit | | $ | 8,217,000 | | | $ | 11,631,000 | | | $ | 13,507,000 | | | $ | 8,832,000 | | | $ | 42,187,000 | |
Net income | | $ | 1,406,000 | | | $ | 3,065,000 | | | $ | 4,897,000 | | | $ | 2,085,000 | | | $ | 11,453,000 | |
Earnings per share—Basic | | $ | 0.12 | | | $ | 0.26 | | | $ | 0.41 | | | $ | 0.17 | | | $ | 0.96 | |
Earnings per share—Diluted | | $ | 0.11 | | | $ | 0.23 | | | $ | 0.36 | | | $ | 0.15 | | | $ | 0.85 | |
Earnings (loss) per common share amounts for fiscal quarters have been calculated independently and may not in the aggregate equal the amount for the full year.
(NOTE R) Pro Forma Financial Statements:
The results of Midlothian Laboratories LLC have been included in the statements of operations since the date of acquisition. Unaudited pro forma results of operations for the years ended April 30, 2008 and 2007 are included below. Such pro forma information assumes that the above acquisition had occurred as of May 1, 2006, and net sales is presented in accordance with our accounting policies. This summary is not necessarily indicative of what our result of operations would have been had these been acquired during such periods, nor does it purport to represent results of operations for any future periods.
| | | | | | | | |
| | | Year Ended
April 30, 2008
(unaudited) | | | Year Ended
April 30, 2007
(unaudited) | |
Net sales | | $ | 66,602,867 | | | $ | 64,877,139 | |
| | | | | | | | |
Net loss | | $ | (4,240,330 | ) | | $ | (1,030,326 | ) |
| | | | | | | | |
| | |
Weighted average numbers of Shares Outstanding—Basic and Diluted | | | 11,353,000 | | | | 11,884,000 | |
Earnings per share Basic and Diluted | | $ | (0.37 | ) | | $ | (0.09 | ) |
(Note S) Subsequent Event (Unaudited):
On July 11, 2008, the Company sold a cough and cold product and related rights for $3.5 million, of which $1,000,000 was payable on closing, and $2,500,000 is payable in installment payments over a period of nine months. The Company will also receive royalties on net sales of the product through December 2010. The Company will realize a gain of $3.5 million on this transaction in the first quarter of fiscal 2009.
F-20
CONSENT OF INDEPENDENT REGISTERED PUBLIC ACCOUNTING FIRM
We consent to the incorporation by reference in the Registration Statements of Hi-Tech Pharmacal Co., Inc. (the “Company”) on Form S-8 (File No. 333-139796) and Form S-8 (File No. 333-126872) of our reports, dated July 11, 2008, with respect to our audits of the financial statements of the Company as of April 30, 2008 and 2007 and for each of the years in the three-year period ended April 30, 2008, and our report dated July 11, 2008 on our audit of the Company’s internal control over financial reporting as of April 30, 2008, included in this Annual Report on Form 10-K.
Eisner LLP
New York, New York
July 11, 2008
F-21
SCHEDULE II
HI-TECH PHARMACAL CO., INC.
VALUATION AND QUALIFYING ACCOUNTS
| | | | | | | | | | | | | | |
Description | | Balance at
Beginning of
Period | | Charges in
costs and
expenses | | | Deductions | | | Balance at
End of Period |
Allowance for doubtful accounts | | | | | | | | | | | | | | |
Year ended April 30, 2008 | | $ | 350,000 | | $ | 6,000 | (a) | | $ | 156,000 | (b) | | $ | 200,000 |
Year ended April 30, 2007 | | $ | 350,000 | | $ | 69,000 | (a) | | $ | 69,000 | (b) | | $ | 350,000 |
Year ended April 30, 2006 | | $ | 350,000 | | | | | | | | | | $ | 350,000 |
Accumulated depreciation | | | | | | | | | | | | | | |
Year ended April 30, 2008 | | $ | 18,405,000 | | $ | 2,190,000 | | | $ | 142,000 | (c) | | $ | 20,453,000 |
Year ended April 30, 2007 | | $ | 16,417,000 | | $ | 1,988,000 | | | | | | | $ | 18,405,000 |
Year ended April 30, 2006 | | $ | 14,607,000 | | $ | 1,957,000 | | | $ | 147,000 | (c) | | $ | 16,417,000 |
| (a) | Change in reserve required |
| (b) | Direct write-off of receivable |
| (c) | Disposition of equipment or retirements |
| ITEM 9. | CHANGES IN AND DISAGREEMENTS WITH ACCOUNTANTS ON ACCOUNTING AND FINANCIAL DISCLOSURE. |
NONE
| ITEM 9A. | CONTROLS AND PROCEDURES. |
Evaluation of Disclosure Controls and Procedures
The Company maintains disclosure controls and procedures that are designed to ensure that information required to be disclosed in the Company’s filings with the SEC is recorded, processed, summarized and reported within the time period specified in the SEC’s rules and forms, and that such information is accumulated and communicated to management, including the Company’s Chief Executive Officer (“CEO”) and Chief Financial Officer (“CFO”), as appropriate, to allow timely decisions regarding required disclosure based on the definition of “disclosure controls and procedures” as defined in Rule 13a-15(e) and Rule 15d-15(e) promulgated under the Securities Exchange Act of 1934, as amended (the “Exchange Act”). In designing and evaluating disclosure controls and procedures, the Company has recognized that any controls and procedures, no matter how well designed and operated, can provide only reasonable assurance of achieving the desired control objectives, and management is required to apply judgment in evaluating its controls and procedures.
The evaluation was performed under the supervision and with the participation of Company management, including its CEO and CFO, to assess the effectiveness of the design and operation of its disclosure controls and procedures (as defined under the Exchange Act). Based on that evaluation, the Company’s management, including its CEO and CFO, concluded that the Company’s disclosure controls and procedures were effective as of April 30, 2008.
Management Report on Internal Control Over Financial Reporting
Management of the Company is responsible for establishing and maintaining adequate internal control over financial reporting as defined in Rules 13a-15(f) and 15d-15(f) under the Exchange Act. The Company’s internal control over financial reporting is designed, under the supervision of the Company’s CEO and CFO, to provide reasonable assurance regarding the reliability of financial reporting and the preparation of financial statements for external purposes in accordance with U.S. GAAP. The Company’s internal control over financial reporting includes those policies and procedures that: (a) pertain to the maintenance of records that, in reasonable detail, accurately and fairly reflect the transactions and dispositions of its assets; (b) provide reasonable assurance that transactions are recorded as necessary to permit preparation of financial statements in accordance with GAAP, and that the Company receipts and expenditures are being made only in accordance with authorizations of management and directors of the Company; and (c) provide reasonable assurance regarding prevention or timely detection of unauthorized acquisition, use or disposition of its assets that could have a material effect on the financial statements. All internal control systems, no matter how well designed, have inherent limitations. Therefore, even those systems determined to be effective can provide only reasonable assurance regarding the reliability of financial reporting and the preparation of financial statements for external purposes in accordance with GAAP.
27
The Company assessed the effectiveness of its internal controls over financial reporting as of April 30, 2008. The Company based the evaluation on the framework in “Internal Control – Integrated Framework” issued by the Committee of Sponsoring Organizations of the Treadway Commission (COSO) and has concluded that the Company’s internal control over financial reporting was effective as of April 30, 2008.
Eisner LLP, the Company’s auditor, has audited the Company’s financial statements included in this report on Form 10-K and, as part of their audit, has issued their report, set forth at page F-3 of our financial statements, on the effectiveness of our internal control over financial reporting, as of April 30, 2008.
Our audit committee is comprised of three non-employee members of the board of directors, all of whom are independent from our Company. The committee charter, which was attached to the Company’s proxy statement dated October 11, 2007, outlines the members’ roles and responsibilities and is consistent with the recently enacted corporate reform laws and regulations. It is the audit committee’s responsibility to appoint an independent registered public accounting firm subject to shareholder ratification, approve both audit and non-audit services performed by the independent registered public accounting firm, and review the reports submitted by the firm. The audit committee meets several times during the year with management, and the independent public accounting firm to discuss audit activities, internal controls, and financial reporting matters, including reviews of our externally published financial results. The independent registered public accounting firm has full and free access to the committee.
Changes in Internal Control over Financial Reporting
There were no significant changes in the Company’s internal control over financial reporting during the quarter of the year ended April 30, 2008.
| | |
| ITEM 9B. | | OTHER INFORMATION |
| |
| | NONE |
28
PART III
| ITEM 10. | DIRECTORS, EXECUTIVE OFFICERS AND CORPORATE GOVERNANCE |
The board has appointed an audit committee consisting entirely of independent directors in accordance with applicable SEC and NASDAQ rules. The members of the committee are Robert M. Holster, Dr. Yashar Hirshaut, and Anthony J. Puglisi. The board has determined that Anthony Puglisi (chairman) is the audit committee financial expert as defined in the SEC rules.
The Board of Directors consisted of seven members. All Directors are elected at each Annual Meeting of Shareholders and hold office until the next Annual Meeting of Shareholders when their respective successors are duly elected and qualified.
Set forth below is the name and age of each Director, his position with the Company and his principal occupation during the past five years and the year in which each Director was first elected as a Director of the Company.
| | | | | | |
Name of Director | | Principal Occupation and other Directorships | | Age | | Elected to
the Board |
| David S. Seltzer | | David S. Seltzer has been Chairman of the Board since September 2004 and Chief Executive Officer and President of the Company since May 1, 1998 and a Director, Secretary and Treasurer since February 1992. From July 1992 to May 1, 1998 Mr. Seltzer was Executive Vice President - Administration and since July 1992, Vice President – Administration and Chief Operating Officer of the Company since March 1992. Mr. Seltzer received a B.A. in Economics from Queens College in 1984. David S. Seltzer is the brother of Reuben Seltzer. | | 48 | | 1992 |
| | | |
| Reuben Seltzer | | Reuben Seltzer has been a Director of the Company since April 1992. Mr. Seltzer is currently serving as a consultant to the Company on legal matters and special projects. Mr. Seltzer is Vice Chairman and Director of Neuro-HiTech Pharmaceuticals, Inc., a drug development company engaged in the development and commercialization of Huperzine A and its analogues since February 2006. Mr. Seltzer had been president of R.M. Realty Services Inc., a real estate investment and consulting company from May 1988 to September 1992. From May 1983 to May 1988 Mr. Seltzer was a vice president and attorney with Merrill Lynch Hubbard Inc., a real estate investment subsidiary of Merrill Lynch and Company. Mr. Seltzer received a B.A. in Economics from Queens College in 1978, a Juris Doctor from the Benjamin N. Cardozo School of Law in 1981 and a L.L.M. from the New York University School of Law in 1987. Reuben Seltzer is the brother of David Seltzer. | | 52 | | 1992 |
| | | |
| Martin M. Goldwyn | | Martin M. Goldwyn was elected a Director of the Company in May 1992. Mr. Goldwyn is a member in the law firm of Tashlik, Kreutzer, Goldwyn & Crandell P.C. Mr. Goldwyn received a B.A. in finance from New York University in 1974 and a Juris Doctor from New York Law School in 1977. | | 56 | | 1992 |
| | | |
| Yashar Hirshaut, M.D. | | Yashar Hirshaut has been a Director of the Company since September 1992. Dr. Hirshaut is a practicing medical oncologist and is currently an Associate Clinical Professor of Medicine at Cornell University Medical College. Since July 1986, he has been a Research Professor of Biology at Yeshiva University. In addition, he has served as editor-in-chief of the Professional Journal of Cancer Investigation since July 1981. Dr. Hirshaut received a B.A. from Yeshiva University in 1959 and his medical degree from Albert Einstein College of Medicine in 1963. | | 70 | | 1992 |
| | | |
| Robert M. Holster | | Robert M. Holster was elected a Director of the Company in April, 2002. Mr. Holster is Chief Executive Officer of HMS Holding Corp. (NASDAQ: HMSY), a company providing cost containment services to healthcare providers and payors. From 1993 to 1998 Mr. Holster was President and Chief Executive Officer of HHL Financial Services Inc., a healthcare accounts receivable management company. Prior to that Mr. Holster served in a number of executive positions, including Chief Financial Officer of Macmillan, Inc. and Controller of Pfizer Laboratories, a division of Pfizer, Inc. | | 61 | | 2002 |
29
| | | | | | |
| | | |
| Anthony J. Puglisi | | Anthony J. Puglisi was elected a Director of the Company on September 21, 2005. Mr. Puglisi is Vice President and Chief Financial Officer of Sbarro, Inc., an owner, operator and franchisor of quick-service restaurants, since February 2004. Prior to joining Sbarro, Mr. Puglisi was the Vice President and Chief Financial Officer of Langer, Inc., a provider of products used to treat muscle-skeletal disorders, from April 2002 to February 2004. Mr. Puglisi was Senior Vice President and Chief Financial Officer of Netrex Corporation from September 2000 to October 2001 and Executive Vice President and Chief Financial Officer of Olsten Corporation, a provider of staffing and home health care services from 1993 to March 2000. Mr. Puglisi has been a certified public accountant in New York for over twenty-five years. He earned a B.B.A. in Accounting from Bernard Baruch College. | | 59 | | 2004 |
| | | |
| Bruce W. Simpson | | Bruce W. Simpson was elected Director of the Company on September 9, 2005. Mr. Simpson is President and CEO of B.W. Simpson & Associates, a consulting company that works with small emerging pharmaceuticals companies in the areas of marketing, business development and strategic planning. Mr. Simpson is a consultant to the Company. Prior to founding his own healthcare-consulting firm in 1998, from July 1998 to August 1999, Mr. Simpson was President of Genpharm, Inc., located in Ontario, Canada, a division of E. Merck. From 1992 to July 1998, he served as President and CEO of Medeva Pharmaceuticals in Rochester, New York. He has been affiliated with American Academy of Allergy and currently is a Director of Draxis Health Inc. and Radial Pharmaceuticals Co. Mr. Simpson holds a B.S. in Marketing from Fairleigh Dickinson University, an M.B.A. in Marketing from the University of Hartford, and has done post-graduate work in healthcare marketing at UCLA. Prior to entering the pharmaceutical field, Mr. Simpson served as a Captain in the United States Marine Corps. | | 66 | | 2004 |
Executive Officers
The executive officers of the Company are set forth in the table below. All executive officers are elected at the annual meeting or interim meetings of the Board of Directors. No arrangements or understanding exists between any executive officer and any other person pursuant to which he was elected as an executive officer.
| | | | |
Name | | Age | | Position and Period Served |
| David S. Seltzer | | 48 | | Chairman of the Board since September 2004, Chief Executive Officer and President of the Company since May 1, 1998 and a Director, Secretary and Treasurer since February 1992. Mr. Seltzer served as Executive Vice President of Administration until February 1992. |
| | |
| William Peters | | 40 | | Vice President and Chief Financial Officer of the Company since May 2004. |
| | |
Significant Employees | | | | |
| | |
Name | | Age | | Position and Period Served |
| Tanya Akimova, Ph.D. | | 54 | | Director of New Business Development since October 2000. |
| | |
| Gary M. April | | 51 | | President of Health Care Products Division since May 1998 and Divisional Vice President of Sales since January 1993. |
| | |
| Edwin A. Berrios | | 55 | | Vice President of Sales and Marketing since November 2000. |
| | |
| Joanne Curri | | 67 | | Director of Regulatory Affairs since January 1992. |
| | |
| Polireddy Dondeti, Ph.D. | | 43 | | Senior Director of Research and Development since October 2003. |
| | |
| Bryce Harvey | | 52 | | President, Midlothian Laboritories since December 2007. |
| | |
| Jesse Kirsh | | 49 | | Senior Director of Quality Assurance since March 1994. |
| | |
| Christopher LoSardo | | 42 | | Vice President of Corporate Development since October 2005. |
| | |
| Eyal Mares | | 45 | | Vice President, Operations since October 2006. |
| | |
| Pudpong Poolsuk | | 64 | | Senior Director of Science since May 2000. |
| | |
| Margaret Santorufo | | 42 | | Vice President and Controller since May 2004. |
| | |
James P. Tracy | | 64 | | Vice President of Information Systems since August 2004. |
30
Audit Committee
We have a separately-designated standing Audit Committee established in accordance with Section 3(a)(58)(A) of the Securities Exchange Act of 1934, as amended (the “Exchange Act”). The members of the Audit Committee are Robert M. Holster, Yashar Hirshaut M.D., and Anthony J. Puglisi, and each member is independent as such term is defined under the rules promulgated by the NASDAQ listing standards.
Audit Committee Financial Expert
The Board of Directors of the Company has determined that Anthony Puglisi is an audit committee financial expert as defined by Item 407(d)(5)(ii) of Regulation S-K of the Exchange Act and is independent within the listing standards set forth by the NASDAQ.
Nominating Committee
The Nominating Committee is responsible for identifying and evaluating nominees for director and for recommending to the Board a slate of nominees for election at the Annual Meeting of Stockholders in accordance with the Nominating Committee’s charter. The Nominating Committee is comprised of Robert M. Holster, Anthony Puglisi and Bruce W. Simpson. They are non-management directors who are “independent” as defined under the rules promulgated by the NASDAQ listing standards.
Code of Ethics
We have adopted a code of ethics for our principal executive officer, principal financial officer, principal accounting officer, controller, persons performing similar functions, as well as directors and employees. We will provide a copy of our Code of Ethics (“Code”) to any person, without charge, upon request to Hi-Tech Pharmacal Co., Inc., Attention: Investors Relations, 369 Bayview Avenue, Amityville, NY 11701, (631) 789-8228. If we make any substantive amendments to the Code or grant any waiver, including any implicit waiver, from a provision of the Code to our principal executive officer, principal financial officer, principal accounting officer or controller or persons performing similar functions, we will disclose the nature of such amendment or waiver on our website or in a report on Form 8-K in accordance with applicable rules and regulations. A copy of the Code of Ethics was filed as an exhibit to our Annual Report on Form 10-K for fiscal year ended April 20, 2006.
Section 16(a) Beneficial Ownership Reporting Compliance
Section 16(a) of the Securities Exchange Act of 1934 requires the Company’s Directors and Executive Officers and persons who own more than ten percent of a registered class of the Company’s equity securities to file with the Securities and Exchange Commission initial reports of ownership and reports of changes in ownership of Common Stock and other equity securities of the Company. Officers, Directors and greater than ten percent shareholders are required by Securities and Exchange Commission regulation to furnish the Company with copies of all Section 16(a) reports they file. The Company believes that all Section 16(a) filing requirements were met during Fiscal 2008. In making this statement, the Company has relied on the written representations of its incumbent directors and officers and copies of the reports that they have filed with the Securities and Exchange Commission and Nasdaq.
| ITEM 11. | EXECUTIVE COMPENSATION. |
Compensation Discussion and Analysis
This Compensation Discussion and Analysis provides a narrative describing how compensation for our named executive officers is established and should be read in conjunction with the compensation tables and related narrative descriptions set forth below.
Objectives and Philosophy of Our Executive Compensation Program
Our mission is to be a significant provider of quality products in the markets we serve. To support this and other strategic objectives as approved by the Board of Directors and to provide adequate returns to shareholders, we must compete for, attract, develop, motivate, and retain top quality executive talent at the corporate office and operating business units during periods of both favorable and unfavorable business conditions.
Our executive compensation program is a critical management tool in achieving this goal. “Pay for performance” is the underlying philosophy for our executive compensation program. Consistent with this philosophy, the program has been carefully conceived and is independently administered by the Compensation Committee of the Board of Directors, which is comprised entirely of non-employee directors.
31
The program is designed and administered to:
| | • | | reward individual and team achievements that contribute to the attainment of our business goals; and |
| | • | | provide a balance of total compensation opportunities, including salary, bonus, and longer-term cash and equity incentives, that are competitive with similarly situated companies and reflective of our performance. |
In seeking to link executive pay to corporate performance, the Compensation Committee believes that the most appropriate measure of corporate performance is the increase in long-term shareholder value, which involves improving such quantitative performance measures as revenue, net income, cash flow, operating margins, earnings per share, and return on shareholders’ equity. The Compensation Committee may also consider qualitative corporate and individual factors which it believes bear on increasing our long-term value to our shareholders. These include: (i) revenue growth; (ii) increases in operating income; (iii) the attainment of specific financial goals; (iv) the development of competitive advantages; (v) the ability to deal effectively with the growing complexity of our businesses; (vi) success in developing business strategies and managing costs; (vii) execution of divestitures, acquisitions, and strategic partnerships; (viii) implementation of operating efficiencies; and (ix) the general performance of individual job responsibilities.
Components of our Executive Compensation Program
The primary elements of our executive compensation program are:
| | • | | annual cash incentive bonus; |
| | • | | a long-term incentive represented by stock options; and |
| | • | | insurance, 401(K) plan and other employee benefits. |
The Company has not, prior to 2008, had a formal or informal policy or target for allocating compensation between long-term and short-term compensation, between cash and non-cash compensation or among different forms of non-cash compensation. Instead, the Compensation Committee, after reviewing information provided by management determines subjectively what it believes to be the appropriate level and mix of the various compensation components.
Base Salary. Base salary is used to recognize the experience, skills, knowledge and responsibilities required of all our employees, including our executives. In determining the amount of compensation to be paid to our executive officers, the Compensation Committee adheres to compensation policies pursuant to which executive compensation is determined. Base salary determinants include the prevailing rate of compensation for positions of like responsibility in the particular geographic area, the level of the executive’s compensation in relation to our other executives with the same, more, or less responsibilities, and the tenure of the individual.
Minimum base salaries are mandated by our employment agreements for Mr. David Seltzer and Mr. William Peters.
Base salaries are reviewed annually or when employment contracts expire by our Compensation Committee, and are adjusted from time to time to realign salaries with market levels after taking into account individual responsibilities, performance and experience.
Annual Cash Incentive Bonus. The Compensation Committee has the authority to award annual bonuses to individual senior executives in accordance with evaluation and performance criteria established each year, and based on the extent to which those criteria were achieved. The Committee believes that the short term bonus plan promotes the Company’s performance-based compensation philosophy by providing executives with direct financial incentives in the form of annual cash bonuses for achieving specific performance goals. Bonus criteria are established, and bonuses ultimately awarded, in a manner intended to reward both overall corporate performance and an individual’s participation in attaining such performance.
In August 2007, the Compensation Committee approved the cash bonus amounts to be paid to William Peters for services performed in 2007. The bonus amount awarded to Mr. Peters for fiscal year 2007 was 15% his 2007 base salary, or $35,000. The cash bonuses awarded was determined based on certain accomplishments during the period. The Compensation Committee did not approve a cash bonus for Mr. Seltzer.
Stock Options. The long-term component of our executive compensation program consists of stock options. We believe that equity grants provide our executives with a strong link to our long-term performance, create an ownership culture and help to align the interest of our executives and our shareholders. Stock options are granted upon the recommendation of management and approval of
32
the Compensation Committee based upon their subjective evaluation of the appropriate amount for the level and amount of responsibility of each executive officer. Factors entering into this process include company-level performance, the individual executive’s performance, the amount of equity previously awarded to the executive and the vesting of such awards.
The Compensation Committee reviews all components of the executive’s compensation when determining annual equity awards to ensure that an executive’s total compensation conforms to our overall philosophy and objectives.
The options generally permit the option holder to buy the number of shares of the underlying Common Stock (an option exercise) at a price equal to the market price of the Common Stock at the time of grant. Thus, the options generally gain value only to the extent the stock price exceeds the option exercise price during the term of the option. Generally, the options vest over a period of four years, with 25% vesting upon the first anniversary of the date of grant and 25% on each anniversary thereafter, and expire no later than ten years after grant.
Equity awards are typically granted to our executives annually in conjunction with the review of their individual performance. We set the exercise price of all stock options to equal the closing price of our Common Stock on the NASDAQ Stock Market on the day of the grant.
Benefits and Other Compensation. We maintain broad-based benefits that are provided to all employees, including health and dental insurance, and a 401(k) plan. Executive officers are eligible to participate in all of our employee benefit plans, at no cost. The Company matches 50% on the first 6% of the contributions to the 401(k) plan for all employees up to the federal maximum.
Mr. David Seltzer and Mr. William Peters received $10,400 and $6,000, respectively, for automobile reimbursements. These amounts were reported as taxable income.
Severance and Change-in-Control Benefits. Pursuant to employment agreements we have entered into with certain of our executives and our 1992 Stock Plan, our executives are entitled to specified benefits in the event of the termination of their employment under specified circumstances, including termination following a change in control of our Company. We have provided more detailed information about these benefits, along with estimates of their value under various circumstances, under the caption “Potential Payments upon Termination of Employment or Change-in-Control” below.
We believe providing these benefits help us compete for executive talent. We believe that our severance and change-in-control benefits are generally in line with severance packages offered to executives by other companies.
Compensation of the Chief Executive Officer
Determination of our compensation for David S. Seltzer, our Chief Executive Officer, takes into account the factors described above as pertinent to the remainder of our executives and employees, while also taking into consideration the proprietary nature of our business and efforts expended in connection with development of our business strategy and product development activities. The Compensation Committee more specifically took into account Mr. Seltzer’s (i) success in growing revenues, (ii) success in improving operating income compared to the prior year, (iii) achievement of certain specified financial and strategic targets, and (iv) success in leading and strengthening the executive team and the operating management teams. The Compensation Committee also took into account the amount of Mr. Seltzer’s compensation relative to chief executive officers of comparable companies.
Tax Considerations
Section 162(m) of the Internal Revenue Code prohibits us from deducting any compensation in excess of $1 million paid to certain of our executive officers, except to the extent that such compensation is paid pursuant to a shareholder approved plan upon the attainment of specified performance objectives. The Compensation Committee believes that tax deductibility is an important factor, but not the sole factor, to be considered in setting executive compensation policy. Accordingly, the Compensation Committee periodically reviews the potential consequences of Section 162(m) and generally intends to take such reasonable steps as are required to avoid the loss of a tax deduction due to Section 162(m). However, the Compensation Committee may, in its judgment, authorize compensation payments that do not comply with the exemptions in Section 162(m) when it believes that such payments are appropriate to attract and retain executive talent.
33
Compensation Committee Report
The Compensation Committee has reviewed and discussed the Compensation Discussion and Analysis with management. Based on this review and discussion, the Compensation Committee recommended to the Board of Directors that it be included in this Annual Report on Form 10-K.
| | | | | | |
| | | | | | The Compensation Committee |
| | | | | | Robert M. Holster |
| | | | | | Yashar Hirshaut, M.D. |
| | | | | | Bruce W. Simpson |
Dated: July 14, 2008
The information contained in the report above shall not be deemed to be “filed” with the Securities and Exchange Commission, nor shall such information be incorporated by reference into any future filing under the Securities Act of 1933, as amended, or the Securities Exchange Act of 1934, as amended, except to the extent specifically incorporated by reference therein.
Compensation Committee Interlocks and Insider Participation
The Compensation Committee of our board of directors is currently composed of Robert M. Holster (chair), Yashar M. Hirshaut, M.D., and Bruce W. Simpson. None of the members of the Compensation Committee has ever been an officer or employee of ours. None of our named executive officers serves or has served as a member of the Board of Directors or compensation committee of any other company that had one or more executive officers serving as a member of our Board of Directors or Compensation Committee.
Summary Compensation Table
The following table summarizes the compensation of the Named Executive Officers for the fiscal year end April 30, 2008. The Named Executive Officers are the Company’s Chief Executive Officer and Chief Financial Officer.
| | | | | | | | | | | | |
Name and Principal Position | | Year | | Salary
($)(1) | | Bonus
($) | | Options
Awards
(#)(2) | | All
Other
Compensation
($)(3) | | Total
($) |
David S. Seltzer President, Chief Executive Officer, Secretary, and Treasurer | | 2008
2007 | | 421,000
401,000 | | 0
314,000 | | 256,000
269,000 | | 27,000
26,000 | | 704,000
1,010,000 |
William Peters Vice President and Chief Financial Officer | | 2008
2007 | | 237,000
218,000 | | 35,000
75,000 | | 128,000
326,000 | | 19,000
18,000 | | 419,000
637,000 |
| (1) | Represents base salary through April 30, 2008. |
| (2) | Represents the fair value of options granted on the grant date in accordance with SFAS 123(R). |
| (3) | Represents the matching contributions to the Hi-Tech Pharmacal Co., Inc. Employee Savings Plan and/or the dollar value of the premium paid by the Company for term life insurance for the benefit of the named executive officer and automobile reimbursement that were reported as taxable income. |
34
Grants of Plan-Based Awards
| | | | | | | | |
Name | | Grant Date | | All Other Option
Awards: Number
of Securities
Underlying
Options (#) (1) | | Exercise or
Base Price of
Option Awards
($/Sh) (2) | | Grant Date
Fair Value
of Stock
and Options
Awards (3) |
David S. Seltzer | | 1/29/08 | | 50,000 | | 10.68 | | 256,000 |
President, Chief Executive Officer, | | 2/2/07 | | 50,000 | | 10.68 | | 269,000 |
Secretary, and Treasurer | | | | | | | | |
William Peters | | 1/29/08 | | 25,000 | | 10.68 | | 128,000 |
Vice President and Chief Financial Officer | | 2/2/07 | | 25,000 | | 10.68 | | 134,500 |
| | 8/9/06 | | 25,000 | | 15.09 | | 191,500 |
| (1) | The amounts set forth in this column reflect the number of stock options granted under our 1992 Stock Option Plan as amended. The options vest at the rate of 25% per year starting on the first anniversary of the grant and expire in 10 years from the date of grant. |
| (2) | The exercise price equals the closing price of our common stock on the date of grant. |
| (3) | The dollar values of stock options disclosed in this column are equal to the aggregate grant date fair value computed in accordance with SFAS 123R, except no assumptions for forfeitures were included. |
Outstanding Equity Awards at Fiscal Year-End
| | | | | | | | | |
| | | Option Awards |
Name | | Number of
Securities
Underlying
Unexercised
Options (#)
Exercisable | | Number of
Securities
Underlying
Unexercised
Options (#)
Unexercisable | | Option Exercise
Price ($) | | Option
Expiration Date |
David S. Seltzer President, Chief Executive Officer, Secretary, and Treasurer | | 112,500 | | — | | $ | 1.64 | | 4/1/09 |
| | 112,500 | | — | | $ | 1.78 | | 6/1/10 |
| | 112,500 | | — | | $ | 3.84 | | 11/15/11 |
| | 112,500 | | — | | $ | 11.56 | | 1/14/13 |
| | 75,000 | | — | | $ | 14.99 | | 12/4/13 |
| | 56,250 | | 18,750 | | $ | 12.05 | | 2/1/15 |
| | 25,000 | | 25,000 | | $ | 23.98 | | 3/8/16 |
| | 12,500 | | 37,500 | | $ | 10.68 | | 2/2/17 |
| | — | | 50,000 | | $ | 10.68 | | 1/29/18 |
William Peters Vice President and Chief Financial Officer | | 15,000 | | — | | $ | 19.95 | | 9/9/13 |
| | 22,125 | | 9,375 | | $ | 10.13 | | 8/2/14 |
| | 18,750 | | 18,750 | | $ | 18.87 | | 8/1/15 |
| | 6,250 | | 18,750 | | $ | 15.09 | | 8/9/16 |
| | 6,250 | | 18,750 | | $ | 10.68 | | 2/2/17 |
| | — | | 25,000 | | $ | 10.68 | | 1/29/18 |
Options Exercises and Stock Vested
| | | | | | | | |
| | | Option Awards | | Stock Awards |
Name | | Number of Shares
Acquired on
Exercise (#) | | Value Realized on
Exercise ($) | | Number of Shares
Acquired on
Vesting (#) | | Value Realized
on Vesting ($) |
David S. Seltzer President, Chief Executive Officer, Secretary, and Treasurer | | 112,500 | | 852,000 | | 0 | | 0 |
William Peters Vice President and Chief Financial Officer | | 0 | | 0 | | 0 | | 0 |
The Company does not maintain a pension plan, or nonqualified deferred contribution or other nonqualified deferred compensation plans.
35
Involuntary Termination. Our employment contracts with Mr. David Seltzer and Mr. William Peters provide for severance pay and other payout amounts in the event that employment is terminated other than for cause or voluntary termination.
Mr. David Seltzer’s employment agreement provides that in the event of a termination of employment by the Company without cause, the Company shall pay to Mr. Seltzer his Base Salary up to the end of the month in which such termination occurs. The employment agreement further provides that in the event of Mr. Seltzer’s death or total disability, he will be paid his Base Salary for the remaining term of the agreement; provided, however, that in the case of a total disability, the Base Salary paid to Mr. Seltzer shall be reduced by any proceeds paid to Mr. Seltzer, his designee or estate, from a disability insurance policy owned by the Company. In addition, if Mr. Seltzer is terminated by the Company without cause or in the event of Mr. Seltzer’s death or total disability, he will also be paid an amount equal to the product of (i) the bonus for the year in which such termination, death or total disability occurred and (ii) a fraction, the numerator of which is the number of months during such year which Mr. Seltzer was employed by the Company through and including the month of his death, total disability or termination of employment, and the denominator of which is twelve.
If Mr. William Peters is terminated, or if he terminates his employment for Good Reason, as defined in his employment agreement, then the Company will pay to him the sum of (i) his salary for the greater of six (6) months or the balance of the term of his agreement and (ii) the pro rata portion of his annual bonus for the prior year. The severance shall be payable weekly. In addition, the Company will continue to keep in effect all health, insurance and welfare benefits for a period of the lesser of six months from the date of termination or until Mr. Peters obtains similar benefits from a new employer. Mr. Peters will not be entitled to severance if the Company gives six months advance written notice that a decision not to renew his agreement has been made by the company.
Change in Control. In the event of a change in control our employment contract with Mr. David Seltzer provides for severance pay equal to three years of the current base salary, the bonus declared payable to him for the preceding calendar year , the continuation of health care benefits for 24 months, the continuance of his automobile lease then in effect, but not more than 3 years, and provides appropriate outplacement services not to exceed $15,000. The payment of the severance and bonus shall be made as soon as practible after termination of employment, but in no event more than thirty days after termination
Our employment contract with Mr. William Peters provides in the event of a change in control for severance pay equal to 2 times the current base salary which equals the sum of (i) his annual salary on the day preceding the change in control, (ii) the annual bonus for the year immediately preceding the change in control. This amount will be made in a lump sum payment within 15 days after the change in control. All insurance and welfare payments will also continue for the lesser of one year or the eligibility of similar benefits from a new employer.
A “Change of Control” shall be deemed to occur upon the earliest to occur after the date of the Agreement of any of the following events:
(a)Acquisition of Stock by Third Party. Any Person (as hereinafter defined) is or becomes the Beneficial Owner (as hereinafter defined), directly or indirectly, of securities of the Company representing forty (40%) percent or more of the combined voting power of the Company’s then outstanding securities and such Person initiates actions to cause the Company to enter into a transaction or series of transactions with such Person or a third party without the prior consent or request of the Board of Directors;
(b)Change in Board of Directors. The date when Continuing Directors cease to be a majority of the Directors then in office, it being understood that it shall not be deemed a Change in Control as long as the majority of the Directors were nominated by the Continuing Directors;
(c)Corporate Transactions. The effective date of a merger or consolidation of the Company with any other entity, and with the power to elect at least a majority of the board of directors or other governing body of such surviving entity; and
36
(d)Liquidation. The approval by the shareholders of the Company of a complete liquidation of the Company or an agreement for the sale or disposition by the Company of all or substantially all of the Company’s assets.
37
Potential Payments Upon Termination of Employment or Change in Control
The following information and table set forth the amount of payments to each of our named executives in the event of a termination of employment as a result of involuntary termination and termination following a change in control.
Assumptions and General Principles. The following assumptions and general principles apply with respect to the following table and any termination of employment of a named executive:
| | • | | The amounts shown in the table assume that each named executive was terminated on April 30, 2008. Accordingly, the table reflects amounts earned as of April 30, 2008 and includes estimates of amounts that would be paid to the named executive upon the occurrence of a termination or change in control. The actual amounts to be paid to a named executive can only be determined at the time of the termination or change in control. |
| | • | | Because we have assumed an April 30, 2008 termination date, each of the named executives would have been entitled to receive 100% of the annual bonus payment made for fiscal year 2007 that was paid in fiscal 2008. If termination would occur in Fiscal 2008, the bonus amount would be the bonus amount that the Board determines to pay out for the year ended April 30, 2008. |
| | • | | A named executive may exercise any stock options that are exercisable prior to the date of termination and any payments related to these stock options are not included in the table because they are not severance payments. |
| | | | | | |
Involuntary Termination | | David
Seltzer | | William
Peters |
Prorated annual bonus compensation | | $ | 0 | | $ | 35,000 |
Cash severance payment | | | 1,328,000 | | | 303,000 |
Continued health care benefits and other | | | — | | | 12,000 |
| | | | | | |
Total | | $ | 1,328,000 | | $ | 350,000 |
| | | | | | |
Change in Control with Termination | | | | | | |
Prorated annual bonus compensation | | $ | 0 | | $ | 35,000 |
Cash severance payment | | | 1,246,000 | | | 485,000 |
Continued health care benefits and other | | | 82,000 | | $ | 23,000 |
| | | | | | |
Total | | $ | 1,328,000 | | $ | 543,000 |
| | | | | | |
Employment Agreements
David S. Seltzer — Chairman of the Board, President, Chief Executive Officer, Secretary and Treasurer
David S. Seltzer serves as Chairman of the Board since Bernard Seltzer retired the position in September, 2004. David S. Seltzer was elected to serve as President and Chief Executive Officer effective May 1, 1998. On March 28, 2007, Hi-Tech Pharmacal Co., Inc. (the “Company”) entered into an amended and restated executive employment agreement with David S. Seltzer pursuant to which Mr. Seltzer is to serve as President and Chief Executive Officer, effective May 1, 2007 through April 30, 2010. Mr. Seltzer received an annual base salary of $421,375 for the period May 1, 2007 through April 30, 2008 (“Base Salary”) and for each fiscal year thereafter during the term of the employment agreement, Mr. Seltzer will be paid a base salary equal to the sum of (a) the Base Salary for the immediately preceding fiscal year and (b) an amount determined by multiplying the Base Salary in effect for the immediately preceding fiscal year by five percent (5%). Mr. Seltzer may also receive a bonus during each year of employment which shall be determined in accordance with an Executive Bonus Plan to be adopted by management and approved by the Company’s Compensation Committee. Such Executive Bonus Plan may be based on the Company meeting certain fiscal goals and also taking into account, among other things, progress towards strategic objectives not fully measured by pre-tax net income. Mr. Seltzer shall be eligible to receive options to purchase a minimum amount of 50,000 shares of the Company’s common stock. The employment agreement provides that in the event of a termination of Mr. Seltzer’s employment by the Company without cause, the Company shall pay to Mr. Seltzer his Base Salary up to the end of the month in which such termination of employment occurs. The employment agreement further provides that in the event of Mr. Seltzer’s death or total disability, he will be paid his Base Salary for the remaining term of the agreement; provided, however, that in the case of a total disability, the Base Salary paid to Mr. Seltzer shall be reduced by any proceeds paid to Mr. Seltzer, his designee or estate, from a disability insurance policy owned by the Company. In addition, if Mr. Seltzer is terminated by the Company without cause or in the event of Mr. Seltzer’s death or total disability, he will also be paid
38
an amount equal to the product of (i) the bonus for the year in which such termination, death or total disability occurred and (ii) a fraction, the numerator of which is the number of months during such year which Mr. Seltzer was employed by the Company through and including the month of his death, total disability or termination of employment, and the denominator of which is twelve. The amended and restated employment agreement contains standard confidentiality provisions and indemnification provisions.
William Peters — Vice President and Chief Financial Officer
The Company has an employment agreement with William Peters, its Vice President and Chief Financial Officer which expires on July 31, 2009. On October 30, 2007 the Company entered into Amendment No. 1 to Mr. Peters’ employment agreement effective July 31, 2007. The agreement automatically renews for successive one-year terms. Annual base salary through July 31, 2008 is $242,550 and $254,668 through July 31, 2009. The agreement provides for annual bonuses to be determined in accordance with performance goals set by the Compensation Committee of the Board of Directors and the President of the Company. The Compensation Committee and the President set a target equal to or greater than 25% of Mr. Peters annual salary. The employment agreement provides for severance payments to Mr. Peters equal to (i) the sum of his salary for the greater of 6 months or the balance of the term of the agreement and (ii) the pro rata portion of his annual bonus for the prior year of his employment in the event of termination. In the event of a termination upon total disability, the Company will pay to Mr. Peters the salary which would otherwise be payable to him during the continuance of such disability. Such employment agreement contains standard confidentiality provisions. In the event of a change in control the Company will pay or cause its successor to pay to Mr. Peters in a cash lump sum an amount equal to 2 times his annual salary on the day preceeding the Change of Control plus his annual bonus for the year immediately preceding the Change of Control and health insurance and welfare benefits.
As described more fully below, this chart summarizes the annual cash compensation for the Company’s non-employee directors during fiscal year 2007.
Director Compensation
| | | | | | | | | | | |
Name | | Fees Earned
or Paid in
Cash ($) | | Stock
Awards
($) | | Option
Awards
($)(1) | | All Other
Compensation
($) | | | Total ($) |
Martin M. Goldwyn | | 8,000 | | -0- | | 54,000 | | | | | 62,000 |
Yashar Hirshaut, M.D. | | 8,000 | | -0- | | 59,000 | | | | | 67,000 |
Robert M. Holster | | 8,000 | | -0- | | 59,000 | | | | | 67,000 |
Anthony Puglisi | | 8,000 | | -0- | | 54,000 | | | | | 62,000 |
Reuben Seltzer | | 8,000 | | -0- | | 54,000 | | 254,000 | (2) | | 316,000 |
Bruce Simpson | | 8,000 | | -0- | | 59,000 | | | | | 67,000 |
| (1) | Represents the dollar values of stock options disclosed in this column are equal to the aggregate grant date fair value computed in accordance with SFAS 123(R), except no assumptions for forfeitures were included. A discussion of the assumptions used in calculating the grant date fair value is set forth in Note 12 of the Notes to Consolidated Financial Statements. |
| (2) | Represents non-employee compensation received by Mr. Reuben Seltzer for new business development and legal services. |
39
Stock Option Plans
The Amended and Restated Stock Option Plan (the “Plan”)
The Company’s Amended and Restated Stock Option Plan provides for a total of 4,857,000 shares of Common Stock authorized to be granted under such Plan. During Fiscal 2008, the Company granted options to purchase 268,000 shares of Common Stock at a weighted average exercise price of$10.68 per share. During Fiscal 2008, 43,000 options were cancelled or expired, and 557,000 shares are available for future grant under such Plan. The Company’s Plan provides for the grant of options to its key employees and directors in order to give such employees a greater personal interest in the success of the Company and an added incentive to continue and advance in their employment. The Company’s Plan provides for a fifteen year expiration period for non-statutory options and ten years for incentive stock options granted thereunder and allows for the exercise of options by delivery by the optionee of previously owned Common Stock of the Company having a fair market value equal to the option price, or by a combination of cash and Common Stock.
The Plan is administered by the Compensation Committee of the Board of Directors. The Committee has broad discretion in determining the recipients of options and numerous other terms and conditions of the options.
The exercise price for shares purchased upon the exercise of non-statutory options granted under the Plan is determined by the Compensation Committee as of the date of the grant.
The exercise price of an incentive stock option must be at least equal to the fair market value of the Common Stock on the date such option is granted (110% of the fair market value for shareholders who, at the time the option is granted, own more than 10% of the total combined classes of stock of the Company or any subsidiary). No employees may be granted incentive stock options in any year for shares having a fair market value, determined as of the date of grant, in excess of $100,000.
No incentive option may have a term of more than ten years (in the case of incentive stock options, five years for shareholders holding 10% or more of the Common Stock of the Company). Options generally may be exercised only if the option holder remains continuously associated with the Company or a subsidiary from the date of grant to the date of exercise. However, options may be exercised upon termination of employment or upon the death or disability of any employee within certain specified periods.
Directors Plan
The Company’s 1994 Directors Stock Option Plan (“Directors Plan”) provides for a total of 600,000 shares of Common Stock authorized to be granted under the Directors Plan.
The Directors Plan provides for the automatic annual grant of options to non-employee directors and is administered by the Board of Directors. Each non-employee director will be automatically granted 11,250 shares of Common Stock on the date of each annual meeting of the Company’s shareholders. A non-employee director who chairs the audit or other committees of the Board of Directors will be automatically granted annually an option to purchase an additional 1,125 shares of Common Stock.
To remain eligible, a non-employee director must continue to be a member of the Board of Directors. Each option granted is exercisable in increments of 25% per year commencing on the first anniversary date of the date of grant. The exercise price for all options may not be less than the fair market value of the Common Stock on the date of grant. Options under the Directors Plan have a term of 10 years and may be exercised for limited periods after a person ceases to serve as a director.
| ITEM 12. | SECURITY OWNERSHIP OF CERTAIN BENEFICIAL OWNERS AND MANAGEMENT AND RELATED STOCKHOLDER MATTERS. |
The following table identifies as of July 10, 2008 each person known to the Company to be the beneficial owner of more than five percent of the Company’s Common Stock, each director of the Company, and all directors and executive officers of the Company as a group, and sets forth the number of shares of the outstanding Common Stock beneficially owned by each such person and such group and the percentage of the shares of the outstanding Common Stock owned by each such person and such group. Except as noted below, the named person has sole voting power and sole investment power over the securities.
40
| | | | | | |
Name and Address of Beneficial Owner | | Amount and
Nature of
Beneficial
Ownership (1) | | | Percent of
Common
Stock | |
| | |
David S. Seltzer c/o Hi-Tech Pharmacal Co., Inc. 369 Bayview Avenue Amityville, New York 11701 | | 2,081,132 | (3) | | 17.3 | % |
| | |
Reuben Seltzer c/o Hi-Tech Pharmacal Co., Inc. 369 Bayview Avenue Amityville, New York 11701 | | 1,142,740 | (4) | | 9.8 | % |
| | |
Martin M. Goldwyn c/o Tashlik, Kreutzer, Goldwyn & Crandell P.C. 40 Cuttermill Road Great Neck, New York 11021 | | 59,308 | (5) | | * | |
| | |
Yashar Hirshaut, M.D. c/o Hi-Tech Pharmacal Co., Inc. 369 Bayview Avenue Amityville, New York 11701 | | 96,563 | (6) | | * | |
| | |
Robert M. Holster c/o Hi-Tech Pharmacal Co., Inc. 369 Bayview Avenue Amityville, New York 11701 | | 53,813 | (7) | | * | |
| | |
William Peters c/o Hi-Tech Pharmacal Co., Inc. 369 Bayview Avenue Amityville, New York 11701 | | 93,375 | (8) | | * | |
| | |
Anthony J. Puglisi c/o Hi-Tech Pharmacal Co., Inc. 369 Bayview Avenue Amityville, New York 11701 | | 19,688 | (9) | | * | |
| | |
Bruce W. Simpson c/o Hi-Tech Pharmacal Co., Inc. 369 Bayview Avenue Amityville, New York 11701 | | 18,351 | (10) | | * | |
| | |
All Directors and Executive Officers as a group (8 persons) | | 3,564,970 | (11) | | 28.4 | % |
| | |
Columbia Management Advisors, Inc. 100 Federal Street 21th Floor Boston, MA 02110-1898 | | 1,053,195 | (12) | | 9.2 | % |
| | |
Dimensional Fund Advisors Inc. 1299 Ocean Avenue 11th Floor Santa Monica, CA 90401 | | 806,036 | (12) | | 7.1 | % |
| | |
Accipter Capital Management LLC 399 Park Avenue 38th Floor New York, NY 10022-8113 | | 723,639 | (12) | | 6.3 | % |
| | |
Roark, Rearden & Hamot LLC 420 Boylston St. Boston, MA 02116 | | 709,620 | (12) | | 6.2 | % |
| | |
Royce & Associates LLC 1414 Avenue of the Americas 9th floor New York, NY 10019-2578 | | 648,830 | (12) | | 5.7 | % |
| | | | | | |
The Estate of Bernard Seltzer c/o Hi-Tech Pharmacal Co., Inc. 369 Bayview Avenue Amityville, New York 11701 | | 590,147 | (2) | | 5.1 | % |
41
| * | Amount represents less than 1% of Common Stock including shares issuable to such beneficial owner under options which are presently exercisable or will become exercisable within 60 days. |
| (1) | Unless otherwise indicated, each person has sole voting and investment power with respect to the shares shown as beneficially owned by such person. |
| (2) | Amount includes 121,875 shares of Common Stock exercisable within 60 days of July 10, 2008. |
| (3) | Amount includes options to purchase 618,750 shares of Common Stock exercisable within 60 days of July 10, 2008 and 215,252 shares of Common Stock owned by Mr. Seltzer’s wife and children and a trust for the benefit of one of his children. |
| (4) | Amount includes options to purchase 232,875 shares of Common Stock exercisable within 60 days of July 10, 2008 and 336,225 shares of Common Stock owned by Mr. Seltzer’s wife and children. |
| (5) | Amount includes options to purchase 59,308 shares of Common Stock exercisable within 60 days of July 10, 2008. |
| (6) | Amount represents options to purchase 74,563 shares of Common Stock exercisable within 60 days of July 10, 2008. |
| (7) | Amount represents options to purchase 53,813 shares of Common Stock exercisable within 60 days of July 10, 2008. |
| (8) | Amount includes options to purchase 93,375 shares of Common Stock exercisable within 60 days of July 10, 2008. |
| (9) | Amount includes options to purchase 19,688 shares of Common Stock exercisable within 60 days of July 10, 2008. |
| (10) | Amount includes options to purchase 18,351 shares of Common Stock exercisable within 60 days of July 10, 2008. |
| (11) | Amount includes options to purchase 1,170,721 shares of Common Stock exercisable within 60 days of July 10, 2008. |
| (12) | Source: 13F Form filings March 31, 2008 |
| ITEM 13. | CERTAIN RELATIONSHIPS AND RELATED TRANSACTIONS AND DIRECTOR INDEPENDENCE. |
For the fiscal year ended April 30, 2008, Mr. Reuben Seltzer was engaged by the Company to provide new business development and legal services. For such services, Mr. Reuben Seltzer received $254,000. Mr. Reuben Seltzer is a director of the Company and the brother of David Seltzer, the Company’s President.
The Company and Reuben Seltzer have a 17.7% and 17.7% interest, respectively, in Marco Hi-Tech JV LLC, a New York limited liability company (“Marco Hi-Tech”), which markets raw materials for nutraceutical products. Additionally, the Company has an investment in an available for sale security, Neuro-Hitech, Inc. of which Reuben Seltzer is a shareholder. The Company has a 9% interest in Neuro-Hitech, Inc.
The Company is jointly developing a generic product outside of its area of expertise with EMET Pharmaceuticals (“EMET”), previously known as XCell Pharmaceuticals, and another company. Reuben Seltzer is a principal of EMET. During the fiscal year, the Company spent approximately $1,591,000 on this project, which was included in research and development expense.
The Company has adopted a policy for approval of transactions between the Company and its directors, director nominees, executive officers, greater than 5% beneficial owners and their respective immediate family members. The policy is not in writing and the Committee has not adopted any pre-approvals under the policy. The related parties transaction described above is subject to, and has been approved and ratified, under this policy.
The policy provides that the Audit Committee reviews all related party transactions subject to the policy and determines whether or not to approve or ratify those transactions. In doing so, the Audit Committee takes into account, among other factors it deems appropriate, whether the transaction is on terms that are no less favorable to the Company than terms generally available to an unaffiliated third party under the same or similar circumstances and the extent of the related party’s interest in the transaction. A summary of any new transactions is provided to the Board for its review in connection with each regularly scheduled Committee meeting.
The Company believes that material affiliated transactions between the Company and its directors, officers, principal stockholders or any affiliates thereof have been, and will be in the future, on terms no less favorable than could be obtained from unaffiliated third parties.
42
Tashlik, Kreutzer, Goldwyn & Crandell P.C. received $256,000 in legal fees for services performed for the Company during the Company’s fiscal year ended April 30, 2008. Mr. Martin M. Goldwyn, a member of such firm, is a director of the Company.
| ITEM 14. | PRINCIPAL ACCOUNTANT FEES AND SERVICES |
Audit Fees
Eisner LLP has served as the auditors for the Company for the fiscal year ended April 30, 2008. Eisner LLP has billed or is expected to bill us $370,000 and $345,000, in the aggregate, for professional services for the audit of our annual financial statements and audit of the Company’s internal controls in compliance with the Sarbanes-Oxley Act of 2002 for fiscal 2008 and 2007, respectively, and for the review of our interim financial statements which are included in our quarterly reports on Form 10-Q for fiscal 2008.
Audit Related Fees
Eisner LLP has billed or is expected to bill us $55,000 and $21,000 for other audit-related fees for fiscal 2008 and 2007, respectively. Other audit-related fees related primarily to services rendered in connection with our filing of registration statements with the SEC and due diligence in connection with potential acquisitions and accounting consultations.
Tax Fees
Eisner LLP has billed or is expected to bill us $56,000 and $36,000 for fiscal 2008 and 2007, respectively, for tax services including tax compliance.
All Other Fees
The Company did not engage Eisner LLP for professional services other than those services captioned “Audit Fees”, “Audit Related Fees”, “Tax Fees” and “Financial Information Systems Design and Implementation Fees” in fiscal 2008
All non-audit services were reviewed with the Audit Committee, which concluded that the provision of such services by Eisner LLP was compatible with the maintenance of that firm’s independence in the conduct of its auditing function.
Financial Information Systems Design and Implementation Fees
Eisner LLP did not provide and did not bill nor was paid any fees for financial information systems design and implementation services in fiscal 2008 and 2007 as described in paragraph (c)(4)(ii) of Rule 2-01 of Regulation S-X.
Policy on Audit Pre-Approval of Audit and Permissible Non-Audit Services of Independent Auditor
Consistent with SEC policies regarding auditor independence, the Audit Committee has responsibility for appointing, setting compensation and overseeing the work of the independent auditor. In recognition of this responsibility, the Audit Committee has established a policy to pre-approve all audit and permissible non-audit services provided by the independent auditor.
Prior to engagement of the independent auditor for the next year’s audit, management will submit a list of services and related fees expected to be rendered during that year within each of four categories of services to the Audit Committee for approval.
1.Audit services include audit and review work performed on the financial statements, as well as work that generally only the independent auditor can reasonably be expected to provide, including comfort letters, statutory audits, and discussions surrounding the proper application of financial accounting and/or reporting standards.
2.Audit-Related services are for assurance and related services that are traditionally performed by the independent auditor, including due diligence related to mergers and acquisitions, employee benefit plan audits, and special procedures required to meet certain regulatory requirements.
3.Tax services include all services, except those services specifically related to the audit of the financial statements, performed by the independent auditor’s tax personnel, including tax analysis; assisting with coordination of execution of tax related activities, primarily in the area of corporate development; supporting other tax related regulatory requirements; and tax compliance and reporting.
43
4.Other Fees are those associated with services not captured in the other categories. The Company generally does not request such services from the independent auditor.
Prior to engagement, the Audit Committee pre-approves independent auditor services within each category. The fees are budgeted and the Audit Committee requires the independent auditor and management to report actual fees versus the budget periodically throughout the year by category of service. During the year, circumstances may arise when it may become necessary to engage the independent auditor for additional services not contemplated in the original pre-approval categories. In those instances, the Audit Committee requires specific pre-approval before engaging the independent auditor.
The Audit Committee may delegate pre-approval authority to one or more of its members. The member to whom such authority is delegated must report, for informational purposes only, any pre-approval decisions to the Audit Committee at its next scheduled meeting.
44
| ITEM 15. | EXHIBITS, FINANCIAL STATEMENT SCHEDULES AND REPORTS ON FORM 8-K. |
| (a) | (1) Financial Statements filed as part of this Report are listed in Item 8 of this Report. |
(2) No other financial schedules have been included because they are not applicable, not required or because required information is included in the consolidated financial statements or notes thereto.
| | | | | |
(a) Exhibit
Number | | Description of Document | | Page Number
Foot-Notes | |
| 3.1 | | Certificate of Amendment to the Certificate of Incorporation | | (1 | ) |
| | |
| 3.2 | | Restated Certificate of Incorporation and By-Laws | | (2 | ) |
| | |
| 4.3 | | Copy of Hi-Tech Pharmacal Co., Inc. Stock Option Plan | | (3 | ) |
| | |
| 4.4 | | Copy of Hi-Tech Pharmacal Co., Inc. Stock Option Agreement | | (4 | ) |
| | |
| 4.5 | | Copy of 1994 Directors Stock Option Plan | | (5 | ) |
| | |
| 10.1 | | Amended and Restated Executive Employment Agreement with David S. Seltzer | | (6 | ) |
| | |
| 10.2 | | Amendment No. 1 to Amended and Restated Executive Employment Agreement of David Seltzer | | (7 | ) |
| | |
| 10.3 | | Employment Agreement of William Peters | | (8 | ) |
| | |
| 10.4 | | Amendment No.1 to Employment Agreement of William Peters | | (9 | ) |
| | |
| 10.5 | | Revolving Credit and Term Loan Agreement, dated October 23, 2002. Confidential Treatment was granted for portions of this Agreement. | | (10 | ) |
| | |
| 10.6 | | First Amendment to the Revolving Credit and Term Loan Agreement dated November 1, 2002. Confidential Treatment has been requested for portions of this agreement. | | (11 | ) |
| | |
| 10.7 | | Second Amendment to the Revolving Credit and Term Loan Agreement dated November 15, 2002. Confidential Treatment was granted for portions of this agreement. | | (12 | ) |
| | |
| 10.8 | | Third Amendment to the Revolving Credit and Term Loan Agreement dated October 21, 2005. | | (13 | ) |
| | |
| *10.9 | | Fourth Amendment and waiver to Revolving Credit and Term Loan Agreement executed April 22, 2008. | | | |
| | |
| 14.1 | | Code of Ethics | | (14 | ) |
| | |
| *23.1 | | Consent of Eisner LLP | | | |
| | |
| *31.1 | | Certification pursuant to Rule 13a-14 or 15d-14 of the Securities Exchange Act of 1934, as adopted pursuant to Section 302 of the Sarbanes-Oxley Act of 2002. | | | |
| | |
| *31.2 | | Certification pursuant to Rule 13a-14 or 15d-14 of the Securities Exchange Act of 1934, as adopted pursuant to Section 302 of the Sarbanes-Oxley Act of 2002. | | | |
| | |
| *32.1 | | Certification of Chief Executive Officer and Chief Financial Officer pursuant to 18 U.S.C. Section 1350, as adopted pursuant to Section 906 of the Sarbanes-Oxley Act of 2002. | | | |
| (1) | Filed as Exhibit 3.1 to Hi-Tech Pharmacal Co., Inc. Annual Report on Form 10-K for the fiscal year ended April��30, 2003 and incorporated herein by reference. |
| (2) | Filed as Exhibit 3.0 to Hi-Tech Pharmacal Co., Inc. Quarterly Report on Form 10-Q for the quarterly period ended October 31, 1994 and incorporated herein by reference. |
| (3) | Filed as Exhibit 10.1 to Hi-Tech Pharmacal Co., Inc. Registration Statement on Form S-1 (No. 33-47860) and incorporated herein by reference. |
| (4) | Filed as Exhibit 10.2 to Hi-Tech Pharmacal Co., Inc. Registration Statement on Form S-1 (No. 33-47860) and incorporated herein by reference. |
| (5) | Filed as Exhibit 10.1 to Hi-Tech Pharmacal Co., Inc. Quarterly Report on Form 10-Q for the quarterly period ended October 31, 1994 and incorporated herein by reference. |
| (6) | Filed as Exhibit 10.1 to Hi-Tech Pharmacal Co., Inc. Annual Report on Form 10-K for the fiscal year ended April 30, 2007 and incorporated herein by reference. |
| (7) | Filed as Exhibit 10.2 to Hi-Tech Pharmacal Co., Inc. Annual Report on Form 10-K for the fiscal year ended April 30, 2007 and incorporated herein by reference. |
45
| (8) | Filed as Exhibit 10.8 to Hi-Tech Pharmacal Co., Inc. Quarterly Report on Form 10-Q for quarterly period ended July 31, 2005 and incorporated herein by reference. |
| (9) | Filed as Exhibit 99.1 to Hi-Tech Pharmacal Co., Inc. Current Report on Form 8-K dated October 30, 2007, filed on October 5, 2007 and incorporated herein by reference. |
| (10) | Filed as Exhibit 10.7 to Hi-Tech Pharmacal Co., Inc. Quarterly Report on Form 10-Q for quarterly period ended October 31, 2002 and incorporated herein by reference. |
| (11) | Filed as Exhibit 10.8 to Hi-Tech Pharmacal Co., Inc. Quarterly Report on Form 10-Q for quarterly period ended October 31, 2002 and incorporated herein by reference. |
| (12) | Filed as Exhibit 10.9 to Hi-Tech Pharmacal Co., Inc. Quarterly Report on Form 10-Q for quarterly period ended October 31, 2002 and incorporated herein by reference. |
| (13) | Filed as Exhibit 10.7 to Hi-Tech Pharmacal Co., Inc. Annual Report on Form 10-K for quarterly period ended April 30, 2008 and incorporated herein by reference. |
| (14) | Filled as Exhibit 14.1 to Hi-Tech Pharmacal Co., Inc. Annual Report on Form 10-K for fiscal year ended April 30, 2008 and incorporated herein by reference. |
46
SIGNATURES
Pursuant to the requirements of Section 13 or 15(d) of the Securities Exchange Act of 1934, the Registrant caused this report to be signed on its behalf by the undersigned, thereunto duly authorized.
| | | | |
| Dated: July 14, 2008 | | HI-TECH PHARMACAL CO., INC. By: |
| | |
| | By: | | /s/ David S. Seltzer |
| | | | David S. Seltzer, Chief Executive Officer, President, Secretary & Treasurer |
| | |
| | By: | | /s/ William Peters |
| | | | William Peters Chief Financial Officer |
Pursuant to the requirements of the Securities Exchange Act of 1934, this Report has been signed below by the following persons on behalf of the Registrant and in the capacities and on the dates indicated.
| | |
/s/ David S. Seltzer | | July 14, 2008 |
David S. Seltzer, Chairman of the Board, Chief Executive Officer,
President, Treasurer, Secretary | | |
| |
/s/ Reuben Seltzer | | July 14, 2008 |
| Reuben Seltzer, Director | | |
| |
/s/ Martin M. Goldwyn | | July 14, 2008 |
| Martin M. Goldwyn, Director | | |
| |
/s/ Yashar Hirshaut, M.D. | | July 14, 2008 |
| Yashar Hirshaut, M.D., Director | | |
| |
/s/ Robert M. Holster | | July 14, 2008 |
| Robert M. Holster, Director | | |
| |
/s/ Anthony J. Puglisi | | July 14, 2008 |
| Anthony J. Puglisi, Director | | |
| |
/s/ Bruce W. Simpson | | July 14, 2008 |
| Bruce W. Simpson, Director | | |
47