UNITED STATES
SECURITIES AND EXCHANGE COMMISSION
Washington, D.C. 20549
FORM 10-K
| þ | ANNUAL REPORT PURSUANT TO SECTION 13 OR 15(d) OF THE SECURITIES EXCHANGE ACT OF 1934 |
For the fiscal year ended December 31, 2007 |
| or |
| o | TRANSITION REPORT PURSUANT TO SECTION 13 OR 15(d) OF THE SECURITIES EXCHANGE ACT OF 1934 |
| For the transition period from ___________ to ___________ |
Commission file number 0-20908
PREMIER FINANCIAL BANCORP, INC.
(Exact name of registrant as specified in its charter)
| Kentucky | 61-1206757 | |
| (State or other jurisdiction of incorporation organization) | (I.R.S. Employer Identification No.) | |
2883 Fifth Avenue Huntington, West Virginia | 25702 | |
| (Address of principal executive offices) | (Zip Code) | |
Registrant’s telephone number (304) 525-1600 | ||
Securities registered pursuant to Section 12(b) of the Act:
| Title of each class | Name of exchange on which registered | |
| Common Stock without par value | NASDAQ:GMS |
Securities registered pursuant to Section 12(g) of the Act: NONE
Indicate by check mark if the registrant is a well-known seasoned issuer, as defined in Rule 405 of the Securities Act. Yes o No þ.
Indicate by check mark if the registrant is not required to file reports pursuant to Section 13 or Section 15(d) of the Exchange Act Yes o No þ.
Indicate by check mark whether the registrant (1) has filed all reports required to be filed by Section 13 or 15(d) of the Securities Exchange Act of 1934 during the preceding 12 months (or for such shorter period that the registrant was required to file such reports), and (2) has been subject to filing requirements for the past 90 days. Yes þ No o.
Indicate by check mark if disclosure of delinquent filers pursuant to Item 405 of Regulation S-K is not contained herein, and will not be contained, to the best of registrant's knowledge, in definitive proxy or information statements incorporated by reference in Part III of this 10-K or any amendment to this Form 10-K. o
PREMIER FINANCIAL BANCORP, INC.
FORM 10-K
December 31, 2007
Indicate by check mark whether the registrant is a large accelerated filer, an accelerated filer, a non-accelerated filer, or a smaller reporting company. See the definitions of “large accelerated filer”, “accelerated filer” and “smaller reporting company” in Rule 12b-2 of the Exchange Act. (Check one):
Large accelerated filer o. | Accelerated filer o. | Non-accelerated filer o. | Smaller reporting company þ |
Indicate by check mark whether the registrant is a shell company (as defined in Rule 12b-2 of the Exchange Act). Yes o No þ.
As of June 30, 2007, the aggregate market value of the registrant’s common stock held by non-affiliates of the registrant was $73,110,473 based on the closing sale price as reported on the National Association of Securities Dealers Automated Quotation System National Market System.
Indicate the number of shares outstanding of each of the issuer’s classes of common stock, as of the latest practicable date.
| Title of each class | Outstanding at March 15, 2008 | |
| Common Stock without par value | 5,237,899 |
DOCUMENTS INCORPORATED BY REFERENCE
| Document | Parts Into Which Incorporated | |
| Proxy Statement for the Annual Meeting of Shareholders to be held on June 18, 2008. | Part III |
| TABLE OF CONTENTS | ||||
| PART I | ||||
Item 1. | 4 | |||
Item 1A. | 14 | |||
Item 1B. | 20 | |||
Item 2. | 20 | |||
Item 3. | 20 | |||
Item 4. | 20 | |||
| PART II | ||||
Item 5. | 21 | |||
Item 6. | 24 | |||
Item 7. | 26 | |||
Item 7A. | 50 | |||
Item 8. | 64 | |||
| 66 | ||||
| 67 | ||||
| 68 | ||||
| 69 | ||||
| 70 | ||||
| 71 | ||||
| 73 | ||||
Item 9. | 104 | |||
Item 9A(T). | 104 | |||
Item 9B. | 105 | |||
| PART III | ||||
Item 10. | 106 | |||
Item 11. | 106 | |||
Item 12. | 106 | |||
Item 13. | 106 | |||
Item 14. | 106 | |||
| PART IV | ||||
Item 15. | 107 | |||
| 110 | ||||
PREMIER FINANCIAL BANCORP, INC.
FORM 10-K
December 31, 2007
PART I
THE COMPANY
Premier Financial Bancorp, Inc. (the "Company" or "Premier") is a multi-bank holding company that, as of March 15, 2008 operates nine banking offices in Kentucky, three banking offices in Ohio, and seven banking offices in West Virginia. At December 31, 2007, Premier had total consolidated assets of $549.3 million, total consolidated deposits of $449.0 million and total consolidated shareholders' equity of $67.4 million. The banking subsidiaries (the "Banks" or "Affiliate Banks") consist of Citizens Deposit Bank & Trust, Vanceburg, Kentucky; Farmers Deposit Bank, Eminence, Kentucky; Ohio River Bank, Ironton, Ohio; First Central Bank, Inc., Philippi, West Virginia; and Boone County Bank, Inc., Madison, West Virginia.
Premier was incorporated as a Kentucky corporation in 1991 and has functioned as a bank holding company since its formation. During 2002, Premier moved its principal executive offices from Georgetown, Kentucky to its present location at 2883 5th Avenue, Huntington, West Virginia, 25702. The purpose of the move was to be more centrally located among Premier's Affiliate Banks and its directorship. Premier's telephone number is (304) 525-1600.
Premier is a legal entity separate and distinct from its Affiliate Banks and non-bank subsidiaries. Accordingly, the right of Premier, and thus the right of Premier's creditors and shareholders, to participate in any distribution of the assets or earnings of any of the Affiliate Banks or non-bank subsidiaries is necessarily subject to the prior claims of creditors of such subsidiaries, except to the extent that claims of Premier, in its capacity as a creditor, may be recognized. The principal source of Premier's revenue is dividends from its Affiliate Banks and non-bank subsidiary. See "REGULATORY MATTERS -- Dividend Restrictions" for discussion of the restrictions on the Affiliate Banks' ability to pay dividends to Premier.
In 2000 Premier suspended its acquisition strategy in order to focus on improving operations, strengthening capital and management oversight and improving the profitability of the banks previously acquired. While Premier remains committed to its core strategy of rural banking with community oriented and locally named institutions, the Company may dispose of additional corporate assets that no longer meet Premier's geographic or operational performance goals. Effective January 3, 2005, Premier merged two of its subsidiary banks, Citizens Deposit Bank & Trust in Vanceburg, Kentucky and Bank of Germantown, in Germantown, Kentucky. Bank of Germantown was merged into Citizens Deposit Bank, with its facilities continuing to operate as branches of Citizens Deposit Bank.
PREMIER FINANCIAL BANCORP, INC.
FORM 10-K
December 31, 2007
In the fourth quarter of 2003, the Company adopted and began to implement a plan to sell its subsidiary Citizens Bank (Kentucky), Inc. ("Citizens Bank") located in Georgetown, Kentucky. On February 13, 2004, the Company announced that it had signed a definitive agreement to sell Citizens Bank in a cash transaction valued at approximately $14,500,000, and on July 1, 2004 the sale transaction closed. In accordance with Financial Accounting Standard 144, "Accounting for the Impairment or Disposal of Long-lived Assets", which became effective for the Company on January 1, 2002, the financial position and results of operations of Citizens Bank are removed from the detail line items in the Company's financial statements and presented separately as "discontinued operations."
Beginning in April 2005 and concluding in July 2005, the Company converted each of its Affiliate Banks from an in-house system administered by a wholly-owned subsidiary to an outsourced system administered by FiServ for their data and item processing functions. Subsequent to the conversion, the operations of the Company’s data processing subsidiary, Premier Data Services, Inc. were suspended and the subsidiary was merged into the Company on June 27, 2006.
In 2007, the Company resumed its strategy to acquire and own community banks. On October 24, 2007, the Company entered into a material definitive agreement with Citizens First Bank, Inc. (Citizens First), a bank with $60 million of total assets located in Ravenswood, West Virginia. Under terms of the definitive agreement, Premier will purchase Citizens First for up to $11,700,000 in stock and cash. Each share of Citizens First common stock will be entitled to merger consideration of cash and stock that will generally total $29.25, subject to certain limitations. Premier will issue 480,000 shares of its common stock plus, depending upon Premier’s stock price nearer to transaction closing, Premier will pay in total up to $5.3 million in cash to the shareholders of Citizens First. The transaction, which still requires approval by Citizens First’s shareholders, is anticipated to close sometime in the second quarter of 2008.
On November 27, 2007, the Company entered into a material definitive agreement with Traders Bankshares, Inc. (Traders), a single bank holding company with $105 million of total assets located in Spencer, West Virginia. Under terms of the definitive agreement, Premier will purchase Traders for approximately $18,140,000 in stock and cash. Each share of Traders common stock will be entitled to merger consideration of $50.00 cash and 3.75 shares of Premier common stock, subject to certain limitations. Premier will issue approximately 675,000 shares of its common stock to the shareholders of Traders. The transaction, which still requires approval by Traders’ shareholders, is anticipated to close sometime in the second quarter of 2008.
PREMIER FINANCIAL BANCORP, INC.
FORM 10-K
December 31, 2007
BUSINESS
General
Through the Banks the Company focuses on providing quality, community banking services to individuals and small-to-medium sized businesses primarily in non-urban areas. By seeking to provide such banking services in non-urban areas, the Company believes that it can minimize the competitive effect of larger financial institutions that typically are focused on large metropolitan areas. Each Bank retains its local management structure which offers customers direct access to the Bank's president and other officers in an environment conducive to friendly, informed and courteous service. This approach also enables each Bank to offer local and timely decision-making, and flexible and reasonable operating procedures and credit policies limited only by a framework of centralized risk controls provided by the Company to promote prudent banking practices. See additional discussion under "Regulatory Matters" below.
Each Bank maintains its community orientation by, among other things, having selected members of its community as members of its board of directors, who assist in the introduction of prospective customers to the Bank and in the development or modification of products and services to meet customer needs. As a result of the development of personal banking relationships with its customers and the convenience and service offered by the Banks, the Banks' lending and investing activities are funded primarily by core deposits.
When appropriate and economically advantageous, the Company centralizes certain of the Banks' back office, support and investment functions in order to achieve consistency and cost efficiency in the delivery of products and services. The Company centrally provides services such as accounting, loan review, operations and network support, human resources, compliance and internal auditing to the Banks to enhance their ability to compete effectively. The Company also provides overall direction in the areas of credit policy and administration, strategic planning, marketing, investment portfolio management and other financial and administrative services. Each Bank participates in product development by advising management of new products and services needed by its customers and desirable changes to existing products and services.
Prior to the conversions in mid 2005, the Company's data processing subsidiary, Premier Data Services, Inc., provided centralized data processing services to four of the Banks. Beginning in late 2004 and continuing through the middle of 2005, the Company converted its data processing system to an external third-party provider. Through the conversion process, Company senior management along with each Bank's management reviewed and standardized their offering of products and services, although pricing decisions remain at the local Bank level. Furthermore, as a result of conversion, the Company through the Banks is able offer more modern products, such as internet banking and check imaging, and will be well positioned to take advantage of emerging technologies such as image exchange to clear items.
PREMIER FINANCIAL BANCORP, INC.
FORM 10-K
December 31, 2007
Each of the Banks provides a wide range of retail and commercial banking services, including commercial, real estate, agricultural and consumer lending; depository and funds transfer services; collections; safe deposit boxes; cash management services; and other services tailored for both individuals and businesses.
The Banks' residential mortgage lending activities consist primarily of loans for purchasing personal residences or loans for commercial or consumer purposes secured by residential mortgages. The Banks also originate residential mortgage loans that are sold in the secondary mortgage market. Consumer lending activities consist of traditional forms of financing for automobile and personal loans including unsecured lines of credit. Commercial lending activities include loans to small businesses located primarily in the communities in which the Banks are located and surrounding areas. Commercial loans are secured by business assets including real estate, equipment, inventory, and accounts receivable. Some commercial loans are unsecured.
The Banks' range of deposit services includes checking accounts, NOW accounts, savings accounts, money market accounts, club accounts, individual retirement accounts, certificates of deposit and overdraft protection. Customers can access their accounts via traditional bank branch locations as well as Automated Teller Machines (ATM’s) and the internet. The Banks also offer bill payment and telephone banking services. Deposits of the Banks are insured by the Bank Insurance Fund administered by the FDIC.
Competition
The Banks encounter strong competition both in making loans and attracting deposits. The deregulation of the banking industry and the widespread enactment of state laws that permit multi-bank holding companies as well as the availability of nationwide interstate banking have created a highly competitive environment for financial services providers. In one or more aspects of its business, each Bank competes with other commercial banks, savings and loan associations, credit unions, finance companies, mutual funds, insurance companies, brokerage and investment banking companies and other financial intermediaries operating in its market and elsewhere, many of which have substantially greater financial and managerial resources. While the Banks are smaller financial institutions, each of the Banks' competitors include large bank holding companies having substantially greater resources and offering certain services that Premier Banks may not currently provide. Each Bank seeks to minimize the competitive effect of larger financial institutions through a community banking approach that emphasizes direct customer access to the Bank's president and other officers in an environment conducive to friendly, informed and courteous service.
PREMIER FINANCIAL BANCORP, INC.
FORM 10-K
December 31, 2007
Management believes that each Bank is positioned to compete successfully in its respective primary market area, although no assurances as to ongoing competitiveness can be given. Competition among financial institutions is based upon interest rates offered on deposit accounts, service charges on deposit accounts for various services related to customer convenience, interest rates charged on loans and other credit, the quality and scope of the services rendered, the convenience of the banking facilities and, in the case of loans to commercial borrowers, relative lending limits. Management believes that the commitment of its Banks to personal service, innovation and involvement in their respective communities and primary market areas, as well as their commitment to quality community banking service, are factors that contribute to their competitiveness.
Regulatory Matters
The following discussion sets forth certain elements of the regulatory framework applicable to bank holding companies and their subsidiaries and provides certain specific information relevant to Premier. This regulatory framework is intended primarily for the protection of depositors and the federal deposit insurance funds and not for the protection of the holders of securities, including Premier common shares. To the extent that the following information describes statutory or regulatory provisions, it is qualified in its entirety by reference to those provisions. A change in the statutes, regulations or regulatory policies applicable to Premier or its subsidiaries may have a material effect on the business of Premier.
General - - As a bank holding company, Premier is subject to regulation under the Bank Holding Company Act ("BHC Act"), and to inspection, examination and supervision by the Board of Governors of the Federal Reserve System ("Federal Reserve"). Under the BHC Act, bank holding companies generally may not acquire ownership or control of more than 5% of the voting shares or substantially all the assets of any company, including a bank, without the Federal Reserve's prior approval. Similarly, bank holding companies generally may not acquire ownership or control of a savings association without the prior approval of the Federal Reserve. Further, branching by the Affiliate Banks is subject to the jurisdiction, and requires the approval of each Affiliate Bank's primary federal banking regulator and, if the Affiliate Bank is a state-chartered bank, the appropriate state banking regulator.
Under the BHC Act, the Federal Reserve has the authority to require a bank holding company to terminate any activity or relinquish control of the nonbank subsidiary (other than a nonbank subsidiary of a bank) upon the Federal Reserve's determination that such activity or control constitutes a risk to the financial soundness and stability of any bank subsidiary of the bank holding company. Premier and the Affiliate Banks are subject to the Federal Reserve Act, which limits borrowings by Premier and its nonbank subsidiaries from the Affiliate Banks and also limits various other transactions between Premier and its nonbank subsidiaries with the Affiliate Banks.
PREMIER FINANCIAL BANCORP, INC.
FORM 10-K
December 31, 2007
The two Affiliate Banks chartered in Kentucky are supervised, regulated and examined by the Kentucky Department of Financial Institutions, the Affiliate Bank chartered in Ohio is supervised, regulated and examined by the Ohio Division of Financial Institutions, and the two Affiliate Banks chartered in West Virginia are supervised, regulated and examined by the West Virginia Division of Banking. In addition, those Affiliate Banks that are members of the Federal Reserve System are supervised and regulated by the Federal Reserve, and those banks that are not members of the Federal Reserve System are supervised and regulated by the Federal Deposit Insurance Corporation ("FDIC"). Each banking regulator has the authority to issue cease-and-desist orders if it determines that the activities of a bank regularly represent an unsafe and unsound banking practice or a violation of law.
Both federal and state law extensively regulates various aspects of the banking business, such as reserve and capital requirements, truth-in-lending and truth-in-savings disclosure, equal credit opportunity, fair credit reporting, trading in securities and other aspects of banking operations. Premier, the Affiliate Banks and Premier's nonbank subsidiary are also affected by the fiscal and monetary policies of the federal government and the Federal Reserve and by various other governmental laws, regulations and requirements. Further, the earnings of Premier and Affiliate Banks are affected by general economic conditions and prevailing interest rates. Legislation and administrative actions affecting the banking industry are frequently considered by the United States Congress, state legislatures and various regulatory agencies. It is not possible to predict with certainty whether such legislation or administrative actions will be enacted or the extent to which the banking industry, in general, or Premier and the Affiliate Banks, in particular, would be affected.
Liability for Bank Subsidiaries - The Federal Reserve has a policy to the effect that a bank holding company is expected to act as a source of financial and managerial strength to each of its subsidiary banks and to maintain resources adequate to support each such subsidiary bank. This support may be required at times when Premier may not have the resources to provide it. In the event of a bank holding company's bankruptcy, any commitment by the bank holding company to a federal bank regulatory agency to maintain the capital of a subsidiary bank would be assumed by the bankruptcy trustee and entitled to priority of payment.
Any depository institution insured by the FDIC may be held liable for any loss incurred, or reasonably expected to be incurred, by the FDIC in connection with (i) the default of a commonly controlled FDIC-insured depository institution, or (ii) any assistance provided by the FDIC to a commonly controlled FDIC-insured depository institution in danger of default. "Default" is defined generally as the appointment of a conservator or receiver and "in danger of default" is defined generally as the existence of certain conditions indicating that a "default" is likely to occur in the absence of regulatory assistance. In the event that such a default occurred with respect to a bank, any loans to the bank from its parent holding company will be subordinate in right of payment of the bank's depositors and certain of its other obligations.
PREMIER FINANCIAL BANCORP, INC.
FORM 10-K
December 31, 2007
Capital Requirements - Premier is subject to capital ratios, requirements and guidelines imposed by the Federal Reserve, which are substantially similar to the ratios, requirements and guidelines imposed by the Federal Reserve and the FDIC on the Banks within their respective jurisdictions. These capital requirements establish higher capital standards for banks and bank holding companies that assume greater credit risks. For this purpose, a bank's or holding company's assets and certain specified off-balance sheet commitments are assigned to four risk categories, each weighted differently based on the level of credit risk that is ascribed to such assets or commitments. A bank's or holding company's capital is divided into two tiers: "Tier I" capital and "Tier II" capital. "Tier I" capital includes common shareholders' equity, non-cumulative perpetual preferred stock, and related surplus (excluding auction rate issues), minority interests in equity accounts of consolidated subsidiaries and Trust Preferred Securities (subject to certain limitations.) Goodwill, certain identifiable intangible assets and certain other assets are subtracted from these sources of capital to calculate Tier I capital. "Tier 2" capital includes, among other items, perpetual preferred stock not meeting the Tier I definition, mandatory convertible securities, subordinated debt and allowances for loan and lease losses, subject to certain limitations, less certain required deductions.
Bank holding companies currently are required to maintain Tier I and total capital (the sum of Tier 1 and Tier 2 capital) equal to at least 4% and 8% of total risk-weighted assets, respectively. At December 31, 2007, Premier met both requirements, with Tier I and total capital equal to 16.1% and 17.3% of its total risk-weighted assets, respectively.
In addition to the risk-based capital guidelines, the Federal Reserve requires bank holding companies to maintain a minimum "leverage ratio" (Tier I capital to adjusted total assets) of 3%, if the holding company has the highest regulatory ratings for risk-based capital purposes. All other bank holding companies are required to maintain a leverage ratio of 3% plus at least 100 to 200 basis points. At December 31, 2007, Premier's leverage ratio was 9.8%.
The foregoing capital requirements are minimum requirements. The Federal Reserve may set capital requirements higher than the minimums described above for holding companies whose circumstances warrant it. For example, holding companies experiencing or anticipating significant growth may be expected to maintain capital ratios, including tangible capital positions, well above the minimum levels.
PREMIER FINANCIAL BANCORP, INC.
FORM 10-K
December 31, 2007
Additionally, the Federal Deposit Insurance Corporation Improvement Act of 1991 ("FDICIA"), among other things, identifies five capital categories for insured depository institutions (well capitalized, adequately capitalized, undercapitalized, significantly undercapitalized and critically undercapitalized) and requires the respective federal regulatory agencies to implement systems for "prompt corrective action" for insured depository institutions that do not meet minimum capital requirements within such categories. FDICIA imposes progressively more restrictive constraints on operations, management and capital distributions, depending on the category in which an institution is classified. Failure to meet the capital guidelines could also subject a banking institution to capital raising requirements.
An "undercapitalized" bank must develop a capital restoration plan and its parent holding company must guarantee the bank's compliance with the plan. The liability of the parent holding company under any such guarantee is limited to the lesser of 5% of the Bank's assets at the time it became "undercapitalized" or the amount needed to comply with the plan. Furthermore, in the event of the bankruptcy of the parent holding company, such guarantee would take priority over the parent's general unsecured creditors. In addition, FDICIA requires the various regulatory agencies to prescribe certain non-capital standards for safety and executive compensation and permits regulatory action against a financial institution that does not meet such standards.
Regulatory Agreements - On January 29, 2003, the Company entered into a written agreement with the Federal Reserve Bank of Cleveland (FRB) which superseded and rescinded a previous agreement between the Company and the Federal Reserve Bank. In, 2006, the Federal Reserve Bank determined that Premier had fully satisfied all of the provisions of the Written Agreement and, accordingly, the FRB terminated the agreement effective April 18, 2006. Among other provisions, the agreement required the Company to retain an independent consultant to review its management, directorate and organizational structure, adopt a management plan responsive to such consultant's report, update its management succession plan in accordance with any recommendations in such consultant's report, monitor its subsidiary banks' compliance with bank policies and loan review programs, conduct formal quarterly reviews of its subsidiary Banks' allowances for loan losses, maintain sufficient capital, submit a plan to the FRB for improving consolidated earnings over a three-year period, and submit to the FRB annual projections of planned sources and uses of the Company's cash, including a plan to service its outstanding debt and then outstanding trust preferred securities. The Company’s compliance with the written agreement was monitored by a committee consisting of three of its outside directors.
PREMIER FINANCIAL BANCORP, INC.
FORM 10-K
December 31, 2007
As previously disclosed in earlier reports, some of the subsidiary Banks have, in the past, been subject to regulatory agreements. Before they were merged together into one entity, two of the Company's subsidiaries, Citizens Deposit Bank & Trust and the Bank of Germantown, entered into similar agreements with their respective primary regulators which, among other things, prohibited the payment of dividends without prior written approval and required significant changes in their credit administration policies. The banks fully complied with the terms of the agreements in 2004 and the agreements were accordingly rescinded by their regulators.
As a result of a 2003 investigation into the conduct of the former president of Farmers Deposit Bank by Premier and the FDIC, Premier charged-off over $17.2 million of loans. The resulting depletion of the allowance for loan losses together with the analysis of additional risk in the loan portfolio warranted significant additional provisions for loan losses at the Bank. In addition to the provision for loan losses, interest income reversals and other non-interest expenses, including bad check write-offs and loan review expenses, were recorded. On December 24, 2003, Premier announced that Farmers Deposit Bank had reached an agreement with the FDIC and the Kentucky Department of Financial Institutions ("KDFI") [collectively referred to as "Supervisory Authorities"] to consent to the issuance of a cease & desist order ("Order") from its Supervisory Authorities. The Order also outlined a number of steps to be taken by Farmers Deposit which were designed to remedy and/or prevent the reoccurrence of events that gave rise to the investigation during the latter half of 2003. Having found that Farmers Deposit had fully complied with the Order, the Supervisory Authorities rescinded the Order on December 13, 2005.
Dividend Restrictions - Premier is dependent on dividends from its Affiliate Banks for its revenues. Various federal and state regulatory provisions limit the amount of dividends the Affiliate Banks can pay to Premier without regulatory approval. At December 31, 2007, approximately $3.0 million of the total shareholders' equity of the Affiliate Banks was available for payment of dividends to Premier without approval by the applicable regulatory authority.
In addition, federal bank regulatory authorities have authority to prohibit Premier's Affiliate Banks from engaging in an unsafe or unsound practice in conducting their business. The payment of dividends, depending upon the financial condition of the bank in question, could be deemed to constitute such an unsafe or unsound practice. The ability of the Affiliate Banks to pay dividends in the future is presently, and could be further, influenced by bank regulatory policies and capital guidelines as well as each Affiliate Bank's earnings and financial condition. Additional information regarding dividend limitations can be found in Note 18 of the accompanying audited consolidated financial statements.
PREMIER FINANCIAL BANCORP, INC.
FORM 10-K
December 31, 2007
Interstate Banking - Under the Riegle-Neal Interstate Banking and Branching Efficiency Act of 1994 (the "Riegle-Neal Act"), subject to certain concentration limits, (i) bank holding companies, such as Premier, are permitted to acquire banks and bank holding companies located in any state of the United States, subject to certain restrictions, and (ii) banks are permitted to acquire branch offices outside their home state by merging with out-of-state banks, purchasing branches in other states or establishing de novo branch offices in other states; provided that, in the case of any such purchase or opening of individual branches, the host state has adopted legislation "opting in" to the relevant provisions of the Riegle-Neal Act; and provided further, that, in the case of a merger with a bank located in another state, the host state has not adopted legislation "opting out" of the relevant provisions of the Riegle-Neal Act.
Gramm-Leach-Bliley Act - On November 12, 1999, the Gramm-Leach-Bliley Act (the "Act") was signed into law, eliminating many of the remaining barriers to full convergence of the banking, securities, and insurance industries. The major provisions of the Act took effect March 12, 2000.
The Act enables a broad-scale consolidation among banks, securities firms, and insurance companies by creating a new type of financial services company called a "financial holding company," a bank holding company with dramatically expanded powers. Financial holding companies can offer virtually any type of financial service, including banking, securities underwriting, insurance (both agency and underwriting), and merchant banking. In addition, the Act permits the Federal Reserve and the Treasury Department to authorize additional activities for financial holding companies, but only if they jointly determine that such activities are "financial in nature" or "complementary to financial activities." Premier does not presently qualify to elect financial holding company status.
The Federal Reserve serves as the primary "umbrella" regulator of financial holding companies, with jurisdiction over the parent company and more limited oversight over its subsidiaries. The primary regulator of each subsidiary of a financial holding company depends on the activities conducted by the subsidiary. A financial holding company need not obtain Federal Reserve approval prior to engaging, either de novo or through acquisitions, in financial activities previously determined to be permissible by the Federal Reserve. Instead, a financial holding company need only provide notice to the Federal Reserve within 30 days after commencing the new activity or consummating the acquisition.
Number of Employees
The Company and its subsidiaries collectively had approximately 226 full-time equivalent employees as of December 31, 2007. Its executive offices are located at 2883 5th Avenue, Huntington, West Virginia 25702, telephone number (304) 525-1600 (facsimile number (304) 525-9701).
PREMIER FINANCIAL BANCORP, INC.
FORM 10-K
December 31, 2007
Like all financial companies, the Company’s business and results of operations are subject to a number of risks, many of which are outside of the Company’s control. In addition to the other information in this report, readers should carefully consider that the following important factors, among others, could materially impact the Company’s business and future results of operations.
Changes in Interest Rates Could Negatively Impact the Company’s Results of Operations
The earnings of the Company are primarily dependent on net interest income, which is the difference between interest earned on loans and investments, and interest paid on interest-bearing liabilities such as deposits and borrowings. Interest rates are highly sensitive to many factors, including government monetary and fiscal policies; domestic and international economic and political conditions; and, in particular, changes in the discount rate by the Board of Governors of the Federal Reserve System. Conditions such as inflation, recession, unemployment, money supply, government borrowing and other factors beyond management’s control may also affect interest rates. If the Company’s interest-earning assets mature, reprice or prepay more quickly than interest-bearing liabilities in a given period, a decrease in market interest rates could adversely affect net interest income. Likewise, if interest-bearing liabilities mature or reprice, or, in the case of deposits, are withdrawn by the accountholder, more quickly than interest-earning assets in a given period, an increase in market interest rates could adversely affect net interest income. Given the Company’s current mix of assets and liabilities, a declining interest rate environment would negatively impact the Company’s results of operations.
Fixed rate loans increase the Company’s exposure to interest rate risk in a rising rate environment because interest-bearing liabilities would be subject to repricing before assets become subject to repricing. Adjustable rate loans decrease the risks to a lender associated with changes in interest rates but involve other risks. As interest rates rise, the periodic payment by the borrower rises to the extent permitted by the terms of the loan, and the increased periodic payment increases the potential for default. At the same time, for secured loans, the marketability of the underlying collateral may be adversely affected by higher interest rates. In a declining interest rate environment, there is likely to be an increase in prepayment activity on loans as the borrowers refinance their loans at lower interest rates. Under these circumstances, the Company’s results of operations could be negatively impacted.
Changes in interest rates also can affect the value of loans, investments and other interest-rate sensitive assets and the Company’s ability to realize gains on the sale or resolution of assets. This type of income can vary significantly from quarter-to-quarter and year-to-year based on a number of different factors, including the interest rate environment. An increase in interest rates that adversely affects the ability of borrowers to pay the principal or interest on
PREMIER FINANCIAL BANCORP, INC.
FORM 10-K
December 31, 2007
loans may lead to an increase in non-performing assets and increased loan loss reserve requirements that could have a material adverse effect on the Company’s results of operations.
Regional Economic Changes in the Company’s Markets Could Adversely Impact Results From Operations
Like all banks, the Company is subject to the effects of any economic downturn, and in particular a significant decline in home values or reduced commercial development in the Company’s markets could have a negative effect on results of operations. The Company’s success depends primarily on the general economic conditions in the counties in which the Company conducts business, and in the West Virginia, southern Ohio and northern Kentucky areas in general. Unlike larger banks that are more geographically diversified, the Company provides banking and financial services to customers primarily in the West Virginia counties of Barbour, Boone, Harrison, Lewis, Lincoln, Logan, Kanawha and Upshur, as well as the southern Ohio counties of Gallia, Lawrence and Scioto and the northern Kentucky counties of Bracken, Fleming, Greenup, Lewis, Mason, and Robertson. The local economic conditions in these market areas have a significant impact on the Company’s ability to originate loans, the ability of the borrowers to repay these loans and the value of the collateral securing these loans. A significant decline in the general economic conditions caused by inflation, recession, unemployment or other factors beyond the Company’s control would affect these local economic conditions and could adversely affect the Company’s financial condition and results of operations. Additionally, a significant decline in home values would likely lead to increased delinquencies and defaults in both the consumer home equity loan and residential real estate loan portfolios and result in increased losses in these portfolios.
New or Revised Tax, Accounting and Other Laws, Regulations, Rules and Standards Could Significantly Impact Strategic Initiatives, Results of Operations and Financial Condition
The financial services industry is highly regulated and laws and regulations may sometimes impose significant limitations on operations. These limitations, and sources of potential liability for the violation of such laws and regulations, are described in Item 1 of Part I of this report under the heading “Business — Regulatory Matters.” These regulations, along with the currently existing tax and accounting laws, regulations, rules and standards, control the methods by which financial institutions conduct business; implement strategic initiatives, as well as past, present, and contemplated tax planning; and govern financial disclosures. These laws, regulations, rules, and standards are constantly evolving and may change significantly over time. The nature, extent, and timing of the adoption of significant new laws, changes in existing laws, or repeal of existing laws may have a material impact on the Company’s results of operations and financial condition, the effects of which are impossible to predict at this time.
PREMIER FINANCIAL BANCORP, INC.
FORM 10-K
December 31, 2007
The Extended Disruption of Vital Infrastructure Could Negatively Impact the Company’s Results of Operations and Financial Condition
The Company’s operations depend upon, among other things, its technological and physical infrastructure, including its equipment and facilities. While disaster recovery procedures are in place, an extended disruption of its vital infrastructure by fire, power loss, natural disaster, telecommunications failure, computer hacking and viruses, terrorist activity or the domestic and foreign response to such activity, or other events outside of the Company’s control, could have a material adverse impact either on the financial services industry as a whole, or on the Company’s business, results of operations, and financial condition.
Strong Competition Within the Company’s Market Area May Limit Profitability
The Company faces significant competition both in attracting deposits and in the origination of loans, as described under the heading “Business — Competition.” Mortgage bankers, commercial banks, credit unions and other savings institutions, which have offices in the Bank’s market area have historically provided most of the Company’s competition for deposits; however, the Company also competes with financial institutions that operate through Internet banking operations throughout the continental United States. In addition, and particularly in times of high interest rates, the Company faces additional and significant competition for funds from money market and mutual funds, securities firms, commercial banks, credit unions and other savings institutions located in the same communities and those that operate through Internet banking operations throughout the continental United States. Many competitors have substantially greater financial and other resources than the Company. Moreover, credit unions do not pay federal or state income taxes and are subject to fewer regulatory constraints than community banks and as a result, they may enjoy a competitive advantage over the Company. The Banks compete for loans principally on the basis of the interest rates and loan fees they charge, the types of loans they originate and the quality of services they provide to borrowers. This advantage places significant competitive pressure on the prices of loans and deposits.
Loss of Large Checking and Money Market Deposit Customers Could Increase Cost of Funds and Have a Negative Effect on Results of Operations
The Company has a number of large deposit customers that maintain balances in checking, money market and repurchase agreement accounts at the Affiliate Banks. The ability to attract these types of deposits has a positive effect on the Company’s net interest margin as they provide a relatively low cost of funds to the Company compared to certificates of deposits or advances. If these depositors were to withdraw these funds and the Affiliate Banks were not able to replace them with similar types of deposits, the cost of funds would increase and the Company’s results of operation would be negatively impacted.
PREMIER FINANCIAL BANCORP, INC.
FORM 10-K
December 31, 2007
Extensive Regulation and Supervision
The Company, primarily through its Affiliate Banks, is subject to extensive federal and state regulation and supervision. Banking regulations are primarily intended to protect depositors’ funds, federal deposit insurance funds and the banking system as a whole, not shareholders. These regulations affect Premier’s lending practices, capital structure, investment practices, dividend policy and growth, among other things. The Company is also subject to a number of federal laws, which, among other things, require it to lend to various sectors of the economy and population, and establish and maintain comprehensive programs relating to anti-money laundering and customer identification. Congress and federal regulatory agencies continually review banking laws, regulations and policies for possible changes. Changes to statutes, regulations or regulatory policies, including changes in interpretation or implementation of statutes, regulations or policies, could affect Premier in substantial and unpredictable ways. Such changes could subject the Company to additional costs, limit the types of financial services and products it may offer and/or increase the ability of non-banks to offer competing financial services and products, among other things. Failure to comply with laws, regulations or policies could result in sanctions by regulatory agencies, civil money penalties and/or reputation damage, along with corrective action plans required by regulatory agencies, any of which could have a material adverse effect on the Company’s business, financial condition and results of operations. Premier and certain of its Affiliate Banks have in the past been subject to such corrective action plans, and therefore there may be some residual reputation damage within the regulatory agencies. While Premier has policies and procedures designed to prevent any such violations, there can be no assurance that such violations will not occur. See the “Regulatory Matters” section in Item 1, “Business”.
Dividend payments by subsidiaries to Premier and by Premier to its shareholders can be restricted.
The Company’s principal source of funds for dividend payments and its debt service obligations is dividends received from the subsidiary Banks. Banking regulations limit the amount of dividends that may be paid without prior approval of regulatory agencies. Under these regulations, the amount of dividends that may be paid in any calendar year is limited to the current year’s net profits, as defined, combined with the retained net profits of the preceding two years, subject to the capital requirements and additional restrictions as discussed in Note 18 to the consolidated financial statements. During 2008 the Banks could, without prior approval, declare dividends of approximately $3.0 million plus any 2008 net profits retained to the date of the dividend declaration.
PREMIER FINANCIAL BANCORP, INC.
FORM 10-K
December 31, 2007
Allowance for Loan Losses May Be Insufficient
Premier, through the Affiliate Banks, maintains an allowance for loan losses based on, among other things, national and regional economic conditions, historical loss experience, evaluations of potential losses on identified problem loans and delinquency trends. Premier believes that its allowance for loan losses is maintained at a level adequate to absorb any probable losses in its loan portfolio given the current information known to Management. These determinations are based upon estimates that are inherently subjective, and their accuracy depends on the outcome of future events. Therefore, Premier cannot predict loan losses with certainty and ultimate losses may differ from current estimates. Depending on changes in economic, operating and other conditions, including changes in interest rates, which are generally beyond its control, Premier’s actual losses could exceed its current allowance estimates. Premier can provide no assurance that its allowance is sufficient to cover all charge-offs in future periods. If charge-offs exceed Premier’s allowance, its earnings would decrease. In addition, regulatory agencies review Premier’s allowance for loan losses and may require additions to the allowance based upon their judgment about information available to them at the time of their examination. A required increase in Premier’s allowance for loan losses could reduce its earnings.
Claims and Litigation Pertaining to Fiduciary Responsibility
From time to time, customers make claims and take legal action pertaining to the Company’s and Affiliate Banks’ performance of their fiduciary responsibilities. If such claims and legal actions are not resolved in a manner favorable to the Banks they may result in financial liability and/or adversely affect the market perception of the Banks and their products and services as well as impact customer demand for those products and services. Any financial liability or reputation damage could have a material adverse effect on the Company’s business, which, in turn, could have a material adverse effect on its financial condition and results of operations
Inability to Hire and Retain Qualified Employees
The Company’s performance is largely dependent on the talents and efforts of highly skilled individuals and their ability to attract and retain customer relationships in a community bank environment. There is intense competition in the financial services industry for qualified employees. In addition, the Company faces increasing competition with businesses outside the financial services industry for the most highly skilled individuals. The Company’s business could be adversely affected if it were unable to retain and motivate its existing key employees and management team. Furthermore, the Company’s success may be impacted if it were unable to recruit replacement management and key employees in a reasonable amount of time.
PREMIER FINANCIAL BANCORP, INC.
FORM 10-K
December 31, 2007
Integration of Pending Acquisitions May Be More Difficult Than Anticipated
The success of the Company’s planned acquisitions of Citizens First Bank, Inc. and/or Traders Bankshares, Inc. will depend on a number of factors, including (but not limited to) Premier’s ability to:
| • | timely and successfully integrate the operations of Premier and each of the planned acquisitions; |
| • | maintain the existing relationships with the depositors of Citizens First and/or Traders Bankshares to minimize the withdrawal of deposits subsequent to the merger(s); |
| • | maintain and enhance the existing relationships with the borrowers of Citizens First and/or Traders Bankshares to limit potential losses from loans made by the them; |
| • | control the incremental non-interest expense of the integrated operations to maintain overall operating efficiencies; |
| • | retain and attract qualified personnel at Citizens First and/or Traders Bankshares; and |
| • | compete effectively in the communities served by Citizens First and Traders Bankshares and in nearby communities. |
PREMIER FINANCIAL BANCORP, INC.
FORM 10-K
December 31, 2007
None.
The Company leases its principal executive offices located in Huntington, West Virginia. The Company also owns property located at 104 Jefferson Street, Brooksville, Kentucky, which serves as a branch for Citizen's Deposit Bank. Except as noted, each of the Banks owns the real property and improvements on which their banking activities are conducted.
Citizens Deposit Bank & Trust, in addition to its main office at 400 Second Street in Vanceburg, Kentucky, has four branch offices in Lewis County, Kentucky, (including one leased facility), one leased branch office in Mason County, Kentucky, one branch located on Highway 10 in Germantown, Kentucky, and one branch located in Bracken County, Kentucky. Farmers Deposit Bank, in addition to its main office at 5230 South Main Street in Eminence, Kentucky, has one branches in Henry County, Kentucky and closed a second branch in Henry County effective January 31, 2008. Ohio River Bank, in addition to its main office at 221 Railroad Street in Ironton, Ohio, has two branches, one leased facility in Lawrence County, Ohio and one in Scioto County, Ohio. First Central Bank, in addition to its main office at 2 South Main Street in Philippi, West Virginia, has a branch located in Buckhannon, West Virginia and a leased branch office located in Upshur County, West Virginia. Boone County Bank, in addition to its main office at 300 State Street, Madison, West Virginia, has one leased branch located in Lincoln County, West Virginia and two other branches, one each located in Boone and Logan Counties, West Virginia.
The Banks are respectively parties to legal actions that are ordinary routine litigation incidental to a commercial banking business. In management's opinion, the outcome of these matters, individually or in the aggregate, will not have a material adverse impact on the results of operations or financial position of the Company.
There were no matters submitted to a vote of security holders, through solicitation of proxies or otherwise during the fourth quarter of the fiscal year covered by this report.
PREMIER FINANCIAL BANCORP, INC.
FORM 10-K
December 31, 2007
PART II
Issuer Purchase of Equity Securities
The Company's common stock is listed on the NASDAQ Global Market System under the symbol PFBI. At December 31, 2007, the Company had approximately 578 record holders of its common shares.
The following table sets forth on a quarterly basis cash dividends paid and the range of high and low sales prices on a per share basis during the quarters indicated.
| Cash | Sales Price | |||||||||||
| Dividends Paid | High | Low | ||||||||||
| 2006 | ||||||||||||
First Quarter | $ | - | $ | 16.44 | $ | 14.01 | ||||||
Second Quarter | - | 16.50 | 13.25 | |||||||||
Third Quarter | 0.05 | 15.40 | 13.90 | |||||||||
Fourth Quarter | 0.05 | 14.90 | 13.40 | |||||||||
| 0.10 | ||||||||||||
| 2007 | ||||||||||||
First Quarter | $ | 0.10 | $ | 16.49 | $ | 13.36 | ||||||
Second Quarter | 0.10 | 16.50 | 15.03 | |||||||||
Third Quarter | 0.10 | 16.45 | 13.23 | |||||||||
Fourth Quarter | 0.10 | 14.77 | 12.10 | |||||||||
| 0.40 | ||||||||||||
| 2008 | ||||||||||||
First Quarter (through March 15, 2008) | $ | 0.10 | $ | 13.59 | $ | 11.01 | ||||||
The payment of dividends by the Company depends upon the ability of the Banks to declare and pay dividends to the Company because the principal source of the Company's revenue will be dividends paid by the Banks. At December 31, 2007 approximately $3.0 million was available for payment as dividends from the Banks to the Company without the need for regulatory approval. In considering the payment of dividends, the Board of Directors will take into account the Company's financial condition, results of operations, tax considerations, costs of expansion, industry standards, economic conditions and need for funds, as well as governmental policies and regulations applicable to the Company and the Banks. See "REGULATORY MATTERS - Capital Requirements" for discussion on capital guidelines.
PREMIER FINANCIAL BANCORP, INC.
FORM 10-K
December 31, 2007
The following Stock Performance Graph and related information shall not be deemed “soliciting material” or to be “filed” with the Securities and Exchange Commission, nor shall such information be incorporated by reference into any future filing under the Securities Act of 1933 or Securities Exchange Act of 1934, each as amended, except to the extent that Premier specifically incorporates it by reference into such filing.
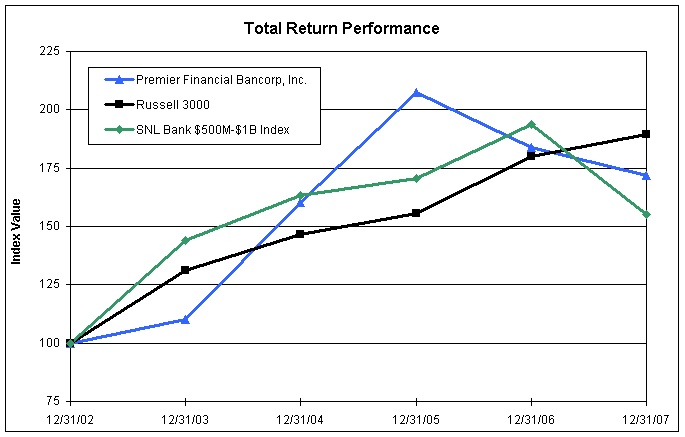
The following graph shows a comparison of cumulative total stockholder return on the Common Stock since December 31, 2002 with the cumulative total returns of both a broad equity market index and a published industry index. The broad equity market index chosen was the Russell 3000 and the published industry index chosen was the SNL ($500M-$1B) Bank Asset-Size Index. The graph reflects historical performance only, which is not indicative of possible future performance of the Common Stock.
Premier Financial Bancorp, Inc.
Period Ending | |||||||||||||||||||
| Index | 12/31/02 | 12/31/03 | 12/31/04 | 12/31/05 | 12/31/06 | 12/31/07 | |||||||||||||
| Premier Financial Bancorp, Inc. | 100.00 | 110.26 | 160.39 | 207.53 | 184.00 | 171.80 | |||||||||||||
| Russell 3000 | 100.00 | 131.06 | 146.71 | 155.69 | 180.16 | 189.42 | |||||||||||||
| SNL $500M-$1B Bank Index | 100.00 | 144.19 | 163.41 | 170.41 | 193.81 | 155.31 | |||||||||||||
| *Source: SNL Financial LC, Charlottesville, VA | |||||||||||||||||||
PREMIER FINANCIAL BANCORP, INC.
FORM 10-K
December 31, 2007
Equity Compensation Plan Information
The following table gives information about the Company’s common stock that may be issued upon the exercise of options, warrants and rights under its two equity compensation plans, the 1996 Stock Option Plan and the 2002 Stock Option Plan, as of December 31, 2007.
Plan Category | Number of securities to be issued upon exercise of outstanding options, warrants and rights (a) | Weighted-average exercise price of outstanding options, warrants and rights (b) | Number of securities remaining available for future issuance under equity compensation plans (Excluding securities reflected in column (a)) (c) | |||||||||
| Equity compensation plans approved by shareholders | ||||||||||||
1996 Stock Option Plan | 11,000 | $ | 16.50 | 0 | ||||||||
2002 Stock Option Plan | 139,249 | 12.35 | 355,082 | |||||||||
Equity compensation plans not approved by shareholders | ||||||||||||
None | ||||||||||||
| Total | 150,249 | $ | 12.65 | 355,082 | ||||||||
PREMIER FINANCIAL BANCORP, INC.
FORM 10-K
December 31, 2007
The following table presents consolidated selected financial data for the Company. It does not purport to be complete and is qualified in its entirety by more detailed financial information and the audited consolidated financial statements contained elsewhere in this annual report. The data presented below reflects separately the impact of discontinued operations as more fully described in Item 1 – “The Company”.
| (Dollars in thousands, except per share amounts) | At or for the Year Ended December 31 | |||||||||||||||||||
| 2007 | 2006 | 2005 | 2004 | 2003(5) | ||||||||||||||||
| Earnings | ||||||||||||||||||||
Net interest income | $ | 22,296 | $ | 21,395 | $ | 19,852 | $ | 18,064 | $ | 19,182 | ||||||||||
Provision for loan losses | (78 | ) | (1,161 | ) | 4 | 1,026 | 20,513 | |||||||||||||
Non-interest income | 4,623 | 4,165 | 3,920 | 3,606 | 4,064 | |||||||||||||||
Non-interest expense | 16,408 | 16,937 | 17,305 | 17,782 | 17,632 | |||||||||||||||
Income taxes (benefit) | 3,470 | 3,283 | 2,029 | 899 | (5,282 | ) | ||||||||||||||
Income (loss) from continuing operations | 7,119 | 6,501 | 4,434 | 1,963 | (9,617 | ) | ||||||||||||||
Income (loss) from discontinued operations (1) | - | - | - | 4,734 | (80 | ) | ||||||||||||||
Net income (loss) | $ | 7,119 | $ | 6,501 | $ | 4,434 | $ | 6,697 | $ | (9,697 | ) | |||||||||
| Financial Position | ||||||||||||||||||||
Total assets of continuing operations | $ | 549,255 | $ | 535,452 | $ | 528,324 | $ | 537,255 | $ | 543,229 | ||||||||||
Total assets of discontinued operations (1) | - | - | - | - | 79,163 | |||||||||||||||
Loans, net of unearned income | 346,570 | 343,797 | 328,717 | 324,937 | 331,794 | |||||||||||||||
Allowance for loan losses | 6,497 | 6,661 | 7,892 | 9,384 | 14,300 | |||||||||||||||
Goodwill and other intangibles | 15,816 | 15,816 | 15,816 | 15,816 | 15,816 | |||||||||||||||
Securities | 124,242 | 121,367 | 137,419 | 153,892 | 147,646 | |||||||||||||||
Deposits | 449,033 | 438,950 | 435,843 | 437,798 | 455,474 | |||||||||||||||
Other borrowings | 26,124 | 33,091 | 19,053 | 20,536 | 18,307 | |||||||||||||||
Subordinated debentures | - | - | 15,722 | 20,876 | 26,546 | |||||||||||||||
Stockholders’ equity | 67,389 | 61,002 | 54,287 | 51,029 | 45,540 | |||||||||||||||
| Share Data | ||||||||||||||||||||
Income (loss) from continuing operations – basic | $ | 1.36 | $ | 1.24 | $ | 0.85 | $ | 0.37 | $ | (1.84 | ) | |||||||||
Income (loss) from continuing operations - diluted | 1.35 | 1.24 | 0.84 | 0.37 | (1.84 | ) | ||||||||||||||
Net income – basic | 1.36 | 1.24 | 0.85 | 1.28 | (1.85 | ) | ||||||||||||||
Net income - diluted | 1.35 | 1.24 | 0.84 | 1.28 | (1.85 | ) | ||||||||||||||
Book value | 12.87 | 11.65 | 10.37 | 9.75 | 8.70 | |||||||||||||||
Cash dividends | 0.40 | 0.10 | 0.00 | 0.00 | 0.00 | |||||||||||||||
PREMIER FINANCIAL BANCORP, INC.
FORM 10-K
December 31, 2007
Item 6. Selected Financial Data (continued)
| (Dollars in thousands, except per share amounts) | At or for the Year Ended December 31 | |||||||||||||||||||
| 2007 | 2006 | 2005 | 2004 | 2003(5) | ||||||||||||||||
Return on average assets (2), (3) | 1.31 | % | 1.21 | % | 0.82 | % | 0.36 | % | (1.66 | )% | ||||||||||
Return on average equity (3) | 11.13 | % | 11.31 | % | 8.42 | % | 4.06 | % | (18.46 | )% | ||||||||||
Dividend payout (3) | 29.41 | % | 8.06 | % | 0.00 | % | 0.00 | % | 0.00 | % | ||||||||||
Stockholders’ equity to total assets at period-end (3) | 12.27 | % | 11.39 | % | 10.28 | % | 9.50 | % | 8.38 | % | ||||||||||
Average stockholders’ equity to average total assets (2) | 11.74 | % | 10.74 | % | 9.77 | % | 8.23 | % | 7.88 | % | ||||||||||
(1) In the fourth quarter of 2003, the Company adopted and began to implement a plan to sell its subsidiary Citizens Bank (Kentucky), Inc. (“Citizens Bank”) located in Georgetown, Kentucky. The sale was completed on July 1, 2004. In accordance with Financial Accounting Standard 144, the financial position and results of operations of Citizens Bank are removed from the detail line items in the table and presented separately as “discontinued operations.” (2) Computed based on average assets from continuing operations (3) Computed based on income (loss) from continuing operations (4) Shareholders’ equity at period-end divided by assets from continuing operations (5) As previously disclosed in earlier reports, a 2003 investigation into the conduct of the former president of Farmers Deposit Bank by Premier and the FDIC, resulted in the charge-off of over $17.2 million of loans. The resulting depletion of the allowance for loan losses together with the analysis of additional risk in the loan portfolio warranted significant additional provisions for loan losses at the Bank. In addition to the provision for loan losses, interest income reversals and other non-interest expenses, including bad check write-offs and loan review expenses, were recorded. See “Regulatory Matters” in item 1 – Description of Business above and Premier’s earlier SEC filings for additional details. | ||||||||||||||||||||
PREMIER FINANCIAL BANCORP, INC.
MANAGEMENT’S DISCUSSION AND ANALYSIS
December 31, 2007
of Operations.
INTRODUCTION
Premier Financial Bancorp, Inc. ("Premier") is a multi-bank holding company headquartered in Huntington, West Virginia. It operates five community bank subsidiaries ranging in size from $71 million to $159 million, each with a local community name and orientation. The banks operate in twenty communities within the states of West Virginia, Ohio and Kentucky and provide their customers with a full range of banking services. On January 3, 2005, Premier merged two of its banks, Citizen's Deposit Bank and Bank of Germantown. On June 27, 2006, Premier merged its inactive data processing subsidiary into the parent company. Prior to Premier’s conversion to an outsourced data services provider in the second quarter of 2005, the data processing subsidiary provided the data processing and management services for four of Premier's affiliate banks and one other non-affiliated bank. As of December 31, 2007, Premier had approximately $549 million in total assets, $347 million in total loans, $449 million in total deposits and $12 million in customer repurchase agreements.
The accompanying consolidated financial statements have been prepared by the management of Premier in conformity with accounting principles generally accepted in the United States of America. The audit committee of the Board of Directors engaged Crowe Chizek and Company LLC (Crowe) as independent auditors to audit the consolidated financial statements, and their report is included elsewhere herein. Financial information appearing throughout this annual report is consistent with that reported in the consolidated financial statements. The following discussion is designed to assist readers of the consolidated financial statements in understanding significant changes in Premier's financial condition and results of operations.
Management's objective of a fair presentation of financial information is achieved through a system of internal accounting controls. The financial control system of Premier is designed to provide reasonable assurance that assets are safeguarded from loss and that transactions are properly authorized and recorded in the financial records. As an integral part of that financial control system, the holding company employs a staff of internal auditors to perform internal audits of the financial records of each of the subsidiaries on a periodic basis. The internal audit staff reports their findings and recommendations to Premier’s audit committee as well as the audit committees of the subsidiaries. Also, on a regular periodic basis, the subsidiary banks are examined by Federal and State banking authorities for safety and soundness as well as compliance with applicable banking laws and regulations. The activities of both the internal and external audit functions are reviewed by the audit committee of the Board of Directors.
PREMIER FINANCIAL BANCORP, INC.
MANAGEMENT’S DISCUSSION AND ANALYSIS
December 31, 2007
FORWARD-LOOKING STATEMENTS
Management's discussion and analysis contains forward-looking statements that are provided to assist in the understanding of anticipated future financial performance. However, such performance involves risks and uncertainties, and there are certain important factors that may cause actual results to differ materially from those anticipated. These important factors include, but are not limited to, economic conditions (both generally and more specifically in the markets in which Premier operates), competition for Premier's customers from other providers of financial services, government legislation and regulation (which changes from time to time), changes in interest rates, Premier's ability to originate quality loans, collect delinquent loans and attract and retain deposits, the impact of Premier's growth or lack thereof, Premier's ability to control costs, and new accounting pronouncements, all of which are difficult to predict and many of which are beyond the control of Premier. The words “may,” “could,” “should,” “would,” “will,” “believe,” “anticipate,” “estimate,” “expect,” “intend,” “plan,” “project,” “predict,” “continue” and similar expressions are intended to identify forward-looking statements.
CRITICAL ACCOUNTING POLICIES
General
The financial condition and results of operations presented in the Consolidated Financial Statements, accompanying Notes to the Consolidated Financial Statements and management's discussion and analysis are, to a large degree, dependent upon our accounting policies. The selection and application of these accounting policies involve judgments, estimates, and uncertainties that are susceptible to change.
Presented below is a discussion of those accounting policies that management believes are the most important to the presentation and understanding of our financial condition and results of operations. These critical accounting policies require management's most difficult, subjective and complex judgments about matters that are inherently uncertain. In the event that different assumptions or conditions were to prevail, and depending upon the severity of such changes, the possibility of materially different financial condition or results of operations is a reasonable likelihood. See also Note 1 of the accompanying consolidated financial statements presented elsewhere in this annual report.
PREMIER FINANCIAL BANCORP, INC.
MANAGEMENT’S DISCUSSION AND ANALYSIS
December 31, 2007
Allowance for Loan Losses
The Company monitors and maintains an allowance for loan losses to absorb an estimate of probable incurred losses inherent in the loan portfolio. The Company maintains policies and procedures that address the systems of control over the following areas of maintenance of the allowance: the systematic methodology used to determine the appropriate level of the allowance to provide assurance that the allowance for loan losses is maintained in accordance with accounting principles generally accepted in the United States of America; the accounting policies for loan charge-offs and recoveries; the assessment and measurement of impairment in the loan portfolio; and the loan grading system.
The Company evaluates various loans individually for impairment as required by Statement of Financial Accounting Standard (SFAS) No. 114, Accounting by Creditors for Impairment of a Loan, and SFAS No. 118, Accounting by Creditors for Impairment of a Loan - Income Recognition and Disclosures. Loans evaluated individually for impairment include non-performing loans, such as loans on non-accrual, loans past due 90 days or more, restructured loans and other loans selected by management including loans graded as substandard or doubtful by the internal credit review process. The evaluations are based upon discounted expected cash flows or collateral valuations. If the evaluation shows that a loan is individually impaired, then a specific reserve is established for the amount of impairment. If a loan evaluated individually is not impaired, then the loan is assessed for impairment under SFAS No. 5, Accounting for Contingencies (SFAS 5), with a group of loans that have similar characteristics.
For loans without individual measures of impairment, the Company makes estimates of losses for groups of loans as required by SFAS 5. Loans are grouped by similar characteristics, including the type of loan, the assigned loan grade and the general collateral type. A loss rate reflecting the expected loss inherent in a group of loans is derived based upon estimates of default rates for a given loan grade, the predominant collateral type for the group and the terms of the loan. The resulting estimate of losses for groups of loans is adjusted for relevant environmental factors and other conditions of the portfolio of loans, including: borrower and industry concentrations; levels and trends in delinquencies, charge-offs and recoveries; changes in underwriting standards and risk selection; level of experience, ability and depth of lending management; and national and local economic conditions.
The amount of estimated impairment for individually evaluated loans and groups of loans is added together for a total estimate of probable incurred loan losses. This estimate of losses is compared to the allowance for loan losses of the Company as of the evaluation date and, if the estimate of losses exceeds the allowance, an additional provision to the allowance would be made. If the estimate of losses is less than the allowance, the degree to which the allowance exceeds the estimate is evaluated to determine whether the allowance falls outside a range of estimates. If the estimate of losses were below the range of reasonable estimates, the
PREMIER FINANCIAL BANCORP, INC.
MANAGEMENT’S DISCUSSION AND ANALYSIS
December 31, 2007
allowance would be reduced by way of a credit to the provision for loan losses. The Company recognizes the inherent imprecision in estimates of losses due to various uncertainties and variability related to the factors used, and therefore a reasonable range around the estimate of losses is derived and used to ascertain whether the allowance is too high. If different assumptions or conditions were to prevail and it is determined that the allowance is not adequate to absorb the new estimate of probable incurred losses, an additional provision for loan losses would be made, which amount may be material to the Consolidated Financial Statements.
Impairment of Goodwill
As required by applicable accounting guidance, goodwill is evaluated at least annually to determine if the amount recorded on the Company's balance sheet is impaired. If goodwill is determined to be impaired, the recorded amount would be reduced to estimated fair value by a charge to expense in the period in which impairment is determined. Impairment is evaluated in the aggregate for all of the Company's banking operations. Operating characteristics of the aggregate banking operations are derived and compared to a database of peer group banks that have been sold. Pricing valuation factors that are considered in estimating the fair value of the Company's aggregate banking operations include price-to-total assets, price-to-total book value, price-to-deposits and price-to-earnings. Unusual events that have impacted the operating characteristics of the Company's aggregate banking operations are considered to assess the likelihood of recurrence and adjustments to historical performance may be made. Changes in assumptions regarding the likelihood of unusual historical events recurring or the use of different pricing valuation factors could have a material impact on management's impairment analysis.
PREMIER FINANCIAL BANCORP, INC.
MANAGEMENT’S DISCUSSION AND ANALYSIS
December 31, 2007
SUMMARY FINANCIAL RESULTS
Premier had net income of $7.119 million in 2007 compared to $6.501 million of net income reported for the year 2006. Net income increased in 2007 as a result of an increase in interest income due to a greater average volume of loans outstanding; a greater volume of average federal funds sold outstanding; higher yields on all earning assets; an increase in secondary market mortgage income; and a reduction in the operating costs of the company. Net income in 2005 was $4.434 million. The increase in 2006 over 2005 was the result of an increase in interest income due to a greater volume of loans outstanding; higher yields on all earning assets; a negative provision for loan losses; and a reduction in the net operating costs of the company. Net income in 2005 was a continuation of the Company's improving profit trends primarily resulting from an increase in interest income due to higher yields on earning assets; a decrease in interest expense due to the early retirement of Trust Preferred Securities; a significant decrease in the provision for loan losses; and a reduction in the net operating costs of the company when compared to the prior year. Basic earnings per share were $1.36 in 2007 compared to $1.24 in 2006 and to $0.85 in 2005.
The following table comparatively illustrates the components of ROA and ROE over the previous five years. Return on average assets (ROA) measures how effectively Premier utilizes its assets to produce net income. Premier's net income in 2007 resulted in an ROA of 1.31%, an increase over the 1.21% ROA in 2006 and the 0.82% ROA reported in 2005. As shown in the table, fully taxable equivalent net interest income (as a percent of average earning assets) again reached its highest level in five years in 2007 at 4.42%. The previous five year high was earned in 2006 at 4.32%. The net loss in 2003 was primarily the result of an increase in the provision for loan losses, resulting in negative net credit income in 2003. In 2004, net credit income was once again positive and continued to increase in both 2005 and again in 2006. In 2005, minimal provisions for loan losses were recorded and thus there was little reduction from net interest income. In 2006, negative provisions for loan losses were recorded which served to increase net credit income to 4.55%. This increase in net credit income (as a percent of average earning assets) was complemented by an increase in non-interest income (as a percent of average earning assets) and a reduction in non-interest expenses (as a percent of average earning assets) when compared to the previous two years. In 2007, while net interest income continued to increase, net credit income was lower than 2006 as a result of minimal negative provisions for loan losses recorded in 2007. However, in 2007, non-interest income (as a percent of average earning assets) reached its highest level in the past five years while non-interest expense (as a percent of average earning assets) reached its lowest level in the past five years. As illustrated in the table, the result was to increase Premier's 2007 return on average earning assets to 1.40% and its return on average total assets to 1.31%, each the highest performance ratio over the past five years.
PREMIER FINANCIAL BANCORP, INC.
MANAGEMENT’S DISCUSSION AND ANALYSIS
December 31, 2007
| ANALYSIS of RETURN ON ASSETS and EQUITY | ||||||||||||||||||||
| from continuing operations | ||||||||||||||||||||
| 2007 | 2006 | 2005 | 2004 | 2003(1) | ||||||||||||||||
| As a percent of average earning assets | ||||||||||||||||||||
Fully taxable-equivalent net interest income | 4.42 | % | 4.32 | % | 4.00 | % | 3.61 | % | 3.63 | % | ||||||||||
Provision for loan losses | 0.02 | 0.23 | (0.00 | ) | (0.20 | ) | (3.81 | ) | ||||||||||||
Net credit income | 4.44 | 4.55 | 4.00 | 3.41 | (0.18 | ) | ||||||||||||||
Gains on the sales of assets & subsidiaries | 0.00 | 0.00 | 0.00 | 0.02 | 0.11 | |||||||||||||||
Non-interest income | 0.91 | 0.84 | 0.78 | 0.69 | 0.62 | |||||||||||||||
Non-interest expense | (3.23 | ) | (3.40 | ) | (3.46 | ) | (3.52 | ) | (3.26 | ) | ||||||||||
Tax equivalent adjustment | (0.04 | ) | (0.03 | ) | (0.03 | ) | (0.03 | ) | (0.07 | ) | ||||||||||
Applicable income taxes | (0.68 | ) | (0.66 | ) | (0.41 | ) | (0.18 | ) | 0.98 | |||||||||||
| Return on average earning assets | 1.40 | 1.30 | 0.88 | 0.39 | (1.79 | ) | ||||||||||||||
Multiplied by average earning assets to average total assets | 93.34 | 93.07 | 92.84 | 92.39 | 92.86 | |||||||||||||||
| Return on average assets | 1.31 | % | 1.21 | % | 0.82 | % | 0.36 | % | (1.66 | )% | ||||||||||
Multiplied by average assets to average equity | 8.52 | X | 9.31 | X | 10.23 | X | 11.33 | X | 11.13 | X | ||||||||||
| Return on average equity | 11.13 | % | 11.31 | % | 8.42 | % | 4.06 | % | (18.46 | )% | ||||||||||
The net overhead ratio (non-interest expense less non-interest income as a percent of average earning assets) decreased in 2007 to 2.32%, the lowest ratio reported in the last five years. This ratio compares to 2.56% in 2006, 2.68% in 2005, 2.83% in 2004 and 2.64% in 2003. The decrease in 2007 net overhead was the result of increases in Premier’s non-interest income related to electronic banking income and secondary market mortgage commissions, plus decreases in non-interest expenses related to staff costs and the accelerated amortization of trust preferred issuance costs recorded in 2006 but not 2007. The decrease in 2006 net overhead was the result of increases in Premier’s non-interest income related to service charges on deposit accounts, electronic banking income and secondary market mortgage commissions, plus decreases in non-interest expenses related to occupancy and equipment costs, net OREO expenses, recoveries of bad check losses, and conversion costs incurred in 2005.
Return on average equity (ROE), another measure of earnings performance, indicates the amount of net income earned in relation to the total equity invested. Premier's 2007 ROE was 11.13% compared to 11.31% in 2006 and 8.42% realized in 2005. ROE decreased slightly in 2007 as average equity increased at a faster pace than average assets resulting in a decrease in the multiplier of average assets to average equity. ROE increased in 2006 primarily due to the increase in net income reported in 2006 versus 2005.
PREMIER FINANCIAL BANCORP, INC.
MANAGEMENT’S DISCUSSION AND ANALYSIS
December 31, 2007
A breakdown of Premier's financial results by quarter for the years ended December 31, 2007 and 2006 is summarized below.
| QUARTERLY FINANCIAL INFORMATION | ||||||||||||||||||||
| (Dollars in thousands, except per share amounts) | ||||||||||||||||||||
| First | Second | Third | Fourth | Full Year | ||||||||||||||||
| 2007 | ||||||||||||||||||||
Interest income | $ | 8,612 | $ | 8,712 | $ | 8,738 | $ | 8,690 | $ | 34,752 | ||||||||||
Interest expense | 3,101 | 3,161 | 3,148 | 3,046 | 12,456 | |||||||||||||||
Net interest income | 5,511 | 5,551 | 5,590 | 5,644 | 22,296 | |||||||||||||||
Provision for loan losses | 36 | (164 | ) | 25 | 25 | (78 | ) | |||||||||||||
Securities gains | 0 | 0 | 0 | 0 | 0 | |||||||||||||||
Net overhead | 2,902 | 3,022 | 2,847 | 3,014 | 11,785 | |||||||||||||||
Income before income taxes | 2,573 | 2,693 | 2,718 | 2,605 | 10,589 | |||||||||||||||
Net income | 1,786 | 1,790 | 1,807 | 1,736 | 7,119 | |||||||||||||||
Basic net income per share | 0.34 | 0.34 | 0.35 | 0.33 | 1.36 | |||||||||||||||
Diluted net income per share | 0.34 | 0.34 | 0.34 | 0.33 | 1.35 | |||||||||||||||
Dividends paid per share | 0.10 | 0.10 | 0.10 | 0.10 | 0.40 | |||||||||||||||
| 2006 | ||||||||||||||||||||
Interest income | $ | 7,676 | $ | 8,014 | $ | 8,248 | $ | 8,462 | $ | 32,400 | ||||||||||
Interest expense | 2,472 | 2,654 | 2,871 | 3,008 | 11,005 | |||||||||||||||
Net interest income | 5,204 | 5,360 | 5,377 | 5,454 | 21,395 | |||||||||||||||
Provision for loan losses | (194 | ) | (819 | ) | (38 | ) | (110 | ) | (1,161 | ) | ||||||||||
Securities gains | 0 | 0 | 0 | 0 | 0 | |||||||||||||||
Net overhead | 3,348 | 3,161 | 3,196 | 3,067 | 12,772 | |||||||||||||||
Income before income taxes | 2,050 | 3,018 | 2,219 | 2,497 | 9,784 | |||||||||||||||
Net income | 1,367 | 2,000 | 1,475 | 1,659 | 6,501 | |||||||||||||||
Basic net income per share | 0.26 | 0.38 | 0.28 | 0.32 | 1.24 | |||||||||||||||
Diluted net income per share | 0.26 | 0.38 | 0.28 | 0.32 | 1.24 | |||||||||||||||
Dividends paid per share | 0.00 | 0.00 | 0.05 | 0.05 | 0.10 | |||||||||||||||
PREMIER FINANCIAL BANCORP, INC.
MANAGEMENT’S DISCUSSION AND ANALYSIS
December 31, 2007
BALANCE SHEET ANALYSIS
Summary
A financial institution's primary sources of revenue are generated by its earning assets, while its major expenses are produced by the funding of these assets with interest bearing liabilities. Effective management of these sources and uses of funds is essential in attaining a financial institution's optimal profitability while maintaining a minimum amount of interest rate risk and credit risk. Information on rate-related sources and uses of funds for each of the three years in the period ended December 31, 2007, is provided in the table below.
PREMIER FINANCIAL BANCORP, INC.
MANAGEMENT’S DISCUSSION AND ANALYSIS
December 31, 2007
| AVERAGE CONSOLIDATED BALANCE SHEETS AND NET INTEREST INCOME ANALYSIS | ||||||||||||||||||||||||||||||||||||
| (Dollars in thousands) | ||||||||||||||||||||||||||||||||||||
| 2007 | 2006 | 2005 | ||||||||||||||||||||||||||||||||||
Average Balance | Interest | Yield/ Rate (2) | Average Balance | Interest | Yield/ Rate (2) | Average Balance | Interest | Yield/ Rate (2) | ||||||||||||||||||||||||||||
| Assets: | ||||||||||||||||||||||||||||||||||||
| Interest earning assets | ||||||||||||||||||||||||||||||||||||
U.S. Treasury and federal agency securities | $ | 82,177 | $ | 3,496 | 4.25 | % | $ | 95,705 | $ | 3,398 | 3.55 | % | $ | 107,177 | $ | 3,278 | 3.06 | % | ||||||||||||||||||
States and municipal obligations (1) | 4,067 | 241 | 5.93 | 2,342 | 138 | 5.89 | 2,666 | 153 | 5.74 | |||||||||||||||||||||||||||
Mortgage backed securities | 37,017 | 1,799 | 4.86 | 33,953 | 1,564 | 4.61 | 37,050 | 1,583 | 4.27 | |||||||||||||||||||||||||||
Other securities | 3,307 | 212 | 6.41 | 3,179 | 182 | 5.73 | 3,089 | 148 | 4.79 | |||||||||||||||||||||||||||
Total investment securities | 126,568 | 5,748 | 4.54 | 135,179 | 5,282 | 3.91 | 149,982 | 5,162 | 3.44 | |||||||||||||||||||||||||||
Federal funds sold | 36,088 | 1,829 | 5.07 | 24,365 | 1,215 | 4.99 | 23,083 | 745 | 3.23 | |||||||||||||||||||||||||||
Interest-bearing deposits with banks | 1,273 | 56 | 4.40 | 486 | 24 | 4.94 | 436 | 12 | 2.75 | |||||||||||||||||||||||||||
Loans, net of unearned income (3)(4) | ||||||||||||||||||||||||||||||||||||
Commercial | 169,217 | 13,591 | 8.03 | 161,898 | 12,424 | 7.67 | 147,398 | 10,291 | 6.98 | |||||||||||||||||||||||||||
Real estate mortgage | 129,072 | 9,474 | 7.34 | 129,944 | 9,271 | 7.13 | 132,527 | 9,236 | 6.97 | |||||||||||||||||||||||||||
Installment | 46,399 | 4,244 | 9.15 | 46,494 | 4,334 | 9.32 | 46,690 | 4,083 | 8.74 | |||||||||||||||||||||||||||
Total loans | 344,688 | 27,309 | 7.92 | 338,336 | 26,029 | 7.69 | 326,615 | 23,610 | 7.23 | |||||||||||||||||||||||||||
Total interest earning assets | 508,617 | 34,942 | 6.87 | 498,366 | 32,550 | 6.53 | 500,116 | 29,529 | 5.90 | |||||||||||||||||||||||||||
| Allowance for loan losses | (6,615 | ) | (7,465 | ) | (8,998 | ) | ||||||||||||||||||||||||||||||
| Cash and due from banks | 13,853 | 13,824 | 13,619 | |||||||||||||||||||||||||||||||||
| Premises and equipment | 6,378 | 7,055 | 7,256 | |||||||||||||||||||||||||||||||||
| Other assets | 22,653 | 23,688 | 26,697 | |||||||||||||||||||||||||||||||||
Total assets | $ | 544,886 | $ | 535,468 | $ | 538,690 | ||||||||||||||||||||||||||||||
| Liabilities and Equity: | ||||||||||||||||||||||||||||||||||||
| Interest bearing liabilities | ||||||||||||||||||||||||||||||||||||
NOW and money market | $ | 119,849 | 1,780 | 1.49 | % | $ | 129,080 | 1,766 | 1.37 | % | $ | 142,501 | 1,409 | 0.99 | % | |||||||||||||||||||||
Savings deposits | 53,000 | 384 | 0.72 | 52,295 | 321 | 0.61 | 59,365 | 412 | 0.69 | |||||||||||||||||||||||||||
Certificates of deposit and other time deposits | 202,183 | 8,855 | 4.38 | 188,044 | 6,896 | 3.67 | 174,057 | 4,904 | 2.82 | |||||||||||||||||||||||||||
Total interest bearing deposits | 375,032 | 11,019 | 2.94 | 369,419 | 8,983 | 2.43 | 375,923 | 6,725 | 1.79 | |||||||||||||||||||||||||||
Short-term borrowings | 13,200 | 321 | 2.43 | 9,591 | 234 | 2.44 | 8,422 | 180 | 2.14 | |||||||||||||||||||||||||||
Other borrowings | 10,047 | 769 | 7.65 | 7,765 | 574 | 7.39 | 1,586 | 14 | 0.88 | |||||||||||||||||||||||||||
FHLB advances | 5,363 | 347 | 6.47 | 7,815 | 453 | 5.80 | 8,775 | 499 | 5.69 | |||||||||||||||||||||||||||
Debentures | - | - | - | 7,887 | 760 | 9.64 | 20,480 | 2,129 | 10.40 | |||||||||||||||||||||||||||
Total interest-bearing liabilities | 403,642 | 12,456 | 3.09 | % | 402,477 | 11,004 | 2.73 | % | 415,186 | 9,547 | 2.30 | % | ||||||||||||||||||||||||
| Non-interest bearing deposits | 74,522 | 72,781 | 66,848 | |||||||||||||||||||||||||||||||||
| Other liabilities | 2,743 | 2,721 | 4,007 | |||||||||||||||||||||||||||||||||
| Shareholders’ equity | 63,979 | 57,489 | 52,649 | |||||||||||||||||||||||||||||||||
Total liabilities and equity | $ | 544,886 | $ | 535,468 | $ | 538,690 | ||||||||||||||||||||||||||||||
Net interest earnings (1) | $ | 22,486 | $ | 21,546 | $ | 19,982 | ||||||||||||||||||||||||||||||
Net interest spread (1) | 3.78 | % | 3.80 | % | 3.60 | % | ||||||||||||||||||||||||||||||
Net interest margin (1) | 4.42 | % | 4.32 | % | 4.00 | % | ||||||||||||||||||||||||||||||
(1) Taxable – equivalent yields are calculated assuming a 34% federal income tax rate (2) Yields are calculated on historical cost except for yields on marketable equity securities that are calculated used fair value (3) Includes loan fees, immaterial in amount, in both interest income and the calculation of yield on loans (4) Includes loans on non-accrual status | ||||||||||||||||||||||||||||||||||||
PREMIER FINANCIAL BANCORP, INC.
MANAGEMENT’S DISCUSSION AND ANALYSIS
December 31, 2007
In 2007, average earning assets increased by 2.1% or $10.3 million from 2006, following a 0.3% or $1.8 million decline in 2006 from 2005. Average interest bearing liabilities, the primary source of funds supporting the earning assets, increased by only 0.3% or $1.2 million in 2007 from 2006, which follows a 3.1% or $12.8 million decline in 2006 from 2005. The 2007 increase in average earnings assets was primarily the result of a $6.4 million increase in average total loans and an $11.7 million increase in average federal funds sold outstanding. These increases more than offset the $8.6 million decline in average total investment securities, as investment funds were used to fund loans and surplus investable proceeds were held in shorter-term but higher yielding federal funds sold during the early part of 2007. The slight increase in 2007 average interest bearing liabilities was the result of a $5.6 million increase in average interest bearing deposits and a $3.6 million increase in average short-term borrowings, primarily customer repurchase agreements, nearly completely offset by an $8.1 million decrease in average high cost debt and Federal Home Loan Bank (FHLB) advances. Furthermore, the increase in average interest bearing deposits was complemented by a $1.7 million increase in average non-interest bearing deposits. In 2006, average earning assets declined, primarily as the result of a $14.8 million decline in average total investment securities, as some maturing funds were used to fund loans or to continue the Company’s debt reduction strategy. The decline in 2006 average interest bearing liabilities was due to a $6.5 million decrease in average interest bearing deposits and a $5.8 million decrease in average high cost debt and Federal Home Loan Bank (FHLB) advances. A portion of the decline in average interest bearing deposits was due to the $1.2 million increase in short-term borrowings, primarily customer repurchase agreements. Furthermore, nearly all of the decrease in average interest bearing deposits was offset by a $5.9 million increase in non-interest bearing deposits. Additional information on each of the components of earning assets and interest bearing liabilities is contained in the following sections of this report.
Loan Portfolio
Premier's loan portfolio is its largest and highest yielding component of average earning assets, totaling 67.8% of average earning assets during 2007. Average loans increased in 2006 by $11.7 million or 3.6% followed by a $6.4 million or 1.9% increase in 2007. The 2007 increase is largely attributable to loan growth in each of Premier’s markets. In, 2007, Premier realized a $2.6 million or 5.3% increase in average outstanding loans in its Ohio markets, a $1.9 million or 1.5% increase in its Kentucky markets and a $1.9 million or 1.1% increase in its West Virginia markets. This follows a $10.0 million or 6.5% increase in average loans its West Virginia markets in 2006, and a $2.1 million or 4.6% increase in loans in its Ohio markets in 2006. In 2006, average loans in Premier’s Kentucky markets remained virtually unchanged.
PREMIER FINANCIAL BANCORP, INC.
MANAGEMENT’S DISCUSSION AND ANALYSIS
December 31, 2007
Total loans at December 31 2007 increased by $2.8 million or 0.8% from the total at December 31, 2006. This increase follows a $15.1 million or 4.6% increase in 2006 from total loans at December 31, 2005. This modest increase in 2007 is primarily the result of sluggish loan demand coupled with a higher level of loan payoffs, which offset $758,000 of loan charge-offs recorded during the year. The increase in 2006 was the result of a significant increase in loan demand in Premier’s markets which more than offset the $1.4 million of loan charge-offs recorded during the year.
Loans secured by real estate, which in total constituted approximately 74% of Premier's loan portfolio at December 31, 2007, consist of a diverse portfolio of predominantly single family residential loans and loans for commercial purposes where real estate is part of the collateral, not the primary source of repayment. Residential real estate mortgage loans generally do not exceed 80% of the value of the real property securing the loan at the time of origination. The residential real estate mortgage loan portfolio primarily consists of adjustable rate residential mortgage loans. The origination of these mortgage loans can be more difficult in a low interest rate environment where there is a significant demand for fixed rate mortgages. Premier also originates mortgage loans to be sold in the secondary market and recognizes non-interest income upon the sale of those mortgages in the form of commissions and servicing release fees. Premier has not engaged in the solicitation of so-called “sub-prime” or “interest only” mortgages. Premier uses third party underwriters to ensure the completeness of the borrowers’ loan application and documentation and to ensure that the loans meet the standards required by prospective loan purchasers. Additional information regarding the volume of mortgage loans originated and sold is contained in Premier’s consolidated statements of cash flows presented elsewhere in this annual report.
Commercial loans are generally made to small-to-medium size businesses located within a defined market area and typically are secured by business assets and guarantees of the principal owners. Additional risks of loss are associated with commercial lending, such as the potential for adverse changes in economic conditions or the borrowers' ability to successfully execute their business plan. Consumer loans generally are made to individuals living in Premier's defined market area who are known to the local bank's staff. Consumer loans are generally made for terms of up to seven years on a secured or unsecured basis; however longer terms may be approved in certain circumstances and for revolving credit lines. While consumer loans generally provide the Company with increased interest income, consumer loans may involve a greater risk of default.
PREMIER FINANCIAL BANCORP, INC.
MANAGEMENT’S DISCUSSION AND ANALYSIS
December 31, 2007
The following table presents a five year comparison of loans by type. With the exception of those categories included in the comparison, there are no loan concentrations which exceed 10% of total loans. Additionally, Premier's loan portfolio contains no loans to foreign borrowers nor does it have a material volume of highly leveraged transaction lending.
| LOAN SUMMARY | |||||||||||||||||||||||||||||||||||
| (Dollars in thousands) | |||||||||||||||||||||||||||||||||||
| As of December 31, | |||||||||||||||||||||||||||||||||||
| 2007 | 2006 | 2005 | 2004 | 2003(2) | |||||||||||||||||||||||||||||||
| $ | % | $ | % | $ | % | $ | % | $ | % | ||||||||||||||||||||||||||
| Summary of Loans by Type | |||||||||||||||||||||||||||||||||||
Commercial, secured by real estate | $ | 100,278 | 28.9 | % | $ | 101,786 | 29.6 | % | $ | 85,989 | 26.2 | % | $ | 101,567 | 31.3 | % | $ | 101,325 | 30.5 | % | |||||||||||||||
Commercial, other | 40,438 | 11.7 | 43,981 | 12.8 | 49,362 | 15.0 | 40,923 | 12.6 | 38,063 | 11.5 | |||||||||||||||||||||||||
Real estate construction | 24,035 | 6.9 | 11,303 | 3.3 | 11,070 | 3.4 | 5,906 | 1.8 | 5,414 | 1.6 | |||||||||||||||||||||||||
Real estate mortgage | 133,776 | 38.6 | 138,795 | 40.4 | 134,570 | 40.9 | 128,243 | 39.5 | 126,134 | 38.0 | |||||||||||||||||||||||||
Agricultural | 1,845 | 0.5 | 1,930 | 0.5 | 1,670 | 0.5 | 2,380 | 0.7 | 3,032 | 0.9 | |||||||||||||||||||||||||
Consumer | 41,893 | 12.1 | 42,188 | 12.3 | 42,096 | 12.8 | 44,470 | 13.7 | 56,216 | 17.0 | |||||||||||||||||||||||||
Other | 4,305 | 1.3 | 3,814 | 1.1 | 3,960 | 1.2 | 1,438 | 0.4 | 1,610 | 0.5 | |||||||||||||||||||||||||
Total loans | $ | 346,570 | 100.0 | % | $ | 343,797 | 100.0 | % | $ | 328,717 | 100.0 | % | $ | 324,927 | 100.0 | % | $ | 331,794 | 100.0 | % | |||||||||||||||
| Non-performing Assets | |||||||||||||||||||||||||||||||||||
Non-accrual loans | $ | 3,157 | $ | 4,698 | $ | 3,751 | $ | 6,847 | $ | 11,958 | |||||||||||||||||||||||||
Accruing loans which are contractually past due 90days or more | 987 | 992 | 853 | 739 | 4,137 | ||||||||||||||||||||||||||||||
Restructured loans | 1,489 | 1,268 | 1,540 | 238 | 104 | ||||||||||||||||||||||||||||||
Total non-performing and restructured loans | 5,633 | 6,958 | 6,144 | 7,824 | 16,199 | ||||||||||||||||||||||||||||||
| Other real estate acquired through foreclosures | 174 | 495 | 2,049 | 2,247 | 3,187 | ||||||||||||||||||||||||||||||
Total non-performing and restructured loans andother real estate | $ | 5,807 | $ | 7,453 | $ | 8,193 | $ | 10,071 | $ | 19,386 | |||||||||||||||||||||||||
| Non-performing and restructured loans as a % oftotal loans | 1.63 | % | 2.02 | % | 1.87 | % | 2.41 | % | 4.88 | % | |||||||||||||||||||||||||
Non-performing and restructured loans and otherreal estate as a % of total assets(1) | 1.06 | % | 1.39 | % | 1.55 | % | 1.87 | % | 3.57 | % | |||||||||||||||||||||||||
| Allocation of Allowance for Loan Losses | |||||||||||||||||||||||||||||||||||
Commercial, other | $ | 689 | 13.5 | % | $ | 839 | 14.4 | % | $ | 1,071 | 16.7 | % | $ | 1,734 | 13.7 | % | $ | 4,166 | 12.9 | % | |||||||||||||||
Real estate, construction | 237 | 6.9 | 117 | 3.3 | 134 | 3.4 | 83 | 1.8 | 662 | 1.6 | |||||||||||||||||||||||||
Real estate, other | 3,092 | 67.5 | 3,395 | 70.0 | 3,810 | 67.1 | 4,276 | 70.8 | 4,886 | 68.5 | |||||||||||||||||||||||||
Consumer installment | 259 | 12.1 | 521 | 12.3 | 772 | 12.8 | 1,255 | 13.7 | 2,478 | 17.0 | |||||||||||||||||||||||||
Unallocated | 2,220 | 1,789 | 2,105 | 2,036 | 2,108 | ||||||||||||||||||||||||||||||
Total | $ | 6,497 | 100.0 | % | $ | 6,661 | 100.0 | % | $ | 7,892 | 100.0 | % | $ | 9,384 | 100.0 | % | $ | 14,300 | 100.0 | % | |||||||||||||||
(1) From continuing operations | |||||||||||||||||||||||||||||||||||
PREMIER FINANCIAL BANCORP, INC.
MANAGEMENT’S DISCUSSION AND ANALYSIS
December 31, 2007
In addition to the loans presented in the loan summary table, Premier also offers certain off-balance sheet products such as letters of credit, revolving credit agreements, and other loan commitments. These products are offered under the same credit standards as the loan portfolio and are included in the risk-based capital ratios used by the Federal Reserve to evaluate capital adequacy. Additional information on off-balance sheet commitments is contained in Note 16 to the consolidated financial statements.
Total non-performing assets, which consist of past-due loans on which interest is not being accrued ("non accrual loans"), foreclosed properties in the process of liquidation ("OREO"), loans with restructured terms to enable a delinquent borrower to repay and accruing loans past due 90 days or more, were $5.8 million or 1.06% of total assets at year-end 2007. The amount continues to decline from the $7.5 million or 1.39% of total assets at year-end 2006 and the $8.2 million or 1.55% of total assets at year-end 2005. The decrease in 2007 was largely due a $1.5 million decrease in non-accrual loans and a continued decrease in OREO property. These decreases offset the increase in restructured loans, while loans past due 90 days or more and still accruing remained virtually unchanged. The decrease in 2006 was largely due to the $1.6 million reduction in OREO property, which was partially offset by an increase in non-accrual loans. As the collection or rehabilitation of previously delinquent loans and charge-offs of loans determined to be uncollectible continued in 2006, these efforts were offset by other loans newly placed on non-accrual status. In 2007, the level of non-accrual loans declined primarily as a result of loan payoffs as well as partial or complete loan charge-offs. Management believes the estimated potential losses related to delinquent loans to be adequately provided for in the allowance for loan losses. These losses were also included in the analyses that supported the recording of negative loan loss provisions during 2006 and the second quarter of 2007. The decrease in non-performing assets in 2005 was due to the collection or rehabilitation of previously delinquent loans, the charge-offs of loans determined to be uncollectible and the sale of $1.7 million of OREO property. As management's efforts to collect these loans upon maturity continue, loans are only renewed using Premier's strengthened credit policies. Otherwise, loans may be placed on non-accrual status and foreclosure proceedings begun to obtain and liquidate any collateral securing the past due or matured loans. Premier is committed to continuing to reduce its level of non-performing assets and maintaining strong underwriting standards to help maintain a lower level of non-performing assets in the future. This effort is revealed in the decline in non-performing assets from the end of 2003 to the end of 2007, primarily related to the sale of OREO properties and the decline in non-accrual loans and loans 90+ days past due. Premier's efforts at its other affiliate banks in 2003 and 2004 were masked by the high level of non-performing assets at Farmers Deposit Bank, which alone totaled $12.5 million at December 31, 2003. At December 31, 2004, the non-performing assets at Farmers Deposit Bank had declined to $6.8 million, leaving $3.3 million of total non-performing assets at the other Affiliate Banks combined. By December 31, 2007, total non-performing assets at Farmers Deposit Bank had declined to $2.4 million.
PREMIER FINANCIAL BANCORP, INC.
MANAGEMENT’S DISCUSSION AND ANALYSIS
December 31, 2007
The Loan Summary table presents five years of comparative non-performing asset information. Other than these loans and the impaired loans discussed in Note 4 to the consolidated financial statements, Premier does not have a significant volume of loans where management has serious doubts about the borrowers’ ability to comply with the present repayment terms of the loan.
It is Premier's policy to place loans that are past due over 90 days on non-accrual status, unless the loans are adequately secured and in the process of collection. Premier had no commitments to provide additional funds on non-accrual loans at December 31, 2007. For real estate loans, upon repossession, the balance of the loan is transferred to "Other Real Estate Owned" (OREO) and carried at the lower of the outstanding loan balance or the fair value of the property based on current appraisals and other current market trends, less estimated disposal costs. If a writedown of the OREO property is necessary at the time of foreclosure, the amount is charged against the allowance for loan losses. A periodic review of the recorded property value is performed in conjunction with normal loan reviews, and if market conditions indicate that the recorded value exceeds the fair market value less estimated disposal costs, additional writedowns of the property value are charged directly to operations.
During 2007 Premier recognized a $20,000 net profit on the disposition of OREO properties, net of writedowns, while in 2006 Premier realized $105,000 net profit on the disposition of OREO properties. During 2005, Premier realized a $17,000 net profit on the disposition of OREO properties. Although loans may be classified as non-performing, some continue to pay interest irregularly or at less than originally contracted terms. During 2007, approximately $234,000 of interest was recognized on non-accrual and restructured loans, while approximately $302,000 would have been recognized in accordance with their original terms.
The allowance for loan losses is maintained to absorb probable incurred losses associated with lending activities. Actual losses are charged against the allowance ("charge-offs") while collections on loans previously charged off ("recoveries") are added back to the allowance. Since actual losses within a given loan portfolio are difficult to predict, management uses a significant amount of estimation and judgment to determine the adequacy of the allowance for loan losses. Factors considered in determining the adequacy of the allowance include an individual assessment of risk on certain loans and total creditor relationships, historical charge-off experience, the type of loan, levels of non-performing and past due loans, and an evaluation of current economic conditions. Loans are evaluated for credit risk and assigned a risk grade. Premier's risk grading criteria are based upon Federal Reserve guidelines and definitions. In evaluating the adequacy of the allowance for loan losses, loans that are assigned passing grades are grouped together and multiplied by historical charge-off percentages to determine an estimated amount of potential losses and a corresponding amount of allowance. Loans that are assigned marginally passing grades are grouped together and allocated slightly higher percentages to determine the estimated amount of potential losses due to the identification of increased risk(s). Loans that are assigned a grade of "substandard" or "doubtful" are usually determined to be impaired.
PREMIER FINANCIAL BANCORP, INC.
MANAGEMENT’S DISCUSSION AND ANALYSIS
December 31, 2007
A loan is categorized and reported as impaired when it is probable that the borrower will be unable to pay all of the principal and interest amounts according to the contractual terms of the loan agreement. In determining whether a loan is impaired, management considers such factors as past payment history, recent economic events, current and projected financial conditions and other relevant information that is available at the time. Impairment is evaluated in total for smaller-balance loans of similar nature such as residential mortgage, consumer, and credit card loans, and on an individual basis for other loans. If a loan is deemed to be impaired, an evaluation of the amount of estimated loss is performed assessing the present value of estimated future cashflows using the loan's existing rate or assessing the fair and realizable value of the loan collateral if repayment is expected solely from the collateral. The estimation of loss is assigned to the impaired loan and is used in determining the adequacy of the allowance for loan losses. For impaired loans, this estimation of loss is reevaluated quarterly and, if necessary, adjusted based upon the current known facts and circumstances related to the loan and the borrower. Additional information on Premier's impaired loans is contained in Note 4 to the consolidated financial statements. The sum of the calculations and estimations of the risk of loss in a given loan portfolio is compared to the recorded balance of the allowance for loan losses. If the total allowance is deemed to be inadequate a charge to earnings is recorded to increase the allowance. Conversely, should an evaluation of the allowance result in a lower estimate of the risk of loss in the loan portfolio and the allowance is deemed to be more than adequate, a reversal of previous charges to earnings ("a negative provision") may be warranted in the current period. Events that may lead to negative provisions include greater than anticipated recoveries, a reduction in the historical loss ratios, securing more collateral on an impaired loan during the collection process, or receiving payment in full on an impaired loan. All of these events occurred in varying degrees during 2007 and 2006 and resulted in $78,000 of negative provisions during 2007 and $1,161,000 of negative provisions during 2006.
At December 31, 2007, the allowance for loan losses was $6.5 million, or 1.87% of total year-end loans. This ratio is a decrease from the prior year’s 1.94% and the 2.40% at the end of 2005. The decrease in the allowance in 2007 was primarily the result of the $78,000 of negative provisions for loan losses coupled with $86,000 of net charge-offs recorded during the year. The decrease in the allowance in 2006 was primarily the result of the $1.2 million of negative provisions for loan losses recorded during the year, as charge-offs in 2006 were nearly offset by recoveries. The decrease in 2005 was the result of the charge-off of $2.2 million of loans previously identified as impaired partially offset by $719,000 of recoveries. Only $4,000 of provision expense was recorded in 2005. In management's opinion, the allowance for loan losses is adequate to absorb the current estimated risk of loss in the existing loan portfolio. The summary of the allowance for loan losses allocated by loan type is presented in the Loan Summary Table above.
The following table provides a detailed history of the allowance for loan losses, illustrating charge-offs and recoveries by loan type, and the annual provision for loan losses over the past five years. In 2007, a negative provision was recorded during the second quarter which exceeded the quarterly provisions recorded during the other three quarters of the year. In 2006, negative provisions were recorded in each of the four quarters of the year. The negative
PREMIER FINANCIAL BANCORP, INC.
MANAGEMENT’S DISCUSSION AND ANALYSIS
December 31, 2007
provisions were recorded primarily as result of realized collections of previously impaired loans whereby estimated losses were previously assigned to the loan. In addition, Premier has been successful in recovering some of its previously charged-off loans. These positive events as well as the ongoing reduction in Premier’s historical loss ratios resulted in a lower estimate of the risk of loss in the loan portfolio and, thus, negative provisions were warranted. The negative provision for loan losses totaled $78,000 in 2007 and $1,161,000 in 2006.
| SUMMARY OF LOAN LOSS EXPERIENCE | ||||||||||||||||||||
| (Dollars in thousands) | ||||||||||||||||||||
| For the Year Ended December 31 | ||||||||||||||||||||
| 2007 | 2006 | 2005 | 2004 | 2003(1) | ||||||||||||||||
| Allowance for loan losses, beginning of period | $ | 6,661 | $ | 7,892 | $ | 9,384 | $ | 14,300 | $ | 9,698 | ||||||||||
| Amounts charged off: | ||||||||||||||||||||
Commercial, financial and agricultural loans | 83 | 154 | 736 | 1,520 | 4,417 | |||||||||||||||
Real estate construction loans | 0 | 0 | 0 | 5 | 0 | |||||||||||||||
Real estate loans – other | 239 | 863 | 549 | 2,413 | 6,427 | |||||||||||||||
Consumer installment loans | 436 | 393 | 930 | 3,054 | 5,669 | |||||||||||||||
Total charge-offs | 758 | 1,410 | 2,215 | 6,992 | 16,513 | |||||||||||||||
| Recoveries on amounts previously charged-off: | ||||||||||||||||||||
Commercial, financial and agricultural loans | 66 | 266 | 91 | 264 | 145 | |||||||||||||||
Real estate construction loans | 14 | 8 | 1 | 1 | 37 | |||||||||||||||
Real estate loans – other | 302 | 340 | 84 | 87 | 74 | |||||||||||||||
Consumer installment loans | 290 | 726 | 543 | 698 | 346 | |||||||||||||||
Total recoveries | 672 | 1,340 | 719 | 1,050 | 602 | |||||||||||||||
| Net charge-offs | 86 | 70 | 1,496 | 5,942 | 15,911 | |||||||||||||||
| Provision for loan losses | (78 | ) | (1,161 | ) | 4 | 1,026 | 20,513 | |||||||||||||
| Allowance for loan losses, end of period | $ | 6,497 | $ | 6,661 | $ | 7,892 | $ | 9,384 | $ | 14,300 | ||||||||||
| Average total loans | $ | 344,688 | $ | 338,336 | $ | 326,615 | $ | 325,610 | $ | 352,156 | ||||||||||
| Total loans at year-end | 346,570 | 343,797 | 328,717 | 324,927 | 331,794 | |||||||||||||||
| As a percent of average loans | ||||||||||||||||||||
Net charge-offs | 0.02 | % | 0.02 | % | 0.46 | % | 1.82 | % | 4.52 | % | ||||||||||
Provision for loan losses | (0.02 | )% | (0.34 | )% | 0.00 | % | 0.32 | % | 5.83 | % | ||||||||||
Allowance for loan losses | 1.88 | % | 1.97 | % | 2.42 | % | 2.88 | % | 4.06 | % | ||||||||||
| As a percent of total loans at year-end | ||||||||||||||||||||
Allowance for loan losses | 1.87 | % | 1.94 | % | 2.40 | % | 2.89 | % | 4.31 | % | ||||||||||
| As a multiple of net charge-offs | ||||||||||||||||||||
Allowance for loan losses | 75.55 | X | 95.16 | X | 5.28 | X | 1.58 | X | 0.90 | X | ||||||||||
Income before tax and provision for loan losses | 122.22 | X | 123.19 | X | 4.32 | X | 0.65 | X | 0.35 | X | ||||||||||
PREMIER FINANCIAL BANCORP, INC.
MANAGEMENT’S DISCUSSION AND ANALYSIS
December 31, 2007
Future provisions to the allowance for loan losses, positive or negative, will depend on future improvement or deterioration in estimated credit risk in the loan portfolio as well as whether additional payments are received on loans having significant credit risk. The provision for loan losses in 2005 was only $4,000. During the third and fourth quarters of 2005, negative provisions were recorded substantially offsetting the provisions recorded during the first half of the year. During the latter half of 2005, Premier realized collections of previously impaired loans for which estimated losses had been previously assigned to the loan, as well as recoveries of previously charged-off loans. Premier continually evaluates the adequacy of its allowance for loan losses, and changes in the provision are based on the estimated probable incurred losses in the loan portfolio.
Net charge-offs in 2007 totaled $86,000, as $758,000 of loans charged-off were nearly offset by $672,000 of recoveries of loans previously charged-off. Net charge-offs in 2006 decreased to just $70,000, as $1,340,000 of recoveries nearly offset $1,410,000 of charge-offs recorded during the year. In comparison, net charge-offs in 2005 totaled $1.5 million. In 2007, Farmers Deposit Bank recorded $296,000 of net recoveries and provided over 70% of the Company’s total recoveries for 2007. In 2006, Farmers Deposit Bank recorded $249,000 of net recoveries and provided nearly 70% of the Company’s total recoveries for 2006. These recoveries are primarily the result of continued collection efforts of the significant number and amount of loans charged-off at Farmers Deposit Bank in 2003 through 2005. Approximately $641,000, or 43% of the 2005 net charge-offs and $4.8 million, or 81% of the Premier’s 2004 net charge-offs were at Farmers Deposit Bank. The level of future recoveries is likely to decrease as the level of past charge-offs has decreased.
Over the past three years, total charge-offs have continued to decline. In 2007, charge-offs on consumer installment loans increased by $43,000 or 10.9%. However, the increase was more than offset by decreases in the level of charge-offs of commercial loans and loans secured by real estate. While total charge-offs decreased in 2006, the level of loans secured by real estate that were charged-off increased by $314,000 or 57.2% as collection efforts on a few real estate secured borrowers came to their ultimate conclusion. All categories of loan charge-offs were down in 2005, while consumer loan charge-offs continued to exceed the other categories of loan charge-offs. Although management believes it has identified the significant remaining credit risk in the loan portfolio, additional charge-offs may be recorded in the coming months due to the level of non-performing loans and the resolution of collection efforts on those loans. Premier continues to make a significant effort to reduce its past due and non-performing loans by reviewing loan files, using the courts to bring borrowers current with the terms of their loan agreements and/or the foreclosure and sale of OREO properties. As in the past, when these plans are executed, Premier may experience increases in non-performing loans and non-performing assets. Furthermore, any resulting increases in loans placed on non-accrual status will have a negative impact on future loan interest income. Also, as these plans are executed, other loans may be identified that would necessitate additional charge-offs and potentially
PREMIER FINANCIAL BANCORP, INC.
MANAGEMENT’S DISCUSSION AND ANALYSIS
December 31, 2007
additional provisions for loan losses. Premier continues to monitor and evaluate the impact that national housing market price declines may have on its local markets and collateral valuations as management evaluates the adequacy of the allowance for loan losses. While some price deterioration is expected, it is not currently anticipated that Premier’s markets will be impacted as severely as other areas of the country due to the historically modest increases in real estate values in the Company’s markets. These factors are considered in determining the adequacy of the allowance for loan losses, which at December 31, 2007 was 1.87% of total loans outstanding and 115% of non-performing loans.
The following table presents the maturity distribution and interest sensitivity of selected loan categories at December 31, 2007. Maturities are based upon contractual terms.
| LOAN MATURITIES and INTEREST SENSITIVITY | ||||||||||||||||
| December 31, 2007 | ||||||||||||||||
| (Dollars in thousands) | ||||||||||||||||
| Projected Maturities* | ||||||||||||||||
| One Year or Less | One Through Five Years | Over Five Years | Total | |||||||||||||
| Commercial, secured by real estate | $ | 35,778 | $ | 53,997 | $ | 10,503 | $ | 100,278 | ||||||||
| Commercial, other | 18,239 | 21,031 | 1,168 | 40,438 | ||||||||||||
| Real estate construction | 13,368 | 6,056 | 4,611 | 24,035 | ||||||||||||
| Agricultural | 1,025 | 552 | 268 | 1,845 | ||||||||||||
Total | $ | 68,410 | $ | 81,636 | $ | 16,550 | $ | 166,596 | ||||||||
| Fixed rate loans | $ | 16,339 | $ | 29,740 | $ | 4,056 | $ | 50,135 | ||||||||
| Floating rate loans | 52,071 | 51,896 | 12,494 | 116,461 | ||||||||||||
Total | $ | 68,410 | $ | 81,636 | $ | 16,550 | $ | 166,596 | ||||||||
| Fixed rate loans projected to mature after one year | $ | 33,796 | ||||||||||||||
| Floating rate loans projected to mature after one year | 64,390 | |||||||||||||||
Total | $ | 98,186 | ||||||||||||||
| (*) Based on scheduled or approximate repayments | ||||||||||||||||
PREMIER FINANCIAL BANCORP, INC.
MANAGEMENT’S DISCUSSION AND ANALYSIS
December 31, 2007
Investment Portfolio and
Other Earning Assets
Investment securities averaged $126.6 million in 2007, down $8.6 million or 6.4% from the $135.2 million averaged in 2006. This decrease follows a $14.8 million or 9.9% decrease in 2006 from the $150.0 million averaged in 2005. As investments matured in 2007 and 2006, not all funds were reinvested in the investment portfolio. Some funds were used to satisfy loan growth, deposit withdrawals and debt payments. Furthermore, during the latter part of 2006 and first half of 2007, bond reinvestment yields were not as attractive as the yield on highly liquid federal funds sold and funds from maturing investments were less likely to be reinvested in bonds. At December 31, 2007, the amount of investments totaled $124.2 million, up $2.9 million from December 31, 2006. This follows a $16.1 million decrease in 2006 from the balance at December 31, 2005. As the Federal Reserve Board has lowered the federal funds rate in the latter portion of 2007, bond yields have become more attractive than the yield on federal funds sold. Thus, to optimize interest income, Premier has begun increasing the amount of funds it has invested in high-quality debt securities.
The following table presents the carrying values of investment securities.
| FAIR VALUE OF SECURITIES AVAILABLE FOR SALE | ||||||||||||
| (Dollars in thousands) | ||||||||||||
| As of December 31 | ||||||||||||
| 2007 | 2006 | 2005 | ||||||||||
| U.S. Treasury securities | $ | 5,574 | $ | 6,401 | $ | 3,941 | ||||||
| U.S. Agency securities | 74,859 | 76,911 | 95,300 | |||||||||
| States and political subdivisions | 3,816 | 3,413 | 2,514 | |||||||||
| Mortgage-backed securities | 39,993 | 34,617 | 35,639 | |||||||||
| Corporate securities | - | 25 | 25 | |||||||||
Total securities | $ | 124,242 | $ | 121,367 | $ | 137,419 | ||||||
As sources of funds (deposits, federal funds purchased, and repurchase agreements with corporate customers) fluctuate, excess funds are initially invested in federal funds sold and other short-term investments. Based upon analyses of asset/liability repricing, interest rate forecasts, and liquidity requirements, funds are periodically reinvested in high-quality debt securities, which typically mature over a longer period of time. At the time of purchase, management determines whether the securities will be classified as trading, available-for-sale, or held-to-maturity. At December 31, 2007 all of Premier's investments were classified as available-for-sale and carried on the books at market value.
PREMIER FINANCIAL BANCORP, INC.
MANAGEMENT’S DISCUSSION AND ANALYSIS
December 31, 2007
As shown in the following Securities Maturity and Yield Analysis table, the average maturity period of the securities available-for-sale at December 31, 2007 was 8 years 8 months, lengthened somewhat by the 13 year 4 month average final maturity of the mortgage-backed securities portfolio. The table uses a final maturity method to report the average maturity of mortgage-backed securities, which excludes the effect of monthly payments and prepayments. Approximately 65% of Premier's investment securities are U.S. Government agency or Treasury securities that have an average maturity of 3 years 4 months. The average maturity of the investment portfolio is managed at a level to maintain a proper matching with interest rate risk guidelines. Premier does not have any securities classified as trading or held-to-maturity and it has no plans to establish such classifications at the present time. Other information regarding investment securities may be found in the following table and in Note 3 to the consolidated financial statements.
| SECURITIES MATURITY AND YIELD ANALYSIS | ||||||||||||
| December 31, 2007 | ||||||||||||
| (Dollars in thousands) | ||||||||||||
| Market Value | Average Maturity (yrs/mos) | Taxable Equivalent Yield* | ||||||||||
| U.S. Treasury securities | ||||||||||||
Within one year | $ | 2,004 | 4.42 | % | ||||||||
After one but within five years | 3,570 | 4.34 | ||||||||||
Total U.S. Treasury Securities | 5,574 | 1/9 | 4.37 | |||||||||
| U.S. Government Agencies securities | ||||||||||||
Within one year | 28,731 | 3.93 | ||||||||||
After one but within five years | 39,091 | 4.84 | ||||||||||
After five but within ten years | 7,037 | 5.23 | ||||||||||
Total U.S. Government Agencies securities | $ | 74,859 | 3/6 | 4.53 | ||||||||
| States and political subdivisions | ||||||||||||
Within one year | 227 | 6.52 | ||||||||||
After one but within five years | 660 | 6.41 | ||||||||||
After five but within ten years | 2,766 | 5.57 | ||||||||||
Over ten years | 163 | 5.96 | ||||||||||
Total states and political subdivisions securities | $ | 3,816 | 7/2 | 5.79 | ||||||||
| Mortgage-backed securities** | ||||||||||||
After one but within five years | 383 | 4.50 | ||||||||||
After five but within ten years | 2,386 | 4.40 | ||||||||||
Over ten years | 37,224 | 4.83 | ||||||||||
Total mortgage-backed securities | $ | 39,993 | 13/4 | 4.80 | ||||||||
| Total securities available-for-sale | $ | 124,242 | 8/8 | 4.65 | ||||||||
| (*) Fully tax-equivalent using the rate of 34% | ||||||||||||
| (**) Maturities for mortgage-backed securities are based on final maturity | ||||||||||||
PREMIER FINANCIAL BANCORP, INC.
MANAGEMENT’S DISCUSSION AND ANALYSIS
December 31, 2007
Premier's average investment in federal funds sold and other short-term investments increased by 48.1% in 2007. This follows a 5.6% increase in 2006. Averaging $36.1 million in 2007, federal funds sold and other short-term investments increased $11.8 million from the $24.4 million averaged in 2006. The increase in average federal funds sold in 2007 was the result of retaining available funds to be used in the short-term to fund loans and satisfy deposit withdrawals. Furthermore, during the latter part of 2006 and first part of 2007, bond yields were not as attractive as the yield on highly liquid federal funds sold and funds from maturing investments were less likely to be invested in bonds. As shown in the Consolidated Average Balance Sheets and Net Interest Income Analysis above, on average, federal funds sold yielded 5.07% in 2007 and 4.99% in 2006. In each year, this yield was higher than the yield earned on U.S. Treasury and Agency securities as well as mortgage backed securities. The increase in average federal funds sold in 2006 was, likewise, the result of retaining available funds to be used in the short-term to fund loans or satisfy deposit withdrawals. Fluctuations in federal funds sold and other short-term investments reflect management's goal to maximize asset yields while maintaining proper asset/liability structure, as discussed in greater detail above and in other sections of this report.
Funding Sources
In 2005, Premier began raising the rates paid on its interest bearing deposits in response to the increase in market interest rates. Market rates continued to increase through 2007. As a result, the average rate paid on interest bearing liabilities increased to 3.09% in 2007, up from the 2.73% paid in 2006, and the 2.30% paid in 2005. The 36 basis point increase in 2007 was primarily the result of a 71 basis point increase in the average rate paid on certificates of deposit and other time deposits, which made up 50.1% of the total average interest bearing liabilities in 2007. During 2007, Premier was able to offset some of the increase in rates paid on deposits by long-term debt refinancing actions taken in 2006 and prepaying approximately $2.1 million of amortizing FHLB advances in the first quarter of 2007. In 2006, Premier refinanced the remaining $15.5 million of its 9.75% Trust Preferred Securities with variable rate bank borrowings as discussed in more detail below. In 2006, the 43 basis point increase in the average rate paid on interest bearing liabilities was primarily the result of an 85 basis point increase in the average rate paid on certificates of deposit and other time deposits, which made up 46.7% of the total average interest bearing liabilities in 2006. During 2006, Premier was able to offset some of the increase in rates paid on deposits by reducing the interest cost on its long-term debt by the Trust Preferred Securities refinancing. Due to alternative sources of investment and an ever increasing sophistication of customers in funds management techniques to maximize return on their money, competition for funds has become more intense. Premier's banks periodically offer special rate products to attract additional deposits.
Premier’s deposits, on average, increased by $7.4 million or 1.7% in 2007 following a $571,000 or 0.1% decrease in 2006 from 2005 average deposits. The increase in 2007 average deposits was from a combination of a $14.1 million increase in average certificates of deposit
PREMIER FINANCIAL BANCORP, INC.
MANAGEMENT’S DISCUSSION AND ANALYSIS
December 31, 2007
and other time deposits plus a $1.7 million increase in non-interest bearing deposits. These increases more than offset a $9.2 million decrease in average NOW and money market deposits. During 2007, as rates paid on certificates of deposits increased, particularly short-term certificates of deposit, customers reallocated their funds from lower yielding transactional deposits such as NOW and money market accounts to these short—term certificates of deposit.
Premier’s deposits, on average, remained relatively unchanged in 2006, decreasing by $571,000 or 0.1% from 2005 average deposits. While average deposits in 2006 remained relatively unchanged in total, the composition of those deposits shifted toward non-interest bearing deposits. In addition, some public fund and tax-exempt organization deposits were reestablished as repurchase agreements in 2006. Average repurchase agreements increased by $1.3 million or 16.4% in 2006 when compared to 2005. In 2007, average repurchase agreements increased by $3.6 million or 37.5%, reflecting the growth in those deposits during latter half of 2006. Also, in both 2006 and 2007, the growth in deposits has been dampened by a decline in deposits at Farmers Deposit Bank. In 2006, average deposits at Farmers Deposit Bank declined by $4.7 million, while in Premier’s other markets, deposits, on average, increased by $4.2 million or 1.1% during 2006. In 2007, average deposits at Farmers Deposit Bank declined by $3.3 million, while in Premier’s other markets, deposits, on average, increased by $10.8 million or 2.8%. Farmers Deposit Bank faces stiff competition for funds from local competitors who have paid higher than market rates for the certificates of deposit.
In 2007, average non-interest bearing deposits continued to increase, surpassing 2006 average non-interest bearing deposits by $1.7 million or 2.4%. This follows a $5.9 million, or 8.9% increase in average non-interest bearing deposits in 2006 when compared to 2005. Since no interest is paid on these deposits, an increase in non-interest bearing deposits helps to increase Premier's net interest margin and its profitability. Non-interest bearing deposits are more susceptible to withdrawal and therefore may provide challenges to maintaining adequate liquidity. (See the additional discussion on liquidity below.) However, Premier’s approach to community banking and friendly customer service has resulted in increases in average non-interest bearing deposits in each of the past five years.
In 2007, average interest bearing deposits increased by $5.6 million or 1.5%. The increase was primarily from an increase in average certificates of deposit and other time deposits as customers sought out higher yielding short-term “special “rates. While offering some “special” certificate of deposit rates, in 2007 Premier continued to focus on building its base of customer relationships by offering more convenient electronic banking products to its non-interest bearing deposit customers. Premier did realize a shift in its interest bearing deposits from lower cost interest bearing transaction accounts to certificates of deposit as customers moved their funds to take advantage of the rising interest rates paid on these certificates. The result was a 51 basis point increase in the average rate paid on interest bearing deposits in 2007. However, Premier also realized an increase in its average savings deposits in 2007. In 2006, average interest bearing deposits decreased by $6.5 million or 1.7%. This decrease
PREMIER FINANCIAL BANCORP, INC.
MANAGEMENT’S DISCUSSION AND ANALYSIS
December 31, 2007
was largely due to the stiff competition for funds in 2006 and high rate certificate of deposits “specials” offered by some of Premier’s local competition. Some of these “special” rates exceeded the yields that Premier could earn by purchasing investments and therefore matching the competition’s rates would have resulted in reducing Premier’s net interest income. Similar to 2007, in 2006 Premier realized a shift in its interest bearing deposits from lower cost savings and interest bearing transaction accounts to certificates of deposit as customers moved their funds to take advantage of the rising interest rates paid on these certificates. The result was a 64 basis point increase in the average rate paid on interest bearing deposits in 2006.
The following table provides information on the maturities of time deposits of $100,000 or more at December 31, 2007.
| MATURITY OF TIME DEPOSITS $100,000 OR MORE | ||||
| December 31, 2007 | ||||
| (Dollars in thousands) | ||||
| Maturing 3 months or less | $ | 12,566 | ||
| Maturing over 3 months | 13,845 | |||
| Maturing over 6 months | 18,397 | |||
| Maturing over 12 months | 10,537 | |||
Total | $ | 55,345 | ||
Other funding sources for Premier include short and long-term borrowings. Premier's short-term borrowings primarily consist of securities sold under agreements to repurchase with commercial, public entity and tax exempt organization customers. These are short-term non-FDIC insured deposit like products that are secured by the pledging of investment securities in Premier’s investment portfolio. Also included in short-term borrowings are federal funds purchased from other banks. These short-term borrowings fluctuate depending on near term funding needs and as part of Premier's management of its asset/liability mix. In 2007, short-term borrowings averaged $13.2 million, up $3.6 million or 37.6% from the average in 2006. The increase is largely due to an increase in repurchase agreements which were newly offered by two of Premier’s subsidiary banks late in 2006. In 2006, short-term borrowings averaged $9.6 million, up $1.2 million or 13.9% from the average in 2005 primarily due to the increase in repurchase agreements discussed above.
Long-term borrowings consist of Federal Home Loan Bank (FHLB) borrowings by Premier's banks, other borrowings by the parent holding company and, prior to 2007, debt issued in the form of subordinated debentures to an unconsolidated trust subsidiary. FHLB advances, on average, declined by 31.4% or $2.5 million in 2007, following a 10.9% or $960,000 decrease in 2006. In the first quarter of 2007, Premier prepaid $2.1 million of its amortizing FHLB advances in an effort to reduce its cost of funds rate. These advances had contractual fixed rates between 5.30% and 5.60%, averaging 5.46%. In 2006, FHLB advances, on average, declined by 10.9% or $960,000. Premier uses fixed rate FHLB advances from time-to-time to fund certain residential and commercial loans as well to maximize investment opportunities as
PREMIER FINANCIAL BANCORP, INC.
MANAGEMENT’S DISCUSSION AND ANALYSIS
December 31, 2007
part of its interest rate risk management. In addition to the prepayment in the first quarter of 2007 described above, Premier made all of its scheduled principal payments in 2007 and 2006, and took advantage of penalty free prepayment opportunities as they became available. At December 31, 2007, FHLB advances totaled $4.8 million and had repayment schedules from three to five years with $4.0 million maturing in 2010.
In 2006, Premier refinanced the remaining $15.7 million of its 9.75% Junior Subordinated Deferrable Interest Debentures ("Subordinated Debentures") that were due in 2027. The refinancing was accomplished using two separate bank borrowings at the parent company and $2.2 million of cash held by the parent in its subsidiary banks. On January 31, 2006, Premier borrowed $7.0 million from First Guaranty Bank in Hammond, Louisiana under a promissory note bearing interest floating daily at the “Wall Street Journal” prime rate and requiring monthly principal payments of $50,000 until maturity on September 28, 2017. The note is secured by a pledge of Premier’s 100% interest in Boone County Bank. The proceeds of this note were used to redeem $7.0 million of the Subordinated Debentures as of January 31, 2006. On November 10, 2006, Premier borrowed $6.5 million from The Bankers’ Bank of Kentucky, Inc. of Frankfort, Kentucky (“Bankers’ Bank”) under a term note bearing interest floating daily at the “Wall Street Journal” prime rate minus 1.00% and requiring 83 monthly principal and interest payments of $100,000 and a final payment of any balance due at maturity on November 9, 2013. The note is secured by a pledge of Premier’s 100% interest in Citizens Deposit Bank and Trust, Inc. and Premier’s 100% interest in Farmers-Deposit Bank, Eminence, Kentucky. In 2007 and 2006, Premier made all scheduled principal and interest payments as well as limited prepayments on the borrowing from First Guaranty Bank. Also during 2006, Premier repaid two $701,000 subordinated notes with a 0% interest rate. For more information on other borrowings, see Note 9 to the consolidated financial statements.
| PAYMENTS DUE ON CONTRACTUAL OBLIGATIONS | ||||||||||||||||||||
| December 31, 2007 | ||||||||||||||||||||
| (Dollars in thousands) | ||||||||||||||||||||
| Total | Less than one year | 1-3 years | 3-5 years | More than five years | ||||||||||||||||
| Federal Home Loan Bank advances | $ | 4,843 | $ | 185 | $ | 4,394 | $ | 264 | $ | 0 | ||||||||||
| Other borrowed funds | 8,412 | 1,512 | 3,181 | 3,145 | 574 | |||||||||||||||
| Operating lease obligations | 440 | 158 | 164 | 116 | 2 | |||||||||||||||
| Data and item processing contracts* | 3,822 | 1,788 | 2,034 | 0 | 0 | |||||||||||||||
Total | $ | 17,517 | $ | 3,643 | $ | 9,773 | $ | 3,525 | $ | 576 | ||||||||||
| * Data and item processing contractual obligations are estimated using the average billing for the last three months of 2007. | ||||||||||||||||||||
On December 20, 2004, Premier entered into a sixty-three month contract with Fiserv Solutions, Inc. (Fiserv) whereby Fiserv will provide data processing and item processing services to Premier. Conversions by Premier's subsidiary banks to Fiserv systems began on April 15, 2005 and were completed by July 31, 2005. Based upon the average billings of the last
PREMIER FINANCIAL BANCORP, INC.
MANAGEMENT’S DISCUSSION AND ANALYSIS
December 31, 2007
three months of 2007 the estimated payments to Fiserv for these services will be approximately $1,357,000 per year beginning in 2008. Actual results may vary depending upon the number and type of accounts actually processed and future customer activity.
Asset/liability management is a means of maximizing net interest income while minimizing interest rate risk by planning and controlling the mix and maturities of interest related assets and liabilities. Premier has established an Asset/Liability Management Committee (ALCO) for the purpose of monitoring and managing interest rate risk and to evaluate investment portfolio strategies. Interest rate risk is the earnings variation that could occur due to changes in market interest rates. The Board of Directors has established policies to monitor and limit exposure to interest rate risk. Premier monitors its interest rate risk through the use of an earnings simulation model developed by an independent third party to analyze net interest income sensitivity.
The earnings simulation model uses assumptions, maturity patterns, and reinvestment rates provided by Premier and forecasts the effect of instantaneous movements in interest rates of both 100 (1.00%) and 200 (2.00%) basis points. The most recent earnings simulation model projects that net interest income would increase by approximately 2.5% over the projected stable rate net interest income if interest rates rise by 100 basis points over the next year. Conversely, the simulation projects an approximate 2.6% decrease in net interest income if interest rates fall by 100 basis points over the next year. Within the same time frame, but assuming a 200 basis point movement in interest rates, the simulation projects that net interest income would increase by 4.7% over the projected stable rate net interest income in a rising rate scenario and would decrease by 5.7% in a falling rate scenario. Under both the 100 and 200 basis point simulations, the percentage changes in net interest income are within Premier's ALCO guidelines.
The model simulation calculations of present value have certain acceptable shortcomings. The discount rates and prepayment assumptions utilized are based on estimated market interest rate levels for similar loans and securities nationwide. The unique characteristics of Premier's loans and securities may not necessarily parallel those assumed in the model simulations, and therefore, actual results could likely result in different discount rates, prepayment experiences and present values. The discount rates used for deposits and borrowings are based upon available alternative types and sources of funds which may not necessarily be indicative of the present value of Premier's deposits and borrowings. Premier's deposits have customer relationship advantages that are difficult to simulate. A higher or lower interest rate environment will most likely result in different investment and borrowing strategies by Premier which would be designed to further mitigate any negative effects on the value of, and the net interest earnings generated on Premier's net assets.
PREMIER FINANCIAL BANCORP, INC.
MANAGEMENT’S DISCUSSION AND ANALYSIS
December 31, 2007
The following table presents summary information about the simulation model's interest rate risk measures and results.
Year-end 2007 | Year-end 2006 | ALCO Guidelines | ||||||||||
| Projected 1-year net interest income | ||||||||||||
-100 bp change vs. base rate | -2.6 | % | -0.9 | % | 5 | % | ||||||
+100 bp change vs. base rate | 2.5 | % | 1.4 | % | 5 | % | ||||||
| Projected 1-year net interest income | ||||||||||||
-200 bp change vs. base rate | -2.7 | % | -2.2 | % | 10 | % | ||||||
+200 bp change vs. base rate | 4.7 | % | 2.6 | % | 10 | % | ||||||
Liquidity
Liquidity is the ability to satisfy demands for deposit withdrawals, lending commitments, and other corporate needs. Premier's liquidity is based on the stable nature of consumer core deposits held by the banking subsidiaries. Likewise, additional liquidity is available from holdings of investment securities and short-term investments which can be readily converted into cash. Furthermore, Premier's banks continue to have the ability to attract short-term sources of funds such as federal funds and repurchase agreements.
Premier generated $9.4 million of cash from operations in 2007, which compares to $5.4 million in 2006 and $2.1 million in 2005. The increase in 2007 was primarily the result of an increase in net income, a decrease in negative provisions for loan losses and cash received from the sale of mortgage loans in the secondary market. The increase in 2006 over 2005 was the result of a return to normal cash generated from operations compared to 2005. The low level in 2005 was primarily the result of the payment of the deferred distributions of the Trust Preferred Securities in March 2005, which came out of cash from operations. Total cash from operations along with proceeds from the sale and maturity of securities and the repayment of loans were used to purchase securities, satisfy deposit withdrawals, fund new loans and reduce outstanding debt during those years. Net cash provided by liquidating investing activities totaled $7.9 million in 2005. However in 2006, $5.9 million of cash was used in investing activities primarily to fund loan growth and in 2007 $5.0 million of cash was used in investing activities, again to fund loan growth but to also increase federal funds sold. In addition to the $9.4 million of cash from operations in 2007, Premier generated $1.0 million in additional cash from financing activities, primarily due to the increase in deposits. The increase in cash from deposits was also used to satisfy the repayment of FHLB advances and other borrowed funds as well as pay dividends to shareholders. In 2006, Premier generated $1.4 million in additional cash from financing activities, primarily due to increases in deposits and repurchase agreements. In 2005, net cash used to satisfy deposit withdrawals and reduce debt totaled $8.4 million. Details on the sources and uses of cash can be found in the Consolidated Statements of Cash Flows in the consolidated financial statements.
PREMIER FINANCIAL BANCORP, INC.
MANAGEMENT’S DISCUSSION AND ANALYSIS
December 31, 2007
At December 31, 2007, the parent company had nearly $7.9 million in cash held with its subsidiary banks. This balance along with cash dividends expected to be received from its subsidiaries is sufficient to cover the operating costs of the parent, service its existing other debt and pay dividends to common shareholders. During 2007, the parent company generated $10.3 million of cash from operations and used $5.9 million to make principal payments on its outstanding debt and pay dividends to shareholders. During 2006, the parent company generated $5.1 million of cash from operations and used $4.9 million to redeem a portion of the Trust Preferred Securities outstanding, make principal payments on its outstanding other debt and pay dividends to shareholders. Also during 2006, the parent company borrowed $13.5 million which was used to redeem the remainder of the Trust Preferred Securities. Additional information on parent company cash flows and financial statements is contained in Note 19 to the consolidated financial statements.
Capital Resources
Premier's consolidated average equity-to-asset ratio increased to 11.74% during 2007, up from 10.74% in 2005 and 9.77% in 2004. The ratios for all three years are considered adequate for a company of Premier's size. The increase in 2007 was largely due to the increase in net income, plus a general rise in the market value of investments from an overall unrealized loss at the end of 2006 to an overall unrealized gain at the end of 2007. The increase in 2006 was largely due to the increase in net income with the slight decline in average total assets. The Federal Reserve's risk-based capital guidelines and leverage ratio measure the capital adequacy of banking institutions. The risk- based capital guidelines weight balance sheet assets and off-balance sheet commitments by prescribed factors relative to credit risk, thus eliminating disincentives for holding low risk assets and requiring more capital for holding higher risk assets. At year-end 2007, Premier’s risk adjusted capital-to-assets ratio was 17.3% compared to 16.0% at December 31, 2006. Both of these ratios are well above the minimum level of 8.0% prescribed for bank holding companies of Premier's size. The leverage ratio is a measure of total tangible equity to total tangible assets. Premier's leverage ratio at December 31, 2007 was 9.8% compared to 8.9% at December 31, 2006. Both of these ratios are above the recommended 4.0% to 5.0% recommended by the Federal Reserve. The increase in the 2007 ratios was primarily the result of the net income recorded in 2007, partially offset by dividends paid to shareholders. The net result was an increase in shareholders’ equity. Premier's capital ratios are the direct result of management's desire to maintain a strong capital position. Additional information on Premier's capital ratios and the capital ratios of its banks may be found in Note 18 to the consolidated financial statements.
PREMIER FINANCIAL BANCORP, INC.
MANAGEMENT’S DISCUSSION AND ANALYSIS
December 31, 2007
The primary source of funds for dividends paid by Premier is the dividends received from its subsidiary banks. Banking regulations limit the amount of dividends that may be paid without prior approval of the regulatory agencies. Under these regulations, the amount of dividends that may be paid without prior approval in any calendar year is limited to the current year's net profits, as defined, combined with the retained net profits of the preceding two years, subject to regulatory capital requirements and additional restrictions more fully described in Note 18 to the consolidated financial statements. During 2008, Premier's banks could, without prior approval, declare and pay to Premier dividends of approximately $3.0 million plus any 2008 net profits retained through the date of declaration by Ohio River Bank, Boone County Bank, First Central Bank and Citizens Deposit Bank. In 2007, Farmers Deposit Bank requested and received approval from its primary regulators to pay a $2.5 million dividend in December 2007. This amount was substantially higher than the bank’s prior two years of reported net income. As such, Farmers Deposit Bank must continue to request approval for up to two years beyond December 31, 2007 to pay any future dividends to the parent company out of its current earnings.
Additional information on the capital position of Premier is included in the following table.
| SELECTED CAPITAL INFORMATION | ||||||||||||
| (Dollars in thousands) | ||||||||||||
| As of December 31 | ||||||||||||
| 2007 | 2006 | Change | ||||||||||
| Stockholders’ Equity | $ | 67,389 | $ | 61,002 | $ | 6,387 | ||||||
Qualifying capital securities of subsidiary trust | 0 | 0 | 0 | |||||||||
Disallowed amounts of goodwill and other intangibles | (15,816 | ) | (15,816 | ) | 0 | |||||||
Disallowed deferred tax assets | 0 | 0 | 0 | |||||||||
Unrealized (gain) loss on securities available for sale | (73 | ) | 1,150 | (1,223 | ) | |||||||
| Tier I capital | $ | 51,500 | $ | 46,336 | $ | 5,164 | ||||||
| Tier II capital adjustments | ||||||||||||
Qualifying capital securities of subsidiary trust | 0 | 0 | ||||||||||
Allowable amount of the allowance for loan losses | 4,038 | 3,977 | ||||||||||
| Total capital | $ | 55,538 | $ | 50,313 | ||||||||
| Total risk-weighted assets | $ | 320,581 | $ | 315,485 | ||||||||
| Ratios | ||||||||||||
Tier I capital to risk-weighted assets | 16.06 | % | 14.69 | % | ||||||||
Total capital to risk-weighted assets | 17.32 | % | 15.95 | % | ||||||||
Leverage at year-end | 9.77 | % | 8.89 | % | ||||||||
PREMIER FINANCIAL BANCORP, INC.
MANAGEMENT’S DISCUSSION AND ANALYSIS
December 31, 2007
INCOME STATEMENT ANALYSIS
Net Interest Income
Net interest income, the amount by which interest generated from earning assets exceeds the expense associated with funding those assets, is Premier's most significant component of earnings. Net interest income on a fully tax-equivalent basis was $22.5 million in 2007, up 4.4% from the $21.5 million earned in 2006 which follows a 7.8% increase in 2006 from 2005. When net interest income is presented on a fully tax-equivalent basis, interest income from tax-exempt earning assets is increased by the amount equivalent to the federal income taxes which would have been paid if this income were taxable at the statutory federal tax rate of 34% for companies of Premier's size. The increase in net interest income in 2007 is largely due to an increase in interest income from loans, investments and federal funds sold partially offset by an increase in interest expense on deposits. The increase in interest income on loans and investments was largely the result of increases in yields while the increase in interest income from federal funds sold and a portion of the increase in loan interest income was the result of a higher average volume of those assets. The increase in interest expense on deposits was largely due to an increase in the rates paid on deposits. However, a higher average volume of certificates of deposit also contributed to the increase in interest expense.
As shown in the Rate Volume Analysis table below, increases in the yields on loans, investments, and other earnings assets increased Premier’s interest income by $1.6 million in 2007. This increase was complemented by a $494,000 increase in interest income due to the higher volume of average loans outstanding and a $594,000 increase in interest income due to the higher volume of average federal funds sold outstanding in 2007. Interest income was decreased by $301,000, however, due to a lower volume of average investment securities outstanding. Also shown in the table below, interest expense on deposits increased by $2.0 million, $1.5 million due to higher rates paid, primarily on certificates of deposit, and $0.5 million due to a higher volume of average certificates of deposit. Also increasing interest expense was the higher average volume of short-term and other borrowings. This interest expense increase was more than offset, however, by the decrease in average FHLB borrowings and the repayment of the trust preferred securities in late 2006.
The increase in net interest income in 2006 is largely due to an increase in interest income from loans, investments and federal funds sold due to higher overall yields and a greater volume of loans outstanding. This increase in interest income more than offset the increase in interest expense in 2006 resulting from higher rates paid on deposits and a higher volume of certificates of deposit. Increases in the yields on loans, investments and other earning assets increased Premier’s interest income by $2.4 million. This increase was complemented by an $867,000 increase in interest income due to an increase in loans outstanding which was partially offset by a $324,000 reduction in interest income due to a lower total of investment securities outstanding. Interest expense on deposits increased by $2.3
PREMIER FINANCIAL BANCORP, INC.
MANAGEMENT’S DISCUSSION AND ANALYSIS
December 31, 2007
million, $2.0 million due to higher rates paid, primarily certificates of deposit, and $0.3 million due to a shifting of deposits from savings and transaction based accounts to certificates of deposit. This overall increase in interest expense was partially offset by net interest expense savings of $855,000 due to the refinancing and early redemption of outstanding debt and the reduction in FHLB borrowings. Some of this interest expense savings was offset by higher interest paid on other short-term borrowings. The combined effect was to increase net interest income by $1,564,000 for the year.
| RATE VOLUME ANALYSIS OF CHANGES IN NET INTEREST INCOME | ||||||||||||||||||||||||
| (Dollars in thousands on a tax equivalent basis) | ||||||||||||||||||||||||
| 2007 vs 2006 | 2006 vs 2005 | |||||||||||||||||||||||
| Increase (decrease) due to change in | Increase (decrease) due to change in | |||||||||||||||||||||||
| Volume | Rate | Net Change | Volume | Rate | Net Change | |||||||||||||||||||
| Interest income*: | ||||||||||||||||||||||||
Loans | $ | 494 | $ | 786 | $ | 1,280 | $ | 867 | $ | 1,552 | $ | 2,419 | ||||||||||||
Investment securities | (301 | ) | 767 | 466 | (324 | ) | 444 | 120 | ||||||||||||||||
Federal funds sold | 594 | 20 | 614 | 43 | 427 | 470 | ||||||||||||||||||
Deposits with banks | 34 | (2 | ) | 32 | 2 | 10 | 12 | |||||||||||||||||
Total interest income | $ | 821 | $ | 1,571 | $ | 2,392 | $ | 588 | $ | 2,433 | $ | 3,021 | ||||||||||||
| Interest expense: | ||||||||||||||||||||||||
Deposits | ||||||||||||||||||||||||
NOW and money market | $ | (71 | ) | $ | 85 | $ | 14 | $ | (116 | ) | $ | 473 | $ | 357 | ||||||||||
Savings | 4 | 59 | 63 | (46 | ) | (45 | ) | (91 | ) | |||||||||||||||
Certificates of deposit | 547 | 1,412 | 1,959 | 419 | 1,573 | 1,992 | ||||||||||||||||||
Short-term borrowings | 88 | (1 | ) | 87 | 27 | 27 | 54 | |||||||||||||||||
Other borrowings | 174 | 21 | 195 | 194 | 366 | 560 | ||||||||||||||||||
FHLB borrowings | (168 | ) | 62 | (106 | ) | (56 | ) | 10 | (46 | ) | ||||||||||||||
Debt | (380 | ) | (380 | ) | (760 | ) | (1,224 | ) | (145 | ) | (1,369 | ) | ||||||||||||
Total interest expense | $ | 193 | $ | 1,259 | $ | 1,452 | $ | (802 | ) | $ | 2,259 | $ | 1,457 | |||||||||||
| Net interest income* | $ | 628 | $ | 312 | $ | 940 | $ | 1,390 | $ | 174 | $ | 1,564 | ||||||||||||
(*) Fully taxable equivalent using the rate of 34% Note – Changes to rate/volume are allocated to both rate and volume on a proportional dollar basis | ||||||||||||||||||||||||
As net interest income dollars increased in 2007, Premier’s net interest margin also increased. In 2007, the yield earned on investment securities increased 63 basis points to 4.54% while the average yield on the loan portfolio increased 23 basis points to 7.92%. The yield on federal funds sold increased 8 basis points to 5.07%. The net result on all earning assets was to increase the yield 34 basis points to 6.87% in 2007, up from the 6.53% earned in 2006 and the 5.90% earned in 2005. Similarly, in 2007 Premier increased the average rate paid on its deposits by 51 basis points to remain competitive with local and national markets. The average rate paid on certificates of deposit increased the most at 71 basis points, while interest bearing transaction accounts increased on average by only 12 basis points in 2007 and savings accounts by increased 11 basis points. While the rates paid on Premier’s short-term borrowings remained
PREMIER FINANCIAL BANCORP, INC.
MANAGEMENT’S DISCUSSION AND ANALYSIS
December 31, 2007
virtually unchanged at 2.43%, the rates paid on other borrowings increased by 26 basis points to 7.65% and the rates paid on FHLB advances increased by 67 basis points to 6.47%. The rates paid on other borrowings increased as Premier refinanced its subordinated debt with floating prime rate and below prime rate loans in 2006 resulting in significant interest expense savings. The rates paid on FHLB advances increased as a result of the prepayment of certain amortizing advances at one affiliate bank while leaving higher rate fixed maturity advances at another bank. The overall result of increasing rates paid on deposits and rate decreases resulting from debt refinancing was to increase the overall cost of funds by 36 basis points to 3.09%, up from 2.73% in 2006 and 2.30% in 2005. As a result, Premier’s net interest spread decreased by 2 basis points. However, the volume of Premier’s interest earning assets increased by a larger amount than its volume of interest bearing liabilities which resulted in an increase in the net interest margin by 10 basis points to 4.42% in 2007, up from 4.32% in 2006 and 4.00% in 2005.
In 2006, the yield earned on investment securities increased 47 basis points to 3.91% while the average yield on the loan portfolio increased 46 basis points to 7.69%. The yield on federal funds sold increased 176 basis points to 4.99%. The net result on all earning assets was to increase the yield by 63 basis points to 6.53% in 2006, up from the 5.90% earned in 2005 and the 5.60% earned in 2004. Similarly, in 2006 Premier increased the average rate paid on its deposits by 64 basis points to remain competitive with local and national markets. The average rate paid on certificates of deposit increased the most at 85 basis points, while interest bearing transaction accounts increased on average by only 38 basis points in 2006. Premier also increased the rates paid on its short-term borrowings by 30 basis points. Rates also increased on other borrowings as Premier refinanced its subordinated debt with floating prime rate and sub prime rate loans. This refinancing resulted in a corresponding decrease in the overall rate paid on debt outstanding. The overall result of increasing rates paid on deposits and rate decreases resulting from debt refinancing was to increase the overall cost of funds by 43 basis points to 2.73%, up from the 2.30% in 2005 and 2.32% in 2004. As a result Premier's net interest spread increased by 20 basis points and its net interest margin increased by 32 basis points to 4.32% in 2006, up from 4.00% in 2005. Further discussion of interest income is included in the section of this report entitled "Balance Sheet Analysis."
Non-interest Income and Expense
Non-interest income has been and will continue to be an important factor for improving profitability. Recognizing this importance, management continues to evaluate areas where non-interest income can be enhanced. As shown in the table of Non-interest Income and Expense below, total fees and other income increased by $458,000 or 11.0% in 2007. The increase in 2007 was largely due to a increases in secondary market mortgage income and electronic banking income. In 2007, secondary market mortgage income (commissions and fees earned for originating and selling mortgage loans to third parties in the secondary market) increased by $347,000 or 114.5% to $650,000. In 2005, Premier changed its approach to secondary market
PREMIER FINANCIAL BANCORP, INC.
MANAGEMENT’S DISCUSSION AND ANALYSIS
December 31, 2007
mortgage originations in an effort to expedite the loan approval process. The increased income in 2007 reflects an expansion of the program to all of Premier’s affiliate banks which generated a greater number of customers taking advantage of this process. Electronic banking income, which consists of debit and credit card transaction fees, ATM fees and internet banking fees, increased $110,000 or 22.1% to $608,000 in 2007. Premier’s conversion to a more modern banking software system in 2005 has allowed Premier to offer more electronic banking services and made it easier for customers to conduct their banking electronically. Service charges on deposit accounts decreased in 2007 by $66,000 or 2.4% to $2,738,000. A new required disclosure of year-to-date NSF charges on customers’ deposit account statements is believed to be resulting in lower overdraft activity by customers. Other non-interest income increased by $67,000, or 12.0%, in 2007. In 2007, other non-interest income includes $212,000 of life insurance benefits on the death of a former officer of a subsidiary. Excluding this benefit, other non-interest income decreased $145,000 in 2007 as Premier discontinued offering trust services in 2006, realized fewer loan extension and late fees in 2007, ceased recording an increase in the cash surrender value of the officer’s life insurance policy in 2007 and recorded lower other miscellaneous income in 2007.
In 2006, total fees and other income increased by $245,000 or 6.3% from the amount earned in 2005. The increase in 2006 was fairly evenly distributed between increases in the volume of service charges on deposit accounts, electronic banking income, and secondary market mortgage income. In 2006, service charges on deposit accounts increased $72,000 or 2.6% to $2,804,000, primarily due to increases in Premier’s non-interest bearing deposit customer base. Electronic banking income increased $95,000 or 23.6% to $498,000 in 2006, largely due to the modernization of the ways Premier’s customers can access their deposit accounts. Secondary market mortgage income increased $86,000 or 39.6% to $303,000 in 2006 as a result of Premier changing its approach to secondary market mortgage originations by expediting the loan approval process. Other non-interest income was relatively unchanged totaling $560,000 in 2006 compared to $568,000 in 2005 as the elimination of data processing fees earned in 2005 was offset by increases in the collection of loan extension and late payment fees in 2006.
In 2007, 2006 and 2005, Premier did not execute any sales of investment securities.
PREMIER FINANCIAL BANCORP, INC.
MANAGEMENT’S DISCUSSION AND ANALYSIS
December 31, 2007
The following table is a summary of non-interest income and expense for each of the years in the three-year period ending December 31, 2007.
| NON-INTEREST INCOME AND EXPENSE | ||||||||||||||||||||||||||||
| (Dollars in thousands) | ||||||||||||||||||||||||||||
| Increase (Decrease) Over Prior Year | ||||||||||||||||||||||||||||
| 2007 | 2006 | |||||||||||||||||||||||||||
| 2007 | 2006 | 2005 | Amount | Percent | Amount | Percent | ||||||||||||||||||||||
| Non-interest income: | ||||||||||||||||||||||||||||
Service charges on deposit accounts | $ | 2,738 | $ | 2,804 | $ | 2,732 | $ | (66 | ) | (2.35 | ) | $ | 72 | 2.64 | ||||||||||||||
Electronic banking income | 608 | 498 | 403 | 110 | 22.09 | 95 | 23.57 | |||||||||||||||||||||
Secondary market mortgage income | 650 | 303 | 217 | 347 | 114.52 | 86 | 39.63 | |||||||||||||||||||||
Other | 627 | 560 | 568 | 67 | 11.96 | (8 | ) | (1.41 | ) | |||||||||||||||||||
Total fees and other income | $ | 4,623 | $ | 4,165 | $ | 3,920 | 458 | 11.00 | 245 | 6.25 | ||||||||||||||||||
Investment securities gains | 0 | 0 | 0 | 0 | 0 | |||||||||||||||||||||||
Total non-interest income | $ | 4,623 | $ | 4,165 | $ | 3,920 | $ | 458 | 11.00 | $ | 245 | 6.25 | ||||||||||||||||
| Non-interest expense: | ||||||||||||||||||||||||||||
Salaries and wages | $ | 7,211 | $ | 7,540 | $ | 7,443 | $ | (329 | ) | (4.36 | ) | $ | 97 | 1.30 | ||||||||||||||
Employee benefits | 1,560 | 1,590 | 1,642 | (30 | ) | (1.89 | ) | (52 | ) | (3.17 | ) | |||||||||||||||||
Total staff costs | 8,771 | 9,130 | 9,085 | (359 | ) | (3.93 | ) | 45 | 0.50 | |||||||||||||||||||
Occupancy and equipment | 1,947 | 1,907 | 2,262 | 40 | 2.10 | (355 | ) | (15.69 | ) | |||||||||||||||||||
Outside data processing | 2,132 | 2,036 | 1,505 | 96 | 4.72 | 531 | 35.28 | |||||||||||||||||||||
Professional fees | 461 | 496 | 554 | (35 | ) | (7.06 | ) | (58 | ) | (10.47 | ) | |||||||||||||||||
Taxes, other than payroll, property and income | 580 | 598 | 423 | (18 | ) | (3.01 | ) | 175 | 41.37 | |||||||||||||||||||
OREO (gains) losses and expenses, net | (50 | ) | (91 | ) | 52 | 41 | 45.05 | (143 | ) | (275.00 | ) | |||||||||||||||||
Bad check losses (recoveries) | 37 | (79 | ) | 36 | 116 | 146.84 | (115 | ) | (319.44 | ) | ||||||||||||||||||
Supplies | 315 | 333 | 362 | (18 | ) | (5.41 | ) | (29 | ) | (8.01 | ) | |||||||||||||||||
Accelerated amortization of subordinated debt issuance costs | 0 | 548 | 184 | (548 | ) | (100.00 | ) | 364 | 197.83 | |||||||||||||||||||
Other expenses | 2,215 | 2,059 | 2,842 | 156 | 7.58 | (783 | ) | (27.55 | ) | |||||||||||||||||||
Total non-interest expenses | $ | 16,408 | $ | 16,937 | $ | 17,305 | $ | (529 | ) | (3.12 | ) | $ | (368 | ) | (2.13 | ) | ||||||||||||
PREMIER FINANCIAL BANCORP, INC.
MANAGEMENT’S DISCUSSION AND ANALYSIS
December 31, 2007
Just as management continues to evaluate areas where non-interest income can be enhanced, it strives to find ways to improve the efficiency of its operations and utilize the economies of scale of the consolidated entity to reduce its operating costs. Premier’s 2007 net overhead ratio, or non-interest expense less non-interest income excluding securities transactions and other similar non-operating transactions to average earning assets was 2.36%, a decrease from the 2.56% realized in 2006 and the 2.68% ratio realized in 2005. The actual dollars of net overhead declined by 6.1% or $775,000 in 2007 which reduced the ratio by 16 basis points. The 2007 net overhead ratio and actual dollars of net overhead expense excludes the $212,000 of life insurance benefits as a non-operating income transaction. In 2006, the net overhead ratio decreased by 12 basis points as the actual dollars of net overhead expense decreased by 4.6% or $613,000. For the year 2007, net overhead was $12.0 million, down from the $12.8 million of 2006 net overhead. The current year decrease follows a $613,000 decrease in 2006 from the $13.4 million of net overhead in 2005.
Total non-interest expense in 2007 decreased by $529,000, or 3.1% from 2006 as decreases in staff costs, professional fees, and accelerated trust preferred issuance cost amortization were only partially offset by higher occupancy and equipment costs, data processing fees, and other expenses plus the absence of bad check loss recoveries and lower net gains on the disposition of OREO. Total non-interest expense in 2006 decreased by $368,000, or 2.1% from 2005 as decreases in occupancy and equipment costs, professional fees, OREO losses, bad check losses and other expenses were only partially offset by higher data processing fees, accelerated trust preferred issuance cost amortization, and taxes not on income.
Staff costs decreased by $359,000 or 3.9% in 2007 versus 2006 as normal salary and wage increases were more than offset by an increase in deferred loan origination costs related to FAS 91. Staff costs increased by $45,000 or 0.5% in 2006 versus 2005. Normal salary and wage increases and $142,000 of stock compensation expense resulting from the adoption of FAS 123R in 2006 were substantially offset by reductions in staff count and corresponding benefit cost reductions resulting from the data processing conversion in 2005.
Occupancy and equipment expenses increased by $40,000 or 2.1% in 2007, largely due to a $70,000 writedown of branch property that was scheduled to be closed at the end of January 2008. The decision to close the branch was made in 2007, and in accordance with FAS 144, the branch property was written down to its estimated realizable value. Excluding this writedown, occupancy and equipment expenses decreased by $30,000 in 2007, largely due to decreases in equipment depreciation. In 2006, occupancy and equipment expenses decreased by $355,000 or 15.7% due to savings from the disposal of equipment and facilities related to Premier’s data processing subsidiary in 2005, lower property and casualty insurance costs, and the expensing of obsolete equipment as part of the data processing conversion in 2005.
Outside data processing expense increased by $96,000 or 4.7% in 2007, largely due to increases in ATM processing costs, internet banking charges and contractual inflationary fee adjustments, partially offset by a decrease in customer overdraft privilege program costs. Outside data processing expense increased by $531,000 or 35.3% in 2006, as 2006 represents the
PREMIER FINANCIAL BANCORP, INC.
MANAGEMENT’S DISCUSSION AND ANALYSIS
December 31, 2007
first full year of expense since Premier converted to an outsourced provider in early-to-mid 2005. Outside data processing expense increased by $482,000, or 47.1% in 2005, as Premier transitioned its internal data and item processing functions to an outsourced provider. Savings in other expense areas such as staff costs, occupancy and equipment expense and other operating expenses have been realized as a result of the conversion.
Professional fees decreased by $35,000 or 7.1% in 2007 largely due to lower internal and external audit costs and lower consulting fees. Professional fees decreased by $58,000 or 10.5% in 2006 largely due to lower internal audit costs, tax preparation fees and consulting expenses. In 2005, Premier used an outside firm to continue to provide internal audits of Farmers Deposit Bank. For 2006 and 2007, these audits were performed by internal staff at the parent company. However, the outside firm provided limited services early in 2006.
Taxes not on income decreased by $18,000, or 3.0%, in 2007 versus 2006. The decrease in 2007 is largely due to a decrease in the amount of expense related to equity based franchise taxes. In 2006, taxes not on income increased by $175,000 or 41.4% versus 2005. The increase in 2006 is largely due to an increase in taxable equity for equity based franchise taxes and an increase in local municipal taxes.
OREO gains, losses and expenses resulted in net gains of $50,000 in 2007 versus $91,000 of net gains in 2006, a $41,000 increase in non-interest expense. OREO expense represents the costs to operate, maintain and liquidate Other Real Estate acquired through foreclosure in satisfaction of unpaid loans. In 2007, as Premier sold most of its remaining inventory of OREO properties, it realized $20,000 of net gains on their disposition as well as $30,000 of expense recoveries. OREO gains, losses and expenses resulted in net gains of $91,000 in 2006 versus $52,000 of net expenses in 2005, a $143,000 reduction of non-interest expense. Similarly, in 2006, as Premier sold a substantial portion of its inventory of OREO properties, it realized $105,000 of net gains on their disposition as well as a reduction in the expenses needed to maintain the properties. A majority of the gains on the disposition of OREO in 2007 and 2006 were on properties from which no previous writedowns had occurred. OREO writedowns and expenses totaled $52,000 in 2005, a $97,000 increase over the net $45,000 benefit realized in 2004. The 2005 expense represents the costs to operate, maintain and liquidate Other Real Estate.
Net losses on bad checks totaled $37,000 in 2007 compared to net recoveries on bad checks of $79,000 in 2006. The $116,000 increase was largely the result of returning to a normal pattern of bad check losses in 2007. In 2006, Premier realized $79,000 of net recoveries of bad checks compared to $36,000 of net losses on bad checks in 2005. The $115,000 decrease in 2006 was a largely the result of a $101,000 partial settlement on the recovery of bad check losses related to dishonored checks in 2003.
Accelerated Trust Preferred issuance costs were recognized in 2005 and 2006. At the time of issuance, the costs to originate the Trust Preferred Securities were capitalized. The costs were being amortized over the 30 year life of the securities which were scheduled to mature in
PREMIER FINANCIAL BANCORP, INC.
MANAGEMENT’S DISCUSSION AND ANALYSIS
December 31, 2007
2027 and were recorded as an adjustment to interest expense. In March 2003, Premier began redeeming its Trust Preferred Securities in accordance with the terms of the instrument. At time of redemption an amount of the remaining unamortized issuance costs proportional to the size of the redemption was expensed to non-interest expense. As a result of the $5.0 million early redemption on December 31, 2005, Premier expensed $184,000 of the issuance costs. In 2006, as a result of the $7.0 million early redemption on January 31, 2006 and the final $8.25 million redeemed on November 10, 2006, Premier expensed the final $548,000 of the issuance costs. No accelerated issuance costs expense was recorded in 2007.
Other expenses totaled $2.2 million in 2007, a $156,000, or 7.6% increase from the $2.1 million recorded in 2006. The increase in 2007 is largely due to significantly higher regulatory expenses, such as FDIC insurance and state examination costs, higher postage costs, travel expenses, employee development and secondary market mortgage underwriting expenses. These increases were partially offset by lower stationery and supplies costs, advertising expenditures, correspondent bank charges and insurance expense. Other expenses totaled $2.1 million in 2006, a $783,000 or $27.6% decrease from the $2.8 million recorded in 2005. The decrease in 2006 is largely due to costs and fees incurred in 2005 related to Premier’s conversion to an outsourced data and item processing provider. These costs included the travel and training of employees, fees and travel expense reimbursements paid to Fiserv to convert Premier’s data and costs associated with upgrading Premier’s computer networks. Other reductions in 2006 expense include lower FDIC insurance costs; recoveries of previously expensed loan collection costs as well as lower costs incurred in 2006; lower insurance costs and costs incurred in 2005 related the termination of trust services. Other expenses that increased in 2006 include advertising, employee training and development, and travel costs associated with the internal audit function.
An analysis of the allowance for loan losses and related provision for loan losses is included in the Loan Portfolio section of the Balance Sheet Analysis of this report.
Applicable Income Taxes
Premier recognized $3.5 million of income tax expense in 2007. This amount compares to $3.3 million of income tax expense recorded in 2006 and $2.0 million of income tax expense recorded in 2005. Premier's effective tax rate was 32.8% in 2007, down slightly from 33.6% in 2006 but up from 31.4% in 2005. Premier's effective tax rate in 2007 decreased primarily as a result of death benefits received from a former officer’s life insurance policy which were not subject to income tax. The effective tax rate in 2006 increased primarily due to stock compensation expense required by FAS 123R, most of which is a non-deductible expense for income tax purposes since it relates primarily to qualified incentive stock options. In addition, the tax saving benefits of holding tax-exempt investments and other tax saving instruments helped to reduce Premier's tax rate in 2005 to 31.4% from the 34.0% statutory rate. Additional information regarding income taxes is contained in Note 10 to the consolidated financial statements.
PREMIER FINANCIAL BANCORP, INC.
MANAGEMENT’S DISCUSSION AND ANALYSIS
December 31, 2007
Effects of Changing Prices
The results of operations and financial condition presented in this report are based on historical cost, unadjusted for the effects of inflation. Inflation affects Premier in two ways. One effect is that inflation can result in increased operating costs which must be absorbed or recovered through increased prices for services. The second effect is on the purchasing power of the corporation. Virtually all of a bank's assets and liabilities are monetary in nature. Regardless of changes in prices, most assets and liabilities of the banking subsidiaries will be converted into a fixed number of dollars. Non-earning assets, such as premises and equipment, do not comprise a major portion of Premier's assets; therefore, most assets are subject to repricing on a more frequent basis than in other industries.
Premier's ability to offset the effects of inflation and potential reductions in future purchasing power depends primarily on its ability to maintain capital levels by adjusting prices for its services and to improve net interest income by maintaining an effective asset/liability mix. Management's efforts to meet these goals are described in other sections of this report.
SUMMARY RESULTS OF OPERATIONS
FOURTH QUARTER 2007
Net income for the three months ended December 31, 2007 totaled $1,736,000, a $77,000 or 4.6% increase from the $1,659,000 of net income reported for the fourth quarter of 2006. On a per share basis, Premier's net income for the fourth quarter of 2007 was 33 cents per share, compared to 32 cents per share for the same quarter last year.
Net interest income totaled $5,644,000 for the fourth quarter of 2007, an increase of $190,000 or 3.5% from the net interest income earned in the same quarter of 2006. The increase is the result of higher interest income on loans and investments due to higher yields and an increase in interest income on loans and federal funds sold due to an increase in their average balance. This increase in interest income was partially offset by an increase in interest expense. An increase in interest expense on deposits as a result of higher rates paid was partially reduced by a decrease in interest expense on borrowings due to lower outstanding balances and lower borrowing rates due to the refinancing of the subordinated debt. During the fourth quarter of 2007, Premier recorded a $25,000 provision for loan losses. This compares to the reversal of $110,000 of previously recorded provisions for loan losses (negative provisions) in the fourth quarter of 2006. The negative provisions were the result of continued improvement in the estimated credit risk at banks formerly subject to regulatory agreements and payments on loans previously identified as having significant credit risk at Farmers Deposit Bank. Future provisions to the allowance for loan losses, positive or negative, will depend on future improvement or deterioration in estimated credit risk in the loan portfolio as well as whether additional payments are received on loans having significant credit risk.
PREMIER FINANCIAL BANCORP, INC.
MANAGEMENT’S DISCUSSION AND ANALYSIS
December 31, 2007
Non-interest income, excluding securities transactions, totaled $1,162,000 in the fourth quarter of 2007, an increase of $28,000 or 2.5% from the $1,134,000 reported in the fourth quarter of 2006. The increase was largely due to increases in secondary market mortgage income and electronic banking income. Non-interest expense totaled $4,176,000 in the fourth quarter of 2007, a $25,000 or 0.6% decrease from the $4,201,000 reported for the fourth quarter of 2006. Decreases in staff costs, occupancy & equipment costs and taxes not on income were nearly offset by increases in outside data processing, professional fees, OREO expenses & writedowns, and a $70,000 real estate impairment writedown on a branch building designated to be sold. Additional quarterly financial data is provided in Note 20 to the consolidated financial statements.
ADOPTION OF NEW ACCOUNTING STANDARDS
Recently Issued Accounting Standards Not Yet Adopted
In September 2006, the FASB issued Statement No. 157, Fair Value Measurements. This Statement defines fair value, establishes a framework for measuring fair value and expands disclosures about fair value measurements. This Statement establishes a fair value hierarchy about the assumptions used to measure fair value and clarifies assumptions about risk and the effect of a restriction on the sale or use of an asset. The standard is effective for fiscal years beginning after November 15, 2007. The adoption of this statement is not anticipated to have a material impact on the financial statements of the Company.
In February 2007, the FASB issued Statement No. 159 – The Fair Value Option for Financial Assets and Financial Liabilities. The standard provides companies with an option to report selected financial assets and liabilities at fair value and establishes presentation and disclosure requirements designed to facilitate comparisons between companies that choose different measurement attributes for similar types of assets and liabilities. The new standard is effective for the Company on January 1, 2008. The Company does not expect the adoption of SFAS No. 159 to have a material impact on the financial statements.
PREMIER FINANCIAL BANCORP, INC.
FORM 10-K
December 31, 2007
The Company's Financial Statements and related Independent Auditors' Report are presented in the following pages. The financial statements filed in this Item 8 are as follows:
Financial Statements:
December 31, 2007, 2006, and 2005 |
PREMIER FINANCIAL BANCORP, INC.
CONSOLIDATED FINANCIAL STATEMENTS
December 31, 2007, 2006, and 2005
PUBLIC ACCOUNTING FIRM
Board of Directors and Shareholders
Premier Financial Bancorp, Inc.
Huntington, West Virginia
We have audited the accompanying consolidated balance sheets of Premier Financial Bancorp, Inc. as of December 31, 2007 and 2006, and the related consolidated statements of income, comprehensive income, changes in stockholders' equity, and cash flows for each of the three years in the period ended December 31, 2007. These financial statements are the responsibility of the Company's management. Our responsibility is to express an opinion on these financial statements based on our audits.
We conducted our audits in accordance with the standards of the Public Company Accounting Oversight Board (United States). Those standards require that we plan and perform the audit to obtain reasonable assurance about whether the financial statements are free of material misstatement. The Company is not required to have, nor were we engaged to perform, an audit of its internal control over financial reporting. Our audit included consideration of internal control over financial reporting as a basis for designing audit procedures that are appropriate in the circumstances, but not for the purpose of expressing an opinion on the effectiveness of the Company's internal control over financial reporting. Accordingly, we express no such opinion. An audit includes examining, on a test basis, evidence supporting the amounts and disclosures in the financial statements. An audit also includes assessing the accounting principles used and significant estimates made by management, as well as evaluating the overall financial statement presentation. We believe that our audits provide a reasonable basis for our opinion.
In our opinion, the consolidated financial statements referred to above present fairly, in all material respects, the financial position of Premier Financial Bancorp, Inc. as of December 31, 2007 and 2006, and the results of its operations and its cash flows for each of the three years in the period ended December 31, 2007, in conformity with U.S. generally accepted accounting principles.
Crowe Chizek and Company LLC
Columbus, Ohio
March 27, 2008
CONSOLIDATED BALANCE SHEETS
December 31, 2007 and 2006
(Dollars in Thousands, Except Per Share Data)
| 2007 | 2006 | |||||||
| ASSETS | ||||||||
| Cash and due from banks | $ | 22,365 | $ | 16,974 | ||||
| Federal funds sold | 32,035 | 27,583 | ||||||
| Securities available for sale | 124,242 | 121,367 | ||||||
| Loans held for sale | 1,891 | 1,978 | ||||||
| Loans | 346,570 | 343,797 | ||||||
Allowance for loan losses | (6,497 | ) | (6,661 | ) | ||||
Net loans | 340,073 | 337,136 | ||||||
| Federal Home Loan Bank and Federal Reserve Bank stock | 3,314 | 3,265 | ||||||
| Premises and equipment, net | 6,200 | 6,533 | ||||||
| Real estate and other property acquired through foreclosure | 174 | 495 | ||||||
| Interest receivable | 2,768 | 2,821 | ||||||
| Goodwill | 15,816 | 15,816 | ||||||
| Other assets | 377 | 1,484 | ||||||
Total assets | $ | 549,255 | $ | 535,452 | ||||
| LIABILITIES AND STOCKHOLDERS' EQUITY | ||||||||
| Deposits | ||||||||
Non-interest bearing | $ | 75,271 | $ | 72,784 | ||||
Time deposits, $100,000 and over | 55,345 | 53,477 | ||||||
Other interest bearing | 318,417 | 312,689 | ||||||
Total deposits | 449,033 | 438,950 | ||||||
| Federal funds purchased | 392 | 976 | ||||||
| Securities sold under agreements to repurchase | 12,477 | 12,555 | ||||||
| Federal Home Loan Bank advances | 4,843 | 7,285 | ||||||
| Other borrowed funds | 8,412 | 12,275 | ||||||
| Interest payable | 1,064 | 1,061 | ||||||
| Other liabilities | 5,645 | 1,348 | ||||||
Total liabilities | 481,866 | 474,450 | ||||||
| Commitments and contingent liabilities | - | - | ||||||
| Stockholders' equity | ||||||||
Preferred stock, no par value; 1,000,000 shares authorized; | ||||||||
none issued or outstanding | - | - | ||||||
Common stock, no par value; 10,000,000 shares authorized; | ||||||||
5,237,899 in 2007 and 5,236,899 in 2006 shares issued and outstanding | 1,109 | 1,108 | ||||||
Additional paid-in capital | 43,763 | 43,624 | ||||||
Retained earnings | 22,444 | 17,420 | ||||||
Accumulated other comprehensive income (loss) | 73 | (1,150 | ) | |||||
Total stockholders' equity | 67,389 | 61,002 | ||||||
Total liabilities and stockholders' equity | $ | 549,255 | $ | 535,452 | ||||
CONSOLIDATED STATEMENTS OF INCOME
Years Ended December 31
(In Thousands, Except Per Share Data)
| 2007 | 2006 | 2005 | ||||||||||
| Interest income | ||||||||||||
Loans, including fees | $ | 27,201 | $ | 25,926 | $ | 23,532 | ||||||
Investment securities | ||||||||||||
Taxable | 5,509 | 5,148 | 5,014 | |||||||||
Tax-exempt | 157 | 88 | 96 | |||||||||
Federal funds sold | 1,829 | 1,215 | 745 | |||||||||
Other interest income | 56 | 23 | 12 | |||||||||
Total interest income | 34,752 | 32,400 | 29,399 | |||||||||
| Interest expense | ||||||||||||
Deposits | 11,019 | 8,984 | 6,725 | |||||||||
Repurchase agreements and other | 321 | 234 | 180 | |||||||||
FHLB advances and other borrowings | 1,116 | 1,027 | 513 | |||||||||
Debentures | - | 760 | 2,129 | |||||||||
Total interest expense | 12,456 | 11,005 | 9,547 | |||||||||
| Net interest income | 22,296 | 21,395 | 19,852 | |||||||||
| Provision for loan losses | (78 | ) | (1,161 | ) | 4 | |||||||
Net interest income after provision for loan losses | 22,374 | 22,556 | 19,848 | |||||||||
| Non-interest income | ||||||||||||
Service charges | 2,738 | 2,804 | 2,732 | |||||||||
Electronic banking income | 608 | 498 | 403 | |||||||||
Secondary market mortgage income | 650 | 303 | 217 | |||||||||
Securities gains | - | - | - | |||||||||
Other | 627 | 560 | 568 | |||||||||
| 4,623 | 4,165 | 3,920 | ||||||||||
| Non-interest expenses | ||||||||||||
Salaries and employee benefits | 8,771 | 9,130 | 9,085 | |||||||||
Occupancy and equipment expenses | 2,017 | 1,907 | 2,262 | |||||||||
Outside data processing | 2,132 | 2,036 | 1,505 | |||||||||
Professional fees | 461 | 496 | 554 | |||||||||
Taxes, other than payroll, property and income | 580 | 598 | 423 | |||||||||
Write-downs, expenses, sales of other real estate owned, net of gains | (50 | ) | (91 | ) | 52 | |||||||
Supplies | 315 | 333 | 362 | |||||||||
Other expenses | 2,182 | 2,528 | 3,062 | |||||||||
| 16,408 | 16,937 | 17,305 | ||||||||||
| Income before income taxes | 10,589 | 9,784 | 6,463 | |||||||||
| Provision for income taxes | 3,470 | 3,283 | 2,029 | |||||||||
| Net income | $ | 7,119 | $ | 6,501 | $ | 4,434 | ||||||
| Weighted average shares outstanding: | ||||||||||||
Basic | 5,237 | 5,236 | 5,233 | |||||||||
Diluted | 5,263 | 5,264 | 5,248 | |||||||||
| Earnings per share: | ||||||||||||
Basic | $ | 1.36 | $ | 1.24 | $ | 0.85 | ||||||
Diluted | 1.35 | 1.24 | 0.84 | |||||||||
CONSOLIDATED STATEMENTS OF COMPREHENSIVE INCOME
Years Ended December 31
(In Thousands, Except Per Share Data)
| 2007 | 2006 | 2005 | ||||||||||
| Net income | $ | 7,119 | $ | 6,501 | $ | 4,434 | ||||||
Other comprehensive income (loss): | ||||||||||||
Unrealized gains and (losses) arising during the period | 1,853 | 861 | (1,805 | ) | ||||||||
Reclassification of realized amount | - | - | - | |||||||||
Net change in unrealized gain (loss) on securities | 1,853 | 861 | (1,805 | ) | ||||||||
Less tax impact | 630 | 293 | (614 | ) | ||||||||
Other comprehensive income (loss): | 1,223 | 568 | (1,191 | ) | ||||||||
| Comprehensive income | $ | 8,342 | $ | 7,069 | $ | 3,243 | ||||||
CONSOLIDATED STATEMENTS OF CHANGES IN STOCKHOLDERS’ EQUITY
Years Ended December 31, 2007, 2006 and 2005
(In Thousands, Except Per Share Data)
Common Stock | Additional Paid-in Capital | Retained Earnings | Accumulated Other Comprehensive Income (Loss) | Total | ||||||||||||||||
| Balances, January 1, 2005 | $ | 1,103 | $ | 43,445 | $ | 7,008 | $ | (527 | ) | $ | 51,029 | |||||||||
Net change in unrealized gains (losses) on securities available for sale | - | - | - | (1,191 | ) | (1,191 | ) | |||||||||||||
| Stock options exercised, 1,667 shares | 2 | 13 | - | - | 15 | |||||||||||||||
| Net income | - | - | 4,434 | - | 4,434 | |||||||||||||||
| Balances, December 31, 2005 | 1,105 | 43,458 | 11,442 | (1,718 | ) | 54,287 | ||||||||||||||
Net change in unrealized gains (losses) on securities available for sale | - | - | - | 568 | 568 | |||||||||||||||
| Cash dividends paid ($0.10 per share) | - | - | (523 | ) | - | (523 | ) | |||||||||||||
| Stock options exercised, 3,002 shares | 3 | 24 | - | - | 27 | |||||||||||||||
| Stock based compensation expense | - | 142 | - | - | 142 | |||||||||||||||
| Net income | - | - | 6,501 | - | 6,501 | |||||||||||||||
| Balances, December 31, 2006 | 1,108 | 43,624 | 17,420 | (1,150 | ) | 61,002 | ||||||||||||||
Net change in unrealized gains (losses) on securities available for sale | - | - | - | 1,223 | 1,223 | |||||||||||||||
| Cash dividends paid ($0.40 per share) | - | - | (2,095 | ) | - | (2,095 | ) | |||||||||||||
| Stock options exercised, 1,000 shares | 1 | 9 | - | - | 10 | |||||||||||||||
| Stock based compensation expense | - | 130 | - | - | 130 | |||||||||||||||
| Net income | - | - | 7,119 | - | 7,119 | |||||||||||||||
| Balances, December 31, 2007 | $ | 1,109 | $ | 43,763 | $ | 22,444 | $ | 73 | $ | 67,389 | ||||||||||
CONSOLIDATED STATEMENTS OF CASH FLOWS
Years Ended December 31
(In Thousands, Except Per Share Data)
| 2007 | 2006 | 2005 | ||||||||||
| Cash flows from operating activities | ||||||||||||
Net income | $ | 7,119 | $ | 6,501 | $ | 4,434 | ||||||
Adjustments to reconcile net income to net cash from operating activities | ||||||||||||
Depreciation and impairment of real estate | 833 | 868 | 976 | |||||||||
Provision for loan losses | (78 | ) | (1,161 | ) | 4 | |||||||
Amortization (accretion), net | (40 | ) | 187 | 236 | ||||||||
FHLB stock dividends | - | (145 | ) | (113 | ) | |||||||
Gains on other real estate owned, net | (20 | ) | (105 | ) | (17 | ) | ||||||
Stock compensation expense | 130 | 142 | - | |||||||||
Loans originated for sale | (27,461 | ) | (14,616 | ) | (7,602 | ) | ||||||
Secondary market loans sold | 28,198 | 13,809 | 6,951 | |||||||||
Secondary market income | (650 | ) | (303 | ) | (217 | ) | ||||||
Changes in : | ||||||||||||
Interest receivable | 53 | (160 | ) | 79 | ||||||||
Deferred income taxes | 648 | 1,071 | 1,119 | |||||||||
Other assets | 558 | 288 | 1,069 | |||||||||
Interest payable | 3 | 337 | (4,808 | ) | ||||||||
Other liabilities | 68 | (1,347 | ) | (18 | ) | |||||||
Net cash from operating activities | 9,361 | 5,366 | 2,093 | |||||||||
| Cash flows from investing activities | ||||||||||||
Purchases of securities available for sale | (41,078 | ) | (23,248 | ) | (18,486 | ) | ||||||
Proceeds from sales of securities available for sale | 25 | - | - | |||||||||
Proceeds from maturities and calls of securities available for sale | 43,571 | 39,974 | 34,143 | |||||||||
Purchase of FHLB stock, net of redemptions | (49 | ) | (60 | ) | (336 | ) | ||||||
Net change in federal funds sold | (4,452 | ) | (8,771 | ) | (1,470 | ) | ||||||
Net change in loans | (4,361 | ) | (20,284 | ) | (6,120 | ) | ||||||
Purchases of loan participations from other banks | (4,825 | ) | (1,605 | ) | (1,197 | ) | ||||||
Payments on loan participations with other banks | 6,045 | 6,067 | 589 | |||||||||
Purchases of premises and equipment, net | (500 | ) | (361 | ) | (845 | ) | ||||||
Proceeds from sale of other real estate acquired through foreclosure | 623 | 2,417 | 1,658 | |||||||||
Net cash from investing activities | (5,001 | ) | (5,871 | ) | 7,936 | |||||||
PREMIER FINANCIAL BANCORP, INC.
CONSOLIDATED STATEMENTS OF CASH FLOWS (Continued)
Years Ended December 31
(In Thousands, Except Per Share Data)
| 2007 | 2006 | 2005 | ||||||||||
| Cash flows from financing activities | ||||||||||||
Net change in deposits | 10,083 | 3,107 | (1,955 | ) | ||||||||
Net change in federal funds purchased | (584 | ) | 976 | (1,838 | ) | |||||||
Net change in agreements to repurchase securities | (78 | ) | 3,238 | 2,109 | ||||||||
Repayment of Federal Home Loan Bank advances | (2,442 | ) | (1,049 | ) | (954 | ) | ||||||
Early redemption of debentures, net | - | (15,250 | ) | (5,000 | ) | |||||||
Repayment of other borrowed funds | (3,863 | ) | (2,627 | ) | (800 | ) | ||||||
Proceeds from other borrowings | - | 13,500 | - | |||||||||
Cash dividends paid | (2,095 | ) | (523 | ) | - | |||||||
Proceeds from stock option exercises | 10 | 27 | 15 | |||||||||
Net cash from financing activities | 1,031 | 1,399 | (8,423 | ) | ||||||||
| Net change in cash and cash equivalents | 5,391 | 894 | 1,606 | |||||||||
| Cash and cash equivalents at beginning of year | 16,974 | 16,080 | 14,474 | |||||||||
| Cash and cash equivalents at end of year | $ | 22,365 | $ | 16,974 | $ | 16,080 | ||||||
| Supplemental disclosures of cash flow information: | ||||||||||||
Cash paid during year for - | ||||||||||||
Interest | $ | 12,453 | $ | 10,667 | $ | 14,354 | ||||||
Income taxes paid | 3,066 | 2,285 | 191 | |||||||||
Non-cash transactions | ||||||||||||
Loans transferred to real estate acquired through foreclosure | $ | 282 | $ | 672 | $ | 1,443 | ||||||
Purchases of securities available for sale not yet settled | 3,500 | - | - | |||||||||
Fixed assets transferred to other real estate owned | - | 141 | - | |||||||||
NOTES TO CONSOLIDATED FINANCIAL STATEMENTS
December 31, 2007, 2006, and 2005
(Dollars in Thousands, Except Per Share Data)
NOTE 1 - - SUMMARY OF SIGNIFICANT ACCOUNTING POLICIES
The consolidated financial statements include the accounts of Premier Financial Bancorp, Inc. (the Company) and its wholly-owned subsidiaries:
| Unaudited | |||||||||||
| December 31, 2007 | |||||||||||
Subsidiary | Location | Year Acquired | Total Assets | Net Income | |||||||
| Citizens Deposit Bank & Trust | Vanceburg, Kentucky | 1991 | $ | 124,695 | $ | 1,789 | |||||
| Farmers Deposit Bank | Eminence, Kentucky | 1996 | 71,157 | 1,244 | |||||||
| Ohio River Bank | Ironton, Ohio | 1998 | 84,359 | 1,160 | |||||||
| First Central Bank, Inc. | Philippi, West Virginia | 1998 | 111,097 | 1,464 | |||||||
| Boone County Bank, Inc. | Madison, West Virginia | 1998 | 159,099 | 2,495 | |||||||
| Mt. Vernon Financial Holdings, Inc. | Huntington, West Virginia | 1999 | 509 | 180 | |||||||
| Parent and Intercompany Eliminations | (1,661 | ) | (1,213 | ) | |||||||
| Consolidated total | $ | 549,255 | $ | 7,119 | |||||||
All material intercompany transactions and balances have been eliminated.
Nature of Operations: The subsidiary banks (Banks) operate under state bank charters and provide traditional banking services to customers primarily located in the counties and adjoining counties in Kentucky, Ohio, and West Virginia in which the Banks operate. Chartered as state banks, the Banks are subject to regulation by their respective state banking regulators and the Federal Deposit Insurance Corporation (FDIC) or the Federal Reserve Bank for member banks. The Company is also subject to regulation by the Federal Reserve Bank.
Estimates in the Financial Statements: The preparation of financial statements in conformity with accounting principles generally accepted in the United States of America requires management to make estimates and assumptions that affect the reported amounts of assets and liabilities, disclosure of contingent assets and liabilities at the date of the financial statements, and the reported amounts of revenues and expenses during the reporting period. Actual results could differ from those estimates. The allowance for loan losses, the identification and evaluation of impaired loans, impairment of goodwill, and fair values of financial instruments are particularly subject to change.
Cash Flows: For purposes of reporting cash flows, cash and cash equivalents include cash on hand, amounts due from banks and interest-earning balances with banks with an original maturity less than ninety days. Net cash flows are reported for loans, federal funds sold, deposits, and other borrowing transactions.
PREMIER FINANCIAL BANCORP, INC.
NOTES TO CONSOLIDATED FINANCIAL STATEMENTS
December 31, 2007, 2006, and 2005
(Dollars in Thousands, Except Per Share Data)
NOTE 1 - SUMMARY OF SIGNIFICANT ACCOUNTING POLICIES (Continued)
Securities: The Company classifies its securities portfolio as either securities available for sale or securities held to maturity. Securities held to maturity are carried at amortized cost.
Securities available for sale might be sold before maturity and are carried at fair value. Adjustments from amortized cost to fair value are recorded in other comprehensive income, net of related income tax. Other securities such as Federal Home Loan Bank stock are carried at cost.
Interest income includes amortization of purchase premium or discount computed using the level yield method. Gains or losses on dispositions are based on the net proceeds and adjusted carrying amount of the securities sold using the specific identification method. Securities are written down to fair value when a decline in fair value is not temporary.
Declines in the fair value of securities below their cost that are other than temporary are reflected as realized losses. In estimating other-than-temporary losses, management considers: (1) the length of time and extent that fair value has been less than cost, (2) the financial condition and near term prospects of the issuer, and (3) the Company’s ability and intent to hold the security for a period sufficient to allow for any anticipated recovery in fair value.
Loans Held for Sale: Mortgage loans originated and intended for sale in the secondary market are carried at the lower of aggregate cost or market, as determined by outstanding commitments from investors. Net unrealized losses, if any, are recorded as a valuation allowance and charged to earnings. Loans are generally sold with servicing released.
Loans: Net loans are stated at the amount of unpaid principal, reduced by unearned income and an allowance for loan losses. Interest income on loans is recognized on the accrual basis except for those loans in a non-accrual of income status. The accrual of interest on impaired loans is discontinued when management believes, after consideration of economic and business conditions and collection efforts, that the borrowers’ financial condition is such that collection of interest is doubtful.
All interest accrued but not received for loans placed on non-accrual is reversed against interest income. Interest received on such loans is accounted for on the cash-basis or cost-recovery method, until qualifying for return to accrual. Loans are returned to accrual status when all the principal and interest amounts contractually due are brought current and future payments are reasonably assured.
PREMIER FINANCIAL BANCORP, INC.
NOTES TO CONSOLIDATED FINANCIAL STATEMENTS
December 31, 2007, 2006, and 2005
(Dollars in Thousands, Except Per Share Data)
NOTE 1 - SUMMARY OF SIGNIFICANT ACCOUNTING POLICIES (Continued)
The allowance for loan losses is a valuation allowance for probable incurred credit losses increased by a provision for loan losses charged to expense. The allowance is an amount that management believes will be adequate to absorb probable incurred losses on existing loans based on evaluations of the collectability of loans and prior loan loss experience. The evaluations take into consideration such factors as changes in the nature and volume of the loan portfolio, overall portfolio quality, review of specific problem loans, and current economic conditions that may affect the borrowers’ ability to pay. Allocations of the allowance may be made for specific loans, but the entire allowance is available for any loan that, in management’s judgment, should be charged-off. Loans are charged against the allowance for loan losses when management believes that the collection of principal is unlikely. Subsequent recoveries, if any, are credited to the allowance.
A loan is impaired when full payment under the loan terms is not expected. Impairment is evaluated in total for smaller-balance loans of similar nature such as residential mortgage, consumer, and credit card loans, and accordingly, they are not separately identified for impairment disclosures. All other loans are evaluated for impairment on an individual basis. If a loan is impaired, a portion of the allowance is allocated so that the loan is reported, net, at the present value of estimated future cash flows using the loan’s existing rate or at the fair value of collateral if repayment is expected solely from the collateral.
Premises and Equipment: Land is carried at cost. Premises and equipment are stated at cost less accumulated depreciation. Depreciation is recorded principally by the straight-line method with useful lives ranging from 7 to 40 years for premises and from 3 to 15 years for equipment.
Real Estate Acquired Through Foreclosure: Real estate acquired through foreclosure is carried at the lower of the recorded investment in the property or its fair value less estimated costs to sell. Upon repossession, the value of the underlying loan is written down to the fair value of the real estate less estimated costs to sell by a charge to the allowance for loan losses, if necessary. Any subsequent write-downs are charged to operating expenses. Parcels of real estate maybe leased to third parties to offset holding period costs. Operating expenses of such properties, net of related income, and gains and losses on their disposition are included in other expenses.
Federal Home Loan Bank (FHLB) stock: The Banks are members of the FHLB system. Members are required to own a certain amount of stock based on the level of borrowings and other factors, and may invest in additional amounts. FHLB stock is carried at cost, classified as a restricted security, and periodically evaluated for impairment based on ultimate recovery of par value. Both cash and stock dividends are reported as income.
PREMIER FINANCIAL BANCORP, INC.
NOTES TO CONSOLIDATED FINANCIAL STATEMENTS
December 31, 2007, 2006, and 2005
(Dollars in Thousands, Except Per Share Data)
NOTE 1 - SUMMARY OF SIGNIFICANT ACCOUNTING POLICIES (Continued)
Long-term Assets: Premises and equipment and other long-term assets are reviewed for impairment when events indicate that the carrying amount may not be recoverable from future undiscounted cash flows. If impaired, the assets are recorded at fair value.
Repurchase Agreements: Substantially all repurchase agreement liabilities represent amounts advanced by various customers. Securities are pledged to cover these liabilities, which are not covered by federal deposit insurance.
Goodwill: Goodwill results from business acquisitions and represents the excess of the purchase price over the fair value of acquired tangible assets and liabilities and identifiable intangible assets. Goodwill is assessed at least annually for impairment and any such impairment will be recognized in the period identified. Impairment is evaluated using the aggregate of all banking operations. To evaluate impairment, management uses pricing valuation factors such as price-to-total assets and price-to-total deposits from databases of actual peer group bank sales. These valuation factors are applied to the comparable factors of the Company’s aggregate banking operations to arrive at estimated fair value. The Company does not have any identifiable intangible assets such as core deposit intangibles.
Stock Based Compensation: Effective January 1, 2006, the Company adopted Statement of Financial Accounting Standards (“SFAS”) No. 123(R), Share-based Payment, using the modified prospective transition method. Accordingly, the Company has recorded stock-based employee compensation cost using the fair value method starting in 2006.
Prior to January 1, 2006, employee compensation expense under stock options was reported using the intrinsic value method; therefore, no stock-based compensation cost is reflected in net income for the year ending December 31, 2005, as all options granted had an exercise price equal to or greater than the market price of the underlying common stock at date of grant.
PREMIER FINANCIAL BANCORP, INC.
NOTES TO CONSOLIDATED FINANCIAL STATEMENTS
December 31, 2007, 2006, and 2005
(Dollars in Thousands, Except Per Share Data)
NOTE 1 - SUMMARY OF SIGNIFICANT ACCOUNTING POLICIES (Continued)
The following table illustrates the effect on net income and earnings per share if expense was measured using the fair value recognition provisions of FASB Statement No. 123, Accounting for Stock-Based Compensation, for the year ending December 31, 2005 (in thousands, except per share information):
| Net Income | $ | 4,434 | ||
| Deduct: Stock based compensation expense determined under fair value based method | (93 | ) | ||
| Pro forma income | $ | 4,341 | ||
| Basic earnings per share from continuing operations | $ | 0.85 | ||
| Pro forma basic earnings per share | 0.83 | |||
| Diluted earnings per share from continuing operations | $ | 0.84 | ||
| Pro forma basic earnings per share | 0.82 |
Income Taxes: Income tax expense is the total of the current year income tax due or refundable and the change in deferred tax assets and liabilities. Deferred tax assets and liabilities are the expected future tax amounts for the temporary differences between carrying amounts and tax bases of assets and liabilities, computed using enacted tax rates. A valuation allowance, if needed, reduces deferred tax assets to the amount expected to be realized.
The Company adopted FASB Interpretation 48, Accounting for Uncertainty in Income Taxes ("FIN 48"), as of January 1, 2007. A tax position is recognized as a benefit only if it is more likely than not" that the tax position would be sustained in a tax examination, with a tax examination being presumed to occur. The amount recognized is the largest amount of tax benefit that is greater than 50% likely of being realized on examination. For tax positions not meeting the "more likely than not" test, no tax benefit is recorded. The adoption had no affect on the Company's financial statements.
The Company recognizes interest related to income tax matters as other interest expense and penalties related to income tax matters as other noninterest expense.
Off Balance Sheet Financial Instruments: Financial instruments include off-balance sheet credit instruments, such as commitments to make loans and commercial letters of credit, issued to meet customer financing needs. The face amount for these items represents the exposure to loss, before considering customer collateral or ability to repay. Such financial instruments are recorded when they are funded.
PREMIER FINANCIAL BANCORP, INC.
NOTES TO CONSOLIDATED FINANCIAL STATEMENTS
December 31, 2007, 2006, and 2005
(Dollars in Thousands, Except Per Share Data)
NOTE 1 - SUMMARY OF SIGNIFICANT ACCOUNTING POLICIES (Continued)
Earnings Per Common Share: Basic earnings per common share is net income divided by the weighted average number of common shares outstanding during the period. Diluted earnings per common share includes the dilutive effect of additional potential common shares issuable under stock options. Earnings and dividends per share are restated for all stock splits and dividends through the date of issuance of the financial statements.
Comprehensive Income: Comprehensive income consists of net income and other comprehensive income. Other comprehensive income includes unrealized gains and losses on securities available for sale which are also recognized as a separate component of equity.
Loss Contingencies: Loss contingencies, including claims and legal actions arising in the ordinary course of business, are recorded as liabilities when the likelihood of loss is probable and an amount or range of loss can be reasonably estimated. Management does not believe there now are such matters that will have a material effect on the financial statements.
Fair Value of Financial Instruments: Fair values of financial instruments are estimated using relevant market information and other assumptions, as more fully disclosed in a separate note. Fair value estimates involve uncertainties and matters of significant judgment regarding interest rates, credit risk, prepayments, and other factors, especially in the absence of broad markets for particular items. Changes in assumptions or in market conditions could significantly affect the estimates.
Operating Segments: All of the Company’s operations are considered by management to be aggregated into one reportable operating segment. While the chief decision-makers monitor the revenue streams of the various products and services, the identifiable segments are not material. Operations are managed and financial performance is evaluated on a Company-wide basis.
Reclassifications: Some items in the prior year financial statements were reclassified to conform to the current presentation.
PREMIER FINANCIAL BANCORP, INC.
NOTES TO CONSOLIDATED FINANCIAL STATEMENTS
December 31, 2007, 2006, and 2005
(Dollars in Thousands, Except Per Share Data)
NOTE 1 - SUMMARY OF SIGNIFICANT ACCOUNTING POLICIES (Continued)
Adoption of New Accounting Standards: The Company adopted FASB Interpretation 48, Accounting for Uncertainty in Income Taxes (“FIN 48”), as of January 1, 2007. The Company and its subsidiaries are subject to U.S. federal income tax as well as income tax of the state of West Virginia. The Company recognizes interest related to income tax matters as interest expense and penalties related to income tax matters as other expense. The Company did not have any amounts accrued for interest and penalties at January 1, 2007. Under FIN 48, a tax position is recognized as a benefit only if it is "more likely than not" that the tax position would be sustained in a tax examination, with a tax examination being presumed to occur. The amount recognized is the largest amount of tax benefit that is greater than 50% likely of being realized on examination. For tax positions not meeting the "more likely than not" test, no tax benefit is recorded. The Company is no longer subject to examination by taxing authorities for years before 2004. The Company does not expect the total amount of unrecognized tax benefits to significantly increase in the next twelve months. The adoption had no effect on the Company’s financial statements.
Recently Issued Accounting Standards Not Yet Adopted: In September 2006, the FASB issued Statement No. 157, Fair Value Measurements. This Statement defines fair value, establishes a framework for measuring fair value and expands disclosures about fair value measurements. This Statement establishes a fair value hierarchy about the assumptions used to measure fair value and clarifies assumptions about risk and the effect of a restriction on the sale or use of an asset. The standard is effective for fiscal years beginning after November 15, 2007. The adoption of this statement is not anticipated to have a material impact on the financial statements of the Company.
In February 2007, the FASB issued Statement No. 159 – The Fair Value Option for Financial Assets and Financial Liabilities. The standard provides companies with an option to report selected financial assets and liabilities at fair value and establishes presentation and disclosure requirements designed to facilitate comparisons between companies that choose different measurement attributes for similar types of assets and liabilities. The new standard is effective for the Company on January 1, 2008. The Company does not expect the adoption of SFAS No. 159 to have a material impact on the financial statements
PREMIER FINANCIAL BANCORP, INC.
NOTES TO CONSOLIDATED FINANCIAL STATEMENTS
December 31, 2007, 2006, and 2005
(Dollars in Thousands, Except Per Share Data)
Included in cash and due from banks are certain non-interest bearing deposits that are held at the Federal Reserve or maintained in vault cash in accordance with average balance requirements specified by the Federal Reserve Board of Governors. The balance requirement at December 31, 2007 and 2006 was approximately $3,109 and $3,300.
Amortized cost and fair value of securities available for sale and the related gross unrealized gains and losses recognized in accumulated other comprehensive income (loss) were as follows:
| 2007 | Amortized Cost | Unrealized Gains | Unrealized Losses | Fair Value | ||||||||||||
| Available for sale | ||||||||||||||||
U. S. Treasury securities | $ | 5,477 | $ | 97 | $ | - | $ | 5,574 | ||||||||
U. S. agency securities | 74,515 | 427 | (83 | ) | 74,859 | |||||||||||
Obligations of states and political subdivisions | 3,789 | 31 | (4 | ) | 3,816 | |||||||||||
Mortgage-backed securities | 40,350 | 131 | (488 | ) | 39,993 | |||||||||||
Total available for sale | $ | 124,131 | $ | 686 | $ | (575 | ) | $ | 124,242 | |||||||
| 2006 | Amortized Cost | Unrealized Gains | Unrealized Losses | Fair Value | ||||||||||||
| Available for sale | ||||||||||||||||
U. S. Treasury securities | $ | 6,454 | $ | - | $ | (53 | ) | $ | 6,401 | |||||||
U. S. agency securities | 77,885 | 43 | (1,017 | ) | 76,911 | |||||||||||
Obligations of states and political subdivisions | 3,413 | 15 | (15 | ) | 3,413 | |||||||||||
Mortgage-backed securities | 35,332 | 40 | (755 | ) | 34,617 | |||||||||||
Corporate securities | 25 | - | - | 25 | ||||||||||||
Total available for sale | $ | 123,109 | $ | 98 | $ | (1,840 | ) | $ | 121,367 | |||||||
PREMIER FINANCIAL BANCORP, INC.
NOTES TO CONSOLIDATED FINANCIAL STATEMENTS
December 31, 2007, 2006, and 2005
(Dollars in Thousands, Except Per Share Data)
NOTE 3 –SECURITIES (Continued)
The amortized cost and fair value of securities at December 31, 2007 by contractual maturity are shown below. Expected maturities will differ from contractual maturities because borrowers may have the right to call or prepay obligations with or without call or prepayment penalties.
Amortized Cost | Fair Value | |||||||
| Available for sale | ||||||||
Due in one year or less | $ | 31,013 | $ | 30,962 | ||||
Due after one year through five years | 42,861 | 43,321 | ||||||
Due after five years through ten years | 9,746 | 9,803 | ||||||
Due after ten years | 161 | 163 | ||||||
Mortgage-backed securities | 40,350 | 39,993 | ||||||
Total available for sale | $ | 124,131 | $ | 124,242 | ||||
There were no sales of securities in 2006 or 2005. Proceeds from sale of securities during 2007 were $25. No gain or loss was realized on the sale.
Securities with an approximate carrying value of $84,116 and $76,845 at December 31, 2007 and 2006 were pledged to secure public deposits, trust funds, securities sold under agreements to repurchase and for other purposes as required or permitted by law.
Securities with unrealized losses at year-end 2007 aggregated by investment category and length of time that individual securities have been in a continuous unrealized loss position are as follows:
| Less than 12 Months | 12 Months or More | Total | ||||||||||||||||||||||
| Description of Securities | Fair Value | Unrealized Loss | Fair Value | Unrealized Loss | Fair Value | Unrealized Loss | ||||||||||||||||||
| U.S. agency securities | $ | 1,997 | $ | (3 | ) | $ | 24,712 | $ | (80 | ) | $ | 26,709 | $ | (83 | ) | |||||||||
Obligations of states and political subdivisions | 245 | (3 | ) | 210 | (1 | ) | 455 | (4 | ) | |||||||||||||||
Gov’t guaranteed mortgage- backed securities | - | - | 11,019 | (239 | ) | 11,019 | (239 | ) | ||||||||||||||||
| Mortgage-backed securities | 4,404 | (49 | ) | 10,179 | (200 | ) | 14,583 | (249 | ) | |||||||||||||||
| Total temporarily impaired | $ | 6,646 | $ | (55 | ) | $ | 46,120 | $ | (520 | ) | $ | 52,766 | $ | (575 | ) | |||||||||
PREMIER FINANCIAL BANCORP, INC.
NOTES TO CONSOLIDATED FINANCIAL STATEMENTS
December 31, 2007, 2006, and 2005
(Dollars in Thousands, Except Per Share Data)
NOTE 3 –SECURITIES (Continued)
Securities with unrealized losses at year-end 2006 aggregated by investment category and length of time that individual securities have been in a continuous unrealized loss position, are as follows:
| Less than 12 Months | 12 Months or More | Total | ||||||||||||||||||||||
| Description of Securities | Fair Value | Unrealized Loss | Fair Value | Unrealized Loss | Fair Value | Unrealized Loss | ||||||||||||||||||
| U.S. treasury securities | $ | 5,435 | $ | (32 | ) | $ | 966 | $ | (21 | ) | $ | 6,401 | $ | (53 | ) | |||||||||
| U.S. agency securities | 3,735 | (12 | ) | 63,145 | (1,005 | ) | 66,880 | (1,017 | ) | |||||||||||||||
Obligations of states and political subdivisions | 1,581 | (12 | ) | 322 | (3 | ) | 1,903 | (15 | ) | |||||||||||||||
Gov’t guaranteed mortgage- backed securities | - | - | 13,121 | (381 | ) | 13,121 | (381 | ) | ||||||||||||||||
| Mortgage-backed securities | 943 | (3 | ) | 14,720 | (371 | ) | 15,663 | (374 | ) | |||||||||||||||
| Total temporarily impaired | $ | 11,694 | $ | (59 | ) | $ | 92,274 | $ | (1,781 | ) | $ | 103,968 | $ | (1,840 | ) | |||||||||
The investment portfolio is predominately high quality interest-bearing bonds with defined maturity dates backed by the U.S. Government or Government sponsored entities. The unrealized losses at December 31, 2007 and December 31, 2006 are price changes resulting from changes in the interest rate environment and are considered to be temporary declines in the value of the securities. Their fair value is expected to recover as the bonds approach their maturity date and/or market conditions improve.
Loans at year-end were as follows:
| 2007 | 2006 | |||||||
| Commercial, secured by real estate | $ | 100,278 | $ | 101,786 | ||||
| Commercial, other | 40,438 | 43,981 | ||||||
| Real estate construction | 24,035 | 11,303 | ||||||
| Residential real estate | 133,776 | 138,795 | ||||||
| Agricultural | 1,845 | 1,930 | ||||||
| Consumer and home equity | 41,893 | 42,188 | ||||||
| Other | 4,305 | 3,814 | ||||||
| $ | 346,570 | $ | 343,797 | |||||
PREMIER FINANCIAL BANCORP, INC.
NOTES TO CONSOLIDATED FINANCIAL STATEMENTS
December 31, 2007, 2006, and 2005
(Dollars in Thousands, Except Per Share Data)
NOTE 4 – LOANS (Continued)
Certain directors and executive officers of the Banks and companies in which they have beneficial ownership, were loan customers of the Banks during 2007 and 2006. Such related party loans are governed by federal banking regulations which require such loans to be made in the ordinary course of business.
An analysis of the 2007 activity with respect to all director and executive officer loans is as follows (in thousands):
| Balance, December 31, 2006 | $ | 14,331 | ||
| Additions, including loans now meeting disclosure requirements | 7,836 | |||
| Amounts collected and loans no longer meeting disclosure requirements | (6,905 | ) | ||
| Balance, December 31, 2007 | $ | 15,262 |
Activity in the allowance for loan losses was as follows:
| 2007 | 2006 | 2005 | ||||||||||
| Balance, beginning of year | $ | 6,661 | $ | 7,892 | $ | 9,384 | ||||||
| Loans charged off | (758 | ) | (1,410 | ) | (2,215 | ) | ||||||
| Recoveries | 672 | 1,340 | 719 | |||||||||
| Provision for loan losses | (78 | ) | (1,161 | ) | 4 | |||||||
| Balance, end of year | $ | 6,497 | $ | 6,661 | $ | 7,892 | ||||||
Impaired loans were as follows:
| 2007 | 2006 | 2005 | ||||||||||
| Impaired loans at year-end with an allowance | $ | 4,761 | $ | 7,766 | $ | 7,926 | ||||||
| Impaired loans at year-end with no allowance | 0 | 0 | 291 | |||||||||
| Amount of the allowance for loan losses allocated | 1,482 | 1,774 | 1,921 | |||||||||
| Average of impaired loans during the year | 5,926 | 8,258 | 10,819 | |||||||||
| Interest income recognized during impairment | 495 | 480 | 583 | |||||||||
| Cash-basis interest income recognized | 495 | 480 | 499 | |||||||||
PREMIER FINANCIAL BANCORP, INC.
NOTES TO CONSOLIDATED FINANCIAL STATEMENTS
December 31, 2007, 2006, and 2005
(Dollars in Thousands, Except Per Share Data)
NOTE 4 – LOANS (Continued)
Nonperforming loans at year end were as follows:
| 2007 | 2006 | 2005 | ||||||||||
| Loans past due over 90 days still on accrual | $ | 987 | $ | 992 | $ | 853 | ||||||
| Non-accrual loans | 3,157 | 4,698 | 3,751 | |||||||||
| Restructured loans | 1,489 | 1,268 | 1,540 | |||||||||
Nonperforming loans include some impaired loans and smaller balance homogeneous loans, such as residential mortgage and consumer loans, that are collectively evaluated for impairment. Loan impairment is reported when full payment under the loan terms is not anticipated, which can include loans that are current or less than 90 days past due.
Year-end premises and equipment were as follows:
| 2007 | 2006 | |||||||
| Land and improvements | $ | 1,522 | $ | 1,522 | ||||
| Buildings and leasehold improvements | 5,673 | 5,659 | ||||||
| Construction in progress | 193 | - | ||||||
| Furniture and equipment | 7,357 | 7,431 | ||||||
| 14,745 | 14,612 | |||||||
| Less: accumulated depreciation | (8,545 | ) | (8,079 | ) | ||||
| $ | 6,200 | $ | 6,533 | |||||
Operating Leases: The Company leases certain branch and other properties as well as some equipment under operating leases. Rent expense, net of rental income, was $213, $204, and $188 for 2007, 2006, and 2005. Rent commitments, before considering renewal options that generally are present, were as follows:
| 2008 | $ | 158 | ||
| 2009 | 89 | |||
| 2010 | 75 | |||
| 2011 | 75 | |||
| 2012 and thereafter | 43 | |||
| $ | 440 |
PREMIER FINANCIAL BANCORP, INC.
NOTES TO CONSOLIDATED FINANCIAL STATEMENTS
December 31, 2007, 2006, and 2005
(Dollars in Thousands, Except Per Share Data)
At December 31, 2007 the scheduled maturities of time deposits are as follows:
| 2008 | $ | 161,823 | ||
| 2009 | 24,518 | |||
| 2010 | 8,297 | |||
| 2011 | 4,630 | |||
| 2012 and thereafter | 3,279 | |||
| $ | 202,547 |
Certain directors and executive officers of the Banks and companies in which they have beneficial ownership were deposit customers of the Banks during 2007 and 2006. The balance of such deposits at December 31, 2007 and 2006 were approximately $10,011 and $11,295.
Securities sold under agreements to repurchase generally mature within one to ninety days from the transaction date. Information concerning securities sold under agreements to repurchase is summarized as follows:
| 2007 | 2006 | |||||||
| Year-end balance | $ | 12,477 | $ | 12,555 | ||||
| Average balance during the year | $ | 13,124 | $ | 9,542 | ||||
| Average interest rate during the year | 2.41 | % | 2.43 | % | ||||
| Maximum month-end balance during the year | $ | 13,672 | $ | 12,555 | ||||
| Weighted average interest rate at year-end | 1.96 | % | 2.34 | % | ||||
PREMIER FINANCIAL BANCORP, INC.
NOTES TO CONSOLIDATED FINANCIAL STATEMENTS
December 31, 2007, 2006, and 2005
(Dollars in Thousands, Except Per Share Data)
The Banks own stock of the Federal Home Loan Bank (FHLB) of Cincinnati, Ohio. This stock allows the Banks to borrow advances from the FHLB.
At year-end, advances from the FHLB were as follows:
| 2007 | 2006 | |||||||
| Payments due at maturity in May 2010, fixed rate at rates from 6.25% to 6.64%, averaging 6.5% | $ | 4,000 | $ | 4,000 | ||||
| Payments due monthly with maturities from October 2011 to June 2012, fixed rates from 4.10% to 4.40%, averaging 4.24% | 843 | 1,106 | ||||||
| Payments due monthly with maturities from March 2011 to June 2011, fixed rates from 5.30% to 5.60%, averaging 5.46% | - | 2,179 | ||||||
| $ | 4,843 | $ | 7,285 | |||||
Advances are secured by the FHLB stock, certain pledged investment securities and substantially all single family first mortgage loans of the participating Banks. Scheduled principal payments due on advances during the five years subsequent to December 31, 2007 are as follows:
| 2008 | $ | 185 | ||
| 2009 | 193 | |||
| 2010 | 4,201 | |||
| 2011 | 201 | |||
| 2012 | 63 | |||
| Thereafter | - | |||
| $ | 4,843 | |||
On January 31, 2006, the Company executed and delivered to First Guaranty Bank of Hammond, Louisiana a Promissory Note and Business Loan Agreement dated January 31, 2006 for the principal amount of $7,000, bearing interest floating daily at the “Wall Street Journal” prime rate (currently 6.50%) and requiring monthly principal payments of $50 until maturity on September 28, 2017. The note is secured by a pledge of Premier’s 100% interest in Boone County Bank (a wholly owned subsidiary) under Commercial Pledge Agreement dated January 31, 2006. Premier’s chairman owns approximately 27.6% of the voting stock of First Guaranty Bank. Premier’s board of directors reviewed the loan and authorized the Company to enter into the loan transaction.
PREMIER FINANCIAL BANCORP, INC.
NOTES TO CONSOLIDATED FINANCIAL STATEMENTS
December 31, 2007, 2006, and 2005
(Dollars in Thousands, Except Per Share Data)
NOTE 9 – NOTES PAYABLE AND OTHER BORROWED FUNDS (Continued)
On November 10, 2006, Premier Financial Bancorp, Inc. (“Premier”) executed and delivered to The Bankers’ Bank of Kentucky, Inc. of Frankfort, Kentucky (“Bankers’ Bank”) a Term Note and Business Loan Agreement dated November 10, 2006 in the principal amount of $6,500, bearing interest floating daily at the “Wall Street Journal” prime rate minus 1.00% (currently 5.50%) and requiring 83 monthly principal and interest payments of $100 and a final payment of any balance due at maturity on November 9, 2013. The note is secured by a pledge of Premier’s 100% interest in Citizens Deposit Bank and Trust, Inc. (a wholly owned subsidiary) and Premier’s 100% interest in Farmers-Deposit Bank, Eminence, Kentucky (a wholly owned subsidiary) under a Stock Pledge and Security Agreement dated November 10, 2006.
Scheduled principal payments due on the two bank borrowings subsequent to December 31, 2007 are as follows:
| 2008 | $ | 1,512 | ||
| 2009 | 1,563 | |||
| 2010 | 1,618 | |||
| 2011 | 1,675 | |||
| 2012 | 1,470 | |||
| Thereafter | 574 | |||
| $ | 8,412 | |||
In addition to the $6,500 Term Note, Premier executed and delivered to the Bankers’ Bank a Promissory Note whereby Premier may request and receive monies from Bankers’ Bank from time to time, but the aggregate outstanding principal balance under the Promissory Note at any time shall not exceed $3,500, and the right to request and receive monies from Bankers’ Bank expires on November 9, 2008. The outstanding principal balance under this Promissory Note shall bear annual interest floating daily at the “Wall Street Journal” prime rate minus 1.00% (currently 5.50%). Interest on this Promissory Note shall be due and payable on the 5th day of each, January, April, July and October during the term of this Promissory Note, and at the maturity date hereof. Any outstanding principal amount loaned to Premier under this Promissory Note, and not previously repaid, shall be due on November 9, 2008. The Promissory Note is secured by the same collateral as the $6,500 Term Note. At December 31, 2007, there was no outstanding principal balance on the Promissory Note.
PREMIER FINANCIAL BANCORP, INC.
NOTES TO CONSOLIDATED FINANCIAL STATEMENTS
December 31, 2007, 2006, and 2005
(Dollars in Thousands, Except Per Share Data)
The components of the provision (benefit) for income taxes are as follows:
| 2007 | 2006 | 2005 | ||||||||||
| Current | $ | 2,822 | $ | 2,212 | $ | 910 | ||||||
| Deferred | 648 | 1,071 | 1,119 | |||||||||
Provision for income taxes | $ | 3,470 | $ | 3,283 | $ | 2,029 | ||||||
The Company’s deferred tax assets and liabilities at December 31 are shown below. No valuation allowance for the realization of deferred tax assets is considered necessary.
| 2007 | 2006 | |||||||
| Deferred tax assets | ||||||||
Allowance for loan losses | $ | 2,209 | $ | 2,265 | ||||
Write-downs of other real estate owned | 15 | 80 | ||||||
Taxable income on non-accrual loans | 103 | 153 | ||||||
Unrealized loss on investment securities | - | 592 | ||||||
Other | 2 | 40 | ||||||
Total deferred tax assets | 2,329 | 3,130 | ||||||
| Deferred tax liabilities | ||||||||
Amortization of intangibles | $ | 2,342 | $ | 2,001 | ||||
Depreciation | 34 | 105 | ||||||
Federal Home Loan Bank dividends | 319 | 318 | ||||||
Deferred loan fees | 170 | - | ||||||
Unrealized gain on investment securities | 38 | - | ||||||
Other | 155 | 157 | ||||||
Total deferred tax liabilities | 3,058 | 2,581 | ||||||
| Net deferred tax assets, included in other assets | $ | (729 | ) | $ | 549 | |||
PREMIER FINANCIAL BANCORP, INC.
NOTES TO CONSOLIDATED FINANCIAL STATEMENTS
December 31, 2007, 2006, and 2005
(Dollars in Thousands, Except Per Share Data)
NOTE 10 – INCOME TAXES (Continued)
An analysis of the differences between the effective tax rates and the statutory U.S. federal income tax rate is as follows:
| 2007 | 2006 | 2005 | ||||||||||||||||||||||
| U.S. federal income tax rate | $ | 3,600 | 34.0 | % | $ | 3,327 | 34.0 | % | $ | 2,197 | 34.0 | % | ||||||||||||
| Changes from the statutory rate | ||||||||||||||||||||||||
Tax-exempt interest income | (124 | ) | (1.2 | ) | (97 | ) | (1.0 | ) | (81 | ) | (1.3 | ) | ||||||||||||
Non-deductible interest expense related to carrying tax-exempt interest earning assets | 11 | 0.1 | 8 | 0.1 | 5 | 0.1 | ||||||||||||||||||
Non-deductible stock compensation expense | 44 | 0.4 | 46 | 0.5 | - | 0.0 | ||||||||||||||||||
Tax credits, net | (2 | ) | (0.0 | ) | (10 | ) | (0.1 | ) | (10 | ) | (0.2 | ) | ||||||||||||
Officer’s life insurance death benefit | (73 | ) | (0.6 | ) | - | - | - | - | ||||||||||||||||
Other | 14 | 0.1 | 9 | 0.1 | (82 | ) | (1.2 | ) | ||||||||||||||||
| $ | 3,470 | 32.8 | % | $ | 3,283 | 33.6 | % | $ | 2,029 | 31.4 | % | |||||||||||||
Unrecognized Tax Benefits: The Company does not have any beginning or ending unrecognized tax benefits. The Company does not expect the total amount of unrecognized tax benefits to significantly increase in the next twelve months. There were no interest and penalties recorded in the income statement or accrued for the year ended December 31, 2007 related to unrecognized tax benefits.
The Company and its subsidiaries file a consolidated U.S. Corporation income tax return and a combined return in the state of West Virginia. The Company files a corporate income tax return in the state of Kentucky. The Company is no longer subject to examination by taxing authorities for years before 2004. A federal examination of the tax years 2001 - 2003 was completed in 2005 with no material adjustments.
The Company has qualified profit sharing plans that cover substantially all employees. Contributions to the plans consist of a Company match and additional amounts at the discretion of the Company’s Board of Directors. Total contributions to the plans were $245, $236 and $229 in 2007, 2006 and 2005.
PREMIER FINANCIAL BANCORP, INC.
NOTES TO CONSOLIDATED FINANCIAL STATEMENTS
December 31, 2007, 2006, and 2005
(Dollars in Thousands, Except Per Share Data)
In 2002, the Company registered 200,000 shares of its common stock to be reserved stock based incentive programs (“the 2002 Plan”). From time to time the Company grants stock options to its employees. The Company accounts for these option grants using SFAS No. 123R, “Share-Based Payments,” which establishes accounting requirements for share-based compensation to employees. Under SFAS 123R, the Company estimates the fair value of the options at the time they are granted to employees and expenses that fair value over the vesting period of the option grant.
On January 17, 2007, 37,000 incentive stock options were granted out of the 2002 Plan at an exercise price of $14.22. These options vest in three equal annual installments ending on January 17, 2010. On February 15, 2006, 35,250 incentive stock options were granted out of the 2002 Plan at an exercise price of $16.00. These options vest in three equal annual installments ending on February 15, 2009. On January 19, 2005, 35,000 incentive stock options were granted out of the 2002 Plan at an exercise price of $11.62. These options vested in three equal annual installments ending on January 19, 2008.
The fair value of the Company's employee stock options granted is estimated at the date of grant using the Black-Scholes option-pricing model. This model requires the input of highly subjective assumptions, changes to which can materially affect the fair value estimate. Additionally, there may be other factors that would otherwise have a significant effect on the value of employee stock options granted but are not considered by the model. The assumptions used in the Black-Scholes option-pricing model are as follows:
| 2007 | 2006 | 2005 | ||||||||||
| Risk-free interest rate | 4.78 | % | 4.62 | % | 3.70 | % | ||||||
| Expected option life (yrs) | 5.00 | 5.00 | 5.00 | |||||||||
| Expected stock price volatility | 0.25 | 0.26 | 0.25 | |||||||||
| Dividend yield | 1.41 | % | 0.00 | % | 0.00 | % | ||||||
| Weighted average fair value of options granted during the year | $ | 3.81 | $ | 5.21 | $ | 3.48 | ||||||
The risk-free interest rate for the expected term of the option is based on the U.S. Treasury yield in effect at the time of the grant. The expected option life was estimated at half the total option term since there has been little option exercise history. The expected stock price volatility is based on historical volatilities of the Company’s common stock. The dividend yield is estimated at the time of the option grant based upon Premier's dividend rate and stock price at that time.
PREMIER FINANCIAL BANCORP, INC.
NOTES TO CONSOLIDATED FINANCIAL STATEMENTS
December 31, 2007, 2006, and 2005
(Dollars in Thousands, Except Per Share Data)
NOTE 12 – STOCK COMPENSATION EXPENSE (Continued)
Compensation expense of $130 and $142 was recorded for the year ended December 31, 2007 and 2006, respectively. The after tax impact was to reduce earnings per share by $0.02 in 2007 and $0.03 in 2006. Prior to the adoption of SFAS No. 123R, the Company presented all tax benefits of deductions resulting from the exercise of stock options as operating cash flows in the Consolidated Statements of Cash Flows. SFAS No. 123R requires the cash flows from the tax benefits resulting from tax deductions in excess of the compensation expense recognized for those options to be classified as financing cash flows.
Stock-based compensation expense is recognized ratably over the requisite service period for all awards. Unrecognized stock-based compensation expense related to stock options totaled $72 at December 31, 2007. This unrecognized expense is expected to be recognized over the next 24 months based on the vesting periods of the options.
Information related to the stock option plan during each year follows:
| 2007 | 2006 | 2005 | ||||||||||
| Intrinsic value of options exercised | $ | 3 | $ | 9 | $ | 5 | ||||||
| Cash received from option exercises | 10 | 27 | 15 | |||||||||
| Tax benefit realized from option exercises | 1 | 2 | - | |||||||||
PREMIER FINANCIAL BANCORP, INC.
NOTES TO CONSOLIDATED FINANCIAL STATEMENTS
December 31, 2007, 2006, and 2005
(Dollars in Thousands, Except Per Share Data)
NOTE 12 – STOCK COMPENSATION EXPENSE - continued
A summary of the Company’s stock option activity is as follows:
| 2007 | 2006 | 2005 | ||||||||||||||||||||||
Weighted Average Exercise | Weighted Average Exercise | Weighted Average Exercise | ||||||||||||||||||||||
| Options | Price | Options | Price | Options | Price | |||||||||||||||||||
| Outstanding at beginning of year | 120,248 | $ | 12.25 | 111,750 | $ | 11.05 | 83,650 | $ | 10.65 | |||||||||||||||
| Grants | 37,000 | 14.22 | 35,250 | 16.00 | 35,000 | 11.62 | ||||||||||||||||||
| Exercises | (1,000 | ) | 10.85 | (3,002 | ) | 9.02 | (1,667 | ) | 8.50 | |||||||||||||||
| Forfeitures or expired | (5,999 | ) | 14.60 | (23,750 | ) | 13.11 | (5,233 | ) | 9.31 | |||||||||||||||
| Outstanding at year-end | 150,249 | $ | 12.65 | 120,248 | $ | 12.25 | 111,750 | $ | 11.05 | |||||||||||||||
| Exercisable at year-end | 84,096 | $ | 11.31 | 55,931 | $ | 10.68 | 54,180 | $ | 11.61 | |||||||||||||||
| Weighted average remaining life | 6.9 | 7.3 | 6.2 | |||||||||||||||||||||
Weighted average fair value of options granted during the year | $ | 3.81 | $ | 5.21 | $ | 3.48 | ||||||||||||||||||
Additional information regarding stock options outstanding and exercisable at December 31, 2007, is provided in the following table:
| - - - - - - - - Outstanding - - - - - - - - | - - - - - - - - Currently Exercisable - - - - - - - - | ||||||||||||||||||||||||||||
| Range of Exercise Prices | Number | Weighted Average Exercise Price | Aggregate Intrinsic Value | Number | Weighted Average Remaining Contractual Life | Weighted Average Exercise Price | Aggregate Intrinsic Value | ||||||||||||||||||||||
| $7.50 to $10.00 | 42,416 | $ | 8.69 | $ | 173 | 42,416 | 5.6 | $ | 8.69 | $ | 173 | ||||||||||||||||||
| $10.01 to $12.50 | 31,833 | 11.62 | 37 | 20,505 | 7.1 | 11.62 | 24 | ||||||||||||||||||||||
| $12.51 to $15.00 | 33,500 | 14.22 | - | - | 9.1 | 14.22 | - | ||||||||||||||||||||||
| $15.01 to $17.50 | 42,500 | 16.13 | - | 21,175 | 6.3 | 16.26 | - | ||||||||||||||||||||||
| Outstanding at Dec 31, 2007 | 150,249 | 12.65 | $ | 210 | 84,096 | 6.9 | 11.31 | $ | 197 | ||||||||||||||||||||
PREMIER FINANCIAL BANCORP, INC.
NOTES TO CONSOLIDATED FINANCIAL STATEMENTS
December 31, 2007, 2006, and 2005
(Dollars in Thousands, Except Per Share Data)
During 2007, 2006, and 2005, the Company paid approximately $231, $228, and $191 for printing, supplies, furniture, and equipment to a company affiliated by common ownership. The Company also paid another affiliate approximately $459, $468, and $499 in 2007, 2006 and 2005 to permit the Company’s employees to participate in that entity’s employee medical benefit plan.
During 2007, 2006 and 2005, the Company paid approximately $52, $52, and $52 to lease its headquarters facility at 2883 Fifth Avenue, Huntington, West Virginia from River City Properties, LLC, an entity 12.5% owned by the Company’s Chairman of the Board.
A reconciliation of the numerators and denominators of the earnings per common share and earnings per common share assuming dilution computations for 2007, 2006 and 2005 is presented below:
| 2007 | 2006 | 2005 | ||||||||||
| Basic earnings per share | ||||||||||||
Income available to common stockholders | $ | 7,119 | $ | 6,501 | $ | 4,434 | ||||||
Weighted average common shares outstanding | 5,237 | 5,236 | 5,233 | |||||||||
Earnings per share | $ | 1.36 | $ | 1.24 | $ | 0.85 | ||||||
| Diluted earnings per share | ||||||||||||
Income available to common stockholders | $ | 7,119 | $ | 6,501 | $ | 4,434 | ||||||
Weighted average common shares outstanding | 5,237 | 5,236 | 5,233 | |||||||||
Add dilutive effects of assumed exercise of stock options | 26 | 28 | 15 | |||||||||
Weighted average common and dilutive potential common shares outstanding | 5,263 | 5,264 | 5,248 | |||||||||
Earnings per share assuming dilution | $ | 1.35 | $ | 1.24 | $ | 0.84 | ||||||
Stock options for 42,500, 46,250 and 32,000 shares of common stock were not considered in computing diluted earnings per share for 2007, 2006 and 2005 because they were antidilutive.
PREMIER FINANCIAL BANCORP, INC.
NOTES TO CONSOLIDATED FINANCIAL STATEMENTS
December 31, 2007, 2006, and 2005
(Dollars in Thousands, Except Per Share Data)
The fair values of the Company’s financial instruments at year-end are as follows:
| 2007 | 2006 | |||||||||||||||
Carrying Amount | Fair Value | Carrying Amount | Fair Value | |||||||||||||
| Financial assets | ||||||||||||||||
Cash and due from banks | $ | 22,365 | $ | 22,365 | $ | 16,974 | $ | 16,974 | ||||||||
Federal funds sold | 32,035 | 32,035 | 27,583 | 27,583 | ||||||||||||
Securities available for sale | 124,242 | 124,242 | 121,367 | 121,367 | ||||||||||||
Loans held for sale | 1,891 | 1,891 | 1,978 | 1,978 | ||||||||||||
Loans, net | 340,073 | 344,158 | 337,136 | 337,730 | ||||||||||||
Federal Home Loan Bank and Federal Reserve Bank stock | 3,314 | 3,314 | 3,265 | 3,265 | ||||||||||||
Interest receivable | 2,768 | 2,768 | 2,821 | 2,821 | ||||||||||||
| Financial liabilities | ||||||||||||||||
Deposits | $ | (449,033 | ) | $ | (448,648 | ) | $ | (438,950 | ) | $ | (437,280 | ) | ||||
Federal funds purchased | (392 | ) | (392 | ) | (976 | ) | (976 | ) | ||||||||
Securities sold under agreements to repurchase | (12,477 | ) | (12,477 | ) | (12,555 | ) | (12,555 | ) | ||||||||
Federal Home Loan Bank advances | (4,843 | ) | (5,051 | ) | (7,285 | ) | (7,506 | ) | ||||||||
Other borrowed funds | (8,412 | ) | (8,367 | ) | (12,275 | ) | (12,303 | ) | ||||||||
Interest payable | (1,064 | ) | (1,064 | ) | (1,061 | ) | (1,061 | ) | ||||||||
Carrying amount is the estimated fair value for cash and due from banks, Federal funds sold, Federal Home Loan Bank and Federal Reserve Bank stock, accrued interest receivable and payable, demand deposits, short-term debt, and variable rate loans or deposits that reprice frequently and fully. Security fair values are based on market prices or dealer quotes, and if no such information is available, on the rate and term of the security and information about the issuer. For fixed rate loans or deposits and for variable rate loans or deposits with infrequent repricing or repricing limits, fair value is based on discounted cash flows using current market rates applied to the estimated life and credit risk. Fair values for impaired loans are estimated using discounted cash flow analysis or underlying collateral values. Fair value of debt is based on current rates for similar financing. The fair value of commitments to extend credit and standby letters of credit is not material.
PREMIER FINANCIAL BANCORP, INC.
NOTES TO CONSOLIDATED FINANCIAL STATEMENTS
December 31, 2007, 2006, and 2005
(Dollars in Thousands, Except Per Share Data)
The Banks are parties to financial instruments with off-balance sheet risk in the normal course of business to meet the financing needs of their customers. These financial instruments include standby letters of credit and commitments to extend credit in the form of unused lines of credit. The Banks use the same credit policies in making commitments and conditional obligations as they do for on-balance sheet instruments. In addition, the Banks offer a service whereby deposit customers for a fee are permitted to overdraw their accounts up to a certain deminimus amount, also known as “bounce protection” or “overdraft protection”. The aggregate unused portion of “bounce protection” was $5,003 and $5,226 at December 31, 2007 and 2006.
At December 31, 2007 and 2006, the Banks had the following financial instruments whose approximate contract amounts represent credit risk:
| 2007 | 2006 | |||||||
| Standby letters of credit | $ | 977 | $ | 678 | ||||
| Commitments to extend credit | ||||||||
Fixed | $ | 6,100 | $ | 5,498 | ||||
Variable | 33,112 | 32,988 | ||||||
Standby letters of credit represent conditional commitments issued by the Banks to guarantee the performance of a third party. The credit risk involved in issuing these letters of credit is essentially the same as the risk involved in extending loans to customers. Collateral held varies but primarily includes real estate and certificates of deposit. Some letters of credit are unsecured.
Commitments to extend credit are agreements to lend to a customer as long as there is no violation of any condition established in the contract. Outstanding commitments are at current market rates. Fixed rate loan commitments have interest rates ranging from 3.36% to 18.00%. Commitments generally have fixed expiration dates or other termination clauses and may require payment of a fee. The Banks evaluate each customer’s creditworthiness on a case-by-case basis. Since some of the commitments are expected to expire without being drawn upon, the total commitment amounts do not necessarily represent future cash requirements. Collateral held varies but may include accounts receivable, inventory, property and equipment, and income producing properties.
PREMIER FINANCIAL BANCORP, INC.
NOTES TO CONSOLIDATED FINANCIAL STATEMENTS
December 31, 2007, 2006, and 2005
(Dollars in Thousands, Except Per Share Data)
Legal proceedings involving the Company and its subsidiaries periodically arise in the ordinary course of business, including claims by debtors and their related interests against the Company’s subsidiaries following initial collection proceedings. These legal proceedings sometimes can involve claims for substantial damages. At December 31, 2007 management is unaware of any legal proceedings for which the expected outcome would have a material adverse effect upon the consolidated financial statements of the Company.
The Company’s principal source of funds for dividend payments is dividends received from the subsidiary Banks. Banking regulations limit the amount of dividends that may be paid without prior approval of regulatory agencies. Under these regulations, the amount of dividends that may be paid in any calendar year is limited to the current year’s net profits, as defined, combined with the retained net profits of the preceding two years, subject to the capital requirements and additional restrictions as discussed below. During 2008 the Banks could, without prior approval, declare dividends to Premier of approximately $3.0 million plus any 2008 net profits retained to the date of the dividend declaration.
The Company and the subsidiary Banks are subject to various regulatory capital requirements administered by the federal banking agencies. Failure to meet minimum capital requirements can initiate certain mandatory and possibly additional discretionary actions by regulators that, if undertaken, could have a direct material effect on the Company’s financial statements. Under capital adequacy guidelines and the regulatory framework for prompt corrective action, the Banks must meet specific guidelines that involve quantitative measures of their assets, liabilities, and certain off-balance sheet items as calculated under regulatory accounting practices.
These quantitative measures established by regulation to ensure capital adequacy require the Company and Banks to maintain minimum amounts and ratios (set forth in the following table) of Total and Tier I capital (as defined in the regulations) to risk-weighted assets (as defined), and of Tier I capital (as defined) to average assets (as defined). Management believes, as of December 31, 2007 the Company and the Banks meet all quantitative capital adequacy requirements to which they are subject.
PREMIER FINANCIAL BANCORP, INC.
NOTES TO CONSOLIDATED FINANCIAL STATEMENTS
December 31, 2007, 2006, and 2005
(Dollars in Thousands, Except Per Share Data)
NOTE 18 - STOCKHOLDERS’ EQUITY (Continued)
The Company’s and the subsidiary Banks’ capital amounts and ratios as of December 31, 2007 are presented in the table below. As of December 31, 2007, the most recent notification from each of the Banks’ primary Federal regulators categorized the subsidiary Banks as well capitalized under the regulatory framework for prompt corrective action. To be categorized as well capitalized, the Banks must maintain minimum Total risk-based, Tier I risk-based and Tier I leverage ratios as set forth in the following table. There are no conditions or events since that notification that management believes have changed the Banks’ categories.
| To Be Well Capitalized | ||||||||||||||||||||||||
| For Capital | Under Prompt Corrective | |||||||||||||||||||||||
| Actual | Adequacy Purposes | Action Provisions | ||||||||||||||||||||||
| 2007 | Amount | Ratio | Amount | Ratio | Amount | Ratio | ||||||||||||||||||
| Total Capital (to Risk-Weighted Assets): | ||||||||||||||||||||||||
Consolidated (1) | $ | 55,538 | 17.3 | % | $ | 25,646 | 8 | % | $ | 32,058 | 10 | % | ||||||||||||
Boone County Bank | 16,492 | 20.9 | 6,319 | 8 | 7,898 | 10 | ||||||||||||||||||
Citizens Deposit Bank | 13,253 | 18.3 | 5,805 | 8 | 7,256 | 10 | ||||||||||||||||||
Farmers Deposit Bank | 8,179 | 18.4 | 3,555 | 8 | 4,443 | 10 | ||||||||||||||||||
Ohio River Bank | 7,537 | 16.5 | 3,653 | 8 | 4,566 | 10 | ||||||||||||||||||
First Central Bank | 9,509 | 11.8 | 6,434 | 8 | 8,043 | 10 | ||||||||||||||||||
| Tier I Capital (to Risk-Weighted Assets): | ||||||||||||||||||||||||
Consolidated (1) | $ | 51,500 | 16.1 | % | $ | 12,823 | 4 | % | $ | 19,235 | 6 | % | ||||||||||||
Boone County Bank | 15,500 | 19.6 | 3,159 | 4 | 4,739 | 6 | ||||||||||||||||||
Citizens Deposit Bank | 12,342 | 17.0 | 2,902 | 4 | 4,354 | 6 | ||||||||||||||||||
Farmers Deposit Bank | 7,603 | 17.1 | 1,777 | 4 | 2,666 | 6 | ||||||||||||||||||
Ohio River Bank | 7,016 | 15.4 | 1,826 | 4 | 2,740 | 6 | ||||||||||||||||||
First Central Bank | 8,594 | 10.7 | 3,217 | 4 | 4,826 | 6 | ||||||||||||||||||
| Tier I Capital (to Average Assets): | ||||||||||||||||||||||||
Consolidated (1) | $ | 51,500 | 9.8 | % | $ | 21,081 | 4 | % | $ | 26,351 | 5 | % | ||||||||||||
Boone County Bank | 15,500 | 10.6 | 5,864 | 4 | 7,330 | 5 | ||||||||||||||||||
Citizens Deposit Bank | 12,342 | 10.0 | 4,927 | 4 | 6,159 | 5 | ||||||||||||||||||
Farmers Deposit Bank | 7,603 | 11.2 | 2,728 | 4 | 3,410 | 5 | ||||||||||||||||||
Ohio River Bank | 7,016 | 8.4 | 3,324 | 4 | 4,155 | 5 | ||||||||||||||||||
First Central Bank | 8,594 | 8.1 | 4,269 | 4 | 5,336 | 5 | ||||||||||||||||||
| (1) Consolidated company is not subject to Prompt Corrective Action Provisions | ||||||||||||||||||||||||
PREMIER FINANCIAL BANCORP, INC.
NOTES TO CONSOLIDATED FINANCIAL STATEMENTS
December 31, 2007, 2006, and 2005
(Dollars in Thousands, Except Per Share Data)
NOTE 18 - STOCKHOLDERS’ EQUITY (Continued)
The Company’s and the subsidiary Banks’ capital amounts and ratios as of December 31, 2006 are presented in the table below:
| To Be Well Capitalized | ||||||||||||||||||||||||
| For Capital | Under Prompt Corrective | |||||||||||||||||||||||
| Actual | Adequacy Purposes | Action Provisions | ||||||||||||||||||||||
| 2006 | Amount | Ratio | Amount | Ratio | Amount | Ratio | ||||||||||||||||||
| Total Capital (to Risk-Weighted Assets): | ||||||||||||||||||||||||
Consolidated (1) | $ | 50,313 | 16.0 | % | $ | 25,239 | 8 | % | $ | 31,549 | 10 | % | ||||||||||||
Boone County Bank | 16,488 | 20.7 | 6,372 | 8 | 7,965 | 10 | ||||||||||||||||||
Citizens Deposit Bank | 12,819 | 17.4 | 5,893 | 8 | 7,366 | 10 | ||||||||||||||||||
Farmers Deposit Bank | 10,441 | 23.2 | 3,606 | 8 | 4,507 | 10 | ||||||||||||||||||
Ohio River Bank | 7,233 | 16.3 | 3,557 | 8 | 4,447 | 10 | ||||||||||||||||||
First Central Bank | 9,291 | 12.6 | 5,904 | 8 | 7,380 | 10 | ||||||||||||||||||
| Tier I Capital (to Risk-Weighted Assets): | ||||||||||||||||||||||||
Consolidated (1) | $ | 46,336 | 14.7 | % | $ | 12,619 | 4 | % | $ | 18,929 | 6 | % | ||||||||||||
Boone County Bank | 15,490 | 19.5 | 3,186 | 4 | 4,779 | 6 | ||||||||||||||||||
Citizens Deposit Bank | 11,893 | 16.2 | 2,946 | 4 | 4,419 | 6 | ||||||||||||||||||
Farmers Deposit Bank | 9,854 | 21.9 | 1,803 | 4 | 2,704 | 6 | ||||||||||||||||||
Ohio River Bank | 6,721 | 15.1 | 1,779 | 4 | 2,668 | 6 | ||||||||||||||||||
First Central Bank | 8,475 | 11.5 | 2,952 | 4 | 4,428 | 6 | ||||||||||||||||||
| Tier I Capital (to Average Assets): | ||||||||||||||||||||||||
Consolidated (1) | $ | 46,336 | 8.9 | % | $ | 20,855 | 4 | % | $ | 26,068 | 5 | % | ||||||||||||
Boone County Bank | 15,490 | 10.6 | 5,824 | 4 | 7,280 | 5 | ||||||||||||||||||
Citizens Deposit Bank | 11,893 | 10.0 | 4,779 | 4 | 5,974 | 5 | ||||||||||||||||||
Farmers Deposit Bank | 9,854 | 13.4 | 2,949 | 4 | 3,686 | 5 | ||||||||||||||||||
Ohio River Bank | 6,721 | 8.4 | 3,211 | 4 | 4,013 | 5 | ||||||||||||||||||
First Central Bank | 8,475 | 8.5 | 3,981 | 4 | 4,976 | 5 | ||||||||||||||||||
| (1) Consolidated company is not subject to Prompt Corrective Action Provisions | ||||||||||||||||||||||||
PREMIER FINANCIAL BANCORP, INC.
NOTES TO CONSOLIDATED FINANCIAL STATEMENTS
December 31, 2007, 2006, and 2005
(Dollars in Thousands, Except Per Share Data)
| CONDENSED BALANCE SHEETS | ||||||||
| December 31 | ||||||||
| 2007 | 2006 | |||||||
| ASSETS | ||||||||
| Cash | $ | 7,858 | $ | 3,562 | ||||
| Investment in subsidiaries | 67,688 | 69,218 | ||||||
| Premises and equipment | 501 | 560 | ||||||
| Other assets | 51 | 375 | ||||||
| Total assets | $ | 76,098 | $ | 73,715 | ||||
| LIABILITIES AND STOCKHOLDERS’ EQUITY | ||||||||
| Other liabilities | $ | 297 | $ | 438 | ||||
| Other borrowed funds | 8,412 | 12,275 | ||||||
Total liabilities | 8,709 | 12,713 | ||||||
| Stockholders’ equity | ||||||||
Preferred stock | - | - | ||||||
Common stock | 1,109 | 1,108 | ||||||
Additional paid-in capital | 43,763 | 43,624 | ||||||
Retained earnings | 22,444 | 17,420 | ||||||
Accumulated other comprehensive income | 73 | (1,150 | ) | |||||
Total stockholders’ equity | 67,389 | 61,002 | ||||||
| Total liabilities and stockholders’ equity | $ | 76,098 | $ | 73,715 | ||||
PREMIER FINANCIAL BANCORP, INC.
NOTES TO CONSOLIDATED FINANCIAL STATEMENTS
December 31, 2007, 2006, and 2005
(Dollars in Thousands, Except Per Share Data)
NOTE 19 - PARENT COMPANY FINANCIAL STATEMENTS (Continued)
| Condensed Statement of Operations | ||||||||||||
| Years Ended December 31 | ||||||||||||
| 2007 | 2006 | 2005 | ||||||||||
| Income | ||||||||||||
Dividends from subsidiaries | $ | 11,085 | $ | 6,440 | $ | 8,405 | ||||||
Interest and dividend income | 41 | 37 | 45 | |||||||||
Other income | 648 | 615 | 484 | |||||||||
Total income | 11,774 | 7,092 | 8,934 | |||||||||
| Expenses | ||||||||||||
Interest expense | 769 | 1,334 | 2,142 | |||||||||
Salaries and employee benefits | 1,337 | 1,199 | 1,180 | |||||||||
Professional fees | 136 | 165 | 37 | |||||||||
Accelerated subordinated debenture issuance costs | - | 548 | 184 | |||||||||
Other expenses | 497 | 420 | 341 | |||||||||
Total expenses | 2,739 | 3,666 | 3,884 | |||||||||
Income before income taxes and equity in undistributed income of subsidiaries | 9,035 | 3,426 | 5,050 | |||||||||
| Income tax (benefit) | (837 | ) | (1,160 | ) | (1,314 | ) | ||||||
| Income before equity in undistributed income of subsidiaries | 9,872 | 4,586 | 6,364 | |||||||||
Equity in undistributed income (excess distributions) of subsidiaries | (2,753 | ) | 1,915 | (1,930 | ) | |||||||
| Net income | $ | 7,119 | $ | 6,501 | $ | 4,434 | ||||||
PREMIER FINANCIAL BANCORP, INC.
NOTES TO CONSOLIDATED FINANCIAL STATEMENTS
December 31, 2007, 2006, and 2005
(Dollars in Thousands, Except Per Share Data)
NOTE 19 - PARENT COMPANY FINANCIAL STATEMENTS (Continued)
| Condensed Statement of Cash Flows | ||||||||||||
| Years Ended December 31 | ||||||||||||
| 2007 | 2006 | 2005 | ||||||||||
| Cash flows from operating activities | ||||||||||||
Net income | $ | 7,119 | $ | 6,501 | $ | 4,434 | ||||||
Adjustments to reconcile net income to net cash from operating activities | ||||||||||||
Depreciation | 97 | 101 | 83 | |||||||||
Stock compensation expense | 130 | 142 | - | |||||||||
(Gain) loss from sales of assets | (5 | ) | (4 | ) | (3 | ) | ||||||
Dividends in excess of net income of subsidiaries | 2,753 | - | 1,930 | |||||||||
Equity in undistributed earnings of subsidiaries | - | (1,915 | ) | - | ||||||||
Change in other assets | 324 | 258 | (35 | ) | ||||||||
Change in other liabilities | (141 | ) | 17 | (4,934 | ) | |||||||
Net cash from operating activities | 10,277 | 5,100 | 1,475 | |||||||||
| Cash flows from investing activities | ||||||||||||
Proceeds from liquidation of subsidiary | - | 203 | - | |||||||||
Proceeds from sales of assets, net of purchases | (33 | ) | (116 | ) | (108 | ) | ||||||
Net cash from investing activities | (33 | ) | 87 | (108 | ) | |||||||
| Cash flows from financing activities | ||||||||||||
Early redemption of subordinated note | - | (15,250 | ) | (5,000 | ) | |||||||
Cash dividends paid to shareholders | (2,095 | ) | (523 | ) | - | |||||||
Issuance of common stock | 10 | 27 | 15 | |||||||||
Proceeds from borrowings | - | 13,500 | - | |||||||||
Payments on other borrowed funds | (3,863 | ) | (2,627 | ) | (800 | ) | ||||||
Net cash from financing activities | (5,948 | ) | (4,873 | ) | (5,785 | ) | ||||||
| Net change in cash and cash equivalents | 4,296 | 314 | (4,418 | ) | ||||||||
| Cash and cash equivalents at beginning of year | 3,562 | 3,248 | 7,666 | |||||||||
| Cash and cash equivalents at end of year | $ | 7,858 | $ | 3,562 | $ | 3,248 | ||||||
PREMIER FINANCIAL BANCORP, INC.
NOTES TO CONSOLIDATED FINANCIAL STATEMENTS
December 31, 2007, 2006, and 2005
(Dollars in Thousands, Except Per Share Data)
| Earnings per Share | ||||||||||||||||||||
| Interest Income | Net Interest Income | Net Income | Basic | Fully Diluted | ||||||||||||||||
| 2007 | ||||||||||||||||||||
First Quarter | $ | 8,612 | $ | 5,511 | $ | 1,786 | $ | 0.34 | $ | 0.34 | ||||||||||
Second Quarter | 8,712 | 5,551 | 1,790 | 0.34 | 0.34 | |||||||||||||||
Third Quarter | 8,738 | 5,590 | 1,807 | 0.35 | 0.34 | |||||||||||||||
Fourth Quarter | 8,690 | 5,644 | 1,736 | 0.33 | 0.33 | |||||||||||||||
| 2006 | ||||||||||||||||||||
First Quarter | $ | 7,676 | $ | 5,204 | $ | 1,367 | $ | 0.26 | $ | 0.26 | ||||||||||
Second Quarter | 8,014 | 5,360 | 2,000 | 0.38 | 0.38 | |||||||||||||||
Third Quarter | 8,248 | 5,377 | 1,475 | 0.28 | 0.28 | |||||||||||||||
Fourth Quarter | 8,462 | 5,454 | 1,659 | 0.32 | 0.32 | |||||||||||||||
In 2007, interest income improved in each of the first three quarters as yields on investments securities increased and the outstanding balance of federal funds sold increased. In the fourth quarter, as the Federal Reserve began reducing its targeted federal funds rate, the Company’s interest income also began to decline. The improvement in interest income resulted in the improvement in net interest income, but was tempered by a rising trend in the rates paid on deposits. During the first two quarters of 2007, the Company aggressively reduced its FHLB and bank borrowings as funds became available. This debt reduction also served to improve net interest income. Fourth quarter net interest income also benefitted from the decline in the floating interest rate on bank borrowings.
Similarly in 2006, interest income improved each quarter as yields on earning assets rose and loan balances outstanding increased. The improvement in interest income drove the improvement in net interest income, but was tempered by rising interest costs on deposits. Net income was also impacted positively in each of the four quarters by reversals of the provision for loan losses (negative provisions) especially the second quarter when $819 of negative provisions were recorded. The negative provisions were due to improvements in the Company’s historical loan loss ratios, recoveries of previously charged-off loans and the collection of impaired loans with previous allocations of the allowance for loan losses that were no longer needed.
PREMIER FINANCIAL BANCORP, INC.
NOTES TO CONSOLIDATED FINANCIAL STATEMENTS
December 31, 2007, 2006, and 2005
(Dollars in Thousands, Except Per Share Data)
On October 24, 2007, the Company entered into a material definitive agreement with Citizens First Bank, Inc. (Citizens First), a bank with $60 million of total assets located in Ravenswood, West Virginia. Under terms of the definitive agreement, Premier will purchase Citizens First for up to $11,700 in stock and cash. Each share of Citizens First common stock will be entitled to merger consideration of cash and stock that will generally total $29.25, subject to certain limitations. Premier will issue 480,000 shares of its common stock plus, depending upon Premier’s stock price nearer to transaction closing, Premier will pay in total up to $5.3 million in cash to the shareholders of Citizens First. The transaction, which still requires approval by Citizens First’s shareholders, is anticipated to close sometime in the second quarter of 2008.
On November 27, 2007, the Company entered into a material definitive agreement with Traders Bankshares, Inc. (Traders), a single bank holding company with $105 million of total assets located in Spencer, West Virginia. Under terms of the definitive agreement, Premier will purchase Traders for approximately $18,140 in stock and cash. Each share of Traders common stock will be entitled to merger consideration of $50.00 cash and 3.75 shares of Premier common stock, subject to certain limitations. Premier will issue approximately 675,000 shares of its common stock to the shareholders of Traders. The transaction, which still requires approval by Traders’ shareholders, is anticipated to close sometime in the second quarter of 2008.
103
PREMIER FINANCIAL BANCORP, INC.
FORM 10-K
December 31, 2007
Item 9. Changes In and Disagreements with Accountants on Accounting and Financial Disclosure
There have been no changes in or disagreements with accountants on accounting or financial disclosure matters.
| A. | Disclosure Controls & Procedures |
Premier management, including the Chief Executive Officer and Chief Financial Officer, has conducted an evaluation of the effectiveness of disclosure controls and procedures pursuant to the Securities and Exchange Act of 1934 Rule 13a-15c as of the end of the period covered by this annual report. Based on that evaluation, the Chief Executive Officer and Chief Financial Officer concluded that the disclosure controls and procedures are effective in ensuring that all material information required to be filed in this annual report has been made known to them in a timely fashion.
| B. | Management’s Report on Internal Control Over Financial Reporting |
Management of the Company is responsible for establishing and maintaining effective internal control over financial reporting as defined in Rules 13a-15(f) under the Securities Exchange Act of 1934. The Company’s internal control over financial reporting is designed to provide reasonable assurance to the Company’s management and board of directors regarding the preparation and fair presentation of published financial statements.
Management assessed the effectiveness of the Company’s internal control over financial reporting as of December 31, 2007. In making this assessment, management used the criteria set forth by the Committee of Sponsoring Organizations of the Treadway Commission (COSO) in Internal Control — Integrated Framework. Based on our assessment, we believe that, as of December 31, 2007, the Company’s internal control over financial reporting is effective based on those criteria.
This annual report does not include an attestation report of the Company’s registered public accounting firm regarding internal control over financial reporting. Management’s report was not subject to attestation by the Company’s registered public accounting firm pursuant to temporary rules of the Securities and Exchange Commission that permit the Company to provide only management’s report in this annual report.
PREMIER FINANCIAL BANCORP, INC.
FORM 10-K
December 31, 2007
| /s/ Robert W. Walker | /s/ Brien M. Chase | |
| Robert W. Walker, President and | Brien M. Chase, Senior Vice President | |
| Chief Executive Officer | and Chief Financial Officer | |
| Date: March 28, 2008 | Date: March 28, 2008 | |
C. Changes in Internal Controls over Financial Reporting
There were no changes in internal controls over financial reporting during the fourth fiscal quarter that have materially affected or are reasonably likely to materially affect Premier's internal controls over financial reporting.
D. Inherent Limitations on Internal Control
"Internal controls" are procedures, which are designed with the objective of providing reasonable assurance that (1) transactions are properly authorized; (2) assets are safeguarded against unauthorized or improper use; and (3) transactions are properly recorded and reported, all so as to permit the preparation of reports and financial statements in conformity with generally accepted accounting principles. However, a control system, no matter how well conceived and operated, can provide only reasonable, not absolute, assurance that the objectives of the control system are met. Further, the design of a control system must reflect the fact that there are resource constraints, and the benefits of controls must be considered relative to their cost. Because of the inherent limitations in all control systems, no evaluation of controls can provide absolute assurance that all control issues and instances of fraud, if any, within a company have been detected. These inherent limitations include the realities that judgments in decision-making can be faulty, and that breakdowns can occur because of simple error or mistake. The design of any system of controls is also based, in part, upon certain assumptions about the likelihood of future events, and there can be no assurance that any design will succeed in achieving its stated goals under all potential future conditions. Over time, a control may become inadequate because of changes in conditions, or the degree of compliance with the policies or procedures may deteriorate. Because of the inherent limitations in a cost-effective control system, misstatements due to error or fraud may occur and not be detected. Finally, controls can be circumvented by the individual acts of some persons, by collusion of two or more people, or by management override of the control.
None
PREMIER FINANCIAL BANCORP, INC.
FORM 10-K
December 31, 2007
PART III
Item 10, 11, 12, 13 and 14. Directors, Executive Officers and Corporate Governance; Executive Compensation; Security Ownership of Certain Beneficial Owners and Management and Related Stockholder Matters; Certain Relationships and Related Transactions, and Director Independence; and Principal Accountant Fees and Services
The information required by these Items is omitted because the Company is filing a definitive proxy statement pursuant to Regulation 14A not later than 120 days after the end of the fiscal year covered by this report which includes the required information. The required information contained in the Company's proxy statement is incorporated herein by reference.
PREMIER FINANCIAL BANCORP, INC.
FORM 10-K
December 31, 2007
PART IV
(a) The following documents are filed as part of this report:
1. Financial Statements:
2. Financial Statement Schedules:
No financial statement schedules have been included as part of this report because they are either not required or the information is otherwise included.
3. List of Exhibits:
The following is a list of exhibits required by Item 601 of Regulation S-K and by paragraph (c) of this Item 14.
Exhibit Number | Description of Document |
| 2.1 | Definitive Merger Agreement between Premier Financial Bancorp, Inc. and Citizens First Bank, Inc. dated October 24, 2007, filed as Exhibit 10.1 to form 8-K filed on October 25, 2007 is incorporated herein by reference. |
| 2.2 | Definitive Merger Agreement between Premier Financial Bancorp, Inc. and Traders Bankshares, Inc. dated November 27, 2007, filed as Exhibit 10.1 to form 8-K filed on November 28, 2007 is incorporated herein by reference. |
| 3.1 | Form of Articles of Incorporation of registrant (included as Exhibit 3.1 to registrant's Registration Statement on Form S-1, Registration No. 333-1702, filed on February 28, 1996 with the Commission and incorporated herein by reference). |
| 3.2 | Form of Articles of Amendment to Articles of Incorporation effective March 15, 1996 re: amendment to Article IV (included as Exhibit 3.2 to registrant's Amendment No. 1 to Registration Statement on Form S-1, Registration No. 333-1702, filed on March 25, 1996 with the Commission and incorporated herein by reference). |
| 3.3 | By-Laws of Premier Financial Bancorp, Inc., as amended, filed as Exhibit 3.1 to Form 10-Q filed on November 13, 2007 is incorporated herein by reference. |
| *** 10.1 | Premier Financial Bancorp, Inc. 1996 Employee Stock Ownership Incentive Plan (included as Exhibit 10.6 to registrant's Registration Statement on Form S-1, Registration No. 333-1702, filed on February 28, 1996 with the Commission and incorporated herein by reference). |
PREMIER FINANCIAL BANCORP, INC.
FORM 10-K
December 31, 2007
Exhibit Number | Description of Document |
| *** 10.2 | Premier Financial Bancorp, Inc.'s 2002 Employee Stock Ownership Incentive Plan, filed as Annex A to definitive proxy statement dated May 17, 2002, filed on April 30, 2002 with the Commission, is incorporated herein by reference. |
| *** 10.3 | Form of Stock Option Agreement pursuant to 2002 Employee Stock Ownership Incentive Plan, filed as Exhibit 10.1 to form 8-K filed January 24, 2005, is incorporated herein by reference. |
| 10.4 | Premier Financial Bancorp, Inc. written agreement with the Federal Reserve Bank of Cleveland dated January 29, 2003, filed as Exhibit 10.4 to form 10-K filed on March 27, 2003, is incorporated herein by reference. |
| 10.5 | Premier Financial Bancorp, Inc. contract with Fiserv Solutions, Inc. dated December 20, 2004, filed as Exhibit 10 to form 8-K filed December 23, 2004, is incorporated herein by reference. |
| 10.6 | Loan Agreement between Premier Financial Bancorp, Inc. and First Guaranty Bank, Hammond, Louisiana, filed as Exhibit 10.6 to form 10-K filed March 30, 2006, is incorporated herein by reference. |
| 10.7 | Promissory Note to First Guaranty Bank, Hammond, Louisiana, filed as Exhibit 10.7 to form 10-K filed March 30, 2006, is incorporated herein by reference. |
| 10.8 | Collateral Agreement with First Guaranty Bank, Hammond Louisiana, filed as Exhibit 10.8 to form 10-K filed March 30, 2006, is incorporated herein by reference. |
| 10.9 | Loan Agreement between Premier Financial Bancorp, Inc. and The Kentucky Bankers’ Bank, Inc. filed as Exhibit 10.1 to form 8-K filed on November 10, 2006, is incorporated herein by reference. |
| 10.10 | Term Note to The Kentucky Bankers’ Bank, Inc. filed as Exhibit 10.2to form 8-K filed on November 10, 2006, is incorporated herein by reference. |
| 10.11 | Promissory Note to The Kentucky Bankers’ Bank, Inc. filed as Exhibit 10.3to form 8-K filed on November 10, 2006, is incorporated herein by reference. |
| 10.12 | Stock Pledge and Security Agreement between Premier Financial Bancorp, Inc. and The Kentucky Bankers’ Bank, Inc. filed as Exhibit 10.4to form 8-K filed on November 10, 2006, is incorporated herein by reference. |
| 14.1 | Premier Financial Bancorp, Inc. Code of Ethics for the Chief Executive Officer, Chief Financial Officer and Chief Accounting Officer, filed as Exhibit 14.1 to form 10-K filed on April 14, 2004, is incorporated herein by reference. |
| 14.2 | Premier Financial Bancorp, Inc. Code of Business Conduct and Ethics, filed as Exhibit 14.2 to form 10-K filed on April 14, 2004, is incorporated herein by reference. |
| 21 | Subsidiaries of registrant |
| 23 | Consent of Independent Registered Public Accounting Firm |
PREMIER FINANCIAL BANCORP, INC.
FORM 10-K
December 31, 2007
Exhibit Number | Description of Document |
| 31.1 | Principal Executive Officer Certification Pursuant to Section 302 of the Sarbanes-Oxley Act of 2002 - Robert W. Walker |
| 31.2 | Principal Executive Officer Certification Pursuant to Section 302 of the Sarbanes-Oxley Act of 2002 - Brien M. Chase |
| 32 | Robert W. Walker and Brien M. Chase Certification Pursuant to 18 U.S.C. Section 1350 as adopted pursuant to Section 906 of the Sarbanes-Oxley Act 2002. |
| *** Denotes executive compensation plans and arrangements. | |
PREMIER FINANCIAL BANCORP, INC.
FORM 10-K
December 31, 2007
Pursuant to the requirements of the Section 13 or 15(d) of the Securities Exchange Act of 1934, registrant has duly caused this report to be signed on its behalf by the undersigned thereunto duly authorized.
| PREMIER FINANCIAL BANCORP, INC. | |
| By: /s/ Robert W. Walker, President | |
| Robert W. Walker, President | |
| Date: March 28, 2008 | |
PREMIER FINANCIAL BANCORP, INC.
FORM 10-K
December 31, 2007
Pursuant to the requirements of the Securities Exchange Act of 1934, this report has been signed below by the following persons on behalf of the registrant in the capacities and on the dates indicated.
| /s/ Robert W. Walker | Principal Executive and Director | March 28, 2008 |
| Robert W. Walker | ||
| /s/ Brien M. Chase | Principal Financial and Accounting | March 28, 2008 |
| Brien M. Chase | Officer | |
| /s/ Toney K. Adkins | Director | March 20, 2008 |
| Toney K. Adkins | ||
| /s/ Hosmer A. Brown, III | Director | March 19, 2008 |
| Hosmer A. Brown, III | ||
| /s/ Edsel Burns | Director | March 26, 2008 |
| Edsel Burns | ||
| /s/ E. V. Holder, Jr. | Director | March 19, 2008 |
| E. V. Holder, Jr. | ||
| /s/ Keith F. Molihan | Director | March 19, 2008 |
| Keith F. Molihan | ||
| /s/ Marshall T. Reynolds | Chairman of the Board | March 19, 2008 |
| Marshall T. Reynolds | ||
| /s/ Neal Scaggs | Director | March 19, 2008 |
| Neal Scaggs | ||
| /s/ Thomas W. Wright | Director | March 19, 2008 |
| Thomas W. Wright | ||
111