UNITED STATES
SECURITIES AND EXCHANGE COMMISSION
Washington, D.C. 20549
FORM 10-K
(Mark One)
| | [X] | Annual Report Pursuant to Section 13 or 15(d) of the Securities Exchange Act of 1934 |
For the fiscal year ended December 31, 2011
or
| | [ ] | Transition report pursuant to Section 13 or 15(d) of the Securities Exchange Act of 1934 |
For the transition period from to
Commission File Number 001-34066

| | |
| Delaware | | 36-3681151 |
(State or other jurisdiction of incorporation or organization) | | (I.R.S. Employer Identification No.) |
120 South LaSalle Street
Chicago, Illinois 60603
(Address of principal executive offices) (zip code)
Registrant’s telephone number, including area code:(312) 564-2000
Securities registered pursuant to Section 12(b) of the Act:
| | |
Title of each class | | Name of each exchange on which registered |
| Common Stock, No Par Value | | Nasdaq Global Select Stock Market |
| 10% Trust Preferred Securities of PrivateBancorp Capital Trust IV | | Nasdaq Global Select Stock Market |
Securities registered pursuant to Section 12(g) of the Act: None
Indicate by check mark if the registrant is a well-known seasoned issuer, as defined in Rule 405 of the Securities Act. Yes [X] No [ ].
Indicate by check mark if the registrant is not required to file reports pursuant to Section 13 or Section 15(d) of the Act.
Yes [ ] No [X].
Indicate by check mark whether the registrant (1) has filed all reports required to be filed by Section 13 or 15(d) of the Securities Exchange Act of 1934 during the preceding 12 months (or for such shorter period that the registrant was required to file such reports), and (2) has been subject to such filing requirements for the past 90 days. Yes [X] No [ ].
Indicate by check mark whether the registrant has submitted electronically and posted on its corporate Web site, if any, every Interactive Data File required to be submitted and posted pursuant to Rule 405 of Regulation S-T (§ 232.405 of this chapter) during the preceding 12 months (or for such shorter period that the registrant was required to submit and post such files). Yes [X] No [ ]
Indicate by check mark if disclosure of delinquent filers pursuant to Item 405 of Regulation S-K (§ 229.405 of this chapter) is not contained herein, and will not be contained, to the best of registrant’s knowledge, in definitive proxy or information statements incorporated by reference in Part III of this Form 10-K or any amendment to this Form 10-K. [X].
Indicate by check mark whether the registrant is a large accelerated filer, an accelerated filer, a non-accelerated filer, or a smaller reporting company. See the definitions of “large accelerated filer,” “accelerated filer” and “smaller reporting company” in Rule 12b-2 of the Exchange Act). Large accelerated filer [X] Accelerated filer [ ] Non-accelerated filer [ ] Smaller reporting company [ ].
Indicate by check mark whether the registrant is a shell company (as defined in Rule 12b-2 of the Act).Yes [ ] No [X].
The aggregate market value of the registrant’s outstanding voting and non-voting common stock held by non-affiliates on June 30, 2011, determined using a per share closing price on that date of $13.80, as quoted on The Nasdaq Stock Market, was $826,139,912.
At February 24, 2012, there were 72,415,731 shares of the issuer’s voting and non-voting common stock, without par value, outstanding.
DOCUMENTS INCORPORATED BY REFERENCE
Portions of the Registrant’s Proxy Statement for its 2012 Annual Meeting of Stockholders are incorporated by reference into Part III hereof.
FORM 10-K
TABLE OF CONTENTS
2
PART I
ITEM 1. BUSINESS
PrivateBancorp, Inc.
PrivateBancorp, Inc. (“PrivateBancorp,” we or the “Company”), was incorporated in Delaware in 1989 and became a holding company registered under the Bank Holding Company Act of 1956, as amended. The PrivateBank and Trust Company (the “Bank” or the “PrivateBank”), the bank subsidiary of PrivateBancorp, was opened in Chicago in 1991. The Bank provides customized business and personal financial services to middle market companies and business owners, executives, entrepreneurs and families in all the markets and communities it serves.
Beginning in late 2007, we hired a team of experienced middle market bankers and, under the leadership of our current chief executive officer, initiated a strategic plan to transform the organization into a leading middle market commercial bank. Over the past four years, we added nearly 1,000 new client relationships, shifted the composition of our loan portfolio from 19% commercial and industrial and 66% commercial real estate and construction at December 31, 2007 to 60% commercial and industrial and 32% commercial real estate and construction at December 31, 2011. Over this four year period, total assets have grown from $5.0 billion at December 31, 2007 to $12.4 billion at December 31, 2011, with total loans up from $4.2 billion at December 31, 2007 to $9.0 billion at December 31, 2011. To support the growth and capital requirements of the organization, since December 31, 2007, we have issued approximately $560.1 million of voting and nonvoting common stock and $143.8 million of trust preferred securities, as well as $243.8 million of preferred stock under the U.S. Department of the Treasury (the “Treasury”) Troubled Asset Relief Program (“TARP”) Capital Purchase Program (“CPP”).
Since we opened for business in Chicago in 1991, we have expanded into multiple geographic markets through the creation of new banks and banking offices and the acquisition of existing banks. Today, we operate through a single bank subsidiary and serve seven geographic markets in the Midwest, as well as Denver and Atlanta. The majority of our business is conducted in the greater Chicago market. We operate 18 full service branch locations in the Chicago market, 10 full service branch locations in the Atlanta, Detroit, Kansas City, Milwaukee and St. Louis markets and 5 business development offices in the Atlanta, Cleveland, Denver, Des Moines and Minneapolis markets. We employed 1,045 full-time equivalent employees at December 31, 2011.
Business Focus and Strategic Direction
Under the leadership of our current management team, our business model has emphasized (1) building middle market commercial client relationships and selectively targeting clients within and outside our current market areas, (2) larger and varied commercial credits with increased diversification across industries, (3) an expanded product suite of treasury management, capital markets and other fee generating services, (4) private banking and wealth management services and products, (5) developing enhanced risk management infrastructure and (6) establishing a community banking platform.
We deliver a full spectrum of commercial and personal banking products and services to our clients through our commercial banking, community banking and private wealth businesses. We leverage our model by introducing clients to a full range of lending, treasury management, and investment and capital markets products to meet their commercial needs and residential mortgage banking, private banking, trust and investment services to meet their personal needs. Our goal is to be one of our clients’ primary banks, build a meaningful long-term relationship and deliver services across our entire product spectrum. In addition, we have identified specific strategic initiatives to provide growth, promote efficiencies and drive non-interest income. They include (1) expanding our community banking efforts by enhancing small-business banking and our retail branch networks through strategic acquisitions as they become available and (2) enhancing private wealth and residential mortgage banking. Set forth below is a summary of each of our business areas, as well as our strategies.
Commercial Banking
Our commercial banking group focuses on the specific needs of middle market companies both in the Midwest, and, to a lesser extent, nationally. Our commercial loan portfolio includes lines of credit to businesses for working capital needs, term loans, and letters of credit. Certain non-residential owner-occupied commercial real estate loans are included in our commercial loan portfolio where the cash flows from the owners’ businesses serve as the primary source of loan repayment.
3
Illinois, Specialty and National Commercial Banking.The Illinois commercial banking group targets primarily Illinois-based middle market clients with $10 million to $2 billion in revenue. Closely related to this group are select specialty banking groups focused on healthcare, architecture, engineering and construction, asset-based lending, and security alarm finance. We believe it is appropriate to provide more individualized assistance to these niche clients due to their specific needs, which may differ from the needs of more general commercial clients. The specialty groups employ bankers with many years of experience in these industries and market primarily to Illinois-based businesses, many of which have a national scope. The national commercial banking group manages middle market commercial banking teams in the markets outside of Illinois in which we have branch banking operations – Atlanta, Detroit, Kansas City, Milwaukee and St. Louis. In these areas, we serve clients with $10 million to $2 billion in revenue. In our business development markets – Cleveland, Denver, Des Moines and Minneapolis – we focus on companies with $50 million to $2 billion in revenue.
Commercial Real Estate.Our commercial real estate business focuses on the needs of commercial real estate professionals including professional commercial and residential real estate developers and investors. The majority of our clients are based within our geographic footprint, though properties financed may be located in other regions. We provide funding for construction, acquisition, redevelopment, working capital, and refinancing of retail, industrial, office and multifamily properties. Our commercial real estate specialists are located in the Chicago, Denver, Detroit, Milwaukee, Minneapolis and St. Louis markets. Given the challenges in the commercial real estate industry during the past few years, we have reduced the size of our commercial real estate portfolio through selective exits and workouts/sales of commercial real estate credits. As of December 31, 2011, commercial real estate loans as a percentage of total loans were 29%, a decrease from 32% as of December 31, 2010. However, we recognize the long term value in serving commercial real estate clients and will continue to provide products and services to these clients, taking appropriate risk management into account. During the last quarter of 2011, we added a net $74.8 million in commercial real estate loans.
Treasury Management, Capital Markets and Syndications. We provide comprehensive services for commercial clients to manage their cash and liquidity, including: receivables and payables services, reporting, reconciliation and data integration solutions and demand deposit account and/or investment options for optimizing balances. We assist clients with their unique financial markets and risk management objectives by providing interest rate and foreign exchange services. With respect to interest rate hedging, we offer clients interest rate swaps, rate caps, floors and collars, rate swaptions and cancellable interest rate swaps. To assist clients with their currency management, we help clients establish foreign exchange policy, budgeting, contract negotiation, risk management and research advisory services; foreign currency wire transfers, drafts, cash letter deposits and collections; and forwards, window forwards, swaps and options. During 2011, we earned treasury management and capital market fees of $19.9 million and $19.3 million, respectively, representing an increase of 18% and 35%, respectively, over the prior year.
As a function of our risk management efforts, our syndications team helps to manage large commitment levels and credit exposure linked to individual client relationships. In larger transactions, the syndications team either fully underwrites loans (in which we lend the full amount but then syndicate portions of that loan to other banks) or we arrange the loan (in which we commit only a portion of the total loan, pro-rata with other banks). In either instance, we receive an administrative agent or arranger’s fee plus interest on the loan. In addition, these transactions provide our client service teams the opportunity to cross-sell other services and products to these clients. During 2011, the majority of the syndications led by the Bank related to loans under $50 million in total size and syndication fee revenue from these activities totaled $5.5 million. As of December 31, 2011, outstanding syndications within our total loan portfolio for transactions which we had arranged approximated $592 million.
Community Banking
Retail Banking.Community banking targets Illinois personal clients with up to $250,000 in investable assets and lending needs of up to $3.5 million. Through a network of 18 branch locations in and around Chicago, community banking provides personal and business banking and investing services including checking, savings, money market, certificates of deposit (“CDs”), home equity loans and lines of credit, business-specific banking and other tailored solutions. In prior years, community banking also originated mortgages, but during 2011, as discussed below, we reorganized residential mortgage banking and centralized its management. As needed, community banking relationship managers refer mortgage clients to the residential mortgage banking team. As of December 31, 2011, 13% of our total deposits were from community banking clients (approximately flat from the prior year) and approximately 20% of community banking’s accounts made up over 85% of its deposits.
Central to our growth and diversification strategies are an expansion of our community banking business and the related branch networks and community banking deposits. As discussed in more detail below under “Deposits,” client deposits represent our core funding source. However, given the commercial focus of our core business strategy, 82% of our current deposit base is comprised of corporate accounts which are generally significantly larger than community deposits. Therefore, we will consider cost effective expansion of our branch network and related retail deposits in order to increase overall deposit funding (to support further commercial loan activity) while simultaneously diversifying the current deposit mix (to decrease the commercial deposit concentration).
4
Given the number of stressed financial institutions within our markets, we may, from time to time, consider strategic acquisitions that could assist us in diversifying our funding mix, decreasing the concentration of commercial deposits, and potentially supplementing our retail branch networks. The size of any potential acquisition would depend on market factors at the time, including the risk profile, deposit base and branch network of a potential target, financing sources and our then-current stock price. There can be no assurances about whether any such acquisition will occur or, if one does, about whether it will ultimately assist with the achievement of these goals.
Residential Mortgage Banking.We offer a full range of residential mortgage loans for purchasing or refinancing 1-4 family residential properties. We generally use a correspondent model in which we originate loans, and sell the majority of these loans in the secondary market, based on the underwriting standards of investors who then service them. For the loans we sell, we earn a one-time fee which is generally not greatly impacted by changes in interest rates. We originate and retain some mortgages in our portfolio. These are generally jumbo mortgage loans with high credit-quality borrowers, or a small number of loans which our investors ultimately decide not to purchase. We do not service loans for other entities or purchase third party originations at this time. In 2011, we originated approximately $315 million of first mortgage loans. During 2011, we centralized our mortgage operations team in one location, reorganized this business under new leadership and recruited experienced mortgage loan officers from larger mortgage banking operations in Chicago, St. Louis and Detroit. We also invested in technological enhancements to strengthen the underwriting, processing and internal controls related to originations. Our ability to increase fee revenue in this business is subject to the interest rate environment and the pressures of general business conditions, including the current depressed housing market with its weakened demand for mortgages and refinancings. As we further develop our mortgage operations, we envision opportunities to cross-sell mortgage products to community banking’s retail and small-business clients.
Small-Business Banking.As part of community banking, small-business banking responds to the personal and corporate banking needs of small businesses, as well as their owners and executives, while targeting commercial clients with business revenue up to $10 million. This group offers commercial lending and treasury management services and products similar to those of our commercial banking group, but of a smaller size. Historically, this group has focused on clients in the Chicago area, but has recently expanded to Detroit. We may consider further expansion in other regions. Our strategy for small-business banking includes using our branch networks and our recently enhanced team of business bankers to attract new small-business clients in order to diversify our loan portfolio and funding base. This client acquisition strategy includes targeted sales programs, marketing campaigns, community involvement and client referrals. To the extent such individuals have significant personal assets; we refer such clients to our private wealth group and its dedicated team of private bankers. During 2010 and 2011, we hired an experienced leader and increased the number of business bankers dedicated to small-business banking. As of December 31, 2011, small-business banking’s loan portfolio was approximately $143 million (representing 2% of our total loan portfolio at that time), including approximately $115 million in covered loans. During 2011, small-business banking added 63 new client relationships. However, our limited retail branch network may limit growth opportunities in this business.
Private Wealth
Our private wealth group offers high net-worth clients (those with more than $1 million in investable assets) private banking, investment management, trust and investment agency services. Most clients in this group are individuals, but we assist some corporate clients with liquidity management.
Private Banking.Our private banking services include consumer loans and customized credit, such as loans for individual and business purposes that are often secured by marketable securities. The private banking portion of our private wealth group also had a significant deposit base of approximately $861 million as of December 31, 2011.
Trust and Investments.With respect to our trust and investment services, we act as fiduciary and investment manager for individual and corporate clients which includes creating asset allocation strategies tailored to each client’s unique situation while using third-party investment managers to execute the overarching strategies. For managed assets, we offer financial advice and act either in a trustee or agency capacity. We also provide custody, escrow, and tax-deferred exchange services. Custody services are considered non-managed in which we administer and safeguard assets but do not provide financial advice. This group also provides some investment services, such as 401(k) rollovers, for retail clients through a third-party broker/dealer. Approximately 89% of our Trust and Investment fee revenue comes from fees charged that are a percentage of the assets under management and administration. These fees are based on the market value of the assets on the last day of the prior month or quarter and are therefore subject to volatility. We also earn certain non-recurring fees such as tax preparation fees, estate settlement and court-appointed guardian fees. Additionally, through a wholly-owned subsidiary, we offer investment advisory services to individuals, families, and foundations with greater than $500,000 of investable assets. This subsidiary creates its own asset allocation strategies independent of the private wealth group. We focus on cross-selling private wealth services across our lines of business to executives and business owners who have a commercial banking relationship with us. As of December 31, 2011, our Trust and Investments group had approximately $4.3 billion in assets under management and administration.
5
In recent years, we streamlined private wealth by simplifying our product offerings and reducing expenses. We also recruited a number of key experienced employees and, to increase internal business referrals, increased training and education around private wealth offerings for our relationship managers that interact with our clients on a regular basis. We are now focusing our attention on the Chicago market and introducing private wealth products and services to existing clients within our commercial banking group, as well as attracting new clients. These efforts will depend in large part on our ability to retain exceptional talent and upgrade technology in this quickly evolving climate.
Lending Activities
We provide a range of commercial, real estate and personal lending products and services to our clients. While the majority of our client relationships today are Chicago-based, many of our clients do business around the country and we have loans secured by real estate in a number of other geographic regions.
We have adopted comprehensive loan policies that include disciplined credit underwriting standards. The goal of our lending program is to meet the credit needs of our diverse client base while using sound credit principles to protect our asset quality. We strive to provide a reliable source of credit, a variety of lending alternatives, and sound financial advice to our clients. When extending credit, our decisions are based upon our client’s ability to repay the loan, as well as the value of any collateral securing the loan. Our assessment of the quality and integrity of the borrower are also key considerations in the loan approval process. Our bankers monitor loan performance and maintain regular contact with our clients. Our credit risk management team actively manages and monitors the loan portfolio, including performing, nonperforming, and stressed credits, and provides workout and nonperforming asset disposition-related activities.
In conjunction with our middle market strategy, our lending activities may involve larger credit relationships. At December 31, 2011 and consistent with 2010, we had 78 unique obligors with credit commitments of $25 million or more totaling $2.5 billion, and with over 90% secured by collateral at December 31, 2011. Of this total commitment, $1.1 billion, or 12% of our loan portfolio, has been used. The remaining $1.4 billion relates to unused or partially drawn commitments. Some of these obligors may be related to other obligors as guarantors or share related ownership structures with other obligors.
6
Approximately 85% of these large obligors are commercial and industrial businesses; the remaining exposure is related to commercial real estate loans. As measured by our internal risk rating system, this population of large obligors represents a higher level of credit quality than our total loan portfolio. Of our largest commitments, five individual obligors have commitments of $50 million or more at December 31, 2011 totaling $302.5 million, compared to six individual obligors at December 31, 2010 totaling $362.5 million. However, only $15.0 million has been drawn on these largest commitments at December 31, 2011, compared to $46.6 million at December 31, 2010.
Commercial
At December 31, 2011, commercial loans, excluding commercial real estate loans discussed below, comprised 60% of our loan portfolio, and include lines of credit, term loans, and letters of credit. Our commercial lines of credit typically are limited to a percentage of the value of the assets securing the line, and are typically priced by a floating rate formula. In general, lines of credit are reviewed annually and are supported by accounts receivable, inventory and/or equipment. Depending on the risk profile of the borrower, we may require periodic aging of receivables, and inventory and equipment listings to verify the quality of the borrowing base prior to advancing funds. Our term loans are typically secured by the assets of our clients’ businesses. Term loans typically have maturities between one to five years, with either floating or fixed rates of interest. In certain circumstances, there may be an interest rate floor. We issue standby or performance letters of credit, and are able to service the international needs of our clients through correspondent banks. We use the same underwriting standards for letters of credit and other unfunded commitments that we would use for funded loans.
Commercial loans contain risks unique to the business and market of each borrower. In order to mitigate these risks, we seek to gain an understanding of the business and industry of each borrower; require appropriate reporting, financial, and/or operating covenants; and regularly evaluate our collateral position. Our commercial lending underwriting process includes an evaluation of the borrower’s financial statements and projections with an emphasis on operating results, cash flow, liquidity and underwriting ratios, as well as the collateral value, to determine the level of creditworthiness of the borrower. These loans may be secured by a first priority security interest in the assets of the borrower and may require the support of a personal guarantee of one or more of the principals of the borrower. From a risk management standpoint, whether the commercial loans are originated within commercial banking or small- business banking, substantially the same credit policies are used.
Commercial Real Estate
At December 31, 2011, commercial real estate loans comprised 29% of our loan portfolio. Our commercial real estate portfolio is comprised of loans secured by various types of collateral including 1-4 family non-owner occupied housing units located primarily in our target market areas, multi-family real estate, office buildings, warehouses, retail space, mixed use buildings, and vacant land, the bulk of which is held for long-term investment or development. Commercial real estate loan concentrations by collateral type are monitored as part of our credit risk management process.
Risks inherent in real estate lending are related to the market value of the property taken as collateral, the underlying cash flows and documentation and the general economic condition of the market in which the collateral is located. To mitigate these risks, we obtain and review appraisals of the property and we assess (a) the ability of the cash flow generated from the collateral property to service debt, (b) the significance of any outside income of the borrower or income from other properties owned by the borrowers, and (c) the strength of guarantors, as applicable.
Construction
At December 31, 2011, construction loans comprised 3% of our loan portfolio. Our construction loan portfolio consists of single-family residential properties, multi-family properties, and commercial projects, and includes both investment properties and properties that will be owner-occupied. As with commercial real estate loans, we monitor our construction loan concentrations as part of our risk management program.
As a product segment, we believe construction loans have the highest inherent risk. We closely monitor the status of each construction loan throughout its term to mitigate these risks. We also seek to manage these risks by, among other things, ensuring that the collateral value of the property throughout the construction process does not fall below acceptable levels, ensuring that funds disbursed are within parameters set by the original construction budget, and properly documenting each construction draw. Typically, we require full investment of the borrower’s equity in construction projects prior to injecting our funds. Generally, we do not allow borrowers to recoup their equity from the sale proceeds of a finished product, if applicable, until we have recovered our funds on the overall project.
7
Residential, Home Equity, and Personal
At December 31, 2011, residential, home equity, and personal loans comprised 8% of our loan portfolio.
Residential Mortgage. We have purchase and refinancing mortgage sales teams in each of the Chicago, St. Louis and Detroit markets, and anticipate expanding residential mortgage sales teams into the Milwaukee, Kansas City and Atlanta markets in 2012. These residential mortgage loans are secured by 1-4 family residential properties generally located near our mortgage sales centers; however, lending outside these areas can occur. The majority of 2011 originations have related to properties around our Chicago-area market. Because we sell the majority of the residential mortgage loans we originate, this business has an overall relatively low credit risk profile. However, we make certain representations and warranties to the purchasers of the loans upon sale, many centering on the quality of our review and underwriting processes. If a borrower defaults during the first twelve months of the loan or we are found to have breached these representations (for example, if we did not correctly adhere to the purchaser’s underwriting standards), we could be required to repurchase the outstanding amount of the applicable loan. Because of this risk, we focus significant attention on the thoroughness of the origination processes. There were no losses arising from these limited recourse obligations in 2011 and losses in 2010 were not material.
Other Consumer Loans. The majority of our other consumer loan portfolio is comprised of home equity loans and lines of credit, and, to a lesser extent, car loans (mostly for used cars) and secured and unsecured consumer loans, often used to fund educational costs or to consolidate debt. Home equity loans and lines of credit are generally secured by second mortgages on 1-4 family residential properties. Since we sell the majority of the residential mortgages we originate, we are often second lien holders on these properties. We do not sell the home equity loans or lines of credit to investors. Other consumer loans include secured and unsecured consumer loans, the majority of which are term loans. Consumer loans generally have shorter terms and lower balances with higher yields as compared to residential real estate loans. Our personal loan portfolio consists largely of loans for investment asset acquisition (which may be secured by marketable or nonmarketable investment securities) and for general liquidity purposes, including lines of credit which may be unsecured. Due to our client relationship focus, which includes lending to entrepreneurs, some of these loans can be sizeable. As of December 31, 2011, the aggregate amount of such personal loans was approximately 3% of total loans.
For more information regarding the composition of our loan portfolio, see “Management’s Discussion and Analysis of Financial Condition and Results of Operations – Loan Portfolio and Credit Quality” and Note 4 of “Notes to Consolidated Financial Statements” in Item 8 of this Form 10-K, and for information regarding our unfunded commitments, see Note 19 of “Notes to Consolidated Financial Statements” in Item 8 of this Form 10-K.
Deposits
We rely on a relationship-driven approach to generate client deposits and regard client deposits as our primary source of funding. Client deposits represented almost all of our total deposits at December 31, 2011 and 94% at December 31, 2010. Given the commercial focus of our core business strategy, a majority of our deposit base is comprised of corporate accounts which are typically larger than retail accounts. We have built a suite of deposit and cash management products and services that support our efforts to attract and retain corporate client accounts. At both December 31, 2011 and December 31, 2010, we had 13 client relationships in which each had more than $75 million in deposits. These deposits totaled $2.2 billion, or 21% of total deposits at December 31, 2011 and $2.5 billion, or 24% of total deposits at December 31, 2010. A majority of the deposits greater than $75 million are from financial services-related businesses, including omnibus accounts from broker-dealer and mortgage companies representing underlying accounts of their customers that may be eligible for pass-through deposit insurance limits. We had 32 client relationships at December 31, 2011 in which each had more than $50 million in total deposits, compared to 21 such relationships at December 31, 2010. These deposits totaled $3.3 billion, or 32% of total deposits and $3.0 billion, or 29% of total deposits at December 31, 2011 and 2010, respectively. In addition, our ten largest depositor accounts totaled $1.9 billion, or 19% of total deposits, at December 31, 2011. Commercial deposits are held in various deposit products we offer, including interest-bearing and non-interest bearing demand deposits, CDARS®, savings and money market accounts. The CDARS® deposit program allows clients to obtain greater FDIC deposit insurance for time deposits in excess of the FDIC insurance limits. Through our community banking and private wealth groups, we offer a variety of personal banking products, including checking, savings and money market accounts and CDs, which serve as an additional source of client deposits.
We also maintain access to a number of wholesale funding sources including brokered deposits, which we utilize to supplement our client deposits as needed to fund asset growth and manage liquidity. Brokered deposits, excluding client-related CDARS®, were less than 1% and 6% of total deposits at December 31, 2011 and 2010, respectively.
For information regarding our deposits, see “Management’s Discussion and Analysis of Financial Condition and Results of Operations – Funding and Liquidity Management” and Note 9 of “Notes to Consolidated Financial Statements” in Item 8 of this Form 10-K.
Investment Activities
We maintain a managed investment portfolio intended to provide liquidity, maximize risk-adjusted total return, and provide a means to modify our asset/liability position as deemed appropriate. We invest primarily in residential mortgage-backed securities and collateralized mortgage obligations backed by U.S. Government-owned agencies or issued by U.S. Government-sponsored enterprises
8
and bank-qualified tax-exempt obligations of state and local political subdivisions. Under our investment policy, we also may invest in U.S. Treasury, U.S. Agency or other securities. The investment portfolio is one of the tools used to manage our net asset/liability position by countering the interest rate risk characteristics of the loan portfolio.
For information regarding our investment portfolio, see “Management’s Discussion and Analysis of Financial Condition and Results of Operations – Investment Portfolio Management” and Note 3 of “Notes to Consolidated Financial Statements” in Item 8 of this Form 10-K.
Competition
We do business in the highly competitive financial services industry. In each of our geographic markets, we compete for loans, deposits, wealth management and other financial services and products with regional, national, and international commercial banks, thrifts, credit unions, investment banks, brokerage firms, money managers, and other providers of financial products and services. The greater Chicago market is particularly competitive as a number of financial services companies are attempting to capitalize on opportunities in the commercial middle market space that have arisen as a result the fragmented nature of the Chicago market and the dislocation of customers in the market as area banks have consolidated. Given current industry trends of reduced loan demand, we face pressure on pricing and loan terms for favorable lending relationships including commercial relationships.
Many of the products within the financial services industry have become commoditized over the past few years and therefore competition is very strong. Given the changing nature of the banking industry, we could experience new deposit competition from a variety of sources including investment banks and finance companies. For private wealth services, we compete with local, regional and national brokerage firms, wealth consulting firms and investment managers, any of which may be either standalone entities or part of larger financial services institutions. Also, because private wealth does not create or offer its own propriety investment products, we are not incentivized to encourage clients to purchase our product, thereby enhancing the independent nature of our advice. In mortgage banking, we compete not only with commercial banks, both large and small, that have operations in our locations, but also with mortgage brokers of various sizes. In all areas, we work to distinguish ourselves through consistent delivery of superior levels of personal service, customized solutions and responsiveness expected by our clients.
Some of our competitors are not subject to the same degree of regulation as that imposed on bank holding companies, federally insured state chartered banks, national banks and federal savings banks, and may be able to price loans, deposits and other products and services more aggressively.
We face competition in attracting and retaining qualified employees. Our ability to continue to compete effectively will depend upon the ability to attract new employees and retain and motivate existing employees.
Segments
For information regarding our business segments, which include Banking, (commercial banking, community banking and the private banking business within private wealth), Trust and Investments and Holding Company Activities, see “Management’s Discussion and Analysis of Financial Condition and Results of Operations - Operating Segments Results” and Note 21 of “Notes to Consolidated Financial Statements” in Item 8 of this Form 10-K.
SUPERVISION AND REGULATION
General
Banking is a highly regulated industry. The following is a summary of certain aspects of various statutes and regulations applicable to PrivateBancorp and its subsidiaries. These summaries are not complete, however, and you should refer to the statutes and regulations for more information. Also, these statutes and regulations may change, or additional statutes or regulations could be adopted, in the future and we cannot predict what effect these changes or new statutes or regulations, if any, could have on our business or revenues. The supervision, regulation and examination of banks and bank holding companies by bank regulatory agencies are intended primarily for the protection of customers and the banking system in the United States. As such, actions taken by bank regulatory agencies may conflict with or be adverse to the interests of the stockholders of banks and bank holding companies.
9
Bank Holding Company Regulation
PrivateBancorp is registered as a bank holding company with the Board of Governors of the Federal Reserve System (the “FRB”) pursuant to the Bank Holding Company Act of 1956, as amended (the Bank Holding Company Act of 1956, as amended, and the regulations issued thereunder are collectively referred to as the “BHC Act”), and we are subject to regulation, supervision and examination by the FRB.
Minimum Capital Requirements. The FRB has adopted risk-based capital requirements for assessing bank holding company capital adequacy. These standards define capital and establish minimum capital ratios in relation to assets, both on an aggregate basis and as adjusted for credit risks and off-balance sheet exposures. Under the FRB’s risk-based guidelines, capital is classified into two categories, Tier 1 and Tier 2 capital.
For bank holding companies, Tier 1 capital, or core capital, consists of the following items, all of which are subject to certain conditions and limitations: common stockholders’ equity and retained earnings; qualifying noncumulative perpetual preferred stock including related surplus and senior perpetual preferred stock issued to the Treasury under its Troubled Asset Relief Program (“TARP”) including related surplus; qualifying cumulative perpetual preferred stock including related surplus subject to certain limitations; qualifying trust preferred securities; minority interests in the common equity accounts of consolidated subsidiaries; and is reduced by goodwill, specified intangible assets, and certain other assets. For bank holding companies, Tier 2 capital, or supplementary capital, consists of the following items, all of which are subject to certain conditions and limitations: the allowance for loan losses; perpetual preferred stock and related surplus; hybrid capital instruments, perpetual debt and mandatory convertible debt securities; unrealized holding gains on equity securities; and term subordinated debt and intermediate-term preferred stock.
Under the FRB’s capital guidelines, bank holding companies are required to maintain a minimum ratio of qualifying total capital to risk-weighted assets of 8%, of which at least 4% must be in the form of Tier 1 capital. The FRB has established a minimum leverage ratio of Tier 1 capital to total assets of 3% for strong bank holding companies (those rated a composite “1” under the FRB’s rating system). For all other bank holding companies, the minimum leverage ratio of Tier 1 capital to total assets is 4%. In addition, the FRB continues to consider the Tier 1 leverage ratio (after deducting all intangibles) in evaluating proposals for expansion or new activities.
Under its capital adequacy guidelines, the FRB emphasizes that the foregoing standards are supervisory minimums and that banking organizations generally are expected to operate above the minimum ratios. These guidelines also state that banking organizations experiencing growth, whether internally or by making acquisitions are expected to maintain strong capital positions substantially above the minimum levels. The FRB may also require a banking organization to maintain capital above the minimum levels based on factors such as the organization’s financial condition or anticipated growth. In addition, the Dodd-Frank Act (as defined and discussed more fully below) requires the adoption of new capital regulations that are required to be, at a minimum, as stringent as current capital and leverage requirements and may limit the use of subordinated debt or similar instruments to meet capital requirements. The Dodd-Frank Act also disallows future issuances of trust preferred securities as Tier 1 qualifying capital, although our currently outstanding trust preferred securities have been grandfathered for Tier 1 eligibility. See the “Supervision and Regulation – Dodd-Frank Wall Street Reform and Consumer Protection Act” section in Item 1, “Business” for additional information regarding the Dodd-Frank Act.
As of December 31, 2011, our total risk-based capital ratio was 14.28%, our Tier 1 risk-based capital ratio was 12.38% and our leverage ratio was 11.33%. See the “Capital – Capital Management – Capital Measurements” section in Item 7, “Management’s Discussion and Analysis of Financial Condition and Results of Operations” and Note 17 of “Notes to Consolidated Financial Statements” in Item 8 of this Form 10-K for more information regarding our capital ratios and the minimum regulatory guidelines.
Source of Strength. Under a longstanding policy of the FRB, a bank holding company is expected to act as a source of financial and managerial strength to its banking subsidiaries and to commit resources to support them. The FRB takes the position that in implementing this policy, it may require a bank holding company to provide financial support to its subsidiaries at times it deems appropriate.
Acquisitions and Activities. The BHC Act requires prior FRB approval for, among other things, the acquisition by a bank holding company of direct or indirect ownership or control of more than 5% of the voting shares or substantially all of the assets of any bank, or for a merger or consolidation of a bank holding company with another bank holding company. With limited exceptions, the BHC Act prohibits a bank holding company from acquiring direct or indirect ownership or control of voting shares of any company that is not a bank or bank holding company and from engaging directly or indirectly in any activity other than banking or managing or controlling banks or performing services for its authorized subsidiaries. A bank holding company may, however, engage in or acquire an interest in a company that engages in activities that the FRB has determined, by regulation or order, to be so closely related to banking or managing or controlling banks as to be a proper incident thereto, such as owning and operating a savings association, performing functions or activities that may be performed by a trust company, owning a mortgage company, or acting as an investment or financial advisor. The FRB, as a matter of policy, may require a bank holding company to be well capitalized at the time of filing an acquisition application and upon consummation of the acquisition.
10
The Gramm-Leach-Bliley Act allows bank holding companies that are in compliance with certain requirements to elect to become “financial holding companies.” Financial holding companies may engage in a broader range of activities than is otherwise permitted for bank holding companies. At this time, PrivateBancorp has not elected to become a financial holding company.
Redemptions. Under the BHC Act, bank holding companies are required to provide the FRB with prior written notice of any purchase or redemption of their outstanding equity securities if the gross consideration for the purchase or redemption, when combined with the net consideration paid for all such purchases or redemptions during the preceding twelve months is equal to 10% or more of their consolidated net worth. The FRB may disapprove such a purchase or redemption if it determines that the proposal would constitute an unsafe or unsound practice or would violate any law, regulation, FRB order, or any condition imposed by or written agreement with the FRB. This prior notice requirement does not apply to any bank holding company that meets certain well capitalized and well managed standards and is not subject to any unresolved supervisory issues.
Under provisions of the Treasury’s Capital Purchase Program (“CPP”) (as more fully discussed below under “2008 Emergency Economic Stabilization Act”), bank holding companies which sold equity securities to the Treasury under the CPP are generally prohibited, provided that such securities remain outstanding, from acquiring or redeeming their common, preferred or trust preferred securities for three years, without the consent of the Treasury. Pursuant to our participation in the CPP, as discussed below, our ability to repurchase equity securities without prior Treasury approval was restricted until January 30, 2012. This CPP restriction on stock repurchases is no longer applicable to the Company; however, the Company continues to be subject to the limitation on stock repurchases described in the preceding paragraph.
Tie-in Arrangements. Under the BHC Act and FRB regulations, we are prohibited from engaging in tie-in arrangements in connection with an extension of credit, lease, or sale of property or furnishing of services. Accordingly, we may not condition a client’s purchase of one of our services on the purchase of another service, except with respect to traditional banking products.
Interstate Banking and Branching Legislation. Under the Riegle-Neal Interstate Banking and Branching Efficiency Act of 1994 (the “Interstate Banking Act”), bank holding companies that are well capitalized and managed are allowed to acquire banks across state lines subject to certain limitations. States may prohibit interstate acquisitions of banks that have not been in existence for at least five years. The FRB is prohibited from approving an application for acquisition if the applicant controls more than 10% of the total amount of deposits of insured depository institutions nationwide. In addition, interstate acquisitions may also be subject to statewide concentration limits.
Furthermore, under the Interstate Banking Act, banks are permitted, under some circumstances, to merge with one another across state lines and thereby create a main bank with branches in separate states. Approval of interstate bank mergers is subject to certain conditions, including: well capitalized and well managed standards, CRA compliance and deposit concentration limits, compliance with federal and state antitrust laws and compliance with applicable state consumer protection laws. After establishing branches in a state through an interstate merger transaction, a bank may establish and acquire additional branches at any location in the state where any bank involved in the interstate merger could have established or acquired branches under applicable federal and state law. In addition, the Interstate Banking Act, as amended by the Dodd-Frank Act, also now permits a bank, with the approval of the appropriate federal and state bank regulatory agencies, to establish a de novo branch in a state other than the bank’s home state if the law of the state in which the branch is to be located would permit establishment of the branch if the out of state bank were a state bank chartered by such state.
Ownership Limitations. Under the Federal Change in Bank Control Act, a person may be required to obtain the prior regulatory approval of the FRB before acquiring the power to directly or indirectly control the management, operations or policies of PrivateBancorp or before acquiring control of 10% or more of any class of our outstanding voting stock. Under the Illinois Banking Act, any acquisition of PrivateBancorp stock that results in a change in control may require prior approval of the Illinois Department of Financial and Professional Regulation.
Dividends. The FRB has issued an updated policy statement on the payment of cash dividends by bank holding companies. In the policy statement, the FRB expressed its view that a bank holding company should inform the FRB and should eliminate, defer or severely limit the payment of dividends if (i) the bank holding company’s net income for the past four quarters is not sufficient to fully fund the dividends; (ii) the bank holding company’s prospective rate of earnings retention is not consistent with the bank holding company’s capital needs and overall current and prospective financial condition; or (iii) the bank holding company will not meet, or is in danger of not meeting, its minimum regulatory capital adequacy ratios. The policy statement also provides that the FRB should be informed in advance prior to declaring or paying a dividend that exceeds earnings for the period (e.g., quarter) for which the dividend is being paid or that could result in a material adverse change to the organization’s capital structure. Additionally, the FRB possesses enforcement powers over bank holding companies and their non-bank subsidiaries to prevent or remedy actions that represent unsafe or unsound practices or violations of applicable statutes and regulations. Among these powers is the ability to prohibit or limit the payment of dividends. We provide notice to and obtain approval from the FRB before declaring or paying any dividends.
11
In addition to the restrictions on dividends imposed by the FRB, Delaware law also places limitations on the ability of a corporation to pay dividends. Corporations may only pay dividends out of surplus or net profits in accordance with Delaware law. The ability of a holding company to pay dividends may also depend on the receipt of dividends from its banking subsidiaries. During 2009, 2010 and 2011, we did not receive any dividends from our banking subsidiaries and we were dependent upon the capital maintained at the holding company level to pay dividends.
Bank Regulation
Our subsidiary bank, the Bank, is subject to extensive supervision and regulation by various federal and state authorities. Additionally, as an affiliate of the Bank, PrivateBancorp is also subject, to some extent, to regulation by the Bank’s supervisory and regulatory authorities. The Bank is an Illinois state-chartered bank and as such, is subject to supervision and examination by the Illinois Department of Financial and Professional Regulation and, as a FRB non-member bank, its primary federal regulator, the FDIC.
Regulatory Approvals and Enforcement. Federal and state laws require banks to seek approval by the appropriate federal or state banking agency (or agencies) for any merger and/or consolidation by or with another depository institution, as well as for the establishment or relocation of any bank or branch office and, in some cases to engage in new activities or form subsidiaries.
Federal and state statutes and regulations provide the appropriate bank regulatory agencies with great flexibility and powers to undertake enforcement actions against financial institutions, holding companies or persons regarded as “institution affiliated parties.” Possible enforcement actions range from the imposition of a capital plan and capital directive to a cease and desist order, civil money penalties, receivership, conservatorship or the termination of deposit insurance.
Transactions with Affiliates. Federal and state statutes place certain restrictions and limitations on transactions between banks and their affiliates, which include holding companies. Among other provisions, these laws place restrictions upon:
| | • | | extensions of credit by an insured financial institution to the bank holding company and any non-banking affiliates; |
| | • | | the purchase by an insured financial institution of assets from affiliates; |
| | • | | the issuance by an insured financial institution of guarantees, acceptances or letters of credit on behalf of affiliates; and |
| | • | | investments by an insured financial institution in stock or other securities issued by affiliates or acceptance thereof as collateral for an extension of credit. |
Permissible Activities, Investments and Other Restrictions. Federal and state laws provide extensive limitations on the types of activities in which our subsidiary bank may engage and the types of investments it may make. For example, banks are subject to restrictions with respect to engaging in securities activities, real estate development activities and insurance activities and may invest only in certain types and amounts of securities and may invest only up to certain dollar amount thresholds in their premises.
Monetary Policy.The Bank is affected by the credit policies of the FRB, which regulate the national supply of bank credit. Such regulation influences overall growth of bank loans, investments and deposits and may also affect interest rates charged on loans and paid on deposits. The FRB’s monetary policies have had a significant effect on the operating results of commercial banks in the past and this trend is likely to continue in the future.
Dividends.Federal and state laws restrict and limit the dividends the Bank may pay. Under the Illinois Banking Act, the Bank, while continuing to operate a banking business, may not pay dividends of an amount greater than its current net profits after deducting losses and bad debts. For the purpose of determining the amount of dividends that an Illinois bank may pay, bad debts are defined as debts upon which interest is past due and unpaid for a period of six months or more unless such debts are well secured and in the process of collection.
In addition to the foregoing, the ability of our subsidiary bank to pay dividends may be affected by the various minimum capital requirements and the capital and non-capital standards established under the Federal Deposit Insurance Corporation Improvements Act of 1991 (“FDICIA”), as described below.
Reserve Requirements. Our subsidiary bank is subject to FRB regulations requiring depository institutions to maintain non-interest-earning reserves against its transaction accounts. For net transaction accounts in 2012, the first $11.5 million of a bank’s transaction accounts (subject to adjustments by the FRB) are exempt from the reserve requirements. The FRB regulations generally require 3%
12
reserves on a bank’s transaction accounts totaling between $11.5 million and $71.0 million. For transaction accounts totaling over $71.0 million, FRB regulations require reserves of $1.8 million plus 10% of the amount over $71.0 million.
Cross-Guaranty. Under the Federal Deposit Insurance Act (“FDI Act”), an insured institution that is commonly controlled with another insured institution shall generally be liable for losses incurred, or reasonably anticipated to be incurred, by the FDIC in connection with the default of such commonly controlled insured institution, or for any assistance provided by the FDIC to such commonly controlled institution, which is in danger of default.
Standards for Safety and Soundness. The FDI Act, as amended by FDICIA and the Riegle Community Development and Regulatory Improvement Act of 1994, requires the FDIC, together with the other federal bank regulatory agencies, to prescribe standards of safety and soundness, by regulations or guidelines, relating generally to operations and management, asset growth, asset quality, earnings, stock valuation and compensation. The federal bank regulatory agencies have adopted a set of guidelines prescribing safety and soundness standards pursuant to FDICIA. The guidelines establish general standards relating to internal controls and information systems, internal audit systems, loan documentation, credit underwriting, interest rate exposure, asset growth, and compensation, fees and benefits. In general, the guidelines require, among other things, appropriate systems and practices to identify and manage the risks and exposures specified in the guidelines. The guidelines prohibit excessive compensation as an unsafe and unsound practice and describe compensation as excessive when the amounts paid are unreasonable or disproportionate to the services performed by an executive officer, employee, director or principal stockholder. In addition, the federal bank regulatory agencies adopted regulations that authorize, but do not require, the agencies to order an institution that has been given notice that it is not satisfying the safety and soundness guidelines to submit a compliance plan. If, after being so notified, an institution fails to submit an acceptable compliance plan or fails in any material respect to implement an accepted compliance plan, the agency must issue an order directing action to correct the deficiency and may issue an order directing other actions of the types to which an undercapitalized institution is subject under the “prompt corrective action” provisions of FDICIA. If an institution fails to comply with such an order, the agency may seek to enforce its order in judicial proceedings and to impose civil money penalties. The federal bank regulatory agencies have also adopted guidelines for asset quality and earning standards. State-chartered banks may also be subject to state statutes, regulations and guidelines relating to safety and soundness, in addition the federal requirements.
Capital Requirements and Prompt Corrective Action. FDICIA defines five capital levels: “well-capitalized,” “adequately capitalized,” “undercapitalized,” “significantly undercapitalized” and “critically undercapitalized.”
FDICIA requires the federal banking regulators to take prompt corrective action with respect to depository institutions that fall below minimum capital standards and prohibits any depository institution from making any capital distribution that would cause it to be undercapitalized. Institutions that are not adequately capitalized may be subject to a variety of supervisory actions, including restrictions on growth, investment activities, capital distributions and affiliate transactions, and will be required to submit a capital restoration plan which, to be accepted by the regulators, must be guaranteed in part by any company having control of the institution (for example, the company or a stockholder controlling the company). In other respects, FDICIA provides for enhanced supervisory authority, including greater authority for the appointment of a conservator or receiver for critically undercapitalized institutions. The capital-based prompt corrective action provisions of FDICIA and its implementing regulations apply to FDIC-insured depository institutions. However, federal banking agencies have indicated that, in regulating bank holding companies, the agencies may take appropriate action at the holding company level based on their assessment of the effectiveness of supervisory actions imposed upon subsidiary insured depository institutions pursuant to the prompt corrective action provisions of FDICIA. State-chartered banks may also be subject to similar supervisory actions by their respective state banking agencies.
Insurance of Deposit Accounts. Under FDICIA, as a FDIC-insured institution, the Bank is required to pay deposit insurance premiums based on the risk it poses to the Deposit Insurance Fund (“DIF”). The FDIC has authority to raise or lower assessment rates on insured deposits in order to achieve required ratios in the insurance fund and to impose special additional assessments. To determine an institution’s assessment rate, each insured institution is placed in a risk category using a two-step process based on capital and supervisory information.
Each insured institution is assigned to one of the following three capital groups: “well capitalized,” “adequately capitalized” or “undercapitalized.” Each insured institution is then assigned one of three supervisory ratings: “A” (institutions with few minor weaknesses), “B” (institutions which demonstrate weaknesses which, if not corrected, could result in significant deterioration of the institution and increased risk of loss to DIF) or “C” (institutions that pose a substantial probability of loss to DIF unless effective corrective action is taken). Insured institutions classified as strongest by the FDIC are subject to the lowest insurance rate; insured institutions classified as weakest by the FDIC are subject to the highest insurance assessment rate.
In October 2008, the FDIC published a restoration plan to reestablish the DIF to the statutory required minimum percentage of deposits, and has amended the plan from time to time thereafter. As part of the restoration plan, the FDIC increased risk-based assessment rates. In November 2009, the FDIC approved a final rule that required insured institutions to prepay their estimated quarterly risk-based assessments for the fourth quarter of 2009 and for all of 2010, 2011 and 2012. The prepaid assessments were
13
recorded as a prepaid expense against which future quarterly assessments are applied. In 2009 we paid $57.0 million in deposit insurance prepayments through 2012. Depending on our performance, any growth and other factors, this prepayment may be more or less than the aggregate insurance assessments through 2012.
In February 2011, the FDIC approved final rules amending the deposit insurance assessment regulations. The rules implement a provision in the Dodd-Frank Act that broadens the assessment base from one based on domestic deposits to one based on total assets less average tangible equity. In addition to broadening the assessment base, the rules establish a separate risk-based assessment system for “large institutions” with more than $10 billion in assets and for other large, highly complex institutions. Prior to the rules taking effect, the rate for insured institutions are assessed based primarily on capital and supervisory information, including examination ratings and certain other factors as described above. The rules eliminate the existing risk categories for large institutions and make the assessment rate a function of examination ratings, a performance component, which is designed to assess the institution’s financial performance and ability to withstand stress, a loss severity component, which is designed to assess the level of potential loss in a failure scenario, and other factors and considerations. Under the rules, large institutions are subject to different minimum and maximum total assessment rate ranges. The ranges are subject to certain adjustments by the FDIC without further rulemaking. The FDIC intends for the new large bank pricing system to result in higher assessments for banks with high-risk asset concentrations, less stable balance sheet liquidity, or potentially higher loss severity in the event of failure. The rules took effect April 1, 2011 and impacted assessments in the second quarter of 2011.
Pursuant to the 2008 Emergency Economic Stabilization Act and the American Recovery and Reinvestment Act of 2009 (each as described more fully below), the maximum deposit insurance on qualifying accounts was increased from $100,000 to $250,000 until December 31, 2013. The Dodd-Frank Act permanently increased the maximum deposit insurance on qualifying accounts to $250,000. Deposit insurance may be terminated by the FDIC upon a finding that an institution has engaged in unsafe or unsound practices, is in an unsafe or unsound condition to continue operations or has violated any applicable law, regulation, rule, order or condition imposed by the FDIC. Such terminations can only occur, if contested, following judicial review through the federal courts. We do not know of any practice, condition or violation that might lead to termination of deposit insurance for the Bank.
The Dodd-Frank Act also raised the minimum reserve ratio of the DIF from 1.15% to 1.35% of estimated insured deposits, which ratio is required to be attained by September 30, 2020, eliminated the size limit of the DIF, and directed the FDIC to issue a rule establishing a new designated reserve ratio. Pursuant to this directive, the FDIC recently issued a rule setting a designated reserve ratio at 2.0% of insured deposits. These policies may result in increased assessments on certain institutions with more than $10 billion in assets.
See the “Dodd-Frank Wall Street Reform and Consumer Protection Act” below for additional information regarding the Dodd-Frank Act.
Community Reinvestment. Under the Community Reinvestment Act (“CRA”), a financial institution has a continuing and affirmative obligation to help meet the credit needs of its entire community, including low- and moderate-income neighborhoods. The CRA does not establish specific lending requirements or programs for financial institutions, or limit an institution’s discretion to develop the types of products and services that it believes are best suited to its particular community. However, institutions are rated on their performance in meeting the needs of their communities. Performance is tested in three areas: (a) lending, to evaluate the institution’s lending performance, particularly to low- and moderate income individuals and neighborhoods and small businesses in its assessment areas; (b) investment, to evaluate the institution’s record of investing in community development projects, affordable housing, and programs benefiting low-income or moderate-income individuals and small businesses; and (c) service, to evaluate the institution’s delivery of products and services through its branches, and automated teller machines as well as its service to the community. The CRA requires each federal banking agency, in connection with its examination of a financial institution, to assess and assign one of four ratings to the institution’s record of meeting the credit needs of its community and to take such record into account in its evaluation of certain applications by the institution, including applications for charters, branches and other deposit facilities, relocations, mergers, consolidations, acquisitions of assets or assumptions of liabilities, and savings and loan holding company acquisitions. The CRA also requires that all institutions make public disclosure of their CRA ratings. The Bank was assigned a “satisfactory” rating at its most recent CRA examinations.
Anti-Money Laundering & OFAC Sanctions Programs. The Bank Secrecy Act (“BSA”), as amended by the USA PATRIOT Act of 2001, imposes significant obligations on financial institutions to detect and deter money laundering and terrorist financing. Financial institutions are required to establish programs designed to implement BSA requirements that include: verifying customer identification, reporting certain large cash transactions, responding to requests for information by law enforcement agencies, and monitoring, investigating and reporting suspicious transactions or activity. The Treasury’s Office of Foreign Assets Control (“OFAC”) enforces economic and trade sanctions based on U.S. foreign policy and national security goals against entities such as targeted foreign countries, terrorists, international narcotics traffickers, and those engaged in the proliferation of weapons of mass destruction. We are subject to these rules and have implemented policies, procedures and controls to comply with the anti-money laundering regulations and the OFAC sanctions programs.
14
Compliance with Consumer Protection Laws. Our bank is subject to many state and federal statutes and regulations designed to protect consumers, such as, CRA, the Truth in Lending Act (Regulation Z), the Truth in Savings Act (Regulation DD), the Equal Credit Opportunity Act (Regulation B), the Fair Housing Act, the Real Estate Settlement Procedures Act, the Home Mortgage Disclosure Act (Regulation C) and the Fair and Accurate Credit Transactions Act. Among other things, these statutes and regulations:
| | • | | require lenders to disclose credit terms in meaningful and consistent ways; |
| | • | | prohibit discrimination against an applicant in any consumer or business credit transaction; |
| | • | | prohibit discrimination in housing-related lending activities; |
| | • | | require certain lenders to collect and report applicant and borrower data regarding loans for home purchases or improvement projects; |
| | • | | require lenders to provide borrowers with information regarding the nature and cost of real estate settlements; |
| | • | | prohibit certain lending practices and limit escrow account amounts with respect to real estate transactions; |
| | • | | require financial institutions to implement identity theft prevention programs and measures to protect the confidentiality of consumer financial information; and |
| | • | | prescribe possible penalties for violations of the requirements of consumer protection statutes and regulations. |
As a result of the Dodd-Frank Act, the newly established Consumer Financial Protection Bureau (the “Bureau”) now has authority for amending existing federal consumer compliance regulations and implementing new such regulations. In addition, the Bureau has responsibility for examining the compliance of financial institutions with assets in excess of $10 billion, such as the Bank, with these consumer protection rules.
Real Estate Lending Concentrations. The FDIC, FRB and the Office of the Comptroller of the Currency have issued guidance on concentrations in commercial real estate lending. The guidance reinforces and enhances existing regulations and guidelines for safe and sound real estate lending. The guidance provides supervisory criteria, including numerical indicators to assist in identifying institutions with potentially significant commercial real estate loan concentrations that may warrant greater supervisory scrutiny. The guidance focuses on institutions properly identifying whether they have a commercial real estate concentration and, if so, instituting the appropriate risk management procedures and increasing capital so that it is commensurate with the risk of having such a concentration.
Allowance for Loan and Lease Losses. In December 2006, the federal bank regulatory agencies issued an Interagency Policy Statement revising their previous policy on the Allowance for Loan and Lease Losses (“ALLL”), which was issued in 1993. The policy statement was updated to ensure consistency with U.S. generally accepted accounting principles (“U.S. GAAP”) and post-1993 supervisory guidance. According to the revised policy statement, the ALLL represents one of the most significant estimates in an institution’s financial statements and regulatory reports. Because of its significance, each institution has a responsibility for developing, maintaining and documenting a comprehensive, systematic, and consistently applied process appropriate to its size and the nature, scope, and risk of its lending activities for determining the amounts of the ALLL and the provision for loan and lease losses.
The policy statement provides that to fulfill this responsibility, each institution should ensure controls are in place to consistently determine the ALLL in accordance with U.S. GAAP, the institution’s stated policies and procedures, management’s best judgment and relevant supervisory guidance. Consistent with long-standing supervisory guidance, the policy states that institutions must maintain an ALLL at a level that is appropriate to cover estimated credit losses on individually evaluated loans determined to be impaired as well as estimated credit losses inherent in the remainder of the loan and lease portfolio. Estimates of credit losses should reflect consideration of all significant factors that affect the collectability of loans in the portfolio as of the evaluation date. Arriving at an appropriate allowance involves a high degree of management judgment and results in a range of estimated losses.
2008 Emergency Economic Stabilization Act
On October 3, 2008, the U.S. Congress enacted the Emergency Economic Stabilization Act (“EESA”). EESA authorized the Secretary of the Treasury to purchase up to $700 billion in troubled assets from qualifying financial institutions pursuant to the TARP. On October 14, 2008, the Treasury, pursuant to its authority under EESA, announced the CPP. Pursuant to the CPP, qualifying public financial institutions could issue senior preferred stock to the Treasury in an amount not less than 1% of risk-weighted assets and not more than 3% of risk-weighted assets or $25 billion, whichever is less. The proceeds from the issuance of preferred stock are included in the financial institution’s Tier 1 capital. The senior preferred stock pays a 5% dividend per annum until the fifth year of the investment and 9% per annum thereafter. In addition to the senior preferred stock, participating public financial institutions must issue a warrant to the Treasury for the purchase of common stock in an amount equal to 15% of the preferred stock investment. The Treasury will not exercise any voting rights with respect to the common shares acquired through the exercise of the warrants. Financial institutions participating in the CPP must agree and comply with certain restrictions, including restrictions on redemption,
15
dividends, repurchases and executive compensation, as discussed below. Finally, the Treasury may unilaterally amend any provision of the CPP to comply with changes in applicable federal statutes.
Redemption. The terms of the CPP contained restrictions on the redemption of the Treasury’s preferred stock investment. These restrictions on redemptions were modified on February 17, 2009, in connection with enactment of the American Recovery and Reinvestment Act of 2009 (the “Recovery Act”) (discussed below).
Dividends.Prior to the third anniversary of the investment or the date on which the Treasury’s senior preferred stock investment has been fully redeemed or transferred, the financial institution may not increase common dividends beyond certain levels without the Treasury’s consent. As noted above, as of January 30, 2012, the foregoing restriction is no longer applicable to PrivateBancorp. In addition, the financial institution may not pay dividends on common stock unless the financial institution has paid dividends on the preferred stock. If the financial institution does not pay dividends on the senior preferred stock for six dividend periods, the Treasury will have the right to elect two members to the board of directors.
Repurchases.Prior to the third anniversary of the investment or the date on which the Treasury’s senior preferred stock investment has been fully redeemed or transferred, the financial institution may not repurchase other equity securities or trust preferred securities without the Treasury’s consent, except repurchases in the ordinary course related to employee benefit plans in a manner consistent with past practice, certain market-making and related transactions by a broker-dealer subsidiary of the financial institution, certain custodian or trustee transactions for another beneficial owner, or certain agreements pre-dating participation in the CPP. As noted above, as of January 30, 2012, the foregoing restriction is no longer applicable to PrivateBancorp.
Executive Compensation. Participating financial institutions must modify certain senior executive compensation agreements consistent with EESA, which generally prohibits incentive compensation agreements that encourage senior executive officers to take unnecessary and excessive risks. In addition, incentive compensation paid to senior executive officers must be recovered if such payments are subsequently determined to be based upon materially inaccurate financial results (i.e., a “clawback” provision). Participating financial institutions are prohibited from making golden parachute payments to senior executive officers and are required to limit the federal tax deduction for compensation paid to senior executive officers to $500,000. For this purpose, “senior executive officer” means an individual who is one of the executives whose compensation is required to be disclosed pursuant to the Exchange Act. As discussed below, these executive compensation restrictions were further expanded by the Recovery Act.
On January 30, 2009, PrivateBancorp closed a transaction with the Treasury in order to participate in the CPP. PrivateBancorp issued preferred stock to the Treasury equal to $243.8 million and a warrant to purchase shares of common stock at an exercise price of $28.35. As a result of the completion of two “qualified equity offerings” in 2009, pursuant to which we received aggregate gross proceeds in excess of $243.8 million, the number of shares of common stock issuable upon exercise of the warrant was reduced by 50% from 1,290,026 to 645,013 shares. Pursuant to its participation in the CPP, PrivateBancorp is subject to the provisions therein.
American Recovery and Reinvestment Act of 2009
On February 17, 2009, the Recovery Act was signed into law. Included among the many provisions of the Recovery Act are restrictions affecting financial institutions who are participants in the TARP, which are set forth in the form of amendments to the EESA. These amendments provide that during the period in which any obligation under the TARP remains outstanding (other than obligations relating to outstanding warrants), TARP recipients are subject to appropriate standards for executive compensation and corporate governance which were set forth in an interim final rule regarding TARP standards for Compensation and Corporate Governance, issued by the Treasury and effective on June 15, 2009 (“Interim Final Rule”). Among the executive compensation and corporate governance provisions included in the Recovery Act and the Interim Final Rule are the following:
| | • | | an incentive compensation “clawback” provision to cover “senior executive officers” (defined in this instance and below to mean the “named executive officers” for whom compensation disclosure is provided in the company’s proxy statement) and the next 20 most highly compensated employees; |
| | • | | a prohibition on certain golden parachute payments to cover any payment related to a departure for any reason (with limited exceptions) made to any senior executive officer (as defined above) and the next five most highly compensated employees; |
| | • | | a limitation on incentive compensation paid or accrued to the five most highly compensated employees of the financial institution, subject to limited exceptions for pre-existing arrangements set forth in written employment contracts executed on or prior to February 11, 2009, and certain awards of restricted stock which may not exceed one-third of annual compensation, are subject to a two-year holding period and cannot be transferred until the Treasury’s preferred stock is redeemed (the amount of such stock which may be transferred is based on the amount of TARP CPP preferred stock that is redeemed); |
16
| | • | | a requirement that the company’s chief executive officer and chief financial officer provide in annual securities filings, a written certification of compliance with the executive compensation and corporate governance provisions of the Interim Final Rule; |
| | • | | an obligation for the compensation committee of the board of directors to evaluate with the company’s chief risk officer certain compensation plans to ensure that such plans do not encourage unnecessary or excessive risks or the manipulation of reported earnings; |
| | • | | a requirement that companies adopt a company-wide policy regarding excessive or luxury expenditures; |
| | • | | a requirement that companies permit a separate, non-binding shareholder vote to approve the compensation of executives; and |
| | • | | a provision that allows the Treasury to review compensation paid prior to enactment of the Recovery Act to senior executive officers and the next 20 most highly-compensated employees to determine whether any payments were inconsistent with the executive compensation restrictions of the EESA, as amended, TARP or otherwise contrary to the public interest. |
In addition, companies who have issued preferred stock to the Treasury under TARP are now permitted to redeem such investments at any time, subject to consultation with banking regulators. Upon such redemption, the warrants may be immediately liquidated by the Treasury.
FDIC Temporary Liquidity Guarantee Program
In October 2008, the FDIC announced the Temporary Liquidity Guarantee Program (“TLGP”) to strengthen confidence and encourage liquidity in the banking system. The program was comprised of two voluntary components: the Transaction Account Guarantee Program (“TAGP”) and the Debt Guarantee Program (“DGP”).
Transaction Account Guarantee Program. Pursuant to the TAGP, the FDIC fully insured, without limit, qualifying transaction accounts held at qualifying depository institutions through December 31, 2010. Qualifying transaction accounts included non-interest-bearing transaction accounts, Interest on Lawyers Trust Accounts (“IOLTAs”) and Negotiable Order of Withdrawal (“NOW”) accounts with interest rates less than 0.5%. The FDIC assessed a fee equal to 10 basis points on transaction account deposit balances in excess of the $250,000 insured limit, which was subsequently increased to 15 to 25 basis points depending upon an institution’s deposit insurance assessment risk category. As provided by the Dodd-Frank Act, as discussed below, the FDIC will insure the full balance of non-interest bearing transaction accounts, including IOLTAs but not NOW accounts, through December 31, 2012, replacing the TAGP at the end of 2010. Beginning on January 1, 2013, non-interest bearing transaction accounts will be insured under the FDIC’s general deposit insurance coverage rules.
Debt Guarantee Program. Pursuant to the DGP, eligible entities were permitted to issue FDIC-guaranteed senior unsecured debt in an amount up to 125% of the entity’s senior unsecured debt outstanding as of September 30, 2008. PrivateBancorp has not issued any guaranteed debt under the DGP.
Dodd-Frank Wall Street Reform and Consumer Protection Act
On July 21, 2010, President Obama signed into law the Dodd-Frank Act which has already significantly changed the financial regulatory landscape and will continue to affect the operating activities of financial institutions and their holding companies, as well as others. Although many of the details of the Dodd-Frank Act, and the full impact it will have on financial institutions and their holding companies, are uncertain at this point, in part because many of the provisions require the adoption of implementing rules and regulations, changes mandated by the Dodd-Frank Act and the expected burden of compliance with the new law and its rules and regulations could increase operating costs and reduce revenues of financial institutions and their holding companies. In addition to the Dodd-Frank Act provisions discussed above, the Dodd-Frank Act also includes provisions that, among other things:
| | • | | Direct the federal bank regulatory agencies to review and propose new capital requirements applicable to banking institutions (such new capital standards applicable to the Bank have not yet been established by the regulatory agencies). The regulations are required to be, at a minimum, as stringent as current capital and leverage requirements and may limit the use of subordinated debt or similar instruments to meet capital requirements. |
| | • | | Provide that any trust preferred securities and certain hybrid securities issued on or after May 19, 2010 will be considered Tier 2 and not Tier 1 capital. Any trust preferred securities issued prior to May 19, 2010 by banks with assets of less than $15 billion as of December 31, 2009 will continue to qualify as Tier 1 capital. Any trust preferred securities issued prior to May 19, 2010 by banks with assets greater than $15 billion as of December 31, 2009 will continue to qualify as Tier 1 capital until January 2013; at that time, the treatment of the trust preferred securities as Tier 1 capital will be phased out over a three year period ending in January 2016. Our currently outstanding trust preferred securities are grandfathered for Tier 1 eligibility. |
17
| | • | | Require regulatory agencies to make capital requirements for bank holding companies countercyclical, so that capital requirements increase in times of economic expansion and decrease in times of economic contraction. |
| | • | | Require financial institutions, with more than $10 billion in assets, such as the Bank, to conduct annual stress tests in accordance with regulations to be issued by the federal bank regulatory agencies. On January 23, 2012, the FDIC issued a proposed rule, subject to public comment (the “Proposed Rule”) requiring state nonmember banks and savings associations, with total consolidated assets of more than $10 billion, to conduct three annual stress tests based on baseline, adverse and severely adverse scenarios. The Proposed Rule requires each covered institution to calculate, based on specific scenarios to be developed by the FDIC and provided to the covered institution, the impact on each institution’s potential losses, pre-provision revenues, loan loss reserves, and pro forma capital positions, including the impact on capital levels and ratios, during the specified time period. In addition, the Proposed Rule requires covered institutions to disclose the results of their stress tests to the FDIC and a summary of such results to the public. The Proposed Rule’s public comment period ends on March 23, 2012. |
| | • | | Increase the regulation of derivatives and hedging transactions. The regulations are expected to impose additional reporting and monitoring requirements, require higher capital and margin requirements and require that certain trades be executed through clearinghouses. |
| | • | | Centralize responsibility for consumer financial protection by creating a new agency, the Bureau, responsible for implementing, examining, and enforcing compliance with federal consumer financial laws. The Bureau will have broad rule-making authority for a wide range of consumer protection laws that apply to all banks, including the authority to prohibit “unfair, deceptive or abusive” acts and practices. Among other things, it is anticipated that the Bureau may consider significant reforms in the mortgage industry. |
| | • | | Create the Financial Stability Oversight Council that will recommend to the FRB increasingly strict rules for capital, leverage, liquidity, risk management and other requirements as companies grow in size and complexity. |
| | • | | Include mortgage reform provisions regarding a customer’s ability to repay and making more loans subject to restrictions applicable to higher cost loans and new disclosures. In addition, certain compensation for mortgage brokers based on certain loan terms has been prohibited (e.g. compensation based on yield spread premiums). |
| | • | | Require financial institutions to make a reasonable and good faith determination that borrowers have the ability to repay loans for which they apply. If a financial institution fails to make such a determination, a borrower can assert this failure as a defense to foreclosure. |
| | • | | Require financial institutions to retain a specified percentage of certain non-traditional mortgage loans and other assets in the event that they seek to securitize such assets. |
| | • | | Implement corporate governance revisions, including with regard to executive compensation, say on pay votes, proxy access by shareholders and “clawback” policies which apply to all public companies, not just financial institutions. |
Basel Committee on Banking Supervision. Although its impact on the implementing rules and regulations of the Dodd-Frank Act remains unclear, the U.S. federal banking agencies have expressed support for recently issued proposals by the Basel Committee on Banking Supervision, commonly referred to as “Basel III,” that provide for heightened bank capital, leverage and liquidity requirements that would be phased in over a multi-year period. Basel III provides for a minimum 4.5% common equity risk-based capital requirement, a 6% Tier 1 risk-based capital requirement, an 8% total risk-based capital requirement, an additional 2.5% common equity capital conservation buffer and a periodic countercyclical capital buffer. The capital conservation buffer is designed to absorb losses in periods of financial and economic distress. The countercyclical buffer would be implemented according to national circumstances. The Basel III proposals also include a non-risk-based leverage ratio, as a supplement to the capital requirements, and liquidity requirements. The extent to which regulators in the United States adopt or incorporate provisions of Basel III in future legislation, including the implementing rules and regulations of the Dodd-Frank Act, remains unclear.
EXECUTIVE OFFICERS
Our executive officers are elected annually by our Board of Directors. Certain information regarding our executive officers is set forth below.
| | | | |
Name (Age) | | Position or Employment for Past Five Years | | Executive Officer Since |
| | |
Larry D. Richman (59) | | President and Chief Executive Officer of PrivateBancorp and The PrivateBank since November 2007. Prior to joining the Company, Mr. Richman was President and Chief Executive Officer of LaSalle Bank, N.A. and President of LaSalle Bank Midwest N.A., which were sold to Bank of America Corporation on October 1, 2007. Mr. Richman began his career with American National Bank and joined Exchange National Bank in 1981, which merged with LaSalle Bank in 1990. | | 2007 |
18
| | | | |
C. Brant Ahrens (41) | | President of Personal Client Services since February 2012 overseeing Private Wealth and Community Banking. Prior to that, he was Chief Operating Officer since October 2009, overseeing community banking, operations, information technology, strategic development, human resources, marketing and communications. Mr. Ahrens joined PrivateBancorp as Chief Strategy Officer in 2007 and added the role of Chief Marketing Officer in 2008. Mr. Ahrens was previously Group Senior Vice President and head of the Financial Institutions Group at LaSalle Bank, N.A., where he spent 15 years in various capacities including risk management, strategic development and as head of International Corporate Banking. | | 2007 |
| | |
Karen B. Case (53) | | President of Commercial Real Estate Banking since October 2007. Prior to joining the Company, Ms. Case was Executive Vice President of LaSalle Bank, N.A. overseeing the Illinois Commercial Real Estate group. Prior to joining LaSalle in 1992, Ms. Case established and managed the Midwest real estate lending operations for New York-based Marine Midland Bank. | | 2007 |
| | |
Jennifer R. Evans (53) | | General Counsel and Corporate Secretary of PrivateBancorp and The PrivateBank, since January 2010. Ms. Evans previously served as a consultant to various financial institutions, audit committees and public companies regarding compliance, regulatory and disclosure matters, and served on the board of directors, and on the audit and asset-liability management committees, of Evergreen Bank Group. Previous to that, Ms. Evans held the role of Executive Vice President and General Counsel for MAF Bancorp, Inc. and its subsidiary Mid America Bank from 2004 to 2007. Ms. Evans spent over 20 years at Vedder Price P.C., a Chicago-based law firm, as a partner and chair of its corporate securities practice group. | | 2010 |
| | |
Bruce R. Hague (57) | | President of National Commercial Banking since October 2007, with responsibility for our regional banking and commercial lending offices. Mr. Hague spent 15 years at LaSalle Bank, N.A., where he ultimately became Executive Vice President of National Commercial Banking, responsible for 23 regional banking offices, including all commercial regional offices located throughout the United States, International Corporate Banking, the LaSalle Leasing Group, Corporate Finance, and Treasury Management Sales. | | 2007 |
| | |
Kevin M. Killips (57) | | Chief Financial Officer since March 2009. Prior to joining the Company, Mr. Killips served as controller and chief accounting officer of Discover Financial Services from March 31, 2008. Prior to joining Discover Financial Services, Mr. Killips was employed by LaSalle Bank where he worked for nearly ten years and ultimately served as Corporate Executive Vice President, North American Chief Accounting Officer and Corporate Controller. Prior to working at LaSalle, he was director of Internal Audit, and then Vice President-Finance for leasing operations at Transamerica Corporation. Mr. Killips, a certified public accountant, also worked for Ernst & Young from 1979-1993. | | 2009 |
| | |
Bruce S. Lubin (58) | | President of Illinois Commercial and Specialty Banking since October 2007. From December 2009 to February 2012, he was also President of The Private Wealth group. Mr. Lubin was previously executive vice president and head of the Illinois Commercial Banking Group at LaSalle Bank, N.A. Mr. Lubin had been employed by LaSalle since 1990, when LaSalle acquired The Exchange National Bank of Chicago. Mr. Lubin was an employee of Exchange beginning in 1984. | | 2007 |
| | |
Kevin J. Van Solkema (51) | | Mr. Van Solkema joined the Company in January 2008 and serves as Chief Credit Risk Officer. Mr. Van Solkema was previously employed by LaSalle Bank, N.A. as Deputy Chief Credit Officer. From March through June 2007, Mr. Van Solkema was employed by CitiMortgage before rejoining LaSalle Bank. In April 2004, Mr. Van Solkema was appointed Head of Consumer Risk Management for ABN AMRO North America/LaSalle Bank, which included responsibility for all credit and operational risk management | | 2008 |
19
| | | | |
| | activities for ABN AMRO Mortgage Group, as well as LaSalle Bank’s consumer lending and portfolio mortgage units. Mr. Van Solkema was Head of Risk Management at Michigan National Bank prior to it being acquired by LaSalle in 2001. | | |
| | |
Leonard Wiatr (64) | | Mr. Wiatr joined the Company in March 2008 as Chief Compliance and Regulatory Affairs Officer and in May 2010 assumed the responsibility of Chief Risk Officer. Mr. Wiatr previously served at ABN AMRO and its subsidiary LaSalle Bank Corp. as Executive Vice President. Previous to that, Mr. Wiatr held the role of Examiner-In-Charge for Large Bank Supervision for the Office of the Comptroller of the Currency. Mr. Wiatr spent 33 years at the Office of the Comptroller of the Currency. | | 2010 |
AVAILABLE INFORMATION
We file annual, quarterly, and current reports, proxy statements and other information with the Securities and Exchange Commission (“SEC”). This information is available free of charge through the investor relations section of our web site at www.theprivatebank.com and through the SEC’s website at www.sec.gov. It may also be obtained at the SEC Public Reference Room in Washington, D.C. Information regarding the operation of the Public Reference Room may be obtained by calling the SEC at 1-800-SEC-0330.
The following documents can be accessed through our web site or are available in print upon the request of any stockholder to our corporate secretary:
| | • | | certificate of incorporation |
| | • | | charters of our audit, compensation, and nominating and corporate governance committees of our board of directors |
| | • | | corporate code of ethics |
| | • | | excessive or luxury expenditures policy |
Within the time period required by the SEC and The NASDAQ Stock Market, we will post on our web site any amendment to our code of ethics and any waiver to the code of ethics applicable to any of our executive officers or directors. In addition, our web site includes information concerning purchases and sales of our securities by our executive officers and directors. References to our website addressed in this report are provided as a convenience and do not constitute, and should not be viewed as, an incorporation by reference of the information contained on, or available through, the website. Therefore, such information should not be considered part of this report.
Our corporate secretary can be contacted by writing to PrivateBancorp, Inc., 120 South LaSalle Street, Chicago, Illinois 60603, Attn: Corporate Secretary. Our investor relations department can be contacted by telephone at (312) 564-2000.
CAUTIONARY STATEMENT REGARDING FORWARD-LOOKING STATEMENTS
Statements contained in this report that are not historical facts may constitute forward-looking statements within the meaning of federal securities laws. Forward-looking statements represent management’s beliefs and expectations regarding future events, such as our anticipated future financial results, credit quality, revenues, expenses, or other financial items, and the impact of business plans and strategies or legislative or regulatory actions. Forward-looking statements are typically identified by words such as “may,” “might,” “will,” “should,” “could,” “would,” “expect,” “plan,” “anticipate,” “intend,” “believe,” “estimate,” “predict,” “project,” “potential,” or “continue” and other comparable terminology.
Our ability to predict results or the actual effects of future plans, strategies or events is inherently uncertain. Factors which could cause actual results to differ from those reflected in forward-looking statements include, but are not limited to: unforeseen credit quality problems or further deterioration in problem assets that could result in charge-offs greater than we have anticipated in our allowance for loan losses; adverse developments impacting one or more large credits; the extent of further deterioration in real estate values in our market areas, particularly in the Chicago area; the impact of market volatility on, among other things, fees related to assets under management and administration; difficulties in resolving problem credits or slower than anticipated dispositions of other real estate owned (“OREO”) which may result in increased losses or higher credit costs; continued uncertainty regarding U.S. and global economic recovery and economic outlook, and ongoing volatility in market conditions, that may impact credit quality or prolong weakness in demand for loans or other banking products and services; weakness in the commercial and industrial sector; unanticipated withdrawals of significant client deposits; lack of sufficient or cost-effective sources of liquidity or funding; the terms and availability
20
of capital when and to the extent necessary or required to repay TARP preferred stock or otherwise; loss of key personnel or an inability to recruit and retain appropriate talent; unanticipated changes in interest rates or significant tightening of credit spreads; competitive pricing pressures; uncertainty regarding implications of the Dodd-Frank Act and the rules and regulations to be adopted in connection with implementation of the legislation, including evolving regulatory capital standards; other legislative, regulatory or accounting changes affecting financial services companies and/or the products and services offered by financial services companies; uncertainties related to potential costs associated with pending litigation; or failures or disruptions to our data processing or other information or operational systems.
These forward-looking statements are subject to significant risks, assumptions and uncertainties, and could be affected by many factors including those set forth in the “Risk Factors” and “Management’s Discussion and Analysis of Financial Condition and Results of Operations” sections of this Form 10-K as well as those set forth in our subsequent periodic and current reports filed with the SEC. These factors should be considered in evaluating forward-looking statements and undue reliance should not be placed on our forward-looking statements. Forward-looking statements speak only as of the date they are made, and we assume no obligation to update any of these statements in public filings in light of future events unless required under the federal securities laws.
ITEM 1A. RISK FACTORS
Our business, financial condition and results of operations are subject to various risks, including those discussed below, which may affect the value of our securities. The risks discussed below are those that we believe are the most significant risks affecting us and our business, although additional risks not presently known to us or that we currently deem less significant may also adversely affect our business, financial condition and results of operations, perhaps materially. Before making a decision to invest in our securities, you should carefully consider the risks and uncertainties described below and elsewhere in this report.
Risks related to our business
Our business has been, and will continue to be, affected by the stress in the commercial real estate market.
The real estate market continues to experience a variety of difficulties and challenging economic conditions. In particular, market conditions in the Chicago metropolitan area remain stressed. If the economy generally, or the real estate market specifically, does not improve or experiences further deterioration, we could suffer losses against commercial real estate and construction loans in excess of what we have provided for in the allowance for loan losses. Since the beginning of 2009, when our commercial real estate and construction loans totaled $3.58 billion, we have recorded $299 million in charge-offs to those portions of the loan portfolio. At December 31, 2011, our commercial real estate and construction loans totaled $2.9 billion, and included $212 million in special mention and potential problem loans, and $155 million in non-performing loans. At December 31, 2011, we allocated $64 million in general reserves and $44 million in specific reserves to the commercial real estate and construction loan portfolios.
Our commercial real estate and construction loan portfolios include loans with large principal amounts and the repayment of these loans is generally dependent on the successful leasing or sale of the property, the successful operation of the business occupying the property, the cost and time frame of constructing or improving a property and the availability of permanent financing. The repayment of these loans is particularly influenced by general conditions in the real estate markets or in the local economy where the property is located. Many commercial real estate and construction loans do not fully amortize the balance over the loan period, but have balloon payments due at maturity. The borrower’s ability to make a balloon payment may depend on their ability to either refinance the loan or complete a timely sale of the underlying property. The borrower’s inability to use funds generated by a project to service a loan until a project is completed, and the more pronounced risk to interest rate movements and the real estate market that these borrowers face while a project is being completed or seeking a buyer, can also make construction loans more vulnerable to risk of default. On a non-owner occupied commercial property, if the cash flow from a borrower’s project is reduced due to leases not being obtained or renewed, that borrower’s ability to repay the loan may be impaired.
We depend on a liquid market in order to sell property that we acquire through foreclosure (OREO) in a cost effective and timely manner. If the real estate market continues to experience difficulties and challenging economic conditions, we may have difficulty selling foreclosed property at values we consider reasonable, particularly land, which may result in increased losses and carrying costs. At December 31, 2011, OREO totaled $125.7 million.
Our loan portfolio is comprised of commercial and industrial loans, many of which include larger credit relationships, and the repayment of which is largely dependent upon the financial success and viability of the borrower and the state of the economy.
Our loan portfolio is significantly comprised of commercial and industrial loans, many of which involve larger credit relationships that expose us to significant concentration of credit risk. At December 31, 2011 and consistent with 2010, we had 78 unique obligors with credit commitments of $25 million or more totaling $2.5 billion. Over 90% of such commitments at December 31, 2011 are secured by collateral. Of this total commitment, $1.1 billion, or 12% of our loan portfolio, has been used. The
21
remaining $1.4 billion relates to unused or partially drawn commitments. Approximately 85% of these large obligors are commercial and industrial businesses; the remaining exposure is related to commercial real estate loans. Of our largest commitments, five individual obligors had commitments of $50 million or more at December 31, 2011, totaling $302.5 million of which $15.0 million has been drawn, compared to $362.5 million at December 31, 2010 of which $46.6 million was drawn. Depending on collateral values, success of a workout strategy or the ability of a borrower to return to performing status, the unexpected occurrence of an event or development adversely impacting one or more of our large clients could materially affect our results of operation and financial condition.
The repayment of the loans in our commercial and industrial portfolio is dependent upon the financial success and viability of the borrower. If the economy remains weak for a prolonged period or experiences further deterioration or if the industry or market in which the borrower operates weakens, our borrowers may experience depressed or dramatic and sudden decreases in revenues that could hinder their ability to repay their loans. Our commercial and industrial loan portfolio, which includes owner-occupied commercial real estate, totaled $5.4 billion, or 60% of our total loan portfolio, at December 31, 2011, compared to $4.9 billion, or 53% of our total loan portfolio, at December 31, 2010.
Many of our commercial and industrial loans are secured by different types of collateral related to the underlying business, such as accounts receivable, inventory and equipment, which fluctuate in value. Should a commercial and industrial loan default require us to foreclose on underlying collateral, we may not recover the principal amount of the loan and the unique nature of certain collateral may make it more difficult and costly to liquidate.
Within our commercial lending business, we have a specialized niche in the nursing and residential care segment of the healthcare industry. At December 31, 2011, 23% of the commercial loan portfolio or $1.2 billion was composed of loans within the healthcare industry, primarily loans in which the facilities securing the loans are dependent, in part, on the receipt of payments and reimbursements under government contracts for services provided. Our clients and their ability to service debt may be adversely impacted by the health of state or federal budgets and the ability of such governments, many of which have experienced budgetary stress in the recent economic environment, to make payments for services previously provided. As of December 31, 2011, 55% of the healthcare portfolio was secured by facilities in five states, with Illinois representing the highest percentage of facilities at 18%.
Our allowance for loan losses may be insufficient to absorb losses in our loan portfolio.
Lending money is a substantial part of our business. Every loan we make carries a certain risk of non-payment. This risk is affected by, among other things:
| | • | | the credit risks posed by the particular borrower and loan type; |
| | • | | changes in economic and industry conditions; |
| | • | | the duration of the loan; |
| | • | | in the case of a collateralized loan, the changes and uncertainties as to the future value of the collateral; and |
| | • | | the ability to identify potential repayment issues in loans at an early stage. |
We maintain an allowance for loan losses at a level management believes is sufficient to absorb credit losses inherent in our loan portfolio. The allowance for loan losses is assessed quarterly and represents an accounting estimate of probable losses in the portfolio at each balance sheet date based on a review of available and relevant information at that time. The allowance is not a prediction of our actual credit losses going forward. The allowance contains provisions for probable losses that have been identified relating to specific borrowing relationships that are considered to be impaired, as well as probable losses inherent in the loan portfolio that are not specifically identified, which is determined using a methodology that is a function of quantitative and qualitative factors applied to segments of our loan portfolio and management’s judgment. The calculation of the allowance involves a great deal of judgment and uncertainty particularly given the state of the overall economy, the continuing stress in the real estate market, and negative events or circumstances that might impact an individual borrower. Accordingly, there can be no assurance that we will not incur losses on loans greater than what we have provided for in the allowance.
The allowance for loan losses was $191.6 million at December 31, 2011, compared to $222.8 million at December 31, 2010. The allowance for loan losses as a percentage of total loans was 2.13% at December 31, 2011, compared to 2.44% at December 31, 2010.
Our allowance as a percentage of total loans reflects a level based on management’s analysis of the risk inherent in our loan portfolio. Although we believe our loan loss allowance is adequate to absorb probable and reasonably estimable losses in our loan portfolio as of the balance sheet date, the allowance may not be adequate especially if economic conditions worsen or the factors used to calculate the allowance change. Our regulators also review the adequacy of our allowance and although they have never done so, do have authority to compel us to increase our allowance in current or future periods.
A large portion of our loan portfolio was originated since 2007 when we initiated a strategic plan to transform the bank into a leading middle market commercial bank. The behavior of a portfolio of more mature loans may be more predictable based on past performance history than a newer portfolio, such as ours. In calculating the allowance, we use historical default and loss information.
22
For those segments of our portfolio that are less seasoned, such as our commercial and industrial portfolio, the available historical default and loss data is more limited, making it more difficult to estimate the probable losses inherent in those portfolios. As a result, the current level of delinquencies and defaults may not be representative of the level that will occur when the newer portion of the portfolio becomes more seasoned, which may be higher than current levels.
In the event we are required to increase our allowance for loan losses, our credit losses exceed our allowance or we are required to take higher than anticipated charge-offs in future periods, our earnings and our capital will be adversely affected. We may experience variability in our quarterly loan loss provision expense and charge-offs if larger credits default, which may impact credit quality trends.
We may be required to hold higher capital levels.
Under applicable regulatory guidelines, we are subject to minimum capital requirements adopted and administered by the federal banking agencies. The current economic environment and the challenges facing many financial institutions, however, have resulted in heightened capital expectations from the federal banking agencies, particularly with respect to financial institutions experiencing credit challenges in their loan portfolios.
Rulemaking proposals under Dodd-Frank Act and Basel III could ultimately impose capital requirements that are more stringent than current requirements and expectations and may limit the use of subordinated debt or similar instruments to meet capital requirements. Future issuances of trust preferred securities have been disallowed as Tier 1 qualifying capital under Dodd-Frank Act, although our currently outstanding trust preferred securities have been grandfathered for Tier 1 eligibility. The Dodd-Frank Act and Basel III also require regulatory agencies to seek to make capital requirements for bank holding companies countercyclical, so that capital requirements increase in times of economic expansion and decrease in times of economic contraction. Because many of the implementing rules have not yet been finalized or even proposed, there is continuing uncertainty surrounding the rulemaking and interpretations under the Dodd-Frank Act and Basel III and the level of capital that will be deemed adequate for our risk profile, as well as market expectations regarding adequate capital levels
We currently manage our balance sheet to maintain capital ratios at levels above the minimum regulatory guidelines that we deem adequate for our risk profile and expect to manage growth within our existing capital base. There can be no assurance, however, that we will be able to maintain capital at these levels or at levels required or expected by our regulators or future laws and regulations, especially considering the uncertainty surrounding such future laws and interpretations. Our capital position may be affected by credit losses and credit deterioration, potential asset impairment, significant draws on our unfunded commitments, or unexpected asset growth.
We may be required to raise capital to maintain capital at appropriate levels. The terms on which we are able to raise capital, such as capital costs and dilutive impact on shareholders, will be dependent upon our access to the capital markets and will be influenced by events, circumstances and risks that are specific to us and the banking industry.
The success of our business is dependent on ongoing access to sufficient and cost-effective sources of liquidity.
We depend on access to a variety of funding sources to provide sufficient liquidity to meet our lending commitments and business needs and to accommodate the transaction and cash management needs of our clients, including funding new loans and client draws on unused lines of credit. As of December 31, 2011, we had a total of $4.1 billion of unfunded commitments to extend credit. Currently, our primary sources of liquidity are client deposits, large institutional deposits, and wholesale market-based borrowings, including brokered deposits. In addition to on-balance sheet liquidity and funding, we maintain access to various external sources of funding. These external sources of funding include Federal Fund counterparty lines, repurchase agreements, the discount window at the Federal Reserve Bank, Federal Home Loan Bank (“FHLB”) borrowings and the brokered deposit market. Our ability to access these external sources depends on availability in the market place and a number of factors such as counterparty relationship strength in the case of Federal Fund counterparty lines and repurchase agreements or the availability of loans eligible under the Federal Reserve’s and the FHLB’s criteria (e.g., stipulations of documentation requirements, credit quality, payment status and other criteria).
If our primary sources of liquidity are insufficient and we are unable to adequately access external sources, we may be required to increase our on-balance sheet liquidity and funding by accessing the capital markets, which may not be cost effective or may have a dilutive effect on our shareholders.
Since 2009, we have experienced a significant increase in client deposits. This has allowed us to reduce our reliance on wholesale funding sources. However, there can be no assurance that this level of client deposit growth will continue or remain at current levels or that we will be able to maintain the lower reliance on wholesale deposits. As returns in the equity markets improve, when the economy improves, interest rates rise or if the current eligibility for unlimited FDIC insurance coverage is eliminated, some of our client deposits may move to other investment options, which may lead to increased reliance on wholesale or other funding sources.
23
In addition, because our deposit base is relatively concentrated given our core commercial banking strategy, the loss of large client relationships could negatively impact our liquidity. At December 31, 2011, we had 13 client relationships with greater than $75 million in deposit balances and our ten largest depositor accounts totaled $1.9 billion, or 19% of total deposits.
We are highly dependent upon the current cash position of the holding company to meet holding company liquidity needs and to pay dividends on our common and preferred stock for the foreseeable future. At December 31, 2011, the holding company had cash and liquid investments totaling $150 million.
The loss of key managing directors may adversely affect our operations.
We are a relationship-driven organization. Our growth and development during the past four years can be attributed in large part to the efforts of our managing directors who have primary contact with our clients and who are extremely important in maintaining personalized relationships with our client base, which is a key aspect of our business strategy. The loss of one or more of these key employees could have a material adverse effect on our operations if we are unable to replace these employees or we are unable to successfully retain the client relationships of a departing managing director.
To the extent weak financial performance, restrictions on compensation due to our participation in the TARP Capital Purchase Program, limitations on available equity awards, or regulatory guidance impact our ability to offer competitive pay programs, we may not be successful in motivating and retaining key employees.
Our business could be significantly impacted if we suffer failure or disruptions of our information systems.
We rely heavily on communications, data processing and other information processing systems to conduct our business and support our day-to-day banking, investment, and trust activities, many of which are provided through third-parties. Although we take ongoing protective monitoring, detection, and prevention measures and perform penetration testing and risk assessments at least annually, our computer systems, software and networks may be vulnerable to unauthorized access, loss or destruction of data (including confidential client information), account takeovers, unavailability of service, computer viruses or other malicious code, or cyberattacks beyond what we can reasonably anticipate and such events could result in material loss. We could suffer disruptions to our systems or damage to our network infrastructure from events that are wholly or partially beyond our control, such as electrical or telecommunications outages, natural disasters, widespread health emergencies or pandemics, or events arising from local or larger scale political events, including terrorist acts. We outsource data processing and other functions to third parties. If our third party providers encounter difficulties or become the source of an attack on or breach of operational systems, data or infrastructure, or if we have difficulty communicating with any such third party system, our business operations could suffer. Any failure or disruption to our systems, or those of a third party provider, could impede our service delivery, customer relationship management, data processing, financial reporting or risk management. There can be no assurance that our policies, procedures and protective measures designed to prevent or limit the effect of a failure, interruption or security breach will be effective, and if significant failure, interruption or security breaches does occur, we could suffer damage to our reputation, a loss of customer business, additional regulatory scrutiny, or exposure to civil litigation, additional costs and possible financial liability. If we fail to maintain adequate infrastructure, systems, controls and personnel relative to our size and products and services, our ability to effectively operate our business may be impaired and our business could be adversely affected.
Our participation in the U.S. Treasury’s Capital Purchase Program subjects us to certain restrictions.
On January 30, 2009, we issued approximately $243.8 million of our senior preferred stock and warrants to purchase shares of common stock at an exercise price of $28.35 per share to the Treasury under the TARP CPP. Based on our participation in the CPP, we agreed to comply with its terms and conditions, which subjects us to certain restrictions, oversight, costs and compliance and reputational risks. For example, we may not, without the consent of the Treasury, increase our dividend, currently $0.01 per share per quarter, above a rate of $0.075 per quarter or, subject to certain exceptions, engage in repurchases of our common stock or trust preferred securities until January 30, 2012 or, if earlier, the date on which all preferred stock issued to the Treasury has been redeemed or transferred by the Treasury. Our participation in the CPP also subjects us to additional executive compensation and other restrictions, which may adversely affect our ability to attract and retain highly-qualified senior executive officers and other employees, particularly in light of the fact that some of the financial institutions with which we compete are not subject to the restrictions imposed by the CPP. Furthermore, under the terms of the securities purchase agreement we entered into with the Treasury, the Treasury will be able to unilaterally amend the agreement to make it consistent with any subsequent statutory provisions implemented by Congress. If we fail to comply with the terms and conditions of the program or the securities purchase agreement, including any restrictions upon our use of the CPP proceeds, we could become subject to a regulatory enforcement action or legal proceedings brought by the U.S. government, which, in turn, would present significant reputational risks for us that could affect our ability to retain or attract new clients or investors (if and when we determine to raise additional capital) or both.
24
We have counterparty risk; the creditworthiness of other financial institutions could expose us to losses on contracts we have with these institutions and could adversely affect our ability to provide services to our clients, specifically products and services relating to foreign exchange, derivatives and letters of credit.
Our ability to provide certain products and service could be adversely affected by the actions and commercial soundness of other banks. Banks are interrelated as a result of lending, clearing, correspondent, counterparty and other relationships. As a result, defaults by, or even rumors or questions about, one or more banks, or the banking industry generally, have in the past led to market-wide liquidity problems and could lead to losses or defaults by us or by other institutions. Many of the transactions engaged in by us in the ordinary course of business, particularly in our capital markets group; expose us to credit risk in the event of default of a counterparty or customer. In such instances, the collateral we hold may be insufficient to mitigate our losses, as we may be unable to realize or liquidate at prices sufficient to recover the full amount of our exposure. Such losses could have a material and adverse effect on our financial condition and results of operations.
Our capital markets group offers an extensive range of over-the-counter interest rate and foreign exchange derivatives products. Although we do not engage in any proprietary trading and we structure these client-generated trading activities to mitigate our exposure to market risk, we remain exposed to various risks, the most significant of which include credit risk of our counterparties, operational risk and settlement risk, which may be most significant in foreign exchange transactions where timing differences between settlement centers can result in us paying our client and/or counterparty before actually receiving the funds. The exposure of our counterparties requires active monitoring as well as liquidity management to ensure timely and cost efficient posting of collateral. Operational risk includes errors in execution of internal bank procedures and controls, which could expose us to financial and/or reputation loss. A lapse or breakdown of these procedures or controls could significantly increase our exposure to counterparty credit risk and operational risk, which could result in a material loss to us.
Risks related to our operating environment
Weak economic conditions could continue to have a material adverse effect on our financial condition and results of operations.
Various segments of the U.S. economy have been in a prolonged and deep slowdown over the past four years, and there is continuing uncertainty, volatility and stress in the U.S. economy and the local economies in each of our markets. Continued and sustained periods of uncertainty, prolonged periods of unemployment, volatility or further deterioration in the international, national or local business or economic conditions could result in, among other things, a further deterioration of credit quality, including a resultant effect on our loan portfolio and allowance for loan losses, and a reduced demand for credit. In addition, higher corporate taxes in the State of Illinois may contribute to an adverse climate for doing business in the state. Continued sustained weakness and uncertainty in business and economic conditions generally, or in our markets specifically, could adversely impact our business through:
| | • | | more clients and counterparties becoming delinquent, filing for protection under bankruptcy laws or defaulting on their loans or other obligations to us; |
| | • | | a decrease in the value of the collateral underlying loans, requiring paydowns by our borrowers to remain in loan-to-value compliance, restricting borrower access to liquidity as defined by borrowing arrangements or, alternatively, resulting in a default; |
| | • | | a decrease in the value of any loans that we may hold for sale or property acquired upon default; |
| | • | | lengthy holding periods required to liquidate property acquired upon default or loans held for sale, thereby increasing carrying costs and potentially impacting market values; and |
| | • | | sluggish demand for loans and other products and services offered by us. |
An increase in the number of delinquencies, bankruptcies or defaults in future periods could result in a higher level of nonperforming assets, net charge-offs, provision for loan and covered asset losses, and valuation adjustments on any loans held for sale, which would materially adversely affect our financial condition and results of operations.
We may be adversely affected by interest rate changes.
Our operating results are largely dependent on our net interest income. Fluctuations in interest rates may significantly affect our net interest income, which is the difference between the interest income earned on earning assets, usually loans and investment securities, and the interest expense paid on deposits and borrowings. We are unable to predict fluctuations in interest rates, which are affected by factors including: monetary policy of the FRB, actual inflation or deflation or expectations regarding the same, recession, unemployment rates, money supply, domestic and foreign events, and instability in domestic and foreign financial markets. The timing of any FRB action to curtail or eliminate various stimulus-related programs, as a result of inflation concerns or otherwise, could have an impact on interest rates in general and our net interest margin in particular.
25
Our investment portfolio also contains interest rate sensitive instruments that may be adversely affected by changes in interest rates or spreads caused by governmental monetary policies, domestic and international economic and political conditions, issuer or insurer credit deterioration and other factors beyond our control. A rise in interest rates or spread widening would reduce the net unrealized gains currently reflected in our investment portfolio and slowdown prepayment, offset by our ability to earn higher rates of return on funds reinvested.
Demand for the products or services of our capital markets group could be negatively impacted by interest rate changes and a decrease in sales volumes from this group could have an adverse impact on our results of operations.
Global economic uncertainty and the potential for a deterioration in the European sovereign debt crisis may adversely affect the financial services industry and could negatively impact our results of operations and financial condition.
Continuing uncertainty in the economic, political and financial markets and the ongoing sovereign debt crisis in Europe could impact our customers and could negatively affect our credit portfolio and liquidity position. There have been recent periods of extreme volatility in the global financial markets and the financial turmoil and uncertainty with respect to the euro zone crisis could threaten the stability of the global banking system and the Company’s financial condition. Continuing uncertainty and volatility or a disruption in the global financial markets could impact the Company’s financial condition to the extent it causes stress on the United States financial services industry. The Company also faces risks related to our counterparties who may have exposure in European sovereign debt holdings, particularly those countries experiencing significant economic, fiscal or political strains. Although we had no direct funded or non-funded exposure to European sovereign or non-sovereign entities in either our Held-to-Maturity or Available-for-Sale portfolios as of December 31, 2011, we conduct business with European financial institutions headquartered in the United Kingdom, Switzerland, France, and Germany, related to repurchase agreements, interest rate swaps, balance sheet hedging, foreign exchange transactions and letter of credit issuance. As is common market practice, certain of our interest rate derivatives and letter of credit transactions with such European financial institutions are collateralized with investment securities that we have been required to pledge to the counterparty institution. Should one of these counterparties experience significant financial distress, those securities could become so-called trapped collateral pending resolution of any applicable proceedings. In addition, although we primarily lend to U.S. commercial clients, the operations, and therefore financial stability, of some of those clients may be affected by disruption or volatility in Europe. Further, the Company may have direct and/or indirect exposure to foreign subsidiaries and affiliates of U.S. domiciled commercial clients. Such subsidiaries and affiliates may be co-borrowers or guarantors of the U.S. client’s credit facilities. In some cases, assets or stock of such subsidiaries or affiliates may be pledged to secure payment and performance of certain credit facilities. At this time, we cannot predict the impact this may have on our results of operations and financial condition.
Risks related to the financial services industry
We are highly regulated and may be adversely affected by changes in banking laws, regulations, and regulatory practices.
We are subject to extensive supervision, regulation and examination. This regulatory structure gives the regulatory authorities extensive discretion in connection with their supervisory and enforcement activities and examination policies to address not only compliance with applicable laws and regulations (including laws and regulations governing consumer credit, and anti-money laundering and anti-terrorism laws), but also capital adequacy, asset quality and risk, management ability and performance, earnings, liquidity, and various other factors. As part of this regulatory structure, we are subject to policies and other guidance developed by the regulatory agencies with respect to capital levels, the timing and amount of dividend payments, the classification of assets and the establishment of adequate loan loss reserves for regulatory purposes. Under this structure the regulatory agencies have broad discretion to impose restrictions and limitations on our operations if they determine, among other things, that our operations are unsafe or unsound, fail to comply with applicable law or are otherwise inconsistent with laws and regulations or with the supervisory policies of these agencies. This supervisory framework could materially impact the conduct, growth and profitability of our operations. Any failure on our part to comply with current laws, regulations, other regulatory requirements or expectations or safe and sound banking practices or concerns about our financial condition, or any related regulatory sanctions or adverse actions against us, could increase our costs or restrict our ability to expand our business and result in damage to our reputation.
Changes in laws, regulations and other regulatory requirements affecting the financial services industry, and the effects of such changes, are difficult to predict and may have unintended consequences. New regulations or changes in the regulatory environment could limit the types of financial services and products we may offer and/or increase the ability of non-banks to offer competing financial services and products, among other things. These changes also can adversely affect borrowers, potentially increasing the risk that they may fail to repay their loans.
The impact of the recently enacted Dodd-Frank Act is still uncertain, is expected to increase our regulatory compliance burden and costs of doing business and could result in enhanced capital and leverage requirements and restrictions on certain products and services we offer.
In July 2010, President Obama signed into law the Dodd-Frank Wall Street Reform and Consumer Protection Act which significantly changes the financial regulatory landscape and will affect the operating activities of financial institutions and their holding companies as well as others. Although many of the details of the Dodd-Frank Act and the full impact it will have on our business or revenues are
26
uncertain at this point, in part because many of the provisions require the adoption of implementing rules and regulations, the burden of compliance with the new law and its rules and regulations will increase operating costs and may reduce revenue.
In addition to capital requirements as previously discussed, the Dodd-Frank Act also increases the regulation of derivatives and hedging transactions. This is expected to impact our capital markets group which offers an extensive range of over-the-counter interest rate and foreign exchange derivatives products to our clients. The regulations are expected to impose additional reporting and monitoring requirements, require higher capital and margin requirements and require that certain trades be executed through clearinghouses, all of which would likely result in added costs of doing business. Depending on the outcome of regulatory implementation (including, but not limited to, the definition of swap dealers and related compliance rules), the prospects for our capital markets business, the demand for its products and the types of products it may cost-effectively offer may be diminished.
The Dodd-Frank Act repealed the prohibition on banks’ payment of interest on demand deposit accounts of commercial clients beginning one year from the date of enactment, and the market impact of this change at this stage has not been meaningful. However, under different market and economic conditions, it may have an impact on the level and cost of liquidity.
Another significant aspect of the Dodd-Frank Act that will affect us is the creation of a new Bureau of Consumer Financial Protection (the “Bureau”) with broad powers to supervise and enforce consumer protection laws. The Bureau will have broad rule-making authority for a wide range of consumer protection laws that apply to all banks, including the authority to prohibit “unfair, deceptive or abusive” acts and practices. Among other things, it is anticipated that the Bureau may consider significant reforms in the mortgage industry that could have an adverse affect on our mortgage business.
No assurance can be given as to the ultimate effect that the Dodd-Frank Act or any of its provisions will have on our business, financial condition and results of operations, the financial services industry or the economy.
Our future success is dependent on our ability to compete effectively in the highly competitive banking industry.
We face substantial competition in all phases of our operations from a variety of different competitors. Our future success will depend on our ability to compete effectively in this highly competitive environment. We compete for loans, deposits, wealth management and other financial services in our geographic markets with other commercial banks, financial companies, thrifts, credit unions and brokerage firms operating in the markets we serve. Many of our competitors offer products and services that we do not or have greater resources and economies of scale to offer products and services that we offer more cost effectively. Certain of our competitors may have better name recognition and market presence that could benefit them in attracting business. In addition, larger competitors may be able to price loans and deposits more aggressively than we do or offer more favorable terms.
To be competitive, we will need to continue to invest in technology, infrastructure and human resources. This investment is directed at enhancing our risk management function and generating new products and services, and adapting existing products and services to the evolving standards and demands of our clients and regulators. Falling behind our competitors, who may have more extensive resources to invest, in any of these areas, could adversely affect our business.
ITEM 1B. UNRESOLVED STAFF COMMENTS
None.
ITEM 2. PROPERTIES
The executive offices of PrivateBancorp are located in downtown Chicago, Illinois at 120 South LaSalle Street. This building which houses a majority of our general corporate functions is leased from an unaffiliated third party. We conduct our business primarily through the Bank at 28 full-service banking offices in the greater Atlanta, Chicago, Detroit, Kansas City, Milwaukee, and St. Louis metropolitan areas. We also have business development offices located in Atlanta, Cleveland, Denver, Des Moines, and Minneapolis. With the exception of 10 locations which are owned, all other offices are leased from unaffiliated third parties. At certain Bank locations, excess space is leased to third parties.
We also own 29 automated teller machines (“ATMs”) located at our banking facilities.
We believe our facilities in the aggregate are suitable and adequate to operate our banking and related business. Additional information with respect to premises, equipment and lease arrangements is presented in Note 7 of “Notes to Consolidated Financial Statements” in Item 8 of this Form 10-K.
27
ITEM 3. LEGAL PROCEEDINGS
On October 22, 2010, a lawsuit was filed in federal court in the Northern District of Illinois against the Company on behalf of a purported class of purchasers of our common stock between November 2, 2007 and October 23, 2009. Certain of our current and former executive officers and directors and firms that participated in the underwriting of our June 2008 and May 2009 public offerings of common stock were also named as defendants in the litigation. On January 25, 2011, the City of New Orleans Employees’ Retirement System and State-Boston Retirement System were together named as the lead plaintiff, and an amended complaint was filed on February 18, 2011. The amended complaint alleged various claims of securities law violations against certain of the named defendants relating to disclosures we made during the class period in filings under the Securities Act of 1933 and the Securities Exchange Act of 1934. The plaintiffs sought class certification, compensatory damages in an unspecified amount, costs and expenses, including attorneys’ fees, and rescission. The defendants filed a joint motion to dismiss seeking dismissal of all counts. On November 7, 2011, the court released its decision on the defendants’ motion and dismissed all counts of the complaint with prejudice. The plaintiffs did not appeal the court’s decision.
As of December 31, 2011, there were various legal proceedings pending against the Company and its subsidiaries in the ordinary course of business. Management does not believe that the outcome of these proceedings will have, individually or in the aggregate, a material adverse effect on the Company’s results of operations, financial condition or cash flows.
ITEM 4. MINE SAFETY DISCLOSURES
Not applicable.
PART II
ITEM 5. MARKET FOR THE REGISTRANT’S COMMON EQUITY,
RELATED STOCKHOLDER MATTERS, AND
ISSUER PURCHASES OF EQUITY SECURITIES
Our common stock is traded under the symbol “PVTB” on the NASDAQ Global Select market tier of The NASDAQ Stock Market. As of February 21, 2012, there were approximately 510 stockholders of record. The following table sets forth the high and low intraday sales prices and quarter-end closing price of our common stock, dividends declared per share, dividend yield and book value per share during each quarter of 2011 and 2010. As of February 24, 2012, our closing market price was $14.50 per share.
| | | | | | | | | | | | | | | | | | | | | | | | | | | | | | | | |
| | | 2011 | | | 2010 | |
| | | Fourth | | | Third | | | Second | | | First | | | Fourth | | | Third | | | Second | | | First | |
Market price of common stock | | | | | | | | | | | | | | | | | | | | | | | | | | | | | | | | |
High | | $ | 12.12 | | | $ | 14.45 | | | $ | 16.49 | | | $ | 16.09 | | | $ | 15.06 | | | $ | 13.00 | | | $ | 17.96 | | | $ | 15.58 | |
Low | | $ | 6.44 | | | $ | 7.19 | | | $ | 13.24 | | | $ | 13.63 | | | $ | 10.96 | | | $ | 10.24 | | | $ | 10.91 | | | $ | 8.85 | |
Quarter-end | | $ | 10.98 | | | $ | 7.52 | | | $ | 13.80 | | | $ | 15.29 | | | $ | 14.38 | | | $ | 11.39 | | | $ | 11.08 | | | $ | 13.70 | |
Cash dividends declared per share | | $ | 0.01 | | | $ | 0.01 | | | $ | 0.01 | | | $ | 0.01 | | | $ | 0.01 | | | $ | 0.01 | | | $ | 0.01 | | | $ | 0.01 | |
Dividend yield at quarter-end(1) | | | 0.36% | | | | 0.53% | | | | 0.29% | | | | 0.26% | | | | 0.28% | | | | 0.35% | | | | 0.36% | | | | 0.29% | |
Book value per share at quarter-end | | $ | 14.72 | | | $ | 14.57 | | | $ | 14.22 | | | $ | 13.98 | | | $ | 13.87 | | | $ | 14.10 | | | $ | 13.98 | | | $ | 13.77 | |
| | (1) | Ratios are presented on an annualized basis. |
A discussion regarding the restrictions applicable to our ability and the ability of our subsidiaries to pay dividends is included in the “Supervision and Regulation – Bank Regulation” section in Item 1 of this Form 10-K and Note 17 of “Notes to Consolidated Financial Statements” in Item 8 of this Form 10-K.
28
Stock Performance Graph
The graph below illustrates, over a five-year period, the cumulative total return (defined as stock price appreciation and dividends) to stockholders from an investment in our common stock against a broad-market total return equity index and a published industry total return equity index. The broad-market total return equity index used in this comparison is the Russell 2000 Index and the published industry total return equity index used in this comparison is the Center for Research in Security Prices index for NASDAQ Bank Stocks.
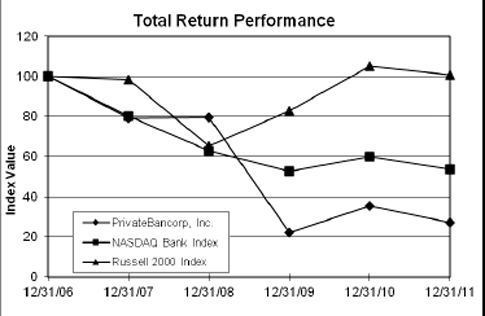
Comparison of Five-Year Cumulative Total Return Among
PrivateBancorp, Inc., the NASDAQ Bank Index, and the Russell 2000 Index(1)
| | | | | | | | | | | | | | | | | | | | | | | | |
| | | Period Ending December 31, | |
| | | 2006 | | | 2007 | | | 2008 | | | 2009 | | | 2010 | | | 2011 | |
| | | | | | |
PrivateBancorp | | $ | 100.00 | | | $ | 79.14 | | | $ | 79.44 | | | $ | 22.01 | | | $ | 35.40 | | | $ | 27.13 | |
| | | | | | |
NASDAQ Bank Index | | | 100.00 | | | | 80.09 | | | | 62.84 | | | | 52.60 | | | | 60.04 | | | | 53.74 | |
| | | | | | |
Russell 2000 Index | | | 100.00 | | | | 98.43 | | | | 65.18 | | | | 82.89 | | | | 105.14 | | | | 100.75 | |
| | (1) | Assumes $100 invested on December 31, 2006 in PrivateBancorp’s common stock, the Russell 2000 Index and the NASDAQ Bank Index with the reinvestment of all related dividends. |
To the extent this Form 10-K is incorporated by reference into any other filing by us under the Securities Act of 1933 or the Securities Exchange Act of 1934, the foregoing“Stock Performance Graph”will not be deemed incorporated, unless specifically provided otherwise in such filing and shall not otherwise be deemed filed under such Acts.
29
Issuer Purchases of Equity Securities
In connection with our participation in the TARP CPP, our ability to repurchase shares of our common stock is subject to the applicable restrictions of the CPP following the January 2009 sale of the preferred stock to the Treasury under the CPP. The restrictions on repurchases will not affect our ability to repurchase shares in connection with the administration of our employee benefit plans as such transactions are in the ordinary course and consistent with our past practice.
The following table summarizes purchases we made during the quarter ended December 31, 2011 in the administration of our employee share-based compensation plans. Under the terms of these plans, we accept shares of common stock from plan participants if they elect to surrender previously-owned shares upon exercise of options to cover the exercise price or, in the case of both restricted shares of common stock or stock options, the withholding of shares to satisfy tax withholding obligations associated with the vesting of restricted shares or exercise of stock options.
Issuer Purchases of Equity Securities
| | | Total Number | | | | Total Number | | | | Total Number | | | | Total Number | |
| | | Total
Number of
Shares
Purchased | | | Average
Price
Paid per
Share | | | Total Number
of Shares
Purchased as
Part of
Publicly
Announced
Plans or
Programs | | | Maximum
Number of
Shares that
May Yet Be
Purchased
Under the
Plan or
Programs | |
October 1 - October 31, 2011 | | | 633 | | | $ | 7.52 | | | | - | | | | - | |
November 1 - November 30, 2011 | | | 2,503 | | | | 10.83 | | | | - | | | | - | |
December 1 - December 31, 2011 | | | 64,226 | | | | 10.85 | | | | - | | | | - | |
| | | | | | | | | | | | | | | | |
Total | | | 67,362 | | | $ | 10.82 | | | | - | | | | - | |
| | | | | | | | | | | | | | | | |
Unregistered Sale of Equity Securities
None.
30
ITEM 6. SELECTED FINANCIAL DATA
Consolidated financial information reflecting a summary of our operating results and financial condition for each of the five years in the period ended December 31, 2011 is presented in the following table. This summary should be read in conjunction with the consolidated financial statements and accompanying notes included elsewhere in this Form 10-K. A more detailed discussion and analysis of the factors affecting our financial condition and operating results is presented in Item 7, “Management’s Discussion and Analysis of Financial Condition and Results of Operations,” of this Form 10-K.
| | | | | | | | | | | | | | | | | | | | | | | | | | | | | | |
| | | | | Years ended December 31, | |
| |
| (Dollars in thousands, except per share data) | | 2011 | | | 2010 | | | 2009 | | | 2008 | | | 2007 | |
Operating Results | | | | | | | | | | | | | | | | | | | | | | | | | | | | | | |
Interest income | | $ | | | 481,146 | | | $ | | | 507,925 | | | $ | | | 478,712 | | | $ | | | 405,383 | | | $ | | | 307,924 | |
Interest expense | | | | | 74,019 | | | | | | 106,968 | | | | | | 153,728 | | | | | | 214,988 | | | | | | 180,886 | |
| | | | | | | | | | | | | | | | | | | | | | | | | | | | | | |
Net interest income | | | | | 407,127 | | | | | | 400,957 | | | | | | 324,984 | | | | | | 190,395 | | | | | | 127,038 | |
Provision for loan and covered loan losses | | | | | 132,897 | | | | | | 194,541 | | | | | | 199,419 | | | | | | 189,579 | | | | | | 16,934 | |
Fee revenue(1) | | | | | 92,476 | | | | | | 81,064 | | | | | | 65,074 | | | | | | 40,806 | | | | | | 25,926 | |
Net securities gains | | | | | 5,771 | | | | | | 12,182 | | | | | | 7,381 | | | | | | 510 | | | | | | 348 | |
Loss on early extinguishment of debt | | | | | - | | | | | | - | | | | | | (985) | | | | | | - | | | | | | - | |
Non-interest expense | | | | | 302,277 | | | | | | 299,598 | | | | | | 247,415 | | | | | | 196,125 | | | | | | 122,409 | |
| | | | | | | | | | | | | | | | | | | | | | | | | | | | | | |
Income (loss) before income taxes | | | | | 70,200 | | | | | | 64 | | | | | | (50,380) | | | | | | (153,993) | | | | | | 13,969 | |
Income tax provision (benefit) | | | | | 25,660 | | | | | | (1,737) | | | | | | (20,564) | | | | | | (61,357) | | | | | | 2,471 | |
| | | | | | | | | | | | | | | | | | | | | | | | | | | | | | |
Net income (loss) | | | | | 44,540 | | | | | | 1,801 | | | | | | (29,816) | | | | | | (92,636) | | | | | | 11,498 | |
Net income attributable to noncontrolling interests | | | | | 170 | | | | | | 284 | | | | | | 247 | | | | | | 309 | | | | | | 363 | |
| | | | | | | | | | | | | | | | | | | | | | | | | | | | | | |
Net income (loss) attributable to controlling interests | | | | | 44,370 | | | | | | 1,517 | | | | | | (30,063) | | | | | | (92,945) | | | | | | 11,135 | |
Preferred stock dividends and discount accretion | | | | | 13,690 | | | | | | 13,607 | | | | | | 12,443 | | | | | | 546 | | | | | | 107 | |
| | | | | | | | | | | | | | | | | | | | | | | | | | | | | | |
Net income (loss) available to common stockholders | | $ | | | 30,680 | | | $ | | | (12,090) | | | $ | | | (42,506) | | | $ | | | (93,491) | | | $ | | | 11,028 | |
| | | | | | | | | | | | | | | | | | | | | | | | | | | | | | |
Weighted-average common shares outstanding | | | | | 70,449 | | | | | | 70,024 | | | | | | 44,516 | | | | | | 29,553 | | | | | | 21,572 | |
Weighted-average diluted common shares outstanding | | | | | 70,642 | | | | | | 70,024 | | | | | | 44,516 | | | | | | 29,553 | | | | | | 22,286 | |
| |
Selected Operating Statistics | | | | | | | | | | | | | | | | | | | | | | | | | | | | | | |
Net revenue(2) | | $ | | | 508,231 | | | $ | | | 497,780 | | | $ | | | 400,066 | | | $ | | | 235,568 | | | $ | | | 157,586 | |
Operating profit(2) | | | | | 205,954 | | | | | | 198,182 | | | | | | 152,651 | | | | | | 39,443 | | | | | | 35,177 | |
Provision for loan losses(3) | | | | | 130,555 | | | | | | 192,024 | | | | | | 198,866 | | | | | | 189,579 | | | | | | 16,934 | |
| |
Per Share Data | | | | | | | | | | | | | | | | | | | | | | | | | | | | | | |
Basic earnings (loss) per share | | $ | | | 0.43 | | | $ | | | (0.17) | | | $ | | | (0.95) | | | $ | | | (3.16) | | | $ | | | 0.50 | |
Diluted earnings (loss) per share | | | | | 0.43 | | | | | | (0.17) | | | | | | (0.95) | | | | | | (3.16) | | | | | | 0.49 | |
Cash dividends declared | | | | | 0.04 | | | | | | 0.04 | | | | | | 0.04 | | | | | | 0.30 | | | | | | 0.30 | |
Book value at year end | | | | | 14.72 | | | | | | 13.87 | | | | | | 13.99 | | | | | | 16.31 | | | | | | 16.42 | |
Tangible book value at year end(2)(4) | | | | | 13.19 | | | | | | 12.30 | | | | | | 12.41 | | | | | | 13.28 | | | | | | 12.86 | |
Market price at year end | | $ | | | 10.98 | | | $ | | | 14.38 | | | $ | | | 8.97 | | | $ | | | 32.46 | | | $ | | | 32.65 | |
Dividend payout ratio | | | | | 9.30% | | | | | | n/m | | | | | | n/m | | | | | | n/m | | | | | | 60.00% | |
| |
Performance Ratios | | | | | | | | | | | | | | | | | | | | | | | | | | | | | | |
Return on average common equity | | | | | 2.98% | | | | | | -1.20% | | | | | | -4.71% | | | | | | -18.71% | | | | | | 3.50% | |
Return on average assets | | | | | 0.36% | | | | | | 0.01% | | | | | | -0.27% | | | | | | -1.25% | | | | | | 0.25% | |
Net interest margin(2) | | | | | 3.49% | | | | | | 3.38% | | | | | | 3.06% | | | | | | 2.73% | | | | | | 3.14% | |
Efficiency ratio(2)(5) | | | | | 59.48% | | | | | | 60.19% | | | | | | 61.84% | | | | | | 83.26% | | | | | | 77.68% | |
| |
31
| | | | | | | | | | | | | | | | | | | | | | | | | | | | | | |
| | | | | As of December 31, | |
| |
(Dollars in thousands) | | | | 2011 | | | | | 2010 | | | | | 2009 | | | | | 2008 | | | | | 2007 | |
| |
Credit Quality(3) | | | | | | | | | | | | | | | | | | | | | | | | | | | | | | |
Nonaccrual loans | | $ | | | 259,852 | | | $ | | | 365,880 | | | $ | | | 395,447 | | | $ | | | 131,919 | | | $ | | | 38,983 | |
90 days past due loans (still accruing interest) | | | | | - | | | | | | - | | | | | | - | | | | | | - | | | | | | 53 | |
| | | | | | | | | | | | | | | | | | | | | | | | | | | | | | |
Nonperforming loans | | | | | 259,852 | | | | | | 365,880 | | | | | | 395,447 | | | | | | 131,919 | | | | | | 39,036 | |
OREO | | | | | 125,729 | | | | | | 88,728 | | | | | | 41,497 | | | | | | 23,823 | | | | | | 9,265 | |
| | | | | | | | | | | | | | | | | | | | | | | | | | | | | | |
Total nonperforming assets | | $ | | | 385,581 | | | $ | | | 454,608 | | | $ | | | 436,944 | | | $ | | | 155,742 | | | $ | | | 48,301 | |
| | | | | | | | | | | | | | | | | | | | | | | | | | | | | | |
Restructured loans accruing interest | | | | | 100,909 | | | | | | 87,576 | | | | | | - | | | | | | - | | | | | | - | |
Net charge-offs | | $ | | | 161,782 | | | $ | | | 190,891 | | | $ | | | 89,850 | | | $ | | | 125,798 | | | $ | | | 6,112 | |
Total nonperforming loans to total loans | | | | | 2.88% | | | | | | 4.01% | | | | | | 4.37% | | | | | | 1.65% | | | | | | 0.93% | |
Total nonperforming assets to total assets | | | | | 3.11% | | | | | | 3.65% | | | | | | 3.63% | | | | | | 1.56% | | | | | | 0.97% | |
Allowance for loan losses to total loans | | | | | 2.13% | | | | | | 2.44% | | | | | | 2.45% | | | | | | 1.41% | | | | | | 1.17% | |
| |
Balance Sheet Highlights | | | | | | | | | | | | | | | | | | | | | | | | | | | | | | |
Total assets | | $ | | | 12,416,870 | | | $ | | | 12,465,621 | | | $ | | | 12,032,584 | | | $ | | | 10,005,519 | | | $ | | | 4,989,203 | |
Average earning assets | | | | | 11,746,032 | | | | | | 11,978,364 | | | | | | 10,740,119 | | | | | | 7,111,380 | | | | | | 4,180,179 | |
Loans(3) | | | | | 9,008,561 | | | | | | 9,114,357 | | | | | | 9,046,625 | | | | | | 8,001,789 | | | | | | 4,177,525 | |
Allowance for loan losses(3) | | | | | 191,594 | | | | | | 222,821 | | | | | | 221,688 | | | | | | 112,672 | | | | | | 48,891 | |
Deposits | | | | | 10,392,854 | | | | | | 10,535,429 | | | | | | 9,891,914 | | | | | | 7,961,438 | | | | | | 3,760,868 | |
Client deposits(6) | | | | | 10,372,355 | | | | | | 9,937,060 | | | | | | 9,305,503 | | | | | | 5,985,628 | | | | | | 3,220,194 | |
Long-term debt | | | | | 379,793 | | | | | | 414,793 | | | | | | 533,023 | | | | | | 618,793 | | | | | | 386,783 | |
Equity | | | | | 1,296,752 | | | | | | 1,227,910 | | | | | | 1,235,616 | | | | | | 605,566 | | | | | | 501,972 | |
| |
Capital Ratios | | | | | | | | | | | | | | | | | | | | | | | | | | | | | | |
Total risk-based capital(2) | | | | | 14.28% | | | | | | 14.18% | | | | | | 14.69% | | | | | | 10.35% | | | | | | 14.23% | |
Tier 1 risk-based capital(2) | | | | | 12.38% | | | | | | 12.06% | | | | | | 12.32% | | | | | | 7.26% | | | | | | 11.42% | |
Tier 1 leverage ratio(2) | | | | | 11.33% | | | | | | 10.78% | | | | | | 11.17% | | | | | | 7.17% | | | | | | 10.96% | |
Tier 1 common capital(2) | | | | | 8.04% | | | | | | 7.69% | | | | | | 7.86% | | | | | | 4.54% | | | | | | 8.14% | |
Tangible equity to tangible assets | | | | | 9.64% | | | | | | 9.04% | | | | | | 9.42% | | | | | | 5.09% | | | | | | 8.23% | |
Tangible common equity to tangible assets(2)(7) | | | | | 7.69% | | | | | | 7.10% | | | | | | 7.42% | | | | | | 4.50% | | | | | | 7.39% | |
Average equity to average assets | | | | | 10.29% | | | | | | 9.93% | | | | | | 10.23% | | | | | | 7.41% | | | | | | 7.16% | |
| |
Selected Information | | | | | | | | | | | | | | | | | | | | | | | | | | | | | | |
Assets under management | | $ | | | 4,303,547 | | | $ | | | 4,271,602 | | | $ | | | 3,983,623 | | | $ | | | 3,261,061 | | | $ | | | 3,361,171 | |
Full-time equivalent employees | | | | | 1,045 | | | | | | 1,060 | | | | | | 1,040 | | | | | | 773 | | | | | | 597 | |
Banking offices | | | | | 39 | | | | | | 39 | | | | | | 38 | | | | | | 23 | | | | | | 20 | |
| |
| | (1) | Computed as total non-interest income less net securities gains (losses) and loss on early extinguishment of debt. |
| | (2) | This is a non-U.S. GAAP financial measure. Refer to Table 33 of Item 7, “Management’s Discussion and Analysis of Financial Condition and Results of Operations” of this Form 10-K for a reconciliation from non-U.S. GAAP to U.S. GAAP. |
| | (3) | Excludes covered assets. |
| | (4) | Computed as total equity less preferred stock, goodwill, and other intangibles divided by outstanding shares of common stock at end of year. |
| | (5) | Computed as non-interest expense divided by the sum of net interest income on a tax equivalent basis (assuming a federal income tax rate of 35%) and non-interest income. |
| | (6) | Total deposits net of traditional brokered deposits and non-client CDARS®. |
| | (7) | Computed as tangible common equity divided by tangible assets, where tangible common equity equals total equity less preferred stock, goodwill, and other intangible assets and tangible assets equals total assets less goodwill and other intangible assets. |
32
ITEM 7. MANAGEMENT’S DISCUSSION AND ANALYSIS OF FINANCIAL CONDITION
AND RESULTS OF OPERATIONS
INTRODUCTION
The following discussion and analysis is intended to address the significant factors affecting our Consolidated Statements of Income for the years 2009 through 2011 and Consolidated Statements of Financial Condition as of December 31, 2010 and 2011. When we use the terms “PrivateBancorp,” the “Company,” “we,” “us,” and “our,” we mean PrivateBancorp, Inc. and its consolidated subsidiaries. When we use the term “the Bank,” we are referring to our wholly owned banking subsidiary, The PrivateBank brand. The following discussion is designed to provide stockholders with a comprehensive review of our operating results and financial condition and should be read in conjunction with the consolidated financial statements, accompanying notes thereto, and other financial information presented in this Form 10-K.
Unless otherwise stated, all earnings per share data included in this section and through the remainder of this discussion are presented on a diluted basis.
OVERVIEW
We reported net income available to common stockholders of $30.7 million, or $0.43 per diluted share, an improvement from a net loss of $12.1 million, or $0.17 per diluted share in 2010.
The financial performance of the Company in 2011 reflected our focused efforts on executing our relationship-based commercial middle market strategy and improving asset quality. This is reflected in $1.4 billion in new client relationships added during the year, $534.6 million growth in our higher-yielding commercial and industrial loan portfolio (an 11% increase from the prior year, the majority of which came from new client relationships) and improved loan mix with the commercial and industrial portfolio representing 60% of total loans at year end 2011 compared to 53% at year end 2010. We also saw meaningful improvement in our asset quality metrics across the board, with nonperforming loans and assets declining 29% and 15%, respectively, from year end 2010 as a result of problem asset dispositions of $387.8 million during 2011, movement of $131.4 million of nonperforming loans to other real estate owned (“OREO”) during 2011, and moderating nonperforming loan inflows resulting from a reduction in early stage problem loans which declined by $524.4 million, or 58%, at December 31, 2011 compared to the prior year levels. With credit quality improving, the provision for loans losses, excluding covered assets, declined $61.5 million from 2010 levels and we reduced our allowance for loan losses by $31.2 million from the prior year end.
Total deposits were $10.4 billion at the end of 2011, relatively flat compared to year end 2010. Noninterest-bearing deposits, however, made up 31% of total deposits at the end of 2011, compared to 21% at the end of 2010, reflecting a 44% increase in such deposits from December 31, 2010. The increase in noninterest-bearing demand deposits is due in part to the current interest rate environment and client desires for greater liquidity.
The shift in the loan mix, improving credit quality, deposit repricing and higher demand deposits helped contribute to a net interest margin of 3.49% for 2011, up 11 basis points from 2010. During 2011, non-interest income and net revenue benefited from successful cross-selling efforts of our fee based products such as capital markets, treasury management and other credit related services to both the new and existing client base.
Although expenses continue to be impacted by higher net foreclosed property costs (due mostly to a higher volume of asset dispositions in 2011 and a 42% increase in the OREO balance at the end of 2011 compared to the prior year resulting from continued asset workout efforts) and higher compensation expense, total non-interest expenses for 2011 remained relatively flat at $302.3 million compared to the prior year reflecting management’s ongoing cost control efforts. Operating profit totaled $206.0 million, up 4% from prior year, and was favorably impacted by higher net revenue and relatively unchanged expense levels. Excluding net securities gains, operating profit increased $14.2 million, or 8%, from 2010.
Please refer to the remaining sections of “Management’s Discussion and Analysis of Financial Condition and Results of Operations” for greater discussion of the various components of our 2011 performance, statement of condition and liquidity.
RESULTS OF OPERATIONS
The profitability of our operations depends on our net interest income, provision for loan and covered loan losses, non-interest income, and non-interest expense. Net interest income is dependent on the amount of and yields earned on interest-earning assets as compared to the amount of and rates paid on interest-bearing liabilities. Net interest income is sensitive to changes in market rates of interest as well as to the execution of our asset/liability management strategy. The provision for loan and covered loan losses is primarily affected by changes in the loan portfolio’s composition and performance, the identification of nonperforming loans, management’s
33
assessment of the collectability of the loan portfolio, and loss experience, as well as economic and market factors. Non-interest income consists primarily of fee revenue from Trust and Investments, mortgage banking, capital markets products, treasury management, loan and credit-related fees, and other services charges and fees. Net securities gains/losses, if any, are also included in non-interest income.
Net Interest Income
Net interest income equals the excess of interest income (including discount accretion on covered loans) plus fees earned on interest-earning assets over interest expense incurred on interest-bearing liabilities. The level of interest rates and the volume and mix of interest-earning assets and interest-bearing liabilities impact net interest income.
Interest rate spread and net interest margin are utilized to measure and explain changes in net interest income. Interest rate spread is the difference between the yield on interest-earning assets and the rate paid for interest-bearing liabilities that fund those assets. The net interest margin is expressed as the percentage of net interest income to average interest-earning assets. The net interest margin exceeds the interest rate spread because noninterest-bearing sources of funds, principally noninterest-bearing demand deposits and stockholders’ equity, also support interest-earning assets.
The accounting policies underlying the recognition of interest income on loans, securities, and other interest-earning assets are included in Note 1 of “Notes to Consolidated Financial Statements” in Item 8 of this Form 10-K.
Our accounting and reporting policies conform to U.S. generally accepted accounting principles (“U.S. GAAP”) and general practice within the financial services industry. For purposes of this discussion, net interest income and any ratios or metrics that include net interest income as a component, such as for example, net interest margin, have been adjusted to a fully tax-equivalent basis to more appropriately compare the returns on certain tax-exempt securities to those on taxable interest-earning assets. Although we believe that these non-U.S. GAAP financial measures enhance investors’ understanding of our business and performance, these non-U.S. GAAP financial measures should not be considered an alternative to U.S. GAAP. The reconciliation of tax-equivalent net interest income is presented in the following table.
Table 1
Effect of Tax-Equivalent Adjustment
(Dollars in thousands)
| | | | | | | | | | | | | | | | | | | | |
| | | Years Ended December 31, | | | % Change | |
| | | 2011 | | | 2010 | | | 2009 | | | 2011-2010 | | | 2010-2009 | |
Net interest income (U.S. GAAP) | | $ | 407,127 | | | $
| 400,957
|
| | $ | 324,984 | | | | 1.5 | | | | 23.4 | |
Tax-equivalent adjustment | | | 2,857 | | | | 3,577 | | | | 3,612 | | | | -20.1 | | | | -1.0 | |
| | | | | | | | | | | | | | | | | | | | |
Tax-equivalent net interest income | | $ | 409,984 | | | $ | 404,534 | | | $ | 328,596 | | | | 1.3 | | | | 23.1 | |
| | | | | | | | | | | | | | | | | | | | |
Table 2 summarizes the changes in our average interest-earning assets and interest-bearing liabilities as well as the average interest rates earned and paid on these assets and liabilities, respectively, for the three years ended December 31, 2011. The table also presents the trend in net interest margin on a quarterly basis for 2011 and 2010, including the tax-equivalent yields on interest-earning assets and rates paid on interest-bearing liabilities. Table 3 below details variances in income and expense for each of the major categories of interest-earning assets and interest-bearing liabilities and indicates the extent to which such variances are attributable to volume and rate changes. Interest income and yields are presented on a tax-equivalent basis assuming a federal income tax rate of 35%, through inclusion of the tax-equivalent adjustment as presented in Table 1 above.
34
Table 2
Net Interest Income and Margin Analysis
(Dollars in thousands)
| | | | | | | | | | | | | | | | | | | | | | | | | | | | | | | | | | | | |
| | | | | | | | | | | | |
| | | 2011 | | | 2010 | | | 2009 | |
| | | Average
Balance | | | Interest (1) | | | Yield/
Rate
(%) | | | Average
Balance | | | Interest (1) | | | Yield/
Rate
(%) | | | Average
Balance | | | Interest (1) | | | Yield/
Rate
(%) | |
Assets: | | | | | | | | | | | | | | | | | | | | | | | | | | | | | | | | | | | | |
Federal funds sold and other short-term investments | | $ | 463,742 | | | $ | 1,181 | | | | 0.25 | | | $ | 733,841 | | | $ | 1,950 | | | | 0.27 | | | $ | 205,104 | | | $ | 1,112 | | | | 0.54 | |
Securities: | | | | | | | | | | | | | | | | | | | | | | | | | | | | | | | | | | | | |
Taxable | | | 1,891,173 | | | | 61,417 | | | | 3.25 | | | | 1,654,885 | | | | 64,316 | | | | 3.89 | | | | 1,293,857 | | | | 58,663 | | | | 4.53 | |
Tax-exempt(2) | | | 140,707 | | | | 8,296 | | | | 5.90 | | | | 165,535 | | | | 10,352 | | | | 6.25 | | | | 163,375 | | | | 10,719 | | | | 6.56 | |
| | | | | | | | | | | | | | | | | | | | | | | | | | | | | | | | | | | | |
Total securities | | | 2,031,880 | | | | 69,713 | | | | 3.43 | | | | 1,820,420 | | | | 74,668 | | | | 4.10 | | | | 1,457,232 | | | | 69,382 | | | | 4.76 | |
| | | | | | | | | | | | | | | | | | | | | | | | | | | | | | | | | | | | |
Loans, excluding covered assets: | | | | | | | | | | | | | | | | | | | | | | | | | | | | | | | | | | | | |
Commercial | | | 5,130,839 | | | | 240,123 | | | | 4.68 | | | | 4,442,350 | | | | 206,013 | | | | 4.64 | | | | 4,032,551 | | | | 182,390 | | | | 4.52 | |
Commercial real estate | | | 2,640,297 | | | | 112,091 | | | | 4.25 | | | | 3,080,086 | | | | 133,903 | | | | 4.35 | | | | 2,914,125 | | | | 133,544 | | | | 4.58 | |
Construction | | | 397,771 | | | | 14,937 | | | | 3.76 | | | | 620,937 | | | | 22,047 | | | | 3.55 | | | | 889,226 | | | | 30,012 | | | | 3.38 | |
Residential | | | 325,606 | | | | 14,070 | | | | 4.32 | | | | 349,494 | | | | 16,546 | | | | 4.73 | | | | 463,493 | | | | 18,170 | | | | 3.92 | |
Personal and home equity | | | 438,266 | | | | 15,751 | | | | 3.59 | | | | 508,274 | | | | 19,163 | | | | 3.77 | | | | 516,850 | | | | 19,995 | | | | 3.87 | |
| | | | | | | | | | | | | | | | | | | | | | | | | | | | | | | | | | | | |
Total loans, excluding covered assets(3) | | | 8,932,779 | | | | 396,972 | | | | 4.44 | | | | 9,001,141 | | | | 397,672 | | | | 4.42 | | | | 8,816,245 | | | | 384,111 | | | | 4.36 | |
| | | | | | | | | | | | | | | | | | | | | | | | | | | | | | | | | | | | |
Total interest-earning assets before covered assets(2) | | | 11,428,401 | | | | 467,866 | | | | 4.09 | | | | 11,555,402 | | | | 474,290 | | | | 4.10 | | | | 10,478,581 | | | | 454,605 | | | | 4.34 | |
| | | | | | | | | | | | | | | | | | | | | | | | | | | | | | | | | | | | |
Covered assets(4) | | | 317,631 | | | | 16,137 | | | | 5.08 | | | | 422,962 | | | | 37,212 | | | | 8.80 | | | | 261,538 | | | | 27,719 | | | | 10.60 | |
| | | | | | | | | | | | | | | | | | | | | | | | | | | | | | | | | | | | |
Total interest-earning assets(2) | | | 11,746,032 | | | $ | 484,003 | | | | 4.12 | | | | 11,978,364 | | | $ | 511,502 | | | | 4.27 | | | | 10,740,119 | | | $ | 482,324 | | | | 4.49 | |
| | | | | | | | | | | | | | | | | | | | | | | | | | | | | | | | | | | | |
Cash and due from banks | | | 158,655 | | | | | | | | | | | | 152,346 | | | | | | | | | | | | 161,513 | | | | | | | | | |
Allowance for loan and covered loan losses | | | (237,038) | | | | | | | | | | | | (244,484) | | | | | | | | | | | | (145,187) | | | | | | | | | |
Other assets | | | 685,475 | | | | | | | | | | | | 669,219 | | | | | | | | | | | | 463,579 | | | | | | | | | |
| | | | | | | | | | | | | | | | | | | | | | | | | | | | | | | | | | | | |
Total assets | | $ | 12,353,124 | | | | | | | | | | | $ | 12,555,445 | | | | | | | | | | | $ | 11,220,024 | | | | | | | | | |
| | | | | | | | | | | | | | | | | | | | | | | | | | | | | | | | | | | | |
Liabilities and Equity: | | | | | | | | | | | | | | | | | | | | | | | | | | | | | | | | | | | | |
Interest-bearing demand deposits | | $ | 587,453 | | | $ | 2,439 | | | | 0.42 | | | $ | 699,598 | | | $ | 3,148 | | | | 0.45 | | | $ | 492,466 | | | $ | 2,646 | | | | 0.54 | |
Savings deposits | | | 205,814 | | | | 786 | | | | 0.38 | | | | 170,268 | | | | 948 | | | | 0.56 | | | | 76,785 | | | | 598 | | | | 0.78 | |
Money market accounts | | | 4,413,971 | | | | 22,171 | | | | 0.50 | | | | 4,690,019 | | | | 33,483 | | | | 0.71 | | | | 3,391,521 | | | | 29,037 | | | | 0.86 | |
Time deposits | | | 1,354,246 | | | | 16,947 | | | | 1.25 | | | | 1,499,713 | | | | 22,387 | | | | 1.49 | | | | 1,657,781 | | | | 35,397 | | | | 2.14 | |
Brokered deposits | | | 1,210,424 | | | | 7,729 | | | | 0.64 | | | | 1,341,254 | | | | 14,071 | | | | 1.05 | | | | 1,820,613 | | | | 43,938 | | | | 2.41 | |
| | | | | | | | | | | | | | | | | | | | | | | | | | | | | | | | | | | | |
Total interest-bearing deposits | | | 7,771,908 | | | | 50,072 | | | | 0.64 | | | | 8,400,852 | | | | 74,037 | | | | 0.88 | | | | 7,439,166 | | | | 111,616 | | | | 1.50 | |
Short-term borrowings | | | 74,918 | | | | 2,011 | | | | 2.68 | | | | 180,439 | | | | 5,088 | | | | 2.82 | | | | 673,071 | | | | 8,094 | | | | 1.20 | |
Long-term debt | | | 401,779 | | | | 21,936 | | | | 5.46 | | | | 476,400 | | | | 27,843 | | | | 5.84 | | | | 611,866 | | | | 34,018 | | | | 5.56 | |
| | | | | | | | | | | | | | | | | | | | | | | | | | | | | | | | | | | | |
Total interest-bearing liabilities | | | 8,248,605 | | | | 74,019 | | | | 0.90 | | | | 9,057,691 | | | | 106,968 | | | | 1.18 | | | | 8,724,103 | | | | 153,728 | | | | 1.76 | |
| | | | | | | | | | | | | | | | | | | | | | | | | | | | | | | | | | | | |
Noninterest-bearing demand deposits | | | 2,669,924 | | | | | | | | | | | | 2,083,874 | | | | | | | | | | | | 1,236,053 | | | | | | | | | |
Other liabilities | | | 163,756 | | | | | | | | | | | | 166,742 | | | | | | | | | | | | 111,826 | | | | | | | | | |
Equity | | | 1,270,839 | | | | | | | | | | | | 1,247,138 | | | | | | | | | | | | 1,148,042 | | | | | | | | | |
| | | | | | | | | | | | | | | | | | | | | | | | | | | | | | | | | | | | |
Total liabilities and equity | | $ | 12,353,124 | | | | | | | | | | | $ | 12,555,445 | | | | | | | | | | | $ | 11,220,024 | | | | | | | | | |
| | | | | | | | | | | | | | | | | | | | | | | | | | | | | | | | | | | | |
Net interest spread | | | | | | | | | | | 3.22 | | | | | | | | | | | | 3.09 | | | | | | | | | | | | 2.73 | |
Effect of noninterest-bearing funds | | | | | | | | | | | 0.27 | | | | | | | | | | | | 0.29 | | | | | | | | | | | | 0.33 | |
| | | | | | | | | | | | | | | | | | | | | | | | | | | | | | | | | | | | |
Net interest income/margin(2) | | | | | | $ | 409,984 | | | | 3.49 | | | | | | | $ | 404,534 | | | | 3.38 | | | | | | | $ | 328,596 | | | | 3.06 | |
| | | | | | | | | | | | | | | | | | | | | | | | | | | | | | | | | | | | |
|
| |
35
Quarterly Net Interest Margin Trend
| | | | | | | | | | | | | | | | | | | | | | | | | | | | | | | | |
| | | 2011 | | | 2010 | |
| | | Fourth | | | Third | | | Second | | | First | | | Fourth | | | Third | | | Second | | | First | |
| | | | | | | | |
Yield on interest-earning assets(2) | | | 4.04% | | | | 4.11% | | | | 4.01% | | | | 4.15% | | | | 4.08% | | | | 4.13% | | | | 4.32% | | | | 4.37% | |
| | | | | | | | |
Yield on interest-earning assets, before covered assets(2) | | | 4.05% | | | | 4.08% | | | | 3.98% | | | | 4.09% | | | | 4.03% | | | | 4.10% | | | | 4.02% | | | | 4.10% | |
| | | | | | | | |
Cost of interest-bearing liabilities | | | 0.85% | | | | 0.90% | | | | 0.90% | | | | 0.93% | | | | 1.01% | | | | 1.14% | | | | 1.21% | | | | 1.34% | |
| | | | | | | | |
Net interest margin(2) | | | 3.48% | | | | 3.49% | | | | 3.36% | | | | 3.46% | | | | 3.33% | | | | 3.28% | | | | 3.39% | | | | 3.33% | |
| | | | | | | | |
Covered asset accretion contribution to net interest margin | | | -% | | | | 0.03% | | | | 0.03% | | | | 0.05% | | | | 0.05% | | | | 0.03% | | | | 0.28% | | | | 0.25% | |
| | | | | | | | |
Net interest margin, excluding impact of covered asset accretion(2) | | | 3.48% | | | | 3.46% | | | | 3.33% | | | | 3.41% | | | | 3.28% | | | | 3.25% | | | | 3.11% | | | | 3.08% | |
|
| |
| | (1) | Interest income included $24.4 million, $21.3 million, and $17.9 million in loan fees for the years ended December 31, 2011, 2010, and 2009, respectively. |
| | (2) | Interest income and yields are presented on a tax-equivalent basis, assuming a federal income tax rate of 35%. See Table 1 for a reconciliation of the effect of the tax-equivalent adjustment. |
| | (3) | Average loans on a nonaccrual basis for the recognition of interest income totaled $340.7 million for 2011, $400.1 million for 2010, and $246.5 million for 2009 and are included in loans for purposes of this analysis. Interest foregone on impaired loans was estimated to be approximately $14.4 million for the year ended December 31, 2011, $17.2 million for 2010 and $10.7 million for 2009, and was based on the average loan portfolio yield for the respective period. |
| | (4) | Covered interest-earning assets consist of loans acquired through a Federal Deposit Insurance Corporation (“FDIC”) assisted transaction that are subject to a loss share agreement and the related indemnification asset. Refer to the section entitled “Covered Assets” for a detailed discussion. |
36
Table 3
Changes in Net Interest Income Applicable to Volumes and Interest Rates(1)
(Amounts in thousands)
| | | | | | | | | | | | | | | | | | | | | | | | | | |
| | | 2011 compared to 2010 | | | | | 2010 compared to 2009 | |
| | | Volume | | | Rate | | | Total | | | | | Volume | | | Rate | | | Total | |
Federal funds sold and other short-term investments | | $ | (691) | | | $ | (78) | | | $ | (769) | | | | | $ | 1,646 | | | $ | (808) | | | $ | 838 | |
Securities: | | | | | | | | | | | | | | | | | | | | | | | | | | |
Taxable | | | 8,482 | | | | (11,381) | | | | (2,899) | | | | | | 14,823 | | | | (9,170) | | | | 5,653 | |
Tax-exempt(2) | | | (1,489) | | | | (567) | | | | (2,056) | | | | | | 140 | | | | (507) | | | | (367) | |
| | | | | | | | | | | | | | | | | | | | | | | | | | |
Total securities | | | 6,993 | | | | (11,948) | | | | (4,955) | | | | | | 14,963 | | | | (9,677) | | | | 5,286 | |
| | | | | | | | | | | | | | | | | | | | | | | | | | |
Loans, excluding covered assets: | | | | | | | | | | | | | | | | | | | | | | | | | | |
Commercial | | | 32,205 | | | | 1,905 | | | | 34,110 | | | | | | 18,910 | | | | 4,713 | | | | 23,623 | |
Commercial real estate | | | (18,734) | | | | (3,078) | | | | (21,812) | | | | | | 7,400 | | | | (7,041) | | | | 359 | |
Construction | | | (8,317) | | | | 1,207 | | | | (7,110) | | | | | | (9,457) | | | | 1,492 | | | | (7,965) | |
Residential | | | (1,088) | | | | (1,388) | | | | (2,476) | | | | | | (4,972) | | | | 3,348 | | | | (1,624) | |
Personal and home equity | | | (2,547) | | | | (865) | | | | (3,412) | | | | | | (328) | | | | (504) | | | | (832) | |
| | | | | | | | | | | | | | | | | | | | | | | | | | |
Total loans, excluding covered assets | | | 1,519 | | | | (2,219) | | | | (700) | | | | | | 11,553 | | | | 2,008 | | | | 13,561 | |
| | | | | | | | | | | | | | | | | | | | | | | | | | |
Total interest-earning assets before covered assets(2) | | | 7,821 | | | | (14,245) | | | | (6,424) | | | | | | 28,162 | | | | (8,477) | | | | 19,685 | |
| | | | | | | | | | | | | | | | | | | | | | | | | | |
Covered assets(3) | | | (7,815) | | | | (13,260) | | | | (21,075) | | | | | | 14,829 | | | | (5,336) | | | | 9,493 | |
| | | | | | | | | | | | | | | | | | | | | | | | | | |
Total interest-earning assets(2) | | | 6 | | | | (27,505) | | | | (27,499) | | | | | | 42,991 | | | | (13,813) | | | | 29,178 | |
| | | | | | | | | | | | | | | | | | | | | | | | | | |
Interest-bearing demand deposits | | | (479) | | | | (230) | | | | (709) | | | | | | 982 | | | | (480) | | | | 502 | |
Savings deposits | | | 173 | | | | (335) | | | | (162) | | | | | | 559 | | | | (209) | | | | 350 | |
Money market accounts | | | (1,874) | | | | (9,438) | | | | (11,312) | | | | | | 9,829 | | | | (5,383) | | | | 4,446 | |
Time deposits | | | (2,039) | | | | (3,401) | | | | (5,440) | | | | | | (3,131) | | | | (9,879) | | | | (13,010) | |
Brokered deposits | | | (1,265) | | | | (5,077) | | | | (6,342) | | | | | | (9,490) | | | | (20,377) | | | | (29,867) | |
| | | | | | | | | | | | | | | | | | | | | | | | | | |
Total interest-bearing deposits | | | (5,484) | | | | (18,481) | | | | (23,965) | | | | | | (1,251) | | | | (36,328) | | | | (37,579) | |
Short-term borrowings | | | (2,843) | | | | (234) | | | | (3,077) | | | | | | (8,732) | | | | 5,726 | | | | (3,006) | |
Long-term debt | | | (4,159) | | | | (1,748) | | | | (5,907) | | | | | | (7,845) | | | | 1,670 | | | | (6,175) | |
| | | | | | | | | | | | | | | | | | | | | | | | | | |
Total interest-bearing liabilities | | | (12,486) | | | | (20,463) | | | | (32,949) | | | | | | (17,828) | | | | (28,932) | | | | (46,760) | |
| | | | | | | | | | | | | | | | | | | | | | | | | | |
Net interest income(2) | | $ | 12,492 | | | $ | (7,042) | | | $ | 5,450 | | | | | $ | 60,819 | | | $ | 15,119 | | | $ | 75,938 | |
| | | | | | | | | | | | | | | | | | | | | | | | | | |
| | (1) | For purposes of this table, changes which are not due solely to volume changes or rate changes are allocated to such categories in proportion to the absolute amounts of the change in each. |
| | (2) | Interest income is presented on a tax-equivalent basis, assuming a federal income tax rate of 35%. See Table 1 for a reconciliation of the effect of the tax-equivalent adjustment. |
| | (3) | Covered interest-earning assets consist of loans acquired through an FDIC-assisted transaction that are subject to a loss share agreement and the related indemnification asset. Refer to the section entitled “Covered Assets” for a detail discussion. |
2011 Compared to 2010
For 2011, net interest margin was 3.49%, an increase of 11 basis points from 3.38% for 2010. The improvement results from a 24 basis point decrease in the average rate paid on interest-bearing deposits and an increase in noninterest-bearing deposits, offset partially by a decrease in the yield on the investment portfolio as discussed below. Also, the shift in the mix of the loan portfolio toward higher-yielding commercial loans and some large non-recurring loan fees increased the average interest rate earned on loans by two basis points. Along with the shift in the mix of the loan portfolio to higher-yielding commercial loans, the level of average nonperforming loans year-over-year was reduced by $59.3 million, mitigating any pricing compression seen within the commercial loan portfolio as well as the $21.1 million reduction in interest income on covered assets from the prior year. The lower interest rate environment negatively impacted the yield on the investment portfolio, resulting in a year-over-year reduction in interest income on a tax-equivalent basis of $5.0 million, despite the $211.5 million increase in the average balance of total securities.
We do not anticipate significant continued benefit to net interest margin in future periods from downward repricing of deposits. Heightened competition, in the face of limited middle market loan demand, could also pressure loan pricing and loan growth in the near term, although year to date we have been successful in maintaining overall yield on our commercial loan portfolio. This reflects
37
higher lending yields in specialized areas that we have pursued, lower levels of nonperforming loans, and some large nonrecurring loans fees. The reshaping of our loan mix, increases in short-term interest rates, and further reduction in nonperforming loans may help to mitigate the impact of loan pricing compression on net interest margin in future periods.
In 2011, we initiated the use of interest rate derivatives as part of our asset liability management strategy to hedge interest rate risk in our primarily floating-rate loan portfolio and, depending on market conditions, including the slope of the yield curve, we intend to enter into additional interest rate swaps. A description and analysis of our market risk and interest rate sensitivity profile and management policies is included in Item 7A, “Quantitative and Qualitative Disclosures About Market Risk,” of this Form 10-K.
2010 Compared to 2009
For 2010, net interest margin was 3.38%, an increase of 32 basis points from 3.06% in 2009. A higher volume of interest-earning assets positively impacted interest income by $43.0 million, while a decline in the average rate earned on covered assets and securities had a negative impact of $13.8 million. Despite an increase of $177.0 million on average nonaccrual loans from 2009 to 2010, the yield on loans, excluding covered assets, improved six basis points from 2009. The increase in loan yields reflects a change in loan mix more heavily weighted to higher-yielding commercial loans than lower-yielding commercial real estate loans. Lower short-term interest rates and deposit repricing initiatives decreased interest expense by $36.3 million, offset in part by higher interest rates paid on borrowings. While total average interest-bearing liabilities increased during 2010, a favorable shift in the mix lowered the amount of higher cost funding and led to a $17.8 million reduction in interest expense due to volume. Increases in net interest margin and interest income for 2010 include the benefit of a full year of higher interest earning covered assets from the mid-2009 FDIC-assisted acquisition. Covered asset accretion positively impacted net interest margin by 15 and 13 basis points for the years ended December 31, 2010 and 2009, respectively.
Provision for loan losses
The provision for loan losses, excluding the provision for covered loans, totaled $130.6 million in 2011, compared to $192.0 million in 2010 and $198.9 million in 2009. The provision for loan losses is a function of our allowance for loan loss methodology used to determine the appropriate level of the allowance for inherent loan losses after net charge-offs have been deducted. Net charge-offs were $161.8 million in 2011, compared to $190.9 million in 2010 and $89.9 million in 2009. For further analysis and information on how we determine the appropriate level for the allowance for loan losses and analysis of credit quality, see “Critical Accounting Policies” and “Credit Quality Management and Allowance for Loan Losses.”
Provision for covered loan losses
For 2011, we recognized $2.3 million in provision for covered loan losses related to the loans purchased under the FDIC-assisted transaction loss share agreement, compared to $2.5 million in 2010 and $553,000 in 2009. The provision for covered loan losses represents the 20% portion of expected losses on covered loans not reimbursed by the FDIC. For information regarding the FDIC-assisted transaction, see “Management’s Discussion and Analysis of Financial Condition and Results of Operations – Covered Assets.”
38
Non-interest Income
Non-interest income is derived from a number of sources related to our banking activities, including loan and credit-related fees, the sale of derivative products to clients through our capital markets group, treasury management services, and fees from our Trust and Investments business. The following table presents a break-out of these multiple sources of revenue for the years ended December 31, 2011, 2010 and 2009.
Table 4
Non-interest Income Analysis
(Dollars in thousands)
| | | | | | | | | | | | | | | | | | | | |
| | | Years ended December 31, | | | % Change | |
| | | 2011 | | | 2010 | | | 2009 | | | 2011-2010 | | | 2010-2009 | |
Trust and Investments | | $ | 17,826 | | | $ | 18,140 | | | $ | 15,459 | | | | -1.7 | | | | 17.3 | |
Mortgage banking | | | 6,703 | | | | 10,187 | | | | 8,930 | | | | -34.2 | | | | 14.1 | |
Capital markets products | | | 19,341 | | | | 14,286 | | | | 17,150 | | | | 35.4 | | | | -16.7 | |
Treasury management | | | 19,923 | | | | 16,920 | | | | 10,148 | | | | 17.7 | | | | 66.7 | |
Loan and credit-related fees | | | 22,207 | | | | 16,526 | | | | 12,888 | | | | 34.4 | | | | 28.2 | |
Other income, service charges, and fees | | | 6,476 | | | | 5,005 | | | | 499 | | | | 29.4 | | | | n/m | |
| | | | | | | | | | | | | | | | | | | | |
Subtotal fee revenue | | | 92,476 | | | | 81,064 | | | | 65,074 | | | | 14.1 | | | | 24.6 | |
Net securities gains | | | 5,771 | | | | 12,182 | | | | 7,381 | | | | -52.6 | | | | 65.0 | |
Early extinguishment of debt | | | - | | | | - | | | | (985) | | | | - | | | | n/m | |
| | | | | | | | | | | | | | | | | | | | |
Total non-interest income | | $ | 98,247 | | | $ | 93,246 | | | $ | 71,470 | | | | 5.4 | | | | 30.5 | |
| | | | | | | | | | | | | | | | | | | | |
n/m Not meaningful
2011 Compared to 2010
Non-interest income for 2011 was $98.2 million, an increase of $5.0 million, or 5%, compared to the prior year period, with all major categories, excluding mortgage banking and Trust and Investments, contributing to the year-over-year growth. Excluding securities gains, non-interest income increased by $11.4 million or 14% to $92.5 million for 2011, compared to $81.1 million for 2010.
Trust and Investments fee revenue declined slightly, by 2%, from 2010 levels. During 2011, we gained momentum in carrying out our strategic initiative to retool and enhance our wealth management business and services through the addition and expansion of new and existing clients. However, Trust and Investments fee revenue for 2011 was impacted by certain nonrecurring larger estate fees recognized in the prior year period, lower retail tax preparation fees, lower fees from our land trust business, which was sold in early 2011 and some client attrition. Also, due to the implementation of a new strategic approach to servicing our client’s investment portfolios which creates a greater reliance on pooled investment vehicles, such as mutual funds and ETFs, and a reduction in using third party account managers, fees were negatively impacted with a commensurate reduction to investment expenses. In addition, Trust and Investment fee revenue is largely dependent on the composition and valuation of assets under management and administration (“AUMA”), and for 2011, there were lower comparative values of AUMA on the date of fee measurement as compared to the prior year. For approximately 89% of the AUMA portfolio whose fees are generated off the value of the assets as of December 31, 2011, the billing date is the last date of the preceding quarter or month creating fluctuations in the fees recognized during the period which may differ from fluctuations in period-end AUMA. AUMA includes assets held in trusts where we serve as trustee, accounts where we make investment decisions on behalf of clients, and non-managed assets we hold in custody for clients or for which we receive fees for advisory or brokerage services. Excluding $299.1 million in deposits included in AUMA, we do not include these assets on our Consolidated Statements of Financial Condition.
Revenue from our mortgage banking business was lower by $3.5 million, or 34%, from 2010, as the prior year experienced an extended period of lower mortgage interest rates and higher refinancing activity as compared to the current year. Unlike the prior year, in 2011, significant refinancing application volume did not begin until the drop in interest rates in August. Application volume remained strong until the end of 2011, and as such, we anticipate this positive trend will continue through the first quarter of 2012.
Capital markets products income increased $5.1 million from 2010 and included a $719,000 negative credit valuation adjustment (“CVA”) compared to a negative CVA of $1.6 million for 2010. The CVA represents the credit component of fair value with regard to both client-based derivatives and the related matched derivatives with interbank dealer counterparties. Exclusive of CVA, capital markets income increased to $20.1 million in 2011 compared to $15.9 million in 2010, and was primarily attributable to increased
39
client interest rate swap fees resulting from both loan originations and renewals, larger margin transactions in the current year, and higher foreign exchange revenue from increased transactions as part of our clients’ ongoing business activities, a small number of large transactions and increased volatility in foreign exchange markets. Approximately 32% of the increase in capital markets revenues came from an increased penetration of our client base. There can be no assurances such increased penetration will continue.
Our treasury management group offers a full range of receivables and payables services in addition to online banking and reporting. These products and services include remote capture, liquidity management and lockbox services which are often linked to non-interest and interest-bearing deposits. Treasury management income increased $3.0 million, or 18%, from 2010. Revenue growth is closely correlated with acquisition of new middle market lending clients with loan growth, though subject to a three to six month lag of implementation. The current year increase reflects ongoing success in cross-selling treasury management services to new and existing commercial clients as well as the full year impact of new clients added during 2010. In addition, during 2011, our earnings credit rate (the rate applied to balances maintained in the client’s deposit account to offset activity charges) remained in-line with market and deposit interest rates, declining slightly during the year and providing a small contribution to the overall increase in fees.
Loan and credit related fees include income generated from letters of credit, unused commitments, loan syndications and various non-yield loan fees. Loan and credit related fees increased $5.7 million, or 34%, from the prior year and is principally due to a higher volume of syndication revenue driven by increased lead agency credits as we leveraged our reputation for execution and expended distribution network. Letter of credit and unused commitment fees were also higher in the current year.
Certain fee revenue is earned contemporaneously with or shortly after successfully generating new client relationships and related loans. However, we also expect additional fee revenue from those new clients over time as we penetrate deeper within those relationships and execute upon our cross-sell strategy. Given the more than $1.4 billion in new client relationships during 2011, as well as the mix of our loan portfolio being predominately commercial (60% of our total loans as of December 31, 2011 were commercial), which we believe provides the most cross-sell opportunity, we may see additional fee revenues from these new clients in the future.
Other income, service charges, and fees increased $1.5 million, or 29%, from 2010. The increase was primarily due to $938,000 in gains on various asset dispositions in 2011, including the sale of our land trust business earlier in the year, as well as $564,000 in losses in the prior year on loans held for sale.
Net securities gains totaled $5.8 million for 2011, compared to $12.2 million for the prior year. During 2011, we sold $290.1 million of securities, which included $188.8 million of collateralized mortgage obligations, $66.0 million of residential mortgage-backed securities, $15.8 million in U.S. Agencies, and $19.5 million of state and municipal securities. The sales assisted in managing prepayment risk and provided a measure of benefit to our capital position. We frequently evaluate our securities and from time to time may take advantage of what we perceive to be pricing opportunities in the market for specific investments.
2010 Compared to 2009
Total non-interest income for the year ended December 31, 2010 was $93.2 million, an increase of $21.8 million, or 30%, from $71.5 million in 2009, reflecting continued success in penetrating and cross-selling targeted middle market commercial relationships. Our total fee revenue for 2010 was $81.1 million, an increase of $16.0 million, or 25%, from $65.1 million in 2009.
Treasury management income increased $6.8 million, or 67%, from 2009. This increase was attributable to improved capabilities in offering a broader suite of products and services to new and existing clients and increasing penetration in our clients’ transaction-based activities.
Trust and Investments income increased $2.7 million, or 17%, from 2009 and was attributable to increases in the value of AUMA, in part due to improved equity and fixed income market performance. Total AUMA totaled $4.0 billion, increasing by $288.0 million, or 7%, from December 31, 2009 to $4.3 billion at December 31, 2010.
Mortgage banking income increased $1.3 million, or 14%, from 2009, reflecting the broader industry trend of increased refinancing based on the low interest rate environment that prevailed during 2010.
Capital markets income decreased $2.9 million, or 17%, from 2009. Of the $2.9 million decrease, $2.4 million represents changes in the credit valuation adjustment, with an $838,000 positive CVA in 2009 and a negative $1.6 million CVA in 2010. Exclusive of CVA adjustments, capital markets income decreased 3% year-over-year, reflecting the reduced client demand for interest-rate derivatives, offset by a $1.9 million increase in foreign exchange revenues, resulting from our implementation of enhanced client interface tools to improve our foreign exchange product offering.
40
Loan and credit related fees increased $3.6 million, or 28%, from the prior year principally due to new commercial loan originations and increased cross-sell penetration which drove a $2.9 million of growth in unused commitment, loan, and letter of credit fees from the prior year.
Other income, service charges, and fees totaled $5.0 million for 2010, compared to $499,000 for 2009. The increase was primarily due to a $3.6 million decrease in losses on loans held for sale from the prior year, which totaled $564,000 in 2010 and $4.2 million in 2009.
Net securities gains increased $4.8 million, or 65%, from 2009. During the year ended December 31, 2010, we took advantage of market conditions to sell $432.9 million of securities, resulting in a net gain of $12.2 million. In contrast, during the year ended December 31, 2009, we sold $265.8 million of securities, resulting in a net gain of $7.4 million.
Non-interest Expense
Table 5
Non-interest Expense Analysis
(Dollars in thousands)
| | | | | | | | | | | | | | | | | | | | |
| | | Years ended December 31, | | | % Change | |
| | | 2011 | | | 2010 | | | 2009 | | | 2011-2010 | | | 2010-2009 | |
Compensation expense: | | | | | | | | | | | | | | | | | | | | |
Salaries and wages | | $ | 94,514 | | | $ | 91,511 | | | $ | 73,533 | | | | 3.3 | | | | 24.4 | |
Share-based costs | | | 15,756 | | | | 17,102 | | | | 20,696 | | | | -7.9 | | | | -17.4 | |
Incentive compensation, retirement costs and other employee benefits | | | 46,493 | | | | 41,250 | | | | 29,424 | | | | 12.7 | | | | 40.2 | |
| | | | | | | | | | | | | | | | | | | | |
Total compensation expense | | | 156,763 | | | | 149,863 | | | | 123,653 | | | | 4.6 | | | | 21.2 | |
Net occupancy expense | | | 29,986 | | | | 29,935 | | | | 26,170 | | | | 0.2 | | | | 14.4 | |
Technology and related costs | | | 11,388 | | | | 10,224 | | | | 10,599 | | | | 11.4 | | | | -3.5 | |
Marketing | | | 8,911 | | | | 8,501 | | | | 9,843 | | | | 4.8 | | | | -13.6 | |
Professional services | | | 9,206 | | | | 12,931 | | | | 16,327 | | | | -28.8 | | | | -20.8 | |
Outsourced servicing costs | | | 8,001 | | | | 7,807 | | | | 4,319 | | | | 2.5 | | | | 80.8 | |
Net foreclosed property expense | | | 27,782 | | | | 15,192 | | | | 5,675 | | | | 82.9 | | | | 167.7 | |
Postage, telephone, and delivery | | | 3,716 | | | | 3,659 | | | | 3,060 | | | | 1.6 | | | | 19.6 | |
Insurance | | | 21,287 | | | | 26,534 | | | | 22,607 | | | | -19.8 | | | | 17.4 | |
Loan and collection | | | 13,571 | | | | 14,623 | | | | 9,617 | | | | -7.2 | | | | 52.1 | |
Other expenses | | | 11,666 | | | | 20,329 | | | | 15,545 | | | | -42.6 | | | | 30.8 | |
| | | | | | | | | | | | | | | | | | | | |
Total non-interest expense | | $ | 302,277 | | | $ | 299,598 | | | $ | 247,415 | | | | 0.9 | | | | 21.1 | |
| | | | | | | | | | | | | | | | | | | | |
| | | | | |
Full-time equivalent (“FTE”) employees | | | 1,045 | | | | 1,060 | | | | 1,040 | | | | -1.4 | | | | 1.9 | |
| | | | |
Operating efficiency ratios: | | | | | | | | | | | | | | | | |
Non-interest expense to average assets | | | 2.45% | | | | 2.39% | | | | 2.21% | | | | | | | | | |
Net overhead ratio(1) | | | 1.65% | | | | 1.64% | | | | 1.57% | | | | | | | | | |
Efficiency ratio(2) | | | 59.48% | | | | 60.19% | | | | 61.84% | | | | | | | | | |
| | (1) | | Computed as non-interest expense, less non-interest income, divided by average total assets. |
| | (2) | | Computed as non-interest expense divided by the sum of net interest income on a tax equivalent basis and non-interest income. The efficiency ratio is presented on a tax-equivalent basis, assuming a federal income tax rate of 35%. See Table 33, “Non-U.S. GAAP Financial Measures,” for a reconciliation of the effect of the tax-equivalent adjustment. |
2011 Compared to 2010
Non-interest expense totaled $302.3 million for 2011, increasing modestly by $2.7 million, or 1%, from $299.6 million in 2010. Despite continued elevated credit costs, expenses remained relatively flat year-over-year, reflecting ongoing cost control management.
41
Compensation expense increased overall by $6.9 million, or 5%, from 2010. Salary and wages were up 3% largely due to annual merit, promotional and market adjustments, slightly offset by a small decline in the number of employees, as well as lower deferred salary costs related to origination expenses on a comparative basis. Share-based payment costs were down $1.3 million primarily due to a higher level of forfeiture-related expense reversals on departed and retiring plan participants during 2011. Incentive compensation, retirement costs and other employee benefits were up by $5.2 million compared to 2010, reflecting higher incentive compensation expense in conjunction with the improved financial results of the Company. This increase was partially offset by the favorable impact on current year incentive compensation expense and accruals of the implementation of a new plan feature requiring a portion of the current year bonus for certain employees to be deferred over a future defined service period.
Technology and related costs increased $1.2 million, or 11%, from 2010 due to various systems upgrades occurring during 2011 including our items processing platform and our data network.
Professional services expense, which includes fees paid for legal, accounting, and consulting services, decreased $3.7 million, or 29%, from 2010. The decrease is primarily due to higher prior year costs relating to risk management consultants, system conversion fees in connection with the integration of the FDIC-assisted acquisition of the former Founders Bank, and audit fees.
Net foreclosed property expense, which includes write-downs on foreclosed properties, gains and losses on sales of foreclosed properties, taxes, and other expenses associated with the maintenance of OREO, increased $12.6 million, or 83%, from 2010. The increase in net foreclosed property expenses is primarily due to higher net losses on the sale of OREO resulting from the accelerated pace of sales, as well as the $37.0 million increase in OREO balances during 2011 due to the rate of nonperforming loan workouts surpassing asset dispositions and higher valuation write-downs resulting from updated appraisals during 2011 as compared to 2010. In 2011, we incurred $9.1 million in net losses on sale of OREO compared to $1.4 million in 2010. Also, OREO write-downs totaled $15.4 million for 2011 compared to $6.6 million for the prior year. While the balance of nonperforming loans has steadily decreased throughout 2011, they were $259.9 million at year end. As a result of this and current OREO balances, we expect net foreclosed property expense to remain at elevated levels as we actively resolve problem loans and liquidate OREO. In evaluating to sell OREO, we seek to maximize our ultimate net recovery. The timing of dispositions will depend on a number of factors, including the pace and timing of the overall recovery of the economy, activity and pricing levels in the real estate market and real estate inventory coming onto the market for sale.
Insurance expense decreased $5.2 million, or 20%, from 2010, primarily due to lower deposit insurance assessments as a result of the change in FDIC insurance assessment methodology. In February 2011, the FDIC adopted final rules amending the deposit insurance assessment regulations, modifying, among other provisions, the assessment base from one based on domestic deposits to one based on total assets less average tangible equity. The final rules took effect April 1, 2011, impacting assessments beginning in the second quarter 2011.
Loan and collection expense, which consists of certain non-reimbursable costs associated with performing loan activities and loan remediation costs of problem and nonperforming loans, decreased $1.1 million, or 7%, from 2010 largely due to a lower level of performing loan costs largely attributable to reduced refinance volumes on a comparative basis. Overall levels remain elevated given the magnitude of problem asset remediation expense.
Other expenses decreased $8.7 million, or 43%, from the prior year. Other expenses include various categories such as bank charges, costs associated with the CDARS® product offering, education-related costs, subscriptions, provisions for unfunded commitments and miscellaneous losses and expenses. The decrease was primarily due to an $842,000 reduction of the reserve for unfunded commitments in 2011, compared to a provision for unfunded commitments of $6.7 million recorded in 2010, as the clients’ average credit quality has improved, while at the same time the level of propensity to fund was also lower in the current economic environment. In addition, decreased volume and rates reduced CDARS® servicing fees by $643,000 from the prior year.
2010 Compared to 2009
Non-interest expense increased $52.2 million, or 21%, from 2009. The increase was primarily due to higher compensation expense, an increase in net foreclosed property and loan and collection expenses related to credit deterioration, and a higher provision for unfunded commitments as compared to the prior year.
Compensation expense increased $26.2 million, or 21%, from 2009 and is largely attributable to higher annual incentive compensation, a higher level of average FTEs as a result of the FDIC-assisted transaction in mid-2009, and increases in commission-based compensation. Incentive compensation expense was higher in 2010, as the prior year did not include any significant level of bonus expense due to the loss from continuing operations reported in 2009.
42
Net occupancy expense increased $3.8 million, or 14%, from 2009. The increase in net occupancy expense from the prior year reflects $920,000 in additional facility rental expense, $1.4 million in increased depreciation expense, and $802,000 in increased maintenance contract expense related to additional offices acquired in the FDIC-assisted transaction, as well as our increased office space.
Professional services, which includes fees paid for legal, accounting, and consulting services, decreased $3.4 million, or 21%, from 2009. The decrease from the prior year relates in part to non-recurring expenses incurred in 2009 in connection with the FDIC-assisted transaction and subsequent integration activities.
Net foreclosed property expense, which includes write-downs on foreclosed properties, gains and losses on sales of foreclosed properties, and other expenses associated with the foreclosure process and maintenance of OREO, increased $9.5 million from 2009. The increase in net foreclosed property expense is primarily due to maintenance and administration associated with a higher volume of OREO properties, coupled with higher valuation write-downs in 2010 as compared to the prior year.
Insurance expense increased $3.9 million, or 17%, from 2009. Excluding the $5.1 million FDIC special assessment in 2009, deposit insurance premiums increased 51% in 2010 due to the combined effect of a higher deposit base upon which fees are assessed, higher fee rates, and the additional 10 basis point assessment paid on covered transaction accounts exceeding $250,000 under the Transaction Account Guarantee Program.
Loan and collection expense increased $5.0 million, or 52%, from 2009 due to a higher volume of appraisals and legal costs incurred in connection with credit remediation efforts on our nonperforming loans.
Other expenses increased $4.8 million, or 31%, from 2009. The increase was attributable to a $6.1 million increase in the provision for unfunded commitments offset by a $1.2 million decrease in restructuring charges primarily relating to 2009.
Income Taxes
Our provision for income taxes includes both federal and state income tax expense. An analysis of the provision for income taxes and the effective income tax rates for the periods 2009 through 2011 are presented in the following table.
Table 6
Income Tax Provision Analysis
(Dollars in thousands)
| | | | | | | | | | | | |
| | | Years ended December 31, | |
| | | 2011 | | | 2010 | | | 2009 | |
Income (loss) before income tax provision | | $ | 70,200 | | | $ | 64 | | | $ | (50,380) | |
Income tax expense (benefit) | | $ | 25,660 | | | $ | (1,737) | | | $ | (20,564) | |
Effective income tax (benefit) rate | | | 36.6% | | | | n/m | | | | -40.8% | |
Generally, our effective income tax rate varies from the statutory federal income tax rate of 35% (federal income tax benefit rate for 2009) principally due to state income taxes, the effects of tax-exempt earnings from municipal securities and bank owned life insurance, non-deductible compensation and business expenses and tax credits.
For 2011, the effective tax rate was also impacted by a $2.8 million tax benefit associated with the repricing of our deferred tax asset due to a change in the Illinois corporate income tax rate that became effective during the first quarter. Excluding this one-time benefit in 2011, our effective income tax rate would have been 40.6%. The impact of the Illinois tax rate increase on 2011 pre-tax earnings increased our effective tax rate by approximately 0.9%. We expect our effective income tax rate in 2012 to be modestly higher than this adjusted 2011 rate (40.6%) due primarily to share price valuation and its impact on the tax benefits related to stock-based compensation, as discussed below.
The effective tax rate in 2010 was not meaningful because the small amount of pre-tax income caused the permanent differences described above to disproportionately impact the effective tax rate compared to what would have normally been expected.
Realization of Deferred Tax Assets
Net deferred tax assets are included in other assets in the accompanying Consolidated Statements of Financial Condition.
43
During the first three quarterly periods of 2011, we were in a cumulative pre-tax loss position for financial statement purposes, measured on a trailing three-year period basis. Under current accounting guidance, this represents significant negative evidence in the assessment of whether deferred tax assets will be realized. At December 31, 2011, we are no longer in a cumulative book loss position. We have concluded that based on the weight provided by certain positive evidence (discussed below), it is more likely than not that the deferred tax assets will be realized.
Taxable income in prior years and reversing deferred taxable income amounts provide sources from which deferred tax assets may be absorbed. Most significantly, however, we have relied on our ability to generate future federal taxable income, exclusive of reversing temporary differences, as the primary source from which deferred tax assets will be absorbed.
In making the determination at December 31, 2011 that it was more likely than not that the deferred tax assets will be realized, we considered the positive evidence associated with (a) taxable income generated in 2010 and 2011, (b) reversing taxable temporary differences in future periods, (c) our emergence from a cumulative book loss position in 2011, (d) continued improvement in pre-tax, pre-loan loss provision earnings results during 2009-2011, a core source for future taxable income, (e) our reporting of pre-tax profits during most of 2010 and 2011, (f) the concentration of credit losses in certain segments and vintages of our loan portfolio during the past three years and the relative moderation of credit trends in recent quarters, (g) our excess capital position relative to “well capitalized” regulatory standards and other industry benchmarks, and (h) no history of federal net operating loss carryforwards and the availability of the 20-year federal net operating loss carryforward period.
We considered negative evidence associated with the continuing challenging economic conditions as well as both positive and negative evidence associated with: (a) our accuracy in forecasting operating income and credit costs; and (b) the estimated timing of reversals of deferred deductible and deferred taxable items and the level of such net reversal amounts relative to earnings run rate assumptions in future periods.
Certain of the factors noted above support our expectation of generating pre-tax book earnings in future periods. We believe this in turn should give rise to taxable income levels (exclusive of reversing temporary differences) that more likely than not would be sufficient to absorb the deferred tax assets.
At December 31, 2011, we had approximately $13 million of deferred tax assets that relate to equity compensation awards, including both unexercised stock options and unvested restricted shares. In both cases, the deferred tax assets may not be fully realized in future periods primarily due to stock price valuation. Currently, most of our stock options are “out of the money” with an exercise price above our current stock price. Depending in part on changes in our stock price, we could incur tax charges at the expiration date of the options or prior to that time if employees terminate and out-of-the money options expire, or in certain instances, when employees exercise options. In the case of restricted shares, the tax benefits will not be fully realized if the fair market value of the awards on the vesting/release date is less than the value of the awards on the grant/modification date.
In such circumstances where there is a “shortfall” in tax benefits on the exercise, vesting or expiration of an equity award, such “shortfall” amounts are charged to stockholders’ equity if there is a sufficient level of “excess” tax benefits accumulated from prior years. During 2011 and 2010, such “shortfall” amounts charged to stockholders’ equity totaled $2.6 million and $3.6 million, respectively. In addition, during 2011, we charged $645,000 of such shortfall tax benefits to income tax expense because the balance of cumulative prior year “excess” tax benefits was reduced to $0. This resulted in an increase in the effective tax rate in 2011. Based on our current stock price level, scheduled vesting of restricted shares and anticipated option expirations, we expect to incur additional “shortfall” tax charges in 2012 which will put upward pressure on our effective income tax rate as described above. The amount of such “shortfall” charges in 2012 and in future periods is dependent on changes in our stock price as well as the impact of employee terminations, option exercise decisions and other factors.
Operating Segments Results
We have three primary business segments: Banking, Trust and Investments, and Holding Company Activities.
Banking
The profitability of our Banking segment is dependent on net interest income, provision for loan losses, non-interest income, and non-interest expense. The net income for the Banking segment for 2011 was $71.9 million, a $38.2 million increase from net income of $33.7 million for 2010. The increase in net income for the Banking segment was primarily due to a $61.6 million in lower provision for loan losses offset by $8.8 million in higher non-interest expense in 2011 as compared to the prior year. Net income for the Banking segment increased $28.8 million from 2009 to 2010, which was primarily due to $73.5 million in higher net interest income, offset by $50.7 million in higher non-interest expense during 2010 as compared to the prior year.
44
Total loans for the Banking segment decreased to $9.0 billion at December 31, 2011, compared to $9.1 billion at December 31, 2010. Total deposits decreased from December 31, 2010 levels of $10.7 billion to $10.5 billion at December 31, 2011.
Trust and Investments
The Trust and Investments segment includes investment management, investment advisory, personal trust and estate administration, custodial and escrow, retirement account administration, and brokerage services. Lodestar Investment Counsel, LLC (“Lodestar”), an investment management firm and wholly-owned subsidiary of the Bank, is included in our Trust and Investments segment. During 2011, we purchased the remaining minority ownership interests of Lodestar held by certain members of Lodestar management, who remain with the Company in management roles.
Net income attributable to controlling interests from Trust and Investments increased to $668,000 for the year ended December 31, 2011, from a net loss of $20,000 for 2010, and down from $1.0 million for 2009. The increase in net income from 2010 to 2011 is primarily attributable to a decrease in non-interest expense. AUMA remained relatively flat at $4.3 billion at December 31, 2011 and December 31, 2010.
Holding Company Activities
The Holding Company Activities segment consists of parent company-only activity and intersegment eliminations. The Holding Company’s most significant asset is its investment in its bank subsidiary. Undistributed earnings relating to this investment is not included in the Holding Company financial results. Holding Company financial results are represented primarily by interest expense on borrowings and operating expenses. Recurring operating expenses consist primarily of share-based compensation and professional fees. The Holding Company Activities segment reported a net loss of $28.2 million for the year ended December 31, 2011, compared to a net loss of $32.2 million for the same period in 2010 and a net loss of $35.9 million for 2009. The reduction is due to lower interest expense on certain junior subordinated debt securities which have repriced downward, as well as reduced professional fees.
Additional information about our operating segments are also discussed in Note 21 of “Notes to Consolidated Financial Statements” in Item 8 of this Form 10-K.
FINANCIAL CONDITION
Investment Portfolio Management
We manage our investment portfolio to maximize the return on invested funds within acceptable risk guidelines, to meet pledging and liquidity requirements, and to adjust balance sheet interest rate sensitivity to attempt to serve as some protection for net interest income levels against the impact of changes in interest rates.
We may adjust the size and composition of our securities portfolio according to a number of factors, including expected liquidity needs, the current and forecasted interest rate environment, our actual and anticipated balance sheet growth rate, the relative value of various segments of the securities markets, and the broader economic and regulatory environment.
Investments are comprised of debt securities and non-marketable equity investments. Our debt securities portfolio is primarily comprised of residential mortgage-backed pools, collateralized mortgage obligations, U.S. Treasury and Agency securities, and state and municipal bonds.
Debt securities that are classified as available-for-sale are carried at fair value and may be sold as part of our asset/liability management strategy in response to changes in interest rates, liquidity needs or significant prepayment risk. Unrealized gains and losses on available-for-sale securities represent the difference between the aggregated cost and fair value of the portfolio and are reported, on an after-tax basis, as a separate component of equity in accumulated other comprehensive income. This balance sheet component will fluctuate as current market interest rates and conditions change, which changes affect the aggregate fair value of the portfolio. In periods of significant market volatility, we may experience significant changes in accumulated other comprehensive income. Accumulated other comprehensive income is not included in the calculation of regulatory capital.
Debt securities that are classified as held-to-maturity are securities we have the ability and intent to hold until maturity and are accounted for using historical cost, adjusted for amortization of premiums and accretion of discounts.
Non-marketable equity investments include Federal Home Loan Bank (“FHLB”) stock and various other equity securities. At December 31, 2011, our investment in FHLB stock was $40.7 million, compared to $20.7 million at December 31, 2010. To increase our sources of liquidity, during the third quarter 2011, we became a member of the FHLB Chicago and purchased $23.7 million of FHLB Chicago stock. FHLB stock holdings are necessary to maintain FHLB advances and availability. Also included in non-
45
marketable equity investments are certain interests we have in investment funds that make qualifying investments for purposes of our compliance with the Community Reinvestment Act (“CRA”). Such investments had a carrying amount of $2.9 million at December 31, 2011.
We do not own any Freddie Mac or Fannie Mae preferred stock or subordinated debt obligations, bank trust preferred securities, or any sub-prime mortgage-backed securities.
Table 7
Investment Securities Portfolio Valuation Summary
(Dollars in thousands)
| | | | | | | | | | | | | | | | | | | | | | | | | | | | | | | | | | | | |
| | | As of December 31, 2011 | | | As of December 31, 2010 | | | As of December 31, 2009 | |
| | | Fair
Value | | | Amortized
Cost | | | % of
Total | | | Fair
Value | | | Amortized
Cost | | | % of
Total | | | Fair
Value | | | Amortized
Cost | | | % of
Total | |
Available-for-Sale | | | | | | | | | | | | | | | | | | | | | | | | | | | | | | | | | | | | |
U.S. Treasury securities | | $ | 61,521 | | | $ | 60,590 | | | | 2.7 | | | $ | - | | | $ | - | | | | - | | | $ | 16,970 | | | $ | 16,758 | | | | 1.1 | |
U.S. Agency securities | | | 10,034 | | | | 10,014 | | | | 0.4 | | | | 10,426 | | | | 10,155 | | | | 0.6 | | | | 10,315 | | | | 10,292 | | | | 0.7 | |
Collateralized mortgage obligations | | | 356,000 | | | | 344,078 | | | | 15.3 | | | | 451,721 | | | | 450,251 | | | | 23.7 | | | | 176,364 | | | | 168,974 | | | | 11.0 | |
Residential mortgage- backed securities | | | 1,189,213 | | | | 1,140,555 | | | | 51.3 | | | | 1,247,031 | | | | 1,222,642 | | | | 65.5 | | | | 1,191,718 | | | | 1,162,924 | | | | 74.5 | |
State and municipal securities | | | 166,197 | | | | 154,080 | | | | 7.2 | | | | 172,108 | | | | 166,209 | | | | 9.0 | | | | 174,174 | | | | 165,828 | | | | 10.9 | |
Foreign sovereign debt | | | 500 | | | | 500 | | | | * | | | | 500 | | | | 500 | | | | * | | | | - | | | | - | | | | - | |
| | | | | | | | | | | | | | | | | | | | | | | | | | | | | | | | | | | | |
Total available-for-sale | | | 1,783,465 | | | | 1,709,817 | | | | 76.9 | | | | 1,881,786 | | | | 1,849,757 | | | | 98.8 | | | | 1,569,541 | | | | 1,524,776 | | | | 98.2 | |
| | | | | | | | | | | | | | | | | | | | | | | | | | | | | | | | | | | | |
| | | | | | | | | |
Held-to-Maturity | | | | | | | | | | | | | | | | | | | | | | | | | | | | | | | | | | | | |
Residential mortgage- backed securities | | | 493,159 | | | | 490,072 | | | | 21.2 | | | | - | | | | - | | | | - | | | | - | | | | - | | | | - | |
State and municipal securities | | | 71 | | | | 71 | | | | * | | | | - | | | | - | | | | - | | | | - | | | | - | | | | - | |
| | | | | | | | | | | | | | | | | | | | | | | | | | | | | | | | | | | | |
Total held-to-maturity | | | 493,230 | | | | 490,143 | | | | 21.2 | | | | - | | | | - | | | | - | | | | - | | | | - | | | | - | |
| | | | | | | | | | | | | | | | | | | | | | | | | | | | | | | | | | | | |
Non-Marketable Equity Investments | | | | | | | | | | | | | | | | | | | | | | | | | | | | | | | | | | | | |
FHLB stock | | | 40,695 | | | | 40,695 | | | | 1.8 | | | | 20,694 | | | | 20,694 | | | | 1.1 | | | | 22,791 | | | | 22,791 | | | | 1.4 | |
Other | | | 2,909 | | | | 2,909 | | | | 0.1 | | | | 2,843 | | | | 2,843 | | | | 0.1 | | | | 6,622 | | | | 6,622 | | | | 0.4 | |
| | | | | | | | | | | | | | | | | | | | | | | | | | | | | | | | | | | | |
Total non-marketable equity investments | | | 43,604 | | | | 43,604 | | | | 1.9 | | | | 23,537 | | | | 23,537 | | | | 1.2 | | | | 29,413 | | | | 29,413 | | | | 1.8 | |
| | | | | | | | | | | | | | | | | | | | | | | | | | | | | | | | | | | | |
Total securities | | $ | 2,320,299 | | | $ | 2,243,564 | | | | 100.0 | | | $ | 1,905,323 | | | $ | 1,873,294 | | | | 100.0 | | | $ | 1,598,954 | | | $ | 1,554,189 | | | | 100.0 | |
| | | | | | | | | | | | | | | | | | | | | | | | | | | | | | | | | | | | |
As of December 31, 2011, our securities portfolio totaled $2.3 billion, an increase of 22% from $1.9 billion at December 31, 2010. During 2011, purchases in securities totaled $1.1 billion with $557.6 million in the available-for-sale portfolio, $497.9 million in the held-to-maturity portfolio, and the remaining $24.3 million in non-marketable equity investments, primarily FHLB stock.
During 2011, to mitigate the future other comprehensive income volatility of adding bonds to the available-for-sale portfolio in a low interest rate environment, we established a held-to-maturity portfolio with the purchase of $490.1 million in residential mortgage-backed securities and $71,000 in state and municipal securities. We anticipate continuing to add opportunistically to the held-to-maturity portfolio.
The current year purchases in the investment portfolio primarily represent the reinvestment of proceeds from sales, maturities, and paydowns in largely similar residential mortgage-backed securities and collateralized mortgage obligations, as well as the reinvestment of growth in the balance sheet.
Also, during 2011, we sold $188.8 million of collateralized mortgage obligations, $66.0 million of residential mortgage-backed securities, $19.5 million of state and municipal securities, and $15.8 million in U.S. Agency securities, resulting in a net securities gain of $5.8 million. The sales assisted in managing prepayment risk and provided a measure of benefit to our capital position.
Investments in collateralized mortgage obligations and residential mortgage-backed securities comprise 88% of the total portfolio at December 31, 2011. All of the mortgage securities are backed by U.S. Government agencies or issued by U.S. Government-sponsored enterprises. All mortgage securities are composed of fixed-rate, fully-amortizing collateral with final maturities of 30 years or less.
46
Investments in debt instruments of state and local municipalities comprised 7% of the total portfolio at December 31, 2011. This type of security has historically experienced very low default rates and provided a predictable cash flow since generally it is not subject to significant prepayment. Insurance companies regularly provide credit enhancement to improve the credit rating and liquidity of a municipal bond issuance. Management considers the credit enhancement and underlying municipality credit rating when evaluating a purchase or sale decision.
At December 31, 2011, our reported equity reflected unrealized net securities gains on available-for-sale securities, net of tax, of $45.1 million, an increase of $25.1 million from December 31, 2010. The change in net unrealized gains compared to the prior year was primarily due to the decrease in interest rates.
The following table presents the maturities of the different types of investments that we owned at December 31, 2011 and the corresponding interest rates.
Table 8
Repricing Distribution and Portfolio Yields
(Dollars in thousands)
| | | | | | | | | | | | | | | | | | | | | | | | | | | | | | | | |
| | | As of December 31, 2011 | |
| | | | |
| | | One Year or Less | | | One Year to Five Years | | | Five Years to Ten Years | | | After 10 years | |
| | | Amortized
Cost | | | Yield to
Maturity | | | Amortized
Cost | | | Yield to
Maturity | | | Amortized
Cost | | | Yield to
Maturity | | | Amortized
Cost | | | Yield to
Maturity | |
Available-for-Sale | | | | | | | | | | | | | | | | | | | | | | | | | | | | | | | | |
U.S. Treasury securities | | $ | - | | | | -% | | | $ | 60,590 | | | | 1.10% | | | $ | - | | | | -% | | | $ | - | | | | -% | |
U.S. Agency securities | | | - | | | | -% | | | | 10,014 | | | | 2.51% | | | | - | | | | -% | | | | - | | | | -% | |
Collateralized mortgage obligations(1) | | | 82,629 | | | | 3.16% | | | | 202,059 | | | | 3.30% | | | | 55,494 | | | | 3.17% | | | | 3,896 | | | | 3.32% | |
Residential mortgage-backed securities(1) | | | 289,113 | | | | 3.40% | | | | 652,629 | | | | 3.24% | | | | 176,516 | | | | 3.22% | | | | 22,297 | | | | 3.21% | |
State and municipal securities(2) | | | 12,430 | | | | 6.94% | | | | 62,455 | | | | 5.75% | | | | 75,732 | | | | 4.75% | | | | 3,463 | | | | 7.06% | |
Foreign sovereign debt | | | 500 | | | | 1.30% | | | | - | | | | -% | | | | - | | | | -% | | | | - | | | | -% | |
| | | | | | | | | | | | | | | | | | | | | | | | | | | | | | | | |
Total available-for-sale | | | 384,672 | | | | 3.46% | | | | 987,747 | | | | 3.27% | | | | 307,742 | | | | 3.59% | | | | 29,656 | | | | 3.68% | |
| | | | | | | | | | | | | | | | | | | | | | | | | | | | | | | | |
| | | | | | | | |
Held-to-Maturity | | | | | | | | | | | | | | | | | | | | | | | | | | | | | | | | |
Residential mortgage-backed securities(1) | | | 58,267 | | | | 2.18% | | | | 286,820 | | | | 2.20% | | | | 117,180 | | | | 2.22% | | | | 27,805 | | | | 2.31% | |
State and municipal securities(2) | | | 23 | | | | 2.95% | | | | 48 | | | | 3.56% | | | | - | | | | -% | | | | - | | | | -% | |
| | | | | | | | | | | | | | | | | | | | | | | | | | | | | | | | |
Total held-to-maturity | | | 58,290 | | | | 2.18% | | | | 286,868 | | | | 2.20% | | | | 117,180 | | | | 2.22% | | | | 27,805 | | | | 2.31% | |
| | | | | | | | | | | | | | | | | | | | | | | | | | | | | | | | |
| | | | | | | | |
Non-Marketable Equity Investments | | | | | | | | | | | | | | | | | | | | | | | | | | | | | | | | |
FHLB stock(3) | | | 40,695 | | | | 0.87% | | | | - | | | | -% | | | | - | | | | -% | | | | - | | | | -% | |
Other | | | 2,909 | | | | n/a | | | | - | | | | -% | | | | - | | | | -% | | | | - | | | | -% | |
| | | | | | | | | | | | | | | | | | | | | | | | | | | | | | | | |
Total non-marketable equity investments | | | 43,604 | | | | 0.81% | | | | - | | | | -% | | | | - | | | | -% | | | | - | | | | -% | |
| | | | | | | | | | | | | | | | | | | | | | | | | | | | | | | | |
Total securities | | $ | 486,566 | | | | 3.07% | | | $ | 1,274,615 | | | | 3.03% | | | $ | 424,922 | | | | 3.21% | | | $ | 57,461 | | | | 3.01% | |
| | | | | | | | | | | | | | | | | | | | | | | | | | | | | | | | |
| | (1) | The repricing distributions and yields to maturity of collateralized mortgage obligations and mortgage-backed securities are based on estimated future cash flows and prepayments. Actual repricings and yields of the securities may differ from those reflected in the table depending upon actual interest rates and prepayment speeds. |
| | (2) | Yields on state and municipal securities are reflected on a tax-equivalent basis, assuming a federal income tax rate of 35%. The maturity date of state and municipal bonds is based on contractual maturity, unless the bond, based on current market prices, is deemed to have a high probability that a call right will be exercised, in which case the call date is used as the maturity date. |
| | (3) | The yield on FHLB stock is based on dividend announcements. |
LOAN PORTFOLIO AND CREDIT QUALITY (excluding covered assets)
Our principal source of revenue arises from our lending activities, primarily composed of interest income and, to a lesser extent, loan origination and commitment fees, net of related costs. The accounting policies underlying the recording of loans in the Consolidated Statements of Financial Condition and the recognition and/or deferral of interest income and fees, net of costs, arising from lending activities are included in Note 1 of “Notes to Consolidated Financial Statements” in Item 8 of this Form 10-K.
47
The following discussion of our loan portfolio and credit quality excludes covered assets. Covered assets represent assets acquired through an FDIC-assisted transaction that are subject to a loss share agreement and are presented separately on the Consolidated Statements of Financial Condition. For additional discussion of covered assets, refer to Note 6 of “Notes to Consolidated Financial Statements” in Item 8 of this Form 10-K and “Management’s Discussion and Analysis of Financial Condition and Results of Operations – Covered Assets.”
Portfolio Composition
Total loans, excluding covered assets, were $9.0 billion as of December 31, 2011, compared to $9.1 billion at December 31, 2010. We continue to strategically reshape our mix of loan products, focusing on commercial loan originations to build our portfolio, funding approximately $1.4 billion in new client relationships since year end 2010. The new loan origination activity was offset by payoffs, paydowns, and disposition activity motivated by our desire to improve asset quality and financial performance. As a result of these ongoing efforts, commercial loans (including owner-occupied commercial real estate loans) increased by $534.6 million during the year and increased as a proportion of total loans to 60% at December 31, 2011, compared to 53% at December 31, 2010. Commercial real estate and construction loans decreased by $539.2 million, or 16%, and represented 32% of total loans at December 31, 2011, compared to 38% at December 31, 2010. We may continue to actively seek to exit accounts that no longer align strategically or do not meet return or other performance hurdles.
The following table presents the composition of our loan portfolio over the past five years.
Table 9
Loan Portfolio
(Dollars in thousands)
| | | | | | | | | | | | | | | | | | | | | | | | | | | | | | | | | | | | | | | | |
| | | As of December 31, | |
| | | 2011 | | | % of
Total | | | 2010 | | | % of
Total | | | 2009 | | | % of
Total | | | 2008 | | | % of
Total | | | 2007 | | | % of
Total | |
| | | | | | | | | | |
Commercial | | $ | 5,399,761 | | | | 59.9 | | | $ | 4,865,168 | | | | 53.3 | | | $ | 4,316,002 | | | | 47.7 | | | $ | 3,593,311 | | | | 44.9 | | | $ | 780,719 | | | | 18.7 | |
Commercial real estate | | | 2,610,459 | | | | 29.0 | | | | 2,905,878 | | | | 31.9 | | | | 3,101,166 | | | | 34.3 | | | | 2,754,876 | | | | 34.4 | | | | 2,135,197 | | | | 51.1 | |
Construction | | | 287,002 | | | | 3.2 | | | | 530,733 | | | | 5.8 | | | | 768,358 | | | | 8.5 | | | | 826,310 | | | | 10.3 | | | | 613,468 | | | | 14.7 | |
Residential real estate | | | 297,229 | | | | 3.3 | | | | 319,146 | | | | 3.5 | | | | 319,463 | | | | 3.5 | | | | 328,138 | | | | 4.1 | | | | 265,466 | | | | 6.4 | |
Home equity | | | 181,158 | | | | 2.0 | | | | 197,179 | | | | 2.2 | | | | 220,025 | | | | 2.4 | | | | 191,934 | | | | 2.4 | | | | 135,483 | | | | 3.2 | |
Personal | | | 232,952 | | | | 2.6 | | | | 296,253 | | | | 3.3 | | | | 321,611 | | | | 3.6 | | | | 307,220 | | | | 3.9 | | | | 247,192 | | | | 5.9 | |
| | | | | | | | | | | | | | | | | | | | | | | | | | | | | | | | | | | | | | | | |
| | | | | | | | | | |
Total | | $ | 9,008,561 | | | | 100.0 | | | $ | 9,114,357 | | | | 100.0 | | | $ | 9,046,625 | | | | 100.0 | | | $ | 8,001,789 | | | | 100.0 | | | $ | 4,177,525 | | | | 100.0 | |
| | | | | | | | | | | | | | | | | | | | | | | | | | | | | | | | | | | | | | | | |
Growth vs. prior year–end | | | -1.2% | | | | | | | | 0.7% | | | | | | | | 13.1% | | | | | | | | 91.5% | | | | | | | | 19.4% | | | | | |
| | | | | | | | | | | | | | | | | | | | | | | | | | | | | | | | | | | | | | | | |
48
The following table summarizes the composition of our commercial loan portfolio at December 31, 2011 and 2010. Our commercial loan portfolio is categorized based on our most significant industry segments, as classified pursuant to the North American Industrial Classification System standard industry description. These categories are based on the nature of the client’s ongoing business activity as opposed to the collateral underlying an individual loan. To the extent that a client’s underlying business activity changes, classification differences between periods will arise.
Table 10
Commercial Loan Portfolio Composition
by Industry Segment
(Dollars in thousands)
| | | | | | | | | | | | | | | | |
| | | December 31, 2011 | | | December 31, 2010 | |
| | | Amount | | | % of Total | | | Amount | | | % of Total | |
Manufacturing | | $ | 1,257,973 | | | | 23 | | | $ | 1,042,963 | | | | 21 | |
Healthcare | | | 1,218,205 | | | | 23 | | | | 1,007,610 | | | | 21 | |
Wholesale trade | | | 482,386 | | | | 9 | | | | 482,747 | | | | 10 | |
Finance and insurance | | | 454,830 | | | | 8 | | | | 449,692 | | | | 9 | |
Real estate and rental and leasing | | | 416,961 | | | | 8 | | | | 368,742 | | | | 8 | |
Professional, scientific and technical services | | | 350,677 | | | | 6 | | | | 298,382 | | | | 6 | |
Administrative, support, waste management and remediation services | | | 321,912 | | | | 6 | | | | 301,735 | | | | 6 | |
Architecture, engineering and construction | | | 197,761 | | | | 4 | | | | 230,062 | | | | 5 | |
All other segments(1) | | | 699,056 | | | | 13 | | | | 683,235 | | | | 14 | |
| | | | | | | | | | | | | | | | |
Total commercial(2) | | $ | 5,399,761 | | | | 100 | | | $ | 4,865,168 | | | | 100 | |
| | | | | | | | | | | | | | | | |
| | (1) | All other segments consist of numerous smaller balances across a variety of industries. |
| | (2) | Includes owner-occupied commercial real estate of $1.1 billion and $898,000 at December 31, 2011 and 2010, respectively. |
Within our commercial lending business, we have a specialized niche in the “assisted living,” nursing and residential care segment of the healthcare industry. At December 31, 2011, 23% of the commercial loan portfolio had been extended primarily to operators in this segment to finance the working capital needs and cost of facilities providing such services. These loans tend to be larger extensions of credit and are primarily to for-profit businesses. To date, this portfolio segment has experienced minimal defaults and losses.
Commercial real estate decreased $295.4 million from December 31, 2010 due to a combination of problem loan dispositions, fewer new originations (although we experienced some increased activity during the second half of 2011), and transitional financing being repaid or refinanced as expected in the secondary market for long-term permanent financing or by other external sources. The collateral underlying our commercial real estate portfolio is principally located in and around our core markets and is significantly concentrated in the Chicago metropolitan area. Declines of $243.7 million in the construction portfolio from December 31, 2010 are partially due to projects reaching completion at which point they are reclassified into the commercial real estate category, as well as problem loan dispositions, payoffs or paydowns, and movements to OREO. The following table summarizes our commercial real estate and construction loan portfolios by collateral type at December 31, 2011 and 2010.
49
Table 11
Commercial Real Estate and Construction Loan Portfolio
by Collateral Type
(Dollars in thousands)
| | | | | | | | | | | | | | | | | | | | | | | | |
| | | December 31, 2011 | | | December 31, 2010 | |
| | | Amount | | | % of Total | | | % Non-
performing (1) | | | Amount | | | % of Total | | | % Non-
performing (1) | |
Commercial Real Estate | | | | | | | | | | | | | | | | | | | | | | | | |
Land | | $ | 230,579 | | | | 9 | | | | 6 | | | $ | 311,464 | | | | 11 | | | | 17 | |
Residential 1-4 family | | | 105,919 | | | | 4 | | | | 23 | | | | 139,689 | | | | 5 | | | | 20 | |
Multi-family | | | 424,119 | | | | 16 | | | | 1 | | | | 457,246 | | | | 16 | | | | 7 | |
Industrial/warehouse | | | 343,071 | | | | 13 | | | | 3 | | | | 391,694 | | | | 13 | | | | 2 | |
Office | | | 568,302 | | | | 22 | | | | 4 | | | | 531,193 | | | | 18 | | | | 4 | |
Retail | | | 431,200 | | | | 17 | | | | 8 | | | | 452,119 | | | | 16 | | | | 5 | |
Health care | | | 140,942 | | | | 5 | | | | - | | | | 114,545 | | | | 4 | | | | - | |
Mixed use/other | | | 366,327 | | | | 14 | | | | 7 | | | | 507,928 | | | | 17 | | | | 9 | |
| | | | | | | | | | | | | | | | | | | | | | | | |
Total commercial real estate | | $ | 2,610,459 | | | | 100 | | | | 5 | | | $ | 2,905,878 | | | | 100 | | | | 7 | |
| | | | | | | | | | | | | | | | | | | | | | | | |
| | | | | | |
Construction | | | | | | | | | | | | | | | | | | | | | | | | |
Land | | $ | 23,422 | | | | 8 | | | | 2 | | | $ | 46,036 | | | | 9 | | | | 19 | |
Residential 1-4 family | | | 21,906 | | | | 8 | | | | 14 | | | | 30,698 | | | | 6 | | | | 15 | |
Multi-family | | | 64,892 | | | | 23 | | | | - | | | | 77,685 | | | | 15 | | | | - | |
Industrial/warehouse | | | 15,216 | | | | 5 | | | | - | | | | 34,703 | | | | 7 | | | | 5 | |
Office | | | 43,403 | | | | 15 | | | | 1 | | | | 92,369 | | | | 17 | | | | 2 | |
Retail | | | 61,469 | | | | 21 | | | | 20 | | | | 92,268 | | | | 17 | | | | 10 | |
Mixed use/other | | | 56,694 | | | | 20 | | | | 10 | | | | 156,974 | | | | 29 | | | | 5 | |
| | | | | | | | | | | | | | | | | | | | | | | | |
Total construction | | $ | 287,002 | | | | 100 | | | | 8 | | | $ | 530,733 | | | | 100 | | | | 6 | |
| | | | | | | | | | | | | | | | | | | | | | | | |
| | (1) | Calculated as nonperforming loans in the respective collateral type divided by total loans of the corresponding collateral type presented above. |
Of the combined commercial real estate and construction portfolios, the single largest category at December 31, 2011 was office real estate, which represented 21% of the combined portfolios. Our total exposure to land loans in the combined portfolios declined to $254.0 million at December 31, 2011 from $357.5 million at December 31, 2010. Our longer-term goal is to reduce land loans as a percentage of the loan portfolio, although further meaningful reduction of our land loan exposure may be challenging in the near term due to the current illiquidity of this asset class. As a percentage of the total commercial real estate and construction portfolios, land loans declined from 11% at December 31, 2010 to 9% at December 31, 2011.
50
Maturity and Interest Rate Sensitivity of Loan Portfolio
The following table summarizes the maturity distribution of our loan portfolio as of December 31, 2011, by category, as well as the interest rate sensitivity of loans in these categories that have maturities in excess of one year.
Table 12
Maturities and Sensitivities of Loans
to Changes in Interest Rates
(Amounts in thousands)
| | | | | | | | | | | | | | | | |
| | | As of December 31, 2011 | |
| | | Due in
1 year
or less | | | Due after 1
year through
5 years | | | Due after
5 years | | | Total | |
Commercial | | $ | 1,360,111 | | | $ | 3,986,040 | | | $ | 53,610 | | | $ | 5,399,761 | |
Commercial real estate | | | 1,040,846 | | | | 1,522,630 | | | | 46,983 | | | | 2,610,459 | |
Construction | | | 182,458 | | | | 104,335 | | | | 209 | | | | 287,002 | |
Residential real estate | | | 9,638 | | | | 40,775 | | | | 246,816 | | | | 297,229 | |
Home equity | | | 47,486 | | | | 102,530 | | | | 31,142 | | | | 181,158 | |
Personal | | | 155,273 | | | | 76,061 | | | | 1,618 | | | | 232,952 | |
| | | | | | | | | | | | | | | | |
Total | | $ | 2,795,812 | | | $ | 5,832,371 | | | $ | 380,378 | | | $ | 9,008,561 | |
| | | | | | | | | | | | | | | | |
| | | | |
Loans maturing after one year: | | | | | | | | | | | | | | | | |
Predetermined (fixed) interest rates | | | | | | $ | 597,152 | | | $ | 53,440 | | | | | |
Floating interest rates | | | | | | | 5,235,219 | | | | 326,938 | | | | | |
| | | | | | | | | | | | | | | | |
Total | | | | | | $ | 5,832,371 | | | $ | 380,378 | | | | | |
| | | | | | | | | | | | | | | | |
Of the $5.6 billion in loans maturing after one year with a floating interest rate, $1.4 billion are subject to interest rate floors under the loan agreement with $1.2 billion that have such floors in effect at December 31, 2011. On a number of occasions we have eliminated customers’ interest rate floors in consideration of their entering into interest rate swap transactions with us.
Delinquent Loans, Special Mention and Potential Problem Loans, and Nonperforming Assets
Loans are reported delinquent if the required principal and interest payments have not been received within 30 days of the date such payment is due. Delinquency can be driven by either failure of the borrower to make payments within the term of the loan or failure to make the final payment at maturity. The majority of our loans are not fully amortizing over the term. As a result, a sizeable final repayment is often required at maturity. If a borrower lacks refinancing options or the ability to pay, the loan may become delinquent at maturity. Of total commercial real estate and construction loans outstanding at December 31, 2011, $274.3 million are scheduled to mature in the first quarter of 2012, of which all but 1% were performing at December 31, 2011.
Loans considered special mention are performing in accordance with the contractual terms but demonstrate potential weakness that if left unresolved, may result in deterioration in the Company’s credit position and/or the repayment prospects for the credit. Borrowers rated special mention may exhibit adverse operating trends, high leverage, tight liquidity, or other credit concerns.
Potential problem loans are loans that we have identified as performing in accordance with contractual terms, but for which management has some level of concern (greater than that of special mention loans) about the ability of the borrowers to meet existing repayment terms in future periods. These loans continue to accrue interest but the ultimate collection of these loans is questionable due to the same conditions that characterize a special mention credit. These credits may also be considered inadequately protected by the current net worth and/or paying capacity of the obligor or guarantors or the collateral pledged. These loans generally have a well-defined weakness or weaknesses that may jeopardize collection of the debt and are characterized by the distinct possibility that the Company will sustain some loss if the deficiencies are not resolved. Although these loans are generally identified as potential problem loans and require additional attention by management, they may never become nonperforming.
Special mention and potential problem loans as of December 31, 2011 and 2010 are presented in Table 19.
Nonperforming assets include nonperforming loans and real estate that has been acquired primarily through foreclosure proceedings and are awaiting disposition and are presented in Table 14. Nonperforming loans consist of nonaccrual loans, including restructured loans that remain on nonaccrual. We specifically exclude certain restructured loans that accrue interest from our definition of nonperforming loans if the borrower has demonstrated the ability to meet the new terms of the restructuring as evidenced by a
51
minimum of at least six months of performance in compliance with the restructured terms or if the borrower’s performance prior to the restructuring or other significant events at the time of the restructuring supports returning or maintaining the loan on accrual status. All loans are placed on nonaccrual status when principal or interest payments become 90 days past due or earlier if management deems the collectability of the principal or interest to be in question rather than waiting until the loans become 90 days past due. When interest accruals are discontinued, accrued but uncollected interest is reversed reducing interest income. Subsequent receipts on nonaccrual loans are recorded in the financial statements as a reduction of principal, and interest income is only recorded on a cash basis after principal recovery is reasonably assured. Classification of a loan as nonaccrual does not necessarily preclude the ultimate collection of loan principal and/or interest. Nonperforming loans are presented in Tables 14, 15, 17, and 19.
Foreclosed assets represent property acquired as the result of borrower defaults on loans secured by a mortgage on real property. Foreclosed assets are recorded at the lesser of current carrying value or estimated fair value, less estimated selling costs at the time of foreclosure. Write-downs occurring at foreclosure are charged against the allowance for loan losses. On a periodic basis, the carrying values of these properties are adjusted based upon new appraisals and/or market indications. Write-downs are recorded for subsequent declines in net realizable value and are included in non-interest expense along with other expenses related to maintaining the properties. Additional information on our OREO is presented in Tables 20 through 22.
As part of our ongoing risk management practices and in certain circumstances, we may extend or modify the terms of a loan to maximize the collection of amounts due when a borrower is experiencing financial difficulties. The modification may consist of concessionary reduction in interest rate, extension of the maturity date, reduction in the principal balance, or other action intended to minimize potential losses that would otherwise not be considered in order to improve the chance of a successful recovery on the loan. Such concessions as part of a modification are accounted for as troubled debt restructurings (“TDRs”). Restructured loans can involve loans remaining on nonaccrual, moving to nonaccrual, or continuing on accrual status, depending on the individual facts and circumstances of the borrower. We may utilize a multiple note structure as a workout alternative for certain loans. The multiple note structure typically bifurcates a troubled loan into two separate notes, where the first note is reasonably assured of repayment and performance according to the modified terms, and the second note of the troubled loan that is not reasonably assured of repayment is charged-off. TDRs accrue interest as long as the borrower complies with the revised terms and conditions and has historically demonstrated repayment performance at a level commensurate with the modified terms; otherwise, the restructured loan will be classified as nonaccrual. Restructured loans accruing interest were $100.9 million at December 31, 2011, compared to $87.6 million at December 31, 2010. Of total restructured loans accruing interest modified during the year ended December 31, 2011, 59% were modified to extend the maturity date and 85% were from commercial loan relationships. The composition of our restructured loans accruing interest by loan category and our recorded investment is presented in Tables 14 and 18. During 2011, $6.6 million in loans that were previously classified as a restructured loans accruing interest were subsequently re-underwritten as pass rated credits which is evidence that the borrower would no longer be considered “troubled,” and as such, the TDR classification was removed.
Total nonperforming assets declined 15% to $385.6 million at December 31, 2011 from $454.6 million at December 31, 2010, reflecting strong progress in improving the overall asset quality of the portfolio and reducing problem assets. Nonperforming assets were 3.11% of total assets at December 31, 2011, compared to 3.65% at December 31, 2010. During the year, total nonperforming loans declined by $106.0 million, or 29%, due to disposition activity, moderating nonperforming loan inflows, and movement of nonperforming loans to OREO. OREO increased $37.0 million, or 42%, from December 31, 2010, as problem loans continue to progress through the workout process.
Disposition activity and ongoing workout efforts drove a reduction in special mention and potential problem loans. Loans in these early stage problem loan categories were down $524.4 million, or 58%, from December 31, 2010 to $382.1 million at December 31, 2011. Disposition activity in 2011 included the sale of $308.9 million in problem loans, including $97.0 million in nonperforming loans, and $79.0 million in OREO at a 15% net incremental charge based on the carrying value net of specific reserves at the time of disposition. In 2012, we will continue to assess the market for the best disposition strategy and approach. As we work through the remainder of the portfolio, we may see some fluctuations in disposition prices.
Nonperforming loans were $259.9 million at December 31, 2011, down 29% from $365.9 million at December 31, 2010. The amount of nonperforming loan inflows, which is primarily composed of potential problem loans moving through the workout process (i.e., moving from potential problem to nonperforming status), were $341.5 million for 2011 compared to $447.4 million for 2010. Inflows to nonperforming loans were more than offset by problem loan resolutions (including transfers to OREO), dispositions, and charge-offs during 2011. As shown in Table 17 providing nonperforming loan stratification by size, twelve nonperforming loans in excess of $5.0 million comprised 52% of our total nonperforming loans at December 31, 2011. Commercial real estate and construction loans were 60% of our total nonperforming loans at December 31, 2011, reflecting the stress in the sector.
As discussed above, our focused asset management activities led to declines in special mention and potential problem loans year over year as we have worked to improve overall credit quality. Since the majority of inflows to nonperforming loans have been migrating from the special mention or potential problem loan categories, we expect that future nonperforming loan inflows will likely continue to moderate. However, because many of our potential problem loans are commercial real estate-related, a highly-stressed loan sector,
52
and because the potential problem loan population contains some larger-sized credits, our total nonperforming loans may fluctuate over the next several quarters as we continue to execute remediation plans and work through the credit cycle. In addition, credit quality trends may also be impacted by the uncertainty in global economic conditions and market turmoil that could disrupt workout plans, adversely affect clients, or negatively impact collateral valuations. Further, net nonperforming asset levels could fluctuate depending on the timing of dispositions or other remediation actions. Our efforts to continue to dispose of nonperforming and problem assets in future quarters may be impacted by a number of factors, including but not limited to, the pace and timing of the overall recovery of the economy, activity levels in the real estate market, real estate inventory coming into the market for sale and collateral asset class. OREO is likely to remain elevated as nonperforming commercial real estate loans continue to move through the collection process.
The following table breaks down our loan portfolio at December 31, 2011 between performing, delinquent and nonperforming status.
Table 13
Delinquency Analysis
(Dollars in thousands)
| | | | | | | | | | | | | | | | | | | | | | | | |
| | | | | | Delinquent | | | | | | | |
| | | Current | | | 30 – 59
Days
Past Due | | | 60 – 89
Days
Past Due | | | 90 Days
Past Due
and Accruing | | | Nonaccrual | | | Total Loans | |
As of December 31, 2011 | | | | | | | | | | | | | | | | | | | | | | | | |
Loan Balances: | | | | | | | | | | | | | | | | | | | | | | | | |
Commercial | | $ | 5,326,862 | | | $ | 6,018 | | | $ | 923 | | | $ | - | | | $ | 65,958 | | | $ | 5,399,761 | |
Commercial real estate | | | 2,463,902 | | | | 3,523 | | | | 9,777 | | | | - | | | | 133,257 | | | | 2,610,459 | |
Construction | | | 262,742 | | | | - | | | | 2,381 | | | | - | | | | 21,879 | | | | 287,002 | |
Residential real estate | | | 278,195 | | | | 3,800 | | | | 645 | | | | - | | | | 14,589 | | | | 297,229 | |
Personal and home equity | | | 388,686 | | | | 446 | | | | 809 | | | | - | | | | 24,169 | | | | 414,110 | |
| | | | | | | | | | | | | | | | | | | | | | | | |
Total loans | | $ | 8,720,387 | | | $ | 13,787 | | | $ | 14,535 | | | $ | - | | | $ | 259,852 | | | $ | 9,008,561 | |
| | | | | | | | | | | | | | | | | | | | | | | | |
% of Loan Balance: | | | | | | | | | | | | | | | | | | | | | | | | |
Commercial | | | 98.65% | | | | 0.11% | | | | 0.02% | | | | -% | | | | 1.22% | | | | 100.00% | |
Commercial real estate | | | 94.40% | | | | 0.13% | | | | 0.37% | | | | -% | | | | 5.10% | | | | 100.00% | |
Construction | | | 91.55% | | | | -% | | | | 0.83% | | | | -% | | | | 7.62% | | | | 100.00% | |
Residential real estate | | | 93.59% | | | | 1.28% | | | | 0.22% | | | | -% | | | | 4.91% | | | | 100.00% | |
Personal and home equity | | | 93.85% | | | | 0.11% | | | | 0.20% | | | | -% | | | | 5.84% | | | | 100.00% | |
| | | | | | | | | | | | | | | | | | | | | | | | |
Total loans | | | 96.81% | | | | 0.15% | | | | 0.16% | | | | -% | | | | 2.88% | | | | 100.00% | |
| | | | | | | | | | | | | | | | | | | | | | | | |
As of December 31, 2010 | | | | | | | | | | | | | | | | | | | | | | | | |
Loan Balances: | | | | | | | | | | | | | | | | | | | | | | | | |
Commercial | | $ | 4,793,144 | | | $ | 1,024 | | | $ | 759 | | | $ | - | | | $ | 70,241 | | | $ | 4,865,168 | |
Commercial real estate | | | 2,668,639 | | | | 10,264 | | | | 12,346 | | | | - | | | | 214,629 | | | | 2,905,878 | |
Construction | | | 495,435 | | | | - | | | | 1,895 | | | | - | | | | 33,403 | | | | 530,733 | |
Residential real estate | | | 300,027 | | | | 180 | | | | 4,098 | | | | - | | | | 14,841 | | | | 319,146 | |
Personal and home equity | | | 442,535 | | | | 14,098 | | | | 4,033 | | | | - | | | | 32,766 | | | | 493,432 | |
| | | | | | | | | | | | | | | | | | | | | | | | |
Total loans | | $ | 8,699,780 | | | $ | 25,566 | | | $ | 23,131 | | | $ | - | | | $ | 365,880 | | | $ | 9,114,357 | |
| | | | | | | | | | | | | | | | | | | | | | | | |
% of Loan Balance: | | | | | | | | | | | | | | | | | | | | | | | | |
Commercial | | | 98.52% | | | | 0.02% | | | | 0.02% | | | | -% | | | | 1.44% | | | | 100.00% | |
Commercial real estate | | | 91.83% | | | | 0.35% | | | | 0.43% | | | | -% | | | | 7.39% | | | | 100.00% | |
Construction | | | 93.35% | | | | -% | | | | 0.36% | | | | -% | | | | 6.29% | | | | 100.00% | |
Residential real estate | | | 94.01% | | | | 0.06% | | | | 1.28% | | | | -% | | | | 4.65% | | | | 100.00% | |
Personal and home equity | | | 89.68% | | | | 2.86% | | | | 0.82% | | | | -% | | | | 6.64% | | | | 100.00% | |
| | | | | | | | | | | | | | | | | | | | | | | | |
Total loans | | | 95.46% | | | | 0.28% | | | | 0.25% | | | | -% | | | | 4.01% | | | | 100.00% | |
| | | | | | | | | | | | | | | | | | | | | | | | |
53
The following table provides a comparison of our nonperforming assets, restructured loans accruing interest, and past due loans for the past five years.
Table 14
Nonperforming Assets, Restructured and Past Due Loans
(Dollars in thousands)
| | | | | | | | | | | | | | | | | | | | |
| | | December 31, | |
| | | 2011 | | | 2010 | | | 2009 | | | 2008 | | | 2007 | |
Nonaccrual loans: | | | | | | | | | | | | | | | | | | | | |
Commercial | | $ | 65,958 | | | $ | 70,241 | | | $ | 69,346 | | | $ | 11,735 | | | $ | 8,886 | |
Commercial real estate | | | 133,257 | | | | 214,629 | | | | 171,049 | | | | 48,143 | | | | 13,371 | |
Construction | | | 21,879 | | | | 33,403 | | | | 113,822 | | | | 63,305 | | | | 13,406 | |
Residential real estate | | | 14,589 | | | | 14,841 | | | | 14,481 | | | | 6,829 | | | | 898 | |
Personal and home equity | | | 24,169 | | | | 32,766 | | | | 26,749 | | | | 1,907 | | | | 2,422 | |
| | | | | | | | | | | | | | | | | | | | |
Total nonaccrual loans | | $ | 259,852 | | | $ | 365,880 | | | $ | 395,447 | | | $ | 131,919 | | | $ | 38,983 | |
90 days past due loans (still accruing interest) | | | - | | | | - | | | | - | | | | - | | | | 53 | |
| | | | | | | | | | | | | | | | | | | | |
Total nonperforming loans | | $ | 259,852 | | | $ | 365,880 | | | $ | 395,447 | | | $ | 131,919 | | | $ | 39,036 | |
OREO | | | 125,729 | | | | 88,728 | | | | 41,497 | | | | 23,823 | | | | 9,265 | |
| | | | | | | | | | | | | | | | | | | | |
Total nonperforming assets | | $ | 385,581 | | | $ | 454,608 | | | $ | 436,944 | | | $ | 155,742 | | | $ | 48,301 | |
| | | | | | | | | | | | | | | | | | | | |
Restructured loans accruing interest: | | | | | | | | | | | | | | | | | | | | |
Commercial | | $ | 47,768 | | | $ | 8,017 | | | $ | - | | | $ | - | | | $ | - | |
Commercial real estate | | | 36,149 | | | | 60,019 | | | | - | | | | - | | | | - | |
Construction | | | - | | | | 4,348 | | | | - | | | | - | | | | - | |
Residential real estate | | | 3,238 | | | | 798 | | | | - | | | | - | | | | - | |
Personal and home equity | | | 13,754 | | | | 14,394 | | | | - | | | | - | | | | - | |
| | | | | | | | | | | | | | | | | | | | |
Total restructured loans accruing interest | | $ | 100,909 | | | $ | 87,576 | | | $ | - | | | $ | - | | | $ | - | |
| | | | | | | | | | | | | | | | | | | | |
30-89 days past due loans | | $ | 28,322 | | | $ | 48,697 | | | $ | 102,661 | | | $ | 35,404 | | | $ | 102,598 | |
Nonperforming loans to total loans (excluding covered assets) | | | 2.88% | | | | 4.01% | | | | 4.37% | | | | 1.65% | | | | 0.93% | |
Nonperforming loans to total assets | | | 2.09% | | | | 2.94% | | | | 3.29% | | | | 1.32% | | | | 0.78% | |
Nonperforming assets to total assets | | | 3.11% | | | | 3.65% | | | | 3.63% | | | | 1.56% | | | | 0.97% | |
Allowance for loan losses as a percent of nonperforming loans | | | 74% | | | | 61% | | | | 56% | | | | 85% | | | | 125% | |
54
The following two tables present changes in our nonperforming loans and loans classified as restructured loans accruing interest portfolios for the years ended December 31, 2011 and 2010.
Table 15
Nonperforming Loans Rollforward
(Amounts in thousands)
| | | | | | | | |
| | | December 31, | |
| | | 2011 | | | 2010 | |
Balance at beginning of year | | $ | 365,880 | | | $ | 395,447 | |
Additions: | | | | | | | | |
New nonaccrual loans(1) | | | 341,523 | | | | 447,402 | |
Reductions: | | | | | | | | |
Return to performing status | | | (17,520) | | | | (42,900) | |
Paydowns and payoffs, net of advances | | | (46,675) | | | | (76,501) | |
Net sales | | | (97,027) | | | | (21,838) | |
Transfer to OREO | | | (131,390) | | | | (140,250) | |
Charge-offs, net | | | (154,939) | | | | (195,480) | |
| | | | | | | | |
Total reductions | | | (447,551) | | | | (476,969) | |
| | | | | | | | |
Balance at end of year | | $ | 259,852 | | | $ | 365,880 | |
| | | | | | | | |
(1)Amounts represent loan balances as of the end of the quarter in which loans were classified as new nonaccrual loans.
Table 16
Restructured Loans Accruing Interest Rollforward
(Amounts in thousands)
| | | | | | | | |
| | | December 31, | |
| | | 2011 | | | 2010 | |
Balance at beginning of year | | $ | 87,576 | | | $ | - | |
Additions: | | | | | | | | |
New restructured loans accruing interest(1) | | | 91,386 | | | | 98,826 | |
Restructured loans returned to accruing status | | | 2,128 | | | | - | |
Reductions: | | | | | | | | |
Paydowns and payoffs, net of advances | | | (33,329) | | | | 1,187 | |
Transferred to nonperforming loans | | | (24,855) | | | | (12,437) | |
Net sales | | | (11,860) | | | | - | |
Removal of restructured loan status(2) | | | (6,594) | | | | - | |
Charge-offs, net | | | (3,543) | | | | - | |
| | | | | | | | |
Balance at end of year | | $ | 100,909 | | | $ | 87,576 | |
| | | | | | | | |
| | (1) | Amounts represent loan balances as of the end of the quarter in which loans were classified as new restructured loans accruing interest. |
| | (2) | Loans were previously classified as an accruing TDR and subsequently re-underwritten as pass rated credits. Per our TDR policy, the TDR classification is removed. See “Management’s Discussion and Analysis of Financial Condition and Results of Operations – Credit Quality Management and Allowance for Loan Losses” for information regarding TDRs. |
55
The following table presents the stratification of our nonperforming loans as of December 31, 2011 and 2010.
Table 17
Nonperforming Loans Stratification
(Dollars in thousands)
| | | $259,85200 | | | | $259,85200 | | | | $259,85200 | | | | $259,85200 | | | | $259,85200 | | | | $259,85200 | |
| | | Stratification | |
| As of December 31, 2011 | | $10.0 Million
or More | | | $5.0 Million to
$9.9 Million | | | $3.0 Million to
$4.9 Million | | | $1.5 Million to
$2.9 Million | | | Under $1.5
Million | | | Total | |
| | | | | | |
Amount: | | | | | | | | | | | | | | | | | | | | | | | | |
Commercial | | $ | 30,226 | | | $ | 16,820 | | | $ | 3,448 | | | $ | 3,434 | | | $ | 12,030 | | | $ | 65,958 | |
Commercial real estate | | | 56,969 | | | | 10,257 | | | | 15,740 | | | | 21,549 | | | | 28,742 | | | | 133,257 | |
Construction | | | 12,490 | | | | - | | | | 4,760 | | | | 1,547 | | | | 3,082 | | | | 21,879 | |
Residential real estate | | | - | | | | - | | | | 4,789 | | | | 2,473 | | | | 7,327 | | | | 14,589 | |
Personal and home equity | | | - | | | | 7,108 | | | | - | | | | 3,795 | | | | 13,266 | | | | 24,169 | |
| | | | | | | | | | | | | | | | | | | | | | | | |
Total nonperforming loans | | $ | 99,685 | | | $ | 34,185 | | | $ | 28,737 | | | $ | 32,798 | | | $ | 64,447 | | | $ | 259,852 | |
| | | | | | | | | | | | | | | | | | | | | | | | |
| | | | | | |
Number of Borrowers: | | | | | | | | | | | | | | | | | | | | | | | | |
Commercial | | | 2 | | | | 2 | | | | 1 | | | | 2 | | | | 39 | | | | 46 | |
Commercial real estate | | | 4 | | | | 2 | | | | 4 | | | | 10 | | | | 56 | | | | 76 | |
Construction | | | 1 | | | | - | | | | 1 | | | | 1 | | | | 5 | | | | 8 | |
Residential real estate | | | - | | | | - | | | | 1 | | | | 1 | | | | 19 | | | | 21 | |
Personal and home equity | | | - | | | | 1 | | | | - | | | | 2 | | | | 37 | | | | 40 | |
| | | | | | | | | | | | | | | | | | | | | | | | |
Total | | | 7 | | | | 5 | | | | 7 | | | | 16 | | | | 156 | | | | 191 | |
| | | | | | | | | | | | | | | | | | | | | | | | |
| | |
As of December 31, 2010 | | | | | | | | |
| | | | | | |
Amount: | | | | | | | | | | | | | | | | | | | | | | | | |
Commercial | | $ | 32,344 | | | $ | 6,051 | | | $ | 8,420 | | | $ | 7,861 | | | $ | 15,565 | | | $ | 70,241 | |
Commercial real estate | | | 11,905 | | | | 61,718 | | | | 52,856 | | | | 33,912 | | | | 54,238 | | | | 214,629 | |
Construction | | | - | | | | 11,733 | | | | 4,434 | | | | 8,383 | | | | 8,853 | | | | 33,403 | |
Residential real estate | | | - | | | | - | | | | 4,790 | | | | - | | | | 10,051 | | | | 14,841 | |
Personal and home equity | | | 15,491 | | | | - | | | | 4,419 | | | | 1,932 | | | | 10,924 | | | | 32,766 | |
| | | | | | | | | | | | | | | | | | | | | | | | |
Total nonperforming loans | | $ | 59,740 | | | $ | 79,502 | | | $ | 74,919 | | | $ | 52,088 | | | $ | 99,631 | | | $ | 365,880 | |
| | | | | | | | | | | | | | | | | | | | | | | | |
| | | | | | |
Number of Borrowers: | | | | | | | | | | | | | | | | | | | | | | | | |
Commercial | | | 2 | | | | 1 | | | | 2 | | | | 3 | | | | 50 | | | | 58 | |
Commercial real estate | | | 1 | | | | 9 | | | | 13 | | | | 16 | | | | 92 | | | | 131 | |
Construction | | | - | | | | 2 | | | | 1 | | | | 4 | | | | 14 | | | | 21 | |
Residential real estate | | | - | | | | - | | | | 1 | | | | - | | | | 17 | | | | 18 | |
Personal and home equity | | | 1 | | | | - | | | | 1 | | | | 1 | | | | 28 | | | | 31 | |
| | | | | | | | | | | | | | | | | | | | | | | | |
Total | | | 4 | | | | 12 | | | | 18 | | | | 24 | | | | 201 | | | | 259 | |
| | | | | | | | | | | | | | | | | | | | | | | | |
56
The following table presents the stratification of our restructured loans accruing interest as of December 31, 2011 and 2010.
Table 18
Restructured Loans Accruing Interest Stratification
(Dollars in thousands)
| | | $100,909 00 | | | | $100,909 00 | | | | $100,909 00 | | | | $100,909 00 | | | | $100,909 00 | | | | $100,909 00 | |
| | | Stratification | |
| As of December 31, 2011 | | $10.0 Million
or More | | | $5.0 Million to
$9.9 Million | | | $3.0 Million to
$4.9 Million | | | $1.5 Million to
$2.9 Million | | | Under $1.5
Million | | | Total | |
| | | | | | |
Amount: | | | | | | | | | | | | | | | | | | | | | | | | |
Commercial | | $ | 15,279 | | | $ | 24,264 | | | $ | 4,331 | | | $ | - | | | $ | 3,894 | | | $ | 47,768 | |
Commercial real estate | | | 21,273 | | | | 5,165 | | | | - | | | | 4,944 | | | | 4,767 | | | | 36,149 | |
Residential real estate | | | - | | | | - | | | | - | | | | 2,213 | | | | 1,025 | | | | 3,238 | |
Personal and home equity | | | 12,691 | | | | - | | | | - | | | | - | | | | 1,063 | | | | 13,754 | |
| | | | | | | | | | | | | | | | | | | | | | | | |
Total restructured loans accruing interest | | $ | 49,243 | | | $ | 29,429 | | | $ | 4,331 | | | $ | 7,157 | | | $ | 10,749 | | | $ | 100,909 | |
| | | | | | | | | | | | | | | | | | | | | | | | |
| | | | | | |
Number of Borrowers: | | | | | | | | | | | | | | | | | | | | | | | | |
Commercial | | | 1 | | | | 4 | | | | 1 | | | | - | | | | 10 | | | | 16 | |
Commercial real estate | | | 1 | | | | 1 | | | | - | | | | 2 | | | | 10 | | | | 14 | |
Residential real estate | | | - | | | | - | | | | - | | | | 1 | | | | 2 | | | | 3 | |
Personal and home equity | | | 1 | | | | - | | | | - | | | | - | | | | 2 | | | | 3 | |
| | | | | | | | | | | | | | | | | | | | | | | | |
Total | | | 3 | | | | 5 | | | | 1 | | | | 3 | | | | 24 | | | | 36 | |
| | | | | | | | | | | | | | | | | | | | | | | | |
As of December 31, 2010 | | | | | | | | | | | | | | | | | | | | | | | | |
| | | | | | |
Amount: | | | | | | | | | | | | | | | | | | | | | | | | |
Commercial | | $ | - | | | $ | - | | | $ | - | | | $ | 4,553 | | | $ | 3,464 | | | $ | 8,017 | |
Commercial real estate | | | 36,409 | | | | 5,250 | | | | 7,064 | | | | 4,662 | | | | 6,634 | | | | 60,019 | |
Construction | | | - | | | | - | | | | 3,112 | | | | - | | | | 1,236 | | | | 4,348 | |
Residential real estate | | | - | | | | - | | | | - | | | | - | | | | 798 | | | | 798 | |
Personal and home equity | | | 13,114 | | | | - | | | | - | | | | - | | | | 1,280 | | | | 14,394 | |
| | | | | | | | | | | | | | | | | | | | | | | | |
Total restructured loans accruing interest | | $ | 49,523 | | | $ | 5,250 | | | $ | 10,176 | | | $ | 9,215 | | | $ | 13,412 | | | $ | 87,576 | |
| | | | | | | | | | | | | | | | | | | | | | | | |
| | | | | | |
Number of Borrowers: | | | | | | | | | | | | | | | | | | | | | | | | |
Commercial | | | - | | | | - | | | | - | | | | 2 | | | | 7 | | | | 9 | |
Commercial real estate | | | 2 | | | | 1 | | | | 2 | | | | 2 | | | | 9 | | | | 16 | |
Construction | | | - | | | | - | | | | 1 | | | | - | | | | 1 | | | | 2 | |
Residential real estate | | | - | | | | - | | | | - | | | | - | | | | 1 | | | | 1 | |
Personal and home equity | | | 1 | | | | - | | | | - | | | | - | | | | 1 | | | | 2 | |
| | | | | | | | | | | | | | | | | | | | | | | | |
Total | | | 3 | | | | 1 | | | | 3 | | | | 4 | | | | 19 | | | | 30 | |
| | | | | | | | | | | | | | | | | | | | | | | | |
57
The following table presents the credit quality of our loan portfolio as of December 31, 2011 and 2010, segmented by our transformational and legacy portfolios. We have reduced the level of problem loans in every category, with an overall reduction of 50% from December 31, 2010. Legacy loans, which represent approximately 23% of our total loan portfolio and 56% of nonperforming loans at December 31, 2011, decreased by $927.0 million from December 31, 2010.
Table 19
Credit Quality
(Dollars in thousands)
| | | | | | | | | | | | | | | | | | | | | | | | | | | | | | | | | | |
| | | Special
Mention | | | % of
Portfolio
Loan
Type | | | | | Potential
Problem
Loans | | | % of
Portfolio
Loan
Type | | | | | Non-
Performing
Loans | | | % of
Portfolio
Loan
Type | | | | | Total
Loans | |
As of December 31, 2011 | | | | | | | | | | | | | | | | | | | | | | | | | | | | | | | | | | |
Transformational | | | | | | | | | | | | | | | | | | | | | | | | | | | | | | | | | | |
Commercial | | $ | 41,995 | | | | 0.8 | | | | | $ | 66,279 | | | | 1.3 | | | | | $ | 49,220 | | | | 1.0 | | | | | $ | 4,951,935 | |
Commercial real estate | | | 59,031 | | | | 3.9 | | | | | | 1,769 | | | | 0.1 | | | | | | 49,031 | | | | 3.3 | | | | | | 1,497,661 | |
Construction | | | 7,272 | | | | 3.6 | | | | | | 9,283 | | | | 4.6 | | | | | | 12,489 | | | | 6.2 | | | | | | 201,879 | |
Residential real estate | | | 4,490 | | | | 3.5 | | | | | | 5,450 | | | | 4.2 | | | | | | 2,844 | | | | 2.2 | | | | | | 129,161 | |
Home equity | | | - | | | | - | | | | | | 381 | | | | 0.7 | | | | | | 78 | | | | 0.1 | | | | | | 54,530 | |
Personal | | | - | | | | - | | | | | | 866 | | | | 0.6 | | | | | | 330 | | | | 0.2 | | | | | | 139,643 | |
| | | | | | | | | | | | | | | | | | | | | | | | | | | | | | | | | | |
Total transformational | | $ | 112,788 | | | | 1.6 | | | | | $ | 84,028 | | | | 1.2 | | | | | $ | 113,992 | | | | 1.6 | | | | | $ | 6,964,809 | |
Legacy | | | | | | | | | | | | | | | | | | | | | | | | | | | | | | | | | | |
Commercial | | $ | 12,331 | | | | 2.7 | | | | | $ | 13,049 | | | | 2.9 | | | | | $ | 16,738 | | | | 3.7 | | | | | $ | 457,826 | |
Commercial real estate | | | 73,884 | | | | 6.6 | | | | | | 60,424 | | | | 5.4 | | | | | | 84,226 | | | | 7.6 | | | | | | 1,112,798 | |
Construction | | | - | | | | - | | | | | | - | | | | - | | | | | | 9,390 | | | | 11.0 | | | | | | 85,123 | |
Residential real estate | | | 4,854 | | | | 2.9 | | | | | | 12,481 | | | | 7.4 | | | | | | 11,745 | | | | 7.0 | | | | | | 168,068 | |
Home equity | | | 758 | | | | 0.6 | | | | | | 6,003 | | | | 4.7 | | | | | | 11,525 | | | | 9.1 | | | | | | 126,628 | |
Personal | | | 350 | | | | 0.4 | | | | | | 1,110 | | | | 1.2 | | | | | | 12,236 | | | | 13.1 | | | | | | 93,309 | |
| | | | | | | | | | | | | | | | | | | | | | | | | | | | | | | | | | |
Total legacy | | $ | 92,177 | | | | 4.5 | | | | | $ | 93,067 | | | | 4.6 | | | | | $ | 145,860 | | | | 7.1 | | | | | $ | 2,043,752 | |
| | | | | | | | | | | | | | | | | | | | | | | | | | | | | | | | | | |
Total | | $ | 204,965 | | | | 2.3 | | | | | $ | 177,095 | | | | 2.0 | | | | | $ | 259,852 | | | | 2.9 | | | | | $ | 9,008,561 | |
| | | | | | | | | | | | | | | | | | | | | | | | | | | | | | | | | | |
As of December 31, 2010 | | | | | | | | | | | | | | | | | | | | | | | | | | | | | | | | | | |
Transformational | | | | | | | | | | | | | | | | | | | | | | | | | | | | | | | | | | |
Commercial | | $ | 85,039 | | | | 2.0 | | | | | $ | 121,816 | | | | 2.9 | | | | | $ | 39,192 | | | | 0.9 | | | | | $ | 4,246,469 | |
Commercial real estate | | | 87,495 | | | | 6.6 | | | | | | 125,497 | | | | 9.4 | | | | | | 22,214 | | | | 1.7 | | | | | | 1,329,378 | |
Construction | | | 37,590 | | | | 11.7 | | | | | | 21,774 | | | | 6.8 | | | | | | 105 | | | | * | | | | | | 320,151 | |
Residential real estate | | | 1,214 | | | | 1.4 | | | | | | 5,888 | | | | 6.8 | | | | | | 35 | | | | * | | | | | | 86,473 | |
Home equity | | | - | | | | - | | | | | | 346 | | | | 1.2 | | | | | | - | | | | - | | | | | | 28,356 | |
Personal | | | - | | | | - | | | | | | 1,280 | | | | 1.0 | | | | | | - | | | | - | | | | | | 132,813 | |
| | | | | | | | | | | | | | | | | | | | | | | | | | | | | | | | | | |
Total transformational | | $ | 211,338 | | | | 3.4 | | | | | $ | 276,601 | | | | 4.5 | | | | | $ | 61,546 | | | | 1.0 | | | | | $ | 6,143,640 | |
Legacy | | | | | | | | | | | | | | | | | | | | | | | | | | | | | | | | | | |
Commercial | | $ | 26,891 | | | | 4.3 | | | | | $ | 52,013 | | | | 8.4 | | | | | $ | 31,049 | | | | 5.0 | | | | | $ | 618,699 | |
Commercial real estate | | | 115,577 | | | | 7.3 | | | | | | 134,545 | | | | 8.5 | | | | | | 192,415 | | | | 12.2 | | | | | | 1,576,500 | |
Construction | | | 30,325 | | | | 14.4 | | | | | | 23,345 | | | | 11.1 | | | | | | 33,298 | | | | 15.8 | | | | | | 210,582 | |
Residential real estate | | | 8,748 | | | | 3.8 | | | | | | 9,213 | | | | 4.0 | | | | | | 14,806 | | | | 6.4 | | | | | | 232,673 | |
Home equity | | | 3,757 | | | | 2.2 | | | | | | 10,926 | | | | 6.5 | | | | | | 8,195 | | | | 4.9 | | | | | | 168,823 | |
Personal | | | 2,198 | | | | 1.3 | | | | | | 947 | | | | 0.6 | | | | | | 24,571 | | | | 15.0 | | | | | | 163,440 | |
| | | | | | | | | | | | | | | | | | | | | | | | | | | | | | | | | | |
Total legacy | | $ | 187,496 | | | | 6.3 | | | | | $ | 230,989 | | | | 7.8 | | | | | $ | 304,334 | | | | 10.2 | | | | | $ | 2,970,717 | |
| | | | | | | | | | | | | | | | | | | | | | | | | | | | | | | | | | |
Total | | $ | 398,834 | | | | 4.4 | | | | | $ | 507,590 | | | | 5.6 | | | | | $ | 365,880 | | | | 4.0 | | | | | $ | 9,114,357 | |
| | | | | | | | | | | | | | | | | | | | | | | | | | | | | | | | | | |
58
Foreclosed real estate
OREO totaled $125.7 million at December 31, 2011, compared to $88.7 million at December 31, 2010, and is comprised of 400 properties. The increase in OREO properties from year end 2010 reflects our efforts to move problem loans through the credit management collection process by means of foreclosure or other resolution strategy to gain control of the real estate collateral for ultimate sale. Given current economic conditions and the difficult real estate market, the time required to sell these properties in an orderly fashion has increased, and OREO is likely to remain elevated as nonperforming commercial real estate loans continue to move through the collection process. OREO is recorded at the lower of the recorded investment in the loan at the time of acquisition or the fair value, determined on the basis of current appraisals, comparable sales, and other estimates of value obtained principally from independent sources, adjusted for estimated selling costs. Updated appraisals on OREO are typically obtained every twelve months and evaluated internally at least every six months. Table 20 presents a rollforward of OREO for the years ended December 31, 2011 and 2010. Table 21 presents the composition of OREO properties at December 31, 2011 and 2010 and Table 22 presents OREO property by geographic location at December 31, 2011 and 2010.
Table 20
OREO Rollforward
(Amounts in thousands)
| | | | | | | | |
| | | Year Ended December 31, | |
| | | 2011 | | | 2010 | |
Beginning balance | | $ | 88,728 | | | $ | 41,497 | |
New foreclosed properties | | | 131,396 | | | | 140,980 | |
Valuation adjustments | | | (15,419) | | | | (6,588) | |
Disposals: | | | | | | | | |
Sale proceeds | | | (69,898) | | | | (85,809) | |
Net loss on sale | | | (9,078) | | | | (1,352) | |
| | | | | | | | |
Ending balance | | $ | 125,729 | | | $ | 88,728 | |
| | | | | | | | |
Table 21
OREO Properties by Type
(Dollars in thousands)
| | | | | | | | | | | | | | | | | | | | | | | | |
| | | December 31, 2011 | | | December 31, 2010 | |
| | | Number
of Properties | | | Amount | | | % of
Total | | | Number
of Properties | | | Amount | | | % of
Total | |
Single-family homes | | | 71 | | | $ | 26,866 | | | | 21 | | | | 24 | | | $ | 21,534 | | | | 24 | |
Land parcels | | | 262 | | | | 51,465 | | | | 41 | | | | 320 | | | | 34,122 | | | | 38 | |
Multi-family | | | 14 | | | | 3,327 | | | | 3 | | | | 14 | | | | 6,061 | | | | 7 | |
Office/industrial | | | 44 | | | | 37,019 | | | | 29 | | | | 20 | | | | 26,511 | | | | 30 | |
Retail | | | 9 | | | | 7,052 | | | | 6 | | | | 1 | | | | 500 | | | | 1 | |
| | | | | | | | | | | | | | | | | | | | | | | | |
Total OREO properties | | | 400 | | | $ | 125,729 | | | | 100 | | | | 379 | | | $ | 88,728 | | | | 100 | |
| | | | | | | | | | | | | | | | | | | | | | | | |
59
Table 22
OREO Property Type by Location
(Dollars in thousands)
| | | | | | | | | | | | | | | | | | | | | | | | | | | | |
| | | Illinois | | | Georgia | | | Michigan | | | South
Eastern (1) | | | Mid
Western (2) | | | Other | | | Total | |
As of December 31, 2011 | | | | | | | | | | | | | | | | | | | | | | | | | | | | |
Single-family homes | | $ | 23,277 | | | $ | 385 | | | $ | 1,718 | | | $ | - | | | $ | 608 | | | $ | 878 | | | $ | 26,866 | |
Land parcels | | | 29,370 | | | | 2,898 | | | | 3,171 | | | | 9,568 | | | | 6,458 | | | | - | | | | 51,465 | |
Multi-family | | | 3,327 | | | | - | | | | - | | | | - | | | | - | | | | - | | | | 3,327 | |
Office/industrial | | | 18,430 | | | | 1,656 | | | | 548 | | | | 3,762 | | | | 9,228 | | | | 3,395 | | | | 37,019 | |
Retail | | | 4,501 | | | | 1,615 | | | | 936 | | | | - | | | | - | | | | - | | | | 7,052 | |
| | | | | | | | | | | | | | | | | | | | | | | | | | | | |
Total OREO properties | | $ | 78,905 | | | $ | 6,554 | | | $ | 6,373 | | | $ | 13,330 | | | $ | 16,294 | | | $ | 4,273 | | | $ | 125,729 | |
| | | | | | | | | | | | | | | | | | | | | | | | | | | | |
% of Total | | | 63% | | | | 5% | | | | 5% | | | | 11% | | | | 13% | | | | 3% | | | | 100% | |
| | | | | | | |
As of December 31, 2010 | | | | | | | | | | | | | | | | | | | | | | | | | | | | |
Single-family homes | | $ | 14,943 | | | $ | 139 | | | $ | 6,194 | | | $ | - | | | $ | 258 | | | $ | - | | | $ | 21,534 | |
Land parcels | | | 10,874 | | | | 4,772 | | | | 3,626 | | | | 10,396 | | | | 4,454 | | | | - | | | | 34,122 | |
Multi-family | �� | | 5,166 | | | | - | | | | 895 | | | | - | | | | - | | | | - | | | | 6,061 | |
Office/industrial | | | 13,505 | | | | 1,104 | | | | 3,787 | | | | 4,573 | | | | 3,542 | | | | - | | | | 26,511 | |
Retail | | | 500 | | | | - | | | | - | | | | - | | | | - | | | | - | | | | 500 | |
| | | | | | | | | | | | | | | | | | | | | | | | | | | | |
Total OREO properties | | $ | 44,988 | | | $ | 6,015 | | | $ | 14,502 | | | $ | 14,969 | | | $ | 8,254 | | | $ | - | | | $ | 88,728 | |
| | | | | | | | | | | | | | | | | | | | | | | | | | | | |
% of Total | | | 51% | | | | 7% | | | | 16% | | | | 17% | | | | 9% | | | | - | | | | 100% | |
| | (1) | Represents the southeastern states of Arkansas and Florida. |
| | (2) | Represents the Midwestern states of Kansas, Missouri, Wisconsin, Indiana and Ohio. |
At December 31, 2011, OREO land parcels, currently an illiquid asset class, consisted of 262 properties and represented the largest portion of OREO at 41% of the total OREO carrying value with a total value of $51.5 million. Office/industrial properties represented 29% of the total OREO carrying value and consisted of 44 properties. Single-family homes represented 21% of the total OREO carrying value and consisted of 71 properties.
Credit Quality Management and Allowance for Loan Losses
We maintain an allowance for loan losses at a level management believes is sufficient to absorb credit losses inherent in the loan portfolio. The allowance for loan losses is assessed quarterly and represents an accounting estimate of probable losses in the portfolio at each balance sheet date based on a review of available and relevant information at that time. The allowance is not a prediction of our actual credit losses going forward based on current and available information. The allowance contains provisions for probable losses that have been identified relating to specific borrowing relationships that are considered to be impaired (the “specific component” of the allowance), as well as probable losses inherent in the loan portfolio that are not specifically identified (the “general allocated component” of the allowance), which is determined using a methodology that is a function of quantitative and qualitative factors and management judgment applied to defined segments of our loan portfolio.
The specific component of the allowance relates to impaired loans. Impaired loans consist of nonaccrual loans (which include nonaccrual TDRs) and loans classified as accruing TDRs. A loan is considered nonaccrual when, based on current information and events, management believes that it is probable that we will be unable to collect all amounts due (both principal and interest) according to the original contractual terms of the loan agreement. All loans that are over 90 days past due in principal or interest are by definition considered “impaired” and placed on nonaccrual status. Management may also place some loans on nonaccrual status before they are 90 days past due if they meet the above definition of “impaired.” Once a loan is determined to be impaired, the amount of impairment is measured based on the loan’s observable fair value, the fair value of the underlying collateral less selling costs if the loan is collateral-dependent, or the present value of expected future cash flows discounted at the loan’s effective interest rate. Impaired loans exceeding $500,000 are evaluated individually while smaller loans are evaluated as pools using historical loss experience as well as management’s loss expectations for the respective asset class and product type. If the estimated fair value of the impaired loan is less than the recorded investment in the loan (including accrued interest, net of deferred loan fees and costs and unamortized premium or discount), impairment is recognized by creating a specific reserve as a component of the allowance for loan losses. The recognition of any reserve required on new impaired loans is recorded in the same quarter in which the transfer of the loan to nonaccrual status occurred. All impaired loans are reviewed quarterly for any changes that would affect the specific reserve. Any impaired loan in which a determination has been made that the economic value is permanently reduced is charged-off against the allowance for loan losses to reflect its current economic value in the period in which the determination has been made.
60
When collateral-dependent real estate loans are determined to be impaired, updated appraisals are typically obtained every twelve months and evaluated internally at least every six months. In addition, both borrower and market-specific factors are taken into consideration, which may result in obtaining more frequent appraisal updates or internal assessments. Appraisals are conducted by third-party independent appraisers under internal direction and engagement. Any appraisal with a value in excess of $250,000 is subject to a compliance review. Appraisals received with a value in excess of $1.0 million are subject to a technical review. Appraisals are either reviewed internally or sent to an outside technical firm if appropriate. Both levels of review involve a scope appropriate for the complexity and risk associated with the loan and its collateral. We consider other factors or recent developments which could adjust the valuations indicated in the appraisals or internal reviews. As of December 31, 2011, the average appraisal age used in the impaired loan valuation process was approximately 200 days. The amount of impaired assets which, by policy, requires an independent appraisal, but does not have a current external appraisal at year end due to the timing of the receipt of the appraisal is not material to the overall reserve. In situations such as this, we establish a probable impairment reserve for the account based on our experience in the related asset class and type.
The general allocated component of the allowance is determined using a methodology that is a function of quantitative and qualitative factors applied to segments of our loan portfolio. The methodology takes into account at a product level the originating line of business and vintage (transformational or legacy), the origination year, the risk rating migration of the note, and historical default and loss history of similar products. Using this information, the methodology produces a range of possible reserve amounts by product type. We consider the appropriate balance of the general allocated component of the reserve within these ranges based on a variety of internal and external quantitative and qualitative factors to reflect data or timeframes not captured by the model as well as market and economic data and management judgment. In certain instances, these additional factors and judgments may lead to management’s conclusion that the appropriate level of the reserve is outside the range determined through the framework. In our evaluation of the adequacy of the allowance at December 31, 2011, we considered a number of factors for each product that included, but were not limited to, the following: for the commercial portfolio, the pace of growth in the commercial loan sector, the existence of larger individual credits and specialized industry concentrations, and general macroeconomic indicators such as GDP employment trends, and manufacturing activity, which overall show some signs of improvement in recent months, but still are susceptible to sustainability risk and possible negative ramifications from the European debt crisis; for the commercial real estate portfolio, the potential impact of general commercial real estate trends, particularly occupancy and leasing rate trends, charge-off severity and collateral value changes; for the construction portfolio, construction employment, industry experience on construction loan losses, and construction spending rates, and for the residential, home equity, and personal portfolios, home price indices and sales volume, vacancy rates, delinquency rates and general economic conditions and interest rate trends which impact these products. The Bank has limited exposure with a related junior collateral position in any product type with the exception of Home Equity Lines of Credit (HELOCs). This product is by definition usually secured in the junior position to the first mortgage on the related property. The Bank evaluates the allowance for loan losses for HELOCs as one of our six primary, segregated product types. Default rates on our HELOC portfolio have historically been below industry averages and our allowance reflects the performance and loss history unique to our portfolio.
The establishment of the allowance for loan losses involves a high degree of judgment and includes an inherent level of imprecision given the difficulty of identifying all the factors impacting loan repayment and the timing of when losses actually occur. While management utilizes its best judgment and information available, the ultimate adequacy of the allowance is dependent upon a variety of factors beyond our control, including, but not limited to, client performance, the economy, changes in interest rates and property values, and the interpretation by regulatory authorities of loan classifications.
Although we determine the amount of each element of the allowance separately and consider this process to be an important credit management tool, the entire allowance for loan losses is available for the entire loan portfolio.
Management evaluates the adequacy of the allowance for loan losses and reviews the allowance for loan losses and the underlying methodology with the Audit Committee of the Board of Directors quarterly. As of December 31, 2011, management concluded the allowance for loan losses was adequate (i.e., sufficient to absorb losses that are inherent in the portfolio at that date, including those not yet identifiable).
As an integral part of their examination process, various federal and state regulatory agencies also review the allowance for loan losses. These agencies may require that certain loan balances be classified differently or charged off when their credit evaluations differ from those of management, based on their judgments about information available to them at the time of their examination.
The accounting policies underlying the establishment and maintenance of the allowance for loan losses through provisions charged to operating expense are discussed in Note 1 of “Notes to Consolidated Financial Statements” in Item 8 of this Form 10-K.
61
The following table presents changes in the allowance for loan losses, excluding covered assets, for the past five years.
Table 23
Allowance for Loan Losses and
Summary of Loan Loss Experience
(Dollars in thousands)
| | | | | | | | | | | | | | | | | | | | |
| | | Years ended December 31, | |
| | 2011 | | | 2010 | | | 2009 | | | 2008 | | | 2007 | |
Change in allowance for loan losses: | | | | | | | | | | | | | | | | | | | | |
Balance at beginning of year | | $ | 222,821 | | | $ | 221,688 | | | $ | 112,672 | | | $ | 48,891 | | | $ | 38,069 | |
Loans charged-off: | | | | | | | | | | | | | | | | | | | | |
Commercial | | | (32,742) | | | | (32,160) | | | | (31,745) | | | | (14,926) | | | | (2,668) | |
Commercial real estate | | | (108,814) | | | | (100,467) | | | | (27,565) | | | | (49,905) | | | | (1,918) | |
Construction | | | (11,282) | | | | (27,499) | | | | (23,471) | | | | (54,438) | | | | (1,347) | |
Residential real estate | | | (2,009) | | | | (4,735) | | | | (1,495) | | | | (3,022) | | | | - | |
Home equity | | | (6,586) | | | | (3,708) | | | | (1,186) | | | | (2,199) | | | | - | |
Personal | | | (9,594) | | | | (28,471) | | | | (15,798) | | | | (2,196) | | | | (383) | |
| | | | | | | | | | | | | | | | | | | | |
Total charge-offs | | | (171,027) | | | | (197,040) | | | | (101,260) | | | | (126,686) | | | | (6,316) | |
| | | | | | | | | | | | | | | | | | | | |
Recoveries on loans previously charged-off: | | | | | | | | | | | | | | | | | | | | |
Commercial | | | 4,280 | | | | 2,967 | | | | 3,988 | | | | 239 | | | | 168 | |
Commercial real estate | | | 3,162 | | | | 1,328 | | | | 1,759 | | | | 74 | | | | 1 | |
Construction | | | 291 | | | | 983 | | | | 5,057 | | | | 482 | | | | - | |
Residential real estate | | | 61 | | | | 33 | | | | 152 | | | | 47 | | | | - | |
Home equity | | | 337 | | | | 95 | | | | 73 | | | | 1 | | | | - | |
Personal | | | 1,114 | | | | 743 | | | | 381 | | | | 45 | | | | 35 | |
| | | | | | | | | | | | | | | | | | | | |
Total recoveries | | | 9,245 | | | | 6,149 | | | | 11,410 | | | | 888 | | | | 204 | |
| | | | | | | | | | | | | | | | | | | | |
Net charge-offs | | | (161,782) | | | | (190,891) | | | | (89,850) | | | | (125,798) | | | | (6,112) | |
Provisions charged to operating expense | | | 130,555 | | | | 192,024 | | | | 198,866 | | | | 189,579 | | | | 16,934 | |
| | | | | | | | | | | | | | | | | | | | |
Balance at end of year | | $ | 191,594 | | | $ | 222,821 | | | $ | 221,688 | | | $ | 112,672 | | | $ | 48,891 | |
| | | | | | | | | | | | | | | | | | | | |
| | | | | |
Total loans, excluding covered assets, at year end | | $ | 9,008,561 | | | $ | 9,114,357 | | | $ | 9,046,625 | | | $ | 8,001,789 | | | $ | 4,177,525 | |
Allowance as a percent of loans at year end | | | 2.13% | | | | 2.44% | | | | 2.45% | | | | 1.41% | | | | 1.17% | |
Average loans, excluding covered assets | | $ | 8,915,750 | | | $ | 8,980,368 | | | $ | 8,806,217 | | | $ | 6,283,662 | | | $ | 3,678,818 | |
Ratio of net charge-offs to average loans outstanding for the year | | | 1.81% | | | | 2.13% | | | | 1.02% | | | | 2.00% | | | | 0.17% | |
Our allowance for loan losses declined $31.2 million from $222.8 million at December 31, 2010 to $191.6 million at December 31, 2011. The decrease in the allowance is primarily the result of an improved credit risk profile for the performing portfolio as reflected in the reduced levels of special mention and potential problem loans and improving loan portfolio mix due to the reshaping activities previously discussed. The ratio of the allowance for loan losses to total loans (excluding covered assets) was 2.13% at December 31, 2011, down from 2.44% as of December 31, 2010. The allowance for loan losses as a percentage of nonperforming loans was 74% compared to the December 31, 2010 level of 61%. The provision for loan losses was $130.6 million for 2011, compared to $192.0 million in 2010.
For 2011, net charge-offs totaled $161.8 million as compared to $190.9 million in 2010. Continued high levels of charge-offs reflect real estate collateral values, particularly land values, which have remained low. Commercial real estate comprised 65% of net charge-offs in 2011, reflecting the challenging market conditions associated with these loan types.
62
The following table presents our allocation of the allowance for loan losses by specific category for the past five years.
Table 24
Allocation of Allowance for Loan Losses
(Dollars in thousands)
| | | | | | | | | | | | | | | | | | | | | | | | | | | | | | | | | | | | | | | | |
| | | As of December 31, | |
| | | 2011 | | | % of
Total
Allowance | | | 2010 | | | % of
Total
Allowance | | | 2009 | | | % of
Total
Allowance | | | 2008 | | | % of
Total
Allowance | | | 2007 | | | % of
Total
Allowance | |
General allocated reserve: | | | | | | | | | | | | | | | | | | | | | | | | | | | | | | | | | | | | | | | | |
Commercial | | $ | 46,500 | | | | 24 | | | $ | 52,100 | | | | 23 | | | $ | 43,350 | | | | 20 | | | $ | 39,524 | | | | 35 | | | $ | 8,375 | | | | 17 | |
Commercial real estate | | | 56,000 | | | | 29 | | | | 72,850 | | | | 33 | | | | 77,223 | | | | 35 | | | | 31,625 | | | | 28 | | | | 22,909 | | | | 47 | |
Construction | | | 7,650 | | | | 4 | | | | 16,000 | | | | 7 | | | | 23,581 | | | | 10 | | | | 27,231 | | | | 24 | | | | 9,966 | | | | 20 | |
Residential real estate | | | 5,400 | | | | 3 | | | | 4,275 | | | | 2 | | | | 3,635 | | | | 2 | | | | 1,294 | | | | 1 | | | | 360 | | | | 1 | |
Home equity | | | 2,750 | | | | 1 | | | | 3,150 | | | | 1 | | | | 2,862 | | | | 1 | | | | 1,000 | | | | 1 | | | | 202 | | | | - | |
Personal | | | 3,350 | | | | 2 | | | | 3,475 | | | | 2 | | | | 5,277 | | | | 2 | | | | 1,527 | | | | 2 | | | | 2,229 | | | | 5 | |
| | | | | | | | | | | | | | | | | | | | | | | | | | | | | | | | | | | | | | | | |
Total allocated | | | 121,650 | | | | 63 | | | | 151,850 | | | | 68 | | | | 155,928 | | | | 70 | | | | 102,201 | | | | 91 | | | | 44,041 | | | | 90 | |
Specific reserve | | | 69,944 | | | | 37 | | | | 70,971 | | | | 32 | | | | 65,760 | | | | 30 | | | | 330 | | | | - | | | | 2,964 | | | | 6 | |
Unallocated reserve | | | - | | | | - | | | | - | | | | - | | | | - | | | | - | | | | 10,141 | | | | 9 | | | | 1,886 | | | | 4 | |
| | | | | | | | | | | | | | | | | | | | | | | | | | | | | | | | | | | | | | | | |
Total | | $ | 191,594 | | | | 100 | | | $ | 222,821 | | | | 100 | | | $ | 221,688 | | | | 100 | | | $ | 112,672 | | | | 100 | | | $ | 48,891 | | | | 100 | |
| | | | | | | | | | | | | | | | | | | | | | | | | | | | | | | | | | | | | | | | |
Under our methodology, the allowance for loan losses is comprised of the following components:
General Allocated Component of the Allowance
The general allocated component of the allowance decreased by $30.2 million during 2011, from $151.9 million at December 31, 2010 to $121.7 million at December 31, 2011. The reduction in the general allocated reserve was primarily influenced by the improved risk profile of the performing portfolio during the year, as exposure in special mention and potential problem loans declined by $524.4 million, or 58%, due in part to the sale or other disposition of these problem credits. Also, the portfolio is becoming more weighted in transformational and commercial loans, where our historical credit performance has been better, and less weighted in legacy and commercial real estate loans, where historical performance has been weaker. This changing mix positively impacts reserve requirements, based on our historical loss experience to date.
The allocated reserve for our commercial real estate and construction portfolios, which represented 52% of our total allocated reserve at December 31, 2011, declined $25.2 million, or 28%, from December 31, 2010. The decrease in this allocation is primarily due to a lower balance and improved risk ratings of remaining loans in the commercial real estate and construction sectors at the end of the current year as compared to the prior year. The combined coverage ratio of the allocated reserve for these portfolios was 2.2% at December 31, 2011 and 2.6% at December 31, 2010.
Specific Component of the Allowance
At December 31, 2011, the specific component of the allowance decreased by $1.1 million to $69.9 million from $71.0 million at December 31, 2010. The specific reserve requirements are primarily influenced by new loan additions to nonperforming status, as well as changes to collateral values. Our impaired loans are primarily collateral-dependent with such loans totaling $291.1 million of the total $360.8 million in impaired loans at December 31, 2011.
Reserve for Unfunded Commitments
In addition to the allowance for loan losses, we maintain a reserve for unfunded commitments at a level we believe to be sufficient to absorb estimated probable losses related to unfunded credit facilities. At December 31, 2011, our reserve for unfunded commitments declined $842,000 from December 31, 2010 to $7.2 million as a result of an improved risk profile of the portfolio and a lower propensity to fund. Net adjustments to the reserve for unfunded commitments are included in other non-interest expense in the Consolidated Statements of Income. Unfunded commitments, excluding covered assets, totaled $4.4 billion and $4.1 billion at December 31, 2011 and 2010, respectively.
63
COVERED ASSETS
Covered assets represent purchased loans and foreclosed loan collateral covered under loss sharing agreements with the FDIC as a result of the 2009 FDIC-assisted acquisition of the former Founders Bank from the FDIC. Under the loss share agreements, the FDIC generally will assume 80% of the first $173 million of credit losses and 95% of the credit losses in excess of $173 million, in both cases relating to assets existing at the date of acquisition.
The carrying amounts of covered assets as of December 31, 2011 and 2010 are presented in the following table:
Table 25
Covered Assets
(Amounts in thousands)
| | | | | | | | |
| | | December 31, | |
| | | 2011 | | | 2010 | |
Commercial loans | | $ | 31,568 | | | $ | 44,812 | |
Commercial real estate loans | | | 150,210 | | | | 189,194 | |
Residential mortgage loans | | | 50,403 | | | | 56,748 | |
Consumer installment and other loans | | | 6,123 | | | | 9,129 | |
Foreclosed real estate | | | 30,342 | | | | 32,155 | |
Assets in lieu | | | - | | | | 469 | |
Estimated loss reimbursement by the FDIC | | | 38,161 | | | | 64,703 | |
| | | | | | | | |
Total covered assets | | | 306,807 | | | | 397,210 | |
Allowance for covered loan losses | | | (25,939) | | | | (15,334) | |
| | | | | | | | |
Net covered assets | | $ | 280,868 | | | $ | 381,876 | |
| | | | | | | | |
Total covered assets decreased by $90.4 million, or 23%, from $397.2 million at December 31, 2010 to $306.8 million at December 31, 2011. The reduction is primarily attributable to $59.1 million in principal paydowns, net of advances, as well as the resulting impact of such on the evaluation of expected cash flows and discount accretion levels. In addition, the estimated loss reimbursement by the FDIC (“the FDIC indemnification receivable”) further contributed to the reduction as a result of loss claims paid by the FDIC. The allowance for covered loan losses increased by $10.6 million to $25.9 million at December 31, 2011 from $15.3 million at December 31, 2010, reflecting a further credit deterioration in expected cash flows on certain pools of covered loans since the date of acquisition. Of the total increase in the allowance for covered loan losses, 80% was offset through the FDIC indemnification receivable and the remaining 20% representing the non-reimbursable portion of the loss share agreement recognized as a charge to provision for loan and covered loan losses on the Consolidated Statements of Income. As of December 31, 2011, the FDIC had reimbursed the Company $88.6 million in losses under the loss share agreements.
The following table presents covered loan delinquencies and nonperforming covered assets as of December 31, 2011 and 2010 and excludes purchased impaired loans which are accounted for on a pool basis. Since each purchased impaired pool is accounted for as a single asset with a single composite interest rate and an aggregate expectation of cash flows, the past due status of the pools, or that of individual loans within the pools, is not meaningful. Because we are recognizing interest income on each pool of such loans, they are all considered to be performing. Covered assets are excluded from the asset quality presentation of our originated loan portfolio, given the loss share indemnification from the FDIC.
Table 26
Past Due Covered Loans and Nonperforming Covered Assets
(Amounts in thousands)
| | | | | | | | |
| | | December 31, | |
| | | 2011 | | | 2010 | |
30-59 days past due | | $ | 7,221 | | | $ | 5,885 | |
60-89 days past due | | | 3,479 | | | | 2,853 | |
90 days or more past due and still accruing | | | - | | | | - | |
Nonaccrual | | | 19,894 | | | | 16,357 | |
| | | | | | | | |
Total past due and nonperforming covered loans | | | 30,594 | | | | 25,095 | |
Foreclosed real estate | | | 30,342 | | | | 32,155 | |
| | | | | | | | |
Total past due and nonperforming covered assets | | $ | 60,936 | | | $ | 57,250 | |
| | | | | | | | |
64
FUNDING AND LIQUIDITY MANAGEMENT
We have implemented various policies to manage our liquidity position in order to meet our cash flow requirements and maintain sufficient capacity to meet our clients’ needs and accommodate fluctuations in asset and liability levels due to changes in our business operations as well as unanticipated events. We also have in place contingency funding plans designed to allow us to operate through a period of stress when access to normal sources of funding may be constrained. As part of our asset/liability management strategy, we utilize a variety of funding sources in an effort to optimize the balance of duration risk, cost, liquidity risk and contingency planning.
The Bank’s principal sources of funds are client deposits, including large institutional deposits, capital contributions by the parent company, and cash from operations. The Bank’s principal uses of funds include funding growth in the core asset portfolios, including loans, and to a lesser extent, our investment portfolio, which is used primarily to manage interest rate and liquidity risk. The primary sources of funding for the holding company include dividends when received from its bank subsidiary, intercompany tax reimbursements from the Bank, and proceeds from the issuance of senior, subordinated and convertible debt, as well as equity. Primary uses of funds for the parent company include repayment of maturing debt, interest paid to our debt holders, dividends paid to stockholders, and capital contributions to the Bank.
We consider client deposits our core funding source. At December 31, 2011, 84% of our total assets were funded by client deposits, compared to 80% at December 31, 2010. We define client deposits as all deposits other than traditional brokered deposits and non-client CDARS® (as described in the footnotes to Table 27 below). While we expect overall liquidity in the banking system to remain high until economic recovery and market factors improve, the level of our client deposits may fluctuate based on client needs, seasonality and other economic or market factors. If the client deposits fluctuate due to any of these factors, we will utilize other external sources of liquidity, including wholesale funding.
Given the commercial focus of our core business strategy, a majority of our deposit base is comprised of corporate accounts which are typically larger than retail accounts. We have built a suite of deposit and cash management products and services that support our efforts to attract and retain corporate client accounts. Thirteen client relationships, each with greater than $75 million in deposits accounted for $2.2 billion, or 21% of total deposits at December 31, 2011. A majority of the deposits greater than $75 million are from financial services related businesses, including omnibus accounts from broker-dealer and mortgage companies representing underlying accounts of their customers that may be eligible for pass-through deposit insurance limits. Thirty-two relationships, each with greater than $50 million in deposits, accounted for $3.3 billion, or 32% or total deposits at December 31, 2011. We take deposit concentration risk into account in managing our liquid asset levels. Liquid assets refer to cash on hand, federal funds sold, unpledged securities, as well as collateral based borrowing. Net liquid assets represent the sum of the liquid asset categories less the amount of assets pledged to secure public funds and certain deposits that require collateral. Net liquid assets at the Bank were $1.6 billion and $1.8 billion at December 31, 2011 and 2010, respectively. We maintain liquidity at levels we believe sufficient to meet anticipated client liquidity needs, fund anticipated loan growth, selectively purchase securities and investments and opportunistically pay down wholesale funds.
While we first look toward internally generated deposits as our funding source, we utilize wholesale funding, including brokered deposits, as needed to enhance liquidity and to fund asset growth. Brokered deposits are deposits that are sourced from external and unrelated financial institutions by a third party. This funding requires advance notification to structure the type of deposit desired by the Bank. Brokered deposits can vary in term from one month to several years and have the benefit of being a source of longer-term funding. Our asset/liability management policy currently limits our use of brokered deposits, excluding reciprocal CDARS®, to levels no more than 25% of total deposits, and total brokered deposits to levels no more than 40% of total deposits. At December 31, 2011, brokered deposits exclusive of reciprocal CDARS® were less than 1% of total deposits while total brokered deposits were 8% of total deposits.
Our cash flows are comprised of three classifications: cash flows from operating activities, cash flows from investing activities, and cash flows from financing activities. Cash flows from operating activities primarily include results of operations for the year, adjusted for items in net income that did not impact cash. Net cash provided by operating activities increased by $62.1 million from 2010 to $270.3 million for 2011, which was primarily due to an increase in net income from the prior year. Cash flows from investing activities reflect the impact of loans and investments acquired for our interest-earning asset portfolios and asset sales. For 2011, net cash used in investing activities was $405.2 million, compared to $504.0 million for the prior year. This change in cash flows represents larger amounts of cash redeployed towards investments and loans in the prior year than the current year. Cash flows from financing activities include transactions and events whereby cash is obtained from depositors, creditors or investors. Net cash used in financing activities for 2011 was $157.5 million, compared to net cash provided by financing activities of $410.9 million for the prior year. This change in cash flows represents the decrease in total deposits in the current year as compared to the prior year.
65
Deposits
Middle market commercial client relationships from a diversified industry base in our markets are the primary source of our deposit base. Due to our middle market commercial banking focused business model, our client deposit base provides access to larger deposit balances that result in a concentrated deposit base. The deposits are held in different deposit products such as interest-bearing and noninterest-bearing demand deposits, CDARS®, savings and money market accounts. The following table provides a comparison of deposits by category over the last three years.
Table 27
Deposits
(Dollars in thousands)
| | | | | | | | | | | | | | | | | | | | | | | | | | | | | | | | |
| | | As of December 31, | | | % Change | |
| | | 2011 | | | %
of Total | | | 2010 | | | %
of Total | | | 2009 | | | %
of Total | | | 2011-2010 | | | 2010-2009 | |
Noninterest-bearing deposits | | $ | 3,244,307 | | | | 31.2 | | | $ | 2,253,661 | | | | 21.4 | | | $ | 1,840,900 | | | | 18.6 | | | | 44.0 | | | | 22.4 | |
Interest-bearing deposits | | | 595,238 | | | | 5.7 | | | | 616,761 | | | | 5.9 | | | | 752,728 | | | | 7.6 | | | | -3.5 | | | | -18.1 | |
Savings deposits | | | 210,138 | | | | 2.0 | | | | 190,685 | | | | 1.8 | | | | 141,614 | | | | 1.4 | | | | 10.2 | | | | 34.7 | |
Money market accounts | | | 4,168,082 | | | | 40.0 | | | | 4,631,138 | | | | 43.9 | | | | 3,912,361 | | | | 39.6 | | | | -10.0 | | | | 18.4 | |
Brokered deposits: | | | | | | | | | | | | | | | | | | | | | | | | | | | | | | | | |
Traditional | | | 20,499 | | | | 0.2 | | | | 329,107 | | | | 3.1 | | | | 389,590 | | | | 3.9 | | | | -93.8 | | | | -15.5 | |
Client CDARS®(1) | | | 795,452 | | | | 7.7 | | | | 852,458 | | | | 8.1 | | | | 979,728 | | | | 9.9 | | | | -6.7 | | | | -13.0 | |
Non-client CDARS®(1) | | | - | | | | - | | | | 269,262 | | | | 2.6 | | | | 196,821 | | | | 2.0 | | | | -100.0 | | | | 36.8 | |
| | | | | | | | | | | | | | | | | | | | | | | | | | | | | | | | |
Total brokered deposits | | | 815,951 | | | | 7.9 | | | | 1,450,827 | | | | 13.8 | | | | 1,566,139 | | | | 15.8 | | | | -43.8 | | | | -7.4 | |
Time deposits | | | 1,359,138 | | | | 13.1 | | | | 1,392,357 | | | | 13.2 | | | | 1,678,172 | | | | 17.0 | | | | -2.4 | | | | -17.0 | |
| | | | | | | | | | | | | | | | | | | | | | | | | | | | | | | | |
Total deposits | | $ | 10,392,854 | | | | 100.0 | | | $ | 10,535,429 | | | | 100.0 | | | $ | 9,891,914 | | | | 100.0 | | | | -1.4 | | | | 6.5 | |
| | | | | | | | | | | | | | | | | | | | | | | | | | | | | | | | |
Client deposits(2) | | $ | 10,372,355 | | | | 99.8 | | | $ | 9,937,060 | | | | 94.3 | | | $ | 9,305,503 | | | | 94.1 | | | | 4.4 | | | | 6.8 | |
| | | | | | | | | | | | | | | | | | | | | | | | | | | | | | | | |
| | (1) | The CDARS® deposit program is a deposit services arrangement that effectively achieves FDIC deposit insurance for jumbo deposit relationships. These deposits are classified as brokered deposits for regulatory deposit purposes; however, we classify certain of these deposits as client CDARS® due to the source being our client relationships and are, therefore, not traditional brokered deposits. We also participate in a non-client CDARS® program that is more like a traditional brokered deposit program. |
| | (2) | Total deposits, net of traditional brokered deposits and non-client CDARS®. |
Total deposits at December 31, 2011 decreased by $142.6 million from year end 2010 as money market accounts, non-client CDARS®, and traditional brokered deposits declined, partially offset by increased balances in noninterest-bearing deposits. Client deposits increased by $435.3 million from December 31, 2010 and client deposits as a percentage of total deposits also increased from 94% at December 31, 2010 to almost all deposits at December 31, 2011. We anticipate client deposits to fluctuate in line with client needs and usage of liquidity. Noninterest-bearing deposits grew to $3.2 billion at December 31, 2011, an increase of 44% compared to one year ago. The increase in noninterest-bearing deposits can be attributed to several factors including growth from existing and new commercial client relationships, client focused treasury management product offerings, and deposit movements
66
reflecting our clients’ desire to hold greater liquidity in this economic environment, as well as temporary unlimited insurance coverage on these types of accounts. From December 31, 2011 through December 31, 2012, all noninterest-bearing deposits, with the exception of negotiable order of withdrawal accounts, are fully insured by the FDIC.
In response to the provision of the Dodd-Frank Act requiring repeal of the regulatory prohibition on payment of interest on commercial demand deposits effective in July 2011, we began offering an interest-bearing checking account for business customers in the third quarter of 2011. As anticipated, this change did not have a material effect on our deposit mix or our cost of funds in the low-rate environment.
Brokered deposits totaled $816.0 million at December 31, 2011, decreasing $634.9 million from December 31, 2010 due to a reduced reliance on traditional brokered deposits and non-client CDARS® deposits. Brokered deposits at December 31, 2011 included $795.5 million in client-related CDARS®. Brokered deposits, excluding client CDARS®, declined by $577.9 million from the prior year end and were less than 1% of total deposits at December 31, 2011 compared to 6% at December 31, 2010. Consistent with our funding needs, during 2011, we elected not to replace certain maturing non-client CDARS® and traditional brokered deposits as total loans remained relatively flat and we continued to see client deposit inflows.
Public balances, denoting the funds held on account for municipalities and other public entities, are included as a part of our total deposits. We enter into specific agreements with certain public customers to pledge collateral, primarily securities, in support of the balances on account. These relationships may provide cross-sell opportunities with treasury management, as well as other business referral opportunities. At December 31, 2011, we had public funds on account totaling $927.4 million, of which less than 32% were collateralized with securities. Year-to-year changes in balances are influenced by the tax collection activities of the various municipalities as well as the general level of interest rates.
The following table presents our brokered and time deposits as of December 31, 2011, which are expected to mature during the period specified.
Table 28
Scheduled Maturities of Brokered and Time Deposits
(Amounts in thousands)
| | | | | | | | | | | | |
| | | Brokered | | | Time | | | Total | |
Year ending December 31, | | | | | | | | | | | | |
2012: | | | | | | | | | | | | |
First quarter | | $ | 442,611 | | | $ | 275,575 | | | $ | 718,186 | |
Second quarter | | | 137,039 | | | | 246,369 | | | | 383,408 | |
Third quarter | | | 39,858 | | | | 210,799 | | | | 250,657 | |
Fourth quarter | | | 139,350 | | | | 175,498 | | | | 314,848 | |
2013 | | | 46,884 | | | | 292,666 | | | | 339,550 | |
2014 | | | 8,648 | | | | 34,917 | | | | 43,565 | |
2015 | | | 1,561 | | | | 106,655 | | | | 108,216 | |
2016 | | | - | | | | 16,515 | | | | 16,515 | |
2017 and thereafter | | | - | | | | 144 | | | | 144 | |
| | | | | | | | | | | | |
Total | | $ | 815,951 | | | $ | 1,359,138 | | | $ | 2,175,089 | |
| | | | | | | | | | | | |
The following table presents our time deposits of $100,000 or more as of December 31, 2011, which are expected to mature during the period specified.
Table 29
Maturities of Time Deposits of $100,000 or More(1)
(Amounts in thousands)
| | | | |
| | | December 31,
2011 | |
Maturing within 3 months | | $ | 629,461 | |
After 3 but within 6 months | | | 338,674 | |
After 6 but within 12 months | | | 482,258 | |
After 12 months | | | 416,655 | |
| | | | |
Total | | $ | 1,867,048 | |
| | | | |
| | (1) | Includes brokered deposits. |
67
Over the past several years in the generally low interest rate environment, our clients have tended to keep the maturities of their deposits short and short-term certificates of deposit have generally been renewed on terms and with maturities of similar duration. In the event that time deposits are not renewed, we expect to replace those deposits with traditional deposits, brokered deposits, or borrowed money sufficient to meet our funding needs.
Short-term Borrowings and Long-term Debt
Short-term borrowings, which at December 31, 2011 consisted solely of FHLB advances that mature in one year or less, totaled $156.0 million, increasing by $37.4 million from $118.6 million at December 31, 2010, due to increases in short-term FHLB advances from the prior year. The year-over-year increase is attributable to the reclassification from long-term debt as advances approach maturity. Scheduled maturities of short-term borrowings during the first quarter 2012 total $126.0 million. The following table provides a comparison of short-term borrowings by category for the last three years.
Table 30
Short-Term Borrowings
(Dollars in thousands)
| | | | | | | | | | | | | | | | | | | | | | | | | | | | |
| | | 2011 | | | | | 2010 | | | | | 2009 | |
| | | Amount | | | Rate (%) | | | | | Amount | | | Rate (%) | | | | | Amount | | | Rate (%) | |
At year end: | | | | | | | | | | | | | | | | | | | | | | | | | | | | |
Securities sold under agreements to repurchase | | $ | - | | | | - | | | | | $ | - | | | | - | | | | | $ | 3,975 | | | | 0.60 | |
FHLB advances | | | 156,000 | | | | 0.33 | | | | | | 117,620 | | | | 2.40 | | | | | | 211,000 | | | | 2.74 | |
Credit facility and other borrowings | | | - | | | | - | | | | | | 941 | | | | - | | | | | | - | | | | - | |
| | | | | | | | | | | | | | | | | | | | | | | | | | | | |
Total short-term borrowings | | $ | 156,000 | | | | 0.33 | | | | | $ | 118,561 | | | | 2.40 | | | | | $ | 214,975 | | | | 2.70 | |
| | | | | | | | | | | | | | | | | | | | | | | | | | | | |
Average for the year: | | | | | | | | | | | | | | | | | | | | | | | | | | | | |
Securities sold under agreements to repurchase | | $ | 16 | | | | 0.60 | | | | | $ | 2,063 | | | | 0.59 | | | | | $ | 33,786 | | | | 0.24 | |
Borrowings under Federal Reserve Bank (“FRB”) programs | | | - | | | | - | | | | | | - | | | | - | | | | | | 391,027 | | | | 0.25 | |
Federal funds purchased | | | - | | | | - | | | | | | 5,589 | | | | 0.15 | | | | | | 45,008 | | | | 0.48 | |
FHLB advances | | | 74,380 | | | | 2.70 | | | | | | 171,752 | | | | 2.95 | | | | | | 174,991 | | | | 2.91 | |
Contingent convertible senior notes | | | - | | | | - | | | | | | - | | | | - | | | | | | 23,600 | | | | 5.77 | |
Credit facility and other borrowings | | | 522 | | | | - | | | | | | 1,035 | | | | - | | | | | | 4,658 | | | | 8.53 | |
| | | | | | | | | | | | | | | | | | | | | | | | | | | | |
Total short-term borrowings | | $ | 74,918 | | | | 2.68 | | | | | $ | 180,439 | | | | 2.82 | | | | | $ | 673,070 | | | | 1.20 | |
| | | | | | | | | | | | | | | | | | | | | | | | | | | | |
Maximum month-end balance: | | | | | | | | | | | | | | | | | | | | | | | | | | | | |
Securities sold under agreements to repurchase | | $ | 5 | | | | | | | | | $ | 4,629 | | | | | | | | | $ | 102,666 | | | | | |
Borrowings under FRB programs | | | - | | | | | | | | | | - | | | | | | | | | | 700,000 | | | | | |
Federal funds purchased | | | - | | | | | | | | | | - | | | | | | | | | | 184,000 | | | | | |
FHLB advances | | | 156,000 | | | | | | | | | | 237,000 | | | | | | | | | | 211,000 | | | | | |
Contingent convertible senior notes | | | - | | | | | | | | | | - | | | | | | | | | | 114,680 | | | | | |
Credit facility and other borrowings | | | 2,291 | | | | | | | | | | 1,944 | | | | | | | | | | 20,000 | | | | | |
Long-term debt, which is comprised of junior subordinated debentures, a subordinated debt facility and the long-term portion of FHLB advances, decreased by $35.0 million to $379.8 million at December 31, 2011 from $414.8 million at December 31, 2010. The reduction in long-term debt was attributable to FHLB advance activity with $35.0 million of FHLB advances reclassified from long-term to short-term during the year.
In addition to on-balance sheet funding and other liquid assets such as cash and investment securities, we maintain access to various external sources of funding, which assist in the prudent management of funding costs, interest rate risk, and anticipated funding needs or other considerations. Some sources of funding are accessible same-day while others require advance notice. Funds that are immediately accessible include Federal Fund counterparty lines, which are uncommitted lines of credit from other financial institutions, and the borrowing term is typically overnight. Availability of Federal Fund lines fluctuate based on market conditions and counterparty relationship strength. Unused overnight Fed Funds borrowings available for use totaled $200.0 million and $95.0 million, respectively, at December 31, 2011 and 2010. Repurchase agreements (“Repos”) are also an immediate source of funding in which we pledge assets to a counterparty against which we can borrow with the agreement to repurchase at a specified date in the future. Repos can vary in term, from overnight to longer, but are regarded as short-term in nature. An additional source of overnight funding is the discount window at the FRB. We maintain access to the discount window by pledging loans as collateral to the FRB. Funding
68
availability is primarily dictated by the amount of loans pledged, but also impacted by the margin applied to the loans by the FRB. The amount of loans pledged to the FRB can fluctuate due to the availability of loans eligible under the FRB’s criteria which include stipulations of documentation requirements, credit quality, payment status and other criteria. At December 31, 2011, we had $1.1 billion in borrowing capacity through the FRB discount window’s primary credit program compared to $536.8 million at December 31, 2010. To increase our access to liquidity, during 2011, we became a member of the FHLB Chicago, establishing access to additional FHLB borrowing capacity of $382.8 million at December 31, 2011.
Refer to Notes 11 and 12 to the “Notes to Consolidated Financial Statements” in Item 8 of this Form 10-K for additional details regarding the junior subordinated debentures and subordinated debt facility.
CONTRACTUAL OBLIGATIONS, COMMITMENTS, OFF-BALANCE SHEET RISK, AND CONTINGENT LIABILITIES
Through our normal course of operations, we have entered into certain contractual obligations and other commitments. Such obligations generally relate to the funding of operations through deposits or debt issuances, as well as leases for premises and equipment. As a financial services provider, we routinely enter into commitments to extend credit. While contractual obligations represent our future cash requirements, a significant portion of commitments to extend credit may expire without being drawn upon. Such commitments are subject to the same credit policies and approval process as all comparable loans we make.
The following table presents our significant fixed and determinable contractual obligations and significant commitments as of December 31, 2011 which are expected to come due and payable during the period specified. Further discussion of the nature of each obligation is included in the referenced note to the consolidated financial statements.
Table 31
Contractual Obligations, Commitments, Contingencies, and Off-Balance Sheet Items
(Amounts in thousands)
| | | | | | | | | | | | | | | | | | | | | | |
| | | | | Payments Due In(2) | | | | |
| | | Financial
Statement
Note
Reference(1) | | Less Than
One Year | | | One to
Three Years | | | Three to
Five
Years | | | Over Five
Years | | | Total | |
Deposits without a stated maturity | | 9 | | $ | 8,217,765 | | | $ | - | | | $ | - | | | $ | - | | | $ | 8,217,765 | |
Time deposits | | 9 | | | 908,241 | | | | 327,583 | | | | 123,170 | | | | 144 | | | | 1,359,138 | |
Brokered deposits (3) | | 9 | | | 758,858 | | | | 55,532 | | | | 1,561 | | | | - | | | | 815,951 | |
Short-term borrowings | | 10 | | | 156,000 | | | | - | | | | - | | | | - | | | | 156,000 | |
Long-term debt | | 11 | | | - | | | | 7,000 | | | | 123,000 | | | | 249,793 | | | | 379,793 | |
Operating leases | | 7 | | | 10,903 | | | | 21,590 | | | | 20,150 | | | | 52,508 | | | | 105,151 | |
Purchase obligations(4) | | - | | | 40,355 | | | | 42,454 | | | | 42,048 | | | | - | | | | 124,857 | |
| | | | | | |
Commitments to extend credit: | | | | | | | | | | | | | | | | | | | | | | |
Home equity lines | | 19 | | | | | | | | | | | | | | | | | | | 159,072 | |
All other commitments | | 19 | | | | | | | | | | | | | | | | | | | 3,948,097 | |
Letters of credit: | | | | | | | | | | | | | | | | | | | | | | |
Standby | | 19 | | | | | | | | | | | | | | | | | | | 367,714 | |
Commercial | | 19 | | | | | | | | | | | | | | | | | | | 2,127 | |
| | (1) | Refer to “Notes to Consolidated Financial Statements” in Item 8 of this Form 10-K. |
| | (2) | In the banking industry, interest-bearing obligations are principally utilized to fund interest-earning assets. As such, interest charges on related contractual obligations were excluded from reported amounts as the potential cash outflows would have corresponding cash inflows form interest-earning assets. |
| | (3) | Includes $42,000 of unamortized broker commissions. |
| | (4) | Purchase obligations exclude obligations for goods and services that already have been incurred and are reflected on our Consolidated Statements of Financial Condition. |
Our operating lease obligations represent short- and long-term lease and rental payments for facilities, equipment, and certain software or data processing.
Purchase obligations at December 31, 2011 reflect the minimum obligation under legally binding contracts with contract terms that are both fixed and determinable. Our purchase obligations include payments under, among other things, consulting, outsourcing, data,
69
advertising, sponsorships, software license and telecommunications. Purchase obligations also includes the estimated aggregate cash severance amounts (not prohibited under the executive compensation restrictions applicable to Troubled Asset Relief Program (“TARP”) Capital Purchase Program (“CPP”) participants) that would be due to employees under employment contracts and arrangements, assuming all employees with such arrangements were involuntarily terminated on December 31, 2011.
Our commitments to fund civic and community investments, which represent future cash outlays for the construction and development of properties for low-income housing, small business real estate, and historic tax credit projects that qualify for CRA purposes, are not included in the contractual obligations table above. The timing and amounts of these commitments are projected based upon the financing arrangements provided in each project’s partnership or operating agreement, and could change due to variances in the construction schedule, project revisions, or the cancellation of the project.
As of December 31, 2011, the Company had $454,000 of unrecognized tax benefits (exclusive of net interest expense accruals) that would impact the effective tax rate if recognized in future periods. Because the amount and timing of any future cash settlements cannot be predicted with reasonable certainty, this estimated liability has been excluded from the contractual obligations table above. See Note 15 of “Notes to Consolidated Financial Statements” in Item 8 of this Form 10-K for additional information and disclosure related to uncertain tax positions.
Due to the recent uncertainties with regard to European sovereign debt holdings, particularly those countries experiencing significant economic, fiscal or political strains, there are concerns regarding the risks to financial institutions as a result of direct and indirect exposures to European sovereign and non-sovereign debt holdings. As it relates to our investment portfolio, we had no direct funded or non-funded exposure to European sovereign or non-sovereign entities in either our Held-to-Maturity or Available-for-Sale portfolios as of December 31, 2011. However, we conduct business with European financial institutions headquartered in the United Kingdom, Switzerland, France, and Germany, related to repurchase agreements, interest rate swaps, balance sheet hedging, foreign exchange transactions and letter of credit issuance. As is common market practice, certain of our interest rate derivatives and letter of credit transactions with such European financial institutions (including their US branches and subsidiaries) are collateralized with approximately $54 million of investment securities at December 31, 2011. The interest rate derivative transactions are subject to master netting and collateral support agreements which significantly limit the Company’s exposure to loss as they generally require daily posting of collateral. At December 31, 2011, the Company was in a net payable position to each of these European banks. We also maintained cash balances with various European financial institutions in the aforementioned countries to support our foreign exchange business. As of December 31, 2011, we do not have any outstanding borrowings under lines for repurchase agreements.
The Company may have direct or indirect exposure to foreign subsidiaries and affiliates of United States (“US”)-domiciled commercial clients. Those entities may be co-borrowers or guarantors of the US parent’s credit facilities with the Company, and in some cases collateral consisting of assets or stock of those entities may be pledged to the Company to secure payment and performance of those credit facilities. In most cases however, the underwriting and credit decision is based on the performance of the US alone. See, “Risk Factors” in Item 1A of this Annual Report on Form 10-K for more information.
CAPITAL
Equity totaled $1.3 billion at December 31, 2011, increasing by $68.8 million from December 31, 2010 and was largely attributable to current year net income and higher net unrealized gains on available-for-sale securities included in accumulated other comprehensive income.
Capital Issuances
We did not have any common or preferred stock offerings in either 2011 or 2010.
Capital Management
Under applicable regulatory capital adequacy guidelines, the Company and the Bank are subject to various capital requirements adopted and administered by the federal banking agencies. These guidelines specify minimum capital ratios calculated in accordance with the definitions in the guidelines, including the leverage ratio which is Tier 1 capital as a percentage of adjusted average assets, and the Tier 1 capital ratio and the total capital ratio each as a percentage of risk-weighted assets and off-balance sheet items that have been weighted according to broad risk categories. These minimum ratios are shown in the table below.
To satisfy safety and soundness standards, banking institutions are expected to maintain capital levels in excess of the regulatory minimums depending on the risk inherent in the balance sheet, regulatory expectations and the changing risk profile of business activities and plans. Under our capital planning policy, we target capital ratios at levels we believe are appropriate based on such risk considerations, taking into account the current operating and economic environment, internal risk guidelines, and our strategic objectives as well as regulatory expectations. At the Bank, primarily due to our credit loss experience and recent levels of nonperforming loans, our policy currently calls for minimum capital ratios of 8.25% Tier 1 leverage and 12.0% total risk-based capital. We have not set a timetable for repaying TARP funds but are continuing to evaluate the best timing and approach for the shareholders and the Company.
70
The following table presents information about our capital measures and the related regulatory capital guidelines.
Table 32
Capital Measurements
(Dollars in thousands)
| | | | | | | | | | | | | | | | | | | | | | | | |
| | | Actual | | | FRB Guidelines
For Minimum
Regulatory Capital | | | Regulatory Minimum
For “Well Capitalized”
under FDICIA | |
| | | December 31,
2011 | | | December 31,
2010 | | | Ratio | | | Excess Over
Regulatory
Minimum at
12/31/11 | | | Ratio | | | Excess Over
Well
Capitalized
under
FDICIA at
12/31/11 | |
Regulatory capital ratios: | | | | | | | | | | | | | | | | | | | | | |
Total risk-based capital: | | | | | | | | | | | | | | | | | | | | | | | | |
Consolidated | | | 14.28% | | | | 14.18% | | | | 8.00% | | | $ | 702,560 | | | | n/a | | | | n/a | |
The PrivateBank | | | 12.66 | | | | 12.32 | | | | n/a | | | | n/a | | | | 10.00% | | | $ | 297,213 | |
| | | | | | |
Tier 1 risk-based capital: | | | | | | | | | | | | | | | | | | | | | | | | |
Consolidated | | | 12.38 | | | | 12.06 | | | | 4.00 | | | | 937,272 | | | | n/a | | | | n/a | |
The PrivateBank | | | 10.76 | | | | 10.19 | | | | n/a | | | | n/a | | | | 6.00 | | | | 531,240 | |
| | | | | | |
Tier 1 leverage: | | | | | | | | | | | | | | | | | | | | | | | | |
Consolidated | | | 11.33 | | | | 10.78 | | | | 4.00 | | | | 896,073 | | | | n/a | | | | n/a | |
The PrivateBank | | | 9.85 | | | | 9.11 | | | | n/a | | | | n/a | | | | 5.00 | | | | 591,493 | |
| | | | | |
Other capital ratios (consolidated)(1): | | | | | | | | | | | | | | | | | | | | | |
Tier 1 common equity to risk- weighted assets(2) | | | 8.04 | | | | 7.69 | | | | | | | | | | | | | | | | | |
Tangible common equity to tangible assets(2) | | | 7.69 | | | | 7.10 | | | | | | | | | | | | | | | | | |
Tangible equity to tangible assets(2) | | | 9.64 | | | | 9.04 | | | | | | | | | | | | | | | | | |
Tangible equity to risk- weighted assets(2) | | | 10.60 | | | | 10.08 | | | | | | | | | | | | | | | | | |
Total equity to total assets | | | 10.44 | | | | 9.85 | | | | | | | | | | | | | | | | | |
| | (1) | Ratios are not subject to formal FRB regulatory guidance. |
| | (2) | Ratios are non-U.S. GAAP financial measures. Refer to Table 33, “Non-U.S. GAAP Financial Measures” for a reconciliation to U.S. GAAP presentation. |
As of December 31, 2011, all of our $244.8 million of outstanding junior subordinated deferrable interest debentures held by trusts that issued guaranteed capital debt securities (“Debentures”) are included in Tier 1 capital. The Tier 1 qualifying amount is limited to 25% of Tier 1 capital under FRB regulations. Further, of the $120.0 million in outstanding subordinated debt facility at December 31, 2011, 60% of the balance qualified as Tier II capital. Effective in the third quarter 2010, Tier II capital qualification was reduced by 20% of the total balance outstanding and annually thereafter will be reduced by an additional 20%. For a full description of our Debentures and subordinated debt, refer to Notes 11 and 12 of “Notes to Consolidated Financial Statements” in Item 8 of this Form 10-K.
For further details of the regulatory capital requirements and ratios as of December 31, 2011 and 2010 for the Company and the Bank, refer to Note 17 of “Notes to Consolidated Financial Statements” in Item 8 of this Form 10-K.
Dividends
We declared dividends of $0.04 per common share during 2011. Based on the closing stock price at December 31, 2011 of $10.98, the annualized dividend yield on our common stock was 0.36%. The dividend payout ratio, which represents the percentage of dividends declared to stockholders to earnings per share, was 9.3% for 2011. We have no current plans to seek to raise dividends on our common stock.
71
As a result of our participation in the TARP CPP, prior to January 30, 2012, we were subject to various restrictions on our ability to increase the cash dividends we pay on our common stock above the quarterly rate of $0.075 per share, the rate in effect when our participation in TARP CPP began. Although this restriction is no longer applicable, we still may not pay dividends on our common stock unless we have paid dividends on our outstanding preferred stock, including the CPP preferred stock, and non-voting common stock. In addition, we currently provide notice to and obtain approval from the FRB before declaring or paying any dividends. For additional information regarding limitations and restrictions on our ability to pay dividends, refer to the “Supervision and Regulation” and “Risk Factors” sections in Item 1 and Item 1A, respectively, of this Form 10-K.
Stock Repurchase Program
Our ability to repurchase shares of our common stock is subject to the applicable restrictions of the CPP following the sale of the preferred stock to the Treasury under the TARP program. Please refer to EESA in “Supervision and Regulation” of Item 1 of this Form 10-K for additional discussion of the CPP and TARP programs.
In connection with restrictions on stock repurchases as part of the CPP, we terminated our repurchase program in February 2009. The restrictions on repurchases will not affect our ability to repurchase shares in connection with the administration of our employee benefit plans, as such transactions are in the ordinary course and consistent with our past practice. During 2011, we repurchased 117,616 shares with an average value of $11.91 per share with all repurchases associated with shares submitted in satisfaction of taxes and/or exercise price amounts in connection with the settlement of share-based compensation awards.
IMPACT OF INFLATION
Our consolidated financial statements and the related notes thereto included in this report have been prepared in accordance with U.S. generally accepted accounting principles and practices within the banking industry. Under these principles and practices, we are required to measure our financial position in terms of historical dollars, without considering changes in the relative purchasing power of money over time due to inflation.
Unlike many industrial companies, virtually all of our assets and liabilities are monetary in nature. As a result, interest rates have a more significant impact on our performance than the general level of inflation. Over short periods of time, interest rates may not necessarily move in the same direction or in the same magnitude as inflation. For analysis of our sensitivity to changes in interest rates, refer to the “Quantitative and Qualitative Disclosures About Market Risk” section at Item 7A of this Form 10-K.
NON-U.S. GAAP FINANCIAL MEASURES
This report contains both U.S. GAAP and non-U.S. GAAP based financial measures. These non-U.S. GAAP financial measures include net interest income, net interest margin, net revenue, operating profit, and efficiency ratio all on a fully taxable-equivalent basis, Tier 1 common equity to risk-weighted assets, tangible common equity to tangible assets, tangible equity to risk-weighted assets, tangible equity to tangible assets, and tangible book value. We believe that presenting these non-U.S. GAAP financial measures will provide information useful to investors in understanding our underlying operational performance, our business, and performance trends and facilitates comparisons with the performance of others in the banking industry.
We use net interest income on a taxable-equivalent basis in calculating various performance measures by increasing the interest income earned on tax-exempt assets to make it fully equivalent to interest income earned on taxable investments assuming a 35% tax rate. Management believes this measure to be the preferred industry measurement of net interest income as it enhances comparability to net interest income arising from taxable and tax-exempt sources, and accordingly believes that providing this measure may be useful for peer comparison purposes.
In addition to capital ratios defined by banking regulators, we also consider various measures when evaluating capital utilization and adequacy, including Tier 1 common equity to risk-weighted assets, tangible common equity to tangible assets, tangible equity to tangible assets, tangible equity to risk-weighted assets, and tangible book value. These calculations are intended to complement the capital ratios defined by banking regulators for both absolute and comparative purposes. All of these measures exclude the ending balances of goodwill and other intangibles while certain of these ratios exclude preferred capital components. Because U.S. GAAP does not include capital ratio measures, we believe there are no comparable U.S. GAAP financial measures to these ratios. We believe these non-U.S. GAAP financial measures are relevant because they provide information that is helpful in assessing the level of capital available to withstand unexpected market conditions. Additionally, presentation of these measures allows readers to compare certain aspects of our capitalization to other companies. However, because there are no standardized definitions for these ratios, our calculations may not be comparable with other companies, and the usefulness of these measures to investors may be limited.
72
Non-U.S. GAAP financial measures have inherent limitations, are not required to be uniformly applied, and are not audited. Although these non-U.S. GAAP financial measures are frequently used by stakeholders in the evaluation of a company, they have limitations as analytical tools, and should not be considered in isolation or as a substitute for analyses of results as reported under U.S. GAAP. As a result, we encourage readers to consider our Consolidated Financial Statements in their entirety and not to rely on any single financial measure.
The following table reconciles Non-U.S. GAAP financial measures to U.S. GAAP:
Table 33
Non-U.S. GAAP Financial Measures
(Dollars in thousands, except per share data)
(Unaudited)
| | | | | | | | | | | | | | | | | | | | |
| | | Years Ended December 31, | |
| | | 2011 | | | 2010 | | | 2009 | | | 2008 | | | 2007 | |
Taxable-equivalent interest income | | | | | | | | | | | | | | | | | | | | |
U.S. GAAP net interest income | | $ | 407,127 | | | $ | 400,957 | | | $ | 324,984 | | | $ | 190,395 | | | $ | 127,038 | |
Taxable-equivalent adjustment | | | 2,857 | | | | 3,577 | | | | 3,612 | | | | 3,857 | | | | 4,274 | |
| | | | | | | | | | | | | | | | | | | | |
Taxable-equivalent net interest income(a) | | $ | 409,984 | | | $ | 404,534 | | | $ | 328,596 | | | $ | 194,252 | | | $ | 131,312 | |
| | | | | | | | | | | | | | | | | | | | |
| | | | | |
Average Earning Assets(b) | | $ | 11,746,032 | | | $ | 11,978,364 | | | $ | 10,740,119 | | | $ | 7,111,380 | | | $ | 4,180,179 | |
| | | | | |
Net Interest Margin(a) / (b) | | | 3.49% | | | | 3.38% | | | | 3.06% | | | | 2.73% | | | | 3.14% | |
| | | | | |
Net Revenue | | | | | | | | | | | | | | | | | | | | |
Taxable-equivalent net interest income(a) | | $ | 409,984 | | | $ | 404,534 | | | $ | 328,596 | | | $ | 194,252 | | | $ | 131,312 | |
U.S. GAAP non-interest income | | | 98,247 | | | | 93,246 | | | | 71,470 | | | | 41,316 | | | | 26,274 | |
| | | | | | | | | | | | | | | | | | | | |
Net revenue | | $ | 508,231 | | | $ | 497,780 | | | $ | 400,066 | | | $ | 235,568 | | | $ | 157,586 | |
| | | | | | | | | | | | | | | | | | | | |
| | | | | |
Operating Profit | | | | | | | | | | | | | | | | | | | | |
U.S. GAAP income before income taxes | | $ | 70,200 | | | $ | 64 | | | $ | (50,380) | | | $ | (153,993) | | | $ | 13,969 | |
Provision for loan and covered loan losses | | | 132,897 | | | | 194,541 | | | | 199,419 | | | | 189,579 | | | | 16,934 | |
Taxable-equivalent adjustment | | | 2,857 | | | | 3,577 | | | | 3,612 | | | | 3,857 | | | | 4,274 | |
| | | | | | | | | | | | | | | | | | | | |
Operating profit | | $ | 205,954 | | | $ | 198,182 | | | $ | 152,651 | | | $ | 39,443 | | | $ | 35,177 | |
| | | | | | | | | | | | | | | | | | | | |
| | | | | |
Efficiency Ratio | | | | | | | | | | | | | | | | | | | | |
U.S. GAAP non-interest expense(c) | | $ | 302,277 | | | $ | 299,598 | | | $ | 247,415 | | | $ | 196,125 | | | $ | 122,409 | |
Taxable-equivalent net interest income(a) | | $ | 409,984 | | | $ | 404,534 | | | $ | 328,596 | | | $ | 194,252 | | | $ | 131,312 | |
U.S. GAAP non-interest income | | | 98,247 | | | | 93,246 | | | | 71,470 | | | | 41,316 | | | | 26,274 | |
| | | | | | | | | | | | | | | | | | | | |
Net revenue(d) | | $ | 508,231 | | | $ | 497,780 | | | $ | 400,066 | | | $ | 235,568 | | | $ | 157,586 | |
| | | | | | | | | | | | | | | | | | | | |
Efficiency ratio(c) / (d) | | | 59.48% | | | | 60.19% | | | | 61.84% | | | | 83.26% | | | | 77.68% | |
73
| | | | | | | | | | | | | | | | | | | | | | |
| | | Years Ended December 31, |
| | | 2011 | | | 2010 | | | 2009 | | | 2008 | | | 2007 |
Tier 1 Common Capital | | | | | | | | | | | | | | | | | | | | | | |
U.S. GAAP total equity | | $ | 1,296,752 | | | $ | 1,227,910 | | | $ | 1,235,616 | | | $ | 605,566 | | | $ | 501,972 | | | |
Trust preferred securities | | | 244,793 | | | | 244,793 | | | | 244,793 | | | | 192,667 | | | | 101,033 | | | |
Less: accumulated other comprehensive income, net of tax | | | 46,697 | | | | 20,078 | | | | 27,896 | | | | 27,568 | | | | 7,934 | | | |
Less: disallowed deferred tax assets | | | - | | | | 5,377 | | | | 7,619 | | | | - | | | | - | | | |
Less: goodwill | | | 94,571 | | | | 94,621 | | | | 94,671 | | | | 95,045 | | | | 93,341 | | | |
Less: other intangibles | | | 15,353 | | | | 16,840 | | | | 18,485 | | | | 6,544 | | | | 6,457 | | | |
| | | | | | | | | | | | | | | | | | | | | | |
Tier 1 risk-based capital | | | 1,384,924 | | | | 1,335,787 | | | | 1,331,738 | | | | 669,076 | | | | 495,273 | | | |
Less: preferred stock | | | 240,403 | | | | 238,903 | | | | 237,487 | | | | 58,070 | | | | 41,000 | | | |
Less: trust preferred securities | | | 244,793 | | | | 244,793 | | | | 244,793 | | | | 192,667 | | | | 101,033 | | | |
Less: noncontrolling interests | | | - | | | | 33 | | | | 33 | | | | 33 | | | | 33 | | | |
| | | | | | | | | | | | | | | | | | | | | | |
Tier 1 common capital(e) | | $ | 899,728 | | | $ | 852,058 | | | $ | 849,425 | | | $ | 418,306 | | | $ | 353,207 | | | |
| | | | | | | | | | | | | | | | | | | | | | |
| | | | | | |
Tangible Common Equity | | | | | | | | | | | | | | | | | | | | | | |
U.S. GAAP total equity | | $ | 1,296,752 | | | $ | 1,227,910 | | | $ | 1,235,616 | | | $ | 605,566 | | | $ | 501,972 | | | |
Less: goodwill | | | 94,571 | | | | 94,621 | | | | 94,671 | | | | 95,045 | | | | 93,341 | | | |
Less: other intangibles | | | 15,353 | | | | 16,840 | | | | 18,485 | | | | 6,544 | | | | 6,457 | | | |
| | | | | | | | | | | | | | | | | | | | | | |
Tangible equity(f) | | | 1,186,828 | | | | 1,116,449 | | | $ | 1,122,460 | | | | 503,977 | | | | 402,174 | | | |
Less: preferred stock | | | 240,403 | | | | 238,903 | �� | | | 237,487 | | | | 58,070 | | | | 41,000 | | | |
| | | | | | | | | | | | | | | | | | | | | | |
Tangible common equity(g) | | $ | 946,425 | | | $ | 877,546 | | | $ | 884,973 | | | $ | 445,907 | | | $ | 361,174 | | | |
| | | | | | | | | | | | | | | | | | | | | | |
| | | | | | |
Tangible Assets | | | | | | | | | | | | | | | | | | | | | | |
U.S. GAAP total assets | | $ | 12,416,870 | | | $ | 12,465,621 | | | $ | 12,032,584 | | | $ | 10,005,519 | | | $ | 4,989,203 | | | |
Less: goodwill | | | 94,571 | | | | 94,621 | | | | 94,671 | | | | 95,045 | | | | 93,341 | | | |
Less: other intangibles | | | 15,353 | | | | 16,840 | | | | 18,485 | | | | 6,544 | | | | 6,457 | | | |
| | | | | | | | | | | | | | | | | | | | | | |
Tangible assets(h) | | $ | 12,306,946 | | | $ | 12,354,160 | | | $ | 11,919,428 | | | $ | 9,903,930 | | | $ | 4,889,405 | | | |
| | | | | | | | | | | | | | | | | | | | | | |
| | | | | | |
Risk-weighted Assets(i) | | $ | 11,191,298 | | | $ | 11,080,051 | | | $ | 10,812,520 | | | $ | 9,210,473 | | | $ | 4,337,498 | | | |
| | | | | | |
Period-end Common Shares Outstanding(j) | | | 71,745 | | | | 71,327 | | | | 71,332 | | | | 33,568 | | | | 28,075 | | | |
| | | | | | |
Ratios: | | | | | | | | | | | | | | | | | | | | | | |
Tier 1 common equity to risk-weighted assets(e) / (i) | | | 8.04% | | | | 7.69% | | | | 7.86% | | | | 4.54% | | | | 8.14% | | | |
Tangible equity to tangible assets(f) / (h) | | | 9.64% | | | | 9.04% | | | | 9.42% | | | | 5.09% | | | | 8.23% | | | |
Tangible equity to risk-weighted assets(f) / (i) | | | 10.60% | | | | 10.08% | | | | 10.38% | | | | 5.47% | | | | 9.27% | | | |
Tangible common equity to tangible assets(g) / (h) | | | 7.69% | | | | 7.10% | | | | 7.42% | | | | 4.50% | | | | 7.39% | | | |
Tangible book value(g) / (j) | | $ | 13.19 | | | $ | 12.30 | | | $ | 12.41 | | | $ | 13.28 | | | $ | 12.86 | | | |
CRITICAL ACCOUNTING POLICIES
Our consolidated financial statements are prepared in accordance with U.S. GAAP, and our accounting policies are consistent with predominant practices in the financial services industry. Critical accounting policies are those policies that require management to make the most significant estimates, assumptions, and judgments based on information available at the date of the financial statements that affect the amounts reported in the financial statements and accompanying notes. Future changes in information may affect these estimates, assumptions, and judgments, which, in turn, may affect amounts reported in the consolidated financial statements.
Our most significant accounting policies are presented in Note 1, “Summary of Significant Accounting Policies,” to the Notes to Consolidated Financial Statements of Item 8 of this Form 10-K. These policies, along with the disclosures presented in the other consolidated financial statement notes and in this discussion, provide information on how significant assets and liabilities are valued in the consolidated financial statements and how those values are determined. Based on the valuation techniques used and the sensitivity of financial statement amounts to the methods, assumptions, and estimates underlying those amounts, management has determined that our accounting policies with respect to the allowance for loan losses, goodwill and intangible assets, income taxes and fair value
74
measurements are the accounting areas requiring subjective or complex judgments that are most important to our financial position and results of operations, and, as such, are considered to be critical accounting policies, as discussed below.
Allowance for Loan Losses
We maintain an allowance for loan losses at a level management believes is sufficient to absorb credit losses inherent in our loan portfolio. The allowance for loan losses is assessed quarterly and represents an accounting estimate of probable losses in the portfolio at each balance sheet date based on a review of available and relevant information at that time. The allowance consists of provisions for probable losses that have been identified relating to specific borrowing relationships that are individually evaluated for impairment (“the specific component”), as well as probable losses inherent in our loan portfolio that are not specifically identified (“the general allocated component”), which is determined using a methodology that is a function of quantitative and qualitative factors applied to segments of our loan portfolio as well as management’s judgment.
The specific component relates to impaired loans. Impaired loans consist of nonaccrual loans (which include nonaccrual TDRs) and loans classified as accruing TDRs. A loan is considered impaired when, based on current information and events, management believes that it is probable that we will be unable to collect all amounts due (both principal and interest) according to the original contractual terms of the loan agreement. Once a loan is determined to be impaired, the amount of impairment is measured based on the loan’s observable fair value, fair value of the underlying collateral less selling costs if the loan is collateral-dependent, or the present value of expected future cash flows discounted at the loan’s effective interest rate.
If the measurement of the impaired loan is less than the recorded investment in the loan, impairment is recognized by creating a specific valuation reserve as a component of the allowance for loan losses. Impaired loans exceeding $500,000 are evaluated individually, while loans less than $500,000 are evaluated as pools using historical loss experience, as well as management’s loss expectations, for the respective asset class and product type.
Impaired loans with specific reserves are reviewed quarterly for any changes that would affect the specific reserve. Any impaired loan for which a determination has been made that the economic value is permanently reduced is charged-off against the allowance for loan losses to reflect its current economic value in the period in which the determination has been made.
At the time a collateral-dependent loan is initially determined to be impaired, we review the existing collateral appraisal. If the most recent appraisal is greater than a year old, a new appraisal is obtained on the underlying collateral. Appraisals for loans in excess of $500,000 are updated with a new independent appraisal at least annually and are formally reviewed by our internal appraisal department upon receipt of a new appraisal as well as at the six-month interval between the independent appraisals. All impaired loans and their related reserves are reviewed and updated each quarter. If during the course of the six-month review period there is evidence supporting a meaningful decline in the value of collateral, a new appraisal is required to support the value of the impaired loan. With an immaterial number of exceptions, all appraisals and internal reviews are current under this methodology at December 31, 2011.
To determine the general allocated component of the allowance for loan losses, we segregate loans by originating line of business and vintage (“transformational” and “legacy”) for reserve purposes because of observable similarities in the performance experience of loans underwritten by these business units. In general, loans originated by the business units that existed prior to the strategic changes of the Company in 2007 are considered “legacy” loans. Loans originated by a business unit that was established in connection with or following the strategic business transformation plan are considered “transformational” loans. Renewals or restructurings of legacy loans may continue to be evaluated as legacy loans depending on the structure or defining characteristics of the new transaction. The Company has implemented a line of business model that has reorganized the legacy business units so that after 2009, all new loan originations are considered transformational.
The methodology produces an estimated range of potential loss exposure for the product types within each originating line of business. We consider the appropriate balance of the general allocated component of the reserve within these ranges based on a variety of internal and external quantitative and qualitative factors to reflect data or timeframes not captured by the basic allowance framework as well as market and economic data and management judgment. In certain instances, these additional factors and judgments may lead to management’s conclusion that the appropriate level of the reserve is outside the range determined through the basic allowance framework.
Determination of the allowance is inherently subjective, as it requires significant estimates, including the amounts and timing of expected future cash flows on impaired loans, estimated losses on pools of homogeneous loans based on historical loss experience, risk ratings, product type, and vintage, as well as consideration of current economic trends and portfolio attributes, all of which may be susceptible to significant change.
Credit exposures deemed to be uncollectible are charged-off against the allowance, while recoveries of amounts previously charged-off are credited to the allowance. A provision for loan losses, which is a charge against earnings, is recorded to bring the allowance for
75
loan losses to a level that, in management’s judgment, is appropriate to absorb probable losses in the loan portfolio as of the balance sheet date.
Goodwill and Intangible Assets
Goodwill represents the excess of purchase price over the fair value of net assets acquired using the acquisition method of accounting. Other intangible assets represent purchased assets that also lack physical substance but can be distinguished from goodwill because of contractual or other legal rights or because the asset is capable of being sold or exchanged either on its own or in combination with a related contract, asset, or liability.
Goodwill is allocated to reporting units at acquisition. Subsequently, goodwill is not amortized but, instead, is tested at the reporting unit level at least an annually for impairment or more often if an event occurs or circumstances change that indicate it is more likely than not that the fair value of a reporting unit is less than its carrying amount. In the event that we conclude that all or a portion of our goodwill may be impaired, a noncash charge for the amount of such impairment would be recorded in earnings. Such a charge would have no impact on tangible or regulatory capital.
The impairment testing process is conducted by assigning net assets and goodwill to each reporting unit. In “step one,” the fair value of each reporting unit is compared to the recorded book value. Our step one calculation of each reporting unit’s fair value is based upon a simple average of two metrics: (1) a primary market approach, which measures fair value based upon trading multiples of independent publicly traded financial institutions of comparable size and character to the reporting units, and (2) an income approach, which estimates fair value based upon discounted cash flows (“DCF”) and terminal value (using the perpetuity growth method). If the fair value of the reporting unit exceeds its carrying value, goodwill is not considered impaired and “step two” is not considered necessary. If the carrying value of a reporting unit exceeds its fair value, the impairment test continues (“step two”) by comparing the carrying value of the reporting unit’s goodwill to the implied fair value of goodwill. The implied fair value of goodwill is determined using the residual approach, where the fair value of a reporting unit is allocated to all of the assets and liabilities of that unit as if the reporting unit had been acquired in a business combination and the fair value of the reporting unit, calculated in step one, is the price paid to acquire the reporting unit. The excess of the fair value of the reporting unit over the amounts assigned to its assets and liabilities is the implied fair value of goodwill. An impairment charge is recognized to the extent the carrying value of goodwill exceeds the implied fair value of goodwill.
Goodwill impairment testing is considered a “critical accounting estimate” as estimates and assumptions are made about future performance and cash flows, as well as other prevailing market factors. For our annual impairment testing, we engage an independent valuation firm to assist in the computation of the fair value estimates of each reporting unit as part of its impairment assessment. In connection with obtaining an independent third-party valuation, management provides certain information and assumptions that are utilized in the DCF and implied fair value calculations. Assumptions critical to the process include: forecasted cash flows, which are developed for each segment by considering several key business drivers such as historical performance, forward interest rates (using forward interest rate curves to forecast future expected interest rates), anticipated loan and deposit growth, and industry and economic trends; discount rates; and credit quality assessments, among other considerations. We provide the best information available at the time to be used in these estimates and calculations.
In our annual goodwill impairment test performed as of October 31, 2011, the Company determined that the Trust and Investments reporting unit “passed” (the fair value exceeded the carrying amount) step one of the goodwill impairment test, while the Banking reporting unit failed step one of the impairment test. As a result of the step one procedures performed, the Banking reporting unit’s adjusted net book value exceeded its fair value by approximately $45.9 million. However, the Company determined that no goodwill impairment charge was necessary based on the implied fair value adjustments of the Banking reporting unit’s assets and liabilities determined in the step two valuation procedures. As a result of the step two procedures performed, the implied fair value of the Banking reporting unit’s goodwill exceeded its carrying amount by approximately $90.4 million.
Identified intangible assets that have a finite useful life are amortized over that life in a manner that reflects the estimated decline in the economic value of the identified intangible asset and are subject to impairment testing whenever events or changes in circumstances indicate that the carrying value may not be recoverable. During 2011, there were no events or circumstances to indicate that there may be impairment of intangible assets. All of the other intangible assets have finite lives which are amortized over varying periods not exceeding 15 years and include core deposit premiums, client relationship, and assembled workforce intangibles, which are amortized on a straight line basis.
Income Taxes
The determination of income tax expense or benefit, and the amounts of current and deferred income tax assets and liabilities are based on complex analyses of many factors, including interpretation of federal and state income tax laws, current financial accounting standards, the difference between tax and financial reporting bases of assets and liabilities (temporary differences), assessments of the likelihood that the reversals of deferred deductible temporary differences will yield tax benefits, and estimates of reserves required for tax uncertainties. In addition, for interim reporting purposes, management generally determines its income tax provision, exclusive of any discrete items, based on its current best estimate of pre-tax income, permanent differences and the resulting effective tax rate expected for the full year.
We are subject to the federal income tax laws of the United States and the tax laws of the states and other jurisdictions where we conduct business. We periodically undergo examination by various governmental taxing authorities. Such authorities may require that changes in the amount of tax expense be recognized when their interpretations of tax law differ from those of management, based on
76
their judgments about information available to them at the time of their examinations. There can be no assurance that future events, such as court decisions, new interpretations of existing law or positions by federal or state taxing authorities, will not result in tax liability amounts that differ from our current assessment of such amounts, the impact of which could be significant to future results.
Temporary differences may give rise to deferred tax assets or liabilities, which are recorded on our Consolidated Statements of Financial Condition. We assess the likelihood that deferred tax assets will be realized in future periods based on weighing both positive and negative evidence and establish a valuation allowance for those deferred tax assets for which recovery is unlikely, based on a standard of “more likely” than not. In making this assessment, we must make judgments and estimates regarding the ability to realize these assets through: (a) the future reversal of existing taxable temporary differences, (b) future taxable income, (c) the possible application of future tax planning strategies, and (d) carryback to taxable income in prior years. We have not established a valuation allowance relating to our deferred tax assets at December 31, 2011. However, there is no guarantee that the tax benefits associated with these deferred tax assets will be fully realized. We have concluded, as of December 31, 2011, that it is more likely than not that such tax benefits will be realized.
In the preparation of income tax returns, tax positions are taken based on interpretation of federal and state income tax laws for which the outcome of such positions may not be certain. We periodically review and evaluate the status of uncertain tax positions and may establish tax reserves for tax benefits that may not be realized. The amount of any such reserves are based on the standards for determining such reserves as set forth in current accounting guidance and our estimates of amounts that may ultimately be due or owed (including interest). These estimates may change from time to time based on our evaluation of developments subsequent to the filing of the income tax return, such as tax authority audits, court decisions or other tax law interpretations. There can be no assurance that any tax reserves will be sufficient to cover tax liabilities that may ultimately be determined to be owed. At December 31, 2011, we had $454,000 of tax reserves established relating to uncertain tax positions that would favorably affect the Company’s effective tax rate if recognized in future periods.
For additional discussion of income taxes, see “Management’s Discussion and Analysis of Financial Condition and Results of Operations – Income Taxes” and Notes 1 and 15 of “Notes to Consolidated Financial Statements” in Item 8 of this Form 10-K.
Fair Value Measurements
Certain of the Company’s assets and liabilities are measured at fair value at each reporting date, including securities available for sale, derivatives, and certain loans held for sale. Additionally, other assets are periodically evaluated for impairment using fair value estimates, including goodwill and other intangible assets, assets acquired in business combinations, impaired loans, and OREO.
The Company measures fair value in accordance with U.S. GAAP, which defines fair value as the price that would be received to sell an asset or paid to transfer a liability in an orderly transaction between market participants at the measurement date.
U.S. GAAP establishes a fair value hierarchy that categorizes fair value measurements based on the observability of the valuation inputs used in determining fair value. Level 1 valuations are based on unadjusted quoted prices for identical instruments traded in active markets. Level 2 valuations are based on quoted prices for similar instruments, quoted prices in markets that are not active, or other inputs that are observable or can be corroborated by observable market data. Level 3 valuations use at least one significant unobservable input that is supported by little or no market activity.
Judgment is required to determine whether certain assets measured at fair value are included in Level 2 or Level 3. When making this judgment, we consider all available information, including observable market data, indications of market liquidity and orderliness, and our understanding of the valuation techniques and significant inputs used. Classification of Level 2 or Level 3 is based upon the specific facts and circumstances of each instrument or instrument category and judgments are made regarding the significance of the Level 3 inputs to the instruments’ fair value measurement in its entirety. If Level 3 inputs are considered significant, the instrument is classified as Level 3.
Judgment is also required when determining the fair value of an asset or liability when either relevant observable inputs do not exist or available observable inputs are in a market that is not active. When relevant observable inputs are not available, the Company must use its own assumptions about future cash flows and appropriately risk-adjusted discount rates. Conversely, in some cases observable inputs may require significant adjustments. For example, in cases where the volume and level of trading activity in an asset or liability have declined significantly, the available prices vary significantly over time or among market participants, or the prices are not current, the observable inputs may not be relevant and could require adjustment.
Valuation techniques and models used to measure the fair value of financial instruments on a recurring basis are reviewed and validated by the Company on at least a quarterly basis. The Company uses a variety of methods to validate the overall reasonableness of the fair values obtained from external sources, including evaluating pricing service inputs and methodologies, using exception
77
reports based on analytical criteria, comparing prices obtained to prices received from other pricing sources, and reviewing the reasonableness of prices based on Company knowledge of market liquidity and other market-related conditions.
The Company believes its valuation methods are appropriate and consistent with those of other market participants. However, the use of different methodologies or assumptions to determine the fair value of certain financial instruments could result in a different estimate of fair value at the reporting date. Imprecision in estimating unobservable market inputs can affect the amount of income or loss recorded for a particular position.
Additional information regarding fair value measurements is included in Note 20 of “Notes to the Consolidated Financial Statements” in Item 8 of this Form 10-K.
ITEM 7A. QUANTITATIVE AND QUALITATIVE DISCLOSURES ABOUT MARKET RISK
As a continuing part of our financial strategy and in accordance with our asset/liability management policies, we attempt to manage the impact of fluctuations in market interest rates on our net interest income. This effort entails providing a reasonable balance between interest rate risk, credit risk, liquidity risk and maintenance of yield. Our asset/liability management policies also authorize us to enter into derivative instruments as a tool to further manage the interest rate exposure of the Bank’s balance sheet. We may manage interest rate risk by structuring the asset and liability characteristics of our balance sheet and/or by executing derivatives designated as accounting hedges.
Interest rate changes do not affect all categories of assets and liabilities equally or simultaneously. There are other factors that are difficult to measure and predict that would influence the effect of interest rate fluctuations on our Consolidated Statements of Income.
In July 2011, we initiated the use of interest rate derivatives as part of our asset liability management strategy to hedge interest rate risk in our primarily floating-rate loan portfolio and, depending on market conditions; we may expand this program and enter into additional interest rate swaps.
The majority of our interest-earning assets are floating rate instruments. To manage the interest rate risk of our balance sheet, we have the ability to use a combination of financial instruments, including medium-term and short-term financings, variable-rate debt instruments, fixed rate loans and securities and interest rate swaps. Approximately 61% of the total loan portfolio is indexed to LIBOR, 21% of the total loan portfolio is indexed to the prime rate, and another 8% of the total loan portfolio otherwise adjusts with other reference interest rates. Of the $5.6 billion in loans maturity after one year with a floating interest rate, 25% are subject to interest rate floors under the terms of the loan agreements, the majority of which are in effect at December 31, 2011 and are reflected in the interest sensitivity analysis below. Changes in market rates and the shape of the yield curve may give us the opportunity to make changes to our investment securities portfolio as part of our asset/liability management strategy.
We use a simulation model to estimate the potential impact of various interest rate changes on our income statement and our interest-earning asset and interest-bearing liability portfolios, assuming the size and nature of these portfolios remain constant throughout the twelve month measurement period. The simulation assumes that assets and liabilities accrue interest on their current pricing basis. Assets and liabilities then re-price based on current terms and assuming instantaneous parallel shifts in the applicable yield curves and remain at that new interest rate through the end of the measurement period. The model attempts to illustrate the potential change in annual net interest income if the foregoing occurred. The following table shows the estimated impact of an immediate change in interest rates as of December 31, 2011 and 2010.
Analysis of Net Interest Income Sensitivity
(Dollars in thousands)
| | | | | | | | | | | | | | | | | | | | |
| | | Immediate Change in Rates | |
| | | -50 | | | +50 | | | +100 | | | +200 | | | +300 | |
December 31, 2011: | | | | |
Dollar change | | $ | (13,906) | | | $ | 16,526 | | | $ | 33,347 | | | $ | 67,447 | | | $ | 104,766 | |
Percent change | | | -3.6% | | | | 4.3% | | | | 8.7% | | | | 17.6% | | | | 27.4% | |
December 31, 2010: | | | | | | | | | | | | | | | | | | | | |
Dollar change | | $ | (8,800) | | | $ | 12,245 | | | $ | 25,144 | | | $ | 53,152 | | | $ | 84,492 | |
Percent change | | | -2.3% | | | | 3.1% | | | | 6.5% | | | | 13.7% | | | | 21.7% | |
The estimated impact to our net interest income over a one year period is reflected in dollar terms and percentage change. As an example, this table illustrates that if there had been an instantaneous parallel shift in the yield curve of +100 basis points on December 31,
78
2011, net interest income would increase by $33.3 million, or 8.7%, over a twelve-month period, as compared to a net interest income increase of $25.1 million, or 6.5%, if there had been an instantaneous parallel shift of +100 basis points at December 31, 2010.
Changes in the effect on net interest income at December 31, 2011 compared to December 31, 2010 are due to changes in the composition and nature of the repricing of interest rate-sensitive assets relative to rate-sensitive liabilities since year end 2010. Interest rate sensitivity increased during 2011 due to several factors, primarily liability compositional changes. Non-interest sensitive deposits increased while rate sensitive deposits, such as money market deposits, decreased. Rate-sensitive liabilities mitigate rate-sensitive assets. Accordingly, as rate-sensitive liabilities decrease, less asset sensitivity is offset by the liabilities as a whole. Taken together, the asset composition was more rate sensitive than in the prior year, and less of the asset sensitivity was mitigated by rate-sensitive liabilities, producing an overall increase in asset sensitivity. This effect was partially mitigated by the hedging program established in 2011.
The preceding sensitivity analysis is based on numerous assumptions including: the nature and timing of interest rate levels including the shape of the yield curve, prepayments on loans and securities, pricing decisions on loans and deposits, reinvestment/replacement of asset and liability cash flows and others. While our assumptions are developed based upon current economic and local market conditions, we cannot make any assurances as to the predictive nature of these assumptions including how client preferences or competitor influences might change.
ITEM 8. FINANCIAL STATEMENTS AND SUPPLEMENTARY DATA
Report of Independent Registered Public Accounting Firm
The Board of Directors and Shareholders of PrivateBancorp, Inc.:
We have audited the accompanying consolidated statements of financial condition of PrivateBancorp, Inc. and subsidiaries as of December 31, 2011 and 2010, and the related consolidated statements of income, changes in equity and cash flows for each of the three years in the period ended December 31, 2011. These consolidated financial statements are the responsibility of the Company’s management. Our responsibility is to express an opinion on these financial statements based on our audits.
We conducted our audits in accordance with the standards of the Public Company Accounting Oversight Board (United States). Those standards require that we plan and perform the audit to obtain reasonable assurance about whether the financial statements are free of material misstatement. An audit includes examining, on a test basis, evidence supporting the amounts and disclosures in the financial statements. An audit also includes assessing the accounting principles used and significant estimates made by management, as well as evaluating the overall financial statement presentation. We believe that our audits provide a reasonable basis for our opinion.
In our opinion, the financial statements referred to above present fairly, in all material respects, the consolidated financial position of PrivateBancorp, Inc. and subsidiaries as of December 31, 2011 and 2010, and the consolidated results of their operations and their cash flows for each of the three years in the period ended December 31, 2011, in conformity with U.S. generally accepted accounting principles.
We also have audited, in accordance with the standards of the Public Company Accounting Oversight Board (United States), PrivateBancorp, Inc’s internal control over financial reporting as of December 31, 2011, based on criteria established in Internal Control – Integrated Framework issued by the Committee of Sponsoring Organizations of the Treadway Commission and our report dated February 27, 2012 expressed an unqualified opinion thereon.
/S/ ERNST & YOUNG LLP
Chicago, Illinois
February 27, 2012
79
PRIVATEBANCORP, INC.
CONSOLIDATED STATEMENTS OF FINANCIAL CONDITION
(Amounts in thousands)
| | | | | | | | |
| | | December 31, | |
| | | 2011 | | | 2010 | |
Assets | | | | | | | | |
Cash and due from banks | | $ | 156,131 | | | $ | 112,772 | |
Federal funds sold and other short-term investments | | | 205,610 | | | | 541,316 | |
Loans held for sale | | | 32,049 | | | | 30,758 | |
Securities available-for-sale, at fair value | | | 1,783,465 | | | | 1,881,786 | |
Securities held-to-maturity, at amortized cost (fair value: $493.2 million – 2011) | | | 490,143 | | | | - | |
Non-marketable equity investments (FHLB stock: $40.7 million – 2011; $20.7 million – 2010) | | | 43,604 | | | | 23,537 | |
Loans – excluding covered assets, net of unearned fees | | | 9,008,561 | | | | 9,114,357 | |
Allowance for loan losses | | | (191,594) | | | | (222,821) | |
| | | | | | | | |
Loans, net of allowance for loan losses and unearned fees | | | 8,816,967 | | | | 8,891,536 | |
Covered assets | | | 306,807 | | | | 397,210 | |
Allowance for covered loan losses | | | (25,939) | | | | (15,334) | |
| | | | | | | | |
Covered assets, net of allowance for covered loan losses | | | 280,868 | | | | 381,876 | |
Other real estate owned, excluding covered assets | | | 125,729 | | | | 88,728 | |
Premises, furniture, and equipment, net | | | 38,633 | | | | 40,975 | |
Accrued interest receivable | | | 35,732 | | | | 33,854 | |
Investment in bank owned life insurance | | | 50,966 | | | | 49,408 | |
Goodwill | | | 94,571 | | | | 94,621 | |
Other intangible assets | | | 15,353 | | | | 16,840 | |
Capital markets derivative assets | | | 101,676 | | | | 100,250 | |
Other assets | | | 145,373 | | | | 177,364 | |
| | | | | | | | |
Total assets | | $ | 12,416,870 | | | $ | 12,465,621 | |
| | | | | | | | |
Liabilities | | | | |
Demand deposits: | | | | | | | | |
Noninterest-bearing | | $ | 3,244,307 | | | $ | 2,253,661 | |
Interest-bearing | | | 595,238 | | | | 616,761 | |
Savings deposits and money market accounts | | | 4,378,220 | | | | 4,821,823 | |
Brokered deposits | | | 815,951 | | | | 1,450,827 | |
Time deposits | | | 1,359,138 | | | | 1,392,357 | |
| | | | | | | | |
Total deposits | | | 10,392,854 | | | | 10,535,429 | |
Short-term borrowings | | | 156,000 | | | | 118,561 | |
Long-term debt | | | 379,793 | | | | 414,793 | |
Accrued interest payable | | | 5,567 | | | | 5,968 | |
Capital markets derivative liabilities | | | 104,140 | | | | 102,018 | |
Other liabilities | | | 81,764 | | | | 60,942 | |
| | | | | | | | |
Total liabilities | | | 11,120,118 | | | | 11,237,711 | |
| | | | | | | | |
Equity | | | | | | | | |
Preferred stock – Series B | | | 240,403 | | | | 238,903 | |
Common stock: | | | | | | | | |
Voting | | | 67,947 | | | | 67,436 | |
Nonvoting | | | 3,536 | | | | 3,536 | |
Treasury stock | | | (21,454) | | | | (20,054) | |
Additional paid-in capital | | | 968,787 | | | | 954,977 | |
Accumulated deficit | | | (9,164) | | | | (36,999) | |
Accumulated other comprehensive income, net of tax | | | 46,697 | | | | 20,078 | |
| | | | | | | | |
Total stockholders’ equity | | | 1,296,752 | | | | 1,227,877 | |
| | | | | | | | |
Noncontrolling interests | | | - | | | | 33 | |
| | | | | | | | |
Total equity | | | 1,296,752 | | | | 1,227,910 | |
| | | | | | | | |
Total liabilities and equity | | $ | 12,416,870 | | | $ | 12,465,621 | |
| | | | | | | | |
| | |
See accompanying notes to consolidated financial statements. | | |
80
PRIVATEBANCORP, INC.
CONSOLIDATED STATEMENTS OF FINANCIAL CONDITION – (Continued)
(Amounts in thousands, except per share data)
| | | | | | | | | | | | | | | | | | | | | | | | |
| | | December 31, 2011 | | | December 31, 2010 | |
| | | Preferred
Stock-Series B | | | Common Stock | | | Preferred
Stock-Series B | | | Common Stock | |
| | | | Voting | | | Nonvoting | | | | Voting | | | Nonvoting | |
Per Share Data | | | | | | | | | | | | | | | | | | | | | | | | |
Par value | | | None | | | | None | | | | None | | | | None | | | | None | | | | None | |
Liquidation value | | $ | 1,000 | | | | n/a | | | | n/a | | | $ | 1,000 | | | | n/a | | | | n/a | |
Stated value | | | None | | | $ | 1.00 | | | $ | 1.00 | | | | None | | | $ | 1.00 | | | $ | 1.00 | |
Share Balances | | | | | | | | | | | | | | | | | | | | | | | | |
Shares authorized | | | 1,000 | | | | 174,000 | | | | 5,000 | | | | 1,000 | | | | 174,000 | | | | 5,000 | |
Shares issued | | | 244 | | | | 68,978 | | | | 3,536 | | | | 244 | | | | 68,443 | | | | 3,536 | |
Shares outstanding | | | 244 | | | | 68,209 | | | | 3,536 | | | | 244 | | | | 67,791 | | | | 3,536 | |
Treasury shares | | | - | | | | 769 | | | | - | | | | - | | | | 652 | | | | - | |
n/a Not applicable
See accompanying notes to consolidated financial statements.
81
PRIVATEBANCORP, INC.
CONSOLIDATED STATEMENTS OF INCOME
(Amounts in thousands, except per share data)
| | | | | | | | | | | | |
| | | Years ended December 31, | |
| | | 2011 | | | 2010 | | | 2009 | |
Interest Income | | | | | | | | | | | | |
Loans, including fees | | $ | 413,109 | | | $ | 434,884 | | | $ | 411,830 | |
Federal funds sold and other short-term investments | | | 1,181 | | | | 1,950 | | | | 1,112 | |
Securities: | | | | | | | | | | | | |
Taxable | | | 61,417 | | | | 64,316 | | | | 58,663 | |
Exempt from Federal income taxes | | | 5,439 | | | | 6,775 | | | | 7,107 | |
| | | | | | | | | | | | |
Total interest income | | | 481,146 | | | | 507,925 | | | | 478,712 | |
| | | | | | | | | | | | |
Interest Expense | | | | | | | | | | | | |
Interest-bearing demand deposits | | | 2,439 | | | | 3,148 | | | | 2,646 | |
Savings deposits and money market accounts | | | 22,957 | | | | 34,431 | | | | 29,635 | |
Brokered and time deposits | | | 24,676 | | | | 36,458 | | | | 79,335 | |
Short-term borrowings | | | 2,011 | | | | 5,088 | | | | 8,094 | |
Long-term debt | | | 21,936 | | | | 27,843 | | | | 34,018 | |
| | | | | | | | | | | | |
Total interest expense | | | 74,019 | | | | 106,968 | | | | 153,728 | |
| | | | | | | | | | | | |
Net interest income | | | 407,127 | | | | 400,957 | | | | 324,984 | |
Provision for loan and covered loan losses | | | 132,897 | | | | 194,541 | | | | 199,419 | |
| | | | | | | | | | | | |
Net interest income after provision for loan and covered loan losses | | | 274,230 | | | | 206,416 | | | | 125,565 | |
| | | | | | | | | | | | |
Non-interest Income | | | | | | | | | | | | |
Trust and Investments | | | 17,826 | | | | 18,140 | | | | 15,459 | |
Mortgage banking | | | 6,703 | | | | 10,187 | | | | 8,930 | |
Capital markets products | | | 19,341 | | | | 14,286 | | | | 17,150 | |
Treasury management | | | 19,923 | | | | 16,920 | | | | 10,148 | |
Loan and credit related fees | | | 22,207 | | | | 16,526 | | | | 12,888 | |
Other income, service charges and fees | | | 6,476 | | | | 5,005 | | | | 499 | |
Net securities gains | | | 5,771 | | | | 12,182 | | | | 7,381 | |
Early extinguishment of debt | | | - | | | | - | | | | (985) | |
| | | | | | | | | | | | |
Total non-interest income | | | 98,247 | | | | 93,246 | | | | 71,470 | |
| | | | | | | | | | | | |
Non-interest Expense | | | | | | | | | | | | |
Salaries and employee benefits | | | 156,763 | | | | 149,863 | | | | 123,653 | |
Net occupancy expense | | | 29,986 | | | | 29,935 | | | | 26,170 | |
Technology and related costs | | | 11,388 | | | | 10,224 | | | | 10,599 | |
Marketing | | | 8,911 | | | | 8,501 | | | | 9,843 | |
Professional services | | | 9,206 | | | | 12,931 | | | | 16,327 | |
Outsourced servicing costs | | | 8,001 | | | | 7,807 | | | | 4,319 | |
Net foreclosed property expenses | | | 27,782 | | | | 15,192 | | | | 5,675 | |
Postage, telephone, and delivery | | | 3,716 | | | | 3,659 | | | | 3,060 | |
Insurance | | | 21,287 | | | | 26,534 | | | | 22,607 | |
Loan and collection expense | | | 13,571 | | | | 14,623 | | | | 9,617 | |
Other expenses | | | 11,666 | | | | 20,329 | | | | 15,545 | |
| | | | | | | | | | | | |
Total non-interest expense | | | 302,277 | | | | 299,598 | | | | 247,415 | |
| | | | | | | | | | | | |
Income (loss) before income taxes | | | 70,200 | | | | 64 | | | | (50,380) | |
Income tax provision (benefit) | | | 25,660 | | | | (1,737) | | | | (20,564) | |
| | | | | | | | | | | | |
Net income (loss) | | | 44,540 | | | | 1,801 | | | | (29,816) | |
Net income attributable to noncontrolling interests | | | 170 | | | | 284 | | | | 247 | |
| | | | | | | | | | | | |
Net income (loss) attributable to controlling interests | | | 44,370 | | | | 1,517 | | | | (30,063) | |
Preferred stock dividends and discount accretion | | | 13,690 | | | | 13,607 | | | | 12,443 | |
| | | | | | | | | | | | |
Net income (loss) available to common stockholders | | $ | 30,680 | | | $ | (12,090) | | | $ | (42,506) | |
| | | | | | | | | | | | |
Per Common Share Data | | | | | | | | | | | | |
Basic | | $ | 0.43 | | | $ | (0.17) | | | $ | (0.95) | |
Diluted | | $ | 0.43 | | | $ | (0.17) | | | $ | (0.95) | |
Common dividends per share | | $ | 0.04 | | | $ | 0.04 | | | $ | 0.04 | |
Weighted-average common shares outstanding | | | 70,449 | | | | 70,024 | | | | 44,516 | |
Weighted-average diluted common shares outstanding | | | 70,642 | | | | 70,024 | | | | 44,516 | |
See accompanying notes to consolidated financial statements.
82
PRIVATEBANCORP, INC.
CONSOLIDATED STATEMENTS OF CHANGES IN EQUITY
(Amounts in thousands, except per share data)
| | | | | | | | | | | | | | | | | | | | | | | | | | | | | | | | |
| | | Preferred
Stock | | | Common
Stock | | | Treasury
Stock | | | Additional
Paid-in
Capital | | | Retained
Earnings
(Accumulated
Deficit) | | | Accumulated
Other
Comprehensive
Income | | | Non-
controlling
Interests | | | Total | |
Balance at January 1, 2009 | | $ | 58,070 | | | $ | 32,468 | | | $ | (17,285) | | | $ | 482,347 | | | $ | 22,365 | | | $ | 27,568 | | | $ | 33 | | | $ | 605,566 | |
Comprehensive Income: | | | | | | | | | | | | | | | | | | | | | | | | | | | | | | | | |
Net (loss) income | | | - | | | | - | | | | - | | | | - | | | | (30,063) | | | | - | | | | 247 | | | | (29,816) | |
Other comprehensive income(1) | | | - | | | | - | | | | - | | | | - | | | | - | | | | 328 | | | | - | | | | 328 | |
| | | | | | | | | | | | | | | | | | | | | | | | | | | | | | | | |
Total comprehensive loss | | | | | | | | | | | | | | | | | | | | | | | | | | | | | | | (29,488) | |
Cash dividends: | | | | | | | | | | | | | | | | | | | | | | | | | | | | | | | | |
Common stock ($0.04 per share) | | | - | | | | - | | | | - | | | | - | | | | (1,951) | | | | - | | | | - | | | | (1,951) | |
Preferred stock | | | - | | | | - | | | | - | | | | - | | | | (11,214) | | | | - | | | | - | | | | (11,214) | |
Issuance of preferred stock | | | 236,257 | | | | - | | | | - | | | | - | | | | - | | | | - | | | | - | | | | 236,257 | |
Conversion of preferred stock to common stock | | | (58,070) | | | | 1,951 | | | | - | | | | 56,116 | | | | - | | | | - | | | | - | | | | (3) | |
Issuance of common stock | | | - | | | | 35,674 | | | | - | | | | 373,981 | | | | - | | | | - | | | | - | | | | 409,655 | |
Issuance of common stock warrants | | | - | | | | - | | | | - | | | | 7,558 | | | | - | | | | - | | | | - | | | | 7,558 | |
Accretion of preferred stock discount | | | 1,230 | | | | - | | | | - | | | | - | | | | (1,230) | | | | - | | | | - | | | | - | |
Common stock issued under benefit plans | | | - | | | | 351 | | | | - | | | | 775 | | | | - | | | | - | | | | - | | | | 1,126 | |
Shortfall tax benefit from share-based compensation | | | - | | | | - | | | | - | | | | (1,135) | | | | - | | | | - | | | | - | | | | (1,135) | |
Stock repurchased in connection with benefit plans | | | - | | | | - | | | | (1,204) | | | | - | | | | - | | | | - | | | | - | | | | (1,204) | |
Share-based compensation expense | | | - | | | | - | | | | - | | | | 20,696 | | | | - | | | | - | | | | - | | | | 20,696 | |
Noncontrolling interests distributions | | | - | | | | - | | | | - | | | | - | | | | - | | | | - | | | | (247) | | | | (247) | |
| | | | | | | | | | | | | | | | | | | | | | | | | | | | | | | | |
Balance at December 31, 2009 | | $ | 237,487 | | | $ | 70,444 | | | $ | (18,489) | | | $ | 940,338 | | | $ | (22,093) | | | $ | 27,896 | | | $ | 33 | | | $ | 1,235,616 | |
| | | | | | | | | | | | | | | | | | | | | | | | | | | | | | | | |
Comprehensive Income: | | | | | | | | | | | | | | | | | | | | | | | | | | | | | | | | |
Net income | | | - | | | | - | | | | - | | | | - | | | | 1,517 | | | | - | | | | 284 | | | | 1,801 | |
Other comprehensive loss(1) | | | - | | | | - | | | | - | | | | - | | | | - | | | | (7,818) | | | | | | | | (7,818) | |
| | | | | | | | | | | | | | | | | | | | | | | | | | | | | | | | |
Total comprehensive loss | | | - | | | | - | | | | - | | | | - | | | | - | | | | - | | | | - | | | | (6,017) | |
Cash dividends: | | | | | | | | | | | | | | | | | | | | | | | | | | | | | | | | |
Common stock ($0.04 per share) | | | - | | | | - | | | | - | | | | - | | | | (2,816) | | | | - | | | | - | | | | (2,816) | |
Preferred stock | | | - | | | | - | | | | - | | | | - | | | | (12,191) | | | | - | | | | - | | | | (12,191) | |
Issuance of common stock | | | - | | | | - | | | | - | | | | (178) | | | | - | | | | - | | | | - | | | | (178) | |
Accretion of preferred stock discount | | | 1,416 | | | | - | | | | - | | | | - | | | | (1,416) | | | | - | | | | - | | | | - | |
Common stock issued under benefit plans | | | - | | | | 521 | | | | - | | | | 1,286 | | | | - | | | | - | | | | - | | | | 1,807 | |
Shortfall tax benefit from share-based compensation | | | - | | | | - | | | | - | | | | (3,564) | | | | - | | | | - | | | | - | | | | (3,564) | |
Stock repurchased in connection with benefit plans | | | - | | | | - | | | | (1,565) | | | | - | | | | - | | | | - | | | | - | | | | (1,565) | |
Share-based compensation expense | | | - | | | | 7 | | | | - | | | | 17,095 | | | | - | | | | - | | | | - | | | | 17,102 | |
Noncontrolling interests distributions | | | - | | | | - | | | | - | | | | - | | | | - | | | | - | | | | (284) | | | | (284) | |
| | | | | | | | | | | | | | | | | | | | | | | | | | | | | | | | |
Balance at December 31, 2010 | | $ | 238,903 | | | $ | 70,972 | | | $ | (20,054) | | | $ | 954,977 | | | $ | (36,999) | | | $ | 20,078 | | | $ | 33 | | | $ | 1,227,910 | |
| | | | | | | | | | | | | | | | | | | | | | | | | | | | | | | | |
|
(1) Net of taxes and reclassification adjustments. See accompanying notes to consolidated financial statements. |
83
PRIVATEBANCORP, INC.
CONSOLIDATED STATEMENTS OF CHANGES IN EQUITY – (Continued)
(Amounts in thousands, except per share data)
| | | | | | | | | | | | | | | | | | | | | | | | | | | | | | | | |
| | | Preferred
Stock | | | Common
Stock | | | Treasury
Stock | | | Additional
Paid-in
Capital | | | Retained
Earnings
(Accumulated
Deficit) | | | Accumulated
Other
Comprehensive
Income | | | Non-
controlling
Interests | | | Total | |
Balance at December 31, 2010 | | $ | 238,903 | | | $ | 70,972 | | | $ | (20,054) | | | $ | 954,977 | | | $ | (36,999) | | | $ | 20,078 | | | $ | 33 | | | $ | 1,227,910 | |
Comprehensive Income: | | | | | | | | | | | | | | | | | | | | | | | | | | | | | | | | |
Net income | | | - | | | | - | | | | - | | | | - | | | | 44,370 | | | | - | | | | 170 | | | | 44,540 | |
Other comprehensive income(1) | | | - | | | | - | | | | - | | | | - | | | | - | | | | 26,619 | | | | - | | | | 26,619 | |
| | | | | | | | | | | | | | | | | | | | | | | | | | | | | | | | |
Total comprehensive income | | | - | | | | - | | | | - | | | | - | | | | - | | | | - | | | | - | | | | 71,159 | |
Cash dividends: | | | | | | | | | | | | | | | | | | | | | | | | | | | | | | | | |
Common stock ($0.04 per share) | | | - | | | | - | | | | - | | | | - | | | | (2,844) | | | | - | | | | - | | | | (2,844) | |
Preferred stock | | | - | | | | - | | | | - | | | | - | | | | (12,191) | | | | - | | | | - | | | | (12,191) | |
Issuance of common stock | | | - | | | | - | | | | - | | | | 31 | | | | - | | | | - | | | | - | | | | 31 | |
Accretion of preferred stock discount | | | 1,500 | | | | - | | | | - | | | | - | | | | (1,500) | | | | - | | | | - | | | | - | |
Common stock issued under benefit plans | | | - | | | | 457 | | | | - | | | | 682 | | | | - | | | | - | | | | - | | | | 1,139 | |
Shortfall tax benefit from share-based compensation | | | - | | | | - | | | | - | | | | (2,638) | | | | - | | | | - | | | | - | | | | (2,638) | |
Stock repurchased in connection with benefit plans | | | - | | | | - | | | | (1,400) | | | | - | | | | - | | | | - | | | | - | | | | (1,400) | |
Share-based compensation expense | | | - | | | | 54 | | | | - | | | | 15,702 | | | | - | | | | - | | | | - | | | | 15,756 | |
Noncontrolling interests activities | | | - | | | | - | | | | - | | | | 33 | | | | - | | | | - | | | | (203) | | | | (170) | |
| | | | | | | | | | | | | | | | | | | | | | | | | | | | | | | | |
Balance at December 31, 2011 | | $ | 240,403 | | | $ | 71,483 | | | $ | (21,454) | | | $ | 968,787 | | | $ | (9,164) | | | $ | 46,697 | | | $ | - | | | $ | 1,296,752 | |
| | | | | | | | | | | | | | | | | | | | | | | | | | | | | | | | |
|
(1) Net of taxes and reclassification adjustments. |
See accompanying notes to consolidated financial statements.
84
PRIVATEBANCORP, INC.
CONSOLIDATED STATEMENTS OF CASH FLOWS
(Amounts in thousands)
| | | | | | | | | | | | |
| | | Years ended December 31, | |
| | | 2011 | | | 2010 | | | 2009 | |
Operating Activities | | | | | | | | | | | | |
Net income (loss) | | $ | 44,370 | | | $ | 1,517 | | | $ | (30,063) | |
Adjustments to reconcile net income (loss) to net cash provided by operating activities: | | | | | | | | | | | | |
Provision for loan and covered loan losses | | | 132,897 | | | | 194,541 | | | | 199,419 | |
Depreciation of premises, furniture, and equipment | | | 8,777 | | | | 7,851 | | | | 6,447 | |
Net amortization of premium on securities | | | 13,011 | | | | 7,648 | | | | 1,487 | |
Net gains on securities | | | (5,771) | | | | (12,182) | | | | (7,381) | |
Net losses (gains) on sale of other real estate owned | | | 9,078 | | | | 1,352 | | | | (936) | |
Net accretion of discount on covered assets | | | (2,727) | | | | (18,844) | | | | (14,497) | |
Bank owned life insurance income | | | (1,558) | | | | (1,742) | | | | (1,728) | |
Net increase in deferred loan fees | | | 5,724 | | | | 4,145 | | | | 8,589 | |
Share-based compensation expense | | | 15,953 | | | | 17,501 | | | | 20,596 | |
Provision for deferred income tax expense (benefit) | | | 1,725 | | | | (17,227) | | | | (64,810) | |
Amortization of other intangibles | | | 1,487 | | | | 1,645 | | | | 1,737 | |
Change in loans held for sale | | | (1,291) | | | | (2,395) | | | | (3,854) | |
Fair market value adjustments on derivatives | | | 696 | | | | 1,350 | | | | (1,080) | |
Net (increase) decrease in accrued interest receivable | | | (1,878) | | | | 1,708 | | | | (1,280) | |
Net decrease in accrued interest payable | | | (401) | | | | (3,705) | | | | (27,950) | |
Net decrease (increase) in other assets | | | 30,134 | | | | 40,390 | | | | (17,070) | |
Net increase (decrease) in other liabilities | | | 20,098 | | | | (15,378) | | | | 19,002 | |
| | | | | | | | | | | | |
Net cash provided by operating activities | | | 270,324 | | | | 208,175 | | | | 86,628 | |
| | | | | | | | | | | | |
Investing Activities | | | | | | | | | | | | |
Available-for-sale securities and non-marketable equity investments: | | | | | | | | | | | | |
Proceeds from maturities, repayments, and calls | | | 399,111 | | | | 423,304 | | | | 363,380 | |
Proceeds from sales | | | 295,870 | | | | 432,895 | | | | 265,778 | |
Purchases | | | (581,884) | | | | (1,178,673) | | | | (592,659) | |
Held-to-maturity securities: | | | | | | | | | | | | |
Proceeds from maturities, repayments, and calls | | | 7,338 | | | | - | | | | - | |
Purchases | | | (497,945) | | | | - | | | | - | |
Net increase in loans | | | (192,505) | | | | (393,615) | | | | (1,163,725) | |
Cash and cash equivalents received in FDIC-assisted acquisition | | | - | | | | - | | | | 46,460 | |
Net decrease in covered assets | | | 101,393 | | | | 133,721 | | | | 65,540 | |
Proceeds from sale of other real estate owned | | | 69,898 | | | | 85,809 | | | | 35,720 | |
Net purchases of premises, furniture, and equipment | | | (6,435) | | | | (7,482) | | | | (13,502) | |
| | | | | | | | | | | | |
Net cash used in investing activities | | | (405,159) | | | | (504,041) | | | | (993,008) | |
| | | | | | | | | | | | |
Financing Activities | | | | | | | | | | | | |
Net (decrease) increase in deposit accounts | | | (142,575) | | | | 643,515 | | | | 1,125,691 | |
Net decrease in short-term borrowings | | | (941) | | | | (3,034) | | | | (433,080) | |
Proceeds on FHLB advances | | | 171,000 | | | | - | | | | 100,000 | |
Repayment of FHLB advances | | | (167,000) | | | | (211,000) | | | | (218,000) | |
Proceeds from the issuance of preferred stock and common stock warrant | | | - | | | | - | | | | 243,815 | |
Proceeds (payments for) from the issuance of common stock | | | 31 | | | | (178) | | | | 409,655 | |
Stock repurchased in connection with benefit plans | | | (1,400) | | | | (1,565) | | | | (1,204) | |
Cash dividends paid | | | (15,128) | | | | (15,122) | | | | (11,628) | |
Exercise of stock options and restricted share activity | | | 1,139 | | | | 1,807 | | | | 1,126 | |
Shortfall tax benefit from exercise of stock options and release of restricted share activity | | | (2,638) | | | | (3,564) | | | | (1,135) | |
| | | | | | | | | | | | |
Net cash (used in) provided by financing activities | | | (157,512) | | | | 410,859 | | | | 1,215,240 | |
| | | | | | | | | | | | |
Net (decrease) increase in cash and cash equivalents | | | (292,347) | | | | 114,993 | | | | 308,860 | |
Cash and cash equivalents at beginning of year | | | 654,088 | | | | 539,095 | | | | 230,235 | |
| | | | | | | | | | | | |
Cash and cash equivalents at end of year | | $ | 361,741 | | | $ | 654,088 | | | $ | 539,095 | |
| | | | | | | | | | | | |
| | | |
Supplemental Disclosures of Cash Flow Information: | | | | | | | | | | | | |
Cash paid for interest | | $ | 74,420 | | | $ | 110,673 | | | $ | 181,678 | |
Cash paid for income taxes | | | 25,616 | | | | 8,067 | | | | 8,930 | |
Non-cash transfers of loans to other real estate | | | 131,396 | | | | 140,607 | | | | 55,469 | |
| |
See accompanying notes to consolidated financial statements. | |
85
NOTES TO CONSOLIDATED FINANCIAL STATEMENTS
| 1. | SUMMARY OF SIGNIFICANT ACCOUNTING POLICIES |
Nature of Operations – PrivateBancorp, Inc. (“PrivateBancorp” or the “Company”) was incorporated in Delaware in 1989 and became a holding company registered under the Bank Holding Company Act of 1956, as amended. The PrivateBank and Trust Company (“PrivateBank-Chicago,” “PrivateBank,” or the “Bank”), the sole banking subsidiary of PrivateBancorp, was opened in Chicago in 1991. The Company completed its initial public offering in June of 1999. The Bank provides customized business and personal financial services to middle market companies and business owners, executives, entrepreneurs and families in seven geographic markets in the Midwest, as well as Denver and Atlanta. The majority of the Bank’s business is conducted in the greater Chicago market.
Principles of Consolidation and Basis of Presentation – The accompanying consolidated financial statements include the accounts and results of operations of the Company and its subsidiaries. The Company consolidates subsidiaries in which it holds, directly or indirectly, a controlling financial interest. In consolidation, all significant intercompany accounts and transactions are eliminated. Investments in unconsolidated entities are accounted for using the equity method of accounting when the Company has the ability to exercise significant influence over operating and financing decisions. Investments that do not meet the criteria for equity method accounting are accounted for using the cost method of accounting. Assets held in a fiduciary or agency capacity are not assets of the Company or its subsidiaries and, accordingly, are not included in the consolidated financial statements.
The accounting and reporting policies of the Company and its subsidiaries conform to U.S. generally accepted accounting principles (“U.S. GAAP”) and general practice within the banking industry. Certain reclassifications have been made to prior year amounts to conform to the current year presentation. We use the accrual basis of accounting for financial reporting purposes.
In preparing the consolidated financial statements, we have considered the impact of events occurring subsequent to December 31, 2011 for potential recognition or disclosure in this annual report on Form 10-K.
Business Combinations – Business combinations are accounted for under the acquisition method of accounting. Under the acquisition method, assets and liabilities of the business acquired are recorded at their estimated fair value as of the date of acquisition, with any excess of the cost of the acquisition over the fair value of the net tangible and identifiable intangible assets acquired recorded as goodwill. Results of operations of the acquired business are included in the Consolidated Statements of Income from the effective date of acquisition.
Use of Estimates – The preparation of consolidated financial statements in conformity with U.S. GAAP requires management to make estimates and assumptions that affect the amounts reported in the consolidated financial statements and accompanying notes. Actual results could differ from those estimates. The following is a summary of the significant accounting policies adhered to in the preparation of the consolidated financial statements.
Cash and Cash Equivalents– For purposes of the Consolidated Statements of Cash Flows, management has defined cash and cash equivalents to include cash and due from banks, federal funds sold, and other short-term investments. Generally, federal funds are sold for one-day periods, but not longer than 30 days. Short-term investments generally mature in less than 30 days. All cash and cash equivalents have maturities of three months or less.
Investment Securities – At the time of purchase, debt securities are classified as held-to-maturity or available-for-sale. Debt securities are classified as held-to-maturity when the Company has the positive intent and ability to hold the securities to maturity. Held-to-maturity securities are carried at amortized cost. Securities are classified as available-for-sale when management has the intent and ability to hold such securities for an indefinite period of time, but not necessarily to maturity. Any decision to sell available-for-sale securities would be based on various factors, including, but not limited to asset/liability management strategies, changes in interest rates or prepayment risks, liquidity needs, or regulatory capital considerations. Available-for-sale securities are carried at fair value with unrealized gains and losses, net of related deferred income taxes, recorded as a separate component of other comprehensive income (“OCI”).
The historical cost of debt securities is adjusted for amortization of premiums and accretion of discounts over the estimated life of the security, using the level-yield method. Amortization of premium and accretion of discount are included in interest income from the related security.
Purchases and sales of securities are recognized on a trade date basis. Realized securities gains or losses are reported in net securities gains (losses) in the Consolidated Statements of Income. The cost of securities sold is based on the specific identification method. On
86
a quarterly basis, we make an assessment to determine whether there have been any events or circumstances to indicate that a security for which there is an unrealized loss is impaired on an other-than-temporary (“OTTI”) basis. This determination requires significant judgment. OTTI is considered to have occurred (1) if management intends to sell the security; (2) if it is more likely than not we will be required to sell the security before recovery of its amortized cost basis; or (3) if the present value of the expected cash flows is not sufficient to recover the entire amortized cost basis. For debt securities that we do not expect to sell or for which it is not more likely than not that the Company will be required to sell prior to recovery, the OTTI is separated into credit and noncredit components. The credit-related OTTI, represented by the expected loss in principal, is recognized in non-interest income, while noncredit-related OTTI is recognized in OCI. Noncredit-related OTTI results from other factors, including increased liquidity spreads and changes in risk-free interest rates. All of the OTTI is recognized in earnings for securities we expect to sell. Presentation of OTTI is made in the income statement on a gross basis with a reduction for the amount of OTTI recognized in OCI. Once an OTTI is recorded, future significant increases in expected cash flows are treated as prospective yield adjustments.
Non-marketable equity securities are carried at cost. Impairment testing on these investments is based on applicable accounting guidance and the cost basis is reduced when impairment is deemed to be other-than-temporary.
Loans Held for Sale – Loans held for sale (“LHFS”) represent mortgage loan originations intended to be sold in the secondary market and other loans that management has an active plan to sell. LHFS are carried at the lower of cost or fair value as determined on an individual asset basis or carried at fair value where the Company has elected fair value accounting. Beginning on August 1, 2011, the Company elected to measure residential mortgage loans originated as held for sale under the fair value option on a prospective basis. Increases or decreases in the fair value of these LHFS are recognized in other income, service charges and fees in the Consolidated Statements of Income. Mortgage loan origination costs related to LHFS which the Company accounts for under the fair value option are recognized in noninterest expense as incurred. Held for investment loans that have been transferred to LHFS are carried at the lower of cost or fair value. For these LHFS, any decreases in value below cost are recognized in mortgage banking revenue in the Consolidated Statements of Income and increases in fair value above cost are not recognized until the loans are sold. The credit component of any write down upon transfer to LHFS is reflected in charge-offs to the allowance for loan losses. Loan origination costs for LHFS carried at the lower of cost or fair value are capitalized as part of the carrying amount of the loans and recognized as a reduction of mortgage banking revenue upon the sale of such loans.
Fair value is determined based on quoted market rates and our judgment of relevant market conditions. Gains and losses on the disposition of loans held for sale are determined on the specific identification method. Mortgage loans sold in the secondary market are sold without retaining servicing rights.
Originated Loans Held for Investment – Originated loans held for investment are carried at the principal amount outstanding, net of unearned income, deferred loan fees or costs, and any direct principal charge-offs. Interest income on loans is accrued based on principal amounts outstanding. Loan origination fees, fees for commitments that are expected to be exercised and certain direct loan origination costs are deferred and the net amount is amortized over the life of the related loan or commitment period as a yield adjustment. Other credit-related fees are recognized as fee income when earned.
Delinquent and Nonaccrual Loans– Loans are considered past due or delinquent if the required principal and interest payments have not been received as of the date such payment is due. Generally, loans (including impaired loans) are placed on nonaccrual status: (a) when either principal or interest payments are 90 days or more past due based on contractual terms; or (b) when an individual analysis of a borrower’s creditworthiness indicates a loan should be placed on nonaccrual status rather than waiting until the loan becomes 90 days past due. When a loan is placed on nonaccrual status, accrued and unpaid interest credited to income is reversed and accretion of net deferred loan fees ceases. Subsequent receipts on nonaccrual loans are recorded as a reduction of principal, and interest income may only be recorded on a cash basis after recovery of principal is reasonably assured. Nonaccrual loans are returned to accrual status when all delinquent principal and interest payments become current in accordance with the terms of the loan agreement and when the financial position of the borrower and other relevant factors indicate there is no longer doubt as to such collectability.
Impaired Loans – Impaired loans consist of nonaccrual loans (which include nonaccrual troubled debt restructurings (“TDRs”)) and loans classified as accruing TDRs. A loan is considered impaired when, based on current information and events, management believes that it is probable that we will be unable to collect all amounts due (both principal and interest) according to the original contractual terms of the loan agreement. Once a loan is determined to be impaired, the amount of impairment is measured based on the loan’s observable fair value, the fair value of the underlying collateral less selling costs if the loan is collateral-dependent, or the present value of expected future cash flows discounted at the loan’s effective interest rate.
If the measurement of the impaired loan is less than the recorded investment in the loan, impairment is recognized by creating a specific valuation reserve as a component of the allowance for loan losses. Impaired loans exceeding $500,000 are evaluated individually, while smaller loans are evaluated as pools using historical loss experience, as well as management’s loss expectations, for the respective asset class and product type.
87
Impaired loans with specific reserves are reviewed quarterly for any changes that would affect the specific reserve. Any impaired loan for which a determination has been made that the economic value is permanently reduced is charged-off against the allowance for loan losses to reflect its current economic value in the period in which the determination has been made.
At the time a collateral-dependent loan is initially determined to be impaired, we review the existing collateral appraisal. If the most recent appraisal is greater than a year old, a new appraisal is obtained on the underlying collateral. Appraisals for loans in excess of $500,000 are updated with a new independent appraisal at least annually and are formally reviewed by our internal appraisal department upon receipt of a new appraisal as well as at the six-month interval between the independent appraisals. All impaired loans and their related reserves are reviewed and updated each quarter. If during the course of the six-month review period there is evidence supporting a meaningful decline in the value of collateral, a new appraisal is required to support the value of the impaired loan. With an immaterial number of exceptions, all appraisals and internal reviews are current under this methodology at December 31, 2011.
Restructured Loans –Loans may be modified in the normal course of business for competitive reasons or to strengthen the Company’s position. Loan modifications and restructurings may also occur when the borrower experiences financial difficulty and needs temporary or permanent relief from the original contractual terms of the loan. These modifications are structured on a loan-by-loan basis, and depending on the circumstances, may include extensions of maturity dates, rate reductions, forgiveness of principal, or other concessions. The Company may also utilize a multiple note structure as a workout alternative for certain loans. The multiple note structure typically bifurcates a troubled loan into two separate notes, where the first note is reasonably assured of repayment and performance according to the modified terms, and the portion of the troubled loan that is not reasonably assured of repayment is charged-off. Loans that have been modified to accommodate a borrower who is experiencing financial difficulties, and for which the Company has granted a concession that it would not otherwise consider, are considered a TDR.
We consider many factors in determining whether to agree to a loan modification involving concessions, and seek a solution that will both minimize potential loss to the Company and attempt to help the borrower. We evaluate our borrowers’ current and forecasted future cash flows, their ability and willingness to make current contractual or proposed modified payments, the value of the underlying collateral (if applicable), the possibility of obtaining additional security or guarantees, and the potential costs related to a repossession or foreclosure and the subsequent sale of the collateral.
Restructured loans can involve loans remaining on nonaccrual, moving to nonaccrual, or continuing on accrual status, depending on the individual facts and circumstances of the borrower. Generally, a nonaccrual loan that is restructured remains on nonaccrual for a period of at least six months to ensure that the borrower performs in accordance with the restructured terms including consistent and timely loan payments. However, the borrower’s performance prior to the restructuring or other significant events at the time of the restructuring may be considered in assessing whether the borrower can meet the new terms and may result in the loan being returned to accrual status after a shorter performance period or concurrent with the restructuring. In such situations, the loan will be reported as a “restructured loan accruing interest.” If the borrower’s performance under the new terms is not reasonably assured, the loan remains classified as a nonaccrual loan.
The allowance for loan losses on restructured loans is determined by discounting the restructured cash flows by the original effective rate, or if collateral-dependent, by obtaining an appraisal.
Allowance for Loan Losses – We maintain an allowance for loan losses at a level management believes is sufficient to absorb credit losses inherent in our loan portfolio. The allowance for loan losses is assessed quarterly and represents an accounting estimate of probable losses in the portfolio at each balance sheet date based on a review of available and relevant information at that time. The allowance consists of provisions for probable losses that have been identified relating to specific borrowing relationships that are individually evaluated for impairment (“the specific component”), as well as probable losses inherent in our loan portfolio that are not specifically identified (“the general allocated component”), which is determined using a methodology that is a function of quantitative and qualitative factors applied to segments of our loan portfolio as well as management’s judgment.
The specific component relates to impaired loans. Impaired loans consist of nonaccrual loans (which include nonaccrual TDRs) and loans classified as accruing TDRs. See “Impaired Loans” section of this Note 1 for detailed discussion of the specific component of the allowance for loan losses.
To determine the general allocated component of the allowance for loan losses, we segregate loans by originating line of business and vintage (“transformational” and “legacy”) for reserve purposes because of observable similarities in the performance experience of loans underwritten by these business units. In general, loans originated by the business units that existed prior to the strategic changes of the Company in 2007 are considered “legacy” loans. Loans originated by a business unit that was established in connection with or following the strategic business transformation plan are considered “transformational” loans. Renewals or restructurings of legacy loans may continue to be evaluated as legacy loans depending on the structure or defining characteristics of the new transaction. The
88
Company has implemented a line of business model that has reorganized the legacy business units so that after 2009, all new loan originations are considered transformational.
The methodology produces an estimated range of potential loss exposure for the product types within each originating line of business. We consider the appropriate balance of the general allocated component of the reserve within these ranges based on a variety of internal and external quantitative and qualitative factors to reflect data or timeframes not captured by the basic allowance framework as well as market and economic data and management judgment. In certain instances, these additional factors and judgments may lead to management’s conclusion that the appropriate level of the reserve is outside the range determined through the basic allowance framework.
The product segments we evaluate in the general reserve methodology are commercial loans, commercial real estate loans, constructions loans and consumer loans (which include personal loans, residential mortgage loans and home equity lines of credit). Our commercial loan portfolio includes lines of credit to businesses, term loans and letters of credit. Certain non-residential owner-occupied commercial real estate loans are also included in our commercial loan portfolio where the cash flows from the owner’s business serve as the primary source of loan repayment. Commercial loans contain risks unique to the business and market of each borrower and the repayment is dependent upon the financial success and viability of the borrower.
Commercial real estate loans are comprised of loans secured by various types of collateral including 1-4 family non-owner occupied housing units located primarily in our target market areas, multi-family real estate, office buildings, warehouses, retail space, mixed use buildings, and vacant land, the bulk of which is held for long-term investment or development. Risks inherent in real estate lending are related to the market value of the property taken as collateral, the underlying cash flows and the general economic condition of the market in which the collateral is located. Repayment is generally dependent on the ability of the borrower to attract tenants at rental rates that provide for debt service. Repayment of commercial real estate loans is also somewhat dependent on long term financing options available to the borrower.
Our construction loan portfolio consists of single-family residential properties, multi-family properties, and commercial projects, and includes both investment properties and properties that will be owner-occupied. Risks inherent in construction lending are similar to those in commercial real estate lending. Additional risks include the cost and time frame of constructing or improving a property, the borrower’s inability to use funds generated by a project to service a loan until a project is completed, the more pronounced risk to interest rate movements and the real estate market that these borrowers face while a project is being completed or seeking a buyer and the availability of permanent financing. Because of the nature of construction loans, as a product segment, these loans have the highest inherent risk in our portfolio and are often the highest yielding loans in our portfolio.
Consumer loans are a smaller portion of our overall portfolio and consist of residential home mortgages, home equity lines of credit and personal loans. The risk issues associated with these products are closely correlated to the U.S. housing market and the local markets in which the collateral resides and include home price indices, sales volume, unemployment rates, vacancy rates, foreclosure rates, loan to value ratios, and delinquency rates. Some personal loans may be unsecured.
Determination of the allowance is inherently subjective, as it requires significant estimates, including the amounts and timing of expected future cash flows on impaired loans, estimated losses on pools of homogeneous loans based on historical loss experience, risk ratings, product type, and vintage, as well as consideration of current economic trends and portfolio attributes, all of which may be susceptible to significant change.
Credit exposures deemed to be uncollectible are charged-off against the allowance, while recoveries of amounts previously charged-off are credited to the allowance. A provision for loan losses, which is a charge against earnings, is recorded to bring the allowance for loan losses to a level that, in management’s judgment, is appropriate to absorb probable losses in the loan portfolio as of the balance sheet date.
Reserve for Unfunded Commitments – We maintain a reserve for unfunded commitments at a level we believe to be sufficient to absorb estimated probable losses related to unfunded credit facilities. The reserve is included in other liabilities on the Consolidated Statements of Financial Condition. The reserve is computed using a methodology similar to that used to determine the general allocated component of the allowance for loan losses and is based on a model which uses recent commitment utilization patterns at the product level as a method of predicting future usage across the portfolio. Net adjustments to the reserve for unfunded commitments are included in other non-interest expense in the Consolidated Statements of Income.
Purchased Loans – Purchased loans acquired through portfolio purchases or in a business combination are accounted for under specialized accounting guidance when the loans have evidence of credit deterioration at the time of acquisition and for which it is probable that not all contractual payments will be collected (“purchased impaired loans”). Evidence of credit quality deterioration as of the purchase date may include statistics such as past due and nonaccrual status, declines in current borrower FICO scores,
89
geographic concentration and declines in current loan-to-value ratios. U.S. GAAP requires these loans to be recorded at fair value at acquisition date and prohibits the “carrying over” or the creation of valuation allowances in the initial accounting for loans acquired in a transfer.
The fair values for purchased impaired loans are determined by discounting cash flows expected to be collected using an observable discount rate for similar instruments with adjustments that management believes a market participant would consider in determining fair value. We estimate the timing and amount of cash flows expected to be collected at acquisition using internal models that incorporate management’s best estimate of current key assumptions, such as default rates, loss severity and payment speeds.
Under the applicable accounting guidance for purchased impaired loans, any excess of cash flows expected at acquisition over the estimated fair value is referred to as the accretable yield and is recognized into interest income over the remaining life of the loan using the constant effective yield method when there is a reasonable expectation about amount and timing of such cash flows. The difference between contractually required payments at acquisition and the cash flows expected to be collected at acquisition is referred to as the non-accretable difference. Subsequent decreases in the expected cash flows will generally result in an allowance for loan losses. Subsequent increases in cash flows result in a reversal of the provision for losses to the extent of prior charges or an adjustment to the accretable yield. Purchased impaired loans with common risk characteristics are accounted for on a pool basis as a single asset with a single composite interest rate and an aggregate expectation of cash flows. Because we are recognizing interest income on each pool of loans, they are all considered to be performing.
U.S. GAAP requires purchased loans not subject to the specialized accounting guidance (“purchased non-impaired loans”) to be recorded at fair value at acquisition date and prohibits the “carrying over” or the creation of valuation allowances in the initial accounting for loans acquired in a transfer. Differences between the purchase price and the unpaid principal balance at the date of acquisition are recorded in interest income over the life of the loan. Decreases in expected cash flows after the purchase date are recognized by recording an allowance for loan losses.
Covered Assets – Purchased loans and foreclosed loan collateral covered under loss sharing or similar credit protection agreements with the Federal Deposit Insurance Corporation (“FDIC”) are reported separately on the face of the Consolidated Statements of Financial Condition inclusive of the fair value of reimbursement cash flows the Company expects to receive from the FDIC under those agreements. Similarly, the provision for covered loan losses is recorded net of the expected reimbursement from the FDIC.
Other Real Estate Owned – Other real estate owned (“OREO”) is comprised of property acquired through foreclosure proceedings or acceptance of a deed-in-lieu of foreclosure in partial or total satisfaction of certain loans. Properties are recorded at the lower of the recorded investment in the loan at the time of acquisition or the fair value, determined on the basis of current appraisals, comparable sales, and other estimates of value obtained principally from independent sources, adjusted for estimated selling costs. Any write-downs in the carrying value of a property at the time of acquisition are charged against the allowance for loan losses. Any subsequent write-downs to reflect current fair value, as well as gains or losses on disposition and revenues or expenses incurred in maintaining such properties are treated as period costs and reported in non-interest expense in the Consolidated Statements of Income.
Depreciable Assets – Premises, furniture and equipment, and leasehold improvements are stated at cost less accumulated depreciation. Depreciation expense is determined by the straight-line method over the estimated useful lives of the assets. Leasehold improvements are amortized on a straight-line basis over the shorter of the life of the asset or the lease term. Rates of depreciation are generally based on the following useful lives: buildings, 30-40 years; leasehold improvements, typically 1-16 years; and furniture and equipment including software, 3-7 years. Gains on dispositions are included in other income, and losses on dispositions are included in other expense in the Consolidated Statements of Income. Maintenance and repairs are charged to operating expenses as incurred, while improvements that extend the useful life of assets are capitalized and depreciated over the estimated remaining life.
Long-lived depreciable assets are evaluated periodically for impairment when events or changes in circumstances indicate the carrying amount may not be recoverable. Impairment exists when the expected undiscounted future cash flows of a long-lived asset are less than its carrying value. In that event, the Company recognizes a loss equal to the difference between the carrying amount and the estimated fair value of the asset based on a quoted market price, if applicable, or a discounted cash flow analysis. Impairment losses are recorded in other non-interest expense in the Consolidated Statements of Income.
Bank Owned Life Insurance (“BOLI”) – BOLI represents life insurance policies on the lives of certain Company officers for which the Company is the beneficiary. These policies are recorded as an asset on the Consolidated Statements of Financial Condition at their cash surrender value, or the amount that could be realized currently. The change in cash surrender value and insurance proceeds received are recorded as BOLI income in non-interest income in the Consolidated Statements of Income.
Goodwill and Other Intangible Assets – Goodwill represents the excess of purchase price over the fair value of net assets acquired using the acquisition method of accounting. Other intangible assets represent purchased assets that also lack physical substance but
90
can be distinguished from goodwill because of contractual or other legal rights or because the asset is capable of being sold or exchanged either on its own or in combination with a related contract, asset, or liability.
Goodwill is tested at the reporting unit level at least annually for impairment or more often if an event occurs or circumstances change that indicate it is more likely than not that the fair value of a reporting unit is less than its carrying amount. The Company has determined that its operating segments qualify as reporting units under U.S. GAAP. In “step one” of the impairment testing process, the fair value of each reporting unit is compared to the recorded book value. Our step one calculation of each reporting unit’s fair value is based upon a simple average of two metrics: (1) a primary market approach, which measures fair value based upon trading multiples of independent publicly traded financial institutions of comparable size and character to the reporting units, and (2) an income approach, which estimates fair value based upon discounted cash flows and terminal value (using the perpetuity growth method). If the fair value of the reporting unit exceeds its carrying value, goodwill is not considered impaired and “step two” is not considered necessary. If the carrying value of a reporting unit exceeds its fair value, the impairment test continues (“step two”) by comparing the carrying value of the reporting unit’s goodwill to the implied fair value of goodwill. The implied fair value of goodwill is determined using the residual approach, where the fair value of a reporting unit is allocated to all of the assets and liabilities of that unit as if the reporting unit had been acquired in a business combination and the fair value of the reporting unit, calculated in step one, is the price paid to acquire the reporting unit. The excess of the fair value of the reporting unit over the amounts assigned to its assets and liabilities is the implied fair value of goodwill. An impairment charge is recognized to the extent the carrying value of goodwill exceeds the implied fair value of goodwill.
Identified intangible assets that have a finite useful life are amortized over that life in a manner that reflects the estimated decline in the economic value of the identified intangible asset and are subject to impairment testing whenever events or changes in circumstances indicate that the carrying value may not be recoverable. All of the Company’s other intangible assets have finite lives and are amortized over varying periods not exceeding 15 years.
Fiduciary Assets and Assets Under Management – Assets held in a fiduciary capacity for clients are not included in the consolidated financial statements as they are not assets of the Company or its subsidiaries. Fiduciary and asset management fees are generally determined based upon market values of assets under management as of a specified date during the period and are included as a component of non-interest income in the Consolidated Statements of Income.
Advertising Costs – All advertising costs are expensed in the period they are incurred.
Loss Contingencies – Loss contingencies, including claims and legal actions arising in the ordinary course of business, are recorded as liabilities when the likelihood of loss is probable and an amount or range of loss can be reasonably estimated.
Derivative Instruments – We utilize an overall risk management strategy that incorporates the use of derivative instruments that are not designated in hedge relationships to reduce interest rate risk, as it relates to mortgage loan commitments and planned sales, and foreign currency volatility. We also use derivative instruments that are not designated in hedge relationships for client accommodation as we provide derivative risk management solutions for our clients. Additionally, we use interest rate derivatives designated in cash flow hedge relationships to hedge interest rate risk in our loan portfolio that is comprised primarily of floating rate loans.
All derivative instruments are recorded at fair value on the Consolidated Statements of Financial Condition, after considering the effects of master netting agreements as allowed under authoritative accounting guidance.
On the date we enter into a derivative contract, we designate the derivative instrument as a fair value hedge, cash flow hedge, or as a freestanding derivative instrument. Derivative instruments designated in a hedge relationship to mitigate exposure to changes in the fair value of an asset or liability attributable to a particular risk, such as interest rate risk, are considered to be fair value hedges. Derivative instruments designated in a hedge relationship to mitigate exposure to variability in expected future cash flows to be received or paid related to an asset or liability or other types of forecasted transactions are considered to be cash flow hedges. We formally document all relationships between hedging instruments and hedged items, as well as our risk management objective and strategy for undertaking each hedge transaction.
For derivative instruments that are designated and qualify as a fair value hedge and are effective, the gain or loss on the derivative instrument, as well as the offsetting loss or gain on the hedged item attributable to the hedged risk, are recognized in current earnings during the period of the change in fair values. For derivative instruments that are designated and qualify as a cash flow hedge, the effective portion of the gain or loss on the derivative instrument is reported as a component of OCI. The unrealized gain or loss is reclassified into earnings in the same period or periods during which the hedged transaction affects earnings. For all hedge relationships, derivative gains and losses not effective in hedging the change in fair value or expected cash flows of the hedged item are recognized immediately in current earnings during the period of change. For derivatives not designated in a hedge relationship, changes in fair value are reported in current earnings during the period of change.
91
At the hedge’s inception and at least quarterly thereafter, a formal assessment is performed to determine whether changes in the fair values or cash flows of the derivative instruments have been highly effective in offsetting changes in the fair values or cash flows of the hedged item and whether they are expected to be highly effective in the future. If a derivative instrument designated as a hedge is terminated or ceases to be highly effective, hedge accounting is discontinued prospectively and the gain or loss is amortized to earnings over the remaining life of the hedged asset or liability (fair value hedge) or over the same period(s) that the forecasted hedged transactions impact earnings (cash flow hedge). If the forecasted transaction is no longer probable of occurring, the gain or loss is included in earnings immediately.
See Note 18 for additional information on derivative instruments.
Income Taxes – The Company and its subsidiaries file a consolidated Federal income tax return. The provision for income taxes is based on income reported in the Consolidated Statements of Income, rather than amounts reported on our income tax return.
We recognize a deferred tax asset or liability for the estimated future tax effects attributable to “temporary differences.” Temporary differences include differences between financial statement income and tax return income that are expected to reverse in future periods, as well as differences between the financial reporting and tax bases of assets and liabilities that are also expected to be settled in future periods. Deferred tax assets and liabilities are measured using the enacted tax rates that we expect will apply when the differences are reversed or settled. A valuation allowance is recorded to reduce deferred tax assets to the amount management concludes is more likely than not to be realized.
We periodically review and evaluate the status of uncertain tax positions and may establish tax reserves for tax benefits that may not be realized. Any income tax-related interest and penalties are included in income tax expense.
Net Earnings Per Common Share – Basic income (loss) per common share is calculated using the two-class method. The two-class method is an earnings allocation formula that determines earnings per share for each share of common stock and participating securities according to dividends declared (distributed earnings) and participation rights in undistributed earnings. Distributed and undistributed earnings are allocated between common and participating security stockholders based on their respective rights to receive dividends. Unvested share-based payment awards that contain nonforfeitable rights to dividends or dividend equivalents are considered participating securities (i.e., the Company’s deferred stock units and nonvested restricted stock awards and restricted stock units, excluding certain awards with forfeitable rights to dividends). Undistributed net losses are not allocated to holders of participating securities, as they do not have a contractual obligation to fund the losses incurred by the Company. Net income (loss) attributable to common shares is then divided by the weighted-average number of common shares outstanding during the period, net of participating securities.
Diluted income (loss) per common share considers common stock issuable under the assumed release of nonvested restricted stock awards and units with forfeitable dividend rights and the assumed exercise of stock options granted under the Company’s stock plans as well as the assumed exercise of a warrant related to the United States Treasury (“U.S. Treasury”) under the Troubled Asset Relief Program (“TARP”) Capital Purchase Program (“CPP”) (potentially dilutive common stock equivalents). Diluted income (loss) attributable to common shares is then divided by the total of weighted-average number of common shares and common stock equivalents outstanding during the period, net of participating securities. Potentially dilutive common stock equivalents are excluded from the computation of diluted earnings per common share in periods in which the effect would be antidilutive. Diluted earnings per common share is calculated under the more dilutive of either the treasury method or the two-class method. See Note 14 for additional information.
Treasury Stock – Treasury stock acquired is recorded at cost and is carried as a reduction of equity on the Consolidated Statements of Financial Condition.
Share-Based Compensation– Share-based compensation cost is recognized as expense for stock options, restricted stock awards, restricted stock units, and deferred stock units issued to employees and non-employee directors based on the fair value of these awards at the date of grant. A binomial option-pricing model is utilized to estimate the fair value of stock options, while the closing market price of the Company’s common stock at the date of grant is used for restricted stock awards, restricted stock units, and deferred stock units. The costs are recognized ratably on a straight-line basis over the requisite service period, generally defined as the vesting period for the awards. When an award is granted to an employee who is retirement eligible or who will become retirement eligible prior to the end of the service period and will continue to vest after retirement, the compensation cost of these awards is recognized over the period up to the date an employee first becomes eligible to retire. The amortization of share-based compensation generally reflects estimated forfeitures adjusted for actual forfeiture experience. As compensation expense is recognized, a deferred tax asset is recorded that represents an estimate of the future tax deduction from exercise or release of restrictions. However, in cases in which a future tax deduction will not be allowed because of TARP-related compensation restrictions, a deferred tax asset is not recorded. At the time share-based awards are exercised, cancelled, expire, or restrictions are released, we may be required to recognize an adjustment to
92
stockholders’ equity or income tax expense, depending on the market price of the Company’s stock at that time and the amount of the deferred tax asset relating to such awards. Share-based compensation expense is included in “salaries and wages” in the Consolidated Statements of Income.
For additional details on our share-based compensation plans, refer to Notes 15 and 16.
Comprehensive Income– Comprehensive income consists of two components, reported net income and OCI. OCI refers to revenue, expenses, gains, and losses that are recorded as an element of equity but are excluded from reported net income. OCI consists of unrealized gains (losses) on securities available-for-sale and changes in the fair value of derivative instruments designated in cash flow hedges, net of tax.
Preferred Stock – Preferred stock ranks senior to common stock with respect to dividends and has preference in the event of liquidation. The shares of fixed rate cumulative perpetual preferred stock, Series B (“Series B Preferred Stock”) issued to the U.S. Treasury under the TARP CPP of the Emergency Economic Stabilization Act of 2008 and the warrant issued under the CPP are accounted for as permanent equity on the Consolidated Statements of Financial Condition. The proceeds received were allocated between the Series B Preferred Stock and the warrant based upon their relative fair values as of the date of issuance, which resulted in the recording of a discount on the Series B Preferred Stock upon issuance that reflects the value allocated to the warrant. The discount is accreted by a charge to retained earnings using the effective interest method over the expected life of the preferred stock of five years.
The Series B Preferred Stock pays cumulative dividends at a rate of 5% per annum until the fifth anniversary of the date of issuance, and thereafter at a rate of 9% per annum. Dividends are payable quarterly in arrears and accrued as earned over the period the Series B Preferred Stock is outstanding. Preferred dividends paid (declared and accrued) and the related accretion is deducted from net income for computing income available to common stockholders and earnings per share computations.
Segment Disclosures – An operating segment is a component of a business that (i) engages in business activities from which it may earn revenues and incur expenses; (ii) has operating results that are reviewed regularly by the entity’s chief operating decision maker to make decisions about resources to be allocated to the segment and assess its performance; and (iii) has discrete financial information available. Our chief operating decision maker evaluates the operations of the Company under three operating segments: Banking, Trust and Investments, and Holding Company. Refer to Note 21 for additional disclosure regarding the performance of our operating segments.
Variable Interest Entities – A variable interest entity (“VIE”) is a partnership, limited liability company, trust, or other legal entity that does not have sufficient equity to permit it to finance its activities without additional subordinated financial support from other parties, or whose investors lack one of three characteristics associated with owning a controlling financial interest. Those characteristics are: (i) the power, through voting rights or similar rights, to direct the activities of an entity that most significantly impact the entity’s economic performance, (ii) the obligation to absorb the expected losses of an entity; and (iii) the right to receive the expected residual returns of the entity.
U.S. GAAP requires VIEs to be consolidated by the party that has a controlling financial interest in the VIE (i.e., the primary beneficiary). The Company is deemed to have a controlling financial interest and is the primary beneficiary of a VIE if it has both the power to direct the activities of the VIE that most significantly impact the VIE’s economic performance and an obligation to absorb losses or the right to receive benefits that could potentially be significant to the VIE.
| 2. | RECENT ACCOUNTING PRONOUNCEMENTS |
Recently Adopted Accounting Pronouncements
Disclosures on Loan Credit Quality and Allowance for Credit Losses – On December 31, 2010, we adopted new accounting guidance issued by the Financial Accounting Standards Board (“FASB”) related to improving disclosures about an entity’s allowance for loan losses and the credit quality of its loans. The guidance requires additional disclosure to facilitate financial statement users’ evaluation of the following: (1) the nature of credit risk inherent in the entity’s loan portfolio, (2) how that risk is analyzed and assessed in arriving at the allowance for loan losses, and (3) the changes and reasons for those changes in the allowance for loan losses. This guidance was effective for the Company’s financial statements as of December 31, 2010, as it relates to disclosures required as of the end of a reporting period. Disclosures that relate to activity during a reporting period became effective for the Company’s financial statements beginning on January 1, 2011. Since the new guidance only affects disclosures, it did not impact our financial position and consolidated results of operations upon adoption.
93
Fair Value Measurement Disclosures – On January 1, 2011, we adopted the additional disclosure requirements that had a delayed effective date under the new accounting guidance issued by the FASB in January 2010 regarding separate presentation of information about purchases, sales, issuances and settlements for Level 3 fair value measurements. As this guidance only affects disclosures, the adoption of this guidance did not impact our financial position and consolidated results of operations.
Troubled Debt Restructurings – On July 1, 2011, we adopted new guidance related to a creditor’s accounting for TDRs, as well as new disclosure requirements related to TDRs. The guidance clarifies whether a modification of a loan receivable constitutes a concession to a borrower that is experiencing financial difficulty. The guidance and disclosures were effective for the Company’s financial statements that include periods beginning on or after July 1, 2011, with retrospective application to the Company’s annual reporting period beginning on January 1, 2011. The adoption of this guidance did not have a material impact on our financial position and consolidated results of operations.
Accounting Pronouncements Pending Adoption
Transfers and Servicing– On April 29, 2011, the FASB issued amendments to its accounting guidance on the effective control assessment for repurchase agreements that in part determines whether a transaction is accounted for as a sale or a secured borrowing. The amendments remove from the assessment of effective control: (1) the criterion requiring the transferor to have the ability to repurchase or redeem the financial assets on substantially the agreed terms, even in the event of default by the transferee, and (2) the collateral maintenance implementation guidance related to that criterion. The guidance will be effective for the Company’s financial statements that include periods beginning on or after January 1, 2012. The adoption of this guidance is not expected to have a material impact on our financial position and consolidated results of operations.
Fair Value Measurement – On May 12, 2011, the FASB issued amendments to its fair value measurement guidance. The amendments substantially converge the principles for measuring fair value and the requirements for related disclosures under U.S. GAAP and International Financial Reporting Standards. The amendments include clarifications and new guidance related to the highest and best use and valuation premise, measuring the fair value of an instrument classified in shareholders’ equity, measuring the fair value of financial instruments that are managed within a portfolio, and the application of block discounts and other premiums and discounts in a fair value measurement. The amendments also require additional disclosures about fair value measurements. The guidance will be effective for the Company’s financial statements that include periods beginning on or after January 1, 2012. The adoption of this guidance is not expected to have a material impact on our financial position and consolidated results of operations.
Statement of Comprehensive Income – On June 16, 2011, the FASB issued guidance on the presentation of the statement of comprehensive income and in addition provided further clarifying guidance on presentation requirements on December 23, 2011. This guidance provides the Company the option of presenting net income and other comprehensive income in one continuous statement of comprehensive income or in two separate but consecutive statements. The amendments do not change what items are reported in other comprehensive income. The guidance will be effective for the Company’s financial statements that include periods beginning on or after January 1, 2012 and must be retrospectively applied. As this guidance affects only our presentation of the statement of comprehensive income, the adoption of this guidance will not have a material impact on our financial position and consolidated results of operations.
Testing Goodwill for Impairment – On September 15, 2011, the FASB issued guidance that permits the Company to perform a qualitative assessment of whether it is more likely than not that the fair value of a reporting unit is less than its carrying value before applying the existing two-step goodwill impairment test. If the Company concludes that this is the case, the Company would proceed with the existing two-step test, whereby the Company would quantitatively determine whether the fair value of a reporting unit is less than its carrying value, and if so, measure the amount of any goodwill impairment. Otherwise, the Company would be able to bypass the two-step test and conclude that goodwill is not impaired from a qualitative perspective. The guidance will be effective for the Company’s financial statements that include periods beginning on or after January 1, 2012. The adoption of this guidance will not have a material impact on our financial position and consolidated results of operations.
Disclosures about Offsetting Assets and Liabilities – On December 16, 2011, the FASB issued guidance to enhance current disclosure requirements on offsetting financial assets and liabilities. The new disclosure requirements are limited to recognized financial instruments subject to master netting arrangements or similar agreements. At a minimum, the Company will be required to disclose the following information separately for financial assets and liabilities: (a) the gross amounts of recognized financial assets and liabilities, (b) the amounts offset under current U.S. GAAP, (c) the net amounts presented in the balance sheet, (d) the amounts subject to an enforceable master netting arrangement or similar agreement that were not included in (b), and (e) the difference between (c) and (d). The guidance will be effective for the Company’s financial statements that include periods beginning on or after January 1, 2013, and must be retrospectively applied. As this guidance affects only our disclosures, the adoption of this guidance will not have a material impact on our financial position and consolidated results of operations.
94
Securities Portfolio
(Amounts in thousands)
| | | | | | | | | | | | | | | | | | | | | | | | | | | | | | | | | | |
| | | December 31, | |
| | |
| | | 2011 | | | 2010 | |
| | | Amortized
Cost | | | Gross Unrealized | | | | | Fair
Value | | | Amortized
Cost | | | Gross Unrealized | | | Fair
Value | |
| | | | Gains | | | Losses | | | | | | | Gains | | | Losses | | |
Securities Available-for-Sale | | | | | | | | | | | | | | | | | | | | | | | | | | | | | | | | | | |
U.S. Treasury | | $ | 60,590 | | | $ | 931 | | | $ | - | | | | | $ | 61,521 | | | $ | - | | | $ | - | | | $ | - | | | $ | - | |
U.S. Agencies | | | 10,014 | | | | 20 | | | | - | | | | | | 10,034 | | | | 10,155 | | | | 271 | | | | - | | | | 10,426 | |
Collateralized mortgage obligations | | | 344,078 | | | | 12,062 | | | | (140) | | | | | | 356,000 | | | | 450,251 | | | | 9,400 | | | | (7,930) | | | | 451,721 | |
Residential mortgage -backed securities | | | 1,140,555 | | | | 48,660 | | | | (2) | | | | | | 1,189,213 | | | | 1,222,642 | | | | 31,701 | | | | (7,312) | | | | 1,247,031 | |
State and municipal | | | 154,080 | | | | 12,140 | | | | (23) | | | | | | 166,197 | | | | 166,209 | | | | 6,433 | | | | (534) | | | | 172,108 | |
Foreign sovereign debt | | | 500 | | | | - | | | | - | | | | | | 500 | | | | 500 | | | | - | | | | - | | | | 500 | |
| | | | | | | | | | | | | | | | | | | | | | | | | | | | | | | | | | |
Total | | $ | 1,709,817 | | | $ | 73,813 | | | $ | (165) | | | | | $ | 1,783,465 | | | $ | 1,849,757 | | | $ | 47,805 | | | $ | (15,776) | | | $ | 1,881,786 | |
| | | | | | | | | | | | | | | | | | | | | | | | | | | | | | | | | | |
| | | | | | | | |
Securities Held-to-Maturity | | | | | | | | | | | | | | | | | | | | | | | | | | | | | | | |
Residential mortgage -backed securities | | $ | 490,072 | | | $ | 3,172 | | | $ | (85) | | | | | $ | 493,159 | | | $ | - | | | $ | - | | | $ | - | | | $ | - | |
State and municipal | | | 71 | | | | - | | | | - | | | | | | 71 | | | | - | | | | - | | | | - | | | | - | |
| | | | | | | | | | | | | | | | | | | | | | | | | | | | | | | | | | |
Total | | $ | 490,143 | | | $ | 3,172 | | | $ | (85) | | | | | $ | 493,230 | | | $ | - | | | $ | - | | | $ | - | | | $ | - | |
| | | | | | | | | | | | | | | | | | | | | | | | | | | | | | | | | | |
Non-Marketable Equity Investments | | | | | | | | | | | | | | | | | | | | | | | | | | | | | | | | | | |
FHLB stock | | $ | 40,695 | | | $ | - | | | $ | - | | | | | $ | 40,695 | | | $ | 20,694 | | | $ | - | | | $ | - | | | $ | 20,694 | |
Other | | | 2,909 | | | | - | | | | - | | | | | | 2,909 | | | | 2,843 | | | | - | | | | - | | | | 2,843 | |
| | | | | | | | | | | | | | | | | | | | | | | | | | | | | | | | | | |
Total | | $ | 43,604 | | | $ | - | | | $ | - | | | | | $ | 43,604 | | | $ | 23,537 | | | $ | - | | | $ | - | | | $ | 23,537 | |
| | | | | | | | | | | | | | | | | | | | | | | | | | | | | | | | | | |
Non-marketable equity investments primarily consist of Federal Home Loan Bank (“FHLB”) stock and represent amounts required to be invested in the common stock of the FHLB. This equity security is “restricted” in that it can only be sold to the FHLB or another member institution at par. Therefore, it is less liquid than other equity securities. The fair value is estimated to be cost, and no other-than-temporary impairments have been recorded on this security during 2011 and 2010.
The carrying value of securities pledged to secure public deposits, trust deposits, derivative transactions with counterparty banks, standby letters of credit with counterparty banks and for other purposes as permitted or required by law, totaled $514.6 million and $656.3 million at December 31, 2011 and 2010, respectively.
Excluding securities issued or backed by the U.S. Government and its agencies and U.S. Government-sponsored enterprises, there were no investments in securities from one issuer that exceeded 10% of consolidated equity at December 31, 2011 or 2010.
The following table presents the aggregate amount of unrealized losses and the aggregate related fair values of securities with unrealized losses as of December 31, 2011 and 2010. The securities presented are grouped according to the time periods during which the securities have been in a continuous unrealized loss position.
95
Securities In Unrealized Loss Position
(Amounts in thousands)
| | | | | | | | | | | | | | | | | | | | | | | | |
| | | Less Than 12 Months | | | 12 Months or Longer | | | Total | |
| | | Fair
Value | | | Unrealized
Losses | | | Fair
Value | | | Unrealized
Losses | | | Fair
Value | | | Unrealized
Losses | |
As of December 31, 2011 | | | | | | | | | | | | | | | | | | | | | | | | |
Securities Available-for-Sale | | | | | | | | | | | | | | | | | | | | | | | | |
Collateralized mortgage obligations | | $ | 36,126 | | | $ | (140) | | | $ | - | | | $ | - | | | $ | 36,126 | | | $ | (140) | |
Residential mortgage-backed securities | | | 154 | | | | (2) | | | | - | | | | - | | | | 154 | | | | (2) | |
State and municipal | | | 4,352 | | | | (23) | | | | - | | | | - | | | | 4,352 | | | | (23) | |
| | | | | | | | | | | | | | | | | | | | | | | | |
Total | | $ | 40,632 | | | $ | (165) | | | $ | - | | | $ | - | | | $ | 40,632 | | | $ | (165) | |
| | | | | | | | | | | | | | | | | | | | | | | | |
Securities Held-to-Maturity | | | | | | | | | | | | | | | | | | | | | | | | |
Residential mortgage-backed securities | | $ | 80,500 | | | $ | (85) | | | $ | - | | | $ | - | | | $ | 80,500 | | | $ | (85) | |
| | | | | | |
As of December 31, 2010 | | | | | | | | | | | | | | | | | | | | | | | | |
Securities Available-for-Sale | | | | | | | | | | | | | | | | | | | | | | | | |
Collateralized mortgage obligations | | $ | 148,643 | | | $ | (7,930) | | | $ | - | | | $ | - | | | $ | 148,643 | | | $ | (7,930) | |
Residential mortgage-backed securities | | | 378,211 | | | | (7,312) | | | | - | | | | - | | | | 378,211 | | | | (7,312) | |
State and municipal | | | 33,710 | | | | (534) | | | | - | | | | - | | | | 33,710 | | | | (534) | |
| | | | | | | | | | | | | | | | | | | | | | | | |
Total | | $ | 560,564 | | | $ | (15,776) | | | $ | - | | | $ | - | | | $ | 560,564 | | | $ | (15,776) | |
| | | | | | | | | | | | | | | | | | | | | | | | |
There were no securities in an unrealized loss position for greater than 12 months at December 31, 2011 and 2010. The decrease in unrealized losses from the prior year for agency backed collateralized mortgage obligations, agency backed residential mortgage-backed securities and state and municipal securities were caused primarily by decreases in interest rates and tightening of credit spreads.
The unrealized losses on these securities as of December 31, 2011 are attributable to changes in interest rates, and because we do not intend to sell the investments and it is not more likely than not that we will be required to sell the investments before recovery of their amortized cost bases, which may be at maturity, we do not consider these investments to be other-than-temporarily impaired at December 31, 2011.
96
Remaining Contractual Maturity of Securities
(Amounts in thousands)
| | | | | | | | | | | | | | | | | | |
| | | December 31, 2011 | |
| | | Available-For-Sale | | | | | Held-To-Maturity and
Non-Marketable Equity
Investments | |
| | | Amortized
Cost | | | Fair
Value | | | | | Amortized
Cost | | | Fair
Value | |
U.S. Treasury, U.S. Agencies, state and municipals and foreign sovereign debt securities | | | | | | | | | | | | | | | | | | |
One year or less | | $ | 1,942 | | | $ | 1,953 | | | | | $ | 23 | | | $ | 23 | |
One year to five years | | | 98,608 | | | | 101,421 | | | | | | 48 | | | | 48 | |
Five years to ten years | | | 102,932 | | | | 111,942 | | | | | | - | | | | - | |
After ten years | | | 21,702 | | | | 22,936 | | | | | | - | | | | - | |
All other securities | | | | | | | | | | | | | | | | | | |
Collateralized mortgage obligations | | | 344,078 | | | | 356,000 | | | | | | - | | | | - | |
Residential mortgage-backed securities | | | 1,140,555 | | | | 1,189,213 | | | | | | 490,072 | | | | 493,159 | |
Non-marketable equity investments | | | - | | | | - | | | | | | 43,604 | | | | 43,604 | |
| | | | | | | | | | | | | | | | | | |
Total | | $ | 1,709,817 | | | $ | 1,783,465 | | | | | $ | 533,747 | | | $ | 536,834 | |
| | | | | | | | | | | | | | | | | | |
Securities Gains (Losses)
(Amounts in thousands)
| | | | | | | | | | | | |
| | | Years ended December 31, | |
| | | 2011 | | | 2010 | | | 2009 | |
Proceeds from sales | | $ | 295,870 | | | $ | 432,895 | | | $ | 265,778 | |
| | | |
Gross realized gains | | $ | 6,300 | | | $ | 13,469 | | | $ | 8,527 | |
Gross realized losses | | | (529) | | | | (1,287) | | | | (1,146) | |
| | | | | | | | | | | | |
Net realized gains | | $ | 5,771 | | | $ | 12,182 | | | $ | 7,381 | |
| | | | | | | | | | | | |
| | | |
Income tax provision on net realized gains | | $ | 2,295 | | | $ | 4,669 | | | $ | 2,826 | |
Refer to Note 13 for additional details of the securities available-for-sale portfolio and the related impact of unrealized gains (losses) on other comprehensive income.
97
The following loan portfolio and credit quality disclosures exclude covered loans. Covered loans represent loans acquired through a FDIC-assisted transaction that are subject to a loss share agreement and are presented separately in the Consolidated Statements of Financial Condition. Refer to Note 6 for a detailed discussion regarding covered loans.
Loan Portfolio
(Amounts in thousands)
| | | | | | | | |
| | | December 31, | |
| | | 2011 | | | 2010 | |
Commercial and industrial | | $ | 4,264,738 | | | $ | 3,967,548 | |
Commercial – owner-occupied commercial real estate | | | 1,135,023 | | | | 897,620 | |
| | | | | | | | |
Total commercial | | | 5,399,761 | | | | 4,865,168 | |
Commercial real estate | | | 2,186,340 | | | | 2,448,632 | |
Commercial real estate – multi-family | | | 424,119 | | | | 457,246 | |
| | | | | | | | |
Total commercial real estate | | | 2,610,459 | | | | 2,905,878 | |
Construction | | | 287,002 | | | | 530,733 | |
Residential real estate | | | 297,229 | | | | 319,146 | |
Home equity | | | 181,158 | | | | 197,179 | |
Personal | | | 232,952 | | | | 296,253 | |
| | | | | | | | |
Total loans | | $ | 9,008,561 | | | $ | 9,114,357 | |
| | | | | | | | |
| | |
Deferred loan fees included as a reduction in total loans | | $ | 39,259 | | | $ | 33,535 | |
Overdrawn demand deposits included in total loans | | $ | 1,919 | | | $ | 3,197 | |
We primarily lend to businesses and consumers in the market areas in which we have physical locations. We seek to diversify our loan portfolio by loan type, industry, and borrower.
Carrying Value of Loans Pledged
(Amounts in thousands)
| | | | | | | | |
| | | December 31, | |
| | | 2011 | | | 2010 | |
Loans pledged to secure: | | | | | | | | |
Federal Reserve Bank discount window borrowings | | $ | 1,352,012 | | | $ | 913,599 | |
FHLB advances | | | 583,507 | | | | 184,026 | |
| | | | | | | | |
Total | | $ | 1,935,519 | | | $ | 1,097,625 | |
| | | | | | | | |
Related Party Loans
Some of our executive officers and directors are, and have been during the preceding year, clients of our Bank, and some of our executive officers and directors are direct or indirect owners of 10% or more of the stock of corporations which are, or have been in the past, clients of the Bank. As clients, they have had transactions with the Bank, in the ordinary course of business of the Bank, including borrowings, that are or were on substantially the same terms (including interest rates and collateral on loans) as those prevailing at the time for comparable transactions with nonaffiliated persons. The Securities and Exchange Commission has determined that, with respect to the Company and its significant subsidiaries, expanded disclosure of borrowings by directors and executive officers and certain of their related interests should be made if the loans outstanding are greater than 5% of the issuer’s stockholders’ equity, in the aggregate. These loans totaled $11.2 million and $24.7 million at December 31, 2011 and 2010, respectively, and were not greater the 5% of stockholders’ equity at either December 31, 2011 or 2010. Related party credit extensions totaled $19.3 million and $97.7 million at December 31, 2011 and 2010, respectively. In the opinion of management, none of the transactions involved more than the normal risk of collectability or presented any other unfavorable features.
98
Loan Portfolio Aging
Loan Portfolio Aging
(Amounts in thousands)
| | | | | | | | | | | | | | | | | | | | | | | | | | | | |
| | | | | | Delinquent | | | | | | | | | | |
| | | | | | | |
| | | Current | | | 30 – 59
Days Past
Due | | | 60 – 89
Days Past
Due | | | 90 Days Past
Due and
Accruing | | | Total
Accruing
Loans | | | Nonaccrual | | | Total Loans | |
| | | | | | | |
As of December 31, 2011 | | | | | | | | | | | | | | | | | | | | | | | | | | | | |
Commercial | | $ | 5,326,862 | | | $ | 6,018 | | | $ | 923 | | | $ | - | | | $ | 5,333,803 | | | $ | 65,958 | | | $ | 5,399,761 | |
Commercial real estate | | | 2,463,902 | | | | 3,523 | | | | 9,777 | | | | - | | | | 2,477,202 | | | | 133,257 | | | | 2,610,459 | |
Construction | | | 262,742 | | | | - | | | | 2,381 | | | | - | | | | 265,123 | | | | 21,879 | | | | 287,002 | |
Residential real estate | | | 278,195 | | | | 3,800 | | | | 645 | | | | - | | | | 282,640 | | | | 14,589 | | | | 297,229 | |
Home equity | | | 168,322 | | | | 433 | | | | 800 | | | | - | | | | 169,555 | | | | 11,603 | | | | 181,158 | |
Personal | | | 220,364 | | | | 13 | | | | 9 | | | | - | | | | 220,386 | | | | 12,566 | | | | 232,952 | |
| | | | | | | | | | | | | | | | | | | | | | | | | | | | |
Total loans | | $ | 8,720,387 | | | $ | 13,787 | | | $ | 14,535 | | | $ | - | | | $ | 8,748,709 | | | $ | 259,852 | | | $ | 9,008,561 | |
| | | | | | | | | | | | | | | | | | | | | | | | | | | | |
| | | | | | | |
As of December 31, 2010 | | | | | | | | | | | | | | | | | | | | | | | | | | | | |
Commercial | | $ | 4,793,144 | | | $ | 1,024 | | | $ | 759 | | | $ | - | | | $ | 4,794,927 | | | $ | 70,241 | | | $ | 4,865,168 | |
Commercial real estate | | | 2,668,639 | | | | 10,264 | | | | 12,346 | | | | - | | | | 2,691,249 | | | | 214,629 | | | | 2,905,878 | |
Construction | | | 495,435 | | | | - | | | | 1,895 | | | | - | | | | 497,330 | | | | 33,403 | | | | 530,733 | |
Residential real estate | | | 300,027 | | | | 180 | | | | 4,098 | | | | - | | | | 304,305 | | | | 14,841 | | | | 319,146 | |
Home equity | | | 185,675 | | | | 976 | | | | 2,333 | | | | - | | | | 188,984 | | | | 8,195 | | | | 197,179 | |
Personal | | | 256,860 | | | | 13,122 | | | | 1,700 | | | | - | | | | 271,682 | | | | 24,571 | | | | 296,253 | |
| | | | | | | | | | | | | | | | | | | | | | | | | | | | |
Total loans | | $ | 8,699,780 | | | $ | 25,566 | | | $ | 23,131 | | | $ | - | | | $ | 8,748,477 | | | $ | 365,880 | | | $ | 9,114,357 | |
| | | | | | | | | | | | | | | | | | | | | | | | | | | | |
99
Impaired Loans
Impaired Loans
(Amounts in thousands)
| | | | | | | | | | | | | | | | | | | | |
| | | Unpaid
Contractual
Principal
Balance | | | Recorded
Investment
With No
Specific
Reserve | | | Recorded
Investment
With
Specific
Reserve | | | Total
Recorded
Investment | | | Specific
Reserve | |
As of December 31, 2011 | | | | | | | | | | | | | | | | | | | | |
Commercial | | $ | 123,317 | | | $ | 67,628 | | | $ | 46,098 | | | $ | 113,726 | | | $ | 14,163 | |
Commercial real estate | | | 185,287 | | | | 55,173 | | | | 114,233 | | | | 169,406 | | | | 38,905 | |
Construction | | | 24,135 | | | | 1,548 | | | | 20,331 | | | | 21,879 | | | | 5,202 | |
Residential real estate | | | 18,577 | | | | 10,502 | | | | 7,325 | | | | 17,827 | | | | 976 | |
Home equity | | | 12,881 | | | | 2,310 | | | | 9,293 | | | | 11,603 | | | | 1,272 | |
Personal | | | 38,515 | | | | 14,751 | | | | 11,569 | | | | 26,320 | | | | 9,426 | |
| | | | | | | | | | | | | | | | | | | | |
Total impaired loans | | $ | 402,712 | | | $ | 151,912 | | | $ | 208,849 | | | $ | 360,761 | | | $ | 69,944 | |
| | | | | | | | | | | | | | | | | | | | |
| | | | | |
As of December 31,2010 | | | | | | | | | | | | | | | | | | | | |
Commercial | | $ | 86,341 | | | $ | 30,143 | | | $ | 48,115 | | | $ | 78,258 | | | $ | 17,271 | |
Commercial real estate | | | 304,043 | | | | 121,926 | | | | 152,722 | | | | 274,648 | | | | 38,747 | |
Construction | | | 52,055 | | | | 11,437 | | | | 26,314 | | | | 37,751 | | | | 3,778 | |
Residential real estate | | | 17,186 | | | | 4,413 | | | | 11,226 | | | | 15,639 | | | | 1,046 | |
Home equity | | | 8,575 | | | | - | | | | 8,195 | | | | 8,195 | | | | 2,614 | |
Personal | | | 48,911 | | | | 21,227 | | | | 17,738 | | | | 38,965 | | | | 7,515 | |
| | | | | | | | | | | | | | | | | | | | |
Total impaired loans | | $ | 517,111 | | | $ | 189,146 | | | $ | 264,310 | | | $ | 453,456 | | | $ | 70,971 | |
| | | | | | | | | | | | | | | | | | | | |
Average Recorded Investment and Interest Income Recognized on Impaired Loans(1)
(Amounts in thousands)
| | | | | | | | |
| | | Year Ended | |
| | | Average Recorded
Investment | | | Interest Income
Recognized | |
December 31, 2011 | | | | | | | | |
Commercial | | $ | 99,548 | | | $ | 2,585 | |
Commercial real estate | | | 245,722 | | | | 2,852 | |
Construction | | | 35,411 | | | | 181 | |
Residential real estate | | | 19,060 | | | | 67 | |
Home equity | | | 12,230 | | | | 29 | |
Personal | | | 31,928 | | | | 497 | |
| | | | | | | | |
Total | | $ | 443,899 | | | $ | 6,211 | |
| | | | | | | | |
| | |
December 31, 2010 | | $ | 423,527 | | | | | |
|
(1) Represents amounts while classified as impaired for the periods presented. | |
Credit Quality Indicators
The Company has adopted an internal risk rating policy in which each loan is rated for credit quality with a numerical rating of 1 through 8. Loans rated 5 and better (1-5 ratings, inclusive) are credits that exhibit acceptable financial performance, cash flow, and leverage. We attempt to mitigate risk by structure, collateral, monitoring, or other meaningful controls. Credits rated 6 are considered special mention as these credits demonstrate potential weakness that if left unresolved, may result in deterioration in the Company’s credit position and/or the repayment prospects for the credit. Borrowers rated special mention may exhibit adverse operating trends, high leverage, tight liquidity or other credit concerns. Potential problem loans are loans that we have identified as performing in
100
accordance with contractual terms, but for which management has some level of concern about the ability of the borrowers to meet existing repayment terms in future periods. These loans have a risk rating of 7 but are not classified as nonaccrual. The ultimate collection of these loans is questionable due to the same conditions that characterize a 6-rated credit. These credits may also be considered inadequately protected by the current net worth and/or paying capacity of the obligor or guarantors or the collateral pledged. These loans generally have a well-defined weakness or weaknesses that may jeopardize collection of the debt and are characterized by the distinct possibility that the Company will sustain some loss if left unresolved. Although these loans are generally identified as potential problem loans and require additional attention by management, they may never become nonperforming. Nonperforming loans include nonaccrual loans risk rated 7 or 8 and have all the weaknesses inherent in a 7-rated potential problem loan with the added characteristic that the weaknesses make collection or liquidation in full, on the basis of currently-existing facts, conditions and values, highly questionable and improbable. Special mention, potential problem and nonperforming loans are reviewed at minimum on a quarterly basis, while all other rated credits over a certain dollar threshold, depending on product segment, are reviewed annually or as the situation warrants.
Credit Quality Indicators
(Dollars in thousands)
| | | | | | | | | | | | | | | | | | | | | | | | | | | | |
Product Segment | | Special
Mention | | | % of
Portfolio
Loan
Type | | | Potential
Problem
Loans | | | % of
Portfolio
Loan
Type | | | Non-
Performing
Loans | | | % of
Portfolio
Loan
Type | | | Total Loans | |
As of December 31, 2011 | | | | | | | | | | | | | | | | | | | | | | | | | | | | |
Commercial | | $ | 54,326 | | | | 1.0 | | | $ | 79,328 | | | | 1.5 | | | $ | 65,958 | | | | 1.2 | | | $ | 5,399,761 | |
Commercial real estate | | | 132,915 | | | | 5.1 | | | | 62,193 | | | | 2.4 | | | | 133,257 | | | | 5.1 | | | | 2,610,459 | |
Construction | | | 7,272 | | | | 2.5 | | | �� | 9,283 | | | | 3.2 | | | | 21,879 | | | | 7.6 | | | | 287,002 | |
Residential real estate | | | 9,344 | | | | 3.1 | | | | 17,931 | | | | 6.0 | | | | 14,589 | | | | 4.9 | | | | 297,229 | |
Home equity | | | 758 | | | | 0.4 | | | | 6,384 | | | | 3.5 | | | | 11,603 | | | | 6.4 | | | | 181,158 | |
Personal | | | 350 | | | | 0.2 | | | | 1,976 | | | | 0.8 | | | | 12,566 | | | | 5.4 | | | | 232,952 | |
| | | | | | | | | | | | | | | | | | | | | | | | | | | | |
Total | | $ | 204,965 | | | | 2.3 | | | $ | 177,095 | | | | 2.0 | | | $ | 259,852 | | | | 2.9 | | | $ | 9,008,561 | |
| | | | | | | | | | | | | | | | | | | | | | | | | | | | |
|
| |
As of December 31, 2010 | | | | | | | | | | | | | | | | | | | | | | | | | | | | |
Commercial | | $ | 111,930 | | | | 2.3 | | | $ | 173,829 | | | | 3.6 | | | $ | 70,241 | | | | 1.4 | | | $ | 4,865,168 | |
Commercial real estate | | | 203,072 | | | | 7.0 | | | | 260,042 | | | | 8.9 | | | | 214,629 | | | | 7.4 | | | | 2,905,878 | |
Construction | | | 67,915 | | | | 12.8 | | | | 45,119 | | | | 8.5 | | | | 33,403 | | | | 6.3 | | | | 530,733 | |
Residential real estate | | | 9,962 | | | | 3.1 | | | | 15,101 | | | | 4.7 | | | | 14,841 | | | | 4.7 | | | | 319,146 | |
Home equity | | | 3,757 | | | | 1.9 | | | | 11,272 | | | | 5.7 | | | | 8,195 | | | | 4.2 | | | | 197,179 | |
Personal | | | 2,198 | | | | 0.7 | | | | 2,227 | | | | 0.8 | | | | 24,571 | | | | 8.3 | | | | 296,253 | |
| | | | | | | | | | | | | | | | | | | | | | | | | | | | |
Total | | $ | 398,834 | | | | 4.4 | | | $ | 507,590 | | | | 5.6 | | | $ | 365,880 | | | | 4.0 | | | $ | 9,114,357 | |
| | | | | | | | | | | | | | | | | | | | | | | | | | | | |
101
Troubled Debt Restructured Loans
Troubled Debt Restructured Loans Outstanding
(Amounts in thousands)
| | | | | | | | |
| | | December 31, | |
| | | 2011 | | | 2010 | |
Accruing interest: | | | | | | | | |
Commercial | | $ | 47,768 | | | $ | 8,017 | |
Commercial real estate | | | 36,149 | | | | 60,019 | |
Construction | | | - | | | | 4,348 | |
Residential real estate | | | 3,238 | | | | 798 | |
Personal | | | 13,754 | | | | 14,394 | |
| | | | | | | | |
Total accruing | | $ | 100,909 | | | $ | 87,576 | |
| | | | | | | | |
| | |
Nonaccrual: | | | | | | | | |
Commercial | | $ | 28,409 | | | $ | 1,247 | |
Commercial real estate | | | 32,722 | | | | 45,028 | |
Construction | | | 960 | | | | - | |
Residential real estate | | | 3,592 | | | | 1,350 | |
Home equity | | | 2,082 | | | | 16,427 | |
Personal | | | 7,639 | | | | 1,229 | |
| | | | | | | | |
Total nonaccrual | | $ | 75,404 | | | $ | 65,281 | |
| | | | | | | | |
At December 31, 2011 and 2010, commitments to lend additional funds to debtors whose loan terms have been modified in a TDR (both accruing and nonaccruing) totaled $16.1 million and $3.7 million, respectively.
102
Additions to Troubled Debt Restructurings During the Period
(Amounts in thousands)
| | | | | | | | | | | | |
| | | Year Ended December 31, 2011 | |
| | | Number of
Borrowers | | | Outstanding Recorded Investment (1) | |
| | | | Pre-Modification | | | Post-Modification | |
Accruing interest: | | | | | | | | | | | | |
Commercial | | | | | | | | | | | | |
Extension of maturity date(2) | | | 15 | | | $ | 45,280 | | | $ | 45,177 | |
Other concession(3) | | | 6 | | | | 25,488 | | | | 26,201 | |
Multiple note structuring | | | 1 | | | | 8,837 | | | | 5,265 | |
| | | | | | | | | | | | |
Total commercial | | | 22 | | | | 79,605 | | | | 76,643 | |
Commercial real estate | | | | | | | | | | | | |
Extension of maturity date(2) | | | 13 | | | | 7,590 | | | | 7,590 | |
Multiple note structuring | | | 2 | | | | 9,990 | | | | 5,344 | |
| | | | | | | | | | | | |
Total commercial real estate | | | 15 | | | | 17,580 | | | | 12,934 | |
Residential real estate | | | | | | | | | | | | |
Extension of maturity date(2) | | | 2 | | | | 374 | | | | 374 | |
Home equity | | | | | | | | | | | | |
Extension of maturity date(2) | | | 2 | | | | 203 | | | | 203 | |
Personal | | | | | | | | | | | | |
Extension of maturity date(2) | | | 1 | | | | 265 | | | | 265 | |
Other concession(3) | | | 1 | | | | 252 | | | | 252 | |
| | | | | | | | | | | | |
Total personal | | | 2 | | | | 517 | | | | 517 | |
| | | | | | | | | | | | |
Total accruing | | | 43 | | | $ | 98,279 | | | $ | 90,671 | |
| | | | | | | | | | | | |
Change in recorded investment due to principal paydown at time of modification | | | | | | | | | | $ | 503 | |
Change in recorded investment due to charge-offs as part of the multiple note structuring | | | | | | | | | | $ | 7,497 | |
| (1) | Represents amounts as of the date immediately prior to and immediately after the modification is effective. |
| (2) | Extension of maturity date also includes loans renewed at existing rate of interest which is considered a below market rate for that particular loan’s risk profile. |
| (3) | Other concessions primarily include interest rate reductions, loan increases, and deferral of principal. |
103
Additions to Troubled Debt Restructurings During the Period (Continued)
(Amounts in thousands)
| | | | | | | | | | | | |
| | | Year Ended December 31, 2011 | |
| | | Number of
Borrowers | | | Outstanding Recorded Investment (1) | |
| | | | Pre-Modification | | | Post-Modification | |
Nonaccrual: | | | | | | | | | | | | |
Commercial | | | | | | | | | | | | |
Extension of maturity date(2) | | | 4 | | | $ | 20,320 | | | $ | 20,320 | |
Other concession(3) | | | 2 | | | | 128 | | | | 328 | |
| | | | | | | | | | | | |
Total commercial | | | 6 | | | | 20,448 | | | | 20,648 | |
Commercial real estate | | | | | | | | | | | | |
Extension of maturity date(2) | | | 7 | | | | 18,625 | | | | 17,136 | |
Other concession(3) | | | 2 | | | | 6,208 | | | | 6,208 | |
| | | | | | | | | | | | |
Total commercial real estate | | | 9 | | | | 24,833 | | | | 23,344 | |
Construction | | | | | | | | | | | | |
Extension of maturity date(2) | | | 1 | | | | 179 | | | | 179 | |
Residential real estate | | | | | | | | | | | | |
Extension of maturity date(2) | | | 3 | | | | 1,446 | | | | 1,446 | |
Other concession(3) | | | 1 | | | | 696 | | | | 696 | |
| | | | | | | | | | | | |
Total residential real estate | | | 4 | | | | 2,142 | | | | 2,142 | |
Home equity | | | | | | | | | | | | |
Extension of maturity date(2) | | | 2 | | | | 206 | | | | 206 | |
Other concession(3) | | | 1 | | | | 490 | | | | 490 | |
| | | | | | | | | | | | |
Total home equity | | | 3 | | | | 696 | | | | 696 | |
Personal | | | | | | | | | | | | |
Extension of maturity date(2) | | | 4 | | | | 695 | | | | 681 | |
| | | | | | | | | | | | |
Total nonaccrual | | | 27 | | | $ | 48,933 | | | $ | 47,690 | |
| | | | | | | | | | | | |
Change in recorded investment due to principal paydown at time of modification | | | | | | | | | | $ | 1,503 | |
| | (1) | Represents amounts as of the date immediately prior to and immediately after the modification is effective. |
| | (2) | Extension of maturity date also includes loans renewed at existing rate of interest which is considered a below market rate for that particular loan’s risk profile. |
| | (3) | Other concessions primarily include interest rate reductions, loan increases, and deferral of principal. |
At the time an accruing loan becomes modified as a TDR, it is considered impaired and no longer included as part of the general loan loss reserve determination. However, our general reserve methodology may consider the amount and/or characteristics of the TDRs removed as one of many credit or portfolio considerations in establishing final reserve requirements.
Modified loans which meet the definition of a TDR (both accruing and nonaccruing), including those that have payment defaults, are considered impaired and, accordingly, the loans are specifically evaluated for impairment at the end of each accounting period with a specific valuation reserve created, if necessary, as a component of the allowance for loan losses. Refer to the “Impaired Loan” and “Allowance for Loan Losses” sections of Note 1 regarding our policy for assessing potential impairment on such loans. At December 31, 2011, our allowance for loan losses included $25.7 million in specific reserves for nonaccrual TDRs. There were no specific reserves for accruing TDRs at December 31, 2011.
104
The following table presents the recorded investment and number of loans modified as a TDR during the previous 12 months which subsequently became nonperforming during the year ended December 31, 2011. A loan becomes nonperforming and placed on nonaccrual status typically when the principal or interest payments are 90 days past due based on contractual terms or when an individual analysis of a borrower’s creditworthiness indicates a loan should be placed on nonaccrual status earlier than when the loan becomes 90 days past due.
Troubled Debt Restructurings
That Became Nonperforming Within 12 Months of Restructuring
(Amounts in thousands)
| | | | | | | | |
| | | Year Ended December 31, 2011 | |
| | | Number of
Borrowers | | | Recorded
Investment (1) | |
Commercial | | | 8 | | | $ | 6,710 | |
Commercial real estate | | | 11 | | | | 9,095 | |
Construction | | | 2 | | | | 4,018 | |
Residential real estate | | | 1 | | | | 99 | |
Home equity | | | 2 | | | | 176 | |
Personal | | | 1 | | | | 250 | |
| | | | | | | | |
Total | | | 25 | | | $ | 20,348 | |
| | | | | | | | |
(1) Represents amounts as of the balance sheet date from the quarter the default was first reported. | |
| 5. | ALLOWANCE FOR LOAN LOSSES AND RESERVE FOR UNFUNDED COMMITMENTS |
Allowance for Loan Losses (excluding covered assets)(1)
(Amounts in thousands)
| | | | | | | | | | | | |
| | | Years ended December 31, | |
| | | 2011 | | | 2010 | | | 2009 | |
Allowance for Loan Losses: | | | | | | | | | | | | |
Balance at beginning of year | | $ | 222,821 | | | $ | 221,688 | | | $ | 112,672 | |
Loans charged-off | | | (171,027) | | | | (197,040) | | | | (101,260) | |
Recoveries on loans previously charged-off | | | 9,245 | | | | 6,149 | | | | 11,410 | |
| | | | | | | | | | | | |
Net charge-offs | | | (161,782) | | | | (190,891) | | | | (89,850) | |
Provision for loan losses | | | 130,555 | | | | 192,024 | | | | 198,866 | |
| | | | | | | | | | | | |
Balance at end of year | | $ | 191,594 | | | $ | 222,821 | | | $ | 221,688 | |
| | | | | | | | | | | | |
Ending balance, individually evaluated for impairment(2) | | $ | 69,944 | | | $ | 70,971 | | | $ | 65,760 | |
Ending balance, collectively evaluated for impairment | | $ | 121,650 | | | $ | 151,850 | | | $ | 155,928 | |
| | | |
Recorded Investment in Loans: | | | | | | | | | | | | |
Ending balance, individually evaluated for impairment(2) | | $ | 360,761 | | | $ | 453,456 | | | $ | 395,447 | |
Ending balance, collectively evaluated for impairment | | | 8,647,800 | | | | 8,660,901 | | | | 8,651,178 | |
| | | | | | | | | | | | |
Total recorded investment in loans | | $ | 9,008,561 | | | $ | 9,114,357 | | | $ | 9,046,625 | |
| | | | | | | | | | | | |
(1) Referto Note 6 for a detailed discussion regarding covered assets. (2) Referto Note 1 and Note 4 for additional information regarding impaired loans. | | | | | |
105
Additional detail on the allowance for loan losses and recorded investment in loans, by product segment, for the year ended December 31, 2011 is presented in the following table.
Allowance for Loan Losses and Recorded Investment in Loans (excluding covered assets)(1)
(Amounts in thousands)
| | | | | | | | | | | | | | | | | | | | | | | | | | | | |
| | | For the Year Ended December 31, 2011 | |
| | | Commercial | | | Commercial
Real
Estate | | | Construction | | | Residential
Real
Estate | | | Home
Equity | | | Personal | | | Total | |
Allowance for Loan Losses: | | | | | | | | | | | | | | | | | | | | | | | | | | | | |
Balance at beginning of year | | $ | 70,115 | | | $ | 110,853 | | | $ | 19,778 | | | $ | 5,321 | | | $ | 5,764 | | | $ | 10,990 | | | $ | 222,821 | |
Loans charged-off | | | (32,742) | | | | (108,814) | | | | (11,282) | | | | (2,009) | | | | (6,586) | | | | (9,594) | | | | (171,027) | |
Recoveries on loans previously charged-off | | | 4,280 | | | | 3,162 | | | | 291 | | | | 61 | | | | 337 | | | | 1,114 | | | | 9,245 | |
| | | | | | | | | | | | | | | | | | | | | | | | | | | | |
Net charge-offs | | | (28,462) | | | | (105,652) | | | | (10,991) | | | | (1,948) | | | | (6,249) | | | | (8,480) | | | | (161,782) | |
Provision for loan losses | | | 19,010 | | | | 89,704 | | | | 4,065 | | | | 3,003 | | | | 4,507 | | | | 10,266 | | | | 130,555 | |
| | | | | | | | | | | | | | | | | | | | | | | | | | | | |
Balance at end of year | | $ | 60,663 | | | $ | 94,905 | | | $ | 12,852 | | | $ | 6,376 | | | $ | 4,022 | | | $ | 12,776 | | | $ | 191,594 | |
| | | | | | | | | | | | | | | | | | | | | | | | | | | | |
Ending balance, individually evaluated for impairment(2) | | $ | 14,163 | | | $ | 38,905 | | | $ | 5,202 | | | $ | 976 | | | $ | 1,272 | | | $ | 9,426 | | | $ | 69,944 | |
Ending balance, collectively evaluated for impairment | | $ | 46,500 | | | $ | 56,000 | | | $ | 7,650 | | | $ | 5,400 | | | $ | 2,750 | | | $ | 3,350 | | | $ | 121,650 | |
| | | | | | | |
Recorded Investment in Loans: | | | | | | | | | | | | | | | | | | | | | | | | | | | | |
Ending balance, individually evaluated for impairment(2) | | $ | 113,726 | | | $ | 169,406 | | | $ | 21,879 | | | $ | 17,827 | | | $ | 11,603 | | | $ | 26,320 | | | $ | 360,761 | |
Ending balance, collectively evaluated for impairment | | | 5,286,035 | | | | 2,441,053 | | | | 265,123 | | | | 279,402 | | | | 169,555 | | | | 206,632 | | | | 8,647,800 | |
| | | | | | | | | | | | | | | | | | | | | | | | | | | | |
Total recorded investment in loans | | $ | 5,399,761 | | | $
| 2,610,459
|
| | $ | 287,002 | | | $ | 297,229 | | | $ | 181,158 | | | $ | 232,952 | | | $ | 9,008,561 | |
| | | | | | | | | | | | | | | | | | | | | | | | | | | | |
(1) Refer to Note 6 for a detailed discussion regarding covered assets.
(2) Refer to Note 4 for additional information regarding impaired loans.
Reserve for Unfunded Commitments(1)
(Amounts in thousands)
| | | | | | | | | | | | |
| | | Years Ended December 31, | |
| | | 2011 | | | 2010 | | | 2009 | |
Balance at beginning of year | | $ | 8,119 | | | $ | 1,452 | | | $ | 840 | |
(Release) provision for unfunded commitments | | | (842) | | | | 6,667 | | | | 612 | |
| | | | | | | | | | | | |
Balance at end of year | | $ | 7,277 | | | $ | 8,119 | | | $ | 1,452 | |
| | | | | | | | | | | | |
| | | |
Unfunded commitments, excluding covered assets, at year end | | $ | 4,448,177 | | | $ | 4,128,221 | | | $ | 3,959,846 | |
|
| (1) Unfunded commitments include commitments to extend credit, standby letters of credit and commercial letters of credit | |
Refer to Note 19 for additional details of commitments to extend credit, standby letters of credit and commercial letters of credit.
106
In 2009, the Bank acquired certain assets and assumed substantially all of the deposits of the former Founders Bank from the FDIC. Assets totaling approximately $843 million were purchased at a discount of $54 million. The Bank and the FDIC entered into a loss sharing agreement regarding future losses incurred on loans and foreclosed loan collateral existing at the date of acquisition. Under the terms of the loss-sharing agreement, the FDIC generally will assume 80% of the first $173 million of credit losses and 95% of the credit losses in excess of $173 million.
As a result of the loss sharing agreement discussed above, the acquired loans, foreclosed loan collateral and indemnification receivable (representing the present value of the expected reimbursement from the FDIC related to expected losses on the acquired loans and foreclosed real estate under such agreement) are presented in our Consolidated Statements of Financial Condition as “covered assets.” The carrying amount of covered assets is presented in the following table.
Covered Assets
(Amounts in thousands)
| | | | | | | | | | | | | | | | | | | | | | | | | | | | | | | | |
| | | December 31, 2011 | | | December 31, 2010 | |
| | | Purchased
Impaired
Loans | | | Purchased
Nonimpaired
Loans | | | Other
Assets | | | Total | | | Purchased
Impaired
Loans | | | Purchased
Nonimpaired
Loans | | | Other
Assets | | | Total | |
| | | | | | | | | | | | | | | | | | | | | | | | |
Commercial loans | | $ | 10,489 | | | $ | 21,079 | | | $ | - | | | $ | 31,568 | | | $ | 12,824 | | | $ | 31,988 | | | $ | - | | | $ | 44,812 | |
Commercial real estate loans | | | 38,433 | | | | 111,777 | | | | - | | | | 150,210 | | | | 57,979 | | | | 131,215 | | | | - | | | | 189,194 | |
Residential mortgage loans | | | 292 | | | | 50,111 | | | | - | | | | 50,403 | | | | 258 | | | | 56,490 | | | | - | | | | 56,748 | |
Consumer installment and other | | | 281 | | | | 5,518 | | | | 324 | | | | 6,123 | | | | 197 | | | | 8,624 | | | | 308 | | | | 9,129 | |
Foreclosed real estate | | | - | | | | - | | | | 30,342 | | | | 30,342 | | | | - | | | | - | | | | 32,155 | | | | 32,155 | |
Asset in lieu | | | - | | | | - | | | | - | | | | - | | | | - | | | | - | | | | 469 | | | | 469 | |
Estimated loss reimbursement by the FDIC | | | - | | | | - | | | | 38,161 | | | | 38,161 | | | | - | | | | - | | | | 64,703 | | | | 64,703 | |
| | | | | | | | | | | | | | | | | | | | | | | | | | | | | | | | |
Total covered assets | | | 49,495 | | | | 188,485 | | | | 68,827 | | | | 306,807 | | | | 71,258 | | | | 228,317 | | | | 97,635 | | | | 397,210 | |
Allowance for covered loan losses | | | (14,727) | | | | (11,212) | | | | - | | | | (25,939) | | | | (8,601) | | | | (6,733) | | | | - | | | | (15,334) | |
| | | | | | | | | | | | | | | | | | | | | | | | | | | | | | | | |
Net covered assets | | $ | 34,768 | | | $ | 177,273 | | | $ | 68,827 | | | $ | 280,868 | | | $ | 62,657 | | | $ | 221,584 | | | $ | 97,635 | | | $ | 381,876 | |
| | | | | | | | | | | | | | | | | | | | | | | | | | | | | | | | |
| | | | | |
Nonperforming covered loans(1) | | | $ | 19,894 | | | | | | | | | | | | | | | $ | 16,357 | |
| | (1) | Excludes purchased impaired loans which are accounted for on a pool basis based on common risk characteristics as a single asset with a single composite interest rate and an aggregate expectation of cash flows. Because we are recognizing interest income on each pool of loans, all purchased impaired loans are considered to be performing. |
At date of purchase, all purchased loans and the related indemnification asset were recorded at fair value.
On an ongoing basis, the accounting for purchased loans and the related indemnification asset follows applicable authoritative accounting guidance for purchased nonimpaired loans and purchased impaired loans. The amounts that we realize on these loans and the related indemnification asset could differ materially from the carrying value reflected in these financial statements, based upon the timing and amount of collections on the acquired loans in future periods. Our losses on these assets may be mitigated to the extent covered under the specific terms and provisions of any loss share agreements.
The allowance for covered loan losses is determined in a manner consistent with our policy for the originated loan portfolio. The following table presents changes in the allowance for covered loan losses for the periods presented.
107
Allowance for Covered Loan Losses
(Amounts in thousands)
| | | | | | | | | | | | | | | | | | | | | | | | | | | | | | | | | | | | |
| | | Years Ended December 31, | |
| | | 2011 | | | 2010 | | | 2009 | |
| | | | | | | | | |
| | | Purchased
Impaired
Loans | | | Purchased
Nonimpaired
Loans | | | Total | | | Purchased
Impaired
Loans | | | Purchased
Nonimpaired
Loans | | | Total | | | Purchased
Impaired
Loans | | | Purchased
Nonimpaired
Loans | | | Total | |
Balance at beginning of year | | $ | 8,601 | | | $ | 6,733 | | | $ | 15,334 | | | $ | 755 | | | $ | 2,009 | | | $ | 2,764 | | | $ | - | | | $ | - | | | $ | - | |
Loans charged-off | | | (264) | | | | (70) | | | | (334) | | | | (20) | | | | (6) | | | | (26) | | | | - | | | | - | | | | - | |
Recoveries on loans previously charged-off | | | 454 | | | | 86 | | | | 540 | | | | 14 | | | | 2 | | | | 16 | | | | - | | | | - | | | | - | |
| | | | | | | | | | | | | | | | | | | | | | | | | | | | | | | | | | | | |
Net recoveries (charge-offs) | | | 190 | | | | 16 | | | | 206 | | | | (6) | | | | (4) | | | | (10) | | | | - | | | | - | | | | - | |
Provision for covered loan losses(1) | | | 5,936 | | | | 4,463 | | | | 10,399 | | | | 7,852 | | | | 4,728 | | | | 12,580 | | | | 755 | | | | 2,009 | | | | 2,764 | |
| | | | | | | | | | | | | | | | | | | | | | | | | | | | | | | | | | | | |
Balance at end of year | | $ | 14,727 | | | $ | 11,212 | | | $ | 25,939 | | | $ | 8,601 | | | $ | 6,733 | | | $ | 15,334 | | | $ | 755 | | | $ | 2,009 | | | $ | 2,764 | |
| | | | | | | | | | | | | | | | | | | | | | | | | | | | | | | | | | | | |
| | (1) | Includes a provision for credit losses of $2.3 million, $2.5 million, and $553,000 recorded in the Consolidated Statements of Income for the years ended December 31, 2011, 2010, and 2009, respectively, representing the Company’s 20% non-reimbursable portion under the loss share agreement. |
Disposals (including sales) of loans or foreclosed property result in removal of the asset from the covered asset portfolio at its carrying amount.
Changes in the carrying amount and accretable yield for purchased impaired loans that evidenced deterioration at the acquisition date are set forth in the following table.
Changes in Purchased Impaired Loans Accretable Yield and Carrying Amount
(Amounts in thousands)
| | | | | | | | | | | | | | | | |
| | | Years Ended December 31, | |
| | | 2011 | | | 2010 | |
| | | Accretable
Yield | | | Carrying
Amount
of Loans | | | Accretable
Yield | | | Carrying
Amount of
Loans | |
Balance at beginning of year | | $ | 13,253 | | | $ | 71,258 | | | $ | 34,790 | | | $ | 94,140 | |
Payments received | | | - | | | | (11,558) | | | | - | | | | (7,596) | |
Charge-offs/disposals(1) | | | (14,659) | | | | (14,659) | | | | (24,520) | | | | (24,449) | |
Reclassifications from nonaccretable difference, net | | | 11,455 | | | | - | | | | 12,146 | | | | - | |
Accretion | | | (4,454) | | | | 4,454 | | | | (9,163) | | | | 9,163 | |
| | | | | | | | | | | | | | | | |
Balance at end of year | | $ | 5,595 | | | $ | 49,495 | | | $ | 13,253 | | | $ | 71,258 | |
| | | | | | | | | | | | | | | | |
Contractual amount outstanding at end of year | | | | | | $ | 75,159 | | | | | | | $ | 114,336 | |
| | (1) | Includes transfers to covered foreclosed real estate. |
108
| 7. | PREMISES, FURNITURE, AND EQUIPMENT |
Premises, Furniture, and Equipment
(Amounts in thousands)
| | | | | | | | |
| | | December 31, | |
| | | 2011 | | | 2010 | |
Land | | $ | 1,226 | | | $ | 1,227 | |
Building | | | 7,133 | | | | 6,856 | |
Leasehold improvements | | | 32,343 | | | | 30,289 | |
Furniture and equipment | | | 48,384 | | | | 44,632 | |
| | | | | | | | |
Total cost | | | 89,086 | | | | 83,004 | |
Accumulated depreciation | | | (50,453) | | | | (42,029) | |
| | | | | | | | |
Net book value | | $ | 38,633 | | | $ | 40,975 | |
| | | | | | | | |
Depreciation expense on premises, furniture, and equipment totaled $8.8 million in 2011, $7.9 million in 2010, and $6.4 million in 2009.
At December 31, 2011, we were obligated under certain non-cancellable operating leases for premises and equipment, which expire at various dates through the year 2023. Many of these leases contain renewal options, and certain leases provide options to purchase the leased property during or at the expiration of the lease period at specific prices. Some leases contain escalation clauses calling for rentals to be adjusted for increased real estate taxes and other operating expenses, or proportionately adjusted for increases in the consumer or other price indices. The following summary reflects the future minimum rental payments, by year, required under operating leases that, as of December 31, 2011, have initial or remaining non-cancellable lease terms in excess of one year.
Operating Leases
(Amounts in thousands)
| | | | |
| | | Total | |
Year ending December 31, | | | | |
2012 | | $ | 10,903 | |
2013 | | | 10,855 | |
2014 | | | 10,735 | |
2015 | | | 10,809 | |
2016 | | | 9,341 | |
2017 and thereafter | | | 52,508 | |
| | | | |
Total minimum lease payments | | $ | 105,151 | |
| | | | |
| | | | | | | | | | | | |
| | | Years Ended December 31, | |
| | | 2011 | | | 2010 | | | 2009 | |
Rental expense charged to operations(1) | | $ | 11,780 | | | $ | 12,293 | | | $ | 11,493 | |
Rental income from premises leased to others | | $ | 676 | | | $ | 781 | | | $ | 432 | |
(1) Includingamounts paid under short-term cancellable leases. | | | | | | | | | | | | |
109
| 8. | GOODWILL AND OTHER INTANGIBLE ASSETS |
Changes in the Carrying Amount of Goodwill by Operating Segment
(Amounts in thousands)
| | | | | | | | | | | | | | | | |
| | | Banking | | | Trust and
Investments | | | Holding
Company
Activities | | | Consolidated | |
Balance as of December 31, 2009 | | $ | 81,755 | | | $ | 12,916 | | | $ | - | | | $ | 94,671 | |
Tax benefit adjustment | | | - | | | | (50) | | | | - | | | | (50) | |
| | | | | | | | | | | | | | | | |
Balance as of December 31, 2010 | | | 81,755 | | | | 12,866 | | | | - | | | | 94,621 | |
Tax benefit adjustment | | | - | | | | (50) | | | | - | | | | (50) | |
| | | | | | | | | | | | | | | | |
Balance as of December 31, 2011 | | $ | 81,755 | | | $ | 12,816 | | | $ | - | | | $ | 94,571 | |
| | | | | | | | | | | | | | | | |
Goodwill is not amortized but, instead, is subject to impairment tests at least on an annual basis or more often if events or circumstances occur that would indicate it is more likely than not that the fair value of a reporting unit is less than its carrying value. In our annual goodwill impairment test performed as of October 31, 2011, the Company determined that the Trust and Investments reporting unit “passed” (the fair value exceeded the carrying amount) step one of the goodwill impairment test, while the Banking reporting unit failed step one of the impairment test. As a result of the step one procedures performed, the Banking reporting unit’s adjusted net book value exceeded its fair value by approximately $45.9 million. However, the Company determined that no goodwill impairment charge was necessary based on the implied fair value adjustments of the Banking reporting unit’s assets and liabilities determined in the step two valuation procedures. As a result of the step two procedures performed, the implied fair value of the Banking reporting unit’s goodwill exceeded its carrying amount by approximately $90.4 million.
There were no impairment charges for goodwill recorded in 2011, 2010, or 2009. The Company is not aware of any events or circumstances that would result in goodwill impairment as of December 31, 2011.
The reduction in goodwill is due to an adjustment for tax benefits associated with the goodwill attributable to Lodestar Investment Counsel, LLC (“Lodestar”), an investment management firm and wholly-owned subsidiary of the Company.
We have other intangible assets capitalized on the Consolidated Statements of Financial Condition in the form of core deposit premiums, client relationships and an assembled workforce. These intangible assets are being amortized over their estimated useful lives, which range from 3 years to 15 years. We review intangible assets for possible impairment whenever events or changes in circumstances indicate that carrying amounts may not be recoverable. During 2011, there were no events or circumstances to indicate there may be impairment of intangible assets, and no impairment charges for other intangible assets were recorded in 2011, 2010, or 2009.
Other Intangible Assets
(Amounts in thousands)
| | | | | | | | | | | | | | | | | | | | | | | | |
| | | Gross Carrying Amount | | | Accumulated Amortization | | | Net Carrying Amount | |
| | | | | | |
| | | 2011 | | | 2010 | | | 2011 | | | 2010 | | | 2011 | | | 2010 | |
Core deposit intangible | | $ | 18,093 | | | $ | 18,093 | | | $ | 5,079 | | | $ | 4,098 | | | $ | 13,014 | | | $ | 13,995 | |
Client relationships | | | 4,900 | | | | 4,900 | | | | 2,561 | | | | 2,168 | | | | 2,339 | | | | 2,732 | |
Assembled workforce | | | 736 | | | | 736 | | | | 736 | | | | 623 | | | | - | | | | 113 | |
| | | | | | | | | | | | | | | | | | | | | | | | |
Total | | $ | 23,729 | | | $ | 23,729 | | | $ | 8,376 | | | $ | 6,889 | | | $ | 15,353 | | | $ | 16,840 | |
| | | | | | | | | | | | | | | | | | | | | | | | |
110
Additional Information - Other Intangible Assets
(Dollars in thousands)
| | | | | | | | | | | | |
| | | Years Ended December 31, | |
| | | |
| | | 2011 | | | 2010 | | | 2009 | |
Additions to other intangible assets: | | | | | | | | | | | | |
Core deposit intangible(1) | | $ | - | | | $ | - | | | $ | 12,378 | |
Client relationships(1) | | $ | - | | | $ | - | | | $ | 1,300 | |
Weighted average remaining life at year end (in years): | | | | | | | | | | | | |
Core deposit intangible | | | 5 | | | | 6 | | | | 7 | |
Client relationships | | | 8 | | | | 8 | | | | 9 | |
Assembled workforce | | | - | | | | 1 | | | | 2 | |
Amortization expense | | $ | 1,487 | | | $ | 1,645 | | | $ | 1,737 | |
(1) The 2009 additions were in connection with the 2009 FDIC-assisted acquisition of Founders Bank. | |
Scheduled Amortization of Other Intangible Assets
(Amounts in thousands)
| | | | |
| | | Total | |
Year ending December 31, | | | | |
2012 | | $ | 2,673 | |
2013 | | | 3,101 | |
2014 | | | 3,190 | |
2015 | | | 2,639 | |
2016 | | | 2,345 | |
2017 and thereafter | | | 1,405 | |
| | | | |
Total | | $ | 15,353 | |
| | | | |
Summary of Deposits
(Amounts in thousands)
| | | | | | | | |
| | | December 31, | |
| | | 2011 | | | 2010 | |
Noninterest-bearing deposits | | $ | 3,244,307 | | | $ | 2,253,661 | |
Interest-bearing deposits | | | 595,238 | | | | 616,761 | |
Savings deposits | | | 210,138 | | | | 190,685 | |
Money market accounts | | | 4,168,082 | | | | 4,631,138 | |
Time deposits less than $100,000 | | | 308,041 | | | | 359,875 | |
Time deposits of $100,000 or more(1) | | | 1,867,048 | | | | 2,483,309 | |
| | | | | | | | |
Total deposits | | $ | 10,392,854 | | | $ | 10,535,429 | |
| | | | | | | | |
(1) Includes deposits which, to the knowledge of the Company, have been placed with the Bank by a person who acts as a broker in placing these deposits on behalf of others or are otherwise deemed to be “brokered” by bank regulatory rules and regulations such as the Company’s deposits under the CDARS® deposit program (“Brokered Deposits”). | |
111
Maturities of Time Deposits of $100,000 or More(1)
(Amounts in thousands)
| | | | |
| | | 2011 | |
Maturing within 3 months | | $ | 629,461 | |
After 3 but within 6 months | | | 338,674 | |
After 6 but within 12 months | | | 482,258 | |
After 12 months | | | 416,655 | |
| | | | |
Total | | $ | 1,867,048 | |
| | | | |
(1) Includes Brokered Deposits.
Summary of Short-Term Borrowings
(Dollars in thousands)
| | | | | | | | | | | | | | | | |
| | | December 31, 2011 | | | December 31, 2010 | |
| | | Amount | | | Rate | | | Amount | | | Rate | |
FHLB advances | | $ | 156,000 | | | | 0.33% | | | $ | 117,620 | | | | 2.40% | |
Other | | | - | | | | - | | | | 941 | | | | - | |
| | | | | | | | | | | | | | | | |
Total short-term borrowings | | $ | 156,000 | | | | | | | $ | 118,561 | | | | | |
| | | | | | | | | | | | | | | | |
| | | | |
Unused overnight federal funds availability(1) | | $ | 200,000 | | | | | | | $ | 95,000 | | | | | |
Borrowing capacity through the Federal Reserve Bank’s (“FRB”) discount window primary credit program(2) | | $ | 1,074,687 | | | | | | | $ | 536,836 | | | | | |
Unused FHLB advances availability | | $ | 261,490 | | | | | | | $ | n/a | | | | | |
Weighted average remaining maturity of FHLB advances at year end (in months) | | | 1.8 | | | | | | | | 3.9 | | | | | |
(1) Our total availability of overnight fed fund borrowings is not a committed line of credit and is dependent upon lender availability. (2) Includes federal term auction facilities. Our borrowing capacity changes each quarter subject to available collateral and FRB discount factors. n/a Not applicable | |
The amounts above include any unamortized premium or discount and fair value adjustments recognized in connection with debt acquired through acquisitions.
During 2011, we became a member of the FHLB Chicago, establishing access to additional FHLB borrowing capacity of $382.8 million at December 31, 2011, of which $261.5 million was available. Prior to becoming a member of the FHLB Chicago, we merged into The PrivateBank-Chicago former bank subsidiaries that were member banks of the FHLB system. Advances prior to the merger of the banks, which as of December 31, 2011 comprise short-term and long-term advances of $35.0 million and $15.0 million, respectively, remain outstanding until maturity.
FHLB advances reported as short-term borrowings represent advances with a remaining maturity of one year or less. Short-term FHLB advances are secured by qualifying residential and multi-family mortgages.
112
Long-Term Debt
(Dollars in thousands)
| | | | | | | | |
| | | December 31, | |
| | | 2011 | | | 2010 | |
Parent Company: | | | | | | | | |
3.21% junior subordinated debentures due 2034(1)(a) | | $ | 8,248 | | | $ | 8,248 | |
2.26% junior subordinated debentures due 2035(2)(a) | | | 51,547 | | | | 51,547 | |
2.05% junior subordinated debentures due 2035(3)(a) | | | 41,238 | | | | 41,238 | |
10.00% junior subordinated debentures due 2068(a) | | | 143,760 | | | | 143,760 | |
| | | | | | | | |
Subtotal | | | 244,793 | | | | 244,793 | |
Subsidiaries: | | | | | | | | |
FHLB advances | | | 15,000 | | | | 50,000 | |
4.08% subordinated debt facility due 2015(4)(b) | | | 120,000 | | | | 120,000 | |
| | | | | | | | |
Subtotal | | | 135,000 | | | | 170,000 | |
| | | | | | | | |
Total long-term debt | | $ | 379,793 | | | $ | 414,793 | |
| | | | | | | | |
| | |
Weighted average interest rate of FHLB long-term advances at year end | | | 4.42% | | | | 4.39% | |
Weighted average remaining maturity of FHLB long-term advances at year end (in months) | | | 49.2 | | | | 37.5 | |
| | (1) | Variable rate in effect at December 31, 2011, based on three-month LIBOR + 2.65%. |
| | (2) | Variable rate in effect at December 31, 2011, based on three-month LIBOR + 1.71%. |
| | (3) | Variable rate in effect at December 31, 2011, based on three-month LIBOR + 1.50%. |
| | (4) | Variable rate in effect at December 31, 2011, based on three-month LIBOR + 3.50%. |
| | (a) | Qualifies as Tier I capital for regulatory capital purposes; the capital qualification is grandfathered under the Dodd-Frank Wall Street Reform and Consumer Protection Act of 2010. |
| | (b) | Effective in the third quarter 2010, Tier II capital qualification was reduced by 20% of the total balance outstanding and annually thereafter will be reduced by an additional 20%. As of December 31, 2011 and 2010, respectively, 60% and 80% of the balance qualified as Tier II capital for regulatory capital purposes. |
We have $244.8 million in junior subordinated debentures issued to four separate wholly-owned trusts for the purpose of issuing Company-obligated mandatorily redeemable preferred securities. Refer to Note 12 for further information on the nature and terms of these and previously issued debentures.
FHLB long-term advances, which had a combination of fixed and floating interest rates, were secured by qualifying residential and multi-family mortgages, state and municipal bonds and mortgage-related securities.
We have $120.0 million outstanding under a 7-year subordinated debt facility due September 2015. The debt facility has a variable rate of interest based on LIBOR plus 3.50%, per annum, payable quarterly and re-prices quarterly. The debt may be prepaid at any time prior to maturity without penalty and is subordinate to any future senior indebtedness.
We reclassify long-term debt to short-term borrowings when the remaining maturity becomes less than one year.
Scheduled Maturities of Long-Term Debt
(Amounts in thousands)
| | | | |
| | | Total | |
Year ending December 31, | | | | |
2013 | | $ | 5,000 | |
2014 | | | 2,000 | |
2015 | | | 123,000 | |
2016 | | | - | |
2017 and thereafter | | | 249,793 | |
| | | | |
Total | | $ | 379,793 | |
| | | | |
113
| 12. | JUNIOR SUBORDINATED DEFERRABLE INTEREST DEBENTURES HELD BY TRUSTS THAT ISSUED GUARANTEED CAPITAL DEBT SECURITIES |
As of December 31, 2011, we sponsored, and wholly owned, 100% of the common equity of four trusts that were formed for the purpose of issuing Company-obligated mandatorily redeemable preferred securities (“Trust Preferred Securities”) to third-party investors and investing the proceeds from the sale of the Trust Preferred Securities solely in junior subordinated debt securities of the Company (“Debentures”). The Debentures held by the trusts, which totaled $244.8 million, are the sole assets of each trust. Our obligations under the Debentures and related documents, taken together, constitute a full and unconditional guarantee by the Company of the obligations of the trusts. The guarantee covers the distributions and payments on liquidation or redemption of the Trust Preferred Securities, but only to the extent of funds held by the trusts. We have the right to redeem the Debentures in whole or in part, on or after specific dates, at a redemption price specified in the indentures plus any accrued but unpaid interest to the redemption date. We may also have the right to redeem the Debentures at an earlier time, if future legislative or regulatory changes impact our capital treatment of the Trust Preferred Securities. We used the proceeds from the sales of the Debentures for general corporate purposes.
Under current accounting rules, the trusts qualify as variable interest entities for which we are not the primary beneficiary and therefore ineligible for consolidation. Accordingly, the trusts are not consolidated in our financial statements. The subordinated Debentures issued by us to the trusts are included in our Consolidated Statements of Financial Condition as “long-term debt” with the corresponding interest distributions recorded as interest expense. The common shares issued by the trusts are included in other assets in our Consolidated Statements of Financial Condition with the related dividend distributions recorded in other non-interest income.
Common Securities, Preferred Securities, and Related Debentures
(Amounts in thousands)
| | | | | | | | | | | | | | | | | | | | | | | | | | | | | | | | |
| | | | | | Principal Amount of
Debentures(3) | |
| | | Issuance
Date | | | Common
Securities
Issued | | | Trust
Preferred
Securities
Issued(1) | | | Coupon
Rate(2) | | | Earliest
Redemption
Date (on or
after)(3) | | | Maturity | | | December 31, | |
| | | | | | | | 2011 | | | 2010 | |
Bloomfield Hills Statutory Trust I | | | May 2004 | | | $ | 248 | | | $ | 8,000 | | | | 3.21% | | | | Jun. 17, 2009 | | | | Jun. 2034 | | | $ | 8,248 | | | $ | 8,248 | |
PrivateBancorp Statutory Trust II | | | Jun. 2005 | | | | 1,547 | | | | 50,000 | | | | 2.26% | | | | Sep. 15, 2010 | | | | Sep. 2035 | | | | 51,547 | | | | 51,547 | |
PrivateBancorp Statutory Trust III | | | Dec. 2005 | | | | 1,238 | | | | 40,000 | | | | 2.05% | | | | Dec. 15, 2010 | | | | Dec. 2035 | | | | 41,238 | | | | 41,238 | |
PrivateBancorp Statutory Trust IV | | | May 2008 | | | | 10 | | | | 143,750 | | | | 10.00% | | | | Jun. 13, 2013 | | | | Jun. 2068 | | | | 143,760 | | | | 143,760 | |
| | | | | | | | | | | | | | | | | | | | | | | | | | | | | | | | |
Total | | | | | | $ | 3,043 | | | $ | 241,750 | | | | | | | | | | | | | | | $ | 244,793 | | | $ | 244,793 | |
| | | | | | | | | | | | | | | | | | | | | | | | | | | | | | | | |
| | (1) | The trust preferred securities accrue distributions at a rate equal to the interest rate and maturity identical to that of the related Debentures. The trust preferred securities will be redeemed upon maturity of the related Debentures. |
| | (2) | Reflects the coupon rate in effect at December 31, 2011. The coupon rate for the Bloomfield Hills Statutory Trust I is a variable rate and is based on three-month LIBOR plus 2.65%. The coupon rates for the PrivateBancorp Statutory Trusts II and III are at a variable rate based on three-month LIBOR plus 1.71% for Trust II and three-month LIBOR plus 1.50% for Trust III. The coupon rate for the PrivateBancorp Statutory Trust IV is fixed. Distributions for all of the Trusts are payable quarterly. We have the right to defer payment of interest on the Debentures at any time or from time to time for a period not exceeding five years provided no extension period may extend beyond the stated maturity of the Debentures. During such extension period, distributions on the trust preferred securities would also be deferred, and our ability to pay dividends on our common stock would be restricted. The Federal Reserve has the ability to prevent interest payments on the Debentures. |
| | (3) | The trust preferred securities are subject to mandatory redemption, in whole or in part, upon repayment of the Debentures at maturity or their earlier redemption. Subject to restrictions relating to our participation in the TARP CPP, the Debentures are redeemable in whole or in part prior to maturity at any time after the dates shown in the table, and earlier at our discretion if certain conditions are met, and, in any event, only after we have obtained Federal Reserve approval, if then required under applicable guidelines or regulations. |
114
TARP Capital Purchase Program
In January 2009, we issued 243,815 shares of fixed rate cumulative perpetual preferred stock, Series B (“Series B Preferred Stock”) to the U.S. Treasury under the CPP of the Emergency Economic Stabilization Act of 2008 for proceeds of $243.8 million. Cumulative dividends on the Series B Preferred Stock are payable at 5% per annum for the first five years and at a rate of 9% per annum thereafter. We are prohibited from paying any dividend with respect to shares of our common stock unless all accrued and unpaid dividends are paid in full on the Series B Preferred Stock for all past dividend periods. The Series B Preferred Stock is non-voting, other than class voting rights on matters that could adversely affect the Series B Preferred Stock. The Series B Preferred Stock is callable at par after three years. Prior to the end of three years, the Series B Preferred Stock may be redeemed with the proceeds from one or more qualified equity offerings of any Tier 1 perpetual preferred or common stock of at least $61.0 million (each a “Qualified Equity Offering”). The redemption price is equal to the sum of the liquidation amount per share and any accrued and unpaid dividends on the Series B preferred Stock. The U.S. Treasury may also transfer the Series B Preferred Stock to a third party at any time. Notwithstanding the foregoing limitations, the American Recovery and Reinvestment Act of 2009 (“ARRA”) requires the U.S. Treasury, subject to consultation with appropriate banking regulators, to permit participants in the CPP to redeem preferred stock issued under the CPP without regard to whether the recipient has completed a Qualified Equity Offering or replaced such funds from any other source, or to any waiting period.
In conjunction with the purchase of the Company’s Series B Preferred Stock, the U.S. Treasury received a ten year warrant that entitles it to purchase up to 1,290,026 shares of the Company’s common stock at an exercise price of $28.35 per share. In December 2009, as a result of the completion of two qualified equity offerings, as provided by the terms of the warrant, the number of shares of common stock issuable upon exercise of the warrant was reduced by 50% from 1,290,026 to 645,013 shares. The ARRA provides that the U.S. Treasury may liquidate this warrant if we fully redeem the Series B Preferred Stock either as a result of redemption by us at a market price determined under the warrant or sale by the U.S. Treasury to a third party.
The Series B Preferred Stock and the warrant issued under the CPP are accounted for as permanent equity on the Consolidated Statements of Financial Condition. The allocated carrying values of the Series B Preferred Stock and the warrant on the date of issuance (based on their relative fair values) were $236.3 million and $7.6 million, respectively. The Series B Preferred Stock and the warrant qualify as Tier 1 regulatory capital.
Under the terms of our agreements with the U.S. Treasury in connection with our participation in the CPP, we are not prohibited from increasing quarterly common stock dividends at any time, but are precluded from raising the quarterly dividend above $0.075 per share prior to January 30, 2012. Furthermore, as a bank holding company, our ability to pay dividends is also subject to regulatory restrictions resulting from the recent losses we have incurred. We must provide notice to and obtain approval from the FRB before declaring or paying any dividends. Dividends also may be limited as a result of safety and soundness considerations. Our quarterly common stock dividend for each of the four quarters of 2011 was $0.01 per share.
Issuance of Common Stock
There were no public or private offerings of common stock during 2011 or 2010 other than that issued in connection with our share-based compensation plans. Refer to Note 16 for a detailed discussion of such plans.
115
The following table presents a summary of the Company’s common stock offerings during 2009.
Summary of Common Stock Offerings
(Dollars in thousands, except per share data)
| | | | | | | | | | | | | | | | |
| | | Common Stock
Public Offering | | | Non-voting
Common
Stock(1) | | | | |
| | May 2009 | | | November
2009 | | | November
2009 | | | Total | |
Number of shares issued | | | 11,600,000 | | | | 19,324,051 | | | | 1,330,720 | | | | 32,254,771 | |
Underwriters overallotment: | | | | | | | | | | | | | | | | |
Fully exercised | | | - | | | | 2,898,607 | | | | 254,159 | | | | 3,152,766 | |
Partially exercised (of 1.74 million shares) | | | 266,673 | | | | - | | | | - | | | | 266,673 | |
| | | | | | | | | | | | | | | | |
Total shares issued | | | 11,866,673 | | | | 22,222,658 | (2) | | | 1,584,879 | | | | 35,674,210 | |
| | | | | | | | | | | | | | | | |
| | | | |
Price | | $ | 19.25 | | | $ | 8.50 | | | $ | 8.075 | (3) | | | | |
Proceeds, net of underwriters commissions but before offering expenses | | $ | 217,012 | | | $ | 181,211 | | | $ | 12,798 | | | $ | 411,021 | |
| | (1) | Purchased by certain affiliates of GTCR Golder Raunder II, LLC (“GTCR”) through an exercise of its existing preemptive rights (based on the November aggregate public offering amount, less the amount being purchased by GTCR in the offering, including the exercise by the underwriters of their option to purchase additional shares). The non-voting common stock converts into common stock on a one-for-one basis. |
| | (2) | Includes 4.1 million shares, ($35.3 million) purchased by GTCR. |
| | (3) | Equals the public offering price less the underwriting discount per share. |
The net proceeds from the May and November 2009 public offerings, as well as from the sale of non-voting common stock, qualify as tangible common equity and Tier 1 capital.
Issuance of Series A Preferred Stock and Conversion Transactions
In June 2009, we amended our amended and restated certificate of incorporation to (1) create a new class of non-voting common stock (the “Non-voting Common Stock”), and (2) amend and restate the Certificate of Designations of the Company’s Series A Junior Non-voting Preferred Stock (the “Series A Preferred Stock”) to provide, among other things, that the shares of Series A Preferred Stock are convertible only into shares of Non-voting Common Stock. Under the amended terms of the Series A Preferred Stock, each share of Series A Preferred Stock was convertible into one share of Non-voting Common Stock, each share of which is, in turn, convertible into one share of common stock. We issued 1,951,037 shares of Non-voting Common Stock to GTCR upon notice of conversion by GTCR of all of its 1,951.037 shares of Series A Preferred Stock. The shares of Series A Preferred Stock held and converted by GTCR represented all of the issued and outstanding shares of Series A Preferred Stock on such date. We also entered into an amendment to our existing Preemptive and Registration Rights Agreement with GTCR pursuant to which we agreed, among other things, to register the shares of common stock issuable upon conversion of the newly issued shares of Non-voting Common Stock for resale under the Securities Act of 1933.
116
Comprehensive Income
Components of Accumulated Other Comprehensive Income
(Amounts in thousands)
| | | | | | | | | | | | | | | | | | | | |
| | | Years Ended December 31, | |
| | | 2011 | | | 2010 | | | 2009 | |
| | | Unrealized
Gain (Loss) on
Available-for-
Sale Securities | | | Accumulated
Gain (Loss)
on Effective
Cash Flow
Hedges | | | Total | | | Unrealized
Gain (Loss) on
Available-for-
Sale Securities | �� | | Unrealized
Gain (Loss) on
Available-for-
Sale Securities | |
Balance at beginning of year | | $ | 20,078 | | | $ | - | | | $ | 20,078 | | | $ | 27,896 | | | $ | 27,568 | |
Unrealized gains on securities | | | 47,431 | | | | - | | | | 47,431 | | | | 359 | | | | 8,439 | |
Unrealized gains on cash flow hedges | | | - | | | | 3,156 | | | | 3,156 | | | | - | | | | - | |
Tax expense on unrealized gains | | | (18,869) | | | | (1,256) | | | | (20,125) | | | | (108) | | | | (3,246) | |
Reclassification adjustment of net gains included in net income | | | (5,812) | | | | (570) | | | | (6,382) | | | | (13,095) | | | | (7,896) | |
Reclassification adjustments for tax expense on realized net gains | | | 2,312 | | | | 227 | | | | 2,539 | | | | 5,026 | | | | 3,031 | |
| | | | | | | | | | | | | | | | | | | | |
Balance at end of year | | $ | 45,140 | | | $ | 1,557 | | | $ | 46,697 | | | $ | 20,078 | | | $ | 27,896 | |
| | | | | | | | | | | | | | | | | | | | |
117
14. EARNINGS PER COMMON SHARE
Basic and Diluted Earnings per Common Share
(Amounts in thousands, except per share data)
| | | | | | | | | | | | |
| | | Years ended December 31, | |
| | | 2011 | | | 2010 | | | 2009 | |
Basic earnings per common share | | | | | | | | | | | | |
Net income (loss) attributable to controlling interests | | $ | 44,370 | | | $ | 1,517 | | | $ | (30,063) | |
Preferred dividends and discount accretion of preferred stock | | | 13,690 | | | | 13,607 | | | | 12,443 | |
| | | | | | | | | | | | |
Net income (loss) available to common stockholders | | | 30,680 | | | | (12,090) | | | | (42,506) | |
Less: Earnings allocated to participating stockholders(1) | | | 363 | | | | 62 | | | | - | |
| | | | | | | | | | | | |
Earnings allocated to common stockholders | | $ | 30,317 | | | $ | (12,152) | | | $ | (42,506) | |
| | | | | | | | | | | | |
| | | |
Weighted-average common shares outstanding | | | 70,449 | | | | 70,024 | | | | 44,516 | |
Basic earnings per common share | | $ | 0.43 | | | $ | (0.17) | | | $ | (0.95) | |
| | | |
Diluted earnings per common share | | | | | | | | | | | | |
Earnings allocated to common stockholders(2) | | $ | 30,315 | | | $ | (12,152) | | | $ | (42,506) | |
| | | |
Weighted-average common shares outstanding(3): | | | | | | | | | | | | |
Weighted-average common shares outstanding | | | 70,449 | | | | 70,024 | | | | 44,516 | |
Dilutive effect of stock awards | | | 193 | | | | - | | | | - | |
| | | | | | | | | | | | |
Weighted-average diluted common shares outstanding | | | 70,642 | | | | 70,024 | | | | 44,516 | |
| | | | | | | | | | | | |
Diluted earnings per common share | | $ | 0.43 | | | $ | (0.17) | | | $ | (0.95) | |
| | | |
Antidilutive shares not included in diluted earnings per common share computation(3)(4): | | | | | | | | | | | | |
Stock options | | | 3,525 | | | | 3,384 | | | | 5,253 | |
Unvested stock/unit awards | | | 195 | | | | 1,247 | | | | 1,656 | |
Warrant related to the U.S. Treasury Capital Purchase Program | | | 645 | | | | 645 | | | | 645 | |
| | | | | | | | | | | | |
Total antidilutive shares | | | 4,365 | | | | 5,276 | | | | 7,554 | |
| | | | | | | | | | | | |
| | (1) | Unvested share-based payment awards that contain nonforfeitable rights to dividends or dividend equivalents are considered participating securities (i.e., the Company’s deferred stock units and nonvested restricted stock awards and restricted stock units, excluding certain awards with forfeitable rights to dividends). |
| | (2) | Earnings allocated to common stockholders for basic and diluted earnings per share may differ under the two-class method as a result of adding common stock equivalents for options and warrants to dilutive shares outstanding, which alters the ratio used to allocate earnings to common stockholders and participating securities for the purposes of calculating diluted earnings per share. |
| | (3) | Due to the net loss available to common stockholders reported for the years ended December 31, 2010 and 2009, all potentially dilutive common stock equivalents were excluded from the diluted net loss per share computation as their inclusion would have been antidilutive. |
| | (4) | For the year ended December 31, 2011, represents potentially dilutive common stock securities for which the exercise price for the stock options and warrants and fair value of non-vested restricted stock/units was greater than the average market price of our common stock during the period. |
118
15. INCOME TAXES
Components of Income Taxes
(Amounts in thousands)
| | | | | | | | | | | | |
| | | Years Ended December 31, | |
| | | 2011 | | | 2010 | | | 2009 | |
Current tax provision: | | | | | | | | | | | | |
Federal | | $ | 19,529 | | | $ | 13,278 | | | $ | 39,476 | |
State | | | 4,406 | | | | 2,212 | | | | 4,770 | |
| | | | | | | | | | | | |
Total | | | 23,935 | | | | 15,490 | | | | 44,246 | |
| | | | | | | | | | | | |
Deferred tax provision (benefit): | | | | | | | | | | | | |
Federal | | | 4,437 | | | | (14,678) | | | | (57,816) | |
State | | | (2,712) | | | | (2,549) | | | | (6,994) | |
| | | | | | | | | | | | |
Total | | | 1,725 | | | | (17,227) | | | | (64,810) | |
| | | | | | | | | | | | |
Total income tax expense (benefit) | | $ | 25,660 | | | $ | (1,737) | | | $ | (20,564) | |
| | | | | | | | | | | | |
Tax expense amounts of $2.6 million, $3.6 million and $1.1 million in 2011, 2010 and 2009, respectively, are not included in the totals above and relate to the exercise and expiration of stock options and vesting of restricted stock. In accordance with applicable authoritative accounting guidance for share-based compensation, these amounts were recorded directly to shareholders’ equity.
Reconciliation of Income Tax Provision to Statutory Federal Rate
(Amounts in thousands)
| | | | | | | | | | | | |
| | | Years Ended December 31, | |
| | | 2011 | | | 2010 | | | 2009 | |
Income tax provision (benefit) at statutory federal income tax rate | | $ | 24,570 | | | $ | 22 | | | $ | (17,633) | |
Increase (decrease) in taxes resulting from: | | | | | | | | | | | | |
Tax exempt income | | | (1,925) | | | | (2,338) | | | | (2,354) | |
Meals, entertainment and related expenses | | | 547 | | | | 564 | | | | 511 | |
Bank owned life insurance | | | (545) | | | | (610) | | | | (605) | |
Investment credits | | | (320) | | | | (351) | | | | (270) | |
Non-deductible compensation | | | 1,987 | | | | 1,122 | | | | 1,140 | |
State income taxes | | | 3,480 | | | | (219) | | | | (1,799) | |
Tax audit settlements | | | - | | | | 518 | | | | - | |
Deferred tax asset adjustment – Illinois tax rate change | | | (2,833) | | | | - | | | | - | |
Other | | | 699 | | | | (445) | | | | 446 | |
| | | | | | | | | | | | |
Total income tax provision (benefit) | | $ | 25,660 | | | $ | (1,737) | | | $ | (20,564) | |
| | | | | | | | | | | | |
119
Differences between the amounts reported in the consolidated financial statements and the tax bases of assets and liabilities result in temporary differences for which deferred tax assets and liabilities have been recorded.
Deferred Tax Assets and Liabilities
(Amounts in thousands)
| | | | | | | | |
| | | December 31, | |
| | | 2011 | | | 2010 | |
Deferred tax assets: | | | | |
Allowance for loan losses | | $ | 89,399 | | | $ | 95,918 | |
Share-based payment expenses | | | 13,136 | | | | 13,125 | |
Deferred compensation | | | 9,693 | | | | 8,262 | |
State net operating loss carryforwards | | | 147 | | | | 255 | |
Loan fees | | | 19,161 | | | | 16,598 | |
OREO write-downs | | | 4,909 | | | | 3,519 | |
Nonaccrual interest income | | | 5,888 | | | | 6,102 | |
Covered assets – loans and OREO | | | 17,167 | | | | 26,556 | |
Other | | | 3,623 | | | | 4,770 | |
| | | | | | | | |
Total deferred tax assets | | | 163,123 | | | | 175,105 | |
| | |
Deferred tax liabilities: | | | | | | | | |
Unrealized gain on securities available-for-sale | | | (29,297) | | | | (12,281) | |
Intangible assets and acquisition adjustments | | | (6,730) | | | | (7,649) | |
Loan costs | | | (1,676) | | | | (1,292) | |
Premises and equipment | | | (2,543) | | | | (2,098) | |
Covered assets – FDIC loss share receivable | | | (15,175) | | | | (25,215) | |
Other | | | (1,381) | | | | (247) | |
| | | | | | | | |
Total deferred tax liabilities | | | (56,802) | | | | (48,782) | |
| | | | | | | | |
Net deferred tax assets | | $ | 106,321 | | | $ | 126,323 | |
| | | | | | | | |
At December 31, 2011, we had state net operating loss carryforwards of $3.7 million, which are available to offset future state taxable income and will begin to expire in 2028.
Deferred Tax Assets
During the first three quarterly periods of 2011, we were in a cumulative pre-tax loss position for financial statement purposes, measured on a trailing three-year basis. Under current accounting guidance, this represents significant negative evidence in the assessment of whether deferred tax assets will be realized. At December 31, 2011, we were no longer in a cumulative book loss position. We have concluded that based on the weight provided by certain positive evidence (discussed below), it is more likely than not that the deferred tax assets will be realized.
Taxable income in prior years and reversing deferred taxable income amounts provide sources from which deferred tax assets may be absorbed. Most significantly, however, we have relied on our ability to generate future federal taxable income, exclusive of reversing temporary differences, as the primary source from which deferred tax assets will be absorbed.
In making the determination at December 31, 2011 that it was more likely than not the deferred tax assets will be realized, we considered the positive evidence associated with (a) taxable income generated in 2010 and 2011; (b) reversing taxable temporary differences in future periods; (c) our emergence from a cumulative book loss position in 2011; (d) continued improvement in pre-tax, pre-loan loss provision earnings results during 2009-2011, a core source for future taxable income; (e) our reporting of pre-tax profits during most of 2010 and 2011; (f) the concentration of credit losses in certain segments and vintages of our loan portfolio during the past three years and the relative moderation of credit trends in recent quarters; (g) our excess capital position relative to “well capitalized” regulatory standards and other industry benchmarks; and (h) no history of federal net operating loss carryforwards and the availability of the 20-year federal net operating loss carryforward period.
We considered negative evidence associated with the continuing challenging economic conditions as well as both positive and negative evidence associated with: (a) our accuracy in forecasting operating income and credit costs; and (b) the estimated timing of
120
reversals of deferred deductible and deferred taxable items and the level of such net reversal amounts relative to earnings assumptions in future periods.
Certain of the factors noted above support our expectation of generating pre-tax book earnings in future periods. We believe this in turn should give rise to taxable income levels (exclusive of reversing temporary differences) that more likely than not would be sufficient to absorb the deferred tax assets.
Liabilities Associated with Unrecognized Tax Benefits
A reconciliation of the beginning and ending amount of unrecognized tax benefits is as follows:
Roll Forward of Unrecognized Tax Benefits
(Amounts in thousands)
| | | | | | | | | | | | |
| | | Years Ended December 31, | |
| | | 2011 | | | 2010 | | | 2009 | |
Balance at beginning of year | | $ | 783 | | | $ | 876 | | | $ | - | |
Additions for tax positions related to current year | | | - | | | | 86 | | | | - | |
Additions for tax positions related to prior years | | | 12 | | | | 848 | | | | 876 | |
Reductions for tax positions related to prior years | | | (42) | | | | - | | | | - | |
Reductions for lapse of statute of limitations | | | (254) | | | | (250) | | | | - | |
Reductions for settlements with tax authorities | | | - | | | | (777) | | | | - | |
| | | | | | | | | | | | |
Balance at end of year | | $ | 499 | | | $ | 783 | | | $ | 876 | |
| | | | | | | | | | | | |
| | | |
Interest and penalties, net of tax effect, recognized in income tax (benefit) expense during the year | | $ | (25) | | | $ | 23 | | | $ | 68 | |
Interest and penalties, net of tax effect, accrued at year end(1) | | $ | 57 | | | $ | 82 | | | $ | 68 | |
| | (1) | Not included in the unrecognized tax benefits roll forward presented above |
As of December 31, 2011 and 2010, there were $454,000 and $631,000, respectively, of unrecognized tax benefits relating to uncertain tax positions that would favorably impact the effective tax rate, if recognized in future periods. While it is expected that the amount of unrecognized tax benefits will change in the next twelve months, the Company does not anticipate this change will have a material impact on the results of operations or the financial position of the Company.
We file a U.S. federal income tax return and state income tax returns in various states. We are no longer subject to examinations by U.S. federal tax authorities for 2007 and prior years. We are also no longer subject to examinations by certain state departments of revenue for 2005 and prior years.
Illinois Tax Legislation
In January 2011, the state of Illinois passed legislation that increased the corporate income tax rate from 7.3% to 9.5% (which includes a personal property replacement tax of 2.5%). The change is effective for tax years 2011 through 2014 with the rate declining to 7.75% in 2015 and returning to the pre-2011 rate of 7.3% in 2025. As a result of this change, income tax expense for the year ended December 31, 2011 was reduced by $2.8 million for a one-time adjustment to the valuation of the Company’s deferred tax asset, offset in part by higher Illinois tax expense on 2011 earnings.
16. SHARE-BASED COMPENSATION AND OTHER BENEFITS
Share-Based Plans
2011 Incentive Compensation Plan (the “2011 Plan”)– In March 2011 the Board of Directors approved the 2011 Plan which was subsequently approved in May 2011 by the Company’s stockholders at the Company’s 2011 Annual Meeting of Stockholders. The 2011 Plan replaced the 2007 Long-Term Incentive Compensation Plan (the “2007 Plan”) and allows for the issuance of incentive and non-qualified stock options, stock appreciation rights, restricted stock and restricted stock units, equity-based performance stock and units, stock awards and other cash and stock-based incentives to employees, including officers and directors of the Company and its subsidiaries.
121
At December 31, 2011, the 2011 Plan remains the Company’s only share-based compensation plan which allows for the granting of additional awards. At December 31, 2011, 4.7 million shares are available for future grant of which no more than 2.7 million remain available for issuance as restricted stock or units. The number of shares that remain available for future grants also includes an indeterminate number of shares that may become available for re-issuance due to the recycling provisions under the 2011 Plan. To the extent shares of common stock subject to an outstanding award under the 2011 Plan or the 2007 Plan are not issued or are cancelled by reason of the failure to earn the shares issuable under, or the forfeiture, termination, surrender, cancellation or expiration of such award, then such shares shall, to the extent of the forfeiture, cancellation or expiration, again be available for grant under the 2011 Plan. Shares of common stock shall not again be available for issuance if those shares are surrendered or withheld as payment of either the exercise price of an award or used for the payment of withholding taxes in respect of an award.
The Company has four inactive plans for which no shares remain available for grant, but have unvested or unexercised awards outstanding at December 31, 2011.
Stock options that are issued to certain key employees vest generally over a period ranging from 3 to 5 years based on continuous service and have a 10-year term. All stock options granted under the plans have an exercise price equal to the closing price of our common stock on the date the awards are granted. Although both incentive stock options and non-qualified stock options have been issued in the past, we have not issued incentive stock options since 2005.
We may also issue common stock with restrictions to certain key employees and non-employee directors. The shares are restricted as to transfer, but are not restricted as to voting rights and generally receive similar dividend payments as stockholders, although in certain cases dividends are not distributed until vesting. Other than in the case of salary stock discussed below, the transfer restrictions generally lapse over a three-year period and are contingent upon continued employment and in certain cases on the satisfaction of specified performance criteria. We also issue restricted stock units which settle in common stock when restrictions lapse. These units are issued on similar terms as restricted common stock but these instruments have no voting rights and receive dividend equivalents rather than dividends.
Effective in 2010, the Company began paying a portion of the base salary of certain executives in shares of the Company’s common stock (“salary stock”) under the 2007 Plan and effective in June 2011, the 2011 Plan. The salary stock is fully vested as of the grant date and has all of the rights of a stockholder, including the right to vote and receive dividends. As a condition of receiving the salary stock, each executive has entered into an agreement with the Company providing that he/she may not sell or otherwise transfer the shares of salary stock for 24 months after issuance, except in the event of death or disability. The salary stock is paid in installments, semi-monthly on each payroll date with the number of shares issued based on the closing price of the Company’s common stock as of each payroll date. The related expense is included in salaries and employee benefits on the Consolidated Statements of Income.
Salary Stock Issued
(Amounts in thousands, except per share data)
| | | | | | | | |
| | | Years Ended December 31, | |
| | | 2011 | | | 2010 | |
Amount of salary granted as stock awards, net of payroll tax withholding | | $ | 606 | | | $ | 88 | |
Number of shares of salary stock issued | | | 54 | | | | 7 | |
Weighted-average issuance price | | $ | 11.26 | | | $ | 12.48 | |
We issue shares to fulfill stock options exercises, deferred stock unit allocations, restricted stock awards and unit vesting and salary stock awards from available authorized shares. At December 31, 2011, we believe there are adequate authorized shares to satisfy anticipated award issuances in 2012.
122
Financial Statement Impact
The Company recognizes share-based compensation expense based on the estimated fair value of the option or award at the date of grant or modification. Share-based compensation costs are recorded as a component of salaries and employee benefits on the Consolidated Statements of Income.
Effect of Recognizing Share-based Compensation Expense
(Amounts in thousands)
| | | | | | | | | | | | |
| | | Years ended December 31, | |
| | | 2011 | | | 2010 | | | 2009 | |
Recognized share-based compensation expense: | | | | | | | | | | | | |
Stock option expense | | $ | 6,717 | | | $ | 7,815 | | | $ | 10,215 | |
Restricted stock and unit expense (including salary stock) | | | 9,039 | | | | 9,287 | | | | 10,481 | |
| | | | | | | | | | | | |
Total share-based compensation expense | | | 15,756 | | | | 17,102 | | | | 20,696 | |
Income tax benefit | | | (5,289) | | | | (5,863) | | | | (6,969) | |
| | | | | | | | | | | | |
Share-based compensation expense, net of tax | | $ | 10,467 | | | $ | 11,239 | | | $ | 13,727 | |
| | | | | | | | | | | | |
| | | |
Unrecognized share-based compensation expense: | | | | | | | | | | | | |
Stock options | | | 8,022 | | | | 12,037 | | | | 20,767 | |
Weighted-average amortization period remaining (in years) | | | 1.4 | | | | 1.9 | | | | 2.8 | |
Restricted stock and unit expense | | | 11,745 | | | | 15,114 | | | | 16,070 | |
Weighted-average amortization period remaining (in years) | | | 1.5 | | | | 1.9 | | | | 2.6 | |
123
Stock Options
The following table summarizes our stock option activity for the years ended December 31, 2011, 2010 and 2009.
Stock Option Transactions
(Amounts in thousands, except per share data)
| | | | | | | | | | | | | | | | |
| | | Options | | | Weighted-Average | | | Aggregate
Intrinsic
Value(2) | |
| | | Exercise
Price | | | Remaining
Contractual
Life(1) | | |
2009 | | | | | | | | | | | | | | | | |
Outstanding at beginning of year | | | 5,625 | | | $ | 29.39 | | | | | | | | | |
Granted(3) | | | 281 | | | | 15.28 | | | | | | | | | |
Exercised | | | (127) | | | | 8.75 | | | | | | | | | |
Forfeited | | | (398) | | | | 30.59 | | | | | | | | | |
Expired | | | (130) | | | | 30.72 | | | | | | | | | |
| | | | | | | | | | | | | | | | |
Outstanding at end of year | | | 5,251 | | | $ | 29.01 | | | | 7.6 | | | $ | 312 | |
| | | | | | | | | | | | | | | | |
Exercisable at end of year | | | 1,714 | | | $ | 29.50 | | | | 6.7 | | | $ | 300 | |
| | | | |
2010 | | | | | | | | | | | | | | | | |
Outstanding at beginning of year | | | 5,251 | | | $ | 29.01 | | | | | | | | | |
Granted(3) | | | 79 | | | | 12.90 | | | | | | | | | |
Exercised | | | (42) | | | | 4.77 | | | | | | | | | |
Forfeited(4) | | | (1,580) | | | | 29.57 | | | | | | | | | |
Expired | | | (349) | | | | 29.83 | | | | | | | | | |
| | | | | | | | | | | | | | | | |
Outstanding at end of year | | | 3,359 | | | $ | 28.59 | | | | 6.8 | | | $ | 1,103 | |
| | | | | | | | | | | | | | | | |
Exercisable at end of year | | | 1,921 | | | $ | 29.12 | | | | 6.4 | | | $ | 758 | |
| | | | |
2011 | | | | | | | | | | | | | | | | |
Outstanding at beginning of year | | | 3,359 | | | $ | 28.59 | | | | | | | | | |
Granted(3) | | | 670 | | | | 14.80 | | | | | | | | | |
Exercised | | | (22) | | | | 5.56 | | | | | | | | | |
Forfeited | | | (192) | | | | 25.05 | | | | | | | | | |
Expired | | | (188) | | | | 32.94 | | | | | | | | | |
| | | | | | | | | | | | | | | | |
Outstanding at end of year | | | 3,627 | | | $ | 26.15 | | | | 6.1 | | | $ | 311 | |
| | | | | | | | | | | | | | | | |
Exercisable at end of year | | | 2,190 | | | $ | 28.58 | | | | 5.1 | | | $ | 236 | |
Ending vested and expected to vest | | | 3,529 | | | $ | 26.28 | | | | 6.1 | | | $ | 304 | |
| | (1) | Represents the average contractual life remaining in years. |
| | (2) | Aggregate intrinsic value represents the total pretax intrinsic value (i.e., the difference between our closing stock price on the last trading day of the respective year and the option exercise price, multiplied by the number of shares) that would have been received by the option holders if they had exercised their options on the last day of the respective year. This amount will fluctuate with changes in the fair value of our common stock. |
| | (3) | As a percentage of total stock options granted, 6% in 2011 and 15% in 2009 were granted to the Company’s named executive officers (“NEOs”), as will be reported in its 2012 Proxy Statement. No stock options were granted to the NEOs in 2010. |
| | (4) | Includes 1.4 million stock options surrendered in connection with the 2010 award modifications as more fully discussed in the “Share-Based Compensation Modification” section presented further in this Note. |
124
Summary of Stock Options Outstanding and Exercisable
(Number of shares in thousands)
| | | 000000000000 | | | | 000000000000 | | | | 000000000000 | | | | 000000000000 | | | | 000000000000 | |
| | | Outstanding Options | | | Exercisable Options | |
Range of Exercise Price | | Shares | | | Weighted-Average | | | Shares | | | Weighted-
Average
Exercise
Price | |
| | | Remaining
Contractual
Life(1) | | | Exercise
Price | | | |
$6.92 - $16.48 | | | 884 | | | | 8.2 | | | $ | 13.70 | | | | 221 | | | $ | 11.39 | |
$16.49 - $26.37 | | | 1,065 | | | | 5.4 | | | | 25.70 | | | | 715 | | | | 25.51 | |
$26.38 - $32.19 | | | 818 | | | | 5.2 | | | | 29.93 | | | | 591 | | | | 29.96 | |
$32.20 - $46.51 | | | 860 | | | | 5.5 | | | | 35.91 | | | | 663 | | | | 36.41 | |
| | | | | | | | | | | | | | | | | | | | |
Total | | | 3,627 | | | | 6.1 | | | $ | 26.15 | | | | 2,190 | | | $ | 28.58 | |
| | | | | | | | | | | | | | | | | | | | |
| | (1) | Represents the weighted average contractual life remaining in years. |
Stock Option Valuation Assumptions - In accordance with current accounting guidance, we estimate the fair value of stock options at the date of grant using a binomial option-pricing model that utilizes the assumptions outlined in the following table.
Stock Option Valuation Assumptions
| | | | | | | | | | | | |
| | | Years Ended December 31, | |
| | | 2011 | | | 2010 | | | 2009 | |
Expected life of the option (in years) | | | 4.5 – 5.5 | | | | 5.5 – 6.5 | | | | 5.0 - 6.6 | |
Expected stock volatility | | | 45.5 – 52.3% | | | | 47.5 - 49.3% | | | | 46.1 - 52.4% | |
Risk-free interest rate | | | 1.9 – 3.7% | | | | 2.5 – 4.2% | | | | 2.8 - 4.0% | |
Expected dividend yield | | | 0.3 – 0.6% | | | | 0.3 – 0.4% | | | | 0.1 - 2.1% | |
Weighted-average fair value of options at their grant date | | $ | 6.80 | | | $ | 6.29 | | | $ | 7.58 | |
Expected life is based on historical exercise and termination behavior. Expected stock price volatility is based on historical volatility of our common stock combined with the implied volatility on the exchange traded stock options that are derived from the value of our common stock. The risk-free interest rate is based on the implied yield currently available on U.S. Treasury zero-coupon issues with a remaining term equal to the expected life of the option. The expected dividend yield represents the most recent annual dividend yield as of the date of grant. Management reviews and adjusts the assumptions used to calculate the fair value of an option on a periodic basis to better reflect expected trends.
Other Stock Option Information
(Dollars in thousands)
| | | | | | | | | | | | |
| | | Years Ended December 31, | |
| | | 2011 | | | 2010 | | | 2009 | |
Total intrinsic value of stock options exercised | | $ | 164 | | | $ | 321 | | | $ | 1,576 | |
Cash received from stock options exercised | | $ | 126 | | | $ | 201 | | | $ | 1,073 | |
Income tax benefit realized from stock options exercised | | $ | 47 | | | $ | 76 | | | $ | 236 | |
125
Restricted Stock and Restricted Unit Awards
Restricted Stock and Unit Award Transactions
(Number of shares/units in thousands)
| | | | | | | | | | | | | | | | | | | | | | | | |
| | | Years Ended December 31, | |
| | | 2011 | | | 2010 | | | 2009 | |
Restricted Stock and Unit Awards(1) | | Number
of Shares/
Units | | | Weighted-
Average
Grant Date
Fair Value | | | Number of
Shares/Units | | | Weighted-
Average
Grant Date
Fair Value | | | Number
of Shares/
Units | | | Weighted-
Average
Grant Date
Fair Value | |
Nonvested restricted stock and unit awards at beginning of year | | | 1,086 | | | $ | 26.16 | | | | 1,543 | | | $ | 21.62 | | | | 1,693 | | | $ | 23.91 | |
Granted(2) (3) | | | 574 | | | | 14.36 | | | | 231 | | | | 13.80 | | | | 318 | | | | 15.08 | |
Vested | | | (463) | | | | 25.08 | | | | (513) | | | | 28.40 | | | | (254) | | | | 25.56 | |
Forfeited | | | (137) | | | | 25.40 | | | | (175) | | | | 32.19 | | | | (214) | | | | 30.07 | |
| | | | | | | | | | | | | | | | | | | | | | | | |
Nonvested restricted stock and unit awards at end of year | | | 1,060 | | | $ | 20.84 | | | | 1,086 | | | $ | 26.16 | | | | 1,543 | | | $ | 21.62 | |
| | | | | | | | | | | | | | | | | | | | | | | | |
Vested, but not issued at end of year | | | 79 | | | | 17.85 | | | | 88 | | | | 16.10 | | | | 59 | | | | 29.60 | |
| | (1) | Includes salary stock awards. |
| | (2) | As a percentage of total restricted stock and unit awards granted, 19% in 2011, 3% in 2010 and 30% in 2009 were granted to the Company’s NEOs, as will be reported in its 2012 Proxy Statement. Excluding the stock awards granted as salary stock as part of certain NEOs’ fixed compensation, 10%, 0% and 30% of the total restricted stock and unit awards were granted to the NEOs in 2011, 2010 and 2009, respectively. |
| | (3) | Does not include 937,182 awards modified in January 2010 of which 206,250 awards were granted to such NEOs. Refer to “Share-Based Compensation Award Modifications” in this footnote for further details. |
The fair value of restricted stock and units that vest based on service provided by the recipient is determined based on our closing stock price on the date of grant and is recognized as compensation expense over the vesting period.
Other Restricted Stock and Unit Award Information
(Dollars in thousands)
| | | | | | | | | | | | |
| | | Years Ended December 31, | |
| | | 2011 | | | 2010 | | | 2009 | |
Total fair value of vested/released restricted stock and units | | $ | 5,536 | | | $ | 6,757 | | | $ | 3,710 | |
Income tax benefit realized from vesting/release of restricted stock and unit awards | | $ | 1,700 | | | $ | 2,067 | | | $ | 1,421 | |
Upon the vesting/release of restricted stock and unit awards, the Company records an adjustment to its deferred tax benefit previously recorded in the Consolidated Statements of Income to reflect the actual tax benefit realized. The actual tax benefit realized is based on the fair value of the awards on the vesting/release date and the deferred tax benefit is based on the fair value of the awards on the grant or modification date. The actual tax benefit realized for shares vesting or settling during the years ended December 31, 2011, 2010 and 2009 was less than the deferred tax benefit for those shares, with the “shortfall” charged against prior years’ accumulated “excess” tax benefits maintained as a component of additional paid in capital in stockholders’ equity. The exercise or expiration of stock options can also give rise to “shortfall” tax benefits. The total of such shortfall charges to stockholders’ equity for the years ended December 31, 2011, 2010, and 2009 was $2.6 million, $3.6 million, and $1.1 million, respectively. In addition, during 2011, $645,000 of the “shortfall” adjustment was included in income tax expense in the Consolidated Statements of Income as the balance in stockholders’ equity of the prior years’ accumulated “excess” tax benefits was reduced to $0. The “shortfall” adjustments recorded over the past three years were primarily due to the decline in our stock price at the vest/release date compared to the stock price when the awards were granted.
126
Liability Awards
During 2011 we settled the share-based awards associated with the issuance of certain contractual “put” rights related to the minority interest owned by the principals of Lodestar. These awards were settled in cash and accordingly were accounted as liability awards under current accounting guidance. Unlike equity awards, liability awards are re-measured at fair value at each reporting date until settlement, with the change in value recognized in current period expense. The charge to expense was $197,000 and $399,000 for 2011 and 2010, respectively, and a contra expense of $100,000 in 2009. The awards were settled for $3.6 million. The Company has no other liability awards outstanding at December 31, 2011.
Share-Based Compensation Award Modifications
On December 29, 2011, the Compensation Committee of the Board of Directors approved changes to the vesting schedules of certain equity awards previously granted to two executives of the Company to ensure that the vesting of such awards would comply with restrictions on incentive compensation applicable to certain of the most highly compensated employees of companies that received funding under the U.S. Treasury’s TARP CPP. Among other requirements, the TARP rules generally prohibit the Company from paying or accruing incentive bonuses (except for TARP-compliant restricted stock) to its five most highly compensated employees as calculated for purposes of the TARP rules (“MHCEs”). While neither of these two executives were considered an MCHE when the equity awards were granted in early 2011, the reported changes are being made because it was anticipated they will be among the MHCEs for 2012.
The amended awards include 28,506 shares of restricted stock and nonqualified stock options to purchase, at $14.99 per share, 47,650 shares of the Company’s common stock which were awarded to the two executives as part of the Company’s 2010 annual incentive bonus program and the 2011 long-term incentive program. Both the options and restricted shares were scheduled to vest in three equal annual installments beginning on the first anniversary of their respective grant dates.
The amendments provide for (1) acceleration of the vesting dates of the options so that they vested 100% on December 29, 2011 and (2) restructuring of the restricted stock to be TARP-compliant by pushing back the first vesting tranche of the restricted shares so that they will vest two-thirds on the second anniversary of their respective 2011 grant dates and one-third on the third anniversary. As a result of the accelerated option vesting dates, the recognition of the expense associated with the full fair value of the options, $329,000, was accelerated into 2011, but such action did not create any additional overall expense for the Company. The modification to the vesting dates for the restricted stock awards did not modify the fair value nor expense recognition of the fair value on such awards.
In 2010 the Compensation Committee and the Board of Directors approved amendments to certain previously-granted performance share awards to modify the vesting provisions to provide for time vesting of the awards rather than performance vesting based on certain stock price appreciation targets established in 2007. The performance shares were awarded in late-2007 and 2008 pursuant to our Strategic Long-Term Incentive Compensation Plan and the 2007 Plan in connection with the recruitment or retention of key employees. Except for the change in vesting conditions, the amendments did not change the number of shares, the vesting schedule, continued service requirements or any other terms or conditions set forth in the original awards.
A total of 127 employees’ awards were modified. The incremental cost of this modification was $9.9 million that would be recognized from 2010 through 2012. For the years ended December 31, 2011 and 2010, respectively, we recognized $2.8 million and $3.0 million, respectively, net of forfeitures in share-based compensation expense in connection with the modification of these awards.
There were no share-based compensation award modifications in 2009.
Savings and Retirement Plan
The Company has a defined contribution retirement plan, The PrivateBancorp, Inc. Savings, Retirement and Employee Stock Ownership Plan (the “KSOP”), which allows employees, at their option, to make contributions up to 75% of compensation on a pre-tax basis and/or after-tax basis through salary deferrals under Section 401(k) of the Internal Revenue Code. At the employees’ direction, employee contributions are invested among a variety of investment alternatives. For employees who have met a one-year service requirement and make voluntary contributions to the KSOP, we contribute an amount equal to $0.50 for each dollar contributed up to 6% of an employee’s compensation (subject to certain maximum compensation amounts as prescribed in Internal Revenue Service guidance). The Company’s matching contribution vests in increments of 20% annually for each year in which 1,000 hours are worked. The KSOP also allows for a discretionary company contribution. Although no such contribution was made for 2011, 2010 or 2009, the discretionary component vests in increments of 20% annually over a period of 5 years based on the employee’s years of service.
127
KSOP Plan Information
(Amounts in thousands)
| | | | | | | | | | | | |
| | | Years Ended December 31, | |
| | | 2011 | | | 2010 | | | 2009 | |
Company matching contribution | | $ | 1,931 | | | $ | 1,785 | | | $ | 1,463 | |
Number of Company shares held in KSOP | | | 479 | | | | 465 | | | | 428 | |
Fair value of Company shares held by KSOP | | $ | 5,261 | | | $ | 6,681 | | | $ | 3,839 | |
Dividends received | | $ | 20 | | | $ | 18 | | | $ | 14 | |
Deferred Compensation Plan
We maintain a non-qualified deferred compensation plan (the “Plan”) which allows eligible participants to defer the receipt of cash compensation or non-employee director fees otherwise payable to them. The purpose of the Plan is to further our ability to attract and retain high quality executives and non-employee directors. Executive officers who participate in the Plan may elect to defer up to 50% of annual base salary and 100% of annual bonus amounts and directors may elect to defer up to 100% of his or her annual director’s fees. Participants elect at the time amounts are deferred whether such deferral amounts will be credited with “earnings” as if they were invested in either a fixed income account with interest credited based on our prime rate (not to exceed 120% of the applicable federal long-term rate) on the cash value of the funds deposited, or in deferred stock units (“DSUs”) in Company stock with earnings credited in the form of dividends equivalent to that paid to our common stockholders. Except for an “earnings” credit on the deferred amounts, we do not provide any contributions or credits to participants under the Plan. At December 31, 2011 and 2010, there were 128,026 and 72,947 DSUs, respectively, in the Plan. At the time of distribution, amounts credited in DSUs are paid in shares of our common stock while amounts credited in the fixed income account are paid in cash. All elections and payments under the Plan are subject to compliance with requirements of Section 409A of the Internal Revenue Code which may limit elections and require delay in payment of benefits in certain circumstances.
17. REGULATORY AND CAPITAL MATTERS
The Company and the Bank are subject to various regulatory requirements that impose restrictions on cash, loans or advances, and dividends. The Bank is required to maintain reserves against deposits. Reserves are held either in the form of vault cash or non-interest-bearing balances maintained with the FRB and are based on the average daily balances and statutory reserve ratios prescribed by the type of deposit account.
Cash Restrictions
(Amounts in thousands)
| | | | | | | | |
| | | December 31, | |
| | | 2011 | | | 2010 | |
Reserve balances required to be maintained with the FRB | | $ | 50,682 | | | $ | 33,027 | |
Cash and due from banks held as collateral for standby letter of credit services | | $ | - | | | $ | 22,000 | |
Under current FRB regulations, the Bank is limited in the amount it may loan or advance to the parent company and its nonbank subsidiaries. Loans or advances to a single subsidiary may not exceed 10% and loans to all subsidiaries may not exceed 20% of the Bank’s capital stock and surplus, as defined. Loans from the Bank to nonbank subsidiaries and the parent company are also required to meet certain collateral requirements.
Various state banking regulations limit the amount of dividends that may be paid to the parent company by the Bank. Dividend payments by the Bank are subject to regulatory approval and are contingent upon a number of factors including the Bank’s ability to meet applicable regulatory capital requirements, the strength of the Bank’s balance sheet and its ability to support any projected growth, and the Bank’s profitability and earnings. No dividends were paid by the Bank to the parent company during 2011 or 2010. As of December 31, 2011, the Bank had the capacity under banking regulation to pay dividends of $50.3 million, subject to prior regulatory approval and the Company’s internal capital policy.
Under applicable regulatory capital adequacy guidelines, the Company and the Bank are subject to various capital requirements adopted and administered by the federal banking agencies. These guidelines specify minimum capital ratios calculated in accordance with the definitions in the guidelines, including the leverage ratio which is Tier 1 capital as a percentage of adjusted average assets,
128
and the Tier 1 capital ratio and the total capital ratio each as a percentage of risk-weighted assets and off-balance sheet items that have been weighted according to broad risk categories. These minimum ratios are shown in the table below.
To satisfy safety and soundness standards, banking institutions are expected to maintain capital levels in excess of the regulatory minimums depending on the risk inherent in the balance sheet, regulatory expectations and the changing risk profile of business activities and plans. Under our capital planning policy, we target capital ratios at levels we believe are appropriate based on such risk considerations, taking into account the current operating and economic environment, internal risk guidelines, and our strategic objectives as well as regulatory expectations. At the Bank, primarily due to our credit loss experience and recent levels of nonperforming loans, our policy currently calls for minimum capital ratios of 8.25% Tier 1 leverage and 12.0% total risk-based capital amongst other key capital metrics.
As of December 31, 2011, the Company and the Bank met all capital adequacy requirements to which they are subject. As of December 31, 2011, the most recent regulatory notification classified the Bank as “well capitalized” under the regulatory framework for prompt corrective action. There are no conditions or events since that notification that management believes would change the Bank’s classification for this purpose. Failure to meet minimum capital requirements could result in certain mandatory, and possible discretionary, actions by regulators which, if undertaken, could have a material effect on our consolidated financial statements.
The following table presents information about our capital measures and the related regulatory capital guidelines.
Capital Measurements
(Amounts in thousands, except for ratios)
| | | | | | | | | | | | | | | | | | | | | | | | |
| | | Actual | | | FRB Guidelines for
Minimum Regulatory
Capital | | | Regulatory Minimum
For “Well Capitalized”
under FDICIA | |
| | | Capital | | | Ratio | | | Capital | | | Ratio | | | Capital | | | Ratio | |
As of December 31, 2011: | | | | | | | | | | | | | | | | | | | | | | | | |
Total risk-based capital: | | | | | | | | | | | | | | | | | | | | | | | | |
Consolidated | | $ | 1,597,863 | | | | 14.28% | | | $ | 895,304 | | | | 8.00% | | | | n/a | | | | n/a | |
The PrivateBank | | | 1,413,862 | | | | 12.66 | | | | n/a | | | | n/a | | | $ | 1,116,649 | | | | 10.00% | |
Tier 1 risk-based capital: | | | | | | | | | | | | | | | | | | | | | | | | |
Consolidated | | | 1,384,924 | | | | 12.38 | | | | 447,652 | | | | 4.00 | | | | n/a | | | | n/a | |
The PrivateBank | | | 1,201,229 | | | | 10.76 | | | | n/a | | | | n/a | | | | 669,989 | | | | 6.00 | |
Tier 1 leverage: | | | | | | | | | | | | | | | | | | | | | | | | |
Consolidated | | | 1,384,924 | | | | 11.33 | | | | 488,851 | | | | 4.00 | | | | n/a | | | | n/a | |
The PrivateBank | | | 1,201,229 | | | | 9.85 | | | | n/a | | | | n/a | | | | 609,736 | | | | 5.00 | |
| | | | | | |
As of December 31, 2010: | | | | | | | | | | | | | | | | | | | | | | | | |
Total risk-based capital: | | | | | | | | | | | | | | | | | | | | | | | | |
Consolidated | | $ | 1,571,619 | | | | 14.18% | | | $ | 886,404 | | | | 8.00% | | | | n/a | | | | n/a | |
The PrivateBank | | | 1,363,054 | | | | 12.32 | | | | n/a | | | | n/a | | | $ | 1,106,185 | | | | 10.00% | |
Tier 1 risk-based capital: | | | | | | | | | | | | | | | | | | | | | | | | |
Consolidated | | | 1,335,787 | | | | 12.06 | | | | 443,202 | | | | 4.00 | | | | n/a | | | | n/a | |
The PrivateBank | | | 1,127,448 | | | | 10.19 | | | | n/a | | | | n/a | | | | 663,711 | | | | 6.00 | |
Tier 1 leverage: | | | | | | | | | | | | | | | | | | | | | | | | |
Consolidated | | | 1,335,787 | | | | 10.78 | | | | 495,873 | | | | 4.00 | | | | n/a | | | | n/a | |
The PrivateBank | | | 1,127,448 | | | | 9.11 | | | | n/a | | | | n/a | | | | 618,774 | | | | 5.00 | |
n/a Not applicable
18. DERIVATIVE INSTRUMENTS
We utilize an overall risk management strategy that incorporates the use of derivative instruments to reduce certain risks related to interest rate risk, as it relates to mortgage loan commitments and planned sales, and foreign currency volatility. We also use these instruments to accommodate our clients as we provide them with risk management solutions. None of the above-mentioned end-user and client-related derivatives were designated as hedging instruments at December 31, 2011 and 2010.
129
Additionally, in July 2011, we initiated the use of interest rate derivatives as part of our asset strategy to hedge interest rate risk in our loan portfolio which is comprised primarily of floating rate loans. These derivatives were designated as cash flow hedges.
Derivatives expose us to counterparty credit risk. Credit risk is managed through our standard underwriting process. Actual exposures are monitored against various types of credit limits established to contain risk within parameters. Additionally, credit risk is managed through the use of collateral and netting agreements.
Composition of Derivative Instruments
and Fair Value
(Amounts in thousands)
| | | | | | | | | | | | | | | | | | | | | | | | | | | | | | | | |
| | | Asset Derivatives | | | Liability Derivatives | |
| | | December 31, 2011 | | | December 31, 2010 | | | December 31, 2011 | | | December 31, 2010 | |
| | | Notional/
Contract
Amount (1) | | | Fair
Value | | | Notional/
Contract
Amount (1) | | | Fair
Value | | | Notional/
Contract
Amount (1) | | | Fair
Value | | | Notional/
Contract
Amount (1) | | | Fair
Value | |
Derivatives designated as hedging instruments(2): | | | | | | | | | | | | | | | | | | | | | | | | | | | | | | | | |
Interest rate contracts | | $ | 200,000 | | | $ | 2,586 | | | $ | - | | | $ | - | | | $ | - | | | $ | - | | | $ | - | | | $ | - | |
Less: netting adjustments(3) | | | | | | | - | | | | | | | | - | | | | | | | | - | | | | | | | | - | |
| | | | | | | | | | | | | | | | | | | | | | | | | | | | | | | | |
Total | | | | | | | 2,586 | | | | | | | | - | | | | | | | | - | | | | | | | | - | |
| | | | | | | | | | | | | | | | | | | | | | | | | | | | | | | | |
Derivatives not designated as hedging instruments: | | | | | | | | | | | | | | | | | | | | | | | | | | | | | | | | |
Capital markets group derivatives(4): | | | | | | | | | | | | | | | | | | | | | | | | | | | | | | | | |
Interest rate contracts | | $ | 2,985,774 | | | $ | 104,482 | | | $ | 3,028,827 | | | $ | 102,386 | | | $ | 2,985,774 | | | $ | 107,612 | | | $ | 3,028,827 | | | $ | 104,799 | |
Foreign exchange contracts | | | 101,401 | | | | 5,203 | | | | 109,956 | | | | 4,069 | | | | 101,401 | | | | 4,517 | | | | 109,956 | | | | 3,416 | |
Credit contracts(1) | | | 43,218 | | | | 12 | | | | 4,523 | | | | 1 | | | | 94,921 | | | | 32 | | | | 68,945 | | | | 9 | |
| | | | | | | | | | | | | | | | | | | | | | | | | | | | | | | | |
Subtotal | | | | | | | 109,697 | | | | | | | | 106,456 | | | | | | | | 112,161 | | | | | | | | 108,224 | |
Less: netting adjustments(3) | | | | | | | (8,021) | | | | | | | | (6,206) | | | | | | | | (8,021) | | | | | | | | (6,206) | |
| | | | | | | | | | | | | | | | | | | | | | | | | | | | | | | | |
Total | | | | | | | 101,676 | | | | | | | | 100,250 | | | | | | | | 104,140 | | | | | | | | 102,018 | |
| | | | | | | | | | | | | | | | | | | | | | | | | | | | | | | | |
Other derivatives(2): | | | | | | | | | | | | | | | | | | | | | | | | | | | | | | | | |
Foreign exchange contracts | | $ | 8,217 | | | $ | 196 | | | $ | 4,425 | | | $ | 29 | | | $ | 3,883 | | | $ | 26 | | | $ | - | | | $ | - | |
Mortgage banking derivatives | | | | | | | 563 | | | | | | | | 221 | | | | | | | | 683 | | | | | | | | 280 | |
| | | | | | | | | | | | | | | | | | | | | | | | | | | | | | | | |
Subtotal | | | | | | | 759 | | | | | | | | 250 | | | | | | | | 709 | | | | | | | | 280 | |
| | | | | | | | | | | | | | | | | | | | | | | | | | | | | | | | |
Total derivatives not designated as hedging instruments | | | | | | | 102,435 | | | | | | | | 100,500 | | | | | | | | 104,849 | | | | | | | | 102,298 | |
| | | | | | | | | | | | | | | | | | | | | | | | | | | | | | | | |
Grand total derivatives | | | | | | $ | 105,021 | | | | | | | $ | 100,500 | | | | | | | $ | 104,849 | | | | | | | $ | 102,298 | |
| | | | | | | | | | | | | | | | | | | | | | | | | | | | | | | | |
| | (1) | The remaining average notional amounts are shown for credit contracts. |
| | (2) | Derivative assets and liabilities designated as hedging instruments and other derivative assets and liabilities not designated as hedging instruments are reported in other assets and other liabilities on the Consolidated Statements of Financial Condition, respectively. |
| | (3) | Represents netting of derivative asset and liability balances, and related cash collateral, with the same counterparty subject to master netting agreements. Authoritative accounting guidance permits the netting of derivative receivables and payables when a legally enforceable master netting agreement exists between the Company and a derivative counterparty. A master netting agreement is an agreement between two counterparties who have multiple derivative contracts with each other that provide for the net settlement of contracts through a single payment, in a single currency, in the event of default on or termination of any one contract. |
| | (4) | Capital markets group asset and liability derivatives are reported separately on the Consolidated Statements of Financial Condition. |
130
Certain of our derivative contracts contain embedded credit risk contingent features that if triggered either allow the derivative counterparty to terminate the derivative or require additional collateral. These contingent features are triggered if we do not meet specified financial performance indicators such as minimum capital ratios under the federal banking agencies’ guidelines. All requirements were met at December 31, 2011. Details on these derivative contracts are set forth in the following table.
Derivatives Subject to Credit Risk Contingency Features
(Amounts in thousands)
| | | | | | | | |
| | | December 31, | |
| | | 2011 | | | 2010 | |
Fair value of derivatives with credit contingency features in a net liability position | | $ | 56,586 | | | $ | 66,649 | |
Collateral posted for those transactions in a net liability position | | $ | 56,082 | | | $ | 70,334 | |
If credit risk contingency features were triggered: | | | | | | | | |
Additional collateral required to be posted to derivative counterparties | | $ | 321 | | | $ | 347 | |
Outstanding derivative instruments that would be immediately settled | | $ | 48,677 | | | $ | 52,354 | |
Derivatives Designated in Hedge Relationships
Our objectives in using interest rate derivatives are to add stability to interest income and to manage our exposure to interest rate movements.
Cash flow hedges – During the third and fourth quarters of 2011, we entered into receive fixed/pay variable interest rate swaps to convert certain floating-rate commercial loans to fixed rate in order to substantially reduce the variability in forecasted interest cash flows due to market interest rate changes. We use regression analysis to assess the effectiveness of cash flow hedges at the inception of the hedge relationship and on an ongoing basis. Ineffectiveness is generally measured as the amount by which the cumulative change in fair value of the hedging instrument exceeds the present value of the cumulative change in the hedged item’s expected cash flows. Measured ineffectiveness is recognized directly in other non-interest income in the Consolidated Statements of Income. The effective portion of the gains or losses on cash flow hedges are recorded, net of tax, in accumulated other comprehensive income (“AOCI”) and are subsequently reclassified to interest income on loans in the period that the hedged interest receipts affect earnings. As of December 31, 2011, the maximum length of time over which forecasted interest cash flows are hedged is seven years. There are no components of derivative gains or losses excluded from the assessment of hedge effectiveness related to our cash flow hedge strategy.
Change in Accumulated Other Comprehensive Income
Related to Interest Rate Swaps Designated as Cash Flow Hedge
(Amounts in thousands)
| | | | |
| | | 2011 | |
Unrealized gain at beginning of year | | $ | - | |
Amount of gain recognized in AOCI | | | 3,156 | |
Amount reclassified from AOCI to interest income on loans | | | (570) | |
| | | | |
Unrealized gain at end of year | | $ | 2,586 | |
| | | | |
As of December 31 2011, $1.1 million in net deferred gains, net of tax, recorded in AOCI are expected to be reclassified into earnings during the next twelve months. This amount could differ from amounts actually recognized due to changes in interest rates, hedge de-designations, and the addition of other hedges subsequent to December 31, 2011.
131
Gain (Loss) Recorded in Consolidated Statements of Income
and Accumulated Other Comprehensive Income Related to
Interest Rate Swaps Designated as Cash Flow Hedge
(Amounts in thousands)
| | | | |
| | | Year Ended
December 31,
2011 | |
Amount of gain (loss), net of tax, recognized in AOCI (effective portion) | | $ | 1,900 | |
Amount of gain (loss), pre-tax, reclassified from AOCI to interest income on loans | | | 570 | |
Amount of gain (loss), pre-tax, recognized in other non-interest income (ineffective portion) | | | - | |
During the year ended December 31, 2011, there were no gains or losses from cash flow hedge derivatives related to ineffectiveness that were reclassified to current earnings. We are required to reclassify such gains or losses related to ineffectiveness in circumstances where the original forecasted transaction is no longer probable of occurring.
Derivatives Not Designated in Hedge Relationships
End-User Derivatives– We enter into derivatives that include commitments to fund certain mortgage loans to be sold into the secondary market and forward commitments for the future delivery of residential mortgage loans. It is our practice to enter into forward commitments for the future delivery of residential mortgage loans when customer interest rate lock commitments are entered into to economically hedge the effect of changes in interest rates on our commitments to fund the loans as well as on our portfolio of mortgage loans held-for-sale. At December 31, 2011, we had approximately $98.3 million of interest rate lock commitments and $130.3 million of forward commitments for the future delivery of residential mortgage loans with rate locks at rates consistent with the lock commitment.
We are also exposed at times to foreign exchange risk as a result of issuing loans in which the principal and interest are settled in a currency other than U.S. dollars. Currently our exposure is to the Euro and British pound on $12.1 million of loans and we manage this risk by using currency forward derivatives.
Client Related Derivatives – We offer, through our capital markets group, over-the-counter interest rate and foreign exchange derivatives to our clients, including but not limited to, interest rate swaps, options on interest rate swaps, interest rate options (also referred to as caps, floors, collars, etc.), foreign exchange forwards, and options as well as cash products such as foreign exchange spot transactions. When our clients enter into an interest rate or foreign exchange derivative transaction with us, we mitigate our exposure to market risk through the execution of off-setting positions with inter-bank dealer counterparties. Although the off-setting nature of transactions originated by our capital markets group limit our market risk exposure, they do expose us to other risks including counterparty credit, settlement, and operational risk.
To accommodate our loan clients, we occasionally enter into risk participation agreements (“RPA”) with counterparty banks to either accept or transfer a portion of the credit risk related to their interest rate derivatives. This allows clients to execute an interest rate derivative with one bank while allowing for distribution of the credit risk among participating members. We have entered into written RPAs in which we accept a portion of the credit risk associated with a loan client’s interest rate derivative in exchange for a fee. We manage this credit risk through our loan underwriting process, and when appropriate, the RPA is backed by collateral provided by our clients under their loan agreement.
The current payment/performance risk of written RPAs is assessed using internal risk ratings which range from 1 to 8 with the latter representing the highest credit risk. The risk rating is based on several factors including the financial condition of the RPA’s underlying derivative counterparty, present economic conditions, performance trends, leverage, and liquidity.
The maximum potential amount of future undiscounted payments that we could be required to make under our written RPAs assumes that the underlying derivative counterparty defaults and that the floating interest rate index of the underlying derivative remains at zero percent. In the event that we would have to pay out any amounts under our RPAs, we will seek to recover these from assets that our clients pledged as collateral for the derivative and the related loan.
132
Risk Participation Agreements
(Dollars in thousands)
| | | | | | | | |
| | | December 31, | |
| | | 2011 | | | 2010 | |
Fair value of written RPAs | | $ | (32) | | | $ | (9) | |
Range of remaining terms to maturity (in years) | | | Less than 1 to 4 | | | | Less than 1 to 4 | |
Range of assigned internal risk ratings | | | 3 to 4 | | | | 3 to 5 | |
Maximum potential amount of future undiscounted payments | | $ | 3,075 | | | $ | 2,413 | |
Percent of maximum potential amount of future undiscounted payments covered by proceeds from liquidation of pledged collateral | | | 55% | | | | 80% | |
Gain (Loss) Recognized on Derivative Instruments
Not Designated in Hedging Relationship
(Amounts in thousands)
| | | | | | | | | | | | |
| | | Years Ended December 31, | |
| | | 2011 | | | 2010 | | | 2009 | |
Gain on derivatives recognized in capital markets products income: | | | | | | | | |
Interest rate contracts | | $ | 13,232 | | | $ | 9,794 | | | $ | 14,650 | |
Foreign exchange contracts | | | 5,719 | | | | 4,301 | | | | 2,433 | |
Credit contracts | | | 390 | | | | 191 | | | | 67 | |
| | | | | | | | | | | | |
Total capital markets group derivatives | | | 19,341 | | | | 14,286 | | | | 17,150 | |
| | | | | | | | | | | | |
Gain (loss) on other derivatives recognized in other income, service charges and fees: | | | | | | | | |
Foreign exchange derivatives | | | 141 | | | | 32 | | | | (279) | |
Mortgage banking derivatives | | | (57) | | | | (171) | | | | 230 | |
| | | | | | | | | | | | |
Total other derivatives | | | 84 | | | | (139) | | | | (49) | |
| | | | | | | | | | | | |
Total derivatives | | $ | 19,425 | | | $ | 14,147 | | | $ | 17,101 | |
| | | | | | | | | | | | |
133
19. COMMITMENTS, GUARANTEES, AND CONTINGENT LIABILITIES
Credit Extension Commitments and Guarantees
In the normal course of business, we enter into a variety of financial instruments with off-balance sheet risk to meet the financing needs of our clients and to conduct lending activities. These instruments principally include commitments to extend credit, standby letters of credit, and commercial letters of credit. These instruments involve, to varying degrees, elements of credit and interest rate risk in excess of the amount reflected in the Consolidated Statements of Financial Condition.
Contractual or Notional Amounts of Financial Instruments
(Amounts in thousands)
| | | | | | | | |
| | | December 31, | |
| | | 2011 | | | 2010 | |
Commitments to extend credit: | | | | | | | | |
Home equity lines | | $ | 159,072 | | | $ | 175,365 | |
Residential 1-4 family construction - secured | | | 34,167 | | | | 15,600 | |
Commercial real estate - secured | | | 539,667 | | | | 472,032 | |
Commercial and industrial | | | 3,197,347 | | | | 2,929,215 | |
All other commitments | | | 176,916 | | | | 278,825 | |
| | | | | | | | |
Total commitments to extend credit | | $ | 4,107,169 | | | $ | 3,871,037 | |
| | | | | | | | |
Letters of credit: | | | | | | | | |
Financial standby | | $ | 341,502 | | | $ | 265,675 | |
Performance standby | | | 26,212 | | | | 32,425 | |
Commercial letters of credit | | | 2,127 | | | | 115 | |
| | | | | | | | |
Total letters of credit | | $ | 369,841 | | | $ | 298,215 | |
| | | | | | | | |
Commitments to extend credit are agreements to lend funds to a client as long as there is no violation of any condition established in the contract. Commitments generally have fixed expiration dates or other termination clauses and variable interest rates tied to the prime rate or LIBOR and may require payment of a fee. Since many of the commitments are expected to expire without being drawn upon, the total commitment amounts do not necessarily represent future cash-flow requirements. As of December 31, 2011, we had a reserve for unfunded commitments of $7.3 million, which reflects our estimate of inherent losses associated with these commitment obligations. The reserve is recorded in other liabilities in the Consolidated Statements of Financial Condition.
Standby and commercial letters of credit are conditional commitments issued by us to guarantee the performance of a client to a third party. Standby letters of credit include performance and financial guarantees for clients in connection with contracts between our clients and third parties. Standby letters of credit are agreements where we are obligated to make payment to a third party on behalf of a client in the event the client fails to meet its contractual obligations. Commercial letters of credit are issued specifically to facilitate commerce and typically result in the commitment being drawn on when the underlying transaction is consummated between the client and the third party.
In the event of a client’s nonperformance, our credit loss exposure is equal to the contractual amount of those commitments. We manage this credit risk in a similar manner to evaluating credit risk in extending loans to clients under our credit policies. We use the same credit policies in making credit commitments as for on-balance sheet instruments, mitigating exposure to credit loss through various collateral requirements, if deemed necessary. In the event of nonperformance by the clients, we have rights to the underlying collateral, which could include commercial real estate, physical plant and property, inventory, receivables, cash and marketable securities.
The maximum potential future payments guaranteed by us under standby letters of credit arrangements are equal to the contractual amount of the commitment. The unamortized fees associated with standby letters of credit, which are included in other liabilities in the Consolidated Statements of Financial Condition, totaled $633,000 as of December 31, 2011. We amortize these amounts into income over the commitment period. As of December 31, 2011, standby letters of credit had a remaining weighted-average term of approximately 13 months, with remaining actual lives ranging from less than 1 year to 19 years.
134
Credit Card Settlement Guarantees
Our third-party vendor issues corporate purchase credit cards on behalf of our commercial clients. The corporate purchase credit cards are issued to employees of our commercial clients at the client’s direction and used for payment of business-related expenses. In most circumstances, these cards will be underwritten by our third-party vendor. However, in certain circumstances, we may enter into a recourse agreement, which transfers the credit risk from the third-party vendor to us in the event that the licensee fails to meet its financial payment obligation. In these circumstances, a total exposure amount is established for our corporate client. In addition to the obligations presented in the prior table, the maximum potential future payments guaranteed by us under this third-party settlement guarantee is $3.2 million at December 31, 2011.
We believe that the estimated amounts of maximum potential future payments are not representative of our actual potential loss given our insignificant historical losses from this third-party settlement guarantee program. As of December 31, 2011, we have not recorded any contingent liability in the consolidated financial statements for this settlement guarantee program, and management believes that the probability of any payments under this arrangement is remote.
Mortgage Loans Sold with Recourse
Certain mortgage loans sold have limited recourse provisions. We recorded no losses for the year ended December 31, 2011 arising from limited recourse provisions. The losses for the year ended December 31, 2010 arising from limited recourse provisions were not material. Based on this experience, the Company has not established any liability for potential future payments relating to mortgage loans sold in prior periods.
Legal Proceedings
On October 22, 2010, a lawsuit was filed in federal court in the Northern District of Illinois against the Company on behalf of a purported class of purchasers of our common stock between November 2, 2007 and October 23, 2009. Certain of our current and former executive officers and directors and firms that participated in the underwriting of our June 2008 and May 2009 public offerings of common stock were also named as defendants in the litigation. On January 25, 2011, the City of New Orleans Employees’ Retirement System and State-Boston Retirement System were together named as the lead plaintiff, and an amended complaint was filed on February 18, 2011. The amended complaint alleged various claims of securities law violations against certain of the named defendants relating to disclosures we made during the class period in filings under the Securities Act of 1933 and the Securities Exchange Act of 1934. The plaintiffs sought class certification, compensatory damages in an unspecified amount, costs and expenses, including attorneys’ fees, and rescission. The defendants filed a joint motion to dismiss seeking dismissal of all counts. On November 7, 2011, the court released its decision on the defendants’ motion and dismissed all counts of the complaint with prejudice. The plaintiffs did not appeal the court’s decision.
As of December 31, 2011, there were various legal proceedings pending against the Company and its subsidiaries in the ordinary course of business. Management does not believe that the outcome of these proceedings will have, individually or in the aggregate, a material adverse effect on the Company’s results of operations, financial condition or cash flows.
20. ESTIMATED FAIR VALUE OF FINANCIAL INSTRUMENTS
We measure, monitor, and disclose certain of our assets and liabilities on a fair value basis. Fair value is used on a recurring basis to account for securities available-for-sale, mortgage loans held for sale, derivative assets, derivative liabilities, and certain other assets and other liabilities. In addition, fair value is used on a non-recurring basis to apply lower-of-cost-or-market accounting to foreclosed real estate and certain other loans held for sale, evaluate assets or liabilities for impairment, including collateral-dependent impaired loans, and for disclosure purposes. Fair value is defined as the price that would be received to sell an asset or paid to transfer a liability in an orderly transaction between market participants at the measurement date. Depending on the nature of the asset or liability, we use various valuation techniques and input assumptions when estimating fair value.
U.S. GAAP requires us to maximize the use of observable inputs and minimize the use of unobservable inputs when measuring fair value and establishes a fair value hierarchy that prioritizes the inputs used to measure fair value into three broad levels based on the reliability of the input assumptions. The hierarchy gives the highest priority to level 1 measurements and the lowest priority to level 3 measurements. The three levels of the fair value hierarchy are defined as follows:
| | • | | Level 1 – Unadjusted quoted prices for identical assets or liabilities traded in active markets. |
135
| | • | | Level 2 – Observable inputs other than level 1 prices, such as quoted prices for similar instruments; quoted prices in markets that are not active; or other inputs that are observable or can be corroborated by observable market data for substantially the full term of the asset or liability. |
| | • | | Level 3 – Unobservable inputs that are supported by little or no market activity and that are significant to the fair value of the assets or liabilities. |
The categorization of where an asset or liability falls within the hierarchy is based on the lowest level of input that is significant to the fair value measurement.
Valuation Methodology
We believe our valuation methods are appropriate and consistent with other market participants. However, the use of different methodologies or assumptions to determine the fair value of certain financial instruments could result in a different estimate of fair value. Additionally, the methods used may produce a fair value calculation that may not be indicative of net realizable value or reflective of future fair values.
The following describes the valuation methodologies we use for assets and liabilities measured at fair value, including the general classification of the assets and liabilities pursuant to the valuation hierarchy.
Securities Available-for-Sale –Securities available-for-sale include U.S. Treasury, collateralized mortgage obligations, residential mortgage-backed securities, state and municipal securities, and foreign sovereign debt. Substantially all available-for-sale securities are fixed income instruments that are not quoted on an exchange, but may be traded in active markets. The fair value of these securities is based on quoted market prices obtained from external pricing services. The principal markets for our securities portfolio are the secondary institutional markets, with an exit price that is predominantly reflective of bid level pricing in those markets. U.S. Treasury securities have been classified in level 1 of the valuation hierarchy. Virtually all other remaining securities are classified in level 2 of the valuation hierarchy. On a quarterly basis, the Company uses a variety of methods to validate the overall reasonableness of the fair values obtained from external pricing services, including evaluating pricing service inputs and methodologies, using exception reports based on analytical criteria, comparing prices obtained to prices received from other pricing sources, and reviewing the reasonableness of prices based on the Company’s knowledge of market liquidity and other market-related conditions. While our validation procedures may result in the use of a price obtained from our primary pricing source or our secondary pricing source, we have not altered the fair values obtained from the external pricing services.
Mortgage Loans Held for Sale –Mortgage loans held for sale represent mortgage loan originations intended to be sold in the secondary market. On August 1, 2011, we elected the fair value option for mortgage loans originated with the intention of selling to a third party bank that are originated as of or subsequent to this date. The election of the fair value option aligns the accounting for these loans with the related mortgage banking derivatives used to economically hedge them. These mortgage loans are measured at fair value as of each reporting date, with changes in fair value recognized through mortgage banking non-interest income. Mortgage loans originated with the intention of selling to a third party bank prior to August 1, 2011 were accounted for at the lower of cost or fair value. The fair value of mortgage loans held for sale is determined based on prices obtained for loans with similar characteristics from third party sources. On a quarterly basis, the Company validates the overall reasonableness of the fair values obtained from third party sources by comparing prices obtained to prices received from various other pricing sources, and reviewing the reasonableness of prices based on Company knowledge of market liquidity and other market-related conditions. Mortgage loans held for sale are classified in level 2 of the valuation hierarchy.
Other Loans Held for Sale – Other loans held for sale represent other loans that management has an active plan to sell. Other loans held for sale are accounted for at the lower of cost or fair value, which is determined based on a variety of factors, including quoted market rates and our judgment of other relevant market conditions. Other loans held for sale are classified in level 3 of the valuation hierarchy.
Collateral-Dependent Impaired Loans – We do not record loans at fair value on a recurring basis. However, periodically, we record nonrecurring adjustments to reduce the carrying value of loans based on fair value measurement. Loans for which it is probable that payment of interest or principal will not be made in accordance with the original contractual terms of the original loan agreement are considered impaired. Impaired loans for which repayment of the loan is expected to be provided solely by the underlying collateral requires classification in the fair value hierarchy. We measure the fair value of collateral-dependent impaired loans based on the fair value of the collateral securing these loans. Substantially all collateral-dependent impaired loans are secured by real estate with the fair value generally determined based upon appraisals performed by a certified or licensed appraiser using inputs such as absorption rates, capitalization rates and comparables. We also consider other factors or recent developments that could result in adjustments to the
136
collateral value estimates indicated in the appraisals. Accordingly, fair value estimates for collateral-dependent impaired loans are classified in level 3 of the valuation hierarchy. The carrying value of impaired loans and the related valuation allowance are disclosed in Note 4.
OREO –OREO is valued on a nonrecurring basis using third-party appraisals of each property and our judgment of other relevant market conditions and is classified in level 3 of the valuation hierarchy.
Covered Assets-Foreclosed Real Estate –Covered assets-foreclosed real estate is valued on a nonrecurring basis using third-party appraisals of each property and our judgment of other relevant market conditions and is classified in level 3 of the valuation hierarchy.
Capital Market Derivative Assets and Derivative Liabilities – Client-related derivative instruments with positive fair values are reported as an asset and derivative instruments with negative fair value are reported as liabilities, in both cases after taking into account the effects of master netting agreements. The fair value of client-related derivative assets and liabilities is determined based on prices obtained from third party advisors using standardized industry models. Many factors affect derivative values, including the level of interest rates, the market’s perception of our nonperformance risk as reflected in our credit spread, and our assessment of counterparty nonperformance risk. The nonperformance risk assessment is based on our evaluation of credit risk, or if available, on observable external assessments of credit risk. Values of client-related derivative assets and liabilities are primarily based on observable inputs and are generally classified in level 2 of the valuation hierarchy. Level 3 derivatives include risk participation agreements and derivatives associated with clients whose loans are risk rated 6 or higher. Refer to “Credit Quality Indicators” in Note 4 of “Notes to the Consolidated Financial Statements” above for further discussion on risk ratings. On a quarterly basis, the Company uses a variety of methods to validate the overall reasonableness of the fair values obtained from third party advisors, including evaluating inputs and methodologies used by the third party advisors, comparing prices obtained to prices received from other pricing sources, and reviewing the reasonableness of prices based on Company knowledge of market liquidity and other market-related conditions. While we may challenge prices obtained from third party advisors based on our validation procedures, we have not altered the fair values ultimately provided by the third party advisors.
Other Assets and Other Liabilities –Included in other assets and other liabilities are cash flow hedges designated in a hedging relationship and other end-user derivative instruments that we use to manage our foreign exchange and interest rate risk. Those derivative instruments with a positive fair value are reported as assets and those with a negative fair value are reported as liabilities. The fair value is determined based on prices obtained from third party advisors. These derivative assets and liabilities are classified in level 2 of the valuation hierarchy. On a quarterly basis, the Company uses a variety of methods to validate the overall reasonableness of the fair values obtained from third party advisors, including evaluating inputs and methodologies used by the third party advisors, comparing prices obtained to prices received from other pricing sources, and reviewing the reasonableness of prices based on Company knowledge of market liquidity and other market-related conditions. While we may challenge prices obtained from third party advisors based on our validation procedures, we have not altered the fair values ultimately provided by the third party advisors.
137
Assets and Liabilities Measured at Fair Value on a Recurring Basis
The following table presents the hierarchy level and fair value for each major category of assets and liabilities measured at fair value at December 31, 2011 and 2010 on a recurring basis.
Fair Value Measurements on a Recurring Basis
(Amounts in thousands)
| | | | | | | | | | | | | | | | | | | | | | | | | | | | | | | | |
| | | December 31, 2011 | | | December 31, 2010 | |
| | | Quoted
Prices in
Active
Markets
for Identical
Assets
(Level 1) | | | Significant
Other
Observable
Inputs
(Level 2) | | | Significant
Unobservable
Inputs
(Level 3) | | | Total | | | Quoted
Prices in
Active
Markets
for Identical
Assets
(Level 1) | | | Significant
Other
Observable
Inputs
(Level 2) | | | Significant
Unobservable
Inputs
(Level 3) | | | Total | |
Assets: | | | | | | | | | | | | | | | | | | | | | | | | | | | | | | | | |
Securities available-for-sale: | | | | | | | | | | | | | | | | | | | | | | | | | | | | | | | | |
U.S. Treasury | | $ | 61,521 | | | $ | - | | | $ | - | | | $ | 61,521 | | | $ | - | | | $ | - | | | $ | - | | | $ | - | |
U.S. Agencies | | | - | | | | 10,034 | | | | - | | | | 10,034 | | | | - | | | | 10,426 | | | | - | | | | 10,426 | |
Collateralized mortgage obligations | | | - | | | | 356,000 | | | | - | | | | 356,000 | | | | - | | | | 451,721 | | | | - | | | | 451,721 | |
Residential mortgage- backed securities | | | - | | | | 1,189,213 | | | | - | | | | 1,189,213 | | | | - | | | | 1,247,031 | | | | - | | | | 1,247,031 | |
State and municipal | | | - | | | | 166,197 | | | | - | | | | 166,197 | | | | - | | | | 172,108 | | | | - | | | | 172,108 | |
Foreign sovereign debt | | | - | | | | 500 | | | | - | | | | 500 | | | | - | | | | 500 | | | | - | | | | 500 | |
| | | | | | | | | | | | | | | | | | | | | | | | | | | | | | | | |
Total securities available-for-sale | | | 61,521 | | | | 1,721,944 | | | | - | | | | 1,783,465 | | | | - | | | | 1,881,786 | | | | - | | | | 1,881,786 | |
Mortgage loans held for sale | | | - | | | | 32,049 | | | | - | | | | 32,049 | | | | - | | | | - | | | | - | | | | - | |
Capital markets derivative assets(1) | | | - | | | | 100,849 | | | | 827 | | | | 101,676 | | | | - | | | | 95,596 | | | | 4,654 | | | | 100,250 | |
Other assets(2) | | | - | | | | 759 | | | | - | | | | 759 | | | | - | | | | 250 | | | | - | | | | 250 | |
| | | | | | | | | | | | | | | | | | | | | | | | | | | | | | | | |
Total assets | | $ | 61,521 | | | $ | 1,855,601 | | | $ | 827 | | | $ | 1,917,949 | | | $ | - | | | $ | 1,977,632 | | | $ | 4,654 | | | $ | 1,982,286 | |
| | | | | | | | | | | | | | | | | | | | | | | | | | | | | | | | |
| | | | | | | | |
Liabilities: | | | | | | | | | | | | | | | | | | | | | | | | | | | | | | | | |
Capital markets derivative liabilities(1) | | $ | - | | | $ | 104,108 | | | $ | 32 | | | $ | 104,140 | | | $ | - | | | $ | 102,009 | | | $ | 9 | | | $ | 102,018 | |
Other liabilities(2) | | | - | | | | 709 | | | | - | | | | 709 | | | | - | | | | 280 | | | | - | | | | 280 | |
| | | | | | | | | | | | | | | | | | | | | | | | | | | | | | | | |
Total liabilities | | $ | - | | | $ | 104,817 | | | $ | 32 | | | $ | 104,849 | | | $ | - | | | $ | 102,289 | | | $ | 9 | | | $ | 102,298 | |
| | | | | | | | | | | | | | | | | | | | | | | | | | | | | | | | |
| | (1) | Capital markets derivative assets and derivative liabilities include client-related derivatives. |
| | (2) | Other assets and other liabilities include derivatives designated in hedging relationships, derivatives for commitments to fund certain mortgage loans held for sale and end-user foreign exchange derivatives. |
If a change in valuation techniques or input assumptions for an asset or liability occurred between periods, we would consider whether this would result in a transfer between the three levels of the fair value hierarchy. There have been no significant transfers of assets or liabilities between level 1 and level 2 of the valuation hierarchy between December 31, 2010 and December 31, 2011.
Other than electing the fair value option for mortgage loans held for sale, there have been no other changes in the valuation techniques and related inputs we used for assets and liabilities measured at fair value on a recurring basis from December 31, 2010 to December 31, 2011.
138
Reconciliation of Beginning and Ending Fair Value For Those
Fair Value Measurements Using Significant Unobservable Inputs (Level 3)
(Amounts in thousands)
| | | | | | | | | | | | | | | | | | | | |
| | | December 31, 2011 | | | December 31, 2010 | |
| | | Derivative
Assets | | | Derivative
(Liabilities) | | | State and
Municipal
Securities
Available-
For-Sale | | | Derivative
Assets | | | Derivative
(Liabilities) | |
Balance at beginning of year | | $ | 4,654 | | | $ | (9) | | | $ | 3,615 | | | $ | 1,468 | | | $ | (101) | |
Total gains (losses): | | | | | | | | | | | | | | | | | | | | |
Included in earnings(1) | | | (163) | | | | 377 | | |
| -
|
| | | 2,436 | | | | 170 | |
Included in other comprehensive income | | | - | | |
| -
|
| |
| -
|
| | | - | | | | - | |
Purchases, issuances, sales and settlements: | | | | | | | | | | | | | | | | | | | | |
Purchases | | | - | | |
| -
|
| | | - | | | | - | | | | - | |
Issuances | | | 42 | | | | (30) | | | | - | | | | - | | | | (78) | |
Sales | |
| -
|
| |
| -
|
| | | (3,615) | | | | - | | | | - | |
Settlements | | | (3,490) | | | | (370) | | | | - | | | | (3,819) | | | | - | |
Level 3 transfers (out) in | | | (216) | | |
| -
|
| | | - | | | | 4,569 | | | | - | |
| | | | | | | | | | | | | | | | | | | | |
Balance at end of year | | $ | 827 | | | $ | (32) | | | $ | - | | | $ | 4,654 | | | $ | (9) | |
| | | | | | | | | | | | | | | | | | | | |
Change in unrealized gains (losses) in earnings relating to assets and liabilities still held at end of year | | $ | (304) | | | $ | (377) | | | $ | - | | | $ | 2,391 | | | $ | (165) | |
| | | | | | | | | | | | | | | | | | | | |
| | (1) | Amounts disclosed in this line are included in capital markets products income in the Consolidated Statements of Income. |
During the years ended December 31, 2011 and 2010, respectively, $845,000 and $8.9 million of derivative assets were transferred from level 2 to level 3 of the valuation hierarchy due to a lack of observable market data, as there was deterioration in the credit risk of the derivative counterparty. Also, during the years ended December 31, 2011 and 2010, respectively, $1.1 million and $4.3 million of derivative assets were transferred from level 3 to level 2 of the valuation hierarchy due to an improvement in the credit risk of the counterparty. We recognize transfers in and transfers out at the end of each quarterly reporting period.
Financial Instruments Recorded Using the Fair Value Option
Difference Between Aggregate Fair Value and Aggregate Remaining Principal Balance
for Mortgage Loans Held For Sale Elected to be Carried at Fair Value
(Amounts in thousands)
| | | | | | | | | | | | |
| | | December 31, 2011 | |
| | | Aggregate Fair
Value | | | Difference | | | Aggregate Unpaid
Principal Balance | |
Mortgage loans held for sale(1) | | $ | 32,049 | | | $ | 120 | | | $ | 31,929 | |
|
(1) The change in fair value is reflected in mortgage banking non-interest income. | |
As of December 31, 2011, none of the mortgage loans held for sale were nonaccrual loans or 90 days or more past due and still accruing interest. Changes in fair value due to instrument-specific credit risk for the year ended December 31, 2011 were not material.
139
Assets and Liabilities Measured at Fair Value on a Nonrecurring Basis
The following table provides the fair value for each major category of assets measured at fair value at December 31, 2011 and 2010 on a nonrecurring basis. All fair value measurements on a nonrecurring basis were measured using level 3 of the valuation hierarchy.
Fair Value Measurements on a Nonrecurring Basis
(Amounts in thousands)
| | | $000,000,000 | | | | $000,000,000 | |
| | | December 31, | |
| | | 2011 | | | 2010 | |
Loans held for sale | | $ | - | | | $ | 30,758 | |
Collateral-dependent impaired loans, net of reserve for loan losses | | | 223,640 | | | | 328,492 | |
Covered assets - foreclosed real estate | | | 30,342 | | | | 32,155 | |
OREO | | | 125,729 | | | | 88,728 | |
| | | | | | | | |
Total assets | | $ | 379,711 | | | $ | 480,133 | |
| | | | | | | | |
Collateral-Dependent Impaired Loans
(Amounts in thousands)
| | | $000,000,000 | | | | $000,000,000 | |
| | | December 31, | |
| | | 2011 | | | 2010 | |
Carrying value | | $ | 291,086 | | | $ | 398,015 | |
Specific reserves(1) | | | (67,446) | | | | (69,523) | |
| | | | | | | | |
Fair value | | $ | 223,640 | | | $ | 328,492 | |
| | | | | | | | |
| | $000,000,000 | | $000,000,000 |
|
(1) Excludes specific reserves on non-collateral dependent impaired loans. |
There have been no changes in the valuation techniques and related inputs we used for assets and liabilities measured at fair value on a nonrecurring basis from December 31, 2010 to December 31, 2011 other than the previously discussed election of the fair value option for mortgage loans held for sale effective August 1, 2011. Accordingly, mortgage loans held for sale are reported in the fair value measurements on a recurring basis tables.
Estimated Fair Value of Certain Financial Instruments
U.S. GAAP requires disclosure of the estimated fair values of certain financial instruments, both assets and liabilities, on and off-balance sheet, for which it is practical to estimate the fair value. Because the estimated fair values provided herein exclude disclosure of the fair value of certain other financial instruments and all non-financial instruments, any aggregation of the estimated fair value amounts presented would not represent total underlying value. Examples of non-financial instruments having significant value include the future earnings potential of significant customer relationships and the value of Trust and Investments’ operations and other fee-generating businesses. In addition, other significant assets including property, plant, and equipment and goodwill are not considered financial instruments and, therefore, have not been valued.
Various methodologies and assumptions have been utilized in management’s determination of the estimated fair value of our financial instruments, which are detailed below. The fair value estimates are made at a discrete point in time based on relevant market information. Because no market exists for a significant portion of these financial instruments, fair value estimates are based on judgments regarding future expected economic conditions, loss experience, and risk characteristics of the financial instruments. These estimates are subjective, involve uncertainties, and cannot be determined with precision. Changes in assumptions could significantly affect the estimates.
In addition to the valuation methodology explained above for financial instruments recorded at fair value, the following methods and assumptions were used in estimating the fair value of financial instruments that are carried at cost in the Consolidated Statements of Financial Condition.
Short-term financial assets and liabilities –For financial instruments with a shorter-term or with no stated maturity, prevailing market rates, and limited credit risk, the carrying amounts approximate fair value. Those financial instruments include cash and due from banks, federal funds sold and other short-term investments, accrued interest receivable, and accrued interest payable.
140
Securities held-to-maturity –The fair value of securities held-to-maturity is based on quoted market prices or dealer quotes. If a quoted market price is not available, fair value is estimated using quoted market prices for similar securities.
Non-marketable equity investments – Non-marketable equity investments include FHLB stock and other various equity securities. The carrying value of FHLB stock approximates fair value as the stock is non-marketable, but can only be sold to the FHLB or another member institution at par. The carrying value of all other equity investments approximates fair value.
Loans– The fair value of loans is calculated by discounting scheduled cash flows through the estimated maturity using estimated market discount rates that reflect the credit and interest rate risk inherent in the loan. The estimate of maturity is based on contractual terms and includes assumptions that reflect our and the industry’s historical experience with repayments for each loan classification. The estimation is modified, as required, by the effect of current economic and lending conditions, collateral, and other factors.
Covered assets –Covered assets include the acquired loans and foreclosed loan collateral (including the fair value of expected reimbursements from the FDIC). The fair value of covered assets is calculated by discounting expected cash flows through the estimated maturity using estimated market discount rates that reflect the credit and interest rate risk inherent in the asset. The estimate of maturity is based on contractual terms and includes assumptions that reflect our and the industry’s historical experience with repayments for each asset classification. The estimate is modified, as required, by the effect of current economic and lending conditions, collateral, and other factors.
Investment in BOLI – The fair value of our investment in BOLI is equal to its cash surrender value.
Deposit liabilities – The fair values disclosed for noninterest-bearing demand deposits, savings deposits, interest-bearing deposits, and money market deposits are equal to the amount payable on demand at the reporting date (i.e., their carrying amounts). The fair value for certificates of deposit and brokered deposits were estimated using present value techniques by discounting the future cash flows. The discount rate is estimated using the rates currently offered for deposits of similar remaining maturities.
Short-term borrowings – The fair value of repurchase agreements and FHLB advances with the remaining maturities of one year or less is estimated by discounting the obligations using the rates currently offered for repurchase agreements or borrowings of similar remaining maturities. The carrying amounts of funds purchased and other borrowed funds approximate their fair value due to their short-term nature.
Long-term debt– The fair value of subordinated debt, FHLB advances with remaining maturities greater than one year, and the junior subordinated debentures are estimated by discounting future cash flows using current interest rates for similar financial instruments.
Commitments – Given the limited interest rate exposure posed by the commitments outstanding at period-end due to their variable rate structure, termination clauses provided in the agreements, and the market rate of fees charged, we have deemed the fair value of commitments outstanding to be immaterial.
141
Financial Instruments
(Amounts in thousands)
| | | | | | | | | | | | | | | | |
| | | As of | |
| | | December 31, 2011 | | | December 31, 2010 | |
| | | Carrying
Amount | | | Estimated
Fair Value | | | Carrying
Amount | | | Estimated
Fair Value | |
Financial Assets: | | | | | | | | | | | | | | | | |
Cash and due from banks | | $ | 156,131 | | | $ | 156,131 | | | $ | 112,772 | | | $ | 112,772 | |
Federal funds sold and other short-term investments | | | 205,610 | | | | 205,610 | | | | 541,316 | | | | 541,316 | |
Loans held for sale | | | 32,049 | | | | 32,049 | | | | 30,758 | | | | 30,758 | |
Securities available-for-sale | | | 1,783,465 | | | | 1,783,465 | | | | 1,881,786 | | | | 1,881,786 | |
Securities held-to-maturity | | | 490,143 | | | | 493,230 | | | | - | | | | - | |
Non-marketable equity investments | | | 43,604 | | | | 43,604 | | | | 23,537 | | | | 23,537 | |
Loans, net of allowance for loan losses and unearned fees | | | 8,816,967 | | | | 8,465,358 | | | | 8,891,536 | | | | 8,535,266 | |
Covered assets, net of allowance for covered loan losses | | | 280,868 | | | | 306,976 | | | | 381,876 | | | | 400,783 | |
Accrued interest receivable | | | 35,732 | | | | 35,732 | | | | 33,854 | | | | 33,854 | |
Investment in BOLI | | | 50,966 | | | | 50,966 | | | | 49,408 | | | | 49,408 | |
Capital markets derivative assets | | | 101,676 | | | | 101,676 | | | | 100,250 | | | | 100,250 | |
Financial Liabilities: | | | | | | | | | | | | | | | | |
Deposits | | $ | 10,392,854 | | | $ | 10,405,158 | | | $ | 10,535,429 | | | $ | 10,549,930 | |
Short-term borrowings | | | 156,000 | | | | 156,047 | | | | 118,561 | | | | 120,522 | |
Long-term debt | | | 379,793 | | | | 343,121 | | | | 414,793 | | | | 414,340 | |
Accrued interest payable | | | 5,567 | | | | 5,567 | | | | 5,968 | | | | 5,968 | |
Capital markets derivative liabilities | | | 104,140 | | | | 104,140 | | | | 102,018 | | | | 102,018 | |
We have three primary operating segments: Banking and Trust and Investments, each of which are delineated by the products and services that each segment offers, and the Holding Company. The Banking operating segment includes commercial and personal banking services, which includes mortgage originations. Commercial banking services are primarily provided to corporations and other business clients and include a wide array of lending and cash management products. Personal banking services offered to individuals, professionals, and entrepreneurs include direct lending and depository services. The Trust and Investments segment includes certain activities of our PrivateWealth group, including investment management, investment advisory, personal trust and estate administration, custodial and escrow, retirement account administration, and brokerage services. The activities of the third operating segment, the Holding Company, include the direct and indirect ownership of our banking and nonbanking subsidiaries, the issuance of debt and intersegment eliminations.
The accounting policies of the individual operating segments are the same as those of the Company as described in Note 1. Transactions between operating segments are primarily conducted at fair value, resulting in profits that are eliminated from consolidated results of operations. Financial results for each segment are presented below. For segment reporting purposes, the statement of financial condition of Trust and Investments is included with the Banking segment.
142
Operating Segments Performance
(Amounts in thousands)
| | | | | | | | | | | | | | | | |
| Year Ended December 31, | | Banking | | | Trust and
Investments | | | Holding
Company
and Other
Adjustments (1) | | | Consolidated | |
2011 | | | | | | | | | | | | | | | | |
Net interest income (loss) | | $ | 423,657 | | | $ | 2,466 | | | $ | (18,996) | | | $ | 407,127 | |
Provision for loan and covered loan losses | | | 132,897 | | | | - | | | | - | | | | 132,897 | |
Non-interest income | | | 79,990 | | | | 18,130 | | | | 127 | | | | 98,247 | |
Non-interest expense | | | 258,578 | | | | 19,203 | | | | 24,496 | | | | 302,277 | |
| | | | | | | | | | | | | | | | |
Income (loss) before taxes | | | 112,172 | | | | 1,393 | | | | (43,365) | | | | 70,200 | |
Income tax provision (benefit) | | | 40,263 | | | | 555 | | | | (15,158) | | | | 25,660 | |
| | | | | | | | | | | | | | | | |
Net income (loss) | | | 71,909 | | | | 838 | | | | (28,207) | | | | 44,540 | |
Noncontrolling interest expense | | | - | | | | 170 | | | | - | | | | 170 | |
| | | | | | | | | | | | | | | | |
Net income (loss) attributable to controlling interests | | $ | 71,909 | | | $ | 668 | | | $ | (28,207) | | | $ | 44,370 | |
| | | | | | | | | | | | | | | | |
Assets | | $ | 11,034,516 | | | $ | - | | | $ | 1,382,354 | | | $ | 12,416,870 | |
Total loans | | | 9,008,561 | | | | - | | | | - | | | | 9,008,561 | |
Deposits | | | 10,542,517 | | | | - | | | | (149,663) | | | | 10,392,854 | |
| | | | |
2010 | | | | | | | | | | | | | | | | |
Net interest income | | $ | 420,609 | | | $ | 2,622 | | | $ | (22,274) | | | $ | 400,957 | |
Provision for loan and covered loan losses | | | 194,541 | | | | - | | | | - | | | | 194,541 | |
Non-interest income | | | 74,954 | | | | 18,127 | | | | 165 | | | | 93,246 | |
Non-interest expense | | | 249,749 | | | | 20,317 | | | | 29,532 | | | | 299,598 | |
| | | | | | | | | | | | | | | | |
Income (loss) before taxes | | | 51,273 | | | | 432 | | | | (51,641) | | | | 64 | |
Income tax provision (benefit) | | | 17,585 | | | | 168 | | | | (19,490) | | | | (1,737) | |
| | | | | | | | | | | | | | | | |
Net income (loss) | | | 33,688 | | | | 264 | | | | (32,151) | | | | 1,801 | |
Noncontrolling interest expense | | | - | | | | 284 | | | | - | | | | 284 | |
| | | | | | | | | | | | | | | | |
Net income (loss) attributable to controlling interests | | $ | 33,688 | | | $ | (20) | | | $ | (32,151) | | | $ | 1,517 | |
| | | | | | | | | | | | | | | | |
Assets | | $ | 11,180,923 | | | $ | - | | | $ | 1,284,698 | | | $ | 12,465,621 | |
Total loans | | | 9,114,357 | | | | - | | | | - | | | | 9,114,357 | |
Deposits | | | 10,720,500 | | | | - | | | | (185,071) | | | | 10,535,429 | |
| | | | |
2009 | | | | | | | | | | | | | | | | |
Net interest income | | $ | 347,121 | | | $ | 2,824 | | | $ | (24,961) | | | $ | 324,984 | |
Provision for loan and covered loan losses | | | 199,419 | | | | - | | | | - | | | | 199,419 | |
Non-interest income | | | 56,475 | | | | 14,775 | | | | 220 | | | | 71,470 | |
Non-interest expense | | | 199,077 | | | | 15,516�� | | | | 32,822 | | | | 247,415 | |
| | | | | | | | | | | | | | | | |
Income (loss) before taxes | | | 5,100 | | | | 2,083 | | | | (57,563) | | | | (50,380) | |
Income tax provision (benefit) | | | 251 | | | | 809 | | | | (21,624) | | | | (20,564) | |
| | | | | | | | | | | | | | | | |
Net income (loss) | | | 4,849 | | | | 1,274 | | | | (35,939) | | | | (29,816) | |
Noncontrolling interest expense | | | - | | | | 247 | | | | - | | | | 247 | |
| | | | | | | | | | | | | | | | |
Net income (loss) attributable to controlling interests | | $ | 4,849 | | | $ | 1,027 | | | $ | (35,939) | | | $ | (30,063) | |
| | | | | | | | | | | | | | | | |
Assets | | $ | 10,782,845 | | | $ | - | | | $ | 1,249,739 | | | $ | 12,032,584 | |
Total loans | | | 9,046,625 | | | | - | | | | - | | | | 9,046,625 | |
Deposits | | | 10,130,346 | | | | - | | | | (238,432) | | | | 9,891,914 | |
| (1) | Deposit amounts represent the elimination of Holding Company cash accounts included in total deposits of the Banking segment. |
143
| 22. | VARIABLE INTEREST ENTITIES |
As discussed in Note 12, we sponsor and wholly own 100% of the common equity of four trusts that were formed for the purpose of issuing trust preferred securities to third-party investors and investing the proceeds from the sale of the trust preferred securities solely in debentures issued by the Company. The trusts’ only assets as of December 31, 2011 were the $244.8 million principal balance of the debentures and the related interest receivable. The trusts meet the definition of a VIE, but the Company is not the primary beneficiary of the trusts and accordingly, the trusts are not consolidated in our financial statements.
We hold certain investments in funds that make investments in accordance with the provisions of the Community Reinvestment Act. Such investments have a carrying amount of $2.6 million at December 31, 2011 and are included within non-marketable equity investments in our Consolidated Statements of Financial Condition. The investments meet the definition of a VIE, but the Company is not the primary beneficiary as we are a limited investor in those investment funds and do not have the power over their investment activities. Accordingly, we will continue to account for our interests in these investments using the cost or equity method. Our maximum exposure to loss is limited to the carrying amount plus additional required future capital contributions of $1.6 million as of December 31, 2011.
| 23. | CONDENSED PARENT COMPANY FINANCIAL STATEMENTS |
The following represents the condensed financial statements of PrivateBancorp, Inc., the parent company.
Statements of Financial Condition
(Parent Company only)
(Amounts in thousands)
| | | | | | | | |
| | | December 31, | |
| | | 2011 | | | 2010 | |
Assets | | | | | | | | |
Cash and interest-bearing deposits | | $ | 149,662 | | | $ | 185,071 | |
Investment in and advances to subsidiaries | | | 1,357,850 | | | | 1,260,112 | |
Other assets | | | 39,251 | | | | 33,543 | |
| | | | | | | | |
Total assets | | $ | 1,546,763 | | | $ | 1,478,726 | |
| | | | | | | | |
Liabilities and Equity | | | | | | | | |
Long-term debt | | $ | 244,793 | | | $ | 244,793 | |
Accrued expenses and other liabilities | | | 5,218 | | | | 6,056 | |
Equity | | | 1,296,752 | | | | 1,227,877 | |
| | | | | | | | |
Total liabilities and equity | | $ | 1,546,763 | | | $ | 1,478,726 | |
| | | | | | | | |
144
Statements of Income
(Parent Company only)
(Amounts in thousands)
| | | | | | | | | | | | |
| | | Years ended December 31, | |
| | | 2011 | | | 2010 | | | 2009 | |
Income | | | | | | | | | | | | |
Interest income | | $ | 19 | | | $ | 46 | | | $ | 44 | |
Securities transactions and other income | | | 125 | | | | 165 | | | | 220 | |
| | | | | | | | | | | | |
Total income | | | 144 | | | | 211 | | | | 264 | |
| | | | | | | | | | | | |
Expenses | | | | | | | | | | | | |
Interest expense | | | 16,532 | | | | 19,652 | | | | 22,128 | |
Salaries and other employee benefits | | | 18,081 | | | | 21,314 | | | | 23,462 | |
Other expenses | | | 6,415 | | | | 8,218 | | | | 9,360 | |
| | | | | | | | | | | | |
Total expenses | | | 41,028 | | | | 49,184 | | | | 54,950 | |
| | | | | | | | | | | | |
Loss before income taxes and equity in undistributed income of subsidiaries | | | (40,884) | | | | (48,973) | | | | (54,686) | |
Income tax benefit | | | 14,169 | | | | 18,453 | | | | 20,459 | |
| | | | | | | | | | | | |
Loss before undistributed income of subsidiaries | | | (26,715) | | | | (30,520) | | | | (34,227) | |
Equity in undistributed income of subsidiaries | | | 71,255 | | | | 32,321 | | | | 4,411 | |
| | | | | | | | | | | | |
Net income (loss) | | | 44,540 | | | | 1,801 | | | | (29,816) | |
Net income attributable to noncontrolling interests | | | 170 | | | | 284 | | | | 247 | |
| | | | | | | | | | | | |
Net income (loss) attributable to controlling interests | | | 44,370 | | | | 1,517 | | | | (30,063) | |
Preferred stock dividend | | | 13,690 | | | | 13,607 | | | | 12,443 | |
| | | | | | | | | | | | |
Net gain (loss) available to common stockholders | | $ | 30,680 | | | $ | (12,090) | | | $ | (42,506) | |
| | | | | | | | | | | | |
145
Statements of Cash Flows
(Parent Company only)
(Amounts in thousands)
| | | | | | | | | | | | |
| | | Years ended December 31, | |
| | | 2011 | | | 2010 | | | 2009 | |
Operating Activities | | | | | | | | | | | | |
Net income (loss) | | $ | 44,540 | | | $ | 1,801 | | | $ | (29,816) | |
Adjustments to reconcile net income to net cash provided by operating activities: | | | | | | | | | | | | |
Equity in undistributed income from subsidiaries | | | (71,255) | | | | (32,321) | | | | (4,411) | |
Share-based compensation expense | | | 15,756 | | | | 17,102 | | | | 20,696 | |
Depreciation of premises, furniture and equipment | | | 306 | | | | 326 | | | | 335 | |
Net (increase) decrease in other assets | | | (6,014) | | | | (5,023) | | | | 15,646 | |
Net decrease in other liabilities | | | (746) | | | | (1,624) | | | | (1,686) | |
| | | | | | | | | | | | |
Net cash (used in) provided by operating activities | | | (17,413) | | | | (19,739) | | | | 764 | |
| | | | | | | | | | | | |
Investing Activities | | | | | | | | | | | | |
Net capital investments in bank subsidiaries | | | - | | | | (15,000) | | | | (281,000) | |
| | | | | | | | | | | | |
Net cash used in investing activities | | | - | | | | (15,000) | | | | (281,000) | |
| | | | | | | | | | | | |
Financing Activities | | | | | | | | | | | | |
Repayment of debt | | | - | | | | - | | | | (135,000) | |
Proceeds from the issuance of preferred stock and common stock warrant | | | - | | | | - | | | | 243,815 | |
Proceeds from (payments for) the issuance of common stock | | | 31 | | | | (178) | | | | 409,655 | |
Stock repurchased in connection with benefit plans | | | (1,400) | | | | (1,565) | | | | (1,204) | |
Cash dividends paid | | | (15,128) | | | | (15,122) | | | | (11,628) | |
Exercise of stock options and restricted share activity | | | 1,139 | | | | 1,807 | | | | 1,126 | |
Shortfall tax benefit from exercise of stock options and release of restricted share activity | | | (2,638) | | | | (3,564) | | | | (1,135) | |
| | | | | | | | | | | | |
Net cash (used in) provided by financing activities | | | (17,996) | | | | (18,622) | | | | 505,629 | |
| | | | | | | | | | | | |
Net (decrease) increase in cash and cash equivalents | | | (35,409) | | | | (53,361) | | | | 225,393 | |
Cash and cash equivalents at beginning of year | | | 185,071 | | | | 238,432 | | | | 13,039 | |
| | | | | | | | | | | | |
Cash and cash equivalents at end of year | | $ | 149,662 | | | $ | 185,071 | | | $ | 238,432 | |
| | | | | | | | | | | | |
146
| 24. | QUARTERLY EARNINGS PERFORMANCE (UNAUDITED) |
Quarterly Earnings Performance(1)
(Dollars in thousands, except per share data)
| | | | | | | | | | | | | | | | | | | | | | | | | | | | | | | | |
| | | 2011 | | | 2010 | |
| | | | | | | | |
| | | Fourth | | | Third | | | Second | | | First | | | Fourth | | | Third | | | Second | | | First | |
| | | | | | | | |
Interest income | | $ | 119,648 | | | $ | 118,894 | | | $ | 119,745 | | | $ | 122,859 | | | $ | 122,838 | | | $ | 124,641 | | | $ | 131,672 | | | $ | 128,774 | |
| | | | | | | | |
Interest expense | | | 16,666 | | | | 17,805 | | | | 19,242 | | | | 20,306 | | | | 22,491 | | | | 25,682 | | | | 28,340 | | | | 30,455 | |
| | | | | | | | |
Net interest income | | | 102,982 | | | | 101,089 | | | | 100,503 | | | | 102,553 | | | | 100,347 | | | | 98,959 | | | | 103,332 | | | | 98,319 | |
| | | | | | | | |
Provision for loan and covered loan losses | | | 31,611 | | | | 32,615 | | | | 31,093 | | | | 37,578 | | | | 35,166 | | | | 41,435 | | | | 45,392 | | | | 72,548 | |
| | | | | | | | |
Fee revenue | | | 25,029 | | | | 23,265 | | | | 20,922 | | | | 23,260 | | | | 25,556 | | | | 20,331 | | | | 20,138 | | | | 15,039 | |
| | | | | | | | |
Net securities gains (losses) | | | 364 | | | | 4,370 | | | | 670 | | | | 367 | | | | 9,309 | | | | 3,029 | | | | (185) | | | | 29 | |
| | | | | | | | |
Non-interest expense | | | 76,230 | | | | 75,034 | | | | 75,664 | | | | 75,349 | | | | 82,148 | | | | 68,077 | | | | 76,002 | | | | 73,371 | |
| | | | | | | | |
Income (loss) before income taxes | | | 20,534 | | | | 21,075 | | | | 15,338 | | | | 13,253 | | | | 17,898 | | | | 12,807 | | | | 1,891 | | | | (32,532) | |
| | | | | | | | |
Income tax provision (benefit) | | | 9,468 | | | | 7,593 | | | | 6,320 | | | | 2,279 | | | | 5,919 | | | | 4,786 | | | | (766) | | | | (11,676) | |
| | | | | | | | |
Net income (loss) | | | 11,066 | | | | 13,482 | | | | 9,018 | | | | 10,974 | | | | 11,979 | | | | 8,021 | | | | 2,657 | | | | (20,856) | |
| | | | | | | | |
Net income attributable to noncontrolling interests | | | 7 | | | | 33 | | | | 58 | | | | 72 | | | | 67 | | | | 71 | | | | 76 | | | | 70 | |
| | | | | | | | |
Net income (loss) attributable to controlling interests | | | 11,059 | | | | 13,449 | | | | 8,960 | | | | 10,902 | | | | 11,912 | | | | 7,950 | | | | 2,581 | | | | (20,926) | |
| | | | | | | | |
Preferred stock dividends and discount accretion | | | 3,430 | | | | 3,426 | | | | 3,419 | | | | 3,415 | | | | 3,409 | | | | 3,405 | | | | 3,399 | | | | 3,394 | |
| | | | | | | | |
Net income (loss) available to common stockholders | | $ | 7,629 | | | $ | 10,023 | | | $ | 5,541 | | | $ | 7,487 | | | $ | 8,503 | | | $ | 4,545 | | | $ | (818) | | | $ | (24,320) | |
| |
| | | | | | | | |
Basic earnings per share | | $ | 0.11 | | | $ | 0.14 | | | $ | 0.08 | | | $ | 0.10 | | | $ | 0.12 | | | $ | 0.06 | | | $ | (0.01) | | | $ | (0.35) | |
| | | | | | | | |
Diluted earnings per share | | $ | 0.11 | | | $ | 0.14 | | | $ | 0.08 | | | $ | 0.10 | | | $ | 0.12 | | | $ | 0.06 | | | $ | (0.01) | | | $ | (0.35) | |
| |
| | | | | | | | |
Return on average common equity | | | 2.86% | | | | 3.80% | | | | 2.18% | | | | 3.03% | | | | 3.31% | | | | 1.77% | | | | -0.33% | | | | -9.86% | |
| | | | | | | | |
Return on average assets | | | 0.36% | | | | 0.44% | | | | 0.29% | | | | 0.35% | | | | 0.38% | | | | 0.25% | | | | 0.08% | | | | -0.68% | |
| | | | | | | | |
Net interest margin – tax- equivalent | | | 3.48% | | | | 3.49% | | | | 3.36% | | | | 3.46% | | | | 3.33% | | | | 3.28% | | | | 3.39% | | | | 3.33% | |
| |
| | (1) | All ratios are presented on an annualized basis. |
147
ITEM 9. CHANGES IN AND DISAGREEMENTS WITH ACCOUNTANTS ON
ACCOUNTING AND FINANCIAL DISCLOSURE
Not applicable.
ITEM 9A. CONTROLS AND PROCEDURES
As of the end of the period covered by this report (the “Evaluation Date”), the Company carried out an evaluation, under the supervision and with the participation of the Company’s management, including the Company’s Chief Executive Officer and its Chief Financial Officer, of the effectiveness of the design and operation of the Company’s disclosure controls and procedures pursuant to Rule 13a-15 and 15d-15 of the Securities Exchange Act of 1934 (the “Exchange Act”). Based on that evaluation, the Chief Executive Officer and Chief Financial Officer concluded that as of the Evaluation Date, the Company’s disclosure controls and procedures are effective to ensure that information required to be disclosed by the Company in reports that it files or submits under the Exchange Act is recorded, processed, summarized, and reported within the time periods specified in Securities and Exchange Commission rules and forms. There were no changes in the Company’s internal control over financial reporting during the quarter ended December 31, 2011 that have materially affected, or are reasonably likely to materially affect, the Company’s internal control over financial reporting.
Management’s Report On Internal Control Over Financial Reporting
Management of the Company is responsible for establishing and maintaining effective internal control over financial reporting as defined in Rules 13a-15(f) and 15d-15(f) under the Exchange Act. The Company’s internal control over financial reporting is designed to provide reasonable assurance to the Company’s management and board of directors regarding the preparation and fair presentation of published financial statements.
Management, including our Chief Executive Officer and Chief Financial Officer, assessed the effectiveness of the Company’s internal control over financial reporting as of December 31, 2011. In making this assessment, management used the criteria set forth in “Internal Control – Integrated Framework” issued by the Committee of Sponsoring Organizations of the Treadway Commission. Based on this assessment, management has determined that the Company’s internal control over financial reporting as of December 31, 2011 was effective based on the specified criteria.
Ernst & Young LLP, the independent registered public accounting firm that audited the Company’s consolidated financial statements included in this Annual Report on Form 10-K, has issued an attestation report on the effectiveness of the Company’s internal control over financial reporting as of December 31, 2011. That report, which expresses an unqualified opinion on the Company’s internal control over financial reporting as of December 31, 2011, is included in this Item under the heading “Attestation Report of Independent Registered Public Accounting Firm.”
Attestation Report of Independent Registered Public Accounting Firm
Report of Independent Registered Public Accounting Firm
The Board of Directors and Shareholders of PrivateBancorp, Inc.
We have audited PrivateBancorp, Inc.’s and subsidiaries’ internal control over financial reporting as of December 31, 2011, based on criteria established in Internal Control—Integrated Framework issued by the Committee of Sponsoring Organizations of the Treadway Commission (the COSO criteria). PrivateBancorp, Inc. and subsidiaries’ management is responsible for maintaining effective internal control over financial reporting, and for its assessment of the effectiveness of internal control over financial reporting included in the accompanying Management’s Report on Internal Control Over Financial Reporting. Our responsibility is to express an opinion on the company’s internal control over financial reporting based on our audit.
We conducted our audit in accordance with the standards of the Public Company Accounting Oversight Board (United States). Those standards require that we plan and perform the audit to obtain reasonable assurance about whether effective internal control over financial reporting was maintained in all material respects. Our audit included obtaining an understanding of internal control over financial reporting, assessing the risk that a material weakness exists, testing and evaluating the design and operating effectiveness of internal control based on the assessed risk, and performing such other procedures as we considered necessary in the circumstances. We believe that our audit provides a reasonable basis for our opinion.
148
A company’s internal control over financial reporting is a process designed to provide reasonable assurance regarding the reliability of financial reporting and the preparation of financial statements for external purposes in accordance with generally accepted accounting principles. A company’s internal control over financial reporting includes those policies and procedures that (1) pertain to the maintenance of records that, in reasonable detail, accurately and fairly reflect the transactions and dispositions of the assets of the company; (2) provide reasonable assurance that transactions are recorded as necessary to permit preparation of financial statements in accordance with generally accepted accounting principles, and that receipts and expenditures of the company are being made only in accordance with authorizations of management and directors of the company; and (3) provide reasonable assurance regarding prevention or timely detection of unauthorized acquisition, use or disposition of the company’s assets that could have a material effect on the financial statements.
Because of its inherent limitations, internal control over financial reporting may not prevent or detect misstatements. Also, projections of any evaluation of effectiveness to future periods are subject to the risk that controls may become inadequate because of changes in conditions, or that the degree of compliance with the policies or procedures may deteriorate.
In our opinion, PrivateBancorp, Inc. and subsidiaries maintained, in all material respects, effective internal control over financial reporting as of December 31, 2011, based on the COSO criteria.
We also have audited, in accordance with the standards of the Public Company Accounting Oversight Board (United States), the consolidated statements of financial condition of PrivateBancorp, Inc. and subsidiaries as of December 31, 2011 and December 31, 2010, and the related consolidated statements of income, changes in stockholders’ equity, and cash flows for each of the three years in the period ended December 31, 2011 of PrivateBancorp, Inc. and our report dated February 27, 2012 expressed an unqualified opinion thereon.
/S/ ERNST & YOUNG LLP
Chicago, Illinois
February 27, 2012
149
ITEM 9B. OTHER INFORMATION
None.
PART III
ITEM 10. DIRECTORS, EXECUTIVE OFFICERS, AND CORPORATE GOVERNANCE
Certain information regarding our executive officers is included under “Executive Officers” in Part 1, Item 1of this Form 10-K and the information included therein is incorporated herein by reference.
Information regarding our directors will be included in our Proxy Statement to be filed for our 2012 Annual Meeting of Stockholders (the “Proxy Statement”) under the heading “Election of Directors” and the information to be included therein is incorporated herein by reference.
Information regarding our directors’ and executive officers’ compliance with Section 16(a) of the Exchange Act will be included in the Proxy Statement under the heading “Section 16(a) Beneficial Ownership Reporting Compliance” and the information to be included therein is incorporated herein by reference.
Information regarding the Corporate Governance Committee of our Board of Directors and the procedures by which our stockholders may recommend nominees to our Board of Directors, and information regarding the Audit Committee of our Board of Directors and its “audit committee financial expert”, will be included in the Proxy Statement under the heading “Corporate Governance” and the information to be included therein is incorporated herein by reference.
We have adopted a Code of Ethics as required by the NASDAQ listing standards and the rules of the SEC. The Code of Ethics applies to all of our directors, officers, including our Chief Executive Officer and Chief Financial Officer, and employees. The Code of Ethics is publicly available on our website at www.pvtb.com or at www.theprivatebank.com. If we make substantive amendments to the Code of Ethics or grant any waiver, including any implicit waiver, that applies to any of our directors or executive officers, we will disclose the nature of such amendment or waiver on our website or in a report on Form 8-K in accordance with applicable NASDAQ and SEC rules.
ITEM 11. EXECUTIVE COMPENSATION
Information regarding compensation of our executive officers and directors is included in the Proxy Statement under the headings “Compensation Discussion and Analysis”, “Executive Compensation”, and “Director Compensation” and the information included therein is incorporated herein by reference.
The information required by this item regarding Compensation Committee Interlocks and Insider Participation is included under the heading “Executive Compensation – Compensation Committee Interlocks and Insider Participation” in the Proxy Statement, and the Compensation Committee Report is included in the Proxy Statement under the heading “Compensation Committee Report.” The information included therein is incorporated herein by reference.
ITEM 12. SECURITY OWNERSHIP OF CERTAIN BENEFICIAL OWNERS AND MANAGEMENTAND RELATED STOCKHOLDER MATTERS
Information regarding security ownership of certain beneficial owners and management is included in the Proxy Statement under the heading “Security Ownership of Certain Beneficial Owners, Directors and Executive Officers” and the information included therein is incorporated herein by reference.
150
Securities Authorized for Issuance Under Equity Compensation Plans
The following table sets forth information, as of December 31, 2011, relating to our equity compensation plans pursuant to which equity awards are authorized for issuance.
| | | | | | | | | | | | |
| | | Equity Compensation Plan Information | |
| Equity Compensation Plan Category | | Number of securities
to be issued upon
exercise of
outstanding options,
warrants, and rights
(a) | | | Weighted-average
exercise price of
outstanding options,
warrants, and rights
(b) | | | Number of securities
remaining available for
future issuance under
equity compensation plans
(excluding securities
reflected in column (a))
(c) | |
Approved by security holders(1) | | | 1,833,024 | | | $ | 21.31 | | | | 4,744,632 | |
Not approved by security holders(2) | | | 1,921,745 | | | | 29.03 | | | | - | |
| | | | | | | | | | | | |
Total | | | 3,754,769 | | | $ | 25.26 | | | | 4,744,632 | |
| | | | | | | | | | | | |
| | | | |
(1) | | Includes all outstanding options and awards under our 2011 Incentive Compensation Plan, 2007 Long-Term Incentive Compensation Plan, Stock Incentive Plan, the Incentive Compensation Plan, and shares underlying deferred stock units credited under our Deferred Compensation Plan, payable on a one-for-one basis in shares of our common stock (the “Plans”). Additional information and details about the Plans are also disclosed in Note 16 of “Notes to Consolidated Financial Statements” in Item 8 of this Form 10-K. | | |
(2) | | Includes all outstanding options and awards under the Strategic Long Term Incentive Plan. Additional information and details about the Plans are also disclosed in Note 16 of “Notes to Consolidated Financial Statements” in Item 8 of this Form 10-K. | | |
ITEM 13. CERTAIN RELATIONSHIPS AND RELATED TRANSACTIONS AND DIRECTOR
INDEPENDENCE
Information regarding certain relationships and related party transactions is included in our Proxy Statement under the heading “Transactions with Related Persons” and the information included therein is incorporated herein by reference. Information regarding our directors and their independence is included in the Proxy Statement under the heading “Corporate Governance” and the information included therein is incorporated herein by reference.
ITEM 14. PRINCIPAL ACCOUNTANT FEES AND SERVICES
Information regarding the fees we paid our independent accountants, Ernst & Young LLP, during 2011 is included in the Proxy Statement under the heading “Principal Accounting Firm Fees” and the information included therein is incorporated herein by reference.
PART IV
ITEM 15. EXHIBITS AND FINANCIAL STATEMENT SCHEDULES
| | |
(a) (1) | | Financial Statements |
| |
| | The following consolidated financial statements of the Registrant and its subsidiaries are filed as a part of this document under “Item 8. FINANCIAL STATEMENTS AND SUPPLEMENTARY DATA.” |
| |
| | Report of Independent Registered Public Accounting Firm. |
| |
| | Consolidated Statements of Financial Condition as of December 31, 2011 and 2010. |
| |
| | Consolidated Statements of Income for the years ended December 31, 2011, 2010, and 2009. |
| |
| | Consolidated Statements of Changes in Equity for the years ended December 31, 2011, 2010, and 2009. |
| |
| | Consolidated Statements of Cash Flows for the years ended December 31, 2011, 2010, and 2009. |
| |
| | Notes to Consolidated Financial Statements. |
| |
(a) (2) | | Financial Statement Schedules |
151
| | |
| | All financial statement schedules for the Registrant and its subsidiaries required by Item 8 and Item 15 of this Form 10-K are omitted because of the absence of conditions under which they are required, or because the information is set forth in the consolidated financial statements or the notes thereto. |
| |
(a) (3) | | Exhibits |
| |
| | See Exhibit Index filed at the end of this report, which is incorporated herein by reference. |
SIGNATURES
Pursuant to the requirements of Section 13 or 15(d) of the Securities Exchange Act of 1934, the registrant has duly caused this report to be signed on its behalf by the undersigned, thereunto duly authorized.
PRIVATEBANCORP, INC.
Registrant
| | | | | | |
| | By: | | /S/ LARRY D. RICHMAN | | |
| | | | Larry D. Richman | | |
| | | | President and Chief Executive Officer | | |
| | | |
| | Date: | | February 27, 2012 | | |
POWER OF ATTORNEY
KNOW ALL PERSONS BY THESE PRESENTS, that each person whose signature appears below hereby constitutes and appoints Larry D. Richman and Jennifer R. Evans, and each of them, the true and lawful attorney-in-fact and agents of the undersigned, with full power of substitution and resubstitution, for and in the name, place and stead of the undersigned, to sign any and all amendments to this Annual Report on Form 10-K, and to file the same, with all exhibits thereto and other documents in connection therewith, with the Securities and Exchange Commission, and hereby grants to such attorneys-in-fact and agents, and each of them, full power and authority to do and perform each and every act and thing requisite and necessary to be done, as fully as to all intents and purposes as each of the undersigned might or could do in person, hereby ratifying and confirming all that said attorneys-in-fact and agents, or any of them, or their or his substitutes, may lawfully do or cause to be done by virtue hereof.
Pursuant to the requirements of the Securities Exchange Act of 1934, this report has been signed below by the following persons on behalf of the Registrant and in the capacities indicated on February 27, 2012.
| | | | | | |
| | Signatures | | | | Title |
| | | |
| | /S/ LARRY D. RICHMAN | | | | President, Chief Executive Officer and Director |
| | Larry D. Richman | | | | |
| | | |
| | /S/ KEVIN M. KILLIPS | | | | Chief Financial Officer, Principal Financial Officer and Principal Accounting Officer |
| | Kevin M. Killips | | | | |
| | | |
| | /S/ JAMES M. GUYETTE | | | | Chairman and Director |
| | James M. Guyette | | | | |
| | | |
| | /S/ NORMAN R. BOBINS | | | | Director |
| | Norman R. Bobins | | | | |
| | | |
| | /S/ ROBERTG F. COLEMAN | | | | Director |
| | Robert F. Coleman | | | | |
| | | |
| | /S/ RALPH B. MANDELL | | | | Director |
| | Ralph B. Mandell | | | | |
| | | |
| | /S/ CHERYL MAYBERRY MCKISSACK | | | | Director |
| | Cheryl Mayberry McKissack | | | | |
152
| | | | | | |
| | /S/ JAMES B. NICHOLSON | | | | Director |
| | James B. Nicholson | | | | |
| | | |
| | /S/ EDWARD W. RABIN | | | | Director |
| | Edward W. Rabin | | | | |
| | | |
| | /S/ COLLIN E. ROCHE | | | | Director |
| | Collin E. Roche | | | | |
| | | |
| | /S/ WILLIAM R. RYBAK | | | | Director |
| | William R. Rybak | | | | |
| | | |
| | /S/ ALEJANDRO SILVA | | | | Director |
| | Alejandro Silva | | | | |
153
EXHIBIT INDEX
| | |
Exhibit
Number | | Description of Documents |
| |
3.1 | | Amended and Restated Certificate of Incorporation of PrivateBancorp, Inc., dated June 24, 1999, as amended, is incorporated herein by reference to Exhibit 3.1 to the Quarterly Report on Form 10-Q (File No. 000-25887) filed on May 14, 2003. |
| |
3.2 | | Certificate of Amendment to the Amended and Restated Certificate of Incorporation of PrivateBancorp, Inc., as amended, dated June 17, 2009, is incorporated herein by reference to Exhibit 3.1 to the Current Report on Form 8-K (File No. 001-34066) filed on June 19, 2009. |
| |
3.3 | | Certificate of Amendment to the Amended and Restated Certificate of Incorporation of PrivateBancorp, Inc., as amended, dated June 15, 2010, is incorporated herein by reference to Exhibit 3.3 to the Quarterly Report on Form 10-Q (File No. 001-34066) filed on August 9, 2010. |
| |
3.4 | | Certificate of Amendment to the Amended and Restated Certificate of Incorporation of PrivateBancorp, Inc., as amended, dated June 17, 2009, amending and restating the Certificate of Designations of the Series A Junior Non-Voting Preferred Stock of PrivateBancorp, Inc., is incorporated herein by reference to Exhibit 3.2 to the Current Report on Form 8-K (File No. 001-34066) filed on June 19, 2009. |
| |
3.5 | | Certificate of Designations of Fixed Rate Cumulative Perpetual Preferred Stock, Series B, dated January 28, 2009 is incorporated herein by reference to Exhibit 3.1 to the Current Report on Form 8-K (File No. 001-34066) filed on February 3, 2009. |
| |
3.6 | | Amended and Restated By-laws of PrivateBancorp, Inc. are incorporated herein by reference to Exhibit 3.5 to the Annual Report on Form 10-K (File No. 001-34066) filed on March 1, 2010. |
| |
4.1 | | Certain instruments defining the rights of the holders of certain securities of PrivateBancorp, Inc. and certain of its subsidiaries, none of which authorize a total amount of securities in excess of 10% of the total assets of PrivateBancorp, Inc. and its subsidiaries on a consolidated basis, have not been filed as exhibits. PrivateBancorp, Inc. hereby agrees to furnish a copy of any of these agreements to the Securities and Exchange Commission upon request. |
| |
4.2 | | Form of Preemptive and Registration Rights Agreement dated as of November 26, 2007 is incorporated herein by reference to Exhibit 10.2 to the Current Report on Form 8-K (File No. 001-34066) filed on November 27, 2007. |
| |
4.3 | | Amendment No. 1 to Preemptive and Registration Rights Agreement dated as of June 17, 2009 by and among PrivateBancorp, Inc., GTCR Fund IX/A, L.P., GTCR Fund IX/B, L.P., and GTCR Co-Invest III, L.P., is incorporated herein by reference to Exhibit 4.1 to the Current Report on Form 8-K (File No. 001-34066) filed on June 19, 2009. |
| |
4.4 | | Warrant dated January 30, 2009, as amended, issued by PrivateBancorp, Inc. to the United States Department of the Treasury to purchase shares of common stock of PrivateBancorp, Inc. is incorporated herein by reference to Exhibit 4.2 to the Current Report on Form 8-K (File No. 001-34066) filed on February 3, 2009. |
| |
10.1 | | Lease agreement for 120 S. LaSalle Street, Chicago, Illinois dated as of April 25, 2008, as amended, by and between TR 120 S. LaSalle Corp and The PrivateBank and Trust Company is incorporated herein by reference to Exhibit 10.6 to the Quarterly Report on Form 10-Q (File No. 000-25887) filed on August 11, 2008. |
| |
10.2 | | Subordinated Term Loan Agreement dated as of September 26, 2008 among The PrivateBank and Trust Company, the Lenders From Time to Time Party Thereto and SunTrust Bank, as Administrative Agent, is incorporated herein by reference to Exhibit 10.2 to the Current Report on Form 8-K (File No. 001-34066) filed on October 2, 2008. |
154
| | |
| |
10.3 | | Form of Stock Purchase Agreement dated as of November 26, 2007 is incorporated herein by reference to Exhibit 10.1 to the Current Report on Form 8-K (File No. 000-34066) filed on November 27, 2007. |
| |
10.4 | | Letter Agreement including the Securities Purchase Agreement – Standard Terms attached thereto, dated January 30, 2009, between PrivateBancorp, Inc. and the United States Department of the Treasury, with respect to the issuance and sale of the Preferred Stock and the Warrant is herein incorporated by reference to Exhibit 10.1 to the Current Report on Form 8-K (File No. 000-25887) filed on February 3, 2009. |
| |
10.5 | | Letter Agreement dated as of June 17, 2009 by and among PrivateBancorp, Inc., GTCR Fund IX/A, L.P., GTCR Fund IX/B, L.P. and GTCR Co-Invest III, L.P. is incorporated herein by reference to Exhibit 10.1 to the Current Report on Form 8-K (File No. 000-34066) filed on June 19, 2009. |
| |
10.6 | | Stock Purchase Agreement dated as of November 2, 2009 among PrivateBancorp, Inc. and GTCR Fund IX/A, L.P., GTCR Fund IX/B, L.P. and GTCR Co-Invest III, L.P. is incorporated herein by reference to Exhibit 10.1 to the Current Report on Form 8-K (File No. 001-34066) filed on November 4, 2009. |
| |
10.7 | | PrivateBancorp, Inc. Incentive Compensation Plan, as amended, is incorporated herein by reference to Appendix A to the Proxy Statement for its 2005 Annual Meeting of Stockholders (File No. 000-25887) filed on March 11, 2005. |
| |
10.8 | | PrivateBancorp, Inc. Strategic Long-Term Incentive Plan is incorporated herein by reference to Exhibit 99.1 to the Form S-8 Registration Statement (File No. 333-147451) filed on November 16, 2007. |
| |
10.9 | | PrivateBancorp, Inc. 2007 Long-Term Incentive Compensation Plan is incorporated herein by reference to Exhibit 99.1 to the Form S-8 Registration Statement (File No. 333-151178) filed on May 23, 2008. |
| |
10.10 | | Form of Incentive Stock Option Agreement pursuant to the PrivateBancorp, Inc. Incentive Compensation Plan is incorporated herein by reference to Exhibit 10.29 to the Annual Report on Form 10-K (File No. 000-25887) filed on March 10, 2005. |
| |
10.11 | | Form of Director Stock Option Agreement pursuant to the PrivateBancorp, Inc. Incentive Compensation Plan is incorporated herein by reference to Exhibit 10.30 to the Annual Report on Form 10-K (File No. 000-25887) filed on March 10, 2005. |
| |
10.12 | | Form of Non-qualified Stock Option Agreement pursuant to the PrivateBancorp, Inc. Incentive Compensation Plan is incorporated herein by reference to Exhibit 10.2 to the Quarterly Report on Form 10-Q (File No. 000-25887) filed on November 9, 2006. |
| |
10.13 | | Form of Restricted Stock Award Agreement pursuant to the PrivateBancorp, Inc. Incentive Compensation Plan is incorporated herein by reference to Exhibit 10.1 to the Quarterly Report on Form 10-Q (File No. 000-25887) filed on November 9, 2006. |
| |
10.14 | | Form of Inducement Performance Share Award Agreement pursuant to the PrivateBancorp, Inc. Strategic Long-Term Incentive Compensation Plan is incorporated herein by reference to Exhibit 10.19 to the Annual Report on Form 10-K (File No. 000-25887) filed on February 29, 2008. |
| |
10.15 | | Form of Nonqualified Inducement Performance Stock Option Agreement pursuant to the PrivateBancorp, Inc. Strategic Long-Term Incentive Compensation Plan is herein incorporated by reference to Exhibit 10.20 to the Annual Report on Form 10-K (File No. 000-25887) filed on February 29, 2008. |
| |
10.16 | | Form of Nonqualified Inducement Time-Vested Stock Option Agreement pursuant to the PrivateBancorp, Inc. Strategic Long-Term Incentive Compensation Plan is incorporated herein by |
155
| | |
| | reference to Exhibit 10.21 to the Annual Report on Form 10-K (File No. 000-25887) filed on February 29, 2008. |
| |
10.17 | | Form of non-employee Director Restricted Stock Award Agreement pursuant to the PrivateBancorp, Inc. 2007 Long-Term Incentive Compensation Plan is incorporated herein by reference to Exhibit 10.1 to the Quarterly Report on Form 10-Q (File No. 001-34066) filed on August 11, 2008. |
| |
10.18 | | Form of Employee Non-qualified Stock Option Agreement pursuant to the PrivateBancorp, Inc. 2007 Long-Term Incentive Compensation Plan is incorporated herein by reference to Exhibit 10.2 to the Quarterly Report on Form 10-Q (File No. 001-34066) filed on August 11, 2008. |
| |
10.19 | | Form of Employee Restricted Stock Award Agreement for Restricted Stock Units pursuant to the PrivateBancorp, Inc. 2007 Long-Term Incentive Compensation Plan is incorporated herein by reference to Exhibit 10.3 to the Quarterly Report on Form 10-Q (File No. 001-34066) filed on August 11, 2008. |
| |
10.20 | | Form of Employee Restricted Stock Award Agreement for Restricted Stock Units pursuant to the PrivateBancorp, Inc. 2007 Long-Term Incentive Compensation Plan is incorporated herein by reference to Exhibit 10.4 to the Quarterly Report on Form 10-Q (File No. 001-34066) filed on August 11, 2008. |
| |
10.21 | | Form of Amendment Agreement dated as of January 28, 2010 by and between PrivateBancorp, Inc. and certain officers including Larry D. Richman, C. Brant Ahrens, Bruce R. Hague and Bruce S. Lubin to amend each such officer’s agreements evidencing an award of performance shares granted under the PrivateBancorp, Inc. Strategic Long-Term Incentive Compensation Plan and/or the PrivateBancorp, Inc. 2007 Long-Term Incentive Compensation Plan is incorporated herein by reference to Exhibit 10.23 to the Annual Report on Form 10-K (File No. 001-34066) filed on March 1, 2010. |
| |
10.22 | | Form of Indemnification Agreement by and between PrivateBancorp, Inc. and its directors and executive officers is incorporated herein by reference to Exhibit 10.10 to the Form S-1/A Registration Statement (File No. 333-77147) filed on June 15, 1999. |
| |
10.23 | | Employment Term Sheet Agreement between Ralph B. Mandell and PrivateBancorp, Inc. dated December 14, 2007 is incorporated herein by reference to Exhibit 10.6 to the Annual Report on Form 10-K (File No. 000-25887) filed on February 29, 2008. |
| |
10.24 | | Restricted Stock Award Agreement pursuant to the PrivateBancorp, Inc. 2007 Long-Term Incentive Compensation Plan between PrivateBancorp, Inc. and Ralph B. Mandell effective as of March 30, 2009 is incorporated herein by reference to Exhibit 10.2 to the Quarterly Report on Form 10-Q (File No. 001-34066) filed on May 8, 2009. |
| |
10.25 | | Amendment to Term Sheet Agreement dated as of February 12, 2010, by and between PrivateBancorp, Inc. and Ralph B. Mandell is incorporated herein by reference to Exhibit 10.1 to the Quarterly Report on Form 10-Q (File No. 001-34066) filed on May 10, 2010. |
| |
10.26 | | Employment Term Sheet Agreement among Larry D. Richman, PrivateBancorp, Inc. and The PrivateBank and Trust Company dated October 30, 2007 is incorporated herein by reference to Exhibit 10.7 to the Annual Report on Form 10-K (File No. 000-25887) filed on February 29, 2008. |
| |
10.27 | | Restricted Stock Award Agreement pursuant to the PrivateBancorp, Inc. 2007 Long-Term Incentive Compensation Plan between PrivateBancorp, Inc. and Larry D. Richman effective as of March 30, 2009 is incorporated herein by reference to Exhibit 10.1 to the Quarterly Report on Form 10-Q (File No. 001-34066) filed on May 8, 2009. |
| |
10.28(a) | | Employment Term Sheet Agreement among C. Brant Ahrens, PrivateBancorp, Inc. and The PrivateBank and Trust Company dated November 7, 2007. |
| |
10.29 | | Employment Term Sheet Agreement among Bruce R. Hague, PrivateBancorp, Inc. and The |
156
| | |
| | PrivateBank and Trust Company dated October 25, 2007 is incorporated herein by reference to Exhibit 10.9 to the Annual Report on Form 10-K (File No. 000-25887) filed on February 29, 2008. |
| |
10.30 | | Employment Term Sheet Agreement among Bruce S. Lubin, PrivateBancorp, Inc. and The PrivateBank and Trust Company dated October 24, 2007 is incorporated herein by reference to Exhibit 10.11 to the Annual Report on Form 10-K (File No. 000-25887) filed on February 29, 2008. |
| |
10.31 | | Term Sheet Agreement dated July 7, 2008 between The PrivateBank and Trust Company and Norman R. Bobins is incorporated herein by reference to Exhibit 10.3 to the Quarterly Report on Form 10-Q (File No. 000-25887) filed on November 10, 2008. |
| |
10.32 | | Amendment to Term Sheet Agreement, dated as of May 27, 2010, by and between PrivateBancorp, Inc. and Norman R. Bobins is incorporated herein by reference to Exhibit 10.34 to the Annual Report on Form 10-K filed on March 1, 2011. |
| |
10.33 | | Employment Term Sheet Agreement among Kevin M. Killips, PrivateBancorp, Inc. and The PrivateBank and Trust Company dated February 6, 2009 is incorporated herein by reference to Exhibit 10.1 to the Current Report on Form 8-K (File No. 000-25887) filed on February 9, 2009. |
| |
10.34 | | Salary Stock Award Agreement, dated as of March 18, 2010, by and between PrivateBancorp, Inc. and Kevin M. Killips is incorporated herein by reference to Exhibit 10.2 to the Quarterly Report on Form 10-Q (File No. 001-34066) filed on May 10, 2010. |
| |
10.35 | | Form of Senior Executive Officer Letter Agreement and Waiver executed by each of the following as required pursuant to the Securities Purchase Agreement dated January 30, 2009 entered into between PrivateBancorp, Inc. and the United States Department of the Treasury under the TARP Capital Purchase Program: Larry D. Richman, Bruce Lubin, Bruce Hague, C. Brant Ahrens, and Ralph B. Mandell, is incorporated herein by reference to Exhibit 10.33 to the Annual Report on Form 10-K (File No. 001-34066) filed on March 2, 2009. |
| |
10.36 | | TARP Compensation Agreement, dated as of March 31, 2011, by and between PrivateBancorp, Inc. and the Chief Executive Officer is incorporated herein by reference to Exhibit 10.1 to the Quarterly Report on Form 10-Q (File No. 001-34066) filed on May 9, 2011. |
| |
10.37 | | TARP Compensation Agreement, dated as of March 31, 2011, by and between PrivateBancorp, Inc. and Bruce R. Hague is incorporated herein by reference to Exhibit 10.2 to the Quarterly Report on Form 10-Q (File No. 001-34066) filed on May 9, 2011. |
| |
10.38 | | PrivateBancorp, Inc. 2011 Incentive Compensation Plan is incorporated herein by reference to Appendix A to the Proxy Statement for its 2011 Annual Meeting of Stockholders (File No. 001-34066) filed on April 14, 2011. |
| |
10.39 | | Form of Restricted Stock Award Agreement pursuant to the PrivateBancorp, Inc. 2011 Incentive Compensation Plan is incorporated herein by reference to Exhibit 10.2 to the Quarterly Report on Form 10-Q (File No. 001-34066) filed on August 9, 2011. |
| |
10.40 | | Form of Stock Option Agreement pursuant to the PrivateBancorp, Inc. 2011 Compensation Plan is incorporated herein by reference to Exhibit 10.3 to the Quarterly Report on Form 10-Q (File No. 001-34066) filed on August 9, 2011. |
| |
10.41(a) | | Form of Amendment Agreement to Stock Option Agreement pursuant to the PrivateBancorp, Inc. 2011 Compensation Plan by and between PrivateBancorp, Inc. and each of Bruce Lubin and Kevin Killips, effective December 29, 2011. |
| |
10.42 | | Consulting Agreement by and between PrivateBancorp, Inc. and Ralph B. Mandell, dated June 1, 2011 is incorporated herein by reference to Exhibit 10.4 to the Quarterly Report on Form 10-Q (File No. 001-34066) filed on August 9, 2011. |
| |
10.43 | | LDR TARP Deferred Payment Trust by and between PrivateBancorp, Inc. and GreatBanc Trust |
157
| | |
| | Company, dated June 17, 2011 is incorporated herein by reference to Exhibit 10.5 to the Quarterly Report on Form 10-Q (File No. 001-34066) filed on August 9, 2011. |
| |
| 10.44 | | BRH TARP Deferred Payment Trust by and between PrivateBancorp, Inc. and GreatBanc Trust Company, dated June 17, 2011 is incorporated herein by reference to Exhibit 10.6 to the Quarterly Report on Form 10-Q (File No. 001-34066) filed on August 9, 2011. |
| |
| 10.45 | | Summary of Compensation Arrangement with Norman R. Bobins, adopted July 2011, effective as of January 1, 2011 is incorporated herein by reference to Exhibit 10.1 to the Quarterly Report on Form 10-Q (File No. 001-34066) filed on November 8, 2011. |
| |
| 10.46 | | Employee Leasing Agreement by and between The PrivateBank and Trust Company and Norman Bobins Consulting LLC, entered into October 2011, effective as of January 1, 2011 is incorporated herein by reference to Exhibit 10.2 to the Quarterly Report on Form 10-Q (File No. 001-34066) filed on November 8, 2011. |
| |
| 11 | | Statement re: Computation of Per Share Earnings - The computation of basic and diluted earnings per share is included in Note 14 of the Company’s Notes to Consolidated Financial Statements included in “Item 8. Financial Statements and Supplementary Data” included in this report on Form 10-K. |
| |
| 12(a) | | Statement re: Computation of Ratio of Earnings to Fixed Charges. |
| |
| 21(a) | | Subsidiaries of the Registrant. |
| |
| 23(a) | | Consent of Independent Registered Public Accounting Firm. |
| |
| 24 | | Power of Attorney (set forth on signature page). |
| |
| 31.1(a) | | Certification of Chief Executive Officer pursuant to 18 U.S.C. Section 1350, as adopted pursuant to Section 302 of the Sarbanes-Oxley Act of 2002. |
| |
| 31.2(a) | | Certification of Chief Financial Officer pursuant to 18 U.S.C. Section 1350, as adopted pursuant to Section 302 of the Sarbanes-Oxley Act of 2002. |
| |
| 32.1(a) (b) | | Certification of Chief Executive Officer and Chief Financial Officer pursuant to 18 U.S.C. Section 1350, as adopted pursuant to Section 906 of the Sarbanes-Oxley Act of 2002. |
| |
| 99.1(a) | | Certification of Chief Executive Officer of PrivateBancorp, Inc. under 31 C.F.R. Section 30.15. |
| |
| 99.2(a) | | Certification of Chief Financial Officer of PrivateBancorp, Inc. under 31 C.F.R. Section 30.15. |
| |
| 101(a) (c) | | The following financial statements from the PrivateBancorp, Inc. Annual Report on Form 10-K for the year ended December 31, 2011, filed on February 27, 2012, formatted in Extensive Business Reporting Language (XBRL): (i) consolidated statements of financial condition, (ii) consolidated statements of income, (iii) consolidated statements of changes in equity, (iv) consolidated statements of cash flows, and (v) the notes to consolidated financial statements. |
| (b) | This exhibit shall not be deemed “filed” for purposes of Section 18 of the Securities Exchange Act of 1934, or otherwise subject to the liability of that section, and shall not be deemed to be incorporated by reference into any filing under the Securities Act of 1933 or the Securities Exchange Act of 1934. |
| (c) | As provided in Rule 406T of Regulation S-T, this information is furnished and not filed for purposes of Sections 11 and 12 of the Securities Act of 1933 and Section 18 of the Securities Exchange Act of 1934. |
Exhibits 10.7 through 10.46 are management contracts or compensatory plans or arrangements.
158