UNITED STATES
SECURITIES AND EXCHANGE COMMISSION
Washington, D.C. 20549
FORM 10-K
ANNUAL REPORT PURSUANT TO SECTION 13 OR 15(d)
OF THE SECURITIES EXCHANGE ACT OF 1934
For the fiscal year ended October 31, 2008
Commission file number 0-20842
PLATO Learning, Inc.
(Exact name of Registrant as specified in its charter)
| Delaware | 36-3660532 |
| (State or other jurisdiction of incorporation or organization) | (IRS Employer Identification Number) |
| 10801 Nesbitt Avenue South, Bloomington, MN | 55437 |
| (Address of principal executive offices) | (Zip Code) |
Registrant’s telephone number, including area code:
(952) 832-1000
| Securities registered pursuant to Section 12(b) of the Act: | Name of exchange on which registered: |
| Common Stock, Par Value $.01 | NASDAQ Global Market |
Securities registered pursuant to Section 12(g) of the Act:
None
Indicate by check mark if the Registrant is a well-known seasoned issuer, as defined in Rule 405 of the Securities Act. Yes £ No T
Indicate by check mark if the Registrant is not required to file reports pursuant to Section 13 or Section 15(d) of the Act. Yes £ No T
Indicate by check mark whether the Registrant (1) has filed all reports required to be filed by Section 13 or 15(d) of the Securities Exchange Act of 1934 during the preceding 12 months, and (2) has been subject to such filing requirements for the past 90 days. Yes T No £
Indicate by check mark if disclosure of delinquent filers pursuant to Item 405 of Regulation S-K is not contained herein, and will not be contained, to the best of Registrant’s knowledge, in definitive proxy or information statements incorporated by reference in Part III of this Form 10-K or any amendment to this Form 10-K. £
Indicate by check mark whether the registrant is a large accelerated filer, an accelerated filer, or a non-accelerated filer. See definition of “accelerated filer and large accelerated filer” in Rule 12b-2 of the Exchange Act. (Check one)
Large Accelerated Filer £ Accelerated Filer T Non-Accelerated Filer £ Smaller Reporting Company £
(Do not check if smaller reporting company)
Indicate by check mark whether the Registrant is a shell company (as defined in Rule 12b-2 of the Act.) Yes £ No T
The aggregate market value of common stock held by non-affiliates of the Registrant, as of April 30, 2008 (the last business day of the Registrant’s most recently completed second fiscal quarter) was approximately $66,000,000.
The number of shares of the Registrant’s common stock, par value $.01, outstanding as of December 31, 2008 was 24,080,915 shares.
DOCUMENTS INCORPORATED BY REFERENCE
Portions of the Company’s definitive Proxy Statement for the Company’s Annual Meeting of Stockholders to be held on March 26, 2009 (the “2009 Proxy Statement”) are incorporated by reference in Part III.
PLATO LEARNING, INC.
Form 10-K
Fiscal Year Ended October 31, 2008
TABLE OF CONTENTS
| Page | ||
| PART I | ||
| Item 1. | 1 | |
| Item 1A. | 7 | |
| Item 1B. | 12 | |
| Item 2. | 12 | |
| Item 3. | 12 | |
| Item 4. | 12 | |
| PART II | ||
| Item 5. | 13 | |
| Item 6. | 15 | |
| Item 7. | 16 | |
| Item 7A. | 32 | |
| Item 8. | 33 | |
| Item 9. | 65 | |
| Item 9A. | 65 | |
| Item 9B. | 66 | |
| PART III | ||
| Item 10. | 67 | |
| Item 11. | 68 | |
| Item 12. | 68 | |
| Item 13. | 68 | |
| Item 14. | 68 | |
| PART IV | ||
| Item 15. | 69 | |
| 70 | ||
| 71 | ||
PART I
Forward-Looking Statements
In addition to historical information, this Form 10-K contains forward-looking statements. These forward-looking statements are made in reliance upon the safe harbor provisions of the Private Securities Litigation Reform Act of 1995 (“the Act”). The words “believe,” “expect,” “anticipate,” “intend,” “estimate,” “forecast,” “project,” “should” and similar expressions are intended to identify “forward-looking statements” within the meaning of the Act. Forward-looking statements include, among others, statements about our future performance, the sufficiency of our sources of capital for future needs, and the expected impact of recently issued accounting pronouncements. These forward-looking statements are subject to certain risks and uncertainties that could cause actual results to differ materially from those reflected in the forward-looking statements. Factors that might cause such a difference include, but are not limited to, those discussed in Part I Item 1A of this Form 10-K. Readers are cautioned not to place undue reliance on these forward-looking statements, which reflect management’s opinions only as of the date hereof. We undertake no obligation to revise or publicly release any revision to these forward-looking statements based on circumstances or events, which occur in the future. Readers should carefully review the risk factors described in Part I Item 1A of this report on Form 10-K and in other documents we file from time to time with the Securities and Exchange Commission.
ITEM 1. BUSINESS
Business Description
PLATO Learning, Inc. is a Delaware corporation that was incorporated in 1989 and is headquartered in Bloomington, Minnesota. We are a leading provider of on-line instruction, curriculum management, assessment, and related professional development services to K–12 schools, community colleges and other educational institutions across the country. Our products are used by customers principally to provide alternative instruction to students performing below their grade level in order to help those students return to the classroom, recover course credits, pass high school exit exams or prepare for college and other post-secondary studies. In addition to the value provided to students, our solutions allow school districts to retain state and federal funding tied to student enrollment. Our courseware and assessment products are designed primarily to help educators meet the demands of state and federal student achievement initiatives for intervention, dropout prevention and college readiness. We also offer online and onsite staff professional development services to ensure optimal use of our products and to help schools meet their accountability requirements and school improvement plans.
Our research-based courseware library includes thousands of hours of mastery-based instruction covering discrete learning objectives in the subject areas of reading, writing, language arts, mathematics, science, and social studies. Our web-based assessment and alignment tools ensure that instruction can be personalized to each student’s unique needs and the curriculum has alignment to local, state, and national standards. Using our web-based products, educators are able to identify each student’s instructional needs and prescribe an individual learning program of PLATO Learning courseware, educational web sites, the school’s textbooks and other core and supplemental instructional materials. A variety of reports are available to help educators identify gaps in student understanding and ensure that standard learning objectives are being addressed.
Beginning in late fiscal year 2005, we implemented a strategy to deliver our products and solutions on a subscription basis using a new internet-based learning management platform we call the PLATO Learning EnvironmentTM, or PLETM. The majority of our subscription periods range from one to three years with a dollar value weighted average subscription period of approximately two years in fiscal 2008. As of October 31, 2008, over 1,200 school districts, community colleges and other educational institutions across 50 states subscribed to our instructional solutions delivered on PLETM, and nearly 1.2 million students, teachers and administrators at these institutions were registered to use PLETM.
We operate our principal business in one industry segment, which is the development and marketing of educational software and related services.
Market
Based on recent market data from Simba Information (“Simba”), approximately $9.1 billion is spent annually on print and electronic instructional materials in the U.S. K-12 market. Of that spending, approximately $1.8 billion is spent on electronic instructional materials which Simba classifies into three categories of products: courseware, modular software and videos. Our instructional products fall primarily into the courseware category, which, according to Simba, is the fastest growing market in the K-12 instructional materials market, growing 8.5% in 2007, and projected to grow 9.3% to $928 million in 2008.
Our newest instructional products are delivered on a subscription basis over the internet, via our learning management system, the PLATO Learning EnvironmentTM, or PLETM. Today, 99% of the nation’s K-12 public schools have Internet access, and as a result, schools are increasingly turning to web-based methods of instruction as a supplement to their instructor-led programs due to their flexibility, cost-efficiency, and effectiveness.
Some of our customers have integrated our products into their core classroom instruction, but most use them to provide alternative instructional programs to students who, for various reasons, have not been successful learning in the classroom environment. These remedial programs help students return to the classroom or recover course credits needed to move to the next grade level, pass high school exit exams and graduate. Earning a high-school diploma represents a key milestone in an individual's schooling and social and economic advancement, but according to the National Center for Education Statistics, more than 25% of incoming freshman do not finish high school. Statistics like these raise the awareness of the effectiveness of U.S. public schools and have led to legislative requirements and public demand for increased accountability and improvements in U.S. K-12 schools. These trends have led to increasing demand for solutions like ours and others that address the need to improve school effectiveness and graduation rates. As a result, we believe that technology-based instructional materials have the ability to cost effectively create a personalized and flexible instructional environment, and are generally preferred over print-based materials by today’s students, and will continue to grow faster than the total instructional materials market.
Strategy
Since late 2005, we have been executing a strategy focused on four core strategic initiatives:
| · | Leverage our strong brand and extensive library of curriculum to grow market share in the intervention market. Our traditional strength has been the intervention market - solutions that help students who are one or more grade levels behind and at risk of not being promoted to the next grade or not graduating. Instruction delivered using technology provides an ideal solution for this market need as instructional intervention generally occurs outside the traditional classroom and requires self-paced learning personalized for each student’s unique learning needs. The technology solutions currently sold to this market are characterized by a large number of smaller competitors. We believe that providing new and differentiated solutions on an Internet-based platform such as PLE, combined with our strong brand in this market, uniquely positions us to be a dominant provider of technology-based solutions in the fragmented intervention market. |
| · | Create a core competency in software product development. By the end of fiscal 2006, we completed a restructuring of our software development organization centered on an off-shore development capability and structured software development processes that has greatly lowered development costs and improved product quality and time to market. |
| · | Deliver our instructional solutions on a single, Internet-based delivery platform. Emerging trends over the last several years are driving acknowledgement of the benefits of delivering curriculum into the K–12 market over the Internet. These trends include improving Internet technology, significant investments by school districts in technology infrastructure, the high cost of ownership of multi-vendor, on-site applications, growing use and acceptance of Internet-based resources in the K–12 market, ubiquitous Internet accessibility outside the classroom, and student and teacher demographics with respect to technology expectations and adoption. Targeting these trends, we developed and launched PLE™ in July 2006, an intuitive, web-based Learning Management System that is available to students, teachers and administrators anywhere an Internet connection and browser are available. As of the end of fiscal year 2007, the majority of our instructional content had been refreshed and transitioned to PLE™, and in 2008 we added assessments and personalized learning capabilities that prescribe instructional content based on each individual student’s needs. |
| · | Transition our business model from sales of perpetual licenses, to a subscription-based, on-demand, software-as-a-service (“SaaS”) application. Historically, we operated a traditional software business model in which software products were licensed to customers on a perpetual basis for installation and use on their own technology. This business model had many undesirable characteristics including high product maintenance and support costs, high volatility and low visibility of financial results, and a dependence on large sales at or near quarter-end to achieve financial targets, often resulting in significant price discounting and a short-term business focus. We believe the subscription-based business model provides significant advantages in that it produces significant operating leverage, a predictable recurring revenue stream through subscription renewals, and greater visibility and stability to future operating results. In fiscal year 2008, approximately 85% of our product orders were for subscription-based products, up from approximately 68% in fiscal year 2007. |
Products
Our products consist of a comprehensive portfolio of technology-based instructional content, classroom assessment, and related professional development that we market to K–12 schools, community colleges and other educational institutions. Our products are used by these customers principally to provide alternative instruction to students performing below their grade level in order to help those students return to the classroom, recover course credits, pass high school exit exams or prepare for college and other post-secondary studies.
Instructional Content
Our content library consists of rich, interactive, multimedia instructional content that is highly engaging for both students and teachers. This research-based courseware library includes more than 6,000 hours of mastery-based instruction material covering the primary K-12 subject areas of mathematics, science, reading/language arts, and social studies.
Our content can be applied to multiple student learning profiles (e.g. general education, special education, at-risk) and tailored for students across multiple grade-levels. Content offerings are classified as intervention solutions when applied to students performing below grade-level, as core or supplemental instructional solutions for mainstream students performing at grade level, and as advanced placement offerings for students performing above grade level. We believe our content provides the following differentiating factors:
| · | Interactive, engaging multimedia instruction that is highly differentiated from the static text-biased content provided by many other companies; |
| · | Content that is cross-referenced to academic standards set by states, the federal government, and other standard-setting bodies; |
| · | Assessments that are tied to these standards and generate personalized lesson plans based on an individual student’s test results; |
| · | Content arranged into a series of semester-long pre-configured online courses for grades 7–12 that can be employed both inside and outside of the classroom; |
| · | Fully customizable by schools to fit their unique instructional needs; |
| · | Correlated to all primary textbooks used in K–12 schools. |
Learning Management System
In July 2006, we launched the PLATO Learning Environment™ (PLE), a web-based platform to deliver all of our instructional solutions, providing a unified curriculum management and delivery system that requires only an Internet connection and a browser. In addition to anytime-anywhere delivery of our products, PLE provides the following differentiating factors:
| · | Automated alignments of instructional content to learning standards in all states and the major national standards such as SAT, ACT, GED, and NAEP; |
| · | Access to pre-set teacher materials used to supplement the online curriculum; |
| · | Built-in links to many popular websites containing other K–12 curriculum; |
| · | Functionality allowing school districts to create customized courses tailored to their specific instructional scope and sequence, including the ability for teachers to upload documents they have created for access by students; |
| · | Search functionality that allows users to find resources and content based on standards applicable to their instructional requirements; |
| · | Preparation of assessment tests and generation of recommendations for relevant follow-up content based on results; |
| · | Automated grading and reporting for whole course or supplemental programs. |
Classroom Formative Assessment
Formative assessment involves collecting feedback from learning activities to adapt instruction to a learner’s needs. Our assessment database consists of more than 180,000 test items linked to state, district, and national learning objectives across all subject areas of reading, math, science and social studies. In conjunction with powerful data management tools, our assessment solutions can provide assessment results by student demographic category and facilitate data-driven decision making for school curriculum development, textbook choices and providing personalized learning. PLATO® Test Packs with Prescriptions prescribe individual learning paths to PLATO® content based on student performance, which can then be completed at the student’s own learning pace. As a result, PLATO Test Packs give teachers the flexibility to allow PLE to automatically prescribe assignments or to make manual adjustments before assigning lessons.
Instructional Solutions
We combine our large library of interactive content and assessments with the unique features of PLE to deliver a variety of instructional solutions to educational institutions. In K-12 schools, these solutions primarily address at-risk students who have fallen behind in the classroom, allowing these students to recover credits, move to the next grade level, avoid dropping out of school or prepare for their high school exit exam. In the post-secondary market, our developmental algebra products, sold under the Academic Systems® brand, are primarily intended for students who have completed high school but are not yet ready for college level math courses. We also provide instructional solutions to adult education markets for GED preparation, workforce readiness, and life and career skills.
Services and Product Support
Our professional services offerings ensure that customers receive the consultation, training and services needed to successfully implement our solutions and integrate educational technology into their day-to-day teaching and learning environment. Services are delivered in face-to-face sessions as well as synchronous and asynchronous online delivery methods.
We provide telephone and online product support to our customers. Subscription customers are entitled to support as part of their subscription fees to our online products. Customers who purchased perpetual license products can choose to obtain telephone support by paying an annual software maintenance fee.
Sales and Marketing
Our sales channel consists of direct sales representatives located throughout the U.S. and inside sales representatives operating out of our corporate headquarters in Bloomington, Minnesota. We also utilize distributors and resellers in certain geographic markets.
In the K–12 market we sell to school districts of all sizes, but generally target larger school districts. In the post-secondary market, we target community colleges, four-year universities, adult education centers, and correctional institutions.
Competition
The market for electronic instructional materials is served by hundreds of companies that offer a range of instructional products and services. At one end of the market are companies offering modular software applications or videos that consist of a single element of instructional content or an individual course or application. At the other end are companies like PLATO Learning that provide full course offerings that span multiple grade levels and/or subject areas. These companies are “comprehensive” in terms of being able to package a solution that covers multiple grade levels, subjects, and associated reports and assessments. Between the comprehensive and non-comprehensive categories there are as many variations as there are companies.
We estimate that the five largest companies serving this market – PLATO Learning, Pearson Education, Renaissance Learning, Houghton Mifflin/RiverDeep, and Scholastic – have an estimated combined market share of approximately 40%. PLATO Learning and Pearson Education provide courseware across all K–12 grade levels, while Houghton Mifflin/Riverdeep, Renaissance Learning, and Scholastic limit the breadth of grade levels and/or subject areas their solutions address. In the intervention market we compete against a number of smaller competitors, including Compass Learning, OdysseyWare, Apex Learning, American Education Corporation (A+), and others. Many of these smaller, non-comprehensive companies focus on a geographic segment or district size, rather than the national market. The needs, size, and location of school districts often influence the opportunities for which companies choose to compete.
When competing with any company, we differentiate our solutions by emphasizing the depth of our multimedia rich courseware aligned to standards, the benefits of a single learning management system that delivers all content over the Internet for all grades and core subject areas, the completeness of alignments to state and national standards, and the unique diagnostic and prescriptive capabilities of our products to improve performance on state exams and standards. We also believe that our record of student improvement and product development capabilities differentiate us from the competition. Based on our experience, we believe that these are key factors that buyers use in evaluating competitive offerings.
Product Development
Our product development group develops, enhances, and maintains our courseware, assessment, instructional management software, and delivery system platforms. We utilize both domestic and offshore resources. In fiscal year 2008, approximately 45% of our total product development spending was incurred offshore.
Proprietary Rights
Our courseware is proprietary and we protect it primarily under a combination of the laws of copyrights, trademarks, and trade secrets. We also utilize copyright and trademark protection, license agreements, employment agreements, employment termination agreements, third-party non-disclosure agreements, and other methods to protect our proprietary rights. We regard many of our intellectual property rights as essential to our business and enforce our intellectual property rights when we become aware of any infringements or potential infringements and believe they warrant such action.
Backlog
We consider backlog to be the total of deferred revenue reported on our balance sheet plus unbilled amounts due under non-cancelable subscription agreements. On this basis, backlog was $53.9 million and $49.1 million at October 31, 2008 and 2007, respectively, broken down as follows:
| October 31, | ||||||||
| 2008 | 2007 | |||||||
| Subscription | $ | 41,694 | $ | 32,938 | ||||
| License fees | 467 | 622 | ||||||
| Services | 11,705 | 15,563 | ||||||
| Total deferred revenue | $ | 53,866 | $ | 49,123 | ||||
At October 31, 2008, we expect approximately $13.3 million of our deferred revenue to be recognized subsequent to fiscal year 2009.
Seasonality
Our quarterly financial results fluctuate as a result of a number of factors including public education budget cycles and the mix of perpetual license fee and subscription product sales. Historically we have experienced our lowest order levels, cash balances and revenues in the first and second quarters of our fiscal year, and higher levels of orders, cash and revenues in our third and fourth quarters. More recently, our increasing emphasis on sales of subscription products has moderated the seasonality of our revenues. Because of these factors, the results for interim periods are not necessarily indicative of the results to be expected for the full fiscal year.
Employees
As of October 31, 2008, we had approximately 384 employees. We also contract with offshore resources in the development of new products. We have never experienced a work stoppage as a result of a labor dispute, and none of our employees are represented by a labor organization.
Non-Audit Services Performed by Independent Registered Public Accounting Firm
Pursuant to Section 10A(i)(2) of the Securities Exchange Act of 1934, as added by Section 202 of the Sarbanes-Oxley Act of 2002, we are responsible for disclosing to investors the non-audit services approved by our Audit Committee to be performed by, our independent registered public accounting firm. Non-audit services are defined as services other than those provided in connection with an audit or a review of our financial statements. During the period covered by this Annual Report on Form 10-K, our Audit Committee pre-approved non-audit services, consisting of fees paid for online research materials.
Web Site Access to Reports
Our Annual Reports on Form 10-K, Quarterly Reports on Form 10-Q, Definitive Proxy Statements on Schedule 14A, Current Reports on Form 8-K, and any amendments to those reports, are made available free of charge on our web site (www.plato.com) as soon as reasonably practicable after such reports are filed with the Securities and Exchange Commission (“SEC”). Statements of changes in beneficial ownership of our securities on Form 4 by our executive officers and directors are made available on our web site by the end of the business day following the submission of such filings to the SEC. All reports mentioned above are also available from the SEC’s web site (www.sec.gov).
ITEM 1A. RISK FACTORS
We operate in a market environment that involves significant risks, many of which are beyond our control. The following risk factors may adversely impact our results of operations, financial position, cash flow and the market price of our common stock. Although we believe that we have identified and discussed below the key risk factors affecting our business, they are not the only ones facing us. There may be additional risks and uncertainties that are not presently known or that are not currently believed to be significant that also may affect our results of operations and financial condition.
Risks Relating to Our Industry
We derive a substantial portion of our revenues from public school funding, which is dependent on support from federal, state, and local governments. Changes in funding for public school systems could reduce our revenues and cash flows and impede the growth of our business.
The availability of funding to purchase our products is subject to many factors that can affect government funding. These factors include downturns in general economic conditions, like those which we are currently experiencing, that can reduce government tax revenues and may affect education funding, emergence of other priorities that can divert government funding from educational objectives, periodic changes in government leadership that can change spending priorities, and the government appropriations process, which is often slow and unpredictable. In many instances, customers rely on specific funding appropriations to purchase our products. Curtailments, delays, or reductions in this funding can delay or reduce revenues and cash flow we had otherwise forecasted to receive.
The growth of our business depends on continued investment by public school systems in interactive educational technology and products. Changes to funding of public school systems can slow this type of investment and adversely affect our revenues and market opportunities.
Competition in our industry is intense and growing, which could adversely affect our performance.
Our industry is intensely competitive, rapidly evolving, and subject to technological change. We compete primarily against organizations offering educational and training software and services, including comprehensive curriculum software publishers, companies providing single-title retail products, and Internet content and service providers. Some of our competitors have substantially greater financial, technical and marketing resources than us. The demand for e-learning products and services has grown significantly with the advent of on-line educational institutions, improvements in Internet access and reductions in the cost of technology. While this growing demand presents opportunities for us, it also results in the addition or consolidation of competitors. Increased competition in our industry could result in price reductions, reduced operating margins, or loss of market share, which could seriously harm our business, cash flows, and operating results.
Risks Relating to Our Company
The success of our business model is dependent on growth in market acceptance of online subscription products delivered over the Internet. If this acceptance does not grow or is otherwise diminished, our revenues will continue to decline and may affect our ability to achieve profitability.
Our ability to generate revenue growth and to become profitable is dependent on significant growth of subscription fees to our Internet-based products. Market acceptance of software solutions delivered over the Internet can be negatively affected by factors such as customers’ confidentiality concerns with regard to student information that is stored outside of their controlled computing environments, existing investments in owned courseware, technology infrastructure and related personnel, customer preferences with regard to perpetual licenses vs. annual subscription decisions, and availability, reliability and security of access to the Internet within a school district.
Adverse changes in these factors could result in a decline in the acceptance of web-based courseware solutions making it difficult for us to execute our current business model. As a result, we may need to reevaluate that business model, which may affect our ability to achieve profitability.
The success of our product investment strategy and our ability to remain competitive against companies with access to larger amounts of capital is dependent on our ability to maintain our cost-effective off-shore development resources. If we are unable to do so, we would experience significant product delays and increases in product development costs which would adversely affect our strategy, competitive position, revenues and profitability.
More than 45% of our total product development and maintenance spending in fiscal year 2008 was incurred on off-shore development resources. We believe the use of these resources provides us greater flexibility, cost savings, and a greater return on our development investments. These resources are also critical to our ability to quickly transition our products to a subscription-based business model, respond quickly to market changes and to compete against companies with access to larger amounts of capital than we have. However, this dependence introduces risks common to many outsourcing relationships. These risks include the supplier’s ability to maintain sufficient capacity, control costs, and hire, train, and retain qualified resources, as well as risks associated with our limited direct control and physical access to these resources. Our supplier agreements contain provisions intended to limit some of these risks; however, there can be no assurance that they will be effective at doing so. If our supplier relationships are suddenly and adversely affected, it would cause significant product delays and increased development costs, which would have a material negative effect on our competitive position, revenues and profitability.
Our future success may be dependent on our ability to compete in the broader instructional materials market against larger competitors with significantly greater resources than we have.
The instructional materials market has been dominated for many years by a small number of large publishers that provide textbooks and other printed materials to the school market. These companies have well-established distribution channels and significantly greater marketing, curriculum and financial resources than us. As electronic instructional materials continue to grow and take market share from print materials, competition from these companies will increase and we may not be able to compete effectively.
Our future success is dependent on Internet and other technology developments, our ability to adapt to these and other technological changes and to meet evolving industry standards.
Our ability to execute our strategy of delivering our products on a subscription basis over the Internet and generating the related expected revenues is dependent on the development and maintenance of Internet technology as well as our ability to adapt and respond to changes in Internet and other software technologies.
We may encounter difficulties responding to these and other technological changes that could delay our introduction of products and services or require us to make larger than anticipated investments to maintain existing products. Software industries are characterized by rapid technological change and obsolescence, frequent product introductions, and evolving industry standards. Our future success will, to a significant extent, depend on our ability to maintain and enhance our existing products, develop and introduce new products, satisfy an expanded range of customer needs, and achieve market acceptance. We may not have sufficient resources to make the necessary investments to develop and implement the technological advances required to maintain our competitive position.
Since fiscal 2005 we have been transitioning our business from products that are licensed on a perpetual basis to those that are licensed on a subscription basis. The different revenue recognition characteristics of these products affect the comparability of our financial results. Until we fully complete this transition, our business will be difficult to predict and compare from period to period. Our business is also seasonal. As a result of these factors, we may continue to experience unexpected fluctuations in our quarterly cash flows, revenues and results from operations, which may adversely affect our stock price and the implementation of our strategy.
We expect sales of perpetual license products to continue to decline as we fully complete our transition to subscription-based products. As a result, our operating results will continue to be difficult to predict, may be difficult to compare to historical periods, and may fluctuate from quarter-to-quarter due to factors such as the size, timing, and product mix of license vs. subscription orders. In addition, public school budget cycles result in purchases that have historically been concentrated in the last two quarters of our fiscal year. Accordingly, our annual operating performance can be materially and adversely affected if factors such as school budget constraints, availability of federal and state funding, sales productivity and new product introductions do not align with these purchasing patterns. If such annual results are not achieved we may have to delay or adjust components of our strategy implementation which may affect our ability to achieve profitability.
Our transition from perpetual to subscription-based products has resulted in an increasing trend whereby cash receipts from the sale of our products has shifted from payment shortly after the time of sale, to payment over the subscription period. This trend, together with the seasonality of our business previously discussed, may adversely affect our short-term liquidity.
We generally require that one-year subscriptions and sales of perpetual licenses be paid in full within a short time after completion of the sale. Multi-year subscription customers may be given an option to pay for these subscriptions annually in advance, and these customers are increasingly electing, or negotiating, to make multi-year payments. This increasing delay in the receipt of payment for the sales of our products, together with the seasonality of our business discussed above, has adversely affected our cash flows and may increase our short-term liquidity needs.
Misuse or misappropriation of our proprietary rights or inadvertent infringement by us on the rights of others could adversely affect our results of operations.
We regard many of our intellectual property rights as essential to our business. We rely on a combination of the laws of copyrights, trademarks, and trade secrets, as well as license agreements, employment and employment termination agreements, third-party non-disclosure agreements, and other methods to protect our proprietary rights. We enforce our intellectual property rights when we become aware of any infringements or potential infringements and believe they warrant such action. If we were unsuccessful in our ability to protect these rights, our operating results could be adversely affected.
Although we believe our products and services have been independently developed and that none of our products or services infringes on the rights of others, third parties may assert infringement claims against us in the future. We may be required to modify our products, services or technologies or obtain a license to permit our continued use of those rights. We may not be able to do so in a timely manner or upon reasonable terms and conditions. Failure to do so could harm our business and operating results.
We have a number of technological mechanisms to prevent or inhibit unauthorized copying of our software products and generally require the execution of a written license agreement, which restricts use and copying of our software products. However, if such copying or misuse were to occur to any substantial degree, our operating results could be adversely affected.
If our security measures are breached and unauthorized access is obtained to our web-based products, they may be perceived as not being secure, customers may curtail or stop using these products and we may incur significant legal and financial exposure and liabilities.
The use of our web-based subscription products involves the storage of certain personal information with regard to the teachers and students using these products. If our security measures are breached and unauthorized access to this information occurs, our reputation will be damaged, our business may suffer and we could incur significant liability. Because the techniques used to attempt unauthorized access to systems such as ours change frequently and generally are not recognized until attempted on a target, we may be unable to anticipate these techniques or to implement adequate preventative measures. If an actual or perceived breach of our security occurs, the market perception of the security of our system could be harmed and we could lose sales and customers.
Claims relating to content available on or accessible from, our web sites may subject us to liabilities and additional expense.
Our web-based subscription products incorporate content from, and links to, third-party web sites which are not under our direct control. As a result, we could be subject to claims relating to this content. In addition to exposing us to potential liability, claims of this type could require us to change our web sites in a manner that could be less attractive to our customers and divert our financial and development resources.
Interruptions or delays in service from our third-party Web hosting facilities could impair the delivery of our service and harm our business.
Our subscription products are delivered using standard computer hardware located in two, third-party Web hosting facilities, with the primary facility located on the west coast of the United States. We do not control the operation of these facilities, and they are vulnerable to damage or interruption from earthquakes, floods, fires, power loss, telecommunications failures and similar events. Despite precautions taken at these facilities, the occurrence of a natural disaster or other unanticipated problems at these facilities could result in lengthy interruptions in our service. Even with disaster recovery arrangements in place, our service could be interrupted. Interruptions in our service may reduce our revenue, cause us to issue credits, cause customers to terminate their subscriptions and adversely affect our renewal rates and our ability to attract new customers. Our business will also be harmed if our customers and potential customers believe our service is unreliable.
ITEM 1B. UNRESOLVED STAFF COMMENTS
None.
We lease all of our facilities, including our corporate headquarters in Bloomington, Minnesota. We continue to be a party to two leases for unoccupied office space in the United Kingdom. Our leased facilities are adequate to meet our current and expected business requirements.
From time to time, we may become involved in litigation arising out of operations in the normal course of business. As of October 31, 2008, we were not party to any pending legal proceedings the outcome of which could reasonably be expected to have a material unfavorable or favorable effect on our operating results, financial position or cash flows.
ITEM 4. SUBMISSION OF MATTERS TO A VOTE OF SECURITY HOLDERS
None.
PART II.
ITEM 5. MARKET FOR THE REGISTRANT’S COMMON EQUITY, RELATED STOCKHOLDER MATTERS AND ISSUER PURCHASES OF EQUITY SECURITIES
Market Information
Our common stock has traded publicly on the NASDAQ Global Market under the symbol “TUTR” since December 23, 1992. The quarterly ranges of high and low prices per share of our common stock were as follows:
| 2008 | 2007 | |||||||||||||||
| Fiscal Quarter | High | Low | High | Low | ||||||||||||
| First | $ | 4.70 | $ | 2.90 | $ | 5.96 | $ | 4.90 | ||||||||
| Second | 3.88 | 2.44 | 5.59 | 3.70 | ||||||||||||
| Third | 3.04 | 1.84 | 4.73 | 3.81 | ||||||||||||
| Fourth | 3.22 | 1.30 | 4.80 | 3.00 | ||||||||||||
Holders
As of December 31, 2008, there were approximately 512 record holders of our common stock, excluding stockholders whose stock is held either in nominee name and/or street name brokerage accounts. Based on information available to us, there were approximately 1,807 holders of our common stock whose stock is held either in nominee name and/or street name brokerage accounts.
Stock Performance Graph
The following stock performance graph does not constitute soliciting material, and should not be deemed filed or incorporated by reference into any other Company filing under the Securities Act of 1933 or the Securities Exchange Act of 1934, except to the extent the Company specifically incorporates this stock performance graph by reference therein.
In accordance with Securities and Exchange Commission regulations, the following performance graph compares the cumulative total stockholder return on our common stock to the cumulative total return on the NASDAQ Composite Index and the weighted average return of our peer group (described below) for the five years ended October 31, 2008, assuming an initial investment of $100 and the reinvestment of all dividends.
Our current peer group consists of the following: LeapFrog Enterprises, Inc., Nobel Learning Communities, Princeton Review, Inc., Renaissance Learning, Inc., Scholastic Corp., School Specialty, Inc. and Scientific Learning, Inc.
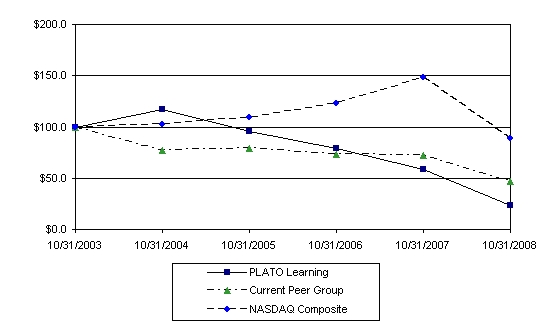
| 10/31/2003 | 10/31/2004 | 10/31/2005 | 10/31/2006 | 10/31/2007 | 10/31/2008 | |||||||||||||||||||
| PLATO Learning, Inc. | $ | 100.00 | $ | 116.88 | $ | 95.24 | $ | 78.91 | $ | 58.81 | $ | 23.47 | ||||||||||||
| Current Peer Group | $ | 100.00 | $ | 77.33 | $ | 79.11 | $ | 72.75 | $ | 72.52 | $ | 46.63 | ||||||||||||
| NASDAQ | $ | 100.00 | $ | 102.21 | $ | 109.73 | $ | 122.49 | $ | 147.97 | $ | 89.07 | ||||||||||||
Dividends
We did not declare or pay cash dividends on our common stock in fiscal years 2008 or 2007. While future cash dividend payments are at the discretion of our Board of Directors, our current intentions are to reinvest all earnings in the development and growth of our business.
Securities Authorized for Issuance Under Equity Compensation Plans
The information required by Item 201(d) of Regulation S-K is set forth under Item 12 of this Annual Report on Form 10-K.
Repurchases
We repurchased 1,550 and 36,836 shares of our common stock for an aggregate cost of approximately $4,000 and $105,000 during the second and third quarters of fiscal 2008, respectively. The shares were repurchased in accordance with employee elections to withhold shares to fund tax withholdings due upon vesting of restricted stock. Shares repurchased but not reissued are presented as treasury stock in the Consolidated Balance Sheet.
ITEM 6. SELECTED FINANCIAL DATA
| (In thousands, except per share amounts) | 2008 | 2007 | 2006 | 2005 | 2004 | |||||||||||||||
| For the year ended October 31: | ||||||||||||||||||||
| Revenues(1) | $ | 68,401 | $ | 69,632 | $ | 90,719 | $ | 121,804 | $ | 141,801 | ||||||||||
| Gross profit (2) | 26,933 | 32,113 | 49,936 | 56,996 | 91,248 | |||||||||||||||
| Operating expenses: | ||||||||||||||||||||
| Sales and marketing | 27,632 | 29,849 | 38,598 | 49,996 | 61,586 | |||||||||||||||
| General and administrative | 10,366 | 12,095 | 16,619 | 18,420 | 19,469 | |||||||||||||||
| Product maintenance and development | 4,060 | 4,334 | 5,496 | 5,646 | 5,973 | |||||||||||||||
| Amortization of intangibles | 1,550 | 1,740 | 3,711 | 4,322 | 4,308 | |||||||||||||||
| Goodwill impairment (3) | 71,865 | - | - | - | - | |||||||||||||||
| Restructuring, impairment and other charges | 6,748 | (478 | ) | 9,093 | 6,025 | - | ||||||||||||||
| Operating loss | (95,288 | ) | (15,427 | ) | (23,581 | ) | (27,413 | ) | (88 | ) | ||||||||||
| Other income, net | 254 | 1,159 | 1,701 | 586 | 290 | |||||||||||||||
| Income tax expense (benefit) | (3,137 | ) | 608 | 600 | 860 | 2,030 | ||||||||||||||
| Net loss | (91,897 | ) | (14,876 | ) | (22,480 | ) | (27,687 | ) | (1,828 | ) | ||||||||||
| Basic and diluted loss per share | $ | (3.85 | ) | $ | (0.63 | ) | $ | (0.95 | ) | $ | (1.18 | ) | $ | (0.08 | ) | |||||
| At October 31: | ||||||||||||||||||||
| Cash and cash equivalents | $ | 20,018 | $ | 24,297 | $ | 33,094 | $ | 46,901 | $ | 29,235 | ||||||||||
| Marketable securities | - | - | - | 213 | 16,223 | |||||||||||||||
| Accounts receivable, net (4) | 6,834 | 11,752 | 17,497 | 22,768 | 41,852 | |||||||||||||||
| Total assets | 68,967 | 162,780 | 175,198 | 197,328 | 232,744 | |||||||||||||||
| Long-term debt, excluding current portion | - | - | 18 | 57 | 42 | |||||||||||||||
| Deferred revenue (4) | 44,921 | 44,600 | 40,814 | 40,431 | 51,575 | |||||||||||||||
| Total liabilities | 58,911 | 62,045 | 60,748 | 62,501 | 73,294 | |||||||||||||||
| Stockholders' equity | $ | 10,056 | $ | 100,735 | $ | 114,450 | $ | 134,827 | $ | 159,450 | ||||||||||
| (1) | In 2006, we began transitioning our business model from one that sells one-time perpetual licenses to our software, for which revenue is generally recognized up-front upon delivery, to one that sells subscription-based products, for which revenue is recognized over the subscription period. As a result, this transition will affect the comparability of our revenues and profitability from period to period until it is complete. |
| (2) | Gross profit was reduced by asset impairment charges related to: |
| 2008 | 2007 | 2006 | 2005 | 2004 | ||||||||||||||||
| Capitalized product development | $ | 5,085 | $ | 531 | $ | - | $ | 4,412 | $ | - | ||||||||||
| Purchased technology intangible assets | - | - | 1,089 | 8,782 | - | |||||||||||||||
| $ | 5,085 | $ | 531 | $ | 1,089 | $ | 13,194 | $ | - | |||||||||||
See Notes 7 and 8 to the Consolidated Financial Statements.
| (3) | For additional detailed information see Note 8 to the Consolidated Financial Statements. |
| (4) | To conform to the Balance Sheet presentation used in 2008, we reduced accounts receivable and deferred revenue for 2007 and 2006 by amounts not billed under non-cancelable subscription agreements. These amounts totaled $4,523 and $1,032 as of October 31, 2007 and 2006, respectively. |
ITEM 7. MANAGEMENT’S DISCUSSION AND ANALYSIS OF FINANCIAL CONDITION AND RESULTS OF OPERATIONS
Fiscal Year
Our fiscal year is from November 1 to October 31. Unless otherwise stated, references to the years 2008, 2007, and 2006 relate to the fiscal years ended October 31, 2008, 2007, and 2006, respectively. References to future years also relate to our fiscal year ending October 31.
Critical Accounting Policies and Estimates
Our discussion and analysis of financial condition and results of operations is based upon our consolidated financial statements, which have been prepared in accordance with accounting principles generally accepted in the United States of America. The preparation of these financial statements requires us to make estimates and judgments that affect the reported amounts of assets, liabilities, revenues, and expenses. We continually evaluate our critical accounting policies and estimates, and have identified the policies relating to the following areas as those that are significant to our financial statement presentation, and require difficult, subjective, or complex judgments:
| · | Revenue recognition |
| · | Capitalized product development costs |
| · | Valuation of our deferred income taxes |
| · | Valuation and impairment analysis of goodwill and identified intangible assets |
Our discussion of these policies is intended to supplement, but not replace, the more detailed discussion of these and other accounting policies and disclosures contained in the Notes to Consolidated Financial Statements.
Revenue Recognition. We derive our revenues from three sources: (1) subscription revenues, which are comprised of subscription fees from customers accessing our online, web-based products; (2) license revenues from non-cancelable perpetual license agreements; and (3) related professional and support services and other revenue.
We recognize revenue when all of the following conditions are met:
| · | There is persuasive evidence of an arrangement; |
| · | Access to our online subscription products has been provided to the customer or the perpetual courseware has been delivered; |
| · | The amount of fees to be paid by the customer is fixed and determinable; and |
| · | The collectability of the fee is probable. |
Revenue from the licensing of software under subscription arrangements is recognized on a ratable basis over the subscription period starting the later of the first day of the subscription period or when all revenue recognition criteria identified above have been met. Amounts that have been invoiced are recorded in accounts receivable and in deferred revenue or revenue, depending on whether the revenue recognition criteria have been met. Amounts due under non-cancelable subscription agreements are not recognized in accounts receivable or deferred revenue until such amounts are invoiced to the customer.
We also provide professional services, which consist of training and implementation services, as well as ongoing customer support and maintenance. Training and implementation services are not essential to the functionality of our software products. Revenues from these services are recognized separately upon delivery where there is objective and reliable evidence of fair value of each deliverable. Software support revenue is deferred and recognized ratably over the support period.
For revenue arrangements with multiple deliverables, we allocate the total amount the customer will pay to the separate units of accounting based on their relative fair values, as determined by the price of the undelivered items when sold separately.
If collectability of the fee is not probable, revenue is recognized as payments are received from the customer provided all other revenue recognition criteria have been met. If the fee due from the customer is not fixed or determinable, revenue is recognized as the payments become due provided all other revenue recognition criteria have been met.
Capitalized Product Development Costs. Our investments in product development are significant, and the rules that govern how these costs are accounted for in our financial statements can have a significant impact on our operating results from period to period.
Our product development costs relate to the research, development, enhancement, and maintenance of our perpetual and subscription-based software products. We account for software development costs in accordance with the provisions of SFAS No. 86. “Accounting for the Costs of Computer Software to be Sold, Leased or Otherwise Marketed.” Costs related to the initial design and development of new products and the routine enhancement and maintenance of existing products are expensed as incurred. When projects reach technological feasibility we begin capitalization of the related project costs. Capitalization ends when a product is available for general release to our customers, at which time amortization of the capitalized costs begins. The amortization of these costs is included in cost of revenues related to license fees and subscriptions.
We evaluate our capitalized costs on a quarterly basis to determine if the unamortized cost related to any product, or group of products, exceeds its estimated net realizable value. Estimating net realizable value requires us to use judgment in projecting future revenues and cash flows to be generated by the product and thereby quantifying the amount, if any, to be written off. Actual cash flows realized could differ materially from those estimated. In addition, any future changes to our software product offerings could result in write-offs of previously capitalized costs and have a significant impact on our consolidated results of operations. Our analysis as of October 31, 2008 and 2007 resulted in impairment charges on these assets of $4.6 million and $0.5 million, respectively.
Valuation of Deferred Income Taxes. Our accounting policy for the valuation of deferred income taxes is considered critical for several reasons. Significant judgment is required in the assessment of the need for a valuation allowance. In addition, income tax accounting rules, in combination with purchase accounting rules applied in the acquisition of Lightspan in 2004, resulted in a complex tax accounting situation in which, until 2008, we have not recognized tax benefits on operating losses or on the realization of deferred tax assets, but regardless of our operating results, have been recognizing tax expense on future tax liabilities related to tax deductible goodwill.
The majority of our deferred tax assets represent net operating loss carryforwards which are available to offset future taxable income. These loss carryforwards include those acquired in the acquisition of Lightspan in 2004, as well as carryforward losses that existed prior to, or were incurred after, the acquisition. Our ability to realize the benefit of these loss carryforwards is dependent upon our ability to generate future taxable income., Our history of cumulative operating losses over the past several years has led to our current assessment that it is more likely than not that our net deferred taxes will not be realized. As a result, our deferred tax assets are fully reserved and will remain fully reserved until the related tax benefits are realized through the generation of taxable income in a particular year, or until we can demonstrate a history of generating taxable income.
Until 2008, our calculation of net deferred tax assets excluded a deferred tax liability related to tax deductible goodwill. The timing of the reversal of this difference was considered indefinite because it would not reverse until the underlying assets that created the goodwill were disposed of or sold. In 2008, the goodwill was determined to be fully impaired, and as a result, the deferred tax liability associated with tax deductible goodwill was reversed.
Goodwill and Identified Intangible Assets. Goodwill and identified intangible assets are recorded when the purchase price paid for an acquisition exceeds the fair value of the tangible assets acquired. Most of the companies we have acquired have not had significant tangible assets. As a result, a significant portion of the purchase price paid in acquisitions has been allocated to identified intangible assets and/or goodwill.
Identified intangible assets are amortized to expense over their expected useful lives and goodwill is not amortized. Once established, these assets are subject to periodic impairment assessments to determine if their current carrying values are recoverable based on information available at the time these assessments are made. Significant assumptions and estimates are required in making these assessments. Accordingly, the assumptions and estimates we use in implementing this policy affect the amount of identified intangible asset amortization and impairment charges, if any, reflected in our operating results. Our impairment assessments at October 31, 2008 resulted in the elimination of goodwill and a related impairment charge of $71.9 million, and impairment charges of $1.9 million on identified intangible technology and customer assets acquired in previous acquisitions. There were no impairment charges on identified intangible assets or goodwill in 2007.
General Factors Affecting our Financial Results
There are a number of general factors that affect our results from period to period. These factors are discussed below.
Revenue. We are transitioning our business model from one that sells one-time perpetual licenses to our software, for which revenue is generally recognized up-front upon delivery, to one that sells subscription-based products, for which revenue is recognized over the subscription period. As a result, this transition will affect the comparability of our revenues from period to period until it is complete. The transition became most evident in 2006 when we introduced many of our new subscription-based products. As subscription revenues grow as a percentage of total revenues, we expect our period to period revenues to become more comparable and predictable.
Because subscription revenues are recognized ratably over the future subscription period, changes in subscription revenue lag behind changes in orders for subscription products. Periods of strong subscription order growth and increasing deferred revenue balances are generally followed by periods of strong subscription revenue growth, and vice versa. In 2008, a meaningful, but declining portion of our revenues continued to be derived from sales of perpetual licenses to our software products. These revenues are reported as license fees in our consolidated statement of operations. Changes in the quantity and size of individual license fee transactions can have a significant impact on revenues in a period. Our business is also seasonal, with the largest portion of our license fees typically coming in the third and fourth quarters of our fiscal year, and professional service fees being the greatest during periods in which schools are in session. Subscription revenues are less seasoned because they are recognized ratably over the subscription period. While this seasonality does not generally impact the comparability of our annual results, it can significantly impact our results from quarter to quarter.
Gross Profit. Our gross profit during a period is dependent on a number of factors. License fee revenues historically have had high gross profit due to the low direct cost of delivering these products. As a result, the mix of license fee revenues to total revenues in a given period significantly influences reported total gross profit. In addition, a large portion of our costs of revenue are fixed in nature. These costs include amortization of capitalized software development and purchased technology, depreciation and other infrastructure costs to support our hosted subscription services, customer support operations, and full-time professional services personnel who deliver our training services. Accordingly, increases in revenues allow us to leverage these costs resulting in higher gross profit, while decreases in revenues have the opposite effect.
Operating Expenses. General and administrative expenses are substantially fixed in nature. However, certain components such as our provision for bad debts, professional fees, and other expenses can vary based on business results, individual events, or initiatives we may be pursuing at various times throughout the year.
Incentive compensation is a significant variable component of our sales and marketing expenses, approximating 8% to 9% of total revenues in any given period. Sales and marketing expenses also include costs such as travel, tradeshows, and conferences that can vary with revenue activity or individual events that occur during the period.
Product maintenance and development expense in our consolidated statement of operations does not reflect our total level of spending in these areas. Costs to enhance or maintain existing products, or to develop products prior to achieving technological feasibility, are charged to product maintenance and development expense as incurred. Costs incurred to develop new products after technological feasibility is achieved, which represent the majority of our total development spending, are capitalized and amortized to cost of revenues. Accordingly, product maintenance and development expense in our consolidated statement of operations can fluctuate from period to period, in terms of both total dollars and as a percentage of revenue, based on the nature and timing of activities occurring during the period.
Amortization of intangibles represents the amortization of certain identified intangible assets acquired through various acquisitions. While these expenses are generally predictable from period to period because they are fixed over the course of their individual useful lives, they can be affected by events and other factors that result in impairment of these assets and a corresponding reduction in future amortization.
Non-GAAP Financial Measures
The following discussion and analysis of our financial condition and results of operations includes non-GAAP financial measures, identified in the reconciliations below, that is not prepared in accordance with generally accepted accounting principles and may be different from non-GAAP financial measures used by other companies. Non-GAAP financial measures should not be considered as a substitute for, or superior to, measures of financial performance prepared in accordance with GAAP. These non-GAAP financial measures have been used because we believe they are useful to investors by providing greater transparency to supplemental information used in our internal financial and operational analysis. Investors are encouraged to review the following reconciliations of the non-GAAP financial measures used herein to their most directly comparable GAAP financial measures as provided with our consolidated financial statements.
Reconciliation of GAAP Net Loss and Loss Per Share to Non-GAAP Net Loss and Loss Per Share Before Impairments, Restructuring and Other Charges and Benefits (in thousands, except per share amounts)
| 2008 | 2007 | 2006 | ||||||||||
| Net Loss: | ||||||||||||
| Net loss, as reported | $ | (91,897 | ) | $ | (14,876 | ) | $ | (22,480 | ) | |||
| Goodwill impairment | 71,865 | - | - | |||||||||
| Income tax benefit related to goodwill impairment change | (3,137 | ) | - | - | ||||||||
| Restructuring, impairment and other charges | 11,833 | 53 | 10,182 | |||||||||
| Net loss before impairments, restructuring and other charges and benefits | $ | (11,336 | ) | $ | (14,823 | ) | $ | (12,298 | ) | |||
| Loss per Share (basic and diluted): | ||||||||||||
| Loss per share , as reported | $ | (3.85 | ) | $ | (0.63 | ) | $ | (0.95 | ) | |||
| Goodwill impairment | 3.01 | - | - | |||||||||
| Income tax benefit related to goodwill impairment charge | (0.13 | ) | - | - | ||||||||
| Restructuring, impairment and other charges | 0.49 | 0.01 | 0.43 | |||||||||
| Loss per Share before impairments, restructuring and other charges and benefits | $ | (0.48 | ) | $ | (0.62 | ) | $ | (0.52 | ) | |||
| Basic and diluted weighted average common shares outstanding (GAAP) | 23,854 | 23,754 | 23,679 | |||||||||
Reconciliation of GAAP Operating Expense to Non-GAAP Operating Expenses before Impairments, Restructuring and Other Charges (in thousands)
| 2008 | 2007 | 2006 | ||||||||||
| Total operating expenses, as reported | $ | 122,221 | $ | 47,540 | $ | 73,517 | ||||||
| Goodwill impairment | 71,865 | - | - | |||||||||
| Restructuring, impairment and other charges (benefit) | 6,748 | (478 | ) | 9,093 | ||||||||
| Operating expenses before impairments, restructuring and other charges | $ | 43,608 | $ | 48,018 | $ | 64,424 | ||||||
Overview of Financial Results
The transition of our company to a software-as-a-service (“SaaS”) business model that began in 2005 continued throughout 2006, 2007 and most of 2008. Although revenues in 2008 continued to be adversely affected by declining emphasis on sales of legacy perpetual products and related software maintenance, strong growth in subscription revenues on our SaaS products have now substantially offset these declines. Compared to 2007, total 2008 revenues declined $1.2 million, or 1.8%, to $68.4 million.
Our cost management activities throughout the transition have led to significant declines in the costs of operating our business. Together with the moderating revenue declines, these cost declines led to an improvement in our 2008 non-GAAP net loss excluding impairments, restructuring and other charges and benefits, to ($11.3) million, or ($0.48) per share, from ($14.8) million, or ($0.62) per share, in 2007. On a GAAP basis, our net loss was ($91.9) million for 2008 compared to ($14.9) million for 2007, with the increase primarily attributable to the non-cash impairment charge to goodwill described below.
In each of the years of our SaaS transition we have incurred impairment, restructuring and other charges that were generally unrelated to our day-to-day operating activities, but were a necessary part of our long-term transition. In 2008 we recorded a non-cash impairment charge of $71.9 million on goodwill acquired in acquisitions made prior to launching our SaaS strategy, $6.5 million in non-cash impairment charges on software development costs and previously acquired intangible assets, and $5.3 million in cash restructuring and other charges related to a transition in our leadership and activities that we believe will ensure continued operating expense savings in 2009.
By the end of 2008, we completed the first phase of our transition strategy marked by the achievement of double-digit order and revenue growth from our new internet-based subscription products, the moderation of our product investment to levels consistent with our long-term business model, reduction in our cost structure to ensure we move closer to profitability in 2009, and the transition to a new generation of leadership to execute the next phase of our strategy.
We will continue in 2009 to execute the next phase of our long-term strategy, focusing on refining our interactions with customers, building out our product capabilities and how we package and sell them in the market, and improving the overall experience of our customers. We will continue to develop our sales organization and look forward to building continuous relationships with our customers throughout the entire subscription life cycle. The financial effects of the transition to subscription products, however, may continue to adversely affect the comparability of our year-over-year financial results in the near term. This and other risks we face in our business are discussed in more detail in Item 1A of Part I of this report.
Results of Operations
Our discussion and analysis of results of operations should be read in conjunction with the section above captioned “General Factors Affecting our Financial Results”.
Revenues
The following tables summarize certain key information to aid in the understanding of our discussion and analysis of revenues:
Sales Order Information (in thousands)
| 2008 | 2007 | 2006 | ||||||||||||||||||
| Amount | Change from 2007 | Amount | Change from 2006 | Amount | ||||||||||||||||
| Order Value: | ||||||||||||||||||||
| Subscriptions | 43,585 | 19.8 | % | 36,368 | 38.5 | % | 26,259 | |||||||||||||
| License fees | 7,886 | (53.4 | %) | 16,931 | (54.2 | %) | 36,974 | |||||||||||||
| Services | 20,637 | (15.3 | %) | 24,377 | (16.5 | %) | 29,177 | |||||||||||||
| $ | 72,108 | (7.2 | %) | $ | 77,676 | (15.9 | %) | $ | 92,410 | |||||||||||
| Percent of Total Order Value: | ||||||||||||||||||||
| Subscriptions | 60 | % | 47 | % | 29 | % | ||||||||||||||
| License fees | 11 | % | 22 | % | 40 | % | ||||||||||||||
| Services | 29 | % | 31 | % | 31 | % | ||||||||||||||
| 100 | % | 100 | % | 100 | % | |||||||||||||||
Revenue by Category (in thousands)
| 2008 | 2007 | 2006 | ||||||||||||||||||
| Amount | Change from 2007 | Amount | Change from 2006 | Amount | ||||||||||||||||
| Subscriptions | $ | 35,221 | 45.7 | % | $ | 24,173 | 33.0 | % | $ | 18,176 | ||||||||||
| License fees | 8,458 | (52.2 | %) | 17,712 | (52.5 | %) | 37,322 | |||||||||||||
| Services | 24,722 | (10.9 | %) | 27,747 | (21.2 | %) | 35,221 | |||||||||||||
| $ | 68,401 | (1.8 | %) | $ | 69,632 | (23.2 | %) | $ | 90,719 | |||||||||||
2008 vs. 2007.
Total revenues decreased $1.2 million, or 1.8%, to $68.4 million in 2008. Subscription revenues increased $11.0 million, or 45.7%, to $35.2 million as strong growth in subscription product orders in 2007 and 2008 were recognized as revenue over the portion of the subscription periods occurring in 2008. While subscription revenue growth was strong, it was not sufficient to fully offset a decline in license fees and services revenues. Our strategic shift away from legacy perpetual software products resulted in a $9.3 million, or 52.2%, decline in license fee revenues to $8.5 million. Services revenues declined 10.9% to $24.7 million due primarily to a decline in software support revenues on previously purchased perpetual products.
Total orders declined from $77.7 million in 2007 to $72.1 million in 2008, reflecting a slowing of orders in the second half of the fourth quarter of 2008 as news worsened on the broader U.S. economy and school districts put spending decisions on hold as they evaluated the effects on their budgets. The order decline also reflects the continuing transition from selling products that are licensed on a perpetual basis, which have higher one-time selling prices, to those that are licensed on a subscription basis, which have lower selling prices but are renewable at the end of each subscription period.
2007 vs. 2006.
Total revenues decreased 23.2% to $69.6 million in 2007 from $90.7 million in 2006, due primarily to the $19.6 million decline in perpetual license fee revenues that reflected our shifting sales emphasis from legacy perpetual products to subscription products delivered on PLE. Subscription revenues increased 33.0% compared to 2006 and surpassed license revenue as a percent of total revenue. Services revenues declined 21.2% from 2006 on a decline in revenues from professional services and technical services, which are tied closely to perpetual license orders.
Gross Profit
To aid in the understanding of our discussion and analysis of gross profit, the following tables summarize the percentage of total revenue, and the gross profit percentage for each revenue category:
Gross Profit Percentage
| Increase (Decrease) | ||||||||||||||||||||
| Revenue Category | 2008 | 2007 | 2006 | 2007 to 2008 | 2006 to 2007 | |||||||||||||||
| Subscriptions | 47.0 | % | 35.7 | % | 50.5 | % | 11.3 | % | (14.8 | %) | ||||||||||
| License fees | 37.6 | % | 52.6 | % | 64.6 | % | (15.0 | %) | (12.0 | %) | ||||||||||
| Services | 49.7 | % | 53.0 | % | 50.3 | % | (3.3 | %) | 2.7 | % | ||||||||||
| Total (1) | 39.4 | % | 46.1 | % | 55.0 | % | (6.7 | %) | (8.9 | %) | ||||||||||
(1) Asset impairment charges of $5.1 million, $0.5 million and $1.1 million in 2008, 2007 and 2006, respectively, are reflected in the Total Gross Profit Percentage in the table, but are not reflected in the individual revenue category gross profit percentages.
Percentage of Total Revenue
| Revenue Category | 2008 | 2007 | 2006 | |||||||||
| Subscriptions | 51.5 | % | 34.7 | % | 20.0 | % | ||||||
| License fees | 12.4 | % | 25.4 | % | 41.2 | % | ||||||
| Services | 36.1 | % | 39.9 | % | 38.8 | % | ||||||
| Total | 100.0 | % | 100.0 | % | 100.0 | % | ||||||
2008 vs. 2007
The total gross profit percentage declined to 39.4% in 2008, and includes the negative effect of $5.1 million in asset impairment charges which had the effect of decreasing 2008 reported margins by 7.4 percentage points compared to a total gross profit margin in 2007 of 46.1%.
The changes from 2007 to 2008 in the gross profit percentages of each revenue category were as follows:
| · | The increase in the subscription gross profit percentage, from 35.7% in 2007 to 47.0% in 2008, reflects the lower delivery and support costs of our internet-based subscription products. Subscription revenues increased $11.0 million while increases in subscription related product development amortization, royalty costs and support services increased only $3.1 million, resulting in a gross profit percentage on incremental subscription revenues of approximately 72%. |
| · | The decline in the license fee gross profit percentage, from 52.6% in 2007 to 37.6% in 2008, was the result of lower license fee revenues, as discussed above, on a base of primarily fixed costs including amortization of product development and purchased intangibles, and distribution costs. |
| · | The decrease in the services gross profit percentage, from 53.0% in 2007 to 49.7% in 2008, was due to a decrease in the mix of higher margin software support services revenues which are tied closely to perpetual license orders. |
2007 vs. 2006
The 2007 total gross profit percentage decreased to 46.1% in 2007 from 55.0% in 2006, primarily due to the decline in higher margin license fee revenue. Higher margin license fee revenues decreased from 41.2% to 25.4% of total revenue, while subscription revenues, which were still in an early-stage growth period and experiencing lower margins, increased from 20.0% to 34.7% of total revenues. These changes in revenue mix were due to the factors discussed under “Revenues” above.
The changes from 2006 to 2007 in the gross profit percentages of each revenue category were as follows:
| · | The decrease in the subscription gross profit percentage, from 50.5% in 2006 to 35.7% in 2007, was due to an increase in product development amortization on new subscription products released in 2006 and 2007, combined with the reallocation of customer support resources from legacy to new subscription products in response to the growth in subscription customers, partially offset by the increase in subscription revenue. |
| · | The decline in the license fee gross profit percentage, from 64.6% in 2006 to 52.6% in 2007, was the result of lower license fee revenues, as discussed above, on a base of primarily fixed costs including amortization of product development and purchased intangibles, and distribution costs. |
| · | The increase in the services gross profit percentage, from 50.3% in 2006 to 53.0% in 2007, was due to improvements in productivity and utilization of resources in our professional services organization, and to an increase in the mix of higher margin software support services revenues which have low variable costs. |
Operating Expenses
To aid in the understanding of our discussion and analysis of our operating expenses, the following table summarizes the amount and percentage change in the amounts from the previous year for certain operating expense line items:
| Amount, in thousands | Increase (Decrease) | |||||||||||||||||||
| 2008 | 2007 | 2006 | 2007 to 2008 | 2006 to 2007 | ||||||||||||||||
| Sales and marketing | $ | 27,632 | $ | 29,849 | $ | 38,598 | (7.4 | %) | (22.7 | %) | ||||||||||
| General and administrative | 10,366 | 12,095 | 16,619 | (14.3 | %) | (27.2 | %) | |||||||||||||
| Product maintenance and development | 4,060 | 4,334 | 5,496 | (6.3 | %) | (21.1 | %) | |||||||||||||
| Amortization of intangibles | 1,550 | 1,740 | 3,711 | (10.9 | %) | (53.1 | %) | |||||||||||||
| Operating expenses excluding impairments, restructuring and other charges | 43,608 | 48,018 | 64,424 | (9.2 | %) | (25.5 | %) | |||||||||||||
| Goodwill impairment | 71,865 | - | - | N/A | N/A | |||||||||||||||
| Restructuring, impairment and other charges | 6,748 | (478 | ) | 9,093 | (1511.7 | %) | N/A | |||||||||||||
| Total operating expenses | $ | 122,221 | $ | 47,540 | $ | 73,517 | 157.1 | % | (35.3 | %) | ||||||||||
2008 vs. 2007
Total operating expenses in 2008 increased to $122.2 million and included $78.6 million in impairments, restructuring and other charges. See further discussion below and Note 14 to consolidated financial statements for a detailed description of these charges. Operating expenses excluding impairments, restructuring and other charges, declined 9.2% to $43.6 million in 2008 compared to $48.0 million in 2007.
Sales and marketing expenses declined to $27.6 million in 2008 as compared to $29.8 million in 2007. This decrease primarily reflects improved management of indirect sales and marketing costs and better leveraging of our inside sales resources. None of the decline was due to a reduction in the number of direct field sales representatives which remained approximately the same from 2007 to 2008.
General and administrative expenses declined 14.3% to $10.4 million in 2008 as compared to $12.1 million in 2007, due primarily to reductions in labor and incentive costs and declines in the cost of compliance activities and internal business systems support.
Product maintenance and development expenses for 2008 were $4.1 million compared to $4.3 million for 2007. The reduction in product maintenance and development expenses reflects the increasing stability of our PLE platform and efficiencies built into delivering new releases of the platform. Total product development spending, which represents the combination of spending on projects that are capitalized and those that are expensed, was $14.7 million in 2008, or 21.5% of total revenues, compared to total spending in 2007 of $20.0 million, or 28.8% of total revenues. The decline reflects completion of a three year product roadmap for the first phase of our SaaS strategy initiated in late 2005.
Amortization of intangibles represents the amortization of identified intangible assets, other than technology, acquired in acquisitions. Amortization of $1.6 million in 2008 represented a decrease of 10.9% from 2007 as certain assets acquired in earlier acquisitions became fully amortized during 2008.
Operating expenses in 2008 include a non-cash impairment charge of $71.9 million on goodwill acquired in multiple acquisitions between 2000 and 2003. The assets from these acquisitions are not a material part of our current SaaS strategy. As described in our critical accounting policies, we account for goodwill under the provisions of SFAS No. 142, Goodwill and Other Intangible Assets (“SFAS 142”). SFAS 142 requires that goodwill be reviewed for potential impairment annually, or when events or changes in circumstances indicate the carrying value of the goodwill might exceed its current fair value. One of the indicators of impairment is a sustained decline in a company’s share price whereby market capitalization of the company is less than its book value for an extended period of time. We began to experience such a decline starting in March 2008. After trading in a range near our book value throughout the summer, we experienced a further decline in our stock price as the financial markets reacted to the credit crisis facing major lending institutions, and worsening conditions in the overall economy. Additionally the Company has experienced operation losses during the past three years while the Company has experienced growth in subscription product orders in fiscal 2007 and fiscal 2008, subscription revenue was not sufficient to fully offset a decline in license fees and service revenues during those years. As a result of these factors, we concluded in the fourth quarter of 2008 that our recorded goodwill was impaired.
Under SFAS 142, the determination of the amount of the impairment required that the fair values of our assets and liabilities be determined as if we had been acquired in a hypothetical business combination with a purchase price equal to the market capitalization of our company as of October 31, 2008, adjusted for certain factors that might reasonably affect the value of our company if purchased in an actual acquisition. The estimates and assumptions used in determining the hypothetical purchase price and fair value determinations are inherently subject to uncertainty.
Under accounting rules for business combinations, goodwill exists only if the purchase price exceeds the fair value of the net assets of the acquired entity. Our impairment analysis concluded that the purchase price as determined above was less than the sum of the fair value of our identified tangible and intangible assets, less the fair value of our liabilities. Accordingly, no value was assigned to goodwill resulting in full impairment of goodwill and a related non-cash charge to 2008 operating results of $71.9 million. The impairment of goodwill is not expected to have any impact on our day-to-day business operations, liquidity or long-term SaaS strategy.
Impairment, restructuring and other charges consist of $1.4 million in non-cash impairment charges on previously acquired intangible assets, and $5.3 million in cash and non-cash charges related to achieving continued cost efficiencies in our SaaS business model, and the transition of our CEO in late 2008.
2007 vs. 2006
Total operating expenses in 2007 were $47.5 million, down from $73.5 million in 2006, which included $9.1 million in impairment, restructuring and other charges. Excluding these charges in both years, operating expenses declined 25.5% to $48.0 million.
Sales and marketing expenses declined to $29.8 million in 2007 as compared to $38.6 million in 2006. This decrease primarily reflects changes made early in 2007 to reduce the level of field sales resources, concentrate the remaining resources in the territories with the largest market potential, and better leverage of our inside sales organization. Also contributing to the decline was a decrease in commissions resulting from the decrease in revenues.
General and administrative expenses were $12.1 million in 2007 as compared to $16.6 million in 2006 due primarily to reductions in labor costs, external audit fees, and legal expenses.
Product maintenance and development expenses for 2007 were $4.3 million compared to $5.5 million reported for 2006. The reduction in product maintenance and development expenses reflects lower maintenance costs on legacy products and lower start-up costs on new product investments. Total product development spending, which represents the combination of spending on projects that are capitalized and those that are expensed, was $20.0 million in 2007, or 28.8% of total revenues, compared to total spending in 2006 of $20.8 million, or 22.9% of total revenues.
Amortization of intangibles represents the amortization of identified intangible assets, other than technology, acquired in acquisitions. Amortization of $1.7 million in 2007 represented a decrease of 53.1% from 2006 as certain assets acquired in earlier acquisitions were either impaired during 2006 or became fully amortized during 2007.
Interest Income
Interest income decreased from $1.3 million in 2007 to $0.5 million in 2008. This decrease is due to lower average cash and cash equivalents balances as well as a decline in interest rates earned on these balances.
Interest income decreased from $1.7 million in 2006 to $1.3 million in 2007. This decrease reflected a decline in our average cash and cash equivalents balances, partially offset by higher interest rates earned on these investments.
Income Taxes
As discussed earlier under the caption “Critical Accounting Policies and Estimates,” our net deferred tax assets, excluding the deferred tax liability relating to tax deductible goodwill, are fully reserved. Accordingly, we do not record a current income tax benefit related to our current year operating losses.
Prior to 2008, certain tax deductible goodwill could not be used to offset other net deferred tax assets resulting in the recording of income tax expense related to this liability of $0.6 million in 2007 and 2006. In 2008, the full impairment of the tax-deductible goodwill, as discussed above, resulted in the reversal of the cumulative deferred tax liability and a corresponding income tax benefit of $3.1 million.
We implemented the provisions of FIN 48, Accounting for Uncertainty in Income Taxes – and Interpretation of FASB Statement No. 109, effective November 1, 2007. The impact of adopting FIN 48 on our consolidated financial statements was not material and no cumulative effect adjustment was recorded to the November 1, 2007 balance of accumulated deficit. We did however increase our gross deferred tax assets by $11.5 million, related to the increase in the value of our net operating losses due to adjustments to tax limitations on the utilization of net operating losses.
Liquidity and Capital Resources
At October 31, 2008, our principal sources of liquidity included cash and cash equivalents totaling $20.0 million and net billed accounts receivable of $6.8 million and unbilled commitments from customers under non-cancelable subscription contracts totaling $8.9 million, of which $4.5 million is expected to be collected in 2009. In addition, on June 4, 2007, we entered into a three-year senior secured credit facility which provides us with a revolving line of credit up to the lesser of $20 million or one times our trailing twelve months subscription and maintenance revenue. Under the agreement, we have the option of selecting an interest rate for any drawdown under the facility equal to the applicable Prime or Libor Rate plus a sliding margin that is based on the amount of borrowings outstanding. Borrowings under the agreement are secured by all of our assets. Financial covenants are limited to annual maximums on capitalized software development spending, and minimum quarterly thresholds of earnings before interest, taxes, depreciation and amortization (EBITDA) which are tested only when the unused portion of the line of credit plus our cash and cash equivalents on hand is less than $12.5 million. We capitalized legal and banking fees of $523,000 associated with this credit facility in 2007. These costs are being amortized over the three-year term of the agreement. There were no draw-downs on this facility in 2008 or 2007.
Our cash provided by operations declined to $6.5 million in 2008 from $9.7 million, due primarily to the decline in total orders discussed above, partially offset by reductions in overall spending. Cash used in investing activities declined to $11.0 million in 2008, from $17.9 million in 2007. The significant decline in net cash used in investing activities from 2007 to 2008 reflected a reduction in our product investment requirements based on the completion of the conversion of our extensive content to the PLE environment. These changes from 2007 to 2008 resulted in a decrease in our cash and cash equivalents of $4.3 million for the year ended October 31, 2008. While our investing in product development has been significant over the past three years, we expect positive cash flow from operations to continue in future periods. See the section captioned “Outlook” below for a further discussion of expected fiscal year 2009 cash balances.
Our principal commitments consist of future minimum payments due under operating leases, royalty and non-cancelable software license agreements. In addition, any future borrowings under our revolving loan agreement as discussed above would require future use of cash. At October 31, 2008, the future minimum payments under these commitments were as follows:
| Payments Due by Period (in thousands) | ||||||||||||||||||||
| Contractual Obligations | Total | 1 Year or Less | 1 to 3 Years | 3 to 5 Years | More than 5 Years | |||||||||||||||
| Operating leases | $ | 3,076 | $ | 1,682 | $ | 1,164 | $ | 230 | $ | - | ||||||||||
| Royalty agreements | 4,360 | 2,160 | 2,200 | - | - | |||||||||||||||
| Non-cancelable software license agreements | 449 | 222 | 227 | - | - | |||||||||||||||
| Capital leases obligations | 15 | 9 | 6 | - | - | |||||||||||||||
| Total | $ | 7,900 | $ | 4,073 | $ | 3,597 | $ | 230 | $ | - | ||||||||||
A number of our operating lease agreements provide us with the option to renew. Our future lease obligations would change if we exercised these options.
Purchase orders are not included in the table above. Our purchase orders represent authorizations to purchase rather than binding agreements. The contractual commitment amounts in the table above are associated with agreements that are enforceable and legally binding and that specify all significant terms, including fixed or minimum services to be used, fixed minimum or variable price provisions, and the approximate timing of the transaction. Obligations under contracts that we can cancel without significant penalty are not included in the table above.
We believe our existing cash, cash equivalents, anticipated cash provided by operating activities, and availability under our line of credit will be sufficient to meet our working capital and capital expenditure needs over the next 12 months. Our future capital requirements will depend on many factors, including the timing and extent of product development expenditures, order volume, and the timing and collection of receivables.
Disclosures about Off-Balance Sheet Arrangements
We did not have any off-balance sheet arrangements as of October 31, 2008 or October 31, 2007.
Fiscal Year 2009 Outlook
While our view of fiscal 2009 is complicated by the effect of current economic conditions on school budgets, we believe we can achieve high single-digit subscription order growth, low double digit subscription revenue growth, and continued improvement in subscription margins in 2009. We expect cost of revenue and operating expenses in 2009 to decline from fiscal 2008 amounts excluding impairments, restructuring and other charges, by nearly $8 million, and our capitalized software product investment to moderate to between $5.0 million and $6.0 million. We expect cash balances will decline seasonally throughout the first half of the fiscal year, and build throughout the second half of the year, with year end 2009 cash balances expected to achieve or slightly exceed year end fiscal 2008 balances.
Interest Rate Risk
On June 4, 2007, we entered into a three-year senior secured credit facility which provides us with a revolving line of credit up to the lesser of $20 million or one times our trailing twelve months subscription and maintenance revenue. Under the agreement we have the option of selecting an interest rate for any drawdown under the facility equal to the applicable Prime or Libor Rate plus a sliding margin that is based on the amount of borrowings outstanding. There were no borrowings outstanding at October 31, 2008 or 2007.
Foreign Currency Exchange Rate Risk
Our foreign operations are not a significant component of our business, and as a result, risks relating to foreign currency fluctuation are considered minimal.
New Accounting Pronouncements
In May 2008, the FASB issued Statement of Financial Accounting Standards (“SFAS”) No. 162, “The Hierarchy of Generally Accepted Accounting Principles.” SFAS No. 162 identifies the sources of accounting principles and the framework for selecting the principles used in the preparation of financial statements of nongovernmental entities that are presented in accordance with U.S. Generally Accepted Accounting Principles (“GAAP”). SFAS No. 162 concludes that the GAAP hierarchy should be directed toward the entity and not its auditor, and should reside in the accounting literature established by the FASB, as opposed to the American Institute of Certified Public Accountants (“AICPA”) Statement on Auditing Standards No. 69, “The Meaning of Present Fairly in Conformity with Generally Accepted Accounting Principles.” SFAS No. 162 is effective 60 days following the SEC’s approval of the Public Company Accounting Oversight Board (“PCAOB”) amendments to AU Section 411, “The Meaning of Present Fairly in Conformity with Generally Accepted Accounting Principles.” We do not expect SFAS No. 162 to have a material impact on our consolidated financial statements.
In April 2008, the FASB issued staff position (“FSP”) No. FAS 142-3, “Determination of the Useful Life of Intangible Assets.” FSP No. FAS 142-3 amends the factors that should be considered in developing renewal or extension assumptions used to determine the useful life of a recognized intangible asset under SFAS No. 142, “Goodwill and Other Intangible Assets.” The intent of the position is to improve the consistency between the useful life of a recognized intangible asset under SFAS No. 142 and the period of expected cash flows used to measure the fair value of the asset under SFAS No. 141R, and other U.S. generally accepted accounting principles. The provisions of FSP No. FAS 142-3 are effective for our fiscal year 2010 and are currently not expected to have a material effect on our consolidated financial statements.
In December 2007, the FASB issued SFAS No. 141(R) “Business Combinations” (“SFAS No. 141(R)”). SFAS 141(R) establishes principles and requirements for how an acquirer recognizes and measures in its financial statements the identifiable assets acquired, the liabilities assumed, any noncontrolling interest in the acquiree and the goodwill acquired. SFAS 141(R) also establishes disclosure requirements to enable the evaluation of the nature and financial effects of the business combination. SFAS 141(R) is effective as of the beginning of an entity’s fiscal year that begins after December 15, 2008, and will be adopted by us in the first quarter of fiscal 2010. SFAS 141(R) is currently not expected to have a material effect on our consolidated financial statements.
In December 2007, the FASB issued SFAS 160, Noncontrolling Interests in Consolidated Financial Statements, an amendment of ARB No. 51 (“SFAS 160”). SFAS 160 will change the accounting and reporting for minority interests, which will be recharacterized as noncontrolling interests (NCI) and classified as a component of equity. This new consolidation method will significantly change the accounting for transactions with minority interest holders. SFAS 160 is effective for fiscal years beginning after December 15, 2008, and will be adopted by us in the first quarter of fiscal year 2010. SFAS 160 is currently not expected to have a material effect on our consolidated financial statements.
In February 2007, the FASB issued SFAS No. 159, “The Fair Value Option for Financial Assets and Financial Liabilities – Including an amendment of FASB Statement No. 115,” (“SFAS No. 159”). This standard permits entities to measure many financial instruments and certain other items at fair value. The objective is to improve financial reporting by providing entities with the opportunity to mitigate volatility in reported earnings caused by measuring related assets and liabilities differently without having to apply complex hedge accounting provisions. The provisions of SFAS No. 159 are effective beginning in our fiscal year 2009 and are currently not expected to have a material effect on our consolidated financial statements.
In September 2006, the FASB issued SFAS No. 157, “Fair Value Measurements” (“SFAS No. 157”), to establish a consistent framework for measuring fair value and expand disclosures on fair value measurements. The provisions of SFAS No. 157 are effective beginning in our fiscal year 2009 and are currently not expected to have a material effect on our consolidated financial statements.
In July 2006, the FASB issued Interpretation No. 48, “Accounting for Uncertainty in Income Taxes—an interpretation of FASB Statement No. 109” (“FIN 48”). FIN 48 clarifies the accounting for uncertainty in income taxes recognized in an enterprise’s financial statements in accordance with FASB Statement 109, “Accounting for Income Taxes.” FIN 48 became effective for us in the first quarter of fiscal year 2008 and did not have a material effect on our consolidated financial statements.
ITEM 7A. QUANTITATIVE AND QUALITATIVE DISCLOSURES ABOUT MARKET RISK
The information appearing under the captions “Interest Rate Risk” and “Foreign Currency Exchange Risk” in Item 7 of this Annual Report on Form 10-K is incorporated herein by reference.
| (a)(1) | Consolidated Financial Statements: |
| Page | |
| Reports of Independent Registered Public Accounting Firms | 34 |
| Consolidated Statements of Operations for the years ended October 31, 2008, 2007, and 2006 | 38 |
| Consolidated Balance Sheets as of October 31, 2008 and 2007 | 39 |
| Consolidated Statements of Cash Flows for the years ended October 31, 2008, 2007, and 2006 | 40 |
| Consolidated Statements of Stockholders’ Equity and Comprehensive Loss for the years ended October 31, 2008, 2007, and 2006 | 41 |
| Notes to Consolidated Financial Statements | 42 |
REPORTS OF INDEPENDENT REGISTERED PUBLIC ACCOUNTING FIRMS
Board of Directors and Stockholders
PLATO Learning, Inc.
We have audited the accompanying consolidated balance sheets of PLATO Learning, Inc. and subsidiaries (the “Company”) as of October 31, 2008 and 2007, and the related consolidated statements of operations, stockholders’ equity and comprehensive loss, and cash flows for each of the two years in the period ended October 31, 2008. These consolidated financial statements are the responsibility of the Company’s management. Our responsibility is to express an opinion on these financial statements based on our audit.
We conducted our audit in accordance with the standards of the Public Company Accounting Oversight Board (United States). Those standards require that we plan and perform the audit to obtain reasonable assurance about whether the financial statements are free of material misstatement. An audit includes examining, on a test basis, evidence supporting the amounts and disclosures in the financial statements. An audit also includes assessing the accounting principles used and significant estimates made by management, as well as evaluating the overall financial statement presentation. We believe that our audits provide a reasonable basis for our opinion.
In our opinion, the consolidated financial statements referred to above present fairly, in all material respects, the consolidated financial position of PLATO Learning, Inc. and subsidiaries as of October 31, 2008 and 2007, and the results of its operations and its cash flows for each of the two years in the period ended October 31, 2008, in conformity with accounting principles generally accepted in the United States of America.
We also have audited, in accordance with the standards of the Public Company Accounting Oversight Board (United States), the Company’s internal control over financial reporting as of October 31, 2008, based on criteria established in Internal Control—Integrated Framework issued by the Committee of Sponsoring Organizations of the Treadway Commission (COSO), and our report dated January 13, 2009, expressed an unqualified opinion on the effectiveness of the Company’s internal control over financial reporting.
/s/ Grant Thornton LLP
Minneapolis, Minnesota
January 14, 2009
Board of Directors and Stockholders
PLATO Learning, Inc.
We have audited the internal control over financial reporting of PLATO Learning, Inc. and subsidiaries (the “Company”) as of October 31, 2008, based on criteria established in Internal Control—Integrated Framework issued by the Committee of Sponsoring Organizations of the Treadway Commission (COSO). The Company’s management is responsible for maintaining effective internal control over financial reporting and for its assessment of the effectiveness of internal control over financial reporting, included in the accompanying Management’s Report on Internal Control Over Financial Reporting. Our responsibility is to express an opinion on the effectiveness of the Company’s internal control over financial reporting based on our audit.
We conducted our audit in accordance with the standards of the Public Company Accounting Oversight Board (United States). Those standards require that we plan and perform the audit to obtain reasonable assurance about whether effective internal control over financial reporting was maintained in all material respects. Our audit included obtaining an understanding of internal control over financial reporting, assessing the risk that a material weakness exists, testing and evaluating the design and operating effectiveness of internal control based on the assessed risk, and performing such other procedures as we considered necessary in the circumstances. We believe that our audit provides a reasonable basis for our opinion.
A company’s internal control over financial reporting is a process designed to provide reasonable assurance regarding the reliability of financial reporting and the preparation of financial statements for external purposes in accordance with generally accepted accounting principles. A company’s internal control over financial reporting includes those policies and procedures that (1) pertain to the maintenance of records that, in reasonable detail, accurately and fairly reflect the transactions and dispositions of the assets of the company; (2) provide reasonable assurance that transactions are recorded as necessary to permit preparation of financial statements in accordance with generally accepted accounting principles, and that receipts and expenditures of the company are being made only in accordance with authorizations of management and directors of the company; and (3) provide reasonable assurance regarding prevention or timely detection of unauthorized acquisition, use, or disposition of the company’s assets that could have a material effect on the financial statements.
Because of its inherent limitations, internal control over financial reporting may not prevent or detect misstatements. Also, projections of any evaluation of effectiveness to future periods are subject to the risk that controls may become inadequate because of changes in conditions, or that the degree of compliance with the policies or procedures may deteriorate.
In our opinion, PLATO Learning, Inc. and subsidiaries maintained, in all material respects, effective internal control over financial reporting as of October 31, 2008, based on criteria established in Internal Control—Integrated Framework issued by COSO.
We also have audited, in accordance with the standards of the Public Company Accounting Oversight Board (United States), the consolidated balance sheets of PLATO Learning, Inc. and subsidiaries as of October 31, 2008, and the related consolidated statements of operations, stockholders’ equity and comprehensive loss, and cash flows for each of the two years in the period ended October 31, 2008, and our report dated January 13, 2009 expressed an unqualified opinion on those consolidated financial statements.
/s/ Grant Thornton LLP
Minneapolis, Minnesota
January 14, 2009
To the Stockholders and Board of Directors of PLATO Learning, Inc.:
In our opinion, the consolidated balance sheet as of October 31, 2006 and the related consolidated statements of operations, of statement of stockholders' equity and comprehensive loss and of cash flows for the period ended October 31, 2006 present fairly, in all material respects, the financial position of PLATO Learning, Inc. and its subsidiaries at October 31, 2006, and the results of their operations and their cash flows for the period ended October 31, 2006, in conformity with accounting principles generally accepted in the United States of America. These financial statements are the responsibility of the Company's management. Our responsibility is to express an opinion on these financial statements based on our audit. We conducted our audit of these statements in accordance with the standards of the Public Company Accounting Oversight Board (United States). Those standards require that we plan and perform the audit to obtain reasonable assurance about whether the financial statements are free of material misstatement. An audit includes examining, on a test basis, evidence supporting the amounts and disclosures in the financial statements, assessing the accounting principles used and significant estimates made by management, and evaluating the overall financial statement presentation. We believe that our audit provide a reasonable basis for our opinion.
/s/ PricewaterhouseCoopers LLP
Minneapolis, Minnesota
January 13, 2009
PLATO LEARNING, INC. AND SUBSIDIARIES
CONSOLIDATED STATEMENTS OF OPERATIONS
(In thousands, except per share amounts)
| YEAR ENDED OCTOBER 31, | ||||||||||||
| 2008 | 2007 | 2006 | ||||||||||
| REVENUES | ||||||||||||
| Subscriptions | $ | 35,221 | $ | 24,173 | $ | 18,176 | ||||||
| License fees | 8,458 | 17,712 | 37,322 | |||||||||
| Services | 24,722 | 27,747 | 35,221 | |||||||||
| Total revenues | 68,401 | 69,632 | 90,719 | |||||||||
| COST OF REVENUES | ||||||||||||
| Subscriptions | 18,674 | 15,540 | 9,000 | |||||||||
| License fees | 5,277 | 8,396 | 13,204 | |||||||||
| Services | 12,432 | 13,052 | 17,490 | |||||||||
| Impairment charges | 5,085 | 531 | 1,089 | |||||||||
| Total cost of revenues | 41,468 | 37,519 | 40,783 | |||||||||
| GROSS PROFIT | 26,933 | 32,113 | 49,936 | |||||||||
| OPERATING EXPENSES | ||||||||||||
| Sales and marketing | 27,632 | 29,849 | 38,598 | |||||||||
| General and administrative | 10,366 | 12,095 | 16,619 | |||||||||
| Product maintenance and development | 4,060 | 4,334 | 5,496 | |||||||||
| Amortization of intangibles | 1,550 | 1,740 | 3,711 | |||||||||
| Goodwill impairment | 71,865 | - | - | |||||||||
| Restructuring, impairment and other charges (benefit) | 6,748 | (478 | ) | 9,093 | ||||||||
| Total operating expenses | 122,221 | 47,540 | 73,517 | |||||||||
| OPERATING LOSS | (95,288 | ) | (15,427 | ) | (23,581 | ) | ||||||
| Interest income | 549 | 1,254 | 1,684 | |||||||||
| Interest expense | (300 | ) | (117 | ) | (34 | ) | ||||||
| Other, net | 5 | 22 | 51 | |||||||||
| LOSS BEFORE INCOME TAXES | (95,034 | ) | (14,268 | ) | (21,880 | ) | ||||||
| Income tax expense (benefit) | (3,137 | ) | 608 | 600 | ||||||||
| NET LOSS | $ | (91,897 | ) | $ | (14,876 | ) | $ | (22,480 | ) | |||
| LOSS PER SHARE: | ||||||||||||
| Basic and diluted | $ | (3.85 | ) | $ | (0.63 | ) | $ | (0.95 | ) | |||
| WEIGHTED AVERAGE COMMON SHARES OUTSTANDING | ||||||||||||
| Basic and diluted | 23,854 | 23,754 | 23,679 | |||||||||
See Notes to Consolidated Financial Statements
PLATO LEARNING, INC. AND SUBSIDIARIES
CONSOLIDATED BALANCE SHEETS
(In thousands)
| OCTOBER 31, | ||||||||
| 2008 | 2007 | |||||||
| ASSETS | ||||||||
| Current assets: | ||||||||
| Cash and cash equivalents | $ | 20,018 | $ | 24,297 | ||||
| Accounts receivable, net | 6,834 | 11,752 | ||||||
| Other current assets | 7,408 | 7,759 | ||||||
| Total current assets | 34,260 | 43,808 | ||||||
| Equipment and leasehold improvements, net | 3,589 | 5,615 | ||||||
| Product development costs, net | 24,086 | 30,266 | ||||||
| Goodwill | - | 71,865 | ||||||
| Identified intangible assets, net | 3,723 | 7,983 | ||||||
| Other long-term assets | 3,309 | 3,243 | ||||||
| Total assets | $ | 68,967 | $ | 162,780 | ||||
| LIABILITIES AND STOCKHOLDERS' EQUITY | ||||||||
| Current liabilities: | ||||||||
| Accounts payable | $ | 3,085 | $ | 4,608 | ||||
| Accrued compensation | 3,996 | 5,453 | ||||||
| Other accrued liabilities | 6,909 | 4,245 | ||||||
| Deferred revenue | 36,005 | 36,094 | ||||||
| Total current liabilities | 49,995 | 50,400 | ||||||
| Long-term deferred revenue | 8,916 | 8,506 | ||||||
| Deferred income taxes | - | 3,139 | ||||||
| Total liabilities | 58,911 | 62,045 | ||||||
| Commitments and contingent liabilities (see Note 11) | - | - | ||||||
| Stockholders' equity: | ||||||||
| Common stock, $.01 par value, 50,000 shares authorized; 24,046 shares issued and 23,988 outstanding at October 31, 2008; 23,824 shares issued and 23,804 shares outstanding at October 31, 2007 | 240 | 238 | ||||||
| Additional paid in capital | 171,143 | 169,927 | ||||||
| Treasury stock at cost, 58 shares at October 31, 2008 20 shares at October 31, 2007 | (315 | ) | (205 | ) | ||||
| Accumulated deficit | (159,790 | ) | (67,893 | ) | ||||
| Accumulated other comprehensive loss | (1,222 | ) | (1,332 | ) | ||||
| Total stockholders' equity | 10,056 | 100,735 | ||||||
| Total liabilities and stockholders' equity | $ | 68,967 | $ | 162,780 | ||||
See Notes to Consolidated Financial Statements
PLATO LEARNING, INC. AND SUBSIDIARIES
CONSOLIDATED STATEMENTS OF CASH FLOWS
(In thousands)
| YEAR ENDED OCTOBER 31, | ||||||||||||
| 2008 | 2007 | 2006 | ||||||||||
| OPERATING ACTIVITIES: | ||||||||||||
| Net loss | $ | (91,897 | ) | $ | (14,876 | ) | $ | (22,480 | ) | |||
| Adjustments to reconcile net loss to net cash provided by operating activities: | ||||||||||||
| Deferred income taxes (benefit) | (3,137 | ) | 608 | 600 | ||||||||
| Impairment charges | 78,540 | 531 | 7,044 | |||||||||
| Amortization of capitalized product development costs | 12,233 | 10,739 | 7,706 | |||||||||
| Amortization of identified intangible and other long-term assets | 2,618 | 2,970 | 5,249 | |||||||||
| Depreciation and amortization of equipment and leasehold improvements | 2,094 | 2,441 | 2,408 | |||||||||
| Provision for doubtful accounts | - | (553 | ) | (380 | ) | |||||||
| Stock-based compensation | 1,012 | 1,174 | 1,650 | |||||||||
| Gain on sale of marketable securities | - | - | (37 | ) | ||||||||
| Loss on disposal of equipment | 103 | 3 | 166 | |||||||||
| Changes in operating assets and liabilities: | ||||||||||||
| Accounts receivable | 4,918 | 6,322 | 4,619 | |||||||||
| Other current and long-term assets | 37 | (385 | ) | 2,785 | ||||||||
| Accounts payable | (1,523 | ) | (78 | ) | 1,748 | |||||||
| Other current and long-term liabilities | 1,216 | (3,020 | ) | (4,480 | ) | |||||||
| Deferred revenue | 321 | 3,786 | 383 | |||||||||
| Total adjustments | 98,432 | 24,538 | 29,461 | |||||||||
| Net cash provided by operating activities | 6,535 | 9,662 | 6,981 | |||||||||
| INVESTING ACTIVITIES: | ||||||||||||
| Capitalized internal product development costs | (10,670 | ) | (15,698 | ) | (15,316 | ) | ||||||
| Purchased product development | - | (475 | ) | (3,000 | ) | |||||||
| Purchases of equipment and leasehold improvements | (338 | ) | (1,750 | ) | (3,172 | ) | ||||||
| Purchases of marketable securities | - | - | (11,750 | ) | ||||||||
| Sales and maturities of marketable securities | - | - | 11,979 | |||||||||
| Net cash used in investing activities | (11,008 | ) | (17,923 | ) | (21,259 | ) | ||||||
| FINANCING ACTIVITIES: | ||||||||||||
| Net proceeds from issuance of common stock | 109 | 203 | 741 | |||||||||
| Payment of debt financing fees | - | (523 | ) | - | ||||||||
| Repayments of capital lease obligations | (25 | ) | (47 | ) | (90 | ) | ||||||
| Net cash (used in) provided by financing activities | 84 | (367 | ) | 651 | ||||||||
| EFFECT OF EXCHANGE RATE CHANGES ON CASH & CASH EQUIVALENTS | 110 | (169 | ) | (180 | ) | |||||||
| Net decrease in cash and cash equivalents | (4,279 | ) | (8,797 | ) | (13,807 | ) | ||||||
| Cash and cash equivalents at beginning of period | 24,297 | 33,094 | 46,901 | |||||||||
| CASH AND CASH EQUIVALENTS AT END OF PERIOD | $ | 20,018 | $ | 24,297 | $ | 33,094 | ||||||
See Notes to Consolidated Financial Statements
PLATO LEARNING, INC. AND SUBSIDIARIES
CONSOLIDATED STATEMENTS OF STOCKHOLDERS' EQUITY AND COMPREHENSIVE LOSS
(In thousands)
| Common Stock | Retained | Accumulated | ||||||||||||||||||||||||||
| Shares | Par Value | Additional Paid in Capital | Treasury Stock | Earnings (Accumulated Deficit) | Other Comprehensive Loss | Total Stockholders' Equity | ||||||||||||||||||||||
| BALANCES, OCTOBER 31, 2005 | 23,617 | 236 | 166,295 | (205 | ) | (30,537 | ) | (962 | ) | 134,827 | ||||||||||||||||||
| Comprehensive loss: | ||||||||||||||||||||||||||||
| Net loss | - | - | - | - | (22,480 | ) | - | (22,480 | ) | |||||||||||||||||||
| Unrealized gains on available for sale securities | - | - | - | - | - | (23 | ) | (23 | ) | |||||||||||||||||||
| Foreign currency translation adjustments | - | - | - | - | - | (177 | ) | (177 | ) | |||||||||||||||||||
| Total comprehensive loss | (22,680 | ) | ||||||||||||||||||||||||||
| Exercise of stock options and shares issued under employee stock purchase plan | 117 | 1 | 741 | - | - | - | 742 | |||||||||||||||||||||
| Stock-based compensation | 7 | - | 1,561 | - | - | - | 1,561 | |||||||||||||||||||||
| BALANCES, OCTOBER 31, 2006 | 23,741 | 237 | 168,597 | (205 | ) | (53,017 | ) | (1,162 | ) | 114,450 | ||||||||||||||||||
| Comprehensive loss: | ||||||||||||||||||||||||||||
| Net loss | - | - | - | - | (14,876 | ) | - | (14,876 | ) | |||||||||||||||||||
| Foreign currency translation adjustments | - | - | - | - | - | (170 | ) | (170 | ) | |||||||||||||||||||
| Total comprehensive loss | (15,046 | ) | ||||||||||||||||||||||||||
| Exercise of stock options and shares issued under employee stock purchase plan | 56 | 1 | 202 | - | - | - | 203 | |||||||||||||||||||||
| Stock-based compensation | 27 | - | 1,128 | - | - | - | 1,128 | |||||||||||||||||||||
| BALANCES, OCTOBER 31, 2007 | 23,824 | 238 | 169,927 | (205 | ) | (67,893 | ) | (1,332 | ) | 100,735 | ||||||||||||||||||
| Comprehensive loss: | ||||||||||||||||||||||||||||
| Net loss | - | - | - | - | (91,897 | ) | - | (91,897 | ) | |||||||||||||||||||
| Foreign currency translation adjustments | - | - | - | - | - | 110 | 110 | |||||||||||||||||||||
| Total comprehensive loss | (91,787 | ) | ||||||||||||||||||||||||||
| Share issued under employee stock purchase plan | 85 | 1 | 217 | - | - | - | 218 | |||||||||||||||||||||
| Stock-based compensation | 117 | 1 | 999 | - | - | - | 1,000 | |||||||||||||||||||||
| Share repurchases | (38 | ) | (110 | ) | (110 | ) | ||||||||||||||||||||||
| BALANCES, OCTOBER 31, 2008 | 23,988 | $ | 240 | $ | 171,143 | $ | (315 | ) | $ | (159,790 | ) | $ | (1,222 | ) | $ | 10,056 | ||||||||||||
See Notes to Consolidated Financial Statements
PLATO LEARNING, INC. AND SUBSIDIARIES
NOTES TO CONSOLIDATED FINANCIAL STATEMENTS
Note 1. General
Fiscal Year
Our fiscal year is from November 1 to October 31. Unless otherwise stated, references to the years 2008, 2007, and 2006 relate to the fiscal years ended October 31, 2008, 2007, and 2006, respectively. References to future years also relate to our fiscal year ended October 31.
Consolidation
The accompanying consolidated financial statements include the accounts of PLATO Learning, Inc. and its wholly owned subsidiaries. All significant intercompany accounts and transactions have been eliminated.
Use of Estimates
The preparation of financial statements in conformity with accounting principles generally accepted in the United States of America requires us to make estimates and assumptions that affect the reported amounts of assets and liabilities and disclosure of contingent assets and liabilities at the date of the financial statements and the reported amounts of revenues and expenses during the period. Significant estimates include the deferred tax asset valuation allowance and the valuation and recoverability of capitalized product development costs, goodwill, and identified intangible assets. Actual results could differ from those estimates.
Change In Classification of Unbilled Amounts Due Under Non-Cancelable Subscription Agreements
In 2008, we changed the classification of amounts due but not yet invoiced under non-cancellable subscription agreements. In previous years these amounts were reported as unbilled accounts receivable and deferred revenue on our Consolidated Balance Sheet. In 2008, these amounts have been excluded from these accounts. Prior year amounts for 2006 and 2007 of $1,032,000 and $4,523,000, respectively, have been reclassified to conform to the 2008 method of presentation. The change in classification had no effect on the Consolidated Statement of Operations or Total Shareholders’ Equity.
Note 2. Summary of Significant Accounting Policies
Cash and Cash Equivalents
All highly liquid investments purchased with an original maturity of three months or less are considered to be cash equivalents. Any such investments are carried at amortized cost, which approximates fair value.
Accounts Receivable
Accounts receivable are initially recorded at fair value upon the sale of products or services to our customers. We maintain an allowance for doubtful accounts at an amount estimated to be sufficient to provide adequate protection against losses resulting from extending credit to our customers. In judging the adequacy of the allowance for doubtful accounts, we consider multiple factors including historical bad debt experience, the general economic environment, the need for specific client reserves, and the aging of our receivables. The provision for doubtful accounts is included in general and administrative expense on the consolidated statement of operations.
Concentration of Credit Risk
Financial instruments that potentially subject us to concentrations of credit risk consist primarily of trade accounts receivable from public school districts. We perform evaluations of our customers’ credit worthiness and require no collateral from our customers. Although many of our customers are dependent upon various government funding sources and are subject to appropriation of funds, we do not believe there is a significant concentration of risk associated with any specific governmental program or funding source.
Equipment and Leasehold Improvements
Equipment and leasehold improvements are stated at cost, less accumulated depreciation and amortization. The straight-line method of depreciation is used over the estimated useful lives of the assets. This is generally three to five years for equipment, and the shorter of the lease term or estimated useful life for leasehold improvements. Upon retirement or disposition, the cost and related accumulated depreciation and amortization are removed from the accounts, and any gain or loss is included in our results of operations. Maintenance and repairs are expensed as incurred.
Goodwill and Other Intangible Assets
We account for goodwill and other intangible assets under the provisions of SFAS No. 142, Goodwill and Other Intangible Assets (“SFAS 142”). In accordance with SFAS 142, goodwill and identified intangible assets are recorded when the purchase price paid for an acquisition exceeds the fair value of the tangible assets acquired. Most of the companies we have acquired have not had significant tangible assets. As a result, a significant portion of the purchase price paid in acquisitions has been allocated to identified intangible assets and/or goodwill.
Identified intangible assets are amortized to expense over their expected useful lives and goodwill is not amortized. Once established, these assets are subject to periodic impairment assessments to determine if their current carrying values are recoverable based on information available at the time these assessments are made. Significant assumptions and estimates are required in making these assessments. Accordingly, the assumptions and estimates we use in implementing this policy affect the amount of identified intangible asset amortization and impairment charges, if any, reflected in our operating results. As discussed in Note 8, our impairment assessments at October 31, 2008 resulted in the elimination of goodwill and a related impairment charge of $71.9 million, and impairment charges of $1.9 million on identified intangible technology and customer assets acquired in previous acquisitions. There was no impairment charge on identified intangible assets or goodwill in 2007.
Long Lived Assets
We review identified intangible and other long lived assets for impairment whenever events or changes in circumstances indicate that the carrying amount of an asset may not be recoverable. If such events or changes in circumstances are present, the undiscounted cash flows method is used to determine whether the asset is impaired. Cash flows would include the estimated terminal value of the asset and exclude any interest charges. To the extent the carrying value of the asset exceeds the undiscounted cash flows over the estimated remaining life of the asset, the impairment is measured using discounted cash flows. Considerable judgment is required in the evaluation of whether certain events or circumstances lead to an indication of impairment, and in the assumptions used in determining the amount and period over which future revenues are expected to be earned, related costs, terminal values, and discount rates. In 2008, we recorded asset impairment charges on certain long-lived purchased technology and customer assets. No asset impairment charges on long-lived assets were incurred in 2007. In 2006, we recorded asset impairment charges on certain long-lived purchased technology, customer and trademark assets. See Note 8 for further discussion of these charges.
Revenue Recognition
We derive our revenues from three sources: (1) subscription revenues, which are comprised of subscription fees from customers accessing our online, web-based products; (2) license revenues from non-cancelable perpetual license agreements; and (3) related professional and support services and other revenue.
We recognize subscription revenues in accordance with the provisions of SEC Staff Accounting Bulletin No. 104, Revenue Recognition, and Emerging Issues Task Force Issue No. 00-21, Revenue Arrangements with Multiple Deliverables. We recognize license fee revenue in accordance with the provisions of Statement of Position No. 97-2, Software Revenue Recognition, as amended and modified, as well as Technical Practice Aids issued from time to time by the American Institute of Certified Public Accountants.
We recognize revenue when all of the following conditions are met:
| · | There is persuasive evidence of an arrangement; |
| · | Access to our online subscription products has been provided to the customer or the perpetual courseware has been delivered; |
| · | The amount of fees to be paid by the customer is fixed and determinable; and |
| · | The collectability of the fee is probable. |
Our arrangements do not contain general rights of return.
Revenue from the licensing of software under subscription arrangements is recognized on a ratable basis over the subscription period starting the later of the first day of the subscription period or when all revenue recognition criteria identified above have been met. Amounts that have been invoiced are recorded in accounts receivable and in deferred revenue or revenue, depending on whether the revenue recognition criteria have been met. Amounts due under non-cancelable subscription agreements are not recognized in accounts receivable or deferred revenue until such amounts are invoiced to the customer.
We also provide professional services, training, and implementation services, as well as ongoing customer support and maintenance. Training, and implementation services are not essential to the functionality of our software products. Revenues from these services are recognized separately upon delivery where there is objective and reliable evidence of fair value of each deliverable. Software support revenue is deferred and recognized ratably over the support period.
For revenue arrangements with multiple deliverables, we allocate the total amount the customer will pay to the separate units of accounting based on their relative fair values, as determined by the price of the undelivered items when sold separately.
If collectability of the fee is not probable, revenue is recognized as payments are received from the customer provided all other revenue recognition criteria have been met. If the fee due from the customer is not fixed or determinable, revenue is recognized as the payments become due provided all other revenue recognition criteria have been met.
Deferred Revenue
We generally invoice our customers at the time of order and record deferred revenue for the portion of the order related to subscription products and services for which the revenue recognition criteria have not been met. Accordingly, the deferred revenue balance represents the value of billed subscription and services agreements. As the revenue recognition criteria are met, revenue is subsequently recognized.
Deferred Commissions
Deferred commissions represent the portion of sales incentive compensation paid to our sales representatives associated with the portion of subscription and services contracts billed but not yet recognized as revenue. Commissions are earned at the time of invoicing, paid monthly, and the related expense is deferred and amortized over the term of the related customer contracts on the basis that the deferred commission amounts are recoverable through the future revenue streams under the billed portion of customer contracts. We believe this is the preferable method of accounting as the commission charges are so closely related to the revenue from the billed portion of customer contracts that they should be recorded as an asset and charged to expense over the same period that the revenue is recognized.
Advertising and Sales Promotion Costs
Advertising and sales promotion costs, which are expensed as incurred, were $495,000, $440,000 and $453,000 for 2008, 2007, and 2006, respectively.
Product Development Costs
Our product development costs relate to the research, development, enhancement, and maintenance of our perpetual and subscription based software. We account for software development costs in accordance with the provisions of SFAS No. 86. “Accounting for the Costs of Computer Software to be Sold, Leased or Otherwise Marketed.” Product development costs include employee salaries and benefits, third-party contractor fees, and overhead costs such as facilities expenses. The amortization of capitalized product development costs is included in cost of revenues related to subscriptions and license fees. Research and development costs, relating principally to the design and development of new products prior to the achievement of technological feasibility, and the routine enhancement, and maintenance of existing products, are expensed as incurred.
We capitalize product development costs when the projects under development reach technological feasibility. Technological feasibility is established when we have completed all planning, designing, coding, and testing activities necessary to establish that a product can be produced to meet its design specifications. Capitalization ends when a product is available for general release to our customers, at which time amortization of the capitalized costs begins.
We amortize these costs using the greater of: (a) the amount determined by the ratio of the product’s current revenue to total expected future revenue, or (b) the straight-line method over the estimated useful life of the product, which is four years for all platform, math and science products released after July 2006, and three years for all other products. During all periods presented, we used the straight-line method to amortize the capitalized costs as this method resulted in greater amortization.
We evaluate our capitalized costs on a quarterly basis to determine if the unamortized cost related to any product, or class of products, exceeds its estimated net realizable value. If capitalized costs are determined to be impaired, a related charge is recorded in our statement of operations.
Purchased product development represents non-refundable amounts paid under a revised license agreement for software used in our subscription products. We purchased $475,000 in 2007 and $3,000,000 in 2006. No purchases were made in 2008. These amounts are being amortized on a straight-line basis through April 2008 and August 2010, respectively.
Fully amortized product development costs are written off when it is determined that these assets are no longer substantially in use in existing products. These write-offs have no effect on total assets or results of operations.
Stock-Based Compensation
We account for stock-based compensation under the provisions of Statement of Financial Accounting Standards No. 123(R), “Share-Based Payment” (“SFAS 123(R)”), using the modified prospective transition application method. Under this method, compensation expense is recognized for the unvested portion of awards granted to employees on or before October 31, 2005, and for employee awards granted, modified, or settled after October 31, 2005. We use the straight-line method to recognize compensation expense over the requisite service period of the award. See Note 13 for additional stock-based compensation disclosures under FAS 123(R).
SFAS 123(R) also requires that the cash retained as a result of the tax deductibility of the increase in the value of share-based arrangements be presented as a component of cash flows from financing activities in the consolidated statement of cash flows. Prior to the adoption of SFAS 123(R), such amounts were presented as a component of cash flows from operating activities. Due to our tax net operating loss position, we did not realize cash savings as a result of the tax deduction for stock-based compensation for the year ended October 31, 2008 or 2007.
Income Taxes
We account for income taxes using the asset and liability method, which requires recognition of deferred tax liabilities and assets for the expected future tax consequences of events that have been included in our financial statements or tax returns. Under this method, deferred tax liabilities and assets are determined based on the difference between the financial statement and tax basis of assets and liabilities, using enacted tax rates in effect for the year in which the differences are expected to reverse. Deferred tax assets are reduced by a valuation allowance when it is more likely than not that some component or all of the deferred tax assets will not be realized. Tax rate changes are reflected in income during the period such changes are enacted.
Loss per Share
Basic and diluted loss per share is calculated by dividing net loss by the weighted average number of common shares outstanding during the period as follows (in thousands, except per share amounts):
| 2008 | 2007 | 2006 | ||||||||||
| Net loss | $ | (91,897 | ) | $ | (14,876 | ) | $ | (22,480 | ) | |||
| Basic and diluted weighted average common shares outstanding | 23,854 | 23,754 | 23,679 | |||||||||
| Basic and diluted loss per share | $ | (3.85 | ) | $ | (0.63 | ) | $ | (0.95 | ) | |||
Potential common shares, which consist of stock options and warrants and restricted stock, are anti-dilutive in a net loss situation and are therefore excluded in the calculation of diluted loss per share. Accordingly, the calculation of diluted loss per share for the periods presented for 2008, 2007 and 2006 excluded the effect of approximately 2,630,000, 2,682,000 and 3,195,000 potential common shares, respectively, as they were anti-dilutive.
Foreign Currency Translation
The functional currency for each of our foreign subsidiaries is the respective local currency. All assets and liabilities of our foreign subsidiaries are translated from local currencies to United States dollars at period end rates of exchange, while revenues and expenses are translated at the average exchange rates during the period. Translation adjustments arising from the translation of net assets located outside of the United States (“U.S.”) into U.S. dollars are recorded as a separate component of stockholders' equity. The cumulative losses related to foreign currency translation adjustments included in stockholders’ equity were $1,222,000, $1,332,000 and $1,162,000 at October 31, 2008, 2007 and 2006, respectively. Any gains or losses resulting from foreign currency transactions are included in the consolidated statements of operations and were not significant during the periods presented.
Comprehensive Loss
The components of our comprehensive loss include our net loss, unrealized gains and losses on available for sale marketable securities, and foreign currency translation adjustments. Comprehensive loss for all periods presented is included in our consolidated statements of stockholders’ equity and comprehensive loss.
New Accounting Pronouncements
In May 2008, the FASB issued Statement of Financial Accounting Standards (“SFAS”) No. 162, “The Hierarchy of Generally Accepted Accounting Principles.” SFAS No. 162 identifies the sources of accounting principles and the framework for selecting the principles used in the preparation of financial statements of nongovernmental entities that are presented in accordance with U.S. Generally Accepted Accounting Principles (“GAAP”). SFAS No. 162 concludes that the GAAP hierarchy should be directed toward the entity and not its auditor, and should reside in the accounting literature established by the FASB, as opposed to the American Institute of Certified Public Accountants (“AICPA”) Statement on Auditing Standards No. 69, “The Meaning of Present Fairly in Conformity with Generally Accepted Accounting Principles.” SFAS No. 162 is effective 60 days following the SEC’s approval of the Public Company Accounting Oversight Board (“PCAOB”) amendments to AU Section 411, “The Meaning of Present Fairly in Conformity with Generally Accepted Accounting Principles.” We do not expect SFAS No. 162 to have a material impact on our consolidated financial statements.
In April 2008, the FASB issued staff position (“FSP”) No. FAS 142-3, “Determination of the Useful Life of Intangible Assets.” FSP No. FAS 142-3 amends the factors that should be considered in developing renewal or extension assumptions used to determine the useful life of a recognized intangible asset under SFAS No. 142, “Goodwill and Other Intangible Assets.” The intent of the position is to improve the consistency between the useful life of a recognized intangible asset under SFAS No. 142 and the period of expected cash flows used to measure the fair value of the asset under SFAS No. 141R, and other U.S. generally accepted accounting principles. The provisions of FSP No. FAS 142-3 are effective for our fiscal year 2010 and are currently not expected to have a material effect on our consolidated financial statements.
In December 2007, the FASB issued SFAS No. 141(R) “Business Combinations” (“SFAS No. 141(R)”). SFAS 141(R) establishes principles and requirements for how an acquirer recognizes and measures in its financial statements the identifiable assets acquired, the liabilities assumed, any noncontrolling interest in the acquiree and the goodwill acquired. SFAS 141(R) also establishes disclosure requirements to enable the evaluation of the nature and financial effects of the business combination. SFAS 141(R) is effective as of the beginning of an entity’s fiscal year that begins after December 15, 2008, and will be adopted by us in the first quarter of fiscal 2010. SFAS 141(R) is currently not expected to have a material effect on our consolidated financial statements.
In December 2007, the FASB issued SFAS 160, Noncontrolling Interests in Consolidated Financial Statements, an amendment of ARB No. 51 (“SFAS 160”). SFAS 160 will change the accounting and reporting for minority interests, which will be recharacterized as noncontrolling interests (NCI) and classified as a component of equity. This new consolidation method will significantly change the accounting for transactions with minority interest holders. SFAS 160 is effective for fiscal years beginning after December 15, 2008, and will be adopted by us in the first quarter of fiscal year 2010. SFAS 160 is currently not expected to have a material effect on our consolidated financial statements.
In February 2007, the FASB issued SFAS No. 159, “The Fair Value Option for Financial Assets and Financial Liabilities – Including an amendment of FASB Statement No. 115,” (“SFAS No. 159”). This standard permits entities to measure many financial instruments and certain other items at fair value. The objective is to improve financial reporting by providing entities with the opportunity to mitigate volatility in reported earnings caused by measuring related assets and liabilities differently without having to apply complex hedge accounting provisions. The provisions of SFAS No. 159 are effective beginning in our fiscal year 2009 and are currently not expected to have a material effect on our consolidated financial statements.
In September 2006, the FASB issued SFAS No. 157, “Fair Value Measurements” (“SFAS No. 157”), to establish a consistent framework for measuring fair value and expand disclosures on fair value measurements. The provisions of SFAS No. 157 are effective beginning in our fiscal year 2009 and are currently not expected to have a material effect on our consolidated financial statements.
In July 2006, the FASB issued Interpretation No. 48, “Accounting for Uncertainty in Income Taxes—an interpretation of FASB Statement No. 109” (“FIN 48”). FIN 48 clarifies the accounting for uncertainty in income taxes recognized in an enterprise’s financial statements in accordance with FASB Statement 109, “Accounting for Income Taxes.” FIN 48 became effective for us in the first quarter of fiscal year 2008 and did not have a material effect on our consolidated financial statements.
Note 3. Supplemental Financial Statement Information
Supplemental information regarding our cash flows is as follows (in thousands):
| 2008 | 2007 | 2006 | ||||||||||
| Cash paid for interest | $ | 126 | $ | 45 | $ | 34 | ||||||
| Cash (refunded) paid for income taxes | 57 | (86 | ) | 28 | ||||||||
| Non-cash investing and financing activities: | ||||||||||||
| Capital lease obligations incurred | - | 27 | - | |||||||||
Note 4. Accounts Receivable
The components of accounts receivable at October 31 were as follows (in thousands):
| 2008 | 2007 | |||||||
| Trade accounts receivable | $ | 7,130 | $ | 12,071 | ||||
| Allowance for doubtful accounts | (296 | ) | (319 | ) | ||||
| $ | 6,834 | $ | 11,752 | |||||
The allowance for doubtful accounts activity was as follows (in thousands):
| 2008 | 2007 | 2006 | ||||||||||
| Balance, November 1 | $ | 319 | $ | 928 | $ | 1,647 | ||||||
| Provision for doubtful accounts, net of other reserve adjustments | - | (553 | ) | (380 | ) | |||||||
| Write-offs, net of recoveries | (23 | ) | (56 | ) | (339 | ) | ||||||
| $ | 296 | $ | 319 | $ | 928 | |||||||
The provision for doubtful accounts is included in general and administrative expense on the consolidated statements of operations.
Note 5. Deferred Commissions
Total deferred commissions at October 31, 2008 and 2007 were $4,268,000 and $4,157,000. Of these amounts, $834,000 and $874,000 were recorded as long-term deferred commissions at October 31, 2008 and 2007, respectively.
Note 6. Equipment and Leasehold Improvements
The components of equipment and leasehold improvements at October 31 were as follows (in thousands):
| 2008 | 2007 | |||||||
| Equipment | $ | 13,450 | $ | 17,224 | ||||
| Leasehold improvements | 904 | 930 | ||||||
| Total | $ | 14,354 | $ | 18,154 | ||||
| Accumulated depreciation and amortization | (10,765 | ) | (12,539 | ) | ||||
| $ | 3,589 | $ | 5,615 | |||||
Depreciation and amortization expense was $2,094,000, $2,441,000 and $2,408,000 for 2008, 2007, and 2006, respectively.
Note 7. Product Development Costs
A reconciliation of capitalized product development costs is as follows (in thousands):
| Gross Carrying Value | Accumulated Amortization | Net Carrying Value | ||||||||||
| Balance, October 31, 2006 | $ | 40,577 | $ | (15,214 | ) | $ | 25,363 | |||||
| Capitalized internal product development costs | 15,698 | - | 15,698 | |||||||||
| Purchased product development | 475 | - | 475 | |||||||||
| Amortization | - | (10,739 | ) | (10,739 | ) | |||||||
| Impairments | (531 | ) | - | (531 | ) | |||||||
| Write-off of fully amortized costs | (4,843 | ) | 4,843 | - | ||||||||
| Balance, October 31, 2007 | 51,376 | (21,110 | ) | 30,266 | ||||||||
| Capitalized internal product development costs | 10,670 | - | 10,670 | |||||||||
| Amortization | - | (12,233 | ) | (12,233 | ) | |||||||
| Impairments | (4,617 | ) | - | (4,617 | ) | |||||||
| Write-off of fully amortized costs | (7,573 | ) | 7,573 | - | ||||||||
| Balance, October 31, 2008 | $ | 49,856 | $ | (25,770 | ) | $ | 24,086 | |||||
Purchased product development represents non-refundable amounts paid under a revised license agreement for software used in our subscription products. This amount is being amortized on a straight-line basis through August 2010.
Amortization expense related to capitalized product development costs was $12,233,000, $10,739,000, and $7,706,000 for 2008, 2007, and 2006, respectively, and is included as a component of cost of revenues related to subscriptions and license fees in the consolidated statements of operations.
In 2008 and 2007, we recorded impairment charges of $4,617,000 and $531,000, respectively, related to capitalized product development costs. These charges, which are reported in cost of revenues, resulted from our evaluation of expected future revenues from certain products relative to the estimated capitalized product development costs.
In 2008 and 2007, we wrote off approximately $7,573,000 and $4,843,000 of product development costs and related accumulated amortization which were fully amortized and were no longer considered substantially in use.
Note 8. Goodwill and Identified Intangible Assets
Goodwill
Goodwill has been recorded for the excess of the purchase price of acquisitions over the fair value of identified tangible and intangible assets less the fair value of liabilities assumed in these acquisitions. These acquisitions were completed in fiscal years 2000 through 2003 and the assets from these acquisitions are not a material part of our current SaaS strategy. We account for goodwill under the provisions of SFAS No. 142, Goodwill and Other Intangible Assets (“SFAS 142”). SFAS 142 requires that goodwill be reviewed for potential impairment annually, or when events or changes in circumstances indicate the carrying value of the goodwill might exceed its current fair value. One of the indicators of impairment is a sustained decline in a company’s share price whereby market capitalization of the company is less than its book value for an extended period of time. We began to experience such a decline starting in March 2008. After trading in a range near our book value throughout the summer, we experienced a further decline in our stock price as the financial markets reacted to the credit crisis facing major lending institutions, and worsening conditions in the overall economy. Additionally the Company has experienced operation losses during the past three years while the Company has experienced growth in subscription product orders in fiscal 2007 and fiscal 2008, subscription revenue was not sufficient to fully offset a decline in license fees and service revenues during those years. Based on these and other factors, we concluded in the fourth quarter of 2008 that our recorded goodwill was impaired.
Under SFAS 142, the determination of the amount of the impairment required that the fair values of our assets and liabilities be determined as if the Company had been acquired in a hypothetical business combination with a purchase price equal to the market capitalization of the Company as of October 31, 2008, adjusted for certain factors that might reasonably affect the value of the Company if purchased in an actual acquisition. The estimates and assumptions used in determining the hypothetical purchase price and fair value determinations are inherently subject to uncertainty.
Our impairment analysis concluded that the purchase price as determined above was less than the sum of the fair value of our identified tangible and intangible assets, less the fair value of our liabilities. Under accounting rules for business combinations, goodwill exists only if the purchase price exceeds the fair value of the net assets of the acquired entity. Accordingly, no value was assigned to goodwill resulting in full impairment of goodwill and a related non-cash charge to 2008 operating results of $71,865,000. The impairment of goodwill resulted in the reversal of the cumulative deferred tax liability associated with tax-deductible goodwill and a corresponding income tax benefit of $3,137,000. The impairment of goodwill is not expected to have any impact on our day-to-day business operations, liquidity or long-term SaaS strategy.
Identified Intangible Assets
Identified intangible assets subject to amortization, resulting from our previous acquisitions, were as follows (in thousands):
| 2008 | 2007 | |||||||||||||||||||||||
| Gross Carrying Value | Accumulated Amortization | Net Carrying Value | Gross Carrying Value | Accumulated Amortization | Net Carrying Value | |||||||||||||||||||
| Acquired technology | $ | 7,300 | $ | (5,320 | ) | $ | 1,980 | $ | 13,563 | $ | (10,295 | ) | $ | 3,268 | ||||||||||
| Trademarks and tradenames | 1,380 | (1,380 | ) | - | 1,380 | (1,380 | ) | - | ||||||||||||||||
| Customer relationships and lists | 19,800 | (18,057 | ) | 1,743 | 20,200 | (15,485 | ) | 4,715 | ||||||||||||||||
| Noncompete agreements | - | - | - | - | - | - | ||||||||||||||||||
| $ | 28,480 | $ | (24,757 | ) | $ | 3,723 | $ | 35,143 | $ | (27,160 | ) | $ | 7,983 | |||||||||||
Amortization expense and impairment charges related to the identified intangible assets presented above were as follows (in thousands):
Fiscal Years Ended October 31, | ||||||||||||
| 2008 | 2007 | 2006 | ||||||||||
| Cost of revenues: | ||||||||||||
| Amortization expense | $ | 821 | $ | 821 | $ | 1,206 | ||||||
| Impairment charges | 467 | - | 1,089 | |||||||||
| 1,288 | 821 | 2,295 | ||||||||||
| Operating expenses | ||||||||||||
| Amortization expense | 1,550 | 1,740 | 3,710 | |||||||||
| Impairment charges | 1,422 | - | 5,955 | |||||||||
| 2,972 | 1,740 | 9,665 | ||||||||||
| $ | 4,260 | $ | 2,561 | $ | 11,960 | |||||||
The estimated future amortization expense for the identified intangible assets presented above is as follows (in thousands):
Cost of Revenues | Operating Expenses | Total | ||||||||||
| 2009 | $ | 485 | $ | 854 | $ | 1,339 | ||||||
| 2010 | 485 | 854 | 1,339 | |||||||||
| 2011 | 485 | 35 | 520 | |||||||||
| 2012 | 485 | - | 485 | |||||||||
| 2013 | 40 | - | 40 | |||||||||
| Thereafter | - | - | - | |||||||||
| $ | 1,980 | $ | 1,743 | $ | 3,723 | |||||||
The future amortization amounts presented above are estimates. Actual future amortization expense may be different due to future acquisitions, impairments, changes in amortization periods, or other factors.
In 2008, we recorded impairment charges of $1,889,000 related to acquired technology and customer assets. The technology impairment charges of $467,000, which are reported in cost of revenues, resulted from our evaluation of expected future revenues from certain products given changes in product strategies formalized in the fourth quarter of 2008. These charges were primarily related to retired products and a decrease in the anticipated future cash flows from these products relative to the cash flows expected at the time these assets were purchased. Impairment charges on identified customer intangible assets totaled $1,422,000 and are reported in operating expenses. These charges were also triggered by reductions in anticipated future revenues attributable to these assets.
There were no impairment charges on identified intangible assets in 2007.
In 2006, we recorded impairment charges totaling $7,044,000 on identified intangible assets acquired in previous acquisitions. Impairment charges on identified technology assets totaled $1,089,000 and were recorded in cost of revenues. Impairment charges on identified customer and trademark intangible assets totaled $5,955,000 and are reported in operating expenses. These impairment charges were triggered by our 2006 actual financial performance and resulting reductions in anticipated future revenues attributable to these assets. The expected revenue reductions related primarily to accelerated declines we experienced in the sale of certain perpetual license or maturing products sold to the identified customer base, or that contain these trademarks.
Note 9. Revolving Loan
On June 4, 2007, we entered into a three-year senior secured credit facility which provides us with a revolving line of credit up to the lesser of $20 million or one times the Company’s trailing twelve months subscription and maintenance revenue. Under the agreement, we have the option of selecting an interest rate for any drawdown under the facility equal to the applicable Prime or Libor Rate plus a sliding margin that is based on the amount of borrowings outstanding. Borrowings under the agreement are secured by all of the assets of the Company. Financial covenants are limited to maximum annual levels of capitalized product development spending, and minimum quarterly thresholds of earnings before interest, taxes, depreciation and amortization (EBITDA) which are tested only when the unused portion of the line of credit plus our cash and cash equivalents on hand is less than $12.5 million. We capitalized legal and banking fees of $523,000 associated with this credit facility. These costs are being amortized over the three-year term of the agreement. At October 31, 2008 and 2007, availability under the line was $20.0 million and there were no borrowings outstanding.
Note 10. Deferred Revenue
| October 31, | ||||||||
| 2008 | 2007 | |||||||
| Total deferred revenue | $ | 44,921 | $ | 44,600 | ||||
| Less: Long-term portion | (8,916 | ) | (8,506 | ) | ||||
| Current deferred revenue | $ | 36,005 | $ | 36,094 | ||||
The long-term portion of deferred revenues represents amounts we expect to recognize as revenue in periods beyond one year from the balance sheet date.
Note 11. Commitments and Contingent Liabilities
Operating Leases
We lease our various office facilities. Certain of these operating leases contain renewal options, escalation clauses and requirements that we pay taxes, insurance and maintenance costs. Estimated amounts for these costs are included in future minimum rental payments. Commitments for future minimum rental payments under non-cancelable operating leases are as follows (in thousands):
| 2009 | $ | 1,682 | ||
| 2010 | 985 | |||
| 2011 | 178 | |||
| 2012 | 164 | |||
| 2013 | 66 | |||
| Thereafter | - | |||
| $ | 3,075 |
Rent expense was $2,503,000, $1,716,000, and $4,101,000 for 2008, 2007, and 2006, respectively. Amounts for 2008 and 2006 include rent expenses accrued for vacated facilities as discussed in Note 14. In 2008, we accrued $904,000 for rent related to vacated facilities during our 2008 restructure. See Note 14 for additional information regarding our 2008 restructure. In 2006, accrued vacated facilities rent expense was reduced by $322,000 due to actual or expected subleasing arrangements for two of our U.K. facilities.
Royalty Agreements
We have entered into various third-party product royalty agreements that provide for future minimum royalty payments of $2,160,000 in 2009 and $2,200,000 in 2010.
401(k) Plan
We have a discretionary 401(k) plan for all employees who are at least 21 years of age and have completed 3 months of service with the Company. Our discretionary contributions are funded each year and totaled $805,000 in 2008, $718,000 in 2007, and $576,000 in 2006.
Employment Agreements
As of October 31, 2008, we had entered into various employment agreements with our executive officers, which provide for aggregate severance payments of up to approximately $2,050,000, subject to certain conditions and events.
Legal Proceedings
From time to time, we may become involved in litigation arising out of operations in the normal course of business. We are not aware of any pending legal proceedings the outcome of which could reasonably be expected to have a material unfavorable or favorable effect on our operating results, financial position or cash flows.
Note 12. Stockholders’ Equity
Common Stock Issued
Shares of common stock issued pursuant to the exercise of stock options and for purchases under our employee stock purchase plan were 85,000, 56,000 and 117,000 shares for 2008, 2007, and 2006, respectively.
Common Stock Repurchased
We repurchased 1,550 and 36,836 shares of our common stock for an aggregate cost of approximately $4,000 and $105,000 during the second and third quarters of 2008, respectively. The shares were repurchased in accordance with employee elections to withhold shares to fund tax withholdings due upon vesting of restricted stock. Shares repurchased but not reissued are presented as treasury stock in the consolidated balance sheet.
No shares of common stock were repurchased in 2007.
Stock Incentive and Stock Option Plans
Prior to November 1, 2005, we adopted various stock incentive plans (“Prior Stock Plans”) that authorized the granting of stock options, stock appreciation rights, and stock awards to directors, officers, and key employees, subject to certain conditions, including continued employment. Stock options under these plans were granted with an exercise price equal to the fair market value of our common stock on the date of grant. Options granted to our outside directors were exercisable immediately. All other options granted become exercisable ratably over a service period of two to four years and expire, if unexercised, after eight or ten years from the grant date.
On December 8, 2005, our Board of Directors approved the 2006 Stock Incentive Plan (“2006 Plan”), which was ratified at the annual meeting of stockholders on March 2, 2006. The Plan permits the grant of stock options, stock appreciation rights, restricted stock, performance shares, and other stock awards. The total number of shares available for issuance under the 2006 Plan is equal to the sum of (a) the shares remaining under the Prior Stock Plans, and (b) any shares issued under the Prior Stock Plans that are forfeited, canceled, or expire without being exercised. Effective with the adoption of the 2006 Plan, shares will no longer be issued under the Prior Stock Plans. Stock options under the 2006 Plan are granted with an exercise price equal to the fair market value of our common stock on the date of grant. Options granted to our outside directors are exercisable immediately. All other options granted become exercisable ratably over a service period of three to four years and expire, if unexercised, after eight years from the grant date.
Stock option transactions under these plans were as follows (share amounts in thousands):
| 2008 | 2007 | 2006 | ||||||||||
| Options outstanding at beginning of year | 2,522 | 2,876 | 2,652 | |||||||||
| Options granted | 507 | 199 | 827 | |||||||||
| Options exercised | - | - | (90 | ) | ||||||||
| Options forfeited or expired | (412 | ) | (553 | ) | (513 | ) | ||||||
| Options outstanding at end of year | 2,617 | 2,522 | 2,876 | |||||||||
| Options exercisable at end of year | 1,958 | 2,020 | 2,037 | |||||||||
| Weighted average exercise prices: | ||||||||||||
| Outstanding at beginning of year | $ | 8.49 | $ | 8.83 | $ | 9.51 | ||||||
| Granted | 2.89 | 4.35 | 7.63 | |||||||||
| Exercised | - | - | 6.60 | |||||||||
| Forfeited | 7.57 | 8.77 | 10.79 | |||||||||
| Outstanding at end of year | 7.40 | 8.49 | 8.83 | |||||||||
| Exercisable at end of year | 8.40 | 8.88 | 9.38 | |||||||||
Stock options outstanding and exercisable at October 31, 2008 were as follows (share amounts in thousands):
| Range of Exercise Prices | Number Outstanding | Weighted-Average Remaining Years Contractual Life | Weighted-Average Exercise Price | Number Exercisable | Weighted Average Exercise Price | |||||||||||||||||
| $2.53 - $3.99 | 588 | 6.5 | $ | 3.04 | 190 | $ | 3.33 | |||||||||||||||
| $4.07 - $7.14 | 549 | 3.8 | 5.85 | 474 | 6.05 | |||||||||||||||||
| $7.38 - $7.60 | 568 | 4.7 | 7.54 | 384 | 7.52 | |||||||||||||||||
| $7.76 - $10.52 | 551 | 3.4 | 8.47 | 548 | 8.47 | |||||||||||||||||
| $12.97 - $23.62 | 361 | 2.6 | 14.98 | 362 | 14.98 | |||||||||||||||||
| 2,617 | 4.4 | $ | 7.40 | 1,958 | $ | 8.40 | ||||||||||||||||
In addition to these plans, we also have an Employee Stock Purchase Plan under which employees are entitled to purchase our common stock at a 15% discount to the market price at the beginning or end of the quarterly purchase period as defined in the plan, whichever is lower. We incurred $81,000, $72,000 and $52,000 in 2008, 2007 and 2006, respectively, for the purchase discount that is included in stock compensation expense. In December 2005, we also entered into “Bonus Unit” agreements with certain employees under which these employees are eligible for cash compensation equal to the number of bonus units multiplied by the market price of our common stock on each of October 31, 2006, 2007 and 2008, provided they are employed with us on those dates. At October 31, 2008, a total of 7,500 bonus units were outstanding. As these awards are payable in cash, estimated amounts payable under these agreements are adjusted with changes in the market price of our stock and are classified as a liability in the consolidated balance sheet.
Common Stock Warrants
There were no outstanding common stock warrants as of October 31, 2008 and 2007. Warrants to purchase 200,000 shares of our common stock expired in May 2007.
Note 13. Stock-Based Compensation
As described in Note 2, effective November 1, 2005, we adopted the provisions of Statement of Financial Accounting Standards No. 123(R), “Share-Based Payment” (“SFAS 123(R)”), using the modified prospective transition application method. Under this method, compensation expense is recognized for employee awards granted, modified, or settled subsequent to October 31, 2005, and the unvested portion of awards granted to employees prior to November 1, 2005. We use the straight-line method to recognize compensation expense over the requisite service period of the award, which we have determined to be the vesting period, and an annual pre-vesting forfeiture rate of 13%, which was determined based on historical pre-vesting forfeiture data. The fair value of option awards in 2008 was determined using the Black-Scholes option pricing model utilizing the following assumptions:
| Expected life | 4.6 years |
| Risk-free rate of return | 2.6%- 2.9% |
| Volatility | 49.0% |
| Dividend yield | 0.0% |
In accordance with SFAS 123(R), we review our current assumptions on a periodic basis and adjust them as necessary to ensure proper option valuation. The expected life of an award was determined based on our analysis of historical exercise behavior taking into consideration various participant demographics and option characteristic criteria. The risk-free rate of return is based on the yield on zero coupon U.S. Treasury STRIPS with a remaining life that is consistent with the expected life of the options being valued. Our estimate of volatility incorporated a number of the factors outlined in SFAS 123(R), but was principally determined by examining our historical stock price volatility.
Total stock-based compensation expense recorded for the year ended October 31, 2008, 2007 and 2006 was $1,012,000, $1,174,000 and $1,650,000, respectively.
The intrinsic value of an option is the amount by which the fair value of the underlying stock exceeds its exercise price. There were no options exercised in the years ended October 31, 2007 and 2008. The total intrinsic value of all options outstanding at October 31, 2008 and 2007 was $0 and $55,000, respectively. The weighted average fair value of options granted during the year ended October 31, 2008 and 2007 was $1.08 per share and $1.95 per share, respectively.
As of October 31, 2008 and 2007, the total unrecognized compensation cost related to unvested stock-based compensation arrangements was approximately $1.2 million and $1.4 million, respectively, and the related weighted average period over which it is expected to be recognized remained at approximately two years.
Note 14. Restructuring, Impairments and Other Charges
Restructuring, impairments and other charges are summarized as follows (in thousands):
| 2008 | 2007 | 2006 | ||||||||||
| Restructuring charges: | ||||||||||||
| Severance and related benefits for U.K. headcount reduction | $ | 70 | $ | - | $ | - | ||||||
| Severance and related benefits for U.S. and Canada headcount reduction | 3,112 | 288 | 1,450 | |||||||||
| U.K. facility closure liabilities | - | (766 | ) | 1,557 | ||||||||
| U.S. facility closure liabilities | 1,045 | - | - | |||||||||
| Other | - | - | 131 | |||||||||
| 4,227 | (478 | ) | 3,138 | |||||||||
| Impairment charges: | ||||||||||||
| Identified intangible assets | 1,889 | - | 7,044 | |||||||||
| Fixed assets | 168 | - | - | |||||||||
| Capitalized product development | 4,617 | 531 | - | |||||||||
| Goodwill | 71,865 | - | - | |||||||||
| 78,539 | 531 | 7,044 | ||||||||||
| Other charges: | ||||||||||||
| Executive officer changes | 932 | - | - | |||||||||
| $ | 83,698 | $ | 53 | $ | 10,182 | |||||||
| Amounts included in: | ||||||||||||
| Cost of revenue | $ | 5,085 | $ | 531 | $ | 1,089 | ||||||
| Operating expenses | 78,613 | (478 | ) | 9,093 | ||||||||
| $ | 83,698 | $ | 53 | $ | 10,182 | |||||||
Restructuring Charges
Fiscal Year 2008: In the second and fourth quarters of 2008, we incurred restructuring charges of $1,635,000 and $1,547,000, respectively, related to additional workforce reductions in the U.S. Included in the fourth quarter expense was $36,000 related to stock compensation charges. During the third and fourth quarter of 2008, we expensed approximately $800,000 and $245,000, respectively, related to closing our facilities in Atlanta, San Diego and Puerto Rico and a Bloomington warehouse which included approximately $93,000 related to asset impairment charges.
Fiscal Year 2007: During the third quarter of 2007, we terminated a lease for one of our United Kingdom facilities that was closed in connection with our restructuring activities that began in 2005. As a result of this transaction, we recorded a reduction in the restructure accrual related to this facility of approximately $766,000 with a corresponding benefit to earnings.
In October 2007, we consolidated our service and sales organizations under the leadership of one executive. Severance and related costs of $288,000 were recorded related to these actions.
Fiscal Year 2006: In the first nine months of fiscal year 2006, we reduced headcount in the U.S. as a continuation of restructuring activities initiated in October 2005. These actions resulted in severance and related costs totaling $264,000.
In October 2006, we initiated plans to reduce additional U.S. sales and general and administrative headcount based on fourth quarter financial performance and the resulting impact on our financial plans for 2007. Severance and related costs of $1,186,000 were recorded related to these actions. In addition to these charges, we also recorded $1,557,000 related to lease commitments on our remaining facility in the United Kingdom (“U.K”) which was vacated in the fourth quarter 2006.
The restructuring reserve activity was as follows (in thousands):
Severance and related benefits | Facility closings | Other | Total | |||||||||||||
| Reserve balance at October 31, 2006 | $ | 1,232 | $ | 1,526 | $ | 316 | $ | 3,074 | ||||||||
| Provision for restructuring | 288 | (766 | ) | - | (478 | ) | ||||||||||
| Cash payments | (1,058 | ) | (555 | ) | (43 | ) | (1,656 | ) | ||||||||
| Other | (38 | ) | 411 | (273 | ) | 100 | ||||||||||
| Reserve balance at October 31, 2007 | 424 | 616 | - | 1,040 | ||||||||||||
| Provision for restructuring | 3,146 | 952 | - | 4,098 | ||||||||||||
| Cash payments | (1,806 | ) | (427 | ) | - | (2,233 | ) | |||||||||
| Other | - | (112 | ) | - | (112 | ) | ||||||||||
| Reserve balance at October 31, 2008 | $ | 1,764 | $ | 1,029 | $ | - | $ | 2,793 | ||||||||
Impairment Charges
The impairment charges on product development, goodwill and acquired identified intangible assets are more fully described in Note 7 and 8 to consolidated financial statements, respectively.
Other Charges
In September 2008, we announced that Michael Morache would be stepping down as President and Chief Executive Officer effective as of the close of business on October 31, 2008. The Board of Directors approved an arrangement with Mr. Morache whereby he would receive the severance benefits as described in his employment agreement, subject to certain agreed-upon modifications, including the extension of the amount of time Mr. Morache has to exercise vested stock options. In the fourth quarter of 2008, we recorded total charges of $932,000, including $216,000 of non-cash stock-based compensation, related to Mr. Morache’s termination.
Note 15. Income Taxes
The components of loss before income taxes were as follows (in thousands):
| 2008 | 2007 | 2006 | ||||||||||
| United States | $ | (95,456 | ) | $ | (15,396 | ) | $ | (19,255 | ) | |||
| Foreign | 422 | 1,128 | (2,625 | ) | ||||||||
| $ | (95,034 | ) | $ | (14,268 | ) | $ | (21,880 | ) | ||||
The components of income tax expense (benefit) were as follows (in thousands):
| 2008 | 2007 | 2006 | ||||||||||
| Federal | $ | (3,137 | ) | $ | 608 | $ | 600 | |||||
| State and local | - | - | - | |||||||||
| $ | (3,137 | ) | $ | 608 | $ | 600 | ||||||
| Current tax expense | $ | - | $ | - | $ | - | ||||||
| Deferred tax expense (benefit) | (3,137 | ) | 608 | 600 | ||||||||
| $ | (3,137 | ) | $ | 608 | $ | 600 | ||||||
In 2007 and 2006, income tax expense of $608,000 and $600,000, respectively, was related to tax deductible goodwill. In 2008, the full impairment of the tax-deductible goodwill, as discussed in Note 8 above, resulted in the reversal of the cumulative deferred tax liability and a corresponding income tax benefit of $3,137,000.
Income tax expense differs from the amount computed by applying the U.S. federal statutory income tax rate to earnings (loss) before income taxes as follows (in thousands):
| 2008 | 2007 | 2006 | ||||||||||
| U.S. federal statutory rate at 34% | $ | (32,311 | ) | $ | (4,851 | ) | $ | (7,439 | ) | |||
| Goodwill | - | 608 | 600 | |||||||||
| Non-deductible goodwill | 15,769 | - | - | |||||||||
| Other non-deductible expenses | 138 | 91 | 130 | |||||||||
| No benefit from foreign (income) loss | (144 | ) | (383 | ) | 892 | |||||||
| Increase in deferred tax valuation allowance | 13,411 | 5,143 | 6,417 | |||||||||
| $ | (3,137 | ) | $ | 608 | $ | 600 | ||||||
The components of the net deferred tax liability at October 31 were as follows (in thousands):
| 2008 | 2007 | |||||||
| Current: | ||||||||
| Accrued liabilities and reserves | $ | 5,511 | $ | 5,109 | ||||
| Valuation allowance | (5,511 | ) | (5,109 | ) | ||||
| Net current deferred tax asset | - | - | ||||||
| Long-term: | ||||||||
| Net operating loss carryforward | 69,450 | 57,974 | ||||||
| Tax credit carryforwards | 608 | 608 | ||||||
| Product development expense recognition | 3,381 | 3,371 | ||||||
| Equipment basis difference | (422 | ) | (483 | ) | ||||
| Identified intangible asset basis difference | (627 | ) | (3,601 | ) | ||||
| Goodwill basis difference | 5,218 | (3,139 | ) | |||||
| Other | 1,608 | 1,150 | ||||||
| Valuation allowance | (79,216 | ) | (59,019 | ) | ||||
| Net long-term deferred tax liability | - | (3,139 | ) | |||||
| $ | - | $ | (3,139 | ) | ||||
We had a net deferred tax liability of $0 and $3,139,000 at October 31, 2008 and 2007, respectively, related to tax deductible goodwill from a previous acquisition. In 2008, the full impairment of the tax-deductible goodwill resulted in the reversal of the cumulative deferred tax liability.
At October 31, 2008 and 2007, our deferred tax assets were fully reserved. At October 31, 2008, approximately $66,849,000 of the gross deferred tax asset relates to our net operating loss carryforwards in the U.S. of approximately $167,124,000, which expire in varying amounts between 2009 and 2028. These loss carryforwards include those of Lightspan, a U.S. company acquired in the first quarter of 2004, as limited by Section 382 of the Internal Revenue Code. Also included in our gross deferred tax asset was $2,601,000 related to net operating loss carryforwards of approximately $8,645,000 in our foreign subsidiaries. We have provided a full valuation allowance related to these foreign deferred income tax assets due to the uncertainty in realization of future taxable income in these jurisdictions.
Realization of our U.S. deferred tax asset is dependent on generating sufficient taxable income in the U.S. prior to expiration of these loss carryforwards. Our history of cumulative operating losses over the past several years has led to our current assessment that it is more likely than not that our net deferred taxes will not be realized. As a result, our deferred tax assets are fully reserved and will remain fully reserved until the related tax benefits are realized through the generation of taxable income in a particular year, or until we can demonstrate a history of generating taxable income. Subsequent realization, if any, of all deferred tax assets will be recorded as a reduction of income tax expense in the year realized.
We implemented the provisions of FIN 48, Accounting for Uncertainty in Income Taxes – an Interpretation of FASB Statement no. 109, effective November 1, 2007. This interpretation clarifies the accounting for uncertainty in income taxes recognized in our financial statements and prescribes a recognition threshold and measurement criteria for the financial statement recognition and measurement of a tax position taken or expected to be taken in a tax return. It also provides guidance on derecognition, classification, interest and penalties, accounting in interim periods, disclosure and transition. The impact of adopting FIN 48 on our consolidated financial statements was not material and no cumulative effect adjustment was recorded to the November 1, 2007 balance of accumulated deficit. In 2008, we recognized no tax benefit or liabilities for uncertainties related to prior and current year income tax positions, which were determined to be immaterial. We did, however increase our gross deferred tax assets by $11,476,000, related to the increase in the value of our net operating losses due to adjustments of tax limitations on the utilization of net operating losses.
Note 16. Segment and Geographic Information
We operate in one industry segment, which is the development and marketing of educational software and related services. Net sales by geographic area are presented by attributing revenues from external customers on the basis of the country in which the product and services are sold. Information about our geographic operations is as follows (in thousands):
| 2008 | 2007 | 2006 | ||||||||||
| Revenues from unaffiliated customers: | ||||||||||||
| United States | $ | 67,527 | $ | 68,737 | $ | 88,349 | ||||||
| Foreign | 874 | 895 | 2,370 | |||||||||
| $ | 68,401 | $ | 69,632 | $ | 90,719 | |||||||
| Long-term assets (at October 31): | ||||||||||||
| United States | $ | 34,707 | $ | 120,755 | $ | 116,406 | ||||||
| Foreign | - | 6 | 23 | |||||||||
| $ | 34,707 | $ | 120,761 | $ | 116,429 | |||||||
Note 17. Selected Quarterly Financial Data (Unaudited)
(In thousands, except per share data)
| January 31 | April 30 | July 31 | October 31 | Total | ||||||||||||||||
| 2008: | ||||||||||||||||||||
| Revenues | $ | 16,135 | $ | 16,245 | $ | 18,638 | $ | 17,383 | $ | 68,401 | ||||||||||
| Gross profit | 7,468 | 7,018 | 9,333 | 3,114 | 26,933 | |||||||||||||||
| Operating expenses | 11,419 | 13,346 | 11,231 | 86,225 | 122,221 | |||||||||||||||
| Net loss (1) | (3,911 | ) | (6,473 | ) | (2,061 | ) | (79,452 | ) | (91,897 | ) | ||||||||||
| Basic and diluted loss per share (2) | $ | (0.16 | ) | $ | (0.27 | ) | $ | (0.09 | ) | $ | (3.32 | ) | $ | (3.85 | ) | |||||
| 2007: | ||||||||||||||||||||
| Revenues | $ | 17,026 | $ | 15,213 | $ | 19,203 | $ | 18,190 | $ | 69,632 | ||||||||||
| Gross profit | 8,364 | 6,453 | 9,501 | 7,795 | 32,113 | |||||||||||||||
| Operating expenses | 13,160 | 11,888 | 10,615 | 11,877 | 47,540 | |||||||||||||||
| Net loss (3) | (4,526 | ) | (5,306 | ) | (1,046 | ) | (3,998 | ) | (14,876 | ) | ||||||||||
| Basic and diluted loss per share (2) | $ | (0.19 | ) | $ | (0.22 | ) | $ | (0.04 | ) | $ | (0.17 | ) | $ | (0.63 | ) | |||||
(1) In the fourth quarter of 2008, we incurred $5,085 of asset impairment charges related to certain product development assets and identified technology intangible assets. These charges were recorded in cost of revenues, which reduced gross profit. Restructuring, impairment and other charges of $1,635, $800 and $76,178 for second, third and fourth quarters, respectively, were included in operating expenses. See Notes 7, 8 and 14 to the Consolidated Financial Statements. The fourth quarter of 2008 also includes a tax benefit of $3,137 related to the elimination of the deferred tax liability on tax-deductible goodwill. See Note 15 to the Consolidated Financial Statements.
(2) The sum of the quarterly loss per share does not equal the annual loss per share due to changes in average shares outstanding.
(3) In the fourth quarter of 2007, we incurred $531 of asset impairment charges related to certain product development assets. These charges were recorded in cost of revenues, which reduced gross profit. Restructuring charges of ($478) were included in operating expenses.
See Notes 7 and 14 to the Consolidated Financial Statements.
None.
Evaluation of Disclosure Controls and Procedures
As of the end of the period covered by this Annual Report on Form 10-K, we carried out an evaluation under the supervision and with the participation of our Disclosure Committee and our management, including the Chief Executive Officer and the Chief Financial Officer, of the effectiveness of the design and operation of our disclosure controls and procedures as defined in Exchange Act Rules 13a-15(e) and 15d-15(e). Disclosure controls and procedures are designed to ensure that information required to be disclosed in our reports filed under the Securities Exchange Act of 1934 (the “Exchange Act”) is recorded, processed, summarized, and reported within the time periods specified in the SEC’s rules and forms and that such information is accumulated and communicated to our management, including the Chief Executive Officer and Chief Financial Officer, to allow timely decisions regarding required disclosure. Based on this evaluation, our Chief Executive Officer and Chief Financial Officer concluded that the design and operation of our disclosure controls and procedures were effective as of October 31, 2008.
Management’s Report on Internal Control over Financial Reporting
Our management is responsible for establishing and maintaining adequate internal control over financial reporting, as defined in Exchange Act Rules 13a-15(f) and 15d-15(f). Our internal control over financial reporting is a process designed to provide reasonable assurance regarding the reliability of financial reporting and the preparation of financial statements for external purposes in accordance with generally accepted accounting principles.
Because of its inherent limitations, internal control over financial reporting may not prevent or detect misstatements. Also, projections of any evaluation of effectiveness to future periods are subject to the risk that controls may become inadequate because of changes in conditions, or that the degree of compliance with the policies or procedures may deteriorate.
Under the supervision and with the participation of our management, including our Chief Executive Officer and Chief Financial Officer, we conducted an evaluation of the effectiveness of our internal control over financial reporting as of October 31, 2008 based on the criteria established in Internal Control — Integrated Framework issued by the Committee of Sponsoring Organizations of the Treadway Commission (COSO). Based on the results of this evaluation, we concluded that our internal control over financial reporting was effective as of October 31, 2008.
The effectiveness of our internal control over financial reporting as of October 31, 2008 has been audited by Grant Thornton LLP, an independent registered public accounting firm, as stated in their report which is included in Part II, Item 8 of this Annual Report on Form 10-K.
Changes in Internal Control over Financial Reporting
There were no changes in our internal control over financial reporting identified in connection with the evaluation required by paragraph (d) of Exchange Act Rules 13a-15 or 15d-15 that was conducted during the last fiscal quarter, that have materially affected, or are reasonably likely to materially affect, our internal control over financial reporting.
None.
PART III.
The information required by Item 10 of this Annual Report on Form 10-K with respect to identification of our directors and identification of an audit committee financial expert is set forth under the captions “Election of Directors” and “Committees and Meetings of the Board of Directors” in our 2009 Proxy Statement and is incorporated herein by reference.
Information with respect to our Executive Officers as of January 1, 2009 is as follows:
| Name | Age | Position | ||
| Vincent P. Riera | 38 | President and Chief Executive Officer | ||
| Robert J. Rueckl | 47 | Vice President and Chief Financial Officer | ||
| James T. Lynn | 56 | Vice President and Chief Technology Officer |
Executive officers are appointed by, and serve at the discretion of, the Board of Directors.
Vincent P. Riera joined PLATO Learning in April 2007 as Senior Vice President, K-12 Sales, was appointed Senior Vice President, Sales and Service in September 2007 and became President and Chief Executive Officer on November 1, 2008. Prior to that, Mr. Riera served as Vice President of the professional division of Gateway, Inc. and held a wide range of sales and sales leadership positions at GE Capital, Equant, Inc. and MCIWorldcom.
Robert J. Rueckl joined PLATO Learning in June 2005 as Vice President, Controller and Chief Accounting Officer, and in January 2007, became Vice President and Chief Financial Officer. Prior to that, Mr. Rueckl held the positions of Executive Vice President and Chief Financial Officer, and Vice President, Controller at Zomax Incorporated, a publicly held supply chain services company. From 1996 to 2002, Mr. Rueckl held several senior finance positions at ADC Telecommunications. Prior to ADC, Mr. Rueckl spent five years at Cray Research in several accounting and finance positions, and six years in the audit practice of KPMG.
James T. Lynn joined PLATO Learning in May 2005 as Vice President and Chief Technology Officer. Prior to that, he was Senior Staff Systems Engineer at Lockheed Martin, where he managed advanced technology research programs and initiatives. From 2001 to 2003, Mr. Lynn was the Vice President of Technology at Pearson Digital Learning, and his business experience also includes senior engineering positions with ID Certify, Motorola, and Group Technologies Corp. (formerly Honeywell DCPD).
The information required by Item 405 of Regulation S-K is set forth under the caption “Section 16(a) Beneficial Ownership Reporting Compliance” in our 2009 Proxy Statement and is incorporated herein by reference.
Code of Ethics
We have adopted a code of business conduct and ethics for all of our employees and directors, including our chief executive officer, chief financial officer, other executive officers, and senior financial personnel, a copy of which is available on our web site (www.plato.com). We intend to post on our web site any material changes to or waiver from, our code of business conduct and ethics, if any, within four business days of any such event.
ITEM 11. EXECUTIVE COMPENSATION.
The information required by Item 11 of this Annual Report on Form 10-K is set forth under the captions “Executive Compensation,” “Compensation Committee Interlocks and Insider Participation,” “Report of the Compensation Committee” and “Director Compensation” in our 2009 Proxy Statement and is incorporated herein by reference.
ITEM 12. SECURITY OWNERSHIP OF CERTAIN BENEFICIAL OWNERS AND MANAGEMENT AND RELATED STOCKHOLDER MATTERS.
Our equity compensation plan information as of October 31, 2008 is as follows:
| Plan Category | Number of Securities to be Issued Upon Exercise of Outstanding Options | Weighted-Average Exercise Price of Outstanding Options | Number of Securities Remaining Available for Future Issuance | |||||||||
| Equity compensation plans approved by security holders | 2,617,000 | $ | 7.40 | 2,029,000 | ||||||||
| Equity compensation plans not approved by security holders | - | - | - | |||||||||
| Total | 2,617,000 | $ | 7.40 | 2,029,000 | ||||||||
All other information required by Item 12 of this Annual Report on Form 10-K is set forth under the caption “Security Ownership of Certain Beneficial Owners and Management” in our 2009 Proxy Statement and is incorporated herein by reference.
The information required by Item 13 of this Annual Report on Form 10-K is set forth under the captions “Certain Relationships and Related Transactions” and “Other Compensation Arrangements” in our 2009 Proxy Statement and is incorporated herein.
The information required by Item 14 of this Annual Report on Form 10-K is set forth under the caption “Fees Paid to Principal Accountants” in our 2009 Proxy Statement and is incorporated herein by reference.
PART IV
| (a) | Documents filed as a part of this report: |
| 1. | Financial Statements. |
The following Consolidated Financial Statements and Report of Independent Registered Public Accounting Firms as set forth in Item 8 of this Annual Report on Form 10-K:
Consolidated Statements of Operations for the fiscal years ended October 31, 2008, 2007, and 2006.
Consolidated Balance Sheets as of October 31, 2008 and 2007.
Consolidated Statements of Cash Flows for the fiscal years ended October 31, 2008, 2007, and 2006.
Consolidated Statements of Stockholders’ Equity and Comprehensive Loss for the fiscal years ended October 31, 2008, 2007, and 2006.
Notes to Consolidated Financial Statements.
| 2. | Financial Statement Schedules. |
The schedules are either not applicable or the required information is shown in the consolidated financial statements or notes thereto.
| 3. | Exhibits. |
See “Exhibit Index” on page 71 of this Annual Report on Form 10-K for a description of the documents that are filed as Exhibits to this report or incorporated by reference herein.
| (b) | See Item 15(a)(3) above. |
| (c) | See Item 15(a)(2) above. |
SIGNATURES
Pursuant to the requirements of Section 13 or 15 (d) of the Securities Exchange Act of 1934, the Registrant has duly caused this report to be signed on its behalf by the undersigned, thereunto duly authorized.
| PLATO LEARNING, INC. | |||
| January 14, 2009 | By | /s/ Vincent P. Riera | |
| Vincent P. Riera | |||
| President and Chief Executive Officer | |||
Pursuant to the requirements of the Securities Exchange Act of 1934, this report has been signed below by the following persons on behalf of the Registrant and in the capacities indicated on January 14, 2009.
| Signature: | Title: | |
| /s/ Vincent P. Riera | President and Chief Executive Officer | |
| Vincent P. Riera | (principal executive officer) | |
| /s/ Robert J. Rueckl | Vice President and Chief Financial Officer | |
| Robert J. Rueckl | (principal financial officer and | |
| principal accounting officer) | ||
| * | ||
| David W. Smith | Chairman of the Board | |
| * | ||
| Susan E. Knight | Director | |
| * | ||
| John G. Lewis | Director | |
| * | ||
| M. Lee Pelton | Director | |
| * | ||
| Robert S. Peterkin | Director | |
| * | ||
| J. Ted Sanders | Director |
| * | /s/ Robert J. Rueckl | |
| Robert J. Rueckl | ||
| Attorney-in Fact |
EXHIBIT INDEX TO FORM 10-K
| For the Fiscal Year Ended: | Commission File No. |
| October 31, 2008 | 0-20842 |
Exhibit
| Number | Description |
| 3.01 | Certificate of Incorporation is incorporated by reference to the corresponding exhibit of our Registration Statement on Form S-1 (File Number 33-54296). |
| 3.02 | Amended and Restated Bylaws of PLATO Learning, Inc., Amended as of September 11, 2008, are incorporated by reference to the corresponding exhibit of our Current Report on Form 8-K dated September 17, 2005 (File Number 0-20842). |
| 3.03 | Certificate of Amendment of Amended Certificate of Incorporation is incorporated by reference to the corresponding exhibit of our Annual Report on Form 10-K for the year ended October 31, 2001 (File Number 0-20842). |
| 3.04 | Certificate of Amendment of Certificate of Incorporation, filed November 6, 1992, is incorporated by reference to the corresponding exhibit of our Quarterly Report on Form 10-Q for the period ended April 30, 2002 (File Number 0-20842). |
| 3.05 | Certificate of Amendment of Amended Certificate of Incorporation, filed March 20, 2002, is incorporated by reference to the corresponding exhibit of our Quarterly Report on Form 10-Q for the period ended April 30, 2002 (File Number 0-20842). |
| 4.01 | Form of Stock Certificate is incorporated by reference to the corresponding exhibit of our Registration Statement on Form S-1 (File Number 33-54296). |
| 10.01 | Lease for Bloomington, Minnesota office is incorporated by reference to Exhibit 10.08 of our Annual Report on Form 10-K for the year ended October 31, 2000 (File Number 0-20842). |
| 10.02 | Form of Indemnification Agreement is incorporated by reference to Exhibit 10.11 of our Current Report on Form 8-K dated June 21, 2006. |
| 10.03 | 1997 Stock Incentive Plan is incorporated by reference to Appendix A of our 1997 Proxy Statement (File Number 0-20842). * |
| 10.04 | 1997 Non-Employee Directors Stock Option Plan is incorporated by reference to Appendix B of our 1997 Proxy Statement (File Number 0-20842). * |
| 10.05 | 2000 Stock Incentive Plan is incorporated by reference to Exhibit 4.03 of our Registration Statement on Form S-8 (File Number 33-45228). * |
Exhibit
| Number | Description |
| 10.06 | 2000 Non-Employee Directors Stock Option Plan is incorporated by reference to Exhibit 4.03 of our Registration Statement on Form S-8 (File Number 33-45230).* |
| 10.07 | PLATO Learning, Inc. 2002 Stock Plan, as amended, is incorporated by reference to Exhibit 10.39 of our Current Report on Form 8-K/A, Amendment No. 1, dated March 3, 2005 (File Number 0-20842). * |
| 10.08 | Forms of stock option agreement for 2002 Stock Plan, as amended, are incorporated by reference to Exhibit 10.39 of our Current Report on Form 8-K dated December 7, 2005 (File Number 0-20842). * |
| 10.09 | PLATO Learning, Inc. 2006 Stock Incentive Plan, is incorporated by reference to Exhibit 10.29, 10.30 and 10.51 of our Current Report on Form 8-K, dated March 8, 2006 (File Number 0-20842).* |
| 10.10 | PLATO Learning, Inc. 2006 Stock Incentive Plan, as amended, is incorporated by reference to Exhibit 10.7 of our Current Report on Form 8-K, dated September 11, 2008 (File Number 0-20842).* |
| 10.11 | Forms of stock appreciation rights agreement for 2006 Stock Incentive Plan, are incorporated by reference to Exhibit 10.14 of our Annual Report on Form 10-K, dated January 12, 2007 (File Number 0-20842).* |
| 10.12 | Directors Compensation Plan, as amended, is incorporated by reference to Exhibit 10.33 of our Current Report on Form 8-K, dated March 31, 2008 (File Number 0-20842).* |
| 10.13 | Fiscal 2006 Executive Annual Incentive Plan is incorporated by reference to Exhibit 10.42 of our Current Report on Form 8-K dated October 26, 2005 (File Number 0-20842).* |
| 10.14 | Fiscal 2007 Executive Annual Incentive Plan is incorporated by reference to Exhibit 10.57 of our Current Report on Form 8-K dated December 13, 2006 (File Number 0-20842).* |
| 10.15 | Resignation Agreement and General Release by and between Laurence Betterley and PLATO Learning, Inc., is incorporated by reference to Exhibit 10.1 of our Current Report on Form 8-K dated January 16, 2007 (File Number 0-20842).* |
| 10.16 | Credit Agreement, dated June 4, 2007, and amended on December 30, 2008, by and among PLATO Learning, Inc. Wells Fargo Foothill, Inc. and the other parties that are signatories thereto, is incorporated by reference to Exhibit 10.1 of our Current Report on Form 8-K dated June 5, 2007 (File Number 0-20842). |
| 10.17 | Form of Employee Restricted Stock Agreement is incorporated by reference to Exhibit 10.1 to our Quarterly Report on Form 10-Q dated September 10, 2007 (File Number 0-20842).* |
| 10.18 | PLATO Learning, Inc. 2008 Executive Annual Cash Incentive Plan, incorporated by reference to Exhibit 10.28 of our Current Report on Form 8-K dated January 24, 2008 (File Number 0-20842).* |
| 10.19 | PLATO Learning, Inc. 2008 Executive Annual Equity Incentive Plan, incorporated by reference to Exhibit 10.29 of our Current Report on Form 8-K, dated March 31, 2008 (File Number 0-20842).* |
| 10.20 | Forms of stock option agreement, are incorporated by reference to Exhibit 10.30 of our Current Report on Form 8-K, dated March 31, 2008 (File Number 0-20842).* |
| 10.21 | Forms of performance shares agreement, are incorporated by reference to Exhibit 10.31 of our Current Report on Form 8-K, dated March 31, 2008 (File Number 0-20842).* |
| 10.22 | Form of stock appreciation rights agreement, are incorporated by reference to Exhibit 10.32 of our Current Report on Form 8-K, dated March 31, 2008 (File Number (0-20842).* |
| 10.23 | Forms of employee restricted stock unit agreement, are incorporated by reference to Exhibit 10.29 of our Current Report on Form 8-K, dated May 19, 2008 (File Number 0-20842).* |
| 10.24 | Employment Agreement, dated as of February 28, 2005, by and between PLATO Learning, Inc. and Michael A. Morache, is incorporated by reference to Exhibit 10.14 of our Annual Report on Form 10-K, dated January 14, 2008 (File Number 0-20842). * |
| 10.25 | Employment Agreement with David H. LePage, is incorporated by reference to Exhibit 10.15 of our Annual Report on Form 10-K, dated January 14, 2008 (File Number 0-20842).* |
| 10.26 | Employment Agreement with James T. Lynn, is incorporated by reference to Exhibit 10.17 of our Annual Report on Form 10-K, dated January 14, 2008 (File Number 0-20842).* |
| 10.27 | Employment Agreement with Robert J. Rueckl, is incorporated by reference to Exhibit 10.19 of our Annual Report on Form 10-K, dated January 14, 2008 (File Number 0-20842).* |
| 10.28 | Employment Agreement with Vincent Riera is incorporated by reference to Exhibit 10.1 of our Current Report on Form 8-K, dated September 25, 2008 (File Number 0-20842).* |
| Separation Letter from PLATO Learning to David H. LePage.* |
| General Release and Waiver of Claims by Michael A. Morache.* |
| Subsidiaries of the Registrant. |
| Consent of Independent Registered Public Accounting Firm. |
| Consent of Independent Registered Public Accounting Firm |
| Power of Attorney. |
| Certification of Chief Executive Officer pursuant to Section 302 of the Sarbanes-Oxley Act of 2002. |
| Certification of Chief Financial Officer pursuant to Section 302 of the Sarbanes-Oxley Act of 2002. |
| Certification of Chief Executive Officer pursuant to Section 906 of the Sarbanes-Oxley Act of 2002. |
| Certification of Chief Financial Officer pursuant to Section 906 of the Sarbanes-Oxley Act of 2002. |
* Denotes management contract or compensatory plan, contract or arrangement
** Filed herewith
73