UNITED STATES
SECURITIES AND EXCHANGE COMMISSION
WASHINGTON, D.C. 20549
FORM 10-K
ý ANNUAL REPORT PURSUANT TO SECTION 13 OR 15(d) OF THE
SECURITIES EXCHANGE ACT OF 1934
For the fiscal year ended February 29, 2008
OR
o TRANSITION REPORT PURSUANT TO SECTION 13 OR 15(d) OF THE
SECURITIES EXCHANGE ACT OF 1934
For the transition period from ____________ to ____________
Commission file number: 1-12777
AZZ incorporated
(Exact name of registrant as specified in its charter)
| TEXAS | | 75-0948250 |
| (State or other jurisdiction of incorporation or organization) | | (I.R.S. Employer Identification No.) |
| | | |
| University Centre I, Suite 200 | | |
| 1300 South University Drive | | |
| Fort Worth, Texas | | 76107 |
| (Address of principal executive offices) | | (Zip Code) |
(817) 810-0095
(Registrant’s telephone number, including area code)
None
(Former name, former address and former fiscal year, if changed since last report)
Securities registered pursuant to Section 12(b) of the Act:
| Title of each class | | Name of each exchange on which registered |
| Common Stock, $1.00 par value per share | | New York Stock Exchange |
Securities registered pursuant to Section 12(g) of the Act: None
Indicate by check mark if the registrant is a well-known seasoned issuer, as defined in Rule 405 of the Securities Act.
Indicate by check mark if the registrant is not required to file reports pursuant to Section 13 or Section 15(d) of the Exchange Act.
Indicate by check mark whether the registrant (1) has filed all reports required to be filed by Section 13 or 15(d) of the Securities Exchange Act of 1934 during the preceding 12 months (or for such shorter period that the registrant was required to file such reports), and (2) has been subject to such filing requirements for the past 90 days.
Indicate by check mark if disclosure of delinquent filers pursuant to Item 405 of Regulation S-K is not contained herein, and will not be contained, to the best of registrant's knowledge, in definitive proxy or information statements incorporated by reference in Part III of this Form 10-K or any amendment to this Form 10-K. T
Indicate by check mark whether the registrant is a large accelerated filer, an accelerated filer, or a non-accelerated filer. See definition of “accelerated filer and large accelerated filer” in Rule 12b-2 of the Exchange Act.
Large accelerated filer £ | | Accelerated filer T | | Non-accelerated filer £ | | Smaller Reporting Company £ |
Indicate by check mark whether the registrant is a shell company (as defined in Rule 12b-2 of the Exchange Act).
As of August 31, 2007 (the last business day of its most recently completed second fiscal quarter), the aggregate market value of the registrant’s common stock held by non-affiliates of the registrant was $331,321,585 based on the closing sale price of $28.40 per share as reported on the New York Stock Exchange (For purposes of determining the above stated amount, only the directors, executive officers and 10% or greater shareholders of the registrant have been deemed affiliates; however, this does not represent a conclusion by the registrant that any or all such persons are affiliates of the registrant).
As of February 29, 2008, there were 12,128,972 shares of the registrant’s common Stock ($1.00 par value) outstanding, after giving effect to our two-for-one stock split, effective in the form of a share dividend on May 4, 2007.
DOCUMENTS INCORPORATED BY REFERENCE
| Document | | Parts Into Which Incorporated |
| Proxy Statement for the 2008 Annual Meeting of Shareholders to be held July 8, 2008 | | Part III |
AZZ incorporated
YEAR ENDED FEBRUARY 29, 2008
| PART I | | | | 1 |
| Item 1. | | Business | | 1 |
| Item 1A. | | Risk Factors | | 5 |
| Item 1B. | | Unresolved Staff Comments | | 8 |
| Item 2. | | Properties | | 8 |
| Item 3. | | Legal Proceedings | | 9 |
| Item 4. | | Submission of Matters to a Vote of Security Holders | | 9 |
| | | | | |
| PART II | | | | 9 |
| Item 5. | | Market for Registrant’s Common Equity, Related Stockholder Matters and Issuer Purchases of Equity Securities | | 9 |
| Item 6. | | | | 11 |
| Item 7. | | Management’s Discussion and Analysis of Financial Condition and Results of Operation | | 11 |
| Item 7A. | | Quantitative and Qualitative Disclosures About Market Risk | | 22 |
| Item 8. | | Financial Statements and Supplementary Data | | 22 |
| Item 9. | | Changes in and Disagreements with Accountants on Accounting and Financial Disclosure | | 22 |
| Item 9A. | | Controls and Procedures | | 22 |
| Item 9B. | | Other Information | | 23 |
| | | | | |
| PART III | | | | 23 |
| Item 10. | | Directors, Executive Officers and Corporate Governance | | 23 |
| Item 11. | | Executive Compensation | | 24 |
| Item 12. | | Security Ownership of Certain Beneficial Owners and Management and Related Stockholder Matters | | 24 |
| Item 13. | | Certain Relationships and Related Transactions, and Directors Independence | | 25 |
| Item 14. | | Principal Accountant Fees and Services | | 25 |
| | | | | |
| PART IV | | | | 25 |
| Item 15. | | Exhibits and Financial Statement Schedules | | 25 |
| | | | | |
| SIGNATURES | | | | 26 |
Forward Looking Statements
This Annual Report on Form 10-K may contain “forward-looking statements” within the meaning of Section 27A of the Securities Act of 1933, as amended, and Section 21E of the Securities Exchange Act of 1934, as amended. These statements are generally identified by the use of words such as “anticipate,” “expect,” “estimate,” “intend,” “should,” “may,” “believe,” and terms with similar meanings. Although the Company believes that the current views and expectations reflected in these forward-looking statements are reasonable, those views and expectations, and the related statements, are inherently subject to risks, uncertainties, and other factors, many of which are not under the Company’s control. Those risks, uncertainties, and other factors could cause the actual results to differ materially from those in the forward-looking statements. Those risks, uncertainties, and factors include, but are not limited to: the level of customer demand for and response to products and services offered by the Company, including demand by the power generation markets, electrical transmission and distribution markets, the general industrial market, and the hot dip galvanizing markets; prices and raw material cost, including the cost of zinc and natural gas, which are used in the hot dip galvanizing process; changes in economic conditions of the various markets the Company serves, both foreign and domestic; customer requested delays of shipments; acquisition opportunities or lack thereof; adequacy of financing; and availability of experienced management employees to implement the Company’s growth strategy. The Company expressly disclaims any obligation to release publicly any updates or revisions to these forward-looking statements to reflect any change in its views or expectations. The Company can give no assurances that such forward-looking statements will prove to be correct.
PART I
Item 1. Business
AZZ incorporated (“AZZ”, the “Company” or “we”) was established in 1956 and incorporated under the laws of the State of Texas. We are an electrical equipment and components manufacturer, serving the global markets of power generation, transmission and distribution, and the general industrial markets, and a leading provider of hot dip galvanizing services to the steel fabrication market nationwide. We offer products through two distinct business segments, the Electrical and Industrial Products Segment and the Galvanizing Services Segment.
Electrical and Industrial Products Segment
Our Electrical and Industrial Products Segment produces highly engineered specialty electrical products as well as industrial lighting and tubular products, all of which we market and sell both in domestic and international markets. Our electrical products are designed, manufactured and configured to distribute electrical power to and from generators, transformers, switching devices and other electrical configurations and are supplied to the power generation, transmission and distribution markets as well as the general industrial market. Our industrial products include industrial lighting and tubular products used for petro-chemical and industrial applications. We provide lighting products to the petroleum, food processing, and to industries with unique lighting challenges. We also provide tubular products to the petroleum industry.
The markets for our Electrical and Industrial Products Segment are highly competitive and consist of a few large multi-national companies, as well as numerous small independent companies. Competition is based primarily on product quality, range of product line, price and service. While some of our competitors are much larger and better financed than us, we believe that we can compete favorably with them.
Copper, aluminum and steel are the primary raw materials used by this segment. All of these raw materials are currently readily available.
We sell this segment's products through manufacturers' representatives, distributors, agents and our internal sales force. We are not dependent on any single customer for this segment, and the loss of any single customer would not have a material adverse effect on our consolidated revenues or net income.
Backlog of orders for the Electrical and Industrial Products Segment was approximately $134.9 million at February 29, 2008, $120.7 million at February 28, 2007, and $73.8 million at February 28, 2006. The majority of the backlog as of February 29, 2008 should be delivered during the next 18 months. We believe that the contracts and purchase orders included in the backlog are firm.
We employ a total of 747 people in this segment as of February 29, 2008.
Galvanizing Services Segment
The Galvanizing Services Segment provides hot dip galvanizing to the steel fabrication industry through facilities located throughout the South, Midwest and Southwest United States. Hot dip galvanizing is a metallurgical process in which molten zinc is applied to a customer's material. The zinc bonding renders a corrosion protection to fabricated steel for extended periods of up to 50 years. As of February 29, 2008, we operate fourteen galvanizing plants, which are located in Texas, Louisiana, Alabama, Mississippi, Arkansas, Arizona, Indiana and Ohio.
Galvanizing is a highly competitive business, and we compete with other galvanizing companies, captive galvanizing facilities operated by manufacturers, and alternate forms of corrosion protection such as paint. Our galvanizing market is generally limited to areas within a relatively close proximity of our galvanizing plants due to freight cost.
Zinc, the principal raw material used in the galvanizing process, is currently readily available, but has volatile pricing. We manage our exposure to commodity pricing of zinc by utilizing agreements with zinc suppliers that include protective caps to guard against escalating commodity prices.
We typically serve fabricators and/or manufacturers who provide services to the electrical and telecommunications, bridge and highway, petrochemical and general industrial markets, as well as numerous original equipment manufacturers (“OEMs”). We do not depend on any single customer for our galvanizing services, and the loss of any single customer would not have a material adverse effect on our consolidated revenues or net income.
The backlog of galvanizing orders generally is nominal due to the short time requirement involved in the process.
We employ a total of 675 people in this segment as of February 29, 2008.
Recent Developments
On March 31, 2008, AZZ incorporated entered into an Asset Purchase Agreement to acquire substantially all of the assets AAA Industries, Inc. The purchase price of the transaction was approximately $83,000,000, subject to adjustment as more fully described in the Asset Purchase Agreement filed on Form 8-K on April 1, 2008. The purchased assets included six galvanizing plants (three plants located in Illinois, one plant located in Indiana, one plant located in Minnesota and one plant located in Oklahoma) and related equipment and supplies.
The purchase price will be allocated to the underlying assets and liabilities based on their estimated fair values. The resulting goodwill from this transaction is currently estimated at $16 million. The goodwill estimate is preliminary, pending the results of appraisals, and audit, and further financial analysis. For the year ended December 31, 2007, AAA Industries, Inc. had sales of approximately $55 million.
Additionally, on March 31, 2008, the Company entered into a Note Purchase Agreement pursuant to which the Company issued $100,000,000 aggregate principal amount of its 6.24% unsecured Senior Notes due March 31, 2018 through a private placement (the "Note Offering"). Pursuant to the Note Purchase Agreement, the Company’s payment obligations with respect to the Senior Notes may be accelerated upon any Event of Default, as defined in the Note Purchase Agreement.
In connection with the Note Offering, the Company entered into the Second Amendment to Second Amended and Restated Credit Agreement, (the “Second Amendment”) with Bank of America, N. A. (“Bank of America”), which amended the Second Amended and Restated Credit Agreement by and among the Company, Bank of America and
certain other lenders (including Bank of America) dated as of May 25, 2006 (the “Credit Agreement”). The Second Amendment contains the consent of Bank of America to the Note Offering and amended the Credit Agreement to provide that the Note Offering will not constitute a default under the Credit Agreement.
The Senior Notes provide for various financial covenants of a) Minimum Consolidated Net Worth - Maintain on a consolidated basis net worth equal to at least the sum of $116.9 million plus 50% of future net income; b) Maximum Ratio of Consolidated Indebtedness to Consolidated EBITDA – Maintain a ratio of indebtedness to EBITDA (as defined in Note Purchase Agreement) not to exceed 3.25:1.00; c) Fixed Charge Coverage Ratio – Maintains on a consolidated basis a Fixed Charge Coverage Ratio of at least 2.0:1.0; d) Priority Indebtedness – The Company will not at any time permit aggregate amount of all Priority Indebtedness to exceed 10% of Consolidated Net Worth. In conjunction with Note Offering, the Credit Agreement with Bank of America was amended to reflect the same debt covenants as presented above.
Executive Officers of the Registrant
Name | Age | Business Experience for Past Five Years Position or Office with Registrant or Prior Employer | Held Since |
| | | | |
| David H. Dingus | 60 | President and Chief Executive Officer | 2001 |
| | | | |
| Dana L. Perry | 59 | Senior Vice President of Finance, Chief Financial Officer and Secretary Vice President of Finance, Chief Financial Officer, Asst. Sec. | 2004 1992-2004 |
| | | | |
| John V. Petro | 62 | Senior Vice President Operations, Electrical & Industrial Products Vice President Operations, Electrical & Industrial Products | 2006 2001-2006 |
| | | | |
| Clement H. Watson | 61 | Vice President Sales, Electrical Products | 2000 |
| | | | |
| Jim C. Stricklen | 59 | Vice President, Business and Manufacturing Systems Vice President, Assist Connectivity Technology | 2004 2001-2003 |
| | | | |
| Tim E. Pendley | 46 | Vice President Operations, Galvanizing Services Segment Division Operations Manager | 2004 1999-2004 |
| | | | |
| Richard W. Butler | 42 | Vice President, Corporate Controller Corporate Controller | 2004 1999-2004 |
| | | | |
| Robert D. Ruffin | 67 | Vice President, Human Resources Corporate Director, Human Resources | 2005 1999-2005 |
| | | | |
| Ashok E. Kolady | 34 | Vice President, Business Development Operation, Marketing, & Business Development, Eaton Corp Process Improvement Lead, General Motors Corporation | 2007 2004-2007 1999-2004 |
Each executive officer was elected by the Board of Directors to hold office until the next Annual Meeting or until his successor is elected. There are no family relationships between the Executive Officers of the Company.
Available Information
We are subject to the reporting requirements of the Securities Exchange Act of 1934, as amended, and its rules and regulations. The Exchange Act requires us to file reports, proxy statements and other information with the SEC. Copies of these reports, proxy statements and other information can be inspected and copied at:
| | SEC Public Reference Room |
| | 100 F Street, N.E. |
| | Washington, D.C. 20549 |
You may obtain information on the operation of the Public Reference Room by calling the SEC at 1-800-SEC-0330. You may also obtain copies of any material we have filed with the SEC by mail at prescribed rates from:
| | Public Reference Section |
| | Securities and Exchange Commission |
| | 100 F Street N.E. |
| | Washington, D.C. 20549 |
You may obtain these materials electronically by accessing the SEC’s website on the Internet at:
In addition, we make available, free of charge, on our internet website, our annual report on Form 10-K, quarterly reports on Form 10-Q, current reports on Form 8-K, and amendments to these reports filed or furnished pursuant to Section 13(a) or 15(d) of the Exchange Act as soon as reasonably practicable after we electronically file this material with, or furnish it to, the SEC. You may review these documents, under the heading “Investor Relations,” subheading “SEC Filings,” on our website at:
Reports and other information concerning our Company are available for inspection and copying at:
| | New York Stock Exchange |
| | 20 Broad Street |
| | New York, New York 10005 |
Corporate Governance
Our Company’s Board of Directors (the "Board"), with the assistance of its Nominating and Corporate Governance Committee, has adopted Corporate Governance Guidelines that set forth the Board’s policies regarding corporate governance.
In connection with the Board's responsibility to oversee our legal compliance and conduct, the Board has adopted a Code of Ethics, which applies to the Company’s officers, directors and employees.
The Board has adopted charters for each of its Audit Committee, Compensation Committee and Nominating and Corporate Governance Committee. You may review the Corporate Governance Guidelines, our Code of Ethics and our Committee charters under the Heading “Investor Relations,” subheading “Corporate Governance,” on our website at:
You may also obtain a copy of these documents by mailing a request to:
| | AZZ incorporated |
| | Investor Relations |
| | University Centre I, Suite 200 |
| | 1300 South University Drive |
| | Fort Worth, TX 76107 |
Item 1A. Risk Factors
Our business is subject to a variety of risks, including the risks described below. While we believe that the risks and uncertainties described below are the most significant risks and uncertainties facing our business, they are not the only ones facing us. Additional risks and uncertainties not known to us or not described below may also impair our business operations. If any of the following risks actually occur, our business, financial condition and results of operations could be negatively impacted and our future growth could be impacted as well.
Our business segments operate in highly competitive markets
Many of our competitors, primarily in our Electrical and Industrial Products Segment, are significantly larger and have substantially more resources than we do. Competition is based on a number of factors, including price. Certain of our competitors may have lower cost structures and may, therefore, be able to provide their products and services at lower rates than we are able to provide. We cannot be certain that our competitors will not develop the expertise, experience and resources to provide services that are superior in both price and quality. Similarly, we cannot be certain that we will be able to maintain or enhance our competitive position within our industries, maintain our customer base at current levels or increase our customer base.
Our business segments are sensitive to economic downturns
If the general level of economic activity deteriorates from current levels, our customers may delay or cancel new projects. If there is a reduction in demand for our products or services, as a result of a downturn in the general economy, there could be a material adverse effect on price levels and the quantity of goods and services purchased, therefore adversely impacting revenues and results from operations. A number of factors, including financing conditions and potential bankruptcies in the industries we serve, could adversely affect our customers and their ability or willingness to fund capital expenditures in the future and pay for past services.
International and political events may adversely affect our Electrical and Industrial Products Segment
A portion of the revenues from our Electrical and Industrial Products Segment are from international markets. The occurrence of any of the risks described below could have an adverse effect on our consolidated results of operations, cash flows and financial condition:
| | · | political and economic instability; |
| | · | social unrest, acts of terrorism, force majeure, war or other armed conflict; |
| | · | currency fluctuation, devaluations and conversion restrictions; |
| | · | governmental activities that limit or disrupt markets, restrict payments or limit the movement of funds; and |
| | · | trade restrictions and economic embargoes by the United States or other countries. |
Fluctuations in the price and supply of raw materials and natural gas for our business segments may adversely affect our operations.
We purchase a wide variety of raw materials for our Electrical and Industrial Products Segment to manufacture our products, including steel, aluminum and copper. Unanticipated increases in raw material requirements or price increases could increase production costs and adversely affect profitability. In our Galvanizing Service Segment, zinc and natural gas represent a large portion of our cost of sales. The prices of zinc and natural gas are highly volatile. The following factors, which are beyond our control, affect the price of raw materials and natural gas for our business segments: supply and demand; freight costs and transportation availability; inventory levels; trade duties and taxes; and labor disputes. We seek to maintain operating margins by attempting to increase the price of our products and services in response to increased costs, but may not be successful in passing these price increases through to our customers.
Our dependence upon fixed-price contracts for our Electrical and Industrial Products Segment could adversely affect our business.
We currently generate, and expect to continue to generate, a significant portion of our revenues under fixed price contracts. We must estimate the costs of completing a particular project to bid for fixed-price contracts. The actual cost of labor and materials, however, may vary from the costs we originally estimated. Depending on the size of particular project, variations from estimated cost could have a significant impact on our operating results for any fiscal year.
Our compliance with various governmental regulations and environmental risks may increase our costs.
Our business is subject to numerous federal, state, provincial, local and foreign laws and regulations, including regulations, primarily in our Galvanizing Services Segment, with respect to air emissions, storm water runoff and the generation, handling, storage, transportation, treatment, and disposal of waste materials. Although we believe we are substantially in compliance with all applicable laws and regulations, legal requirements are frequently changed and subject to interpretation, and the presently unpredictable ultimate cost of compliance with these requirements could adversely impact our operations. We may be required to make significant expenditures to comply with governmental laws and regulations. Existing laws or regulations, as currently interpreted or reinterpreted in the future, or future laws or regulations, could have a material adverse effect on our results of operations and financial condition.
Our acquisition strategy involves a number of risks.
We intend to pursue growth through the pursuit of opportunities to acquire companies or assets that will enable us to expand our product and service offerings. We routinely review potential acquisitions. However, we may be unable to implement this growth strategy if we cannot reach agreement on potential strategic acquisitions on acceptable terms or for other reasons. Moreover, our acquisition strategy involves certain risks, including:
| | · | difficulties in the integration of operations and systems; |
| | · | the termination of relationships by key personnel and customers of the acquired company; |
| | · | a failure to add additional employees to handle the increased volume of business; |
| | · | additional financial and accounting challenges and complexities in areas such as tax planning, treasury management and financial reporting; |
| | · | risks and liabilities from our acquisitions, some of which may not be discovered during our due diligence; |
| | · | a disruption of our ongoing business or an inability of our ongoing business to receive sufficient management attention; and |
| | · | a failure to realize the cost savings or other financial benefits we anticipated. |
Future acquisitions may require us to obtain additional equity or debt financing, which may not be available on attractive terms.
Our use of percentage-of-completion accounting in the Electrical and Industrial Products Segment could result in a reduction or elimination of previously reported profits.
As discussed in “Management’s Discussion and Analysis of Financial Condition and Results of Operations-Critical Accounting Policies and Estimates” and in the notes to our consolidated financial statements, a portion of our revenues is recognized on a percentage-of-completion method of accounting. The percentage-of-completion accounting practice we use results in our recognizing contract revenues and earnings ratably over the contract term in proportion to our incurrence of contract costs. The earnings or losses recognized on individual contracts are based on estimates of contract revenues, costs and profitability. Contract losses are recognized in full when determined, and contract profit estimates are adjusted based on ongoing reviews of contract profitability. Actual collection of contract amounts or change orders could differ from estimated amounts and could result in a reduction or elimination of previously recognized earnings. In certain circumstances, it is possible that such adjustments could be significant.
We may not be able to fully realize the revenue value reported in our backlog for our Electrical and Industrial Products Segment.
We have a backlog of work in our Electrical and Industrial Products Segment to be completed on contracts. Orders included in our backlog are represented by customer purchase orders and contracts, which we believe to be firm. Backlog develops as a result of new business secured, which represents the revenue value of new project commitments received by us during a given period. Backlog consists of projects which have either (1) not yet been started or (2) are in progress and are not yet complete. In the latter case, the revenue value reported in backlog is the remaining value associated with work that has not yet been completed. From time to time, projects are cancelled that appeared to have a high certainty of going forward at the time they were recorded as new business taken. In the event of a project cancellation, we may be reimbursed for certain costs but typically have no contractual right to the total revenue reflected in our backlog. In addition to being unable to recover certain direct costs, we may also incur additional costs resulting from underutilized assets if projects are cancelled.
Our operating results may vary significantly from quarter to quarter.
Our quarterly results may be materially and adversely affected by:
| | · | the timing and volume of work under new agreements; |
| | · | general economic conditions; |
| | · | the budgetary spending patterns of customers; |
| | · | variations in the margins of projects performed during any particular quarter; |
| | · | losses experienced in our operations not otherwise covered by insurance; |
| | · | a change in the demand or production of our products and our services caused by severe weather conditions; |
| | · | a change in the mix of our customers, contracts and business; |
| | · | a change in customer delivery schedule; |
| | · | increases in design and manufacturing costs; and |
| | · | abilities of customers to pay their invoices owed to us. |
Accordingly, our operating results in any particular quarter may not be indicative of the results that you can expect for any other quarter or for the entire year.
We may be unsuccessful at generating internal growth.
Our ability to generate internal growth will be affected by, among other factors, our ability to:
| | · | attract new customers, internationally and domestically; |
| | · | increase the number or size of projects performed for existing customers; |
| | · | hire and retain employees; and |
| | · | increase volume utilizing our existing facilities. |
Many of the factors affecting our ability to generate internal growth may be beyond our control, and we cannot be certain that our strategies will be successful or that we will be able to generate cash flow sufficient to fund our operations and to support internal growth. If we are unsuccessful, we may not be able to achieve internal growth, expand our operations or grow our business.
The departure of key personnel could disrupt our business.
We depend on the continued efforts of our executive officers and senior management. We cannot be certain that any individual will continue in such capacity for any particular period of time. The loss of key personnel, or the inability to hire and retain qualified employees, could negatively impact our ability to manage our business.
Our business requires skilled labor, and we may be unable to attract and retain qualified employees.
Our ability to maintain our productivity and profitability will be limited by our ability to employ, train and retain skilled personnel necessary to meet our requirements. We may experience shortages of qualified personnel. We cannot be certain that we will be able to maintain an adequately skilled labor force necessary to operate efficiently and to support our growth strategy or that our labor expense will not increase as a result of shortage in the supply of skilled personnel. Labor shortages or increased labor costs could impair our ability to maintain our business or grow our revenues.
Item 1B. Unresolved Staff Comments
There were no unresolved staff comments as of February 29, 2008.
Item 2. Properties
The following table sets forth information about the Company's principal facilities, owned or leased, on February 29, 2008:
| Location | Land/Acres | Buildings/Sq. Footage | Segment/Occupant |
| | | | |
| Crowley, Texas | 29.7 | 201,000 | Electrical and Industrial Products |
| Houston, Texas | 5.4 | 61,600 | Electrical and Industrial Products |
| Richland, Mississippi | 6.7 | 58,700 | Electrical and Industrial Products |
| Pittsburg, Kansas | 15.3 | 87,800 | Electrical and Industrial Products |
| Medway, Massachusetts | - | (Leased) 80,863 | Electrical and Industrial Products |
| Fulton, Missouri | - | (Leased) 82,000 | Electrical and Industrial Products |
| Tulsa, Oklahoma | - | (Leased) 66,000 | Electrical and Industrial Products |
| Greenville, South Carolina | - | (Leased) 51,000 | Electrical and Industrial Products |
| Crowley, Texas | 28.5 | 79,200 | Galvanizing Services |
| Houston, Texas | 25.2 | 61,800 | Galvanizing Services |
| Waskom, Texas | 10.6 | 30,400 | Galvanizing Services |
| Beaumont, Texas | 12.9 | 33,700 | Galvanizing Services |
| Moss Point, Mississippi | 13.5 | 16,000 | Galvanizing Services |
| Richland, Mississippi | 5.6 | 22,800 | Galvanizing Services |
| Citronelle, Alabama | 10.8 | 34,000 | Galvanizing Services |
| Goodyear, Arizona | 16.8 | 36,800 | Galvanizing Services |
| Prairie Grove, Arkansas | 11.5 | 34,000 | Galvanizing Services |
| Belle Chasse, Louisiana | 9.5 | 34,000 | Galvanizing Services |
| Port Allen, Louisiana | 22.2 | 48,700 | Galvanizing Services |
| Cincinnati, Ohio | 15 | 81,700 | Galvanizing Services |
| Muncie, Indiana | 6.6 | 50,200 | Galvanizing Services |
| Plymouth, Indiana | 40 | 42,900 | Galvanizing Services |
| Fort Worth, Texas | - | (Leased) 18,600 | Corporate Offices |
Item 3. Legal Proceedings
Environmental Proceedings
We are subject to various environmental protection reviews by state and federal government agencies. We cannot presently determine the ultimate liability, if any, that might result from these reviews or additional clean-up and remediation expenses. However, as a result of an internal analysis and prior clean-up efforts, we believe that the reviews and any required remediation will not have a material impact on the Company. In order to maintain permits to operate certain of our facilities, we may need to make future capital expenditures for equipment in order to meet new or existing environmental regulations.
Other Proceedings
We are involved from time to time in various suits and claims arising in the normal course of business. In management’s opinion, the ultimate resolution of these matters will not have a material effect on our financial position or results of operations.
Item 4. Submission of Matters to a Vote of Security Holders
No matter was submitted to a vote of security holders through the solicitation of proxies or otherwise during the fourth quarter of the fiscal year ended February 29, 2008.
PART II
| Item 5. | Market for Registrant's Common Equity, Related Stockholder Matters and Issuer Purchases of Equity Securities. |
Our common stock, $1.00 par value, (“Common Stock”) is traded on the New York Stock Exchange and under the symbol “AZZ”. The following table sets forth the high and low sales prices of our Common Stock on the New York Stock Exchange on a quarterly basis for each of the two fiscal years ended February 29, 2008 and February 28, 2007, all of which have been adjusted to reflect our two-for-one stock split, effected in the form of a stock dividend on May 4, 2007.
| | | Quarter Ended May 31, | | | Quarter Ended August 31, | | | Quarter Ended November 30, | | | Quarter Ended February 29/28, | |
| Per Share | | 2007 | | | 2006 | | | 2007 | | | 2006 | | | 2007 | | | 2006 | | | 2008 | | | 2007 | |
| High | | $ | 34.62 | | | $ | 13.00 | | | $ | 41.45 | | | $ | 16.34 | | | $ | 37.41 | | | $ | 21.39 | | | $ | 37.50 | | | $ | 27.77 | |
| Low | | $ | 18.325 | | | $ | 10.54 | | | $ | 27.14 | | | $ | 10.67 | | | $ | 24.41 | | | $ | 14.56 | | | $ | 25.85 | | | $ | 19.60 | |
Dividends Declared | | | - | | | | - | | | | - | | | | - | | | | - | | | | - | | | | - | | | | - | |
The payment of dividends is within the discretion of our Board and will depend on our earnings, capital requirements, operating and financial condition and other factors. We expect for the foreseeable future to invest substantially all of our earnings in the expansion of our business and reduction of debt.
The approximate number of holders of record of our common stock at May 12, 2008 was 483. See Item 12 of this Report for information regarding securities authorized for issuance under equity compensation plans.
STOCK PRICE PERFORMANCE GRAPH
The following graph illustrates the five-year cumulative total return on investments in our Common Stock, the CRSP Index for NYSE Stock Market (U.S. Companies) and the CRSP Index for NYSE Stocks (SIC 5000-5099 US Companies). These indices are prepared by the Center for Research in Security Prices of The University of Chicago Graduate School of Business. AZZ is listed on The New York Stock Exchange and is engaged in two industry segments. The shareholder return shown below is not necessarily indicative of future performance. Total return, as shown, assumes $100 invested on February 28, 2003, in shares of AZZ common stock and each index, all with cash dividends reinvested. The calculations exclude trading commissions and taxes.
Comparison of Five Year-Cumulative Total Returns
Value of $100 Invested on February 28, 2003
For Fiscal Year Ended on the Last Day of February
| Symbol | CRSP Total Returns Index for: | 2/03 | 2/04 | 2/05 | 2/06 | 2/07 | 2/08 |
| u | AZZ incorporated | 100.0 | 140.0 | 141.7 | 199.4 | 354.3 | 619.8 |
| ■ | CRSP Index for NYSE Stock Market (US Companies) | 100.0 | 140.5 | 153.3 | 169.0 | 192.9 | 186.1 |
| CRSP Index for NYSE Stocks (SIC 5000-5099 US Companies) | 100.0 | 145.3 | 165.5 | 199.9 | 203.5 | 162.3 |
| | Wholesale trade - durable goods | | | | | | |
| | | Fiscal Year | |
| | | 2008 | | | 2007 (a) | | | 2006 | | | 2005 | | | 2004 | |
| | | (In thousands, except per share amounts) | |
| Summary of operations: | | | | | | | | | | | | | | | |
| Net sales | | $ | 320,193 | | | $ | 260,344 | | | $ | 187,184 | | | $ | 152,428 | | | $ | 136,201 | |
| Net income | | | 27,688 | | | | 21,604 | | | | 7,827 | | | | 4,812 | | | | 4,263 | |
| | | | | | | | | | | | | | | | | | | | | |
| Earnings per share: | | | | | | | | | | | | | | | | | | | | |
Basic earnings per common share(b) | | $ | 2.30 | | | $ | 1.86 | | | $ | .70 | | | $ | .44 | | | $ | .40 | |
Diluted earnings per common share(b) | | | 2.26 | | | | 1.82 | | | | .69 | | | | .44 | | | | .39 | |
| | | | | | | | | | | | | | | | | | | | | |
| Total assets | | $ | 193,319 | | | $ | 200,908 | | | $ | 141,026 | | | $ | 128,635 | | | $ | 120,026 | |
| Long-term debt | | | - | | | | 35,200 | | | | 14,375 | | | | 23,875 | | | | 25,375 | |
| Total liabilities | | | 47,163 | | | | 89,759 | | | | 53,758 | | | | 53,316 | | | | 50,729 | |
| Shareholders' equity | | | 146,157 | | | | 111,148 | | | | 87,269 | | | | 75,319 | | | | 69,298 | |
| Working capital | | | 60,299 | | | | 62,252 | | | | 27,917 | | | | 24,839 | | | | 20,209 | |
| | | | | | | | | | | | | | | | | | | | | |
| Cash provided by operating activities | | $ | 38,926 | | | $ | 6,928 | | | $ | 12,794 | | | $ | 6,471 | | | $ | 14,963 | |
| Capital expenditures | | | 9,926 | | | | 10,659 | | | | 6,602 | | | | 6,649 | | | | 3,645 | |
| Depreciation & amortization | | | 8,199 | | | | 6,660 | | | | 5,720 | | | | 5,653 | | | | 5,731 | |
| Cash dividend per common share | | | | | | | - | | | | - | | | | - | | | | - | |
| | | | | | | | | | | | | | | | | | | | | |
Weighted average shares outstanding (b) | | | 12,013 | | | | 11,599 | | | | 11,168 | | | | 10,888 | | | | 10,694 | |
| | | | | | | | | | | | | | | | | | | | | |
| (a) | Includes the acquisition of Witt Galvanizing, Inc. on November 1, 2006. |
| (b) | Adjusted to reflect a two-for-one stock split, effective in the form of a stock dividend on May 4, 2007. |
| Item 7. | Management's Discussion and Analysis of Financial Condition and Results of Operation. |
Overview
We operate two distinct business segments, the Electrical and Industrial Products Segment and the Galvanizing Services Segment. The Electrical and Industrial Products Segment serves the power generation, transmission and distribution markets as well as the general industrial market. As of February 29, 2008, the Galvanizing Services Segment consists of fourteen hot dip-galvanizing facilities located throughout the South, Midwest and Southwest United States that provide galvanizing services to the steel fabrication industry. All per share data in this section have been adjusted to reflect our two-for-one stock split effected May 4, 2007.
For the fiscal year-ended February 29, 2008, we recorded revenues of $320.2 million compared to the prior year’s revenues of $260.3 million. Approximately 56% of our revenues were generated from the Electrical and Industrial Products Segment and approximately 44% were generated from the Galvanizing Services Segment. Net income for fiscal 2008 was $27.7 million compared to $21.6 million for fiscal 2007. Net income as a percentage of sales was 8.6% for fiscal 2008 as compared to 8.3% for fiscal 2007. Earnings per share increased by 24% to $2.26 per share for fiscal 2008 compared to $1.82 per share for fiscal 2007, on a diluted basis.
Results of Operations
Year ended February 29, 2008 (Fiscal 2008) compared with year ended February 28, 2007 (Fiscal 2007)
Management believes that analyzing our revenue and operating income by segment is the most meaningful way to analyze our results of operations. Segment operating income consists of net sales less cost of sales, specifically identifiable selling, general and administrative expenses, and other (income) expense items that are specifically identifiable to a segment. The other (income) expense items included in segment operating income are generally insignificant. For a reconciliation of segment operating income to pretax income, see Note 11 to Notes to Consolidated Financial Statements.
Backlog
Our operations ended fiscal 2008 with a backlog of $134.9 million, an increase of 12% as compared to fiscal 2007 backlog of $120.7 million. All ending backlog relates to our Electrical and Industrial Products Segment. Our book-to-bill ratio was 1.04 to 1 for fiscal 2008 as compared to 1.18 to 1 in the prior year. In fiscal 2008, we continued our efforts to improve our market coverage and expand our served markets. New orders were balanced across our power generation, transmission and distribution, and industrial markets. Incoming orders increased 8% for fiscal 2008 as compared to the same period last year. The fourth quarter backlog while remaining strong was down when compared to the second quarter and third quarter of fiscal 2008.
Quotations activity and project opportunities continue at a strong pace, however, the timing of release of these orders, particularly large international orders has been slower than desired and has had an adverse impact on our backlog. Similar to the quarterly variances we have seen over the past two years, we again believe the timing of release of these orders is a timing issue rather than a market correction.
The following table reflects bookings and shipments for fiscal 2008 and 2007.
Backlog Table
(In thousands)
| | Period Ending | | | | Period Ending | | | |
| Backlog | 2/28/07 | | $ | 120,666 | | 2/28/06 | | $ | 73,765 | |
| Bookings | | | | 334,403 | | | | | 307,245 | |
| Shipments | | | | 320,193 | | | | | 260,344 | |
| Backlog | 2/29/08 | | $ | 134,876 | | 2/28/07 | | $ | 120,666 | |
| Book to Bill Ratio | | | | 1.04 | | | | | 1.18 | |
Revenues
Our consolidated revenues for fiscal 2008 increased by $59.8 million or 23%, as compared to fiscal 2007.
The following table reflects the breakdown of revenue by segment:
| | | 2008 | | | 2007 | |
| | | (In thousands) | |
| Revenue: | | | | | | |
| Electrical and Industrial Products | | $ | 179,181 | | | $ | 150,250 | |
| Galvanizing Services | | | 141,012 | | | | 110,094 | |
| Total Revenue | | $ | 320,193 | | | $ | 260,344 | |
The Electrical and Industrial Products Segment produces highly engineered specialty products supplied to the power generation, power transmission, power distribution and general industrial markets as well as lighting and tubular products to the industrial and petroleum markets. The segment recorded revenues for fiscal 2008 of $179.2 million, an increase of 19% above fiscal 2007 results of $150.3 million. The increased revenue were generated as a result of a continuation of improved market demand and improved pricing, primarily from our high voltage transmission, power generation and utility distribution market as compared to fiscal 2007. Our challenge is to continue to succeed in our efforts to expand our served markets and product offerings, while maintaining our strong operating performance and management of volatile raw material pricing.
Our Galvanizing Services Segment, which is made up of fourteen hot dip galvanizing facilities as of February 29, 2008, generated revenues of $141 million, a 28% increase from the prior year’s revenues of $110 million. The increased revenue resulted from a 10% improvement in pricing and 18% increase in the pounds of steel produced in fiscal 2008 as compared to fiscal 2007. Our acquisition of Witt Galvanizing, Inc. on November 1, 2006, accounted for 68% of the increase in the pounds of steel produced. The remaining 32% increase in volume resulted from increased project work, which was spread across all of our served markets. Historically, revenues for this segment have followed closely the condition of the industrial sector of the general economy.
Segment Operating Income
The following table reflects the breakdown of total operating income by segment:
| | | 2008 | | | 2007 | |
| | | (In thousands) | |
| Segment Operating Income: | | | | | | |
| Electrical and Industrial Products | | $ | 29,158 | | | $ | 21,301 | |
| Galvanizing Services | | | 35,087 | | | | 31,945 | |
| Total Segment Operating Income | | $ | 64,245 | | | $ | 53,246 | |
Total segment operating income (see Note 11 to Notes to Consolidated Financial Statements) increased $11 million to $64.2 million in fiscal 2008 as compared to $53.2 million in fiscal 2007. Consolidated operating margins as a percentage of sales were 20% for each of fiscal 2008 and fiscal 2007. The Electrical and Industrial Products Segment generated 45% of the operating income for fiscal 2008, while the Galvanizing Services Segment produced the remaining 55%.
Our continuous improvement programs, combined with aggressive marketing programs, have had a positive impact on our operating results for fiscal 2008. We believe that these efforts, and the leverage gained from additional volumes have positively impacted our results.
Operating income for the Electrical and Industrial Products Segment increased $7.9 million or 37% for fiscal 2008, to $29.2 million as compared to $21.3 million for fiscal 2007. Operating margins for this segment were 16% for fiscal 2008 as compared to 14% for fiscal 2007. Operating margins and profit improvement are attributable to the leverage gained from increased volumes and pricing actions as a result of favorable market conditions.
Operating income for the Galvanizing Service Segment increased $3.1 million for fiscal 2008, to $35.1 million as compared to $31.9 million for the prior year. The improved operating results reflect improved market conditions, which generated higher revenues. Operating margins were 25% for fiscal 2008 as compared to 29% for fiscal 2007. Operating margins were lower during fiscal 2008 due to higher FIFO inventory costs of zinc as compared to fiscal 2007. Due to our First In First Out ("FIFO") cost basis on our zinc inventory, the higher cost for zinc purchased in fiscal 2007 was recognized in fiscal 2008. While margins were lower for fiscal 2008 as compared to fiscal 2007, favorable market conditions allowed us to maintain margins at levels above our historical margins of 18% to 22%. Increased volatility in future zinc prices could have an effect on future revenues and earnings. Margins could be negatively impacted by a reduction in pricing if market demand decreases for galvanizing services.
General Corporate Expense
General corporate expenses were $18.9 million for fiscal 2008 and $17.2 million for fiscal 2007. As a percentage of sales, general corporate expenses were 5.9% for fiscal 2008 as compared to 6.6% in fiscal 2007. The increased general corporate expense for fiscal 2008 resulted from increased compensation expense and employee profit sharing expense. Compensation expense increased approximately $1.3 million, as compared to the same period in fiscal 2007, related primarily to our stock appreciation rights program. Profit sharing expense increased $.4 million in fiscal 2008 as compared to same period in the prior year.
Interest
Interest expense for fiscal 2008 was $1.5 million, which is relatively unchanged as compared to February 28, 2007. Total obligations under the Credit Agreement were paid in full as of February 29, 2008, a decrease of $35.2 million as compared to fiscal 2007.
Other (Income) Expense
For fiscal 2008 and 2007, the amounts in other (income) expense (see Note 11 of Notes to Consolidated Financial Statements) were insignificant.
Provision For Income Taxes
The provision for income taxes reflects an effective tax rate of 37% for fiscal 2008 and fiscal 2007. Increased benefits in our effective tax rate from the American Jobs Creation Act of 2005 were offset by compensation expense that will not be deductible due to the limitations on deductibility established under Section 162(m) of the Internal Revenue Code.
Year ended February 28, 2007 (Fiscal 2007) compared with year ended February 28, 2006 (Fiscal 2006)
Management believes that analyzing our revenue and operating income by segment is the most meaningful way to analyze our results of operations. Segment operating income consists of net sales less cost of sales, specifically identifiable selling, general and administrative expenses, and other (income) expense items that are specifically identifiable to a segment. The other (income) expense items included in segment operating income are generally insignificant. For a reconciliation of segment operating income to pretax income, see Note 11 to Notes to Consolidated Financial Statements.
Backlog
Our operations ended fiscal 2007 with a backlog of $120.7 million, an increase of 64% as compared to fiscal 2006 backlog of $73.8 million. All of our backlog data relate to our Electrical and Industrial Products Segment. Our book-to-bill ratio was 1.18 to 1 for fiscal 2007 as compared to 1.05 to 1 in the prior year. In fiscal 2007, we continued our efforts to improve our market coverage and expand our served markets. The increased backlog reflects improvements in all of our served markets domestically and internationally, particularly in our high voltage transmission products.
The following table reflects bookings and shipments for fiscal 2007 and 2006.
Backlog Table
(In thousands)
| | Period Ending | | | | Period Ending | | | |
| Backlog | 2/28/06 | | $ | 73,765 | | 2/28/05 | | $ | 64,769 | |
| Bookings | | | | 307,245 | | | | | 196,180 | |
| Shipments | | | | 260,344 | | | | | 187,184 | |
| Backlog | 2/28/07 | | $ | 120,666 | | 2/28/06 | | $ | 73,765 | |
| Book to Bill Ratio | | | | 1.18 | | | | | 1.05 | |
Revenues
The following table reflects the breakdown of revenue by segment:
| | | 2007 | | | 2006 | |
| | | (In thousands) | |
| Revenue: | | | | | | |
| Electrical and Industrial Products | | $ | 150,250 | | | $ | 123,736 | |
| Galvanizing Services | | | 110,094 | | | | 63,448 | |
| Total Revenue | | $ | 260,344 | | | $ | 187,184 | |
Our consolidated net revenues for fiscal 2007 increased by $73.2 million or 39%, as compared to fiscal 2006.
The Electrical and Industrial Products Segment recorded revenues for fiscal 2007 of $150.3 million, an increase of 21% above fiscal 2006 results of $123.7 million. The increased revenue was generated from continued strong market demand, primarily our high voltage transmission and petroleum markets, and improved market conditions from the power generation market, which had been stagnant for several years. In addition to the improved market conditions, several quick turn projects were completed during the third and fourth quarters of fiscal 2007, which generated increased revenues. The passage of the energy legislation had a positive impact on this segment.
Our Galvanizing Services Segment generated revenues of $110 million, a 74% increase from the prior year’s revenues of $63.4 million. The increased revenue resulted from a 54% improvement in pricing and a 20% increase in the pounds of steel produced in fiscal 2007 as compared to fiscal 2006. Our acquisition of Witt Galvanizing, Inc. on November 1, 2006, accounted for 33% of the increase in the pounds of steel produced. The remaining 67% increase in volume resulted from improvements in all of our markets. The increase in selling price was the result of price increases implemented to offset the rising commodity cost of zinc. Historically, revenues for this segment have followed closely the condition of the industrial sector of the general economy.
Segment Operating Income
The following table reflects the breakdown of total operating income by segment:
| | | 2007 | | | 2006 | |
| | | (In thousands) | |
| Segment Operating Income: | | | | | | |
| Electrical and Industrial Products | | $ | 21,301 | | | $ | 11,357 | |
| Galvanizing Services | | | 31,945 | | | | 12,676 | |
| Total Segment Operating Income | | $ | 53,246 | | | $ | 24,033 | |
Total segment operating income (see Note 11 to Notes to Consolidated Financial Statements) increased 122% to $53.2 million in fiscal 2007 as compared to $24 million in fiscal 2006. Consolidated operating margins as a percentage of sales improved to 20% for fiscal 2007 as compared to 13% for fiscal 2006. The improvement resulted primarily from leverage obtained from increased revenues and improved pricing levels. The Electrical and Industrial Products Segment generated 40% of the operating income for fiscal 2007, while the Galvanizing Services Segment produced the remaining 60%.
Operating income for the Electrical and Industrial Products Segment increased $9.9 million or 87% for fiscal 2007, to $21.3 million as compared to $11.4 million for fiscal 2006. Operating margins for this segment were 14% for fiscal 2007 as compared to 9% for fiscal 2006. Operating margins and profit resulted from leverage obtained through increased revenues and improved market conditions, which allowed for more aggressive pricing to recover material cost increases for copper, aluminum and steel that occurred over the past two years. We were also able to capitalize on quick turn jobs that carried increased margins during fiscal 2007.
Operating income for the Galvanizing Service Segment increased $19.2 million for fiscal 2007, to $31.9 million as compared to $12.7 million for the prior year. The improved operating results reflect improved market conditions, which generated higher revenues, and improved price realization required to offset the rising cost of zinc. Operating margins improved to 29% for fiscal 2007 as compared to 20% for fiscal 2006. Operating profit and margins benefited from insurance gains in the amount of $700,000 related to Hurricanes Katrina and Rita. The carrying value of these affected assets was written off during fiscal 2006 when the damage was incurred.
General Corporate Expense
General corporate expenses were $17.1 million for fiscal 2007 and $10.2 million for fiscal 2006. As a percentage of sales, general corporate expenses were 6.6% for fiscal 2007 as compared to 5.5% in fiscal 2006. The increased general corporate expense for fiscal 2007 resulted from increased compensation expense and employee profit sharing expense. The increased compensation expense of approximately $3.5 million as compared to the same period in fiscal 2006, related primarily to our stock appreciation rights program and the adoption of FASB Statement No. 123R. Our profit sharing program, which covers substantially all our employees, was reinstated for fiscal 2007 to enhance our ability to hire and retain qualified personnel. As a result of reinstating this program, costs increased $2.4 million for fiscal 2007 as compared to fiscal 2006.
Interest
Interest expense for fiscal 2007 was $1.5 million, a decrease of 11% as compared to $1.7 million in fiscal 2006. The decrease in interest expense resulted from significantly reduced levels of debt for the majority of fiscal 2007. Additional debt of approximately $13.4 million was added in November 1, 2006, to fund the acquisition of Witt Galvanizing, Inc. Our total outstanding bank debt was $35.2 million at the end of fiscal 2007, an increase of $15.3 million as compared to $19.9 million at the end of fiscal 2006. In addition to the acquisition of Witt Galvanizing Inc., additional borrowing was required to fund our working capital requirements due to increased business levels. As a result, our long-term debt to equity ratio was .32 to 1 for fiscal 2007 as compared to .16 to 1 for fiscal 2006.
Other (Income) Expense
For fiscal 2007 and 2006, the amounts in other (income) expense (see Note 11 of Notes to Consolidated Financial Statements) were insignificant.
Provision For Income Taxes
The provision for income taxes reflects an effective tax rate of 37% for fiscal 2007 and 35% for fiscal 2006. Benefits in our effective tax rate from the American Jobs Creation Act of 2005 were offset by the higher statutory tax rate of 35% for the current period as compared to 34% in the prior year due to increased income levels, higher state income taxes due to differences in the mix of profits generated from our operating facilities located in varying tax jurisdictions, and an allowance in fiscal 2007 for deferred compensation that we currently believe will not be deductible in future years due to the limitations on deductibility established under Section 162(m) of the Internal Revenue Code.
Liquidity and Capital Resources
We have historically met our cash needs through a combination of cash flows from operating activities and bank borrowings. Our cash requirements are generally for operating activities, capital improvements, debt repayment and acquisitions. We believe that working capital, borrowing capabilities, and funds generated from operations should be sufficient to finance anticipated operational activities, capital improvements, and payment of debt and possible future acquisitions.
Our operating activities generated cash flows of approximately $38.9 million, $6.9 million, and $12.8 million during fiscal 2008, 2007, and 2006, respectively. Cash flow from operations in fiscal 2008 included net income in the amount of $27.7 million, depreciation and amortization in the amount of $8.2 million, and other adjustments to reconcile net income to net cash in the amount of a $.5 million. Included in other adjustments to reconcile net income to net cash was provision for bad debt, deferred income taxes, gain or loss on the sale of assets and non-cash adjustments. Positive cash flow was recognized due to decreased accounts receivables, inventories, prepaid expenses and increased accrued liabilities in the amount of $11.3 million, $2.1 million, $1 million and $.5 million, respectively. Accounts receivable days outstanding improved with average days outstanding of 49 days for fiscal 2008, as compared to 51 days at fiscal 2007. These positive cash flow items were offset by decreased accounts payable balances and increased revenue in excess of billings in the amount of $9.3 million and $3 million, respectively. The accounts payable reduction decrease is due to less advantageous payment terms from some of our critical material vendors.
Our working capital was $60.3 million at February 29, 2008, as compared to $62.3 million at February 28, 2007.
During fiscal 2008, capital improvements were made in the amount of $9.9 million. The breakdown of capital spending by segment for fiscal 2008, 2007, and 2006 can be found in Note 11 of the Notes to Consolidated Financial Statements.
For fiscal 2008, long-term debt decreased by $35.2 million resulting in no outstanding debt as of February 29, 2008.
We received proceeds from the sale of property and equipment in the amount of $.2 million and proceeds from the exercise of stock options and related tax benefits in the amount of $6.5 million. There were no cash dividends declared or paid in fiscal 2008, and no resumption of a cash dividend is currently anticipated.
On May 25, 2006, we entered into the Second Amended and Restated Credit Agreement (the “Credit Agreement”), which replaced our Amended and Restated Revolving and Term Credit Agreement dated as of November 1, 2001.
The Credit Agreement provides for a $60 million revolving line of credit with one lender, Bank of America, N.A., maturing on May 25, 2011. This is an unsecured revolving credit facility, which refinanced outstanding borrowings and is used to provide for working capital needs, capital improvements, future acquisitions, and letter of credit needs. At February 29, 2008, we had no outstanding debt borrowed against the revolving credit facility. However, we had letters of credit outstanding in the amount of $10.5 million, which left approximately $49.5 million of additional credit available under the revolving credit facility.
The Credit Agreement provides for various financial covenants consisting of a) Minimum Consolidated Net Worth – maintain on a consolidated basis net worth equal to at least the sum of $69.8 million, representing 80% of net worth at February 28, 2006 plus 75% of future net income, b) Maximum Leverage Ratio- maintain on a consolidated basis a Leverage Ratio (as defined in the Credit Agreement) not to exceed 3.0:1.0, c) Fixed Charge Coverage Ratio- maintain on a consolidated basis a Fixed Charge Coverage Ratio of at least 1.5:1.0 and d) Capital Expenditures- not to make Capital Expenditures on a consolidated basis in an amount in excess of $14 million during any fiscal year.
The Credit Agreement provides for an applicable margin ranging from .75% to 1.25% over the Eurodollar Rate and Commitment Fees ranging from .175% to .25% depending on our Leverage Ratio.
On March 31, 2008, the Company entered into a Note Purchase Agreement pursuant to which the Company issued $100,000,000 aggregate principal amount of its 6.24% unsecured Senior Notes (the "Notes") due March 31, 2018 through a private placement (the "Note Offering"). Pursuant to the Note Purchase Agreement, the Company’s payment obligations with respect to the Notes may be accelerated upon any Event of Default, as defined in the Note Purchase Agreement.
In connection with the Note Offering, the Company entered into the Second Amendment to Second Amended and Restated Credit Agreement, (the “Second Amendment”) with Bank of America, N. A. (“Bank of America”), which amended the Second Amended and Restated Credit Agreement by and among the Company, Bank of America and certain other lenders (including Bank of America) dated as of May 25, 2006 (the “Credit Agreement”). The Second Amendment contains the consent of Bank of America to the Note Offering and amended the Credit Agreement to provide that the Note Offering will not constitute a default under the Credit Agreement.
The Senior Notes provide for various financial covenants of a) Minimum Consolidated Net Worth - Maintain on a consolidated basis net worth equal to at least the sum of $116.9 million plus 50% of future net income; b) Maximum Ratio of Consolidated Indebtedness to Consolidated EBITDA – Maintain a ratio of indebtedness to EBITDA (as defined in Note Purchase Agreement) not to exceed 3.25:1.00; c) Fixed Charge Coverage Ratio – Maintains on a consolidated basis a Fixed Charge Coverage Ratio of at least 2.0:1.0; d) Priority Indebtedness – The Company will not at any time permit aggregate amount of all Priority Indebtedness to exceed 10% of Consolidated Net Worth. In conjunction with Note Offering, the Credit Agreement with Bank of America was amended to reflect the same debt covenants as presented above.
Our current ratio (current assets/current liabilities) was 2.41 to 1 at the end of fiscal 2008, as compared to 2.25 to 1 at the end of fiscal 2007. Shareholder equity grew 31% during fiscal 2008 to $146.2 million. Long-term debt as a percentage of shareholders’ equity ratio was 0 to 1 at the end of fiscal 2008 as compared to .32 to 1 at the end of fiscal 2007.
We have not experienced significant impacts on our operations from increases in general inflation other than for specific commodities and employee health care costs. We have exposure to commodity price increases in both segments of our business, primarily copper, aluminum and steel in the Electrical and Industrial Products Segment, and zinc and natural gas in the Galvanizing Services Segment. We attempt to minimize these increases through escalation clauses in customer contracts for copper, aluminum and steel, when market conditions allow and protective caps purchased on zinc. In addition to these measures, we attempt to recover other cost increases through improvements to our manufacturing process and through increases in prices where competitively feasible.
Off Balance Sheet Transactions and Related Matters
There are no off-balance sheet transactions, arrangements, obligations (including contingent obligations), or other relationships of the Company with unconsolidated entities or other persons that have, or may have, a material effect on our financial condition, changes in financial condition, revenues or expenses, results of operations, liquidity, capital expenditures or capital resources.
Contractual Commitments
Leases
The Company leases various facilities under non-cancelable operating leases with an initial term in excess of one year. As of February 29, 2008, the future minimum payments required under these operating leases are summarized below. Rental expense for real estate and personal property was approximately $3,132,000, $2,517,000, and $2,211,000 for fiscal years ended 2008, 2007 and 2006, respectively, and includes all short-term as well as long-term rental agreements.
The following summarizes the Company’s operating leases for the next five years and thereafter.
| | | Operating Leases | |
| | | | |
| 2009 | | $ | 2,203 | |
| 2010 | | | 2,579 | |
| 2011 | | | 2,541 | |
| 2012 | | | 2,296 | |
| 2013 | | | 2,070 | |
| Thereafter | | | 13,526 | |
| Total | | $ | 25,215 | |
Commodity pricing
The Company manages its exposures to commodity prices through the use of the following:
In the Electrical and Industrial Products Segment, the Company has exposure to commodity pricing for copper, aluminum, and steel. Because the Electrical and Industrial Products Segment does not commit contractually to minimum volumes, increases in price for these items are normally managed through escalation clauses to the customer’s contracts, although during difficult market conditions these escalation clauses may be difficult to obtain.
In the Galvanizing Services Segment, the Company utilizes contracts with its zinc suppliers that include protective caps to guard against escalating commodity prices. The Company also secures firm pricing for natural gas supplies with individual utilities when possible. There are no contracted volume purchase commitments associated with our zinc or natural gas agreements. Management believes these contractual agreements ensure adequate supplies and partially offset exposure to commodity price swings.
There are no contracted purchase commitments for any other commodity items including steel, aluminum, natural gas, copper, zinc or any other commodity.
Other
At February 29, 2008, the Company had outstanding letters of credit in the amount of $10.5 million. These letters of credit are issued to a portion of the Company’s customers to cover any potential warranty costs that the customer might incur and are in lieu of performance and bid bonds. In addition, as of February 29, 2008, a warranty reserve in the amount of $1.7 million has been established to offset any future warranty claims.
The Company has been named as a defendant in certain lawsuits in the normal course in business. It is the policy of management to disclose the amount or range of reasonably possible losses in excess of recorded amounts. In the opinion of management, after consulting with legal counsel, the liabilities, if any, resulting from these matters should not have a material effect on our financial position or results of operations.
Critical Accounting Policies and Estimates
The preparation of the consolidated financial statements requires us to make estimates that affect the reported value of assets, liabilities, revenues and expenses. Our estimates are based on historical experience and various other factors that we believe are reasonable under the circumstances, and form the basis for our conclusions. We continually evaluate the information used to make these estimates as business and economic conditions change. Accounting policies and estimates considered most critical are allowances for doubtful accounts, accruals for contingent liabilities, revenue recognition, impairment of long-lived assets, identifiable intangible assets and goodwill, accounting for income taxes, and stock options and stock appreciation rights. Actual results may differ from these estimates under different assumptions or conditions. The development and selection of the critical accounting policies and the related disclosures below have been reviewed with the Audit Committee of the Board of Directors. More information regarding significant accounting policies can be found in Note 1 of the Notes to Consolidated Financial Statements.
Allowance for Doubtful Accounts- The carrying value of our accounts receivable is continually evaluated based on the likelihood of collection. An allowance is maintained for estimated losses resulting from our customer’s inability to make required payments. The allowance is determined by historical experience of uncollected accounts, the level of past due accounts, overall level of outstanding accounts receivable, information about specific customers with respect of their inability to make payments and future expectations of conditions that might impact the collectibility of accounts receivable. If the financial condition of our customers were to deteriorate, resulting in an impairment of their ability to make payments, additional allowances may be required.
Accruals for Contingent Liabilities - The amounts we record for estimated claims, such as self insurance programs, warranty, environmental, and other contingent liabilities, requires us to make judgments regarding the amount of expenses that will ultimately be incurred. We use past history and experience, as well as other specific circumstances surrounding these claims in evaluating the amount of liability that should be recorded. Actual results may be different than what we estimate.
Revenue Recognition –Revenue is recognized for the Electrical and Industrial Products Segment upon transfer of title and risk to customers, or based upon the percentage of completion method of accounting for electrical products built to customer specifications under long term contracts. We recognize revenue for the Galvanizing Services Segment upon completion of the galvanizing process performed on the customers’ material or shipment of this material. Revenue for the Galvanizing Service Segment is typically recognized at completion of the service unless we specifically agree with the customer to hold its material for a predetermined period of time after the completion of the galvanizing process and, in that circumstance, we invoice and recognize revenue upon shipment. Customer advanced payments presented in the balance sheet arise from advanced payments received from our customers prior to shipment of the product and are not related to revenue recognized under the percentage of completion method. The extent of progress for revenue recognized using the percentage of completion method is measured by the ratio of contract costs incurred to date to total estimated contract costs at completion. Contract costs include direct labor and material, and certain indirect costs. Selling, general and administrative costs are charged to expense as incurred. Provisions for estimated losses, if any, on uncompleted contracts are made in the period in which such losses are able to be determined. The assumptions made in determining the estimated cost could differ from actual performance resulting in a different outcome for profits or losses than anticipated.
Impairment of Long-Lived Assets, Identifiable Intangible Assets and Goodwill– We record impairment losses on long-lived assets, including identifiable intangible assets, when events and circumstances indicate that the assets might be impaired and the undiscounted projected cash flows associated with those assets are less than the carrying amounts of those assets. In those situations, impairment losses on long-lived assets are measured based on the excess of the carrying amount over the asset’s fair value, generally determined based upon discounted estimates of future cash flows. A significant change in events, circumstances or projected cash flows could result in an impairment of long-lived assets, including identifiable intangible assets. An annual impairment test of goodwill is performed in the fourth quarter of each fiscal year. The test is calculated using the anticipated future cash flows after tax from our operating segments. Based on the present value of the future cash flows, we will determine whether impairment may exist. A significant change in projected cash flows or cost of capital for future years could result in an impairment of goodwill in future years. Variables impacting future cash flows include, but are not limited to, the level of customer demand for and
response to products and services we offer to the power generation market, the electrical transmission and distribution markets, the general industrial market and the hot dip galvanizing market; changes in economic conditions of these various markets; raw material and natural gas costs; and availability of experienced labor and management to implement our growth strategies.
Accounting for Income Taxes - We account for income taxes under the provisions of SFAS No. 109, "Accounting For Income Taxes" ("SFAS No. 109"). The objectives of accounting for income taxes are to recognize the amount of taxes payable or refundable for the current year and deferred tax liabilities and assets for the future tax consequences of events that have been recognized in our financial statements or tax returns. SFAS No. 109 also requires that deferred tax assets be reduced by a valuation allowance if it is more likely than not that some portion or all of the deferred tax asset will not be realized. Developing our provision for income taxes requires significant judgment and expertise in deferral and state income tax laws, regulations and strategies, including the determination of deferred tax assets and liabilities and, if necessary, any valuation allowances that may be required for deferred tax assets. Our judgments and tax strategies are subject to audit by various taxing authorities.
Stock Options and Stock Appreciation Rights - Our employees and directors are periodically granted stock options or Stock Appreciation Rights by the Compensation Committee of the Board of Directors. In fiscal 2007, we adopted the provisions of SFAS No. 123R, Share-Based Payment. Under the provisions of SFAS No. 123R, the compensation cost of all employee stock-based compensation awards is measured based on the grant-date fair value of those awards and that cost is recorded as compensation expense over the period during which the employee is required to perform service in exchange for the award (generally over the vesting period of the award). The valuation of stock based compensation awards is complex in that there are a number of variables included in the calculation of the value of the award:
| | · | Volatility of our stock price |
| | · | Expected term of the option |
| | · | Risk-free interest rate over the expected term |
| | · | Expected number of options that will not vest |
We have elected to use a Black-Scholes pricing model in the valuation of our stock options and stock appreciation rights.
These variables are developed using a combination of our internal data with respect to stock price volatility and exercise behavior of option holders and information from outside sources. The development of each of these variables requires a significant amount of judgment. Changes in the values of the above variables will result in different option valuations and, therefore, different amounts of compensation cost.
Recent Accounting Pronouncements
In December 2007, the Financial Accounting Standard board ("FASB") issued SFAS No. 141, (revised 2007), "Business Combinations" ("SFAS No. 141(R)"), which continues the evolution toward fair value reporting and significantly changes the accounting for acquisitions that close beginning in 2009, both at the acquisition date and in subsequent periods. SFAS No. 141(R) introduces new accounting concepts and valuation complexities, and many of the changes have the potential to generate greater earnings volatility after an acquisition. SFAS No. 141(R) applies to acquisitions on or after March 1, 2009 and will impact the Company's reporting prospectively only.
In December 2007, FASB issued SFAS No. 160, "Noncontrolling Interests in Consolidated Statements – an amendment of ARB No. 51" ("SFAS No. 160"), which requires companies to measure an acquisition of noncontrolling (minority) interest at fair value in the equity section of the acquiring entity's balance sheet. The objective of SFAS No. 160 is to improve the comparability and transparency of financial data as well as to help prevent manipulation of earnings. The changes introduced by the new standards are likely to affect the planning and execution, as well as the accounting and disclosure, of merger transactions. The effective date to adopt SFAS No.
160 for us is March 1, 2009 and we do not expect the adoption to have a material effect on our results of operations and financial position.
In February 2007, the FASB issued SFAS No. 159, "The Fair Value Option for Financial Assets and Financial Liabilities, including an amendment of FASB Statement No. 115" ("SFAS No. 159"). This standard permits an entity to choose to measure many financial instruments and certain items at fair value. Most of the provisions in SFAS No. 159 are elective; however, the amendment to FASB SFAS No. 115, "Accounting for Certain Investments in Debt and Equity Securities:, applies to all entities with available –for-sale and trading securities. The provisions of SFAS No. 159 are effective as of the beginning of an entity's first fiscal year that begins after November 15, 2007. We do not expect the adoption of SFAS No. 159 to have a significant impact on our consolidated financial statements.
In September 2006, the FASB issued SFAS No. 157, "Fair Value Measurements" ("SFAS No. 157"), which defines fair value, establishes a framework for measuring fair value and expands disclosures about fair value measurements. The provisions of SFAS No. 157 are effective for financial statements issued for fiscal years beginning after November 15, 2007. In February of 2008, the FASB issued FASB Staff position No. 157-2 which delays the effective date of SFAS No. 157 for non-financial assets and liabilities which are not measured at fair value on a recurring basis (at least annually) until fiscal years beginning after November 15, 2008. We are currently in the process of evaluating the impact of the adoption of SFAS no. 157 on our consolidated financial statements.
Item 7A. Quantitative and Qualitative Disclosures About Market Risk.
Market risk affecting our operations results primarily from changes in interest rates and commodity prices. We have only limited involvement with derivative financial instruments and are not a party to any leveraged derivatives.
In the Electrical and Industrial Products Segment, we have exposure to commodity pricing for copper, aluminum, and steel. Increases in price for these items are normally managed through escalation clauses in our customer’s contracts, although during difficult market conditions these escalation clauses may not be readily obtainable. We manage our exposures to commodity prices, primarily zinc used in its Galvanizing Services Segment, by utilizing agreements with zinc suppliers that include protective caps to guard against escalating commodity prices. We believe these agreements ensure adequate supplies and partially offset exposure to commodity price swings.
We do not believe that a hypothetical change of 10% of the interest rate currently in effect or a change of 10% of commodity prices would have a significantly adverse effect on our results of operations, financial position, or cash flows as long as we are able to pass along the increases in commodity prices to our customers. To date, we have been successful in passing along the rising cost of zinc without an adverse effect on our results of operations. However, there can be no assurance that either interest rates or commodity prices will not change in excess of the 10% hypothetical amount, which could have an adverse effect on our results of operations, financial position, and cash flows if we are unable to pass along these increases to our customers.
Item 8. Financial Statements and Supplementary Data.
The Index to our Consolidated Financial Statements is found on page 27. Our Financial Statements and Notes to these Consolidated Financial Statements follow the index.
Item 9. Changes In and Disagreements With Accountants on Accounting and Financial Disclosure.
None
Item 9A. Controls and Procedures.
Evaluation of Disclosure Controls and Procedures
As required by Exchange Act Rules 13a-15 and 15d-15, an evaluation was conducted under the supervision and with the participation of management, including our Chief Executive Officer and Chief Financial Officer, of the effectiveness of the design and operation of our disclosure controls and procedures to ensure that information
required to be disclosed by us in our reports filed or submitted under the Exchange Act is (a) accumulated and communicated to our management, including our principal executive and financial officers, as appropriate to allow timely decisions regarding required disclosure and (b) recorded, processed, summarized and reported within the time periods specified in the SEC’s rules and forms. Based upon that evaluation, our Chief Executive Officer and Chief Financial Officer have concluded that these disclosure controls and procedures were effective as of the end of the period covered by this Annual Report on Form 10-K to ensure that information required to be disclosed by us in the reports that we file or submit under the Exchange Act is (x) accumulated and communicated to management, including our principal executive and financial officers, as appropriate to show timely decisions regarding required disclosure and (y) recorded, processed, summarized and reported within the time periods specified by the SEC’s rules and forms.
Internal Controls Over Financial Reporting
While the Company believes that its existing disclosure controls and procedures have been effective to accomplish their objectives, the Company intends to continue to examine, refine and document its disclosure controls and procedures and to monitor ongoing developments in this area.
(a) Report of Management Regarding Internal Control Over Financial Reporting
See management’s report on page 28.
(b) BDO Seidman LLP, our independent public accounting firm, has issued an audit report on our internal control over financial reporting which is included in page 29.
(c) Changes in Internal Controls Over Financial Reporting
There has not been any change in our internal control over financial reporting during the period covered by this report that has materially affected, or is reasonably likely to materially affect, our internal control over financial reporting.
Item 9B. Other Information
None
PART III
Item 10. Directors, Executive Officers and Corporate Governance.
The information required by this item with regard to executive officers is included in Part I, Item 1 of this report under the heading "Executive Officers of the Registrant."
Information regarding directors of AZZ required by this Item is incorporated by reference to the section entitled “Election of Directors” set forth in the Proxy Statement for our 2008 Annual Meeting of Shareholders.
The information regarding compliance with Section 16(a) of the Securities Exchange Act of 1934 required by this Item is incorporated by reference to the section entitled “Section 16(a) Beneficial Ownership Reporting Compliance” set forth in the Proxy Statement for our 2008 Annual Meeting of Shareholders.
Information regarding our audit committee financial experts and code of ethics and business conduct required by this item is incorporated by reference to the section entitled “Matters Relating to Corporate Governance, Board Structure, Director Compensation and Stock Ownership” set forth in the Proxy Statement for our 2008 Annual Meeting of Shareholders.
No director or nominee for director has any family relationship with any other director or nominee or with any executive officer of our company.
Item 11. Executive Compensation
The information required by this Item is incorporated herein by reference to the section entitled “Executive Compensation” and the section entitled “Matters Relating to Corporate Governance, Board Structure, Director Compensation and Stock Ownership – Fees Paid to Directors” set forth in our Proxy Statement for our 2008 Annual Meeting of Shareholders.
Item 12. Security Ownership of Certain Beneficial Owners and Management and Related Stockholder Matters
The information required by this Item is incorporated herein by reference to the section entitled “Executive Compensation” and the section entitled “Matters Relating to Corporate Governance, Board Structure, Director Compensation and Stock Ownership – Security Ownership of Management” set forth in the Proxy Statement for our 2008 Annual Meeting of Shareholders.
Equity Compensation Plans
The following table provides a summary of information as of February 29, 2008, relating to our equity compensation plans in which our common stock is authorized for issuance. All shares and price data have been adjusted to reflect our two-for-one stock split, effected in the form of a share dividend on May 4, 2007.
Equity Compensation Plan Information:
| | | (a) Number of securities to be issued upon exercise of outstanding options, warrants and rights | | | (b) Weighted average exercise price of outstanding options, warrants and rights | | | (c) Number of securities remaining available for future issuance under equity compensation plans (excluding shares reflected in column (a)) | |
Equity compensation plans approved by shareholders (1) | | | 485,292 | (3) | | $ | 12.78 | | | | 334,447 | (2) |
Total | | | 485,292 | | | $ | 12.78 | | | | 334,447 | |
| | (1) | Consists of the 2005 Long-Term Incentive Plan, 2001 Long-Term Incentive Plan, the 1998 Incentive Stock Option Plan, the 1997 Non-Statutory Stock Option Grants, and the 1991 Non Statutory Stock Option Plan. See Note 9, “Stock Options and Other Shareholder Matters” to our “Notes to Consolidated Financial Statements” for further information. |
| | (2) | Consists of shares remaining available for future issuance under the 2005 Long-Term Incentive Plan of 102,114 shares, 2001 Long-Term Incentive Plan of 211,144 shares and the 1997 Non Statutory Stock Option Grants of 18,219 shares. |
| | (3) | The average term of outstanding options and stock appreciation rights is 2.3 years. |
Description of Other Plans for the Grant of Equity Compensation
The following are plans under which shares of our Common Stock have been reserved for issuance as compensation to our Independent Directors and Advisory Directors. The shares covered by those plans are not included in the table above on equity compensation plans because they do not provide for options, warrants or rights. All shares and price data have been adjusted to reflect our two-for-one stock split, effected in the form of a share dividend on May 4, 2007.
1999 Independent Director Share Ownership Plan
On January 19, 1999, the Board of Directors established the 1999 Independent Director Share Ownership Plan (as amended, the “Independent Director Plan”). Each independent Director was granted 1,000 shares of our Common Stock after each annual meeting of the shareholders, after which the director continued in office, beginning with the 1999 Annual Meeting and continuing until the 2005 Annual Meeting, at which time the number of shares granted increased to 2,000 shares. At the 2007 Annual Meeting the number of shares granted was determined to be the equivalent of $25,000 of stock, based on the stock price at the close of business on the Annual Meeting date, which equated to 683 shares per director. A total of 100,000 shares were covered by the Plan, of which 5,219 shares remain available under the Plan at February 29, 2008.
2000 Advisory Director Share Ownership Plan
On March 28, 2000, the Board of Directors established the 2000 Advisory Director Share Ownership Plan (the “Advisory Director Plan”). Under that Plan, Advisory Directors receive a grant of 1,000 shares of Common Stock of the Company after each annual shareholders meeting after which they continue to serve as an Advisory Director until they receive a total of 10,000 shares, including shares received while serving as an active member of the Board of Directors. A total of 20,000 shares were covered by the Plan, of which, 13,000 shares remain available under the Plan at February 29, 2008. The Board has no Advisory Directors at the present time and has no current plans to add Advisory Directors in the future.
Item 13. Certain Relationships and Related Transactions, and Director Independence
The information required by this Item is incorporated by reference to the section entitled “Certain Relationships and Related Party Transactions” and “Director Independence” set forth in the Proxy Statement for our 2008 Annual Meeting of Shareholders.
PART IV
Item 14. Principal Accountant Fees and Services
Information required by this Item is incorporated by reference to the sections entitled “Other Business – Independent Auditor Fees” and “Other Business – Pre-approval of Non-audit Fees” set forth in our Proxy Statement for our 2008 Annual Meeting of Shareholders.
Item 15. Exhibits and Financial Statement Schedules.
| | 1. | The financial statements filed as a part of this report are listed in the “Index to Consolidated Financial Statements” on page 27. |
| | 2. | Financial Statements Schedules |
Schedule II – Valuation and Qualifying Accounts and Reserves filed as a part of this report is listed in the “Index to Consolidated Financial Statements” on page 27.
Schedules and compliance information other than those referred to above have been omitted since the required information is not present or is not present in amounts sufficient to require submission of the schedule, or because the information required is included in the consolidated financial statements and the notes thereto.
| | B. | Exhibits Required by Item 601 of Regulation S-K |
A list of the exhibits required by Item 601 of Regulation S-K and filed as part of this report is set forth in the Index to Exhibits beginning on page 54, which immediately precedes such exhibits.
SIGNATURES
Pursuant to the requirements of Section 13 or 15(d) of the Securities Exchange Act of 1934, the registrant has duly caused this report to be signed on its behalf by the undersigned thereunto duly authorized.
| | AZZ incorporated | |
| | (Registrant) | |
Date: 5/9/2008 | | By: /s/ David H. Dingus |
| | | David H. Dingus, Principal Executive Officer and Director |
Pursuant to the requirements of the Securities Exchange Act of 1934, this report has been signed below by the following persons on behalf of AZZ and in the capacities and on the dates indicated.
| /s/David H. Dingus | | /s/ Dana L. Perry | |
| David H. Dingus, Principal Executive Officer and Director | | Dana L. Perry, Principal Financial Officer and Director | |
| | | | |
| | | | |
| /s/Daniel R. Feehan | | /s/ Richard Butler | |
| Daniel R. Feehan, Director | | Richard Butler, Vice President and Controller, Principal Accounting Officer | |
| | | | |
| | | | |
| /s/Martin C. Bowen | | /s/Peter A. Hegedus | |
| Martin C. Bowen, Director | | Peter A. Hegedus, Director | |
| | | | |
| | | | |
| /s/Daniel E. Berce | | /s/Dr. H. Kirk Downey | |
| Daniel E. Berce, Director | | Dr. H. Kirk Downey, Chairman of the Board and Director | |
| | | | |
| | | | |
| /s/Sam Rosen | | /s/Kevern R. Joyce | |
| Sam Rosen, Director | | Kevern R. Joyce, Director | |
| | | | |
Index to Consolidated Financial Statements and Schedules
| | | | | Page |
| 1 | | Consolidated Financial Statements | | |
| | | | | |
| | | Management’s Report on Internal Controls Over Financial Reporting | | 28 |
| | | | | |
| | | Report of Independent Registered Public Accounting Firm | | 29-31 |
| | | | | |
| | | | | 32 |
| | | | | |
| | | | | 33-34 |
| | | | | |
| | | | | 35-36 |
| | | | | |
| | | | | 37 |
| | | | | |
| | | | | 38-52 |
| | | | | |
| | | | | |
| 2. | | Consolidated Financial Statements Schedule | | |
| | | | | |
| | | | | 53 |
Management’s Report on Internal Control Over Financial Reporting
Our management is responsible for establishing and maintaining adequate internal control over financial reporting, as such term is defined in Exchange Act Rule 13a-15(f). Under the supervision and with the participation of our management including our Chief Executive Officer and Chief Financial Officer, we conducted an evaluation of the effectiveness of our internal control over financial reporting based on the framework in “Internal Control- Integrated Framework” issued by the Committee of Sponsoring Organizations of the Treadway Commission, "COSO". Based on our evaluation under the framework in COSO, our management concluded that our internal control over financial reporting was effective as of February 29, 2008. BDO Seidman, LLP, our independent registered public accounting firm, has issued an audit report on our internal control over financial reporting which is in included at page 29.
Report of Independent Registered Public Accounting Firm |
Board of Directors and Shareholders
AZZ incorporated
Fort Worth, Texas
We have audited the accompanying consolidated balance sheets of AZZ incorporated as of February 29, 2008 and February 28, 2007 and the related consolidated statements of income, shareholders’ equity, and cash flows for each of the years in the two year period ended February 29, 2008. Our audits also included the financial statement schedule listed in Item 15 of this Form 10-K. We have also audited AZZ incorporated's internal control over financial reporting as of February 29, 2008, based on criteria established in Internal Control – Integrated Framework issued by the Committee of Sponsoring Organizations of the Treadway Commission (the COSO criteria). AZZ incorporated’s management is responsible for these financial statements, financial statement schedule, maintaining effective internal control over financial reporting and for its assessment of the effectiveness of internal control over financial reporting, included in the accompanying Management’s Report on Internal Control Over Financial Reporting. Our responsibility is to express an opinion on these financial statements, financial statement schedule and express an opinion on the company’s internal control over financial reporting based on our audits.
We conducted our audits in accordance with the standards of the Public Company Accounting Oversight Board (United States). Those standards require that we plan and perform the audits to obtain reasonable assurance about whether the financial statements and the schedule are free of material misstatement and whether effective internal control over financial reporting was maintained in all material respects. Our audits of the financial statements included examining, on a test basis, evidence supporting the amounts and disclosures in the financial statements, assessing the accounting principles used and significant estimates made by management, as well as evaluating the overall financial statement presentation. Our audit of internal control over financial reporting included obtaining an understanding of internal control over financial reporting, assessing the risk that a material weakness exists and testing and evaluating the design and operating effectiveness of internal control based on the assessed risk. Our audits also included performing such other procedures as we considered necessary in the circumstances. We believe that our audits provide a reasonable basis for our opinions.
A company’s internal control over financial reporting is a process designed to provide reasonable assurance regarding the reliability of financial reporting and the preparation of financial statements for external purposes in accordance with generally accepted accounting principles. A company’s internal control over financial reporting includes those policies and procedures that (1) pertain to the maintenance of records that, in reasonable detail, accurately and fairly reflect the transactions and dispositions of the assets of the company; (2) provide reasonable assurance that transactions are recorded as necessary to permit preparation of financial statements in accordance with generally accepted accounting principles, and that receipts and expenditures of the company are made only in accordance with authorizations of management and directors of the company; and (3) provide reasonable assurance regarding prevention or timely detection of unauthorized acquisition, use, or disposition of the company’s assets that could have a material effect on the financial statements.
Because of its inherent limitations, internal control over financial reporting may not prevent or detect misstatements. Also, projections of any evaluation of effectiveness to future periods are subject to the risk that controls may become inadequate because of changes in conditions, or that the degree of compliance with the policies or procedures may deteriorate.
In our opinion, the consolidated financial statements referred to above present fairly, in all material respects, the financial position of AZZ incorporated as of February 29, 2008 and February 28, 2007 and the results of its operations and its cash flows for each of the years in the two year period ended February 29, 2008, in conformity with accounting principles generally accepted in the United States of America. Also, in our opinion, AZZ incorporated maintained, in all material respects, effective internal control over financial reporting as of February 29, 2008, based on the COSO criteria.
In addition, in our opinion, the financial statement schedule, when considered in relation to the basic consolidated financial statements taken as a whole, present fairly, in all material respects, the information set forth therein.
As discussed in Note 1 to the consolidated financial statements, the Company has adopted Financial Accounting Standards Board (FASB) Interpretation No. 48, Accounting for Uncertainty in Income Taxes – An Interpretation of FASB Statement No. 109 effective March 1, 2007. In addition, the Company changed its method of accounting for share-based payment arrangements in accordance with the provisions of Statement of Financial Accounting Standards No. 123(R), Share-based Payment, effective March 1, 2006.
/s/ BDO Seidman, LLP
Dallas, Texas
May 9, 2008
Report of Independent Registered Public Accounting Firm |
Board of Directors and Shareholders
AZZ incorporated
Fort Worth, Texas
We have audited the accompanying consolidated statements of income, shareholders' equity, and cash flows of AZZ incorporated for the year ended February 28, 2006. Our audit also included the financial statement schedule listed in the Index at Item 15A.2 for the year ended February 28, 2006. These financial statements and financial statement schedule are the responsibility of the Company's management. Our responsibility is to express an opinion on these financial statements and financial statement schedule based on our audit.
We conducted our audit in accordance with the standards of the Public Company Accounting Oversight Board (United States). Those standards require that we plan and perform the audit to obtain reasonable assurance about whether the financial statements are free of material misstatement. An audit includes examining, on a test basis, evidence supporting the amounts and disclosures in the financial statements. An audit also includes assessing the accounting principles used and significant estimates made by management, as well as evaluating the overall financial statement presentation. We believe that our audit provides a reasonable basis for our opinion.
In our opinion, the financial statements referred to above present fairly, in all material respects, the consolidated results of operations of AZZ incorporated and its cash flows for the year ended February 28, 2006, in conformity with U.S. generally accepted accounting principles. Also, in our opinion, the financial statement schedule for the year ended February 28, 2006, referred to above, when considered in relation to the basic financial statements taken as a whole, presents fairly in all material respects the information set forth therein.
/s/ Ernst & Young, LLP
Fort Worth, Texas
April 14, 2006
AZZ incorporated
CONSOLIDATED STATEMENTS OF INCOME
Years ended February 29, 2008, February 28, 2007 and February 28, 2006
| | | 2008 | | | 2007 | | | 2006 | |
| | | | | | | | | | |
| Net sales | | $ | 320,193,104 | | | $ | 260,343,667 | | | $ | 187,184,093 | |
| Costs and expenses: | | | | | | | | | | | | |
| Cost of sales | | | 239,651,058 | | | | 193,411,001 | | | | 149,855,108 | |
| Selling, general, and administrative | | | 36,261,642 | | | | 31,948,452 | | | | 23,898,755 | |
| Net (gain) loss from sale of or insurance settlement on property, plant and equipment | | | 32,211 | | | | (586,001 | ) | | | 22,208 | |
| Interest expense | | | 1,494,731 | | | | 1,495,442 | | | | 1,689,169 | |
| Other income | | | (1,079,431 | ) | | | (524,973 | ) | | | (312,346 | ) |
| | | | 276,360,211 | | | | 225,743,921 | | | | 175,152,894 | |
| | | | | | | | | | | | | |
| Income before income taxes and accounting changes | | | 43,832,893 | | | | 34,599,746 | | | | 12,031,199 | |
| Income tax expense | | | 16,145,304 | | | | 12,910,182 | | | | 4,204,312 | |
| | | | | | | | | | | | | |
| Income before cumulative effect of changes in accounting principles | | $ | 27,687,589 | | | $ | 21,689,564 | | | $ | 7,826,887 | |
| | | | | | | | | | | | | |
| Cumulative effect of change in accounting principles (net of tax of $50,667) | | | - | | | | ( 85,344 | ) | | | - | |
| | | | | | | | | | | | | |
| Net Income | | $ | 27,687,589 | | | $ | 21,604,220 | | | $ | 7,826,887 | |
| | | | | | | | | | | | | |
| Earnings per common share: | | | | | | | | | | | | |
| Basic earnings per share before effect of change in accounting | | $ | 2.30 | | | $ | 1.87 | | | $ | .70 | |
| Cumulative effect of change in accounting | | | - | | | $ | ( .01 | ) | | | - | |
| Basic earnings per share after effect of change in accounting | | $ | 2.30 | | | $ | 1.86 | | | $ | .70 | |
| | | | | | | | | | | | | |
| Diluted earnings per share before effect of change in accounting | | $ | 2.26 | | | $ | 1.83 | | | $ | .69 | |
| Cumulative effect of change in accounting | | | - | | | $ | ( .01 | ) | | | - | |
| Diluted earnings per share after effect of change in accounting | | $ | 2.26 | | | $ | 1.82 | | | $ | .69 | |
| | | | | | | | | | | | | |
| Weighted average number common shares | | | 12,012,789 | | | | 11,599,428 | | | | 11,168,156 | |
| Weighted average number common shares and potentially dilutive common shares | | | 12,227,212 | | | | 11,838,612 | | | | 11,316,084 | |
See accompanying notes to the consolidated financial statements.
AZZ incorporated
CONSOLIDATED BALANCE SHEETS
| Assets | | 2008 | | | 2007 | |
| | | | | | | |
| Current assets: | | | | | | |
| Cash and cash equivalents | | $ | 2,226,941 | | | $ | 1,703,092 | |
| Accounts receivable, net of allowance for doubtful accounts of $630,000 in 2008 and $670,000 in 2007 | | | 38,901,577 | | | | 50,277,554 | |
| Inventories | | | 43,426,468 | | | | 45,487,266 | |
Costs and estimated earnings in excess of billings on uncompleted contracts | | | 13,044,076 | | | | 8,286,324 | |
| Deferred income tax assets | | | 4,391,398 | | | | 4,224,294 | |
| Prepaid expenses and other | | | 1,004,383 | | | | 1,988,834 | |
| Total current assets | | | 102,994,843 | | | | 111,967,364 | |
| | | | | | | | | |
| Property, plant, and equipment, at cost: | | | | | | | | |
| Land | | | 2,992,863 | | | | 2,992,863 | |
| Buildings and structures | | | 36,763,402 | | | | 31,981,329 | |
| Machinery and equipment | | | 46,783,600 | | | | 43,183,977 | |
| Furniture, fixtures, software and computers | | | 8,548,747 | | | | 8,395,328 | |
| Automotive equipment | | | 1,871,116 | | | | 1,927,445 | |
| Construction in progress | | | 2,936,578 | | | | 4,790,693 | |
| | | | 99,896,306 | | | | 93,271,635 | |
| Less accumulated depreciation | | | (51,611,396 | ) | | | (46,643,316 | ) |
| Net property, plant, and equipment | | | 48,284,910 | | | | 46,628,319 | |
| | | | | | | | | |
| Goodwill | | | 40,962,104 | | | | 40,962,104 | |
| Other assets | | | 1,077,423 | | | | 1,349,791 | |
| | | | | | | | | |
| Total Assets | | $ | 193,319,280 | | | $ | 200,907,578 | |
See accompanying notes to the consolidated financial statements.
AZZ incorporated
CONSOLIDATED BALANCE SHEETS
February 29, 2008 and February 28, 2007
| Liabilities and Shareholders' Equity | | 2008 | | | 2007 | |
| | | | | | | |
| Current liabilities: | | | | | | |
| Accounts payable | | $ | 16,035,932 | | | $ | 25,316,165 | |
| Income tax payable | | | 706,966 | | | | 688,000 | |
| Accrued salaries and wages | | | 4,919,804 | | | | 5,025,508 | |
| Other accrued liabilities | | | 10,285,285 | | | | 9,298,370 | |
| Customer advance payment | | | 2,115,330 | | | | 2,900,702 | |
Billings in excess of costs and estimated earnings on uncompleted contracts | | | 3,798,179 | | | | 2,067,945 | |
| Compensation expense related to stock appreciation rights | | | 4,834,325 | | | | 4,418,233 | |
| Total current liabilities | | | 42,695,821 | | | | 49,714,923 | |
| | | | | | | | | |
| Long-term debt due after one year | | | - | | | | 35,200,000 | |
| | | | | | | | | |
| Deferred income taxes | | | 4,466,834 | | | | 4,844,405 | |
| | | | | | | | | |
| Commitments and Contingencies | | | | | | | | |
| | | | | | | | | |
| Shareholders' equity: | | | | | | | | |
| Common stock, $1 par value; 25,000,000 shares authorized; 12,609,160 shares issued at February 29, 2008 and February 28, 2007 | | | 12,609,160 | | | | 12,609,160 | |
| Capital in excess of par value | | | 16,369,938 | | | | 11,086,703 | |
| Retained earnings | | | 119,549,115 | | | | 91,861,526 | |
| Cumulative other comprehensive income | | | - | | | | 28,621 | |
Less common stock held in treasury, at cost (480,188 shares in 2008 and 954,996 shares in 2007) | | | (2,371,588 | ) | | | (4,437,760 | ) |
| Total shareholders' equity | | | 146,156,625 | | | | 111,148,250 | |
| | | | | | | | | |
| | | $ | 193,319,280 | | | $ | 200,907,578 | |
See accompanying notes to the consolidated financial statements.
AZZ incorporated
CONSOLIDATED STATEMENTS OF CASH FLOWS
| | | 2008 | | | 2007 | | | 2006 | |
| Cash flows from operating activities: | | | | | | | | | |
| Net income | | $ | 27,687,589 | | | $ | 21,604,220 | | | $ | 7,826,887 | |
| Adjustments to reconcile net income to net cash provided by operating activities: | | | | | | | | | | | | |
| Depreciation | | | 7,998,899 | | | | 6,478,441 | | | | 5,535,362 | |
| Amortization | | | 199,981 | | | | 181,203 | | | | 184,304 | |
| Non-cash compensation expense | | | 845,346 | | | | 763,957 | | | | 141,200 | |
| Non-cash interest expense | | | 13,580 | | | | 155,841 | | | | 166,696 | |
| Provision for doubtful accounts | | | 111,171 | | | | 450,796 | | | | (596,205 | ) |
| Deferred income tax expense (benefit) | | | (529,264 | ) | | | (1,127,389 | ) | | | 477,126 | |
| Cumulative effect of change in accounting principle | | | - | | | | 85,344 | | | | - | |
| Net (gain) loss on insurance settlement or sale of property, plant and equipment | | | 50,914 | | | | (586,001 | ) | | | 22,208 | |
| Effects of changes in operating assets and liabilities: | | | | | | | | | | | | |
| Accounts receivable | | | 11,264,808 | | | | (16,126,028 | ) | | | (5,471,524 | ) |
| Inventories | | | 2,060,797 | | | | (17,413,761 | ) | | | (4,531,439 | ) |
| Prepaid expenses and other assets | | | 999,226 | | | | (402,038 | ) | | | (798,315 | ) |
| Net change in billings related to costs and estimated earnings on uncompleted contracts | | | (3,027,519 | ) | | | (6,118,020 | ) | | | 2,233,416 | |
| Accounts payable | | | (9,280,234 | ) | | | 8,686,064 | | | | 3,352,880 | |
| Other accrued liabilities and income taxes | | | 530,896 | | | | 10,294,892 | | | | 4,251,174 | |
| | | | | | | | | | | | | |
| Net cash provided by operating activities | | | 38,926,190 | | | | 6,927,521 | | | | 12,793,770 | |
| | | | | | | | | | | | | |
| Cash flows from investing activities: | | | | | | | | | | | | |
| Proceeds from the sale or insurance settlement of property, plant and equipment | | | 219,795 | | | | 749,118 | | | | 658,480 | |
| Acquisition of subsidiaries, net of cash acquired | | | - | | | | (13,425,967 | ) | | | - | |
| Purchases of property, plant and equipment | | | (9,926,198 | ) | | | (10,658,561 | ) | | | (6,601,824 | ) |
| | | | | | | | | | | | | |
| Net cash used in investing activities | | | (9,706,403 | ) | | | (23,335,410 | ) | | | (5,943,344 | ) |
| | | | | | | | | | | | | |
See accompanying notes to the consolidated financial statements.
AZZ incorporated
CONSOLIDATED STATEMENTS OF CASH FLOWS (Continued)
Years ended February 29, 2008, February 28, 2007 and February 28, 2006
| | | 2008 | | | 2007 | | | 2006 | |
| | | | | | | | | | |
| Cash flows from financing activities: | | | | | | | | | |
| Payments on revolving loan | | | (35,200,000 | ) | | | (11,640,482 | ) | | | (15,000,000 | ) |
| Proceeds from exercise of stock options | | | 3,450,413 | | | | 1,260,940 | | | | 3,391,691 | |
| Tax benefits from stock options exercised | | | 3,053,649 | | | | 266,096 | | | | - | |
| Payments on long-term debt | | | - | | | | (12,375,000 | ) | | | (5,500,000 | ) |
| Proceeds from revolving loan | | | - | | | | 39,340,482 | | | | 11,000,000 | |
| | | | | | | | | | | | | |
| Net cash provided by (used in) financing activities | | | (28,695,938 | ) | | | 16,852,036 | | | | (6,108,309 | ) |
| | | | | | | | | | | | | |
| Net increase (decrease) in cash and cash equivalents | | | 523,849 | | | | 444,147 | | | | 742,117 | |
| | | | | | | | | | | | | |
| Cash and cash equivalents at beginning of year | | | 1,703,092 | | | | 1,258,945 | | | | 516,828 | |
| | | | | | | | | | | | | |
| Cash and cash equivalents at end of year | | $ | 2,226,941 | | | $ | $ 1,703,092 | | | $ | $ 1,258,945 | |
| | | | | | | | | | | | | |
| Supplemental disclosures of cash flow information: | | | | | | | | | | | | |
| Cash paid during the year for: | | | | | | | | | | | | |
| Interest | | $ | 1,672,214 | | | $ | $ 1,310,138 | | | $ | $ 1,460,495 | |
| | | | | | | | | | | | | |
| Income taxes | | $ | 13,726,926 | | | $ | 13,849,408 | | | $ | $ 2,468,057 | |
See accompanying notes to the consolidated financial statements.
AZZ incorporated
CONSOLIDATED STATEMENTS OF SHAREHOLDERS’ EQUITY
| | | Common Stock | | | Capital in | | | Retained | | | Cumulative Other | | | Treasury | | | Total | |
| | | | | | excess of | | | earnings | | | Comprehensive | | | Stock | | | | |
| | | Shares | | | Amount | | | par value | | | | | | Income (Loss) | | | | | | | |
| Balance at February 29, 2005 | | | 12,609,160 | | | $ | 12,609,160 | | | $ | 7,809,573 | | | $ | 62,430,418 | | | $ | (55,485 | ) | | $ | (7,474,489 | ) | | $ | 75,319,177 | |
| Exercise of stock options | | | | | | | | | | | 1,241,758 | | | | | | | | | | | | 2,149,933 | | | | 3,391,691 | |
| Stock compensation | | | | | | | | | | | 66,720 | | | | | | | | | | | | 74,480 | | | | 141,200 | |
| Federal income tax deducted on stock options | | | | | | | | | | | 489,975 | | | | | | | | | | | | | | | | 489,975 | |
Comprehensive income: Net income | | | | | | | | | | | | | | | 7,826,887 | | | | | | | | | | | | 7,826,887 | |
Other comprehensive income, net of tax: Unrealized gain on market value of interest rate swaps, net of $56,401 of income tax | | | | | | | | | | | | | | | | | | | 99,711 | | | | | | | | 99,711 | |
| Comprehensive income | | | | | | | | | | | | | | | | | | | | | | | | | | | 7,926,598 | |
| Balance at February 28, 2006 | | | 12,609,160 | | | $ | 12,609,160 | | | $ | 9,608,026 | | | $ | 70,257,305 | | | $ | 44,226 | | | $ | (5,250,076 | ) | | $ | 87,268,641 | |
| Exercise of stock options | | | | | | | | | | | 523,105 | | | | | | | | | | | | 737,836 | | | | 1,260,941 | |
| Stock compensation | | | | | | | | | | | 689,477 | | | | | | | | | | | | 74,480 | | | | 763,957 | |
| Federal income tax deducted on stock options | | | | | | | | | | | 266,095 | | | | | | | | | | | | | | | | 266,095 | |
Comprehensive income: Net income | | | | | | | | | | | | | | | 21,604,221 | | | | | | | | | | | | 21,604,221 | |
Other comprehensive income, net of tax: Unrealized gain (loss) on market value of interest rate swaps, net of ($8,403) of income tax | | | | | | | | | | | | | | | | | | | (15,605 | ) | | | | | | | (15,605 | ) |
| Comprehensive income | | | | | | | | | | | | | | | | | | | | | | | | | | | 21,588,616 | |
| Balance at February 28, 2007 | | | 12,609,160 | | | $ | 12,609,160 | | | $ | 11,086,703 | | | $ | 91,861,526 | | | $ | 28,621 | | | $ | (4,437,760 | ) | | $ | 111,148,250 | |
| Exercise of stock options | | | | | | | | | | | 1,384,240 | | | | | | | | | | | | 2,066,172 | | | | 3,450,412 | |
| Stock compensation | | | | | | | | | | | 845,346 | | | | | | | | | | | | | | | | 845,346 | |
| Federal income tax deducted on stock options | | | | | | | | | | | 3,053,649 | | | | | | | | | | | | | | | | 3,053,649 | |
Comprehensive income: Net income | | | | | | | | | | | | | | | 27,687,589 | | | | | | | | | | | | 27,687,589 | |
Other comprehensive income, net of tax: Unrealized gain (loss) on market value of interest rate swaps, net of ($15,411) of income tax | | | | | | | | | | | | | | | | | | | (28,621 | ) | | | | | | | (28,621 | ) |
| Comprehensive income | | | | | | | | | | | | | | | | | | | | | | | | | | | 27,658,968 | |
| Balance at February 29, 2008 | | | 12,609,160 | | | $ | 12,609,160 | | | $ | 16,369,938 | | | $ | 119,549,115 | | | | - | | | $ | (2,371,588 | ) | | $ | 146,156,625 | |
| | | | | | | | | | | | | | | | | | | | | | | | | | | | | |
See accompanying notes to the consolidated financial statements.
AZZ incorporated
NOTES TO CONSOLIDATED FINANCIAL STATEMENTS (Continued)
1. Summary of significant accounting policies
Organization—AZZ incorporated (the “Company”) operates primarily in the United States of America. Information about the Company’s operations by segment is included in Note 11 to the consolidated financial statements.
Basis of consolidation—The consolidated financial statements include the accounts of AZZ incorporated and its wholly owned subsidiaries. All significant inter-company accounts and transactions have been eliminated in consolidation.
Capital Structure—On April 5, 2007, our Board of Directors authorized a two-for-one split of common stock, to be effected in the form of a share dividend of one share of Common Stock for every one share of Common Stock outstanding. The dividend was paid on May 4, 2007 to shareholders of record on April 20, 2007. All share and per share data provided herein give effect to this stock split, applied retroactively.
Use of estimates—The preparation of the financial statements in conformity with accounting principles generally accepted in the United States of America requires management to make estimates and assumptions that affect the amounts of assets and liabilities and disclosure of contingent assets and liabilities at the date of the financial statements and the reported amounts of revenues and expenses during the reporting period. Actual results could differ from those estimates.
Concentrations of credit risk—Financial instruments that potentially subject the Company to significant concentrations of credit risk consist principally of cash and cash equivalents and trade accounts receivable.
The Company maintains cash and cash equivalents with various financial institutions. These financial institutions are located throughout the United States and Company policy is designed to limit exposure to any one institution. The Company performs periodic evaluations of the relative credit standing of those financial institutions that are considered in the Company’s banking relationships. The Company has not experienced any losses in such accounts and believes it is not exposed to any significant credit risk related to cash and cash equivalents.
Concentrations of credit risk with respect to trade accounts receivable are limited due to the Company’s diversity by virtue of two operating segments, the number of customers, and the absence of a concentration of trade accounts receivable in a small number of customers. The Company performs continual evaluations of the collectibility of trade accounts receivable and allowance for doubtful accounts based upon historical losses, economic conditions and customer specific events. After all collection efforts are exhausted and the account is deemed uncollectible, it is written off against the allowance for doubtful accounts. The Company’s net credit losses in 2008, 2007 and 2006 were approximately $151,000, $181,000 and $366,000, respectively. Collateral is usually not required from customers as a condition of sale.
Revenue recognition—The Company recognizes revenue for the Electrical and Industrial Products Segment upon transfer of title and risk to customer, or based upon the percentage-of-completion method of accounting for electrical products built to customer specifications under long-term contracts. We recognize revenue for the Galvanizing Services Segment upon completion of the galvanizing process performed on the customers’ material or shipment of this material. Revenue for the Galvanizing Service Segment is typically recognized at completion of the service unless we specifically agree with the customer to hold its material for a predetermined period of time after the completion of the galvanizing process and, in that circumstance, we invoice and recognize revenue upon shipment. Customer advanced payments presented in the balance sheet arise from advanced payments received from our customers prior to shipment of the product and are not related to revenue recognized under the percentage of completion method. The extent of progress for revenue recognized using the percentage of completion method is measured by the ratio of contract costs incurred to date to total estimated contract costs at completion. Contract costs include direct labor and material, and certain indirect costs. Selling, general and administrative costs are charged to expense as incurred. Provisions for estimated losses, if any, on uncompleted contracts are made in the period in which such losses
AZZ incorporated
NOTES TO CONSOLIDATED FINANCIAL STATEMENTS (Continued)
are able to be determined. The assumptions made in determining the estimated cost could differ from actual performance resulting in a different outcome for profits or losses than anticipated
Cash and cash equivalents—For purposes of reporting cash flows, cash and cash equivalents include cash on hand, deposits with banks and all highly liquid investments with an original maturity of three months or less.
Shipping and handling cost – The shipping and handling cost are shown net (gross collection less actual cost) within net sales on the Consolidated Statements of Income.
Inventories— Cost is determined principally using a weighted-average method for the Electrical and Industrial Products Segment and the first-in-first-out (FIFO) method for the Galvanizing Services Segment.
Property, plant and equipment — For financial reporting purposes, depreciation is computed using the straight-line method over the estimated useful lives of the related assets as follows:
| Buildings and structures | 10-25 years |
| Machinery and equipment | 3-15 years |
| Furniture and fixtures | 3-15 years |
| Automotive equipment | 3 years |
Maintenance and repairs are charged to expense as incurred; renewals and betterments that significantly extend the useful life of the asset are capitalized.
Long-lived assets, intangible assets and goodwill — Purchased intangible assets included on the balance sheet as other assets are comprised of customer lists, backlogs and non-compete agreements. Such intangible assets are being amortized using the straight-line method over the estimated useful lives of the assets ranging from two to fifteen years. The Company records impairment losses on long-lived assets, including identifiable intangible assets, when events and circumstances indicate that the assets might be impaired and the undiscounted projected cash flows associated with those assets are less than the carrying amounts of those assets. In those situations, impairment loss on a long-lived asset is measured based on the excess of the carrying amount of the asset over the asset's fair value, generally determined based upon discounted estimates of future cash flows. For goodwill, the Company performs an annual impairment test in the fourth quarter of each year or as indicators are present.
Debt issue costs - Debt issue costs, included in other assets, are expensed using the effective interest rate method over the term of the debt.
Income taxes — Income tax expense is based on the liability method. Under this method of accounting, deferred tax assets and liabilities are recognized based on differences between financial accounting and income tax basis of assets and liabilities using presently enacted tax rates and laws.
Stock-based compensation — The Company has granted stock options or stock appreciation rights for a fixed number of shares to employees and directors.
Prior to March 1, 2006, we accounted for stock options granted to our employees and directors under the recognition and measurement provisions of APB Opinion 25, “Accounting for Stock Issued to Employees” and related Interpretations, as permitted by FASB statement No. 123, “Accounting for Stock-Based Compensation.” For our stock options, no stock based compensation expense was recognized in our financial statements prior to March 1, 2006, as all stock options granted had an exercise price equal to the market value of the underlying common stock at the date of grant. Effective March 1, 2006, we adopted the fair value recognition provisions of FASB Statement No. 123R, “Share-Based Payment,” using the modified prospective transition method. Under this method, compensation cost recognized for fiscal 2007 and fiscal 2008 includes compensation cost of $145,000 and $6,000, respectively, for share-based payments granted prior to, but not yet vested as of, February 28, 2006, based on the grant date fair value estimated in
AZZ incorporated
NOTES TO CONSOLIDATED FINANCIAL STATEMENTS (Continued)
accordance with the original provisions of Statement 123. As of February 29, 2008, all shares had vested and related compensation cost has been recognized.
We also began granting stock appreciation rights, or SARs, in the first quarter of fiscal 2005 as part of our stock-based compensation plans. The SARs granted in fiscal 2005 and fiscal 2006 will be settled in cash. Prior to March 1, 2006, we accounted for these SAR grants under the recognition and measurement provisions of APB Opinion No. 25, which required expense to be recognized equal to the amount by which the quoted market value exceeded the original grant price on a mark-to-market basis. Therefore, we recognized $757,000 of compensation expense prior to February 28, 2006. On March 1, 2006, as required under the provisions of Statement 123R, those SARs granted prior to, but not yet vested as of, February 28, 2006, were recorded at their fair value estimated in accordance with Statement 123R, and a cumulative effect of change in accounting principle was recorded in the amount of $85,300, net of tax. Additional compensation expense for these SARs in the amount of $4.8 million for fiscal 2008 and $3.5 million was recorded for fiscal 2007 based on their fair value in accordance with Statement 123R. To date $9.2 million of compensation expense has been recognized for these SARs. The grants for fiscal 2005 were fully vested on February 28, 2007 and were paid in cash during the second quarter ended August 31, 2007 in the amount of $4.4 million.
The following table illustrates the effect on net income and earnings per share if we had applied the fair value recognition provisions of Statement No. 123R to options and SARs granted under our stock-based compensation plans for fiscal 2006. For the purpose of this pro forma disclosure, the value is estimated using a Black-Scholes option-pricing formula and amortized to expense over the option’s vesting periods.
| | | 2006 | |
| | | | |
| Reported net income | | $ | 7,827 | |
| Recognized Compensation, net of tax | | | 570 | |
| Compensation expense per SFAS No.123R, net of tax | | | (981 | ) |
| Pro forma net income for SFAS No. 123R | | $ | 7,417 | |
| | | | | |
| Reported earnings per common share: | | | | |
| Basic | | $ | .70 | |
| Diluted | | $ | .69 | |
| | | | | |
| Compensation expense per SFAS No 123R: | | | | |
| Basic | | $ | (.04 | ) |
| Diluted | | $ | (.03 | ) |
| | | | | |
| Pro forma earnings per common share: | | | | |
| Basic | | $ | .66 | |
| Diluted | | $ | .66 | |
On June 1, 2006, we granted 234,160 SARs to be settled in stock. These Stock Appreciation Rights have a three year cliff vesting schedule, but may vest early if accelerated vesting provisions in the plan are met. These qualify for equity treatment under SFAS 123R. The weighted average fair value of SARs granted on June 1, 2006 was determined to be $2.92 based on the following assumptions: risk-free interest rate of 5%, dividend yield of 0.0%, expected volatility of 27.81% and expected life of 3 years. Compensation expense related to the June 1, 2006 grant was $392,000 for fiscal 2007 and $152,000 for fiscal 2008. As of February 29, 2008, we had unrecognized cost of $139,000 related to June 1, 2006 SARs grants.
AZZ incorporated
NOTES TO CONSOLIDATED FINANCIAL STATEMENTS (Continued)
On March 1, 2007, we granted 147,740 SARs to be settled in stock. These Stock Appreciation Rights have a three year cliff vesting schedule, but may vest early if accelerated vesting provisions in the plan are met and qualify for equity treatment under SFAS 123R. The weighted average fair value of SARs granted on March 1, 2007, was determined to be $5.535 based on the following assumptions: risk-free interest rate of 5%, dividend yield of 0.0%, expected volatility of 29.52% and expected life of 3 years. During the second quarter ended August 31, 2007, the vesting date of 5,920 Stock Appreciation Rights was accelerated due to the retirement of two of the Company’s directors. Compensation expense in the amount of $512,000 was recognized during fiscal 2008. We had unrecognized cost of $306,000 related to the March 1, 2007 SARs grants. See Note 9, stock options and other shareholder matters for additional information on stock based compensation plans.
Financial instruments — The Company’s financial instruments consist of cash and cash equivalents, accounts receivable, accounts payable and long-term debt. The fair values of financial instruments approximate the amount of their carrying value.
Derivative financial instruments— From time to time, the Company uses derivatives to manage interest rate risk. The Company’s policy is to use derivatives for risk management purposes only, which includes maintaining the ratio between the Company’s fixed and floating rate debt obligations that management deems appropriate, and prohibits entering into such contracts for trading purposes. The Company enters into derivatives only with counterparties (primarily financial institutions) which have substantial financial wherewithal to minimize credit risk. The amount of gains or losses from the use of derivative financial instruments has not been and is not expected to be material to the Company’s consolidated financial statements. As of February 29, 2008, the Company had no derivative financial instruments.
Warranty reserves – Within other accrued liabilities, a reserve has been established to provide for the estimated future cost of warranties on a portion of the Company’s delivered products. Management periodically reviews the reserves, and adjustments are made accordingly. A provision for warranty on products is made on the basis of the Company’s historical experience and identified warranty issues. Warranties cover such factors as non-conformance to specifications and defects in material and workmanship. The following is a roll-forward of amounts accrued for warranty reserves:
| | | Warranty Reserve (in thousands) | |
| Balance at February 28, 2005 | | $ | 1,005 | |
| Warranty costs incurred | | | (1,050 | ) |
| Additions charged to income | | | 1,147 | |
| Balance at February 28, 2006 | | $ | 1,102 | |
| Warranty costs incurred | | | (888 | ) |
| Additions charged to income | | | 1,364 | |
| Balance at February 28, 2007 | | $ | 1,578 | |
| Warranty costs incurred | | | (1,034 | ) |
| Additions charged to income | | | 1,188 | |
| Balance at February 29, 2008 | | $ | 1,732 | |
Recent Accounting Pronouncements
In December 2007, the Financial Accounting Standard board ("FASB") issued SFAS No. 141, (revised 2007), "Business Combinations" ("SFAS No. 141(R)"), which continues the evolution toward fair value reporting and significantly changes the accounting for acquisitions that close beginning in 2009, both at the acquisition date and in subsequent periods. SFAS No. 141(R) introduces new accounting concepts and valuation complexities, and many of the changes have the potential to generate greater earnings volatility after an acquisition. SFAS No. 141(R) applies to acquisitions on or after March 1, 2009 and will impact the Company's reporting prospectively only.
AZZ incorporated
NOTES TO CONSOLIDATED FINANCIAL STATEMENTS (Continued)
In December 2007, FASB issued SFAS No. 160, "Noncontrolling Interests in Consolidated Statements – an amendment of ARB No. 51" ("SFAS No. 160"), which requires companies to measure an acquisition of noncontrolling (minority) interest at fair value in the equity section of the acquiring entity's balance sheet. The objective of SFAS No. 160 is to improve the comparability and transparency of financial data as well as to help prevent manipulation of earnings. The changes introduced by the new standards are likely to affect the planning and execution, as well as the accounting and disclosure, of merger transactions. The effective date to adopt SFAS No. 160 for us in March 1, 2009 and we do not expect the adoption to have a material effect on our results of operations and financial position.
In February 2007, the FASB issued SFAS No. 159, "The Fair Value Option for Financial Assets and Financial Liabilities, including an amendment of FASB Statement No. 115" ("SFAS No. 159"). This standard permits an entity to choose to measure many financial instruments and certain items at fair value. Most of the provisions in SFAS No. 159 are elective; however, the amendment to FASB SFAS No. 115, "Accounting for Certain Investments in Debt and Equity Securities":, applies to all entities with available –for-sale and trading securities. The provisions of SFAS No. 159 are effective as of the beginning of an entity's first fiscal year that begins after November 15, 2007. We do not expect the adoption of SFAS No. 159 to have a significant impact on our consolidated financial statements.
In September 2006, the FASB issued SFAS No. 157, "Fair Value Measurements" ("SFAS No. 157"), which defines fair value, establishes a framework for measuring fair value and expands disclosures about fair value measurements. The provisions of SFAS No. 157 are effective for financial statements issued for fiscal years beginning after November 15, 2007. In February of 2008, the FASB issued FASB Staff position No. 157-2 which delays the effective date of SFAS No. 157 for non-financial assets and liabilities which are not measured at fair value on a recurring basis (at least annually) until fiscal years beginning after November 15, 2008. We are currently in the process of evaluating the impact of the adoption of SFAS no. 157 on our consolidated financial statements.
Inventories consist of the following:
| | | 2008 | | | 2007 | |
| | | (In thousands) | |
| Raw materials | | $ | 26,555 | | | $ | 31,724 | |
| Work-in-process | | | 14,182 | | | | 11,458 | |
| Finished goods | | | 2,689 | | | | 2,305 | |
| | | $ | 43,426 | | | $ | 45,487 | |
| 3. | Costs and estimated earnings on uncompleted contracts |
Costs and estimated earnings on uncompleted contracts consist of the following:
| | | 2008 | | | 2007 | |
| | | (In thousands) | |
| Costs incurred on uncompleted contracts | | $ | 47,469 | | | $ | 27,593 | |
| Estimated earnings | | | 19,195 | | | | 12,497 | |
| | | | 66,664 | | | | 40,090 | |
| Less billings to date | | | 57,418 | | | | 33,872 | |
| | | $ | 9,246 | | | $ | 6,218 | |
AZZ incorporated
NOTES TO CONSOLIDATED FINANCIAL STATEMENTS (Continued)
The amounts noted above are included in the accompanying consolidated balance sheet under the following captions:
| | | 2008 | | | 2007 | |
| | | (In thousands) | |
Cost and estimated earnings in excess of billings on uncompleted contracts | | $ | 13,044 | | | $ | 8,286 | |
Billings in excess of costs and estimated earnings on uncompleted contracts | | | (3,798 | ) | | | (2,068 | ) |
| | | $ | 9,246 | | | $ | 6,218 | |
| 4. | Other accrued liabilities |
Other accrued liabilities consist of the following:
| | | 2008 | | | 2007 | |
| | | (In thousands) | |
| Accrued warranty | | $ | 1,732 | | | $ | 1,578 | |
| Group medical insurance | | | 550 | | | | 780 | |
| Profit sharing | | | 3,900 | | | | 3,105 | |
| Commissions | | | 1,251 | | | | 922 | |
| Other | | | 2,852 | | | | 2,913 | |
| | | $ | 10,285 | | | $ | 9,298 | |
The Company has a trustee profit sharing plan and 401(k) plan covering substantially all of its employees. Under the provisions of the plan, the Company contributes amounts as authorized by the Board of Directors. Total contributions to the profit sharing plan, which included the Company’s 401(k) matching, were $4,871,000 for 2008, $3,832,000 for 2007, and $528,000 for 2006.
Deferred federal and state income taxes reflect the net tax effects of temporary differences between the carrying amounts of assets and liabilities for financial accounting purposes and the amounts used for income tax purposes. Significant components of the Company’s net deferred income tax liability are as follows:
| | | 2008 | | | 2007 | |
| | | (In thousands) | |
| Deferred income tax assets: | | | | | | |
| Employee related items | | | 2,606 | | | | 2,245 | |
| Inventories | | | 182 | | | | 226 | |
| Accrued warranty | | | 650 | | | | 592 | |
| Accounts receivable | | | 236 | | | | 251 | |
| Other | | | 717 | | | | 910 | |
| Total deferred income tax assets | | | 4,391 | | | | 4,224 | |
| | | | | | | | | |
| Deferred income tax liabilities: | | | | | | | | |
| Depreciation methods and property basis differences | | | (1,458 | ) | | | (1,744 | ) |
| Other assets and goodwill | | | (3,008 | ) | | | (3,100 | ) |
| Total deferred income tax liabilities | | | (4,466 | ) | | | (4,844 | ) |
| Net deferred income tax liabilities | | $ | (75 | ) | | $ | (620 | ) |
AZZ incorporated
NOTES TO CONSOLIDATED FINANCIAL STATEMENTS (Continued)
| | The provision for income taxes, including tax effect of change in accounting principle, consists of: |
| | | 2008 | | | 2007 | | | 2006 | |
| | | (In thousands) | |
| Federal: | | | | | | | | | |
| Current | | $ | 15,171 | | | $ | 12,536 | | | $ | 3,467 | |
| Deferred | | | (486 | ) | | | (1,062 | ) | | | 484 | |
| State: | | | | | | | | | | | | |
| Current | | | 1,503 | | | | 1,451 | | | | 260 | |
| Deferred | | | (43 | ) | | | (65 | ) | | | (7 | ) |
| | | $ | 16,145 | | | $ | 12,860 | | | $ | 4,204 | |
A reconciliation from the federal statutory income tax rate to the effective income tax rate is as follows:
| | | 2008 | | | 2007 | | | 2006 | |
| | | | | | | | | | |
| Statutory federal income tax rate | | | 35.0 | % | | | 35.0 | % | | | 34.0 | % |
| Expenses not deductible for tax purposes | | | .2 | | | | .3 | | | | .6 | |
| State income taxes, net of federal income tax benefit | | | 2.1 | | | | 2.5 | | | | 1.8 | |
| Benefit of section 199, manufacturing deduction | | | (1.7 | ) | | | (1.1 | ) | | | (.8 | ) |
| Other | | | 1.2 | | | | .6 | | | | (.6 | ) |
| Effective income tax rate | | | 36.8 | % | | | 37.3 | % | | | 35.0 | % |
| 7. | Intangible assets and goodwill |
Goodwill and intangible assets with indefinite lives are not amortized but are subject to annual impairment tests. Other intangible assets with finite lives continue to be amortized over their useful lives.
The Company completed its annual impairment analysis of goodwill on December 31st of each year. As a result the Company determined that there was no impairment of goodwill.
In addition to other miscellaneous assets, the Company classifies its intangible assets other than goodwill in other assets on the consolidated balance sheet.
Intangible assets consisted of the following:
| | | 2008 | | | 2007 | |
| | | (In thousands) | |
| Customer related intangibles | | $ | 765 | | | $ | 765 | |
| Non-compete agreements | | | 1,183 | | | | 1,183 | |
| | | | 1,948 | | | | 1,948 | |
| Less accumulated amortization | | | 961 | | | | 761 | |
| | | $ | 987 | | | $ | 1,187 | |
| | Accumulated amortization related to customer related intangibles and non-compete agreements were $118,000 and $843,000 respectively, at February 29, 2008 and $30,000 and $731,000, respectively, at February 28, 2007. |
AZZ incorporated
NOTES TO CONSOLIDATED FINANCIAL STATEMENTS (Continued)
| | The Company recorded amortization expenses for Fiscal 2008, 2007 and 2006 in the amount of $200,000, $181,000 and $184,000, respectively. The following table projects the estimated amortization expense for the five succeeding fiscal years and thereafter. |
| (In thousands) | |
| 2009 | | $ | 200 | |
| 2010 | | | 151 | |
| 2011 | | | 98 | |
| 2012 | | | 98 | |
| 2013 | | | 98 | |
| Thereafter | | | 342 | |
| Total | | $ | 987 | |
Basic earning per share is based on the weighted average number of shares outstanding during each year. Diluted earnings per share were similarly computed but have been adjusted for the dilutive effect of the weighted average number of stock options and equity stock appreciation rights outstanding. The shares and earnings per share have been adjusted to reflect our two-for-one stock split, effected in the form of a share dividend on May 4, 2007.
The following table sets forth the computation of basic and diluted earnings per share:
| | | 2008 | | | 2007 | | | 2006 | | |
| | | (In thousands, except share and per share amounts) |
| Numerator: | | | | | | | |
| Income before cumulative effect of changes in accounting principles | | $ | 27,688 | | | $ | 21,689 | | | $ | 7,827 | |
| Cumulative effect of accounting change | | | - | | | | (85 | ) | | | - | |
Net income for basic and diluted earnings per common share | | $ | 27,688 | | | $ | 21,604 | | | $ | 7,827 | |
| | | | | | | | | | | | | | |
| Denominator: | | | | | | | | | | | | | |
Denominator for basic earnings per common share - weighted-average shares | | | 12,012,789 | | | | 11,599,428 | | | | 11,168,156 | |
| | | | | | | | | | | | | | |
| Effect of dilutive securities: | | | | | | | | | | | | | |
| Stock options/Equity SARs | | | 214,423 | | | | 239,184 | | | | 147,928 | |
| | | | | | | | | | | | | | |
Denominator for diluted earnings per common share - adjusted weighted- average shares | | | 12,227,212 | | | | 11,838,612 | | | | 11,316,084 | |
| | | | | | | | | | | | | | |
| Earnings per share basic and diluted: | | | | | | | | | | | | | |
| Before cumulative effect of change in accounting principles | | | | | | | | | | | | | |
| Basic earnings per common share | | $ | 2.30 | | | $ | 1.87 | | | $ | .70 | |
| Diluted earnings per common share | | $ | 2.26 | | | $ | 1.83 | | | $ | .69 | |
| After cumulative effect of change in accounting principles | | | | | | | | | | | | | |
| Basic earnings per common share | | $ | 2.30 | | | $ | 1.86 | | | $ | .70 | |
| Diluted earnings per common share | | $ | 2.26 | | | $ | 1.82 | | | $ | .69 | |
AZZ incorporated
NOTES TO CONSOLIDATED FINANCIAL STATEMENTS (Continued)
Stock options for which the exercise price was greater than the average market price of common shares were not included in the computation of diluted earnings per share as the effect would be anti-dilutive. At the end of fiscal years 2008, 2007 and 2006, there were none, none, and 588,456, stock options, respectively, outstanding with exercise prices greater than the average market price of common shares.
| 9. | Stock options and other shareholder matters |
During fiscal 2006, the Company adopted the AZZ incorporated 2005 Long-Term Incentive Plan (“2005 Plan”). The purpose of the 2005 Plan is to promote the growth and prosperity of the Company by permitting the Company to grant to its employees and directors restricted stock, performance awards, stock appreciation rights and options to purchase common stock of the Company. The maximum number of shares that may be issued under the 2005 Plan is 500,000 shares. On June 1, 2006, 234,160 SARs were issued under the 2005 Plan with an exercise price of $11.55. These awards qualify for equity treatment in accordance with SFAS 123R. These stock appreciation rights have a three year cliff vesting schedule, but may vest early if accelerated vesting provisions in the plan are met. The weighted average fair value of SARs granted on June 1, 2006 was determined to be $2.915 based on the following assumptions: risk-free interest rate of 5%, dividend yield of 0.0%, expected volatility of 27.81% and expected life of 3 years. During the second quarter ended August 31, 2007, the vesting date of 22,720 Stock Appreciation Rights was accelerated due to the retirement of two directors and one employee. Compensation expense related to the June 1, 2006 grant was $392,000 for fiscal 2007. Additional compensation in the amount of $152,000 was recognized during fiscal 2008. As of February 29, 2008, we had unrecognized cost of $139,000 related to the June 1, 2006 SAR grants.
On March 1, 2007, 147,740 Stock Appreciation Rights were issued under the 2005 Plan with an exercise price of $19.88. These Stock Appreciation Rights have a three year cliff vesting schedule, but may vest early if accelerated vesting provisions in the plan are met and qualify for equity treatment under SFAS 123R. The weighted average fair value of SARs granted on March 1, 2007, was determined to be $5.535 based on the following assumptions: risk-free interest rate of 5%, dividend yield of 0.0%, expected volatility of 29.52% and expected life of 3 years. During the second quarter ended August 31, 2007, the vesting date of 5,920 Stock Appreciation Rights was accelerated due to the retirement of two of the Company’s directors. Compensation expense in the amount of $512,000 was recognized during fiscal 2008. As of February 29, 2008, we had unrecognized cost of $306,000 related to the March 1, 2007 SAR grants.
During fiscal 2002, the Company adopted the AZZ incorporated 2001 Long-Term Incentive Plan (“2001 Plan”). The purpose of the 2001 Plan is to promote the growth and prosperity of the Company by permitting the Company to grant to its employees, directors and advisors restricted stock and options to purchase common stock of the Company. The maximum number of shares that may be issued under the 2001 Plan is 1.5 million shares. In conjunction with the adoption of the 2001 Plan, all options still available for issuance under pre-existing option plans were terminated. At February 29, 2008, 132,032 vested options were outstanding under the 2001 Plan and exercisable at prices ranging from $4.215 to $12.125 per share. Options under the 2001 Plan vest from immediately upon issuance to ratably over a period of three to five years and expire at various dates through March 2013. There were no new options or Stock Appreciation Rights granted under the 2001 plan during fiscal 2008.
During fiscal 2008, 2007 and 2006, the Company granted its directors and advisory directors 4,781, 16,000 and 16,000 shares of the Company’s common stock for each of the fiscal years, respectively. Stock compensation expense was recognized with regard to these grants in the amount of $175,000 for fiscal 2008, $227,000 for fiscal 2007, and $141,000 for fiscal 2006.
AZZ incorporated
NOTES TO CONSOLIDATED FINANCIAL STATEMENTS (Continued)
On April 7, 2005, the Company implemented Stock Appreciation Rights Plans (the “Plans”) for its key employees and directors. The purpose of the Plans is to enable the Company to attract and retain qualified key employees and directors by offering to them the opportunity to share in increases in the value of the Company to which they contribute. The Company made grants under the Plans in fiscal 2005 and fiscal 2006. The grants outstanding were 207,660 for fiscal 2006 grants as of February 29, 2008. The grants for fiscal 2005 were fully vested on February 28, 2007 and were paid in cash during the second quarter ended August 31, 2007 in the amount of $4.4 million. The fiscal 2006 rights fully vested on February 29, 2008. The value of each vested right will be paid in cash for rights vesting on the Company’s earnings release date for the fiscal year ended February 29, 2008, and shall be equal to the excess, if any, (i) of the average of the closing prices of a share of Common Stock on the New York Stock Exchange for those days on which it trades during the ninety calendar days immediately following the public release of financial results for the period ended February 29, 2008, over (ii) the average of the closing prices of a share of Common Stock on the New York Stock Exchange for those days on which it trades during the ninety calendar days immediately following the Company’s year end earnings release date, which was $7.98 per share for the fiscal 2006 grants. To determine the cash payment, the excess in the average stock price will be multiplied by the number of Stock Appreciation Rights granted to each participant. The value of rights vesting before the normal vesting date will be measured by reference to the price of the Common Stock during a period at or near the accelerated vesting date. The Company recognized $4.4 million for compensation expense related to the Stock Appreciation Rights Plans prior to February 28, 2007. Additional compensation expense related to these Stock Appreciation Rights Plans in the amount of $4.8 million was recognized during fiscal 2008 in accordance with FAS 123R. To date $9.2 million of compensation expense has been recognized for these Stock Appreciation Rights.
A summary of the Company’s stock option and equity settled Stock Appreciation Rights activity and related information is as follows:
| | | 2008 | | | 2007 | | | 2006 | |
| | | Options/ SAR’s | | | Weighted Average Exercise Price | | | Options/ SAR’s | | | Weighted Average Exercise Price | | | Options | | | Weighted Average Exercise Price | |
| Outstanding at beginning of year | | | 825,590 | | | $ | 8.92 | | | | 754,776 | | | $ | 7.90 | | | | 1,368,178 | | | $ | 7.77 | |
| Granted | | | 147,740 | | | | 19.885 | | | | 234,160 | | | | 11.55 | | | | - | | | | - | |
| Exercised | | | (488,038 | ) | | | 8.41 | | | | (158,504 | ) | | | 7.96 | | | | (461,858 | ) | | | 7.35 | |
| Forfeited | | | 0 | | | | N/A | | | | (4,842 | ) | | | 8.80 | | | | (151,544 | ) | | | 8.34 | |
| Outstanding at end of year | | | 485,292 | | | $ | 12.78 | | | | 825,590 | | | $ | 8.92 | | | | 754,776 | | | $ | 7.90 | |
| | | | | | | | | | | | | | | | | | | | | | | | | |
| Exercisable at end of year | | | 248,572 | | | $ | 10.68 | | | | 620,834 | | | $ | 8.78 | | | | 588,270 | | | $ | 8.57 | |
| | | | | | | | | | | | | | | | | | | | | | | | | |
| Weighted average fair value for the fiscal year indicated of options and SARs granted during such year | | | | | | $ | 5.534 | | | | | | | $ | 2.915 | | | | | | | | N/A | |
The aggregate intrinsic value of the equity settled Stock Appreciation Rights and stock options for the outstanding shares/ stock appreciation rights and exercisable shares/ stock appreciation rights at February 29, 2008 were $11 million and $6.2 million, respectively.
AZZ incorporated
NOTES TO CONSOLIDATED FINANCIAL STATEMENTS (Continued)
The following table summarizes additional information about stock options and stock appreciation rights outstanding at February 29, 2008.
Range of Exercise Prices | | | Total Shares/ SAR’s | | | Weighted Average Remaining Life | | | Weighted Average Exercise Price | | | Shares / SAR’s Currently Exercisable | | | Weighted Average Exercise Price | |
| | | | | | | | | | | | | | | | | |
| | $4.215 - $5.545 | | | | 43,764 | | | | 4.54 | | | $ | 4.66 | | | | 43,764 | | | $ | 4.66 | |
| | $7.70 - $8.80 | | | | 87,568 | | | | 4.03 | | | $ | 8.32 | | | | 87,568 | | | $ | 8.32 | |
| | $11.55 - $19.885 | | | | 353,960 | | | | 1.70 | | | $ | 14.89 | | | | 117,240 | | | $ | 14.68 | |
| | $4.125 - $19.885 | | | | 485,292 | | | | 2.38 | | | $ | 12.78 | | | | 248,572 | | | $ | 10.68 | |
Effective January 7, 1999, the Board of Directors approved a stock rights plan, which authorized and declared a dividend distribution of one right for each share of common stock outstanding at the close of business on February 4, 1999. The rights are exercisable at an initial exercise price of $30, subject to certain adjustments as defined in the agreement, if a person or group acquires 15% or more of the Company’s common stock or announces a tender offer that would result in ownership of 15% or more of the common stock. Alternatively, the rights may be redeemed at one cent per right at any time until ten business days following the first public announcement of the acquisition of beneficial ownership of 15% of the Company’s common stock. The rights expire on January 7, 2009.
As of February 29, 2008, the Company has approximately 845,409 and 11,905,548 shares, respectively reserved for future issuance under the stock option plans and the shareholder rights plan.
10. Long-term debt
| Long-term debt consists of the following: | | 2008 | | | 2007 | |
| | | (In thousands) | |
| | | | | | | |
| Revolving line of credit with bank, due May 25, 2011 | | | - | | | $ | 35,200 | |
| | | | - | | | | 35,200 | |
| Less amount due within one year | | | | | | | - | |
| | | | - | | | $ | 35,200 | |
On May 25, 2006, we entered into the Second Amended and Restated Credit Agreement (the “Credit Agreement”), which replaced our Amended and Restated Revolving and Term Credit Agreement dated as of November 1, 2001.
The Credit Agreement provides for a $60 million revolving line of credit with one lender, Bank of America, N.A., maturing on May 25, 2011. This is an unsecured revolving credit facility, which refinanced outstanding borrowings and is used to provide for working capital needs, capital improvements, future acquisitions, and letter of credit needs. At February 29, 2008, we had no outstanding debt borrowed against the revolving credit facility and letters of credit outstanding in the amount of $10.5 million, which left approximately $49.5 million of additional credit available under the revolving credit facility.
The Credit Agreement provides for various financial covenants consisting of a) Minimum Consolidated Net Worth – maintain on a consolidated basis net worth equal to at least the sum of $69.8 million, representing 80% of net worth at February 28, 2006, plus 75% of future net income, b) Maximum Leverage Ratio- maintain on a consolidated basis a Leverage Ratio (as defined in the Credit Agreement) not to exceed 3.0:1.0, c) Fixed Charge Coverage Ratio- maintain on a consolidated basis a Fixed Charge Coverage Ratio of at least 1.5:1.0 and d) Capital Expenditures- not to make Capital Expenditures on a consolidated basis in an amount in excess of $14 million during any fiscal year.
AZZ incorporated
NOTES TO CONSOLIDATED FINANCIAL STATEMENTS (Continued)
The Credit Agreement provides for an applicable margin ranging from .75% to 1.25% over the Eurodollar Rate and Commitment Fees ranging from .175% to .25% depending on our Leverage Ratio. The applicable margin was .75% at February 29, 2008.
11. Operating segments
The Company has two reportable segments as defined by the FASB No. 131, Disclosures about Segments of an Enterprise and Related Information: (1) Electrical and Industrial Products and (2) Galvanizing Services. The Electrical and Industrial Products Segment provides highly engineered specialty components to the power generation transmission and distribution market, as well as products to the industrial market. The Galvanizing Services Segment provides hot dip galvanizing services to the steel fabrication industry through facilities located throughout the south, midwest and southwest. Hot dip galvanizing is a metallurgical process by which molten zinc is applied to a customer’s material. The zinc bonding renders a corrosive resistant coating enhancing the life of the material for up to fifty years.
Information regarding operations and assets by segment is as follows:
| | | 2008 | | | 2007 | | | 2006 | |
| Net sales: | | (In thousands) | |
| Electrical and Industrial Products | | $ | 179,181 | | | $ | 150,250 | | | $ | 123,736 | |
| Galvanizing Services | | | 141,012 | | | | 110,094 | | | | 63,448 | |
| | | $ | 320,193 | | | $ | 260,344 | | | $ | 187,184 | |
| Segment Operating income (a): | | | | | | | | | | | | |
| Electrical and Industrial Products | | $ | 29,158 | | | $ | 21,301 | | | $ | 11,357 | |
| Galvanizing Services | | | 35,087 | | | | 31,945 | | | | 12,676 | |
| Total Segment Operating Income | | | 64,245 | | | | 53,246 | | | | 24,033 | |
| | | | | | | | | | | | | |
| General corporate expenses (b) | | | 18,890 | | | | 17,074 | | | | 10,218 | |
| Interest expense | | | 1,495 | | | | 1,496 | | | | 1,689 | |
| Other (income) expense, net (c) | | | 27 | | | | 76 | | | | 95 | |
| | | | 20,412 | | | | 18,646 | | | | 12,002 | |
| Income before income taxes and accounting changes | | $ | 43,833 | | | $ | 34,600 | | | $ | 12,031 | |
| | | | | | | | | | | | | |
| Depreciation and amortization: | | | | | | | | | | | | |
| Electrical and Industrial Products | | $ | 2,375 | | | $ | 1,826 | | | $ | 1,734 | |
| Galvanizing Services | | | 5,004 | | | | 4,001 | | | | 3,295 | |
| Corporate | | | 820 | | | | 988 | | | | 857 | |
| | | $ | 8,199 | | | $ | 6,815 | | | $ | 5,886 | |
| | | | | | | | | | | | | |
| Expenditures for acquisitions, net of cash, and property, plant and equipment: | | | | | | | | | | | | |
| Electrical and Industrial Products | | $ | 4,998 | | | $ | 5,425 | | | $ | 1,395 | |
| Galvanizing Services | | | 4,662 | | | | 17,990 | | | | 2,581 | |
| Corporate | | | 266 | | | | 669 | | | | 2,626 | |
| | | $ | 9,926 | | | $ | 24,084 | | | $ | 6,602 | |
| Total assets: | | | | | | | | | | | | |
| Electrical and Industrial Products | | $ | 114,722 | | | $ | 112,822 | | | $ | 84,266 | |
| Galvanizing Services | | | 72,083 | | | | 81,076 | | | | 50,160 | |
| Corporate | | | 6,514 | | | | 7,010 | | | | 6,600 | |
| | | $ | 193,319 | | | $ | 200,908 | | | $ | 141,026 | |
| | | | | | | | | | | | | |
| Goodwill: | | | | | | | | | | | | |
| Electrical and Industrial Products | | $ | 30,997 | | | $ | 30,997 | | | $ | 30,997 | |
| Galvanizing Services | | | 9,965 | | | | 9,965 | | | | 9,965 | |
| | | $ | 40,962 | | | $ | 40,962 | | | $ | 40,962 | |
AZZ incorporated
NOTES TO CONSOLIDATED FINANCIAL STATEMENTS (Continued)
| | (a) | Segment operating income consists of net sales less cost of sales, specifically identifiable selling, general and administrative expenses, and other income and expense items that are specifically identifiable to a segment. |
| | (b) | General Corporate Expense consists of selling, general and administrative expenses that are not specifically identifiable to a segment. |
| | (c) | Other (income) expense, net includes gains and losses on sale of property, plant and equipment and other (income) expenses not specifically identifiable to a segment. |
| 12. | Commitments and contingencies |
Leases
The Company leases various facilities under non-cancelable operating leases with an initial term in excess of one year. As of February 29, 2008, the future minimum payments required under these operating leases are summarized in the below table. Rental expense for real estate and personal property was approximately $3,132,000, $2,517,000, and $2,211,000 for fiscal years ended 2008, 2007 and 2006, respectively, and includes all short-term as well as long-term rental agreements.
The following summarizes the Company’s operating leases for the next five years and thereafter.
| | | Operating Leases | |
| | | | |
| 2009 | | $ | 2,203 | |
| 2010 | | | 2,579 | |
| 2011 | | | 2,541 | |
| 2012 | | | 2,296 | |
| 2013 | | | 2,070 | |
| Thereafter | | | 13,526 | |
| Total | | $ | 25,215 | |
Commodity pricing
The Company manages its exposures to commodity prices through the use of the following.
In the Electrical and Industrial Products Segment, the Company has exposure to commodity pricing for copper, aluminum, and steel. Because the Electrical and Industrial Products Segment does not commit contractually to minimum volumes, increases in price for these items are normally managed through escalation clauses to the customer’s contracts, although during difficult market conditions these escalation clauses may be difficult to obtain.
In the Galvanizing Services Segment, the Company utilizes contracts with its zinc suppliers that include protective caps to guard against rising commodity prices. The Company also secures firm pricing for natural gas supplies with individual utilities when possible. There are no contracted volume purchase commitments associated with the zinc or natural gas agreements. Management believes these contractual agreements partially offset exposure to commodity price swings.
There are no contracted purchase commitments for any other commodity items including steel, aluminum, natural gas, copper, zinc or any other commodity.
AZZ incorporated
NOTES TO CONSOLIDATED FINANCIAL STATEMENTS (Continued)
Other
At February 29, 2008, the Company had outstanding letters of credit in the amount of $10.5 million. These letters of credit are issued to a portion of the Company’s customers to cover any potential warranty costs that the customer might incur and in lieu of performance and bid bonds. In addition, as of February 29, 2008, a warranty reserve in the amount of $1.7 million has been established to offset any future warranty claims.
The Company has been named as a defendant in certain lawsuits in the normal course in business. It is the policy of management to disclose the amount or range of reasonably possible losses in excess of recorded amounts. In the opinion of management, after consulting with legal counsel, the liabilities, if any, resulting from these matters should not have a material effect on our financial position or results of operations.
| 13. | Quarterly financial information, unaudited (in thousands, except per share amounts) |
| | | Quarter ended | |
| | | May 31, 2007 | | | August 31, 2007 | | | November 30, 2007 | | | February 29, 2008 | |
| 2008 | | | | | | | | | | | | |
| Net sales | | $ | 75,377 | | | $ | 81,606 | | | $ | 86,593 | | | $ | 76,617 | |
| Gross profit | | | 19,169 | | | | 21,241 | | | | 20,224 | | | | 19,908 | |
| Net income | | | 4,146 | | | | 8,122 | | | | 8,092 | | | | 7,328 | |
| Basic earnings per common share | | | .35 | | | | .67 | | | | .67 | | | | .60 | |
| Diluted earnings per common share | | | .34 | | | | .66 | | | | .66 | | | | .60 | |
| | | | |
| | | Quarter ended | |
| | | May 31, 2006 | | | August 31, 2006 | | | November 30, 2006 | | | February 28, 2007 | |
| 2007 | | | | | | | | | | | | |
| Net sales | | $ | 52,453 | | | $ | 62,882 | | | $ | 65,361 | | | $ | 79,648 | |
| Gross profit | | | 13,745 | | | | 17,031 | | | | 17,115 | | | | 19,042 | |
| Net income | | | 4,126 | | | | 5,279 | | | | 5,245 | | | | 6,954 | |
| Basic earnings per common share | | | .36 | | | | .46 | | | | .45 | | | | .60 | |
| Diluted earnings per common share | | | .35 | | | | .45 | | | | .44 | | | | .58 | |
14. Acquisitions
On October 31, 2006, AZZ incorporated (the “Company”), Arbor-Crowley, Inc., a wholly-owned subsidiary of the Company (“Subsidiary”), Witt Industries, Inc. (“Witt”) and Marcy R. Wydman (“Wydman”), as the sole shareholder of Witt, entered into an Asset Purchase Agreement (the “Purchase Agreement”) pursuant to which Subsidiary purchased all, or substantially all of the assets of Witt relating to Witt’s galvanizing division (the “Asset Purchase”). The purchase price of the transaction was $13,400,000 in cash. The Company used its existing bank line of credit to finance this transaction. The purchased assets included three galvanizing plants, one plant located in Ohio and two plants located in Indiana. Witt’s operating results are included in the financial statements from November 1, 2006. The estimated fair values of the assets acquired and liabilities assumed include $6.6 million of currents assets, consisting of inventory, and accounts receivable, $6.1 million of property, plant and equipment, $.9 million in identified intangible and other assets, and assumed liabilities of $.2 million. The identified intangible assets consist of customer related intangibles with a weighted average useful life of 8.7 years. Pro forma results of operations assuming the acquisition occurred on March 1, 2006 are not presented as they are not significantly different than the Company’s historical results of operations.
AZZ incorporated
NOTES TO CONSOLIDATED FINANCIAL STATEMENTS (Continued)
In connection with the real property located in Muncie, Indiana, the Company, Subsidiary, Witt Galvanizing-Muncie, Inc. and Wydman entered into an Environmental Remediation and Assumption of Liability Agreement pursuant to which Wydman assumed certain potential environmental liabilities with respect to the Site and agreed to perform voluntary remediation of pre-existing pollution conditions at the Site. Remediation of the preexisiting environmental conditions are the responsibility and obligation of the Seller.
15. Subsequent Events
On March 31, 2008, AZZ incorporated entered into an Asset Purchase Agreement to acquire substantially all of the assets AAA Industries, Inc. The purchase price of the transaction was approximately $83,000,000, subject to adjustment as more fully described in the Asset Purchase Agreement filed with the SEC on Form 8-K on April 1, 2008. The purchased assets included six galvanizing plants (three plants located in Illinois, one plant located in Indiana, one plant located in Minnesota and one plant located in Oklahoma) and related equipment and supplies.
The purchase price will be allocated to the underlying assets and liabilities based on their estimated fair values. The resulting goodwill from this transaction is currently estimated at $16 million. The goodwill estimate is preliminary, pending the results of appraisals, and audit, and further financial analysis. For the year ended December 31, 2007, AAA Industries, Inc. had sales of approximately $55 million.
Additionally, on March 31, 2008, the Company entered into a Note Purchase Agreement pursuant to which the Company issued $100,000,000 aggregate principal amount of its 6.24% unsecured Senior Notes due March 31, 2018 through a private placement (the "Note Offering"). Pursuant to the Note Purchase Agreement, the Company’s payment obligations with respect to the Senior Notes may be accelerated upon any Event of Default, as defined in the Note Purchase Agreement.
In connection with the Note Offering the Company entered into the Second Amendment to Second Amended and Restated Credit Agreement, (the “Second Amendment”) with Bank of America, N. A. (“Bank of America”), which amended the Second Amended and Restated Credit Agreement by and among the Company, Bank of America and certain other lenders (including Bank of America) dated as of May 25, 2006 (the “Credit Agreement”). The Second Amendment contains the consent of Bank of America to the Note Offering and amended the Credit Agreement to provide that the Note Offering will not constitute a default under the Credit Agreement.
The Senior Notes provide for various financial covenants of a) Minimum Consolidated Net Worth - Maintain on a consolidated basis net worth equal to at least the sum of $116.9 million plus 50% of future net income; b) Maximum Ratio of Consolidated Indebtedness to Consolidated EBITDA – Maintain a ratio of indebtedness to EBITDA (as defined in Note Purchase Agreement) not to exceed 3.25:1.00; c) Fixed Charge Coverage Ratio – Maintains on a consolidated basis a Fixed Charge Coverage Ratio of at least 2.0:1.0; d) Priority Indebtedness – The Company will not at any time permit aggregate amount of all Priority Indebtedness to exceed 10% of Consolidated Net Worth. In conjunction with Note Offering the Credit Agreement with Bank of America was amended to reflect the same debt covenants as presented above.
AZZ incorporated
Valuation and Qualifying Accounts and Reserves
(in thousands)
| | | | | | Year Ended | | | | |
| | | February 29, 2008 | | | February 28, 2007 | | | February 28, 2006 (a) | |
| Allowance for Doubtful Accounts | | | | | | | | | |
| | | | | | | | | | |
| Balance at Beginning of year | | $ | 670 | | | $ | 400 | | | $ | 1,362 | |
| Additions charged or credited to income | | | 111 | | | | 451 | | | | (596 | ) |
| Balances written off, net of recoveries | | | (151 | ) | | | (181 | ) | | | (366 | ) |
| Balance at end of year | | $ | 630 | | | $ | 670 | | | $ | 400 | |
| | (a) | In fiscal 2004 and 2005, a reserve in the amount of $888,000 was created for a preferential payment claim from the Enron Bankruptcy. This amount was included in the total reserve of $1,362,000 at the end of fiscal 2005. In fiscal 2006, the claim was settled for $300,000 and the reserve was adjusted. |
Index to Exhibits as Required By Item 601 of Regulation S-K.
| 3(1) | Articles of Incorporation, and all amendments thereto (incorporated by reference to the Annual Report on Form 10-K filed by Registrant for the fiscal year ended February 28, 1981). |
| 3(2) | Articles of Amendment to the Article of Incorporation of the Registrant dated June 30, 1988 (incorporated by reference to the Annual Report on Form 10-K filed by Registrant for the fiscal year ended February 29, 2000). |
| 3(3) | Articles of Amendment to the Articles of Incorporation of the Registrant dated October 25, 1999 (incorporated by reference to the Annual Report on Form 10-K filed by Registrant for the fiscal year ended February 29, 2000). |
| 3(4) | Articles of Amendment to the Articles of Incorporation dated July 17, 2000 (incorporated by reference to the Quarterly Report Form 10-Q filed by Registrant for the quarter ended August 31, 2000). |
| 3(5) | Amended and Restated Bylaws of AZZ incorporated (incorporated by reference to the Exhibit 3(1) to the Current Report Form 8-K filed by the Registrant on November 27, 2007). |
| 4 | Form of Stock Certificate for the Company’s $1.00 par value Common Stock (incorporated by reference to the Quarterly Report Form 10-Q filed by Registrant August 31, 2000). |
| 10(1) | Second Amended and Restated Credit Agreement with Bank of America, N.A., dated May 25, 2006 (incorporated by reference to Exhibit 10(1) of the Form 8-K filed by the Registrant on May 26, 2006). |
| 10(2) | First Amendment to Second Amended and Restated Credit Agreement with Bank of America, N.A., dated February 28, 2007 (incorporated by reference to Exhibit 10(1) of the Form 8-K filed by the Registrant on March 1, 2007). |
| 11 | Computation of Per Share Earnings (see Note 8 to the Consolidated Financial Statements). Filed Herewith. |
| 14 | Code of Ethics. The Company’s Code of Business Conduct and Ethics may be accessed via the Company’s Website at www.azz.com. |
| 21 | |
| 23.1 | |
| 23.2 | |
| 31.1 | |
| 31.2 | |
| 32.1 | Chief Executive Officer Certificate pursuant to 18 U.S.C. Section 1350, as adopted pursuant to Section 906 of the Sarbanes-Oxley Act of 2002 dated May 9, 2008. Filed Herewith. |
| 32.2 | Chief Financial Officer Certificate pursuant to 18 U.S.C. Section 1350, as adopted pursuant to Section 906 of the Sarbanes-Oxley Act of 2002 dated May 9, 2008. Filed Herewith. |


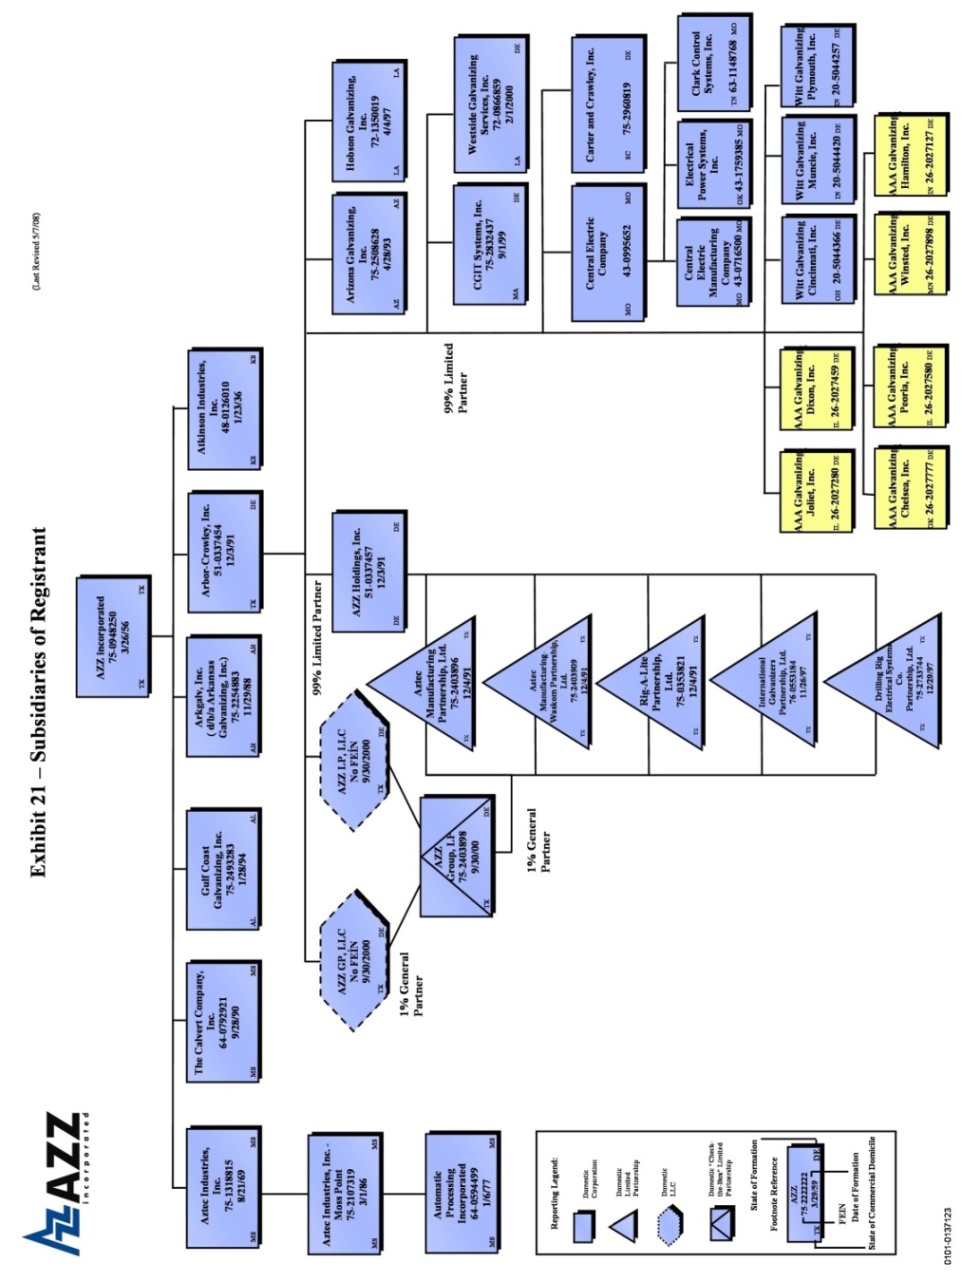