UNITED STATES
SECURITIES AND EXCHANGE COMMISSION
Washington, D.C. 20549
FORM N-CSR
CERTIFIED SHAREHOLDER REPORT OF REGISTERED
MANAGEMENT INVESTMENT COMPANIES
Investment Company Act file number 811- 07584
Rydex Series Funds
(Exact name of registrant as specified in charter)
702 King Farm Boulevard, Suite 200 Rockville, Maryland 20850
(Address of principal executive offices) (Zip code)
Amy J. Lee
Rydex Series Funds
702 King Farm Boulevard, Suite 200
Rockville, Maryland 20850
(Name and address of agent for service)
Registrant's telephone number, including area code: 1-301-296-5100
Date of fiscal year end: December 31
Date of reporting period: December 31, 2017
Form N-CSR is to be used by management investment companies to file reports with the Commission not later than 10 days after the transmission to stockholders of any report that is required to be transmitted to stockholders under Rule 30e-1 under the Investment Company Act of 1940 (17 CFR 270.30e-1). The Commission may use the information provided on Form N-CSR in its regulatory, disclosure review, inspection, and policymaking roles.
A registrant is required to disclose the information specified by Form N-CSR, and the Commission will make this information public. A registrant is not required to respond to the collection of information contained in Form N-CSR unless the Form displays a currently valid Office of Management and Budget ("OMB") control number. Please direct comments concerning the accuracy of the information collection burden estimate and any suggestions for reducing the burden to Secretary, Securities and Exchange Commission, 450 Fifth Street, NW, Washington, DC 20549-0609. The OMB has reviewed this collection of information under the clearance requirements of 44 U.S.C. § 3507.
Item 1. Reports to Stockholders.
The registrant’s annual report transmitted to shareholders pursuant to Rule 30e-1 under the Investment Company Act of 1940, as amended (the “Investment Company Act”), is as follows:
12.31.2017
Guggenheim Funds Annual Report
| Guggenheim Alternative Fund |
| Guggenheim Multi-Hedge Strategies Fund | | |
| Rydex Commodities Fund |
| Rydex Commodities Strategy Fund | | |
| GuggenheimInvestments.com | RDXSGIALT-ANN-1217x1218 |

| DEAR SHAREHOLDER | 2 |
| ECONOMIC AND MARKET OVERVIEW | 4 |
| ABOUT SHAREHOLDERS’ FUND EXPENSES | 6 |
| ALTERNATIVE FUND | |
| MULTI-HEDGE STRATEGIES FUND | 9 |
| COMMODITIES FUND | |
| COMMODITIES STRATEGY FUND | 45 |
| NOTES TO CONSOLIDATED FINANCIAL STATEMENTS | 59 |
| REPORT OF INDEPENDENT REGISTERED PUBLIC ACCOUNTING FIRM | 84 |
| OTHER INFORMATION | 86 |
| INFORMATION ON BOARD OF TRUSTEES AND OFFICERS | 88 |
| GUGGENHEIM INVESTMENTS PRIVACY POLICIES | 93 |
| | THE GUGGENHEIM FUNDS ANNUAL REPORT | 1 |
Dear Shareholder:
Security Investors, LLC (the “Investment Adviser”) is pleased to present the annual shareholder report for two alternative strategy funds that are part of the Rydex Series Funds (each a “Fund”). This report covers performance of the Funds for the annual period ended December 31, 2017.
The Investment Adviser is a part of Guggenheim Investments, which represents the investment management businesses of Guggenheim Partners, LLC (“Guggenheim”), a global, diversified financial services firm.
Guggenheim Funds Distributors, LLC is the distributor of the Funds. Guggenheim Funds Distributors, LLC is affiliated with Guggenheim and the Investment Adviser.
We encourage you to read the Economic and Market Overview section of the report, which follows this letter, and then the Performance Report and Fund Profile for each Fund.
We are committed to providing innovative investment solutions and appreciate the trust you place in us.
Sincerely,
Security Investors, LLC
January 31, 2018
Read a prospectus and summary prospectus (if available) carefully before investing. It contains the investment objectives, risks, charges, expenses and other information, which should be considered carefully before investing. Obtain a prospectus and summary prospectus (if available) at guggenheiminvestments.com or call 800.820.0888.
This material is not intended as a recommendation or as investment advice of any kind, including in connection with rollovers, transfers, and distributions. Such material is not provided in a fiduciary capacity, may not be relied upon for or in connection with the making of investment decisions, and does not constitute a solicitation of an offer to buy or sell securities. All content has been provided for informational or educational purposes only and is not intended to be and should not be construed as legal or tax advice and/or a legal opinion. Always consult a financial, tax and/or legal professional regarding your specific situation.
The Multi-Hedge Strategies Fund is subject to a number of risks and may not be suitable for all investors. ● The Fund’s use of derivatives such as futures, options and swap agreements may expose the Fund to additional risks that it would not be subject to if it invested directly in the securities underlying those derivatives. ● The more the Fund invests in leveraged instruments, the more the leverage will magnify any gains or losses on those investments. ● The Fund’s use of short selling involves increased risks and costs. The Fund risks paying more for a security than it received from its sale. ● The Fund’s investments in high yield securities and unrated securities of similar credit quality (“junk bonds”) may be subject to greater levels of interest rate, credit and liquidity risk than funds that do not invest in such securities. ● The Fund’s fixed income investments will change in value in response to interest rate changes and other factors. ● The Fund’s exposure to the commodity and currency markets may subject the Fund to greater volatility as commodity- and currency-linked derivative investments may be affected by changes in overall market movements, commodity index volatility, changes in interest rates or factors affecting a particular industry, commodity or currency—such as droughts, floods, weather,
| 2 | THE GUGGENHEIM FUNDS ANNUAL REPORT | |
livestock disease, embargoes, tariffs and international economic, political and regulatory developments. The Fund may also incur transaction costs with the conversion between various currencies. ● The Fund’s exposure to foreign currencies subjects the fund to the risk that those currencies will decline in value relative to the U.S. dollar, or, in the case of short positions, that the U.S. dollar will decline in value relative to the currency being hedged. ● These risks may cause the Fund to experience higher losses and/or volatility than a fund that does not invest in derivatives, use leverage or short sales or have exposure to high yield/fixed income securities, foreign currencies and/or securities. ● This Fund is considered non-diversified and can invest a greater portion of its assets in securities of individual issuers than a diversified fund. As a result, changes in the market value of a single security could cause greater fluctuations in the value of Fund shares than would occur in a more diversified fund. ● Please read the prospectus for more detailed information regarding these and other risks.
The Commodities Strategy Fund may not be suitable for all investors. ● The Fund’s exposure to the commodity markets may subject the fund to greater volatility as commodity-linked investments may be affected by changes in overall market movements, commodity index volatility, changes in interest rates or factors affecting a particular industry or commodity—such as droughts, floods, weather, embargos, tariffs and international economic, political and regulatory developments. ● To the extent that the Fund’s investments are concentrated in energy-related commodities, the Fund is subject to the risk that this sector will underperform the market as a whole. ● The Fund’s use of derivatives, such as futures, options, structured notes and swap agreements, may expose the fund to additional risks that it would not be subject to if it invested directly in the securities or investments underlying those derivatives. ● The more the Fund invests in leveraged instruments, the more the leverage will magnify any gains or losses on those investments. ● The Fund is subject to tracking error risks, which may cause the Fund’s performance not to match that of or be lower than the Fund’s underlying benchmark. ● The Fund’s investments in other investment companies subjects the Fund to those risks affecting the investment company, including the possibility that the value of the underlying securities held by the investment company could decrease. Moreover, the Fund will incur its pro rata share of the expenses of the underlying investment companies’ expenses. ●This Fund is considered non-diversified and can invest a greater portion of its assets in securities of individual issuers than a diversified fund. As a result, changes in the market value of a single security could cause greater fluctuations in the value of Fund shares than would occur in a more diversified fund. ● See the prospectus for more information on these and additional risks.
| | THE GUGGENHEIM FUNDS ANNUAL REPORT | 3 |
| ECONOMIC AND MARKET OVERVIEW (Unaudited) | December 31, 2017 |
The market story at the end of 2017 was one of positive economic momentum. Economic activity finished 2017 strongly, led by an acceleration in household spending, which was bolstered by consumer confidence near cyclical highs and healthier household balance sheets. Job growth and rebuilding activity resumed following the several hurricanes that hit the U.S., and elevated business optimism and tax changes could boost business capital expenditures plans in the coming quarters. The economy could also benefit from favorable financial conditions both in the U.S. and abroad, which could keep economic growth well above 2% in 2018.
While job growth continues at an unsustainable pace, wage growth has still been relatively unresponsive to declines in the unemployment rate. This could mean that the natural rate of unemployment is lower than the U.S. Federal Reserve’s (the “Fed”) current estimate of 4.6%, and it could also mean that there is still labor market slack left in the form of people not currently participating in the labor force. Even so, the tighter labor market and increasing worker shortages will put upward pressure on wage growth, which has been held back by meager productivity gains.
Core inflation has been below the Fed’s 2% target for some time now, which should continue for the next few months. However, by the middle of 2018 core inflation should approach the Fed’s target due to an accelerating economy, reduced labor market slack, and favorable base effects. Inflation closer to target and continued declines in the unemployment rate will give the Fed confidence to press on with tightening. Moreover, financial conditions remain highly accommodative, and fiscal stimulus will give the economy an additional boost, giving the Fed further room to raise rates. Thus, even as the fourth quarter of 2017 saw the commencement of the Fed’s balance sheet roll-off in October and another rate hike in December, we expect the Fed to move to increasingly tighter policy.
For the 12 months ended December 31, 2017, the Standard & Poor’s 500® (“S&P 500”) Index* returned 21.83%. The MSCI Europe-Australasia-Far East (“EAFE”) Index* returned 25.03%. The return of the MSCI Emerging Markets Index* was 37.28%.
In the bond market, the Bloomberg Barclays U.S. Aggregate Bond Index* posted a 3.54% return for the period, while the Bloomberg Barclays U.S. Corporate High Yield Index* returned 7.50%. The return of the ICE Bank of America (“BofA”) Merrill Lynch 3-Month U.S. Treasury Bill Index* was 0.86% for the 12-month period.
The opinions and forecasts expressed may not actually come to pass. This information is subject to change at any time, based on market and other conditions, and should not be construed as a recommendation of any specific security or strategy.
| 4 | THE GUGGENHEIM FUNDS ANNUAL REPORT | |
| ECONOMIC AND MARKET OVERVIEW (Unaudited)(concluded) | December 31, 2017 |
*Index Definitions:
The following indices are referenced throughout this report. Indices are unmanaged and not available for direct investment. Index performance does not reflect transaction costs, fees, or expenses.
Bloomberg Barclays U.S. Aggregate Bond Index is a broad-based flagship benchmark that measures the investment grade, U.S. dollar-denominated, fixed-rate taxable bond market, including U.S. Treasuries, government-related and corporate securities, mortgage-backed securities or “MBS” (agency fixed-rate and hybrid adjustable-rate mortgage, or “ARM”, pass-throughs), asset-backed securities (“ABS”), and commercial mortgage-backed securities (“CMBS”) (agency and non-agency).
Bloomberg Barclays U.S. Corporate High Yield Index measures the U.S. dollar-denominated, high yield, fixed-rate corporate bond market. Securities are classified as high yield if the middle rating of Moody’s, Fitch, and S&P is Ba1/BB +/BB + or below.
ICE BofA Merrill Lynch 3-Month U.S. Treasury Bill Index is an unmanaged market Index of U.S. Treasury securities maturing in 90 days that assumes reinvestment of all income.
MSCI EAFE Index is a free float-adjusted market capitalization index that is designed to measure the equity market performance of developed markets, excluding the U.S. & Canada.
MSCI Emerging Markets Index is a free float-adjusted market capitalization weighted index that is designed to measure equity market performance in the global emerging markets.
Standard and Poor’s 500 Index (S&P 500®) is a broad-based index, the performance of which is based on the performance of 500 widely held common stocks chosen for market size, liquidity, and industry group representation.
S&P Goldman Sachs Commodity Index (S&P GSCI®), a benchmark for investment performance in the commodity markets, measures investable commodity price movements and inflation in the world economy. The index is calculated primarily on a world production weighted basis and is comprised of the principal physical commodities that are the subject of active, liquid futures markets.
HFRX Global Hedge Fund Index is designed to be representative of the overall composition of the hedge fund universe. It is comprised of all eligible hedge fund strategies, including, but not limited to, convertible arbitrage, distressed securities, equity hedge, equity market neutral, event driven, macro, merger arbitrage and relative-value arbitrage. The strategies are asset weighted based on the distribution of assets in the hedge fund industry.
| | THE GUGGENHEIM FUNDS ANNUAL REPORT | 5 |
| ABOUT SHAREHOLDERS’ FUND EXPENSES (Unaudited) |
All mutual funds have operating expenses, and it is important for our shareholders to understand the impact of costs on their investments. Shareholders of a fund incur two types of costs: (i) transaction costs, including sales charges (loads) on purchase payments, reinvested dividends, other distributions, and exchange fees, and (ii) ongoing costs, including management fees, administrative services, and shareholder reports, among others. These ongoing costs, or operating expenses, are deducted from a fund’s gross income and reduce the investment return of the fund.
A fund’s expenses are expressed as a percentage of its average net assets, which is known as the expense ratio. The following examples are intended to help investors understand the ongoing costs (in dollars) of investing in a fund and to compare these costs with the ongoing costs of investing in other mutual funds.
The examples are based on an investment of $1,000 made at the beginning of the period and held for the entire six-month period beginning June 30, 2017 and ending December 31, 2017.
The following tables illustrate the Funds’ costs in two ways:
Table 1. Based on actual Fund return: This section helps investors estimate the actual expenses paid over the period. The “Ending Account Value” shown is derived from the Fund’s actual return, and the fifth column shows the dollar amount that would have been paid by an investor who started with $1,000 in the Fund. Investors may use the information here, together with the amount invested, to estimate the expenses paid over the period. Simply divide the Fund’s account value by $1,000 (for example, an $8,600 account value divided by $1,000 = 8.6), then multiply the result by the number provided under the heading “Expenses Paid During Period.”
Table 2. Based on hypothetical 5% return: This section is intended to help investors compare a Fund’s cost with those of other mutual funds. The table provides information about hypothetical account values and hypothetical expenses based on the Fund’s actual expense ratio and an assumed rate of return of 5% per year before expenses, which is not the Fund’s actual return. The hypothetical account values and expenses may not be used to estimate the actual ending account balance or expenses paid during the period. The example is useful in making comparisons because the U.S. Securities and Exchange Commission (the “SEC”) requires all mutual funds to calculate expenses based on the 5% return. Investors can assess a Fund’s costs by comparing this hypothetical example with the hypothetical examples that appear in shareholder reports of other funds.
The calculations illustrated above assume no shares were bought or sold during the period. Actual costs may have been higher or lower, depending on the amount of investment and the timing of any purchases or redemptions.
| 6 | THE GUGGENHEIM FUNDS ANNUAL REPORT | |
| ABOUT SHAREHOLDERS’ FUND EXPENSES (Unaudited)(continued) |
Please note that the expenses shown in the table are meant to highlight your ongoing costs only and do not reflect any transactional costs, such as sales charges (loads) on purchase payments, and contingent deferred sales charges (“CDSC”) on redemptions, if any. Therefore, the second table is useful in comparing ongoing costs only, and will not help you determine the relative total costs of owning different funds. In addition, if these transactional costs were included, your costs would have been higher.
More information about the Funds’ expenses, including annual expense ratios for periods up to five years (subject to the Fund’s inception date), can be found in the Financial Highlights section of this report. For additional information on operating expenses and other shareholder costs, please refer to the appropriate Fund prospectus.
| | THE GUGGENHEIM FUNDS ANNUAL REPORT | 7 |
| ABOUT SHAREHOLDERS’ FUND EXPENSES (Unaudited)(concluded) |
| | Expense
Ratio1 | Fund
Return | Beginning
Account Value
June 30,
2017 | Ending
Account Value
December 31,
2017 | Expenses
Paid During
Period2 |
| Table 1. Based on actual Fund return3 |
| Multi-Hedge Strategies Fund |
| A-Class | 1.95% | 3.36% | $ 1,000.00 | $ 1,033.60 | $ 10.00 |
| C-Class | 2.69% | 2.95% | 1,000.00 | 1,029.50 | 13.76 |
| P-Class | 1.95% | 3.36% | 1,000.00 | 1,033.60 | 10.00 |
| Institutional Class | 1.67% | 3.50% | 1,000.00 | 1,035.00 | 8.57 |
| Commodities Strategy Fund |
| A-Class | 1.62% | 16.76% | 1,000.00 | 1,167.60 | 8.85 |
| C-Class | 2.35% | 16.31% | 1,000.00 | 1,163.10 | 12.81 |
| H-Class | 1.64% | 16.77% | 1,000.00 | 1,167.70 | 8.96 |
| |
| Table 2. Based on hypothetical 5% return (before expenses) | | | |
| Multi-Hedge Strategies Fund | |
| A-Class | 1.95% | 5.00% | $ 1,000.00 | $ 1,015.38 | $ 9.91 |
| C-Class | 2.69% | 5.00% | 1,000.00 | 1,011.64 | 13.64 |
| P-Class | 1.95% | 5.00% | 1,000.00 | 1,015.38 | 9.91 |
| Institutional Class | 1.67% | 5.00% | 1,000.00 | 1,016.79 | 8.49 |
| Commodities Strategy Fund | |
| A-Class | 1.62% | 5.00% | 1,000.00 | 1,017.04 | 8.24 |
| C-Class | 2.35% | 5.00% | 1,000.00 | 1,013.36 | 11.93 |
| H-Class | 1.64% | 5.00% | 1,000.00 | 1,016.94 | 8.34 |
| 1 | | Annualized and excludes expenses of the underlying funds in which the Funds invest. This ratio represents net expenses which include interest and dividend expenses related to securities sold short. Excluding short interest and dividend expenses, the net expense ratio of the Multi-Hedge Strategies Fund would be 1.42%, 2.17%, 1.42% and 1.17% for the A-Class, C-Class, P-Class and Institutional Class, respectively. |
| 2 | | Expenses are equal to the Fund's annualized expense ratio, net of any applicable fee waivers, multiplied by the average account value over the period, multiplied by 184/365 (to reflect the one-half year period). |
| 3 | | Actual cumulative return at net asset value for the period June 30, 2017 to December 31, 2017. |
| 8 | THE GUGGENHEIM FUNDS ANNUAL REPORT | |
| PERFORMANCE REPORT AND FUND PROFILE (Unaudited) | December 31, 2017 |
MULTI-HEDGE STRATEGIES FUND
OBJECTIVE: Seeks to provide long-term capital appreciation with less risk than traditional equity funds.
2017 was the eighth full fiscal year of performance since the Fund’s objective was changed from hedge fund replication to capital appreciation. The Fund seeks capital appreciation with low correlation to equity and fixed income markets, while doing so with low risk*–typically in the 5% to 8% range.
For the year, the Institutional Class shares of the Fund produced a return of 3.76% with annualized risk* of 2.7%. The Fund still succeeded in maintaining low correlation with stock and bond indices, as its correlation with the S&P 500 Index and the Bloomberg Barclays U.S. Aggregate Bond Index came in at 62% and -27%, respectively.
While no longer a hedge fund replication product, the Fund still maintains the HFRX Global Hedge Fund Index as one of its benchmarks. This benchmark returned 5.99% for the year. In contrast to the diversification benefits provided by the Multi-Hedge Strategies Fund, the HFRX Global Hedge Fund Index had a correlation of 68% with the S&P 500 in 2017.
Since the Fund changed its investment objective (starting August 1st, 2009) it has outperformed the HFRX Global Hedge Fund Index by more than 10% (roughly 1.0% annualized), net of fees, while doing so with lower correlation to equity markets.
Four of the five hedge fund strategies used within the Fund contributed positively to gross Fund returns in 2017. The final strategy did not receive an allocation throughout the year, so it did not contribute. During the year, derivatives were used within the Global Macro strategy and for the equity market hedge strategies. Overall the use of derivatives contributed positively to Fund performance for the year.
The Equity Market Neutral (MNRE) strategies contributed 0.39% to gross Fund returns. The Market Neutral models detracted -0.14% while the Closed-end Fund Arbitrage model contributed 0.53%.
The Fixed Income strategies did not contribute during 2017; both the U.S. Treasury Flattener and the High Yield Credit Spread strategies are tactical and neither was attractive throughout the year.
The Global Macro strategies contributed 1.45%. Within Global Macro, the Managed Futures models contributed 0.74%. The Volatility Arbitrage model contributed 0.31%.
The Merger Arbitrage (MRGR) strategy contributed 1.51%.
The Long/Short Equity (SMQLS) strategies contributed 2.60% to gross Fund returns. Long/Short Equity strategies contributed 2.62%, while the Tactical Size model detracted -0.01% in 2017.
| * | | Risk is measured by standard deviation, a statistic of the historical volatility of an investment, usually computed using the most recent 36-monthly returns and then annualized. More generally, it is a measure of the extent to which numbers are spread around their average. The higher the number, the more volatility is to be expected. |
| | THE GUGGENHEIM FUNDS ANNUAL REPORT | 9 |
| PERFORMANCE REPORT AND FUND PROFILE (Unaudited)(continued) | December 31, 2017 |
For the first eight months of the year, an equity market hedge was used explicitly to bring the Fund’s forecast risk characteristics in-line with its objectives, which resulted in a -0.69% contribution to gross Fund returns.
Strategy funds were utilized within the Fund to achieve higher yields than what would otherwise be achieved through overnight repurchase agreements or short term investments.
Performance displayed represents past performance which is no guarantee of future results.
Consolidated Holdings Diversification (Market Exposure as % of Net Assets)
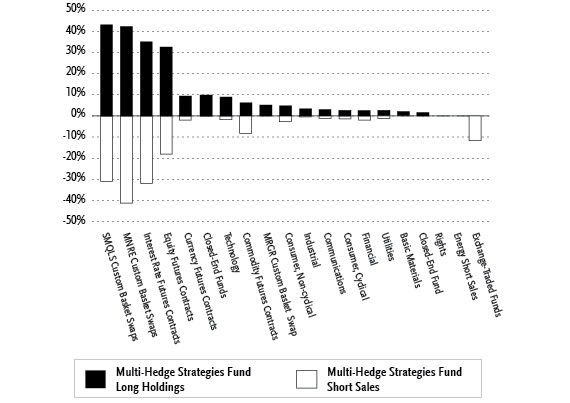
“Consolidated Holdings Diversification (Market Exposure as % of Net Assets)” excludes any temporary cash investments or investments in Guggenheim Strategy Funds Trust mutual funds. Investments in those Funds do not provide “market exposure” to meet the Fund’s investment objective, but will significantly increase the portfolio’s exposure to certain other asset categories (and their associated risks), which may cause the Fund to deviate from its principal investment strategy, including: (i) high yield, high risk debt securities rated below the top four long-term rating categories by a nationally recognized statistical rating organization (also known as “junk bonds”); (ii) securities issued by the U.S. government or its agencies and instrumentalities; (iii) CLOs and similar investments; and (iv) other short-term fixed income securities.
| 10 | THE GUGGENHEIM FUNDS ANNUAL REPORT | |
| PERFORMANCE REPORT AND FUND PROFILE (Unaudited)(continued) | December 31, 2017 |
| Inception Dates: |
| A-Class | September 19, 2005 |
| C-Class | September 19, 2005 |
| P-Class | September 19, 2005 |
| Institutional Class | May 3, 2010 |
| Ten Largest Holdings (% of Total Net Assets) |
| Guggenheim Strategy Fund III | 13.6% |
| Guggenheim Strategy Fund II | 12.8% |
| NXP Semiconductor N.V. | 3.1% |
| General Cable Corp. | 1.3% |
| Sigma Designs, Inc. | 1.3% |
| Silver Spring Networks, Inc. | 1.3% |
| Cavium, Inc. | 1.3% |
| Time Warner, Inc. | 1.2% |
| Clifton Bancorp, Inc. | 1.2% |
| Dynegy, Inc. | 1.1% |
| Top Ten Total | 38.2% |
| | |
| “Ten Largest Holdings” excludes any temporary cash or derivative investments. |
| | THE GUGGENHEIM FUNDS ANNUAL REPORT | 11 |
| PERFORMANCE REPORT AND FUND PROFILE (Unaudited)(continued) | December 31, 2017 |
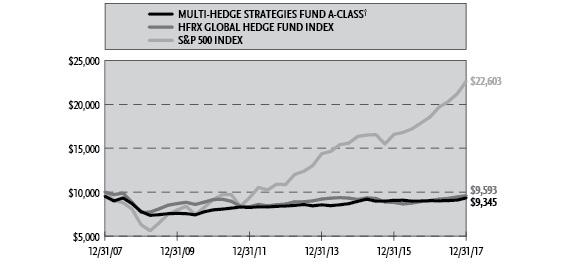
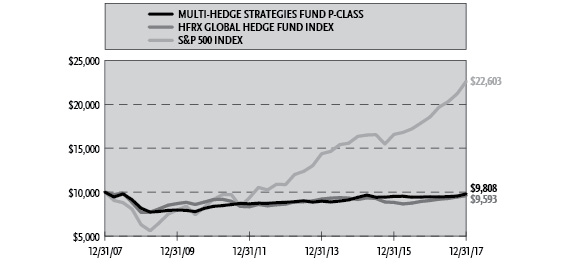
Cumulative Fund Performance*
| 12 | THE GUGGENHEIM FUNDS ANNUAL REPORT | |
| PERFORMANCE REPORT AND FUND PROFILE (Unaudited)(concluded) | December 31, 2017 |
Average Annual Returns*
Periods Ended December 31, 2017
| | 1 Year | 5 Year | 10 Year |
| A-Class Shares | 3.49% | 2.09% | (0.19%) |
| A-Class Shares with sales charge† | (1.42%) | 1.10% | (0.67%) |
| C-Class Shares | 2.72% | 1.33% | (0.94%) |
| C-Class Shares with CDSC‡ | 1.72% | 1.33% | (0.94%) |
| P-Class Shares | 3.49% | 2.09% | (0.19%) |
| S&P 500 Index | 21.83% | 15.79% | 8.50% |
| HFRX Global Hedge Fund Index | 5.99% | 2.12% | (0.41%) |
| | | | |
| | 1 Year | 5 Year | Since Inception
(05/03/10) |
| Institutional Class Shares | 3.76% | 2.35% | 3.00% |
| S&P 500 Index | 21.83% | 15.79% | 13.37% |
| HFRX Global Hedge Fund Index | 5.99% | 2.12% | 0.97% |
| * | | The performance data above represents past performance that is not predictive of future results. The investment return and principal value of an investment in the Fund will fluctuate so that an investor’s shares, when redeemed, may be worth more or less than their original cost. Returns are historical and include changes in principal and reinvested dividends and capital gains and do not reflect the effect of taxes. The S&P 500 Index and HFRX Global Hedge Fund Index are unmanaged indices and, unlike the Fund, have no management fees or operating expenses to reduce their reported returns. The graphs are based on A-Class shares and P-Class shares only; performance for C-Class and Institutional Class shares will vary due to differences in fee structures. |
| † | | Fund returns are calculated using the maximum sales charge of 4.75%. |
| ‡ | | Fund returns include a CDSC of 1% if redeemed within 12 months of purchase. |
| | THE GUGGENHEIM FUNDS ANNUAL REPORT | 13 |
| CONSOLIDATED SCHEDULE OF INVESTMENTS | December 31, 2017 |
| MULTI-HEDGE STRATEGIES FUND | |
| | | Shares | | | Value | |
| | �� | | | | | |
| COMMON STOCKS† - 29.3% |
| | | | | | | |
| Technology - 8.9% |
| NXP Semiconductor N.V.* | | | 15,457 | | | $ | 1,809,860 | |
| Sigma Designs, Inc.*,14 | | | 112,924 | | | | 784,822 | |
| Silver Spring Networks, Inc.*,14 | | | 47,995 | | | | 779,439 | |
| Cavium, Inc.*,14 | | | 9,275 | | | | 777,523 | |
| Dell Technologies Incorporated Class V — Class V*,14 | | | 5,216 | | | | 423,956 | |
| Xcerra Corp.*,14 | | | 37,417 | | | | 366,313 | |
| IXYS Corp.*,14 | | | 14,817 | | | | 354,867 | |
| Total Technology | | | | | | | 5,296,780 | |
| | | | | | | | | |
| Consumer, Non-cyclical - 4.8% |
| Capella Education Co.14 | | | 8,090 | | | | 626,166 | |
| Almost Family, Inc.* | | | 9,809 | | | | 542,928 | |
| Becton Dickinson and Co. | | | 1,850 | | | | 395,915 | |
| Akorn, Inc.*,14 | | | 11,540 | | | | 371,934 | |
| Entellus Medical, Inc.*,1 | | | 14,315 | | | | 349,143 | |
| MoneyGram International, Inc.*,14 | | | 15,763 | | | | 207,757 | |
| Bob Evans Farms, Inc.14 | | | 2,400 | | | | 189,168 | |
| NxStage Medical, Inc.*,14 | | | 7,196 | | | | 174,359 | |
| Total Consumer, Non-cyclical | | | | | | | 2,857,370 | |
| | | | | | | | | |
| Industrial - 3.3% |
| General Cable Corp.14 | | | 26,615 | | | | 787,804 | |
| Orbital ATK, Inc.14 | | | 4,388 | | | | 577,022 | |
| Rockwell Collins, Inc.14 | | | 2,351 | | | | 318,843 | |
| Sparton Corp.*,14 | | | 7,820 | | | | 180,329 | |
| Colfax Corp.* | | | 2,159 | | | | 85,539 | |
| Total Industrial | | | | | | | 1,949,537 | |
| | | | | | | | | |
| Communications - 3.0% |
| Time Warner, Inc.14 | | | 8,085 | | | | 739,535 | |
| Scripps Networks Interactive, Inc. — Class A14 | | | 3,714 | | | | 317,101 | |
| Hawaiian Telcom Holdco, Inc.*,14 | | | 9,139 | | | | 282,030 | |
| Tribune Media Co. — Class A14 | | | 4,621 | | | | 196,254 | |
| General Communication, Inc. — Class A*,14 | | | 4,056 | | | | 158,265 | |
| Symantec Corp. | | | 3,075 | | | | 86,285 | |
| Total Communications | | | | | | | 1,779,470 | |
| | | | | | | | | |
| Consumer, Cyclical - 2.6% |
| HSN, Inc.14 | | | 15,428 | | | | 622,520 | |
| Pinnacle Entertainment, Inc.*,14 | | | 16,942 | | | | 554,511 | |
| Buffalo Wild Wings, Inc.*,14 | | | 2,238 | | | | 349,911 | |
| Total Consumer, Cyclical | | | | | | | 1,526,942 | |
| | | | | | | | | |
| Financial - 2.5% |
| Clifton Bancorp, Inc.14 | | | 40,175 | | | | 686,992 | |
| Xenith Bankshares, Inc.*,14 | | | 6,914 | | | | 233,901 | |
| Bear State Financial, Inc.14 | | | 17,259 | | | | 176,560 | |
| Hartford Financial Services Group, Inc.14 | | | 2,209 | | | | 124,323 | |
| Atlantic Coast Financial Corp.*,14 | | | 11,284 | | | | 106,408 | |
| Genworth Financial, Inc. — Class A* | | | 19,752 | | | | 61,429 | |
| Paragon Commercial Corp.* | | | 900 | | | | 47,889 | |
| MainSource Financial Group, Inc. | | | 200 | | | | 7,262 | |
| Total Financial | | | | | | | 1,444,764 | |
| | | | | | | | | |
| Utilities - 2.4% |
| Dynegy, Inc.*,14 | | | 55,021 | | | | 651,999 | |
| WGL Holdings, Inc.14 | | | 4,721 | | | | 405,251 | |
| Avista Corp.14 | | | 3,544 | | | | 182,480 | |
| Calpine Corp.*,14 | | | 11,866 | | | | 179,533 | |
| Total Utilities | | | | | | | 1,419,263 | |
| | | | | | | | | |
| Basic Materials - 1.8% |
| Monsanto Co.14 | | | 5,548 | | | | 647,896 | |
| Calgon Carbon Corp.14 | | | 18,151 | | | | 386,616 | |
| 14 | THE GUGGENHEIM FUNDS ANNUAL REPORT | SEE NOTES TO FINANCIAL STATEMENTS. |
| CONSOLIDATED SCHEDULE OF INVESTMENTS (continued) | December 31, 2017 |
| MULTI-HEDGE STRATEGIES FUND | |
| | | Shares | | | Value | |
| | | | | | | |
| Deltic Timber Corp. | | | 500 | | | $ | 45,775 | |
| Total Basic Materials | | | | | | | 1,080,287 | |
| | | | | | | | | |
| Total Common Stocks | | | | | | | | |
| (Cost $16,661,380) | | | | | | | 17,354,413 | |
| | | | | | | | | |
| RIGHTS†† - 0.0% |
| Dividend and Income Fund | | | | | | | | |
| Expires 01/31/18 | | | 19,469 | | | | — | |
| Total Rights | | | | | | | | |
| (Cost $—) | | | | | | | — | |
| | | | | | | | | |
| MUTUAL FUNDS† - 26.5% |
| Guggenheim Strategy Fund III2 | | | 322,225 | | | | 8,062,077 | |
| Guggenheim Strategy Fund II2 | | | 302,529 | | | | 7,566,260 | |
| Guggenheim Strategy Fund I2 | | | 3,107 | | | | 77,859 | |
| Total Mutual Funds | | | | | | | | |
| (Cost $15,721,217) | | | | | | | 15,706,196 | |
| | | | | | | | | |
| CLOSED-END FUNDS† - 9.9% |
| Dividend and Income Fund | | | 20,761 | | | | 278,820 | |
| RMR Real Estate Income Fund | | | 14,378 | | | | 274,476 | |
| Central Securities Corp. | | | 9,846 | | | | 269,780 | |
| General American Investors Company, Inc. | | | 7,627 | | | | 262,369 | |
| Boulder Growth & Income Fund, Inc. | | | 20,598 | | | | 228,432 | |
| Eagle Growth & Income Opportunities Fund | | | 5,246 | | | | 86,821 | |
| Adams Natural Resources Fund, Inc. | | | 3,065 | | | | 60,810 | |
| Herzfeld Caribbean Basin Fund, Inc. | | | 6,931 | | | | 49,557 | |
| GDL Fund | | | 4,798 | | | | 46,685 | |
| Adams Diversified Equity Fund, Inc. | | | 3,043 | | | | 45,736 | |
| Nuveen Connecticut Quality Municipal Income Fund | | | 3,567 | | | | 42,519 | |
| Templeton Dragon Fund, Inc. | | | 1,869 | | | | 40,202 | |
| Gabelli Healthcare & WellnessRx Trust | | | 3,855 | | | | 39,822 | |
| Cushing Energy Income Fund1 | | | 4,197 | | | | 39,284 | |
| Mexico Fund, Inc. | | | 2,463 | | | | 38,792 | |
| Legg Mason BW Global Income Opportunities Fund, Inc. | | | 3,032 | | | | 38,719 | |
| Nuveen New Jersey Quality Municipal Income Fund | | | 2,826 | | | | 38,688 | |
| CBRE Clarion Global Real Estate Income Fund | | | 4,776 | | | | 37,826 | |
| Latin American Discovery Fund, Inc. | | | 3,275 | | | | 37,728 | |
| Western Asset Emerging Markets Debt Fund, Inc. | | | 2,408 | | | | 37,444 | |
| Morgan Stanley Asia-Pacific Fund, Inc. | | | 2,029 | | | | 37,334 | |
| BlackRock Resources & Commodities Strategy Trust | | | 3,799 | | | | 37,116 | |
| Morgan Stanley Emerging Markets Domestic Debt Fund, Inc. | | | 4,782 | | | | 36,822 | |
| Principal Real Estate Income Fund | | | 2,129 | | | | 36,598 | |
| Morgan Stanley Emerging Markets Fund, Inc. | | | 2,039 | | | | 36,478 | |
| Sprott Focus Trust, Inc. | | | 4,569 | | | | 36,186 | |
| Macquarie Global Infrastructure Total Return Fund, Inc. | | | 1,386 | | | | 35,731 | |
| Franklin Universal Trust | | | 4,965 | | | | 35,599 | |
| SEE NOTES TO FINANCIAL STATEMENTS. | THE GUGGENHEIM FUNDS ANNUAL REPORT | 15 |
| CONSOLIDATED SCHEDULE OF INVESTMENTS (continued) | December 31, 2017 |
| MULTI-HEDGE STRATEGIES FUND | |
| | | Shares | | | Value | |
| | | | | | | |
| Mexico Equity & Income Fund, Inc. | | | 3,461 | | | $ | 35,510 | |
| Brookfield Global Listed Infrastructure Income Fund, Inc. | | | 2,732 | | | | 35,325 | |
| First Trust Strategic High Income Fund II | | | 2,741 | | | | 35,277 | |
| Alpine Global Premier Properties Fund | | | 5,230 | | | | 35,250 | |
| Lazard Global Total Return and Income Fund, Inc. | | | 1,947 | | | | 35,046 | |
| First Trust Aberdeen Global Opportunity Income Fund | | | 3,005 | | | | 35,038 | |
| Western Asset/Claymore Inflation-Linked Securities & Income Fund2 | | | 2,950 | | | | 34,781 | |
| Cohen & Steers Infrastructure Fund, Inc.1 | | | 1,448 | | | | 34,752 | |
| Templeton Emerging Markets Fund/United States | | | 2,115 | | | | 34,707 | |
| BlackRock Energy and Resources Trust | | | 2,440 | | | | 34,599 | |
| Western Asset/Claymore Inflation-Linked Opportunities & Income Fund2 | | | 3,023 | | | | 34,523 | |
| Western Asset Global High Income Fund, Inc. | | | 3,370 | | | | 34,441 | |
| Prudential Global Short Duration High Yield Fund, Inc. | | | 2,387 | | | | 34,397 | |
| Eaton Vance Michigan Municipal Bond Fund | | | 2,550 | | | | 34,323 | |
| Duff & Phelps Global Utility Income Fund, Inc. | | | 2,203 | | | | 34,191 | |
| Neuberger Berman High Yield Strategies Fund, Inc. | | | 2,898 | | | | 34,081 | |
| Clough Global Opportunities Fund | | | 3,121 | | | | 33,956 | |
| Voya Asia Pacific High Dividend Equity Income Fund | | | 3,238 | | | | 33,934 | |
| Royce Micro-Capital Trust, Inc. | | | 3,586 | | | | 33,870 | |
| Taiwan Fund, Inc. | | | 1,622 | | | | 33,851 | |
| Nuveen Real Asset Income and Growth Fund | | | 1,897 | | | | 33,766 | |
| Morgan Stanley Emerging Markets Debt Fund, Inc. | | | 3,381 | | | | 33,742 | |
| Central and Eastern Europe Fund, Inc. | | | 1,383 | | | | 33,731 | |
| Bancroft Fund Ltd.14 | | | 1,550 | | | | 33,728 | |
| India Fund, Inc.1 | | | 1,291 | | | | 33,721 | |
| Tri-Continental Corp.14 | | | 1,251 | | | | 33,702 | |
| Aberdeen Latin America Equity Fund, Inc. | | | 1,257 | | | | 33,587 | |
| European Equity Fund, Inc. | | | 3,377 | | | | 33,567 | |
| Eaton Vance Limited Duration Income Fund | | | 2,453 | | | | 33,483 | |
| Liberty All Star Equity Fund | | | 5,303 | | | | 33,409 | |
| Invesco High Income Trust II | | | 2,271 | | | | 33,406 | |
| First Trust Aberdeen Emerging Opportunity Fund | | | 2,045 | | | | 33,374 | |
| Cohen & Steers REIT and Preferred Income Fund, Inc. | | | 1,569 | | | | 33,373 | |
| Alpine Total Dynamic Dividend Fund | | | 3,522 | | | | 33,353 | |
| Lazard World Dividend & Income Fund, Inc. | | | 2,867 | | | | 33,343 | |
| Prudential Short Duration High Yield Fund, Inc. | | | 2,248 | | | | 33,203 | |
| Asia Tigers Fund, Inc. | | | 2,679 | | | | 33,139 | |
| 16 | THE GUGGENHEIM FUNDS ANNUAL REPORT | SEE NOTES TO FINANCIAL STATEMENTS. |
| CONSOLIDATED SCHEDULE OF INVESTMENTS (continued) | December 31, 2017 |
| MULTI-HEDGE STRATEGIES FUND | |
| | | Shares | | | Value | |
| | | | | | | |
| Swiss Helvetia Fund, Inc. | | | 2,597 | | | $ | 33,138 | |
| Royce Value Trust, Inc. | | | 2,047 | | | | 33,100 | |
| Western Asset High Income Opportunity Fund, Inc. | | | 6,527 | | | | 33,092 | |
| Alpine Global Dynamic Dividend Fund | | | 3,050 | | | | 33,062 | |
| BlackRock Credit Allocation Income Trust | | | 2,482 | | | | 33,060 | |
| Source Capital, Inc. | | | 811 | | | | 33,056 | |
| Clough Global Dividend and Income Fund | | | 2,475 | | | | 33,017 | |
| LMP Capital and Income Fund, Inc. | | | 2,364 | | | | 32,978 | |
| Templeton Emerging Markets Income Fund | | | 2,951 | | | | 32,963 | |
| China Fund, Inc. | | | 1,522 | | | | 32,951 | |
| Nuveen Global High Income Fund | | | 1,947 | | | | 32,924 | |
| First Trust High Income Long/Short Fund | | | 1,988 | | | | 32,921 | |
| Cohen & Steers Global Income Builder, Inc. | | | 3,331 | | | | 32,910 | |
| Clough Global Equity Fund | | | 2,461 | | | | 32,904 | |
| Gabelli Global Utility & Income Trust1 | | | 1,542 | | | | 32,845 | |
| BlackRock Enhanced Equity Dividend Trust | | | 3,557 | | | | 32,831 | |
| Aberdeen Greater China Fund, Inc. | | | 2,636 | | | | 32,818 | |
| Advent Claymore Convertible Securities and Income Fund2 | | | 2,064 | | | | 32,776 | |
| Wells Fargo Income Opportunities Fund | | | 3,893 | | | | 32,701 | |
| Nuveen AMT-Free Quality Municipal Income Fund | | | 2,378 | | | | 32,698 | |
| Delaware Investments Dividend & Income Fund, Inc. | | | 3,028 | | | | 32,612 | |
| Korea Fund, Inc. | | | 790 | | | | 32,603 | |
| BlackRock Multi-Sector Income Trust | | | 1,796 | | | | 32,597 | |
| Gabelli Dividend & Income Trust | | | 1,392 | | | | 32,587 | |
| Aberdeen Emerging Markets Smaller Company Opportunities Fund, Inc. | | | 2,241 | | | | 32,584 | |
| Aberdeen Japan Equity Fund, Inc. | | | 3,602 | | | | 32,562 | |
| Advent Claymore Convertible Securities and Income Fund II2 | | | 5,436 | | | | 32,562 | |
| Ellsworth Growth and Income Fund Ltd. | | | 3,459 | | | | 32,549 | |
| Western Asset High Income Fund II, Inc. | | | 4,664 | | | | 32,508 | |
| Tekla Healthcare Opportunities Fund | | | 1,855 | | | | 32,500 | |
| BlackRock Corporate High Yield Fund, Inc. | | | 2,966 | | | | 32,448 | |
| New Germany Fund, Inc. | | | 1,667 | | | | 32,423 | |
| Voya Emerging Markets High Income Dividend Equity Fund | | | 3,641 | | | | 32,405 | |
| Advent/Claymore Enhanced Growth & Income Fund2 | | | 3,884 | | | | 32,393 | |
| Nuveen Multi-Market Income Fund, Inc. | | | 4,250 | | | | 32,385 | |
| Western Asset High Yield Defined Opportunity Fund, Inc. | | | 2,137 | | | | 32,311 | |
| MFS Charter Income Trust | | | 3,797 | | | | 32,199 | |
| MFS Multimarket Income Trust | | | 5,304 | | | | 32,195 | |
| ClearBridge American Energy MLP Fund, Inc. | | | 3,885 | | | | 32,168 | |
| SEE NOTES TO FINANCIAL STATEMENTS. | THE GUGGENHEIM FUNDS ANNUAL REPORT | 17 |
| CONSOLIDATED SCHEDULE OF INVESTMENTS (continued) | December 31, 2017 |
| MULTI-HEDGE STRATEGIES FUND | |
| | | Shares | | | Value | |
| | | | | | | |
| BlackRock Enhanced Global Dividend Trust | | | 2,571 | | | $ | 32,163 | |
| BlackRock Enhanced International Dividend Trust | | | 4,927 | | | | 32,124 | |
| Delaware Enhanced Global Dividend & Income Fund | | | 2,648 | | | | 32,120 | |
| Nuveen Tax-Advantaged Dividend Growth Fund | | | 1,827 | | | | 32,119 | |
| Voya Global Advantage and Premium Opportunity Fund | | | 2,807 | | | | 32,084 | |
| Cohen & Steers MLP Income and Energy Opportunity Fund, Inc. | | | 3,129 | | | | 32,072 | |
| BlackRock Debt Strategies Fund, Inc. | | | 2,741 | | | | 32,070 | |
| Wells Fargo Multi-Sector Income Fund | | | 2,452 | | | | 32,023 | |
| Ares Dynamic Credit Allocation Fund, Inc. | | | 1,950 | | | | 32,019 | |
| AllianzGI Equity & Convertible Income Fund | | | 1,514 | | | | 31,991 | |
| Nuveen Tax-Advantaged Total Return Strategy Fund | | | 2,290 | | | | 31,946 | |
| Aberdeen Chile Fund, Inc. | | | 3,568 | | | | 31,862 | |
| Virtus Total Return Fund, Inc. | | | 2,468 | | | | 31,837 | |
| Franklin Limited Duration Income Trust | | | 2,686 | | | | 31,775 | |
| Neuberger Berman Real Estate Securities Income Fund, Inc.1 | | | 5,742 | | | | 31,753 | |
| Japan Smaller Capitalization Fund, Inc. | | | 2,687 | | | | 31,733 | |
| Cohen & Steers Closed-End Opportunity Fund, Inc. | | | 2,384 | | | | 31,731 | |
| AllianzGI NFJ Dividend Interest & Premium Strategy Fund | | | 2,430 | | | | 31,712 | |
| Guggenheim Enhanced Equity Income Fund2 | | | 3,545 | | | | 31,551 | |
| BlackRock Enhanced Capital and Income Fund, Inc. | | | 1,924 | | | | 31,515 | |
| Aberdeen Singapore Fund, Inc. | | | 2,534 | | | | 31,472 | |
| Aberdeen Income Credit Strategies Fund | | | 2,242 | | | | 31,455 | |
| Putnam High Income Securities Fund | | | 3,486 | | | | 31,444 | |
| Wells Fargo Global Dividend Opportunity Fund | | | 5,286 | | | | 31,346 | |
| First Trust Enhanced Equity Income Fund | | | 1,932 | | | | 31,279 | |
| Nuveen Dow 30sm Dynamic Overwrite Fund | | | 1,654 | | | | 31,161 | |
| First Trust Dynamic Europe Equity Income Fund | | | 1,653 | | | | 31,126 | |
| Western Asset Global Corporate Defined Opportunity Fund, Inc.14 | | | 1,728 | | | | 31,104 | |
| Blackrock Science & Technology Trust | | | 1,159 | | | | 30,934 | |
| Eaton Vance Tax-Advantaged Global Dividend Income Fund | | | 1,784 | | | | 30,917 | |
| Morgan Stanley India Investment Fund, Inc. | | | 925 | | | | 30,664 | |
| Asia Pacific Fund, Inc. | | | 2,166 | | | | 30,562 | |
| Total Closed-End Funds | | | | | | | | |
| (Cost $5,215,605) | | | | | | | 5,834,853 | |
| 18 | THE GUGGENHEIM FUNDS ANNUAL REPORT | SEE NOTES TO FINANCIAL STATEMENTS. |
| CONSOLIDATED SCHEDULE OF INVESTMENTS (continued) | December 31, 2017 |
| MULTI-HEDGE STRATEGIES FUND | |
| | | Face
Amount~ | | | Value | |
| | | | | | | |
| U.S. TREASURY BILLS†† - 20.2% |
| U.S. Treasury Bills | | | | | | |
| 1.03% due 01/02/183,4,15 | | $ | 8,000,000 | | | $ | 8,000,000 | |
| 1.31% due 04/19/183,4,5 | | | 2,500,000 | | | | 2,489,634 | |
| 1.04% due 01/02/183,4,15 | | | 1,000,000 | | | | 1,000,000 | |
| 1.44% due 06/14/183,4 | | | 500,000 | | | | 496,695 | |
| Total U.S. Treasury Bills | | | | | | | | |
| (Cost $11,986,496) | | | | | | | 11,986,329 | |
| | | | | | | | | |
| REPURCHASE AGREEMENTS††,6 - 1.4% |
JPMorgan Chase & Co.
issued 12/29/17 at 1.41%
due 01/02/18 | | | 521,945 | | | | 521,945 | |
Bank of America Merrill Lynch
issued 12/29/17 at 1.40%
due 01/02/18 | | | 278,563 | | | | 278,563 | |
| Total Repurchase Agreements | | | | | | | | |
| (Cost $800,508) | | | | | | | 800,508 | |
| | | | | | | | | |
| | | | Shares | | | | | |
| | | | | | | | | |
| SECURITIES LENDING COLLATERAL†,7 - 0.5% |
Money Market Fund
First American Government Obligations Fund — Class Z, 1.15%8 | | | 286,287 | | | | 286,287 | |
| Total Securities Lending Collateral | | | | | | | | |
| (Cost $286,287) | | | | | | | 286,287 | |
| | | | | | | | | |
| Total Investments - 87.8% | | | | | | | | |
| (Cost $50,671,493) | | | | | | $ | 51,968,586 | |
| | | | | | | | | |
| COMMON STOCKS SOLD SHORT† - (10.6)% |
| | | | | | | | | |
| Energy - 0.0% |
| Nabors Industries Ltd. | | | 1 | | | | (7 | ) |
| | | | | | | | | |
| Industrial - (0.5)% |
| United Technologies Corp. | | | 677 | | | | (86,365 | ) |
| Littelfuse, Inc. | | | 937 | | | | (185,357 | ) |
| Total Industrial | | | | | | | (271,722 | ) |
| | | | | | | | | |
| Utilities - (1.1)% |
| Vistra Energy Corp.* | | | 35,874 | | | | (657,212 | ) |
| | | | | | | | | |
| Communications - (1.2)% |
| Sinclair Broadcast Group, Inc. — Class A | | | 1,063 | | | | (40,235 | ) |
| Discovery Communications, Inc. — Class C* | | | 2,260 | | | | (47,844 | ) |
| Cincinnati Bell, Inc.* | | | 5,960 | | | | (124,266 | ) |
| Liberty Ventures* | | | 2,553 | | | | (138,475 | ) |
| AT&T, Inc. | | | 9,379 | | | | (364,656 | ) |
| Total Communications | | | | | | | (715,476 | ) |
| | | | | | | | | |
| Consumer, Cyclical - (1.4)% |
| Penn National Gaming, Inc.* | | | 7,116 | | | | (222,944 | ) |
| Liberty Interactive Corporation QVC Group — Class A* | | | 25,456 | | | | (621,635 | ) |
| Total Consumer, Cyclical | | | | | | | (844,579 | ) |
| | | | | | | | | |
| Technology - (1.8)% |
| Marvell Technology Group Ltd. | | | 20,180 | | | | (433,265 | ) |
| VMware, Inc. — Class A* | | | 5,195 | | | | (651,037 | ) |
| Total Technology | | | | | | | (1,084,302 | ) |
| | | | | | | | | |
| Financial - (1.9)% |
| First Financial Bancorp | | | 200 | | | | (5,270 | ) |
| Potlatch Corp. | | | 800 | | | | (39,920 | ) |
| TowneBank | | | 1,580 | | | | (48,585 | ) |
| Ameris Bancorp | | | 1,918 | | | | (92,448 | ) |
| Union Bankshares Corp. | | | 6,467 | | | | (233,911 | ) |
| Kearny Financial Corp. | | | 47,848 | | | | (691,404 | ) |
| Total Financial | | | | | | | (1,111,538 | ) |
| | | | | | | | | |
| Consumer, Non-cyclical - (2.7)% |
| Becton Dickinson and Co. | | | 1,850 | | | | (396,011 | ) |
| LHC Group, Inc.* | | | 8,975 | | | | (549,719 | ) |
| SEE NOTES TO FINANCIAL STATEMENTS. | THE GUGGENHEIM FUNDS ANNUAL REPORT | 19 |
| CONSOLIDATED SCHEDULE OF INVESTMENTS (continued) | December 31, 2017 |
| MULTI-HEDGE STRATEGIES FUND | |
| | | Shares | | | Value | |
| | | | | | | |
| Strayer Education, Inc. | | | 7,079 | | | $ | (634,137 | ) |
| Total Consumer, Non-cyclical | | | | | | | (1,579,867 | ) |
| | | | | | | | | |
| Total Common Stocks Sold Short | | | | | | | | |
| (Proceeds $5,904,146) | | | | | | | (6,264,703 | ) |
| | | | | | | | | |
| EXCHANGE-TRADED FUNDS SOLD SHORT† - (11.7)% |
| SPDR S&P 500 ETF Trust | | | 126 | | | | (33,624 | ) |
| iShares Russell 1000 Growth ETF | | | 252 | | | | (33,939 | ) |
| VanEck Vectors Russia ETF | | | 3,154 | | | | (66,896 | ) |
| iShares 20+ Year Treasury Bond ETF | | | 680 | | | | (86,265 | ) |
| iShares MSCI Japan ETF | | | 1,558 | | | | (93,371 | ) |
| iShares MSCI Taiwan ETF | | | 2,813 | | | | (101,859 | ) |
| iShares China Large-Capital ETF | | | 2,569 | | | | (118,611 | ) |
| iShares MSCI United Kingdom ETF | | | 3,368 | | | | (120,642 | ) |
| Technology Select Sector SPDR Fund | | | 1,982 | | | | (126,749 | ) |
| iShares MSCI South Korea ETF | | | 1,769 | | | | (132,551 | ) |
| VanEck Vectors Gold Miners ETF | | | 5,929 | | | | (137,790 | ) |
| iShares MSCI Australia ETF | | | 7,084 | | | | (164,136 | ) |
| Utilities Select Sector SPDR Fund | | | 3,152 | | | | (166,047 | ) |
| Consumer Discretionary Select Sector SPDR Fund | | | 1,794 | | | | (177,050 | ) |
| Materials Select Sector SPDR Fund | | | 2,928 | | | | (177,232 | ) |
| iShares MSCI Emerging Markets ETF | | | 3,832 | | | | (180,564 | ) |
| PowerShares QQQ Trust Series 1 | | | 1,189 | | | | (185,199 | ) |
| Industrial Select Sector SPDR Fund | | | 2,490 | | | | (188,418 | ) |
| iShares iBoxx $ Investment Grade Corporate Bond ETF | | | 1,567 | | | | (190,485 | ) |
| iShares Russell 1000 Value ETF | | | 1,651 | | | | (205,285 | ) |
| iShares Core U.S. Aggregate Bond ETF | | | 1,912 | | | | (209,039 | ) |
| iShares 7-10 Year Treasury Bond ETF | | | 2,424 | | | | (255,902 | ) |
| Health Care Select Sector SPDR Fund | | | 3,172 | | | | (262,261 | ) |
| iShares MSCI Mexico ETF | | | 5,537 | | | | (272,919 | ) |
| Consumer Staples Select Sector SPDR Fund | | | 5,324 | | | | (302,882 | ) |
| iShares TIPS Bond ETF | | | 2,802 | | | | (319,652 | ) |
| iShares Russell 2000 Index ETF | | | 2,162 | | | | (329,618 | ) |
| Financial Select Sector SPDR Fund | | | 13,651 | | | | (381,000 | ) |
| Energy Select Sector SPDR Fund | | | 5,801 | | | | (419,180 | ) |
| iShares U.S. Real Estate ETF | | | 5,202 | | | | (421,414 | ) |
| iShares MSCI EAFE ETF | | | 6,446 | | | | (453,218 | ) |
| SPDR Bloomberg Barclays High Yield Bond ETF | | | 17,236 | | | | (632,906 | ) |
| Total Exchange-Traded Funds Sold Short | | | | | | | | |
| (Proceeds $6,789,386) | | | | | | | (6,946,704 | ) |
| Total Securities Sold Short - (22.3)% | | | | | | | | |
| (Proceeds $12,693,532) | | | | | | $ | (13,211,407 | ) |
| Other Assets & Liabilities, net - 34.5% | | | | | | | 20,425,661 | |
| Total Net Assets - 100.0% | | | | | | $ | 59,182,840 | |
| 20 | THE GUGGENHEIM FUNDS ANNUAL REPORT | SEE NOTES TO FINANCIAL STATEMENTS. |
| CONSOLIDATED SCHEDULE OF INVESTMENTS (continued) | December 31, 2017 |
| MULTI-HEDGE STRATEGIES FUND | |
| Description | | Number of
Contracts | | | Expiration
Date | | Notional
Amount | | | Value and
Unrealized
Gain (Loss) | |
| Commodity Futures Contracts Purchased† |
| NY Harbor ULSD Futures Contracts | | | 5 | | | Feb 2018 | | $ | 433,356 | | | $ | 33,278 | |
| Brent Crude Futures Contracts | | | 7 | | | Mar 2018 | | | 466,340 | | | | 31,281 | |
| Low Sulphur Gas Oil Futures Contracts | | | 7 | | | Feb 2018 | | | 421,225 | | | | 25,421 | |
| LME Primary Aluminum Futures Contracts | | | 4 | | | Feb 2018 | | | 226,675 | | | | 23,253 | |
| WTI Crude Futures Contracts | | | 6 | | | Feb 2018 | | | 360,780 | | | | 20,381 | |
| LME Nickel Futures Contracts | | | 2 | | | Feb 2018 | | | 152,856 | | | | 14,063 | |
| Copper Futures Contracts | | | 2 | | | Mar 2018 | | | 164,575 | | | | 12,111 | |
| LME Zinc Futures Contracts | | | 3 | | | Feb 2018 | | | 249,638 | | | | 9,237 | |
| Cotton #2 Futures Contracts | | | 4 | | | Mar 2018 | | | 157,000 | | | | 5,143 | |
| Gold 100 oz. Futures Contracts | | | 2 | | | Feb 2018 | | | 261,100 | | | | 3,431 | |
| LME Lead Futures Contracts | | | 5 | | | Feb 2018 | | | 310,631 | | | | (5,099 | ) |
| Live Cattle Futures Contracts | | | 10 | | | Feb 2018 | | | 486,500 | | | | (16,515 | ) |
| | | | | | | | | $ | 3,690,676 | | | $ | 155,985 | |
| Currency Futures Contracts Purchased† | | | | | | | | | | | | | | |
| British Pound Futures Contracts | | | 37 | | | Mar 2018 | | $ | 3,129,506 | | | $ | 26,961 | |
| Canadian Dollar Futures Contracts | | | 19 | | | Mar 2018 | | | 1,512,970 | | | | 22,251 | |
| Euro Futures Contracts | | | 6 | | | Mar 2018 | | | 903,938 | | | | 12,816 | |
| | | | | | | | | $ | 5,546,414 | | | $ | 62,028 | |
| Interest Rate Futures Contracts Purchased† | | | | | | | | | | | | | | |
| U.S. Treasury Ultra Long Bond Futures Contracts | | | 2 | | | Mar 2018 | | $ | 334,937 | | | $ | 7,247 | |
| U.S. Treasury Long Bond Futures Contracts | | | 4 | | | Mar 2018 | | | 611,625 | | | | 3,368 | |
| Australian Government 10 Year Bond Futures Contracts†† | | | 8 | | | Mar 2018 | | | 804,869 | | | | 1,093 | |
| Euro - Bund Futures Contracts | | | 11 | | | Mar 2018 | | | 2,135,333 | | | | 671 | |
| Long Gilt Futures Contracts†† | | | 1 | | | Mar 2018 | | | 169,081 | | | | 230 | |
| Euro - 30 year Bond Futures Contracts | | | 1 | | | Mar 2018 | | | 196,689 | | | | (822 | ) |
| Euro - BTP Italian Government Bond Futures Contracts†† | | | 28 | | | Mar 2018 | | | 4,577,420 | | | | (17,439 | ) |
| Euro - OATS Futures Contracts†† | | | 64 | | | Mar 2018 | | | 11,931,566 | | | | (25,024 | ) |
| | | | | | | | | $ | 20,761,520 | | | $ | (30,676 | ) |
| Equity Futures Contracts Purchased† | | | | | | | | | | | | | | |
| Hang Seng Index Futures Contracts†† | | | 2 | | | Jan 2018 | | $ | 382,901 | | | $ | 7,918 | |
| Tokyo Stock Price Index Futures Contracts | | | 4 | | | Mar 2018 | | | 646,581 | | | | 7,742 | |
| S&P/TSX 60 IX Index Futures Contracts | | | 5 | | | Mar 2018 | | | 761,778 | | | | 4,323 | |
| Russell 2000 Index Mini Futures Contracts | | | 3 | | | Mar 2018 | | | 230,565 | | | | 2,666 | |
| Nikkei 225 (OSE) Index Futures Contracts | | | 2 | | | Mar 2018 | | | 404,313 | | | | 1,750 | |
| S&P 500 Index Mini Futures Contracts | | | 4 | | | Mar 2018 | | | 535,550 | | | | 517 | |
| NASDAQ-100 Index Mini Futures Contracts | | | 3 | | | Mar 2018 | | | 384,615 | | | | 152 | |
| CBOE Volatility Index Futures Contracts | | | 2 | | | Jun 2018 | | | 29,500 | | | | (605 | ) |
| SPI 200 Index Futures Contracts†† | | | 8 | | | Mar 2018 | | | 939,248 | | | | (1,526 | ) |
| OMX Stockholm 30 Index Futures Contracts†† | | | 6 | | | Jan 2018 | | | 115,021 | | | | (1,560 | ) |
| FTSE MIB Index Futures Contracts†† | | | 1 | | | Mar 2018 | | | 130,514 | | | | (1,724 | ) |
| CAC 40 10 Euro Index Futures Contracts | | | 4 | | | Jan 2018 | | | 254,301 | | | | (2,526 | ) |
| SEE NOTES TO FINANCIAL STATEMENTS. | THE GUGGENHEIM FUNDS ANNUAL REPORT | 21 |
| CONSOLIDATED SCHEDULE OF INVESTMENTS (continued) | December 31, 2017 |
| MULTI-HEDGE STRATEGIES FUND | |
| Description | | Number of
Contracts | | | Expiration
Date | | Notional
Amount | | | Value and
Unrealized
Gain (Loss) | |
| Amsterdam Index Futures Contracts | | | 3 | | | Jan 2018 | | $ | 391,350 | | | $ | (3,820 | ) |
| CBOE Volatility Index Futures Contracts | | | 26 | | | Apr 2018 | | | 357,500 | | | | (41,989 | ) |
| Euro STOXX 50 Index Futures Contracts | | | 45 | | | Mar 2018 | | | 1,879,904 | | | | (60,037 | ) |
| CBOE Volatility Index Futures Contracts | | | 66 | | | Mar 2018 | | | 866,580 | | | | (87,875 | ) |
| CBOE Volatility Index Futures Contracts | | | 176 | | | May 2018 | | | 2,508,000 | | | | (207,816 | ) |
| CBOE Volatility Index Futures Contracts | | | 686 | | | Feb 2018 | | | 8,485,820 | | | | (956,588 | ) |
| | | | | | | | | $ | 19,304,041 | | | $ | (1,340,998 | ) |
| Equity Futures Contracts Sold Short† | | | | | | | | | | | | | | |
| CBOE Volatility Index Futures Contracts | | | 814 | | | Jan 2018 | | $ | 9,279,600 | | | $ | 3,529,627 | |
| FTSE 100 Index Futures Contracts†† | | | 14 | | | Mar 2018 | | | 1,425,960 | | | | (12,878 | ) |
| | | | | | | | | $ | 10,705,560 | | | $ | 3,516,749 | |
| Commodity Futures Contracts Sold Short† | | | | | | | | | | | | | | |
| Coffee 'C' Futures Contracts | | | 11 | | | Mar 2018 | | $ | 520,575 | | | $ | 22,719 | |
| Soybean Meal Futures Contracts | | | 16 | | | Mar 2018 | | | 507,520 | | | | 18,968 | |
| Soybean Futures Contracts | | | 14 | | | Mar 2018 | | | 673,750 | | | | 18,878 | |
| Wheat Futures Contracts | | | 22 | | | Mar 2018 | | | 469,975 | | | | 14,030 | |
| Hard Red Winter Wheat Futures Contracts | | | 22 | | | Mar 2018 | | | 470,250 | | | | 13,272 | |
| Corn Futures Contracts | | | 37 | | | Mar 2018 | | | 649,350 | | | | 11,822 | |
| Cocoa Futures Contracts | | | 13 | | | Mar 2018 | | | 245,440 | | | | 5,712 | |
| Soybean Oil Futures Contracts | | | 25 | | | Mar 2018 | | | 498,000 | | | | 1,185 | |
| Lean Hogs Futures Contracts | | | 1 | | | Feb 2018 | | | 28,640 | | | | (1,924 | ) |
| Silver Futures Contracts | | | 4 | | | Mar 2018 | | | 340,100 | | | | (3,102 | ) |
| Sugar #11 Futures Contracts | | | 11 | | | Mar 2018 | | | 186,648 | | | | (12,672 | ) |
| Natural Gas Futures Contracts | | | 10 | | | Feb 2018 | | | 295,100 | | | | (21,481 | ) |
| | | | | | | | | $ | 4,885,348 | | | $ | 67,407 | |
| Interest Rate Futures Contracts Sold Short† | | | | | | | | | | | | | | |
| Canadian Government 10 Year Bond Futures Contracts†† | | | 80 | | | Mar 2018 | | $ | 8,575,951 | | | $ | 7,739 | |
| U.S. Treasury 10 Year Note Futures Contracts | | | 83 | | | Mar 2018 | | | 10,292,000 | | | | 3,657 | |
| | | | | | | | | $ | 18,867,951 | | | $ | 11,396 | |
| Currency Futures Contracts Sold Short† | | | | | | | | | | | | | | |
| Japanese Yen Futures Contracts | | | 4 | | | Mar 2018 | | $ | 445,325 | | | $ | (1,461 | ) |
| New Zealand Dollar Futures Contracts | | | 7 | | | Mar 2018 | | | 495,670 | | | | (5,718 | ) |
| Australian Dollar Futures Contracts | | | 4 | | | Mar 2018 | | | 312,080 | | | | (7,650 | ) |
| | | | | | | | | $ | 1,253,075 | | | $ | (14,829 | ) |
| 22 | THE GUGGENHEIM FUNDS ANNUAL REPORT | SEE NOTES TO FINANCIAL STATEMENTS. |
| CONSOLIDATED SCHEDULE OF INVESTMENTS (continued) | December 31, 2017 |
| MULTI-HEDGE STRATEGIES FUND | |
| Custom Basket Swap Agreements |
| Counterparty | | Index | | Financing
Rate Pay
(Receive) | | Payment
Frequency | | Maturity
Date | | Notional
Amount | | | Value and
Unrealized
Gain (Loss) | |
| OTC Custom Basket Swap Agreements Sold Short†† |
| Morgan Stanley | | Multi-Hedge Portfolio Short Custom Basket Swap9 | | (1.03%) | | At Maturity | | 08/31/18 | | $ | 18,274,090 | | | $ | (940,750 | ) |
| Morgan Stanley | | Multi-Hedge Portfolio Short Custom Basket Swap10 | | (.90%) | | At Maturity | | 08/31/18 | | | 24,457,727 | | | | (119,101 | ) |
| | | | | | | | | | | $ | 42,731,817 | | | $ | (1,059,851 | ) |
| OTC Custom Basket Swap Agreements†† |
| Morgan Stanley | | Multi-Hedge Portfolio Long Custom Basket Swap13 | | 1.77% | | At Maturity | | 08/31/18 | | $ | 25,553,414 | | | $ | 1,388,757 | |
| Morgan Stanley | | Multi-Hedge Portfolio Long Custom Basket Swap12 | | 1.77% | | At Maturity | | 08/31/18 | | | 25,055,012 | | | | 476,054 | |
| Morgan Stanley | | Multi-Hedge Portfolio Long Custom Basket Swap11 | | 1.65% | | At Maturity | | 09/06/19 | | | 3,002,126 | | | | 16,203 | |
| | | | | | | | | | | $ | 53,610,552 | | | $ | 1,881,014 | |
| | | Shares | | | Percentage
Value | | | Value and
Unrealized
Gain | |
| | | | | | | | | | |
| CUSTOM BASKET OF LONG SECURITIES9 |
| Tailored Brands, Inc. | | | 9,564 | | | | 6.9 | % | | $ | 95,732 | |
| NetApp, Inc. | | | 3,643 | | | | 4.4 | % | | | 62,408 | |
| Southwest Airlines Co. | | | 4,797 | | | | 3.7 | % | | | 50,984 | |
| Intel Corp. | | | 4,510 | | | | 3.6 | % | | | 49,966 | |
| Union Pacific Corp. | | | 2,281 | | | | 3.6 | % | | | 49,685 | |
| United Rentals, Inc.* | | | 1,543 | | | | 3.5 | % | | | 48,327 | |
| Fluor Corp. | | | 5,770 | | | | 3.4 | % | | | 46,864 | |
| Mylan N.V.* | | | 5,071 | | | | 3.1 | % | | | 43,706 | |
| Cisco Systems, Inc. | | | 6,817 | | | | 3.0 | % | | | 41,903 | |
| US Foods Holding Corp.* | | | 8,577 | | | | 2.9 | % | | | 40,209 | |
| United Therapeutics Corp.* | | | 1,634 | | | | 2.8 | % | | | 38,961 | |
| Carlisle Companies, Inc. | | | 1,933 | | | | 2.6 | % | | | 36,689 | |
| Kroger Co. | | | 6,060 | | | | 2.4 | % | | | 33,788 | |
| FedEx Corp. | | | 962 | | | | 2.4 | % | | | 33,086 | |
| Principal Financial Group, Inc. | | | 3,847 | | | | 2.3 | % | | | 32,084 | |
| Tyson Foods, Inc. — Class A | | | 1,719 | | | | 2.2 | % | | | 30,741 | |
| Valero Energy Corp. | | | 3,018 | | | | 2.1 | % | | | 29,771 | |
| Owens Corning | | | 3,160 | | | | 2.0 | % | | | 27,920 | |
| Delta Air Lines, Inc. | | | 3,471 | | | | 2.0 | % | | | 27,833 | |
| United Natural Foods, Inc.* | | | 1,870 | | | | 2.0 | % | | | 27,459 | |
| Verizon Communications, Inc. | | | 5,979 | | | | 1.9 | % | | | 27,013 | |
| JM Smucker Co. | | | 2,306 | | | | 1.9 | % | | | 26,776 | |
| Greenbrier Companies, Inc. | | | 3,891 | | | | 1.9 | % | | | 26,376 | |
| Snap-on, Inc. | | | 941 | | | | 1.8 | % | | | 25,210 | |
| EMCOR Group, Inc. | | | 1,536 | | | | 1.8 | % | | | 24,628 | |
| Cummins, Inc. | | | 1,591 | | | | 1.7 | % | | | 24,173 | |
| SEE NOTES TO FINANCIAL STATEMENTS. | THE GUGGENHEIM FUNDS ANNUAL REPORT | 23 |
| CONSOLIDATED SCHEDULE OF INVESTMENTS (continued) | December 31, 2017 |
| MULTI-HEDGE STRATEGIES FUND | |
| | | Shares | | | Percentage
Value | | | Value and
Unrealized
Gain | |
| | | | | | | | | | |
| Performance Food Group Co.* | | | 4,884 | | | | 1.7 | % | | $ | 23,772 | |
| Norfolk Southern Corp. | | | 1,094 | | | | 1.7 | % | | | 23,320 | |
| Conagra Brands, Inc. | | | 7,440 | | | | 1.6 | % | | | 22,669 | |
| Prudential Financial, Inc. | | | 1,745 | | | | 1.6 | % | | | 22,185 | |
| Chevron Corp. | | | 2,000 | | | | 1.5 | % | | | 21,073 | |
| Energizer Holdings, Inc. | | | 5,148 | | | | 1.4 | % | | | 19,248 | |
| Trinity Industries, Inc. | | | 2,196 | | | | 1.4 | % | | | 18,908 | |
| General Mills, Inc. | | | 2,709 | | | | 1.4 | % | | | 18,860 | |
| Genesee & Wyoming, Inc. — Class A* | | | 2,952 | | | | 1.3 | % | | | 18,576 | |
| WellCare Health Plans, Inc.* | | | 651 | | | | 1.3 | % | | | 18,400 | |
| HP, Inc. | | | 9,829 | | | | 1.3 | % | | | 17,398 | |
| USANA Health Sciences, Inc.* | | | 1,185 | | | | 1.2 | % | | | 16,732 | |
| Crane Co. | | | 1,029 | | | | 1.1 | % | | | 15,857 | |
| International Business Machines Corp. | | | 1,543 | | | | 1.1 | % | | | 15,310 | |
| Aflac, Inc. | | | 2,780 | | | | 1.1 | % | | | 15,119 | |
| Discover Financial Services | | | 814 | | | | 1.0 | % | | | 14,442 | |
| Allison Transmission Holdings, Inc. | | | 2,435 | | | | 1.0 | % | | | 14,347 | |
| Tech Data Corp.* | | | 2,087 | | | | 1.0 | % | | | 14,160 | |
| United Continental Holdings, Inc.* | | | 2,484 | | | | 1.0 | % | | | 14,131 | |
| JetBlue Airways Corp.* | | | 5,227 | | | | 1.0 | % | | | 14,065 | |
| DaVita, Inc.* | | | 964 | | | | 1.0 | % | | | 13,942 | |
| Juniper Networks, Inc. | | | 9,440 | | | | 0.9 | % | | | 12,612 | |
| Boston Beer Company, Inc. — Class A* | | | 320 | | | | 0.9 | % | | | 12,605 | |
| ON Semiconductor Corp.* | | | 3,228 | | | | 0.9 | % | | | 12,487 | |
| Timken Co. | | | 3,113 | | | | 0.9 | % | | | 12,480 | |
| Marathon Petroleum Corp. | | | 3,485 | | | | 0.9 | % | | | 12,382 | |
| Ralph Lauren Corp. — Class A | | | 751 | | | | 0.9 | % | | | 12,107 | |
| Pfizer, Inc. | | | 6,499 | | | | 0.8 | % | | | 11,699 | |
| McKesson Corp. | | | 1,272 | | | | 0.8 | % | | | 11,665 | |
| Zimmer Biomet Holdings, Inc. | | | 1,536 | | | | 0.8 | % | | | 11,633 | |
| Applied Industrial Technologies, Inc. | | | 998 | | | | 0.8 | % | | | 11,403 | |
| AmerisourceBergen Corp. — Class A | | | 891 | | | | 0.8 | % | | | 11,150 | |
| AGCO Corp. | | | 2,916 | | | | 0.8 | % | | | 11,099 | |
| Johnson & Johnson | | | 1,413 | | | | 0.8 | % | | | 10,908 | |
| Kirby Corp.* | | | 2,824 | | | | 0.8 | % | | | 10,789 | |
| Horizon Pharma plc* | | | 9,137 | | | | 0.8 | % | | | 10,550 | |
| Lear Corp. | | | 379 | | | | 0.8 | % | | | 10,493 | |
| HollyFrontier Corp. | | | 1,409 | | | | 0.7 | % | | | 10,294 | |
| LyondellBasell Industries N.V. — Class A | | | 1,449 | | | | 0.7 | % | | | 10,260 | |
| WW Grainger, Inc. | | | 277 | | | | 0.7 | % | | | 10,158 | |
| Ingredion, Inc. | | | 599 | | | | 0.7 | % | | | 9,946 | |
| Lions Gate Entertainment Corp. — Class A* | | | 3,856 | | | | 0.7 | % | | | 9,466 | |
| 24 | THE GUGGENHEIM FUNDS ANNUAL REPORT | SEE NOTES TO FINANCIAL STATEMENTS. |
| CONSOLIDATED SCHEDULE OF INVESTMENTS (continued) | December 31, 2017 |
| MULTI-HEDGE STRATEGIES FUND | |
| | | Shares | | | Percentage
Value | | | Value and
Unrealized
Gain | |
| | | | | | | | | | |
| Lowe’s Companies, Inc. | | | 671 | | | | 0.7 | % | | $ | 9,444 | |
| T-Mobile US, Inc.* | | | 2,256 | | | | 0.7 | % | | | 9,390 | |
| Exxon Mobil Corp. | | | 2,857 | | | | 0.7 | % | | | 9,390 | |
| InterDigital, Inc. | | | 1,627 | | | | 0.7 | % | | | 9,030 | |
| WestRock Co. | | | 2,254 | | | | 0.6 | % | | | 8,791 | |
| Campbell Soup Co. | | | 5,566 | | | | 0.6 | % | | | 8,633 | |
| Interactive Brokers Group, Inc. — Class A | | | 1,747 | | | | 0.6 | % | | | 8,267 | |
| Capital One Financial Corp. | | | 607 | | | | 0.6 | % | | | 8,179 | |
| Arconic, Inc. | | | 3,856 | | | | 0.6 | % | | | 8,106 | |
| Dr Pepper Snapple Group, Inc. | | | 824 | | | | 0.6 | % | | | 7,933 | |
| American Airlines Group, Inc. | | | 1,156 | | | | 0.6 | % | | | 7,876 | |
| Vishay Intertechnology, Inc. | | | 2,600 | | | | 0.6 | % | | | 7,797 | |
| Molson Coors Brewing Co. — Class B | | | 3,321 | | | | 0.6 | % | | | 7,720 | |
| SpartanNash Co. | | | 3,428 | | | | 0.5 | % | | | 7,273 | |
| AECOM* | | | 1,936 | | | | 0.5 | % | | | 7,139 | |
| Cardtronics plc — Class A* | | | 4,155 | | | | 0.5 | % | | | 7,122 | |
| PBF Energy, Inc. — Class A | | | 2,308 | | | | 0.5 | % | | | 7,023 | |
| E*TRADE Financial Corp.* | | | 1,205 | | | | 0.5 | % | | | 6,864 | |
| PACCAR, Inc. | | | 3,369 | | | | 0.5 | % | | | 6,656 | |
| Sabre Corp. | | | 3,137 | | | | 0.5 | % | | | 6,616 | |
| KLA-Tencor Corp. | | | 559 | | | | 0.5 | % | | | 6,590 | |
| Northern Trust Corp. | | | 565 | | | | 0.5 | % | | | 6,471 | |
| Rexnord Corp.* | | | 2,869 | | | | 0.5 | % | | | 6,468 | |
| Prestige Brands Holdings, Inc.* | | | 2,072 | | | | 0.4 | % | | | 6,106 | |
| Huntsman Corp. | | | 1,767 | | | | 0.4 | % | | | 5,896 | |
| EnerSys | | | 1,797 | | | | 0.4 | % | | | 5,868 | |
| First Solar, Inc.* | | | 867 | | | | 0.4 | % | | | 5,356 | |
| JPMorgan Chase & Co. | | | 537 | | | | 0.4 | % | | | 5,318 | |
| Travelers Companies, Inc. | | | 404 | | | | 0.4 | % | | | 5,317 | |
| Bank of New York Mellon Corp. | | | 3,298 | | | | 0.4 | % | | | 4,872 | |
| L3 Technologies, Inc. | | | 338 | | | | 0.3 | % | | | 4,478 | |
| Darling Ingredients, Inc.* | | | 5,866 | | | | 0.3 | % | | | 4,417 | |
| Eli Lilly & Co. | | | 2,995 | | | | 0.3 | % | | | 4,357 | |
| Dean Foods Co. | | | 5,385 | | | | 0.3 | % | | | 4,079 | |
| American Financial Group, Inc. | | | 1,135 | | | | 0.3 | % | | | 3,984 | |
| j2 Global, Inc. | | | 1,831 | | | | 0.3 | % | | | 3,777 | |
| Regal Beloit Corp. | | | 2,364 | | | | 0.3 | % | | | 3,611 | |
| Pilgrim’s Pride Corp.* | | | 1,964 | | | | 0.2 | % | | | 3,408 | |
| Abbott Laboratories | | | 2,176 | | | | 0.2 | % | | | 3,384 | |
| Bill Barrett Corp.* | | | 9,718 | | | | 0.2 | % | | | 3,150 | |
| Amgen, Inc. | | | 1,453 | | | | 0.2 | % | | | 2,930 | |
| Medtronic plc | | | 1,166 | | | | 0.2 | % | | | 2,772 | |
| CA, Inc. | | | 7,974 | | | | 0.2 | % | | | 2,709 | |
| Tenneco, Inc. | | | 954 | | | | 0.2 | % | | | 2,591 | |
| Gibraltar Industries, Inc.* | | | 1,962 | | | | 0.2 | % | | | 2,419 | |
| CACI International, Inc. — Class A* | | | 601 | | | | 0.2 | % | | | 2,395 | |
| U.S. Bancorp | | | 1,360 | | | | 0.2 | % | | | 2,327 | |
| Baxter International, Inc. | | | 848 | | | | 0.2 | % | | | 2,224 | |
| SEE NOTES TO FINANCIAL STATEMENTS. | THE GUGGENHEIM FUNDS ANNUAL REPORT | 25 |
| CONSOLIDATED SCHEDULE OF INVESTMENTS (continued) | December 31, 2017 |
| MULTI-HEDGE STRATEGIES FUND | |
| | | Shares | | | Percentage
Value | | | Value and
Unrealized
Gain (Loss) | |
| | | | | | | | | | |
| Biogen, Inc.* | | | 336 | | | | 0.2 | % | | $ | 2,126 | |
| OneMain Holdings, Inc.* | | | 1,445 | | | | 0.1 | % | | | 2,080 | |
| Celgene Corp.* | | | 1,367 | | | | 0.1 | % | | | 1,965 | |
| CoreLogic, Inc.* | | | 1,956 | | | | 0.1 | % | | | 1,922 | |
| Spectrum Brands Holdings, Inc. | | | 490 | | | | 0.1 | % | | | 1,429 | |
| Brixmor Property Group, Inc. | | | 3,520 | | | | 0.1 | % | | | 1,162 | |
| AbbVie, Inc. | | | 651 | | | | 0.1 | % | | | 1,132 | |
| Blackhawk Network Holdings, Inc.* | | | 1,516 | | | | 0.1 | % | | | 1,068 | |
| Belden, Inc. | | | 720 | | | | 0.0 | % | | | 688 | |
| Edgewell Personal Care Co.* | | | 3,111 | | | | 0.0 | % | | | 103 | |
| ORBCOMM, Inc.* | | | 5,218 | | | | 0.0 | % | | | (7 | ) |
| Summit Hotel Properties, Inc. | | | 4,538 | | | | 0.0 | % | | | (56 | ) |
| Dell Technologies Incorporated Class V — Class V* | | | 881 | | | | 0.0 | % | | | (109 | ) |
| Humana, Inc. | | | 342 | | | | 0.0 | % | | | (121 | ) |
| Ingersoll-Rand plc | | | 626 | | | | 0.0 | % | | | (378 | ) |
| Convergys Corp. | | | 6,382 | | | | 0.0 | % | | | (435 | ) |
| LaSalle Hotel Properties | | | 2,328 | | | | 0.0 | % | | | (554 | ) |
| Omnicom Group, Inc. | | | 1,844 | | | | 0.0 | % | | | (575 | ) |
| Louisiana-Pacific Corp.* | | | 1,996 | | | | (0.1 | %) | | | (743 | ) |
| AES Corp. | | | 14,511 | | | | (0.1 | %) | | | (874 | ) |
| Blackline, Inc.* | | | 845 | | | | (0.1 | %) | | | (1,167 | ) |
| CSRA, Inc. | | | 3,712 | | | | (0.1 | %) | | | (1,691 | ) |
| First Data Corp. — Class A* | | | 8,550 | | | | (0.1 | %) | | | (1,841 | ) |
| Western Union Co. | | | 12,553 | | | | (0.2 | %) | | | (2,719 | ) |
| Travelport Worldwide Ltd. | | | 9,049 | | | | (0.2 | %) | | | (2,943 | ) |
| Icad, Inc.* | | | 8,287 | | | | (0.2 | %) | | | (3,010 | ) |
| Archer-Daniels-Midland Co. | | | 6,789 | | | | (0.2 | %) | | | (3,330 | ) |
| Ameren Corp. | | | 3,322 | | | | (0.2 | %) | | | (3,334 | ) |
| Allergan plc | | | 368 | | | | (0.3 | %) | | | (3,855 | ) |
| DXC Technology Co. | | | 1,665 | | | | (0.3 | %) | | | (3,971 | ) |
| Micron Technology, Inc.* | | | 2,354 | | | | (0.3 | %) | | | (4,065 | ) |
| Portland General Electric Co. | | | 3,579 | | | | (0.4 | %) | | | (5,725 | ) |
| Owens-Illinois, Inc.* | | | 2,272 | | | | (0.4 | %) | | | (5,888 | ) |
| VEREIT, Inc. | | | 28,791 | | | | (0.5 | %) | | | (6,282 | ) |
| Cardinal Health, Inc. | | | 3,493 | | | | (0.5 | %) | | | (7,207 | ) |
| NCR Corp.* | | | 3,104 | | | | (0.5 | %) | | | (7,272 | ) |
| Viavi Solutions, Inc.* | | | 5,878 | | | | (0.6 | %) | | | (7,770 | ) |
| Cirrus Logic, Inc.* | | | 1,319 | | | | (0.6 | %) | | | (7,975 | ) |
| ARRIS International plc* | | | 4,337 | | | | (0.6 | %) | | | (8,278 | ) |
| Bioverativ, Inc.* | | | 2,291 | | | | (0.6 | %) | | | (8,459 | ) |
| Alaska Air Group, Inc. | | | 2,690 | | | | (0.6 | %) | | | (8,615 | ) |
| Sanmina Corp.* | | | 1,945 | | | | (0.6 | %) | | | (8,707 | ) |
| Mack-Cali Realty Corp. | | | 5,389 | | | | (0.6 | %) | | | (8,768 | ) |
| Telephone & Data Systems, Inc. | | | 6,953 | | | | (0.7 | %) | | | (9,748 | ) |
| Walgreens Boots Alliance, Inc. | | | 1,247 | | | | (0.7 | %) | | | (10,228 | ) |
| CenterPoint Energy, Inc. | | | 9,119 | | | | (0.8 | %) | | | (10,578 | ) |
| FirstEnergy Corp. | | | 6,095 | | | | (0.9 | %) | | | (11,871 | ) |
| Edison International | | | 1,559 | | | | (0.9 | %) | | | (12,472 | ) |
| Sanderson Farms, Inc. | | | 502 | | | | (0.9 | %) | | | (12,650 | ) |
| TreeHouse Foods, Inc.* | | | 1,309 | | | | (1.0 | %) | | | (13,398 | ) |
| CVS Health Corp. | | | 3,605 | | | | (1.0 | %) | | | (13,665 | ) |
| 26 | THE GUGGENHEIM FUNDS ANNUAL REPORT | SEE NOTES TO FINANCIAL STATEMENTS. |
| CONSOLIDATED SCHEDULE OF INVESTMENTS (continued) | December 31, 2017 |
| MULTI-HEDGE STRATEGIES FUND | |
| | | Shares | | | Percentage
Value | | | Value and
Unrealized
Gain (Loss) | |
| | | | | | | | | | |
| Xerox Corp. | | | 4,270 | | | | (1.0 | %) | | $ | (13,711 | ) |
| Western Digital Corp. | | | 1,588 | | | | (1.0 | %) | | | (14,108 | ) |
| Versartis, Inc.* | | | 31,619 | | | | (1.0 | %) | | | (14,263 | ) |
| National Fuel Gas Co. | | | 4,599 | | | | (1.0 | %) | | | (14,321 | ) |
| ATN International, Inc. | | | 3,293 | | | | (1.1 | %) | | | (14,845 | ) |
| Merck & Company, Inc. | | | 2,108 | | | | (1.1 | %) | | | (15,681 | ) |
| Benchmark Electronics, Inc.* | | | 4,780 | | | | (1.2 | %) | | | (16,029 | ) |
| PNM Resources, Inc. | | | 3,946 | | | | (1.3 | %) | | | (18,139 | ) |
| Jabil, Inc. | | | 5,256 | | | | (1.6 | %) | | | (22,455 | ) |
| Gilead Sciences, Inc. | | | 3,448 | | | | (1.8 | %) | | | (24,941 | ) |
| Owens & Minor, Inc. | | | 2,789 | | | | (2.0 | %) | | | (28,120 | ) |
| PG&E Corp. | | | 4,793 | | | | (6.8 | %) | | | (94,486 | ) |
| Total Custom Basket of Long Securities | | | | | | | | | | $ | 1,388,757 | |
| | | | | | | | | | | | | |
| CUSTOM BASKET OF SHORT SECURITIES13 |
| Royal Gold, Inc. | | | (3,083 | ) | | | (1.9 | %) | | $ | 17,885 | |
| SPS Commerce, Inc.* | | | (1,158 | ) | | | (1.3 | %) | | | 12,438 | |
| First Republic Bank | | | (1,127 | ) | | | (1.3 | %) | | | 11,852 | |
| FireEye, Inc.* | | | (3,892 | ) | | | (1.2 | %) | | | 11,026 | |
| Education Realty Trust, Inc. | | | (2,878 | ) | | | (1.2 | %) | | | 10,932 | |
| Terreno Realty Corp. | | | (5,676 | ) | | | (1.1 | %) | | | 10,523 | |
| Essex Property Trust, Inc. | | | (565 | ) | | | (1.1 | %) | | | 10,140 | |
| CareTrust REIT, Inc. | | | (2,846 | ) | | | (0.8 | %) | | | 7,724 | |
| Autodesk, Inc.* | | | (831 | ) | | | (0.8 | %) | | | 7,125 | |
| CyrusOne, Inc. | | | (1,676 | ) | | | (0.7 | %) | | | 6,847 | |
| NVIDIA Corp. | | | (345 | ) | | | (0.7 | %) | | | 6,789 | |
| Atmos Energy Corp. | | | (2,940 | ) | | | (0.7 | %) | | | 6,677 | |
| CoreSite Realty Corp. | | | (1,014 | ) | | | (0.7 | %) | | | 6,148 | |
| Hudson Pacific Properties, Inc. | | | (4,752 | ) | | | (0.6 | %) | | | 5,967 | |
| Semtech Corp.* | | | (1,799 | ) | | | (0.6 | %) | | | 5,499 | |
| NewMarket Corp. | | | (257 | ) | | | (0.6 | %) | | | 5,452 | |
| Camden Property Trust | | | (2,259 | ) | | | (0.5 | %) | | | 4,970 | |
| Chesapeake Energy Corp.* | | | (14,798 | ) | | | (0.5 | %) | | | 4,869 | |
| Capitol Federal Financial, Inc. | | | (7,935 | ) | | | (0.5 | %) | | | 4,569 | |
| Rexford Industrial Realty, Inc. | | | (3,985 | ) | | | (0.4 | %) | | | 4,185 | |
| CoStar Group, Inc.* | | | (699 | ) | | | (0.4 | %) | | | 4,113 | |
| American Tower Corp. — Class A | | | (677 | ) | | | (0.4 | %) | | | 3,516 | |
| White Mountains Insurance Group Ltd. | | | (201 | ) | | | (0.4 | %) | | | 3,449 | |
| Vail Resorts, Inc. | | | (233 | ) | | | (0.4 | %) | | | 3,356 | |
| Healthcare Trust of America, Inc. — Class A | | | (3,888 | ) | | | (0.3 | %) | | | 3,284 | |
| Workday, Inc. — Class A* | | | (487 | ) | | | (0.3 | %) | | | 2,909 | |
| Spire, Inc. | | | (1,756 | ) | | | (0.3 | %) | | | 2,595 | |
| Extraction Oil & Gas, Inc.* | | | (3,776 | ) | | | (0.3 | %) | | | 2,516 | |
| Equinix, Inc. | | | (160 | ) | | | (0.3 | %) | | | 2,370 | |
| NiSource, Inc. | | | (1,947 | ) | | | (0.2 | %) | | | 2,293 | |
| WR Grace & Co. | | | (2,272 | ) | | | (0.2 | %) | | | 2,291 | |
| Exponent, Inc. | | | (965 | ) | | | (0.2 | %) | | | 2,210 | |
| Healthcare Realty Trust, Inc. | | | (1,821 | ) | | | (0.2 | %) | | | 1,723 | |
| Equity LifeStyle Properties, Inc. | | | (2,373 | ) | | | (0.2 | %) | | | 1,568 | |
| Cannae Holdings, Inc.* | | | (4,007 | ) | | | (0.2 | %) | | | 1,498 | |
| American International Group, Inc. | | | (1,057 | ) | | | (0.1 | %) | | | 1,137 | |
| SEE NOTES TO FINANCIAL STATEMENTS. | THE GUGGENHEIM FUNDS ANNUAL REPORT | 27 |
| CONSOLIDATED SCHEDULE OF INVESTMENTS (continued) | December 31, 2017 |
| MULTI-HEDGE STRATEGIES FUND | |
| | | Shares | | | Percentage
Value | | | Value and
Unrealized
Gain (Loss) | |
| | | | | | | | | | |
| Alliant Energy Corp. | | | (4,699 | ) | | | (0.1 | %) | | $ | 1,047 | |
| Realty Income Corp. | | | (938 | ) | | | (0.1 | %) | | | 522 | |
| Public Storage | | | (250 | ) | | | (0.1 | %) | | | 509 | |
| Physicians Realty Trust | | | (2,935 | ) | | | (0.1 | %) | | | 485 | |
| Aspen Insurance Holdings Ltd. | | | (1,282 | ) | | | 0.0 | % | | | 427 | |
| IMAX Corp.* | | | (3,677 | ) | | | 0.0 | % | | | (226 | ) |
| American Homes 4 Rent — Class A | | | (5,254 | ) | | | 0.1 | % | | | (676 | ) |
| Intuit, Inc. | | | (341 | ) | | | 0.1 | % | | | (714 | ) |
| Bio-Rad Laboratories, Inc. — Class A* | | | (345 | ) | | | 0.1 | % | | | (896 | ) |
| Macerich Co. | | | (823 | ) | | | 0.1 | % | | | (949 | ) |
| GCP Applied Technologies, Inc.* | | | (1,794 | ) | | | 0.1 | % | | | (994 | ) |
| EastGroup Properties, Inc. | | | (1,191 | ) | | | 0.1 | % | | | (1,156 | ) |
| MSCI, Inc. — Class A | | | (1,688 | ) | | | 0.1 | % | | | (1,340 | ) |
| Dominion Energy, Inc. | | | (647 | ) | | | 0.1 | % | | | (1,389 | ) |
| DCT Industrial Trust, Inc. | | | (2,873 | ) | | | 0.2 | % | | | (1,928 | ) |
| First Industrial Realty Trust, Inc. | | | (3,621 | ) | | | 0.2 | % | | | (1,945 | ) |
| Tyler Technologies, Inc.* | | | (356 | ) | | | 0.2 | % | | | (1,949 | ) |
| Albemarle Corp. | | | (1,962 | ) | | | 0.2 | % | | | (2,162 | ) |
| On Assignment, Inc.* | | | (863 | ) | | | 0.2 | % | | | (2,239 | ) |
| Sensient Technologies Corp. | | | (2,396 | ) | | | 0.3 | % | | | (2,396 | ) |
| Jack Henry & Associates, Inc. | | | (548 | ) | | | 0.3 | % | | | (2,484 | ) |
| Federal Realty Investment Trust | | | (402 | ) | | | 0.3 | % | | | (2,489 | ) |
| Starbucks Corp. | | | (930 | ) | | | 0.3 | % | | | (2,520 | ) |
| Ferro Corp.* | | | (2,392 | ) | | | 0.3 | % | | | (2,811 | ) |
| Douglas Emmett, Inc. | | | (1,309 | ) | | | 0.3 | % | | | (2,874 | ) |
| National Instruments Corp. | | | (1,772 | ) | | | 0.3 | % | | | (2,925 | ) |
| athenahealth, Inc.* | | | (689 | ) | | | 0.3 | % | | | (3,026 | ) |
| Crown Castle International Corp. | | | (990 | ) | | | 0.3 | % | | | (3,030 | ) |
| TransUnion* | | | (4,870 | ) | | | 0.3 | % | | | (3,179 | ) |
| Bio-Techne Corp. | | | (425 | ) | | | 0.4 | % | | | (3,353 | ) |
| Trustmark Corp. | | | (1,648 | ) | | | 0.4 | % | | | (3,436 | ) |
| PennyMac Mortgage Investment Trust | | | (4,599 | ) | | | 0.4 | % | | | (3,573 | ) |
| Sun Communities, Inc. | | | (2,285 | ) | | | 0.4 | % | | | (3,624 | ) |
| Jack in the Box, Inc. | | | (816 | ) | | | 0.4 | % | | | (3,671 | ) |
| Boston Properties, Inc. | | | (786 | ) | | | 0.4 | % | | | (3,715 | ) |
| Commerce Bancshares, Inc. | | | (1,054 | ) | | | 0.4 | % | | | (3,755 | ) |
| Kilroy Realty Corp. | | | (723 | ) | | | 0.4 | % | | | (4,228 | ) |
| PriceSmart, Inc. | | | (872 | ) | | | 0.5 | % | | | (4,295 | ) |
| SEI Investments Co. | | | (798 | ) | | | 0.5 | % | | | (4,362 | ) |
| WD-40 Co. | | | (492 | ) | | | 0.5 | % | | | (4,416 | ) |
| salesforce.com, Inc.* | | | (623 | ) | | | 0.5 | % | | | (4,443 | ) |
| Ecolab, Inc. | | | (2,019 | ) | | | 0.5 | % | | | (4,448 | ) |
| Air Products & Chemicals, Inc. | | | (1,643 | ) | | | 0.5 | % | | | (4,549 | ) |
| 28 | THE GUGGENHEIM FUNDS ANNUAL REPORT | SEE NOTES TO FINANCIAL STATEMENTS. |
| CONSOLIDATED SCHEDULE OF INVESTMENTS (continued) | December 31, 2017 |
| MULTI-HEDGE STRATEGIES FUND | |
| | | Shares | | | Percentage
Value | | | Value and
Unrealized
Loss | |
| | | | | | | | | | |
| Intercontinental Exchange, Inc. | | | (795 | ) | | | 0.5 | % | | $ | (4,699 | ) |
| DexCom, Inc.* | | | (1,003 | ) | | | 0.5 | % | | | (4,840 | ) |
| Regency Centers Corp. | | | (795 | ) | | | 0.6 | % | | | (5,409 | ) |
| Washington Federal, Inc. | | | (1,927 | ) | | | 0.6 | % | | | (5,509 | ) |
| GrubHub, Inc.* | | | (820 | ) | | | 0.6 | % | | | (6,021 | ) |
| First Midwest Bancorp, Inc. | | | (2,307 | ) | | | 0.7 | % | | | (6,423 | ) |
| Ultimate Software Group, Inc.* | | | (321 | ) | | | 0.7 | % | | | (6,552 | ) |
| Cabot Oil & Gas Corp. — Class A | | | (1,985 | ) | | | 0.7 | % | | | (6,599 | ) |
| Yum! Brands, Inc. | | | (1,170 | ) | | | 0.7 | % | | | (6,661 | ) |
| Extra Space Storage, Inc. | | | (692 | ) | | | 0.7 | % | | | (6,757 | ) |
| Alexandria Real Estate Equities, Inc. | | | (706 | ) | | | 0.8 | % | | | (7,077 | ) |
| Ingevity Corp.* | | | (880 | ) | | | 0.8 | % | | | (7,127 | ) |
| Dril-Quip, Inc.* | | | (1,834 | ) | | | 0.8 | % | | | (7,217 | ) |
| Balchem Corp. | | | (2,104 | ) | | | 0.8 | % | | | (7,878 | ) |
| Take-Two Interactive Software, Inc.* | | | (645 | ) | | | 0.8 | % | | | (7,995 | ) |
| Ally Financial, Inc. | | | (3,005 | ) | | | 0.9 | % | | | (8,023 | ) |
| Martin Marietta Materials, Inc. | | | (806 | ) | | | 0.9 | % | | | (8,270 | ) |
| Red Hat, Inc.* | | | (615 | ) | | | 0.9 | % | | | (8,344 | ) |
| Investors Bancorp, Inc. | | | (9,839 | ) | | | 0.9 | % | | | (8,521 | ) |
| PTC, Inc.* | | | (1,936 | ) | | | 0.9 | % | | | (8,623 | ) |
| Nabors Industries Ltd. | | | (8,998 | ) | | | 1.0 | % | | | (9,264 | ) |
| McDonald’s Corp. | | | (1,329 | ) | | | 1.0 | % | | | (9,610 | ) |
| Carpenter Technology Corp. | | | (1,756 | ) | | | 1.0 | % | | | (9,623 | ) |
| Howard Hughes Corp.* | | | (710 | ) | | | 1.0 | % | | | (9,854 | ) |
| Glacier Bancorp, Inc. | | | (1,619 | ) | | | 1.0 | % | | | (9,869 | ) |
| Team, Inc.* | | | (5,358 | ) | | | 1.1 | % | | | (10,025 | ) |
| Cintas Corp. | | | (1,771 | ) | | | 1.1 | % | | | (10,148 | ) |
| CME Group, Inc. — Class A | | | (664 | ) | | | 1.1 | % | | | (10,237 | ) |
| Moody’s Corp. | | | (1,286 | ) | | | 1.1 | % | | | (10,245 | ) |
| SBA Communications Corp.* | | | (897 | ) | | | 1.1 | % | | | (10,354 | ) |
| Lululemon Athletica, Inc.* | | | (808 | ) | | | 1.1 | % | | | (10,399 | ) |
| Rollins, Inc. | | | (5,851 | ) | | | 1.1 | % | | | (10,414 | ) |
| John Bean Technologies Corp. | | | (476 | ) | | | 1.1 | % | | | (10,797 | ) |
| Cognex Corp. | | | (1,594 | ) | | | 1.2 | % | | | (11,480 | ) |
| Dunkin’ Brands Group, Inc. | | | (921 | ) | | | 1.2 | % | | | (11,488 | ) |
| Weatherford International plc* | | | (15,199 | ) | | | 1.2 | % | | | (11,614 | ) |
| Matador Resources Co.* | | | (2,470 | ) | | | 1.2 | % | | | (11,687 | ) |
| Allegheny Technologies, Inc.* | | | (4,434 | ) | | | 1.3 | % | | | (12,132 | ) |
| Healthcare Services Group, Inc. | | | (5,316 | ) | | | 1.3 | % | | | (12,272 | ) |
| FactSet Research Systems, Inc. | | | (1,245 | ) | | | 1.3 | % | | | (12,291 | ) |
| Aqua America, Inc. | | | (2,112 | ) | | | 1.3 | % | | | (12,397 | ) |
| RSP Permian, Inc.* | | | (2,425 | ) | | | 1.4 | % | | | (12,799 | ) |
| Tanger Factory Outlet Centers, Inc. | | | (7,868 | ) | | | 1.4 | % | | | (13,065 | ) |
| LendingTree, Inc.* | | | (214 | ) | | | 1.4 | % | | | (13,234 | ) |
| FMC Corp. | | | (1,540 | ) | | | 1.4 | % | | | (13,392 | ) |
| MarketAxess Holdings, Inc. | | | (889 | ) | | | 1.4 | % | | | (13,467 | ) |
| SEE NOTES TO FINANCIAL STATEMENTS. | THE GUGGENHEIM FUNDS ANNUAL REPORT | 29 |
| CONSOLIDATED SCHEDULE OF INVESTMENTS (continued) | December 31, 2017 |
| MULTI-HEDGE STRATEGIES FUND | |
| | | Shares | | | Percentage
Value | | | Value and
Unrealized
Loss | |
| | | | | | | | | | |
| Vulcan Materials Co. | | | (1,747 | ) | | | 1.4 | % | | $ | (13,637 | ) |
| People’s United Financial, Inc. | | | (7,215 | ) | | | 1.5 | % | | | (13,818 | ) |
| Marriott International, Inc. — Class A | | | (431 | ) | | | 1.5 | % | | | (13,999 | ) |
| Atlassian Corporation plc — Class A* | | | (1,349 | ) | | | 1.5 | % | | | (14,057 | ) |
| S&P Global, Inc. | | | (1,318 | ) | | | 1.5 | % | | | (14,362 | ) |
| Monolithic Power Systems, Inc. | | | (1,748 | ) | | | 1.6 | % | | | (15,009 | ) |
| Verisk Analytics, Inc. — Class A* | | | (2,914 | ) | | | 1.6 | % | | | (15,044 | ) |
| Adobe Systems, Inc.* | | | (750 | ) | | | 1.6 | % | | | (15,479 | ) |
| WisdomTree Investments, Inc. | | | (11,625 | ) | | | 1.7 | % | | | (15,610 | ) |
| Ollie’s Bargain Outlet Holdings, Inc.* | | | (1,453 | ) | | | 1.8 | % | | | (16,800 | ) |
| Callon Petroleum Co.* | | | (7,696 | ) | | | 1.8 | % | | | (17,364 | ) |
| Covanta Holding Corp. | | | (8,797 | ) | | | 1.9 | % | | | (17,810 | ) |
| Nike, Inc. — Class B | | | (2,509 | ) | | | 2.0 | % | | | (18,231 | ) |
| Trex Company, Inc.* | | | (602 | ) | | | 2.0 | % | | | (18,588 | ) |
| Scotts Miracle-Gro Co. — Class A | | | (1,575 | ) | | | 2.0 | % | | | (19,068 | ) |
| Goldman Sachs Group, Inc. | | | (846 | ) | | | 2.0 | % | | | (19,097 | ) |
| Shake Shack, Inc. — Class A* | | | (1,533 | ) | | | 2.1 | % | | | (19,328 | ) |
| Commercial Metals Co. | | | (6,084 | ) | | | 2.1 | % | | | (19,888 | ) |
| Crocs, Inc.* | | | (5,258 | ) | | | 2.1 | % | | | (20,071 | ) |
| Five Below, Inc.* | | | (1,054 | ) | | | 2.3 | % | | | (21,149 | ) |
| Eaton Vance Corp. | | | (2,390 | ) | | | 2.3 | % | | | (21,769 | ) |
| Compass Minerals International, Inc. | | | (3,871 | ) | | | 2.5 | % | | | (23,063 | ) |
| Diamondback Energy, Inc.* | | | (1,206 | ) | | | 2.5 | % | | | (23,866 | ) |
| Southern Copper Corp. | | | (5,346 | ) | | | 2.8 | % | | | (26,125 | ) |
| International Flavors & Fragrances, Inc. | | | (1,780 | ) | | | 3.1 | % | | | (28,845 | ) |
| Cboe Global Markets, Inc. | | | (2,289 | ) | | | 3.3 | % | | | (30,921 | ) |
| Pool Corp. | | | (1,038 | ) | | | 3.5 | % | | | (32,256 | ) |
| Parsley Energy, Inc. — Class A* | | | (7,438 | ) | | | 3.5 | % | | | (32,715 | ) |
| Copart, Inc.* | | | (7,386 | ) | | | 5.9 | % | | | (55,349 | ) |
| Total Custom Basket of Short Securities | | | | | | | | | | $ | (940,750 | ) |
| | | | | | | | | | | | | |
| CUSTOM BASKET OF LONG SECURITIES10 |
| Boyd Gaming Corp. | | | 20,649 | | | | 39.3 | % | | $ | 187,022 | |
| National Storage Affiliates Trust | | | 40,236 | | | | 26.3 | % | | | 125,092 | |
| Tier REIT, Inc. | | | 39,421 | | | | 14.5 | % | | | 69,197 | |
| Alexandria Real Estate Equities, Inc. | | | 7,106 | | | | 12.8 | % | | | 60,746 | |
| GGP, Inc. | | | 37,387 | | | | 11.9 | % | | | 56,758 | |
| Caesars Entertainment Corp.* | | | 66,311 | | | | 10.3 | % | | | 49,119 | |
| RLJ Lodging Trust | | | 39,842 | | | | 9.7 | % | | | 46,185 | |
| Rayonier, Inc. | | | 18,779 | | | | 9.0 | % | | | 42,681 | |
| Regency Centers Corp. | | | 8,327 | | | | 7.6 | % | | | 36,091 | |
| Weyerhaeuser Co. | | | 16,931 | | | | 7.2 | % | | | 34,079 | |
| Pennsylvania Real Estate Investment Trust | | | 33,290 | | | | 5.0 | % | | | 23,928 | |
| 30 | THE GUGGENHEIM FUNDS ANNUAL REPORT | SEE NOTES TO FINANCIAL STATEMENTS. |
| CONSOLIDATED SCHEDULE OF INVESTMENTS (continued) | December 31, 2017 |
| MULTI-HEDGE STRATEGIES FUND | |
| | | Shares | | | Percentage
Value | | | Value and
Unrealized
Gain (Loss) | |
| | | | | | | | | | |
| Federal Realty Investment Trust | | | 4,195 | | | | 4.3 | % | | $ | 20,467 | |
| Invitation Homes, Inc. | | | 40,734 | | | | 4.0 | % | | | 19,180 | |
| Crown Castle International Corp. | | | 8,541 | | | | 3.9 | % | | | 18,759 | |
| Blackstone Mortgage Trust, Inc. — Class A | | | 25,865 | | | | 3.7 | % | | | 17,663 | |
| Sun Communities, Inc. | | | 9,056 | | | | 3.7 | % | | | 17,445 | |
| Prologis, Inc. | | | 13,408 | | | | 1.8 | % | | | 8,655 | |
| American Homes 4 Rent — Class A | | | 37,528 | | | | 1.6 | % | | | 7,395 | |
| Cousins Properties, Inc. | | | 58,531 | | | | (0.3 | %) | | | (1,319 | ) |
| Equity LifeStyle Properties, Inc. | | | 7,432 | | | | (0.4 | %) | | | (1,974 | ) |
| Extended Stay America, Inc. | | | 28,399 | | | | (0.5 | %) | | | (2,287 | ) |
| EastGroup Properties, Inc. | | | 9,884 | | | | (1.2 | %) | | | (5,618 | ) |
| Iron Mountain, Inc. | | | 14,121 | | | | (1.4 | %) | | | (6,805 | ) |
| Spirit Realty Capital, Inc. | | | 85,703 | | | | (1.5 | %) | | | (7,065 | ) |
| Jernigan Capital, Inc. | | | 9,797 | | | | (2.2 | %) | | | (10,603 | ) |
| Healthcare Trust of America, Inc. — Class A | | | 17,283 | | | | (3.0 | %) | | | (14,268 | ) |
| Physicians Realty Trust | | | 29,587 | | | | (3.4 | %) | | | (16,237 | ) |
| MGM Growth Properties LLC — Class A | | | 18,369 | | | | (3.9 | %) | | | (18,757 | ) |
| Gaming and Leisure Properties, Inc. | | | 14,919 | | | | (4.3 | %) | | | (20,352 | ) |
| Summit Hotel Properties, Inc. | | | 33,695 | | | | (4.4 | %) | | | (20,733 | ) |
| Equinix, Inc. | | | 1,860 | | | | (6.2 | %) | | | (29,586 | ) |
| Rexford Industrial Realty, Inc. | | | 33,275 | | | | (6.7 | %) | | | (32,062 | ) |
| American Tower Corp. — Class A | | | 6,188 | | | | (6.8 | %) | | | (32,166 | ) |
| CyrusOne, Inc. | | | 13,779 | | | | (7.1 | %) | | | (33,718 | ) |
| Sabra Health Care REIT, Inc. | | | 36,745 | | | | (23.3 | %) | | | (110,858 | ) |
| Total Custom Basket of Long Securities | | | | | | | | | | $ | 476,054 | |
| | | | | | | | | | | | | |
| CUSTOM BASKET OF SHORT SECURITIES12 |
| Colony NorthStar, Inc. — Class A | | | (55,578 | ) | | | (74.0 | %) | | $ | 88,108 | |
| Omega Healthcare Investors, Inc. | | | (24,032 | ) | | | (69.4 | %) | | | 82,495 | |
| CareTrust REIT, Inc. | | | (34,461 | ) | | | (68.9 | %) | | | 82,075 | |
| VEREIT, Inc. | | | (110,644 | ) | | | (48.5 | %) | | | 57,800 | |
| CoreCivic, Inc. | | | (13,898 | ) | | | (42.0 | %) | | | 49,993 | |
| GEO Group, Inc. | | | (12,422 | ) | | | (37.4 | %) | | | 44,532 | |
| PS Business Parks, Inc. | | | (4,205 | ) | | | (34.2 | %) | | | 40,792 | |
| Lexington Realty Trust | | | (86,414 | ) | | | (30.6 | %) | | | 36,425 | |
| Apartment Investment & Management Co. — Class A | | | (23,695 | ) | | | (30.3 | %) | | | 36,069 | |
| iShares U.S. Real Estate ETF | | | (69,012 | ) | | | (22.0 | %) | | | 26,181 | |
| Piedmont Office Realty Trust, Inc. — Class A | | | (37,137 | ) | | | (18.4 | %) | | | 21,953 | |
| Mid-America Apartment Communities, Inc. | | | (7,784 | ) | | | (12.6 | %) | | | 15,005 | |
| Senior Housing Properties Trust | | | (48,784 | ) | | | (12.4 | %) | | | 14,716 | |
| SEE NOTES TO FINANCIAL STATEMENTS. | THE GUGGENHEIM FUNDS ANNUAL REPORT | 31 |
| CONSOLIDATED SCHEDULE OF INVESTMENTS (continued) | December 31, 2017 |
| MULTI-HEDGE STRATEGIES FUND | |
| | | Shares | | | Percentage
Value | | | Value and
Unrealized
Gain (Loss) | |
| | | | | | | | | | |
| LaSalle Hotel Properties | | | (27,646 | ) | | | (6.3 | %) | | $ | 7,527 | |
| Brixmor Property Group, Inc. | | | (31,993 | ) | | | (0.6 | %) | | | 707 | |
| Liberty Property Trust | | | (18,685 | ) | | | 2.8 | % | | | (3,392 | ) |
| Public Storage | | | (2,862 | ) | | | 3.5 | % | | | (4,224 | ) |
| Weingarten Realty Investors | | | (20,153 | ) | | | 11.9 | % | | | (14,122 | ) |
| Chesapeake Lodging Trust | | | (22,955 | ) | | | 15.9 | % | | | (18,921 | ) |
| SL Green Realty Corp. | | | (7,687 | ) | | | 22.2 | % | | | (26,389 | ) |
| National Retail Properties, Inc. | | | (21,786 | ) | | | 23.2 | % | | | (27,591 | ) |
| Jones Lang LaSalle, Inc. | | | (2,824 | ) | | | 45.0 | % | | | (53,580 | ) |
| Macerich Co. | | | (6,682 | ) | | | 45.3 | % | | | (53,925 | ) |
| CBRE Group, Inc. — Class A* | | | (13,574 | ) | | | 69.5 | % | | | (82,736 | ) |
| Chatham Lodging Trust | | | (39,871 | ) | | | 71.7 | % | | | (85,361 | ) |
| Wynn Resorts Ltd. | | | (3,650 | ) | | | 83.4 | % | | | (99,337 | ) |
| Tanger Factory Outlet Centers, Inc. | | | (36,110 | ) | | | 95.9 | % | | | (114,210 | ) |
| Life Storage, Inc. | | | (11,035 | ) | | | 117.3 | % | | | (139,691 | ) |
| Total Custom Basket of Short Securities | | | | | | | | | | $ | (119,101 | ) |
| | | | | | | | | | | | | |
| CUSTOM BASKET OF LONG SECURITIES11 |
| Regal Entertainment Group — Class A | | | 31,236 | | | | 96.4 | % | | $ | 15,617 | |
| Calpine Corp.* | | | 13,081 | | | | 31.7 | % | | | 5,138 | |
| magicJack VocalTec Ltd.* | | | 41,516 | | | | 23.1 | % | | | 3,736 | |
| Straight Path Communications, Inc. — Class B* | | | 2,150 | | | | 20.3 | % | | | 3,287 | |
| Avista Corp. | | | 7,585 | | | | 6.8 | % | | | 1,104 | |
| Calgon Carbon Corp. | | | 18,151 | | | | (3.9 | %) | | | (635 | ) |
| Sparton Corp.* | | | 8,329 | | | | (7.2 | %) | | | (1,161 | ) |
| Akorn, Inc.* | | | 11,622 | | | | (67.2 | %) | | | (10,883 | ) |
| Total Custom Basket of Long Securities | | | | | | | | | | $ | 16,203 | |
| 32 | THE GUGGENHEIM FUNDS ANNUAL REPORT | SEE NOTES TO FINANCIAL STATEMENTS. |
| CONSOLIDATED SCHEDULE OF INVESTMENTS (continued) | December 31, 2017 |
| MULTI-HEDGE STRATEGIES FUND | |
| ~ | | The face amount is denominated in U.S. dollars unless otherwise indicated. |
| * | | Non-income producing security. |
| † | | Value determined based on Level 1 inputs, unless otherwise noted — See Note 4. |
| †† | | Value determined based on Level 2 inputs — See Note 4. |
| 1 | | All or portion of this security is on loan at December 31, 2017 — See Note 6. |
| 2 | | Affiliated issuer. |
| 3 | | Rate indicated is the effective yield at the time of purchase. |
| 4 | | Zero coupon rate security. |
| 5 | | All or a portion of this security is pledged as futures collateral at December 31, 2017. |
| 6 | | Repurchase Agreements — See Note 5. |
| 7 | | Securities lending collateral — See Note 6. |
| 8 | | Rate indicated is the 7 day yield as of December 31, 2017. |
| 9 | | Total Return based on the return of the custom SMQLS short basket of securities +/- financing at a variable rate. Rate indicated is rate effective at December 31, 2017. |
| 10 | | Total Return based on the return of the custom MNRE short basket of securities +/- financing at a variable rate. Rate indicated is rate effective at December 31, 2017. |
| 11 | | Total Return based on the return of the custom MRGR long basket of securities +/- financing at a variable rate. Rate indicated is rate effective at December 31, 2017. |
| 12 | | Total Return based on the return of the custom MNRE long basket of securities +/- financing at a variable rate. Rate indicated is rate effective at December 31, 2017. |
| 13 | | Total Return based on the return of the custom SMQLS long basket of securities +/- financing at a variable rate. Rate indicated is rate effective at December 31, 2017. |
| 14 | | All or a portion of this security is pledged as short security collateral at December 31, 2017. |
| 15 | | All or a portion of this security is pledged as swap collateral at December 31, 2017. |
| | | plc — Public Limited Corporation |
| | | REIT — Real Estate Investment Trust |
| | | |
| | | See Sector Classification in Other Information section. |
| SEE NOTES TO FINANCIAL STATEMENTS. | THE GUGGENHEIM FUNDS ANNUAL REPORT | 33 |
| CONSOLIDATED SCHEDULE OF INVESTMENTS (continued) | December 31, 2017 |
| MULTI-HEDGE STRATEGIES FUND | |
The following table summarizes the inputs used to value the Fund’s investments at December 31, 2017 (See Note 4 in the Notes to Consolidated Financial Statements):
Investments in
Securities (Assets) | | Level 1
Quoted
Prices | | | Level 1 -
Other* | | | Level 2
Significant
Observable
Inputs | | | Level 2 -
Other* | | | Level 3
Significant
Unobservable
Inputs | | | Total | |
| Commodity Futures Contracts | | $ | — | | | $ | 284,185 | | | $ | — | | | $ | — | | | $ | — | | | $ | 284,185 | |
| Common Stocks | | | 17,354,413 | | | | — | | | | — | | | | — | | | | — | | | | 17,354,413 | |
| Closed-End Funds | | | 5,834,853 | | | | — | | | | — | | | | — | | | | — | | | | 5,834,853 | |
| Currency Futures Contracts | | | — | | | | 62,028 | | | | — | | | | — | | | | — | | | | 62,028 | |
| Equity Futures Contracts | | | — | | | | 3,546,777 | | | | — | | | | 7,918 | | | | — | | | | 3,554,695 | |
| Interest Rate Futures Contracts | | | — | | | | 14,943 | | | | — | | | | 9,062 | | | | — | | | | 24,005 | |
| Mutual Funds | | | 15,706,196 | | | | — | | | | — | | | | — | | | | — | | | | 15,706,196 | |
| Custom Basket Swap Agreements | | | — | | | | — | | | | — | | | | 1,881,014 | | | | — | | | | 1,881,014 | |
| Repurchase Agreement | | | — | | | | — | | | | 800,508 | | | | — | | | | — | | | | 800,508 | |
| Right | | | — | | | | — | | | | — | ** | | | — | | | | — | | | | — | ** |
| Securities Lending Collateral | | | 286,287 | | | | — | | | | — | | | | — | | | | — | | | | 286,287 | |
| U.S. Treasury Bills | | | — | | | | — | | | | 11,986,329 | | | | — | | | | — | | | | 11,986,329 | |
| Total Assets | | $ | 39,181,749 | | | $ | 3,907,933 | | | $ | 12,786,837 | | | $ | 1,897,994 | | | $ | — | | | $ | 57,774,513 | |
| | | | | | | | | | | | | | | | | | | | | | | | | |
Investments in
Securities (Liabilities) | | | Level 1
Quoted
Prices | | | | Level 1 -
Other* | | | | Level 2 Significant Observable Inputs | | | | Level 2 -
Other* | | | | Level 3
Significant
Unobservable
Inputs | | | | Total | |
| Commodity Futures Contracts | | $ | — | | | $ | 60,793 | | | $ | — | | | $ | — | | | $ | — | | | $ | 60,793 | |
| Common Stocks | | | 6,264,703 | | | | — | | | | — | | | | — | | | | — | | | | 6,264,703 | |
| Currency Futures Contracts | | | — | | | | 14,829 | | | | — | | | | — | | | | — | | | | 14,829 | |
| Equity Futures Contracts | | | — | | | | 1,361,256 | | | | — | | | | 17,688 | | | | — | | | | 1,378,944 | |
| Exchange-Traded Funds | | | 6,946,704 | | | | — | | | | — | | | | — | | | | — | | | | 6,946,704 | |
| Interest Rate Futures Contracts | | | — | | | | 822 | | | | — | | | | 42,463 | | | | — | | | | 43,285 | |
| Custom Basket Swap Agreements | | | — | | | | — | | | | — | | | | 1,059,851 | | | | — | | | | 1,059,851 | |
| Total Liabilities | | $ | 13,211,407 | | | $ | 1,437,700 | | | $ | — | | | $ | 1,120,002 | | | $ | — | | | $ | 15,769,109 | |
| * | | Other financial instruments include futures contracts and/or swaps, which are reported as unrealized gain/loss at period end. |
| ** | | Includes security with a market value of $0. |
Transfers between investment levels may occur as the markets fluctuate and/or the availability of data used in an investment’s valuation changes. Transfers between valuation levels, if any, are in comparison to the valuation levels at the end of the previous fiscal year, and are effective using the fair value as of the end of the current fiscal period.
For the year ended December 31, 2017, there were no transfers between levels.
| 34 | THE GUGGENHEIM FUNDS ANNUAL REPORT | SEE NOTES TO FINANCIAL STATEMENTS. |
| CONSOLIDATED SCHEDULE OF INVESTMENTS (continued) | December 31, 2017 |
| MULTI-HEDGE STRATEGIES FUND | |
Affiliated Transactions
Investments representing 5% or more of the outstanding voting shares of a portfolio company of a fund, or control of or by, or common control under Guggenheim Investments (“GI”), result in that portfolio company being considered an affiliated company of such fund, as defined in the 1940 Act.
The Fund may invest in the underlying series of the Guggenheim Strategy Funds Trust consisting of Guggenheim Strategy Fund I, Guggenheim Strategy Fund II, Guggenheim Strategy Fund III, and Guggenheim Variable Insurance Strategy Fund III (collectively, the “Cash Management Funds”), open-end management investment companies managed by GI. The Cash Management Funds, which launched on March 11, 2014, are offered as cash management options only to mutual funds, trusts, and other accounts managed by GI and/or its affiliates, and are not available to the public. The Cash Management Funds pay no investment management fees. The Cash Management Funds’ annual report on Form N-CSR dated September 30, 2017, is available publicly or upon request. This information is available from the EDGAR database on the SEC’s website at https://www.sec.gov/Archives/edgar/data/1601445/000089180417000715/gug72218.htm.
Transactions during the year ended December 31, 2017, in which the portfolio company is an “affiliated person”, were as follows:
| Security Name | | Value 12/31/16 | | | Additions | | | Reductions | | | Realized Gain (Loss) | | | Corporate Actions | | | Change in Unrealized | | | Value 12/31/17 | |
| Closed-End Funds | | | | | | | | | | | | | | | | | | | | | |
| Advent Claymore Convertible Securities and Income Fund | | $ | 8,837 | | | $ | 48,873 | | | $ | (25,293 | ) | | $ | (56 | ) | | | — | | | $ | 415 | | | $ | 32,776 | |
| Advent Claymore Convertible Securities and Income Fund II | | | 202,831 | | | | 35,845 | | | | (215,520 | ) | | | (20,722 | ) | | | — | | | | 30,128 | | | | 32,562 | |
| Advent/Claymore Enhanced Growth & Income Fund | | | 60,763 | | | | 39,907 | | | | (70,663 | ) | | | (5,454 | ) | | | — | | | | 7,840 | | | | 32,393 | |
| Guggenheim Enhanced Equity Income Fund | | | — | | | | 23,840 | | | | (3 | ) | | | — | | | | 6,385 | | | | 1,329 | | | | 31,551 | |
| Guggenheim Enhanced Equity Strategy Fund | | | 8,366 | | | | — | | | | (9,046 | ) | | | 682 | | | | — | | | | (2 | ) | | | — | |
| Guggenheim Equal Weight Enhanced Equity Income Fund | | | 7,956 | | | | — | | | | (1,469 | ) | | | 57 | | | | (6,385 | ) | | | (159 | ) | | | — | |
| Western Asset/Claymore Inflation-Linked Opportunities & Income Fund | | | 441,333 | | | | — | | | | (404,723 | ) | | | (55,646 | ) | | | — | | | | 53,559 | | | | 34,523 | |
| Western Asset/Claymore Inflation-Linked Securities & Income Fund | | | 400,480 | | | | — | | | | (361,180 | ) | | | (42,421 | ) | | | — | | | | 37,902 | | | | 34,781 | |
| Mutual Funds | | | | | | | | | | | | | | | | | | | | | | | | | | | | |
| Guggenheim Strategy Fund I | | | 25,559 | | | | 8,061,883 | | | | (8,000,000 | ) | | | (9,615 | ) | | | — | | | | 32 | | | | 77,859 | |
| Guggenheim Strategy Fund II | | | 6,081 | | | | 8,073,016 | | | | (500,000 | ) | | | (826 | ) | | | — | | | | (12,011 | ) | | | 7,566,260 | |
| Guggenheim Strategy Fund III | | | — | | | | 8,065,314 | | | | — | | | | — | | | | — | | | | (3,237 | ) | | | 8,062,077 | |
| | | $ | 1,162,206 | | | $ | 24,348,678 | | | $ | (9,587,897 | ) | | $ | (134,001 | ) | | $ | — | | | $ | 115,796 | | | $ | 15,904,782 | |
| SEE NOTES TO FINANCIAL STATEMENTS. | THE GUGGENHEIM FUNDS ANNUAL REPORT | 35 |
| CONSOLIDATED SCHEDULE OF INVESTMENTS (concluded) | December 31, 2017 |
| MULTI-HEDGE STRATEGIES FUND | |
| Security Name | | Shares
12/31/17 | | | Investment
Income | | | Capital Gains
Distributions | |
| Closed-End Funds | | | | | | | | | |
| Advent Claymore Convertible Securities and Income Fund | | | 2,064 | | | $ | 1,408 | | | $ | — | |
| Advent Claymore Convertible Securities and Income Fund II | | | 5,436 | | | | 9,922 | | | | — | |
| Advent/Claymore Enhanced Growth & Income Fund | | | 3,884 | | | | 4,179 | | | | — | |
| Guggenheim Enhanced Equity Income Fund | | | 3,545 | | | | 598 | | | | — | |
| Guggenheim Enhanced Equity Strategy Fund | | | — | | | | — | | | | — | |
| Guggenheim Equal Weight Enhanced Equity Income Fund | | | — | | | | 213 | | | | — | |
| Western Asset/Claymore Inflation-Linked Opportunities & Income Fund | | | 3,023 | | | | 8,433 | | | | — | |
| Western Asset/Claymore Inflation-Linked Securities & Income Fund | | | 2,950 | | | | 7,268 | | | | — | |
| Mutual Funds | | | | | | | | | | | | |
| Guggenheim Strategy Fund I | | | 3,107 | | | | 58,826 | | | | 3,056 | |
| Guggenheim Strategy Fund II | | | 302,529 | | | | 68,340 | | | | 4,291 | |
| Guggenheim Strategy Fund III | | | 322,225 | | | | 62,960 | | | | 1,961 | |
| | | | | | | $ | 222,147 | | | $ | 9,308 | |
| 36 | THE GUGGENHEIM FUNDS ANNUAL REPORT | SEE NOTES TO FINANCIAL STATEMENTS. |
| CONSOLIDATED STATEMENT OF ASSETS AND LIABILITIES |
| MULTI-HEDGE STRATEGIES FUND |
December 31, 2017
| Assets: |
| Investments in unaffiliated issuers, at value - including $277,910 of securities loaned (cost $33,958,291) | | $ | 35,263,296 | |
| Investments in affiliated issuers, at value (cost $15,912,694) | | | 15,904,782 | |
| Repurchase agreements, at value (cost $800,508) | | | 800,508 | |
| Cash | | | 18,021,204 | |
| Segregated cash with broker | | | 1,335,190 | |
| Unrealized appreciation on swap agreements | | | 1,881,014 | |
| Receivables: |
| Securities Sold | | | 812,134 | |
| Dividends | | | 72,249 | |
| Fund shares sold | | | 7,093 | |
| Securities lending income | | | 328 | |
| Interest | | | 94 | |
| Total assets | | | 74,097,892 | |
| | | | | |
| Liabilities: |
| Securities sold short, at value (proceeds $12,693,532) | | | 13,211,407 | |
| Unrealized depreciation on swap agreements | | | 1,059,851 | |
| Payable for: |
| Return of securities loaned | | | 286,287 | |
| Variation margin | | | 117,032 | |
| Management fees | | | 69,200 | |
| Swap settlement | | | 61,594 | |
| Securities purchased | | | 35,292 | |
| Fund shares redeemed | | | 15,734 | |
| Distribution and service fees | | | 12,351 | |
| Miscellaneous | | | 46,304 | |
| Total liabilities | | | 14,915,052 | |
| Commitments and contingent liabilities (Note 12) | | | — | |
| Net assets | | $ | 59,182,840 | |
| | | | | |
| Net assets consist of: |
| Paid in capital | | $ | 62,073,602 | |
| Accumulated net investment loss | | | (3,882,861 | ) |
| Accumulated net realized loss on investments | | | (3,034,996 | ) |
| Net unrealized appreciation on investments | | | 4,027,095 | |
| Net assets | | $ | 59,182,840 | |
| | | | | |
| A-Class: |
| Net assets | | $ | 12,154,183 | |
| Capital shares outstanding | | | 487,826 | |
| Net asset value per share | | $ | 24.91 | |
| Maximum offering price per share (Net asset value divided by 95.25%) | | $ | 26.15 | |
| | | | | |
| C-Class: |
| Net assets | | $ | 7,586,445 | |
| Capital shares outstanding | | | 334,496 | |
| Net asset value per share | | $ | 22.68 | |
| | | | | |
| P-Class: |
| Net assets | | $ | 14,065,762 | |
| Capital shares outstanding | | | 564,198 | |
| Net asset value per share | | $ | 24.93 | |
| | | | | |
| Institutional Class: |
| Net assets | | $ | 25,376,450 | |
| Capital shares outstanding | | | 998,453 | |
| Net asset value per share | | $ | 25.42 | |
| SEE NOTES TO FINANCIAL STATEMENTS. | THE GUGGENHEIM FUNDS ANNUAL REPORT | 37 |
| CONSOLIDATED STATEMENT OF OPERATIONS |
| MULTI-HEDGE STRATEGIES FUND |
Year Ended December 31, 2017
| Investment Income: |
| Dividends from securities of unaffiliated issuers (net of foreign withholding tax of $751) | | $ | 838,540 | |
| Dividends from securities of affiliated issuers | | | 222,147 | |
| Interest | | | 235,832 | |
| Income from securities lending, net | | | 10,147 | |
| Total investment income | | | 1,306,666 | |
| | | | | |
| Expenses: |
| Management fees | | | 976,403 | |
| Distribution and service fees: |
| A-Class | | | 28,820 | |
| C-Class | | | 83,167 | |
| P-Class | | | 47,455 | |
| Short sales dividend expense | | | 587,408 | |
| Trustees’ fees* | | | 11,114 | |
| Custodian fees | | | 2,006 | |
| Line of credit fees | | | 691 | |
| Miscellaneous | | | 5,754 | |
| Total expenses | | | 1,742,818 | |
| Less: |
| Expenses waived by Adviser | | | (32,952 | ) |
| Total waived expenses | | | (32,952 | ) |
| Net expenses | | | 1,709,866 | |
| Net investment loss | | | (403,200 | ) |
| | | | | |
| Net Realized and Unrealized Gain (Loss): |
| Net realized gain (loss) on: |
| Investments in unaffiliated issuers | | $ | 9,186,133 | |
| Investments in affiliated issuers | | | (134,001 | ) |
| Swap agreements | | | 1,059,445 | |
| Futures contracts | | | (1,754,376 | ) |
| Foreign currency transactions | | | 992 | |
| Securities sold short | | | (4,182,555 | ) |
| Options written | | | 1,607 | |
| Distributions received from affiliated investment company shares | | | 9,308 | |
| Net realized gain | | | 4,186,553 | |
| Net change in unrealized appreciation (depreciation) on: |
| Investments in unaffiliated issuers | | | (4,012,851 | ) |
| Investments in affiliated issuers | | | 115,796 | |
| Securities sold short | | | 76,269 | |
| Swap agreements | | | 950,291 | |
| Futures contracts | | | 1,764,642 | |
| Options written | | | 26,345 | |
| Foreign currency translations | | | (437 | ) |
| Net change in unrealized appreciation (depreciation) | | | (1,079,945 | ) |
| Net realized and unrealized gain | | | 3,106,608 | |
| Net increase in net assets resulting from operations | | $ | 2,703,408 | |
| * | | Relates to Trustees not deemed "interested persons" within the meaning of Section 2(a)(19) of the 1940 Act. |
| 38 | THE GUGGENHEIM FUNDS ANNUAL REPORT | SEE NOTES TO FINANCIAL STATEMENTS. |
| CONSOLIDATED STATEMENTS OF CHANGES IN NET ASSETS |
| MULTI-HEDGE STRATEGIES FUND | |
| | | Year Ended
December 31,
2017 | | | Year Ended
December 31,
2016 | |
| Increase (Decrease) in Net Assets from Operations: | | | | | | |
| Net investment loss | | $ | (403,200 | ) | | $ | (1,220,398 | ) |
| Net realized gain (loss) on investments | | | 4,186,553 | | | | (286,300 | ) |
| Net change in unrealized appreciation (depreciation) on investments | | | (1,079,945 | ) | | | 714,838 | |
| Net increase (decrease) in net assets resulting from operations | | | 2,703,408 | | | | (791,860 | ) |
| | | | | | | | | |
| Distributions to shareholders from: | | | | | | | | |
| Net investment income | | | | | | | | |
| A-Class | | | — | | | | (18,960 | ) |
| C-Class | | | — | | | | (13,563 | ) |
| P-Class | | | — | | | | (47,562 | ) |
| Institutional Class | | | — | | | | (80,274 | ) |
| Total distributions to shareholders | | | — | | | | (160,359 | ) |
| | | | | | | | | |
| Capital share transactions: | | | | | | | | |
| Proceeds from sale of shares | | | | | | | | |
| A-Class | | | 2,850,883 | | | | 4,253,544 | |
| C-Class | | | 1,628,637 | | | | 5,080,618 | |
| P-Class | | | 3,125,112 | | | | 29,060,073 | |
| Institutional Class | | | 15,878,460 | | | | 22,680,675 | |
| Distributions reinvested | | | | | | | | |
| A-Class | | | — | | | | 17,082 | |
| C-Class | | | — | | | | 11,255 | |
| P-Class | | | — | | | | 45,475 | |
| Institutional Class | | | — | | | | 76,006 | |
| Cost of shares redeemed | | | | | | | | |
| A-Class | | | (3,503,508 | ) | | | (7,364,993 | ) |
| C-Class | | | (2,841,065 | ) | | | (5,699,800 | ) |
| P-Class | | | (20,356,262 | ) | | | (47,382,265 | ) |
| Institutional Class | | | (42,500,227 | ) | | | (21,871,294 | ) |
| Net decrease from capital share transactions | | | (45,717,970 | ) | | | (21,093,624 | ) |
| Net decrease in net assets | | | (43,014,562 | ) | | | (22,045,843 | ) |
| | | | | | | | | |
| Net assets: | | | | | | | | |
| Beginning of year | | | 102,197,402 | | | | 124,243,245 | |
| End of year | | $ | 59,182,840 | | | $ | 102,197,402 | |
| Accumulated net investment loss at end of year | | $ | (3,882,861 | ) | | $ | (3,833,116 | ) |
| SEE NOTES TO FINANCIAL STATEMENTS. | THE GUGGENHEIM FUNDS ANNUAL REPORT | 39 |
| CONSOLIDATED STATEMENTS OF CHANGES IN NET ASSETS (concluded) |
| MULTI-HEDGE STRATEGIES FUND | |
| | | Year Ended
December 31,
2017 | | | Year Ended
December 31,
2016 | |
| Capital share activity: | | | | | | | | |
| Shares sold | | | | | | | | |
| A-Class | | | 117,556 | | | | 176,821 | |
| C-Class | | | 73,750 | | | | 228,850 | |
| P-Class | | | 129,187 | | | | 1,203,802 | |
| Institutional Class | | | 647,744 | | | | 926,919 | |
| Shares issued from reinvestment of distributions | | | | | | | | |
| A-Class | | | — | | | | 710 | |
| C-Class | | | — | | | | 510 | |
| P-Class | | | — | | | | 1,890 | |
| Institutional Class | | | — | | | | 3,106 | |
| Shares redeemed | | | | | | | | |
| A-Class | | | (145,028 | ) | | | (307,132 | ) |
| C-Class | | | (128,450 | ) | | | (257,538 | ) |
| P-Class | | | (843,272 | ) | | | (1,971,217 | ) |
| Institutional Class | | | (1,706,155 | ) | | | (896,437 | ) |
| Net decrease in shares | | | (1,854,668 | ) | | | (889,716 | ) |
| 40 | THE GUGGENHEIM FUNDS ANNUAL REPORT | SEE NOTES TO FINANCIAL STATEMENTS. |
| CONSOLIDATED FINANCIAL HIGHLIGHTS |
| MULTI-HEDGE STRATEGIES FUND | |
This table is presented to show selected data for a share outstanding throughout each period and to assist shareholders in evaluating a Fund’s performance for the periods presented.
| A-Class | | Year Ended
Dec. 31,
2017 | | | Year Ended
Dec. 31,
2016 | | | Year Ended
Dec. 31,
2015 | | | Year Ended
Dec. 31,
2014 | | | Year Ended
Dec. 31,
2013 | |
| Per Share Data | | | | | | | | | | | | | | | | | | | | |
| Net asset value, beginning of period | | $ | 24.08 | | | $ | 24.22 | | | $ | 23.94 | | | $ | 23.03 | | | $ | 22.68 | |
| Income (loss) from investment operations: |
| Net investment income (loss)a | | | (.13 | ) | | | (.24 | ) | | | (.23 | ) | | | (.26 | ) | | | (.18 | ) |
| Net gain (loss) on investments (realized and unrealized) | | | .96 | | | | .14 | | | | .51 | | | | 1.36 | | | | .53 | |
| Total from investment operations | | | .83 | | | | (.10 | ) | | | .28 | | | | 1.10 | | | | .35 | |
| Less distributions from: |
| Net investment income | | | — | | | | (.04 | ) | | | — | | | | (.19 | ) | | | — | |
| Total distributions | | | — | | | | (.04 | ) | | | — | | | | (.19 | ) | | | — | |
| Net asset value, end of period | | $ | 24.91 | | | $ | 24.08 | | | $ | 24.22 | | | $ | 23.94 | | | $ | 23.03 | |
| | | | | | | | | | | | | | | | | | | | | |
| Total Returnb | | | 3.49 | % | | | (0.43 | %) | | | 1.21 | % | | | 4.73 | % | | | 1.54 | % |
| Ratios/Supplemental Data |
| Net assets, end of period (in thousands) | | $ | 12,154 | | | $ | 12,407 | | | $ | 15,620 | | | $ | 11,620 | | | $ | 18,307 | |
| Ratios to average net assets: |
| Net investment income (loss) | | | (0.53 | %) | | | (1.00 | %) | | | (0.96 | %) | | | (1.13 | %) | | | (0.79 | %) |
| Total expensesc | | | 2.18 | % | | | 2.54 | % | | | 2.72 | % | | | 2.86 | % | | | 2.74 | % |
| Net expensesd,e | | | 2.14 | % | | | 2.49 | % | | | 2.65 | % | | | 2.81 | % | | | 2.69 | % |
| Portfolio turnover rate | | | 172 | % | | | 123 | % | | | 163 | % | | | 304 | % | | | 302 | % |
| SEE NOTES TO FINANCIAL STATEMENTS. | THE GUGGENHEIM FUNDS ANNUAL REPORT | 41 |
| CONSOLIDATED FINANCIAL HIGHLIGHTS (continued) |
| MULTI-HEDGE STRATEGIES FUND | |
This table is presented to show selected data for a share outstanding throughout each period and to assist shareholders in evaluating a Fund’s performance for the periods presented.
| C-Class | | Year Ended
Dec. 31,
2017 | | | Year Ended
Dec. 31,
2016 | | | Year Ended
Dec. 31,
2015 | | | Year Ended
Dec. 31,
2014 | | | Year Ended
Dec. 31,
2013 | |
| Per Share Data | | | | | | | | | | | | | | | | | | | | |
| Net asset value, beginning of period | | $ | 22.08 | | | $ | 22.38 | | | $ | 22.29 | | | $ | 21.62 | | | $ | 21.45 | |
| Income (loss) from investment operations: |
| Net investment income (loss)a | | | (.29 | ) | | | (.39 | ) | | | (.39 | ) | | | (.40 | ) | | | (.35 | ) |
| Net gain (loss) on investments (realized and unrealized) | | | .89 | | | | .13 | | | | .48 | | | | 1.26 | | | | .52 | |
| Total from investment operations | | | .60 | | | | (.26 | ) | | | .09 | | | | .86 | | | | .17 | |
| Less distributions from: |
| Net investment income | | | — | | | | (.04 | ) | | | — | | | | (.19 | ) | | | — | |
| Total distributions | | | — | | | | (.04 | ) | | | — | | | | (.19 | ) | | | — | |
| Net asset value, end of period | | $ | 22.68 | | | $ | 22.08 | | | $ | 22.38 | | | $ | 22.29 | | | $ | 21.62 | |
| | | | | | | | | | | | | | | | | | | | | |
| Total Returnb | | | 2.72 | % | | | (1.18 | %) | | | 0.45 | % | | | 3.97 | % | | | 0.79 | % |
| Ratios/Supplemental Data |
| Net assets, end of period (in thousands) | | $ | 7,586 | | | $ | 8,595 | | | $ | 9,342 | | | $ | 9,627 | | | $ | 12,705 | |
| Ratios to average net assets: |
| Net investment income (loss) | | | (1.30 | %) | | | (1.76 | %) | | | (1.73 | %) | | | (1.84 | %) | | | (1.60 | %) |
| Total expensesc | | | 2.94 | % | | | 3.30 | % | | | 3.47 | % | | | 3.62 | % | | | 3.50 | % |
| Net expensesd,e | | | 2.90 | % | | | 3.25 | % | | | 3.40 | % | | | 3.57 | % | | | 3.45 | % |
| Portfolio turnover rate | | | 172 | % | | | 123 | % | | | 163 | % | | | 304 | % | | | 302 | % |
| 42 | THE GUGGENHEIM FUNDS ANNUAL REPORT | SEE NOTES TO FINANCIAL STATEMENTS. |
| CONSOLIDATED FINANCIAL HIGHLIGHTS (continued) |
| MULTI-HEDGE STRATEGIES FUND |
This table is presented to show selected data for a share outstanding throughout each period and to assist shareholders in evaluating a Fund’s performance for the periods presented.
| P-Class | | Year Ended
Dec. 31,
2017 | | | Year Ended
Dec. 31,
2016 | | | Year Ended
Dec. 31,
2015 | | | Year Ended
Dec. 31,
2014 | | | Year Ended
Dec. 31,
2013 | |
| Per Share Data | | | | | | | | | | | | | | | | | | | | |
| Net asset value, beginning of period | | $ | 24.10 | | | $ | 24.24 | | | $ | 23.96 | | | $ | 23.04 | | | $ | 22.69 | |
| Income (loss) from investment operations: |
| Net investment income (loss)a | | | (.14 | ) | | | (.24 | ) | | | (.23 | ) | | | (.25 | ) | | | (.19 | ) |
| Net gain (loss) on investments (realized and unrealized) | | | .97 | | | | .14 | | | | .51 | | | | 1.36 | | | | .54 | |
| Total from investment operations | | | .83 | | | | (.10 | ) | | | .28 | | | | 1.11 | | | | .35 | |
| Less distributions from: |
| Net investment income | | | — | | | | (.04 | ) | | | — | | | | (.19 | ) | | | — | |
| Total distributions | | | — | | | | (.04 | ) | | | — | | | | (.19 | ) | | | — | |
| Net asset value, end of period | | $ | 24.93 | | | $ | 24.10 | | | $ | 24.24 | | | $ | 23.96 | | | $ | 23.04 | |
| | | | | | | | | | | | | | | | | | | | | |
| Total Returnb | | | 3.49 | % | | | (0.47 | %) | | | 1.21 | % | | | 4.77 | % | | | 1.54 | % |
| Ratios/Supplemental Data |
| Net assets, end of period (in thousands) | | $ | 14,066 | | | $ | 30,801 | | | $ | 49,539 | | | $ | 36,411 | | | $ | 50,990 | |
| Ratios to average net assets: |
| Net investment income (loss) | | | (0.56 | %) | | | (1.00 | %) | | | (0.95 | %) | | | (1.09 | %) | | | (0.82 | %) |
| Total expensesc | | | 2.20 | % | | | 2.52 | % | | | 2.72 | % | | | 2.87 | % | | | 2.75 | % |
| Net expensesd,e | | | 2.16 | % | | | 2.47 | % | | | 2.65 | % | | | 2.82 | % | | | 2.71 | % |
| Portfolio turnover rate | | | 172 | % | | | 123 | % | | | 163 | % | | | 304 | % | | | 302 | % |
| SEE NOTES TO FINANCIAL STATEMENTS. | THE GUGGENHEIM FUNDS ANNUAL REPORT | 43 |
| CONSOLIDATED FINANCIAL HIGHLIGHTS (concluded) |
| MULTI-HEDGE STRATEGIES FUND |
This table is presented to show selected data for a share outstanding throughout each period and to assist shareholders in evaluating a Fund’s performance for the periods presented.
| Institutional Class | | Year Ended
Dec. 31,
2017 | | | Year Ended
Dec. 31,
2016 | | | Year Ended
Dec. 31,
2015 | | | Year Ended
Dec. 31,
2014 | | | Year Ended
Dec. 31,
2013 | |
| Per Share Data | | | | | | | | | | | | | | | | | | | | |
| Net asset value, beginning of period | | $ | 24.50 | | | $ | 24.58 | | | $ | 24.24 | | | $ | 23.26 | | | $ | 22.84 | |
| Income (loss) from investment operations: |
| Net investment income (loss)a | | | (.07 | ) | | | (.18 | ) | | | (.18 | ) | | | (.18 | ) | | | (.13 | ) |
| Net gain (loss) on investments (realized and unrealized) | | | .99 | | | | .14 | | | | .52 | | | | 1.35 | | | | .55 | |
| Total from investment operations | | | .92 | | | | (.04 | ) | | | .34 | | | | 1.17 | | | | .42 | |
| Less distributions from: |
| Net investment income | | | — | | | | (.04 | ) | | | — | | | | (.19 | ) | | | — | |
| Total distributions | | | — | | | | (.04 | ) | | | — | | | | (.19 | ) | | | — | |
| Net asset value, end of period | | $ | 25.42 | | | $ | 24.50 | | | $ | 24.58 | | | $ | 24.24 | | | $ | 23.26 | |
| | | | | | | | | | | | | | | | | | | | | |
| Total Returnb | | | 3.76 | % | | | (0.18 | %) | | | 1.44 | % | | | 4.98 | % | | | 1.84 | % |
| Ratios/Supplemental Data |
| Net assets, end of period (in thousands) | | $ | 25,376 | | | $ | 50,395 | | | $ | 49,742 | | | $ | 42,204 | | | $ | 25,435 | |
| Ratios to average net assets: |
| Net investment income (loss) | | | (0.30 | %) | | | (0.74 | %) | | | (0.71 | %) | | | (0.79 | %) | | | (0.54 | %) |
| Total expensesc | | | 1.92 | % | | | 2.30 | % | | | 2.47 | % | | | 2.67 | % | | | 2.56 | % |
| Net expensesd,e | | | 1.88 | % | | | 2.25 | % | | | 2.40 | % | | | 2.62 | % | | | 2.51 | % |
| Portfolio turnover rate | | | 172 | % | | | 123 | % | | | 163 | % | | | 304 | % | | | 302 | % |
| a | | Net investment income (loss) per share was computed using average shares outstanding throughout the period. |
| b | | Total return does not reflect the impact of any applicable sales charges. |
| c | | Does not include expenses of the underlying funds in which the Fund invests. |
| d | | Net expense information reflects the expense ratios after expense waivers. |
| e | | Excluding interest and dividend expense related to short sales, the net expense ratios for the years presented would be: |
| | | 12/31/17 | 12/31/16 | 12/31/15 | 12/31/14 | 12/31/13 |
| | A-Class | 1.42% | 1.43% | 1.44% | 1.42% | 1.40% |
| | C-Class | 2.17% | 2.18% | 2.19% | 2.17% | 2.15% |
| | P-Class | 1.42% | 1.43% | 1.45% | 1.42% | 1.40% |
| | Institutional Class | 1.17% | 1.18% | 1.19% | 1.17% | 1.15% |
| 44 | THE GUGGENHEIM FUNDS ANNUAL REPORT | SEE NOTES TO FINANCIAL STATEMENTS. |
| PERFORMANCE REPORT AND FUND PROFILE (Unaudited) | December 31, 2017 |
COMMODITIES STRATEGY FUND
OBJECTIVE: Seeks to provide investment results that correlate, before fees and expenses, to the performance of a benchmark for commodities. The Fund’s current benchmark is the S&P Goldman Sachs Commodity Index (“GSCI” or “Index”).
For the one-year period ended December 31, 2017, the Fund’s H-Class returned 4.65%, compared with a return of 5.77% for the Index.
The S&P GSCI continued its positive momentum throughout 2017 as the global economy continues to expand at a healthy pace. Sixteen of the 24 components in the Index had positive returns during the period. The best-performing component was aluminum, with a return topping 30%. Other industrial metals, such as zinc, copper, nickel and lead, all had positive returns between 20% and 30%.
Natural gas, sugar, coffee, Kansas wheat, wheat, cocoa, and corn each had double-digit declines during the period.
Commodities were up in 2017 due to continued global economic expansion, which helped drive base metal prices higher. China continued to limit industrial overcapacity. Oil was flat to down for most of the year, but had a strong rally in December as OPEC-led production limits took hold. Gold maintained its safe haven status and ended the year just above $1,300 an ounce.
The strongest S&P GSCI sectors were Industrial Metals (up almost 30%) and Precious Metals (up 12%). Livestock and Energy sectors were also up for the year. Agriculture was the only sector that had negative performance for the year.
Derivatives in the Fund are used to help provide exposure to the composition of the benchmark in the most efficient manner, as well as to provide liquidity. Derivatives are the primary way in which the Fund gains exposure to commodities, and therefore most of the Fund’s performance is due to derivatives.
Guggenheim Strategy Funds were utilized within the Fund to achieve higher yields than what would otherwise be achieved through overnight repurchase agreements or short term investments.
Performance displayed represents past performance which is no guarantee of future results.
| | THE GUGGENHEIM FUNDS ANNUAL REPORT | 45 |
| PERFORMANCE REPORT AND FUND PROFILE (Unaudited)(continued) | December 31, 2017 |
Consolidated Holdings Diversification (Market Exposure as % of Net Assets)
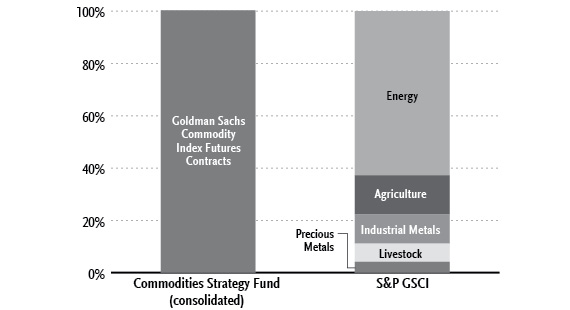
“Consolidated Holdings Diversification (Market Exposure as % of Net Assets)” excludes any temporary cash investments or investments in Guggenheim Strategy Funds Trust mutual funds. Investments in those Funds do not provide “market exposure” to meet the Fund’s investment objective, but will significantly increase the portfolio’s exposure to certain other asset categories (and their associated risks), which may cause the Fund to deviate from its principal investment strategy, including: (i) high yield, high risk debt securities rated below the top four long-term rating categories by a nationally recognized statistical rating organization (also known as “junk bonds”); (ii) securities issued by the U.S. government or its agencies and instrumentalities; (iii) CLOs and similar investments; and (iv) other short-term fixed income securities.
| Inception Dates: |
| A-Class | May 25, 2005 |
| C-Class | May 25, 2005 |
| H-Class | May 25, 2005 |
The Fund invests principally in derivative investments such as swap agreements and futures contracts.
| Largest Holdings (% of Total Net Assets) |
| Guggenheim Strategy Fund II | 19.0% |
| Guggenheim Strategy Fund I | 18.9% |
| Total | 37.9% |
| | |
| “Largest Holdings” excludes any temporary cash or derivative investments. |
| 46 | THE GUGGENHEIM FUNDS ANNUAL REPORT | |
| PERFORMANCE REPORT AND FUND PROFILE (Unaudited)(continued) | December 31, 2017 |
Cumulative Fund Performance*
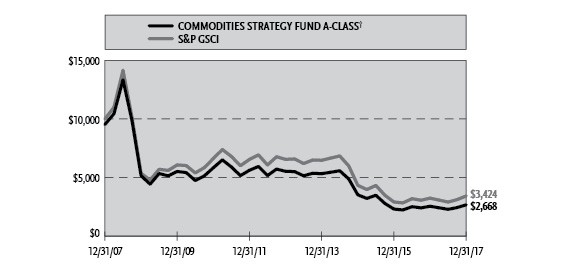
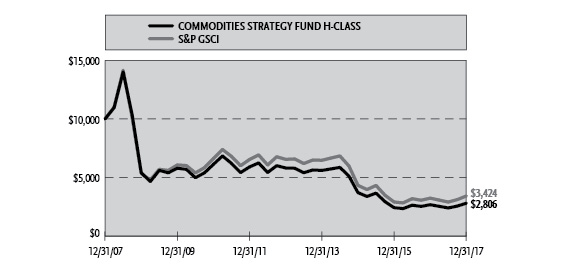
| | THE GUGGENHEIM FUNDS ANNUAL REPORT | 47 |
| PERFORMANCE REPORT AND FUND PROFILE (Unaudited)(concluded) | December 31, 2017 |
Average Annual Returns*
Periods Ended December 31, 2017
| | 1 Year | 5 Year | 10 Year |
| A-Class Shares | 4.68% | (13.55%) | (11.95%) |
| A-Class Shares with sales charge† | (0.30%) | (14.39%) | (12.38%) |
| C-Class Shares | 3.80% | (14.19%) | (12.59%) |
| C-Class Shares with CDSC‡ | 2.80% | (14.19%) | (12.59%) |
| H-Class Shares | 4.65% | (13.55%) | (11.94%) |
| S&P Goldman Sachs Commodity Index | 5.77% | (12.16%) | (10.16%) |
| * | | The performance data above represents past performance that is not predictive of future results. The investment return and principal value of an investment in the Fund will fluctuate so that an investor’s shares, when redeemed, may be worth more or less than their original cost. Returns are historical and include changes in principal and reinvested dividends and capital gains and do not reflect the effect of taxes. The S&P GSCI is an unmanaged index and, unlike the Fund, has no management fees or operating expenses to reduce its reported returns. The graphs are based on A-Class shares and H-Class shares only; performance for C-Class shares will vary due to differences in fee structures. |
| † | | Fund returns are calculated using the maximum sales charge of 4.75%. |
| ‡ | | Fund returns include a CDSC of 1% if redeemed within 12 months of purchase. |
| 48 | THE GUGGENHEIM FUNDS ANNUAL REPORT | |
| CONSOLIDATED SCHEDULE OF INVESTMENTS | December 31, 2017 |
| COMMODITIES STRATEGY FUND | |
| | | Shares | | | Value | |
| | | | | | | |
| MUTUAL FUNDS† - 37.9 | | | | | | |
| Guggenheim Strategy Fund II1 | | | 54,200 | | | $ | 1,355,548 | |
| Guggenheim Strategy Fund I1 | | | 54,088 | | | | 1,355,439 | |
| Total Mutual Funds | | | | | | | | |
| (Cost $2,697,592) | | | | | | | 2,710,987 | |
| | | | | | | | | |
| | | | Face
Amount | | | | | |
| | | | | | | | | |
| FEDERAL AGENCY DISCOUNT NOTES†† - 46.1% |
| Federal Home Loan Bank2 | | | | | | | | |
| 1.05% due 01/02/183,4 | | $ | 3,300,000 | | | | 3,299,904 | |
| Total Federal Agency Discount Notes | | | | | | | | |
| (Cost $3,299,904) | | | | | | | 3,299,904 | |
| | | | | | | | | |
| U.S. TREASURY BILLS†† - 4.2% |
| U.S. Treasury Bills | | | | | | | | |
| 1.31% due 04/19/183,4,5 | | | 300,000 | | | | 298,756 | |
| Total U.S. Treasury Bills | | | | | | | | |
| (Cost $298,807) | | | | | | | 298,756 | |
| REPURCHASE AGREEMENTS††,6 - 9.7% |
JPMorgan Chase & Co.
issued 12/29/17 at 1.41%
due 01/02/18 | | $ | 454,048 | | | | 454,048 | |
Bank of America Merrill Lynch
issued 12/29/17 at 1.40%
due 01/02/18 | | | 242,327 | | | | 242,326 | |
| Total Repurchase Agreements | | | | | | | | |
| (Cost $696,374) | | | | | | | 696,374 | |
| | | | | | | | | |
| Total Investments - 97.9% | | | | | | | | |
| (Cost $6,992,677) | | | | | | $ | 7,006,021 | |
| Other Assets & Liabilities, net - 2.1% | | | | | | | 147,733 | |
| Total Net Assets - 100.0% | | | | | | $ | 7,153,754 | |
| Futures Contracts |
| Description | | Number of
Contracts | | | Expiration
Date | | Notional
Amount | | | Value and
Unrealized
Gain | |
| Commodity Futures Contracts Purchased† |
| Goldman Sachs Commodity Index Futures Contracts | | | 65 | | | Jan 2018 | | $ | 7,175,188 | | | $ | 373,136 | |
| SEE NOTES TO FINANCIAL STATEMENTS. | THE GUGGENHEIM FUNDS ANNUAL REPORT | 49 |
| CONSOLIDATED SCHEDULE OF INVESTMENTS (continued) | December 31, 2017 |
| COMMODITIES STRATEGY FUND | |
| † | | Value determined based on Level 1 inputs — See Note 4. |
| †† | | Value determined based on Level 2 inputs — See Note 4. |
| 1 | | Affiliated issuer. |
| 2 | | The issuer operates under a Congressional charter; its securities are neither issued nor guaranteed by the U.S. Government. |
| 3 | | Rate indicated is the effective yield at the time of purchase. |
| 4 | | Zero coupon rate security. |
| 5 | | All or a portion of this security is pledged as futures collateral at December 31, 2017. |
| 6 | | Repurchase Agreements — See Note 5. |
| | | |
| | | See Sector Classification in Other Information section. |
The following table summarizes the inputs used to value the Fund’s investments at December 31, 2017 (See Note 4 in the Notes to Consolidated Financial Statements):
Investments in
Securities (Assets) | | Level 1
Quoted
Prices | | | Level 1 -
Other* | | | Level 2
Significant
Observable
Inputs | | | Level 3
Significant
Unobservable
Inputs | | | Total | |
| Commodity Futures Contracts | | $ | — | | | $ | 373,136 | | | $ | — | | | $ | — | | | $ | 373,136 | |
| Federal Agency Discount Notes | | | — | | | | — | | | | 3,299,904 | | | | — | | | | 3,299,904 | |
| Mutual Funds | | | 2,710,987 | | | | — | | | | — | | | | — | | | | 2,710,987 | |
| Repurchase Agreement | | | — | | | | — | | | | 696,374 | | | | — | | | | 696,374 | |
| U.S. Treasury Bills | | | — | | | | — | | | | 298,756 | | | | — | | | | 298,756 | |
| Total Assets | | $ | 2,710,987 | | | $ | 373,136 | | | $ | 4,295,034 | | | $ | — | | | $ | 7,379,157 | |
| * | | Other financial instruments include futures contracts and/or swaps, which are reported as unrealized gain/loss at period end. |
Transfers between investment levels may occur as the markets fluctuate and/or the availability of data used in an investment’s valuation changes. Transfers between valuation levels, if any, are in comparison to the valuation levels at the end of the previous fiscal year, and are effective using the fair value as of the end of the current fiscal period.
For the year ended December 31, 2017, there were no transfers between levels.
| 50 | THE GUGGENHEIM FUNDS ANNUAL REPORT | SEE NOTES TO FINANCIAL STATEMENTS. |
| CONSOLIDATED SCHEDULE OF INVESTMENTS (concluded) | December 31, 2017 |
| COMMODITIES STRATEGY FUND | |
Affiliated Transactions
Investments representing 5% or more of the outstanding voting shares of a portfolio company of a fund, or control of or by, or common control under GI, result in that portfolio company being considered an affiliated company of such fund, as defined in the 1940 Act.
The Fund may invest in the underlying series of the Guggenheim Strategy Funds Trust consisting of Guggenheim Strategy Fund I, Guggenheim Strategy Fund II, Guggenheim Strategy Fund III, and Guggenheim Variable Insurance Strategy Fund III (collectively, the “Cash Management Funds”), open-end management investment companies managed by GI. The Cash Management Funds, which launched on March 11, 2014, are offered as cash management options only to mutual funds, trusts, and other accounts managed by GI and/or its affiliates, and are not available to the public. The Cash Management Funds pay no investment management fees. The Cash Management Funds’ annual report on Form N-CSR dated September 30, 2017, is available publicly or upon request. This information is available from the EDGAR database on the SEC’s website at https://www.sec.gov/Archives/edgar/data/1601445/000089180417000715/gug72218.htm.
Transactions during the year ended December 31, 2017, in which the portfolio company is an “affiliated person”, were as follows:
| Security Name | | Value
12/31/16 | | | Additions | | | Reductions | | | Realized
Gain (Loss) | | | Change in
Unrealized | | | Value
12/31/17 | |
| Mutual Funds | | | | | | | | | | | | | | | | | | |
| Guggenheim Strategy Fund I | | $ | 1,452,887 | | | $ | 300,000 | | | $ | (400,000 | ) | | $ | 1,337 | | | $ | 1,215 | | | $ | 1,355,439 | |
| Guggenheim Strategy Fund II | | | 1,452,892 | | | | 300,000 | | | | (400,000 | ) | | | 1,480 | | | | 1,176 | | | | 1,355,548 | |
| | | $ | 2,905,779 | | | $ | 600,000 | | | $ | (800,000 | ) | | $ | 2,817 | | | $ | 2,391 | | | $ | 2,710,987 | |
| Security Name | | Shares
12/31/17 | | | Investment
Income | | | Capital Gains
Distributions | |
| Mutual Funds | | | | | | | | | | | | |
| Guggenheim Strategy Fund I | | | 54,088 | | | $ | 25,207 | | | $ | 515 | |
| Guggenheim Strategy Fund II | | | 54,200 | | | | 30,319 | | | | 724 | |
| | | | | | | $ | 55,526 | | | $ | 1,239 | |
| SEE NOTES TO FINANCIAL STATEMENTS. | THE GUGGENHEIM FUNDS ANNUAL REPORT | 51 |
| CONSOLIDATED STATEMENT OF ASSETS AND LIABILITIES |
| COMMODITIES STRATEGY FUND |
December 31, 2017
| Assets: |
| Investments in unaffiliated issuers, at value (cost $3,598,711) | | $ | 3,598,660 | |
| Investments in affiliated issuers, at value (cost $2,697,592) | | | 2,710,987 | |
| Repurchase agreements, at value (cost $696,374) | | | 696,374 | |
| Cash | | | 2 | |
| Segregated cash with broker | | | 92,760 | |
| Receivables: |
| Fund shares sold | | | 44,893 | |
| Variation margin | | | 33,312 | |
| Dividends | | | 4,393 | |
| Interest | | | 82 | |
| Total assets | | | 7,181,463 | |
| | | | | |
| Liabilities: |
| Payable for: |
| Fund shares redeemed | | | 12,181 | |
| Management fees | | | 4,817 | |
| Distribution and service fees | | | 1,732 | |
| Transfer agent and administrative fees | | | 1,507 | |
| Portfolio accounting fees | | | 603 | |
| Miscellaneous | | | 6,869 | |
| Total liabilities | | | 27,709 | |
| Commitments and contingent liabilities (Note 12) | | | — | |
| Net assets | | $ | 7,153,754 | |
| | | | | |
| Net assets consist of: |
| Paid in capital | | $ | 8,795,462 | |
| Accumulated net investment loss | | | (2,022,903 | ) |
| Accumulated net realized loss on investments | | | (5,285 | ) |
| Net unrealized appreciation on investments | | | 386,480 | |
| Net assets | | $ | 7,153,754 | |
| | | | | |
| A-Class: |
| Net assets | | $ | 819,239 | |
| Capital shares outstanding | | | 9,274 | |
| Net asset value per share | | $ | 88.34 | |
| Maximum offering price per share (Net asset value divided by 95.25%) | | $ | 92.75 | |
| | | | | |
| C-Class: |
| Net assets | | $ | 332,332 | |
| Capital shares outstanding | | | 4,160 | |
| Net asset value per share | | $ | 79.89 | |
| | | | | |
| H-Class: |
| Net assets | | $ | 6,002,183 | |
| Capital shares outstanding | | | 67,902 | |
| Net asset value per share | | $ | 88.39 | |
| 52 | THE GUGGENHEIM FUNDS ANNUAL REPORT | SEE NOTES TO FINANCIAL STATEMENTS. |
| CONSOLIDATED STATEMENT OF OPERATIONS |
| COMMODITIES STRATEGY FUND |
Year Ended December 31, 2017
| Investment Income: |
| Dividends from securities of affiliated issuers | | $ | 55,526 | |
| Interest | | | 31,912 | |
| Total investment income | | | 87,438 | |
| | | | | |
| Expenses: |
| Management fees | | | 55,737 | |
| Distribution and service fees: |
| A-Class | | | 2,701 | |
| C-Class | | | 3,548 | |
| H-Class | | | 12,669 | |
| Transfer agent and administrative fees | | | 16,257 | |
| Legal fees | | | 7,705 | |
| Portfolio accounting fees | | | 6,503 | |
| Custodian fees | | | 958 | |
| Trustees’ fees* | | | 720 | |
| Miscellaneous | | | 8,985 | |
| Total expenses | | | 115,783 | |
| Less: |
| Expenses waived by Adviser | | | (6,276 | ) |
| Total waived expenses | | | (6,276 | ) |
| Net expenses | | | 109,507 | |
| Net investment loss | | | (22,069 | ) |
| | | | | |
| Net Realized and Unrealized Gain (Loss): |
| Net realized gain (loss) on: |
| Investments in affiliated issuers | | $ | 2,817 | |
| Futures contracts | | | 13,909 | |
| Distributions received from affiliated investment company shares | | | 1,239 | |
| Net realized gain | | | 17,965 | |
| Net change in unrealized appreciation (depreciation) on: |
| Investments in unaffiliated issuers | | | (96 | ) |
| Investments in affiliated issuers | | | 2,391 | |
| Futures contracts | | | 174,096 | |
| Net change in unrealized appreciation (depreciation) | | | 176,391 | |
| Net realized and unrealized gain | | | 194,356 | |
| Net increase in net assets resulting from operations | | $ | 172,287 | |
| * | | Relates to Trustees not deemed “interested persons” within the meaning of Section 2(a) (19) of the 1940 Act. |
| SEE NOTES TO FINANCIAL STATEMENTS. | THE GUGGENHEIM FUNDS ANNUAL REPORT | 53 |
| CONSOLIDATED STATEMENTS OF CHANGES IN NET ASSETS |
| COMMODITIES STRATEGY FUND | |
| | | Year Ended
December 31,
2017 | | | Year Ended
December 31,
2016 | |
| Increase (Decrease) in Net Assets from Operations: | | | | | | |
| Net investment loss | | $ | (22,069 | ) | | $ | (66,729 | ) |
| Net realized gain (loss) on investments | | | 17,965 | | | | (1,105,014 | ) |
| Net change in unrealized appreciation (depreciation) on investments | | | 176,391 | | | | 268,384 | |
| Net increase (decrease) in net assets resulting from operations | | | 172,287 | | | | (903,359 | ) |
| | | | | | | | | |
| Distributions to shareholders from: | | | | | | | | |
| Net investment income | | | | | | | | |
| A-Class | | | (12,479 | ) | | | — | |
| C-Class | | | (6,216 | ) | | | — | |
| H-Class | | | (87,310 | ) | | | — | |
| Total distributions to shareholders | | | (106,005 | ) | | | — | |
| | | | | | | | | |
| Capital share transactions: | | | | | | | | |
| Proceeds from sale of shares | | | | | | | | |
| A-Class | | | 49,012,472 | | | | 112,059,540 | |
| C-Class | | | 175,636 | | | | 273,332 | |
| H-Class | | | 135,745,728 | | | | 139,296,552 | |
| Distributions reinvested | | | | | | | | |
| A-Class | | | 11,926 | | | | — | |
| C-Class | | | 6,197 | | | | — | |
| H-Class | | | 86,139 | | | | — | |
| Cost of shares redeemed | | | | | | | | |
| A-Class | | | (48,862,185 | ) | | | (111,853,025 | ) |
| C-Class | | | (327,223 | ) | | | (323,925 | ) |
| H-Class | | | (137,504,288 | ) | | | (139,483,654 | ) |
| Net decrease from capital share transactions | | | (1,655,598 | ) | | | (31,180 | ) |
| Net decrease in net assets | | | (1,589,316 | ) | | | (934,539 | ) |
| | | | | | | | | |
| Net assets: | | | | | | | | |
| Beginning of year | | | 8,743,070 | | | | 9,677,609 | |
| End of year | | $ | 7,153,754 | | | $ | 8,743,070 | |
| Accumulated net investment loss at end of year | | $ | (2,022,903 | ) | | $ | (2,770,217 | ) |
| 54 | THE GUGGENHEIM FUNDS ANNUAL REPORT | SEE NOTES TO FINANCIAL STATEMENTS. |
| CONSOLIDATED STATEMENTS OF CHANGES IN NET ASSETS (concluded) |
| COMMODITIES STRATEGY FUND | |
| | | Year Ended
December 31,
2017 | | | Year Ended
December 31,
2016 | |
| Capital share activity: | | | | | | |
| Shares sold | | | | | | |
| A-Class | | | 631,518 | | | | 1,420,897 | * |
| C-Class | | | 2,261 | | | | 3,655 | * |
| H-Class | | | 1,732,105 | | | | 1,729,009 | * |
| Shares issued from reinvestment of distributions | | | | | | | | |
| A-Class | | | 143 | | | | — | |
| C-Class | | | 82 | | | | — | |
| H-Class | | | 1,034 | | | | — | |
| Shares redeemed | | | | | | | | |
| A-Class | | | (632,591 | ) | | | (1,418,693 | )* |
| C-Class | | | (4,338 | ) | | | (4,539 | )* |
| H-Class | | | (1,751,301 | ) | | | (1,753,049 | )* |
| Net decrease in shares | | | (21,087 | ) | | | (22,720 | )* |
| * | | Capital share activity for the periods presented through December 31, 2016, has been restated to reflect a 1:12 reverse share split effective October 28, 2016 — See Note 11. |
| SEE NOTES TO FINANCIAL STATEMENTS. | THE GUGGENHEIM FUNDS ANNUAL REPORT | 55 |
| CONSOLIDATED FINANCIAL HIGHLIGHTS |
| COMMODITIES STRATEGY FUND | |
This table is presented to show selected data for a share outstanding throughout each period and to assist shareholders in evaluating a Fund’s performance for the periods presented.
| A-Class | | Year Ended
Dec. 31,
2017 | | | Year Ended
Dec. 31,
2016e | | | Year Ended
Dec. 31,
2015e | | | Year Ended
Dec. 31,
2014e | | | Year Ended
Dec. 31,
2013e | |
| Per Share Data | | | | | | | | | | | | | | | |
| Net asset value, beginning of period | | $ | 85.75 | | | $ | 77.58 | | | $ | 118.46 | | | $ | 179.18 | | | $ | 185.89 | |
| Income (loss) from investment operations: |
| Net investment income (loss)a | | | (.22 | ) | | | (.09 | ) | | | (1.32 | ) | | | (1.80 | ) | | | (2.76 | ) |
| Net gain (loss) on investments (realized and unrealized) | | | 4.13 | | | | 8.26 | | | | (39.56 | ) | | | (58.92 | ) | | | (3.95 | ) |
| Total from investment operations | | | 3.91 | | | | 8.17 | | | | (40.88 | ) | | | (60.72 | ) | | | (6.71 | ) |
| Less distributions from: |
| Net investment income | | | (1.32 | ) | | | — | | | | — | | | | — | | | | — | |
| Total distributions | | | (1.32 | ) | | | — | | | | — | | | | — | | | | — | |
| Net asset value, end of period | | $ | 88.34 | | | $ | 85.75 | | | $ | 77.58 | | | $ | 118.46 | | | $ | 179.18 | |
| | | | | | | | | | | | | | | | | | | | | |
| Total Returnb | | | 4.68 | % | | | 10.59 | % | | | (34.55 | %) | | | (33.89 | %) | | | (3.62 | %) |
| Ratios/Supplemental Data |
| Net assets, end of period (in thousands) | | $ | 819 | | | $ | 875 | | | $ | 621 | | | $ | 3,419 | | | $ | 1,990 | |
| Ratios to average net assets: |
| Net investment income (loss) | | | (0.28 | %) | | | (1.02 | %) | | | (1.26 | %) | | | (1.03 | %) | | | (1.50 | %) |
| Total expensesc | | | 1.73 | % | | | 1.77 | % | | | 1.75 | % | | | 1.64 | % | | | 1.63 | % |
| Net expensesd | | | 1.63 | % | | | 1.65 | % | | | 1.62 | % | | | 1.56 | % | | | 1.53 | % |
| Portfolio turnover rate | | | 25 | % | | | 208 | % | | | 486 | % | | | 238 | % | | | — | |
| 56 | THE GUGGENHEIM FUNDS ANNUAL REPORT | SEE NOTES TO FINANCIAL STATEMENTS. |
| CONSOLIDATED FINANCIAL HIGHLIGHTS (continued) |
| COMMODITIES STRATEGY FUND | |
This table is presented to show selected data for a share outstanding throughout each period and to assist shareholders in evaluating a Fund’s performance for the periods presented.
| C-Class | | Year Ended
Dec. 31,
2017 | | | Year Ended
Dec. 31,
2016e | | | Year Ended
Dec. 31,
2015e | | | Year Ended
Dec. 31,
2014e | | | Year Ended
Dec. 31,
2013e | |
| Per Share Data | | | | | | | | | | | | | | | |
| Net asset value, beginning of period | | $ | 78.32 | | | $ | 71.38 | | | $ | 109.79 | | | $ | 167.19 | | | $ | 174.69 | |
| Income (loss) from investment operations: |
| Net investment income (loss)a | | | (.70 | ) | | | (.11 | ) | | | (1.92 | ) | | | (2.76 | ) | | | (3.84 | ) |
| Net gain (loss) on investments (realized and unrealized) | | | 3.59 | | | | 7.05 | | | | (36.49 | ) | | | (54.64 | ) | | | (3.66 | ) |
| Total from investment operations | | | 2.89 | | | | 6.94 | | | | (38.41 | ) | | | (57.40 | ) | | | (7.50 | ) |
| Less distributions from: |
| Net investment income | | | (1.32 | ) | | | — | | | | — | | | | — | | | | — | |
| Total distributions | | | (1.32 | ) | | | — | | | | — | | | | — | | | | — | |
| Net asset value, end of period | | $ | 79.89 | | | $ | 78.32 | | | $ | 71.38 | | | $ | 109.79 | | | $ | 167.19 | |
| | | | | | | | | | | | | | | | | | | | | |
| Total Returnb | | | 3.80 | % | | | 9.66 | % | | | (34.97 | %) | | | (34.31 | %) | | | (4.33 | %) |
| Ratios/Supplemental Data |
| Net assets, end of period (in thousands) | | $ | 332 | | | $ | 482 | | | $ | 502 | | | $ | 1,135 | | | $ | 1,947 | |
| Ratios to average net assets: |
| Net investment income (loss) | | | (0.94 | %) | | | (1.48 | %) | | | (1.95 | %) | | | (1.77 | %) | | | (2.25 | %) |
| Total expensesc | | | 2.48 | % | | | 2.51 | % | | | 2.49 | % | | | 2.39 | % | | | 2.39 | % |
| Net expensesd | | | 2.36 | % | | | 2.38 | % | | | 2.35 | % | | | 2.32 | % | | | 2.28 | % |
| Portfolio turnover rate | | | 25 | % | | | 208 | % | | | 486 | % | | | 238 | % | | | — | |
| SEE NOTES TO FINANCIAL STATEMENTS. | THE GUGGENHEIM FUNDS ANNUAL REPORT | 57 |
| CONSOLIDATED FINANCIAL HIGHLIGHTS (concluded) |
| COMMODITIES STRATEGY FUND |
This table is presented to show selected data for a share outstanding throughout each period and to assist shareholders in evaluating a Fund’s performance for the periods presented.
| H-Class | | Year Ended
Dec. 31,
2017 | | | Year Ended
Dec. 31,
2016e | | | Year Ended
Dec. 31,
2015e | | | Year Ended
Dec. 31,
2014e | | | Year Ended
Dec. 31,
2013e | |
| Per Share Data | | | | | | | | | | | | | | | | | | | | |
| Net asset value, beginning of period | | $ | 85.82 | | | $ | 77.69 | | | $ | 118.68 | | | $ | 179.41 | | | $ | 185.95 | |
| Income (loss) from investment operations: |
| Net investment income (loss)a | | | (.25 | ) | | | (.07 | ) | | | (1.32 | ) | | | (1.80 | ) | | | (2.76 | ) |
| Net gain (loss) on investments (realized and unrealized) | | | 4.14 | | | | 8.20 | | | | (39.67 | ) | | | (58.93 | ) | | | (3.78 | ) |
| Total from investment operations | | | 3.89 | | | | 8.13 | | | | (40.99 | ) | | | (60.73 | ) | | | (6.54 | ) |
| Less distributions from: |
| Net investment income | | | (1.32 | ) | | | — | | | | — | | | | — | | | | — | |
| Total distributions | | | (1.32 | ) | | | — | | | | — | | | | — | | | | — | |
| Net asset value, end of period | | $ | 88.39 | | | $ | 85.82 | | | $ | 77.69 | | | $ | 118.68 | | | $ | 179.41 | |
| | | | | | | | | | | | | | | | | | | | | |
| Total Returnb | | | 4.65 | % | | | 10.52 | % | | | (34.58 | %) | | | (33.85 | %) | | | (3.55 | %) |
| Ratios/Supplemental Data |
| Net assets, end of period (in thousands) | | $ | 6,002 | | | $ | 7,386 | | | $ | 8,555 | | | $ | 8,160 | | | $ | 12,042 | |
| Ratios to average net assets: |
| Net investment income (loss) | | | (0.31 | %) | | | (0.87 | %) | | | (1.33 | %) | | | (1.05 | %) | | | (1.50 | %) |
| Total expensesc | | | 1.74 | % | | | 1.74 | % | | | 1.75 | % | | | 1.65 | % | | | 1.63 | % |
| Net expensesd | | | 1.65 | % | | | 1.62 | % | | | 1.63 | % | | | 1.57 | % | | | 1.53 | % |
| Portfolio turnover rate | | | 25 | % | | | 208 | % | | | 486 | % | | | 238 | % | | | — | |
| a | | Net investment income (loss) per share was computed using average shares outstanding throughout the period. |
| b | | Total return does not reflect the impact of any applicable sales charges. |
| c | | Does not include expenses of the underlying funds in which the Fund invests. |
| d | | Net expense information reflects the expense ratios after expense waivers. |
| e | | Reverse share split — Per share amounts for the periods presented through December 31, 2016 have been restated to reflect a 1:12 reverse share split effective October 28, 2016 — See Note 11. |
| 58 | THE GUGGENHEIM FUNDS ANNUAL REPORT | SEE NOTES TO FINANCIAL STATEMENTS. |
| NOTES TO CONSOLIDATED FINANCIAL STATEMENTS |
Note 1 – Organization, Consolidation of Subsidiary and Significant Accounting Policies
Organization
The Rydex Series Funds (the “Trust”), a Delaware statutory trust, is registered with the SEC under the Investment Company Act of 1940 (”1940 Act”), as an open-ended investment company of the series type. Each series, in effect, is representing a separate Fund. The Trust is authorized to issue an unlimited number of no par value shares. The Trust accounts for the assets of each fund separately.
The Trust offers a combination of seven separate classes of shares: Investor Class shares, A-Class shares, C-Class shares, H-Class shares, P-Class shares, Institutional Class shares and Money Market Class shares. Sales of shares of each Class are made without a front-end sales charge at the net asset value per share (“NAV”), with the exception of A-Class shares. A-Class shares are sold at the NAV, plus the applicable front-end sales charge. The sales charge varies depending on the amount purchased, but will not exceed 4.75%. A-Class share purchases of $1 million or more are exempt from the front-end sales charge but have a 1% contingent deferred sales charge (“CDSC”) if shares are redeemed within 12 months of purchase. C-Class shares have a 1% CDSC if shares are redeemed within 12 months of purchase. Institutional Class shares are offered primarily for direct investment by institutions such as pension and profit sharing plans, endowments, foundations and corporations. Institutional Class shares require a minimum initial investment of $2 million and a minimum account balance of $1 million. At December 31, 2017, the Trust consisted of fifty-three funds.
This report covers the Multi-Hedge Strategies Fund and Commodities Strategy Fund (the “Funds”), each a non-diversified investment company. Only A-Class, C-Class, H-Class, P-Class and Institutional Class shares had been issued by the Funds.
Security Investors, LLC, which operates under the name Guggenheim Investments (“GI”), provides advisory services. Guggenheim Funds Distributors, LLC (“GFD”) acts as principal underwriter for the Trust. GI and GFD are affiliated entities.
Consolidation of Subsidiary
Each of the consolidated financial statements of the Funds includes the accounts of a wholly-owned and controlled Cayman Islands subsidiary (the “Subsidiary”). Significant inter-company accounts and transactions have been eliminated in consolidation for the Funds.
Each Fund may invest up to 25% of its total assets in its Subsidiary which acts as an investment vehicle in order to effect certain investments consistent with the Fund’s investment objectives and policies.
| | THE GUGGENHEIM FUNDS ANNUAL REPORT | 59 |
| NOTES TO CONSOLIDATED FINANCIAL STATEMENTS (continued) |
A summary of each Fund’s investment in its respective Subsidiary is as follows:
| Fund | | Commencement
Date of
Subsidiary | | Subsidiary
Net Assets at
December 31,
2017 | | | % of Net Assets
of the Fund at
December 31,
2017 | |
| Multi-Hedge Strategies Fund | | 09/18/09 | | $ | 830,765 | | | | 1.4 | % |
| Commodities Strategy Fund | | 09/08/09 | | | 891,882 | | | | 12.5 | % |
Significant Accounting Policies
The Funds operate as investment companies and, accordingly, follow the investment company accounting and reporting guidance of the Financial Accounting Standards Board (“FASB”) Accounting Standards Codification Topic 946 Financial Services – Investment Companies.
The following significant accounting policies are in conformity with U.S. generally accepted accounting principles (“U.S. GAAP”) and are consistently followed by the Trust. This requires management to make estimates and assumptions that affect the reported amount of assets and liabilities, contingent assets and liabilities at the date of the consolidated financial statements, and the reported amounts of revenues and expenses during the reporting period. Actual results could differ from these estimates. All time references are based on Eastern Time.
The NAV of each Class of a fund is calculated by dividing the market value of the fund’s securities and other assets, less all liabilities, attributable to the Class by the number of outstanding shares of the Class.
(a) Valuation of Investments
The Board of Trustees of the Funds (the “Board”) has adopted policies and procedures for the valuation of the Funds’ investments (the “Valuation Procedures”). Pursuant to the Valuation Procedures, the Board has delegated to a valuation committee, consisting of representatives from Guggenheim’s investment management, fund administration, legal and compliance departments (the “Valuation Committee”), the day-to-day responsibility for implementing the Valuation Procedures, including, under most circumstances, the responsibility for determining the fair value of the Funds’ securities and/or other assets.
Valuations of the Funds’ securities are supplied primarily by pricing services appointed pursuant to the processes set forth in the Valuation Procedures. The Valuation Committee convenes monthly, or more frequently as needed, to review the valuation of all assets which have been fair valued for reasonableness. The Funds’ officers, through the Valuation Committee and consistent with the monitoring and review responsibilities set forth in the Valuation Procedures, regularly review procedures used and valuations provided by the pricing services.
If the pricing service cannot or does not provide a valuation for a particular investment or such valuation is deemed unreliable, such investment is fair valued by the Valuation Committee.
| 60 | THE GUGGENHEIM FUNDS ANNUAL REPORT | |
| NOTES TO CONSOLIDATED FINANCIAL STATEMENTS (continued) |
Open-end investment companies (“mutual funds”) are valued at their NAV as of the close of business, on the valuation date. Exchange-traded funds (“ETFs”) and closed-end investment companies (“CEFs”) are valued at the last quoted sales price.
U.S. Government securities are valued by either independent pricing services, the last traded fill price, or at the reported bid price at the close of business.
Repurchase agreements are valued at amortized cost, provided such amounts approximate market value.
Equity securities listed on an exchange (New York Stock Exchange (“NYSE”) or American Stock Exchange) are valued at the last quoted sales price as of the close of business on the NYSE, usually 4:00 p.m. on the valuation date. Equity securities listed on the NASDAQ market system are valued at the NASDAQ Official Closing Price on the valuation date, which may not necessarily represent the last sale price. If there has been no sale on such exchange or NASDAQ on a given day, the security is valued at the closing bid price on that day.
Generally, trading in foreign securities markets is substantially completed each day at various times prior to the close of the NYSE. The values of foreign securities are determined as of the close of such foreign markets or the close of the NYSE, if earlier. All investments quoted in foreign currencies are valued in U.S. dollars on the basis of the foreign currency exchange rates prevailing at the close of business. Investments in foreign securities may involve risks not present in domestic investments. The Valuation Committee will determine the current value of such foreign securities by taking into consideration certain factors which may include those discussed above, as well as the following factors, among others: the value of the securities traded on other foreign markets, ADR trading, closed-end fund trading, foreign currency exchange activity, and the trading prices of financial products that are tied to foreign securities. In addition, the Board has authorized the Valuation Committee and GI to use prices and other information supplied by a third party pricing vendor in valuing foreign securities.
Listed options are valued at the Official Settlement Price listed by the exchange, usually as of 4:00 p.m. Long options are valued using the bid price and short options are valued using the ask price. In the event that a settlement price is not available, fair valuation is enacted. Over-the-counter (“OTC”) options are valued using the average bid price (for long options) or average ask price (for short options) obtained from one or more security dealers.
The value of futures contracts is accounted for using the unrealized gain or loss on the contracts that is determined by marking the contracts to their current realized settlement prices. Financial futures contracts are valued at the 4:00 p.m. price on the valuation date. In the event that the exchange for a specific futures contract closes earlier than 4:00 p.m., the futures contract is valued at the Official Settlement Price of the exchange. However, the underlying securities from which the futures contract value is derived are monitored until 4:00 p.m. to determine if fair valuation would provide a more accurate valuation.
| | THE GUGGENHEIM FUNDS ANNUAL REPORT | 61 |
| NOTES TO CONSOLIDATED FINANCIAL STATEMENTS (continued) |
The values of OTC swap agreements entered into by a Fund are accounted for using the unrealized gains or losses on the agreements that are determined by marking the agreements to the last quoted value of the index that the swaps pertain to at the close of the NYSE.
Investments for which market quotations are not readily available are fair-valued as determined in good faith by GI, under the direction of the Board using methods established or ratified by the Board. Valuations in accordance with these methods are intended to reflect each security’s (or asset’s) “fair value”. Each such determination is based on a consideration of all relevant factors, which are likely to vary from one pricing context to another. Examples of such factors may include, but are not limited to market prices; sale prices; broker quotes; and models which derive prices based on inputs such as prices of securities with comparable maturities and characteristics, or based on inputs such as anticipated cash flows or collateral, spread over Treasuries, and other information analysis.
In connection with futures contracts and other derivative investments, such factors may include obtaining information as to how (a) these contracts and other derivative investments trade in the futures or other derivative markets, respectively, and (b) the securities underlying these contracts and other derivative investments trade in the cash market.
(b) U.S. Government and Agency Obligations
Certain U.S. Government and Agency Obligations are traded on a discount basis; the interest rates shown on the Consolidated Schedules of Investments reflect the effective rates paid at the time of purchase by the Funds. Other securities bear interest at the rates shown, payable at fixed dates through maturity.
(c) Short Sales
When a Fund engages in a short sale of a security, an amount equal to the proceeds is reflected as an asset and an equivalent liability. The amount of the liability is subsequently marked-to-market to reflect the market value of the short sale. The Fund maintains a segregated account of cash and/or securities as collateral for short sales.
Fees, if any, paid to brokers to borrow securities in connection with short sales are recorded as interest expense. In addition, the Fund must pay out the dividend rate of the equity or coupon rate of the obligation to the lender and record this as an expense. Short dividend or interest expense is a cost associated with the investment objective of short sales transactions, rather than an operational cost associated with the day-to-day management of any mutual fund. The Fund may also receive rebate income from the broker resulting from the investment of the proceeds from securities sold short.
| 62 | THE GUGGENHEIM FUNDS ANNUAL REPORT | |
| NOTES TO CONSOLIDATED FINANCIAL STATEMENTS (continued) |
(d) Options
Upon the purchase of an option, the premium paid is recorded as an investment, the value of which is marked-to-market daily. If a purchased option expires, the Fund realizes a loss in the amount of the cost of the option. When the Fund enters into a closing sale transaction, it realizes a gain or loss depending on whether the proceeds from the closing sale transaction are greater or less than the cost of the option. If the Fund exercises a put option, it realizes a gain or loss from the sale of the underlying security and the proceeds from such sale will be decreased by the premium originally paid. When the Fund exercises a call option, the cost of the security purchased by the Fund upon exercise increases by the premium originally paid. When the Fund writes (sells) an option, an amount equal to the premium received is entered in that Fund’s accounting records as an asset and equivalent liability. The amount of the liability is subsequently marked-to-market to reflect the current value of the option written. When a written option expires, or if the Fund enters into a closing purchase transaction, it realizes a gain (or loss if the cost of a closing purchase transaction exceeds the premium received when the option was sold).
(e) Futures Contracts
Upon entering into a futures contract, a Fund deposits and maintains as collateral such initial margin as required by the exchange on which the transaction is affected. Pursuant to the contract, the Fund agrees to receive from or pay to the broker an amount of cash equal to the daily fluctuation in value of the contract. Such receipts or payments are known as variation margin and are recorded by the Fund as unrealized gains or losses. When the contract is closed, the Fund records a realized gain or loss equal to the difference between the value of the contract at the time it was opened and the value at the time it was closed.
(f) Swap Agreements
Swap agreements are marked-to-market daily and the change, if any, is recorded as unrealized gain or loss. Payments received or made as a result of an agreement or termination of an agreement are recognized as realized gains or losses.
(g) Currency Translations
The accounting records of the Funds are maintained in U.S. dollars. All assets and liabilities initially expressed in foreign currencies are converted into U.S. dollars at prevailing exchange rates. Purchases and sales of investment securities, dividend and interest income, and certain expenses are translated at the rates of exchange prevailing on the respective dates of such transactions. Changes in the relationship of these foreign currencies to the U.S. dollar can significantly affect the value of the investments and earnings of the Funds. Foreign investments may also subject the Funds to foreign government exchange restrictions, expropriation, taxation, or other political, social or economic developments, all of which could affect the market and/or credit risk of the investments.
| | THE GUGGENHEIM FUNDS ANNUAL REPORT | 63 |
| NOTES TO CONSOLIDATED FINANCIAL STATEMENTS (continued) |
The Funds do not isolate that portion of the results of operations resulting from changes in the foreign exchange rates on investments from the fluctuations arising from changes in the market prices of securities held. Such fluctuations are included with the net realized and unrealized gain or loss on investments.
Reported net realized foreign exchange gains and losses arise from sales of foreign currencies and currency gains or losses realized between the trade and settlement dates on investment transactions. Net unrealized exchange gains and losses arise from changes in the fair values of assets and liabilities other than investments in securities at the fiscal period end, resulting from changes in exchange rates.
(h) Security Transactions
Security transactions are recorded on the trade date for financial reporting purposes. Realized gains and losses from securities transactions are recorded using the identified cost basis. Proceeds from lawsuits related to investment holdings are recorded as realized gains in the respective Fund. Dividend income is recorded on the ex-dividend date, net of applicable taxes withheld by foreign countries. Taxable non-cash dividends are recorded as dividend income. Interest income, including amortization of premiums and accretion of discounts, is accrued on a daily basis. Dividend income from Real Estate Investment Trusts (“REITs”) is recorded based on the income included in the distributions received from the REIT investments using published REIT classifications, including some management estimates when actual amounts are not available. Distributions received in excess of this estimated amount are recorded as a reduction of the cost of investments or reclassified to capital gains. The actual amounts of income, return of capital, and capital gains are only determined by each REIT after its fiscal year-end, and may differ from the estimated amounts.
(i) Distributions
Distributions of net investment income and net realized gains, if any, are declared and paid at least annually. Dividends are reinvested in additional shares unless shareholders request payment in cash. Distributions are recorded on the ex-dividend date and are determined in accordance with income tax regulations which may differ from U.S. GAAP.
(j) Class Allocations
Interest and dividend income, most expenses, all realized gains and losses, and all unrealized gains and losses are allocated to the classes based upon the value of the outstanding shares in each Class. Certain costs, such as distribution and service fees are charged directly to specific classes. In addition, certain expenses have been allocated to the individual Funds in the Trust on a pro rata basis upon the respective aggregate net assets of each Fund included in the Trust.
| 64 | THE GUGGENHEIM FUNDS ANNUAL REPORT | |
| NOTES TO CONSOLIDATED FINANCIAL STATEMENTS (continued) |
(k) Cash
The Funds may leave cash overnight in their cash account with the custodian. Periodically, a Fund may have cash due to the custodian bank as an overdraft balance. A fee is incurred on this overdraft, calculated by multiplying the overdraft by a rate based on the federal funds rate, which was 1.33% at December 31, 2017.
(l) Indemnifications
Under the Funds’ organizational documents, the Trustees and Officers are indemnified against certain liabilities arising out of the performance of their duties to the Trust. In addition, throughout the normal course of business, the Funds enter into contracts that contain a variety of representations and warranties which provide general indemnifications. The Funds’ maximum exposure under these arrangements is unknown, as this would involve future claims that may be made against the Funds and/or their affiliates that have not yet occurred. However, based on experience, the Funds expect the risk of loss to be remote.
Note 2 – Financial Instruments and Derivatives
As part of their investment strategy, the Funds utilize short sales and a variety of derivative instruments. These investments involve, to varying degrees, elements of market risk and risks in excess of the amounts recognized in the Consolidated Statements of Assets and Liabilities. Valuation and accounting treatment of these instruments can be found under Significant Accounting Policies in Note 1 of these Consolidated Notes to Financial Statements.
Short Sales
A short sale is a transaction in which a Fund sells a security it does not own. If the security sold short decreases in price between the time the Fund sells the security and closes its short position, the Fund will realize a gain on the transaction. Conversely, if the security increases in price during the period, the Fund will realize a loss on the transaction. The risk of such price increases is the principal risk of engaging in short sales.
Derivatives
Derivatives are instruments whose values depend on, or are derived from, in whole or in part, the value of one or more other assets, such as securities, currencies, commodities or indices. Derivative instruments may be used to increase investment flexibility (including to maintain cash reserves while maintaining exposure to certain other assets), for risk management (hedging) purposes, to facilitate trading, to reduce transaction costs and to pursue higher investment returns. Derivative instruments may also be used to mitigate certain investment risks, such as foreign currency exchange rate risk, interest rate risk and credit risk. U.S. GAAP requires disclosures to enable investors to better understand how and why a Fund uses derivative instruments, how these derivative instruments are accounted for and their effects on the Fund’s financial position and results of operations.
| | THE GUGGENHEIM FUNDS ANNUAL REPORT | 65 |
| NOTES TO CONSOLIDATED FINANCIAL STATEMENTS (continued) |
The Funds utilized derivatives for the following purposes:
Duration: the use of an instrument to manage the interest rate risk of a portfolio.
Hedge: an investment made in order to reduce the risk of adverse price movements in a security, by taking an offsetting position to protect against broad market moves.
Income: the use of any instrument that distributes cash flows typically based upon some rate of interest.
Index Exposure: the use of an instrument to obtain exposure to a listed or other type of index.
Leverage: gaining total exposure to equities or other assets on the long and short sides at greater than 100% of invested capital.
Liquidity: the ability to buy or sell exposure with little price/market impact.
Speculation: the use of an instrument to express macro-economic and other investment views.
For any Fund whose investment strategy consistently involves applying leverage, the value of the Fund’s shares will tend to increase or decrease more than the value of any increase or decrease in the underlying index or other asset. In addition, because an investment in derivative instruments generally requires a small investment relative to the amount of investment exposure assumed, an opportunity for increased net income is created; but, at the same time, leverage risk will increase. The Fund’s use of leverage, through borrowings or instruments such as derivatives, may cause the Fund to be more volatile and riskier than if they had not been leveraged.
Options Written
The risk in writing a call option is that a Fund may incur a loss if the market price of the underlying security increases and the option is exercised. The risk in writing a put option is that a Fund may incur a loss if the market price of the underlying security decreases and the option is exercised.
In addition, there may be an imperfect correlation between the movement in prices of options and the underlying securities where a Fund may not be able to enter into a closing transaction because of an illiquid secondary market; or, for OTC options, a Fund may be at risk because of the counterparty’s inability to perform.
The following tables represent the Funds’ use and activity of options written for the period ended December 31, 2017:
| Fund | Use | Average Number
of Contracts Written |
| Multi-Hedge Strategies Fund | Hedge, Income | 16 |
| Fund | | Use | | Average Notional Amount | |
| Multi-Hedge Strategies Fund | | Hedge, Income | | $ | 99,775 | |
| 66 | THE GUGGENHEIM FUNDS ANNUAL REPORT | |
| NOTES TO CONSOLIDATED FINANCIAL STATEMENTS (continued) |
Futures
A futures contract is an agreement to purchase (long) or sell (short) an agreed amount of securities or other instruments at a set price for delivery at a future date. There are significant risks associated with a Fund’s use of futures contracts, including (i) there may be an imperfect or no correlation between the changes in market value of the underlying asset and the prices of futures contracts; (ii) there may not be a liquid secondary market for a futures contract; (iii) trading restrictions or limitations may be imposed by an exchange; and (iv) government regulations may restrict trading in futures contracts. When investing in futures, there is minimal counterparty credit risk to a Fund because futures are exchange-traded and the exchange’s clearinghouse, as counterparty to all exchange-traded futures, guarantees against default. Cash deposits are shown as segregated cash with broker on the Consolidated Statements of Assets and Liabilities; securities held as collateral are noted on the Consolidated Schedules of Investments.
The following table represents the Funds’ use and volume of futures on a quarterly basis:
| | | | | Average Notional Amount | |
| Fund | | Use | | Long | | | Short | |
| Multi-Hedge Strategies Fund | | Duration, Hedge, Index exposure, Leverage, Liquidity, Speculation | | $ | 43,351,362 | | | $ | 28,361,272 | |
| Commodities Strategy Fund | | Index exposure, Liquidity | | | 5,543,063 | | | | — | |
Swaps
A swap is an agreement that obligates two parties to exchange a series of cash flows at specified intervals based upon or calculated by reference to changes in specified prices or rates for a specified amount of an underlying asset. A Fund utilizing OTC swaps bears the risk of loss of the amount expected to be received under a swap agreement in the event of the default or bankruptcy of a swap agreement counterparty or if the underlying asset declines in value. Certain standardized swaps are subject to mandatory central clearing and are executed on a multi-lateral or other trade facility platform, such as a registered exchange. There is limited counterparty credit risk with respect to centrally-cleared swaps as the transaction is facilitated through a central clearinghouse, much like an exchange-traded futures contract. Upon entering into a centrally-cleared swap transaction, the Fund is required to deposit with its clearing broker an amount of cash or securities as an initial margin. Subsequent variation margin payments or receipts are made or received by the Fund, depending on fluctuations in the fair value of the reference entity.
Total return swaps involve commitments where single or multiple cash flows are exchanged based on the price of an underlying reference asset (such as index or basket) or a fixed or variable interest rate. Index swaps will usually be computed based on the current index value as of the close of regular trading on the NYSE or other exchange, with the swap value being adjusted to include dividends accrued, financing charges and/or interest associated with the swap agreement.
| | THE GUGGENHEIM FUNDS ANNUAL REPORT | 67 |
| NOTES TO CONSOLIDATED FINANCIAL STATEMENTS (continued) |
A fund utilizing a total return index swap bears the risk of loss of the amount expected to be received under a swap agreement in the event of the default or bankruptcy of a swap agreement counterparty or if the underlying index declines in value.
The following table represents the Funds’ use and volume of total return swaps on a quarterly basis:
| | | | | Average Notional Amount | |
| Fund | | Use | | Long | | | Short | |
| Multi-Hedge Strategies Fund | | Hedge, Index exposure, Leverage, Liquidity, Speculation | | $ | 18,325,733 | | | $ | 12,593,826 | |
Derivative Investment Holdings Categorized by Risk Exposure
The following is a summary of the location of derivative investments on the Funds’ Consolidated Statements of Assets and Liabilities as of December 31, 2017:
| Derivative Investment Type | Asset Derivatives | Liability Derivatives |
| Equity/Currency/Interest Rate/Commodity contracts | Variation margin | Variation margin |
| Equity contracts | Unrealized appreciation on swap agreements | Unrealized depreciation on swap agreements |
The following table sets forth the fair value of the Funds’ derivative investments categorized by primary risk exposure at December 31, 2017:
| Asset Derivative Investments Value |
| Fund | | | Swaps
Equity
Risk | | | | Futures
Equity
Risk* | | | | Futures
Currency
Risk* | | | | Futures
Interest Rate
Risk* | | | | Futures
Commodity
Risk* | | | | Total Value at
December 31,
2017 | |
| Multi-Hedge Strategies Fund | | $ | 1,881,014 | | | $ | 3,554,695 | | | $ | 62,028 | | | $ | 24,005 | | | $ | 284,185 | | | $ | 5,805,927 | |
| Commodities Strategy Fund | | | — | | | | — | | | | — | | | | — | | | | 373,136 | | | | 373,136 | |
| Liability Derivative Investments Value |
| Fund | | Swaps
Equity
Risk | | | Futures
Equity
Risk* | | | Futures
Currency
Risk* | | | Futures
Interest Rate
Risk* | | | Futures
Commodity
Risk* | | | Total Value at
December 31,
2017 | |
| Multi-Hedge Strategies Fund | | $ | 1,059,851 | | | $ | 1,378,944 | | | $ | 14,829 | | | $ | 43,285 | | | $ | 60,793 | | | $ | 2,557,702 | |
| * | | Includes cumulative appreciation (depreciation) of futures contracts as reported on the Consolidated Schedules of Investments. Only current day’s variation margin is reported within the Consolidated Statements of Assets and Liabilities. |
| 68 | THE GUGGENHEIM FUNDS ANNUAL REPORT | |
| NOTES TO CONSOLIDATED FINANCIAL STATEMENTS (continued) |
The following is a summary of the location of derivative investments on the Funds’ Consolidated Statements of Operations for the year ended December 31, 2017:
| Derivative Investment Type | Location of Gain (Loss) on Derivatives |
| Equity/Currency/Interest Rate/Commodity contracts | Net realized gain (loss) on futures contracts |
| | Net change in unrealized appreciation (depreciation) on futures contracts |
| Equity contracts | Net realized gain (loss) on swap agreements |
| | Net change in unrealized appreciation (depreciation) on swap agreements |
| Equity contracts | Net realized gain (loss) on options written |
| | Net change in unrealized appreciation (depreciation) on options written agreements |
The following is a summary of the Funds’ realized gain (loss) and change in unrealized appreciation (depreciation) on derivative investments recognized on the Consolidated Statements of Operations categorized by primary risk exposure for the year ended December 31, 2017:
| Realized Gain (Loss) on Derivative Investments Recognized on the Consolidated Statements of Operations |
| Fund | | Futures
Equity
Risk | | | Swaps
Equity
Risk | | | Futures
Currency
Risk | | | Futures
Interest
Rate
Risk | | | Futures
Commodity
Risk | | | Options
Written
Equity
Risk | | | Total | |
| Multi-Hedge Strategies Fund | | $ | (1,369,705 | ) | | $ | 1,059,445 | | | $ | (143,983 | ) | | $ | 419,061 | | | $ | (659,749 | ) | | $ | 1,607 | | | $ | (693,324 | ) |
| Commodities Strategy Fund | | | — | | | | — | | | | — | | | | — | | | | 13,909 | | | | — | | | | 13,909 | |
| Change in Unrealized Appreciation (Depreciation) on Derivative Investments Recognized on the Consolidated Statements of Operations |
| Fund | | Futures
Equity
Risk | | | Swaps
Equity
Risk | | | Futures
Currency
Risk | | | Futures
Interest
Rate
Risk | | | Futures
Commodity
Risk | | | Options
Written
Equity
Risk | | | Total | |
| Multi-Hedge Strategies Fund | | $ | 1,749,795 | | | $ | 950,291 | | | $ | (36,878 | ) | | $ | (137,007 | ) | | $ | 188,732 | | | $ | 26,345 | | | $ | 2,741,278 | |
| Commodities Strategy Fund | | | — | | | | — | | | | — | | | | — | | | | 174,096 | | | | — | | | | 174,096 | |
In conjunction with the use of short sales and derivative instruments, the Funds are required to maintain collateral in various forms. The Funds use, where appropriate, depending on the financial instrument utilized and the broker involved, margin deposits at the broker, cash and/or securities segregated at the custodian bank, discount notes or the repurchase agreements allocated to the Funds.
| | THE GUGGENHEIM FUNDS ANNUAL REPORT | 69 |
| NOTES TO CONSOLIDATED FINANCIAL STATEMENTS (continued) |
The Trust has established counterparty credit guidelines and enters into transactions only with financial institutions of investment grade or better. The Trust monitors the counterparty credit risk.
Note 3 – Offsetting
In the normal course of business, the Funds enter into transactions subject to enforceable master netting arrangements or other similar arrangements. Generally, the right to offset in those agreements allows the Funds to counteract the exposure to a specific counterparty with collateral received from or delivered to that counterparty based on the terms of the arrangements. These arrangements provide for the right to liquidate upon the occurrence of an event of default, credit event upon merger or additional termination event.
In order to better define their contractual rights and to secure rights that will help the Funds mitigate their counterparty risk, the Funds may enter into an International Swaps and Derivatives Association, Inc. Master Agreement (“ISDA Master Agreement”) or similar agreement with their derivative contract counterparties. An ISDA Master Agreement is a bilateral agreement between a Fund and a counterparty that governs OTC derivatives, including foreign exchange contracts, and typically contains, among other things, collateral posting terms and netting provisions in the event of a default and/or termination event. The provisions of the ISDA Master Agreement typically permit a single net payment in the event of a default (close-out netting) or similar event, including the bankruptcy or insolvency of the counterparty.
For derivatives traded under an ISDA Master Agreement, the collateral requirements are typically calculated by netting the mark-to-market amount for each transaction under such agreement and comparing that amount to the value of any collateral currently pledged by the Funds and the counterparty. For financial reporting purposes, cash collateral that has been pledged to cover obligations of the Funds and cash collateral received from the counterparty, if any, are reported separately on the Consolidated Statements of Assets and Liabilities as segregated cash with broker/receivable for variation margin, or payable for swap settlement/variation margin. Generally, the amount of collateral due from or to a counterparty must exceed a minimum transfer amount threshold (e.g., $300,000) before a transfer is required to be made. To the extent amounts due to the Funds from their counterparties are not fully collateralized, contractually or otherwise, the Funds bear the risk of loss from counterparty nonperformance. The Funds attempt to mitigate counterparty risk by only entering into agreements with counterparties that they believe to be of good standing and by monitoring the financial stability of those counterparties.
For financial reporting purposes, the Funds do not offset derivative assets and derivative liabilities that are subject to netting arrangements in the Consolidated Statements of Assets and Liabilities.
| 70 | THE GUGGENHEIM FUNDS ANNUAL REPORT | |
| NOTES TO CONSOLIDATED FINANCIAL STATEMENTS (continued) |
The following tables present derivative financial instruments and secured financing transactions that are subject to enforceable netting arrangements and offset in the Consolidated Statements of Assets and Liabilities in conformity with U.S. GAAP:
| | | | | | | | | | | | | | Gross Amounts Not Offset
in the Consolidated Statements of
Assets and Liabilities | | | | |
| Fund | | Instrument | | Gross
Amounts of
Recognized
Assets1 | | | Gross
Amounts
Offset In the Consolidated
Statements
of Assets and
Liabilities | | | Net Amount
of Assets
Presented
on the
Consolidated
Statements
of Assets and
Liabilities | | | Financial
Instruments | | | Cash
Collateral
Received | | | Net
Amount | |
| Multi-Hedge Strategies Fund | | Equity Swap Agreements | | $ | 1,881,014 | | | $ | — | | | $ | 1,881,014 | | | $ | (1,059,851 | ) | | $ | — | | | $ | 821,163 | |
| | | | | | | | | | | | | | Gross Amounts Not Offset
in the Consolidated Statements of
Assets and Liabilities | | | | |
| Fund | | Instrument | | Gross
Amounts of
Recognized
Liabilities1 | | | Gross
Amounts Offset In the
Consolidated
Statements
of Assets and
Liabilities | | | Net Amount
of Liabilities
Presented on the
Consolidated
Statements
of Assets and
Liabilitie | | | Financial
Instruments | | | Cash
Collateral
Pledged | | | Net
Amount | |
| Multi-Hedge Strategies Fund | | Equity Swap Agreements | | $ | 1,059,851 | | | $ | — | | | $ | 1,059,851 | | | $ | (1,059,851 | ) | | $ | — | | | $ | — | |
| 1 | | Exchange-traded futures are excluded from these reported amounts. |
The following table presents deposits held by others in connection with derivative investments as of December 31, 2017. The derivatives tables following the Consolidated Schedules of Investments list each counterparty for which cash collateral may have been pledged or received at period end. The Fund has the right to offset these deposits against any related liabilities outstanding with each counterparty.
| Fund | Counterparty/Clearing Agent | Asset Type | Cash
Pledged | Cash
Received |
| Multi-Hedge Strategies Fund | Goldman Sachs Group | Futures contracts | 1,335,190 | — |
| Commodities Strategy Fund | Goldman Sachs Group | Futures contracts | 92,760 | — |
| | THE GUGGENHEIM FUNDS ANNUAL REPORT | 71 |
| NOTES TO CONSOLIDATED FINANCIAL STATEMENTS (continued) |
Note 4 – Fair Value Measurement
In accordance with U.S. GAAP, fair value is defined as the price that the Funds would receive to sell an investment or pay to transfer a liability in an orderly transaction with an independent buyer in the principal market, or in the absence of a principal market, the most advantageous market for the investment or liability. U.S. GAAP establishes a three-tier fair value hierarchy based on the types of inputs used to value assets and liabilities and requires corresponding disclosure. The hierarchy and the corresponding inputs are summarized below:
| Level 1 — | quoted prices in active markets for identical assets or liabilities. |
| Level 2 — | significant other observable inputs (for example quoted prices for securities that are similar based on characteristics such as interest rates, prepayment speeds, credit risk, etc.). |
| Level 3 — | significant unobservable inputs based on the best information available under the circumstances, to the extent observable inputs are not available, which may include assumptions. |
The types of inputs available depend on a variety of factors, such as the type of security and the characteristics of the markets in which it trades, if any. Fair valuation determinations that rely on fewer or no observable inputs require greater judgment. Accordingly, fair value determinations for Level 3 securities require the greatest amount of judgment.
The inputs or methodologies used for valuing securities are not necessarily an indication of the risk associated with investing in those securities. The suitability of the techniques and sources employed to determine fair valuation are regularly monitored and subject to change.
Note 5 – Repurchase Agreements
The Funds transfer uninvested cash balances into a single joint account, the daily aggregate balance of which is invested in one or more repurchase agreements collateralized by obligations of the U.S. Treasury and U.S. government agencies. The joint account includes other Funds in the Guggenheim complex not covered in this report. The collateral is in the possession of the Funds’ custodian and is evaluated to ensure that its market value exceeds, at a minimum, 102% of the original face amount of the repurchase agreements. Each Fund holds a pro rata share of the collateral based on the dollar amount of the repurchase agreement entered into by each Fund.
| 72 | THE GUGGENHEIM FUNDS ANNUAL REPORT | |
| NOTES TO CONSOLIDATED FINANCIAL STATEMENTS (continued) |
At December 31, 2017, the repurchase agreements in the joint account were as follows:
Counterparty and
Terms of Agreement | | Face
Value | | | Repurchase Price | | | Collateral | | Par
Value | | | Fair
Value | |
| JP Morgan Chase & Co. | | | | | | | | U.S. Treasury Notes | | | | | | |
| 1.41% | | | | | | | | | | 1.38% - 2.75% | | | | | | | | |
| Due 01/02/18 | | $ | 118,247,885 | | | | 118,261,779 | | | 04/15/20 - 08/15/26 | | $ | 119,039,900 | | | $ | 120,612,516 | |
| | | | | | | | | | | U.S. TIP Notes | | | | | | | | |
| | | | | | | | | | | 1.13% -3.88% | | | | | | | | |
| | | | | | | | | | | 01/15/21 - 04/15/29 | | | 200 | | | | 323 | |
| | | | | | | | | | | U.S. Treasury Bond | | | | | | | | |
| | | | | | | | | | | 2.50% | | | | | | | | |
| | | | | | | | | | | 02/15/45 | | | 100 | | | | 96 | |
| | | | | | | | | | | | | | | | | $ | 120,612,935 | |
| | | | | | | | | | | | | | | | | | | |
| Bank of America Merrill Lynch | | | | | | | | | | U.S. Treasury Bond | | | | | | | | |
| 1.40% | | | | | | | | | | 4.25% | | | | | | | | |
| Due 01/02/18 | | | 63,109,244 | | | | 63,116,607 | | | 11/15/40 | | $ | 37,050,000 | | | $ | 47,126,331 | |
| | | | | | | | | | | U.S. Treasury Note | | | | | | | | |
| | | | | | | | | | | 1.25% | | | | | | | | |
| | | | | | | | | | | 07/31/23 | | | 18,126,500 | | | | 17,245,173 | |
| | | | | | | | | | | | | | | | | $ | 64,371,504 | |
In the event of counterparty default, the Funds have the right to collect the collateral to offset losses incurred. There is potential loss to the Funds in the event the Funds are delayed or prevented from exercising their rights to dispose of the collateral securities, including the risk of a possible decline in the value of the underlying securities during the period while the Funds seek to assert their rights. The Funds’ investment adviser, acting under the supervision of the Board, reviews the value of the collateral and the creditworthiness of those banks and dealers with which the Funds enter into repurchase agreements to evaluate potential risks.
Note 6 – Portfolio Securities Loaned
The Funds may lend their securities to approved brokers to earn additional income. Security lending income shown on the Consolidated Statements of Operations is shown net of rebates paid to the borrowers and earnings on cash collateral investments shared with the lending agent. Within this arrangement, the Funds act as the lender, U.S. Bank acts as the lending agent, and other approved registered broker dealers act as the borrowers. The Funds receive cash collateral, valued at 102% of the value of the securities on loan. Under the terms of the Funds’ securities lending agreement with U.S. Bank, cash collateral and proceeds are invested in the First American Government Obligations Fund — Class Z. The Funds bear the risk of loss on cash collateral investments. Collateral is maintained over the life of the loan in an amount not less than the value of loaned securities, as determined at the close of fund business each day; any additional collateral required due to changes in security values is delivered to the Funds the next business day. Although the collateral mitigates the risk, the Funds could experience a delay in recovering its
| | THE GUGGENHEIM FUNDS ANNUAL REPORT | 73 |
| NOTES TO CONSOLIDATED FINANCIAL STATEMENTS (continued) |
securities and a possible loss of income or value if the borrower fails to return the securities. The Funds have the right under the securities lending agreement to recover the securities from the borrower on demand. Securities lending transactions are accounted for as secured borrowings. The remaining contractual maturity of the securities lending agreement is overnight and continuous.
At December 31, 2017, the Funds participated in securities lending transactions, which are subject to enforceable netting arrangements, as follows:
| | | Gross Amounts Not Offset in the Consolidated
Statements of Assets and Liabilities | | | Securities Lending Collateral | |
| Fund | | Value of
Securities
Loaned | | | Collateral
Received(a) | | | Net
Amount | | | Cash
Collateral
Invested | | | Cash
Collateral
Uninvested | | | Total
Collateral | |
| Multi-Hedge Strategies Fund | | $ | 277,910 | | | $ | (277,910 | ) | | $ | — | | | $ | 286,287 | | | $ | — | | | $ | 286,287 | |
| (a) | | Actual collateral received by the Fund is greater than the amount shown due to overcollateralization. |
In the event of counterparty default, the Funds have the right to collect the collateral to offset losses incurred. There is potential loss to the Funds in the event the Funds are delayed or prevented from exercising their rights to dispose of the collateral securities, including the risk of a possible decline in the value of the underlying securities during the period while the Funds seek to assert their rights. GI, acting under the supervision of the Board, reviews the value of the collateral and the creditworthiness of those banks and dealers to evaluate potential risks.
Note 7 – Investment Advisory Agreement and other Agreements
Under the terms of an investment advisory contract, the Funds pay GI investment advisory fees calculated at the annualized rates below, based on the average daily net assets of the Funds:
| Fund | Management Fees
(as a % of Net Assets) |
| Multi-Hedge Strategies Fund | 1.15% |
| Commodities Strategy Fund | 0.75% |
GI has contractually agreed to waive the management fee it receives from each Subsidiary in an amount equal to the management fee paid to GI by the Subsidiary. This undertaking will continue in effect for so long as the Funds invest in the Subsidiaries, and may not be terminated by GI unless GI obtains the prior approval of the Funds’ Board of Trustees for such termination. For the period ended December 31, 2017, Multi-Hedge Strategies Fund and Commodities Strategy Fund waived $32,869 and $6,276 respectively, related to investments in the Subsidiary.
| 74 | THE GUGGENHEIM FUNDS ANNUAL REPORT | |
| NOTES TO CONSOLIDATED FINANCIAL STATEMENTS (continued) |
As part of its agreement with the Trust, GI will pay all expenses of the Multi-Hedge Strategies Fund, including the cost of transfer agency, custody, fund administration, legal, audit and other services, except interest expense, taxes (expected to be de minimis), brokerage commissions and other expenses connected with execution of portfolio transactions, short dividend expenses, subsidiary expenses and extraordinary expenses.
GI engages external service providers to perform other necessary services for the Trust, such as audit and accounting related services, legal services, custody, printing and mailing, etc., on a pass-through basis. Such expenses are allocated to various Funds within the complex based on relative net assets.
The Trust has adopted a Distribution Plan applicable to A-Class shares and H-Class shares for which GFD and other firms that provide distribution and/or shareholder services (“Service Providers”) may receive compensation. If a Service Provider provides distribution services, the Funds will pay distribution fees to GFD at an annual rate not to exceed 0.25% of average daily net assets, pursuant to Rule 12b-1 of the 1940 Act. GFD, in turn, will pay the Service Provider out of its fees. GFD may, at its discretion, retain a portion of such payments to compensate itself for distribution services.
The Trust has adopted a separate Distribution and Shareholder Services Plan applicable to its C-Class shares that allows the Funds to pay annual distribution and service fees of 1.00% of the Funds’ C-Class shares average daily net assets. The annual 0.25% service fee compensates a shareholder’s financial adviser for providing ongoing services to the shareholder. The annual distribution fee of 0.75% reimburses GFD for paying the shareholder’s financial adviser an ongoing sales commission. GFD advances the first year’s service and distribution fees to the financial adviser. GFD retains the service and distribution fees on accounts with no authorized dealer of record.
For the year ended December 31, 2017, GFD retained sales charges of $186,037 relating to sales of A-Class shares of the Trust.
If a Fund invests in an affiliated fund, the investing Fund’s adviser has agreed to waive fees at the investing fund level. Fee waivers will be calculated at the investing Fund level without regard to any expense cap, if any, in effect for the investing Fund. Fees waived under this arrangement are not subject to reimbursement to GI. For the year ended December 31, 2017, the Multi-Hedge Strategies Fund waived $83 related to investments in affiliated funds.
Certain officers of the Trust are also officers of GI and GFD.
MUFG Investor Services (US), LLC (“MUIS”) acts as the Funds’ administrator, transfer agent, and accounting agent. As administrator, transfer agent and accounting agent, MUIS is responsible for maintaining the books and records of the Funds’ securities and cash. The U.S Bank, N.A. (“U.S. Bank”) acts as the Funds’ custodian. As custodian, U.S. Bank is responsible for the custody of the
| | THE GUGGENHEIM FUNDS ANNUAL REPORT | 75 |
| NOTES TO CONSOLIDATED FINANCIAL STATEMENTS (continued) |
Funds’ assets. For providing the aforementioned services, MUIS and U.S. Bank are entitled to receive a monthly fee equal to an annual percentage of the Fund’s average daily managed assets subject to certain minimum monthly fees and out of pocket expenses.
Note 8 – Federal Income Tax Information
The Funds intend to comply with the provisions of Subchapter M of the Internal Revenue Code applicable to regulated investment companies and will distribute substantially all taxable net investment income and capital gains sufficient to relieve the Funds from all, or substantially all, federal income, excise and state income taxes. Therefore, no provision for federal or state income tax or federal excise tax is required.
Tax positions taken or expected to be taken in the course of preparing the Funds’ tax returns are evaluated to determine whether the tax positions are “more-likely-than-not” of being sustained by the applicable tax authority. Tax positions not deemed to meet the more-likely-than-not threshold would be recorded as a tax benefit or expense in the current year. Management has analyzed the Funds’ tax positions taken, or to be taken, on federal income tax returns for all open tax years, and has concluded that no provision for income tax is required in the Funds’ financial statements. The Funds’ federal tax returns are subject to examination by the Internal Revenue Service for a period of three years after they are filed.
The Funds intend to invest up to 25% of their assets in the respective Subsidiary which is expected to provide the Funds with exposure to the commodities markets within the limitations of the federal tax requirements under Subchapter M of the Internal Revenue Code. The Funds have received a private letter ruling from the Internal Revenue Service that concludes that the income the Funds receive from the Subsidiary will constitute qualifying income for purposes of Subchapter M of the Internal Revenue Code. The Subsidiary will be classified as a corporation for U.S. federal income tax purposes. A foreign corporation, such as the Subsidiary, will generally not be subject to U.S. federal income taxation unless it is deemed to be engaged in a U.S. trade or business.
The tax character of distributions paid during the year ended December 31, 2017 was as follows:
| Fund | | Ordinary
Income | | | Long-Term
Capital Gain | | | Total
Distributions | |
| Commodities Strategy Fund | | $ | 106,005 | | | $ | — | | | $ | 106,005 | |
The tax character of distributions paid during the year ended December 31, 2016 was as follows:
| Fund | | Ordinary
Income | | | Long-Term
Capital Gain | | | Total
Distributions | |
| Multi-Hedge Strategies Fund | | $ | 160,359 | | | $ | — | | | $ | 160,359 | |
| 76 | THE GUGGENHEIM FUNDS ANNUAL REPORT | |
| NOTES TO CONSOLIDATED FINANCIAL STATEMENTS (continued) |
Note: For federal income tax purposes, short-term capital gain distributions are treated as ordinary income distributions.
The tax components of accumulated earnings/(deficit) as of December 31, 2017 were as follows:
| Fund | | Undistributed
Ordinary
Income | | | Undistribured
Long-Term
Capital Gain | | | Net Unrealized
Appreciation
(Depreciation) | | | Accumulated
Capital and
Other Losses | | | Total | |
| Multi-Hedge Strategies Fund | | $ | — | | | $ | — | | | $ | (3,189,626 | ) | | $ | (219,647 | ) | | $ | (3,409,273 | ) |
| Commodities Strategy Fund | | | 747,314 | | | | — | | | | (2,967,297 | ) | | | — | | | | (2,219,983 | ) |
For Federal income tax purposes, capital loss carryforwards represent realized losses of the Funds that may be carried forward and applied against future capital gains. For taxable years beginning on or before December 22, 2010, such capital losses may be carried forward for a maximum of eight years. Under the RIC Modernization Act of 2010, the Funds are permitted to carry forward capital losses incurred in taxable years beginning after December 22, 2010 for an unlimited period. However, any losses incurred during those taxable years must be utilized prior to the losses incurred in pre-enactment taxable years. As a result of this ordering rule, pre-enactment capital loss carryforwards may be more likely to expire unused. Additionally, post-enactment capital losses that are carried forward will retain their character as either short-term or long-term capital losses rather than being considered all short-term as under previous law. As of December 31, 2017, capital loss carryforwards for the Funds were as follows:
| | | | | | | Unlimited | | | | |
| Fund | | | Expires in
2018 | | | Short-Term | | | Long-Term | | | Total
Capital Loss
Carryforward | |
| Multi-Hedge Strategies Fund | | | | $ | (219,647 | ) | | $ | — | | | $ | — | | | $ | (219,647 | ) |
For the year ended December 31, 2017, the following capital loss carryforward amounts expired or were utilized:
| Fund | | Expired | | | Utilized | | | Total | |
| Multi-Hedge Strategies Fund | | $ | 1,851,764 | | | $ | 6,971,775 | | | $ | 8,823,539 | |
| Commodities Strategy Fund | | | 19,804,892 | | | | 89,758 | | | | 19,894,650 | |
Net investment income and net realized gains (losses) may differ for financial statement and tax purposes because of temporary or permanent book/tax differences. These differences are primarily due to investment in the subsidiaries, the “mark-to-market” of certain derivatives, investment in partnerships, losses deferred due to wash sales, investment in real estate investment trusts, special dividends, investment in securities sold short, foreign currency gains and losses, and investment in swaps. Additional differences may result from the tax treatment of net investment losses and
| | THE GUGGENHEIM FUNDS ANNUAL REPORT | 77 |
| NOTES TO CONSOLIDATED FINANCIAL STATEMENTS (continued) |
the expiration of capital loss carryforward amounts. To the extent these differences are permanent, reclassifications are made to the appropriate capital accounts in the period that the differences arise. These reclassifications have no effect on net assets or NAV per share.
The following adjustments were made on the Consolidated Statements of Assets and Liabilities as of December 31, 2017 for permanent book/tax differences:
| Fund | | Paid In
Capital | | | Undistributed
Net Investment
Income | | | Accumulated
Net Realized
Gain | |
| Multi-Hedge Strategies Fund | | $ | (2,823,696 | ) | | $ | 353,455 | | | $ | 2,470,241 | |
| Commodities Strategy Fund | | | (20,752,073 | ) | | | 875,388 | | | | 19,876,685 | |
At December 31, 2017, the cost of securities for Federal income tax purposes, the aggregate gross unrealized gain for all securities for which there was an excess of value over tax cost and the aggregate gross unrealized loss for all securities for which there was an excess of tax cost over value, were as follows:
| Fund | | Tax
Cost | | | Tax
Unrealized
Gain | | | Tax
Unrealized
(Loss) | | | Net
Unrealized
(Loss) | |
| Multi-Hedge Strategies Fund | | $ | 42,685,285 | | | $ | 2,922,561 | | | $ | (6,111,839 | ) | | $ | (3,189,278 | ) |
| Commodities Strategy Fund | | | 10,095,581 | | | | — | | | | (2,967,297 | ) | | | (2,967,297 | ) |
Note 9 – Securities Transactions
For the year ended December 31, 2017, the cost of purchases and proceeds from sales of investment securities, excluding government securities, short-term investments and derivatives, were as follows:
| Fund | | Purchases | | | Sales | |
| Multi-Hedge Strategies Fund | | $ | 154,356,390 | | | $ | 158,799,907 | |
| Commodities Strategy Fund | | | 600,000 | | | | 800,000 | |
The Funds are permitted to purchase or sell securities from or to certain affiliated funds under specified conditions outlined in procedures adopted by the Board of the Trust. The procedures have been designed to ensure that any purchase or sale of securities by a Fund from or to another fund or portfolio that is or could be considered an affiliate by virtue of having a common investment adviser (or affiliated investment advisers), common Trustees and/or common officers complies with Rule 17a-7 of the 1940 Act. Further, as defined under these procedures, each
| 78 | THE GUGGENHEIM FUNDS ANNUAL REPORT | |
| NOTES TO CONSOLIDATED FINANCIAL STATEMENTS (continued) |
transaction is effected at the current market price to save costs, where permissible. For the year ended December 31, 2017, the Funds engaged in purchases and sales of securities, pursuant to Rule 17a-7 of the 1940 Act, as follows:
| Fund | | Purchases | | | Sales | | | Realized
Gain (Loss) | |
| Multi-Hedge Strategies Fund | | $ | — | | | $ | 374,662 | | | $ | (1,631 | ) |
Note 10 – Line of Credit
The Trust, along with other affiliated trusts, secured an uncommitted $75,000,000 line of credit from U.S. Bank, N.A., which expires June 11, 2018. This line of credit is reserved for emergency or temporary purposes. Borrowings, if any, under this arrangement bear interest equal to the Prime Rate, minus 2%, which shall be paid monthly, averaging 2.09% for the year ended December 31, 2017. The Funds did not have any borrowings outstanding under this agreement at December 31, 2017.
The average daily balances borrowed for the year ended December 31, 2017, were as follows:
| Fund | | Average Daily Balance | |
| Multi-Hedge Strategies Fund | | $ | 33,662 | |
Note 11 – Share Splits
Share splits occurred for the following Fund at the close of business:
| Fund | Effective Date | Split Type |
| Commodities Strategy Fund | October 28, 2016 | One-for-twelve Reverse Share Split |
The effect of this transaction was to divide the number of outstanding shares of the Commodities Strategy Fund by its reverse split ratio, resulting in a corresponding increase in the NAV. The share transactions presented in the Consolidated Statements of Changes in Net Assets and the per share data in the Consolidated Financial Highlights for each of the periods presented prior to the effective date, have been restated to reflect the share split. There was no change in net assets, results of operations or total return as a result of this transaction.
Note 12 – Legal Proceedings
Tribune Company
Rydex Series Funds has been named as a defendant and a putative member of the proposed defendant class of shareholders in the case entitled Kirschner v. FitzSimons, No. 12-2652 (S.D.N.Y.) (formerly Official Committee of Unsecured Creditors of Tribune Co. v. FitzSimons, Adv. Pro. No. 10-54010 (Bankr. D. Del.)) (the “FitzSimons action”), as a result of
| | THE GUGGENHEIM FUNDS ANNUAL REPORT | 79 |
| NOTES TO CONSOLIDATED FINANCIAL STATEMENTS (continued) |
ownership by certain series of the Rydex Series Funds of shares in the Tribune Company (“Tribune”) in 2007, when Tribune effected a leveraged buyout transaction (“LBO”) by which Tribune converted to a privately-held company. In his complaint, the plaintiff has alleged that, in connection with the LBO, Tribune insiders and shareholders were overpaid for their Tribune stock using financing that the insiders knew would, and ultimately did, leave Tribune insolvent. The plaintiff has asserted claims against certain insiders, major shareholders, professional advisers, and others involved in the LBO. The plaintiff is also attempting to obtain from former Tribune shareholders, including the Rydex Series Funds, the proceeds they received in connection with the LBO.
In June 2011, a group of Tribune creditors filed multiple actions against former Tribune shareholders involving state law constructive fraudulent conveyance claims arising out of the 2007 LBO (the “SLCFC actions”). Rydex Series Funds has been named as a defendant in one or more of these suits. In those actions, the creditors seek to recover from Tribune’s former shareholders the proceeds received in connection with the 2007 LBO.
The FitzSimons action and the SLCFC actions have been consolidated with the majority of the other Tribune LBO-related lawsuits in a multidistrict litigation proceeding captioned In re Tribune Company Fraudulent Conveyance Litig., No. 11-md-2696 (S.D.N.Y.) (the “MDL Proceeding”).
On September 23, 2013, the District Court granted the defendants’ omnibus motion to dismiss the SLCFC actions, on the basis that the creditors lacked standing. On September 30, 2013, the creditors filed a notice of appeal of the September 23 order. On October 28, 2013, the defendants filed a joint notice of cross-appeal of that same order.
On March 29, 2016, the U.S. Court of Appeals for the Second Circuit issued its opinion on the appeal of the SLCFC actions. The appeals court affirmed the district court’s dismissal of those lawsuits, but on different grounds than the district court. The appeals court held that while the plaintiffs have standing under the U.S. Bankruptcy Code, their claims were preempted by Section 546(e) of the Bankruptcy Code—the statutory safe harbor for settlement payments. On April 12, 2016, the Plaintiffs in the SLCFC actions filed a petition seeking rehearing en banc before the appeals court. On July 22, 2016, the appeals court denied the petition. On September 9, 2016, the plaintiffs filed a petition for writ of certiorari in the U.S. Supreme Court challenging the Second Circuit’s decision that the safe harbor of Section 546(e) applied to their claims. The shareholder defendants, including the Funds, filed a joint brief in opposition to the petition for certiorari on October 24, 2016. The Supreme Court has not yet granted or denied the petition for certiorari.
On May 23, 2014, the defendants filed motions to dismiss the FitzSimons action, including a global motion to dismiss Count I, which is the claim brought against former Tribune shareholders for intentional fraudulent conveyance under U.S. federal law. On January 6, 2017, the United States District Court for the Southern District of New York granted the shareholder defendants’ motion to dismiss the intentional fraudulent conveyance claim in the FitzSimons action. In dismissing the intentional fraudulent conveyance claim, the Court denied the plaintiff’s request to amend the complaint. The plaintiff requested that the Court direct entry of a final judgment in order to make
| 80 | THE GUGGENHEIM FUNDS ANNUAL REPORT | |
| NOTES TO CONSOLIDATED FINANCIAL STATEMENTS (continued) |
the order immediately appealable. On February 23, 2017, the Court issued an order stating that it intends to permit an interlocutory appeal of the dismissal order, but will wait to do so until it has resolved outstanding motions to dismiss filed by other defendants. Accordingly, the timing of the appeal is uncertain.
On July 18, 2017, the plaintiff submitted a letter to the District Court seeking leave to amend its complaint to add a constructive fraudulent transfer claim. The shareholder defendants opposed that request. On August 24, 2017, the Court denied the plaintiff’s request without prejudice to renewal of the request in the event of an intervening change in the law.
None of these lawsuits alleges any wrongdoing on the part of Rydex Series Funds. The following series of Rydex Series Funds held shares of Tribune and tendered these shares as part of Tribune’s LBO: Nova Fund, S&P 500® Pure Value Fund, Multi-Cap Core Equity Fund, S&P 500® Fund, Multi-Hedge Strategies Fund and Hedged Equity Fund (the “Funds”). The value of the proceeds received by the foregoing Funds was $28,220, $109,242, $9,860, $3,400, $1,181,160, and $10,880, respectively. At this stage of the proceedings, Rydex Series Funds is not able to make a reliable predication as to the outcome of these lawsuits or the effect, if any, on a Fund’s net asset value.
Lyondell Chemical Company
In December 2011, Rydex Series Funds was named as a defendant in Weisfelner, as Trustee of the LB Creditor Trust, v. Fund 1 (In re Lyondell Chemical Co.), Adv. Pro. No. 10-4609 (Bankr. S.D.N.Y.) (the “Creditor Trust Action”). Its funds may also be putative members of the proposed defendant classes in Weisfelner, as Trustee of the LB Litigation Trust v. A. Holmes & H. Holmes TTEE (In re Lyondell Co.), Adv. Pro. No. 10-5525 (Bankr. S.D.N.Y.) (the “Litigation Trust Action”) and Weisfelner, as Trustee of the LB Creditor Trust, v. Reichman (In re Lyondell Chemical Co.), Adv. Pro. No. 12-1570 (Bankr. S.D.N.Y.) (“Reichman”).
Similar to the claims made in the Tribune matter, the Weisfelner complaints seek to have set aside and recovered as fraudulent transfers from former Lyondell Chemical Company (“Lyondell”) shareholders the consideration paid to them pursuant to the cash out merger of Lyondell shareholders in connection with the combination of Lyondell and Basell AF in 2007. Lyondell filed for bankruptcy in 2008. The Creditor Trust Action and Reichman allege claims against the former Lyondell shareholders under state law for both constructive fraudulent transfer and intentional fraudulent transfer. The Litigation Trust Action alleges a claim against the former Lyondell shareholders under federal law for intentional fraudulent transfer.
On April 7, 2014, the plaintiff filed a Third Amended Complaint in the Creditor Trust Action, a Second Amended Complaint in the Litigation Trust Action, and an Amended Complaint in Reichman.
| | THE GUGGENHEIM FUNDS ANNUAL REPORT | 81 |
| NOTES TO CONSOLIDATED FINANCIAL STATEMENTS (continued) |
On May 8, 2014, the plaintiff in the Litigation Trust Action filed a motion to certify a defendant class generally comprised of all former Lyondell shareholders that received proceeds in exchange for their shares in the 2007 merger transaction.
On July 30, 2014, the defendants filed a motion to dismiss these lawsuits. The Bankruptcy Court held oral argument on the motion to dismiss and on the motion for class certification on January 14 and January 15, 2015. On September 15, 2015, the Bankruptcy Court denied the motion for class certification without prejudice to the plaintiff’s right to file a renewed motion. On November 18, 2015, the Bankruptcy Court granted the defendants’ motion to dismiss the intentional fraudulent transfer claims in the Creditor Trust Action, the Litigation Trust Action, and in Reichman, but denied the motion to dismiss the constructive fraudulent transfer claims in the Creditor Trust Action and in Reichman. The Bankruptcy Court entered final judgment dismissing the Litigation Trust Action, but the plaintiff appealed the dismissal to the U.S. District Court for the Southern District of New York.
On July 27, 2016, the District Court reversed the Bankruptcy Court and reinstated the federal law intentional fraudulent transfer claim in the Litigation Trust Action and remanded to the Bankruptcy Court for further proceedings. The District Court found that the fraudulent intent that mattered was that of Lyondell’s CEO, not its board, because the CEO’s intent could be imputed to Lyondell under Delaware law agency principles. The District Court did note, however, that plaintiff faces a high standard for proving “actual intent” to harm creditors, and that it remains to be seen whether plaintiff will be able to make this showing. On August 11, 2016, the shareholder defendants filed a motion for reconsideration and/or to certify an interlocutory appeal of the District Court’s opinion. On October 5, 2016, the District Court denied the motion for reconsideration and/or to certify an interlocutory appeal. On April 21, 2017, the Bankruptcy Court issued an Opinion and Order After Trial in a related Lyondell litigation (the “Blavatnik Action”) rejecting claims for intentional fraudulent transfer and constructive fraudulent transfer in connection with the 2007 LBO. Based on this related ruling in the Blavatnik Action, the shareholder defendants filed a motion to dismiss the Litigation Trust Action on the grounds of collateral estoppel on May 30, 2017. Although the Bankruptcy Court had not yet ruled on the motion to dismiss, on August 15, 2017, the plaintiff in the Litigation Trust action filed a notice of dismissal of all claims against the defendants who joined the motion to dismiss. On August 18, 2017, the Litigation Trust plaintiff also withdrew his request for class certification of a defendant class in the Litigation Trust action. On September 5, 2017, the Court entered an order dismissing the Litigation Trust action with prejudice. The Court’s order dismissed the action as to all defendants as well as to unnamed members of the putative defendant class.
On May 4, 2016, the defendants filed a motion to dismiss, or in the alternative, for a stay of, the Creditor Trust Action and Reichman in light of the U.S. Court of Appeals for the Second Circuit’s opinion in the appeal of the Tribune SLCFC actions. On July 20, 2016, the Bankruptcy Court issued a report and recommendation granting the defendants’ motion to dismiss. On May 30, 2017, the shareholder defendants filed a motion to remand the proceedings in the Creditor Trust and Reichman Actions to the Bankruptcy Court, for consideration of the collateral estoppel ground
| 82 | THE GUGGENHEIM FUNDS ANNUAL REPORT | |
| NOTES TO CONSOLIDATED FINANCIAL STATEMENTS (concluded) |
for dismissal raised by the Bankruptcy Court’s ruling in the Blavatnik Action. On August 18, 2017, the plaintiff in the Creditor Trust action filed a notice of dismissal of claims brought against defendants who had not answered the Third Amended Complaint. The same day, the plaintiff in the Reichman action filed a notice of dismissal of all claims against named defendants who had not filed an answer and withdrew his request for class certification of a defendant class. On September 5, 2017, the Court entered an order dismissing the Creditor Trust and Reichman actions with prejudice. The Court’s order dismissed the actions as to all defendants as well as to unnamed members of the putative defendant class in the Reichman action.
As a result of the dismissals above, there are no longer claims pending against the Rydex Series Funds related to the Lyondell merger.
These lawsuits do not allege any wrongdoing on the part of Rydex Series Funds. The following series of Rydex Series Funds received cash proceeds from the cash out merger in the following amounts: Basic Materials Fund - $1,725,168; Long Short Equity Fund f/k/a U.S. Long Short Momentum Fund - $2,193,600; Global 130/30 Strategy Fund - $37,920; Hedged Equity Fund - $1,440; and Multi-Hedge Strategies Fund - $1,116,480.
| | THE GUGGENHEIM FUNDS ANNUAL REPORT | 83 |
| REPORT OF INDEPENDENT REGISTERED PUBLIC ACCOUNTING FIRM |
To the Shareholders of Guggenheim Multi-Hedge Strategies Fund and Rydex Commodities Strategy Fund and the Board of Trustees of Rydex Series Funds
Opinion on the Financial Statements
We have audited the accompanying consolidated statements of assets and liabilities of Guggenheim Multi-Hedge Strategies Fund and Rydex Commodities Strategy Fund (collectively referred to as the “Funds”), (two of the funds constituting Rydex Series Funds (the “Trust”)), including the consolidated schedules of investments, as of December 31, 2017, and the related consolidated statements of operations for the year then ended, the consolidated statements of changes in net assets for each of the two years in the period then ended, the consolidated financial highlights for each of the five years in the period then ended and the related notes (collectively referred to as the “financial statements”). In our opinion, the financial statements present fairly, in all material respects, the consolidated financial position of each of the Funds (two of the funds constituting Rydex Series Funds) at December 31, 2017, the consolidated results of their operations for the year then ended, the consolidated changes in their net assets for each of the two years in the period then ended and their consolidated financial highlights for each of the five years in the period then ended, in conformity with U.S. generally accepted accounting principles.
Basis for Opinion
These financial statements are the responsibility of the Trust’s management. Our responsibility is to express an opinion on each of the Funds’ financial statements based on our audits. We are a public accounting firm registered with the Public Company Accounting Oversight Board (United States) (“PCAOB”) and are required to be independent with respect to the Trust in accordance with the U.S. federal securities laws and the applicable rules and regulations of the Securities and Exchange Commission and the PCAOB.
We conducted our audits in accordance with the standards of the PCAOB. Those standards require that we plan and perform the audit to obtain reasonable assurance about whether the financial statements are free of material misstatement, whether due to error or fraud. The Trust is not required to have, nor were we engaged to perform, an audit of the Trust’s internal control over financial reporting. As part of our audits we are required to obtain an understanding of internal control over financial reporting but not for the purpose of expressing an opinion on the effectiveness of the Trust’s internal control over financial reporting. Accordingly, we express no such opinion.
Our audits included performing procedures to assess the risks of material misstatement of the financial statements, whether due to error or fraud, and performing procedures that respond to those risks. Such procedures included examining, on a test basis, evidence regarding the amounts and disclosures in the financial statements. Our procedures included confirmation of securities owned as of December 31, 2017, by correspondence with the custodian, transfer agent,
| 84 | THE GUGGENHEIM FUNDS ANNUAL REPORT | |
| REPORT OF INDEPENDENT REGISTERED PUBLIC ACCOUNTING FIRM (concluded) |
and brokers. Our audits also included evaluating the accounting principles used and significant estimates made by management, as well as evaluating the overall presentation of the financial statements. We believe that our audits provide a reasonable basis for our opinion.

We have served as the auditor of one or more Guggenheim investment companies since 1979.
Tysons, Virginia
February 27, 2018
| | THE GUGGENHEIM FUNDS ANNUAL REPORT | 85 |
| OTHER INFORMATION (Unaudited) |
Federal Income Tax Information
This information is being provided as required by the Internal Revenue Code. Amounts shown may differ from those elsewhere in the report because of differences in tax and financial reporting practice.
In January 2018, shareholders will be advised on IRS Form 1099 DIV or substitute 1099 DIV as to the federal tax status of the distributions received by shareholders in the calendar year 2017.
Of the taxable ordinary income distributions paid during the fiscal year ending December 31, 2017, the following funds had the corresponding percentages qualify for the reduced tax rate pursuant to the Jobs and Growth Tax Relief and Reconciliation Act of 2003 or for the dividends received deduction for corporations. See the qualified dividend income and dividend received deduction columns, respectively, in the table below.
Additionally, of the taxable ordinary income distributions paid during the fiscal year ended December 31, 2017, the following funds had the corresponding percentages qualify as qualified short-term capital gains as permitted by IRC Section 871(k)(2). See qualified short-term capital gain columns in the table below.
| Fund | Qualified
Dividend
Income | Dividend
Received
Deduction |
| Commodities Strategy Fund | 0.00% | 0.00% |
Proxy Voting Information
A description of the policies and procedures that the Trust uses to determine how to vote proxies relating to securities held in the Funds’ portfolios is available, without charge and upon request, by calling 800.820.0888. This information is also available from the EDGAR database on the SEC’s website at https://www.sec.gov.
Information regarding how the Funds voted proxies relating to portfolio securities during the most recent 12-month period ended June 30 is available without charge, upon request, by calling 800.820.0888. This information is also available from the EDGAR database on the SEC’s website at https://www.sec.gov.
Sector Classification
Information in the Schedule of Investments is categorized by sectors using sector-level Classifications defined by the Bloomberg Industry Classification System, a widely recognized industry classification system provider. Each Fund’s registration statement has investment policies relating to concentration in specific sectors/industries. For purposes of these investment policies, the Funds usually classify sectors/industries based on industry-level Classifications used by widely recognized industry classification system providers such as Bloomberg Industry Classification System, Global Industry Classification Standards and Barclays Global Classification Scheme.
| 86 | THE GUGGENHEIM FUNDS ANNUAL REPORT | |
| OTHER INFORMATION (Unaudited)(concluded) |
Quarterly Portfolio Schedules Information
The Trust files its complete schedule of portfolio holdings with the SEC for the first and third quarters of each fiscal year on Form N-Q, which are available on the SEC’s website at https://www.sec.gov. The Funds’ Forms N-Q may be reviewed and copied at the SEC’s Public Reference Room in Washington, DC, and that information on the operation of the Public Reference Room may be obtained by calling 800-SEC-0330. Copies of the portfolio holdings are also available to shareholders, without charge and upon request, by calling 800.820.0888.
| | THE GUGGENHEIM FUNDS ANNUAL REPORT | 87 |
| INFORMATION ON BOARD OF TRUSTEES AND OFFICERS (Unaudited) |
A Board of Trustees oversees the Trust, as well as other trusts of GI, in which its members have no stated term of service, and continue to serve after election until resignation. The Statement of Additional Information includes further information about Fund Trustees and Officers, and can be obtained without charge by visiting guggenheiminvestments.com or by calling 800.820.0888.
| Name, Address* and Year of Birth of Trustees | Position(s) Held
with the Trust | Principal Occupation(s)
During Past 5 Years | Number of
Portfolios in
Fund Complex
Overseen by
Trustee | Other
Directorships
Held by
Trustee |
| Independent Trustees | | | |
Angela Brock-Kyle
(1959) | Trustee, Member of the Audit Committee, Chairwoman and Member of the Compliance and Risk Oversight Committee, and Member of the Nominating and Governance Committee. | Current: Founder and Chief Executive Officer, B.O.A.R.D.S (consulting firm). Former: Senior Leader, TIAA (financial services firm) (1987-2012). | 133 | Current: Infinity Property & Casualty Corporation (2014-present). |
Corey A. Colehour
(1945) | Trustee, Member of the Audit Committee, Member of the Nominating and Governance Committee, and Member of the Investment and Performance Committee. | Current: Retired. | 133 | None |
J. Kenneth Dalton
(1941) | Trustee, Member and Chairman of the Audit Committee, and Member of the Compliance and Risk Oversight Committee. | Current: Retired. | 133 | Epiphany Funds (3) (2009-present). |
John O. Demaret
(1940) | Trustee, Member of the Audit Committee, and Member of the Compliance and Risk Oversight Committee. | Current: Retired. | 133 | None |
Werner E. Keller
(1940) | Chairman and Trustee of the Board, and Member of the Audit Committee. | Current: Founder and President, Keller Partners, LLC (investment research firm) (2005-present). | 133 | None |
| 88 | THE GUGGENHEIM FUNDS ANNUAL REPORT | |
| INFORMATION ON BOARD OF TRUSTEES AND OFFICERS (Unaudited)(continued) |
| Name, Address* and Year of Birth of Trustees | Position(s) Held
with the Trust | Principal Occupation(s)
During Past 5 Years | Number of
Portfolios in
Fund Complex
Overseen by
Trustee | Other
Directorships
Held by
Trustee |
| INDEPENDENT TRUSTEES - concluded |
Thomas F. Lydon, Jr.
(1960) | Trustee, Member of the Audit Committee, Chairman and Member of the Nominating and Governance Committee, and Member of the Investment and Performance Committee. | Current: President, Global Trends Investments (registered investment adviser) (1996-present). | 133 | US Global Investors (GROW) (1995-present). |
Patrick T. McCarville
(1942) | Trustee, Member of the Audit Committee, and Member of the Nominating and Governance Committee. | Current: Retired. Former: Chief Executive Officer, Par Industries, Inc., d/b/a Par Leasing (1977-2010). | 133 | None. |
Sandra G. Sponem
(1958) | Trustee, Member of the Audit Committee, Member of the Nominating and Governance Committee, and Chairwoman and Member of the Investment and Performance Committee, | Current: Retired Former: Senior Vice President and Chief Financial Officer, M.A. Mortenson Companies, Inc. (general contracting firm) (2007-2017). | 133 | None. |
| | THE GUGGENHEIM FUNDS ANNUAL REPORT | 89 |
| INFORMATION ON BOARD OF TRUSTEES AND OFFICERS (Unaudited)(continued) |
| Name, Address* and Year of Birth of Trustees | Position(s) Held with the Trust | Principal Occupation(s)
During Past 5 Years |
| OFFICERS | | |
Michael P. Byrum
(1970) | Vice President | Current: Senior Vice President, Security Investors, LLC (2010-present); President and Chief Investment Officer, Rydex Holdings, LLC (2008-present); Director and Chairman, Advisory Research Center, Inc. (2006-present); Manager, Guggenheim Specialized Products, LLC (2005-present). Former: Vice President, Guggenheim Distributors, LLC (2009); Director (2009-2010) and Secretary (2002-2010), Rydex Fund Services, LLC; Director (2008-2010), Chief Investment Officer (2006-2010), President (2004-2010) and Secretary (2002-2010), Rydex Advisors, LLC; Director (2008-2010), Chief Investment Officer (2006-2010), President (2004-2010) and Secretary (2002-2010), Rydex Advisors II, LLC. |
James M. Howley
(1972) | Assistant Treasurer | Current: Managing Director, Guggenheim Investments (2004-present); Assistant Treasurer, certain other funds in the Fund Complex (2006-present). Former: Manager, Mutual Fund Administration of Van Kampen Investments, Inc. (1996-2004). |
Keith D. Kemp
(1960) | Assistant Treasurer | Current: Treasurer and Assistant Treasurer, certain other funds in the Fund Complex (2010-present); Managing Director, Guggenheim Investments (2015-present); Chief Financial Officer, Guggenheim Specialized Products, LLC (2016-present). Former: Managing Director and Director, Transparent Value, LLC (2010-2016); Director, Guggenheim Partners Investment Management, LLC (2010-2015); Chief Operating Officer, Macquarie Capital Investment Management (2007-2009). |
Amy J. Lee
(1961) | President | Current: President and Chief Executive Officer, certain other funds in the Fund Complex (2017- present); Chief Legal Officer, certain other funds in the Fund Complex (2014-present); Senior Managing Director, Guggenheim Investments (2012-present). Former: Vice President, Associate General Counsel and Assistant Secretary, Security Benefit Life Insurance Company and Security Benefit Corporation (2004-2012). |
| 90 | THE GUGGENHEIM FUNDS ANNUAL REPORT | |
| INFORMATION ON BOARD OF TRUSTEES AND OFFICERS (Unaudited)(continued) |
| Name, Address* and Year of Birth of Trustees | Position(s) Held with the Trust | Principal Occupation(s)
During Past 5 Years |
| OFFICERS - continued | |
Mark E. Mathiasen
(1978) | Secretary | Current: Secretary, certain other funds in the Fund Complex (2007-present); Managing Director, Guggenheim Investments (2007-present). |
Glenn McWhinnie
(1969) | Assistant Treasurer | Current: Vice President, Guggenheim Investments (2009-present). |
Elisabeth Miller
(1968) | Chief Compliance Officer | Current: CCO, certain other funds in the Fund Complex (2012-present); CCO, Security Investors, LLC (2012- present); CCO, Guggenheim Funds Investment Advisors, LLC (2012-present); Managing Director, Guggenheim Investments (2012-present). Vice President, Guggenheim Funds Distributors, LLC (2014-present). Former: CCO, Guggenheim Distributors, LLC (2009-2014); Senior Manager, Security Investors, LLC (2004-2009); Senior Manager, Guggenheim Distributors, LLC (2004-2009). |
Adam J. Nelson
(1979) | Assistant Treasurer | Current: Vice President, Guggenheim Investments (2015-present); Assistant Treasurer, certain other funds in the Fund Complex (2015-present). Former: Assistant Vice President and Fund Administration Director, State Street Corporation (2013-2015); Fund Administration Assistant Director, State Street (2011-2013); Fund Administration Manager, State Street (2009-2011). |
Kimberly J. Scott
(1974) | Assistant Treasurer | Current: Director, Guggenheim Investments (2012-present); Assistant Treasurer, certain other funds in the Fund Complex (2012-present). Former: Financial Reporting Manager, Invesco, Ltd. (2010-2011); Vice President/Assistant Treasurer, Mutual Fund Administration for Van Kampen Investments, Inc./Morgan Stanley Investment Management (2009-2010); Manager of Mutual Fund Administration, Van Kampen Investments, Inc./Morgan Stanley Investment Management (2005-2009). |
| | THE GUGGENHEIM FUNDS ANNUAL REPORT | 91 |
| INFORMATION ON BOARD OF TRUSTEES AND OFFICERS (Unaudited)(concluded) |
| Name, Address* and Year of Birth of Trustees | Position(s) Held with the Trust | Principal Occupation(s)
During Past 5 Years |
| OFFICERS - concluded | |
John L. Sullivan
(1955) | Chief Financial Officer and Treasurer | Current: CFO, Chief Accounting Officer and Treasurer, certain other funds in the Fund Complex (2010-present); Senior Managing Director, Guggenheim Investments (2010-present). Former: Managing Director and CCO, each of the funds in the Van Kampen Investments fund complex (2004-2010); Managing Director and Head of Fund Accounting and Administration, Morgan Stanley Investment Management (2002-2004); CFO and Treasurer, Van Kampen Funds (1996-2004). |
Jon Szafran
(1989) | Assistant Treasurer | Current: Vice President, Guggenheim Investments (2017-present); Assistant Treasurer, certain other funds in the Fund Complex (2017-present). Former: Assistant Treasurer of Henderson Global Funds and Manager of US Fund Administration, Henderson Global Investors (North America) Inc. ("HGINA"), (2017); Senior Analyst of US Fund Administration, HGINA (2014-2017); Senior Associate of Fund Administration, Cortland Capital Market Services, LLC (2013-2014); Experienced Associate, PricewaterhouseCoopers LLP (2012-2013). |
| * | | All Trustees and Officers may be reached c/o Guggenheim Investments, 227 West Monroe Street, Chicago, Illinois 60606. |
| 92 | THE GUGGENHEIM FUNDS ANNUAL REPORT | |
| GUGGENHEIM INVESTMENTS PRIVACY POLICIES (Unaudited) |
Guggenheim Investments as used herein refers to Guggenheim Partners, LLC, Guggenheim Funds Investment Advisors, LLC, Guggenheim Partners Investment Management, LLC, Guggenheim Funds Distributors, LLC and Security Investors, LLC as well as the funds in the Guggenheim Funds complex (the “funds”).
Our Commitment to You
When you become a Guggenheim Investments investor, you entrust us with not only your hard-earned money but also with personal and financial information about you. We recognize that your relationship with us is based on trust and that you expect us to act responsibly and in your best interests. Because we have access to personal information about you, we hold ourselves to high standards in its safekeeping and use. This means, most importantly, that we do not sell client or account information to anyone—whether you are a current or former Guggenheim Investments client.
The Information We Collect About You and How We Collect It
In the course of doing business with shareholders and investors, we collect nonpublic personal information about you. You typically provide personal information when you complete a Guggenheim Investments account application or when you request a transaction that involves Rydex and Guggenheim Funds or one of the Guggenheim affiliated companies. “Nonpublic personal information” is personally identifiable information about you. For example it includes your name and address, Social Security or taxpayer identification number, assets, income, account balance, bank account information and investment activity (e.g. purchase and redemption history).
How We Share Your Personal Information
As a matter of policy, we do not disclose your nonpublic personal information to nonaffiliated third parties except as required or permitted by law. As emphasized above, we do not sell information about current or former clients or their accounts to third parties. Nor do we share such information, except when necessary to complete transactions at your request or to make you aware of related investment products and services that we offer. Additional details about how we handle your personal information are provided below.
To complete certain transactions or account changes that you direct, it may be necessary to provide your personal information to companies, individuals or groups that are not affiliated with Guggenheim Investments. For example if you ask to transfer assets from another financial institution to Guggenheim Investments, we will need to provide certain information about you to that company to complete the transaction. In connection with servicing your accounts or to alert you to other Guggenheim Investments investment products and services, we may share your information within the Guggenheim Investments family of affiliated companies. This would include, for example, sharing your information within Guggenheim Investments so we can make you aware of new funds or the services offered through another Guggenheim Investments
| | THE GUGGENHEIM FUNDS ANNUAL REPORT | 93 |
| GUGGENHEIM INVESTMENTS PRIVACY POLICIES (Unaudited)(concluded) |
affiliated company. In certain instances, we may contract with nonaffiliated companies to perform services for us. Where necessary, we will disclose information we have about you to these third parties. In all such cases, we provide the third party with only the information necessary to carry out its assigned responsibilities and only for that purpose. And we require these third parties to treat your personal information with the same high degree of confidentiality that we do. In certain instances, we may share information with other financial institutions regarding individuals and entities in response to the U.S.A. Patriot Act. Finally we will share personal information about you if we are compelled by law to do so, if you direct us to do so with your consent, or in other circumstances as permitted by law.
How We Safeguard Your Personal Information
We maintain physical, electronic and procedural safeguards to protect your personal information. Within Guggenheim Investments, access to such information is limited to those who need it to perform their jobs such as servicing your account, resolving problems or informing you of new products and services.
| 94 | THE GUGGENHEIM FUNDS ANNUAL REPORT | |
This page intentionally left blank.
This page intentionally left blank.
This page intentionally left blank.
12.31.2017
Guggenheim Funds Annual Report
| Guggenheim Alternative Fund |
| Guggenheim Managed Futures Strategy Fund | | |
| GuggenheimInvestments.com | RMFSF-ANN-1217x1218 |

| DEAR SHAREHOLDER | 2 |
| ECONOMIC AND MARKET OVERVIEW | 4 |
| ABOUT SHAREHOLDERS’ FUND EXPENSES | 6 |
| MANAGED FUTURES STRATEGY FUND | 9 |
| NOTES TO CONSOLIDATED FINANCIAL STATEMENTS | 27 |
| REPORT OF INDEPENDENT REGISTERED PUBLIC ACCOUNTING FIRM | 46 |
| OTHER INFORMATION | 48 |
| INFORMATION ON BOARD OF TRUSTEES AND OFFICERS | 50 |
| GUGGENHEIM INVESTMENTS PRIVACY POLICIES | 55 |
| | THE GUGGENHEIM FUNDS ANNUAL REPORT | 1 |
Dear Shareholder:
Security Investors, LLC (the “Investment Adviser”), is pleased to present the annual shareholder report for the Managed Futures Strategy Fund (the “Fund”) that is part of the Rydex Series Funds. This report covers performance of the Fund for the annual period ended December 31, 2017.
The Investment Adviser is a part of Guggenheim Investments, which represents the investment management businesses of Guggenheim Partners, LLC (“Guggenheim”), a global, diversified financial services firm.
Guggenheim Funds Distributors, LLC is the distributor of the Fund. Guggenheim Funds Distributors, LLC is affiliated with Guggenheim and the Investment Adviser.
We encourage you to read the Economic and Market Overview section of the report, which follows this letter, and then the Performance Report and Fund Profile for the Fund.
We are committed to providing innovative investment solutions and appreciate the trust you place in us.
Sincerely,
Security Investors, LLC
January 31, 2018
Read a prospectus and summary prospectus (if available) carefully before investing. It contains the investment objectives, risks, charges, expenses and other information, which should be considered carefully before investing. Obtain a prospectus and summary prospectus (if available) at guggenheiminvestments.com or call 800.820.0888.
This material is not intended as a recommendation or as investment advice of any kind, including in connection with rollovers, transfers, and distributions. Such material is not provided in a fiduciary capacity, may not be relied upon for or in connection with the making of investment decisions, and does not constitute a solicitation of an offer to buy or sell securities. All content has been provided for informational or educational purposes only and is not intended to be and should not be construed as legal or tax advice and/or a legal opinion. Always consult a financial, tax and/or legal professional regarding your specific situation.
| 2 | THE GUGGENHEIM FUNDS ANNUAL REPORT | |
The Managed Futures Strategy Fund may not be suitable for all investors. ●The Fund’s investments in securities and derivatives, in general, are subject to market risks that may cause their prices, and therefore the Fund’s value, to fluctuate over time. An investment in the Fund may lose money. ● The Fund’s investments in derivatives may pose risks in addition to those associated with investing directly in securities or other investments, including illiquidity of the derivatives, imperfect correlations with underlying investments or the Fund’s other portfolio holdings, lack of availability and counterparty risk. To the extent the Fund invests in derivatives to seek to hedge risk or limit leveraged exposure created by other investments, there is no guarantee that such hedging strategies will be effective at managing risk or limiting exposure to leveraged investments. ● The Fund’s use of leverage will exaggerate the effect on net asset value of any increase or decrease in the market value of the Fund’s portfolio. ●The Fund’s use of short selling involves increased risk and costs. The Fund risks paying more for a security than it received from its sale. Theoretically, securities sold short have the risk of unlimited losses. ●The Fund’s investments in fixed income securities will change in value in response to interest rate changes and other factors. In general, bond prices rise when interest rates fall and vice versa. ● The Fund‘s exposure to high yield, asset backed and mortgaged backed securities may subject the Fund to greater volatility. ●The Fund’s indirect and direct exposure to foreign currencies subjects the Fund to the risk that those currencies will decline in value relative to the U.S. dollar, or, in the case of short positions, that the U.S. dollar will decline in value relative to the currency being hedged. ●The Fund’s exposure to the commodity markets may subject the fund to greater volatility as commodity-linked investments may be affected by changes in overall market movements, commodity index volatility, changes in interest rates or factors affecting a particular industry or commodity such as droughts, floods, weather, embargos, tariffs and international economic, political and regulatory developments. ●The Fund may invest in securities of foreign companies directly, or indirectly through the use of other investment companies and financial instruments that are linked to the performance of foreign issuers. Foreign securities markets generally have less trading volume and less liquidity than U.S. markets, and prices in some foreign markets may fluctuate more than those of securities traded on U.S. markets. ●This Fund is considered nondiversified and can invest a greater portion of its assets in securities of individual issuers than a diversified fund. As a result, changes in the market value of a single security could cause greater fluctuations in the value of fund shares than would occur in a more diversified fund. ●See the prospectus for more information on these and other risks.
| | THE GUGGENHEIM FUNDS ANNUAL REPORT | 3 |
| ECONOMIC AND MARKET OVERVIEW (Unaudited) | December 31, 2017 |
The market story at the end of 2017 was one of positive economic momentum. Economic activity finished 2017 strongly, led by an acceleration in household spending, which was bolstered by consumer confidence near cyclical highs and healthier household balance sheets. Job growth and rebuilding activity resumed following the several hurricanes that hit the U.S., and elevated business optimism and tax changes could boost business capital expenditure plans in the coming quarters. The economy could also benefit from favorable financial conditions both in the U.S. and abroad, which could keep economic growth well above 2% in 2018.
While job growth continues at an unsustainable pace, wage growth has still been relatively unresponsive to declines in the unemployment rate. This could mean that the natural rate of unemployment is lower than the U.S. Federal Reserve’s (the “Fed”) current estimate of 4.6%, and it could also mean that there is still labor market slack left in the form of people not currently participating in the labor force. Even so, the tighter labor market and increasing worker shortages will put upward pressure on wage growth, which has been held back by meager productivity gains.
Core inflation has been below the Fed’s 2% target for some time now, which should continue for the next few months. However, by the middle of 2018 core inflation should approach the Fed’s target due to an accelerating economy, reduced labor market slack, and favorable base effects. Inflation closer to target and continued declines in the unemployment rate will give the Fed confidence to press on with tightening. Moreover, financial conditions remain highly accommodative, and fiscal stimulus will give the economy an additional boost, giving the Fed further room to raise rates. Thus, even as the fourth quarter of 2017 saw the commencement of the Fed’s balance sheet roll-off in October and another rate hike in December, we expect the Fed to move to increasingly tighter policy.
For the 12 months ended December 31, 2017, the Standard & Poor’s 500® (“S&P 500”) Index* returned 21.83%. The MSCI Europe-Australasia-Far East (“EAFE”) Index* returned 25.03%. The return of the MSCI Emerging Markets Index* was 37.28%.
In the bond market, the Bloomberg Barclays U.S. Aggregate Bond Index* posted a 3.54% return for the period, while the Bloomberg Barclays U.S. Corporate High Yield Index* returned 7.50%. The return of the ICE Bank of America (“BofA”) Merrill Lynch 3-Month U.S. Treasury Bill Index* was 0.86% for the 12-month period.
The opinions and forecasts expressed may not actually come to pass. This information is subject to change at any time, based on market and other conditions, and should not be construed as a recommendation of any specific security or strategy.
| 4 | THE GUGGENHEIM FUNDS ANNUAL REPORT | |
| ECONOMIC AND MARKET OVERVIEW (Unaudited)(concluded) | December 31, 2017 |
*Index Definitions:
The following indices are referenced throughout this report. Indices are unmanaged and not available for direct investment. Index performance does not reflect transaction costs, fees, or expenses.
Bloomberg Barclays U.S. Aggregate Bond Index is a broad-based flagship benchmark that measures the investment grade, U.S. dollar-denominated, fixed-rate taxable bond market, including U.S. Treasuries, government-related and corporate securities, mortgage-backed securities or “MBS” (agency fixed-rate and hybrid adjustable-rate mortgage, or “ARM”, pass-throughs), asset-backed securities (“ABS”), and commercial mortgage-backed securities (“CMBS”) (agency and non-agency).
Bloomberg Barclays U.S. Corporate High Yield Index measures the U.S. dollar-denominated, high yield, fixed-rate corporate bond market. Securities are classified as high yield if the middle rating of Moody’s, Fitch, and S&P is Ba1/BB +/BB + or below.
ICE BofA Merrill Lynch 3-Month U.S. Treasury Bill Index is an unmanaged market Index of U.S. Treasury securities maturing in 90 days that assumes reinvestment of all income.
MSCI EAFE Index is a free float-adjusted market capitalization index that is designed to measure the equity market performance of developed markets, excluding the U.S. & Canada.
MSCI Emerging Markets Index is a free float-adjusted market capitalization weighted index that is designed to measure equity market performance in the global emerging markets.
Standard and Poor’s 500 Index (S&P 500®) is a broad-based index, the performance of which is based on the performance of 500 widely held common stocks chosen for market size, liquidity, and industry group representation.
SG (Societe Generale) CTA Index is designed to track the largest 20 (by AUM) Commodity Trading Advisors, or CTAs, and be representative of the managed futures space. The CTA Index is equally weighted, and rebalanced and reconstituted annually.
| | THE GUGGENHEIM FUNDS ANNUAL REPORT | 5 |
| ABOUT SHAREHOLDERS’ FUND EXPENSES (Unaudited) |
All mutual funds have operating expenses, and it is important for our shareholders to understand the impact of costs on their investments. Shareholders of a fund incur two types of costs: (i) transaction costs, including sales charges (loads) on purchase payments, reinvested dividends, other distributions, and exchange fees, and (ii) ongoing costs, including management fees, administrative services, and shareholder reports, among others. These ongoing costs, or operating expenses, are deducted from a fund’s gross income and reduce the investment return of the fund.
A fund’s expenses are expressed as a percentage of its average net assets, which is known as the expense ratio. The following examples are intended to help investors understand the ongoing costs (in dollars) of investing in a fund and to compare these costs with the ongoing costs of investing in other mutual funds.
The examples are based on an investment of $1,000 made at the beginning of the period and held for the entire six-month period beginning June 30, 2017 and ending December 31, 2017.
The following tables illustrate the Fund’s costs in two ways:
Table 1. Based on actual Fund return: This section helps investors estimate the actual expenses paid over the period. The “Ending Account Value” shown is derived from the Fund’s actual return, and the fifth column shows the dollar amount that would have been paid by an investor who started with $1,000 in the Fund. Investors may use the information here, together with the amount invested, to estimate the expenses paid over the period. Simply divide the Fund’s account value by $1,000 (for example, an $8,600 account value divided by $1,000 = 8.6), then multiply the result by the number provided under the heading “Expenses Paid During Period.”
Table 2. Based on hypothetical 5% return: This section is intended to help investors compare a Fund’s cost with those of other mutual funds. The table provides information about hypothetical account values and hypothetical expenses based on the Fund’s actual expense ratio and an assumed rate of return of 5% per year before expenses, which is not the Fund’s actual return. The hypothetical account values and expenses may not be used to estimate the actual ending account balance or expenses paid during the period. The example is useful in making comparisons because the U.S. Securities and Exchange Commission (the “SEC”) requires all mutual funds to calculate expenses based on the 5% return. Investors can assess a Fund’s costs by comparing this hypothetical example with the hypothetical examples that appear in shareholder reports of other funds.
The calculations illustrated above assume no shares were bought or sold during the period. Actual costs may have been higher or lower, depending on the amount of investment and the timing of any purchases or redemptions.
| 6 | THE GUGGENHEIM FUNDS ANNUAL REPORT | |
| ABOUT SHAREHOLDERS’ FUND EXPENSES (Unaudited)(continued) |
Please note that the expenses shown in the table are meant to highlight your ongoing costs only and do not reflect any transactional costs, such as sales charges (loads) on purchase payments, and contingent deferred sales charges (“CDSC”) on redemptions, if any. Therefore, the second table is useful in comparing ongoing costs only, and will not help you determine the relative total costs of owning different funds. In addition, if these transactional costs were included, your costs would have been higher.
More information about the Fund’s expenses, including annual expense ratios for periods up to five years (subject to the Fund’s inception date), can be found in the Financial Highlights section of this report. For additional information on operating expenses and other shareholder costs, please refer to the Fund’s prospectus.
More information about a Fund’s expenses, including annual expense ratios for the past five years, can be found in the Financial Highlights section of this report. For additional information on operating expenses and other shareholder costs, please refer to the appropriate Fund prospectus.
| | THE GUGGENHEIM FUNDS ANNUAL REPORT | 7 |
| ABOUT SHAREHOLDERS’ FUND EXPENSES (Unaudited)(concluded) |
| | Expense
Ratio1 | Fund
Return | Beginning
Account Value
June 30,
2017 | Ending
Account Value
December 31,
2017 | Expenses
Paid During
Period2 |
| Table 1. Based on actual Fund return3 |
| Managed Futures Strategy Fund |
| A-Class | 1.71% | 8.69% | $ 1,000.00 | $ 1,086.90 | $ 8.99 |
| C-Class | 2.47% | 8.27% | 1,000.00 | 1,082.70 | 12.97 |
| P-Class | 1.76% | 8.72% | 1,000.00 | 1,087.20 | 9.26 |
| Institutional Class | 1.42% | 8.89% | 1,000.00 | 1,088.90 | 7.48 |
| |
| Table 2. Based on hypothetical 5% return (before expenses) |
| Managed Futures Strategy Fund |
| A-Class | 1.71% | 5.00% | $ 1,000.00 | $ 1,016.59 | $ 8.69 |
| C-Class | 2.47% | 5.00% | 1,000.00 | 1,012.75 | 12.53 |
| P-Class | 1.76% | 5.00% | 1,000.00 | 1,016.33 | 8.94 |
| Institutional Class | 1.42% | 5.00% | 1,000.00 | 1,018.05 | 7.22 |
| 1 | | Annualized and excludes expenses of the underlying funds in which the Fund invests. |
| 2 | | Expenses are equal to the Fund's annualized expense ratio, net of any applicable fee waivers, multiplied by the average account value over the period, multiplied by 184/365 (to reflect the one-half year period). |
| 3 | | Actual cumulative return at net asset value for the period June 30, 2017 to December 31, 2017. |
| 8 | THE GUGGENHEIM FUNDS ANNUAL REPORT | |
| PERFORMANCE REPORT AND FUND PROFILE (Unaudited) | December 31, 2017 |
MANAGED FUTURES STRATEGY FUND
OBJECTIVE: Seeks to achieve absolute returns.
For the one-year period ended December 31, 2017, the Managed Futures Strategy Fund Institutional shares returned 7.69%. The ICE BofA Merrill Lynch 3-Month U.S. Treasury Bill Index, the Fund’s benchmark, returned 0.86%.
The Fund is comprised of multiple proprietary strategies designed to systematically exploit market inefficiencies in futures markets around the globe.
The Fund takes advantage of Guggenheim’s fixed income expertise in managing the Fund’s cash positions primarily through the use of the Guggenheim Strategy Funds.
In addition to its benchmark, the Fund outperformed the SG CTA Index for the year, which posted a return of 2.48%. Compared to traditional markets, the Fund outperformed investment grade bonds but underperformed U.S. equities. The Bloomberg Barclays U.S. Aggregate Bond Index rallied 3.54% while the S&P 500® Index jumped 21.83%.
Year-to-date, equities were the sole positive contributor to the Fund’s performance, while positions in currencies, commodities, and fixed income detracted from returns. Positions in the Dow Jones Industrial Average, the Hang Seng, and the TOPIX all contributed to the Fund’s strong returns, as equity markets rallied in 2017, supported by synchronized global economic growth, strong employment data, and cyclical industries continuing to post strong earnings. The Fund’s positions in Australian short-term government debt and the Japanese yen detracted from returns, along with energy-related positions. The Reserve Bank of Australia chose not to raise its cash-reserve rate in 2017, citing poor wage growth and high household debt, and the Japanese yen appreciated vs. the U.S. dollar due uncertainty with the Trump administration’s fiscal policies, as well as escalating tensions with North Korea.
Entering the first quarter of 2018, the Fund is net long equities, currencies and commodities, while being net short fixed income. Within equities, the Fund’s largest geographical exposure is to the U.S. The Fund’s net short exposure to fixed income is largely due to positions in the U.S., specifically short-term U.S. Treasurys, due to the recent uptick in yields and the Federal Reserve’s anticipated rate hikes in 2018. In terms of commodities, the Fund is generally net short grains and softs, and net long industrial metals, precious metals, energy, and livestock. The Fund is generally short the U.S. dollar with regard to its currency holdings.
The Fund held derivatives for a number of reasons, including liquidity, leverage, speculation, and hedging. Derivatives were liquid and allowed the Fund to gain leveraged access to markets in order to express investment views and to hedge exposures. Futures are an integral part of a managed futures strategy, and therefore derivatives performance was the primary driver of the Fund’s performance for the period.
Performance displayed represents past performance which is no guarantee of future results.
| | THE GUGGENHEIM FUNDS ANNUAL REPORT | 9 |
| PERFORMANCE REPORT AND FUND PROFILE (Unaudited)(continued) | December 31, 2017 |
Consolidated Holdings Diversification (Market Exposure as % of Net Assets)
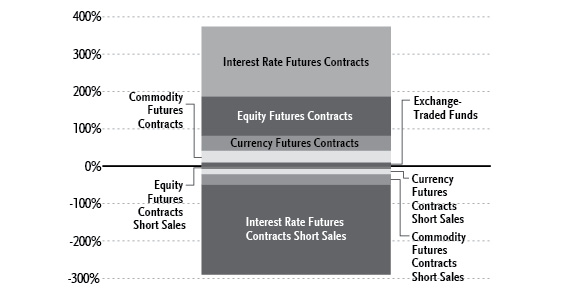
“Consolidated Holdings Diversification (Market Exposure as % of Net Assets)” excludes any temporary cash investments or investments in Guggenheim Strategy Funds Trust mutual funds. Investments in those Funds will significantly increase the portfolio’s exposure to certain other asset categories (and their associated risks), which may cause the Fund to deviate from its principal investment strategy, including: (i) high yield, high risk debt securities rated below the top four long-term rating categories by a nationally recognized statistical rating organization (also known as “junk bonds”); (ii) securities issued by the U.S. government or its agencies and instrumentalities; (iii) CLOs and similar investments; and (iv) other short-term fixed income securities.
| Inception Dates: |
| A-Class | March 2, 2007 |
| C-Class | March 2, 2007 |
| P-Class | March 2, 2007 |
| Institutional Class | May 3, 2010 |
| Ten Largest Holdings (% of Total Net Assets) |
| Guggenheim Strategy Fund III | 30.5% |
| Guggenheim Strategy Fund II | 18.9% |
| Guggenheim Strategy Fund I | 17.8% |
| Guggenheim Ultra Short Duration ETF | 10.7% |
| Top Ten Total | 77.9% |
“Largest Holdings” excludes any temporary cash or derivative investments. |
| 10 | THE GUGGENHEIM FUNDS ANNUAL REPORT | |
| PERFORMANCE REPORT AND FUND PROFILE (Unaudited)(continued) | December 31, 2017 |
Cumulative Fund Performance*
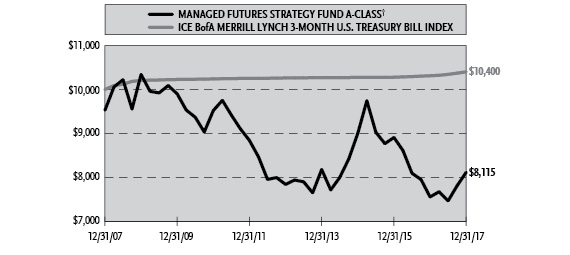
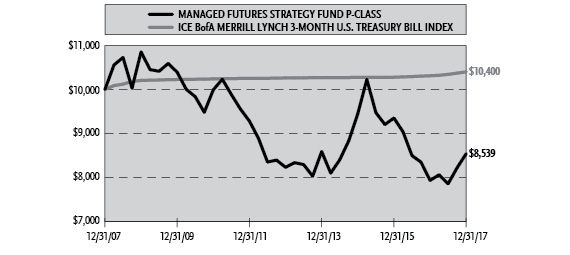
| | THE GUGGENHEIM FUNDS ANNUAL REPORT | 11 |
| PERFORMANCE REPORT AND FUND PROFILE (Unaudited)(concluded) | December 31, 2017 |
Average Annual Returns*
Periods Ended December 31, 2017
| | 1 Year | 5 Year | 10 Year |
| A-Class Shares | 7.41% | 0.69% | (1.59%) |
| A-Class Shares with sales charge‡ | 2.32% | (0.28%) | (2.07%) |
| C-Class Shares | 6.64% | (0.06%) | (2.33%) |
| C-Class Shares with CDSC§ | 5.64% | (0.06%) | (2.33%) |
| P-Class Shares | 7.68% | 0.74% | (1.57%) |
| ICE BofA Merrill Lynch 3-Month U.S. Treasury Bill Index | 0.86% | 0.27% | 0.39% |
| | | | |
| | 1 Year | 5 Year | Since Inception
(05/03/10) |
| Institutional Class Shares | 7.69% | 0.95% | (1.71%) |
| ICE BofA Merrill Lynch 3-Month U.S. Treasury Bill Index | 0.86% | 0.27% | 0.22% |
| * | | The performance data above represents past performance that is not predictive of future results. The investment return and principal value of an investment in the Fund will fluctuate so that an investor’s shares, when redeemed, may be worth more or less than their original cost. Returns are historical and include changes in principal and reinvested dividends and capital gains and do not reflect the effect of taxes. The ICE BofA Merrill Lynch 3-Month U.S. Treasury Bill Index is an unmanaged index and, unlike the Fund, has no management fees or operating expenses to reduce its reported return. The graphs are based on A-Class shares and P-Class shares only; performance for C-Class shares and Institutional Class shares will vary due to differences in fee structure. |
| ‡ | | Fund returns are calculated using the maximum sales charge of 4.75%. |
| § | | Fund returns include a CDSC of 1% if redeemed within 12 months of purchase. |
| 12 | THE GUGGENHEIM FUNDS ANNUAL REPORT | |
| CONSOLIDATED SCHEDULE OF INVESTMENTS | December 31, 2017 |
| MANAGED FUTURES STRATEGY FUND | |
| | | Shares | | | Value | |
| | | | | | | |
| EXCHANGE-TRADED FUNDS† - 10.7% |
| Guggenheim Ultra Short Duration ETF1,2 | | | 108,400 | | | $ | 5,435,176 | |
| Total Exchange-Traded Funds | | | | | | | | |
| (Cost $5,429,550) | | | | | | | 5,435,176 | |
| | | | | | | | | |
| MUTUAL FUNDS† - 67.2% | | | | | | | | |
| Guggenheim Strategy Fund III1 | | | 617,650 | | | | 15,453,598 | |
| Guggenheim Strategy Fund II1 | | | 382,914 | | | | 9,576,692 | |
| Guggenheim Strategy Fund I1 | | | 358,617 | | | | 8,986,940 | |
| Total Mutual Funds | | | | | | | | |
| (Cost $33,960,094) | | | | | | | 34,017,230 | |
| | | | | | | | | |
| | | | Face
Amount | | | | | |
| | | | | | | | | |
| U.S. TREASURY BILLS†† - 9.4% | | | | | | | | |
| U.S. Treasury Bills | | | | | | | | |
| 1.31% due 04/19/183,4,5 | | $ | 4,775,000 | | | | 4,755,201 | |
| Total U.S. Treasury Bills | | | | | | | | |
| (Cost $4,756,019) | | | | | | | 4,755,201 | |
| | | | | | | | | |
| FEDERAL AGENCY DISCOUNT NOTES†† - 2.0% |
| Federal Home Loan Bank6 | | | | | | | | |
| 1.05% due 01/02/184,5 | | | 1,000,000 | | | | 999,971 | |
| Total Federal Agency Discount Notes | | | | | | | | |
| (Cost $999,971) | | | | | | | 999,971 | |
| | | | | | | | | |
| REPURCHASE AGREEMENTS††,7 - 7.3% |
JPMorgan Chase & Co.
issued 12/29/17 at 1.41%
due 01/02/18 | | | 2,409,224 | | | | 2,409,224 | |
Bank of America Merrill Lynch
issued 12/29/17 at 1.40%
due 01/02/18 | | | 1,285,810 | | | | 1,285,810 | |
| Total Repurchase Agreements | | | | | | | | |
| (Cost $3,695,034) | | | | | | | 3,695,034 | |
| | | | | | | | | |
| | | | Shares | | | | | |
| SECURITIES LENDING COLLATERAL†,8 - 4.2% |
| Money Market Fund | | | | | | | | |
| First American Government Obligations Fund — Class Z, 1.15%9 | | | 2,141,225 | | | | 2,141,225 | |
| Total Securities Lending Collateral | | | | | | | | |
| (Cost $2,141,225) | | | | | | | 2,141,225 | |
| Total Investments - 100.8% | | | | | | | | |
| (Cost $50,981,893) | | | | | | $ | 51,043,837 | |
| Other Assets & Liabilities, net - (0.8)% | | | | | | | (423,754 | ) |
| Total Net Assets - 100.0% | | | | | | $ | 50,620,083 | |
| |
| SEE NOTES TO FINANCIAL STATEMENTS. | THE GUGGENHEIM FUNDS ANNUAL REPORT | 13 |
| CONSOLIDATED SCHEDULE OF INVESTMENTS (continued) | December 31, 2017 |
| MANAGED FUTURES STRATEGY FUND | |
Futures Contracts
| Description | | Number of
Contracts | | | Expiration
Date | | Notional
Amount | | | Value and
Unrealized
Gain (Loss) | |
| Commodity Futures Contracts Purchased† | | | | | | | | | | | | | | |
| Brent Crude Futures Contracts | | | 33 | | | Mar 2018 | | $ | 2,198,460 | | | $ | 105,985 | |
| Low Sulphur Gas Oil Futures Contracts | | | 32 | | | Feb 2018 | | | 1,925,600 | | | | 94,927 | |
| NY Harbor ULSD Futures Contracts | | | 14 | | | Feb 2018 | | | 1,213,398 | | | | 87,279 | |
| WTI Crude Futures Contracts | | | 14 | | | Feb 2018 | | | 841,820 | | | | 45,878 | |
| Cotton #2 Futures Contracts | | | 24 | | | Mar 2018 | | | 942,000 | | | | 40,851 | |
| Gold 100 oz. Futures Contracts | | | 26 | | | Feb 2018 | | | 3,394,300 | | | | 40,195 | |
| LME Zinc Futures Contracts | | | 13 | | | Feb 2018 | | | 1,081,762 | | | | 39,864 | |
| Copper Futures Contracts | | | 12 | | | Mar 2018 | | | 987,449 | | | | 33,313 | |
| LME Primary Aluminum Futures Contracts | | | 11 | | | Feb 2018 | | | 623,356 | | | | 26,812 | |
| LME Nickel Futures Contracts | | | 3 | | | Feb 2018 | | | 229,284 | | | | 21,094 | |
| Gasoline RBOB Futures Contracts | | | 5 | | | Feb 2018 | | | 375,144 | | | | 20,502 | |
| Lean Hogs Futures Contracts | | | 7 | | | Feb 2018 | | | 200,480 | | | | 2,595 | |
| Soybean Meal Futures Contracts | | | 2 | | | Mar 2018 | | | 63,440 | | | | (207 | ) |
| LME Lead Futures Contracts | | | 16 | | | Feb 2018 | | | 994,021 | | | | (13,348 | ) |
| Live Cattle Futures Contracts | | | 15 | | | Feb 2018 | | | 729,750 | | | | (34,390 | ) |
| | | | | | | | | $ | 15,800,264 | | | $ | 511,350 | |
| Equity Futures Contracts Purchased† | | | | | | | | | | | | | | |
| Dow Jones Industrial Average Index Mini Futures Contracts | | | 61 | | | Mar 2018 | | $ | 7,546,615 | | | $ | 114,635 | |
| Tokyo Stock Price Index Futures Contracts | | | 21 | | | Mar 2018 | | | 3,394,551 | | | | 61,384 | |
| Hang Seng Index Futures Contracts†† | | | 15 | | | Jan 2018 | | | 2,871,756 | | | | 59,461 | |
| NASDAQ-100 Index Mini Futures Contracts | | | 49 | | | Mar 2018 | | | 6,282,045 | | | | 53,369 | |
| S&P 500 Index Mini Futures Contracts | | | 27 | | | Mar 2018 | | | 3,614,962 | | | | 49,949 | |
| MSCI EAFE Index Mini Futures Contracts | | | 21 | | | Mar 2018 | | | 2,148,405 | | | | 49,361 | |
| MSCI EAFE Index Mini Futures Contracts | | | 15 | | | Mar 2018 | | | 872,775 | | | | 45,950 | |
| FTSE 100 Index Futures Contracts†† | | | 21 | | | Mar 2018 | | | 2,138,940 | | | | 21,346 | |
| S&P MidCap 400 Index Mini Futures Contracts | | | 9 | | | Mar 2018 | | | 1,712,160 | | | | 18,978 | |
| Russell 2000 Index Mini Futures Contracts | | | 14 | | | Mar 2018 | | | 1,075,970 | | | | 12,441 | |
| S&P/TSX 60 IX Index Futures Contracts | | | 27 | | | Mar 2018 | | | 4,113,603 | | | | 10,827 | |
| Nikkei 225 (OSE) Index Futures Contracts | | | 7 | | | Mar 2018 | | | 1,415,095 | | | | 10,304 | |
| MSCI Taiwan Stock Index Futures Contracts | | | 14 | | | Jan 2018 | | | 548,660 | | | | 7,332 | |
| FTSE/JSE TOP 40 Index Futures Contracts†† | | | 19 | | | Mar 2018 | | | 806,573 | | | | 6,797 | |
| FTSE MIB Index Futures Contracts†† | | | 1 | | | Mar 2018 | | | 130,514 | | | | (1,724 | ) |
| OMX Stockholm 30 Index Futures Contracts†† | | | 8 | | | Jan 2018 | | | 153,362 | | | | (2,080 | ) |
| SPI 200 Index Futures Contracts†† | | | 37 | | | Mar 2018 | | | 4,344,021 | | | | (7,253 | ) |
| CAC 40 10 Euro Index Futures Contracts | | | 26 | | | Jan 2018 | | | 1,652,957 | | | | (28,005 | ) |
| DAX Index Futures Contracts | | | 5 | | | Mar 2018 | | | 1,928,015 | | | | (36,292 | ) |
| Amsterdam Index Futures Contracts | | | 22 | | | Jan 2018 | | | 2,869,898 | | | | (37,674 | ) |
| Euro STOXX 50 Index Futures Contracts | | | 82 | | | Mar 2018 | | | 3,425,603 | | | | (105,862 | ) |
| | | | | | | | | $ | 53,046,480 | | | $ | 303,244 | |
| 14 | THE GUGGENHEIM FUNDS ANNUAL REPORT | SEE NOTES TO FINANCIAL STATEMENTS. |
| CONSOLIDATED SCHEDULE OF INVESTMENTS (continued) | December 31, 2017 |
| MANAGED FUTURES STRATEGY FUND | |
| Description | | Number of
Contracts | | | Expiration
Date | | Notional
Amount | | | Value and
Unrealized
Gain (Loss) | |
| Currency Futures Contracts Purchased† | | | | | | | | | | | | | | |
| Euro Futures Contracts | | | 47 | | | Mar 2018 | | $ | 7,080,844 | | | $ | 89,636 | |
| British Pound Futures Contracts | | | 120 | | | Mar 2018 | | | 10,149,750 | | | | 72,751 | |
| Canadian Dollar Futures Contracts | | | 36 | | | Mar 2018 | | | 2,866,680 | | | | 23,856 | |
| Australian Dollar Futures Contracts | | | 6 | | | Mar 2018 | | | 468,120 | | | | (219 | ) |
| | | | | | | | | $ | 20,565,394 | | | $ | 186,024 | |
| Interest Rate Futures Contracts Purchased† | | | | | | | | | | | | | | |
| Long Gilt Futures Contracts†† | | | 22 | | | Mar 2018 | | $ | 3,719,782 | | | $ | 22,783 | |
| U.S. Treasury Ultra Long Bond Futures Contracts | | | 14 | | | Mar 2018 | | | 2,344,562 | | | | 16,250 | |
| U.S. Treasury Long Bond Futures Contracts | | | 19 | | | Mar 2018 | | | 2,905,219 | | | | 4,391 | |
| Euro - 30 year Bond Futures Contracts | | | 2 | | | Mar 2018 | | | 393,377 | | | | (1,645 | ) |
| Euro - Bund Futures Contracts†† | | | 45 | | | Mar 2018 | | | 8,735,453 | | | | (24,955 | ) |
| Euro - BTP Italian Government Bond Futures Contracts | | | 42 | | | Mar 2018 | | | 6,866,131 | | | | (26,863 | ) |
| Australian Government 10 Year Bond Futures Contracts†† | | | 37 | | | Mar 2018 | | | 3,722,521 | | | | (37,367 | ) |
| Euro - OATS Futures Contracts†† | | | 95 | | | Mar 2018 | | | 17,710,918 | | | | (41,286 | ) |
| Euro - Schatz Futures Contracts | | | 360 | | | Mar 2018 | | | 48,365,687 | | | | (45,652 | ) |
| | | | | | | | | $ | 94,763,650 | | | $ | (134,344 | ) |
| Interest Rate Futures Contracts Sold Short† | | | | | | | | | | | | | | |
| U.S. Treasury 2 Year Note Futures Contracts | | | 190 | | | Mar 2018 | | $ | 40,677,813 | | | $ | 79,864 | |
| U.S. Treasury 5 Year Note Futures Contracts | | | 188 | | | Mar 2018 | | | 21,834,437 | | | | 61,179 | |
| Australian Government 3 Year Bond Futures Contracts†† | | | 158 | | | Mar 2018 | | | 13,686,758 | | | | 32,492 | |
| Canadian Government 10 Year Bond Futures Contracts†† | | | 147 | | | Mar 2018 | | | 15,758,310 | | | | 27,082 | |
| U.S. Treasury 10 Year Note Futures Contracts | | | 172 | | | Mar 2018 | | | 21,328,000 | | | | 20,567 | |
| Euro - Bobl Futures Contracts | | | 46 | | | Mar 2018 | | | 7,263,419 | | | | 1,949 | |
| Australian Government 10 Year Bond Futures Contracts†† | | | 9 | | | Mar 2018 | | | 905,478 | | | | 862 | |
| Long Gilt Futures Contracts†† | | | 5 | | | Mar 2018 | | | 845,405 | | | | (527 | ) |
| | | | | | | | | $ | 122,299,620 | | | $ | 223,468 | |
| Commodity Futures Contracts Sold Short† | | | | | | | | | | | | | | |
| Corn Futures Contracts | | | 138 | | | Mar 2018 | | $ | 2,421,900 | | | $ | 39,955 | |
| Hard Red Winter Wheat Futures Contracts | | | 82 | | | Mar 2018 | | | 1,752,750 | | | | 35,316 | |
| Coffee 'C' Futures Contracts | | | 33 | | | Mar 2018 | | | 1,561,725 | | | | 31,985 | |
| Wheat Futures Contracts | | | 60 | | | Mar 2018 | | | 1,281,750 | | | | 28,921 | |
| Soybean Futures Contracts | | | 28 | | | Mar 2018 | | | 1,347,500 | | | | 23,588 | |
| Soybean Meal Futures Contracts | | | 23 | | | Mar 2018 | | | 729,560 | | | | 15,143 | |
| Cocoa Futures Contracts | | | 26 | | | Mar 2018 | | | 490,880 | | | | 6,508 | |
| Soybean Oil Futures Contracts | | | 54 | | | Mar 2018 | | | 1,075,680 | | | | 2,539 | |
| Cattle Feeder Futures Contracts | | | 2 | | | Mar 2018 | | | 142,875 | | | | (607 | ) |
| Lean Hogs Futures Contracts | | | 2 | | | Feb 2018 | | | 57,280 | | | | (3,847 | ) |
| Platinum Futures Contracts | | | 2 | | | Apr 2018 | | | 93,410 | | | | (5,271 | ) |
| Gasoline RBOB Futures Contracts | | | 2 | | | Feb 2018 | | | 150,058 | | | | (8,125 | ) |
| LME Nickel Futures Contracts | | | 2 | | | Feb 2018 | | | 152,856 | | | | (19,909 | ) |
| Sugar #11 Futures Contracts | | | 33 | | | Mar 2018 | | | 559,944 | | | | (29,870 | ) |
| Silver Futures Contracts | | | 12 | | | Mar 2018 | | | 1,020,300 | | | | (38,093 | ) |
| Natural Gas Futures Contracts | | | 33 | | | Feb 2018 | | | 973,830 | | | | (72,052 | ) |
| | | | | | | | | $ | 13,812,298 | | | $ | 6,181 | |
| SEE NOTES TO FINANCIAL STATEMENTS. | THE GUGGENHEIM FUNDS ANNUAL REPORT | 15 |
| CONSOLIDATED SCHEDULE OF INVESTMENTS (continued) | December 31, 2017 |
| MANAGED FUTURES STRATEGY FUND | |
| Description | | Number of
Contracts | | | Expiration
Date | | Notional
Amount | | | Value and
Unrealized
Gain (Loss) | |
| Currency Futures Contracts Sold Short† | | | | | | | | | | | |
| Mexican Peso Futures Contracts | | | 94 | | | Mar 2018 | | $ | 2,357,050 | | | $ | 17,878 | |
| Japanese Yen Futures Contracts | | | 26 | | | Mar 2018 | | | 2,894,613 | | | | (3,120 | ) |
| Canadian Dollar Futures Contracts | | | 8 | | | Mar 2018 | | | 637,040 | | | | (7,166 | ) |
| New Zealand Dollar Futures Contracts | | | 10 | | | Mar 2018 | | | 708,100 | | | | (8,226 | ) |
| Australian Dollar Futures Contracts | | | 6 | | | Mar 2018 | | | 468,120 | | | | (11,476 | ) |
| | | | | | | | | $ | 7,064,923 | | | $ | (12,110 | ) |
| Equity Futures Contracts Sold Short† | | | | | | | | | | | | | | |
| IBEX 35 Index Futures Contracts†† | | | 2 | | | Jan 2018 | | $ | 239,578 | | | $ | 2,926 | |
| Russell 2000 Index Mini Futures Contracts | | | 5 | | | Mar 2018 | | | 384,275 | | | | 1,231 | |
| H-Shares Index Futures Contracts†† | | | 7 | | | Jan 2018 | | | 524,124 | | | | (6,224 | ) |
| FTSE 100 Index Futures Contracts†† | | | 19 | | | Mar 2018 | | | 1,935,232 | | | | (17,843 | ) |
| | | | | | | | | $ | 3,083,209 | | | $ | (19,910 | ) |
| † | | Value determined based on Level 1 inputs, unless otherwise noted — See Note 4. |
| †† | | Value determined based on Level 2 inputs — See Note 4. |
| 1 | | Affiliated issuer. |
| 2 | | All or portion of this security is on loan at December 31, 2017 — See Note 7. |
| 3 | | All or a portion of this security is pledged as futures collateral at December 31, 2017. |
| 4 | | Rate indicated is the effective yield at the time of purchase. |
| 5 | | Zero coupon rate security. |
| 6 | | The issuer operates under a Congressional charter; its securities are neither issued nor guaranteed by the U.S. Government. |
| 7 | | Repurchase Agreements — See Note 6. |
| 8 | | Securities lending collateral — See Note 7. |
| 9 | | Rate indicated is the 7 day yield as of December 31, 2017. |
| | | |
| | | See Sector Classification in Other Information section. |
| 16 | THE GUGGENHEIM FUNDS ANNUAL REPORT | SEE NOTES TO FINANCIAL STATEMENTS. |
| CONSOLIDATED SCHEDULE OF INVESTMENTS (continued) | December 31, 2017 |
| MANAGED FUTURES STRATEGY FUND | |
The following table summarizes the inputs used to value the Fund’s investments at December 31, 2017 (See Note 4 in the Notes to Financial Statements):
| Investments in Securities (Assets) | | Level 1
Quoted
Prices | | | Level 1 -
Other* | | | Level 2
Significant
Observable
Inputs | | | Level 2 -
Other* | | | Level 3
Significant
Unobservable
Inputs | | | Total | |
| Commodity Futures Contracts | | $ | — | | | $ | 743,250 | | | $ | — | | | $ | — | | | $ | — | | | $ | 743,250 | |
| Currency Futures Contracts | | | — | | | | 204,121 | | | | — | | | | — | | | | — | | | | 204,121 | |
| Equity Futures Contracts | | | — | | | | 435,761 | | | | — | | | | 90,530 | | | | — | | | | 526,291 | |
| Exchange-Traded Funds | | | 5,435,176 | | | | — | | | | — | | | | — | | | | — | | | | 5,435,176 | |
| Federal Agency Discount Notes | | | — | | | | — | | | | 999,971 | | | | — | | | | — | | | | 999,971 | |
| Interest Rate Futures Contracts | | | — | | | | 184,200 | | | | — | | | | 83,219 | | | | — | | | | 267,419 | |
| Mutual Funds | | | 34,017,230 | | | | — | | | | — | | | | — | | | | — | | | | 34,017,230 | |
| Repurchase Agreement | | | — | | | | — | | | | 3,695,034 | | | | — | | | | — | | | | 3,695,034 | |
| Securities Lending Collateral | | | 2,141,225 | | | | — | | | | — | | | | — | | | | — | | | | 2,141,225 | |
| U.S. Treasury Bills | | | — | | | | — | | | | 4,755,201 | | | | — | | | | — | | | | 4,755,201 | |
| Total Assets | | $ | 41,593,631 | | | $ | 1,567,332 | | | $ | 9,450,206 | | | $ | 173,749 | | | $ | — | | | $ | 52,784,918 | |
| | | | | | | | | | | | | | | | | | | | | | | | | |
| Investments in Securities (Liabilities) | | | Level 1
Quoted
Prices | | | | Level 1 -
Other* | | | | Level 2
Significant
Observable
Inputs | | | | Level 2 -
Other* | | | | Level 3
Significant
Unobservable
Inputs | | | | Total | |
| Commodity Futures Contracts | | $ | — | | | $ | 225,719 | | | $ | — | | | $ | — | | | $ | — | | | $ | 225,719 | |
| Currency Futures Contracts | | | — | | | | 30,207 | | | | — | | | | — | | | | — | | | | 30,207 | |
| Equity Futures Contracts | | | — | | | | 207,833 | | | | — | | | | 35,124 | | | | — | | | | 242,957 | |
| Interest Rate Futures Contracts | | | — | | | | 74,160 | | | | — | | | | 104,135 | | | | — | | | | 178,295 | |
| Total Liabilities | | $ | — | | | $ | 537,919 | | | $ | — | | | $ | 139,259 | | | $ | — | | | $ | 677,178 | |
| * | | Other financial instruments include futures contracts, which are reported as unrealized gain/loss at period end. |
Transfers between investment levels may occur as the markets fluctuate and/or the availability of data used in an investment’s valuation changes. Transfers between valuation levels, if any, are in comparison to the valuation levels at the end of the previous fiscal year, and are effective using the fair value as of the end of the current fiscal period.
For the year ended December 31, 2017, there were no transfers between levels.
| SEE NOTES TO FINANCIAL STATEMENTS. | THE GUGGENHEIM FUNDS ANNUAL REPORT | 17 |
| CONSOLIDATED SCHEDULE OF INVESTMENTS (concluded) | December 31, 2017 |
| MANAGED FUTURES STRATEGY FUND | |
Affiliated Transactions
Investments representing 5% or more of the outstanding voting shares of a portfolio company of a fund, or control of or by, or common control under Guggenheim Investments (“GI”), result in that portfolio company being considered an affiliated company of such fund, as defined in the 1940 Act.
The Fund may invest in the underlying series of the Guggenheim Strategy Funds Trust consisting of Guggenheim Strategy Fund I, Guggenheim Strategy Fund II, Guggenheim Strategy Fund III, and Guggenheim Variable Insurance Strategy Fund III (collectively, the “Cash Management Funds”), open-end management investment companies managed by GI. The Cash Management Funds, which launched on March 11, 2014, are offered as cash management options only to mutual funds, trusts, and other accounts managed by GI and/or its affiliates, and are not available to the public. The Cash Management Funds pay no investment management fees. The Cash Management Funds’ annual report on Form N-CSR dated September 30, 2017, is available publicly or upon request. This information is available from the EDGAR database on the SEC’s website at https://www.sec.gov/Archives/edgar/data/1601445/000089180417000715/gug72218.htm.
Transactions during the year ended December 31, 2017, in which the portfolio company is an “affiliated person”, were as follows:
| Security Name | | Value 12/31/16 | | | Additions | | | Reductions | | | Realized Gain | | | Change in Unrealized | | | Value 12/31/17 | |
| Exchange-Traded Fund | | | | | | | | | | | | | | | | | | |
| Guggenheim Ultra Short Duration ETF | | $ | 5,433,008 | | | $ | — | | | $ | — | | | $ | — | | | $ | 2,168 | | | $ | 5,435,176 | |
| Mutual Funds | | | | | | | | | | | | | | | | | | | | | | | | |
| Guggenheim Strategy Fund I | | | 26,828,893 | | | | 16,450,541 | | | | (34,350,000 | ) | | | 215,782 | | | | (158,276 | ) | | | 8,986,940 | |
| Guggenheim Strategy Fund II | | | 26,527,725 | | | | 9,393,430 | | | | (26,400,000 | ) | | | 78,428 | | | | (22,891 | ) | | | 9,576,692 | |
| Guggenheim Strategy Fund III | | | 27,274,077 | | | | 10,327,960 | | | | (22,200,000 | ) | | | 22,214 | | | | 29,347 | | | | 15,453,598 | |
| | | $ | 86,063,703 | | | $ | 36,171,931 | | | $ | (82,950,000 | ) | | $ | 316,424 | | | $ | (149,652 | ) | | $ | 39,452,406 | |
| Security Name | | Shares
12/31/17 | | | Investment
Income | | | Capital Gain
Distributions | |
| Exchange-Traded Fund | | | | | | | | | |
| Guggenheim Ultra Short Duration ETF | | | 108,400 | | | $ | 98,091 | | | $ | — | |
| Mutual Funds | | | | | | | | | | | | |
| Guggenheim Strategy Fund I | | | 358,617 | | | | 273,823 | | | | 3,398 | |
| Guggenheim Strategy Fund II | | | 382,914 | | | | 340,672 | | | | 5,094 | |
| Guggenheim Strategy Fund III | | | 617,650 | | | | 527,189 | | | | 3,759 | |
| | | | | | | $ | 1,239,775 | | | $ | 12,251 | |
| 18 | THE GUGGENHEIM FUNDS ANNUAL REPORT | SEE NOTES TO FINANCIAL STATEMENTS. |
| CONSOLIDATED STATEMENT OF ASSETS AND LIABILITIES |
| MANAGED FUTURES STRATEGY FUND |
December 31, 2017
| Assets: |
| Investments in unaffiliated issuers, at value - including $2,090,838 of securities loaned (cost $7,897,215) | | $ | 7,896,397 | |
| Investments in affiliated issuers, at value (cost $39,389,644) | | | 39,452,406 | |
| Repurchase agreements, at value (cost $3,695,034) | | | 3,695,034 | |
| Cash | | | 2,267 | |
| Segregated cash with broker | | | 1,755,460 | |
| Receivables: |
| Fund shares sold | | | 360,634 | |
| Dividends | | | 84,253 | |
| Securities lending income | | | 2,829 | |
| Interest | | | 433 | |
| Total assets | | | 53,249,713 | |
| | | | | |
| Liabilities: |
| Payable for: |
| Return of securities loaned | | | 2,141,225 | |
| Variation margin | | | 223,293 | |
| Fund shares redeemed | | | 110,189 | |
| Securities purchased | | | 57,249 | |
| Management fees | | | 38,080 | |
| Distribution and service fees | | | 13,768 | |
| Transfer agent and administrative fees | | | 10,822 | |
| Portfolio accounting fees | | | 4,328 | |
| Miscellaneous | | | 30,676 | |
| Total liabilities | | | 2,629,630 | |
| Commitments and contingent liabilities (Note 11) | | | — | |
| Net assets | | $ | 50,620,083 | |
| | | | | |
| Net assets consist of: |
| Paid in capital | | $ | 137,079,591 | |
| Accumulated net investment loss | | | (15,724,174 | ) |
| Accumulated net realized loss on investments | | | (71,860,917 | ) |
| Net unrealized appreciation on investments | | | 1,125,583 | |
| Net assets | | $ | 50,620,083 | |
| | | | | |
| A-Class: |
| Net assets | | $ | 10,621,294 | |
| Capital shares outstanding | | | 553,524 | |
| Net asset value per share | | $ | 19.19 | |
| Maximum offering price per share (Net asset value divided by 95.25%) | | $ | 20.15 | |
| | | | | |
| C-Class: |
| Net assets | | $ | 8,234,167 | |
| Capital shares outstanding | | | 470,778 | |
| Net asset value per share | | $ | 17.49 | |
| | | | | |
| P-Class: |
| Net assets | | $ | 21,425,891 | |
| Capital shares outstanding | | | 1,113,922 | |
| Net asset value per share | | $ | 19.23 | |
| | | | | |
| Institutional Class |
| Net assets | | $ | 10,338,731 | |
| Capital shares outstanding | | | 527,098 | |
| Net asset value per share | | $ | 19.61 | |
| SEE NOTES TO FINANCIAL STATEMENTS. | THE GUGGENHEIM FUNDS ANNUAL REPORT | 19 |
| CONSOLIDATED STATEMENT OF OPERATIONS |
| MANAGED FUTURES STRATEGY FUND |
Year Ended December 31, 2017
| Investment Income: |
| Dividends from securities of affiliated issuers | | $ | 1,239,775 | |
| Interest | | | 121,903 | |
| Income from securities lending, net | | | 16,983 | |
| Other income | | | 1,967 | |
| Total investment income | | | 1,380,628 | |
| | | | | |
| Expenses: |
| Management fees | | | 664,746 | |
| Distribution and service fees: |
| A-Class | | | 36,324 | |
| C-Class | | | 92,067 | |
| P-Class | | | 94,079 | |
| Transfer agent and administrative fees | | | 175,585 | |
| Registration fees | | | 79,661 | |
| Portfolio accounting fees | | | 70,234 | |
| Trustees’ fees* | | | 11,697 | |
| Custodian fees | | | 10,434 | |
| Tax expense | | | 209 | |
| Interest Expense | | | 15 | |
| Miscellaneous | | | 63,323 | |
| Total expenses | | | 1,298,374 | |
| Less: | | | | |
| Expenses waived by Adviser | | | (43,472 | ) |
| Net expenses | | | 1,254,902 | |
| Net investment income | | | 125,726 | |
| | | | | |
| Net Realized and Unrealized Gain (Loss): |
| Net realized gain (loss) on: |
| Investments in unaffiliated issuers | | $ | (691 | ) |
| Investments in affiliated issuers | | | 316,424 | |
| Futures contracts | | | 5,875,121 | |
| Foreign currency transactions | | | 9,469 | |
| Distributions received from affiliated investment company shares | | | 12,251 | |
| Net realized gain | | | 6,212,574 | |
| Net change in unrealized appreciation (depreciation) on: |
| Investments in unaffiliated issuers | | | (1,236 | ) |
| Investments in affiliated issuers | | | (149,652 | ) |
| Futures contracts | | | (1,852,727 | ) |
| Foreign currency translations | | | (2,975 | ) |
| Net change in unrealized appreciation (depreciation) | | | (2,006,590 | ) |
| Net realized and unrealized gain | | | 4,205,984 | |
| Net increase in net assets resulting from operations | | $ | 4,331,710 | |
| * | | Relates to Trustees not deemed “interested persons” within the meaning of Section 2(a)(19) of the 1940 Act. |
| 20 | THE GUGGENHEIM FUNDS ANNUAL REPORT | SEE NOTES TO FINANCIAL STATEMENTS. |
| CONSOLIDATED STATEMENTS OF CHANGES IN NET ASSETS |
| MANAGED FUTURES STRATEGY FUND | |
| | | Year Ended
December 31,
2017 | | | Year Ended
December 31,
2016 | |
| Increase (Decrease) in Net Assets from Operations: | | | | | | | | |
| Net investment income (loss) | | $ | 125,726 | | | $ | (205,432 | ) |
| Net realized gain (loss) on investments | | | 6,212,574 | | | | (27,908,873 | ) |
| Net change in unrealized appreciation (depreciation) on investments | | | (2,006,590 | ) | | | (575,770 | ) |
| Net increase (decrease) in net assets resulting from operations | | | 4,331,710 | | | | (28,690,075 | ) |
| | | | | | | | | |
| Distributions to shareholders from: | | | | | | | | |
| Net investment income | | | | | | | | |
| A-Class | | | (493,552 | ) | | | (835,216 | ) |
| C-Class | | | (399,421 | ) | | | (642,841 | ) |
| P-Class | | | (991,652 | ) | | | (4,344,074 | ) |
| Institutional Class | | | (452,612 | ) | | | (320,377 | ) |
| Total distributions to shareholders | | | (2,337,237 | ) | | | (6,142,508 | ) |
| | | | | | | | | |
| Capital share transactions: | | | | | | | | |
| Proceeds from sale of shares | | | | | | | | |
| A-Class | | | 1,330,048 | | | | 11,456,330 | |
| C-Class | | | 468,001 | | | | 640,671 | |
| P-Class | | | 9,193,253 | | | | 35,495,477 | |
| Institutional Class | | | 7,382,823 | | | | 2,088,056 | |
| Distributions reinvested | | | | | | | | |
| A-Class | | | 461,064 | | | | 793,205 | |
| C-Class | | | 387,451 | | | | 623,208 | |
| P-Class | | | 938,994 | | | | 4,259,964 | |
| Institutional Class | | | 452,127 | | | | 320,377 | |
| Cost of shares redeemed | | | | | | | | |
| A-Class | | | (14,404,320 | ) | | | (12,534,971 | ) |
| C-Class | | | (4,014,402 | ) | | | (7,812,593 | ) |
| P-Class | | | (67,689,687 | ) | | | (101,986,446 | ) |
| Institutional Class | | | (3,868,163 | ) | | | (3,737,316 | ) |
| Net decrease from capital share transactions | | | (69,362,811 | ) | | | (70,394,038 | ) |
| Net decrease in net assets | | | (67,368,338 | ) | | | (105,226,621 | ) |
| | | | | | | | | |
| Net assets: | | | | | | | | |
| Beginning of year | | | 117,988,421 | | | | 223,215,042 | |
| End of year | | $ | 50,620,083 | | | $ | 117,988,421 | |
| Accumulated net investment loss at end of year | | $ | (15,724,174 | ) | | $ | (13,385,447 | ) |
| SEE NOTES TO FINANCIAL STATEMENTS. | THE GUGGENHEIM FUNDS ANNUAL REPORT | 21 |
| CONSOLIDATED STATEMENTS OF CHANGES IN NET ASSETS (concluded) |
| MANAGED FUTURES STRATEGY FUND | |
| | | Year Ended
December 31,
2017 | | | Year Ended
December 31,
2016 | |
| Capital share activity: | | | | | | | | |
| Shares sold | | | | | | | | |
| A-Class | | | 69,574 | | | | 576,626 | |
| C-Class | | | 26,149 | | | | 31,071 | |
| P-Class | | | 484,607 | | | | 1,641,302 | |
| Institutional Class | | | 379,958 | | | | 96,780 | |
| Shares issued from reinvestment of distributions | | | | | | | | |
| A-Class | | | 24,127 | | | | 42,720 | |
| C-Class | | | 22,229 | | | | 36,360 | |
| P-Class | | | 48,992 | | | | 229,476 | |
| Institutional Class | | | 23,139 | | | | 16,860 | |
| Shares redeemed | | | | | | | | |
| A-Class | | | (755,054 | ) | | | (603,653 | ) |
| C-Class | | | (229,159 | ) | | | (398,335 | ) |
| P-Class | | | (3,580,641 | ) | | | (4,824,503 | ) |
| Institutional Class | | | (198,586 | ) | | | (174,306 | ) |
| Net decrease in shares | | | (3,684,665 | ) | | | (3,329,602 | ) |
| 22 | THE GUGGENHEIM FUNDS ANNUAL REPORT | SEE NOTES TO FINANCIAL STATEMENTS. |
| CONSOLIDATED FINANCIAL HIGHLIGHTS |
| MANAGED FUTURES STRATEGY FUND | |
This table is presented to show selected data for a share outstanding throughout each period and to assist shareholders in evaluating a Fund’s performance for the periods presented.
| A-Class | | Year Ended
Dec. 31,
2017 | | | Year Ended
Dec. 31,
2016 | | | Year Ended
Dec. 31,
2015 | | | Year Ended
Dec. 31,
2014 | | | Year Ended
Dec. 31,
2013 | |
| Per Share Data | | | | | | | | | | | | | | | | | | | | |
| Net asset value, beginning of period | | $ | 18.71 | | | $ | 23.21 | | | $ | 24.12 | | | $ | 22.15 | | | $ | 21.23 | |
| Income (loss) from investment operations: |
| Net investment income (loss)a | | | .04 | | | | — | b | | | (.14 | ) | | | .02 | | | | (.19 | ) |
| Net gain (loss) on investments (realized and unrealized) | | | 1.34 | | | | (3.53 | ) | | | (.15 | ) | | | 2.23 | | | | 1.11 | |
| Total from investment operations | | | 1.38 | | | | (3.53 | ) | | | (.29 | ) | | | 2.25 | | | | .92 | |
| Less distributions from: |
| Net investment income | | | (.90 | ) | | | (.97 | ) | | | (.62 | ) | | | (.28 | ) | | | — | |
| Total distributions | | | (.90 | ) | | | (.97 | ) | | | (.62 | ) | | | (.28 | ) | | | — | |
| Net asset value, end of period | | $ | 19.19 | | | $ | 18.71 | | | $ | 23.21 | | | $ | 24.12 | | | $ | 22.15 | |
| | | | | | | | | | | | | | | | | | | | | |
| Total Returnc | | | 7.41 | % | | | (15.18 | %) | | | (1.06 | %) | | | 10.06 | % | | | 4.33 | % |
| Ratios/Supplemental Data |
| Net assets, end of period (in thousands) | | $ | 10,621 | | | $ | 22,734 | | | $ | 27,828 | | | $ | 27,514 | | | $ | 76,900 | |
| Ratios to average net assets: |
| Net investment income (loss) | | | 0.21 | % | | | (0.02 | %) | | | (0.57 | %) | | | 0.07 | % | | | (0.89 | %) |
| Total expensesd | | | 1.78 | % | | | 1.84 | % | | | 1.77 | % | | | 1.74 | % | | | 1.74 | % |
| Net expensese | | | 1.72 | % | | | 1.76 | % | | | 1.69 | % | | | 1.68 | % | | | 1.67 | % |
| Portfolio turnover rate | | | 68 | % | | | 16 | % | | | 24 | % | | | 83 | % | | | 102 | % |
| SEE NOTES TO FINANCIAL STATEMENTS. | THE GUGGENHEIM FUNDS ANNUAL REPORT | 23 |
| CONSOLIDATED FINANCIAL HIGHLIGHTS (continued) |
| MANAGED FUTURES STRATEGY FUND | |
This table is presented to show selected data for a share outstanding throughout each period and to assist shareholders in evaluating a Fund’s performance for the periods presented.
| C-Class | | Year Ended
Dec. 31,
2017 | | | Year Ended
Dec. 31,
2016 | | | Year Ended
Dec. 31,
2015 | | | Year Ended
Dec. 31,
2014 | | | Year Ended
Dec. 31,
2013 | |
| Per Share Data | | | | | | | | | | | | | | | | | | | | |
| Net asset value, beginning of period | | $ | 17.26 | | | $ | 21.65 | | | $ | 22.71 | | | $ | 21.04 | | | $ | 20.31 | |
| Income (loss) from investment operations: |
| Net investment income (loss)a | | | (.10 | ) | | | (.16 | ) | | | (.30 | ) | | | (.15 | ) | | | (.33 | ) |
| Net gain (loss) on investments (realized and unrealized) | | | 1.23 | | | | (3.26 | ) | | | (.14 | ) | | | 2.10 | | | | 1.06 | |
| Total from investment operations | | | 1.13 | | | | (3.42 | ) | | | (.44 | ) | | | 1.95 | | | | .73 | |
| Less distributions from: |
| Net investment income | | | (.90 | ) | | | (.97 | ) | | | (.62 | ) | | | (.28 | ) | | | — | |
| Total distributions | | | (.90 | ) | | | (.97 | ) | | | (.62 | ) | | | (.28 | ) | | | — | |
| Net asset value, end of period | | $ | 17.49 | | | $ | 17.26 | | | $ | 21.65 | | | $ | 22.71 | | | $ | 21.04 | |
| | | | | | | | | | | | | | | | | | | | | |
| Total Returnc | | | 6.64 | % | | | (15.81 | %) | | | (1.84 | %) | | | 9.22 | % | | | 3.59 | % |
| Ratios/Supplemental Data |
| Net assets, end of period (in thousands) | | $ | 8,234 | | | $ | 11,245 | | | $ | 21,272 | | | $ | 24,066 | | | $ | 29,637 | |
| Ratios to average net assets: |
| Net investment income (loss) | | | (0.56 | %) | | | (0.81 | %) | | | (1.32 | %) | | | (0.72 | %) | | | (1.63 | %) |
| Total expensesd | | | 2.53 | % | | | 2.61 | % | | | 2.52 | % | | | 2.50 | % | | | 2.48 | % |
| Net expensese | | | 2.47 | % | | | 2.54 | % | | | 2.44 | % | | | 2.43 | % | | | 2.42 | % |
| Portfolio turnover rate | | | 68 | % | | | 16 | % | | | 24 | % | | | 83 | % | | | 102 | % |
| 24 | THE GUGGENHEIM FUNDS ANNUAL REPORT | SEE NOTES TO FINANCIAL STATEMENTS. |
| CONSOLIDATED FINANCIAL HIGHLIGHTS (continued) |
| MANAGED FUTURES STRATEGY FUND |
This table is presented to show selected data for a share outstanding throughout each period and to assist shareholders in evaluating a Fund’s performance for the periods presented.
| P-Class | | Year Ended
Dec. 31,
2017 | | | Year Ended
Dec. 31,
2016 | | | Year Ended
Dec. 31,
2015 | | | Year Ended
Dec. 31,
2014 | | | Year Ended
Dec. 31,
2013 | |
| Per Share Data | | | | | | | | | | | | | | | | | | | | |
| Net asset value, beginning of period | | $ | 18.71 | | | $ | 23.20 | | | $ | 24.11 | | | $ | 22.15 | | | $ | 21.23 | |
| Income (loss) from investment operations: |
| Net investment income (loss)a | | | .06 | | | | (.01 | ) | | | (.14 | ) | | | —b | | | | (.20 | ) |
| Net gain (loss) on investments (realized and unrealized) | | | 1.36 | | | | (3.51 | ) | | | (.15 | ) | | | 2.24 | | | | 1.12 | |
| Total from investment operations | | | 1.42 | | | | (3.52 | ) | | | (.29 | ) | | | 2.24 | | | | .92 | |
| Less distributions from: |
| Net investment income | | | (.90 | ) | | | (.97 | ) | | | (.62 | ) | | | (.28 | ) | | | — | |
| Total distributions | | | (.90 | ) | | | (.97 | ) | | | (.62 | ) | | | (.28 | ) | | | — | |
| Net asset value, end of period | | $ | 19.23 | | | $ | 18.71 | | | $ | 23.20 | | | $ | 24.11 | | | $ | 22.15 | |
| | | | | | | | | | | | | | | | | | | | | |
| Total Returnc | | | 7.68 | % | | | (15.18 | %) | | | (1.06 | %) | | | 10.06 | % | | | 4.33 | % |
| Ratios/Supplemental Data |
| Net assets, end of period (in thousands) | | $ | 21,426 | | | $ | 77,859 | | | $ | 165,086 | | | $ | 180,872 | | | $ | 191,400 | |
| Ratios to average net assets: |
| Net investment income (loss) | | | 0.29 | % | | | (0.07 | %) | | | (0.57 | %) | | | 0.01 | % | | | (0.94 | %) |
| Total expensesd | | | 1.78 | % | | | 1.87 | % | | | 1.77 | % | | | 1.75 | % | | | 1.75 | % |
| Net expensese | | | 1.72 | % | | | 1.79 | % | | | 1.69 | % | | | 1.68 | % | | | 1.68 | % |
| Portfolio turnover rate | | | 68 | % | | | 16 | % | | | 24 | % | | | 83 | % | | | 102 | % |
| SEE NOTES TO FINANCIAL STATEMENTS. | THE GUGGENHEIM FUNDS ANNUAL REPORT | 25 |
| CONSOLIDATED FINANCIAL HIGHLIGHTS (concluded) |
| MANAGED FUTURES STRATEGY FUND |
This table is presented to show selected data for a share outstanding throughout each period and to assist shareholders in evaluating a Fund’s performance for the periods presented.
| Institutional Class | | Year Ended
Dec. 31,
2017 | | | Year Ended
Dec. 31,
2016 | | | Year Ended
Dec. 31,
2015 | | | Year Ended
Dec. 31,
2014 | | | Year Ended
Dec. 31,
2013 | |
| Per Share Data | | | | | | | | | | | | | | | | | | | | |
| Net asset value, beginning of period | | $ | 19.07 | | | $ | 23.56 | | | $ | 24.41 | | | $ | 22.36 | | | $ | 21.38 | |
| Income (loss) from investment operations: |
| Net investment income (loss)a | | | .08 | | | | .04 | | | | (.08 | ) | | | .05 | | | | (.19 | ) |
| Net gain (loss) on investments (realized and unrealized) | | | 1.36 | | | | (3.56 | ) | | | (.15 | ) | | | 2.28 | | | | 1.17 | |
| Total from investment operations | | | 1.44 | | | | (3.52 | ) | | | (.23 | ) | | | 2.33 | | | | .98 | |
| Less distributions from: |
| Net investment income | | | (.90 | ) | | | (.97 | ) | | | (.62 | ) | | | (.28 | ) | | | — | |
| Total distributions | | | (.90 | ) | | | (.97 | ) | | | (.62 | ) | | | (.28 | ) | | | — | |
| Net asset value, end of period | | $ | 19.61 | | | $ | 19.07 | | | $ | 23.56 | | | $ | 24.41 | | | $ | 22.36 | |
| | | | | | | | | | | | | | | | | | | | | |
| Total Returnc | | | 7.69 | % | | | (14.95 | %) | | | (0.80 | %) | | | 10.28 | % | | | 4.63 | % |
| Ratios/Supplemental Data |
| Net assets, end of period (in thousands) | | $ | 10,339 | | | $ | 6,151 | | | $ | 9,029 | | | $ | 11,007 | | | $ | 2,464 | |
| Ratios to average net assets: |
| Net investment income (loss) | | | 0.41 | % | | | 0.20 | % | | | (0.32 | %) | | | 0.21 | % | | | (0.86 | %) |
| Total expensesd | | | 1.53 | % | | | 1.61 | % | | | 1.52 | % | | | 1.50 | % | | | 1.52 | % |
| Net expensese | | | 1.46 | % | | | 1.54 | % | | | 1.44 | % | | | 1.44 | % | | | 1.45 | % |
| Portfolio turnover rate | | | 68 | % | | | 16 | % | | | 24 | % | | | 83 | % | | | 102 | % |
| a | | Net investment income (loss) per share was computed using average shares outstanding throughout the period. |
| b | | Net investment income is less than $0.01 per share. |
| c | | Total return does not reflect the impact of any applicable sales charges. |
| d | | Does not include expenses of the underlying funds in which the Fund invests. |
| e | | Net expense information reflects the expense ratios after expense waivers. |
| 26 | THE GUGGENHEIM FUNDS ANNUAL REPORT | SEE NOTES TO FINANCIAL STATEMENTS. |
| NOTES TO CONSOLIDATED FINANCIAL STATEMENTS |
Note 1 – Organization, Consolidation of Subsidiary and Significant Accounting Policies
Organization
The Rydex Series Funds (the “Trust”), a Delaware statutory trust, is registered with the SEC under the Investment Company Act of 1940 (”1940 Act”), as an open-ended investment company of the series type. Each series, in effect, is representing a separate Fund. The Trust is authorized to issue an unlimited number of no par value shares. The Trust accounts for the assets of each fund separately.
The Trust offers a combination of seven separate classes of shares: Investor Class shares, A-Class shares, C-Class shares, H-Class shares, P-Class shares, Institutional Class shares and Money Market Class shares. Sales of shares of each Class are made without a front-end sales charge at the net asset value per share (“NAV”), with the exception of A-Class shares. A-Class shares are sold at the NAV, plus the applicable front-end sales charge. The sales charge varies depending on the amount purchased, but will not exceed 4.75%. A-Class share purchases of $1 million or more are exempt from the front-end sales charge but have a 1% contingent deferred sales charge (“CDSC”) if shares are redeemed within 12 months of purchase. C-Class shares have a 1% CDSC if shares are redeemed within 12 months of purchase. Institutional Class shares are offered primarily for direct investment by institutions such as pension and profit sharing plans, endowments, foundations and corporations. Institutional Class shares require a minimum initial investment of $2 million and a minimum account balance of $1 million. At December 31, 2017, the Trust consisted of fifty-three funds (the “Funds”).
This report covers the Managed Futures Strategy Fund (the “Fund”), a non-diversified investment company. Only A-Class, C-Class, P-Class and Institutional Class shares had been issued by the Fund.
Security Investors, LLC, which operates under the name Guggenheim Investments (“GI”), provides advisory services. Guggenheim Funds Distributors, LLC (“GFD”) acts as principal underwriter for the Trust. GI and GFD are affiliated entities.
Consolidation of Subsidiary
The consolidated financial statements of the Fund include the accounts of a wholly-owned and controlled Cayman Islands subsidiary (the “Subsidiary”). Significant inter-company accounts and transactions have been eliminated in consolidation for the Fund.
The Fund may invest up to 25% of its total assets in its Subsidiary which acts as an investment vehicle in order to effect certain investments consistent with the Fund’s investment objectives and policies.
A summary of the Fund’s investment in its Subsidiary is as follows:
| Fund | | Inception
Date of
Subsidiary | | Subsidiary
Net Assets at
December 31, 2017 | | | % of Net Assets
of the Fund at
December 31, 2017 | |
| Managed Futures Strategy Fund | | 05/01/08 | | $ | 4,196,599 | | | | 8.3 | % |
| | THE GUGGENHEIM FUNDS ANNUAL REPORT | 27 |
| NOTES TO CONSOLIDATED FINANCIAL STATEMENTS (continued) |
Significant Accounting Policies
The Fund operates as an investment company and, accordingly, follows the investment company accounting and reporting guidance of the Financial Accounting Standards Board (“FASB”) Accounting Standards Codification Topic 946 Financial Services – Investment Companies.
The following significant accounting policies are in conformity with U.S. generally accepted accounting principles (“U.S. GAAP”) and are consistently followed by the Trust. This requires management to make estimates and assumptions that affect the reported amount of assets and liabilities, contingent assets and liabilities at the date of the financial statements, and the reported amounts of revenues and expenses during the reporting period. Actual results could differ from these estimates. All time references are based on Eastern Time.
The NAV of each Class of a fund is calculated by dividing the market value of the fund’s securities and other assets, less all liabilities, attributable to the Class by the number of outstanding shares of the Class.
(a) Valuation of Investments
The Board of Trustees of the Fund (the “Board”) has adopted policies and procedures for the valuation of the Fund’s investments (the “Valuation Procedures”). Pursuant to the Valuation Procedures, the Board has delegated to a valuation committee, consisting of representatives from Guggenheim’s investment management, fund administration, legal and compliance departments (the “Valuation Committee”), the day-to-day responsibility for implementing the Valuation Procedures, including, under most circumstances, the responsibility for determining the fair value of the Fund’s securities and/or other assets.
Valuations of the Fund’s securities are supplied primarily by pricing services appointed pursuant to the processes set forth in the Valuation Procedures. The Valuation Committee convenes monthly, or more frequently as needed, to review the valuation of all assets which have been fair valued for reasonableness. The Fund’s officers, through the Valuation Committee and consistent with the monitoring and review responsibilities set forth in the Valuation Procedures, regularly review procedures used and valuations provided by the pricing services.
If the pricing service cannot or does not provide a valuation for a particular investment or such valuation is deemed unreliable, such investment is fair valued by the Valuation Committee.
Open-end investment companies (“mutual funds”) are valued at their NAV as of the close of business, on the valuation date. Exchange-traded funds (“ETFs”) are valued at the last quoted sales price.
U.S. Government securities are valued by either independent pricing services, the last traded fill price, or at the reported bid price at the close of business.
| 28 | THE GUGGENHEIM FUNDS ANNUAL REPORT | |
| NOTES TO CONSOLIDATED FINANCIAL STATEMENTS (continued) |
Debt securities with a maturity of greater than 60 days at acquisition are valued at prices that reflect broker-dealer supplied valuations or are obtained from independent pricing services, which may consider the trade activity, treasury spreads, yields or price of bonds of comparable quality, coupon, maturity, and type, as well as prices quoted by dealers who make markets in such securities. Short-term debt securities with a maturity of 60 days or less at acquisition are valued at amortized cost, provided such amount approximates market value. Money market funds are valued at net asset value.
Repurchase agreements are valued at amortized cost, provided such amounts approximate market value.
The value of futures contracts is accounted for using the unrealized gain or loss on the contracts that is determined by marking the contracts to their current realized settlement prices. Financial futures contracts are valued at the 4:00 p.m. price on the valuation date. In the event that the exchange for a specific futures contract closes earlier than 4:00 p.m., the futures contract is valued at the Official Settlement Price of the exchange. However, the underlying securities from which the futures contract value is derived are monitored until 4:00 p.m. to determine if fair valuation would provide a more accurate valuation.
Investments for which market quotations are not readily available are fair-valued as determined in good faith by GI, under the direction of the Board, using methods established or ratified by the Board. Valuations in accordance with these methods are intended to reflect each security’s (or asset’s) “fair value”. Each such determination is based on a consideration of all relevant factors, which are likely to vary from one pricing context to another. Examples of such factors may include, but are not limited to market prices; sale prices; broker quotes; and models which derive prices based on inputs such as prices of securities with comparable maturities and characteristics, or based on inputs such as anticipated cash flows or collateral, spread over Treasuries, and other information analysis.
In connection with futures contracts and other derivative investments, such factors may include obtaining information as to how (a) these contracts and other derivative investments trade in the futures or other derivative markets, respectively, and (b) the securities underlying these contracts and other derivative investments trade in the cash market.
(b) U.S. Government and Agency Obligations
Certain U.S. Government and Agency Obligations are traded on a discount basis; the interest rates shown on the Schedule of Investments reflect the effective rates paid at the time of purchase by the Fund. Other securities bear interest at the rates shown, payable at fixed dates through maturity.
| | THE GUGGENHEIM FUNDS ANNUAL REPORT | 29 |
| NOTES TO CONSOLIDATED FINANCIAL STATEMENTS (continued) |
(c) Futures Contracts
Upon entering into a futures contract, the Fund deposits and maintains as collateral such initial margin as required by the exchange on which the transaction is affected. Pursuant to the contract, the Fund agrees to receive from or pay to the broker an amount of cash equal to the daily fluctuation in value of the contract. Such receipts or payments are known as variation margin and are recorded by the Fund as unrealized gains or losses. When the contract is closed, the Fund records a realized gain or loss equal to the difference between the value of the contract at the time it was opened and the value at the time it was closed.
(d) Currency Translations
The accounting records of the Fund are maintained in U.S. dollars. All assets and liabilities initially expressed in foreign currencies are converted into U.S. dollars at prevailing exchange rates. Purchases and sales of investment securities, dividend and interest income, and certain expenses are translated at the rates of exchange prevailing on the respective dates of such transactions.
Changes in the relationship of these foreign currencies to the U.S. dollar can significantly affect the value of the investments and earnings of the Fund. Foreign investments may also subject the Fund to foreign government exchange restrictions, expropriation, taxation, or other political, social or economic developments, all of which could affect the market and/or credit risk of the investments.
The Fund does not isolate that portion of the results of operations resulting from changes in the foreign exchange rates on investments from the fluctuations arising from changes in the market prices of securities held. Such fluctuations are included with the net realized and unrealized gain or loss on investments.
Reported net realized foreign exchange gains and losses arise from sales of foreign currencies and currency gains or losses realized between the trade and settlement dates on investment transactions. Net unrealized exchange gains and losses arise from changes in the fair values of assets and liabilities other than investments in securities at the fiscal period end, resulting from changes in exchange rates.
(e) Security Transactions
Security transactions are recorded on the trade date for financial reporting purposes. Realized gains and losses from securities transactions are recorded using the identified cost basis. Proceeds from lawsuits related to investment holdings are recorded as realized gains in the Fund. Dividend income is recorded on the ex-dividend date, net of applicable taxes withheld by foreign countries. Taxable non-cash dividends are recorded as dividend income. Interest income, including amortization of premiums and accretion of discounts, is accrued on a daily basis. Amendment fees are earned as compensation for evaluating and accepting changes to the original loan agreement and are recognized when received.
| 30 | THE GUGGENHEIM FUNDS ANNUAL REPORT | |
| NOTES TO CONSOLIDATED FINANCIAL STATEMENTS (continued) |
(f) Distributions
Distributions of net investment income and net realized gains, if any, are declared and paid at least annually. Dividends are reinvested in additional shares unless shareholders request payment in cash. Distributions are recorded on the ex-dividend date and are determined in accordance with income tax regulations which may differ from U.S. GAAP.
(g) Class Allocations
Interest and dividend income, most expenses, all realized gains and losses, and all unrealized gains and losses are allocated to the classes based upon the value of the outstanding shares in each Class. Certain costs, such as distribution and service fees are charged directly to specific classes. In addition, certain expenses have been allocated to the individual Funds in the Trust on a pro rata basis upon the respective aggregate net assets of each Fund included in the Trust.
(h) Cash
The Fund may leave cash overnight in its cash account with the custodian. Periodically, the Fund may have cash due to the custodian bank as an overdraft balance. A fee is incurred on this overdraft, calculated by multiplying the overdraft by a rate based on the federal funds rate, which was 1.33% at December 31, 2017.
(i) Indemnifications
Under the Fund’s organizational documents, its Trustees and Officers are indemnified against certain liabilities arising out of the performance of their duties to the Trust. In addition, throughout the normal course of business, the Fund enters into contracts that contain a variety of representations and warranties which provide general indemnifications. The Fund’s maximum exposure under these arrangements is unknown, as this would involve future claims that may be made against the Fund and/or its affiliates that have not yet occurred. However, based on experience, the Fund expects the risk of loss to be remote.
Note 2 – Financial Instruments and Derivatives
As part of its investment strategy, the Fund utilizes a variety of derivative instruments. These investments involve, to varying degrees, elements of market risk and risks in excess of the amounts recognized in the Consolidated Statement of Assets and Liabilities. Valuation and accounting treatment of these instruments can be found under Significant Accounting Policies in Note 1 of these Notes to Consolidated Financial Statements.
Derivatives
Derivatives are instruments whose values depend on, or are derived from, in whole or in part, the value of one or more other assets, such as securities, currencies, commodities or indices. Derivative instruments may be used to increase investment flexibility (including to maintain cash reserves while maintaining exposure to certain other assets), for risk management (hedging) purposes, to facilitate trading, to reduce transaction costs and to pursue higher investment
| | THE GUGGENHEIM FUNDS ANNUAL REPORT | 31 |
| NOTES TO CONSOLIDATED FINANCIAL STATEMENTS (continued) |
returns. Derivative instruments may also be used to mitigate certain investment risks, such as foreign currency exchange rate risk, interest rate risk and credit risk. U.S. GAAP requires disclosures to enable investors to better understand how and why the Fund uses derivative instruments, how these derivative instruments are accounted for and their effects on the Fund’s financial position and results of operations.
The Fund utilized derivatives for the following purposes:
Hedge: an investment made in order to reduce the risk of adverse price movements in a security, by taking an offsetting position to protect against broad market moves.
Leverage: gaining total exposure to equities or other assets on the long and short sides at greater than 100% of invested capital.
Liquidity: the ability to buy or sell exposure with little price/market impact.
Speculation: the use of an instrument to express macro-economic and other investment views.
For any Fund whose investment strategy consistently involves applying leverage, the value of the Fund’s shares will tend to increase or decrease more than the value of any increase or decrease in the underlying index or other asset. In addition, because an investment in derivative instruments generally requires a small investment relative to the amount of investment exposure assumed, an opportunity for increased net income is created; but, at the same time, leverage risk will increase. The Fund’s use of leverage, through borrowings or instruments such as derivatives, may cause the Fund to be more volatile and riskier than if they had not been leveraged.
Futures
A futures contract is an agreement to purchase (long) or sell (short) an agreed amount of securities or other instruments at a set price for delivery at a future date. There are significant risks associated with a Fund’s use of futures contracts, including (i) there may be an imperfect or no correlation between the changes in market value of the underlying asset and the prices of futures contracts; (ii) there may not be a liquid secondary market for a futures contract; (iii) trading restrictions or limitations may be imposed by an exchange; and (iv) government regulations may restrict trading in futures contracts. When investing in futures, there is minimal counterparty credit risk to a Fund because futures are exchange-traded and the exchange’s clearinghouse, as counterparty to all exchange-traded futures, guarantees against default. Cash deposits are shown as segregated cash with broker on the Consolidated Statement of Assets and Liabilities; securities held as collateral are noted on the Consolidated Schedule of Investments.
The following table represents the Fund’s use and volume of futures on a quarterly basis:
| | | | | Average Notional Amount | |
| Fund | | Use | | Long | | | Short | |
| Managed Futures Strategy Fund | | Hedge, Leverage, Liquidity, Speculation | | $ | 206,984,978 | | | $ | 127,958,514 | |
| 32 | THE GUGGENHEIM FUNDS ANNUAL REPORT | |
| NOTES TO CONSOLIDATED FINANCIAL STATEMENTS (continued) |
Derivative Investment Holdings Categorized by Risk Exposure
The following is a summary of the location of derivative investments on the Fund’s Consolidated Statement of Assets and Liabilities as of December 31, 2017:
| Derivative Investment Type | Asset Derivatives | Liability Derivatives |
| Equity/Interest Rate/Currency/Commodity contracts | Variation margin | Variation margin |
The following table sets forth the fair value of the Fund’s derivative investments categorized by primary risk exposure at December 31, 2017:
| Fund | | Futures
Equity
Risk* | | | Futures Currency
Risk* | | | Futures
Interest Rate
Risk* | | | Futures Commodity
Risk* | | | Total Value at
December 31,
2017 | |
| Asset Derivative Investments Value | | | | | | | | | |
| Managed Futures Strategy Fund | | $ | 526,291 | | | $ | 204,121 | | | $ | 267,419 | | | $ | 743,250 | | | $ | 1,741,081 | |
| | | | | | | | | | | | | | | | | | | | | |
| Liability Derivative Investments Value | | | | | | | | | | | | | | | | | | | | |
| Managed Futures Strategy Fund | | $ | 242,957 | | | $ | 30,207 | | | $ | 178,295 | | | $ | 225,719 | | | $ | 677,178 | |
| * | | Includes cumulative appreciation (depreciation) of futures contracts as reported on the Consolidated Schedule of Investments. Only current day’s variation margin is reported within the Consolidated Statement of Assets and Liabilities. |
| Derivative Investment Type | Location of Gain (Loss) on Derivatives |
| Equity/Interest Rate/Currency/Commodity contracts | Net realized gain (loss) on futures contracts |
| | Net change in unrealized appreciation (depreciation) on futures contracts |
The following is a summary of the Fund’s realized gain (loss) and change in unrealized appreciation (depreciation) on derivative investments recognized on the Consolidated Statement of Operations categorized by primary risk exposure for the year ended December 31, 2017:
| Realized Gain (Loss) on Derivative Investments Recognized on the Consolidated Statement of Operations |
| Fund | | Futures
Equity
Risk | | | Futures
Currency
Risk | | | Futures
Interest Rate
Risk | | | Futures
Commodity
Risk | | | Total | |
| Managed Futures Strategy Fund | | $ | 10,161,598 | | | $ | (580,990 | ) | | $ | (479,667 | ) | | $ | (3,225,820 | ) | | $ | 5,875,121 | |
| | THE GUGGENHEIM FUNDS ANNUAL REPORT | 33 |
| NOTES TO CONSOLIDATED FINANCIAL STATEMENTS (continued) |
Change in Unrealized Appreciation (Depreciation) on Derivative
Investments Recognized on the Consolidated Statement of Operations |
| Fund | | Futures
Equity
Risk | | | Futures
Currency
Risk | | | Futures
Interest Rate
Risk | | | Futures
Commodity
Risk | | | Total | |
| Managed Futures Strategy Fund | | $ | (457,300 | ) | | $ | (341,423 | ) | | $ | (1,541,090 | ) | | $ | 487,086 | | | $ | (1,852,727 | ) |
In conjunction with the use of derivative instruments, the Fund is required to maintain collateral in various forms. The Fund uses, where appropriate, depending on the financial instrument utilized and the broker involved, margin deposits at the broker, cash and/or securities segregated at the custodian bank, discount notes or the repurchase agreements allocated to the Fund.
The Trust has established counterparty credit guidelines and enters into transactions only with financial institutions of investment grade or better. The Trust monitors the counterparty credit risk.
Note 3 – Offsetting
In the normal course of business, the Fund enters into transactions subject to enforceable master netting arrangements or other similar arrangements. Generally, the right to offset in those agreements allows the Fund to counteract the exposure to a specific counterparty with collateral received from or delivered to that counterparty based on the terms of the arrangements. These arrangements provide for the right to liquidate upon the occurrence of an event of default, credit event upon merger or additional termination event.
In order to better define their contractual rights and to secure rights that will help the Fund mitigate their counterparty risk, the Fund may enter into an International Swaps and Derivatives Association, Inc. Master Agreement (“ISDA Master Agreement”) or similar agreement with its derivative contract counterparties. An ISDA Master Agreement is a bilateral agreement between a Fund and a counterparty that governs OTC derivatives, including foreign exchange contracts, and typically contains, among other things, collateral posting terms and netting provisions in the event of a default and/or termination event. The provisions of the ISDA Master Agreement typically permit a single net payment in the event of a default (close-out netting) or similar event, including the bankruptcy or insolvency of the counterparty.
For derivatives traded under an ISDA Master Agreement, the collateral requirements are typically calculated by netting the mark-to-market amount for each transaction under such agreement and comparing that amount to the value of any collateral currently pledged by the Fund and the counterparty. For financial reporting purposes, cash collateral that has been pledged to cover obligations of the Fund and cash collateral received from the counterparty, if any, are reported separately on the Consolidated Statement of Assets and Liabilities as segregated cash with broker/receivable for variation margin, or payable for swap settlement/variation margin. Generally, the amount of collateral due from or to a counterparty must exceed a minimum transfer
| 34 | THE GUGGENHEIM FUNDS ANNUAL REPORT | |
| NOTES TO CONSOLIDATED FINANCIAL STATEMENTS (continued) |
amount threshold (e.g., $300,000) before a transfer is required to be made. To the extent amounts due to the Fund from its counterparties are not fully collateralized, contractually or otherwise, the Fund bear the risk of loss from counterparty nonperformance. The Fund attempts to mitigate counterparty risk by only entering into agreements with counterparties that they believe to be of good standing and by monitoring the financial stability of those counterparties.
For financial reporting purposes, the Fund does not offset derivative assets and derivative liabilities that are subject to netting arrangements in the Consolidated Statement of Assets and Liabilities.
Futures are excluded from these reported amounts.
The following table presents deposits held by others in connection with derivative investments as of December 31, 2017. The derivatives tables following the Consolidated Schedule of Investments list each counterparty for which cash collateral may have been pledged or received at period end. The Fund has the right to offset these deposits against any related liabilities outstanding with each counterparty.
| Fund | | Counterparty | | Asset Type | | Cash Pledged | | | Cash Received | |
| Managed Futures Strategy Fund | | Goldman Sachs Group | | Futures contracts | | $ | 1,755,460 | | | $ | — | |
Note 4 – Fair Value Measurement
In accordance with U.S. GAAP, fair value is defined as the price that the Fund would receive to sell an investment or pay to transfer a liability in an orderly transaction with an independent buyer in the principal market, or in the absence of a principal market, the most advantageous market for the investment or liability. U.S. GAAP establishes a three-tier fair value hierarchy based on the types of inputs used to value assets and liabilities and requires corresponding disclosure. The hierarchy and the corresponding inputs are summarized below:
| Level 1 | —quoted prices in active markets for identical assets or liabilities. |
| Level 2 | —significant other observable inputs (for example quoted prices for securities that are similar based on characteristics such as interest rates, prepayment speeds, credit risk, etc.). |
| Level 3 | —significant unobservable inputs based on the best information available under the circumstances, to the extent observable inputs are not available, which may include assumptions. |
The types of inputs available depend on a variety of factors, such as the type of security and the characteristics of the markets in which it trades, if any. Fair valuation determinations that rely on fewer or no observable inputs require greater judgment. Accordingly, fair value determinations for Level 3 securities require the greatest amount of judgment.
The inputs or methodologies used for valuing securities are not necessarily an indication of the risk associated with investing in those securities. The suitability of the techniques and sources employed to determine fair valuation are regularly monitored and subject to change.
| | THE GUGGENHEIM FUNDS ANNUAL REPORT | 35 |
| NOTES TO CONSOLIDATED FINANCIAL STATEMENTS (continued) |
Note 5 – Investment Advisory Agreement and Other Agreements
Under the terms of an investment advisory contract, the Fund pays GI investment advisory fees calculated at an annualized rate of 0.90% of the average daily net assets of the Fund.
GI has contractually agreed to waive the management fee it receives from the Subsidiary in an amount equal to the management fee paid to GI by the Subsidiary. This undertaking will continue in effect for so long as the Fund invests in the Subsidiary, and may not be terminated by GI unless GI obtains the prior approval of the Fund’s Board of Trustees for such termination. For the period ended December 31, 2017, Managed Future Strategy Fund waived $32,605 related to investments in the Subsidiary.
GI engages external service providers to perform other necessary services for the Trust, such as audit and accounting related services, legal services, custody, printing and mailing, etc., on a pass-through basis. Such expenses are allocated to various Funds within the complex based on relative net assets.
The Trust has adopted a Distribution Plan applicable to A-Class and P-Class shares for which GFD and other firms that provide distribution and/or shareholder services (“Service Providers”) may receive compensation. If a Service Provider provides distribution services, the Fund will pay distribution fees to GFD at an annual rate not to exceed 0.25% of average daily net assets, pursuant to Rule 12b-1 of the 1940 Act. GFD, in turn, will pay the Service Providers out of its fees. GFD may, at its discretion, retain a portion of such payments to compensate itself for distribution services.
The Trust has adopted a separate Distribution and Shareholder Services Plan applicable to its C-Class shares that allows the Fund to pay annual distribution and service fees of 1.00% of the Fund’s C-Class shares average daily net assets. The annual 0.25% service fee compensates a shareholder’s financial adviser for providing ongoing services to the shareholder. The annual distribution fee of 0.75% reimburses GFD for paying the shareholder’s financial adviser an ongoing sales commission. GFD advances the first year’s service and distribution fees to the financial adviser. GFD retains the service and distribution fees on accounts with no authorized dealer of record.
If the Fund invests in an affiliated fund, the investing Fund’s adviser has agreed to waive fees at the investing fund level. Fee waivers will be calculated at the investing Fund level without regard to any expense cap, if any, in effect for the investing Fund. Fees waived under this arrangement are not subject to reimbursement to GI. For the year ended December 31, 2017, the Fund waived $10,867 related to investments in affiliated funds.
For the year ended December 31, 2017, GFD retained sales charges of $186,037 relating to sales of A-Class shares of the Trust.
Certain officers of the Trust are also officers of GI and GFD.
| 36 | THE GUGGENHEIM FUNDS ANNUAL REPORT | |
| NOTES TO CONSOLIDATED FINANCIAL STATEMENTS (continued) |
MUFG Investor Services (US), LLC (“MUIS”) acts as the Fund’s administrator, transfer agent and accounting agent. As administrator, transfer agent and accounting agent, MUIS is responsible for maintaining the books and records of the Fund’s securities and cash. The U.S Bank, N.A. (“U.S. Bank”) acts as the Fund’s custodian. As custodian, U.S. Bank is responsible for the custody of the Fund’s assets. For providing the aforementioned services, MUIS and U.S. Bank are entitled to receive a monthly fee equal to an annual percentage of the Fund’s average daily net assets subject to certain minimum monthly fees and out of pocket expenses.
Note 6 – Repurchase Agreements
The Funds transfer uninvested cash balances into a single joint account, the daily aggregate balance of which is invested in one or more repurchase agreements collateralized by obligations of the U.S. Treasury and U.S. government agencies. The joint account includes other Funds in the Guggenheim complex not covered in this report. The collateral is in the possession of the Funds’ custodian and is evaluated to ensure that its market value exceeds, at a minimum, 102% of the original face amount of the repurchase agreements. Each Fund holds a pro rata share of the collateral based on the dollar amount of the repurchase agreement entered into by each Fund.
At December 31, 2017, the repurchase agreements in the joint account were as follows:
Counterparty and
Terms of Agreement | | Face
Value | | | Repurchase Price | | | Collateral | | Par
Value | | | Fair
Value | |
| JP Morgan Chase & Co. | | | | | | | | U.S. Treasury Notes | | | | | | |
| 1.41% | | | | | | | | 1.38% - 2.75% | | | | | | |
| Due 01/02/18 | | $ | 118,247,885 | | | $ | 118,261,779 | | | 04/15/20 - 08/15/26 | | $ | 119,039,900 | | | $ | 120,612,516 | |
| | | | | | | | | | | U.S. TIP Notes | | | | | | | | |
| | | | | | | | | | | 1.13% -3.88% | | | | | | | | |
| | | | | | | | | | | 01/15/21 - 04/15/29 | | | 200 | | | | 323 | |
| | | | | | | | | | | U.S. Treasury Bond | | | | | | | | |
| | | | | | | | | | | 2.50% | | | | | | | | |
| | | | | | | | | | | 02/15/45 | | | 100 | | | | 96 | |
| | | | | | | | | | | | | | | | | $ | 120,612,935 | |
| | | | | | | | | | | | | | | | | | | |
| Bank of America Merrill Lynch | | | | | | | | | | U.S. Treasury Bond | | | | | | | | |
| 1.40% | | | | | | | | | | 4.25% | | | | | | | | |
| Due 01/02/18 | | $ | 63,109,244 | | | $ | 63,116,607 | | | 11/15/40 | | $ | 37,050,000 | | | $ | 47,126,331 | |
| | | | | | | | | | | U.S. Treasury Note | | | | | | | | |
| | | | | | | | | | | 1.25% | | | | | | | | |
| | | | | | | | | | | 07/31/23 | | | 18,126,500 | | | | 17,245,173 | |
| | | | | | | | | | | | | | | | | $ | 64,371,504 | |
In the event of counterparty default, the Funds have the right to collect the collateral to offset losses incurred. There is potential loss to the Funds in the event the Funds are delayed or prevented from exercising their rights to dispose of the collateral securities, including the risk of a possible decline in the value of the underlying securities during the period while the Funds seek
| | THE GUGGENHEIM FUNDS ANNUAL REPORT | 37 |
| NOTES TO CONSOLIDATED FINANCIAL STATEMENTS (continued) |
to assert their rights. The Funds’ investment adviser, acting under the supervision of the Board, reviews the value of the collateral and the creditworthiness of those banks and dealers with which the Funds enter into repurchase agreements to evaluate potential risks.
Note 7 – Portfolio Securities Loaned
The Fund may lend its securities to approved brokers to earn additional income. Security lending income shown on the Consolidated Statement of Operations is shown net of rebates paid to the borrowers and earnings on cash collateral investments shared with the lending agent. Within this arrangement, the Fund act as the lender, U.S. Bank acts as the lending agent, and other approved registered broker dealers act as the borrowers. The Fund receives cash collateral, valued at 102% of the value of the securities on loan. Under the terms of the Fund’s securities lending agreement with U.S. Bank, cash collateral and proceeds are invested in the First American Government Obligations Fund - Class Z. The Fund bears the risk of loss on cash collateral investments. Collateral is maintained over the life of the loan in an amount not less than the value of loaned securities, as determined at the close of fund business each day; any additional collateral required due to changes in security values is delivered to the Fund the next business day. Although the collateral mitigates the risk, the Fund could experience a delay in recovering its securities and a possible loss of income or value if the borrower fails to return the securities. The Fund has the right under the securities lending agreement to recover the securities from the borrower on demand. Securities lending transactions are accounted for as secured borrowings. The remaining contractual maturity of the securities lending agreement is overnight and continuous.
At December 31, 2017, the Fund participated in securities lending transactions, which are subject to enforceable netting arrangements, as follows:
| | | Gross Amounts Not Offset in the Consolidated Statement of Assets and Liabilities | | | Securities Lending Collateral |
| Fund | | Value of Securities Loaned | | | Collateral Received(a) | | | Net Amount | | | Cash
Collateral Invested | | Cash
Collateral Uninvested | | | Total
Collateral | |
| Managed Futures Strategy Fund | | $ | 2,090,838 | | | $ | (2,090,838 | ) | | $ | — | | | $2,141,225 | | $ | — | | | $ | 2,141,225 | |
| (a) | | Actual collateral received by the Fund is greater that the amount shown due to overcollateralization. |
In the event of counterparty default, the Fund has the right to collect the collateral to offset losses incurred. There is potential loss to the Fund in the event the Fund is delayed or prevented from exercising its right to dispose of the collateral securities, including the risk of a possible decline in the value of the underlying securities during the period while the Fund seeks to assert its rights. GI, acting under the supervision of the Board, reviews the value of the collateral and the creditworthiness of those banks and dealers to evaluate potential risks.
| 38 | THE GUGGENHEIM FUNDS ANNUAL REPORT | |
| NOTES TO CONSOLIDATED FINANCIAL STATEMENTS (continued) |
Note 8 – Federal Income Tax Information
The Fund intends to comply with the provisions of Subchapter M of the Internal Revenue Code applicable to regulated investment companies and will distribute substantially all taxable net investment income and capital gains sufficient to relieve the Fund from all, or substantially all, federal income, excise and state income taxes. Therefore, no provision for federal or state income tax or federal excise tax is required.
Tax positions taken or expected to be taken in the course of preparing the Fund’s tax returns are evaluated to determine whether the tax positions are “more-likely-than-not” of being sustained by the applicable tax authority. Tax positions not deemed to meet the more-likely-than-not threshold would be recorded as a tax benefit or expense in the current year. Management has analyzed the Fund’s tax positions taken, or to be taken, on federal income tax returns for all open tax years, and has concluded that no provision for income tax is required in the Fund’s financial statements. The Fund’s federal tax returns are subject to examination by the Internal Revenue Service for a period of three years after they are filed.
The Fund intends to invest up to 25% of its assets in the Subsidiary which is expected to provide the Fund with exposure to the commodities markets within the limitations of the federal tax requirements under Subchapter M of the Internal Revenue Code. The Fund has received a private letter ruling from the Internal Revenue Service that concludes that the income the Fund receives from the Subsidiary will constitute qualifying income for purposes of Subchapter M of the Internal Revenue Code. The Subsidiary will be classified as a corporation for U.S. federal income tax purposes. A foreign corporation, such as the Subsidiary, will generally not be subject to U.S. federal income taxation unless it is deemed to be engaged in a U.S. trade or business.
The tax character of distributions paid during the year ended December 31, 2017 was as follows:
| Fund | | Ordinary
Income | | | Long-Term
Capital Gain | | | Total
Distributions | |
| Managed Futures Strategy Fund | | $ | 2,337,237 | | | $ | — | | | $ | 2,337,237 | |
The tax character of distributions paid during the year ended December 31, 2016 was as follows:
| Fund | | Ordinary
Income | | | Long-Term
Capital Gain | | | Total
Distributions | |
| Managed Futures Strategy Fund | | $ | 6,142,508 | | | $ | — | | | $ | 6,142,508 | |
Note: For federal income tax purposes, short-term capital gain distributions are treated as ordinary income distributions.
| | THE GUGGENHEIM FUNDS ANNUAL REPORT | 39 |
| NOTES TO CONSOLIDATED FINANCIAL STATEMENTS (continued) |
The tax components of accumulated earnings/(deficit) as of December 31, 2017 were as follows:
| Fund | | Undistributed
Ordinary
Income | | | Undistributed
Long-Term
Capital Gain | | | Net Unrealized
Appreciation
(Depreciation) | | | Accumulated
Capital and
Other Losses | | | Total | |
| Managed Futures Strategy Fund | | $ | — | | | $ | — | | | $ | (17,364,038 | ) | | $ | (70,203,707 | ) | | $ | (87,567,745 | ) |
For Federal income tax purposes, capital loss carryforwards represent realized losses of the Fund that may be carried forward and applied against future capital gains. For taxable years beginning on or before December 22, 2010, such capital losses may be carried forward for a maximum of eight years. Under the RIC Modernization Act of 2010, the Fund is permitted to carry forward capital losses incurred in taxable years beginning after December 22, 2010 for an unlimited period. However, any losses incurred during those taxable years must be utilized prior to the losses incurred in pre-enactment taxable years. As a result of this ordering rule, pre-enactment capital loss carryforwards may be more likely to expire unused. Additionally, post-enactment capital losses that are carried forward will retain their character as either short-term or long-term capital losses rather than being considered all short-term as under previous law. As of December 31, 2017, capital loss carryforwards for the Fund were as follows:
| | | | | | Unlimited | | | | |
| Fund | | Expires in
2018 | | | Short-Term | | | Long-Term | | | Total
Capital Loss
Carryforward | |
| Managed Futures Strategy Fund | | $ | (42,873,423 | ) | | $ | (4,101,156 | ) | | $ | (23,229,128 | ) | | $ | (70,203,707 | ) |
For the year ended December 31, 2017, the following capital loss carryforward amounts expired or were utilized:
| Fund | | Expired | | | Utilized | | | Total | |
| Managed Futures Strategy Fund | | $ | 9,859,364 | | | $ | 9,348,010 | | | $ | 19,207,374 | |
Net investment income and net realized gains (losses) may differ for financial statement and tax purposes because of temporary or permanent book/tax differences. These differences are primarily due to investment in the subsidiary, foreign currency gains and losses, the “mark-to-market” of certain derivatives, losses deferred due to wash sales, and distributions in connection with redemption of fund shares. Additional differences may result from the tax treatment of net investment losses and the expiration of capital loss carryforward amounts. To the extent these differences are permanent, reclassifications are made to the appropriate capital accounts in the period that the differences arise. These reclassifications have no effect on net assets or NAV per share.
| 40 | THE GUGGENHEIM FUNDS ANNUAL REPORT | |
| NOTES TO CONSOLIDATED FINANCIAL STATEMENTS (continued) |
The following adjustments were made on the Consolidated Statement of Assets and Liabilities as of December 31, 2017 for permanent book/tax differences:
| Fund | | Paid In
Capital | | | Undistributed
Net Investment
Income/(Loss) | | | Accumulated
Net Realized
Gain/(Loss) | |
| Managed Futures Strategy Fund | | $ | (13,623,658 | ) | | $ | (127,216 | ) | | $ | 13,750,874 | |
At December 31, 2017, the cost of securities for Federal income tax purposes, the aggregate gross unrealized gain for all securities for which there was an excess of value over tax cost and the aggregate gross unrealized loss for all securities for which there was an excess of tax cost over value, were as follows:
| Fund | | Tax
Cost | | | Tax
Unrealized
Gain | | | Tax
Unrealized
Loss | | | Net
Unrealized
Loss | |
| Managed Futures Strategy Fund | | $ | 67,529,460 | | | $ | — | | | $ | (17,363,774 | ) | | $ | (17,363,774 | ) |
Note 9 – Securities Transactions
For the year ended December 31, 2017, the cost of purchases and proceeds from sales of investment securities, excluding government securities, short-term investments and derivatives, was as follows:
| Fund | | Purchases | | | Sales | |
| Managed Futures Strategy Fund | | $ | 36,171,931 | | | $ | 82,950,000 | |
Note 10 – Line of Credit
The Trust, along with other affiliated trusts, secured an uncommitted $75,000,000 line of credit from U.S. Bank, N.A., which expires June 11, 2018. This line of credit is reserved for emergency or temporary purposes. Borrowings, if any, under this arrangement bear interest equal to the Prime Rate, minus 2%, which shall be paid monthly, averaging 2.09% for the year ended December 31, 2017. The Fund did not have any borrowings outstanding under this agreement at December 31, 2017.
The average daily balance borrowed for the period ended December 31, 2017, was as follows:
| Fund | | Average Daily Balance | |
| Managed Futures Strategy Fund | | $ | 841 | |
| | THE GUGGENHEIM FUNDS ANNUAL REPORT | 41 |
| NOTES TO CONSOLIDATED FINANCIAL STATEMENTS (continued) |
Note 11 – Legal Proceedings
Tribune Company
Rydex Series Funds has been named as a defendant and a putative member of the proposed defendant class of shareholders in the case entitled Kirschner v. FitzSimons, No. 12-2652 (S.D.N.Y.) (formerly Official Committee of Unsecured Creditors of Tribune Co. v. FitzSimons, Adv. Pro. No. 10-54010 (Bankr. D. Del.)) (the “FitzSimons action”), as a result of ownership by certain series of the Rydex Series Funds of shares in the Tribune Company (“Tribune”) in 2007, when Tribune effected a leveraged buyout transaction (“LBO”) by which Tribune converted to a privately-held company. In his complaint, the plaintiff has alleged that, in connection with the LBO, Tribune insiders and shareholders were overpaid for their Tribune stock using financing that the insiders knew would, and ultimately did, leave Tribune insolvent. The plaintiff has asserted claims against certain insiders, major shareholders, professional advisers, and others involved in the LBO. The plaintiff is also attempting to obtain from former Tribune shareholders, including the Rydex Series Funds, the proceeds they received in connection with the LBO.
In June 2011, a group of Tribune creditors filed multiple actions against former Tribune shareholders involving state law constructive fraudulent conveyance claims arising out of the 2007 LBO (the “SLCFC actions”). Rydex Series Funds has been named as a defendant in one or more of these suits. In those actions, the creditors seek to recover from Tribune’s former shareholders the proceeds received in connection with the 2007 LBO.
The FitzSimons action and the SLCFC actions have been consolidated with the majority of the other Tribune LBO-related lawsuits in a multidistrict litigation proceeding captioned In re Tribune Company Fraudulent Conveyance Litig., No. 11-md-2696 (S.D.N.Y.) (the “MDL Proceeding”).
On September 23, 2013, the District Court granted the defendants’ omnibus motion to dismiss the SLCFC actions, on the basis that the creditors lacked standing. On September 30, 2013, the creditors filed a notice of appeal of the September 23 order. On October 28, 2013, the defendants filed a joint notice of cross-appeal of that same order.
On March 29, 2016, the U.S. Court of Appeals for the Second Circuit issued its opinion on the appeal of the SLCFC actions. The appeals court affirmed the district court’s dismissal of those lawsuits, but on different grounds than the district court. The appeals court held that while the plaintiffs have standing under the U.S. Bankruptcy Code, their claims were preempted by Section 546(e) of the Bankruptcy Code—the statutory safe harbor for settlement payments. On April 12, 2016, the Plaintiffs in the SLCFC actions filed a petition seeking rehearing en banc before the appeals court. On July 22, 2016, the appeals court denied the petition. On September 9, 2016, the plaintiffs filed a petition for writ of certiorari in the U.S. Supreme Court challenging the Second
| 42 | THE GUGGENHEIM FUNDS ANNUAL REPORT | |
| NOTES TO CONSOLIDATED FINANCIAL STATEMENTS (continued) |
Circuit’s decision that the safe harbor of Section 546(e) applied to their claims. The shareholder defendants, including the Funds, filed a joint brief in opposition to the petition for certiorari on October 24, 2016. The Supreme Court has not yet granted or denied the petition for certiorari.
On May 23, 2014, the defendants filed motions to dismiss the FitzSimons action, including a global motion to dismiss Count I, which is the claim brought against former Tribune shareholders for intentional fraudulent conveyance under U.S. federal law. On January 6, 2017, the United States District Court for the Southern District of New York granted the shareholder defendants’ motion to dismiss the intentional fraudulent conveyance claim in the FitzSimons action. In dismissing the intentional fraudulent conveyance claim, the Court denied the plaintiff’s request to amend the complaint. The plaintiff requested that the Court direct entry of a final judgment in order to make the order immediately appealable. On February 23, 2017, the Court issued an order stating that it intends to permit an interlocutory appeal of the dismissal order, but will wait to do so until it has resolved outstanding motions to dismiss filed by other defendants. Accordingly, the timing of the appeal is uncertain.
On July 18, 2017, the plaintiff submitted a letter to the District Court seeking leave to amend its complaint to add a constructive fraudulent transfer claim. The shareholder defendants opposed that request. On August 24, 2017, the Court denied the plaintiff’s request without prejudice to renewal of the request in the event of an intervening change in the law.
None of these lawsuits alleges any wrongdoing on the part of Rydex Series Funds. The following series of Rydex Series Funds held shares of Tribune and tendered these shares as part of Tribune’s LBO: Nova Fund, S&P 500® Pure Value Fund, Multi-Cap Core Equity Fund, S&P 500® Fund, Multi-Hedge Strategies Fund and Hedged Equity Fund (the “Funds”). The value of the proceeds received by the foregoing Funds was $28,220, $109,242, $9,860, $3,400, $1,181,160, and $10,880, respectively. At this stage of the proceedings, Rydex Series Funds is not able to make a reliable predication as to the outcome of these lawsuits or the effect, if any, on a Fund’s net asset value.
Lyondell Chemical Company
In December 2011, Rydex Series Funds was named as a defendant in Weisfelner, as Trustee of the LB Creditor Trust, v. Fund 1 (In re Lyondell Chemical Co.), Adv. Pro. No. 10-4609 (Bankr. S.D.N.Y.) (the “Creditor Trust Action”). Its funds may also be putative members of the proposed defendant classes in Weisfelner, as Trustee of the LB Litigation Trust v. A. Holmes & H. Holmes TTEE (In re Lyondell Co.), Adv. Pro. No. 10-5525 (Bankr. S.D.N.Y.) (the “Litigation Trust Action”) and Weisfelner, as Trustee of the LB Creditor Trust, v. Reichman (In re Lyondell Chemical Co.), Adv. Pro. No. 12-1570 (Bankr. S.D.N.Y.) (“Reichman”).
Similar to the claims made in the Tribune matter, the Weisfelner complaints seek to have set aside and recovered as fraudulent transfers from former Lyondell Chemical Company (“Lyondell”) shareholders the consideration paid to them pursuant to the cash out merger of Lyondell shareholders in connection with the combination of Lyondell and Basell AF in 2007. Lyondell filed
| | THE GUGGENHEIM FUNDS ANNUAL REPORT | 43 |
| NOTES TO CONSOLIDATED FINANCIAL STATEMENTS (continued) |
for bankruptcy in 2008. The Creditor Trust Action and Reichman allege claims against the former Lyondell shareholders under state law for both constructive fraudulent transfer and intentional fraudulent transfer. The Litigation Trust Action alleges a claim against the former Lyondell shareholders under federal law for intentional fraudulent transfer.
On April 7, 2014, the plaintiff filed a Third Amended Complaint in the Creditor Trust Action, a Second Amended Complaint in the Litigation Trust Action, and an Amended Complaint in Reichman.
On May 8, 2014, the plaintiff in the Litigation Trust Action filed a motion to certify a defendant class generally comprised of all former Lyondell shareholders that received proceeds in exchange for their shares in the 2007 merger transaction.
On July 30, 2014, the defendants filed a motion to dismiss these lawsuits. The Bankruptcy Court held oral argument on the motion to dismiss and on the motion for class certification on January 14 and January 15, 2015. On September 15, 2015, the Bankruptcy Court denied the motion for class certification without prejudice to the plaintiff’s right to file a renewed motion. On November 18, 2015, the Bankruptcy Court granted the defendants’ motion to dismiss the intentional fraudulent transfer claims in the Creditor Trust Action, the Litigation Trust Action, and in Reichman, but denied the motion to dismiss the constructive fraudulent transfer claims in the Creditor Trust Action and in Reichman. The Bankruptcy Court entered final judgment dismissing the Litigation Trust Action, but the plaintiff appealed the dismissal to the U.S. District Court for the Southern District of New York.
On July 27, 2016, the District Court reversed the Bankruptcy Court and reinstated the federal law intentional fraudulent transfer claim in the Litigation Trust Action and remanded to the Bankruptcy Court for further proceedings. The District Court found that the fraudulent intent that mattered was that of Lyondell’s CEO, not its board, because the CEO’s intent could be imputed to Lyondell under Delaware law agency principles. The District Court did note, however, that plaintiff faces a high standard for proving “actual intent” to harm creditors, and that it remains to be seen whether plaintiff will be able to make this showing. On August 11, 2016, the shareholder defendants filed a motion for reconsideration and/or to certify an interlocutory appeal of the District Court’s opinion. On October 5, 2016, the District Court denied the motion for reconsideration and/or to certify an interlocutory appeal. On April 21, 2017, the Bankruptcy Court issued an Opinion and Order After Trial in a related Lyondell litigation (the “Blavatnik Action”) rejecting claims for intentional fraudulent transfer and constructive fraudulent transfer in connection with the 2007 LBO. Based on this related ruling in the Blavatnik Action, the shareholder defendants filed a motion to dismiss the Litigation Trust Action on the grounds of collateral estoppel on May 30, 2017. Although the Bankruptcy Court had not yet ruled on the motion to dismiss, on August 15, 2017, the plaintiff in the Litigation Trust action filed a notice of dismissal of all claims against the defendants who joined the motion to dismiss. On August 18, 2017, the Litigation Trust plaintiff also withdrew his request for class certification of a defendant
| 44 | THE GUGGENHEIM FUNDS ANNUAL REPORT | |
| NOTES TO CONSOLIDATED FINANCIAL STATEMENTS (concluded) |
class in the Litigation Trust action. On September 5, 2017, the Court entered an order dismissing the Litigation Trust action with prejudice. The Court’s order dismissed the action as to all defendants as well as to unnamed members of the putative defendant class.
On May 4, 2016, the defendants filed a motion to dismiss, or in the alternative, for a stay of, the Creditor Trust Action and Reichman in light of the U.S. Court of Appeals for the Second Circuit’s opinion in the appeal of the Tribune SLCFC actions. On July 20, 2016, the Bankruptcy Court issued a report and recommendation granting the defendants’ motion to dismiss. On May 30, 2017, the shareholder defendants filed a motion to remand the proceedings in the Creditor Trust and Reichman Actions to the Bankruptcy Court, for consideration of the collateral estoppel ground for dismissal raised by the Bankruptcy Court’s ruling in the Blavatnik Action. On August 18, 2017, the plaintiff in the Creditor Trust action filed a notice of dismissal of claims brought against defendants who had not answered the Third Amended Complaint. The same day, the plaintiff in the Reichman action filed a notice of dismissal of all claims against named defendants who had not filed an answer and withdrew his request for class certification of a defendant class. On September 5, 2017, the Court entered an order dismissing the Creditor Trust and Reichman actions with prejudice. The Court’s order dismissed the actions as to all defendants as well as to unnamed members of the putative defendant class in the Reichman action.
As a result of the dismissals above, there are no longer claims pending against the Rydex Series Funds related to the Lyondell merger.
These lawsuits do not allege any wrongdoing on the part of Rydex Series Funds. The following series of Rydex Series Funds received cash proceeds from the cash out merger in the following amounts: Basic Materials Fund - $1,725,168; Long Short Equity Fund f/k/a U.S. Long Short Momentum Fund - $2,193,600; Global 130/30 Strategy Fund - $37,920; Hedged Equity Fund - $1,440; and Multi-Hedge Strategies Fund - $1,116,480.
| | THE GUGGENHEIM FUNDS ANNUAL REPORT | 45 |
| REPORT OF INDEPENDENT REGISTERED PUBLIC ACCOUNTING FIRM |
To the Shareholders of Managed Futures Strategy Fund and the Board of Trustees of Rydex Series Funds
Opinion on the Financial Statements
We have audited the accompanying consolidated statement of assets and liabilities of Managed Futures Strategy Fund (the “Fund”) (one of the funds constituting Rydex Series Funds (the “Trust”)), including the consolidated schedule of investments, as of December 31, 2017, and the related consolidated statement of operations for the year then ended, the consolidated statements of changes in net assets for each of the two years in the period then ended, the consolidated financial highlights for each of the five years in the period then ended and the related notes (collectively referred to as the “financial statements”). In our opinion, the financial statements present fairly, in all material respects, the consolidated financial position of the Fund (one of the funds constituting Rydex Series Funds) at December 31, 2017, the consolidated results of its operations for the year then ended, the consolidated changes in its net assets for each of the two years in the period then ended and its consolidated financial highlights for each of the five years in the period then ended, in conformity with U.S. generally accepted accounting principles.
Basis for Opinion
These financial statements are the responsibility of the Trust’s management. Our responsibility is to express an opinion on the Fund’s financial statements based on our audits. We are a public accounting firm registered with the Public Company Accounting Oversight Board (United States) (“PCAOB”) and are required to be independent with respect to the Trust in accordance with the U.S. federal securities laws and the applicable rules and regulations of the Securities and Exchange Commission and the PCAOB.
We conducted our audits in accordance with the standards of the PCAOB. Those standards require that we plan and perform the audit to obtain reasonable assurance about whether the financial statements are free of material misstatement, whether due to error or fraud. The Trust is not required to have, nor were we engaged to perform, an audit of the Trust’s internal control over financial reporting. As part of our audits, we are required to obtain an understanding of internal control over financial reporting, but not for the purpose of expressing an opinion on the effectiveness of the Trust’s internal control over financial reporting. Accordingly, we express no such opinion.
Our audits included performing procedures to assess the risks of material misstatement of the financial statements, whether due to error or fraud, and performing procedures that respond to those risks. Such procedures included examining, on a test basis, evidence regarding the amounts and disclosures in the financial statements. Our procedures included confirmation of securities owned as of December 31, 2017, by correspondence with the custodian, transfer agent,
| 46 | THE GUGGENHEIM FUNDS ANNUAL REPORT | |
| REPORT OF INDEPENDENT REGISTERED PUBLIC ACCOUNTING FIRM (concluded) |
and brokers. Our audits also included evaluating the accounting principles used and significant estimates made by management, as well as evaluating the overall presentation of the financial statements. We believe that our audits provide a reasonable basis for our opinion.

We have served as the auditor of one or more Guggenheim investment companies since 1979.
Tysons, Virginia
February 27, 2018
| | THE GUGGENHEIM FUNDS ANNUAL REPORT | 47 |
| OTHER INFORMATION (Unaudited) |
Federal Income Tax Information
This information is being provided as required by the Internal Revenue Code. Amounts shown may differ from those elsewhere in the report because of differences in tax and financial reporting practice.
In January 2018, shareholders will be advised on IRS Form 1099 DIV or substitute 1099 DIV as to the federal tax status of the distributions received by shareholders in the calendar year 2017.
Of the taxable ordinary income distributions paid during the fiscal year ending December 31, 2017, the Fund had the corresponding percentages qualify for the reduced tax rate pursuant to the Jobs and Growth Tax Relief and Reconciliation Act of 2003 or for the dividends received deduction for corporations. See the qualified dividend income and dividend received deduction columns, respectively, in the table below.
| Fund | Qualified
Dividend
Income | Dividend
Received
Deduction |
| Managed Futures Strategy Fund | 0.00% | 0.00% |
Proxy Voting Information
A description of the policies and procedures that the Trust uses to determine how to vote proxies relating to securities held in the Fund’s portfolios is available, without charge and upon request, by calling 800.820.0888. This information is also available from the EDGAR database on the SEC’s website at https://www.sec.gov.
Information regarding how the Fund voted proxies relating to portfolio securities during the most recent 12-month period ended June 30 is available without charge, upon request, by calling 800.820.0888. This information is also available from the EDGAR database on the SEC’s website at https://www.sec.gov.
Sector Classification
Information in the Schedule of Investments is categorized by sectors using sector-level Classifications defined by the Bloomberg Industry Classification System, a widely recognized industry classification system provider. The Fund’s registration statement has investment policies relating to concentration in specific sectors/industries. For purposes of these investment policies, the Fund usually classifies sectors/industries based on industry-level Classifications used by widely recognized industry classification system providers such as Bloomberg Industry Classification System, Global Industry Classification Standards and Barclays Global Classification Scheme.
| 48 | THE GUGGENHEIM FUNDS ANNUAL REPORT | |
| OTHER INFORMATION (Unaudited)(concluded) |
Quarterly Portfolio Schedules Information
The Trust files its complete schedule of portfolio holdings with the SEC for the first and third quarters of each fiscal year on Form N-Q, which are available on the SEC’s website at https://www.sec.gov. The Fund’s Forms N-Q may be reviewed and copied at the SEC’s Public Reference Room in Washington, DC, and that information on the operation of the Public Reference Room may be obtained by calling 800-SEC-0330. Copies of the portfolio holdings are also available to shareholders, without charge and upon request, by calling 800.820.0888.
| | THE GUGGENHEIM FUNDS ANNUAL REPORT | 49 |
| INFORMATION ON BOARD OF TRUSTEES AND OFFICERS (Unaudited) |
A Board of Trustees oversees the Trust, as well as other trusts of GI, in which its members have no stated term of service, and continue to serve after election until resignation. The Statement of Additional Information includes further information about Fund Trustees and Officers, and can be obtained without charge by visiting guggenheiminvestments.com or by calling 800.820.0888.
| Name, Address* and Year of Birth of Trustees | Position(s) Held
with the Trust | Principal Occupation(s)
During Past 5 Years | Number of
Portfolios in
Fund Complex
Overseen by
Trustee | Other
Directorships
Held by
Trustee |
| Independent Trustees | | | |
Angela Brock-Kyle
(1959) | Trustee, Member of the Audit Committee, Chairwoman and Member of the Compliance and Risk Oversight Committee, and Member of the Nominating and Governance Committee. | Current: Founder and Chief Executive Officer, B.O.A.R.D.S (consulting firm). Former: Senior Leader, TIAA (financial services firm) (1987-2012). | 133 | Current: Infinity Property & Casualty Corporation (2014-present). |
Corey A. Colehour
(1945) | Trustee, Member of the Audit Committee, Member of the Nominating and Governance Committee, and Member of the Investment and Performance Committee. | Current: Retired. | 133 | None |
J. Kenneth Dalton
(1941) | Trustee, Member and Chairman of the Audit Committee, and Member of the Compliance and Risk Oversight Committee. | Current: Retired. | 133 | Epiphany Funds (3) (2009-present). |
John O. Demaret
(1940) | Trustee, Member of the Audit Committee, and Member of the Compliance and Risk Oversight Committee. | Current: Retired. | 133 | None |
Werner E. Keller
(1940) | Chairman and Trustee of the Board, and Member of the Audit Committee. | Current: Founder and President, Keller Partners, LLC (investment research firm) (2005-present). | 133 | None |
| 50 | THE GUGGENHEIM FUNDS ANNUAL REPORT | |
| INFORMATION ON BOARD OF TRUSTEES AND OFFICERS (Unaudited)(continued) |
| Name, Address* and Year of Birth of Trustees | Position(s) Held
with the Trust | Principal Occupation(s)
During Past 5 Years | Number of
Portfolios in
Fund Complex
Overseen by
Trustee | Other
Directorships
Held by
Trustee |
| INDEPENDENT TRUSTEES - concluded |
Thomas F. Lydon, Jr.
(1960) | Trustee, Member of the Audit Committee, Chairman and Member of the Nominating and Governance Committee, and Member of the Investment and Performance Committee. | Current: President, Global Trends Investments (registered investment adviser) (1996-present). | 133 | US Global Investors (GROW) (1995-present). |
Patrick T. McCarville
(1942) | Trustee, Member of the Audit Committee, and Member of the Nominating and Governance Committee. | Current: Retired. Former: Chief Executive Officer, Par Industries, Inc., d/b/a Par Leasing (1977-2010). | 133 | None. |
Sandra G. Sponem
(1958) | Trustee, Member of the Audit Committee, Member of the Nominating and Governance Committee, and Chairwoman and Member of the Investment and Performance Committee, | Current: Retired Former: Senior Vice President and Chief Financial Officer, M.A. Mortenson Companies, Inc. (general contracting firm) (2007-2017). | 133 | None. |
| | THE GUGGENHEIM FUNDS ANNUAL REPORT | 51 |
| INFORMATION ON BOARD OF TRUSTEES AND OFFICERS (Unaudited)(continued) |
| Name, Address* and Year of Birth of Trustees | Position(s) Held
with the Trust | Principal Occupation(s)
During Past 5 Years |
| OFFICERS | | |
Michael P. Byrum
(1970) | Vice President | Current: Senior Vice President, Security Investors, LLC (2010-present); President and Chief Investment Officer, Rydex Holdings, LLC (2008-present); Director and Chairman, Advisory Research Center, Inc. (2006-present); Manager, Guggenheim Specialized Products, LLC (2005-present). Former: Vice President, Guggenheim Distributors, LLC (2009); Director (2009-2010) and Secretary (2002-2010), Rydex Fund Services, LLC; Director (2008-2010), Chief Investment Officer (2006-2010), President (2004-2010) and Secretary (2002-2010), Rydex Advisors, LLC; Director (2008-2010), Chief Investment Officer (2006-2010), President (2004-2010) and Secretary (2002-2010), Rydex Advisors II, LLC. |
James M. Howley
(1972) | Assistant Treasurer | Current: Managing Director, Guggenheim Investments (2004-present); Assistant Treasurer, certain other funds in the Fund Complex (2006-present). Former: Manager, Mutual Fund Administration of Van Kampen Investments, Inc. (1996-2004). |
Keith D. Kemp
(1960) | Assistant Treasurer | Current: Treasurer and Assistant Treasurer, certain other funds in the Fund Complex (2010-present); Managing Director, Guggenheim Investments (2015-present); Chief Financial Officer, Guggenheim Specialized Products, LLC (2016-present). Former: Managing Director and Director, Transparent Value, LLC (2010-2016); Director, Guggenheim Partners Investment Management, LLC (2010-2015); Chief Operating Officer, Macquarie Capital Investment Management (2007-2009). |
Amy J. Lee
(1961) | President | Current: President and Chief Executive Officer, certain other funds in the Fund Complex (2017-present); Chief Legal Officer, certain other funds in the Fund Complex (2014-present); Senior Managing Director, Guggenheim Investments (2012-present). Former: Vice President, Associate General Counsel and Assistant Secretary, Security Benefit Life Insurance Company and Security Benefit Corporation (2004-2012). |
| 52 | THE GUGGENHEIM FUNDS ANNUAL REPORT | |
| INFORMATION ON BOARD OF TRUSTEES AND OFFICERS (Unaudited)(continued) |
| Name, Address* and Year of Birth of Trustees | Position(s) Held
with the Trust | Principal Occupation(s)
During Past 5 Years |
| OFFICERS - continued | |
Mark E. Mathiasen
(1978) | Secretary | Current: Secretary, certain other funds in the Fund Complex (2007-present); Managing Director, Guggenheim Investments (2007-present). |
Glenn McWhinnie
(1969) | Assistant Treasurer | Current: Vice President, Guggenheim Investments (2009-present). |
Elisabeth Miller
(1968) | Chief Compliance Officer | Current: CCO, certain other funds in the Fund Complex (2012-present); CCO, Security Investors, LLC (2012- present); CCO, Guggenheim Funds Investment Advisors, LLC (2012-present); Managing Director, Guggenheim Investments (2012-present). Vice President, Guggenheim Funds Distributors, LLC (2014-present). Former: CCO, Guggenheim Distributors, LLC (2009-2014); Senior Manager, Security Investors, LLC (2004-2009); Senior Manager, Guggenheim Distributors, LLC (2004-2009). |
Adam J. Nelson
(1979) | Assistant Treasurer | Current: Vice President, Guggenheim Investments (2015-present); Assistant Treasurer, certain other funds in the Fund Complex (2015-present). Former: Assistant Vice President and Fund Administration Director, State Street Corporation (2013-2015); Fund Administration Assistant Director, State Street (2011-2013); Fund Administration Manager, State Street (2009-2011). |
Kimberly J. Scott
(1974) | Assistant Treasurer | Current: Director, Guggenheim Investments (2012-present); Assistant Treasurer, certain other funds in the Fund Complex (2012-present). Former: Financial Reporting Manager, Invesco, Ltd. (2010-2011); Vice President/Assistant Treasurer, Mutual Fund Administration for Van Kampen Investments, Inc./Morgan Stanley Investment Management (2009-2010); Manager of Mutual Fund Administration, Van Kampen Investments, Inc./Morgan Stanley Investment Management (2005-2009). |
| | THE GUGGENHEIM FUNDS ANNUAL REPORT | 53 |
| INFORMATION ON BOARD OF TRUSTEES AND OFFICERS (Unaudited)(concluded) |
| Name, Address* and Year of Birth of Trustees | Position(s) Held
with the Trust | Principal Occupation(s)
During Past 5 Years |
| OFFICERS - concluded | |
John L. Sullivan
(1955) | Chief Financial Officer and Treasurer | Current: CFO, Chief Accounting Officer and Treasurer, certain other funds in the Fund Complex (2010-present); Senior Managing Director, Guggenheim Investments (2010-present). Former: Managing Director and CCO, each of the funds in the Van Kampen Investments fund complex (2004-2010); Managing Director and Head of Fund Accounting and Administration, Morgan Stanley Investment Management (2002-2004); CFO and Treasurer, Van Kampen Funds (1996-2004). |
Jon Szafran
(1989) | Assistant Treasurer | Current: Vice President, Guggenheim Investments (2017-present); Assistant Treasurer, certain other funds in the Fund Complex (2017-present). Former: Assistant Treasurer of Henderson Global Funds and Manager of US Fund Administration, Henderson Global Investors (North America) Inc. ("HGINA"), (2017); Senior Analyst of US Fund Administration, HGINA (2014-2017); Senior Associate of Fund Administration, Cortland Capital Market Services, LLC (2013-2014); Experienced Associate, PricewaterhouseCoopers LLP (2012-2013). |
| * | | All Trustees and Officers may be reached c/o Guggenheim Investments, 227 West Monroe Street, Chicago, Illinois 60606. |
| 54 | THE GUGGENHEIM FUNDS ANNUAL REPORT | |
| GUGGENHEIM INVESTMENTS PRIVACY POLICIES (Unaudited) |
Guggenheim Investments as used herein refers to Guggenheim Partners, LLC, Guggenheim Funds Investment Advisors, LLC, Guggenheim Partners Investment Management, LLC, Guggenheim Funds Distributors, LLC and Security Investors, LLC as well as the funds in the Guggenheim Funds complex (the “funds”).
Our Commitment to You
When you become a Guggenheim Investments investor, you entrust us with not only your hard-earned money but also with personal and financial information about you. We recognize that your relationship with us is based on trust and that you expect us to act responsibly and in your best interests. Because we have access to personal information about you, we hold ourselves to high standards in its safekeeping and use. This means, most importantly, that we do not sell client or account information to anyone—whether you are a current or former Guggenheim Investments client.
The Information We Collect About You and How We Collect It
In the course of doing business with shareholders and investors, we collect nonpublic personal information about you. You typically provide personal information when you complete a Guggenheim Investments account application or when you request a transaction that involves Rydex and Guggenheim Funds or one of the Guggenheim affiliated companies. “Nonpublic personal information” is personally identifiable information about you. For example it includes your name and address, Social Security or taxpayer identification number, assets, income, account balance, bank account information and investment activity (e.g. purchase and redemption history).
How We Share Your Personal Information
As a matter of policy, we do not disclose your nonpublic personal information to nonaffiliated third parties except as required or permitted by law. As emphasized above, we do not sell information about current or former clients or their accounts to third parties. Nor do we share such information, except when necessary to complete transactions at your request or to make you aware of related investment products and services that we offer. Additional details about how we handle your personal information are provided below.
To complete certain transactions or account changes that you direct, it may be necessary to provide your personal information to companies, individuals or groups that are not affiliated with Guggenheim Investments. For example if you ask to transfer assets from another financial institution to Guggenheim Investments, we will need to provide certain information about you to that company to complete the transaction. In connection with servicing your accounts or to alert you to other Guggenheim Investments investment products and services, we may share your information within the Guggenheim Investments family of affiliated companies. This would include, for example, sharing your information within Guggenheim Investments so we can make you aware of new funds or the services offered through another Guggenheim Investments
| | THE GUGGENHEIM FUNDS ANNUAL REPORT | 55 |
| GUGGENHEIM INVESTMENTS PRIVACY POLICIES (Unaudited)(concluded) |
affiliated company. In certain instances, we may contract with nonaffiliated companies to perform services for us. Where necessary, we will disclose information we have about you to these third parties. In all such cases, we provide the third party with only the information necessary to carry out its assigned responsibilities and only for that purpose. And we require these third parties to treat your personal information with the same high degree of confidentiality that we do. In certain instances, we may share information with other financial institutions regarding individuals and entities in response to the U.S.A. Patriot Act. Finally we will share personal information about you if we are compelled by law to do so, if you direct us to do so with your consent, or in other circumstances as permitted by law.
How We Safeguard Your Personal Information
We maintain physical, electronic and procedural safeguards to protect your personal information. Within Guggenheim Investments, access to such information is limited to those who need it to perform their jobs such as servicing your account, resolving problems or informing you of new products and services.
| 56 | THE GUGGENHEIM FUNDS ANNUAL REPORT | |
This page intentionally left blank.
This page intentionally left blank.
This page intentionally left blank.
This page intentionally left blank.
This page intentionally left blank.
Item 2. Code of Ethics.
The registrant’s Board of Trustees has adopted a code of ethics that applies to the registrant’s principal executive officer and principal financial officer. No substantive amendments were approved or waivers were granted to the Code during the period covered by this report. The Code is filed as an exhibit to this Form N-CSR.
Item 3. Audit Committee Financial Expert.
The registrant's Board of Trustees has determined that it has at least one audit committee financial expert serving on its audit committee (the “Audit Committee”), Werner Keller. Mr. Keller is “independent,” meaning that he is not an “interested person” of the Registrant (as that term is defined in Section 2(a)(19) of the Investment Company Act of 1940, as amended) and he does not accept any consulting, advisory, or other compensatory fee from the Registrant (except in his capacity as a Board or committee member).
Under applicable securities laws, a person who is determined to be an audit committee financial expert will not be deemed an "expert" for any purpose, including without limitation for the purposes of Section 11 of the Securities Act of 1933, as a result of being designated or identified as an audit committee financial expert. The designation or identification of a person as an audit committee financial expert does not impose on such person any duties, obligations, or liabilities that are greater than the duties, obligations, and liabilities imposed on such person as a member of the audit committee and Board of Trustees in the absence of such designation or identification.
Item 4. Principal Accountant Fees and Services.
(a) Audit Fees. The aggregate Audit Fees billed by the registrant’s principal accountant for professional services rendered for the audit of the annual financial statements or services that are normally provided by the accountant in connection with statutory and regulatory filings or engagements for the fiscal years ended December 31, 2017 and December 31, 2016 were $84,967 and $77,198, respectively.
(b) Audit Related Fees. The aggregate Audit-Related Fees billed by the registrant’s principal accountant for assurance and related services that are reasonably related to the performance of the audit of the registrant’s financial statements and are not reported under paragraph (a) of this Item for the fiscal years ended December 31, 2017 and December 31, 2016 were $0 and $0, respectively.
The aggregate fees billed in the Reporting Periods for assurance and related services by the Auditor to the registrant’s investment adviser (not including any sub-investment adviser whose role is primarily portfolio management and is subcontracted with or overseen by another investment adviser), and any entity controlling, controlled by or under common control with the investment adviser that provides ongoing services to the registrant (“Service Affiliates”) which required pre-approval by the Audit Committee which related to the review of the transfer agent function for the fiscal years ended December 31, 2017 and December 31, 2016 were $0 and $0, respectively.
(c) Tax Fees: The aggregate Tax Fees billed by the registrant’s principal accountant for professional services rendered for tax compliance, tax advice, and tax planning, including preparation of tax returns and distribution assistance, for the fiscal years ended December 31, 2017 and December 31, 2016 were $38,374 and $32,518, respectively.
(d) All Other Fees. The aggregate All Other Fees billed by the registrant’s principal accountant for products and services provided by the principal accountant, other than the services reported in paragraphs (a) through (c) of this Item, for the fiscal years ended December 31, 2017 and December 31, 2016 were $0 and $0, respectively.
(e) Audit Committee Pre-Approval Policies and Procedures. The audit committee has adopted a policy whereby audit and non-audit services performed by the registrant’s principal accountant for the registrant, its investment advisor, and any entity controlling, controlled by, or under common control with the investment advisor that provides ongoing services to the registrant require pre-approval in advance at regularly scheduled audit committee meetings. If such service is required between regularly scheduled audit committee meetings, the chairman of the audit committee, J. Kenneth Dalton, is authorized to pre-approve the service with full committee approval at the next scheduled meeting. There shall be no waivers of the pre-approval process. No services described in (b)-(d) above were approved pursuant to paragraph (c)(7)(i)(C) of Rule 2-01 of Regulation S-X.
(f) Not applicable.
(g) Non-Audit Fees. The aggregate non-audit fees billed by the registrant’s accountant for the most recent fiscal year and the preceding fiscal year for services rendered to the registrant, the investment advisor, and any entity controlling, controlled by, or under common control with the advisor that provides ongoing services to the registrant were $38,374 and $100,091, respectively. These aggregate fees were less than the aggregate fees billed for the same periods by the registrant’s principal accountant for audit services rendered to the registrant, the investment advisor, and any entity controlling, controlled by, or under common control with the advisor that provides ongoing services to the registrant.
(h) Auditor Independence. The registrant’s Audit Committee was provided with information relating to the provision of non-audit services by Ernst & Young, LLP to the registrant’s investment adviser (not including any sub adviser whose role is primarily portfolio management and is subcontracted with or overseen by another investment adviser), and any entity controlling, controlled by, or under common control with the investment adviser that provides ongoing services to the registrant that were not pre-approved by the Audit Committee so that a determination could be made whether the provision of such services is compatible with maintaining Ernst & Young, LLP’s independence.
Item 5. Audit Committee of Listed Registrants.
Not applicable.
Item 6. Investments.
Schedule of Investments is included as part of the report to shareholders filed under Item 1 of this form.
Item 7. Disclosure of Proxy Voting Policies and Procedures for Closed-End Management Investment Companies.
Not applicable.
Item 8. Portfolio Managers of Closed-End Management Investment Companies.
Not applicable.
Item 9. Purchases of Equity Securities by Closed-End Management Investment Company and Affiliated Purchasers.
Not applicable.
Item 10. Submission of Matters to a Vote of Security Holders.
Not applicable.
Item 11. Controls and Procedures.
(a) The registrant’s President (principal executive officer) and Treasurer (principal financial officer) have evaluated the registrant’s disclosure controls and procedures within 90 days of this filing and have concluded that the registrant’s disclosure controls and procedures were effective as of that date in ensuring that information required to be disclosed by the registrant in this Form N-CSR was recorded, processed, summarized, and reported timely.
(b) The registrant’s principal executive officer and principal financial officer are aware of no change in the registrant’s internal control over financial reporting that occurred during the registrant’s second fiscal quarter covered by this report that has materially affected, or is reasonably likely to materially affect, the registrant’s internal control over financial reporting.
Item 12. Disclosure of Securities Lending Activities for Closed End Management Investment Companies.
Not Applicable
Item 13. Exhibits.
(a)(1) The registrant’s code of ethics pursuant to Item 2 of Form N-CSR is attached.
(a)(2) Separate certifications by the President (principal executive officer) and Treasurer (principal financial officer) of the registrant as required by Rule 30a-2(a) under the Act (17 CFR 270.30a-2(a)) are attached.
(b) A certification by the registrant’s President (principal executive officer) and Treasurer (principal financial officer) as required by Rule 30a-2(b) under the Act (17 CFR 270.30a-2(b)) is attached.
SIGNATURES
Pursuant to the requirements of the Securities Exchange Act of 1934 and the Investment Company Act of 1940, the registrant has duly caused this report to be signed on its behalf by the undersigned, thereunto duly authorized.
| (Registrant) | Rydex Series Funds | |
| | | |
| By (Signature and Title)* | /s/ Amy J. Lee | |
| | Amy J. Lee, President | |
| | | |
| Date | March 9, 2018 | |
Pursuant to the requirements of the Securities Exchange Act of 1934 and the Investment Company Act of 1940, this report has been signed below by the following persons on behalf of the registrant and in the capacities and on the dates indicated.
| By (Signature and Title)* | /s/ Amy J. Lee | |
| | Amy J. Lee, President | |
| | | |
| Date | March 9, 2018 | |
| | | |
| By (Signature and Title)* | /s/ John L. Sullivan | |
| | John L. Sullivan, Chief Financial Officer and Treasurer | |
| | | |
| Date | March 9, 2018 | |
| * | Print the name and title of each signing officer under his or her signature. |

