UNITED STATES
SECURITIES AND EXCHANGE COMMISSION
Washington, D.C. 20549
FORM 10-K
(Mark One)
☒ Annual report pursuant to section 13 or 15(d) of the Securities Exchange Act of 1934
for the fiscal year ended December 31, 2024
or
☐ Transition report pursuant to section 13 or 15(d) of the Securities Exchange Act of 1934
for the transition period from to .
Commission file number 0-21810
GENTHERM INCORPORATED
(Exact name of registrant as specified in its charter)
| | |
Michigan |
| 95-4318554 |
(State or other jurisdiction of
incorporation or organization) |
| (I.R.S. Employer
Identification No.) |
28875 Cabot Drive, Novi, MI |
| 48377 |
(Address of principal executive offices) |
| (Zip Code) |
Registrant’s telephone number, including area code: (248) 504-0500
Securities registered pursuant to Section 12(b) of the Act:
| | |
Title of each class | Trading Symbol | Name of each exchange on which registered |
Common Stock, no par value | THRM | Nasdaq |
Securities registered pursuant to Section 12(g) of the Act: None
Indicate by check mark whether the registrant is a well-known seasoned issuer, as defined in Rule 405 of the Securities Act. Yes ☒ No ☐
Indicate by check mark if the registrant is not required to file reports pursuant to Section 13 or Section 15(d) of the Act. Yes ☐ No ☒
Indicate by check mark whether the registrant (1) has filed all reports required to be filed by Section 13 or 15(d) of the Securities Exchange Act of 1934 during the preceding 12 months (or for such shorter period that the registrant was required to file such reports), and (2) has been subject to such filing requirements for the past 90 days. Yes No
Indicate by check mark whether the registrant has submitted electronically every Interactive Data File required to be submitted pursuant to Rule 405 of Regulation S-T (§ 232.405 of this chapter) during the preceding 12 months (or for such shorter period that the registrant was required to submit such files). Yes ☒ No ☐
Indicate by check mark whether the registrant is a large accelerated filer, an accelerated filer, a non-accelerated filer, smaller reporting company, or an emerging growth company. See the definitions of “large accelerated filer”, “accelerated filer”, “smaller reporting company” and “emerging growth company” in Rule 12b-2 of the Exchange Act.
| | | | | | |
Large accelerated filer |
| ☒ |
| Accelerated filer |
| ☐ |
| | | | | | |
Non-accelerated filer |
| ☐ |
| Smaller reporting company |
| ☐ |
| | | | | | |
|
| |
| Emerging growth company |
| ☐ |
If an emerging growth company, indicate by check mark if the registrant has elected not to use the extended transition period for complying with any new or revised financial accounting standards provided pursuant to Section 13(a) of the Exchange Act. ☐
Indicate by check mark whether the registrant has filed a report on and attestation to its management’s assessment of the effectiveness of its internal control over financial reporting under Section 404(b) of the Sarbanes-Oxley Act (15 U.S.C. 7262(b)) by the registered public accounting firm that prepared or issued its audit report. ☒
If securities are registered pursuant to Section 12(b) of the Act, indicate by check mark whether the financial statements of the registrant included in the filing reflect the correction of an error to previously issued financial statements. ☐
Indicate by check mark whether any of those error corrections are restatements that required a recovery analysis of incentive-based compensation received by any of the registrant’s executive officers during the relevant recovery period pursuant to §240.10D-1(b). ☐
Indicate by check mark whether the registrant is a shell company (as defined in Rule 12b-2 of the Act). Yes ☐ No ☒
The aggregate market value of the registrant’s Common Stock held by non-affiliates of the registrant, computed by reference to the closing price of such Common Stock on The Nasdaq Global Select Market as of the last business day of the registrant’s most recently completed second fiscal quarter, June 28, 2024, was $1,519,329,529. For purposes of this computation, the registrant has excluded the market value of all shares of its Common Stock reported as being beneficially owned by executive officers and directors.
As of February 13, 2025, there were 30,788,989 issued and outstanding shares of Common Stock of the registrant.
DOCUMENTS INCORPORATED BY REFERENCE
Portions of the proxy statement for the 2025 annual meeting of shareholders are incorporated by reference into Part III of this Annual Report to the extent described herein.
TABLE OF CONTENTS
GENTHERM INCORPORATED
PART I
Forward-Looking Statements
This Annual Report on Form 10-K for the year ended December 31, 2024 (this “Annual Report”) contains forward-looking statements within the meaning of the “safe harbor” provisions of the Private Securities Litigation Reform Act of 1995. These forward-looking statements represent our goals, beliefs, plans and expectations about our prospects for the future and other future events, such as: the expected light vehicle production in the Company’s key markets; the impact of macroeconomic and geopolitical conditions; the components of and our execution of our strategic plan, product and technology development and manufacturing footprint optimization restructuring plans; our operating performance; long-term consumer and technological trends in the automotive industry and our related market opportunity for our existing and new products and technologies; the competitive landscape; the impact of global tax reform legislation and other regulatory matters; the sufficiency of our cash balances and cash generated from operating, investing and financing activities for our future liquidity and capital resource needs; and our ability to finance sufficient working capital. Reference is made in particular to forward-looking statements included in “Item 1. Business,” “Item 1A. Risk Factors” and “Item 7. Management’s Discussion and Analysis of Financial Condition and Results of Operations.” Such statements may be identified by the use of forward-looking terminology such as “may”, “will”, “expect”, “believe”, “estimate”, “anticipate”, “intend”, “continue”, or similar terms, variations of such terms or the negative of such terms.
The forward-looking statements included in this Annual Report are made as of the date hereof or as of the date specified and are based on management’s reasonable expectations and beliefs. In making these statements, we rely on assumptions and analyses based on our experience and perception of historical trends, current conditions and expected future developments, third-party information and projections from sources that management believes to be reputable, as well as other factors we consider appropriate under the circumstances. Such statements are subject to a number of assumptions, risks, uncertainties and other factors, which are set forth in "Item 1A. Risk Factors" and "Item 7. Management's Discussion and Analysis of Financial Condition and Results of Operations," which are incorporated herein by reference, or as described in subsequent reports we file with the United States Securities and Exchange Commission (the "SEC"), and which could cause actual results and performance to differ materially from that described in or implied by the forward-looking statements. Moreover, we operate in a very competitive and rapidly changing environment and new risks emerge from time to time.
In addition, with reasonable frequency, we have entered into business combinations, acquisitions, divestitures, strategic investments and other significant transactions. Such forward-looking statements do not include the potential impact of any such transactions that may be completed after the date hereof, each of which may present material risks to the Company’s future business and financial results. Except as required by law, we expressly disclaim any obligation or undertaking to update any forward-looking statements to reflect any change in our expectations with regard thereto or any change in events, conditions or circumstances on which any such statement is based.
ITEM 1. BUSINESS
Unless otherwise indicated, references to “Gentherm”, “the Company”, “we”, “our” and “us” in this Annual Report refer to Gentherm Incorporated and its consolidated subsidiaries.
Except to the extent expressly noted herein, the content of our website or the websites of other third parties noted herein are not incorporated by reference in this Annual Report.
Overview
Gentherm Incorporated is the global market leader of innovative thermal management and pneumatic comfort technologies for the automotive industry and a leader in medical patient temperature management. Automotive products include variable temperature Climate Control Seats®, heated interior systems (including heated seats, steering wheels, armrests and other components), battery performance solutions, cable systems, lumbar and massage comfort solutions, fuel management valve systems and other valve systems for brake and engine systems, and other electronic devices. Our automotive products can be found on light vehicles manufactured by nearly all the major original equipment manufacturers ("OEMs") operating in North America and Europe, and several major OEMs in Asia. We operate in locations aligned with our major customers’ product strategies to provide locally enhanced design, integration and production capabilities. Medical products include patient temperature management systems. Our medical products can be found in
hospitals throughout the world, primarily in the U.S., China, Germany and Brazil. The Company is also developing and launching a number of new technologies and products that will help enable improvements to existing products, improve health, wellness and patient outcomes and will lead to new product applications for existing and new and adjacent markets.
We are incorporated under the laws of the State of Michigan. Our website is www.gentherm.com. Our Annual Reports on Form 10-K, Quarterly Reports on Form 10-Q, Current Reports on Form 8-K and amendments to those reports filed or furnished pursuant to Section 13(a) or 15(d) of the Securities Exchange Act of 1934, as amended (the “Exchange Act”), are made available free of charge through our website, www.gentherm.com, as soon as reasonably practicable after we electronically file them with or furnish them to the SEC. These reports are also available on the SEC’s website, www.sec.gov.
Segments
The Company has two reportable segments for financial reporting purposes: Automotive and Medical.
Automotive
The Automotive reporting segment is comprised of the results from our global automotive businesses, including the design, development, manufacturing and sales of automotive climate and comfort systems, cable technology, battery performance solutions, valve systems, and electronic and software solutions.
Climate and comfort systems include seat heaters, blowers and thermoelectric devices for variable temperature control in seats and steering wheel heaters designed to provide individualized thermal comfort to automobile passengers, pneumatic lumbar and massage comfort solutions, and integrated electronic components, such as electronic control units that utilize our proprietary electronics technology and software. Pneumatic lumbar and massage comfort solutions include lumbar support, side bolster adjustment, multi-contour seats and massage systems that can be regulated according to the vehicle occupant. Other climate and comfort systems include neck and shoulder conditioners and climate control systems for door panels and armrests.
Automotive cable technology includes ready-made individual cables and ready-to-install cable networks used to connect components to power sources.
Battery performance solutions consist of cell connecting devices and battery cable technologies used for various types of batteries and thermal management products for heating or cooling 12 volts, 48 volts and high voltage batteries and battery modules.
Valve systems consist of applications that offer solutions in fuel management, ranging from the design of tank ventilation and filling functions to the closed-coupled fuel regulation. The modular systems allow for customizable adaptations. Valve systems also include other valves for brake and engine systems.
Electronic and software systems include electronic control units for climate and comfort systems, electronic control units for memory seat modules and other devices.
Medical
The Medical reporting segment is comprised of the results from the patient temperature management business in the medical industry.
Patient temperature management includes temperature management systems across multiple product categories addressing the needs of hyper-hypothermia therapy in intensive care, normothermia in surgical procedures and additional warming/cooling therapies utilized in acute and chronic care departments and non-hospital facilities.
Business Strategy
Globally, we develop, manufacture, and deliver differentiated solutions that make meaningful differences in everyday life by improving health, wellness, comfort and energy efficiency.
Our business strategy consists of four major pillars:
Leverage World Class Talent and Culture
We have built a talented global team by ingraining throughout the organization four Winning Culture Behaviors: Customer Focus, Global Mindset, Employee Engagement & Inclusion, and Performance & Accountability. Combined with a culture that values engagement, inclusion and belonging as a cornerstone of the company, we have laid a strong foundation for future growth across the company.
Extend Technology Leadership
We have continued to expand our technology leadership with focused investments in key core technologies and competencies, including advanced sensing, human-centric science-based design, system engineering, and software and electronics.
Focused Growth
The focused growth strategy includes four key goals:
▪Accelerate thermal comfort growth by leveraging human thermophysiology and smart ClimateSense® control algorithms to increase personalized passenger comfort and improve energy efficiency;
▪Grow pneumatic comfort business by leveraging the thermal products market share and customer relationships, as well as introducing products and technologies featuring the benefits of combined thermal and pneumatic lumbar and massage comfort solutions;
▪Bring to market and expand our industry leading and proprietary next generation solutions through innovation; and
▪Expand patient temperature management solutions that leverage our expertise in thermophysiology and drive synergies from our climate and comfort businesses, as well as introducing new products and technologies.
These areas of the focused growth strategy are underpinned and enabled by our electronic and software systems.
Deliver Financial Excellence
We have built a culture of performance that includes a focus on high-return growth opportunities. Further, we have undertaken in recent years, restructuring actions to reduce global overhead costs and optimize our manufacturing footprint. We are continuing to strengthen our operational discipline and striving to expand margins and return on invested capital through manufacturing productivity, sourcing excellence and cash flow generation.
Automotive Market Trends
The Gentherm automotive product portfolio aligns well with near-term and long-term consumer and technological trends:
▪Increased demand for comfort products – We believe increased consumer demand for personalized comfort in a vehicle is driving increased adoption of our thermal and pneumatic lumbar and massage comfort solutions. We are continuously striving to bring to market products and technologies that improve the well-being of vehicle occupants. Through our climate and comfort solutions, our focus is to make vehicle comfort an integral part of vehicle occupants' experience. Further, OEM customers are seeking the combined thermal and pneumatic lumbar product. Given this trend we expect to see a much higher rate of adoption of our products into vehicles, and we are poised to take advantage of that through the leveraging of Gentherm’s strong customer relationships to further implement our industry leading pneumatic technologies.
▪Growth of connected/smart devices – One of the most important objectives in achieving comfort is to create a system that is able to sense the needs of vehicle occupants and make performance adjustments based on personalized needs. We utilize machine learning to create and optimize state of the art algorithms to make our products smarter and more advanced with each generation.
▪Focus on health and wellness – Consumers have an increased focus on personal health and wellness and trends are shifting towards consumers using their vehicles as a third living space, outside the home or office. Our technologies are
at the nexus of health, wellness and comfort, where our solutions adjust to enable vehicle occupants to address their health and wellness needs.
▪Increased efficiency and electric range – Our technology is best-in-class and provides a unique, innovative, and energy efficient automotive seating experience, which we believe will be key to vehicles of the future. Our climate and comfort solutions help reduce weight and overall energy consumption of a vehicle, resulting in improved fuel consumption for vehicles with an internal combustion engine, and increased range for electric vehicles. Our battery performance solutions products help improve the life and efficiency of batteries, contributing to increased adoption of powertrain electrification.
▪Emergence of shared mobility – As the world transitions from vehicle ownership to mobility as a service model, our focus on individual personalized comfort becomes even more important. Our focus is to create microclimate solutions, in which each vehicle occupant can create a personalized thermal experience tailored to individual needs.
Research, Development and Partnerships
Our research, development and partnerships activities are an essential part of our efforts to develop new or improved innovative products. Our research scientists are engaged in product development of today and tomorrow across both our Automotive and Medical businesses by bringing evidence-based, data-driven solutions to ensure that our products make meaningful differences in everyday life. We integrate software and intelligent algorithms to offer unparalleled personalization that enhance health, wellness, and comfort.
To offer our customers cutting-edge products and technologies, our strategy includes partnering with key technology leaders in our industry. These activities are critical to optimize energy utilization and production efficiencies, improve effectiveness in our products and minimize the cost to integrate our products with those of our customers.
Research and development is conducted globally at several sites to support our geographically diverse customers. We believe the localized development model improves our ability to effectively serve our customers and increases our innovative capacity.
Core Technologies
Resistive Heaters
Resistive heater technologies are comprised of wire, carbon fiber or positive thermal coefficient (“PTC”) heating elements that quickly and effectively deliver heat to people and objects. Wire heating elements are designed from stainless steel, copper, or our proprietary carbon fiber woven lattice technology called Carbotex® based on the specifications for a particular product application. Resistive heaters have multiple automotive applications, including seat heating, steering wheel heating, interior panel heating and battery heating.
Thermoelectric Technologies
We utilize our internally developed, advanced thermoelectric device technology (“TED”) in various applications, such as efficiently heating and cooling vehicle occupants and precisely controlling the temperature of 48V batteries. A TED is a solid-state circuit that has the capability to produce both hot and cold temperature conditions by use of the Peltier effect. The advantages of advanced TED over conventional compressed gas systems include a reduced environmental impact and less complexity as they have no moving parts and are compact and light weight. Our work on this technology has yielded improvements in areas of functionality, efficiency, durability and performance.
Air Moving Devices
Our highly durable and quiet air moving devices, some of which include our proprietary blower and fan designs, are essential to all of our products that require air movement. We have a broad portfolio of these products that are tailored to various automotive applications, including seat ventilation and electric vehicle battery cooling.
Pneumatic
Pneumatic lumbar and massage comfort solutions operate by inflation and deflation of air bladders to achieve desired comfort effect. Our products' differentiation is that our underlying valve technology for regulating air flow is based on shape memory alloy valves ("SMA"). Gentherm has developed actuators and valves with SMA technology that replace heavy, noisy and less accurate solenoid valves. Our innovative control elements produce precise mechanical forces and movements using the finest wires made of memory metals and without the labor-intensive use of additional sensors.
Electronics
The electronics in our climate and comfort solutions are primarily designed and manufactured by us. We also supply value-added electronic products to third parties for adjacent areas within the automotive interior. In addition, Gentherm manufactures and supplies electronic control units for memory seat modules that include electric motor position sensing technology. This technology further applies to other automotive products requiring fine motor controls.
Valve Technology
Designed and developed with our extensive expertise in advanced injection molding, our passive and active valves are mechanical, spring-loaded or use solenoids for actuation and pneumatic, as well as the innovative Shape Memory Alloy ("SMA") technology to actuate to control a variety of critical applications, including fuel management, motor engine flap control and brake vacuum support.
Solutions
ComfortScale™
ComfortScale is our next generation proprietary combined thermal, lumbar and massage system. The flexible design provides the ability to be foam and seat agnostic and can run across all OEMs and Seat Tier 1’s. The scalable and modular system can be designed from lumbar only to fully contented pneumatic and thermal solutions. ComfortScale is expected to drive significant performance improvement and meaningful reduction in complexity, labor costs and logistic costs. Gentherm secured its first ComfortScale award on General Motor's future full size truck platform that includes the Chevrolet Silverado and the GMC Sierra.
ClimateSense®
ClimateSense is an integrated comfort system designed to create a personalized microclimate for passengers using localized convective, conductive and radiative heating and cooling products. Using automatic regulation technology in combination with our unique occupant-centric control algorithm, ClimateSense offers the ability to personalize and improve overall occupant thermal comfort, improve time to comfort with (all-electric) pre-conditioning, provide comfort with less energy consumption thereby lowering greenhouse gas emissions by conventional internal combustion and hybrid powertrains, and extend range for electrified powertrains through a reduction in central heating, ventilation and air conditioning system usage. Our first production vehicle awards for our ClimateSense technology has launched on the Cadillac Escalade IQ and the Cadillac CELESTIQ.
WellSense™
In January 2024, Gentherm introduced WellSense, a software defined consumer experience that delivers customized in-cabin comfort sensations that promote wellness and well-being. The technology we are developing leverages science-based physiology research as the foundation for proprietary software that orchestrates heating, cooling, lumbar and massage comfort effectors. WellSense delivers enhanced wellness and well-being sensations in product offerings suitable for software defined vehicles and over-the-air feature upgrades for all vehicle configurations. The WellSense software development kit can be combined with additional vehicle features like in-cabin audio, visual and aromatic stimulation to deliver unique sensations that go beyond traditional comfort regulation to help promote individual wellness and well-being.
Products
Climate & Comfort Solutions – Climate Controlled Seats (CCS®)
CCS
Gentherm offers a range of CCS products utilizing proprietary technologies for regulating temperature and enhancing the comfort of vehicle passengers. Our CCS Vent products move air through the seat to provide conditioning. Our CCS Active products utilize TEDs to heat and cool air used to condition the seat. The conditioning air circulates by one of our specially designed air moving devices through an air distribution system installed in the seat cushion and seat back, so that the seat surface can be heated, ventilated or cooled. Each seat has individual electronic controls to adjust the level of heating, ventilating or cooling. Our CCS products improve comfort compared with conventional vehicle cabin air conditioners by focusing heating and cooling directly on the passenger through the seat.
By offering different models of the CCS product, our customers have the opportunity to purchase a wider range of climate control products at different price points. Sales of CCS products, primarily CCS Vent products, contributed 32%, 33% and 35% to our total product revenues for the years ended December 31, 2024, 2023 and 2022, respectively.
CCS Heat
Heated seats, based on our resistive heater core technology, are seamlessly integrated into automotive seat designs, and are constructed using materials that offer the best capacity, installation characteristics and durability. Our design and manufacturing capabilities allow customers to choose among a variety of resistive heater materials based on their individual vehicle specifications. Sales of CCS Heat products contributed 20%, 21% and 24% to our total product revenues for the years ended December 31, 2024, 2023 and 2022, respectively.
CCS Neck Conditioner
Intelligent neck conditioning systems ventilate warm or cabin temperature air directly onto the passenger’s neck and shoulder area. The system combines electronics, air moving device technologies and a PTC heating element into a compact, integrated headrest design that can be adjusted to suit the body size of the passenger.
Climate & Comfort Solutions – Climate Controlled Interior (CCI™)
CCI Steering Wheel Heat
Heated steering wheels deliver heating comfort to automobile drivers through resistive elements. This product can be applied to both leather and wood steering wheels and is a solution for drivers in cold and mild weather climates.
CCI Automotive Heated Interior
Gentherm’s thermally conductive or radiative surfaces, such as door panel armrest and center console armrest products, are powered by our core technologies. The system is thermally managed by a heating control system which can be discretely located in the door panel or seat of the vehicle. Heated door panels and armrests complement our climate-controlled seat and steering wheel products and provide a superior level of thermal comfort to the driving experience.
Climate & Comfort Solutions – Pneumatic Controlled Seats (PCS™)
Gentherm's seat ergonomics system consists primarily of pneumatic lifting elements (air bladders) which are mounted under the surface of seat cushion and back. Through the cyclical inflation and deflation of the lifting elements, the contour of the seat cushion is selectively modified. The lifting elements are controlled by valves, utilizing software that can be enabled in modes by the vehicle occupant in accordance with their preferences and specific body types to provide lumbar and massage comfort solutions.
Gentherm’s breakthrough and award-winning technology, Puls.A™, uses precision micro air pressure bursts to deliver a soothing, pulsating massage that lets drivers and passengers enjoy deep, personal relaxation on every trip. This is entering OEM production and further accelerates the evolution of the vehicle comfort experience.
Climate & Comfort Solutions – Electronics Solutions
Memory Seat Modules
Gentherm has developed a unique way to control certain electrical motors in a vehicle. Our Intelligent Positioning System (IPS®) product suite utilizes proprietary software to determine the position of a power seat and control the memory seat module.
PilotSense Hands-On Detection
All vehicles manufactured with autonomous driving level 2 or higher capabilities are required to ensure that the driver stays in control of the vehicle during operation. To accomplish this task, Gentherm developed PilotSense – a sensor integrated into the steering wheel that monitors whether the driver’s hands are maintaining contact with the steering wheel. This product is available for both heated and non-heated steering wheels.
Battery Performance Solutions
Cell Connecting Technology
Cell connecting technology provides secure connections between advanced automotive batteries to transmit a continuous flow of information about battery temperature and cell voltage during the charging and discharging process to monitor battery system performance. Gentherm has developed a range of cell connecting system products, including flexible foil cell connecting boards that offer improved packaging, weight and functionality. We offer these products in a variety of materials to cover customers’ requirements.
Thermoelectric Battery Thermal Management
Thermal management is critically important for the long-term operation of advanced automotive batteries. The expansion of electrified vehicle applications, such as electric vehicles, plug-in hybrids and mild hybrids, have increased the demand for battery thermal management (“BTM”) systems that enable wider operating temperature ranges, enhanced driving range and prolonged life of the battery. Gentherm’s BTM system can provide precision battery cooling of 48-volt mild hybrid systems on pack or cell-level using patented TED technology. The BTM system maintains the temperature of the lithium-ion battery or other advanced chemistry battery within an acceptable temperature range without the use of chilled liquids or refrigerant loops, making it a light weight, highly scalable, compact solution ideal for automotive applications. Gentherm’s proprietary BTM system is compact and energy efficient, resulting in a minimal energy usage, which is important for an electrified vehicle.
Aside from battery cooling, Gentherm’s BTM portfolio includes battery heating applications. Based on our proprietary technology, we offer solutions to our customers that enable efficient heating of lithium-ion batteries for most electrified vehicles.
Automotive Cable Technology
Gentherm manufactures cable systems used to connect automotive components to power sources. The cable systems are an important element in the production of many of our products and form a significant component in how we generate value to our customers by being an efficient, low-cost and high-quality manufacturer. We offer cable systems as integrated parts of our products and also as stand-alone components for other automotive applications, such as oxygen sensors. Our cable systems business includes both ready-made individual cables and ready-to-install cable networks.
Valve Systems
Gentherm has deep expertise in valve management, providing intelligent solutions for applications in engine systems, brake systems and fuel management such as actuators, thermal management valves, crank case ventilation valves, non-return valves, mechanical switching valves, servo assistance valves, fuel limit vent valves, roll over valves and drain valves. We have many years of experience in precision injection molding and valve technology, which include innovative technologies such as the SMA actuating elements. Due to our modular systems, we implement customized adaptations at attractive costs and are prepared to address future global regulatory emissions requirements.
Patient Temperature Management Systems
Gentherm provides healthcare professionals with superior temperature management solutions and clinical expertise that improve patient outcomes, increase the standard of care and enhance patient satisfaction. We provide a full portfolio of patient temperature management systems that utilizes air, water and resistive technologies across multiple product categories addressing the needs of hyper-hypothermia therapy in intensive care, normothermia in surgical procedures and additional warming/cooling therapies utilized in acute and chronic care departments and non-hospital facilities. Our core brands include Blanketrol®/Kool-Kit®/Maxi-Therm® Lite hyper-hypothermia system, WarmAir®/FilteredFlo® convective warming system, Astopad® resistive patient warming system (leveraging technology used in our automotive products), Electri-Cool®/Micro-Temp® localized cooling/warming systems, Astotherm®/Astoflo® IV fluid and blood warming systems, and Hemotherm® cardiovascular cooling/warming system that delivers precise blood temperature control during cardiopulmonary by-pass and other related cardiovascular procedures.
Automotive Customers
Our Automotive segment customers primarily include light vehicle OEMs and Tier 1s. We also directly supply CCS products to aftermarket distributors and installers.
The Company’s automotive marketing is directed primarily at the OEMs and their Tier 1s and focuses on the enhanced value consumers attribute to vehicles with thermal and pneumatic lumbar and massage comfort solutions. In many cases, the OEMs direct us to work with their suppliers, primarily their Tier 1s, to integrate our products into the vehicle’s seat or interior design. As an independent supplier we can work with any OEM and any seat manufacturer to create scores of innovative and unique configurations for all of their applications.
Once the integration work is complete, prototypes are sent to the OEMs for evaluation and testing. If an OEM awards us the business, a program can then be launched for a particular model on a production basis, but it normally takes one to three years from the time an OEM decides to include any of our products in a vehicle model to actual production for that vehicle. During this process, we derive funding from prototype sales but obtain no significant revenue until mass production begins. Upon commencement of mass production, our products are sold by Tier 1s to the OEMs. Inherent to the automotive supplier market are costs and commitments that are incurred well in advance of the receipt of orders and resulting revenues from customers.
The volume of products we sell is significantly affected by global and regional automotive production levels and the general business conditions in the automotive industry. Our product revenues are generally based upon purchase orders issued by our customers, with updated production schedules for volume adjustments. As such, we typically do not have a backlog of firm orders at any point in time. Once we are selected to supply products for a particular platform, we typically supply those products for the platform life, which is normally five to ten years, although there is no guarantee that this will occur. In addition, when we are the incumbent supplier to a given platform, we believe we have a competitive advantage in winning the redesign or replacement platform, although there is no guarantee that this will occur.
For 2024, our revenues from sales to our two largest customers, Lear Corporation (“Lear”) and Adient plc (“Adient”) were $231 million and $157 million, respectively, representing 16% and 11% of our product revenues, respectively. Revenues from Lear and Adient represent sales of our climate and comfort solutions. Lear is a direct competitor to Gentherm as part of a vertical integration strategy. The loss of or significant reduction of business from Lear or Adient, would likely have a material adverse impact on our business, results of operations and cash flows.
As noted above, in many cases automotive OEMs direct their suppliers such as Lear and Adient to work with us. Combined, approximately 66% of product revenues to these customers was sourced directly by the OEMs. It is, therefore, relevant to understand how our revenues are divided among the OEMs, as shown below.
Our total product revenues for each of the past three years were divided among the OEMs as follows:
| | | | | | | | | | | | |
| | 2024 | | | 2023 | | | 2022 | |
General Motors | | | 13 | % | | | 13 | % | | | 15 | % |
Volkswagen | | | 12 | % | | | 9 | % | | | 9 | % |
Hyundai | | | 9 | % | | | 10 | % | | | 11 | % |
Ford Motor Company | | | 9 | % | | | 7 | % | | | 8 | % |
BMW | | | 8 | % | | | 8 | % | | | 7 | % |
Mercedes-Benz | | | 7 | % | | | 8 | % | | | 7 | % |
Global EV manufacturer | | | 5 | % | | | 4 | % | | | 2 | % |
Honda | | | 4 | % | | | 4 | % | | | 4 | % |
Stellantis | | | 4 | % | | | 6 | % | | | 8 | % |
Jaguar/Land Rover | | | 4 | % | | | 3 | % | | | 3 | % |
Other (including Medical) | | | 25 | % | | | 28 | % | | | 26 | % |
Total | | | 100 | % | | | 100 | % | | | 100 | % |
Production and Suppliers
Our global manufacturing and distribution facilities are located close to our key customers and strategically in low cost regions. In Automotive, we operate five manufacturing sites in Europe located within North Macedonia, Ukraine, Germany and Czech Republic and one distribution center located in Hungary. In North America, we operate three manufacturing sites in Mexico. In Asia, we operate three manufacturing sites in China and one in Vietnam, and one distribution center in South Korea. Further, we are in the process of continuing to optimize our footprint with investments in two new manufacturing plants, one in Morocco and one in China.
For Medical, we operate three manufacturing sites within China, Germany and the United States.
We procure our raw materials from a variety of suppliers around the world. In the normal course of business, we do not carry substantial inventories of these raw materials in excess of levels reasonably required to meet our near-term production requirements.
Proprietary Rights and Patents
The development of new or improved technologies is critical to the execution of our business strategy. Currently owned patents and patents obtained for new or improved technologies form an important basis for the success of the Company and underpin the success of our research and development efforts. We have adopted a policy of obtaining, where practical, the exclusive rights to use technology related to our products through patents or licenses for proprietary technologies or processes. We adapt and commercialize such technologies in products for mass production. We also have developed technologies or furthered the development of acquired technologies through internal research and development efforts.
As of December 31, 2024, Gentherm held 426 issued patents, of which 214 were U.S. patents and 212 were non-U.S. patents. These patents are directed to our climate control products and thermoelectric technologies, battery cell connecting and cable technologies, massage and lumbar technologies, air moving devices, heating technologies, occupant sensing technologies, fluid valve technologies, electronic technologies and medical technologies. The Company continuously evaluates its patents and makes strategic decisions to reduce low-value patents and patents unrelated to current or planned business strategies, while still increasing patent use in-line with our current and planned business strategies.
Competition
Gentherm faces competition from other automotive suppliers and, with respect to certain products, from the OEMs and Tier 1s who manufacture or have the capability to manufacture certain products that Gentherm manufactures and supplies. The automotive supply industry competes on the basis of technology, quality, reliability of supply, design, engineering capability and competitive pricing. The overall number of our automotive competitors has increased in recent years, primarily in China, and the automotive technology and components industry remains extremely competitive. The competitive landscape for patient temperature management systems includes patient temperature management medical device manufacturers.
We believe our expertise in core thermal management and pneumatic comfort technologies, as well as our capability in applying specific component design, global footprint and broad product offerings, make us well positioned to compete against the traditional
thermal management systems and pneumatic comfort suppliers, global Tier 1s and component specialists. OEM customers are expressing a desire for a combined thermal and pneumatic lumbar product, especially from an independent supplier who integrates with many seating providers. This is one of the unique value propositions that Gentherm offers.
See further discussion of the risks relating to competition in Item 1A, “Risk Factors” in this Annual Report.
Seasonality
Our principal operations are directly related to the automotive industry. Consequently, we have historically experienced seasonal fluctuations to the extent automotive vehicle production slows, such as in the summer months when many customer plants close for model year changeovers and in December when many customer plants close for the holidays.
Human Capital Management
Employees
At Gentherm, our mission is to “create and deliver extraordinary solutions that make meaningful differences in everyday life, by improving health, wellness, comfort and energy efficiency.” Our people are the foundation for making our mission come to life every day. Our human capital strategy is focused on creating the right working environment and developing the right skill sets to advance our performance culture and unlock our innovation and growth strategy. We also strive to promote a safe work environment and a culture that values engagement, inclusion and belonging.
Board Oversight
Our Board of Directors and its Committees provide oversight on a broad range of human capital management topics, including corporate culture, talent and succession planning, pay equity, health and safety, training and development, total rewards and engagement and belonging.
People Demographics
Our global workforce creates a competitive advantage and operates in more than 30 locations across 13 countries. As of December 31, 2024, and 2023, Gentherm’s employment levels worldwide were as follows:
| | | | | | | | |
| | 2024 | | | 2023 | |
Mexico | | | 5,478 | | | | 5,013 | |
North Macedonia | | | 2,416 | | | | 2,677 | |
China | | | 1,734 | | | | 1,916 | |
Ukraine | | | 1,520 | | | | 1,684 | |
Vietnam | | | 1,244 | | | | 1,142 | |
Germany | | | 576 | | | | 643 | |
United States | | | 481 | | | | 635 | |
Hungary | | | 355 | | | | 355 | |
Czech Republic | | | 318 | | | | 361 | |
Morocco | | | 52 | | | | — | |
Korea | | | 48 | | | | 44 | |
Japan | | | 14 | | | | 20 | |
United Kingdom | | | 8 | | | | 6 | |
Malta | | | 2 | | | | 8 | |
Total | | | 14,246 | | | | 14,504 | |
Key Highlights of our Human Capital Strategy
In November 2023, we completed our second global engagement survey with a participation rate of 89%. In 2024, we developed leader driven action plans to build on momentum made from our engagement surveys. In recent years we have made progress in manager relationship, performance management and overall confidence in the company. We also created specific location action plans to provide our workforce with a voice in improving our culture and engagement.
Health and Safety
At Gentherm, our “Safety Culture” has become a core strength. Our Vision Zero strategy helped us achieve significant progress in reducing accidents across our sites.
Engagement and Belonging
Our engagement and belonging mission, “Embracing Inclusion Inspires Innovation” cascades from our corporate mission. Our Engagement and Belonging Council has built strong momentum. We took another step forward on this journey by building the framework to drive process and program consistencies across all sites and harness best practices from our employees across the globe. Our goals are ensuring all team members are educated to consistent standards, identifying feedback mechanisms to solve conflicts, and creating a culture of engagement.
Total Rewards
Gentherm’s compensation and benefits programs are designed to attract and retain our employees in the locations where we compete for talent using a mix of elements that allow us to achieve our Company’s short and long-term goals.
▪We provide employee wages that are competitive and consistent with employee positions, skill levels, experience, knowledge and geographic location.
▪We align our executives’ and eligible employees’ annual bonus opportunity and long-term equity compensation with our shareholders’ interests by linking realizable pay with company financial and stock performance.
Total Talent Development
In 2024, we launched a global learning platform and provided employees with tailored resources and development opportunities. Alongside enhanced career planning initiatives, we empowered our workforce with clear growth pathways and tools for success. Employees completed over 500,000 hours of training in 2024, reflecting our commitment to continuous learning and development.
Environmental and Regulatory Compliance
Applicable laws and regulations, and significant changes to such laws and regulations, will potentially lead to increases in costs and complexity, and failure to comply with global and specific country regulations could subject us to civil penalties, production disruptions, or limitations on the sale of affected products. We believe we are materially in compliance with substantially all these requirements or expect to be materially in compliance by the required dates.
Chemical Regulation
There are numerous global laws and regulations that prohibit or restrict the selection and use of certain chemicals for product development and manufacturing and potentially impact an automobile manufacturer’s responsibility for vehicle components at the end of a vehicle’s life. New chemical regulations continue to be introduced and passed, such as the European requirements that require suppliers of parts and vehicles to the European market to disclose certain substances of concern in parts. Further, increases in the use of circuit boards and other electronics may require additional assessment under the directives related to certain hazardous substances and waste from electrical and electronic equipment.
Vehicle Safety
In the U.S., the National Traffic and Motor Vehicle Safety Act of 1966 (the “Safety Act”) regulates motor vehicle equipment that we manufacture and sell as well as vehicles. The Safety Act prohibits the sale in the United States of any new vehicle or equipment that does not conform to applicable federal motor vehicle safety standards established by the National Highway Traffic Safety Administration (“NHTSA”). The Safety Act further requires that if a vehicle manufacturer or NHTSA determine a vehicle or an item of vehicle equipment does not comply with a safety standard, or that vehicle or equipment contains a defect that poses an unreasonable safety risk, the vehicle manufacturer must conduct a safety recall to remedy that condition in the affected vehicles. Should a vehicle manufacturer or NHTSA determine a safety defect or noncompliance issue exists with respect to any of our products, the cost of such recall campaigns could be substantial. Further, many other countries have established vehicle and vehicle equipment safety standards and regulations. Meeting or exceeding the many safety standards is costly as global compliance and non-governmental assessment requirements continue to evolve and grow more complex, and lack harmonization globally.
ITEM 1A. RISK FACTORS
You should carefully consider each of the risks, assumptions, uncertainties and other factors described below and elsewhere in this Annual Report, as well as any amendments or updates reflected in subsequent filings with the SEC. We believe these risks, assumptions, uncertainties and other factors, individually or in the aggregate, could cause our actual results to differ materially from expected and historical results and could materially and adversely affect our business operations, results of operations, financial condition and liquidity.
Industry and Operational Risks
We operate in a highly competitive industry and efforts by our competitors, as well as new entrants to the industry, could adversely affect our business, results of operations and financial condition.
The automotive component supply industry is subject to intense competition. Business is typically awarded to the supplier offering the most favorable combination of cost, quality, timely delivery, technological innovation and service. There can be no assurance that we will be able to compete successfully with the products of our competitors. Our competitors’ efforts to grow market share could exert downward pressure on our product pricing and margins. Vertical integration by competitors and customers, as well as within our supply chain, could complicate and impact sourcing decisions by our customers and adversely affect our sales. Lear, our largest customer, has recently implemented a vertical integration strategy that has resulted in Lear becoming a direct competitor. Other of our customers may also increase levels of production insourcing and compete directly with us for a variety of reasons, such as shifts in business strategies or the emergence of low-cost production opportunities in other countries, which may adversely affect our sales as well as the profit margins on our products. Further, we are experiencing increased competition from Chinese-based component suppliers that are developing relationships with Chinese-based OEMs, which are growing market share in China, and are expanding in key global markets, including Europe and North America.
The material reduction in sales from any of our principal customers, due to acquisition activity, insolvency or otherwise, could materially and adversely affect our business, results of operations, cash flows and financial condition.
For the year ended December 31, 2024, our top two customers were Lear and Adient, which comprised 16% and 11%, respectively, of our product revenues. Combined, approximately 66% of product revenues to these customers was sourced directly by the OEMs. Our products supplied to General Motors and Volkswagen represented 13% and 12% of our total product revenues for the year ended December 31, 2024. The continued growth, viability and financial stability of our principal customers, as well as the OEMs to which our products are supplied, are critical to our success. The loss of any significant portion of our sales from either of these customers or other significant customers, whether due to acquisition activity, insourcing, insolvency or otherwise, would have a material adverse effect on our business, results of operations, cash flows and financial condition. We sometimes experience, and we expect to continue to experience, a delay in our collection of accounts receivable balances from our customers, which may be significant and could be at risk in the event of their bankruptcy or other restructuring.
Our ability to attract and retain talented, diverse and highly skilled employees is critical to our success and competitiveness, and attracting and retaining such employees has caused and could continue to cause an increase in labor costs and may be adversely impacted by current macroeconomic factors in the automotive industry.
Our success depends on our ability to recruit and retain talented and diverse employees who are highly skilled in their areas. In particular, our technologies and products increasingly rely on software and hardware that is highly technical and complex and the market for highly skilled workers and leaders in our industry is extremely competitive and costly. While compensation considerations remain important, current and potential employees are increasingly placing a premium on working for companies with strong brand reputation, flexible work arrangements, and other considerations, such as embracing sustainability and engagement, inclusion and belonging initiatives. The difficulty of attracting, hiring, developing, motivating and retaining highly qualified and diverse employees throughout our Company has caused and could continue to cause increases in the cost of labor due to wage inflation. Failure to continue attracting and retaining such highly qualified and diverse employees could further increase labor costs, disrupt our operations and adversely affect our strategic plans. In addition, direct labor costs have continued to rise in Mexico and other locations. Further, prolonged labor shortages that we have experienced and may continue to experience can adversely impact existing employees, which enhances the challenges of retention and labor expense.
For employees in director positions and above, we utilize equity awards as a significant portion of such employees’ overall compensation in order to attract, retain and motivate them, as well as align their interests with our shareholders. However, our common stock, no par value ("Common Stock"), has declined in value significantly in recent years, in part due to the macroeconomic challenges impacting the automotive industry, and if the value of our Common Stock does not increase in value or declines further, our ability to recruit or retain qualified personnel may be hindered, which could adversely affect our business and prospects.
Additionally, we have implemented several restructuring actions in recent years, and we may undertake additional restructuring actions in the future, to reduce global overhead costs and optimize our manufacturing footprint, which has involved the reduction of our employee workforce in certain locations (while increasing our workforce at other facilities). Such restructuring actions may adversely affect our ability to recruit, retain and motivate skilled personnel. Such restructuring actions may also be distracting to employees and management and may negatively impact our business operations, reputation, or ability to serve our customers.
Labor shortages, work stoppages and additional workforce disruptions impacting us, our suppliers or customers periodically have disrupted our operations and our growth strategies, and resulting increases in labor and related operating costs may adversely impact our financial performance.
Labor shortages, work stoppages and additional workforce disruptions due to illness, quarantines and absenteeism, including ours and those at our suppliers or customers, periodically have disrupted our business and adversely impacted our financial performance. Because the automotive industry relies heavily on “just-in-time” delivery of components, labor shortages or work stoppages at one or more of Gentherm's production facilities or those of our suppliers could have adverse effects on the business and financial results. Similarly, the purchase of our products may be limited if one or more of our direct customers or an OEM were to experience labor shortages or work stoppages, which could result in the temporary shutdown of the related Gentherm production facilities or other restructuring initiatives.
Approximately 35% of the Company's workforce are members of industrial trade unions or worker councils and we believe a significant percentage of employees of our largest customers and suppliers are members of such organizations, all of whom are employed under the terms of various labor agreements. A union strike or inability to enter into a new labor agreement prior to expiration of an existing agreement could have an adverse impact on us or our suppliers or customers.
Our inability to effectively manage the development, timing, quality and costs of new product launches could adversely affect our financial performance.
Gentherm continues to invest significantly in developing and launching new products and related technologies, including software, through internal research and development, and from acquisitions and investments in joint ventures. Further, winning new business awards will include specific customer requirements regarding, among other things, timing, performance and quality standards. The launch of new products and technologies is complex, the success of which depends on a wide range of factors, including the capacity of our internal teams, robustness of our product and manufacturing process development, success in sourcing new components and commodities with suitable suppliers, readiness of our and our suppliers' manufacturing facilities and manufacturing processes, as well as factors related to tooling, equipment, employees, initial product quality and other factors. New launches have become more frequent and even more complicated given the increased use of advanced electronics that must be integrated throughout a vehicle. Given the complexity of new product and technology launches, we may experience difficulties managing product quality, timeliness and associated costs.
The process of designing and developing new technology, products and services is costly and uncertain and requires extensive capital investment. In addition, new program launches require a significant ramp up of costs up to a few years prior to sales of such products. However, our sales related to these new programs generally are dependent upon the timing and success of our customers’ introduction of new vehicles, which in recent years has been adversely impacted by challenging automotive market conditions. Our inability to effectively manage the timing, quality and costs of these new program launches could have a materially adverse effect on our business, results of operations and financial condition.
To the extent we are not able to successfully launch new business, or if we are unable to prevent or effectively remedy errors, bugs, vulnerabilities or defects in our new products and technologies, vehicle production at our customers could be significantly delayed or shut down. Such operating failures could result in significant financial penalties to us or a diversion of personnel and financial resources to improving or fixing launches rather than investment in continuous process improvement or other growth
initiatives, and could result in our customers shifting work away from us to a competitor. Any of the foregoing matters could result in a significant loss of revenue and market share and could have an adverse effect on our profitability and cash flows.
Our ability to grow our product portfolio successfully depends on the sustained acceptance of new products and technologies that we invest in by existing and potential customers and consumers, as well as the success of our customers.
Growing our product portfolio is core to our business, and we regularly identify and evaluate potential new products and technologies to add to our product offerings. In such growth efforts, we have been, and will continue to be, required to educate potential customers and demonstrate that the merits of additional products and technologies we develop, acquire or license justify the costs associated with them. Customers will only adopt new products and technologies if there appears to be significant consumer demand at proposed pricing, and some OEMs may develop their own, be slow to adopt or may never adopt such products and technologies. Further, some of our new products and technologies require OEMs to adopt new ways of developing systems for vehicle interiors, and some OEMs may develop their own, be slow to adopt or may never adopt such products and technologies.
For our automotive products, we rely on OEMs and applicable dealer networks to market new products and technologies to consumers, and we do not have any control over the applicable marketing budget or messaging nor the training of employees and agents. Further, OEMs and dealer networks may market competitive products and technologies offered by our competitors, including those manufactured by such OEMs, in lieu of or in addition to our products and technologies. If customers or consumers conclude that the new products and technologies that we have identified and developed are unnecessary or too expensive or that our competitors offer more favorable sales terms or better products, OEMs and other customers may reduce availability or decline to include our new products in their vehicles. Without acceptance of such products by customers and consumers, our ability to sustain growth in our product portfolio will be inhibited, which could have a material adverse effect on our results of operations, financial condition, business and business strategy.
Although adoption has progressed at a slower rate than expected, there is ongoing significant competition to address the evolution of the automotive industry, including development and use of electric vehicles, autonomous vehicles and mobility on demand services and related software products, and our failure to adapt our strategies and operations successfully could have a material adverse effect on our business, results of operations and financial condition.
The global automotive industry is experiencing a period of significant technological change. While the evolution has progressed at a rate slower than previously expected, we have made and continue to make significant investments to develop, acquire and properly scale the manufacturing of technologies and products that will enhance our long-term competitiveness. Automotive vehicle production has been and is expected to be affected significantly by additional industry or consumer behaviors, including the development and use of autonomous and electric vehicles ("EV"), the cost and accessibility of energy for EV consumption and increasing use of car and ridesharing and on-demand transportation as a service and related software products, as well as complex new regulations. Due to the lower-than-anticipated industry-wide EV adoption rates and near-term pricing pressures, many OEMs and the automotive component supply industry have adjusted spending, production, and/or product launches to better match the pace of such adoption. There have also been certain technology barriers that are detrimental to EVs reaching pricing parity with ICE vehicles. Future EV adoption may also be impacted by, among other factors: perceptions about EV features, quality, safety, performance and cost relative to ICE vehicles; the availability of EV raw materials and components; the range over which EVs may be driven on a given battery charge; the proliferation and speed of charging infrastructure; cost and availability of high fuel-economy ICE vehicles; volatility, or a sustained decrease, in the cost of petroleum-based fuel; and the failure by governments and other third parties to make the investments necessary to make infrastructure improvements or to provide economic incentives promoting the adoption of EVs. Our current financial performance and future operating and financial success will be materially impacted by our ability to execute our strategies addressing the evolution of the automotive industry and customer utilization of personal transportation, including at a pace that aligns with customers and consumers.
In addition, the evolving nature of the markets in which we compete has attracted, and may continue to attract, new entrants, including new entrants from outside the traditional automotive supply industry. These new entrants or our traditional competitors may foresee the course of market developments and customer preferences more accurately than us, develop superior products and technologies, produce similar products at a lower cost, or adapt quicker to new industry technologies. If we do not accurately predict, prepare for and respond to new kinds of technological innovations, market developments and changing customer needs, are unable to appropriately allocate resources to match such developments, or are otherwise unable to successfully execute our EV strategy, our
long-term competitiveness could be harmed significantly and our business, results of operations, financial condition and product growth could be materially and adversely impacted.
The automotive industry, our primary market, is cyclical and is significantly impacted by macroeconomic, geopolitical and similar global factors, and a decline in the production levels of our major customers and OEMs, particularly with respect to automotive light vehicle production in our key markets and models for which we supply significant amounts of product, could materially and adversely affect our business, results of operations and financial condition.
Our Automotive segment represents 97%, 97% and 96% of our product revenues for the years ended December 31, 2024, 2023 and 2022, respectively. Demand for our automotive products is significantly impacted by light vehicle production in key markets of North America, Europe, China, Japan, and Korea, and is ultimately dependent on consumer demand for automotive vehicles, our content per vehicle, and other factors that may limit or otherwise impact production by us, our supply chain and our customers. Automotive sales and production are cyclical and are materially affected by macroeconomic, geopolitical and industry conditions that are outside of our control and the control of our customers and suppliers. These conditions include monetary fiscal policy, economic recessions, inflation, political instability, labor relations issues, energy prices, regulatory requirements, government initiatives, trade restrictions and agreements, capital and liquidity constraints, ongoing geopolitical conflicts, acts or war and terrorism, and natural and man-made disasters, such as the current conflicts between Russia and Ukraine, in the Middle East, and heightened tensions in the Red Sea and South China Sea. In recent years, automotive light vehicle demand and production have been materially impacted by the unexpected shifting demand and plans for EV and the mix of ICE and EV programs .We, like other manufacturers, have a high proportion of fixed structural costs, and therefore relatively small changes in industry vehicle production can have a substantial effect on our financial results. When automotive light vehicle production in our key markets and our sales decline to levels significantly below our planning assumption, as we have experienced periodically, including in 2024, our financial condition, results of operations, and cash flow has been adversely affected. Our operational costs are similarly impacted by such macroeconomic, geopolitical and industry conditions, which has and may continue to adversely impact our margins and profitability.
Our business in China may be subject to aggressive competition and is sensitive to economic, political, and market conditions.
Maintaining a strong position in the Chinese market is a key component of our global growth strategy. The automotive supply market in China is highly competitive, with competition from many of the largest global manufacturers and numerous smaller domestic manufacturers. Domestic Chinese OEMs have continued to expand their market share in China, and as a result, several non-Chinese OEMs have experienced declines in revenue and market share. As the Chinese market evolves, we anticipate that market participants will act aggressively to increase or maintain their market share. Increased competition may result in price reductions, reduced margins and our inability to gain or hold market share. Our business in China is sensitive to economic and market conditions that drive automotive sales volumes in China. Recently, automotive sales volume in China has been growing at a minimal rate, and our business may be impacted if the growth in vehicle demand does not increase at a higher rate or is reduced. If we are unable to maintain our position in the Chinese market or if vehicle sales in China continue to experience minimal growth or decrease, our business and financial results could be materially adversely affected.
Our operations within Ukraine subject us to risks that may harm our operations and financial results.
The conflict between Russia and Ukraine, and certain measures taken in response, have impacted the availability and prices of certain raw materials and energy (especially in Europe) and have led to various economic sanctions, which could have a lasting impact on regional and global economies. Our facility in Vynohradiv, Ukraine is on the far western corner within the Transcarpathia region near the Hungary border. In 2024 and 2023, products manufactured at our Ukraine facility represented approximately 6% of the Company’s total revenue, including automotive cables, seat heaters and steering wheel heaters. At this time, our Ukraine facility is operating at normal levels and we continue to execute contingency plans and, in coordination with certain customers, specific equipment and production relocations leveraging our flexible global manufacturing footprint. Certain of our employees in Ukraine are routinely conscripted into the military and/or sent to the Russian border to fight in the ongoing conflict. We have incurred, and will likely continue to incur costs to support our employees and relocate equipment and production based on customer and company needs. We have also experienced and may continue to experience interruptions in power supply at our Ukraine facility. We have contingency measures in place to address intermittent power supply interruptions, however, extended interruptions could significantly impact our ability to operate the facility. Further, most of our products manufactured in Ukraine are shipped across the border from Ukraine to Hungary for further delivery to our customers. If that border crossing were to be closed or restricted for any reason, we may
experience a significant disruption to our operations. Our response to the ongoing conflict is based on a severity level contingency response plan that has been developed with certain customers. As the situation in Ukraine is very fluid, we continue to monitor its effects on our business and we continue to work closely with our customers to adjust our contingency response as necessary.
Although the length and impact of the ongoing military conflict is highly unpredictable, the conflict in Ukraine has led to and could lead to further market disruptions, including significant volatility in the prices and availability of certain commodities and energy, volatility in credit and capital markets, interruptions in our supply chain, increased costs and reduced availability of labor, materials and components, result in impairment of tangible assets and implementation of restructuring activities, and may impair our ability to complete financial or banking transactions. Any of the foregoing factors could have a material adverse effect on our business, financial results and stock price.
The global automotive supply chain has been adversely impacted by raw material and component shortages, manufacturing disruptions and delays, logistics challenges and tariffs, inflationary and other cost pressures, and we expect such conditions to continue to adversely affect our business, profitability and results of operations.
Our products contain a significant number of components that we source globally from suppliers who, in turn, source components from their global suppliers. The availability of raw materials and product components fluctuates due to factors outside of our control, including supply and demand imbalances, geopolitical and macroeconomic factors, labor disruptions or shortages, trade laws and tariffs, natural disasters, and global pandemics, which has and we expect will continue to impact the ability of our supply chain to meet our production requirements and therefore our ability to meet the production demands of our customers. In some instances, we purchase components, raw materials and parts that are ultimately derived from a single source and may be at an increased risk for supply disruptions. If our supply chain fails to deliver products to us in sufficient quality and quantity on a timely basis, we will be challenged to meet our production schedules and fulfill our orders due to the “just-in-time” manufacturing process that is broadly utilized in our industry, which would decrease sales and profits and could damage our commercial reputation and customer relationships. Furthermore, sudden changes in the production schedules of OEMs and Tier 1s caused by raw material and component shortages also have resulted and may continue to result in operating inefficiencies, which could adversely affect our profitability and results of operations. Additionally, if we are the primary cause for a customer being forced to halt production, the customer may seek to recoup all of its losses and expenses from the Company. Similarly, OEMs and Tier 1s to whom we supply our products are dependent on an ever-greater number of global suppliers to manufacture and sell their products to consumers, which drives sales of our products.
We also have experienced and we may continue to experience margin pressure due to the pricing of components and certain other raw materials, including due to inflation or supply-demand imbalances. Some of our products contain certain components, such as semiconductor chips, and other key raw materials including copper, silver and petroleum-based engineered plastics and raw materials, which generally cannot be substituted. The prices for these components and raw materials fluctuate depending on market conditions. If the market prices and related logistics costs (in particular for imported goods) for these components and raw materials remain higher than normal or they further increase (such as due to recent threats and proposed tariffs and other restrictive trade measures), our gross profit may continue to be adversely impacted, including to the extent our suppliers pass cost increases on to us that we cannot pass on in full to our customers in spite of our mitigation efforts.
We and our customers, and our respective supply chains have been adversely impacted by conflicts in the Middle East and heightened tensions in the Red Sea and South China Sea, resulting in increased working capital to find logistics solutions and causing delays in transit time, as well as impairing our ability to consolidate shipping company utilization for cost and operational efficiencies, which risks have increased since we have shifted significant manufacturing production around the world as part of our manufacturing optimization strategy. The foregoing challenges have adversely affected, and are expected to continue to adversely effect, our business, profitability, cash flow and results of operations.
Inflationary pressures impacting our transportation companies and other third parties have increased and may continue to increase our costs to deliver our products, and therefore adversely impacted our margins and profitability.
The automotive industry has experienced a period of sustained price increases for various transportation and other logistics services. These price increases are expected to continue into the foreseeable future due to continuing challenges with supply-demand imbalances. Although the Company has developed and implemented strategies to mitigate the impact of higher transportation and other logistics costs, these strategies, together with commercial negotiations with Gentherm's customers and suppliers, have not
historically and may not in the future fully offset our price increases, which may result in adverse impacts to the Company’s profitability and results of operations. We generally have been unable to raise prices to address in full the foregoing inflationary pricing pressures, together with price downs for our products that are customary in our industry, and therefore our margins and profitability have been and may continue to be adversely impacted.
Our inability to achieve product cost reductions which offset customer-imposed price reductions could adversely affect our financial performance.
Downward pricing pressure is customarily applied by automotive manufacturers to the automotive supply chain. Our customer contracts generally provide for annual price reductions over the production life of the vehicle, while requiring us to assume significant responsibility for the design, development and engineering of our products, as well as the costs incurred through our supply chain. Prices may also be adjusted on an ongoing basis to reflect changes in product content/costs and other commercial factors. Our inability to achieve product cost reductions that offset customer-imposed price reductions has and could continue to adversely affect our financial condition, results of operations and cash flows.
Security breaches and other disruptions to our information technology networks and systems, including a disruption related to cybersecurity, could interfere with our operations and could compromise the confidentiality of our proprietary information or personal information.
We rely on our information technology, communication networks, enterprise applications, accounting and financial reporting platforms and related systems in connection with many of our business activities. Some of these networks and systems are managed by third-party service providers and are not under our direct control. Our operations routinely involve receiving, storing, processing and transmitting sensitive information pertaining to our business, customers, suppliers, employees and other sensitive matters. We rely upon the capacity, reliability and security of our IT and data security infrastructure, as well as our ability to expand and continually update this infrastructure in response to the changing needs of our business. If we experience a problem with the functioning of an important IT system or a security breach of our IT systems, due to failure to timely upgrade systems or during system upgrades and/or new system implementations, or resulting from failures of our third-party service providers, the resulting disruptions could have an adverse effect on our business.
As with most companies, we have experienced cybersecurity incidents, attempts to breach our systems and other similar incidents, none of which were material in 2024. With a number of our employees working part-time remotely and in periods of significant acquisition integration activity, there may be increased opportunities for unauthorized access and cybersecurity incidents.
Any future cybersecurity incidents could, however: materially disrupt operational systems; result in loss of trade secrets or other proprietary or competitively sensitive information; compromise personally identifiable information regarding customers or employees; delay our ability to deliver products to customers; and jeopardize the security of our facilities. A cybersecurity incident could be caused by malicious outsiders (including state-sponsored espionage or cyberwarfare, which has become commonplace) or insiders using sophisticated methods to circumvent firewalls, encryption and other security defenses. Because techniques used to obtain unauthorized access or to sabotage systems change frequently and generally are not recognized until they are launched against a target, we may be unable to anticipate these techniques or to implement adequate preventative measures. Information technology security threats, including security breaches, computer malware, “ransomware” and other cybersecurity incidents, are increasing in frequency, uniqueness and sophistication to evade detection and remove forensic evidence of the incident, including due to emerging technologies such as artificial intelligence and machine learning, which may cause cybersecurity incidents to be more difficult to detect for periods of time or at all. Many victims of ransomware are forced to pay significant ransoms to regain access to their critical business data, and we may not be permitted under various regulations and laws to make such payments.
We continuously seek to maintain a robust program of information security and controls that we believe is designed to detect, reduce, and mitigate the risk of cybersecurity incidents; however, we may not be aware of all vulnerabilities or might not accurately assess the risks of incidents, and such preventative measures cannot provide absolute security and may not be sufficient in all circumstances or mitigate all potential risks, including potential production disruption or the loss or disclosure of sensitive information. The impact of a material cybersecurity incident could subject us to legal or regulatory sanctions and have a material adverse effect on our competitive position, reputation, results of operations, financial condition and cash flows.
We have implemented and maintain various information security processes designed to identify, assess and manage material risks from cybersecurity threats to our critical systems and our proprietary, strategic or competitive data, which we review for quality and effectiveness on a regular basis, but despite our implementation of security processes, our IT systems, like those of other companies, are vulnerable to intrusion or damages from computer viruses or worms, natural disasters (which may become more frequent due to climate change), unauthorized access, cybersecurity incidents, breaches due to errors, negligence or malfeasance by employees, contractors or others who have access to these systems and other similar disruptions. Any system failure, accident or security breach could result in disruptions to our operations and include the theft of our intellectual property, trade secrets, customer information, human resources information or other confidential information. The foregoing matters could cause significant damage to our reputation, affect our relationships with our customers, lead to claims against us, fines and other penalties assessed upon us by governmental authorities, and ultimately harm our business and financial performance. In addition, we may be required to incur significant costs to remediate and protect against damage caused by these disruptions or security breaches in the future.
Our global operations subject us to risks that may harm our operations and financial results.
In 2024, 65% of our product revenue was generated from sales to customers outside the United States (based on shipment destination), including Europe and Asia. Further, we have significant personnel, property, equipment and operations located outside of the United States. We also conduct certain investing and financing activities in local currencies.
In addition to the general risks relating to our operations, our international operations are subject to significant unique risks inherent in doing business abroad, many of which have had a significant impact on our business and financial performance in recent years, including:
▪exposure to local economic, political, social and labor practices and conditions;
▪different, complex and continuously changing local laws and regulations and enforcement thereof;
▪changes in government leadership;
▪compliance with the requirements of varied global anti-bribery and anti-corruption laws applicable to our international operations, including compliance by any acquired companies;
▪increases in costs of and disruptions in international shipping related to global conflicts and environmental conditions;
▪increases in duties, tariffs and taxation on the import or export of our products related to U.S. trade disputes, trade restrictions, potential trade wars and other global conflicts;
▪exposure to infectious disease and epidemics, including the effects on our business operations, and those of our customers and suppliers, in geographic locations impacted by an outbreak;
▪violence and civil unrest (including acts of terrorism, drug-cartel related and other forms of violence and outbreaks of war);
▪expropriation, nationalization or other protectionist activities;
▪currency exchange rate fluctuations and currency controls;
▪local business and cultural factors that differ from our customary standards and practices;
▪withholding and other taxes on repatriated funds and other payments by subsidiaries;
▪other cultural and linguistic differences;
▪difficulties in managing or overseeing foreign operations and agents;
▪potentially longer payment cycles;
▪different credit risks; and
▪difficulty of enforcing agreements, collecting receivables and protecting intellectual property and other assets through non-U.S. legal systems.
Additionally, our primary manufacturing locations are in Mexico, China, Vietnam, North Macedonia, Czech Republic and Ukraine, all countries that have historically experienced a heightened degree of political, civil and labor uncertainty.
We work with select domestic manufacturers in China, with over 15% of our 2024 product revenue generated from sales to customers in China. Chinese-based OEMs and automotive suppliers are growing market share in global markets. However, continued
U.S.-China trade tensions and weakening economic conditions, among other factors, may result in reduced sales, profitability and margins, increased operating costs and challenges to gaining or holding market share with such OEMs. Furthermore, certain risks and uncertainties of doing business in China are solely within the control of the Chinese government and such regulations may favor domestic Chinese automotive suppliers, including Chinese regulation of the scope of our business and investments in China, as well as our ability to provide cash to and repatriate cash from our business entities in China. In order to maintain access to the Chinese market, we may be required to comply with significant technical and other regulatory requirements that are unique to the Chinese market, at times with challenging lead times. These actions may increase the cost of doing business in China, hinder our ability to compete with Chinese-based automotive suppliers and limit how and under what conditions we may do business in China, which could materially and adversely affect our profitability and financial condition.
Our ongoing efforts to optimize our global supply chain and our manufacturing footprint could cause supply disruptions and be more costly, time-consuming and resource-intensive than expected.
Our ongoing efforts to optimize the efficiency of our global supply chain and manufacturing facilities could cause supply disruptions and could be more expensive, time-consuming and resource-intensive than expected. With respect to our supply chain, certain of our suppliers have and others may decide to discontinue business with us or limit the allocation of products to us, or we may become too dependent on one or more suppliers, which could result in our inability to fill our supply needs and jeopardize our ability to fulfill our contractual obligations, which could in turn, result in a decrease in revenues and profitability, contract penalties or terminations, and damage to customer relationships. With respect to our manufacturing footprint, we have been impacted by operational disruption and incurred significant cash and non-cash expense, including employee severance, retention and termination costs, capital expenditures, accelerated depreciation and impairment of fixed assets, and other transition costs including recruiting, relocation, and machinery and equipment move and set up costs. The actual timing, costs and savings from these projects may differ materially from the Company’s expectations and estimates.
We manage our business based on projected future sales volume, which is highly dependent on information received from customers and general market data, and any inaccuracies or changes in such information could adversely affect our business, results of operations and financial condition.
We manage our business based upon projected future sales volumes, which are based upon many factors, including awarded business and assumptions of conversion rates thereof, customers’ forecasts and general macroeconomic and industry market data. Our product revenues generally are based upon purchase orders issued by our customers, with updated production schedules for volume adjustments, and our customers generally do not guarantee sales volumes. As such, we typically do not have a backlog of firm orders at any point in time. In addition, awarded business may include business under arrangements that our customers have the right to terminate without penalty at any time. Further, our customers’ forecasts are subject to numerous assumptions, and such forecasts often are changed rapidly with limited notice. Therefore, our actual sales volumes, and thus the ultimate amount of revenue that we derive from such sales, are not committed. We also must incur costs and make commitments well in advance of the receipt of orders and resulting revenues from customers. If actual production orders from our customers are not consistent with our projected future sales volumes, especially for our higher-margin products, we could realize substantially less revenue and incur greater expenses over the life of vehicle programs. In recent years, we have been awarded record new business awards, which has enhanced the foregoing risks.
The receipt of orders and resulting revenues from customers is significantly affected by global automotive production levels. Recent macroeconomic, geopolitical and industry factors noted above have made it particularly challenging for us to project future sales volumes and manage our business.
We use important intellectual property in our business. If we are unable to protect our intellectual property or if a third party makes assertions against us or our customers relating to intellectual property rights, our business could be adversely affected.
We own important intellectual property, including patents, trademarks, copyrights and trade secrets. Our intellectual property plays an important role in maintaining our competitive position in many of the markets that we serve.
We cannot guarantee, however, that we will be able to secure all desired protection, nor that the steps we have taken to protect our intellectual property will be adequate, to prevent infringement of our rights or misappropriation or theft of our technology, trade secrets or know-how. For example, effective patent, trademark, copyright and trade secret protection may be unavailable or limited in some of the countries in which we operate. In addition, while we generally enter into confidentiality agreements with our employees
and third parties to protect our trade secrets, know-how, business strategy and other proprietary information, such confidentiality agreements could be breached or otherwise may not provide meaningful protection for our trade secrets and know-how related to the design, manufacture or operation of our products. If it became necessary for us to resort to litigation to protect our intellectual property rights, any proceedings could be burdensome and costly, and we may not prevail. Further, adequate remedies may not be available in the event of an unauthorized use or disclosure of our trade secrets and manufacturing expertise. Finally, for those products in our portfolio that rely on patent protection, once a patent has expired, the product is generally open to competition. Products under patent protection usually generate higher revenues and profitability than those not protected by patents. If we fail to successfully enforce our intellectual property rights, our competitive position and the value of our brands and other intangible assets could suffer, which could harm our business, financial condition, results of operations and cash flows.
In addition, our competitors may develop technologies that are similar or superior to our proprietary technologies or design around the patents we own or license. Further, as we expand our operations in jurisdictions where the protection of intellectual property rights is less robust, the risk of others duplicating our proprietary technologies increases, despite efforts we undertake to protect them. Foreign governments may adopt regulations, and foreign governments or courts may render decisions, requiring compulsory licensing of intellectual property rights, or foreign governments may require products to meet standards that serve to favor local companies or provide reduced protection relative to other countries.
If we fail to manage our growth effectively or to integrate successfully any business ventures, acquisitions, investments or strategic alliance into our business, or realize the benefits from divestitures or business exits, our business and financial performance could be materially adversely harmed.
We regularly consider opportunities to pursue business ventures, acquisitions, investments and strategic alliances that could leverage our products, technologies and capabilities, as well as, enhance our customer base, geographic penetration and scale, to complement our current businesses, some of which could be material. We completed a number of acquisitions and investments in recent years and intend to continue to evaluate such growth opportunities. Finding and assessing a potential growth opportunity and completing a transaction involves extensive due diligence, management time and expense; however, the amount of information we can obtain about a potential growth opportunity may be limited, and we may not be able to identify suitable candidates, negotiate appropriate terms, obtain financing on acceptable terms, complete proposed acquisitions, or expand into new geographies or markets. Further, we can give no assurance that new business ventures, acquisitions, investments and strategic alliances will positively affect our financial performance or will perform as planned, including regarding anticipated synergies or other financial or operational benefits. For significant transactions, we would expect to incur additional debt, issue equity and/or increase capital expenditures, which may increase leverage risks, result in dilution or reduce capital available for other investments in ongoing operations. If we fail to identify and complete suitable acquisition and investment opportunities in a timely and successful manner, our business, growth strategy reputation and results of operations could be materially impacted.
Furthermore, the success of our acquisitions is dependent, in part, on our ability to realize the expected benefits from the integration of the acquired businesses or assets. We may incur an unexpected amount of liabilities or make incorrect estimates regarding the planned accounting for acquisitions, such as the need to record non-recurring charges or write-off of significant amounts of goodwill or other assets that could adversely affect our results of operations, and we could have unexpected challenges due to the limitations of our due diligence process or contractual provisions. Further, the integration of acquired businesses is a complex, costly and time-consuming process that requires significant management attention and resources. It is possible that the integration process could result in the loss of key employees, the disruption of our operations, the inability to maintain or increase its competitive presence, inconsistencies in and incompatibility of information technology and accounting systems, as well as other compliance standards, controls, procedures and policies, difficulties in achieving anticipated cost savings, synergies, business opportunities and growth prospects from the acquisition, additional litigation, compliance or regulatory risk, the diversion of management’s attention to integration matters and difficulties in the assimilation of employees and corporate cultures, especially if the acquisition involves a business, supply chain or operations in one or more countries in which we have a limited history and lack of experience. Any or all of these factors and our increased debt leverage following the closing of any significant transaction could have an adverse effect on our business and financial performance. In addition, many of these factors are outside of our control, and any one of these factors could result in increased costs, decreases in the amount of expected revenues and additional diversion of management’s time and energy, which could materially adversely impact our business, financial condition and results of operations. Likewise, our failure to integrate and manage acquired companies successfully may lead to reduced profitability and future impairment of any associated goodwill and intangible asset balances.
Periodically, we also evaluate opportunities to divest or shut-down non-core businesses and assets, and the Company may consider strategic dispositions and shut-downs in the future. However, we may not achieve some or all of the targeted benefits we originally anticipated at the time of disposition or shut-down, we may continue to retain material liabilities by contract or applicable law, and we may incur impairment charges. Further, for dispositions, we may need to provide material transition services following the transaction, any of which could have an adverse impact on our returns and our overall profitability.
Gentherm’s unsuccessful adoption of new technology such as artificial intelligence could adversely impact its business, operations and reputation.
Gentherm is in the early stages of incorporating automation and artificial intelligence capabilities into the development of technologies and business operations, and into products and services. Artificial intelligence technology is complex and rapidly evolving, and may subject Gentherm to significant competitive, legal, regulatory, operational and other risks. The implementation of artificial intelligence can be costly and there is no guarantee that Gentherm’s use of artificial intelligence will enhance its technologies, benefit its business operations, or produce products and services that are preferred by its customers. Gentherm’s competitors may be more successful in their artificial intelligence strategy and develop superior products and services with the aid of artificial intelligence technology. Additionally, artificial intelligence algorithms or training methodologies may be flawed, and datasets may contain irrelevant, insufficient or biased information, which can cause errors in outputs. This may give rise to legal liability, reputational damage, and materially harm Gentherm’s business. The use of artificial intelligence in the development of Gentherm’s products and services could also cause loss of intellectual property, as well as subject it to risks related to intellectual property infringement or misappropriation, data privacy and cybersecurity. Additionally, market adoption of artificial intelligence technology could be impaired by ethical and other issues inherent in the technology, which could impair demand for Gentherm’s products and services. Furthermore, the U.S. and other countries may adopt laws and regulations related to artificial intelligence. Such laws and regulations could cause Gentherm to incur greater compliance costs and limit the use of artificial intelligence in the development of its products and services. Any failure or perceived failure by Gentherm to comply with such regulatory requirements could subject Gentherm to legal liabilities, reputational damage, or otherwise have a material and adverse impact on Gentherm’s business.
Legal, Regulatory and Compliance Risks
Economic and trade policy, including tariffs and customs regulations, could have a material and adverse effect on our business.
The U.S. has established free trade laws and regulations that set certain duties and tariffs for qualifying imports and exports, subject to compliance with the applicable classification and other requirements. Changes in laws or policies governing the terms of foreign trade, and in particular increased trade restrictions, tariffs or taxes on imports from countries where we manufacture products, such as China and Mexico, could have a material adverse effect on our business and financial results. In recent years, the U.S. and Chinese governments have imposed a series of significant incremental retaliatory tariffs to certain imported products. Most notably with respect to the automotive industry, the U.S. imposed tariffs on imports of certain steel, aluminum and automotive components, and China imposed retaliatory tariffs on imports of U.S. vehicles and certain automotive components. Further, the U.S. administration recently has proposed and begun to enact additional or enhanced tariffs in various jurisdictions relevant to our business. Implementation of tariffs or other restrictive trade measures by the United States and potentially reciprocally by other countries subject to such to tariffs remains highly uncertain. Due to the global nature of our business, specifically in the jurisdictions impacted by the recent tariffs announcements, if the actual and potential tariffs and reciprocal tariffs are implemented as currently proposed, our results of operations could be materially negatively impacted, both directly and indirectly through negative effects to our supply chain, as a result of increased costs, decreased demand and other adverse economic impacts, and we may not be able to successfully mitigate or offset such impacts. Depending upon their implementation and duration, as well as our ability to mitigate their impact, these tariffs and any other future regulatory actions implemented on a broader range of products or raw materials could materially affect our business, including in the form of increased cost of goods sold, decreased margins, increased pricing for customers, reduced sales and disruption in our supply chain. Furthermore, additional trade restrictions could be adopted with little to no advanced notice, and we may not be able to effectively mitigate the adverse impacts from such measures, which could further increase the cost of our products, disrupt our supply chain and impair our ability to effectively operate and compete in the countries where we do business.
In addition, various countries regulate cross-border transactions of certain products through import permitting and licensing requirements. The exportation, re-exportation, transfers within foreign countries and importation of our products, including by our suppliers and vendors, must comply with these laws and regulations, and any violations may result in reputational harm, government investigations and penalties, and a denial or curtailment of importing or exporting activities. Complying with U.S. export, sanctions
and import laws, including ongoing and rapidly changing sanctions against certain countries, regions, governments and related persons and entities, may be time consuming, may increase our costs, and may result in the delay or loss of sales opportunities. If we are found to be in violation of U.S. export, sanctions or import laws, or similar laws in other jurisdictions, we and the individuals working for us could incur substantial fines and penalties. Changes in export, sanctions or import laws or regulations may delay the introduction and sale of our products in the U.S. and international markets, require us to spend resources to seek necessary government authorizations or to develop different versions of our products, or, in some cases, prevent the export or import of our products to certain countries, regions, governments, persons or entities, which could adversely affect our business, financial condition and operating results.
We may face particular privacy, data security and data protection risks.
We are subject to several data privacy and data security laws and regulations in the various jurisdictions that we operate. An increasing number of U.S. states have enacted data privacy and security laws and regulations that govern the collection, use, disclosure, transfer, storage, disposal, and protection of personal information, such as social security numbers, financial information and other information. For example, several U.S. territories and all 50 states have adopted data breach rules that require timely notification if a company has experienced the unauthorized access or acquisition of personal information. Similarly, many of the requirements mandated by the California Consumer Protection Act (“CCPA”) that went into effect on January 1, 2020 have not yet been interpreted by courts, and best practices are still being developed by the industry, all of which increase the risk of compliance failure and related adverse impacts. Other states enacted similar privacy laws in recent years and other states are considering doing so. These privacy laws may impose substantial penalties for violations, impose significant costs for investigations and compliance, allow private class-action litigation and carry significant potential liability for our business and reputation. The rapid evolution and increased adoption of artificial intelligence technologies may intensify these risks.
Legislators and/or regulators in foreign countries in which we operate are increasingly adopting or revising privacy, information security and data protection laws as well. In particular, the European Union’s General Data Protection Regulation (“GDPR”) imposes additional obligations and risk upon our business and which increases substantially the penalties to which we could be subject in the event of any non-compliance. Many countries have enacted similar types of legislative and regulatory requirements concerning data protection, and additional countries are considering similar legal frameworks.
The CCPA, GDPR and other similar laws and regulations including those recently or soon to be enacted, as well as any associated inquiries or investigations or any other government actions, may be costly and burdensome to comply with, lead to a decline in consumer engagement, result in negative publicity, increase our operating costs, require significant management time and attention to monitor and be in compliance with, and subject us to remedies that may harm our business, including fines or demands or orders that we modify or cease existing business practices. Moreover, regulatory actions seeking to impose significant financial penalties for noncompliance and/or legal actions (including pursuant to laws providing for private rights of action by consumers) could be brought against us in the event of a data compromise, misuse of consumer information, or perceived or actual non-compliance with data protection or privacy requirements, privacy, or artificial intelligence requirements. The rapid evolution and increased adoption of artificial intelligence technologies may intensify these risks.
Defects or quality issues associated with our automotive and medical products, as well as a significant product liability lawsuit, warranty claim or product recall involving us or one of our major customers, or an investigation regarding vehicle safety generally, could adversely affect the results of our operations.
Our design, manufacture and marketing of automotive products subject us to warranty and product liability claims in the event that customers, consumers or regulators believe that our products (or the products of our customers that incorporate our products) failed to perform as expected and, in the case of product liability, such failure of our products (or the products of our customers that incorporate our products) results or is alleged to result in bodily injury or property damage. If any of our products are or are alleged to be defective, we also may be required by our customers or regulators to participate in a recall or other corrective action involving such products, which we have been subject to periodically. Automotive manufacturers are increasingly looking to their suppliers for contribution when faced with recalls and product liability claims, as well as requiring their suppliers to guarantee or warrant their products and bear the costs of repair and replacement of such products under new vehicle warranties. See Note 11 “Commitments and Contingencies” to the consolidated financial statements included in this Annual Report for information regarding a recent recall announced by Volkswagen Group of America, Inc. In addition, OEMs historically have recalled vehicles for perceived defects in seat heaters, and we have incurred liabilities in connection with the recalls and other field actions. In addition, governmental regulatory agencies throughout the world, such as NHTSA in the U.S., have safety standards that require manufacturers to remedy defects related
to vehicle safety through safety recall campaigns, and a manufacturer is obligated to recall vehicles if it determines that the vehicles do not comply with a safety standard.
Any large liability claims, if made, could exceed our insurance coverage limits and insurance may not continue to be available on commercially acceptable terms, if at all, and we may incur significant costs to defend these claims. In addition, we may not be successful in recovering amounts from third parties, including sellers in an acquisition transaction or suppliers, in connection with these claims. In certain instances, allegedly defective products may be the result of components supplied by our supply chain, and we may be limited in our ability to obtain recovery from our suppliers of materials or services included within our products that are associated with product liability and warranty claims, particularly if the affected items relate to global platforms or involve defects that are identified years after production. A recall, product liability or warranty claim brought against us that is not insured or is in excess of our available insurance, and if other third parties do not contribute or indemnify us, could have an adverse impact on our results of operations and reputation or market acceptance of our products.
The design, manufacture and marketing of medical products involve certain inherent risks. Manufacturing or design defects, component failures, unapproved or improper use of our products, or inadequate disclosure of risks or other information relating to the use of our products can lead to regulatory action, injury or other serious adverse events. These events could lead to recalls or safety alerts relating to our products (either voluntary or as required by the Food and Drug Administration (“FDA”) or similar governmental authorities in other countries), and could result, in certain cases, in the removal of a product from the market. A recall, inadequate disclosure or defect could result in significant costs and lost sales and customers, enforcement actions and/or investigations by state and federal governments or other enforcement bodies, as well as negative publicity and damage to our reputation that could reduce future demand for our products. Personal injuries relating to the use of our products can also result in significant product liability claims being brought against us. In some circumstances, such adverse events could also cause delays in regulatory approval of new products or the imposition of post-market approval requirements, such as further clinical testing. Such clinical testing is costly and time-consuming and could delay market approval or the meeting of additional post-market requirements.
Tax matters, including changes in the corporate tax rates, disagreement with taxing authorities and imposition of new taxes could impact our results of operations and financial condition.
We are subject to income and other taxes in the U.S. and internationally. We are also subject to regular reviews, examinations, and audits by the Internal Revenue Service and other taxing authorities with respect to our taxes. Although we believe our tax estimates are reasonable, if a taxing authority disagrees with the positions we have taken, we could face additional tax liability, including interest and penalties. There can be no assurance that payment of such additional amounts upon final adjudication of any disputes will not have a material impact on our results of operations and financial position.
We also need to comply with new, evolving or revised tax laws and regulations, such as the European Union’s Pillar Two Directive, which is now substantially effective as of January 1, 2025. The enactment of or other changes in the application or interpretation of tax legislation and other initiatives may have an adverse effect on our business or on our results of operations.
The value of our deferred tax assets may not be realized, which could materially and adversely affect our operating results.
As of December 31, 2024, we had approximately $54.2 million in net deferred tax assets, inclusive of a $25.3 million valuation allowance. These deferred tax assets include net operating loss carryovers and tax credits that can be used to offset taxable income in future periods and reduce income taxes payable in those future periods. Each quarter, we determine the probability of the realization of deferred tax assets, using significant judgments and estimates with respect to, among other things, historical operating results and expectations of future earnings and tax planning strategies. If we determine in the future that there is not sufficient positive evidence to support the valuation of these assets, due to the risk factors described herein or other factors, we may be required to further adjust the valuation allowance to reduce our deferred tax assets. Such a reduction could result in material non-cash expenses in the period in which the valuation allowance is adjusted and could have a material adverse effect on our financial statements.
Our patient temperature management business is subject to extensive industry regulation and failure to comply with all applicable rules and regulation may adversely impact us.
Our patient temperature management business is subject to extensive, complex, costly and evolving government regulation. In the United States, this is principally administered by the FDA. Various regulatory agencies in foreign countries where our medical products are sold also regulate that business. Under both United States and foreign country regulations, we are subject to periodic
inspection of our facilities (including third-party facilities that are performing services for us), procedures and operations and testing of our products. Following such FDA inspections, should any noncompliance with regulations or other quality issues be noted, we may receive observations, notices, citations and/or warning letters that could require us to get FDA approval of a corrective action plan and modify certain activities identified during the inspection, possibly at a significant cost. We are also required to report adverse events associated with our medical products to the FDA and other foreign regulatory authorities where our products have been approved or received market clearance. Unexpected or serious health or safety concerns could result in liability claims, recalls, market withdrawals or other regulatory actions. Changes in laws or regulations could require us to change the way we operate or to utilize resources to maintain compliance, which could increase costs or otherwise disrupt operations. In addition, failure to comply with any applicable laws or regulations could result in fines or revocation of our operating permits and licenses or, in rare circumstances, market withdrawal of the product.
The process for obtaining governmental approval to manufacture and market new medical devices is time-consuming and costly. We are dependent on receiving FDA and other governmental or third-party approvals prior to manufacturing, marketing and shipping any new medical products. We cannot be certain that any new medical products we develop will receive FDA or other necessary approvals. Also receipt of approval in one country does not guarantee approval by the FDA or any other foreign regulatory agency.
Any failure to comply with anti-corruption laws and regulations could have a material and adverse effect on our reputation, business and financial results.
Our operations outside of the United States require us to comply with various anti-bribery and anti-corruption regulations, including but not limited to the U.S. Foreign Corrupt Practices Act, the United Kingdom Bribery Act and the China Anti-Unfair Competition Law. Compliance with these laws and regulations have become increasingly complex due to the increasing global operations of OEMs and automotive component suppliers, including us. Violations of these laws, which are complex and often difficult to interpret and apply, could result in significant criminal penalties or sanctions that could adversely affect our business, financial condition, results of operations and cash flows. Additionally, we have periodically, and intend in the future, to complete acquisitions of and investments in companies, which may have different historical policies, practices and standards that increase the risk of our compliance with various regulations while we integrate such companies.
Our business may be negatively impacted by the effects of climate change and by regulatory and stakeholder-imposed requirements to address climate change and other sustainability issues.
As evidenced by shifting industry and consumer behaviors, including the development and use of EVs, the automotive industry and stakeholders have a heightened focus on climate change and the environmental impact of product manufacturing and end use. This increased focus on sustainability and the environmental impact of the automotive industry and manufacturing processes has caused our customers and other stakeholders to impose additional requirements on us and our suppliers, which often exceed regulatory standards. These customer requirements include increased tracking and reporting of greenhouse gas emissions and other environmental metrics, reduced waste and wastewater from operations, increased use of sustainable materials in our products, and the use of renewable energy sources in our factory operations. We have begun, and expect to continue, to incur increased operating costs and capital expenditures to procure renewable energy and additional equipment or make operational and process changes to comply with customer requirements in addition to state and federal regulations. Furthermore, our practices may be subject to and judged against sustainability standards that are continually evolving and not always clear, including European regulations such as the Corporate Sustainability Reporting Directive that applies to global corporations across jurisdictions and requires adjustments in corporate processes, policies, and strategies, which may be costly and result in significant monetary penalties and reputational harm if non-compliant. Prevailing sustainability standards, expectations and regulations may also reflect contrasting or conflicting values or agendas. To the extent we are unable to meet or exceed customer sustainability requirements, demand for our products and our revenues could be adversely impacted. A failure to adequately meet other stakeholder expectations may result in the loss of business, diluted market valuation, an inability to attract customers or an inability to attract and retain top talent.
Climate change is continuing to receive ever increasing attention worldwide. Many scientists, legislators and others attribute climate change to increased levels of greenhouse gases, including carbon dioxide, which has led to and we expect will continue to lead to legislative and regulatory efforts in many jurisdictions to limit greenhouse gas emissions. New federal or state restrictions on emissions of carbon dioxide that may be imposed on vehicles and automobile fuels could adversely affect demand for vehicles, annual miles driven or the products we sell, lead to changes in automotive technology, and expedite the transition to electric vehicles.
Compliance with any new or more stringent laws or regulations, or stricter interpretations of existing laws, could require increased capital expenditures to improve our product portfolio to meet such new laws, regulations and standards. Such legislative developments could adversely impact our business by increasing costs and could require us to make changes to our operations and result in substantial additional capital expenditures and operating costs. Such regulations may also subject us to new disclosure requirements, new supply chain requirements, new trade restrictions and increased risk of litigation or regulatory action, which could result in increased costs (in our operations and supply chain) and risks to our reputation or consumer demand for our products if we do not meet increasingly demanding stakeholder expectations and standards. These additional costs, changes in operations, or loss of revenues could have a material adverse effect on our business, financial condition, and results of operations.
Finally, the effects of climate change, such as increased intensity, frequency or duration of storms, floods, droughts, wildfires or other severe weather events have and may continue create financial or physical risk to us. Physical risks include disrupting the manufacturing, logistics and procurement activities and employee working conditions of us, our supply chain and our customers. Financial risks include the fluctuating demand for our products and technologies based on the climate where consumers live, since our business involves thermal management technologies, as well as potential additional costs of insurance and maintaining facilities in certain regions prone to climate risk. We could also face indirect financial risks passed through the supply chain, and process disruptions due to physical climate changes could result in price modifications for our products and the resources needed to produce them. Any of the foregoing could have a material adverse effect on our financial condition and results of operations.
We are required to comply with environmental laws and regulations that could cause us to incur significant costs.
Our manufacturing facilities are subject to numerous laws and regulations designed to protect the environment, and we expect that additional requirements with respect to environmental matters will be imposed on us in the future. We may also assume, or be deemed to assume, significant environmental liabilities in acquisitions. Environmental liability may be imposed without regard to fault, and under certain circumstances, can be joint and several, resulting in one party being held responsible for the entire obligation. Material future expenditures may be necessary if compliance standards change or material unknown conditions that require remediation are discovered. Environmental laws could also restrict our ability to expand our facilities or could require us to acquire costly equipment or to incur other significant expenses in connection with our business. Violations of these requirements could result in fines or sanctions, obligations to investigate or remediate contamination, third party property damage or personal injury claims due to the migration of contaminants off-site, or modification or revocation of our operating permits, which could materially and adversely affect our financial condition, results of operations and cash flows.
We are involved from time to time in various legal and regulatory proceedings and claims, which could adversely affect our financial performance.
We are involved in various legal and regulatory proceedings and claims that, from time to time, are significant. These are typically claims that arise in the normal course of business including, without limitation, commercial or contractual disputes, including disputes with our customers, suppliers or competitors, intellectual property matters, personal injury claims, environmental matters, tax matters and employment matters. Such legal and regulatory proceedings could result in an adverse outcome for the Company that would adversely affect our financial condition, results of operations and cash flows.
Financial Risks
We may be unable to realize the expected benefits of our restructuring actions, which could adversely affect our profitability and operations.
We have undertaken and continue to undertake significant restructuring activities in recent years to optimize our manufacturing, footprint and may take similar actions in the future. Charges related to these actions may have a material adverse effect on our results of operations, cash flows and financial condition. We cannot ensure that any current or future restructuring will be completed as planned, on a timely basis or at all, will be on budget, or achieve the desired results. Further, restructuring costs may be substantial and prolonged, and may have a sustained impact on our results of operations and financial condition.
We are subject to significant foreign currency risk and foreign exchange exposure related to our global operations.
A significant portion of our global transactions is conducted in currencies other than the U.S. Dollar, including the Euro, Mexican Peso, Canadian Dollar, Hungarian Forint, North Macedonian Denar, Ukrainian Hryvnia, Japanese Yen, Chinese Renminbi,
Korean Won, Czech Koruna and Vietnamese Dong. While we sometimes employ financial instruments to hedge some of our transactional foreign exchange exposure, developing an effective and economical foreign currency risk strategy is complex and expensive and no strategy can completely insulate us from those exposures. Exchange rates can be volatile and could adversely affect our financial results and comparability of results from period to period. Such exchange rate volatility could also increase the costs of raw materials or components from foreign suppliers, and as a result, our profitability could be adversely affected.
Our existing indebtedness and the inability to access capital markets could restrict our business activities or our ability to execute our strategic objectives or adversely affect our financial performance.
As of December 31, 2024, our total consolidated indebtedness was $220.2 million, with $280.0 million available for additional borrowings under the Second Amended and Restated Credit Agreement subject to specified conditions that Gentherm currently satisfies. We may incur additional indebtedness in the future, including in connection with acquisitions or significant capital expenditures. If our outstanding borrowings increase, including under existing availability of revolving credit or if we incur additional indebtedness, the amount of our outstanding debt could have important, adverse consequences to us and our investors, including:
▪requiring a substantial portion of our cash flow from operations to make interest payments;
▪making it more difficult to satisfy other obligations;
▪increasing our vulnerability to general adverse economic and industry conditions;
▪reducing the cash flow available to fund capital expenditures and other corporate purposes and to grow our businesses;
▪limiting our flexibility in planning for, or reacting to, changes in our businesses and industries; and
▪limiting our ability to borrow additional funds as needed or take advantage of business opportunities as they arise.
Our debt agreements contain certain restrictive covenants and customary events of default. These restrictive covenants limit our ability to take certain actions, such as, among other things: incur additional debt, create liens, make certain payments or distributions (including for the repurchase or redemption of our shares), engage in mergers or consolidations, make certain dispositions and transfers of assets, enter into transactions with affiliates and guarantee indebtedness. While not unusual for financings of the type that we have, the restrictions in our credit facilities may prevent us from taking actions that we believe would be in the best interest of our business and may make it difficult for us to execute our business plans, take advantage of business opportunities, or react to changing industry conditions.
To the extent that we incur additional indebtedness, the risks described above could increase. In addition, our actual cash requirements in the future may be greater than expected. Our ability to make payments of principal and interest on our indebtedness depends upon our future performance. If our cash flow from operations is not sufficient to service our outstanding debt or to repay the outstanding debt as it becomes due, we may not be able to borrow money, sell assets or otherwise raise funds on acceptable terms, or at all, to service or refinance our debt and we may have to reduce or delay planned capital or operating expenditures. The occurrence of any of such events could have a material adverse effect upon our business, cash flows, financial condition and results of operations. If an event of default would occur under our existing debt agreements or any additional indebtedness, our lenders could declare all amounts outstanding to be immediately due and payable, which may cause cross-defaults under our other debt obligations. If our lenders accelerate the maturity of our indebtedness, we may not have sufficient capital available at that time to pay the amounts due to all lenders on a timely basis, and there is no guarantee that we would be able to repay, refinance, or restructure the payments on such debt. Further, under our existing credit facilities, the lenders would have the right to foreclose on certain of our assets, which could have a material adverse effect on our business, results of operations and financial condition.
We utilize various strategies to move funds between countries to manage global liquidity needs without material adverse tax consequences. Any repatriation of cash to the U.S. may result in various tax consequences and the movement of capital remains subject to evolving government regulation, which could have an adverse impact on our liquidity and cash flows.
We continue to expect to be able to move funds between different countries to manage our global liquidity needs without material adverse tax implications, subject to current monetary policies and the terms of the Second Amended and Restated Credit Agreement. We utilize a combination of strategies and currently there are no significant restrictions on the ability of our subsidiaries to pay dividends or make other distributions to Gentherm Incorporated. As of December 31, 2024, the Company’s cash and cash equivalents held by our non-U.S. subsidiaries totaled $106.9 million. If additional non-U.S. cash was needed for our U.S. operations,
we may be required to accrue and pay withholding if we were to distribute such funds from non-U.S. subsidiaries to the U.S. In addition, the movement of capital between our subsidiaries and us in different countries remains subject to evolving government regulation and geopolitical stability, and our liquidity and cash flows could be impacted adversely upon regulatory and geopolitical changes in the future.
Common Stock Investment Risks
The price of our Common Stock may fluctuate significantly.
The price of our Common Stock on the Nasdaq Global Select Market has experienced substantial price volatility and may continue to do so in the future. Additionally, the Company, the automotive industry and the stock market as a whole have experienced significant stock price and volume pressures and fluctuations that have affected stock prices in ways that may have been unrelated to these companies’ operating performance. In particular, while stock price multiples had previously increased in recent years for OEMs and automotive component suppliers to reflect the growth opportunity of the rapid shift to EV production, stock price multiples have declined more recently during this period of uncertainty regarding the pace of EV adoption and general macroeconomic challenges.
In June 2024, the Board of Directors authorized a new stock repurchase program (the “2024 Stock Repurchase Program”) to commence upon expiration of the prior stock repurchase program on June 30, 2024. Under the 2024 Stock Repurchase Program, the Company is authorized to repurchase up to $150.0 million of its issued and outstanding Common Stock over a three-year period, expiring June 30, 2027. Repurchases may be made, from time to time, in amounts and at prices the Company deems appropriate, subject to market conditions, applicable legal requirements, debt covenants and other considerations. Any Company stock repurchases under the program may result in stock price and volume fluctuations. During the year ended December 31, 2024, the Company repurchased shares under the prior stock repurchase program for $20.0 million in the open market and approximately $60.0 million in an accelerated share repurchase program, and under the 2024 Stock Repurchase Program for $29.9 million and have a remaining repurchase authorization of $120.1 million as of December 31, 2024. Price volatility over a given period may cause the average price at which the Company repurchases its Common Stock to exceed the price at a given point in time.
If the Company or the automotive industry generally fails to meet expectations related to future growth, profitability, share repurchases or other market expectations, the Company’s Common Stock price may decline significantly, which could have a material adverse impact on investor confidence, the perceived value of our Common Stock and our ability to continue to use stock based compensation to attract, retain and motivate employees. Any significant sale of Common Stock by any of our largest shareholders also may have a material adverse effect on our stock price and investor confidence.
ITEM 1B. UNRESOLVED STAFF COMMENTS
None.
ITEM 1C. CYBERSECURITY
Our corporate information technology, communication networks, enterprise applications, accounting and financial reporting platforms, and related systems are necessary for the operation of our business. We use these systems, among others, to manage our product development and manufacturing, to communicate internally and externally, to operate our accounting and record-keeping functions, and for many other key aspects of our business. Our business operations rely on the secure collection, storage, transmission, and other processing of proprietary, confidential, and sensitive data.
Risk Management and Strategy
We recognize the importance of assessing, identifying, and managing material risks associated with cybersecurity threats, as such term is defined in Item 106(a) of Regulation S-K. These risks include, among other things: operational risks, intellectual property theft, fraud, extortion, harm to employees or customers, violation of data privacy or security laws, litigation, and legal, financial and reputational risk.
We have implemented and maintain various information security processes designed to identify, assess and manage material risks from cybersecurity threats to our critical systems and our proprietary, strategic or competitive data. Depending on the environment, we implement and maintain various technical, physical, and organizational measures, processes, standards, and/or policies designed to manage and mitigate material risks from cybersecurity threats to our information systems and data, including risk
assessments, incident detection and response, vulnerability management, disaster recovery and business continuity plans, internal controls within our accounting and financial reporting functions, encryption of data, network security controls, access controls, physical security, asset management, systems monitoring, vendor risk management program and employee training. We conduct regular reviews and tests of our information security program and also leverage audits by our internal audit team, tabletop exercises, penetration and vulnerability testing, and other exercises to evaluate the effectiveness of our information security program and improve our security measures and planning. We have an incident response process that relies on a multidisciplinary team for assessing and managing cybersecurity incidents, including an escalation framework based on the materiality of incidents. The multidisciplinary team includes members of our IT security function, executive management of our legal, finance, human resources, corporate communications and internal audit/risk functions and third party service providers of technical, legal and insurance services, as well as coordination with law enforcement as appropriate. Our IT security function also addresses cybersecurity threats through regular vulnerability reviews, risk registry reviews and global team meetings.
Our information security processes are integrated into our overall enterprise risk management (“ERM”) process and system. Our ERM process relies on designated risk managers to identify and assess material risks from cybersecurity threats. The risk managers form a multidisciplinary group including members of our IT security, finance, human resources and legal functions, operations and executive management, and are responsible for timely reporting of risks on an ongoing basis. Our ERM process includes an annual evaluation and ranking of the top risks captured in our ERM system against leading third party benchmark reports on global risks.
We work with third parties from time to time that assist us to identify, assess, and manage cybersecurity risks, including professional services firms, consulting firms, threat intelligence service providers, and penetration testing firms.
To operate our business, we utilize certain third-party service providers to support a variety of functions. We seek to engage reliable, reputable service providers that maintain cybersecurity programs. Depending on the nature of the services provided, the sensitivity and quantity of information processed, and the identity of the service provider, our vendor management process may include reviewing the cybersecurity practices of such provider, contractually imposing obligations on the provider, conducting security assessments, and conducting periodic reassessments during their engagement.
Our systems periodically experience directed attacks that may be intended to lead to financial loss, interruptions and delays in our operations as well as loss, misuse or theft of personal information (of third parties, employees, and other stakeholders) and other data, confidential information or intellectual property. These attacks are increasing in frequency, uniqueness and sophistication to evade detection and remove forensic evidence of the incident, including due to emerging technologies such as artificial intelligence and machine learning, which may cause cybersecurity incidents to be more difficult to detect for periods of time or at all. However, we are not aware of any risks from cybersecurity threats, including as a result of any cybersecurity incidents, which have materially affected or are reasonably likely to materially affect our Company, including our business strategy, results of operations, or financial condition. Refer to “Item 1A. Risk factors” in this annual report on Form 10-K for additional discussion about cybersecurity-related risks.
Governance
Our Board of Directors holds oversight responsibility for the Company’s strategy and risk management, including material risks related to cybersecurity threats. This oversight is executed directly by the Board of Directors and through its committees. Our Board members also engage in ad hoc conversations with management on cybersecurity-related news events and discuss any updates to our cybersecurity risk management and strategy programs.
The Audit Committee of the Board of Directors (the “Audit Committee”) oversees the quality and effectiveness of the control and enterprise risk management processes of systemic risks, including cybersecurity, in accordance with its charter. The Audit Committee receives reports and engages in regular discussions with management regarding the Company’s significant financial risk exposures and the measures implemented to monitor and reasonably manage these risks, including those that may result from material cybersecurity threats. The Audit Committee also receives reports on material cybersecurity and data privacy incidents (if any), which would include plans to mitigate and respond to such incidents, and status on key information security initiatives. These discussions include the Company’s enterprise risk assessment and risk management policies.
The Technology Committee of the Board of Directors oversees the management of risks associated with the Company’s products and technologies, including cybersecurity risks related to new product technologies or significant innovations to existing product technologies, in accordance with its charter.
Our Vice President & Chief Information Officer (the “CIO”) leads our global information security organization and reports to the Board of Directors on matters related to cybersecurity on behalf of the Company’s management. Our CIO has over 20 years of industry experience, including serving in similar roles leading and overseeing cybersecurity programs at other public companies. Team members who support our information security program have relevant educational and industry experience, including holding similar positions at large industrial and technology companies.
Our CIO leads an internal IT Security Committee that meets regularly to oversee company-wide efforts to address cybersecurity threats, to assess the effectiveness of our information security program and to prioritize efforts to improve our security measures and planning. Our IT Security Committee includes members of our IT security function and executive management of our legal, finance and internal audit/risk, human resources and corporate communications and technology functions.
ITEM 2. PROPERTIES
As of December 31, 2024, we operate in more than 30 locations across 13 countries, which are primarily for manufacturing, assembly, distribution, warehousing, engineering and testing. The majority of our Automotive facilities located outside of the U.S. are principally used in manufacturing and distribution and are located in China, Hungary, Mexico, Morocco, North Macedonia, South Korea, Ukraine, Czech Republic, Germany, and Vietnam. Our global headquarters is located in Novi, Michigan, our European headquarters is located in Odelzhausen, Germany and our Asia-Pacific headquarters is located in Shanghai, China. Our Medical business is principally comprised of our headquarters and manufacturing site located in Cincinnati, Ohio and our manufacturing sites in Germany and China. We also have sales offices, warehouses and engineering centers, strategically located throughout the world. Nearly all of our manufacturing and distribution sites in Mexico and Asia are leased, while most of our European sites are owned.
ITEM 3. LEGAL PROCEEDINGS
We are subject to litigation from time to time in the ordinary course of our business, however, there is no current material pending litigation to which we are a party and no material legal proceedings were terminated, settled or otherwise resolved during the fourth quarter of the fiscal year ended December 31, 2024.
ITEM 4. MINE SAFETY DISCLOSURES.
Not applicable.
PART II
ITEM 5. MARKET FOR THE REGISTRANT’S COMMON STOCK, RELATED STOCKHOLDER MATTERS AND ISSUER PURCHASES OF EQUITY SECURITIES
Market Information
Our Common Stock trades on the Nasdaq Global Select Market under the symbol “THRM.”
Holders
As of February 13, 2025, our Common Stock was held by 37 shareholders of record. A substantially greater number of holders are beneficial owners whose shares of record are held by banks, brokers and other nominees.
Dividends
We have not paid any Common Stock cash dividends since formation, and we do not expect to pay any in the foreseeable future. The payment of future dividends is within the discretion of our Board of Directors and will depend upon business conditions, our earnings and financial condition and other factors. Currently, our bank credit facilities limit payment of dividends on our Common Stock.
Stock Repurchase Program
In December 2020, the Board of Directors authorized a stock repurchase program (the “2020 Stock Repurchase Program”). pursuant to which the Company was authorized to repurchase up to $150 million of its issued and outstanding Common Stock over a three-year period, expiring December 15, 2023. On November 1, 2023, the Board of Directors extended the maturity date of the program from December 15, 2023 to June 30, 2024. The Company repurchased $20.0 million in the open market under the 2020 Stock Repurchase Program in 2024.
On November 1, 2023, following the above-noted extension, the Company entered into a Confirmation of Issuer Forward Repurchase Transaction agreement (the “ASR Agreement”) with Bank of America, N.A. (“Bank of America”) that provided for the Company to purchase shares of Common Stock in an aggregate amount of $60 million (the “ASR Repurchase Amount”) under the 2020 Stock Repurchase Program. The final settlement date occurred in the second quarter of 2024. See Note 16, “Equity,” to the consolidated financial statements included in this Annual Report for additional information.
In June 2024, the Board of Directors authorized the 2024 Stock Repurchase Program to commence upon expiration of the 2020 Stock Repurchase Program on June 30, 2024. Under the 2024 Stock Repurchase Program, the Company is authorized to repurchase up to $150.0 million of its issued and outstanding Common Stock over a three-year period, expiring June 30, 2027.
Repurchases under the 2024 Stock Repurchase Program may be made, from time to time, in amounts and at prices the Company deems appropriate, subject to market conditions, applicable legal requirements, debt covenants and other considerations. Any such repurchases may be executed using open market purchases, accelerated share repurchase programs, privately negotiated agreements or other transactions (including Rule 10b5-1 trading plans), and may be funded from cash on hand, available borrowings or proceeds from potential debt or other capital markets sources. The 2024 Stock Repurchase Program may be modified, extended or terminated at any time without prior notice.
Issuer Purchases of Equity Securities During Fourth Quarter 2024
| | | | | | | | | | | | | | | | |
Period | | Total Number of Shares Purchased | | | Average Price
Paid Per Share | | | Total Number of Shares Repurchased as Part of Publicly Announced Plans or Programs | | | Approximate Dollar Value of Shares That May Yet Be Purchased Under the 2024 Stock Repurchase Program | |
October 1, 2024 to October 31, 2024 | | | — | | | $ | — | | | | — | | | $ | 130,117,303 | |
November 1, 2024 to November 30, 2024 | | | — | | | | — | | | | — | | | | 130,117,303 | |
December 1, 2024 to December 31, 2024 | | | 233,449 | | | | 42.84 | | | | 233,449 | | | | 120,117,332 | |
Performance graph
The following graph reflects the comparative changes in the value from December 31, 2019 through December 31, 2024, assuming an initial investment of $100 and the reinvestment of dividends, if any, in (1) our Common Stock, (2) the NASDAQ Composite index, (3) the Russell 2000 Index and (4) the Dow Jones U.S. Auto Parts Index. Historical performance may not be indicative of future shareholder returns.
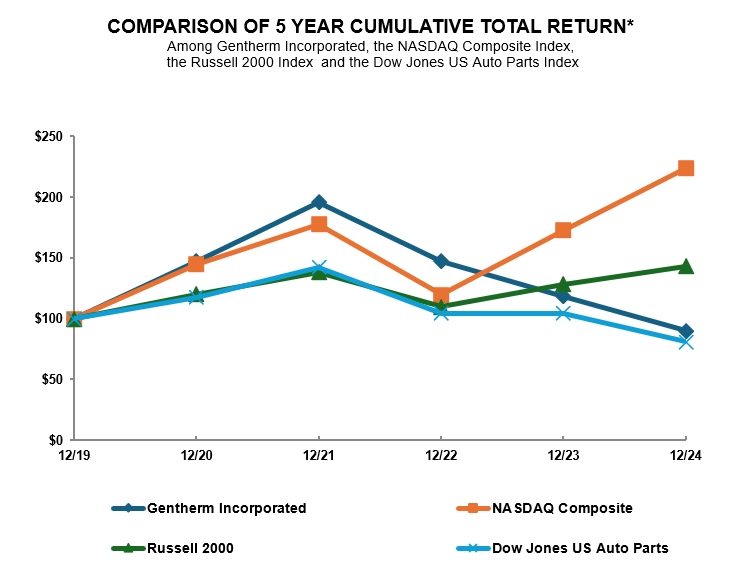
| | | | | | | | | | | | | | | | | | | | | | | | |
| | | | | As of December 31, | |
| | | | | 2020 | | | 2021 | | | 2022 | | | 2023 | | | 2024 | |
Gentherm Incorporated | | $ | 100.00 | | | $ | 146.92 | | | $ | 195.76 | | | $ | 147.08 | | | $ | 117.95 | | | $ | 89.94 | |
NASDAQ Composite | | $ | 100.00 | | | $ | 144.92 | | | $ | 177.06 | | | $ | 119.45 | | | $ | 172.77 | | | $ | 223.87 | |
Russell 2000 | | $ | 100.00 | | | $ | 119.96 | | | $ | 137.74 | | | $ | 109.59 | | | $ | 128.14 | | | $ | 142.93 | |
Dow Jones US Auto Parts | | $ | 100.00 | | | $ | 117.51 | | | $ | 142.18 | | | $ | 104.59 | | | $ | 104.54 | | | $ | 80.91 | |
ITEM 6. RESERVED
ITEM 7. MANAGEMENT’S DISCUSSION AND ANALYSIS OF FINANCIAL CONDITION AND RESULTS OF OPERATIONS
The following discussion and analysis should be read in conjunction with, and is qualified in its entirety by, our consolidated financial statements (and notes related thereto) and other more detailed financial information appearing elsewhere in this Annual Report. Further, you should read the following discussion and analysis of our financial condition and results of operations together with the “Risk Factors” included elsewhere in this Annual Report for a discussion of important factors that could cause actual results to differ materially from the results described in or implied by the forward-looking statements contained in the following discussion and analysis. See also “Forward-Looking Statements” in Part I of this Annual Report.
Overview
Gentherm Incorporated is the global market leader of innovative thermal management and pneumatic comfort technologies for the automotive industry and a leader in medical patient temperature management. Automotive products include variable temperature Climate Control Seats, heated interior systems (including heated seats, steering wheels, armrests and other components), battery performance solutions, cable systems, lumbar and massage comfort solutions, fuel management valve systems and other valve systems for brake and engine systems, and other electronic devices. Our automotive products can be found on vehicles manufactured by nearly all the major original equipment manufacturers ("OEMs") operating in North America and Europe, and several major OEMs in Asia. We operate in locations aligned with our major customers’ product strategies to provide locally enhanced design, integration and production capabilities. Medical products include patient temperature management systems. Our medical products can be found in hospitals throughout the world, primarily in the U.S., China, Germany and Brazil. The Company is also developing a number of new technologies and products that will help enable improvements to existing products, improve health, wellness and patient outcomes and will lead to new product applications for existing and new and adjacent markets.
Our Automotive sales are driven by the number of light vehicles produced by the OEMs primarily in our key markets of North America, Europe, China, Japan and South Korea, which is ultimately dependent on consumer demand for automotive light vehicles, our product content per vehicle, and other factors that may limit or otherwise impact production by us, our supply chain and our customers. Historically, new vehicle demand and product content (i.e. vehicle features) have been driven by macroeconomic and other factors, such as interest rates, automotive manufacturer and dealer sales incentives, fuel prices, consumer confidence, employment levels, income growth trends and government and tax incentives. Vehicle content has also been driven by trends in consumer preferences, such as preferences for smart devices and features, personalized user experience, and comfort, health and wellness. Economic volatility or weakness in North America, Europe or Asia, as well as global geopolitical factors, have and could result in a significant reduction in automotive sales and production by our customers, which have and would have an adverse effect on our business, results of operations and financial condition. We believe our diversified OEM customer base and geographic revenue base, along with our flexible cost structure, have well positioned us to withstand the impact of industry downturns and benefit from industry upturns in the ordinary course. However, shifts in the mix of global automotive production to higher cost regions or to vehicles that contain less of our product content and inflationary pressures have adversely impacted our profitability and may continue to do so. In addition, we have been and may in the future be adversely impacted by volatility or weakness in markets for hybrid or electric vehicles specifically. We believe our products offer certain advantages for hybrid and electric vehicles, including improved energy efficiency, and position us well to withstand changes in the volume mix between vehicles driven by internal combustion engines and hybrid and other electric vehicles. We believe our industry is increasingly progressing towards a focus on human comfort, health and wellness, which is evidenced by increasing adoption rates for comfort products. We believe that products we are developing, such as ClimateSense, WellSense and ComfortScale, position us well to address trends in consumer preferences such as personalized user experience, comfort, health and wellness. Gentherm is an independent partner that can cooperate with any combination of the vehicle OEMs and seat manufacturers globally, including those that are vertically integrated, to create innovative and unique configurations that adapt to industry trends.
Recent Trends
Global Conditions
The global automotive light vehicle industry is impacted by a number of factors, including global and regional economic conditions. At times in recent years, the global economy has experienced significant volatility, inflationary pressures and supply chain disruptions, which have a widespread adverse effect on the global automotive industry. These macroeconomic conditions have
resulted in fluctuating demand and production disruptions, facility closures, labor shortages, work stoppages, and increased prices of inputs to our products. Although some supply chain conditions have steadily improved and certain inflationary pressures have moderated, rising costs of materials, labor, equipment and other inputs used to manufacture and sell our products, including freight and logistics costs, have impacted, and may in the future impact, operating costs and operating results. We continue to employ measures to mitigate the impact of cost increases through identification of sourcing and manufacturing efficiencies where possible. However, we have been unable to fully mitigate or pass through the increases in our operating costs, which may continue in the future.
We are exposed to foreign currency risk due to the translation and remeasurement of the results of certain international operations into U.S. Dollars as part of the consolidation process. Therefore, fluctuations in foreign currency exchange rates can create volatility in the results of operations and may adversely affect our financial condition.
We have a global manufacturing footprint that enables us to serve our customers in the regions they operate and shift production between regions to remain competitive. Throughout the year there have been various ongoing geopolitical conflicts, such as the current conflicts between Russia and Ukraine, and in the Middle East, heightened tensions in the Red Sea and the South China Sea. These conflicts have interrupted ocean freight shipping and if prolonged or intensified, could have a substantial adverse effect on our financial results. Further, there is the potential that certain political pressures, such as changes to international trade agreements, increases in trade tariffs, import quotas or other trade restrictions or actions, including retaliatory responses to such actions, could affect the operations of our OEM customers, resulting in reduced automotive production in certain regions or shifts in the mix of production to higher cost regions. We are monitoring and evaluating the impacts of recently announced potential tariffs and reciprocal tariffs on our supply chain and results of operations. We, like other manufacturers, have a high proportion of fixed structural costs, and therefore relatively small changes in industry vehicle production can have a substantial effect on our financial results.
Fit-for-Growth 2.0
During the first half of 2023, the Company launched Fit-for-Growth 2.0 to execute our long-term growth strategy, including to realign and resize our production capacity and cost structure, lower our cost base, improve our financial performance and cash flow generation, and create a simplified organization best positioned to deliver on our key financial and operational priorities. Fit-for-Growth 2.0 has delivered significant cost reductions through sourcing excellence, value engineering, manufacturing productivity, manufacturing footprint optimization, and product profitability. Additionally, the program has driven and is expected to continue to drive operating expense efficiency to leverage scale.
Exit of Non-Automotive Electronics Business
On December 31, 2022, the Company approved a plan to exit its non-automotive electronics business to strengthen the Company’s core business and focus its resources and equipment with businesses and investments that are more strategic and profitable. The Company has substantially completed the exit of this business.
During the year ended December 31, 2024, the Company recorded a benefit of $4.6 million for the sale of previously reserved inventory. This benefit is recorded in product revenues.
During the year ended December 31, 2023, the Company recorded non-cash impairment charges of $6.1 million for the write down of inventory within the Automotive segment. This charge is recorded in cost of sales.
During the year ended December 31, 2022, the Company recorded non-cash impairment charges of $9.4 million, $5.6 million and $0.7 million for write downs of inventory, intangible assets and property and equipment, respectively.
Impairments - Medical Segment
During the fourth quarter of 2024, we recorded a non-cash impairment charge of $2.0 million for equipment determined to have no future use.
During the first quarter of 2024, we recorded a non-cash impairment charge of $0.5 million for one of our tradenames.
During the second quarter of 2023, an indicator of impairment was identified for the Company’s Medical reporting unit and the Company performed an interim quantitative assessment as of June 30, 2023. The results of this quantitative analysis indicated the carrying value of the reporting unit exceeded the fair value, and accordingly, an impairment expense was recorded for $19.5 million in 2023.
2023 Manufacturing Footprint Rationalization
On September 19, 2023, the Company committed to a restructuring plan (“2023 Plan”) to improve the Company’s manufacturing productivity and rationalize its footprint through the closure and relocation of its manufacturing site in Greenville, South Carolina to a new facility in Monterrey, Mexico. During the year ended December 31, 2024, the Company completed the closure and relocation and completed the sale of its Greenville, South Carolina manufacturing facility, resulting in a gain on sale of $1.9 million. The gain on sale was recorded as a reduction of restructuring expenses, net in the consolidated statements of income. During the year ended December 31, 2024, the Company also recognized restructuring expense of $1.8 million for employee separation costs and $2.4 million for other costs. During the year ended December 31, 2023, the Company recognized restructuring expense of $0.5 million for employee separation costs and $0.2 million for other costs.
The 2023 Plan is expected to be completed by the end of 2025 as the final actions, including consolidation of our original manufacturing site in Monterrey, Mexico into our new facility is complete. The Company expects to incur less than $1 million of additional restructuring costs for the 2023 Plan.
See Note 5, “Restructuring and Impairments” to the consolidated financial statements included in this Annual Report for additional information related to this plan and additional restructuring plans approved in February 2025.
Light Vehicle Production Volumes
Our sales are driven by the number of vehicles produced by the automotive manufacturers, which is ultimately dependent on consumer demand for automotive vehicles, and our content per vehicle, and other factors that may limit or otherwise impact production by us, our supply chain and our customers. According to the forecasting firm S&P Global Mobility (February 2025 release), global light vehicle production in 2024 in the Company’s key markets of North America, Europe, China, Japan and South Korea, as compared to 2023, are shown below (in millions of units):
| | | | | | | | | | | | |
| | 2024 | | | 2023 | | | % Change | |
North America | | | 15.4 | | | | 15.7 | | | | (1.5 | )% |
Europe | | | 17.2 | | | | 18.0 | | | | (4.3 | )% |
Greater China | | | 30.1 | | | | 29.0 | | | | 3.6 | % |
Japan / South Korea | | | 12.0 | | | | 12.8 | | | | (6.3 | )% |
Total light vehicle production volume in key markets | | | 74.7 | | | | 75.5 | | | | (1.0 | )% |
The S&P Global Mobility report (February 2025 release) forecasted light vehicle production volume in the Company’s key markets for full year 2025 to decrease to 74.2 million units, a 0.6% decrease from full year 2024 light vehicle production volumes. Forecasted light vehicle production volumes are a component of the data we use in forecasting future business. However, these forecasts generally are updated monthly, and future forecasts have been and may continue to be significantly different from period to period due to changes in macroeconomic conditions or matters specific to the automotive industry. Further, due to differences in regional product mix at our manufacturing facilities, as well as material production schedules from our customers for our products on specific vehicle programs, our future forecasted results do not directly correlate with the global and/or regional light vehicle production forecasts of S&P Global Mobility or other third-party sources.
New Business Awards
We believe that innovation is an important element to gaining market acceptance of our products and strengthening our market position. During 2024, we secured an estimated $2,400 million of automotive new business awards. Automotive new business awards represent the aggregate projected lifetime revenue of new awards provided by our customers to Gentherm in the applicable period, with the value based on the price and volume projections received from each customer as of the award date. Although automotive new business awards are not firm customer orders, we believe that new business awards are an indicator of future revenue. New business awards are not projections of revenue or future business as of December 31, 2024, the date of this Annual Report or any other date. Customer projections regularly change over time, and we do not update our calculation of any new business award after the date initially communicated. Automotive new business awards in 2024 also do not reflect, in particular, the impact of macroeconomic and
geopolitical challenges on future business. Revenues resulting from automotive new business awards also are subject to additional risks and uncertainties as described in Item 1 under “Forward-Looking Statements” of this Annual Report.
Reportable Segments
The Company has two reportable segments for financial reporting purposes: Automotive and Medical.
See Note 20, “Segment Reporting,” to the consolidated financial statements included in this Annual Report for a description of our reportable segments as well as their proportional contribution to the Company’s reported product revenues, operating income (loss) and significant segment expenses.
Results of Operations Year Ended December 31, 2024 Compared to Year Ended December 31, 2023
This section discusses our consolidated results of operations for the year ended December 31, 2024 compared to the year ended December 31, 2023. For a detailed discussion of our consolidated results of operations for the years ended December 31, 2023 compared to the year ended December 31, 2022, see Part II, Item 7 “Management’s Discussion and Analysis of Financial Condition and Results of Operation” under “Results of Operations Year Ended December 31, 2023 Compared to December 31, 2022” in our annual report on Form 10-K for the year ended December 31, 2023, which was filed with the SEC on February 21, 2024.
The results of operations for the years ended December 31, 2024 and 2023, in thousands, were as follows:
| | | | | | | | | | | | |
| | Year Ended December 31, | |
| | 2024 | | | 2023 | | | Favorable /
(Unfavorable) | |
Product revenues | | $ | 1,456,124 | | | $ | 1,469,076 | | | $ | (12,952 | ) |
Cost of sales | | | 1,089,693 | | | | 1,117,452 | | | | 27,759 | |
Gross margin | | | 366,431 | | | | 351,624 | | | | 14,807 | |
Operating expenses: | | | | | | | | | |
Net research and development expenses | | | 88,697 | | | | 94,358 | | | | 5,661 | |
Selling, general and administrative expenses | | | 155,108 | | | | 155,579 | | | | 471 | |
Restructuring expenses, net | | | 13,110 | | | | 4,739 | | | | (8,371 | ) |
Impairment of intangible assets and property and equipment | | | 2,501 | | | | — | | | | (2,501 | ) |
Impairment of goodwill | | | — | | | | 19,509 | | | | 19,509 | |
Total operating expenses | | | 259,416 | | | | 274,185 | | | | 14,769 | |
Operating income | | | 107,015 | | | | 77,439 | | | | 29,576 | |
Interest expense, net | | | (15,300 | ) | | | (14,641 | ) | | | (659 | ) |
Foreign currency gain (loss) | | | 9,599 | | | | (5,918 | ) | | | 15,517 | |
Other income (loss) | | | 951 | | | | (1,926 | ) | | | 2,877 | |
Earnings before income tax | | | 102,265 | | | | 54,954 | | | | 47,311 | |
Income tax expense | | | 37,318 | | | | 14,611 | | | | (22,707 | ) |
Net income | | $ | 64,947 | | | $ | 40,343 | | | $ | 24,604 | |
Product revenues by product category, in thousands, for the years ended December 31, 2024 and 2023 were as follows:
| | | | | | | | | | | | |
| | Year Ended December 31, | |
| | 2024 | | | 2023 | | | % Change | |
Climate Control Seat | | $ | 468,820 | | | $ | 482,665 | | | | (2.9 | )% |
Seat Heaters | | | 297,866 | | | | 308,588 | | | | (3.5 | )% |
Lumbar and Massage Comfort Solutions | | | 178,584 | | | | 144,923 | | | | 23.2 | % |
Steering Wheel Heaters | | | 169,763 | | | | 153,943 | | | | 10.3 | % |
Valve Systems | | | 105,056 | | | | 106,262 | | | | (1.1 | )% |
Automotive Cables | | | 73,091 | | | | 79,993 | | | | (8.6 | )% |
Battery Performance Solutions | | | 58,183 | | | | 75,484 | | | | (22.9 | )% |
Electronics | | | 33,065 | | | | 40,387 | | | | (18.1 | )% |
Other Automotive | | | 21,850 | | | | 30,707 | | | | (28.8 | )% |
Subtotal Automotive segment | | | 1,406,278 | | | | 1,422,952 | | | | (1.2 | )% |
Medical segment | | | 49,846 | | | | 46,124 | | | | 8.1 | % |
Total Company | | $ | 1,456,124 | | | $ | 1,469,076 | | | | (0.9 | )% |
Product Revenues
Below is a summary of our product revenues, in thousands, for the years ended December 31, 2024 and 2023:
| | | | | | | | | | | | | | | | | | | | | | | | | | | | | |
| | Year Ended December 31, | | | | Variance Due To: | |
| | 2024 | | | 2023 | | | Favorable /
(Unfavorable) | | | | Automotive Volume | | | FX | | | Pricing/ Other | | | Total | |
Product revenues | | $ | 1,456,124 | | | $ | 1,469,076 | | | $ | (12,952 | ) | | | $ | 3,931 | | | $ | (7,129 | ) | | $ | (9,754 | ) | | $ | (12,952 | ) |
Product revenues for the year ended December 31, 2024 decreased 0.9% as compared to the year ended December 31, 2023. The decrease in product revenues is due to unfavorable pricing and foreign currency impacts primarily attributable to the Chinese Renminbi, the Korean Won and the Japanese Yen, partially offset by favorable volumes in several product lines within the Automotive segment and favorable foreign currency impacts primarily attributable to the Euro.
Cost of Sales
Below is a summary of our cost of sales and gross margin, in thousands, for the years ended December 31, 2024 and 2023:
| | | | | | | | | | | | | | | | | | | | | | | | | | | | | | | | | |
| | Year Ended December 31, | | | | Variance Due To: | |
| | 2024 | | | 2023 | | | Favorable /
(Unfavorable) | | | | Automotive Volume | | | FX | | | Operational Performance | | | Other | | | Total | |
Cost of sales | | $ | 1,089,693 | | | $ | 1,117,452 | | | $ | 27,759 | | | | $ | (2,443 | ) | | $ | 6,603 | | | $ | 34,026 | | | $ | (10,427 | ) | | $ | 27,759 | |
Gross margin | | | 366,431 | | | | 351,624 | | | | 14,807 | | | | | 1,488 | | | | (526 | ) | | | 36,136 | | | | (22,291 | ) | | | 14,807 | |
Gross margin - Percentage of product revenues | | | 25.2 | % | | | 23.9 | % | | | | | | | | | | | | | | | | | | | |
Cost of sales for the year ended December 31, 2024 decreased by 2.5% as compared to the year ended December 31, 2023. The decrease in cost of sales is primarily due to supplier cost reductions, value engineering activities, as well as the impact of non-automotive inventory charges in the prior-year period and favorable foreign currency impacts primarily attributable to the Mexican Peso, Ukrainian Hryvnia, and the Chinese Renminbi. These decreases were partially offset by higher wages, higher automotive volumes, start-up costs from our new plants in Tangier, Morocco and Monterrey, Mexico and unfavorable foreign currency impacts primarily attributable to the Euro.
Net Research and Development Expenses
Below is a summary of our net research and development expenses, in thousands, for the years ended December 31, 2024 and 2023:
| | | | | | | | | | | | |
| | Year Ended December 31, | |
| | 2024 | | | 2023 | | | Favorable /
(Unfavorable) | |
Research and development expenses | | $ | 117,826 | | | $ | 125,692 | | | $ | 7,866 | |
Reimbursed research and development expenses | | | (29,129 | ) | | | (31,334 | ) | | | (2,205 | ) |
Net research and development expenses | | $ | 88,697 | | | $ | 94,358 | | | $ | 5,661 | |
Percentage of product revenues | | | 6.1 | % | | | 6.4 | % | | | |
Net research and development expenses for the year ended December 31, 2024 decreased 6.0% as compared to the year ended December 31, 2023. The decrease in net research and development expenses is primarily related to lower project spend and a reduction in resources allocated to the battery performance solutions product category.
Selling, General and Administrative Expenses
Below is a summary of our selling, general and administrative expenses, in thousands, for the years ended December 31, 2024 and 2023:
| | | | | | | | | | | | |
| | Year Ended December 31, | |
| | 2024 | | | 2023 | | | Favorable /
(Unfavorable) | |
Selling, general and administrative expenses | | $ | 155,108 | | | $ | 155,579 | | | $ | 471 | |
Percentage of product revenues | | | 10.7 | % | | | 10.6 | % | | | |
Selling, general and administrative expenses for the year ended December 31, 2024 decreased 0.3% as compared to the year ended December 31, 2023. The decrease in selling, general and administrative expenses is primarily related to acquisition and integration expenses in the prior year and lower compensation expenses, partially offset by leadership transition costs and increased investment in information technology in the current year.
Restructuring Expenses, net
Below is a summary of our restructuring expenses, net, in thousands, for the years ended December 31, 2024 and 2023:
| | | | | | | | | | | | |
| | Year Ended December 31, | |
| | 2024 | | | 2023 | | | Favorable /
(Unfavorable) | |
Restructuring expenses, net | | $ | 13,110 | | | $ | 4,739 | | | $ | (8,371 | ) |
Restructuring expenses, net primarily relate to the 2023 Plan and other discrete restructuring activities focused on optimizing our manufacturing and engineering footprint and the reduction of global overhead expenses. See Note 5, "Restructuring and Impairments," in the notes to the consolidated financial statements included in this Annual Report for additional information.
Impairment of Intangible Assets and Property and Equipment
Below is a summary of our impairment of intangible assets and property and equipment, in thousands, for the years ended December 31, 2024 and 2023:
| | | | | | | | | | | | |
| | Year Ended December 31, | |
| | 2024 | | | 2023 | | | Favorable /
(Unfavorable) | |
Impairment of intangible assets and property and equipment | | $ | 2,501 | | | $ | — | | | $ | (2,501 | ) |
Impairment of intangible assets and property and equipment for the year ended December 31, 2024 is related to equipment determined to have no future use and one of our tradenames.
Impairment of Goodwill
Below is a summary of our impairment of goodwill, in thousands, for the years ended December 31, 2024 and 2023:
| | | | | | | | | | | | |
| | Year Ended December 31, | |
| | 2024 | | | 2023 | | | Favorable /
(Unfavorable) | |
Impairment of goodwill | | $ | — | | | $ | 19,509 | | | $ | 19,509 | |
Impairment of goodwill for the year ended December 31, 2023 is related to the recorded Medical reporting unit goodwill impairment.
Interest Expense, net
Below is a summary of our interest expense, net, in thousands, for the years ended December 31, 2024 and 2023:
| | | | | | | | | | | | |
| | Year Ended December 31, | |
| | 2024 | | | 2023 | | | Favorable /
(Unfavorable) | |
Interest expense, net | | $ | (15,300 | ) | | $ | (14,641 | ) | | $ | (659 | ) |
The increase in interest expense during the year ended December 31, 2024 compared to 2023 is primarily related to the impact from the change in fair value of the interest rate swap derivative.
Foreign Currency Gain (Loss)
Below is a summary of our foreign currency gain (loss), in thousands, for the years ended December 31, 2024 and 2023:
| | | | | | | | | | | | |
| | Year Ended December 31, | |
| | 2024 | | | 2023 | | | Favorable /
(Unfavorable) | |
Foreign currency gain (loss) | | $ | 9,599 | | | $ | (5,918 | ) | | $ | 15,517 | |
Foreign currency gain for the year ended December 31, 2024 included net realized foreign currency loss of $1.1 million and unrealized net foreign currency gain of $10.7 million.
Foreign currency loss for the year ended December 31, 2023 included net realized foreign currency gain of $3.2 million and unrealized net foreign currency loss of $9.1 million.
Other Income (Loss)
Below is a summary of our other income (loss), in thousands, for the years ended December 31, 2024 and 2023:
| | | | | | | | | | | | |
| | Year Ended December 31, | |
| | 2024 | | | 2023 | | | Favorable /
(Unfavorable) | |
Other income (loss) | | $ | 951 | | | $ | (1,926 | ) | | $ | 2,877 | |
The increase in other income is primarily driven by the increase in fair value of our investment in Carrar Ltd., due to observable transactions during the year ended December 31, 2024, as well as an impairment in our investment in Carrar Ltd. during the year ended December 31, 2023. See Note 2, "Summary of Significant Accounting Policies," in the notes to the consolidated financial statements included in this Annual Report for additional information.
Income Tax Expense
Below is a summary of our income tax expense, in thousands, for the years ended December 31, 2024 and 2023:
| | | | | | | | | | | | |
| | Year Ended December 31, | |
| | 2024 | | | 2023 | | | Favorable /
(Unfavorable) | |
Income tax expense | | $ | 37,318 | | | $ | 14,611 | | | $ | (22,707 | ) |
Income tax expense was $37.3 million for the year ended December 31, 2024, on earnings before income tax of $102.3 million, representing an effective tax rate of 36.5 %. The effective tax rate differed from the U.S. Federal statutory rate of 21% primarily due to the unfavorable impact of the global intangible low-tax income ("GILTI"), withholding taxes, other non-deductible expenses, and the settlement of a prior period tax audit, partially offset by the impact of income taxes on foreign earnings at tax rates varying from the U.S. statutory tax rate, research and development credits and incentive tax rates in various jurisdictions.
Income tax expense was $14.6 million for the year ended December 31, 2023, on earnings before income tax of $55.0 million, representing an effective tax rate of 26.6%. The effective tax rate differed from the U.S. Federal statutory rate of 21% primarily due to the unfavorable impact of the GILTI, withholding taxes, other non-deductible expenses, the impact of income taxes on foreign earnings at tax rates varying from the U.S. statutory tax rate and the tax effect of a goodwill impairment, partially offset by research and development credits and prior year adjustments in various jurisdictions.
Liquidity and Capital Resources
Overview
Our primary sources of liquidity and capital resources are cash flows from operations and borrowings available under our Second Amended and Restated Credit Agreement. Our cash requirements consist principally of working capital, capital expenditures, research and development, operating lease payments, income tax payments and general corporate purposes. We generally reinvest available cash flows from operations into our business, while opportunistically utilizing our authorized stock repurchase program. Further, we continuously evaluate acquisition and investment opportunities that will enhance our business strategies.
As of December 31, 2024, the Company had $134.1 million of cash and cash equivalents and $280.0 million of availability under our Second Amended and Restated Credit Agreement. We may issue debt or equity securities, which may provide an additional source of liquidity. However, there can be no assurance equity or debt financing will be available to us when we need it or, if available, the terms will be satisfactory to us and not dilutive to our then-current shareholders.
We continue to expect to be able to move funds between different countries to manage our global liquidity needs without material adverse tax implications, subject to current monetary policies and the terms of the Second Amended and Restated Credit Agreement. We utilize a combination of strategies, including dividends, cash pooling arrangements, intercompany loan repayments and other distributions and advances to provide the funds necessary to meet our global liquidity needs. There are no significant restrictions on the ability of our subsidiaries to pay dividends or make other distributions to Gentherm Incorporated. As of December 31, 2024, the Company’s cash and cash equivalents held by our non-U.S. subsidiaries totaled $106.9 million. If additional non-U.S. cash was needed for our U.S. operations, we may be required to accrue and pay withholding if we were to distribute such funds from non-U.S. subsidiaries to the U.S.; however, based on our current liquidity needs and strategies, we do not anticipate a need to accrue and pay such additional amounts.
We currently believe that our cash and cash equivalents and borrowings available under our Second Amended and Restated Credit Agreement and cash flows from operations will be adequate to meet anticipated cash requirements for at least the next twelve months and the foreseeable future.
Cash and Cash Flows
The table below summarizes our cash activity for each of the last two fiscal years (in thousands):
| | | | | | | | |
| | Year Ended December 31, | |
| | 2024 | | | 2023 | |
Cash and cash equivalents at beginning of period | | $ | 149,673 | | | $ | 153,891 | |
Net cash provided by operating activities | | | 109,646 | | | | 119,265 | |
Net cash used in investing activities | | | (53,531 | ) | | | (24,123 | ) |
Net cash used in financing activities | | | (51,705 | ) | | | (106,051 | ) |
Foreign currency effect on cash and cash equivalents | | | (19,949 | ) | | | 6,691 | |
Cash and cash equivalents at end of period | | $ | 134,134 | | | $ | 149,673 | |
Cash Flows From Operating Activities
Net cash provided by operating activities totaled $109.6 million and $119.3 million for the years ended December 31, 2024 and 2023, respectively. Cash flow provided by operating activities for the year ended December 31, 2024 consisted primarily of net income of $64.9 million, increased by $82.9 million for non-cash charges for depreciation, amortization, stock based compensation, deferred income taxes, impairment of intangible assets and property and equipment and provision for inventory, partially offset by $35.5 million related to changes in assets and liabilities, $1.6 million for a gain on disposition of property and equipment and $1.1 million of other. Cash flow provided by operating activities for the year ended December 31, 2023 consisted primarily of net income of $40.3 million, increased by $66.2 million for non-cash charges for depreciation, amortization, stock based compensation, loss on disposition of property and equipment and other, $6.9 million for inventory provisions, and $19.5 million of goodwill impairment, partially offset by non-cash charges of $13.1 million for deferred income taxes and $0.6 million related to changes in assets and liabilities.
Cash Flows From Investing Activities
Net cash used in investing activities totaled $53.5 million and $24.1 million for the years ended December 31, 2024 and 2023, respectively. Cash flows used in investing activities for the year ended December 31, 2024 primarily included capital expenditures of $73.3 million and technology investments of $1.0 million, partially offset by proceeds from deferred purchase price of factored receivables of $12.9 million and proceeds from the sale of property and equipment of $7.9 million. Cash flows used in investing activities for the year ended December 31, 2023 primarily included capital expenditures of $37.6 million and technology investments of $0.8 million, partially offset by proceeds from deferred purchase price of factored receivables of $13.9 million and proceeds from the sale of property and equipment of $0.4 million.
Cash Flows From Financing Activities
Net cash used in financing activities totaled $51.7 million and $106.1 million for the years ended December 31, 2024 and 2023, respectively. Cash flows used in financing activities for the year ended December 31, 2024 primarily included $2.6 million of net debt activity, $51.6 million of cash paid for the repurchase of Common Stock and $3.3 million paid for employee taxes related to the net settlement of restricted stock units that vested during the year, partially offset by $5.8 million of proceeds from the exercise of Common Stock options. Cash flows used in financing activities for the year ended December 31, 2023 primarily included $91.1 million of cash paid for the repurchase of Common Stock, $12.3 million of net debt activity and $2.9 million paid for employee taxes related to the net settlement of restricted stock units that vested during the year, partially offset by $0.2 million of proceeds from the exercise of Common Stock options.
Debt
The following table summarizes the Company’s debt at December 31, 2024 and 2023 (dollars in thousands):
| | | | | | | | | | | | | | | | |
| | December 31, | |
| | 2024 | | | 2023 | |
| | Interest
Rate | | | Principal
Balance | | | Interest
Rate | | | Principal
Balance | |
Credit Agreement: | | | | | | | | | | | | |
U.S. Revolving Note (U.S. Dollar denominations) | | | 5.86 | % | | $ | 220,000 | | | | 6.58 | % | | $ | 222,000 | |
Other loans | | | — | | | | — | | | | 3.90 | % | | | 233 | |
Finance leases | | | 3.46 | % | | | 201 | | | | 3.53 | % | | | 605 | |
Total debt | | | | | | 220,201 | | | | | | | 222,838 | |
Current maturities | | | | | | (137 | ) | | | | | | (621 | ) |
Long-term debt, less current maturities | | | | | $ | 220,064 | | | | | | $ | 222,217 | |
Credit Agreement
Gentherm, together with certain of its subsidiaries, maintain a revolving credit note (“U.S. Revolving Note”) under its Second Amended and Restated Credit Agreement (the “Second Amended and Restated Credit Agreement”) with a consortium of lenders and Bank of America, N.A. as administrative agent. The Second Amended and Restated Credit Agreement was entered into on June 10, 2022 and amends and restates in its entirety the Amended and Restated Credit Agreement dated June 27, 2019, by and among Gentherm, certain of its direct and indirect subsidiaries, the lenders party thereto and the Agent. The Second Amended and Restated Credit Agreement has a maximum borrowing capacity of $500 million and matures on June 10, 2027. The Second Amended and Restated Credit Agreement contains covenants, that, among other things, (i) prohibit or limit the ability of the borrowers and any material subsidiary to incur additional indebtedness, create liens, pay dividends, make certain types of investments (including acquisitions), enter into certain types of transactions with affiliates, prepay other indebtedness, sell assets or enter into certain other transactions outside the ordinary course of business, and (ii) require that Gentherm maintain a minimum Consolidated Interest Coverage Ratio and a maximum Consolidated Net Leverage Ratio (based on consolidated EBITDA for the applicable trailing four fiscal quarters) as of the end of any fiscal quarter.
Finance Leases
As of December 31, 2024 and 2023, there was $0.2 million and $0.6 million of outstanding finance leases, respectively.
Other Sources of Liquidity
Receivable Factoring
The Company was party to receivable factoring agreements with unrelated third parties under which we could sell receivables for certain account debtors, on a revolving basis, subject to outstanding balances and concentration limits. The receivable factoring agreements were transferred in their entirety to the acquiring entities and were accounted for as a sale. Some of the agreements had deferred purchase price arrangements. During the year ended December 31, 2024, all past factoring arrangements were terminated or expired. As of December 31, 2024 there were remaining receivables factored and outstanding that will be collected in the future, however, no further factoring can occur under these factoring agreements.
Material Cash Requirements
The following table summarizes current and long-term material cash requirements as of December 31, 2024, which we expect to fund primarily with operating cash flows. We have not included amounts for material and component purchase obligations related to standard recurring purchases of materials for use in our manufacturing operations as these amounts are generally consistent from year to year, closely reflect our levels of production, and are not long-term in nature.
| | | | | | | | | | | | | | | | | | | | |
| | Payments Due by Period | |
Material Cash Requirements (in thousands) | | Total | | | Less than 1 year | | | 1 to 3 years | | | 3 to 5 years | | | More than 5 years | |
Long-term debt obligations (1) | | $ | 220,201 | | | $ | 137 | | | $ | 220,064 | | | $ | — | | | $ | — | |
Operating lease obligations (2) | | | 79,027 | | | | 11,440 | | | | 16,428 | | | | 12,284 | | | | 38,875 | |
Capital commitments (3) | | | 9,500 | | | | 9,500 | | | | — | | | | — | | | | — | |
Total | | $ | 308,728 | | | $ | 21,077 | | | $ | 236,492 | | | $ | 12,284 | | | $ | 38,875 | |
(1)Long-term debt obligations do not include an amount payable for interest. See Note 9, “Debt,” to the consolidated financial statements included in this Annual Report for additional information.
(2)See Note 8, “Leases,” to the consolidated financial statements included in this Annual Report for additional information.
(3)Capital commitments is comprised of commitments for capital expenditures. Such commitments are typically less than one year.
Other Commitments
In December 2021, the Company committed to make a $5 million investment in Autotech Fund III, L.P., pursuant to a limited partnership agreement. As a limited partner, the Company will periodically make capital contributions toward this total commitment amount over the expected ten year life of the fund. The Company has made contributions of approximately $1.8 million to the Autotech Fund III, LP as of December 31, 2024. Timing of the remaining $3.2 million of capital contributions is unknown and therefore amounts have been excluded from the Material Cash Requirements table above.
Restructuring subsequent events
In February 2025, the Company committed to additional restructuring plans intended to further optimize its manufacturing footprint by realigning its manufacturing capacity. As a result of these plans, the Company will close its facility in Plzeň, Czech Republic and relocate the manufacturing activities into other existing facilities within the region. Additionally, in Asia, we will relocate certain manufacturing activities from our facility in Shanghai, China to our new facility in Tianjin, China.
In connection with these plans, the Company expects to incur total costs of between $13 million and $21 million. The total expected costs include employee severance, retention and termination costs of between $7 million and $11 million and capital expenditures of between $3 million and $5 million. The Company also expects to incur other transition costs including recruiting, relocation, and machinery and equipment move and set up costs of between $3 million and $5 million.
Capital Expenditures
We anticipate capital expenditures in fiscal year 2025 of approximately $70 million to $80 million. We will continue support organic growth through capacity expansion in our facilities and make capital improvements as necessary. We believe cash on hand,
cash generated from operations, and the borrowing capacity available under our Second Amended and Restated Credit Agreement will be sufficient to support our capital expenditures.
Stock Repurchase Program
In December 2020, the Board of Directors of Gentherm Incorporated (the “Board of Directors”) authorized the 2020 Stock Repurchase Program. Under the 2020 Stock Repurchase Program, the Company was authorized to repurchase up to $150.0 million of its issued and outstanding Common Stock over a three-year period, expiring December 15, 2023. On November 1, 2023, the Board of Directors extended the maturity date of the program from December 15, 2023 to June 30, 2024.
During the year ended December 31, 2024, the Company repurchased $20.0 million in the open market under the 2020 Stock Repurchase Program with an average price paid per share of $52.65.
On November 1, 2023, following the above-noted extension, the Company entered into the ASR Agreement with Bank of America, N.A. that provided for the Company to purchase shares of Common Stock in an aggregate amount of $60.0 million under the 2020 Stock Repurchase Program.
Under the terms of the ASR Agreement, on November 2, 2023, the Company paid $60.0 million to Bank of America for an initial purchase of approximately 1.22 million shares of Common Stock, representing 80% of ASR Repurchase Amount. The final settlement date occurred in the second quarter of 2024. During the year ended December 31, 2024, the Company paid $0.3 million in cash as the final settlement of the ASR Agreement. The 2020 Stock Repurchase Program had $17.5 million of repurchase authorization remaining at the time of expiration.
In June 2024, the Board of Directors authorized the “2024 Stock Repurchase Program” to commence upon expiration of the 2020 Stock Repurchase Program on June 30, 2024. Under the 2024 Stock Repurchase Program, the Company is authorized to repurchase up to $150.0 million of its issued and outstanding Common Stock over a three-year period, expiring June 30, 2027. Repurchases under the 2024 Stock Repurchase Program may be made, from time to time, in amounts and at prices the Company deems appropriate, subject to market conditions, applicable legal requirements, debt covenants and other considerations. Any such repurchases may be executed using open market purchases, accelerated share repurchase programs, privately negotiated agreements or other transactions. Repurchases may be funded from cash on hand, available borrowings or proceeds from potential debt or other capital markets sources.
During the year ended December 31, 2024, the Company repurchased shares under the 2024 Stock Repurchase Program for $29.9 million and have a remaining repurchase authorization of $120.1 million as of December 31, 2024.
Stock repurchases are subject to excise tax, subject to specified exclusions and adjustments. Excise tax of $0.5 million was charged to Common Stock for the year ended December 31, 2024.
For further information related to our stock repurchase program, see Note 16, "Equity" in the notes to the consolidated financial statements included in this Annual Report.
Effects of Inflation
The automotive component supply industry has historically been subject to inflationary pressures with respect to materials and labor. At times in recent years, the automotive industry has experienced significant volatility in the costs of certain materials and components, labor and transportation. Although supply chain conditions have steadily improved and certain inflationary pressures have moderated, rising costs of materials, labor, equipment and other inputs used to manufacture and sell our products, including freight and logistics costs, have impacted, and may in the future impact, operating costs and operating results. Although the Company has developed and implemented strategies to mitigate the impact of higher material component costs and transportation costs through sourcing and manufacturing efficiencies where possible, these strategies together with commercial negotiations with Gentherm's customers and suppliers have not fully offset to date and may not fully offset our future cost increases. Such inflationary cost increase may increase the cash required to fund our operations by a material amount.
Critical Accounting Estimates
Our consolidated financial statements have been prepared in accordance with accounting principles generally accepted in the United States of America (“GAAP”). In preparing these consolidated financial statements, management was required to make
estimates and assumptions that affect the reported amounts of assets, liabilities, revenues and expenses. These estimates and assumptions are based on our historical experience, the terms of existing contracts, our evaluation of trends in the industry, information provided by our customers and suppliers and information available from other outside sources, as appropriate. These estimates and assumptions are subject to an inherent degree of uncertainty. Because future events and their effects cannot be determined with certainty, actual results could differ from our assumptions and estimates, and such differences could be material to our financial statements.
We have identified the following estimates as our most critical accounting estimates, which are those that are most important to aid in fully understanding and evaluating the Company’s financial condition and results of operations, and that require management’s most subjective and complex judgments. Information regarding our other significant accounting estimates and policies are disclosed in Note 2, "Summary of Significant Accounting Policies", of the notes to the consolidated financial statements.
Goodwill
Critical estimates: Goodwill is tested for impairment at least annually as of December 31 and whenever events or changes in circumstances indicate that the carrying value may not be recoverable. In conducting our annual impairment assessment testing, we first perform a qualitative assessment of whether it is more likely than not that a reporting unit’s fair value is less than its carrying amount. If not, no further goodwill impairment testing is performed. If it is more likely than not that a reporting unit’s fair value is less than its carrying amount, or if we elect not to perform a qualitative assessment of a reporting unit, we then compare the fair value of the reporting unit to the related net book value. If the net book value of a reporting unit exceeds its fair value, an impairment loss is measured and recognized.
The Company utilizes an income approach to estimate the fair value of a reporting unit and a market valuation approach to further support this analysis. The income approach is based on projected debt-free cash flow that is discounted to the present value using discount factors that consider the timing and risk of cash flows. We believe that this approach is appropriate because it provides a fair value estimate based on the reporting unit’s expected long-term operating cash flow performance. This approach also mitigates the impact of cyclical trends that occur in our industry. Fair value is estimated using internally developed forecasts, as well as commercial and discount rate assumptions. The discount rate used is the value-weighted average of our estimated cost of equity and of debt (“cost of capital”) derived using both known and estimated customary market metrics. Our weighted average cost of capital is adjusted to reflect risk, if necessary. Other significant assumptions include terminal value growth rates and terminal value margin rates. To further support the fair value estimate determined by the income approach, the Company utilizes a market valuation approach to estimate the fair value of a reporting unit. The market approach considers historical and/or anticipated financial metrics of a reporting unit and applies valuation multiples based on recent observed transactions involving companies similar enough to the reporting units from which to draw meaningful conclusions.
Judgments and uncertainties: These fair value calculations contain uncertainties as they require management to make assumptions about future cash flows and appropriate discount rates to reflect the risk inherent in the future cash flows and to derive a reasonable enterprise value and related premium. Our ability to realize the future cash flows used in our fair value calculations is affected by factors such as the success of strategic initiatives, changes in economic conditions, changes in our operating performance and changes in our business strategies. The estimated future cash flows reflect management's latest assumptions of the financial projections based on current and anticipated competitive landscape, including estimates of revenue based on production volumes over the foreseeable future and long-term growth rates, and operating margins based on historical trends and future cost containment activities.
Also, the market valuation approach is highly subjective as it requires the selection of comparable companies and valuation multiples.
Impact if actual results differ from assumptions: As of December 31, 2024, our goodwill balance included $72.8 million related to our Automotive segment and $26.8 million related to our Medical segment. These balances could be fully or partially impaired if management does not achieve the expected cash flows assumed in the fair value estimates or if assumptions and cash flow estimates change in future periods.
The Company’s Medical segment is comprised of one reporting unit (the “Medical reporting unit”). The estimated fair value of the Medical reporting unit exceeded its carrying value by approximately 15% as of December 31, 2024. The Medical reporting unit is at risk of failing future impairment tests, as the estimate of fair value does not substantially exceed its carrying value. The Company’s
estimated future cash flow projections for the Medical reporting unit for the period of 2025 through 2029 assume a compound annual growth rate for revenue of approximately 13.1%, which we deem to be a critical assumption in the fair value determination as of December 31, 2024. This forecasted revenue growth, which is significantly higher than historical periods, is primarily driven by our anticipated product launches that are expected to increase volume and price due to new features and product capabilities. Realization of this assumed revenue growth is dependent on the successful launch of these new products and product features and the acceptance of customers. If this revenue growth is not achieved or if the estimated growth rates are reduced because of new information or experience, the fair value of the Medical reporting unit could decrease, which could result in a material impairment of goodwill. Additionally, forecasted cash flows assume margin expansion as a direct result of the forecasted revenue growth. If we experience higher costs than assumed in our forecast or if we experience other deviations from forecasted results and/or external factors (e.g., increase of interest rates), it could result in a material impairment.
The Company's reporting units in its Automotive segment each have a fair value that is substantially in excess of its respective carrying value as of December 31, 2024.
Income Taxes
Critical estimates: The Company is subject to income taxes in the United States and numerous international jurisdictions. In calculating our effective income tax rate, we make judgments regarding certain tax positions, including the timing and amount of deductions and allocations of income among various tax jurisdictions. When determining whether we will be able to realize deferred tax assets, judgment is used to evaluate the positive and negative evidence, including forecasting taxable income using historical and future operating results. The provision for income taxes includes current income taxes as well as deferred income taxes. Deferred tax assets and liabilities are measured based on the difference between the financial statement and tax base of assets and liabilities at the applicable enacted tax rates.
Judgments and uncertainties: We have various tax filing positions with regard to the timing and amount of deductions and credits and the allocation of income among various tax jurisdictions, based on our interpretation of local tax laws, supported by external advisor review for material positions.
Valuation allowances are established when necessary on a jurisdictional basis to reduce deferred tax assets to the amounts expected to be realized when management considers it more likely than not that some portion or all of a deferred tax asset will not be realized. The determination as to whether a deferred tax asset will be realized is based on the evaluation of positive and negative evidence, which includes historical profitability, future market growth, future taxable income, the expected timing of the reversals of existing temporary differences and tax planning strategies. The Company assesses deferred taxes and the adequacy or need for a valuation allowance on a quarterly basis.
The Company is subject to ongoing tax examinations and assessments in various jurisdictions. At any time, multiple tax years are subject to audit by the various tax authorities and a number of years may elapse before a particular matter, for which a liability has been established, is audited and fully resolved or clarified. In evaluating the exposures associated with various tax filing positions, the Company may record liabilities for such exposures. The Company generally adjusts its liabilities for unrecognized tax benefits and related indemnification obligations through earnings in the period in which an uncertain tax position is effectively settled, the statute of limitations expires for the relevant taxing authority to examine the tax position, or when more information becomes available. Although management believes that the judgments and estimates discussed herein are reasonable, actual results could differ, and may materially increase or decrease the effective tax rate, as well as impact the Company’s operating results.
Impact if actual results differ from assumptions: Some or all of management’s judgments are subject to review by the taxing authorities. If one or more of the taxing authorities were to successfully challenge our right to realize some or all of the tax benefit we have recorded, and we were unable to realize this benefit, it could have a material adverse effect on our financial results and cash flows. Further, if the Company is unable to generate sufficient future taxable income, there is a material change in the actual effective tax rates, a change to the time period within which the underlying temporary differences become taxable or deductible, or if the tax laws change unfavorably, then the Company could be required to increase the valuation allowance against deferred tax assets, resulting in an increase in income tax expense and the effective tax rate.
For the year ended December 31, 2024, each change of the effective tax rate by one percentage point would impact income tax expense by $1.0 million.
Recent Accounting Pronouncements
For a complete description of recent accounting standards which we have not yet been required to implement which may be applicable to our operations, as well as significant accounting standards that have been adopted during the year ended December 31, 2024, see Note 3, “New Accounting Pronouncements,” to the consolidated financial statements included in this Annual Report.
ITEM 7A. QUANTITATIVE AND QUALITATIVE DISCLOSURES ABOUT MARKET RISK
The Company is exposed to various market risks including, but not limited to, changes in foreign currency exchange rates, changes in interest rates and price fluctuations of certain material commodities such as copper. Market risks for changes in interest rates relate primarily to the Company's debt obligations under the Second Amended and Restated Credit Agreement. Foreign currency exchange risks are attributable to sales to foreign customers and purchases from foreign suppliers not denominated in a location’s functional currency, foreign plant operations, intercompany indebtedness, acquisitions denominated in foreign currencies, intercompany investments and include exposures to the Euro, Mexican Peso, Canadian Dollar, Hungarian Forint, North Macedonian Denar, Ukrainian Hryvnia, Japanese Yen, Chinese Renminbi, Korean Won, Czech Koruna and Vietnamese Dong.
The Company regularly enters into derivative contracts with the objective of managing its financial and operational exposure arising from these risks by offsetting gains and losses on the underlying exposures with gains and losses on the financial instruments used to hedge them. The decision of whether and when to execute derivative financial instruments, along with the duration of the instrument, may vary from period to period depending on market conditions, the relative costs of the instruments and capacity to hedge. The duration is linked to the timing of the underlying exposure, with the connection between the two being regularly monitored. The Company does not enter into derivative financial instruments for speculative or trading purposes. Some derivative contracts do not qualify for hedge accounting; for other derivative contracts, we elect to not apply hedge accounting.
The Company’s designated hedging relationships are formally documented at the inception of the hedge, and hedges must be highly effective in offsetting changes to future cash flows on hedged transactions both at the inception of a hedge and on an ongoing basis to be designated for hedge accounting treatment. For derivative contracts that can be classified as a cash flow hedge, the effective portion of the change in the fair value of the derivative is recorded to accumulated other comprehensive loss in the consolidated balance sheets. When the underlying hedge transaction is realized, the gain or loss included in accumulated other comprehensive loss is recorded in earnings in the consolidated statements of income on the same line as the gain or loss on the hedged item attributable to the hedged risk. The Company records the ineffective portion of foreign currency and copper commodity hedging instruments, if any, to cost of sales, and the ineffective portion of interest rate swaps, if any, to interest expense in the consolidated statements of income. Cash flows associated with derivatives are reported in net cash provided by operating activities in the Company’s consolidated statements of cash flows.
Information related to the fair values of all derivative instruments in our consolidated balance sheet as of December 31, 2024 is set forth in Note 14, “Financial Instruments” in the consolidated financial statements included in this Annual Report.
Interest Rate Sensitivity
The table presents principal cash flows and related weighted average interest rates by expected maturity dates for each of the Company’s debt obligations, excluding finance leases. The information is presented in U.S. dollar equivalents, which is the Company’s reporting currency.
| | | | | | | | | | | | | | | | | | | | | | | | |
| | Expected Maturity Date | |
| | 2025 | | | 2026 | | | 2027 | | | 2028 | | | Total | | | Fair Value | |
Liabilities | | | | | | | | | | | | | | | | | | |
Long-Term Debt: | | | | | | | | | | | | | | | | | | |
Variable rate | | $ | — | | | $ | — | | | $ | 220,000 | | | $ | — | | | $ | 220,000 | | | $ | 220,000 | |
Variable interest rate as of December 31, 2024 | | | | | | | | | 5.86 | % | | | | | | 5.86 | % | | | |
Based on the amounts outstanding as of December 31, 2024, a hypothetical 100 basis point change (increase or decrease) in interest rates would impact annual interest expense by $2.2 million. To hedge the Company's exposure to interest payment fluctuations on a portion of the borrowings, we entered into a floating-to-fixed interest rate swap agreement with a notional amount of $100.0 million.
Exchange Rate Sensitivity
The table below provides information about the Company’s foreign currency forward exchange rate agreements that are sensitive to changes in foreign currency exchange rates. The table presents the notional amounts and weighted average exchange rates by expected (contractual) maturity dates for each type of foreign currency forward exchange agreement. These notional amounts generally are used to calculate the contractual payments to be exchanged under the contract.
| | | | | | | | | | | | | | | | | |
| | Expected Maturity or Transaction Date | | | | | |
Anticipated Transactions and Related Derivatives | | 2025 | | | 2026 | | | Total | | | Fair Value | | |
USD Functional Currency | | | | | | | | | | | | | |
Exchange Agreements: | | | | | | | | | | | | | |
(Receive MXN / Pay USD) | | | | | | | | | | | | | |
Total contract amount | | $ | 79,359 | | | $ | 35,122 | | | $ | 114,481 | | | $ | (1,952 | ) | |
Average contract rate | | | 19.85 | | | | 20.50 | | | | 20.05 | | | | | |
(Receive HUF / Pay EUR) | | | | | | | | | | | | | |
Total contract amount | | $ | 12,015 | | | $ | — | | | $ | 12,015 | | | $ | (86 | ) | |
Average contract rate | | | 399.50 | | | | — | | | | 399.50 | | | | | |
The table below presents the potential gain and loss in fair value for the foreign currency derivative contracts from a hypothetical 10% change in quoted currency exchange rates.
| | | | | | | | | | | | | | | | |
| | 2024 | | | 2023 | |
Exchange Rate Sensitivity | | Potential loss in fair value | | | Potential gain in fair value | | | Potential loss in fair value | | | Potential gain in fair value | |
Exchange Agreements:(Receive MXN / Pay USD) | | $ | 6,243 | | | $ | 7,359 | | | $ | 7,179 | | | $ | 9,798 | |
Exchange Agreements:(Receive HUF / Pay EUR) | | | 917 | | | | 1,120 | | | | — | | | | — | |
ITEM 8. FINANCIAL STATEMENTS AND SUPPLEMENTARY DATA
The audited consolidated financial statements and related financial information required to be filed hereunder are indexed on page F-1 of this Annual Report and are incorporated herein by reference.
ITEM 9. CHANGES IN AND DISAGREEMENTS WITH ACCOUNTANTS ON ACCOUNTING AND FINANCIAL DISCLOSURE
None.
ITEM 9A. CONTROLS AND PROCEDURES
Evaluation of Disclosure Controls and Procedures
Management of the Company, under the supervision and with the participation of the Chief Executive Officer and the Chief Financial Officer, carried out an evaluation of the effectiveness of the design and operation of the Company’s disclosure controls and procedures as of December 31, 2024. As defined in Rules 13a-15(e) and 15d-15(e) under the Securities Exchange Act of 1934 (as amended, the “Exchange Act”), disclosure controls and procedures are controls and procedures designed to provide reasonable assurance that information required to be disclosed in reports filed or submitted under the Exchange Act is recorded, processed, summarized and reported on a timely basis, and that such information is accumulated and communicated to management, including the Chief Executive Officer and Chief Financial Officer, as appropriate, to allow timely decisions regarding required disclosure. Based upon this evaluation, the Chief Executive Officer and Chief Financial Officer have concluded that the Company’s disclosure controls and procedures were effective as of December 31, 2024.
Management’s Report on Internal Control Over Financial Reporting
Management is responsible for establishing and maintaining adequate internal control over financial reporting, as such term is defined in Exchange Act Rules 13a-15(f) and 15d-15(f), for the Company. Internal control over financial reporting is a process designed to provide reasonable assurance regarding the reliability of financial reporting and the preparation of financial statements for external purposes in accordance with generally accepted accounting principles. Under the supervision and with the participation of the Chief Executive Officer and Chief Financial Officer, management conducted an evaluation of the effectiveness of the Company’s internal control over financial reporting as of December 31, 2024 based on the framework set forth by the Committee of Sponsoring Organizations of the Treadway Commission (COSO) in “Internal Control-Integrated Framework (2013).” Based on that evaluation, management has concluded that the Company’s internal control over financial reporting was effective as of December 31, 2024.
The attestation report of the Company’s independent registered public accounting firm, regarding the effectiveness of the Company’s internal control over financial reporting, is set forth in Item 15, "Exhibits and Financial Statement Schedules," included under the caption "Report of Independent Registered Public Accounting Firm".
Changes in Internal Control Over Financial Reporting
There were no changes in our internal control over financial reporting during the quarter ended December 31, 2024 that have materially affected, or are reasonably likely to materially affect, our internal control over financial reporting.
Inherent Limitations on Effectiveness of Controls
Our management, including the Chief Executive Officer and Chief Financial Officer, does not expect that our disclosure controls and procedures or our internal control over financial reporting will prevent or detect all errors and all fraud. A control system, no matter how well-designed and operated, can provide only reasonable, not absolute, assurance that the control system’s objectives will be met. The design of a control system must reflect the fact that there are resource constraints, and the benefits of controls must be considered relative to their costs. Further, because of the inherent limitations in all control systems, no evaluation of controls can provide absolute assurance that misstatements due to error or fraud will not occur or that all control issues and instances of fraud, if any, have been detected.
ITEM 9B. OTHER INFORMATION
During the three months ended December 31, 2024, none of the Company's directors or Section 16 officers adopted or terminated (i) any contract, instruction or written plan for the purchase or sale of Company securities that was intended to satisfy the affirmative defense conditions of Rule 10b5-1(c) of the Exchange Act or (ii) any non-Rule 10b5-1 trading arrangement.
ITEM 9C. DISCLOSURE REGARDING FOREIGN JURISDICTIONS THAT PREVENT INSPECTIONS
None.
PART III
ITEM 10. DIRECTORS, EXECUTIVE OFFICERS AND CORPORATE GOVERNANCE
The information required by this item is set forth under the following captions in our proxy statement to be filed with respect to the 2025 annual meeting of shareholders (the “Proxy Statement”), all of which is incorporated herein by reference: “Proposal No. 1 – Election of Directors”, “Corporate Governance – Key Policies and Practices”, “Corporate Governance – Standing Committees of the Board”, “Executive Officers” and “Additional Information – Requirements for Submission of Shareholder Proposals and Nominations for 2026 Annual Meeting.”
ITEM 11. EXECUTIVE COMPENSATION.
The information required by this item set forth under the following captions in our Proxy Statement, all of which is incorporated herein by reference: “Director Compensation”, “Compensation Discussion & Analysis”, “Compensation and Talent Committee Report”, and “Named Executive Officer Compensation Tables.”
ITEM 12. SECURITY OWNERSHIP OF CERTAIN BENEFICIAL OWNERS AND MANAGEMENT AND RELATED STOCKHOLDER MATTERS.
The information required by this item is set forth under the following caption in our Proxy Statement, which is incorporated herein by reference: “Security Ownership of Certain Beneficial Owners and Management.”
ITEM 13. CERTAIN RELATIONSHIPS AND RELATED TRANSACTIONS, AND DIRECTOR INDEPENDENCE.
The information required by this item is set forth under the following captions in our Proxy Statement, all of which is incorporated herein by reference: “Proposal No. 1 – Election of Directors – Director Independence” and “Related Person Transactions.”
ITEM 14. PRINCIPAL ACCOUNTING FEES AND SERVICES.
The information required by this item is set forth under the following caption in our Proxy Statement, which is incorporated herein by reference: “Proposal No. 3 – Ratification of Appointment of Independent Registered Public Accounting Firm For 2025" and "Audit Committee Matters.”
PART IV
ITEM 15. EXHIBITS AND FINANCIAL STATEMENT SCHEDULES
The following documents are filed as part of this Annual Report:
The following financial statements of the Company and reports of independent accountants are included in Item 15 of this Annual Report:
2.Financial Statement Schedule.
The following Schedule to Financial Statements is included herein:
Schedule II — Valuation and Qualifying Accounts.
The exhibits to this Annual Report are as follows:
| | | | | | | | | | | | |
| | | | |
| Incorporated by Reference |
Exhibit
Number | | Exhibit Description |
| Filed/Furnished Herewith |
| Form | | Period Ending | | Exhibit / Appendix Number | | Filing Date |
10.4.2** | | Form of Performance Stock Unit Award Agreement under the Gentherm Incorporated 2023 Equity Incentive Plan | | | | 8-K | | | | 10.2 | | 5/18/23 |
10.4.3** | | Form of Restricted Stock Unit Award Agreement under the Gentherm Incorporated 2023 Equity Incentive Plan | | | | 8-K | | | | 10.3 | | 5/18/23 |
10.4.4** | | Form of Restricted Stock Award Agreement (Director) under the Gentherm Incorporated 2023 Equity Incentive Plan | | | | 8-K | | | | 10.4 | | 5/18/23 |
10.5.1 | | Second Amended and Restated Credit Agreement, dated as of June 10, 2022, by and among Gentherm Incorporated, Gentherm (Texas), Inc., Gentherm Licensing, Limited Partnership, Gentherm Medical, LLC, Gentherm GmbH, Gentherm Enterprises GmbH and Gentherm Licensing GmbH, the lenders party thereto, and Bank of America, N.A., as administrative agent, swing line lender and L/C issuer. | | | | 8-K | | | | 10.1 | | 6/13/22 |
10.5.2 | | Second Amended and Restated Pledge and Security Agreement, dated as of June 10, 2022, by and among Gentherm Incorporated, Gentherm (Texas), Inc., Gentherm Medical, LLC, Gentherm Properties I, LLC, Gentherm Properties II, LLC and Bank of America, N.A. | | | | 8-K | | | | 10.2 | | 6/13/22 |
10.6.1** |
| Employment Contract between Gentherm Incorporated and Phillip Eyler, dated as of September 18, 2017 |
|
|
| 8-K |
|
|
| 10.1 |
| 10/3/17 |
10.6.2** |
| Amendment to Employment Terms between Gentherm Incorporated and Phillip Eyler, dated as of December 7, 2018 |
|
|
| 8-K |
|
|
| 10.1 |
| 12/7/18 |
10.6.3** |
| Second Amendment to Employment Terms between Gentherm Incorporated and Phillip Eyler dated as of April 21, 2020 |
| | | 10-Q | | 6/30/20 | | 10.4 | | 8/4/20 |
10.7.1** |
| Offer Letter between Gentherm Incorporated and Matteo Anversa, dated as of October 22, 2018 |
|
|
| 8-K |
|
|
| 10.1 |
| 12/12/18 |
10.7.2** |
| First Amendment to Offer Letter Agreement between Gentherm Incorporated and Matteo Anversa dated as of April 21, 2020 |
| | | 10-Q | | 6/30/20 | | 10.5 | | 8/4/20 |
10.7.3** | | Second Amendment to Offer Letter Agreement between Gentherm Incorporated and Matteo Anversa, dated as of March 12, 2021 | | | | 8-K | | | | 10.5 | | 3/15/21 |
10.8.1** |
| Employment Contract between Gentherm GmbH and Thomas Stocker, effective September 1, 2019 |
|
|
| 10-Q |
| 9/30/19 |
| 10.1 |
| 10/29/19 |
10.8.2** | | First Amendment to the Employment Agreement between Gentherm Enterprises GmbH and Thomas Stocker, effective June 28, 2021 | | | | 10-Q | | 6/30/21 | | 10.1 | | 7/30/21 |
10.9.1** |
| Offer Letter between Gentherm Incorporated and Hui (Helen) Xu, effective November 4, 2019 |
| |
| 10-K |
| 12/31/19 |
| 10.11 |
| 2/20/20 |
10.9.2** | | Amendment to Offer Letter between Gentherm Incorporated and Helen Xu, dated as of August 21, 2023 | | | | 10-Q | | 9/30/23 | | 10.1 | | 10/26/23 |
10.10** | | Severance Pay Plan for Eligible Employees of Gentherm Incorporated | | | | 8-K | | | | 10.4 | | 3/15/21 |
10.11** | | Form of First Amendment to Executive Offer Letter | | | | 8-K | | | | 10.7 | | 3/15/21 |
| | | | | | | | | | | | |
| | | | |
| Incorporated by Reference |
Exhibit
Number | | Exhibit Description |
| Filed/Furnished Herewith |
| Form | | Period Ending | | Exhibit / Appendix Number | | Filing Date |
10.12.1** |
| Amended and Restated Gentherm Incorporated Deferred Compensation Plan, dated May 20, 2019 (and effective January 1, 2019) |
|
|
| 10-Q |
| 6/30/19 |
| 10.4 |
| 7/26/19 |
10.12.2** |
| Deferred Compensation Agreement, between Gentherm Incorporated and Phillip Eyler, dated as of December 31, 2018. |
|
|
| 8-K |
|
|
| 10.2 |
| 1/4/19 |
10.13** | | Separation and Consulting Agreement between Gentherm Incorporated and Phillip Eyler, dated as of November 6, 2024 | | | | 8-K | | | | 10.2 | | 11/8/24 |
10.14** | | Offer Letter between Gentherm Incorporated and William T. Presley, dated as of November 6, 2024 | | | | 8-K | | | | 10.1 | | 11/8/24 |
10.15** | | Offer Letter between Gentherm Incorporated and Jonathan Douyard, dated as of November 20, 2024 | | | | 8-K | | | | 10 | | 11/20/24 |
10.16** | | Offer Letter between Gentherm Incorporated and Barb Runyon, dated as of June 18, 2018 | | | | 10-Q | | 6/30/20 | | 10.1 | | 8/4/20 |
10.17** | | Offer Letter between Gentherm Incorporated and Jaymi Wilson, dated as of July 7, 2018 | | X | | | | | | | | |
19 | | Securities Trading Policy | | X | | | | | | | | |
21 |
| List of Subsidiaries (Direct and Indirect) of the Company | | X | | | | | | | | |
23.1 |
| Consent of Ernst & Young LLP |
| X |
|
|
|
|
|
|
|
|
24 | | Power of Attorney | | X | | | | | | | | |
31.1 |
| Section 302 Certification - CEO | | X | | | | | | | | |
31.2 |
| Section 302 Certification – CFO | | X | | | | | | | | |
32.1*** |
| Section 906 Certification – CEO | | X | | | | | | | | |
32.2*** |
| Section 906 Certification - CFO | | X | | | | | | | | |
97 | | Gentherm Incorporated Policy for the Recovery of Erroneously Awarded Compensation | | | | 10-K | | 12/31/23 | | 97 | | 2/21/24 |
101.INS |
| Inline XBRL Instance Document – The instance document does not appear in the Interactive Data File because its XBRL tags are embedded within the Inline XBRL document. |
| X |
|
|
|
|
|
|
|
|
101.SCH |
| Inline XBRL Taxonomy Extension Schema With Embedded Linkbase Documents |
| X |
|
|
|
|
|
|
|
|
104 | | Cover Page Interactive Date File – the cover page XBRL tags are embedded within the Inline XBRL document | | X | | | | | | | | |
* Schedules and exhibits to this agreement have been omitted pursuant to Item 601(a)(5) of Regulation S-K. The Company agrees to furnish any omitted schedules or exhibits upon the request of the SEC.
** Indicates management contract or compensatory plan or arrangement.
*** Documents are furnished not filed.
ITEM 16. Form 10-K Summary
None.
INDEX TO FINANCIAL STATEMENTS
| | | |
|
| Page | |
Reports of Ernst & Young LLP, Independent Registered Public Accounting Firm (PCAOB ID: 42) |
| F-2 | |
Consolidated Balance Sheets as of December 31, 2024 and 2023 |
| F-5 | |
Consolidated Statements of Income for the years ended December 31, 2024, 2023, and 2022 |
| F-6 | |
Consolidated Statements of Comprehensive Income for the years ended December 31, 2024, 2023, and 2022 |
| F-7 | |
Consolidated Statements of Changes in Shareholders’ Equity for the years ended December 31, 2024, 2023, and 2022 |
| F-8 | |
Consolidated Statements of Cash Flows for the years ended December 31, 2024, 2023, and 2022 |
| F-9 | |
Notes to the Consolidated Financial Statements |
| F-10 | |
REPORT OF INDEPENDENT REGISTERED PUBLIC ACCOUNTING FIRM
To the Shareholders and the Board of Directors of Gentherm Incorporated
Opinion on the Financial Statements
We have audited the accompanying consolidated balance sheets of Gentherm Incorporated (the Company) as of December 31, 2024 and 2023, the related consolidated statements of income, comprehensive income, changes in shareholders' equity and cash flows for each of the three years in the period ended December 31, 2024, and the related notes and financial statement schedule listed in the Index at Item 15 (collectively referred to as the “consolidated financial statements”). In our opinion, the consolidated financial statements present fairly, in all material respects, the financial position of the Company at December 31, 2024 and 2023, and the results of its operations and its cash flows for each of the three years in the period ended December 31, 2024, in conformity with U.S. generally accepted accounting principles.
We also have audited, in accordance with the standards of the Public Company Accounting Oversight Board (United States) (PCAOB), the Company's internal control over financial reporting as of December 31, 2024, based on criteria established in Internal Control—Integrated Framework issued by the Committee of Sponsoring Organizations of the Treadway Commission (2013 framework), and our report dated February 19, 2025, expressed an unqualified opinion thereon.
Basis for Opinion
These financial statements are the responsibility of the Company's management. Our responsibility is to express an opinion on the Company’s financial statements based on our audits. We are a public accounting firm registered with the PCAOB and are required to be independent with respect to the Company in accordance with the U.S. federal securities laws and the applicable rules and regulations of the Securities and Exchange Commission and the PCAOB.
We conducted our audits in accordance with the standards of the PCAOB. Those standards require that we plan and perform the audit to obtain reasonable assurance about whether the financial statements are free of material misstatement, whether due to error or fraud. Our audits included performing procedures to assess the risks of material misstatement of the financial statements, whether due to error or fraud, and performing procedures that respond to those risks. Such procedures included examining, on a test basis, evidence regarding the amounts and disclosures in the financial statements. Our audits also included evaluating the accounting principles used and significant estimates made by management, as well as evaluating the overall presentation of the financial statements. We believe that our audits provide a reasonable basis for our opinion.
Critical Audit Matter
The critical audit matter communicated below is a matter arising from the current period audit of the financial statements that was communicated or required to be communicated to the audit committee and that: (1) relates to accounts or disclosures that are material to the financial statements and (2) involved our especially challenging, subjective or complex judgments. The communication of the critical audit matter does not alter in any way our opinion on the consolidated financial statements, taken as a whole, and we are not, by communicating the critical audit matter below, providing a separate opinion on the critical audit matter or on the account or disclosure to which it relates.
| |
| Valuation of Goodwill |
Description of the Matter | As of December 31, 2024, the Company’s goodwill was $99.6 million consisting of $72.8 million in the automotive segment and $26.8 million in the medical segment. As discussed in Note 2 to the consolidated financial statements, goodwill is tested for impairment at least annually as of December 31 and whenever events or changes in circumstances indicate that it is more likely than not that a reporting unit’s fair value is less than it’s carrying amount. Auditing management’s annual goodwill impairment assessment for the medical reporting unit was complex and highly judgmental due to the estimation required to determine the fair value of the reporting unit. In particular, the fair value estimates used in the valuation of the medical reporting unit were sensitive to assumptions, such as revenue growth rates and operating margins, which are affected by expectations about future market or economic conditions. |
How We Addressed the Matter in Our Audit | We obtained an understanding, evaluated the design and tested the operating effectiveness of controls over the Company’s annual goodwill assessment, and annual forecasting process whereby the Company develops assumptions that are used in its analyses. This included controls over management's review of the valuation model and the assumptions used in the fair value measurements discussed above. To test the estimated fair value of the Company’s medical reporting unit, we performed audit procedures that included, among others, assessing the methodologies used and directly testing the assumptions and the underlying data used by the Company in its analysis, including assessing the completeness and accuracy of such underlying data. We utilized internal valuation specialists to assist in the evaluation of the assumptions and other relevant information that are most significant to the fair value estimate of the reporting unit, such as assessing the fair value methodologies applied and evaluating the reasonableness of the discount rate selected by management. We compared the assumptions used by management to current industry and economic trends, historical performance, guideline public companies in the same industry and strategic plans. We performed sensitivity analyses of assumptions to evaluate the changes in the fair value of the reporting units that would result from changes in the assumptions. Furthermore, we assessed the appropriateness of the disclosures in the consolidated financial statements. |
/s/ ERNST & YOUNG LLP
We have served as the Company’s auditor since 2020.
Detroit, Michigan
February 19, 2025
REPORT OF INDEPENDENT REGISTERED PUBLIC ACCOUNTING FIRM
To the Shareholders and the Board of Directors of Gentherm Incorporated
Opinion on Internal Control Over Financial Reporting
We have audited Gentherm Incorporated’s internal control over financial reporting as of December 31, 2024, based on criteria established in Internal Control—Integrated Framework issued by the Committee of Sponsoring Organizations of the Treadway Commission (2013 framework) (the COSO criteria). In our opinion, Gentherm Incorporated (the Company) maintained, in all material respects, effective internal control over financial reporting as of December 31, 2024, based on the COSO criteria.
We also have audited, in accordance with the standards of the Public Company Accounting Oversight Board (United States) (PCAOB), the consolidated balance sheets of the Company as of December 31, 2024 and 2023, the related consolidated statements of income, comprehensive income, changes in shareholders' equity and cash flows for each of the three years in the period ended December 31, 2024, and the related notes and financial statement schedule listed in the Index at Item 15 and our report dated February 19, 2025 expressed an unqualified opinion thereon.
Basis for Opinion
The Company’s management is responsible for maintaining effective internal control over financial reporting and for its assessment of the effectiveness of internal control over financial reporting included in the accompanying Management’s Report on Internal Control Over Financial Reporting. Our responsibility is to express an opinion on the Company’s internal control over financial reporting based on our audit. We are a public accounting firm registered with the PCAOB and are required to be independent with respect to the Company in accordance with the U.S. federal securities laws and the applicable rules and regulations of the Securities and Exchange Commission and the PCAOB.
We conducted our audit in accordance with the standards of the PCAOB. Those standards require that we plan and perform the audit to obtain reasonable assurance about whether effective internal control over financial reporting was maintained in all material respects.
Our audit included obtaining an understanding of internal control over financial reporting, assessing the risk that a material weakness exists, testing and evaluating the design and operating effectiveness of internal control based on the assessed risk, and performing such other procedures as we considered necessary in the circumstances. We believe that our audit provides a reasonable basis for our opinion.
Definition and Limitations of Internal Control Over Financial Reporting
A company’s internal control over financial reporting is a process designed to provide reasonable assurance regarding the reliability of financial reporting and the preparation of financial statements for external purposes in accordance with generally accepted accounting principles. A company’s internal control over financial reporting includes those policies and procedures that (1) pertain to the maintenance of records that, in reasonable detail, accurately and fairly reflect the transactions and dispositions of the assets of the company; (2) provide reasonable assurance that transactions are recorded as necessary to permit preparation of financial statements in accordance with generally accepted accounting principles, and that receipts and expenditures of the company are being made only in accordance with authorizations of management and directors of the company; and (3) provide reasonable assurance regarding prevention or timely detection of unauthorized acquisition, use, or disposition of the company’s assets that could have a material effect on the financial statements.
Because of its inherent limitations, internal control over financial reporting may not prevent or detect misstatements. Also, projections of any evaluation of effectiveness to future periods are subject to the risk that controls may become inadequate because of changes in conditions, or that the degree of compliance with the policies or procedures may deteriorate.
/s/ ERNST & YOUNG LLP
Detroit, Michigan
February 19, 2025
GENTHERM INCORPORATED
CONSOLIDATED BALANCE SHEETS
(In thousands, except share data)
| | | | | | | | |
| | December 31, | |
| | 2024 | | | 2023 | |
ASSETS | | | | | | |
Current Assets: | | | | | | |
Cash and cash equivalents | | $ | 134,134 | | | $ | 149,673 | |
Accounts receivable, net | | | 258,112 | | | | 253,579 | |
Inventory, net | | | 227,356 | | | | 205,892 | |
Other current assets | | | 64,413 | | | | 78,420 | |
Total current assets | | | 684,015 | | | | 687,564 | |
Property and equipment, net | | | 252,970 | | | | 245,234 | |
Goodwill | | | 99,603 | | | | 104,073 | |
Other intangible assets, net | | | 57,251 | | | | 66,482 | |
Operating lease right-of-use assets | | | 43,954 | | | | 27,358 | |
Deferred income tax assets | | | 75,041 | | | | 81,930 | |
Other non-current assets | | | 34,722 | | | | 21,730 | |
Total assets | | $ | 1,247,556 | | | $ | 1,234,371 | |
LIABILITIES AND SHAREHOLDERS’ EQUITY | | | | | | |
Current Liabilities: | | | | | | |
Accounts payable | | $ | 226,815 | | | $ | 215,827 | |
Current lease liabilities | | | 7,517 | | | | 7,700 | |
Current maturities of long-term debt | | | 137 | | | | 621 | |
Other current liabilities | | | 105,824 | | | | 100,805 | |
Total current liabilities | | | 340,293 | | | | 324,953 | |
Long-term debt, less current maturities | | | 220,064 | | | | 222,217 | |
Non-current lease liabilities | | | 37,052 | | | | 16,175 | |
Pension benefit obligation | | | 4,017 | | | | 3,209 | |
Other non-current liabilities | | | 29,183 | | | | 23,095 | |
Total liabilities | | $ | 630,609 | | | $ | 589,649 | |
Shareholders’ equity: | | | | | | |
Common Stock: | | | | | | |
No par value; 55,000,000 shares authorized 30,788,639 and 31,542,001 issued and outstanding at December 31, 2024 and December 31, 2023, respectively | | | 2,049 | | | | 50,503 | |
Paid-in capital | | | 4,290 | | | | — | |
Accumulated other comprehensive loss | | | (85,193 | ) | | | (30,160 | ) |
Accumulated earnings | | | 695,801 | | | | 624,379 | |
Total shareholders’ equity | | | 616,947 | | | | 644,722 | |
Total liabilities and shareholders’ equity | | $ | 1,247,556 | | | $ | 1,234,371 | |
The accompanying notes are an integral part of these consolidated financial statements
GENTHERM INCORPORATED
CONSOLIDATED STATEMENTS OF INCOME
(In thousands, except per share data)
| | | | | | | | | | | | |
| | Year Ended December 31, | |
| | 2024 | | | 2023 | | | 2022 | |
Product revenues | | $ | 1,456,124 | | | $ | 1,469,076 | | | $ | 1,204,656 | |
Cost of sales | | | 1,089,693 | | | | 1,117,452 | | | | 931,006 | |
Gross margin | | | 366,431 | | | | 351,624 | | | | 273,650 | |
Operating expenses: | | | | | | | | | |
Net research and development expenses | | | 88,697 | | | | 94,358 | | | | 85,722 | |
Selling, general and administrative expenses | | | 155,108 | | | | 155,579 | | | | 132,693 | |
Restructuring expenses, net | | | 13,110 | | | | 4,739 | | | | 637 | |
Impairment of intangible assets and property and equipment | | | 2,501 | | | | — | | | | 6,291 | |
Impairment of goodwill | | | — | | | | 19,509 | | | | — | |
Total operating expenses | | | 259,416 | | | | 274,185 | | | | 225,343 | |
Operating income | | | 107,015 | | | | 77,439 | | | | 48,307 | |
Interest expense, net | | | (15,300 | ) | | | (14,641 | ) | | | (4,294 | ) |
Foreign currency gain (loss) | | | 9,599 | | | | (5,918 | ) | | | (6,778 | ) |
Other income (loss) | | | 951 | | | | (1,926 | ) | | | 1,147 | |
Earnings before income tax | | | 102,265 | | | | 54,954 | | | | 38,382 | |
Income tax expense | | | 37,318 | | | | 14,611 | | | | 13,941 | |
Net income | | $ | 64,947 | | | $ | 40,343 | | | $ | 24,441 | |
Basic earnings per share | | $ | 2.08 | | | $ | 1.23 | | | $ | 0.74 | |
Diluted earnings per share | | $ | 2.06 | | | $ | 1.22 | | | $ | 0.73 | |
Weighted average number of shares – basic | | | 31,293 | | | | 32,778 | | | | 33,126 | |
Weighted average number of shares – diluted | | | 31,476 | | | | 33,067 | | | | 33,503 | |
The accompanying notes are an integral part of these consolidated financial statements
GENTHERM INCORPORATED
CONSOLIDATED STATEMENTS OF COMPREHENSIVE INCOME
(In thousands)
| | | | | | | | | | | | |
| | Year Ended December 31, | |
| | 2024 | | | 2023 | | | 2022 | |
Net income | | $ | 64,947 | | | $ | 40,343 | | | $ | 24,441 | |
Other comprehensive (loss) income: | | | | | | | | | |
Pension benefit obligations, net of tax | | | (840 | ) | | | 56 | | | | 1,826 | |
Foreign currency translation adjustments, net of tax | | | (45,266 | ) | | | 13,439 | | | | (14,081 | ) |
Unrealized (loss) gain on foreign currency derivative securities, net of tax | | | (8,927 | ) | | | 2,834 | | | | 2,693 | |
Unrealized loss on commodity derivative securities, net of tax | | | — | | | | — | | | | (5 | ) |
Other comprehensive (loss) income, net of tax | | | (55,033 | ) | | | 16,329 | | | | (9,567 | ) |
Comprehensive income | | $ | 9,914 | | | $ | 56,672 | | | $ | 14,874 | |
The accompanying notes are an integral part of these consolidated financial statements
GENTHERM INCORPORATED
CONSOLIDATED STATEMENTS OF CHANGES IN SHAREHOLDERS’ EQUITY
(In thousands)
| | | | | | | | | | | | | | | | | | | | | | | | |
| | | | | | | | | | | Accumulated | | | | | | | |
| | | | | | | | | | | Other | | | | | | | |
| | Common Stock | | | Paid-in | | | Comprehensive | | | Accumulated | | | | |
| | Shares | | | Amount | | | Capital | | | (Loss) Income | | | Earnings | | | Total | |
Balance at December 31, 2021 | | | 33,008 | | | $ | 118,646 | | | $ | 5,866 | | | $ | (36,922 | ) | | $ | 566,216 | | | $ | 653,806 | |
Net income | | | — | | | | — | | | | — | | | | — | | | | 24,441 | | | | 24,441 | |
Other comprehensive loss | | | — | | | | — | | | | — | | | | (9,567 | ) | | | — | | | | (9,567 | ) |
Stock compensation, net | | | 194 | | | | 4,012 | | | | (419 | ) | | | — | | | | — | | | | 3,593 | |
Balance at December 31, 2022 | | | 33,202 | | | $ | 122,658 | | | $ | 5,447 | | | $ | (46,489 | ) | | $ | 590,657 | | | $ | 672,273 | |
Net income | | | — | | | | — | | | | — | | | | — | | | | 40,343 | | | | 40,343 | |
Other comprehensive income | | | — | | | | — | | | | — | | | | 16,329 | | | | — | | | | 16,329 | |
Stock compensation, net | | | 129 | | | | 9,147 | | | | (68 | ) | | | — | | | | — | | | | 9,079 | |
Stock repurchase | | | (1,789 | ) | | | (81,302 | ) | | | (5,379 | ) | | | — | | | | (6,621 | ) | | | (93,302 | ) |
Balance at December 31, 2023 | | | 31,542 | | | $ | 50,503 | | | $ | — | | | $ | (30,160 | ) | | $ | 624,379 | | | $ | 644,722 | |
Net income | | | — | | | | — | | | | — | | | | — | | | | 64,947 | | | | 64,947 | |
Other comprehensive loss | | | — | | | | — | | | | — | | | | (55,033 | ) | | | — | | | | (55,033 | ) |
Stock compensation, net | | | 266 | | | | 14,153 | | | | (1,055 | ) | | | — | | | | (179 | ) | | | 12,919 | |
Stock repurchase | | | (1,019 | ) | | | (62,607 | ) | | | 5,345 | | | | — | | | | 6,654 | | | | (50,608 | ) |
Balance at December 31, 2024 | | | 30,789 | | | $ | 2,049 | | | $ | 4,290 | | | $ | (85,193 | ) | | $ | 695,801 | | | $ | 616,947 | |
The accompanying notes are an integral part of these consolidated financial statements
GENTHERM INCORPORATED
CONSOLIDATED STATEMENTS OF CASH FLOWS
(In thousands)
| | | | | | | | | | | | |
| | Year Ended December 31, | |
| | 2024 | | | 2023 | | | 2022 | |
Operating Activities: | | | | | | | | | |
Net income | | $ | 64,947 | | | $ | 40,343 | | | $ | 24,441 | |
Adjustments to reconcile net income to net cash provided by operating activities: | | | | | | | | | |
Depreciation and amortization | | | 52,975 | | | | 50,948 | | | | 44,394 | |
Deferred income taxes | | | 10,580 | | | | (13,072 | ) | | | (7,322 | ) |
Stock based compensation | | | 10,432 | | | | 11,627 | | | | 6,599 | |
Provisions for inventory | | | 6,437 | | | | 6,867 | | | | 15,923 | |
Impairment of intangible assets and property and equipment | | | 2,501 | | | | — | | | | 6,291 | |
(Gain) loss on disposition of property and equipment | | | (1,603 | ) | | | 721 | | | | 771 | |
Impairment of goodwill | | | — | | | | 19,509 | | | | — | |
Other | | | (1,156 | ) | | | 2,920 | | | | 721 | |
Changes in assets and liabilities: | | | | | | | | | |
Accounts receivable, net | | | (12,077 | ) | | | (4,195 | ) | | | (44,221 | ) |
Inventory | | | (34,195 | ) | | | 6,907 | | | | (40,322 | ) |
Other assets | | | (44,696 | ) | | | (26,179 | ) | | | (11,906 | ) |
Accounts payable | | | 16,222 | | | | 31,029 | | | | 28,314 | |
Other liabilities | | | 39,279 | | | | (8,160 | ) | | | (8,736 | ) |
Net cash provided by operating activities | | | 109,646 | | | | 119,265 | | | | 14,947 | |
Investing Activities: | | | | | | | | | |
Purchases of property and equipment | | | (73,314 | ) | | | (37,602 | ) | | | (39,703 | ) |
Proceeds from the sale of property and equipment | | | 7,862 | | | | 391 | | | | 248 | |
Acquisition of businesses, net of cash acquired | | | — | | | | — | | | | (205,487 | ) |
Proceeds from deferred purchase price of factored receivables | | | 12,876 | | | | 13,903 | | | | 5,538 | |
Cost of technology investments | | | (955 | ) | | | (815 | ) | | | (495 | ) |
Net cash used in investing activities | | | (53,531 | ) | | | (24,123 | ) | | | (239,899 | ) |
Financing Activities: | | | | | | | | | |
Borrowings on debt | | | 68,000 | | | | 60,000 | | | | 207,000 | |
Repayments of debt | | | (70,615 | ) | | | (72,280 | ) | | | (13,272 | ) |
Proceeds from the exercise of Common Stock options | | | 5,791 | | | | 263 | | | | 1,670 | |
Taxes withheld and paid on employees' share-based payment awards | | | (3,296 | ) | | | (2,940 | ) | | | (5,471 | ) |
Cash paid for the repurchase of Common Stock | | | (51,585 | ) | | | (91,094 | ) | | | — | |
Net cash (used in) provided by financing activities | | | (51,705 | ) | | | (106,051 | ) | | | 189,927 | |
Foreign currency effect | | | (19,949 | ) | | | 6,691 | | | | (1,690 | ) |
Net decrease in cash and cash equivalents | | | (15,539 | ) | | | (4,218 | ) | | | (36,715 | ) |
Cash and cash equivalents at beginning of period | | | 149,673 | | | | 153,891 | | | | 190,606 | |
Cash and cash equivalents at end of period | | $ | 134,134 | | | $ | 149,673 | | | $ | 153,891 | |
Supplemental disclosure of cash flow information: | | | | | | | | | |
Cash paid for taxes | | $ | 20,837 | | | $ | 23,273 | | | $ | 21,645 | |
Cash paid for interest | | | 13,007 | | | | 13,242 | | | | 6,338 | |
Non-Cash Investing Activities: | | | | | | | | | |
Period-end balance of accounts payable for property and equipment | | $ | 5,154 | | | $ | 7,754 | | | $ | 2,526 | |
Deferred purchase price of receivables factored in the period | | | 9,276 | | | | 13,885 | | | | 3,769 | |
The accompanying notes are an integral part of these consolidated financial statements
GENTHERM INCORPORATED
NOTES TO THE CONSOLIDATED FINANCIAL STATEMENTS
(In thousands, except share and per share data)
Note 1 — Overview
Gentherm Incorporated, a Michigan corporation, and its consolidated subsidiaries (“Gentherm”, “we”, “us”, “our” or the “Company”) is the global market leader of innovative thermal management and pneumatic comfort technologies for the automotive industry and a leader in medical patient temperature management. Automotive products include variable temperature Climate Control Seats, heated interior systems (including heated seats, steering wheels, armrests and other components), battery performance solutions, cable systems, lumbar and massage comfort solutions, fuel management valve systems and other valve systems, and other electronic devices. Our automotive products can be found on vehicles manufactured by nearly all the major original equipment manufacturers (“OEMs”) operating in North America and Europe, and several major OEMs in Asia. We operate in locations aligned with our major customers’ product strategies to provide locally enhanced design, integration and production capabilities. Medical products include patient temperature management systems. Our medical products can be found in hospitals throughout the world, primarily in the U.S., China, Germany and Brazil. The Company is also developing a number of new technologies and products that will help enable improvements to existing products, improve health, wellness and patient outcomes and will lead to new product applications for existing and new and adjacent markets.
Note 2 — Summary of Significant Accounting Policies
Basis of Presentation
The consolidated financial statements have been prepared in accordance with accounting principles generally accepted in the United States of America (“GAAP”).
Principles of Consolidation
The consolidated financial statements include the accounts of the Company, its wholly owned subsidiaries and those entities in which it has a controlling financial interest. The Company evaluates its relationship with other entities for consolidation and to identify whether such entities are variable interest entities (“VIE”) and to assess whether the Company is the primary beneficiary of such entities. Investments in affiliates in which Gentherm does not have control but does have the ability to exercise significant influence over operating and financial policies are accounted for under the equity method. When Gentherm does not have the ability to exercise significant influence (generally when ownership interest is less than 20%), investments in affiliates are measured at cost, less impairments, adjusted for observable price changes in orderly transactions for identical or similar investments of the same issuer.
Intercompany transactions and balances between consolidated businesses have been eliminated.
Use of Estimates
In preparing these consolidated financial statements, management was required to make estimates and assumptions that affect the reported amounts of assets, liabilities, revenues and expenses. These estimates and assumptions are based on our historical experience, the terms of existing contracts, our evaluation of trends in the industry, information provided by our customers and suppliers and information available from other outside sources, as appropriate. These estimates and assumptions are subject to an inherent degree of uncertainty. We are not presently aware of any events or circumstances that would require us to update such estimates and assumptions or revise the carrying value of our assets or liabilities. Our estimates may change, however, as new events occur and additional information is obtained. As a result, actual results may differ significantly from our estimates, and any such differences may be material to our financial statements.
Business Combinations
In accordance with ASC Topic 805, “Business Combinations,” acquisitions are recorded using the acquisition method of accounting. The Company includes the operating results of acquired entities from their respective dates of acquisition. The Company recognizes and measures the identifiable assets acquired, liabilities assumed, and any non-controlling interest as of the acquisition date
GENTHERM INCORPORATED
NOTES TO THE CONSOLIDATED FINANCIAL STATEMENTS (Continued)
(In thousands, except share and per share data)
fair value. The excess, if any, of total consideration transferred in a business combination over the fair value of identifiable assets acquired, liabilities assumed and any non-controlling interest is recognized as goodwill. Costs incurred as a result of a business combination other than costs related to the issuance of debt or equity securities are recorded in the period the costs are incurred. During the measurement period, which may be up to one year from the acquisition date, the Company may record adjustments to assets acquired and liabilities assumed with the corresponding offset to goodwill.
Revenue Recognition
Revenue is recognized from agreements containing enforceable rights and obligations, when promised goods are delivered or services are completed. Taxes assessed by a governmental authority that are both imposed on and concurrent with a specific revenue-producing transaction, that are collected by the Company from a customer, are excluded from product revenues. Shipping and handling fees billed to customers are included in product revenues, while costs of shipping and handling are included in cost of sales.
Automotive Revenues
The Company generates revenue from the production of automotive parts sold to its customers under long-term supply agreements (“LTAs”). The duration of an LTA is generally consistent with the life cycle of a vehicle; however, a LTA does not reach the level of a performance obligation until Gentherm receives either a purchase order and/or a materials release from its customer for a specific number of production parts at a specified price, at which point an enforceable contract exists. Revenue is recognized when control of the production parts has transferred to the customer according to the terms of the contract, which typically occurs at a point in time when the parts are shipped or delivered to the customer’s premises.
Revenue is measured as the amount of consideration we expect to receive in exchange for transferring production parts. Transaction price is determined based on the price and quantity of parts specified in the contract with the customer at the time of shipment, adjusted for discrete price adjustments and consideration payable to a customer. Discrete price reductions may occur to remain competitive with market prices. These price reductions are negotiated based on changes in product specifications, product content/cost or other commercial factors. Some of these amounts include estimates of variable consideration which are recorded at the most likely amount to which the Company expects to be entitled based on historical experience and input from customer negotiations.
From time to time, the Company provides cash incentives to customers in exchange for new business awards. The Company evaluates the underlying economics of each amount of consideration payable to a customer to determine the proper accounting by understanding the reasons for the payment, the rights and obligations resulting from the payment, the nature of the promises in the contract, and other relevant facts and circumstances. When the Company concludes that the payment is incurred only if the new business is obtained and the Company expects to recover the amounts from the customer over the term of the new business arrangement, the Company recognizes these payments as an asset. The Company amortizes the asset as a reduction of revenue as products related to the payment are transferred to the customer, based on the total amount of products expected to be sold over the term of the arrangement (generally 5 to 10 years following start of production). The Company evaluates the amounts capitalized each reporting period for recoverability and recognizes a reduction of revenue for any amounts that are no longer expected to be recovered over the term of the business arrangement. Payments to customers that are not capitalized are recognized as a reduction to revenue at the time of the commitment to make such payments.
As of December 31, 2024 and 2023, total capitalized payments to customers were $14,276 and $7,305, respectively.
There have been no impairment losses in relation to the costs capitalized. During the year ended December 31, 2024 and 2023, $447 and $179, respectively, was amortized into product revenues.
The Company has no material contract assets or contract liabilities as of December 31, 2024.
Medical Revenues
Revenues from our patient temperature management business unit are generated from the sale of products and equipment. Our medical products and equipment focus on patient temperature management. The Company sells medical products and equipment
GENTHERM INCORPORATED
NOTES TO THE CONSOLIDATED FINANCIAL STATEMENTS (Continued)
(In thousands, except share and per share data)
primarily through distributor and group purchasing organization agreements. These agreements allow member participants to the distributor or group purchasing organization to make purchases at discounted prices negotiated by the distributor or group purchasing organization. A rebate is incurred at the point in time a member participant purchases product covered under these types of agreements. Rebates are accounted for as variable consideration, using an expected value, probability weighted approach, based on the level of sales to the distributor and the time lag between the initial sale and the rebate claim in determining the transaction price of a contract. Revenue is recognized when control of the medical products or equipment has transferred to the customer according to the terms of the contract, which typically occurs at the point in time when the parts are either shipped or delivered to the customer’s premises.
Cash and Cash Equivalents
The Company considers all highly liquid investments purchased with original maturities of less than 90 days to be cash equivalents. The Company had cash and cash equivalents of $106,905 and $125,251 held in foreign jurisdictions as of December 31, 2024 and 2023, respectively.
Concentration of Credit Risk
The following is a summary of the percentage of product revenues and accounts receivable from the Company's customers with a percentage of net sales greater than 10 percent:
| | | | | | | | | | | | | | | | | | | | |
| | Percentage of Total Product Revenues | | | Percentage of Total Net Accounts Receivable | |
| | Year Ended December 31, | | | Year Ended December 31, | |
| | 2024 | | | 2023 | | | 2022 | | | 2024 | | | 2023 | |
Lear | | | 16 | % | | | 15 | % | | | 16 | % | | | 16 | % | | | 17 | % |
Adient | | | 11 | % | | | 13 | % | | | 15 | % | | | 11 | % | | | 19 | % |
Accounts Receivable
Accounts receivable are stated at the invoiced amount, less allowance for doubtful accounts for estimated amounts not expected to be collected, and do not bear interest.
The Company establishes and maintains allowances for the inability or unwillingness of customers to make required payments on their accounts receivable balances. These allowances reflect management's estimate of credit losses over the remaining expected life of such assets, measured primarily using historical write-off experience by industry and regional economic data, as well as current conditions and forecasts that affect the collectability of the reported amount. We write-off accounts receivable when they become uncollectible. As of December 31, 2024 and 2023, the Company’s accounts receivable are reflected net of reserves of $1,605 and $1,171, respectively. Changes in the allowance for doubtful accounts were not significant during the years ended December 31, 2024 and 2023.
In the Asia-Pacific region, the Company receives bank notes from certain customers to settle trade receivables. The collection of such bank notes is included in operating cash flows based on the substance of the underlying transactions, which are operating in nature. Bank notes held by the Company are classified as notes receivable within other current assets. The Company may hold such bank notes until maturity, exchange them with suppliers to settle liabilities, or sell them to third-party financial institutions in exchange for cash.
Inventory
The Company’s inventory is measured at the lower of cost or net realizable value. Raw materials, components and consumables are measured using the weighted average cost method. Work-in-process and finished goods are measured using the first-in first-out method. If the net realizable value expected on the reporting date is below cost, a write-down is recorded to adjust inventory to its net
GENTHERM INCORPORATED
NOTES TO THE CONSOLIDATED FINANCIAL STATEMENTS (Continued)
(In thousands, except share and per share data)
realizable value. We recognize a reserve for obsolete and slow-moving inventories based on estimates of future sales and an inventory item’s capacity to be repurposed for a different use. We consider the number of months' supply on hand based on current planned requirements, uncommitted future projections and historical usage in estimating the inventory reserve.
Property and Equipment
Property and equipment is recorded at cost less accumulated depreciation. Expenditures for general repairs and maintenance are charged to expense as incurred. When property or equipment is retired or otherwise disposed of, the related cost and accumulated depreciation are removed from the accounts. Gains or losses from retirements and disposals are recorded as operating income or expense.
Depreciation is computed using the straight-line method. The estimated useful lives of the Company’s property and equipment are as follows:
| | |
Asset Category | | Useful Life |
Buildings and improvements | | 1 to 30 years |
Plant and equipment | | 10 years |
Production tooling | | 2 to 10 years |
Leasehold improvements | | Term of lease |
Information technology | | 1 to 5 years |
The Company recognized depreciation expense of $45,503, $42,186 and $33,730 for the years ended December 31, 2024, 2023 and 2022, respectively.
Tooling
The Company incurs costs related to tooling used in the manufacture of products sold to its customers. In some cases, the Company enters into contracts with its customers whereby the Company incurs the costs to design, develop and purchase tooling and is then reimbursed by the customer under a reimbursement contract. Tooling costs that will be reimbursed by customers are included in other current assets in the accompanying consolidated balance sheets at the lower of accumulated cost or the customer reimbursable amount. As of December 31, 2024 and 2023, the Company had $19,740 and $16,877, respectively, of reimbursable tooling costs capitalized. Company-owned tooling is included in property and equipment and depreciated over its expected useful life, generally two to ten years.
Goodwill and Other Intangible Assets
Goodwill and other intangible assets recorded in conjunction with business combinations are based on the Company’s estimate of fair value, as of the date of acquisition.
Amortization of other intangible assets is computed using the straight-line method. The fair value and corresponding useful lives for acquired intangible assets are listed below as follows:
| | |
Asset Category | | Useful Life |
Customer relationships | | 8 to 15 years |
Technology | | 5 to 12 years |
Product development costs | | 5 to 10 years |
Trade names | | Indefinite |
Software development costs | | 4 to 5 years |
Our business strategy largely centers on designing products based upon internally developed and purchased technology, and we protect certain technology with patents that have value to our business strategy. All costs associated with the development and
GENTHERM INCORPORATED
NOTES TO THE CONSOLIDATED FINANCIAL STATEMENTS (Continued)
(In thousands, except share and per share data)
issuance of new patents are expensed as incurred. Such costs are classified as net research and development expenses in the accompanying consolidated statements of income.
Valuation of Long-lived Assets
The carrying value of long-lived assets held for use, including definite-lived intangible assets, is periodically evaluated when events or circumstances warrant such a review. The carrying value of a long-lived asset held for use is considered impaired when the anticipated separately identifiable undiscounted cash flows from the asset are less than the carrying value of the asset. In that event, a loss is recognized based on the amount by which the carrying value exceeds the estimated fair value of the long-lived asset. Impairment losses on long-lived assets held for sale are recognized if the carrying value of the asset is in excess of the asset’s estimated fair value, reduced for the cost to dispose of the asset.
Impairments of Other Intangible Assets and Goodwill
Goodwill is tested for impairment at least annually as of December 31 and whenever events or changes in circumstances indicate that the carrying value may not be recoverable. In conducting our annual impairment assessment testing, we first perform a qualitative assessment of whether it is more likely than not that a reporting unit’s fair value is less than its carrying amount. If not, no further goodwill impairment testing is performed. If it is more likely than not that a reporting unit’s fair value is less than its carrying amount, or if we elect not to perform a qualitative assessment of a reporting unit, we then compare the fair value of the reporting unit to the related net book value. If the net book value of a reporting unit exceeds its fair value, an impairment loss is measured and recognized.
The Company utilizes an income approach to estimate the fair value of a reporting unit and a market valuation approach to further support this analysis (level 3). The income approach is based on projected debt-free cash flow that is discounted to the present value using discount factors that consider the timing and risk of cash flows. We believe that this approach is appropriate because it provides a fair value estimate based on the reporting unit’s expected long-term operating cash flow performance. This approach also mitigates the impact of cyclical trends that occur in our industry. Fair value is estimated using internally developed forecasts, as well as commercial and discount rate assumptions. The discount rate used is the value-weighted average of our estimated cost of equity and of debt (“cost of capital”) derived using both known and estimated customary market metrics. Our weighted average cost of capital is adjusted to reflect risk, if necessary. Other significant assumptions include terminal value growth rates and terminal value margin rates. While there are inherent uncertainties related to the assumptions used and to management’s application of these assumptions to this analysis, we believe that the income approach provides a reasonable estimate of the fair value of a reporting unit.
The Company performs its indefinite-lived intangible asset impairment assessment annually as of December 31, and between annual assessments if an event occurs or circumstances change that would more likely than not reduce the fair value of a reporting unit below its carrying amount. See Note 7, "Goodwill and Other Intangibles," for additional information about the goodwill impairment analysis.
Investments in Non-consolidated Affiliates
During 2021, the Company’s Automotive segment invested $5,200 for an ownership interest in Carrar Ltd. (“Carrar”), an Israel-based technology developer of advanced thermal management systems for the electric mobility market. In June 2023, the Company made an additional investment in Carrar of $500. In December 2023, we recorded a non-cash impairment charge of $2,900 in other income (loss). In 2024 there was an increase in the fair value of the Company's investment in Carrar of $1,097 due to observable transactions, resulting in a carrying value of $3,897 as of December 31, 2024. The Company determined that Carrar is a VIE; however, the Company does not have a controlling financial interest or have the power to direct the activities that most significantly affect the economic performance of the investment. Therefore, the Company has concluded that it is not the primary beneficiary.
GENTHERM INCORPORATED
NOTES TO THE CONSOLIDATED FINANCIAL STATEMENTS (Continued)
(In thousands, except share and per share data)
Gentherm’s investment in Carrar is measured at cost, less impairments, adjusted for observable price changes in orderly transactions for identical or similar investments of the same issuer, and is recorded in other non-current assets.
During 2021, the Company’s Automotive segment invested $2,357 for an ownership interest in Forciot Oy (“Forciot”), a Finland-based technology developer of sensors for touch, motion and force measurement. Gentherm’s investment in Forciot is measured at cost, less impairments, adjusted for observable price changes in orderly transactions for identical or similar investments of the same issuer, and is recorded in other non-current assets.
In December 2021, the Company committed to make a $5,000 investment in Autotech Fund III, L.P., pursuant to a limited partnership agreement. As a limited partner, the Company will periodically make capital contributions toward this total commitment amount over the expected ten-year life of the fund. The Company has made contributions totaling approximately $1,765 to the Autotech Fund III, L.P. as of December 31, 2024. This fund focuses broadly on the automotive industry and compliments the Company’s innovation strategy.
Research and Development Expenses
Research and development activities are expensed as incurred. Such costs and related reimbursements are classified as net research and development expenses in the accompanying consolidated statements of income.
Leases
The Company determines whether a contractual arrangement is or contains a lease at contract inception. A lease liability and corresponding right-of-use asset are measured and recognized based on the present value of lease payments. To determine the present value of lease payments, the Company uses its incremental borrowing rate as of the lease commencement date, unless there is a rate implicit in the lease agreement. The incremental borrowing rate is based on the Company’s credit rating, determined on a fully collateralized loan basis from information available at commencement date, and the duration of the lease term (the “reference rate”). For leases at foreign subsidiaries denominated in U.S. Dollars, a risk premium associated with the borrower subsidiary’s country is added to the reference rate. For significant leases at foreign subsidiaries denominated in a foreign currency, the U.S. Dollar risk free rate with a duration similar to that of the lease term is subtracted from the reference rate and a corresponding foreign currency risk free rate with a duration similar to that of the lease term is added to the reference rate.
Operating lease assets are included in operating lease right-of-use assets and the related liabilities are included in current lease liabilities and non-current lease liabilities in the accompanying consolidated balance sheets. Assets under finance leases are included in property and equipment, net, and the related liabilities are included in current maturities of long-term debt, and long-term debt on the Company’s consolidated balance sheets.
For all classes of underlying assets, the Company accounts for leases that contain separate lease and non-lease components as containing a single lease component. The Company does not recognize lease right-of-use assets and lease liabilities from leases with an original lease term of 12 months or less and, instead, recognizes rent payments on a straight-line basis over the lease term in the consolidated statements of income.
Income Taxes
The Company records income tax expense using the liability method which specifies that deferred tax assets and liabilities be measured each year based on the difference between the financial statement and tax base of assets and liabilities at the applicable enacted tax rates. A valuation allowance is provided for deferred tax assets when management considers it more likely than not that the asset will not be realized. At December 31, 2024 and 2023, a valuation allowance has been provided for certain deferred tax assets which the Company has concluded are more likely than not to not be realized. If future annual taxable income were to be significantly less than current and projected levels, there is a risk that certain of our deferred tax assets not already provided for by the valuation allowance would expire prior to utilization.
GENTHERM INCORPORATED
NOTES TO THE CONSOLIDATED FINANCIAL STATEMENTS (Continued)
(In thousands, except share and per share data)
The Company recognizes the financial statement benefit of a tax position only after determining that the relevant tax authority would more likely than not sustain the position following an audit. For tax positions meeting the more-likely-than-not threshold, the amount recognized in the financial statements is the largest benefit that has a greater than 50 percent likelihood of being realized upon ultimate settlement with the relevant tax authority. The Company recognizes interest and penalties related to income tax matters in income tax expense.
Derivative Financial Instruments – Hedge Accounting
All derivative instruments are required to be reported on the balance sheet at fair value unless the transactions qualify and are designated as normal purchases or sales. Changes in fair value are reported currently through earnings unless they meet hedge accounting criteria. The Company’s designated hedging relationships are formally documented at the inception of the hedge, and hedges must be highly effective in offsetting changes to future cash flows on hedged transactions both at the inception of a hedge and on an ongoing basis to be designated for hedge accounting treatment.
The Company accounts for its designated derivative financial instruments as cash flow hedges. For derivative contracts which are designated as a cash flow hedge, the effective portion of the change in the fair value of the derivative contract is recorded to accumulated other comprehensive loss (“AOCI”) in the accompanying consolidated balance sheets. When the underlying hedge transaction is realized, the gain or loss included in AOCI is recorded into earnings in the accompanying consolidated statements of income on the same line as the gain or loss on the hedged item attributable to the hedged risk. Any ineffective portion of the gain or loss is recognized in the accompanying consolidated statements of income under cost of goods sold for foreign currency derivatives and commodity derivatives. These hedging transactions and the respective correlations meet the requirements for hedge accounting.
Exposure to fluctuations in interest rates and certain commodity prices are managed by entering into swaps with various counterparties. The Company does not enter into derivative transactions for speculative or trading purposes. As part of the hedging program approval process, Gentherm identifies the specific financial risk which the derivative transaction will minimize, the appropriate hedging instrument to be used to reduce the risk and the correlation between the financial risk and the hedging instrument. Hedge positions, as well as the correlation between the transaction risks and the hedging instruments, are reviewed on an ongoing basis.
Earnings per Share
Basic earnings per share is computed by dividing net income by the weighted average number of shares of the Company's common stock, no par value ("Common Stock") outstanding during the respective period. The Company’s diluted earnings per share give effect to all potential shares of Common Stock outstanding during a period that do not have an anti-dilutive impact to the calculation. In computing the number of diluted shares outstanding, the treasury stock method is used in order to arrive at a net number of shares created upon the conversion of Common Stock equivalents.
Stock Based Compensation
Stock based payments that involve the issuance of Common Stock to employees, including grants of employee stock options, restricted stock, and time-based and performance-based restricted stock units, are recognized in the consolidated financial statements as compensation expense based upon the fair value on the date of grant.
Stock based payments that are satisfied only by the payment of cash, such as stock appreciation rights, are accounted for as liabilities. The liability is reported at market value of the vested portion of the underlying units. During each period, the change in the liability is recorded as compensation expense.
GENTHERM INCORPORATED
NOTES TO THE CONSOLIDATED FINANCIAL STATEMENTS (Continued)
(In thousands, except share and per share data)
Note 3 — New Accounting Pronouncements
Recently Adopted Accounting Pronouncements
Segment Reporting
In November 2023, the FASB issued ASU 2023-07, "Segment Reporting (Topic 280): Improvements to Reportable Segment Disclosures". ASU 2023-07 requires a public entity to disclose, on an annual and interim basis, significant segment expenses that are included within each reported measure of segment profit or loss and regularly reviewed by the chief operating decision maker ("CODM"), the title and position of the CODM, clarification regarding the CODM's use of multiple measures of a segment's profit or loss in assessing segment performance (this must include a measure that is consistent with the measurement principles under GAAP, but may also include additional measures of a segment's profit or loss), and a description of the composition of amounts within an "Other" segment line item. Further, ASU 2023-07 requires that all annual disclosures about a reportable segment's profit or loss and assets currently required by Topic 280 to be provided in interim periods. The Company adopted ASU 2023-07 as of December 31, 2024. See Note 20, “Segment Reporting” for the disclosures related to the adoption of ASU 2023-07.
Recently Issued Accounting Pronouncements Not Yet Adopted
Income Taxes
In December 2023, the FASB issued ASU 2023-09, "Income Taxes (Topic 740): Improvements to Income Tax Disclosures". ASU 2023-09 enhances income tax disclosures to further disaggregate the effective tax rate reconciliation and income taxes paid. This update is effective for fiscal years beginning after December 15, 2024. ASU 2023-09 should be adopted prospectively, but retrospective application is permitted. Further, early adoption is permitted. We are currently in the process of determining the impact the implementation of ASU 2023-09 will have on the Company’s financial statement disclosures.
Disaggregation of Income Statement Expenses
In November 2024, the FASB issued ASU 2024-03, "Income Statement—Reporting Comprehensive Income—Expense Disaggregation Disclosures (Subtopic 220-40) ". ASU 2024-03 enhances disclosures around certain costs and expenses. This update is effective for annual reporting periods beginning after December 15, 2026, and interim periods beginning after December 15, 2027. ASU 2024-03 should be adopted retrospectively to all periods presented in the financial statements and early adoption is permitted. We are currently in the process of determining the impact the implementation of ASU 2024-03 will have on the Company’s financial statement disclosures.
Note 4 – Acquisitions
Alfmeier Präzision SE
On August 1, 2022, the Company acquired 100% of the equity interests of Alfmeier Präzision SE (“Alfmeier”), a global leader in automotive lumbar and massage comfort solutions and a leading provider of advanced valve systems technology, integrated electronics and software. The total consideration transferred was $170,700. The results of Alfmeier's operations are reported within the Automotive segment from the acquisition date.
The following table provides product revenues and operating income from Alfmeier that are included in our consolidated financial statements for the year ended December 31, 2022, following the August 1, 2022 acquisition date:
| | | | |
| | Year Ended December 31, | |
| | 2022 | |
Product revenues | | $ | 98,960 | |
Net loss | | | (2,675 | ) |
GENTHERM INCORPORATED
NOTES TO THE CONSOLIDATED FINANCIAL STATEMENTS (Continued)
(In thousands, except share and per share data)
The following unaudited pro forma information represents our product revenues and net income as if the acquisition of Alfmeier had occurred as of January 1, 2022:
| | | | |
| | Year Ended December 31, | |
| | 2022 | |
Product revenues | | $ | 1,348,295 | |
Net income | | | 17,645 | |
Jiangmen Dacheng Medical Equipment Co. Ltd
On July 13, 2022, the Company acquired 100% of the equity interests of Jiangmen Dacheng Medical Equipment Co. Ltd (“Dacheng”) and its wholly owned subsidiary, IOB Medical, Inc. Dacheng, is a manufacturer of medical materials and medical equipment, including patient temperature management solutions, for numerous local and international customers. The total consideration was $35,048. The results of Dacheng's operations are reported within the Medical segment from the acquisition date.
The following table provides product revenues and operating income from Dacheng that are included in our consolidated financial statements for the year ended December 31, 2022, following the July13, 2022 acquisition date:
| | | | |
| | Year Ended December 31, | |
| | 2022 | |
Product revenues | | $ | 3,499 | |
Net loss | | | (217 | ) |
The pro forma effects of this acquisition would not materially impact the Company’s reported results for any period presented, and as a result no pro forma financial statements are presented.
Note 5 — Restructuring
The Company continuously monitors market developments, industry trends and changing customer needs and in response, may undertake restructuring actions, as necessary, to execute management’s strategy, streamline operations and optimize the Company’s cost structure. Restructuring actions may include the realignment of existing manufacturing footprint, facility closures, or similar actions, either in the normal course of business or pursuant to significant restructuring programs.
These actions may result in employees receiving voluntary or involuntary employee termination benefits, which are mainly statutory requirements or other contractual agreements. Voluntary termination benefits are accrued when an employee accepts the related offer. Involuntary termination benefits are accrued upon the commitment to a termination plan and when the benefit arrangement is communicated to affected employees, or when liabilities are determined to be probable and estimable, depending on the existence of a substantive plan for severance or termination.
2023 Manufacturing Footprint Rationalization
On September 19, 2023, the Company committed to a restructuring plan (“2023 Plan”) to improve the Company’s manufacturing productivity and rationalize its footprint through the closure and relocation of its existing manufacturing facility in Greenville, South Carolina to a new facility in Monterrey, Mexico.
During the year ended December 31, 2024, the Company completed the sale of its Greenville, South Carolina manufacturing facility, resulting in a gain on sale of $1,927. The gain on sale was recorded as a reduction of restructuring expenses, net in the consolidated statements of income.
During the year ended December 31, 2024, the Company also recognized restructuring expense of $1,839 for employee separation costs and $2,381 for other costs.
GENTHERM INCORPORATED
NOTES TO THE CONSOLIDATED FINANCIAL STATEMENTS (Continued)
(In thousands, except share and per share data)
During the year ended December 31, 2023, the Company recognized restructuring expense of $538 for employee separation costs and $159 for other costs.
Since the inception of this program, the Company has recorded $2,990 of restructuring expenses, net, related to employee severance, retention termination costs, accelerated depreciation of fixed assets, gain on sale and other transition costs. The remaining actions under this 2023 Plan, including the consolidation of our original manufacturing site in Monterrey, Mexico into our new facility, are expected to be substantially completed by the end of 2025. The Company expects to incur less than $1,000 of additional restructuring costs for the 2023 Plan.
Other Restructuring Activities
The Company has undertaken several discrete restructuring actions in an effort to optimize its cost structure.
During the year ended December 31, 2024, the Company’s Automotive segment recognized $6,216 for employee separation costs related to structural cost reductions impacting the Company’s global salaried workforce.
During the year ended December 31, 2024, the Company’s Automotive segment recognized $1,965 for employee separation costs and $474 for other costs related to the relocation of electronic component manufacturing in Germany to a manufacturing facility in China.
During the year ended December 31, 2024, the Company recognized $876 for employee separation costs and $1,286 for other costs related to all other restructuring actions. These other restructuring actions are focused on the reduction of global overhead costs.
The Company expects to incur less than $1,000 of additional restructuring costs for the other restructuring actions that have been approved as of December 31, 2024.
During the years ended December 31, 2023 and 2022, the Company recognized $3,208 and $56 for employee separation costs, respectively, and $834 and $581 for other costs, respectively. These restructuring expenses were primarily associated with restructuring actions focused on the rotation of our manufacturing footprint to best cost locations and the reduction of global overhead costs.
Restructuring Expenses, net by Reporting Segment
Restructuring expenses, net by reporting segment for the years ended December 31, 2024, 2023 and 2022 was as follows:
| | | | | | | | | | | | |
| | Year Ended December 31, | |
| | 2024 | | | 2023 | | | 2022 | |
Automotive | | $ | 12,238 | | | $ | 3,187 | | | $ | 637 | |
Medical | | | 20 | | | | 363 | | | | — | |
Corporate | | | 852 | | | | 1,189 | | | | — | |
Total | | $ | 13,110 | | | $ | 4,739 | | | $ | 637 | |
GENTHERM INCORPORATED
NOTES TO THE CONSOLIDATED FINANCIAL STATEMENTS (Continued)
(In thousands, except share and per share data)
Restructuring Liability
The following table summarizes restructuring activity for all restructuring initiatives for the years ended December 31, 2024 and 2023:
| | | | | | | | | | | | |
| | Employee Separation Costs | | | Other Related Costs, net (a) | | | Total | |
Balance at December 31, 2022 | | $ | 588 | | | $ | — | | | $ | 588 | |
Additions, charged to restructuring expenses, net | | | 3,892 | | | | 993 | | | | 4,885 | |
Change in estimate | | | (146 | ) | | | — | | | | (146 | ) |
Cash payments | | | (2,224 | ) | | | (878 | ) | | | (3,102 | ) |
Non-cash utilization | | | — | | | | (115 | ) | | | (115 | ) |
Currency translation and other | | | 40 | | | | — | | | | 40 | |
Balance at December 31, 2023 | | $ | 2,150 | | | $ | — | | | $ | 2,150 | |
Additions, charged to restructuring expenses, net | | | 10,896 | | | | 2,214 | | | | 13,110 | |
Cash payments | | | (9,593 | ) | | | (1,333 | ) | | | (10,926 | ) |
Non-cash utilization | | | — | | | | (881 | ) | | | (881 | ) |
Currency translation and other | | | (165 | ) | | | — | | | | (165 | ) |
Balance at December 31, 2024 | | $ | 3,288 | | | $ | — | | | $ | 3,288 | |
(a)Includes gain on sale of the Greenville facility
Exit of Non-Automotive Electronics Business
On December 31, 2022, the Company approved a plan to exit its non-automotive electronics business to strengthen the Company’s core business and focus its resources and equipment with businesses and investments that are more strategic and profitable. The Company has substantially completed the exit of this business.
During the year ended December 31, 2024, the Company recorded a benefit of $4,554 for the sale of previously reserved inventory. This benefit is recorded in product revenues in the accompanying consolidated statements of income.
During the year ended December 31, 2023, the Company recorded non-cash impairment charges of $6,064 for the write down of inventory. This charge is recorded in cost of sales in the accompanying consolidated statements of income.
During the year ended December 31, 2022, the Company recorded non-cash impairment charges of $9,378, $5,601 and $690 for write downs of inventory, intangible assets and property and equipment, respectively. Write downs of inventory are recorded in cost of sales and write downs of intangible assets and property and equipment are recorded in impairment of intangible assets and property and equipment in the accompanying consolidated statements of income.
Subsequent Events
In February 2025, the Company committed to additional restructuring plans intended to further optimize its manufacturing footprint by realigning its manufacturing capacity. As a result of these plans, the Company will close its facility in Plzeň, Czech Republic and relocate the manufacturing activities into other existing facilities within the region. Additionally, in Asia, we will relocate certain manufacturing activities from our facility in Shanghai, China to our new facility in Tianjin, China.
In connection with these plans, the Company expects to incur total costs of between $13,000 and $21,000. The total expected costs include employee severance, retention and termination costs of between $7,000 and $11,000 and capital expenditures of between $3,000 and $5,000. The Company also expects to incur other transition costs including recruiting, relocation, and machinery and equipment move and set up costs of between $3,000 and $5,000.
GENTHERM INCORPORATED
NOTES TO THE CONSOLIDATED FINANCIAL STATEMENTS (Continued)
(In thousands, except share and per share data)
Note 6 — Details of Certain Financial Statement Components
| | | | | | | | |
| | December 31, | |
| | 2024 | | | 2023 | |
Inventory: | | | | | | |
Raw materials, net | | $ | 137,511 | | | $ | 126,013 | |
Work in process, net | | | 19,059 | | | | 15,704 | |
Finished goods, net | | | 70,786 | | | | 64,175 | |
Total inventory, net | | $ | 227,356 | | | $ | 205,892 | |
Other current assets: | | | | | | |
Income tax and other tax receivable | | $ | 20,611 | | | $ | 16,017 | |
Billable tooling | | | 19,740 | | | | 16,877 | |
Notes receivable | | | 11,190 | | | | 18,226 | |
Prepaid expenses | | | 6,305 | | | | 7,889 | |
Receivables due from factor | | | 1,111 | | | | 4,422 | |
Short-term derivative financial instruments | | | 719 | | | | 10,717 | |
Other | | | 4,737 | | | | 4,272 | |
Total other current assets | | $ | 64,413 | | | $ | 78,420 | |
Property and equipment: | | | | | | |
Machinery and equipment | | $ | 260,578 | | | $ | 236,277 | |
Buildings and improvements | | | 117,953 | | | | 130,374 | |
Information technology | | | 45,157 | | | | 41,543 | |
Production tooling | | | 37,765 | | | | 28,033 | |
Leasehold improvements | | | 23,262 | | | | 12,269 | |
Construction in progress | | | 36,846 | | | | 27,461 | |
Total property and equipment | | | 521,561 | | | | 475,957 | |
Less: accumulated depreciation | | | (268,591 | ) | | | (230,723 | ) |
Total property and equipment, net | | $ | 252,970 | | | $ | 245,234 | |
Other current liabilities: | | | | | | |
Accrued employee liabilities | | $ | 42,277 | | | $ | 43,176 | |
Income tax and other taxes payable | | | 26,385 | | | | 19,327 | |
Liabilities from discounts and rebates | | | 20,501 | | | | 22,916 | |
Restructuring | | | 3,288 | | | | 2,150 | |
Accrued warranty | | | 3,507 | | | | 3,945 | |
Short-term derivative financial instruments | | | 2,037 | | | | — | |
Other | | | 7,829 | | | | 9,291 | |
Total other current liabilities | | $ | 105,824 | | | $ | 100,805 | |
GENTHERM INCORPORATED
NOTES TO THE CONSOLIDATED FINANCIAL STATEMENTS (Continued)
(In thousands, except share and per share data)
Note 7 — Goodwill and Other Intangibles
Goodwill
Changes in the carrying amount of goodwill, by reportable segment, for the years ended December 31, 2024 and 2023 were as follows:
| | | | | | | | | | | | |
| | Automotive | | | Medical | | | Total | |
Balance as of December 31, 2022 | | $ | 73,069 | | | $ | 46,705 | | | $ | 119,774 | |
Impairment of goodwill | | | — | | | | (19,509 | ) | | | (19,509 | ) |
Currency translation and other | | | 3,627 | | | | 181 | | | | 3,808 | |
Balance as of December 31, 2023 | | $ | 76,696 | | | $ | 27,377 | | | $ | 104,073 | |
Currency translation and other | | | (3,942 | ) | | | (528 | ) | | | (4,470 | ) |
Balance as of December 31, 2024 | | $ | 72,754 | | | $ | 26,849 | | | $ | 99,603 | |
Other Intangible Assets
Other intangible assets and accumulated amortization balances as of December 31, 2024 and 2023 were as follows:
| | | | | | | | | | | | | | | | |
| | Gross
Carrying Value | | | Accumulated
Amortization | | | Accumulated
Impairment | | | Net Carrying
Value | |
Definite-lived: | | | | | | | | | | | | |
Customer relationships | | $ | 109,608 | | | $ | (67,787 | ) | | $ | (5,477 | ) | | $ | 36,344 | |
Technology | | | 43,458 | | | | (29,976 | ) | | | (24 | ) | | | 13,458 | |
Product development costs | | | 18,019 | | | | (17,849 | ) | | | — | | | | 170 | |
Software development | | | 1,007 | | | | (201 | ) | | | — | | | | 806 | |
Indefinite-lived: | | | | | | | | | | | | |
Tradenames | | | 7,003 | | | | — | | | | (530 | ) | | | 6,473 | |
Balance as of December 31, 2024 | | $ | 179,095 | | | $ | (115,813 | ) | | $ | (6,031 | ) | | $ | 57,251 | |
| | | | | | | | | | | | |
| | Gross
Carrying Value | | | Accumulated
Amortization | | | Accumulated
Impairment | | | Net Carrying
Value | |
Definite-lived: | | | | | | | | | | | | |
Customer relationships | | $ | 115,465 | | | $ | (67,923 | ) | | $ | (5,814 | ) | | $ | 41,728 | |
Technology | | | 45,861 | | | | (29,292 | ) | | | (25 | ) | | | 16,544 | |
Product development costs | | | 19,434 | | | | (19,270 | ) | | | — | | | | 164 | |
Software development | | | 1,007 | | | | — | | | | — | | | | 1,007 | |
Indefinite-lived: | | | | | | | | | | | | |
Tradenames | | | 7,039 | | | | — | | | | — | | | | 7,039 | |
Balance as of December 31, 2023 | | $ | 188,806 | | | $ | (116,485 | ) | | $ | (5,839 | ) | | $ | 66,482 | |
During the first quarter of 2024, we recorded a non-cash impairment charge of $530 for one of our Medical tradenames.
As of December 31, 2022, the estimated fair value of the Medical reporting unit exceeded its carrying value by less than 10%. During the second quarter of 2023, the Company’s Medical reporting unit did not perform in-line with forecasted results primarily driven by slower than anticipated revenue growth. As a result, an indicator of impairment was identified and the Company performed an interim quantitative assessment as of June 30, 2023. The results of this quantitative analysis indicated the carrying value of the reporting unit exceeded the fair value of the reporting unit, and accordingly an impairment expense was recorded for $19,509. The Company performed its annual assessment of the Medical reporting unit goodwill as of December 31, 2024 and 2023 utilizing quantitative approaches and determined the fair value of the Medical reporting unit exceeded its carrying value at each date.
GENTHERM INCORPORATED
NOTES TO THE CONSOLIDATED FINANCIAL STATEMENTS (Continued)
(In thousands, except share and per share data)
The Company utilized an income approach to estimate the fair value of the reporting unit and a market valuation approach to further support this analysis (level 3). The income approach was based on projected debt-free cash flow that was discounted to the present value using discount factors that considered the timing and risk of cash flows. Fair value was estimated using internally developed forecasts, as well as commercial and discount rate assumptions. The discount rate used was the value-weighted average of our estimated cost of equity and of debt (“cost of capital”) derived using both known and estimated customary market metrics. Our weighted average cost of capital includes a company specific risk premium to address the risks associated with achieving the projected revenue and profitability growth rates. Other significant assumptions included terminal value growth rates and terminal value margin rates. Our ability to realize the future cash flows used in our calculations is affected by factors such as the success of strategic initiatives, changes in economic conditions, changes in our operating performance and changes in our business strategies. To further support the fair value estimate determined by the income approach, the Company utilized a market valuation approach to estimate the fair value of the Medical reporting unit. The market approach considered historical and anticipated financial metrics of the Medical reporting unit and applied valuation multiples based on recent observed transactions involving companies similar enough to the Medical reporting unit from which to draw meaningful conclusions.
In addition to annual impairment testing, which is performed in the fourth quarter of each fiscal year, the Company continuously monitors for events and circumstances that could negatively impact the key assumptions used in determining fair value and therefore would require interim impairment testing, including long-term revenue growth projections, profitability, discount rates, recent market valuations from transactions by comparable companies, volatility in the Company's market capitalization, and general industry, market and macroeconomic conditions. We are not presently aware of any other events or circumstances that would require us to revise the carrying value of our goodwill or other intangible assets as of December 31, 2024.
A total of $7,019, $8,290, and $9,018 in other intangible assets were amortized in 2024, 2023 and 2022, respectively.
An estimate of future amortization of other intangible assets, is as follows:
| | | | |
2025 | | $ | 6,860 | |
2026 | | | 6,424 | |
2027 | | | 6,337 | |
2028 | | | 6,276 | |
2029 | | | 5,598 | |
Note 8 — Leases
The Company has operating and finance leases for real estate, office equipment, automobiles, forklifts and certain other equipment. Certain real estate leases are for land which have a remaining lease term of one to 38 years, and some of these arrangements have an end date that is at the discretion of the lessee. Excluding land leases, our leases have remaining lease terms ranging from less than one year to nine years and may include options to extend the lease. We do not have lease arrangements with related parties.
Components of lease expense for the years ended December 31, 2024, 2023 and 2022 were as follows:
| | | | | | | | | | | | |
| | Year Ended December 31, | |
| | 2024 | | | 2023 | | | 2022 | |
Lease cost: | | | | | | | | | |
Operating lease cost | | $ | 10,747 | | | $ | 9,606 | | | $ | 8,040 | |
Amortization of ROU assets - finance leases | | | 370 | | | | 390 | | | | 168 | |
Interest on lease liabilities - finance leases | | | 14 | | | | 28 | | | | 16 | |
Short-term lease cost | | | 3,684 | | | | 2,651 | | | | 1,773 | |
Sublease income | | | — | | | | — | | | | (101 | ) |
Total lease cost | | $ | 14,815 | | | $ | 12,675 | | | $ | 9,896 | |
GENTHERM INCORPORATED
NOTES TO THE CONSOLIDATED FINANCIAL STATEMENTS (Continued)
(In thousands, except share and per share data)
Other information related to leases is as follows:
| | | | | | | | |
| | Year Ended December 31, | |
| | 2024 | | | 2023 | |
Cash paid for amounts included in the measurement of lease liabilities: | | | | | | |
Operating cash flows for operating leases | | $ | 10,428 | | | $ | 9,249 | |
Operating cash flows for finance leases | | | 14 | | | | 81 | |
Financing cash flows for finance leases | | | 383 | | | | 390 | |
Right-of-use lease assets obtained in exchange for lease obligations: | | | | | | |
Operating leases | | $ | 30,720 | | | $ | 4,704 | |
| | | | | | |
| | December 31, 2024 | | | December 31, 2023 | |
Weighted average remaining lease term: | | | | | | |
Operating leases | | 9.3 years | | | 5.6 years | |
Finance leases | | 1.5 years | | | 1.9 years | |
Weighted average discount rate: | | | | | | |
Operating leases | | | 6.09 | % | | | 4.96 | % |
Finance leases | | | 3.46 | % | | | 3.53 | % |
A summary of operating leases as of December 31, 2024, under all non-cancellable operating leases with terms exceeding one year is as follows:
| | | | |
2025 | | $ | 9,285 | |
2026 | | | 7,450 | |
2027 | | | 5,701 | |
2028 | | | 5,208 | |
2029 | | | 4,911 | |
2030 or later | | | 26,593 | |
Total future minimum lease payments | | | 59,148 | |
Less imputed interest | | | (14,579 | ) |
Total | | $ | 44,569 | |
A summary of finance leases as of December 31, 2024, under all non-cancellable finance leases with terms exceeding one year is as follows:
| | | | |
2025 | | $ | 137 | |
2026 | | | 64 | |
Total | | $ | 201 | |
As of December 31, 2024 the Company has various operating leases that have not yet commenced with future undiscounted payments of $19,878. These operating leases will commence in 2025 and have initial lease terms of two to 15 years. The most significant of these leases relates to the Company's new corporate headquarters building in Novi, Michigan. In connection with our move to a new location, we completed the sale of our former headquarters building in Northville, Michigan in January 2025. The sale resulted in cash proceeds of $3,740 and is expected to result in a loss on sale of $2,311 that will be recognized in the first quarter of 2025.
GENTHERM INCORPORATED
NOTES TO THE CONSOLIDATED FINANCIAL STATEMENTS (Continued)
(In thousands, except share and per share data)
Note 9 — Debt
The following table summarizes the Company’s debt as of December 31, 2024 and 2023:
| | | | | | | | | | | | | | | | |
| | December 31, | |
| | 2024 | | | 2023 | |
| | Interest
Rate | | | Principal
Balance | | | Interest
Rate | | | Principal
Balance | |
Credit Agreement: | | | | | | | | | | | | |
U.S. Revolving Note (U.S. Dollar denominations) | | | 5.86 | % | | $ | 220,000 | | | | 6.58 | % | | $ | 222,000 | |
Other loans | | | — | | | | — | | | | 3.90 | % | | | 233 | |
Finance leases | | | 3.46 | % | | | 201 | | | | 3.53 | % | | | 605 | |
Total debt | | | | | | 220,201 | | | | | | | 222,838 | |
Current maturities | | | | | | (137 | ) | | | | | | (621 | ) |
Long-term debt, less current maturities | | | | | $ | 220,064 | | | | | | $ | 222,217 | |
Credit Agreement
On June 10, 2022, the Company entered into a Second Amended and Restated Credit Agreement (the “Second Amended and Restated Credit Agreement”) with a consortium of lenders and Bank of America, N.A. as administrative agent (the “Agent”). The Second Amended and Restated Credit Agreement amended and restated in its entirety the Amended and Restated Credit Agreement dated June 27, 2019, by and among Gentherm, certain of its direct and indirect subsidiaries, the lenders party thereto and the Agent.
The Second Amended and Restated Credit Agreement provides for a $500,000 secured revolving credit facility (the “Revolving Credit Facility”) (a $25,000 increase from the revolving credit facility under the Amended and Restated Credit Agreement), with a $50,000 sublimit for swing line loans and a $15,000 sublimit for the issuance of standby letters of credit. Any amount of the facility utilized for swing line loans or letters of credit outstanding will reduce the amount available under the Second Amended and Restated Credit Agreement. The Company had $2,838 of outstanding letters of credit issued as of December 31, 2024 and no outstanding letters of credit issued as of December 31, 2023.
Subject to specified conditions, Gentherm can increase the Revolving Credit Facility or incur secured term loans in an aggregate amount of up to $200,000. The Second Amended and Restated Credit Agreement extended the maturity of the Revolving Credit Facility from June 27, 2024 to June 10, 2027.
The U.S. borrowers and guarantors participating in the Second Amended and Restated Credit Agreement also entered into a Second Amended and Restated Pledge and Security Agreement (the “Second Amended and Restated Security Agreement”). The Second Amended and Restated Security Agreement grants a security interest to the Agent in substantially all of the personal property of the Company and its U.S. subsidiaries designated as borrowers to secure their respective obligations under the Second Amended and Restated Security Agreement, including the stock and membership interests of specified subsidiaries (limited to 66% of the stock in the case of certain non-U.S. subsidiaries). In addition to the security obligations, all obligations under the Second Amended and Restated Credit Agreement (including all obligations of any U.S. or non-U.S. loan party) are unconditionally guaranteed by certain of Gentherm’s domestic subsidiaries, and the German subsidiary borrowers and certain other foreign subsidiaries guarantee all obligations of the non-U.S. loan parties under the Second Amended and Restated Credit Agreement. The Second Amended and Restated Credit Agreement restricts, among other things, the amount of dividend payments the Company can make to shareholders.
The Second Amended and Restated Credit Agreement contains covenants, that, among other things, (i) prohibit or limit the ability of the borrowers and any material subsidiary to incur additional indebtedness, create liens, pay dividends, make certain types of investments (including acquisitions), enter into certain types of transactions with affiliates, prepay other indebtedness, sell assets or enter into certain other transactions outside the ordinary course of business, and (ii) require that Gentherm maintain a minimum Consolidated Interest Coverage Ratio and a maximum Consolidated Net Leverage Ratio (based on consolidated EBITDA for the applicable trailing four fiscal quarters) as of the end of any fiscal quarter. The Second Amended and Restated Credit Agreement also contains customary events of default. As of December 31, 2024, the Company was in compliance with the terms of the Second
GENTHERM INCORPORATED
NOTES TO THE CONSOLIDATED FINANCIAL STATEMENTS (Continued)
(In thousands, except share and per share data)
Amended and Restated Credit Agreement. The Second Amended and Restated Credit Agreement additionally contains customary events of default. Upon the occurrence of an event of default, the amounts outstanding under the Revolving Credit Facility may be accelerated and may become immediately due and payable.
Under the Second Amended and Restated Credit Agreement, U.S. Dollar denominated loans bear interest at either a base rate (“Base Rate Loans”) or Term SOFR rate (“Term SOFR Rate Loans”), plus a margin (“Applicable Rate”). The rate for Base Rate Loans is equal to the highest of the Federal Funds Rate plus 0.50%, Bank of America’s prime rate, or the Term SOFR rate plus 1.00%. The rate for Term SOFR Rate Loans denominated in U.S. Dollars is equal to the forward-looking Secured Overnight Financing Rate (“SOFR”) term rate administered by the CME with a term of one month. All loans denominated in a currency other than the U.S. Dollar must be Term SOFR Rate Loans. Interest is payable at least quarterly. Additionally, a commitment fee of between 0.175% to 0.300%, which will vary based on the Consolidated Net Leverage Ratio, as defined in the Second Amended and Restated Credit Agreement, is payable on the average daily unused amounts under the Revolving Credit Facility.
The Applicable Rate varies based on the Consolidated Net Leverage Ratio reported by the Company. As long as the Company is not in default of the terms and conditions of the Second Amended and Restated Credit Agreement, the lowest and highest possible Applicable Rate is 1.125% and 2.125%, respectively, for Term SOFR Rate Loans and 0.125% and 1.125%, respectively, for Base Rate Loans.
Borrowing availability is subject to, among other things, the Company’s compliance with the minimum Consolidated Interest Coverage Ratio and the maximum Consolidated Net Leverage Ratio as of the end of any fiscal quarter. Based upon consolidated EBITDA for the trailing four fiscal quarters calculated for purposes of the Consolidated Net Leverage Ratio, $280,000 remained available as of December 31, 2024 for additional borrowings under the Second Amended and Restated Credit Agreement subject to specified conditions that Gentherm currently satisfies.
In connection with the Second Amended and Restated Credit Agreement, the Company incurred debt issuance costs of $1,520, which have been capitalized and are amortized into interest expense over the term of the Revolving Credit Facility. In addition, unamortized deferred debt issuance costs of $144 were written off and recognized in interest expense, net during the twelve months ended December 31, 2022.
The scheduled principal maturities of our debt as of December 31, 2024 were as follows:
| | | | | | | | | | | | |
| | U.S.
Revolving
Note | | | Other Debt | | | Total | |
2025 | | $ | — | | | $ | 137 | | | $ | 137 | |
2026 | | | — | | | | 64 | | | | 64 | |
2027 | | | 220,000 | | | | — | | | | 220,000 | |
2028 | | | — | | | | — | | | | — | |
2029 | | | — | | | | — | | | | — | |
Total | | $ | 220,000 | | | $ | 201 | | | $ | 220,201 | |
Note 10 — Pension and Other Post Retirement Benefit Plans
The Company maintains a U.S. defined benefit pension plan covering a former Company executive (“U.S. Plan”) and a German defined benefit pension plan covering certain retired executive employees of the Company’s wholly owned subsidiary, Gentherm GmbH (“German Plan”).
GENTHERM INCORPORATED
NOTES TO THE CONSOLIDATED FINANCIAL STATEMENTS (Continued)
(In thousands, except share and per share data)
The components of net periodic benefit cost for the Company’s defined benefit plans for the years ended December 31, 2024, 2023 and 2022 were as follows:
| | | | | | | | | | | | | | | | | | | | | | | | |
| | U.S. Plan | | | German Plan | |
| | Year Ended December 31, | | | Year Ended December 31, | |
| | 2024 | | | 2023 | | | 2022 | | | 2024 | | | 2023 | | | 2022 | |
Net periodic benefit cost: | | | | | | | | | | | | | | | | | | |
Service cost | | $ | — | | | $ | — | | | $ | — | | | $ | — | | | $ | — | | | $ | — | |
Interest cost | | | 101 | | | | 115 | | | | 56 | | | | 234 | | | | 217 | | | | 92 | |
Expected return on plan assets | | | — | | | | — | | | | — | | | | (130 | ) | | | (115 | ) | | | (109 | ) |
Amortization of prior service cost and actuarial loss | | | — | | | | — | | | | 22 | | | | 19 | | | | 23 | | | | 114 | |
Net periodic benefit cost | | $ | 101 | | | $ | 115 | | | $ | 78 | | | $ | 123 | | | $ | 125 | | | $ | 97 | |
Assumptions: | | | | | | | | | | | | | | | | | | |
Discount rate | | | 4.45 | % | | | 4.65 | % | | | 1.80 | % | | | 4.56 | % | | | 4.10 | % | | | 1.08 | % |
Long-term return on assets | | N/A | | | N/A | | | N/A | | | | 3.20 | % | | | 3.20 | % | | | 2.90 | % |
A reconciliation of the change in benefit obligation and the change in plan assets for the years ended December 31, 2024 and 2023 is as follows:
| | | | | | | | | | | | | | | | |
| | U.S. Plan | | | German Plan | |
| | As of December 31, | | | As of December 31, | |
| | 2024 | | | 2023 | | | 2024 | | | 2023 | |
Change in projected benefit obligation: | | | | | | | | | | | | |
Balance at beginning of year | | $ | 2,602 | | | $ | 2,811 | | | $ | 5,406 | | | $ | 5,398 | |
Interest cost | | | 101 | | | | 115 | | | | 234 | | | | 217 | |
Paid pension distributions | | | (342 | ) | | | (342 | ) | | | (256 | ) | | | (290 | ) |
Actuarial (gain) loss | | | (30 | ) | | | 18 | | | | 1,259 | | | | (89 | ) |
Exchange rate impact | | | — | | | | — | | | | (362 | ) | | | 170 | |
Balance at end of year | | $ | 2,331 | | | $ | 2,602 | | | $ | 6,281 | | | $ | 5,406 | |
Change in plan assets: | | | | | | | | | | | | |
Balance at beginning of year | | $ | — | | | $ | — | | | $ | 4,145 | | | $ | 3,918 | |
Actual return on plan assets | | | — | | | | — | | | | 104 | | | | 98 | |
Contributions | | | — | | | | — | | | | — | | | | — | |
Paid pension distributions | | | — | | | | — | | | | — | | | | — | |
Exchange rate impact | | | — | | | | — | | | | (244 | ) | | | 129 | |
Balance at end of year | | $ | — | | | $ | — | | | $ | 4,005 | | | $ | 4,145 | |
| | | | | | | | | | | | |
Underfunded Status | | $ | (2,331 | ) | | $ | (2,602 | ) | | $ | (2,276 | ) | | $ | (1,261 | ) |
| | | | | | | | | | | | |
Balance sheet classification: | | | | | | | | | | | | |
Other current liabilities | | $ | (342 | ) | | $ | (357 | ) | | $ | (248 | ) | | $ | (297 | ) |
Pension benefit obligation | | | (1,989 | ) | | | (2,245 | ) | | | (2,028 | ) | | | (964 | ) |
Accumulated other comprehensive loss (pre-tax): | | | | | | | | | | | | |
Actuarial losses | | | 194 | | | | 223 | | | | 2,063 | | | | 899 | |
| | | | | | | | | | | | |
Assumptions: | | | | | | | | | | | | |
Discount rate | | | 4.85 | % | | | 4.45 | % | | | 3.38 | % | | | 4.56 | % |
Pre-tax amounts included in AOCI that are expected to be recognized in net periodic benefit cost during the year ended December 31, 2025 are as follows:
| | | | | | | | |
| | U.S Plan | | | German Plan | |
Actuarial losses | | $ | — | | | $ | 71 | |
GENTHERM INCORPORATED
NOTES TO THE CONSOLIDATED FINANCIAL STATEMENTS (Continued)
(In thousands, except share and per share data)
The accumulated benefit obligations were as follows:
| | | | | | | | | | | | | | | | |
| | U.S. Plan | | | German Plan | |
| | As of December 31, | | | As of December 31, | |
| | 2024 | | | 2023 | | | 2024 | | | 2023 | |
Accumulated benefit obligation | | $ | 2,331 | | | $ | 2,602 | | | $ | 6,281 | | | $ | 5,406 | |
Interest costs are recognized in selling, general and administrative expenses in the consolidated statements of income and actuarial gains and losses are included the consolidated balance sheets as part of accumulated other comprehensive loss within shareholders’ equity. Actuarial gains or losses are amortized to selling, general and administrative expense in the consolidated statements of income based on the average future life of the U.S Plan or German Plan using the corridor method. Prior service cost is included in selling, general and administrative expenses in the consolidated statements of income.
Plan assets – German Plan
Plan assets are comprised of Gentherm GmbH’s pension insurance policies and are pledged to the beneficiaries of the German Plan. A market valuation technique, based on observable underlying insurance charges, is used to determine the fair value of the pension plan assets (Level 2).
The expected return on plan assets assumption used to calculate Gentherm GmbH’s pension benefit obligation was determined using actual returns realized on plan assets in the prior year.
Contributions
We do not expect contributions to be paid to the U.S. Plan or the German Plan during the next fiscal year.
The schedule of future expected pension payments is as follows:
| | | | | | | | |
| | Projected Pension
Benefit Payments | |
Year | | U.S Plan | | | German Plan | |
2025 | | $ | 342 | | | $ | 248 | |
2026 | | | 342 | | | | 249 | |
2027 | | | 342 | | | | 249 | |
2028 | | | 342 | | | | 247 | |
2029 | | | 342 | | | | 1,628 | |
2030-2033 | | | 1,026 | | | | 1,565 | |
Total | | $ | 2,736 | | | $ | 4,186 | |
Defined Contribution Plans
The Company also sponsors defined contribution plans for eligible employees. On a discretionary basis, the Company matches a portion of the employee contributions and or makes additional discretionary contributions. Gentherm recognized costs of $2,264, $2,344 and $1,984 related to contributions to its defined contribution plans during the years ended December 31, 2024, 2023 and 2022, respectively.
Note 11 — Commitments and Contingencies
Legal and Other Contingencies
The Company is subject to various legal actions and claims in the ordinary course of its business, which may include those arising out of breach of contracts, intellectual property rights, environmental matters, regulatory matters and employment-related matters. The Company establishes accruals for matters which it believes that losses are probable and can be reasonably estimated.
GENTHERM INCORPORATED
NOTES TO THE CONSOLIDATED FINANCIAL STATEMENTS (Continued)
(In thousands, except share and per share data)
Although it is not possible to predict with certainty the outcome of these matters, the Company is of the opinion that the ultimate resolution of these matters outstanding as of December 31, 2024 will not have a material adverse effect on its results of operations or financial position. Product liability and warranty reserves are recorded separately from legal reserves.
Product Liability and Warranty Matters
Our products subject us to warranty claims and, from time to time, product liability claims based on the Company’s products alleged failure to perform as expected or resulting in alleged bodily injury or property damage. If any of our products are or are alleged to be defective, we may be required to participate in a recall or other corrective action involving such products. The Company maintains warranty and product liability insurance coverage at levels based on commercial norms and historical claims experience. The Company can provide no assurances that it will not experience material warranty or product liability claims or liabilities in the future or that it will not incur significant costs to defend such claims.
The Company accrues warranty obligations for products sold based on management estimates of future failure rates and current claim cost experience, with support from the sales, engineering, quality and legal functions. Using historical information available to the Company, including any claims filed by customers, the warranty accrual is adjusted quarterly to reflect management’s estimate of future claims.
On February 14, 2024, the National Highway Traffic Safety Administration announced that Volkswagen Group of America, Inc. (“VW”) is recalling 261,257 vehicles from model years 2015-2020 to remedy an alleged problem with a suction jet pump seal inside the fuel tank system. VW informed Gentherm of its plan to conduct the recall on April 3, 2024. The suction jet pump is a product originally designed and manufactured by Alfmeier, the business Gentherm acquired in August 2022. The Company has not accepted any financial responsibility for the recall and intends to provide replacement parts for the recall at commercial pricing paid by VW. The Company is pursuing discussions with VW to advance its position and resolve this matter. No litigation has been threatened or filed as of the date of this report. If the Company is obligated to indemnify VW for the direct and indirect costs associated with the recall, such costs could be material. The Company has insurance policies that generally include coverage of the costs of a recall, subject to insured limits, although the Company’s costs related to manufacturing of replacement parts are generally not covered. In addition, the Company’s purchase agreement of Alfmeier includes indemnification provisions under which the Company believes it would have a claim against the sellers. Given the uncertainty that exists concerning the resolution of this matter, as of the date of this report, the Company cannot reasonably estimate the amount and timing of possible costs that may be incurred by the Company.
The following is a reconciliation of the changes in accrued warranty costs:
| | | | | | | | |
| | Year Ended December 31, | |
| | 2024 | | | 2023 | |
Balance at beginning of year | | $ | 3,945 | | | $ | 2,380 | |
Warranty claims paid | | | (6,382 | ) | | | (2,252 | ) |
Warranty expense for products shipped during the current period | | | 5,812 | | | | 3,955 | |
Adjustments to warranty estimates from prior periods | | | 247 | | | | (174 | ) |
Adjustments due to currency translation | | | (115 | ) | | | 36 | |
Balance at end of year | | $ | 3,507 | | | $ | 3,945 | |
Employees
Approximately 35% of the Company’s workforce are members of industrial trade unions or worker councils and are employed under the terms of various labor agreements. In 2025, certain agreements will require a vote on the terms of their respective labor contracts.
GENTHERM INCORPORATED
NOTES TO THE CONSOLIDATED FINANCIAL STATEMENTS (Continued)
(In thousands, except share and per share data)
Note 12 — Supplier Finance Program
Beginning in 2024, the Company became party to a supplier finance program with a third-party service provider (“Service Provider”), pursuant to which the Company has offered the opportunity to participate to certain of the Company's suppliers. The Company has no economic interest in a supplier’s participation and the Company has not pledged any assets to the Service Provider under this program.
Under this program, the Company and supplier initially agree on the contractual payment terms for the goods to be procured for the Company in the ordinary course. A supplier’s participation in this program is voluntary and does not impact its contractual payment terms with the Company, including the payment amount and timing of when payments are due. A participating supplier has the sole discretion to determine whether to discount one or more invoices, if any, to the Service Provider in exchange for payment by the Service Provider on an earlier date than provided for in the contract with the Company. Amounts due to participating suppliers are included in accounts payable in the consolidated balance sheets until the Company makes payment to the Service Provider, even though the payment of such amount will be made to the supplier at an earlier date by the Service Provider. As of December 31, 2024, the Company had outstanding payment obligations to participating suppliers of $21,232 confirmed under the program. Payments of the Company’s obligations to the Service Provider are reported as operating cash flows in the consolidated statements of cash flows.
The following is a reconciliation of the changes in confirmed obligations to participating suppliers:
| | | | |
| | Year Ended December 31, | |
| | 2024 | |
Outstanding at beginning of year | | $ | — | |
Invoices confirmed | | | 90,343 | |
Invoices settled | | | (69,111 | ) |
Outstanding at end of year | | $ | 21,232 | |
Note 13 — Earnings Per Share
Basic earnings per share are computed by dividing net income by the weighted average number of shares of Common Stock outstanding during the period. The Company’s diluted earnings per share give effect to all potential shares of Common Stock outstanding during a period that do not have an anti-dilutive impact to the calculation. In computing the diluted earnings per share, the treasury stock method is used in determining the number of shares assumed to be issued from the exercise of Common Stock equivalents.
The following table illustrates earnings per share and the weighted average shares outstanding used in calculating basic and diluted earnings per share:
| | | | | | | | | | | | |
| | Year Ended December 31, | |
| | 2024 | | | 2023 | | | 2022 | |
Net income | | $ | 64,947 | | | $ | 40,343 | | | $ | 24,441 | |
| | | | | | | | | |
Basic weighted average shares of Common Stock outstanding | | | 31,293,113 | | | | 32,778,055 | | | | 33,126,202 | |
Dilutive effect of stock options, restricted stock awards and restricted stock units | | | 183,373 | | | | 288,862 | | | | 376,952 | |
Diluted weighted average shares of Common Stock outstanding | | | 31,476,486 | | | | 33,066,917 | | | | 33,503,154 | |
| | | | | | | | | |
Basic earnings per share | | $ | 2.08 | | | $ | 1.23 | | | $ | 0.74 | |
Diluted earnings per share | | $ | 2.06 | | | $ | 1.22 | | | $ | 0.73 | |
GENTHERM INCORPORATED
NOTES TO THE CONSOLIDATED FINANCIAL STATEMENTS (Continued)
(In thousands, except share and per share data)
See Note 18, "Accounting for Stock Based Compensation," for information about the Company’s different equity incentive plans.
Note 14 —Financial Instruments
Derivative Financial Instruments
The Company is exposed to various market risks including, but not limited to, changes in foreign currency exchange rates, changes in interest rates and price fluctuations of certain material commodities such as copper. Market risks for changes in interest rates relate primarily to its debt obligations under the Second Amended and Restated Credit Agreement. Foreign currency exchange risks are attributable to sales to foreign customers and purchases from foreign suppliers not denominated in a location’s functional currency, foreign plant operations, intercompany indebtedness, intercompany investments and include exposures to the Euro, Mexican Peso, Canadian Dollar, Hungarian Forint, North Macedonian Denar, Ukrainian Hryvnia, Japanese Yen, Chinese Renminbi, Korean Won, Czech Koruna and Vietnamese Dong.
The Company regularly enters into derivative contracts with the objective of managing its financial and operational exposure arising from these risks by offsetting gains and losses on the underlying exposures with gains and losses on the financial instruments used to hedge them. The decision of whether and when to execute derivative financial instruments, along with the duration of the instrument, may vary from period to period depending on market conditions, the relative costs of the instruments and capacity to hedge. The duration is linked to the timing of the underlying exposure, with the connection between the two being regularly monitored. The Company does not enter into derivative financial instruments for speculative or trading purposes. Some derivative contracts do not qualify for hedge accounting; for other derivative contracts, we elect to not apply hedge accounting.
The Company’s designated hedging relationships are formally documented at the inception of the hedge, and hedges must be highly effective in offsetting changes to future cash flows on hedged transactions both at the inception of a hedge and on an ongoing basis to be designated for hedge accounting treatment. For derivative contracts which can be classified as a cash flow hedge, the effective portion of the change in the fair value of the derivative is recorded to accumulated other comprehensive loss in the consolidated balance sheets. When the underlying hedge transaction is realized, the gain or loss included in accumulated other comprehensive loss is recorded in earnings in the consolidated statements of income on the same line as the gain or loss on the hedged item attributable to the hedged risk. The Company records the ineffective portion of foreign currency and copper commodity hedging instruments, if any, to cost of sales, in the consolidated statements of income. Cash flows associated with derivatives are reported in net cash provided by operating activities in the Company’s consolidated statements of cash flows.
The Company uses an income approach to value derivative instruments, analyzing quoted market prices to calculate the forward values and then discounting such forward values to the present value using benchmark rates at commonly quoted intervals for the instrument’s full term.
The Company is party to a floating-to-fixed interest rate swap agreement that is an undesignated hedge of the Company’s exposure to interest payment fluctuations on a portion of the Revolving Credit Facility borrowings. The periodic changes in fair value are recognized in interest expense, net.
GENTHERM INCORPORATED
NOTES TO THE CONSOLIDATED FINANCIAL STATEMENTS (Continued)
(In thousands, except share and per share data)
Information related to the recurring fair value measurement of derivative financial instruments in the consolidated balance sheet as of December 31, 2024 is as follows:
| | | | | | | | | | | | | | | | | | | | | | |
| | | | | | | Asset Derivatives | | | Liability Derivatives | | | | |
| | Fair Value
Hierarchy | | Notional Amount | | | Balance Sheet
Location | | Fair
Value | | | Balance Sheet
Location | | Fair
Value | | | Net Asset/
(Liabilities) | |
Derivatives Designated as Cash Flow Hedges | | | | | | | | | | | | | | | | | | |
Foreign currency derivatives | | Level 2 | | $ | 126,496 | | | Other current assets | | $ | — | | | Other current liabilities | | $ | 2,037 | | | $ | (2,037 | ) |
Derivatives Not Designated as Hedging Instruments | | | | | | | | | | | | | | | | | | |
Interest rate contracts | | Level 2 | | $ | 100,000 | | | Other current assets | | $ | 719 | | | Other current liabilities | | $ | — | | | $ | 719 | |
Information related to the recurring fair value measurement of derivative financial instruments in the consolidated balance sheet as of December 31, 2023 is as follows:
| | | | | | | | | | | | | | | | | | | | | | |
| | | | | | | Asset Derivatives | | | Liability Derivatives | | | | |
| | Fair Value
Hierarchy | | Notional Amount | | | Balance Sheet
Location | | Fair
Value | | | Balance Sheet
Location | | Fair
Value | | | Net Asset/
(Liabilities) | |
Derivatives Designated as Cash Flow Hedges | | | | | | | | | | | | | | | | | | |
Foreign currency derivatives | | Level 2 | | $ | 101,109 | | | Other current assets | | $ | 8,655 | | | Other current liabilities | | $ | — | | | $ | 8,655 | |
Derivatives Not Designated as Hedging Instruments | | | | | | | | | | | | | | | | | | |
Interest rate contracts | | Level 2 | | $ | 100,000 | | | Other current assets | | $ | 2,062 | | | Other current liabilities | | $ | — | | | $ | 2,062 | |
Information related to the effect of derivative instruments in the consolidated statements of income is as follows:
| | | | | | | | | | | | | | |
| | | | Year Ended December 31, | |
| | Location | | 2024 | | | 2023 | | | 2022 | |
Derivatives Designated as Cash Flow Hedges | | | | | | | | | | | |
Foreign currency derivatives | | Cost of sales – income | | $ | 3,717 | | | $ | 8,630 | | | $ | 1,458 | |
| | Other comprehensive (loss) income | | | (11,259 | ) | | | 3,483 | | | | 3,496 | |
Total foreign currency derivatives | | | | $ | (7,542 | ) | | $ | 12,113 | | | $ | 4,954 | |
| | | | | | | | | | | |
Commodity derivatives | | Cost of sales – income | | $ | — | | | $ | — | | | $ | 19 | |
| | Other comprehensive (loss) income | | | — | | | | — | | | | (6 | ) |
Total commodity derivatives | | | | $ | — | | | $ | — | | | $ | 13 | |
| | | | | | | | | | | |
Derivatives Not Designated as Hedging Instruments | | | | | | | | | | | |
Foreign currency derivatives | | Foreign currency gain (loss) | | $ | — | | | $ | — | | | $ | (3,806 | ) |
Total foreign currency derivatives | | | | $ | — | | | $ | — | | | $ | (3,806 | ) |
| | | | | | | | | | | |
Interest rate contracts | | Interest expense, net | | $ | (1,343 | ) | | $ | (710 | ) | | $ | 2,772 | |
Total interest rate derivatives | | | | $ | (1,343 | ) | | $ | (710 | ) | | $ | 2,772 | |
The Company did not incur any hedge ineffectiveness during the years ended December 31, 2024 and 2023.
GENTHERM INCORPORATED
NOTES TO THE CONSOLIDATED FINANCIAL STATEMENTS (Continued)
(In thousands, except share and per share data)
Accounts Receivable Factoring
The Company previously sold certain customer trade receivables on a non-recourse basis under factoring arrangements with designated financial institutions. The sale of receivables under these agreements was considered an off-balance sheet arrangement to the Company and was accounted for as a true sale and excluded from accounts receivable in the consolidated balance sheets. These factoring arrangements included a deferred purchase price component in which a portion of the purchase price for the receivable was paid by the financial institution in cash upon sale and the remaining portion was recorded as a deferred purchase price receivable and paid at a later date. Deferred purchase price receivables are recorded in other current assets within the consolidated balance sheets. Cash proceeds received upon the sale of the receivables are included in net cash provided by operating activities and the cash proceeds received on the deferred purchase price receivables are included in net cash used in investing activities. During the year ended December 31, 2024, the factoring agreements the Company was party to either expired or were terminated.
Receivables factored and availability under receivables factoring agreements balances as of December 31, 2024 and 2023 were as follows:
| | | | | | | | |
| | December 31, | |
| | 2024 | | | 2023 | |
Receivables factored and outstanding (a) | | $ | 755 | | | $ | 18,532 | |
(a)During the year ended December 31, 2024, the factoring agreements the Company was party to either expired or were terminated. As of December 31, 2024 there were remaining receivables factored and outstanding that will be collected in the future, however, no further factoring can occur under these factoring agreements.
Trade receivables sold and factoring fees incurred during the years ended December 31, 2024 and 2023 were as follows:
| | | | | | | | |
| | Year Ended December 31, | |
| | 2024 | | | 2023 | |
Trade receivables sold | | $ | 98,761 | | | $ | 135,116 | |
Factoring fees incurred | | | 615 | | | | 800 | |
Note 15 — Fair Value Measurement
Fair value is defined as the exchange price that would be received to sell an asset or paid to transfer a liability (an exit price) in the principal or most advantageous market for the asset or liability in an orderly transaction between market participants on the measurement date. Fair value measurements are based on one or more of the following three valuation techniques:
Market: This approach uses prices and other relevant information generated by market transactions involving identical or comparable assets or liabilities.
Income: This approach uses valuation techniques to convert future amounts to a single present value amount based on current market expectations.
Cost: This approach is based on the amount that would be required to replace the service capacity of an asset (replacement cost).
The Company uses the following fair value hierarchy to measure fair value into three broad levels, which are described below:
Level 1: Quoted prices (unadjusted) in active markets that are accessible at the measurement date for assets or liabilities. The fair value hierarchy gives the highest priority to Level 1 inputs.
Level 2: Inputs, other than quoted market prices included in Level 1, that are observable either directly or indirectly for the asset or liability.
Level 3: Unobservable inputs are used when little or no market data is available. The fair value hierarchy gives the lowest priority to Level 3 inputs.
GENTHERM INCORPORATED
NOTES TO THE CONSOLIDATED FINANCIAL STATEMENTS (Continued)
(In thousands, except share and per share data)
Items Measured at Fair Value on a Recurring Basis
Except for derivative financial instruments (see Note 14) and pension plan assets (see Note 10), the Company has no material financial assets and liabilities that are carried at fair value at December 31, 2024 and 2023. In determining fair value, the Company utilizes valuation techniques that maximize the use of observable inputs and minimize the use of unobservable inputs to the extent possible and also considers counterparty credit risk in its assessment of fair value.
Items Measured at Fair Value on a Nonrecurring Basis
The Company measures certain assets and liabilities at fair value on a non-recurring basis. As these nonrecurring fair value measurements are generally determined using unobservable inputs, these fair value measurements are classified within Level 3 of the fair value hierarchy. The Company utilized a third-party to assist in the Level 3 fair value estimates of goodwill of the Medical reporting unit (see Note 7). The estimated fair value was based on third-party valuation and management’s estimate, generally utilizing income and market approaches. As of December 31, 2024, and December 31, 2023, there were no other significant assets or liabilities measured at fair value on a non-recurring basis.
Items Not Carried at Fair Value
The Company uses an income valuation technique to measure the fair values of its debt instruments by converting amounts of future cash flows to a single present value amount using rates based on current market expectations (Level 2 inputs). As of December 31, 2024, and 2023, the carrying values of the indebtedness under the Company’s Credit Agreement were not materially different than their estimated fair values because the interest rates on variable rate debt approximated rates currently available to the Company (see Note 9). The carrying amounts of financial instruments comprising cash and cash equivalents, short-term investments, accounts receivable, notes receivable and accounts payable approximate fair value because of the short maturities of these instruments.
Note 16 — Equity
Common Stock
The Company is authorized to issue up to 59,991,000 shares, of which 55,000,000 shares shall be Common Stock, without par value, and 4,991,000 shall be Preferred Stock, without par value. As of December 31, 2024, an aggregate of 30,788,639 shares of its Common Stock were issued and outstanding. As of December 31, 2024, there are no preferred stock shares issued or outstanding. The Common Stock is listed on the Nasdaq Global Select Market under the symbol, “THRM”, and has the following rights and privileges:
▪Voting rights. All shares of the Common Stock have identical rights and privileges. With limited exceptions, holders of common stock are entitled to one vote for each outstanding share of Common Stock held of record by each shareholder on all matters properly submitted for the vote of the Company’s shareholders.
▪Dividend rights. Subject to applicable law, any contractual restrictions and the rights of the holders of outstanding preferred stock, if any, holders of Common Stock are entitled to receive ratably such dividends and other distributions that the Company’s Board of Directors, in its discretion, declares from time to time.
▪Liquidation rights. Upon the dissolution, liquidation or winding up of the Company, subject to the rights of the holders of outstanding preferred stock, if any, holders of Common Stock are entitled to receive ratably the assets of the Company available for distribution to the Company’s shareholders in proportion to the number of shares of Common Stock held by each shareholder.
▪Conversion, Redemption and Preemptive Rights. Holders of Common Stock have no conversion, redemption, sinking fund, preemptive, subscription or similar rights.
GENTHERM INCORPORATED
NOTES TO THE CONSOLIDATED FINANCIAL STATEMENTS (Continued)
(In thousands, except share and per share data)
Stock Repurchase Program
In December 2020, the Board of Directors of Gentherm Incorporated (“Board of Directors”) authorized a stock repurchase program (the “2020 Stock Repurchase Program”). Under the 2020 Stock Repurchase Program, the Company was authorized to repurchase up to $150,000 of its issued and outstanding Common Stock over a three-year period, expiring December 15, 2023. On November 1, 2023, the Board of Directors extended the maturity date of the program from December 15, 2023 to June 30, 2024.
During the year ended December 31, 2024, the Company repurchased $20,000 in the open market under the 2020 Stock Repurchase Program with an average price paid per share of $52.65.
On November 1, 2023, following the above-noted extension, the Company entered into a Confirmation of Issuer Forward Repurchase Transaction agreement (the “ASR Agreement”) with Bank of America, N.A. (“Bank of America”) that provided for the Company to purchase shares of Common Stock in an aggregate amount of $60,000 (the “ASR Repurchase Amount”) under the 2020 Stock Repurchase Program.
Under the terms of the ASR Agreement, on November 2, 2023, the Company paid $60,000 to Bank of America for an initial purchase of approximately 1.22 million shares of Common Stock, representing 80% of ASR Repurchase Amount. The final settlement date occurred in the second quarter of 2024. During the year ended December 31, 2024, the Company paid $286 in cash as the final settlement of the ASR Agreement. The 2020 Stock Repurchase Program had $17,491 of repurchase authorization remaining at the time of expiration.
In June 2024, the Board of Directors authorized a new stock repurchase program (the “2024 Stock Repurchase Program”) to commence upon expiration of the 2020 Stock Repurchase Program on June 30, 2024. Under the 2024 Stock Repurchase Program, the Company is authorized to repurchase up to $150,000 of its issued and outstanding Common Stock over a three-year period, expiring June 30, 2027. Repurchases may be made, from time to time, in amounts and at prices the Company deems appropriate, subject to market conditions, applicable legal requirements, debt covenants and other considerations. Any such repurchases may be executed using open market purchases, accelerated share repurchase programs, privately negotiated agreements or other transactions. Repurchases may be funded from cash on hand, available borrowings or proceeds from potential debt or other capital markets sources.
During the year ended December 31, 2024, the Company repurchased $29,883 under the 2024 Stock Repurchase Program with an average price paid per share of $46.73. The 2024 Stock Repurchase Program had $120,117 of repurchase authorization remaining as of December 31, 2024.
Stock repurchases are subject to excise tax, subject to specified exclusions and adjustments. Excise tax of $502 was charged to common stock for the year ended December 31, 2024.
GENTHERM INCORPORATED
NOTES TO THE CONSOLIDATED FINANCIAL STATEMENTS (Continued)
(In thousands, except share and per share data)
Note 17 – Reclassifications Out of Accumulated Other Comprehensive Loss
Reclassification adjustments and other activities impacting accumulated other comprehensive loss during the years ended December 31, 2024, 2023 and 2022 are as follows:
| | | | | | | | | | | | | | | | | | | | |
| | Defined
Benefit
Pension
Plans | | | Foreign
Currency
Translation
Adjustments | | | Commodity Hedge Derivatives | | | Foreign
Currency
Hedge
Derivatives | | | Total | |
Balance at December 31, 2023 | | $ | (1,011 | ) | | $ | (34,830 | ) | | $ | — | | | $ | 5,681 | | | $ | (30,160 | ) |
Other comprehensive loss before reclassifications | | | (1,242 | ) | | | (45,519 | ) | | | — | | | | (3,648 | ) | | | (50,409 | ) |
Income tax effect of other comprehensive loss before reclassifications | | | 335 | | | | 253 | | | | — | | | | 784 | | | | 1,372 | |
Amounts reclassified from accumulated other comprehensive loss into net income | | | 91 | | | | — | | | | — | | | | (7,611 | ) | a | | (7,520 | ) |
Income taxes reclassified into net income | | | (24 | ) | | | — | | | | — | | | | 1,548 | | | | 1,524 | |
Net current period other comprehensive loss | | | (840 | ) | | | (45,266 | ) | | | — | | | | (8,927 | ) | | | (55,033 | ) |
Balance at December 31, 2024 | | $ | (1,851 | ) | | $ | (80,096 | ) | | $ | — | | | $ | (3,246 | ) | | $ | (85,193 | ) |
(a)The amounts reclassified from accumulated other comprehensive loss are included in cost of sales. See Note 14 for information related to the effect of foreign currency derivative instruments on our consolidated statements of income.
| | | | | | | | | | | | | | | | | | | | |
| | Defined
Benefit
Pension
Plans | | | Foreign
Currency
Translation
Adjustments | | | Commodity Hedge Derivatives | | | Foreign
Currency
Hedge
Derivatives | | | Total | |
Balance at December 31, 2022 | | $ | (1,067 | ) | | $ | (48,269 | ) | | $ | — | | | $ | 2,847 | | | $ | (46,489 | ) |
Other comprehensive income before reclassifications | | | 54 | | | | 13,125 | | | | — | | | | 13,086 | | | | 26,265 | |
Income tax effect of other comprehensive income before reclassifications | | | (15 | ) | | | 314 | | | | — | | | | (2,770 | ) | | | (2,471 | ) |
Amounts reclassified from accumulated other comprehensive loss into net income | | | 23 | | | | — | | | | — | | | | (9,603 | ) | a | | (9,580 | ) |
Income taxes reclassified into net income | | | (6 | ) | | | — | | | | — | | | | 2,121 | | | | 2,115 | |
Net current period other comprehensive income | | | 56 | | | | 13,439 | | | | — | | | | 2,834 | | | | 16,329 | |
Balance at December 31, 2023 | | $ | (1,011 | ) | | $ | (34,830 | ) | | $ | — | | | $ | 5,681 | | | $ | (30,160 | ) |
(a)The amounts reclassified from accumulated other comprehensive loss are included in cost of sales. See Note 14 for information related to the effect of foreign currency derivative instruments on our consolidated statements of income.
GENTHERM INCORPORATED
NOTES TO THE CONSOLIDATED FINANCIAL STATEMENTS (Continued)
(In thousands, except share and per share data)
| | | | | | | | | | | | | | | | | | | | |
| | Defined Benefit
Pension Plans | | | Foreign Currency
Translation
Adjustments | | | Commodity Hedge Derivatives | | | Foreign Currency
Hedge
Derivatives | | | Total | |
Balance at December 31, 2021 | | $ | (2,893 | ) | | $ | (34,188 | ) | | $ | 5 | | | $ | 154 | | | $ | (36,922 | ) |
Other comprehensive income (loss) before reclassifications | | | 2,341 | | | | (13,786 | ) | | | 13 | | | | 4,954 | | | | (6,478 | ) |
Income tax effect of other comprehensive income (loss) before reclassifications | | | (621 | ) | | | (295 | ) | | | (3 | ) | | | (1,092 | ) | | | (2,011 | ) |
Amounts reclassified from accumulated other comprehensive loss into net income | | | 137 | | | | — | | | | (19 | ) | a | | (1,458 | ) | a | | (1,340 | ) |
Income taxes reclassified into net income | | | (31 | ) | | | — | | | | 4 | | | | 289 | | | | 262 | |
Net current period other comprehensive income (loss) | | | 1,826 | | | | (14,081 | ) | | | (5 | ) | | | 2,693 | | | | (9,567 | ) |
Balance at December 31, 2022 | | $ | (1,067 | ) | | $ | (48,269 | ) | | $ | — | | | $ | 2,847 | | | $ | (46,489 | ) |
(a)The amounts reclassified from accumulated other comprehensive loss are included in cost of sales. See Note 14 for information related to the effect of commodity and foreign currency derivative instruments on our consolidated statements of income.
The Company expects all of the existing gains and losses related to foreign currency derivatives reported in accumulated other comprehensive loss as of December 31, 2024 to be reclassified into earnings during the next twelve months. See Note 14, "Financial Instruments," for additional information about derivative financial instruments and the effects from reclassification to net income.
Note 18 — Accounting for Stock Based Compensation
On May 18, 2023 the Company’s shareholders approved the Gentherm Incorporated 2023 Equity Incentive Plan (the “2023 Equity Plan”), covering 3,730,000 shares of the Common Stock, plus the number of shares of Common Stock that, as of the effective date of the 2023 Equity Plan, that were subject to awards granted under the Gentherm Incorporated 2013 Equity Incentive Plan (the “2013 Equity Plan”) and that, on or after the effective date of the 2023 Equity Plan, were forfeited, surrendered, terminated (other than by exercise), cancelled, lapsed or reacquired by the Company prior to vesting, without the delivery of any shares of Common Stock, and otherwise comply with the recycling provisions of the 2013 Equity Plan and 2023 Equity Plan. The 2023 Equity Plan permits the granting of various awards including stock options (including both nonqualified stock options and incentive stock options), stock appreciation rights ("SARs"), restricted stock, restricted stock units ("RSUs"), performance stock units (including performance-based RSUs under the 2013 Equity Plan, "PSUs") and performance units, and other awards to employees, outside directors and consultants and advisors of the Company. As of December 31, 2024, the Company had an aggregate of 3,448,234 shares of Common Stock available to issue under the 2023 Equity Plan.
During the three-year period ended December 31, 2024, the Company has outstanding stock options, SARs, restricted stock awards and RSUs to employees, directors and consultants. These awards become available to the recipient upon the satisfaction of a vesting condition, either based on a period of service or based on the performance of a specific achievement. For equity-based awards with a service condition, the requisite service period typically ranges between two to four years for employees and consultants and one year for directors. As of December 31, 2024, there were 279,841 PSUs outstanding. These awards cliff vest after three-years based on the Company’s achievement of one of five separate performance metrics: a target return on invested capital ratio (“ROIC”), as defined in the award agreement, for a specified fiscal year; a target three-year cumulative Adjusted EBITDA (“Adjusted EBITDA”), as defined in the award agreement; a target annual and three-year growth in the expansion of Adjusted EBITDA Margin Rate (“Adjusted EBITDA Margin Rate”), as defined in the award agreement (as modified by the Company’s relative total shareholder return); the Company’s relative total shareholder return (“TSR”), as defined in the award agreement, during a specific three-year measurement period; and a target relative revenue growth relative to light vehicle production in the Company's relevant markets ("RRG"), as defined in the award agreement, during a specific three-year measurement period (in certain cases, as modified by the Company’s relative total shareholder return). In each case, awards will be earned at 50% of the target number of shares for achieving a minimum threshold or up to 200% of the target number of shares for exceeding the target, with a linear adjustment between threshold and target
GENTHERM INCORPORATED
NOTES TO THE CONSOLIDATED FINANCIAL STATEMENTS (Continued)
(In thousands, except share and per share data)
or between target and stretch performance goals. All other outstanding, unvested equity-based awards were service based. Equity-based award vesting may be accelerated at the discretion of the Board under conditions specified in the 2023 Equity Plan and the 2013 Equity Plan.
Under FASB ASC Topic 718, the provisions of the PSUs that vest upon the achievement of relative TSR are considered a market condition, and therefore the effect of that market condition is reflected in the grant date fair value for this portion award. A third party was engaged to complete a Monte Carlo simulation to account for the market condition. That simulation takes into account the beginning stock price of our Common Stock, the expected volatilities for the relative TSR comparator group, the expected volatilities for the Company’s stock price, correlation coefficients, the expected risk-free rate of return and the expected dividend yield of the Company and the comparator group. The single grant-date fair value computed by this valuation method is recognized by the Company in accounting for the awards regardless of the actual future outcome of the relative TSR feature. The grant date fair value of the other PSUs and RSUs are calculated as the closing price of our Common Stock as quoted on Nasdaq on the grant date multiplied by the number of shares subject to the award. Each of ROIC, Adjusted EBITDA, Adjusted EBITDA Margin Rate and RRG are considered a performance condition and the grant-date fair value for ROIC PSUs, Adjusted EBITDA PSUs, Adjusted EBITDA Margin Rate and RRG PSUs correspond with management's expectation of the probable outcome of the performance condition as of the grant date. The Adjusted EBITDA Margin Rate PSUs and the RRG PSUs granted in 2024 are also subject to a relative TSR modifier that can adjust the total payout of PSUs by -25% if performance does not reach threshold or +25% if performance exceeds maximum. Therefore, the grant date fair value of the Adjusted EBITDA Margin Rate PSUs and RRG PSUs for 2024 were further impacted by the fair value of the relative TSR modifier.
The total recognized and unrecognized stock based compensation expense is as follows:
| | | | | | | | | | | | | | | | | | | | |
Stock Based Compensation Expense | | 2024 | | | 2023 | | | 2022 | | | Unrecognized Stock Based Compensation Expense at December 31, 2024 | | | Remaining Weighted Average Vesting Period | |
RSUs | | $ | 6,871 | | | $ | 6,216 | | | $ | 5,551 | | | $ | 7,395 | | | | 1.92 | |
PSUs | | | 2,454 | | | | 4,661 | | | | 954 | | | | 7,795 | | | | 1.98 | |
Restricted Stock | | | 1,115 | | | | 878 | | | | 888 | | | | 402 | | | | 0.37 | |
SARs | | | (8 | ) | | | (128 | ) | | | (794 | ) | | | — | | | | — | |
Total stock based compensation | | $ | 10,432 | | | $ | 11,627 | | | $ | 6,599 | | | $ | 15,592 | | | | 1.91 | |
The related deferred tax benefit (expense) for the years ended December 31, 2024, 2023 and 2022 was $1,485, $1,794, and $(444), respectively. If Gentherm were to realize expired stock based payment arrangements, they would be reported as a forfeit in the activity roll forward tables below.
GENTHERM INCORPORATED
NOTES TO THE CONSOLIDATED FINANCIAL STATEMENTS (Continued)
(In thousands, except share and per share data)
RSUs
The following table summarizes RSU activity during the years ended December 31, 2024, 2023 and 2022:
| | | | | | | | |
Unvested Restricted Stock Units | | Time Vesting
Shares | | | Weighted-Average
Grant Date
Fair Value | |
Outstanding at December 31, 2021 | | | 193,626 | | | $ | 56.02 | |
Granted | | | 117,507 | | | | 66.86 | |
Vested | | | (95,692 | ) | | | 49.85 | |
Forfeited | | | (13,863 | ) | | | 70.52 | |
Outstanding at December 31, 2022 | | | 201,578 | | | $ | 64.27 | |
Granted | | | 136,964 | | | | 58.68 | |
Vested | | | (82,695 | ) | | | 59.43 | |
Forfeited | | | (23,986 | ) | | | 59.47 | |
Outstanding at December 31, 2023 | | | 231,861 | | | $ | 63.19 | |
Granted | | | 184,959 | | | | 54.20 | |
Vested | | | (129,477 | ) | | | 64.55 | |
Forfeited | | | (84,682 | ) | | | 57.71 | |
Outstanding at December 31, 2024 | | | 202,661 | | | $ | 56.35 | |
The total intrinsic value of RSUs vested during the years ended December 31, 2024, 2023 and 2022 was $8,358, $4,915 and $4,774, respectively.
PSUs
The following table summarizes PSU activity during the years ended December 31, 2024, 2023 and 2022:
| | | | | | | | |
Unvested Performance Stock Units | | Performance Stock Unit Shares | | | Weighted-Average
Grant Date
Fair Value | |
Outstanding at December 31, 2021 | | | 319,336 | | | $ | 57.27 | |
Granted | | | 106,604 | | | | 75.57 | |
Performance Adjustment | | | 42,746 | | | | 58.30 | |
Vested | | | (133,477 | ) | | | 52.34 | |
Forfeited | | | (14,760 | ) | | | 65.02 | |
Outstanding at December 31, 2022 | | | 320,449 | | | $ | 62.90 | |
Granted | | | 153,121 | | | | 65.90 | |
Performance Adjustment | | | (59,928 | ) | | | 33.90 | |
Vested | | | (59,928 | ) | | | 49.25 | |
Forfeited | | | (28,737 | ) | | | 65.97 | |
Outstanding at December 31, 2023 | | | 324,977 | | | $ | 74.10 | |
Granted | | | 235,388 | | | | 60.68 | |
Performance Adjustment | | | (52,856 | ) | | | 79.49 | |
Vested | | | (27,850 | ) | | | 92.44 | |
Forfeited | | | (199,818 | ) | | | 61.35 | |
Outstanding at December 31, 2024 | | | 279,841 | | | $ | 63.30 | |
The total intrinsic value of PSUs vested during the years ended December 31, 2024, 2023 and 2022 was $2,574, $2,951 and $6,986, respectively.
GENTHERM INCORPORATED
NOTES TO THE CONSOLIDATED FINANCIAL STATEMENTS (Continued)
(In thousands, except share and per share data)
Restricted Stock
The following table summarizes restricted stock activity during the years ended December 31, 2024, 2023 and 2022:
| | | | | | | | |
Unvested Restricted Stock | | Shares | | | Weighted-Average
Grant Date
Fair Value | |
Outstanding at December 31, 2021 | | | 11,376 | | | $ | 70.33 | |
Granted | | | 13,600 | | | | 73.54 | |
Vested | | | (11,376 | ) | | | 70.33 | |
Forfeited | | | — | | | | — | |
Outstanding at December 31, 2022 | | | 13,600 | | | $ | 73.54 | |
Granted | | | 17,923 | | | | 56.96 | |
Vested | | | (11,900 | ) | | | 73.54 | |
Forfeited | | | (1,700 | ) | | | 73.54 | |
Outstanding at December 31, 2023 | | | 17,923 | | | $ | 56.96 | |
Granted | | | 21,296 | | | | 50.72 | |
Vested | | | (17,923 | ) | | | 56.96 | |
Forfeited | | | — | | | | — | |
Outstanding at December 31, 2024 | | | 21,296 | | | $ | 50.72 | |
The compensation cost associated with restricted stock is estimated on the date of grant using quoted market prices (Level 1 input). The total fair value of restricted stock vested in 2024, 2023 and 2022 was $1,021, $875 and $800, respectively.
SARs
The following table summarizes SARs activity during the years ended December 31, 2024, 2023 and 2022:
| | | | | | | | | | | | | | | | |
Stock Appreciation Rights | | Shares | | | Weighted-Average
Exercise Price | | | Weighted-Average
Remaining
Contractual Term | | | Aggregate
Intrinsic Value | |
Outstanding at December 31, 2021 | | | 55,600 | | | $ | 41.15 | | | | 1.28 | | | $ | 2,544 | |
Granted | | | — | | | | — | | | | | | | |
Exercised | | | (40,850 | ) | | | 42.27 | | | | | | | |
Forfeited | | | — | | | | — | | | | | | | |
Outstanding at December 31, 2022 | | | 14,750 | | | $ | 38.05 | | | | 1.15 | | | $ | 402 | |
Granted | | | — | | | | — | | | | | | | |
Exercised | | | (12,500 | ) | | | 38.05 | | | | | | | |
Forfeited | | | — | | | | — | | | | | | | |
Outstanding at December 31, 2023 | | | 2,250 | | | $ | 38.05 | | | | 0.15 | | | $ | 32 | |
Granted | | | — | | | | — | | | | | | | |
Exercised | | | (2,250 | ) | | | 38.05 | | | | | | | |
Forfeited | | | — | | | | — | | | | | | | |
Outstanding at December 31, 2024 | | | — | | | $ | — | | | | — | | | $ | — | |
Exercisable at December 31, 2024 | | | — | | | $ | — | | | | — | | | $ | — | |
GENTHERM INCORPORATED
NOTES TO THE CONSOLIDATED FINANCIAL STATEMENTS (Continued)
(In thousands, except share and per share data)
The total intrinsic value of SARs exercised during the years ended December 31, 2024, 2023 and 2022 was $25, $242 and $1,348, respectively.
Stock Options
The following table summarizes stock option activity during the years ended December 31, 2024, 2023 and 2022:
| | | | | | | | | | | | | | | | |
Options | | Shares | | | Weighted-Average
Exercise Price | | | Weighted-Average
Remaining
Contractual Term | | | Aggregate
Intrinsic Value | |
Outstanding at December 31, 2021 | | | 206,750 | | | $ | 36.72 | | | | 2.60 | | | $ | 10,375 | |
Granted | | | — | | | | — | | | | | | | |
Exercised | | | (44,116 | ) | | | 37.87 | | | | | | | |
Forfeited | | | — | | | | — | | | | | | | |
Outstanding at December 31, 2022 | | | 162,634 | | | $ | 36.41 | | | | 2.68 | | | $ | 8,212 | |
Granted | | | — | | | | — | | | | | | | |
Exercised | | | (6,450 | ) | | | 40.79 | | | | | | | |
Forfeited | | | (16,500 | ) | | $ | 41.59 | | | | | | | |
Outstanding at December 31, 2023 | | | 139,684 | | | $ | 35.59 | | | | 0.90 | | | $ | 2,342 | |
Granted | | | — | | | | — | | | | | | | |
Exercised | | | (139,684 | ) | | | 35.59 | | | | | | | |
Forfeited | | | — | | | | — | | | | | | | |
Outstanding at December 31, 2024 | | | — | | | $ | — | | | | — | | | $ | — | |
Exercisable at December 31, 2024 | | | — | | | $ | — | | | | — | | | $ | — | |
The total intrinsic value of stock options exercised during the years ended December 31, 2024, 2023 and 2022 was $2,071, $201 and $1,582, respectively.
Note 19 — Income Taxes
The income tax provisions were calculated based upon the following components of earnings before income tax for the years ended December 31, 2024, 2023 and 2022:
| | | | | | | | | | | | |
| | Year Ended December 31, | |
| | 2024 | | | 2023 | | | 2022 | |
(Loss) earnings before income tax: | | | | | | | | | |
Domestic | | $ | (54,073 | ) | | $ | (37,222 | ) | | $ | (34,211 | ) |
Foreign | | | 156,338 | | | | 92,176 | | | | 72,593 | |
Earnings before income tax | | $ | 102,265 | | | $ | 54,954 | | | $ | 38,382 | |
GENTHERM INCORPORATED
NOTES TO THE CONSOLIDATED FINANCIAL STATEMENTS (Continued)
(In thousands, except share and per share data)
The components of the provision for income taxes for the years ended December 31, 2024, 2023 and 2022 are summarized as follows:
| | | | | | | | | | | | |
| | Year Ended December 31, | |
| | 2024 | | | 2023 | | | 2022 | |
Current income tax (benefit) expense: | | | | | | | | | |
Federal | | $ | (1,181 | ) | | $ | 3,510 | | | $ | 3,006 | |
State and local | | | 679 | | | | 414 | | | | 650 | |
Foreign | | | 27,240 | | | | 23,759 | | | | 17,607 | |
Total current income tax expense | | | 26,738 | | | | 27,683 | | | | 21,263 | |
Deferred income tax (benefit) expense: | | | | | | | | | |
Federal | | | (7,944 | ) | | | (7,495 | ) | | | (5,971 | ) |
State and local | | | 66 | | | | 444 | | | | (213 | ) |
Foreign | | | 18,458 | | | | (6,021 | ) | | | (1,138 | ) |
Total deferred income tax expense (benefit) | | | 10,580 | | | | (13,072 | ) | | | (7,322 | ) |
Total income tax expense | | $ | 37,318 | | | $ | 14,611 | | | $ | 13,941 | |
No income taxes have been provided on indefinitely reinvested earnings of certain foreign subsidiaries at December 31, 2024. In addition, deferred U.S. income taxes have not been provided on the undistributed earnings of the Company’s foreign subsidiaries since these earnings will not be taxable upon repatriation to the United States. These earnings will be primarily treated as previously taxed income from either the one-time transition tax or global intangible low-taxed income provision, or they will be offset with a 100% dividend received deduction.
To the extent dividends are paid within foreign tiered subsidiaries, withholding and income taxes may be incurred upon repatriation through the chain. Taxes of $5,088 have been accrued on undistributed earnings that are not indefinitely reinvested and are primarily related to China, Germany, Ukraine, North Macedonia, Czech Republic and Malta. As of December 31, 2024, taxes have not been provided on $194,777 of undistributed earnings in various subsidiaries as those earnings have been indefinitely invested. If, in the future, these earnings were to be repatriated to foreign affiliates, additional tax provisions would be required. It is not practicable to determine the unrecognized deferred tax liability on these undistributed earnings. There are no other material liabilities for income taxes on the undistributed earnings of foreign subsidiaries, as the Company has concluded that such earnings are either indefinitely reinvested or should not give rise to additional income tax liabilities as a result of the distribution of such earnings.
GENTHERM INCORPORATED
NOTES TO THE CONSOLIDATED FINANCIAL STATEMENTS (Continued)
(In thousands, except share and per share data)
The deferred tax assets and deferred tax liabilities and related valuation allowance were comprised of the following as of December 31, 2024 and 2023:
| | | | | | | | |
| | December 31, | |
| | 2024 | | | 2023 | |
Deferred tax assets: | | | | | | |
Net operating losses | | $ | 35,966 | | | $ | 44,053 | |
Intangible assets | | | 10,893 | | | | 4,314 | |
Research and development credits | | | 5,475 | | | | 7,127 | |
Property and equipment | | | 4,132 | | | | 4,800 | |
Valuation reserves and accrued liabilities | | | 8,446 | | | | 11,221 | |
Capitalized research and development costs | | | 28,318 | | | | 23,658 | |
Stock compensation | | | 2,039 | | | | 3,227 | |
Defined benefit obligation | | | 1,514 | | | | 1,691 | |
Inventory | | | 717 | | | | 181 | |
Other credits | | | — | | | | 8,946 | |
Other | | | 8,707 | | | | 9,154 | |
Total deferred tax asset | | | 106,207 | | | | 118,372 | |
Valuation allowance | | | (25,272 | ) | | | (35,888 | ) |
Deferred tax liabilities: | | | | | | |
Unrealized foreign currency exchange gains | | $ | (1,092 | ) | | $ | — | |
Undistributed profits of subsidiary | | | (5,016 | ) | | | (4,609 | ) |
Property and equipment | | | (10,524 | ) | | | (12,627 | ) |
Intangible assets | | | (8,720 | ) | | | — | |
Other | | | (1,383 | ) | | | (1,550 | ) |
Total deferred tax liability | | | (26,735 | ) | | | (18,786 | ) |
Net deferred tax asset | | $ | 54,200 | | | $ | 63,698 | |
Reconciliations between the statutory Federal income tax rate and the effective rate of income tax expense for the years ended December 31, 2024, 2023 and 2022 are as follows:
| | | | | | | | | | | | |
| | Year Ended December 31, | |
| | 2024 | | | 2023 | | | 2022 | |
Statutory Federal income tax rate | | | 21.0 | % | | | 21.0 | % | | | 21.0 | % |
Increase (decrease) resulting from: | | | | | | | | | |
Change in valuation allowance | | | (9.0 | )% | | | (3.1 | )% | | | 6.4 | % |
Effect of different tax rates of foreign jurisdictions | | | (0.7 | )% | | | 0.9 | % | | | (4.9 | )% |
Tax credits & deductions related to R&D | | | (3.7 | )% | | | (8.5 | )% | | | (10.1 | )% |
Goodwill impairment | | | — | | | | 4.1 | % | | | — | |
Non-deductible expenses | | | 15.7 | % | | | 6.8 | % | | | 14.9 | % |
Non-deductible expenses related to acquisitions | | | — | | | | — | | | | 7.0 | % |
Other foreign, state and local taxes | | | 2.1 | % | | | 3.5 | % | | | 0.7 | % |
Tax impact of foreign income | | | 7.5 | % | | | 3.6 | % | | | 4.2 | % |
Stock option compensation | | | 1.0 | % | | | — | | | | (3.8 | )% |
Audit settlements and statute expirations | | | 11.0 | % | | | — | | | | — | |
Incentive tax rates in foreign jurisdictions | | | (5.5 | )% | | | (1.9 | )% | | | — | |
Other | | | (2.9 | )% | | | 0.2 | % | | | 0.9 | % |
Effective rate | | | 36.5 | % | | | 26.6 | % | | | 36.3 | % |
GENTHERM INCORPORATED
NOTES TO THE CONSOLIDATED FINANCIAL STATEMENTS (Continued)
(In thousands, except share and per share data)
The Company has Net Operating Loss (“NOL”) carryforwards as follows:
| | | | | | |
Jurisdiction | | Amount as of December 31, 2024 | | | Years of Expiration |
U.S. state income tax | | $ | 41,396 | | | 2025-2043 |
Foreign | | | 199,365 | | | Never |
As of December 31, 2024, the Company has consolidated deferred tax assets of $106,207 with a valuation allowance of $25,272 principally related to tax net operating losses, credit carryforwards and other deferred tax assets in the U.S. and various foreign jurisdictions, and certain U.S. state income tax attributes. The Company has considered historical pre-tax income or loss and the four sources of income in determining the need for a valuation allowance when the realization of its deferred tax assets are not more likely than not. The four sources of income considered are 1) taxable income in prior carryback years where carryback is allowable, 2) future reversals of existing temporary differences, 3) consideration of reasonable and prudent tax planning strategies, and 4) forecasts of future taxable income, exclusive of reversing temporary differences and carryforwards. In the cases where a valuation allowance has been recorded, the evidence described above did not result in a conclusion that the deferred tax assets are more likely than not.
The Company has NOL carryforwards in various states associated with the benefits of the state dividends received reduction and foreign royalty exclusion. The state NOL carryforwards generally expire at various dates from 2025 to 2043. We have concluded that there is not sufficient evidence these NOL carryforwards will be utilized, and thus have not recognized the benefit of these NOL carryforwards as of December 31, 2024.
At December 31, 2024, certain non-U.S. subsidiaries had gross NOL carryforwards totaling $199,365 which have no expiration date. The Company has a valuation allowance recorded of $15,263 recorded against deferred tax assets of $31,441 of the total non-U.S. subsidiaries’ net operating loss carryforwards as of December 31, 2024.
The Company is subject to taxation in the United States and various state and foreign jurisdictions. As of December 31, 2024, the Company was no longer subject to U.S. Federal examinations by tax authorities for tax years before 2020 and was no longer subject to foreign examinations by tax authorities for tax years before 2015.
The Company currently benefits from incentive tax rates in various non-U.S. jurisdictions with expiration dates from 2025 – 2029. Certain of the Company’s Chinese subsidiaries began to benefit from a reduced corporate income tax rate in 2024 as a result of their High and New Technology Enterprises (“HNTE”) status. For the years ended December 31, 2024, 2023 and 2022, income in foreign jurisdictions with such holidays was $50,372, $8,185, and $2,414, respectively.
At December 31, 2024, 2023 and 2022, the Company had total unrecognized tax benefits of $8,266, $5,486 and $6,185, respectively, all of which, if recognized, would affect the effective income tax rates. The reconciliation of the beginning and ending amount of unrecognized tax benefits is as follows:
| | | | | | | | | | | | |
| | Year Ended December 31, | |
| | 2024 | | | 2023 | | | 2022 | |
Balance at beginning of year | | $ | 5,486 | | | $ | 6,185 | | | $ | 5,665 | |
Additions based on tax position related to current year | | | 78 | | | | 87 | | | | 972 | |
Additions based on tax position related to prior year | | | 4,587 | | | | 347 | | | | 433 | |
Reductions from settlements and statute of limitation expiration | | | (1,636 | ) | | | (1,266 | ) | | $ | (610 | ) |
Effect of foreign currency translation | | | (249 | ) | | | 133 | | | | (275 | ) |
Balance at end of year | | $ | 8,266 | | | $ | 5,486 | | | $ | 6,185 | |
The Company classifies income tax-related penalties and net interest as income tax expense. In the years ended December 31, 2024, 2023 and 2022, income tax related interest and penalties were not material. It is reasonably possible that audit settlements, the conclusions of current examinations or the expiration of the statute of limitations in several jurisdictions could impact the Company’s unrecognized tax benefits. A reversal of approximately $4,000 is reasonably possible in the next 12 months due to the statute of limitations in various taxing jurisdictions as well as conclusion ongoing tax audits.
GENTHERM INCORPORATED
NOTES TO THE CONSOLIDATED FINANCIAL STATEMENTS (Continued)
(In thousands, except share and per share data)
Note 20 — Segment Reporting
The Company is organized under two reportable segments: Automotive and Medical.
The Automotive reporting segment is comprised of the results from our global automotive businesses, including the design, development, manufacturing and sales of automotive climate and comfort systems, cable systems, battery performance solutions, lumbar and massage comfort solutions, valve systems, and electronic and software systems.
The Medical reporting segment is comprised of the results from our patient temperature management business in the medical industry. Patient temperature management includes temperature management systems across multiple product categories addressing the needs of hyper-hypothermia therapy in intensive care, normothermia in surgical procedures and additional warming/cooling therapies utilized in acute and chronic care departments and non-hospital facilities.
The Corporate and other unallocated expenses category includes certain enterprise and governance activities resulting in unallocated corporate costs and other activity and net costs that the Company may choose not to allocate directly to its business segments.
Segment information is used by management, specifically our chief operating decision maker ("CODM"), the President and Chief Executive Officer, for making operating decisions for the Company. Our CODM uses operating income or loss to evaluate the performance and allocate resources for each of the Company’s segments. Operating income or loss is used to monitor budget versus actual results and year-over-year actual results to inform the decisions of how to allocate capital and resources within the Company. The measure of assets has not been disclosed for each segment as it is not regularly reviewed by the CODM.
GENTHERM INCORPORATED
NOTES TO THE CONSOLIDATED FINANCIAL STATEMENTS (Continued)
(In thousands, except share and per share data)
The table below presents segment information about the reported product revenues, operating income (loss), and significant segment expenses of the Company for the years ended December 31, 2024, 2023 and 2022:
| | | | | | | | | | | | |
| | Year Ended December 31, | |
Product Revenues | | 2024 | | | 2023 | | | 2022 | |
Automotive | | $ | 1,406,278 | | | $ | 1,422,952 | | | $ | 1,161,616 | |
Medical | | | 49,846 | | | | 46,124 | | | | 43,040 | |
Total | | | 1,456,124 | | | | 1,469,076 | | | | 1,204,656 | |
| | | | | | | | | |
Significant Segment Expenses and Operating Performance | | | | | | | | | |
Automotive | | | | | | | | | |
Cost of sales | | | 1,058,989 | | | | 1,090,941 | | | | 898,260 | |
Net research and development expenses | | | 68,787 | | | | 70,778 | | | | 75,137 | |
Selling, general and administrative expenses | | | 65,924 | | | | 72,090 | | | | 62,858 | |
Restructuring expenses, net | | | 12,238 | | | | 3,187 | | | | 637 | |
Impairment of intangible assets and property and equipment | | | — | | | | — | | | | 6,291 | |
Automotive operating income | | | 200,340 | | | | 185,956 | | | | 118,433 | |
| | | | | | | | | |
Medical | | | | | | | | | |
Cost of sales | | | 25,868 | | | | 24,619 | | | | 24,938 | |
Other operating expenses | | | 21,836 | | | | 24,230 | | | | 22,131 | |
Impairment of intangible assets and property and equipment | | | 2,501 | | | | 19,509 | | | | — | |
Medical operating loss | | | (359 | ) | | | (22,234 | ) | | | (4,029 | ) |
| | | | | | | | | |
Corporate and Other Unallocated Expenses | | | | | | | | | |
Corporate and other unallocated expenses | | | (92,966 | ) | | | (86,283 | ) | | | (66,097 | ) |
Total consolidated operating income | | $ | 107,015 | | | $ | 77,439 | | | $ | 48,307 | |
| | | | | | | | | |
Other Segment Disclosures | | | | | | | | | |
Depreciation and Amortization | | | | | | | | | |
Automotive | | $ | 47,752 | | | $ | 45,845 | | | $ | 39,815 | |
Medical | | | 3,542 | | | | 3,654 | | | | 3,344 | |
Corporate and other unallocated expenses | | | 1,681 | | | | 1,449 | | | | 1,235 | |
Total | | $ | 52,975 | | | $ | 50,948 | | | $ | 44,394 | |
GENTHERM INCORPORATED
NOTES TO THE CONSOLIDATED FINANCIAL STATEMENTS (Continued)
(In thousands, except share and per share data)
Automotive and Medical segment product revenues by product category for each of the years ended December 31, 2024, 2023 and 2022 are as follows:
| | | | | | | | | | | | |
| | Year Ended December 31, | |
| | 2024 | | | 2023 | | | 2022 | |
Climate Control Seat | | $ | 468,820 | | | $ | 482,665 | | | $ | 426,046 | |
Seat Heaters | | | 297,866 | | | | 308,588 | | | | 283,970 | |
Lumbar and Massage Comfort Solutions (a) | | | 178,584 | | | | 144,923 | | | | 56,980 | |
Steering Wheel Heaters | | | 169,763 | | | | 153,943 | | | | 120,949 | |
Valve Systems (a) | | | 105,056 | | | | 106,262 | | | | 41,980 | |
Automotive Cables | | | 73,091 | | | | 79,993 | | | | 76,962 | |
Battery Performance Solutions | | | 58,183 | | | | 75,484 | | | | 71,907 | |
Electronics | | | 33,065 | | | | 40,387 | | | | 44,106 | |
Other Automotive | | | 21,850 | | | | 30,707 | | | | 38,716 | |
Subtotal Automotive segment | | | 1,406,278 | | | | 1,422,952 | | | | 1,161,616 | |
Medical segment (a) | | | 49,846 | | | | 46,124 | | | | 43,040 | |
Total Company | | $ | 1,456,124 | | | $ | 1,469,076 | | | $ | 1,204,656 | |
(a)Includes product revenues from acquisitions since their respective acquisition dates (see Note 4).
Revenue (based on shipment destination) by geographic area for each of the years ended December 31, 2024, 2023 and 2022 is as follows:
| | | | | | | | | | | | |
| | Year Ended December 31, | |
| | 2024 | | | 2023 | | | 2022 | |
United States | | $ | 504,444 | | | $ | 537,096 | | | $ | 472,468 | |
China | | | 224,221 | | | | 221,512 | | | | 183,419 | |
Germany | | | 105,927 | | | | 102,383 | | | | 75,367 | |
South Korea | | | 104,120 | | | | 115,854 | | | | 94,937 | |
Czech Republic | | | 78,785 | | | | 69,714 | | | | 49,293 | |
Slovakia | | | 55,085 | | | | 44,946 | | | | 34,686 | |
Japan | | | 53,730 | | | | 60,879 | | | | 57,718 | |
Romania | | | 52,616 | | | | 53,982 | | | | 47,532 | |
Mexico | | | 43,327 | | | | 45,733 | | | | 23,233 | |
United Kingdom | | | 41,098 | | | | 34,765 | | | | 22,380 | |
Other | | | 192,771 | | | | 182,212 | | | | 143,623 | |
Total Non-U.S. | | | 951,680 | | | | 931,980 | | | | 732,188 | |
Total Company | | $ | 1,456,124 | | | $ | 1,469,076 | | | $ | 1,204,656 | |
Property and equipment, net, for each of the geographic areas in which the Company operates as of December 31, 2024 and 2023 is as follows:
| | | | | | | | |
| | December 31, | |
Property and equipment, net | | 2024 | | | 2023 | |
Mexico | | $ | 47,814 | | | $ | 39,943 | |
China | | | 44,767 | | | | 45,429 | |
United States | | | 42,928 | | | | 37,413 | |
Germany | | | 42,457 | | | | 46,586 | |
North Macedonia | | | 25,374 | | | | 27,675 | |
Vietnam | | | 20,920 | | | | 21,664 | |
Czech Republic | | | 9,440 | | | | 11,126 | |
Hungary | | | 7,994 | | | | 9,097 | |
Ukraine | | | 5,174 | | | | 5,986 | |
Other | | | 6,102 | | | | 315 | |
Total | | $ | 252,970 | | | $ | 245,234 | |
GENTHERM INCORPORATED
SCHEDULE II — VALUATION AND QUALIFYING ACCOUNTS
For the Years Ended December 31, 2024, 2023 and 2022
(In thousands)
| | | | | | | | | | | | | | | | | | | | |
Description | | Balance at
Beginning
of Period | | | Charged to
Costs and
Expenses | | | Other Activity | | | Deductions
from
Reserves | | | Balance at
End of
Period | |
Allowance for Deferred Income Tax Assets | | | | | | | | | | | | | | | |
Year Ended December 31, 2022 | | $ | 16,090 | | | $ | 2,482 | | | $ | 18,099 | | a | $ | — | | | $ | 36,671 | |
Year Ended December 31, 2023 | | | 36,671 | | | | (1,746 | ) | | | 963 | | | | — | | | | 35,888 | |
Year Ended December 31, 2024 | | | 35,888 | | | | (12,004 | ) | | | 1,388 | | | | — | | | | 25,272 | |
| | | | | | | | | | | | | | | |
Reserve for Inventory | | | | | | | | | | | | | | | |
Year Ended December 31, 2022 | | $ | 6,014 | | | $ | 15,923 | | | $ | (133 | ) | | $ | (2,558 | ) | | $ | 19,246 | |
Year Ended December 31, 2023 | | | 19,246 | | | | 6,867 | | | | 3,876 | | | | (1,972 | ) | | | 28,017 | |
Year Ended December 31, 2024 | | | 28,017 | | | | 6,437 | | | | (346 | ) | | | (13,166 | ) | | | 20,942 | |
(a)Includes amount relates to valuation allowance from acquisitions.
SIGNATURES
Pursuant to the requirements of Section 13 or 15(d) of the Securities Exchange Act of 1934, the registrant has duly caused this Annual Report to be signed on its behalf by the undersigned, thereunto duly authorized.
| | | |
| | GENTHERM INCORPORATED |
| | | |
| | By: | /S/ William Presley |
| | | William Presley |
| | | President and Chief Executive Officer |
| | | |
| | | Date: February 19, 2025 |
Pursuant to the requirements of the Securities Exchange Act of 1934, this Annual Report has been signed below by the following persons on behalf of the registrant in the capacities and on the dates indicated.
| | | | |
Signature | | Capacity | | Date |
| | | | |
/s/ WILLIAM PRESLEY | | Director, President and Chief | | February 19, 2025 |
WILLIAM PRESLEY | | Executive Officer (Principal Executive Officer) | | |
| | | | |
/s/ JONATHAN DOUYARD | | Executive Vice President, Chief | | February 19, 2025 |
JONATHAN DOUYARD | | Financial Officer and Treasurer (Principal Financial Officer) | | |
| | | | |
/s/ NICHOLAS BREISACHER | | Vice President, Chief Accounting Officer | | February 19, 2025 |
NICHOLAS BREISACHER | | (Principal Accounting Officer) | | |
| | | | |
* | | Director, Chairman of the Board | | February 19, 2025 |
RONALD HUNDZINSKI | | | | |
| | | | |
* | | Director | | February 19, 2025 |
SOPHIE DESORMIÈRE | | | | |
| | | | |
* | | Director | | February 19, 2025 |
David Heinzmann | | | | |
| | | | |
* | | Director | | February 19, 2025 |
LAURA KOWALCHIK | | | | |
| | | | |
* | | Director | | February 19, 2025 |
CHARLES KUMMETH | | | | |
| | | | |
* | | Director | | February 19, 2025 |
BETSY METER | | | | |
| | | | |
* | | Director | | February 19, 2025 |
JOHN STACEY | | | | |
| | | | |
* | | Director | | February 19, 2025 |
KENNETH WASHINGTON | | | | |
| |
*By: | /s/ William Presley |
| William Presley, Attorney-in-Fact |