Table of Contents
UNITED STATES
SECURITIES AND EXCHANGE COMMISSION
Washington, D.C. 20549
FORM N-CSR
CERTIFIED SHAREHOLDER REPORT OF REGISTERED
MANAGEMENT INVESTMENT COMPANIES
Investment Company Act file number: 811-07704
Schwab Capital Trust – Target Index Funds
(Exact name of registrant as specified in charter)
211 Main Street, San Francisco, California 94105
(Address of principal executive offices) (Zip code)
Marie Chandoha
Schwab Capital Trust
211 Main Street, San Francisco, California 94105
(Name and address of agent for service)
Registrant’s telephone number, including area code: (415) 636-7000
Date of fiscal year end: March 31
Date of reporting period: March 31, 2018
Item 1: Report(s) to Shareholders.
Table of Contents

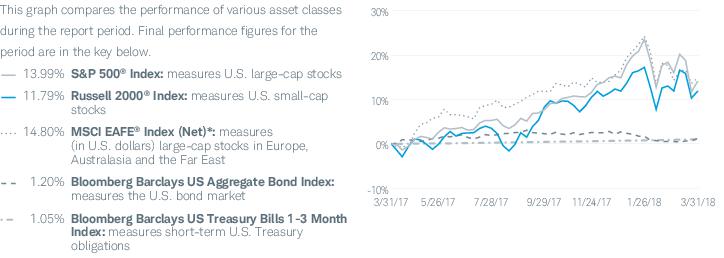
| Total Returns For the 12 Months Ended March 31, 2018 | |
| Schwab Target 2010 Index Fund1 (Ticker Symbol: SWYAX) | 5.57% |
| Target 2010 Passive Composite Index | 5.68% |
| Fund Category: Morningstar Target-Date 2000-20102 | 5.94% |
| Performance Details | pages 8-10 |
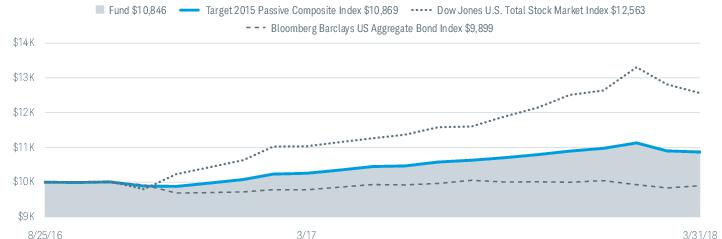
| Schwab Target 2015 Index Fund1 (Ticker Symbol: SWYBX) | 5.83% |
| Target 2015 Passive Composite Index | 5.95% |
| Fund Category: Morningstar Target-Date 20152 | 6.87% |
| Performance Details | pages 11-13 |
| Schwab Target 2020 Index Fund1 (Ticker Symbol: SWYLX) | 7.30% |
| Target 2020 Passive Composite Index | 7.44% |
| Fund Category: Morningstar Target-Date 20202 | 7.60% |
| Performance Details | pages 14-16 |
| Schwab Target 2025 Index Fund1 (Ticker Symbol: SWYDX) | 8.93% |
| Target 2025 Passive Composite Index | 8.97% |
| Fund Category: Morningstar Target-Date 20252 | 9.10% |
| Performance Details | pages 17-19 |
| Schwab Target 2030 Index Fund1 (Ticker Symbol: SWYEX) | 10.12% |
| Target 2030 Passive Composite Index | 10.08% |
| Fund Category: Morningstar Target-Date 20302 | 10.37% |
| Performance Details | pages 20-22 |
| Schwab Target 2035 Index Fund1 (Ticker Symbol: SWYFX) | 10.96% |
| Target 2035 Passive Composite Index | 10.99% |
| Fund Category: Morningstar Target-Date 20352 | 11.73% |
| Performance Details | pages 23-25 |
| 1 | On July 24, 2017, the Investor Share class and Institutional Share class of the fund were consolidated into a single class of shares of the fund. The performance and financial history of the fund is that of the fund’s former Institutional Shares. Accordingly, the past performance shown is that of the fund’s former Institutional Shares. |
| 2 | Source for category information: Morningstar, Inc. The Morningstar Category return represents all active and index mutual funds within the category as of the report date. |
| Total Returns For the 12 Months Ended March 31, 2018 | |
| Schwab Target 2040 Index Fund1 (Ticker Symbol: SWYGX) | 11.97% |
| Target 2040 Passive Composite Index | 11.86% |
| Fund Category: Morningstar Target-Date 20402 | 12.42% |
| Performance Details | pages 26-28 |
| Schwab Target 2045 Index Fund1 (Ticker Symbol: SWYHX) | 12.57% |
| Target 2045 Passive Composite Index | 12.40% |
| Fund Category: Morningstar Target-Date 20452 | 13.18% |
| Performance Details | pages 29-31 |
| Schwab Target 2050 Index Fund1 (Ticker Symbol: SWYMX) | 12.85% |
| Target 2050 Passive Composite Index | 12.73% |
| Fund Category: Morningstar Target-Date 20502 | 13.25% |
| Performance Details | pages 32-34 |
| Schwab Target 2055 Index Fund1 (Ticker Symbol: SWYJX) | 13.25% |
| Target 2055 Passive Composite Index | 13.05% |
| Fund Category: Morningstar Target-Date 20552 | 13.61% |
| Performance Details | pages 35-37 |
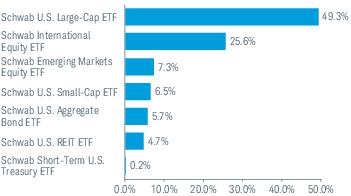
| Schwab Target 2060 Index Fund1 (Ticker Symbol: SWYNX) | 13.22% |
| Target 2060 Passive Composite Index | 13.15% |
| Fund Category: Morningstar Target-Date 2060+2 | 13.72% |
| Performance Details | pages 38-40 |
| 1 | On July 24, 2017, the Investor Share class and Institutional Share class of the fund were consolidated into a single class of shares of the fund. The performance and financial history of the fund is that of the fund’s former Institutional Shares. Accordingly, the past performance shown is that of the fund’s former Institutional Shares. |
| 2 | Source for category information: Morningstar, Inc. The Morningstar Category return represents all active and index mutual funds within the category as of the report date. |

President and CEO of
Charles Schwab Investment
Management, Inc. and the
funds covered in this report.

| * | The net version of the index reflects reinvested dividends net of withholding taxes, but reflects no deductions for expenses or other taxes. |
 | Zifan Tang, Ph.D., CFA, Senior Portfolio Manager, is responsible for the management of the funds. She has served as portfolio manager of the funds since August 2016. Prior to joining CSIM in 2012, Ms. Tang was a product manager at Thomson Reuters and, from 1997 to 2009, worked as a portfolio manager at Barclays Global Investors, which was subsequently acquired by BlackRock. |
| 1 | Percentages may not add up to 100% due to rounding. |
| 2 | ETF performance can be expressed on a market price or NAV basis. The returns cited in this section are Market Price Returns. The ETF’s per share NAV is the value of one share of the ETF. NAV is calculated by taking the ETF’s total assets (including the market value of securities owned), subtracting liabilities, and dividing by the number of shares outstanding. The NAV Return is based on the NAV of the ETF, and the Market Price Return is based on the market price per share of the ETF. The price used to calculate market return (Market Price) is determined by using the midpoint between the highest bid and the lowest offer on the primary stock exchange on which the shares of the ETF are listed for trading, as of the time that the ETF’s NAV is calculated. NAV is used as a proxy for purposes of calculating Market Price Return on inception date. Market Price and NAV returns assume that dividends and capital gain distributions have been reinvested in the ETF at Market Price and NAV, respectively. |

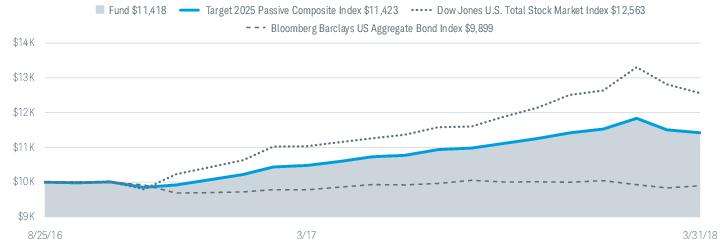
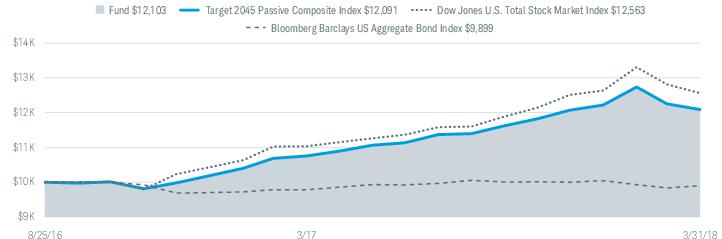
| Fund and Inception Date | 1 Year | Since Inception |
| Schwab Target 2010 Index Fund (8/25/16) | 5.57% | 4.91% |
| Target 2010 Passive Composite Index | 5.68% | 5.05% |
| Dow Jones U.S. Total Stock Market IndexSM | 13.84% | 15.37% |
| Bloomberg Barclays US Aggregate Bond Index | 1.20% | -0.63% |
| Fund Category: Morningstar Target-Date 2000-20103 | 5.94% | N/A |
| Fund Expense Ratios4: Net 0.08%; Gross 0.14% | ||
| 1 | Fund expenses may have been partially absorbed by CSIM and its affiliates. Without these reductions, the fund’s returns would have been lower. These returns do not reflect the deduction of taxes that a shareholder would pay on fund distributions or the redemption of fund shares. |
| 2 | On July 24, 2017, the Investor Share class and Institutional Share class of the fund were consolidated into a single class of shares of the fund. The performance and financial history of the fund is that of the fund’s former Institutional Shares. Accordingly, the past performance shown is that of the fund’s former Institutional Shares. |
| 3 | Source for category information: Morningstar, Inc. The Morningstar Category return represents all active and index mutual funds within the category as of the report date. |
| 4 | As stated in the prospectus. Includes 0.06% of acquired fund fees and expenses, which are indirect expenses incurred by the fund through its investments in the underlying funds. Net Expense: Expenses reduced by a contractual fee waiver in effect for so long as CSIM serves as the investment adviser to the fund. Gross Expense: Does not reflect the effect of contractual fee waivers. For actual ratios during the period, refer to the financial highlights section of the financial statements. |
| Number of Holdings | 10 |
| Portfolio Turnover Rate | 28% |
| 1 | The percentage may differ from the Portfolio Holdings because the above calculation is based on a percentage of total investments, whereas the calculation in the Portfolio Holdings is based on a percentage of net assets. |
| 2 | The fund intends to primarily invest in affiliated Schwab ETFs and may also invest in affiliated Schwab and Laudus mutual funds and unaffiliated third party ETFs and mutual funds (all such ETFs and mutual funds referred to as “underlying funds”). |
| 3 | This list is not a recommendation of any security by the investment adviser. |
| 4 | The holdings listed exclude any temporary liquidity investments. |
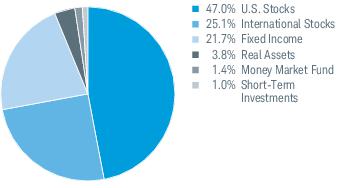
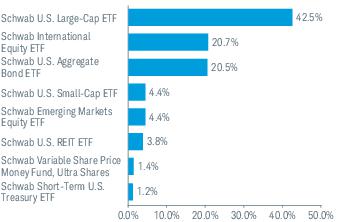
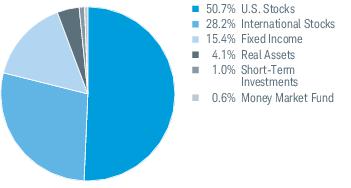
| 1 | Percentages may not add up to 100% due to rounding. |
| 2 | ETF performance can be expressed on a market price or NAV basis. The returns cited in this section are Market Price Returns. The ETF’s per share NAV is the value of one share of the ETF. NAV is calculated by taking the ETF’s total assets (including the market value of securities owned), subtracting liabilities, and dividing by the number of shares outstanding. The NAV Return is based on the NAV of the ETF, and the Market Price Return is based on the market price per share of the ETF. The price used to calculate market return (Market Price) is determined by using the midpoint between the highest bid and the lowest offer on the primary stock exchange on which the shares of the ETF are listed for trading, as of the time that the ETF’s NAV is calculated. NAV is used as a proxy for purposes of calculating Market Price Return on inception date. Market Price and NAV returns assume that dividends and capital gain distributions have been reinvested in the ETF at Market Price and NAV, respectively. |
| Fund and Inception Date | 1 Year | Since Inception |
| Schwab Target 2015 Index Fund (8/25/16) | 5.83% | 5.22% |
| Target 2015 Passive Composite Index | 5.95% | 5.36% |
| Dow Jones U.S. Total Stock Market IndexSM | 13.84% | 15.37% |
| Bloomberg Barclays US Aggregate Bond Index | 1.20% | -0.63% |
| Fund Category: Morningstar Target-Date 20153 | 6.87% | N/A |
| Fund Expense Ratios4: Net 0.08%; Gross 0.14% | ||
| 1 | Fund expenses may have been partially absorbed by CSIM and its affiliates. Without these reductions, the fund’s returns would have been lower. These returns do not reflect the deduction of taxes that a shareholder would pay on fund distributions or the redemption of fund shares. |
| 2 | On July 24, 2017, the Investor Share class and Institutional Share class of the fund were consolidated into a single class of shares of the fund. The performance and financial history of the fund is that of the fund’s former Institutional Shares. Accordingly, the past performance shown is that of the fund’s former Institutional Shares. |
| 3 | Source for category information: Morningstar, Inc. The Morningstar Category return represents all active and index mutual funds within the category as of the report date. |
| 4 | As stated in the prospectus. Includes 0.06% of acquired fund fees and expenses, which are indirect expenses incurred by the fund through its investments in the underlying funds. Net Expense: Expenses reduced by a contractual fee waiver in effect for so long as CSIM serves as the investment adviser to the fund. Gross Expense: Does not reflect the effect of contractual fee waivers. For actual ratios during the period, refer to the financial highlights section of the financial statements. |
| Number of Holdings | 10 |
| Portfolio Turnover Rate | 47% |
| 1 | The percentage may differ from the Portfolio Holdings because the above calculation is based on a percentage of total investments, whereas the calculation in the Portfolio Holdings is based on a percentage of net assets. |
| 2 | The fund intends to primarily invest in affiliated Schwab ETFs and may also invest in affiliated Schwab and Laudus mutual funds and unaffiliated third party ETFs and mutual funds (all such ETFs and mutual funds referred to as “underlying funds”). |
| 3 | This list is not a recommendation of any security by the investment adviser. |
| 4 | The holdings listed exclude any temporary liquidity investments. |
| 1 | Percentages may not add up to 100% due to rounding. |
| 2 | ETF performance can be expressed on a market price or NAV basis. The returns cited in this section are Market Price Returns. The ETF’s per share NAV is the value of one share of the ETF. NAV is calculated by taking the ETF’s total assets (including the market value of securities owned), subtracting liabilities, and dividing by the number of shares outstanding. The NAV Return is based on the NAV of the ETF, and the Market Price Return is based on the market price per share of the ETF. The price used to calculate market return (Market Price) is determined by using the midpoint between the highest bid and the lowest offer on the primary stock exchange on which the shares of the ETF are listed for trading, as of the time that the ETF’s NAV is calculated. NAV is used as a proxy for purposes of calculating Market Price Return on inception date. Market Price and NAV returns assume that dividends and capital gain distributions have been reinvested in the ETF at Market Price and NAV, respectively. |
| Fund and Inception Date | 1 Year | Since Inception |
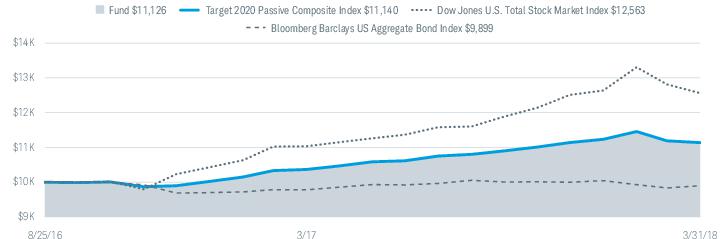
| Schwab Target 2020 Index Fund (8/25/16) | 7.30% | 6.91% |
| Target 2020 Passive Composite Index | 7.44% | 6.99% |
| Dow Jones U.S. Total Stock Market IndexSM | 13.84% | 15.37% |
| Bloomberg Barclays US Aggregate Bond Index | 1.20% | -0.63% |
| Fund Category: Morningstar Target-Date 20203 | 7.60% | N/A |
| Fund Expense Ratios4: Net 0.08%; Gross 0.13% | ||
| 1 | Fund expenses may have been partially absorbed by CSIM and its affiliates. Without these reductions, the fund’s returns would have been lower. These returns do not reflect the deduction of taxes that a shareholder would pay on fund distributions or the redemption of fund shares. |
| 2 | On July 24, 2017, the Investor Share class and Institutional Share class of the fund were consolidated into a single class of shares of the fund. The performance and financial history of the fund is that of the fund’s former Institutional Shares. Accordingly, the past performance shown is that of the fund’s former Institutional Shares. |
| 3 | Source for category information: Morningstar, Inc. The Morningstar Category return represents all active and index mutual funds within the category as of the report date. |
| 4 | As stated in the prospectus. Includes 0.05% of acquired fund fees and expenses, which are indirect expenses incurred by the fund through its investments in the underlying funds. Net Expense: Expenses reduced by a contractual fee waiver in effect for so long as CSIM serves as the investment adviser to the fund. Gross Expense: Does not reflect the effect of contractual fee waivers. For actual ratios during the period, refer to the financial highlights section of the financial statements. |
| Number of Holdings | 11 |
| Portfolio Turnover Rate | 21% |
| 1 | The percentage may differ from the Portfolio Holdings because the above calculation is based on a percentage of total investments, whereas the calculation in the Portfolio Holdings is based on a percentage of net assets. |
| 2 | The fund intends to primarily invest in affiliated Schwab ETFs and may also invest in affiliated Schwab and Laudus mutual funds and unaffiliated third party ETFs and mutual funds (all such ETFs and mutual funds referred to as “underlying funds”). |
| 3 | This list is not a recommendation of any security by the investment adviser. |
| 4 | The holdings listed exclude any temporary liquidity investments. |
| 1 | Percentages may not add up to 100% due to rounding. |
| 2 | ETF performance can be expressed on a market price or NAV basis. The returns cited in this section are Market Price Returns. The ETF’s per share NAV is the value of one share of the ETF. NAV is calculated by taking the ETF’s total assets (including the market value of securities owned), subtracting liabilities, and dividing by the number of shares outstanding. The NAV Return is based on the NAV of the ETF, and the Market Price Return is based on the market price per share of the ETF. The price used to calculate market return (Market Price) is determined by using the midpoint between the highest bid and the lowest offer on the primary stock exchange on which the shares of the ETF are listed for trading, as of the time that the ETF’s NAV is calculated. NAV is used as a proxy for purposes of calculating Market Price Return on inception date. Market Price and NAV returns assume that dividends and capital gain distributions have been reinvested in the ETF at Market Price and NAV, respectively. |
| Fund and Inception Date | 1 Year | Since Inception |
| Schwab Target 2025 Index Fund (8/25/16) | 8.93% | 8.66% |
| Target 2025 Passive Composite Index | 8.97% | 8.69% |
| Dow Jones U.S. Total Stock Market IndexSM | 13.84% | 15.37% |
| Bloomberg Barclays US Aggregate Bond Index | 1.20% | -0.63% |
| Fund Category: Morningstar Target-Date 20253 | 9.10% | N/A |
| Fund Expense Ratios4: Net 0.08%; Gross 0.13% | ||
| 1 | Fund expenses may have been partially absorbed by CSIM and its affiliates. Without these reductions, the fund’s returns would have been lower. These returns do not reflect the deduction of taxes that a shareholder would pay on fund distributions or the redemption of fund shares. |
| 2 | On July 24, 2017, the Investor Share class and Institutional Share class of the fund were consolidated into a single class of shares of the fund. The performance and financial history of the fund is that of the fund’s former Institutional Shares. Accordingly, the past performance shown is that of the fund’s former Institutional Shares. |
| 3 | Source for category information: Morningstar, Inc. The Morningstar Category return represents all active and index mutual funds within the category as of the report date. |
| 4 | As stated in the prospectus. Includes 0.05% of acquired fund fees and expenses, which are indirect expenses incurred by the fund through its investments in the underlying funds. Net Expense: Expenses reduced by a contractual fee waiver in effect for so long as CSIM serves as the investment adviser to the fund. Gross Expense: Does not reflect the effect of contractual fee waivers. For actual ratios during the period, refer to the financial highlights section of the financial statements. |
| Number of Holdings | 10 |
| Portfolio Turnover Rate | 14% |
| 1 | The percentage may differ from the Portfolio Holdings because the above calculation is based on a percentage of total investments, whereas the calculation in the Portfolio Holdings is based on a percentage of net assets. |
| 2 | The fund intends to primarily invest in affiliated Schwab ETFs and may also invest in affiliated Schwab and Laudus mutual funds and unaffiliated third party ETFs and mutual funds (all such ETFs and mutual funds referred to as “underlying funds”). |
| 3 | This list is not a recommendation of any security by the investment adviser. |
| 4 | The holdings listed exclude any temporary liquidity investments. |
| 1 | Percentages may not add up to 100% due to rounding. |
| 2 | ETF performance can be expressed on a market price or NAV basis. The returns cited in this section are Market Price Returns. The ETF’s per share NAV is the value of one share of the ETF. NAV is calculated by taking the ETF’s total assets (including the market value of securities owned), subtracting liabilities, and dividing by the number of shares outstanding. The NAV Return is based on the NAV of the ETF, and the Market Price Return is based on the market price per share of the ETF. The price used to calculate market return (Market Price) is determined by using the midpoint between the highest bid and the lowest offer on the primary stock exchange on which the shares of the ETF are listed for trading, as of the time that the ETF’s NAV is calculated. NAV is used as a proxy for purposes of calculating Market Price Return on inception date. Market Price and NAV returns assume that dividends and capital gain distributions have been reinvested in the ETF at Market Price and NAV, respectively. |
| Fund and Inception Date | 1 Year | Since Inception |
| Schwab Target 2030 Index Fund (8/25/16) | 10.12% | 9.95% |
| Target 2030 Passive Composite Index | 10.08% | 9.96% |
| Dow Jones U.S. Total Stock Market IndexSM | 13.84% | 15.37% |
| Bloomberg Barclays US Aggregate Bond Index | 1.20% | -0.63% |
| Fund Category: Morningstar Target-Date 20303 | 10.37% | N/A |
| Fund Expense Ratios4: Net 0.08%; Gross 0.13% | ||
| 1 | Fund expenses may have been partially absorbed by CSIM and its affiliates. Without these reductions, the fund’s returns would have been lower. These returns do not reflect the deduction of taxes that a shareholder would pay on fund distributions or the redemption of fund shares. |
| 2 | On July 24, 2017, the Investor Share class and Institutional Share class of the fund were consolidated into a single class of shares of the fund. The performance and financial history of the fund is that of the fund’s former Institutional Shares. Accordingly, the past performance shown is that of the fund’s former Institutional Shares. |
| 3 | Source for category information: Morningstar, Inc. The Morningstar Category return represents all active and index mutual funds within the category as of the report date. |
| 4 | As stated in the prospectus. Includes 0.05% of acquired fund fees and expenses, which are indirect expenses incurred by the fund through its investments in the underlying funds. Net Expense: Expenses reduced by a contractual fee waiver in effect for so long as CSIM serves as the investment adviser to the fund. Gross Expense: Does not reflect the effect of contractual fee waivers. For actual ratios during the period, refer to the financial highlights section of the financial statements. |
| Number of Holdings | 10 |
| Portfolio Turnover Rate | 8% |
| 1 | The percentage may differ from the Portfolio Holdings because the above calculation is based on a percentage of total investments, whereas the calculation in the Portfolio Holdings is based on a percentage of net assets. |
| 2 | The fund intends to primarily invest in affiliated Schwab ETFs and may also invest in affiliated Schwab and Laudus mutual funds and unaffiliated third party ETFs and mutual funds (all such ETFs and mutual funds referred to as “underlying funds”). |
| 3 | This list is not a recommendation of any security by the investment adviser. |
| 4 | The holdings listed exclude any temporary liquidity investments. |
| 1 | Percentages may not add up to 100% due to rounding. |
| 2 | ETF performance can be expressed on a market price or NAV basis. The returns cited in this section are Market Price Returns. The ETF’s per share NAV is the value of one share of the ETF. NAV is calculated by taking the ETF’s total assets (including the market value of securities owned), subtracting liabilities, and dividing by the number of shares outstanding. The NAV Return is based on the NAV of the ETF, and the Market Price Return is based on the market price per share of the ETF. The price used to calculate market return (Market Price) is determined by using the midpoint between the highest bid and the lowest offer on the primary stock exchange on which the shares of the ETF are listed for trading, as of the time that the ETF’s NAV is calculated. NAV is used as a proxy for purposes of calculating Market Price Return on inception date. Market Price and NAV returns assume that dividends and capital gain distributions have been reinvested in the ETF at Market Price and NAV, respectively. |
| Fund and Inception Date | 1 Year | Since Inception |
| Schwab Target 2035 Index Fund (8/25/16) | 10.96% | 10.98% |
| Target 2035 Passive Composite Index | 10.99% | 11.01% |
| Dow Jones U.S. Total Stock Market IndexSM | 13.84% | 15.37% |
| Bloomberg Barclays US Aggregate Bond Index | 1.20% | -0.63% |
| Fund Category: Morningstar Target-Date 20353 | 11.73% | N/A |
| Fund Expense Ratios4: Net 0.08%; Gross 0.13% | ||
| 1 | Fund expenses may have been partially absorbed by CSIM and its affiliates. Without these reductions, the fund’s returns would have been lower. These returns do not reflect the deduction of taxes that a shareholder would pay on fund distributions or the redemption of fund shares. |
| 2 | On July 24, 2017, the Investor Share class and Institutional Share class of the fund were consolidated into a single class of shares of the fund. The performance and financial history of the fund is that of the fund’s former Institutional Shares. Accordingly, the past performance shown is that of the fund’s former Institutional Shares. |
| 3 | Source for category information: Morningstar, Inc. The Morningstar Category return represents all active and index mutual funds within the category as of the report date. |
| 4 | As stated in the prospectus. Includes 0.05% of acquired fund fees and expenses, which are indirect expenses incurred by the fund through its investments in the underlying funds. Net Expense: Expenses reduced by a contractual fee waiver in effect for so long as CSIM serves as the investment adviser to the fund. Gross Expense: Does not reflect the effect of contractual fee waivers. For actual ratios during the period, refer to the financial highlights section of the financial statements. |
| Number of Holdings | 10 |
| Portfolio Turnover Rate | 14% |
| 1 | The percentage may differ from the Portfolio Holdings because the above calculation is based on a percentage of total investments, whereas the calculation in the Portfolio Holdings is based on a percentage of net assets. |
| 2 | The fund intends to primarily invest in affiliated Schwab ETFs and may also invest in affiliated Schwab and Laudus mutual funds and unaffiliated third party ETFs and mutual funds (all such ETFs and mutual funds referred to as “underlying funds”). |
| 3 | This list is not a recommendation of any security by the investment adviser. |
| 4 | The holdings listed exclude any temporary liquidity investments. |
| 1 | Percentages may not add up to 100% due to rounding. |
| 2 | ETF performance can be expressed on a market price or NAV basis. The returns cited in this section are Market Price Returns. The ETF’s per share NAV is the value of one share of the ETF. NAV is calculated by taking the ETF’s total assets (including the market value of securities owned), subtracting liabilities, and dividing by the number of shares outstanding. The NAV Return is based on the NAV of the ETF, and the Market Price Return is based on the market price per share of the ETF. The price used to calculate market return (Market Price) is determined by using the midpoint between the highest bid and the lowest offer on the primary stock exchange on which the shares of the ETF are listed for trading, as of the time that the ETF’s NAV is calculated. NAV is used as a proxy for purposes of calculating Market Price Return on inception date. Market Price and NAV returns assume that dividends and capital gain distributions have been reinvested in the ETF at Market Price and NAV, respectively. |
| Fund and Inception Date | 1 Year | Since Inception |
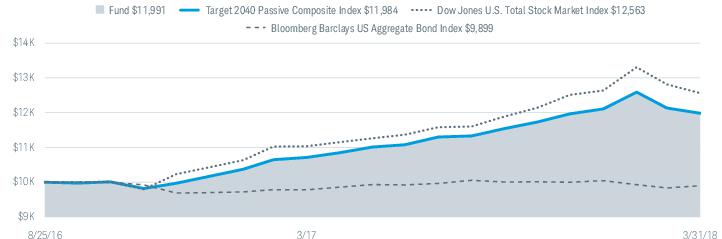
| Schwab Target 2040 Index Fund (8/25/16) | 11.97% | 12.04% |
| Target 2040 Passive Composite Index | 11.86% | 12.01% |
| Dow Jones U.S. Total Stock Market IndexSM | 13.84% | 15.37% |
| Bloomberg Barclays US Aggregate Bond Index | 1.20% | -0.63% |
| Fund Category: Morningstar Target-Date 20403 | 12.42% | N/A |
| Fund Expense Ratios4: Net 0.08%; Gross 0.13% | ||
| 1 | Fund expenses may have been partially absorbed by CSIM and its affiliates. Without these reductions, the fund’s returns would have been lower. These returns do not reflect the deduction of taxes that a shareholder would pay on fund distributions or the redemption of fund shares. |
| 2 | On July 24, 2017, the Investor Share class and Institutional Share class of the fund were consolidated into a single class of shares of the fund. The performance and financial history of the fund is that of the fund’s former Institutional Shares. Accordingly, the past performance shown is that of the fund’s former Institutional Shares. |
| 3 | Source for category information: Morningstar, Inc. The Morningstar Category return represents all active and index mutual funds within the category as of the report date. |
| 4 | As stated in the prospectus. Includes 0.05% of acquired fund fees and expenses, which are indirect expenses incurred by the fund through its investments in the underlying funds. Net Expense: Expenses reduced by a contractual fee waiver in effect for so long as CSIM serves as the investment adviser to the fund. Gross Expense: Does not reflect the effect of contractual fee waivers. For actual ratios during the period, refer to the financial highlights section of the financial statements. |
| Number of Holdings | 10 |
| Portfolio Turnover Rate | 15% |
| 1 | The percentage may differ from the Portfolio Holdings because the above calculation is based on a percentage of total investments, whereas the calculation in the Portfolio Holdings is based on a percentage of net assets. |
| 2 | The fund intends to primarily invest in affiliated Schwab ETFs and may also invest in affiliated Schwab and Laudus mutual funds and unaffiliated third party ETFs and mutual funds (all such ETFs and mutual funds referred to as “underlying funds”). |
| 3 | This list is not a recommendation of any security by the investment adviser. |
| 4 | The holdings listed exclude any temporary liquidity investments. |
| 1 | Percentages may not add up to 100% due to rounding. |
| 2 | ETF performance can be expressed on a market price or NAV basis. The returns cited in this section are Market Price Returns. The ETF’s per share NAV is the value of one share of the ETF. NAV is calculated by taking the ETF’s total assets (including the market value of securities owned), subtracting liabilities, and dividing by the number of shares outstanding. The NAV Return is based on the NAV of the ETF, and the Market Price Return is based on the market price per share of the ETF. The price used to calculate market return (Market Price) is determined by using the midpoint between the highest bid and the lowest offer on the primary stock exchange on which the shares of the ETF are listed for trading, as of the time that the ETF’s NAV is calculated. NAV is used as a proxy for purposes of calculating Market Price Return on inception date. Market Price and NAV returns assume that dividends and capital gain distributions have been reinvested in the ETF at Market Price and NAV, respectively. |
| Fund and Inception Date | 1 Year | Since Inception |
| Schwab Target 2045 Index Fund (8/25/16) | 12.57% | 12.69% |
| Target 2045 Passive Composite Index | 12.40% | 12.63% |
| Dow Jones U.S. Total Stock Market IndexSM | 13.84% | 15.37% |
| Bloomberg Barclays US Aggregate Bond Index | 1.20% | -0.63% |
| Fund Category: Morningstar Target-Date 20453 | 13.18% | N/A |
| Fund Expense Ratios4: Net 0.08%; Gross 0.14% | ||
| 1 | Fund expenses may have been partially absorbed by CSIM and its affiliates. Without these reductions, the fund’s returns would have been lower. These returns do not reflect the deduction of taxes that a shareholder would pay on fund distributions or the redemption of fund shares. |
| 2 | On July 24, 2017, the Investor Share class and Institutional Share class of the fund were consolidated into a single class of shares of the fund. The performance and financial history of the fund is that of the fund’s former Institutional Shares. Accordingly, the past performance shown is that of the fund’s former Institutional Shares. |
| 3 | Source for category information: Morningstar, Inc. The Morningstar Category return represents all active and index mutual funds within the category as of the report date. |
| 4 | As stated in the prospectus. Includes 0.06% of acquired fund fees and expenses, which are indirect expenses incurred by the fund through its investments in the underlying funds. Net Expense: Expenses reduced by a contractual fee waiver in effect for so long as CSIM serves as the investment adviser to the fund. Gross Expense: Does not reflect the effect of contractual fee waivers. For actual ratios during the period, refer to the financial highlights section of the financial statements. |
| Number of Holdings | 9 |
| Portfolio Turnover Rate | 11% |
| 1 | The percentage may differ from the Portfolio Holdings because the above calculation is based on a percentage of total investments, whereas the calculation in the Portfolio Holdings is based on a percentage of net assets. |
| 2 | The fund intends to primarily invest in affiliated Schwab ETFs and may also invest in affiliated Schwab and Laudus mutual funds and unaffiliated third party ETFs and mutual funds (all such ETFs and mutual funds referred to as “underlying funds”). |
| 3 | This list is not a recommendation of any security by the investment adviser. |
| 4 | The holdings listed exclude any temporary liquidity investments. |
| 1 | Percentages may not add up to 100% due to rounding. |
| 2 | ETF performance can be expressed on a market price or NAV basis. The returns cited in this section are Market Price Returns. The ETF’s per share NAV is the value of one share of the ETF. NAV is calculated by taking the ETF’s total assets (including the market value of securities owned), subtracting liabilities, and dividing by the number of shares outstanding. The NAV Return is based on the NAV of the ETF, and the Market Price Return is based on the market price per share of the ETF. The price used to calculate market return (Market Price) is determined by using the midpoint between the highest bid and the lowest offer on the primary stock exchange on which the shares of the ETF are listed for trading, as of the time that the ETF’s NAV is calculated. NAV is used as a proxy for purposes of calculating Market Price Return on inception date. Market Price and NAV returns assume that dividends and capital gain distributions have been reinvested in the ETF at Market Price and NAV, respectively. |

| Fund and Inception Date | 1 Year | Since Inception |
| Schwab Target 2050 Index Fund (8/25/16) | 12.85% | 13.06% |
| Target 2050 Passive Composite Index | 12.73% | 13.01% |
| Dow Jones U.S. Total Stock Market IndexSM | 13.84% | 15.37% |
| Bloomberg Barclays US Aggregate Bond Index | 1.20% | -0.63% |
| Fund Category: Morningstar Target-Date 20503 | 13.25% | N/A |
| Fund Expense Ratios4: Net 0.08%; Gross 0.14% | ||
| 1 | Fund expenses may have been partially absorbed by CSIM and its affiliates. Without these reductions, the fund’s returns would have been lower. These returns do not reflect the deduction of taxes that a shareholder would pay on fund distributions or the redemption of fund shares. |
| 2 | On July 24, 2017, the Investor Share class and Institutional Share class of the fund were consolidated into a single class of shares of the fund. The performance and financial history of the fund is that of the fund’s former Institutional Shares. Accordingly, the past performance shown is that of the fund’s former Institutional Shares. |
| 3 | Source for category information: Morningstar, Inc. The Morningstar Category return represents all active and index mutual funds within the category as of the report date. |
| 4 | As stated in the prospectus. Includes 0.06% of acquired fund fees and expenses, which are indirect expenses incurred by the fund through its investments in the underlying funds. Net Expense: Expenses reduced by a contractual fee waiver in effect for so long as CSIM serves as the investment adviser to the fund. Gross Expense: Does not reflect the effect of contractual fee waivers. For actual ratios during the period, refer to the financial highlights section of the financial statements. |
| Number of Holdings | 8 |
| Portfolio Turnover Rate | 15% |
| 1 | The percentage may differ from the Portfolio Holdings because the above calculation is based on a percentage of total investments, whereas the calculation in the Portfolio Holdings is based on a percentage of net assets. |
| 2 | The fund intends to primarily invest in affiliated Schwab ETFs and may also invest in affiliated Schwab and Laudus mutual funds and unaffiliated third party ETFs and mutual funds (all such ETFs and mutual funds referred to as “underlying funds”). |
| 3 | This list is not a recommendation of any security by the investment adviser. |
| 4 | The holdings listed exclude any temporary liquidity investments. |
| 1 | Percentages may not add up to 100% due to rounding. |
| 2 | ETF performance can be expressed on a market price or NAV basis. The returns cited in this section are Market Price Returns. The ETF’s per share NAV is the value of one share of the ETF. NAV is calculated by taking the ETF’s total assets (including the market value of securities owned), subtracting liabilities, and dividing by the number of shares outstanding. The NAV Return is based on the NAV of the ETF, and the Market Price Return is based on the market price per share of the ETF. The price used to calculate market return (Market Price) is determined by using the midpoint between the highest bid and the lowest offer on the primary stock exchange on which the shares of the ETF are listed for trading, as of the time that the ETF’s NAV is calculated. NAV is used as a proxy for purposes of calculating Market Price Return on inception date. Market Price and NAV returns assume that dividends and capital gain distributions have been reinvested in the ETF at Market Price and NAV, respectively. |
| Fund and Inception Date | 1 Year | Since Inception |
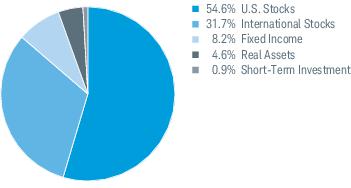
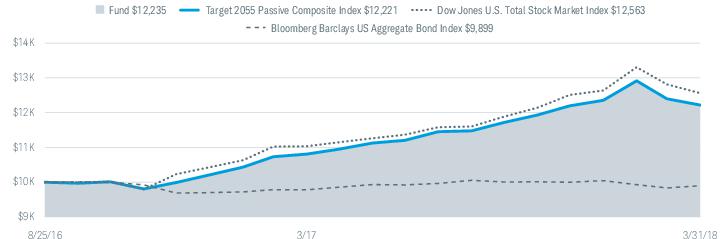
| Schwab Target 2055 Index Fund (8/25/16) | 13.25% | 13.46% |
| Target 2055 Passive Composite Index | 13.05% | 13.39% |
| Dow Jones U.S. Total Stock Market IndexSM | 13.84% | 15.37% |
| Bloomberg Barclays US Aggregate Bond Index | 1.20% | -0.63% |
| Fund Category: Morningstar Target-Date 20553 | 13.61% | N/A |
| Fund Expense Ratios4: Net 0.08%; Gross 0.14% | ||
| 1 | Fund expenses may have been partially absorbed by CSIM and its affiliates. Without these reductions, the fund’s returns would have been lower. These returns do not reflect the deduction of taxes that a shareholder would pay on fund distributions or the redemption of fund shares. |
| 2 | On July 24, 2017, the Investor Share class and Institutional Share class of the fund were consolidated into a single class of shares of the fund. The performance and financial history of the fund is that of the fund’s former Institutional Shares. Accordingly, the past performance shown is that of the fund’s former Institutional Shares. |
| 3 | Source for category information: Morningstar, Inc. The Morningstar Category return represents all active and index mutual funds within the category as of the report date. |
| 4 | As stated in the prospectus. Includes 0.06% of acquired fund fees and expenses, which are indirect expenses incurred by the fund through its investments in the underlying funds. Net Expense: Expenses reduced by a contractual fee waiver in effect for so long as CSIM serves as the investment adviser to the fund. Gross Expense: Does not reflect the effect of contractual fee waivers. For actual ratios during the period, refer to the financial highlights section of the financial statements. |
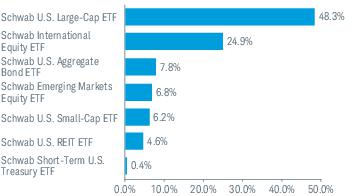
| Number of Holdings | 8 |
| Portfolio Turnover Rate | 23% |
| 1 | The percentage may differ from the Portfolio Holdings because the above calculation is based on a percentage of total investments, whereas the calculation in the Portfolio Holdings is based on a percentage of net assets. |
| 2 | The fund intends to primarily invest in affiliated Schwab ETFs and may also invest in affiliated Schwab and Laudus mutual funds and unaffiliated third party ETFs and mutual funds (all such ETFs and mutual funds referred to as “underlying funds”). |
| 3 | This list is not a recommendation of any security by the investment adviser. |
| 4 | The holdings listed exclude any temporary liquidity investments. |
| 1 | Percentages may not add up to 100% due to rounding. |
| 2 | ETF performance can be expressed on a market price or NAV basis. The returns cited in this section are Market Price Returns. The ETF’s per share NAV is the value of one share of the ETF. NAV is calculated by taking the ETF’s total assets (including the market value of securities owned), subtracting liabilities, and dividing by the number of shares outstanding. The NAV Return is based on the NAV of the ETF, and the Market Price Return is based on the market price per share of the ETF. The price used to calculate market return (Market Price) is determined by using the midpoint between the highest bid and the lowest offer on the primary stock exchange on which the shares of the ETF are listed for trading, as of the time that the ETF’s NAV is calculated. NAV is used as a proxy for purposes of calculating Market Price Return on inception date. Market Price and NAV returns assume that dividends and capital gain distributions have been reinvested in the ETF at Market Price and NAV, respectively. |
| Fund and Inception Date | 1 Year | Since Inception |
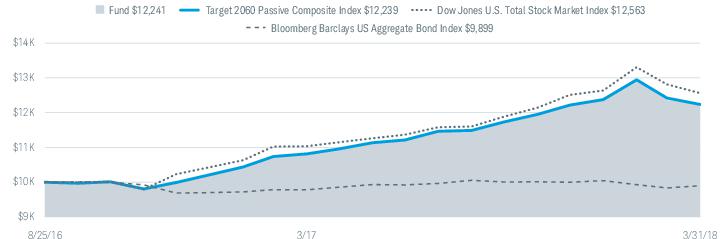
| Schwab Target 2060 Index Fund (8/25/16) | 13.22% | 13.49% |
| Target 2060 Passive Composite Index | 13.15% | 13.49% |
| Dow Jones U.S. Total Stock Market IndexSM | 13.84% | 15.37% |
| Bloomberg Barclays US Aggregate Bond Index | 1.20% | -0.63% |
| Fund Category: Morningstar Target-Date 2060+3 | 13.72% | N/A |
| Fund Expense Ratios4: Net 0.08%; Gross 0.14% | ||
| 1 | Fund expenses may have been partially absorbed by CSIM and its affiliates. Without these reductions, the fund’s returns would have been lower. These returns do not reflect the deduction of taxes that a shareholder would pay on fund distributions or the redemption of fund shares. |
| 2 | On July 24, 2017, the Investor Share class and Institutional Share class of the fund were consolidated into a single class of shares of the fund. The performance and financial history of the fund is that of the fund’s former Institutional Shares. Accordingly, the past performance shown is that of the fund’s former Institutional Shares. |
| 3 | Source for category information: Morningstar, Inc. The Morningstar Category return represents all active and index mutual funds within the category as of the report date. |
| 4 | As stated in the prospectus. Includes 0.06% of acquired fund fees and expenses, which are indirect expenses incurred by the fund through its investments in the underlying funds. Net Expense: Expenses reduced by a contractual fee waiver in effect for so long as CSIM serves as the investment adviser to the fund. Gross Expense: Does not reflect the effect of contractual fee waivers. For actual ratios during the period, refer to the financial highlights section of the financial statements. |
| Number of Holdings | 8 |
| Portfolio Turnover Rate | 19% |
| 1 | The percentage may differ from the Portfolio Holdings because the above calculation is based on a percentage of total investments, whereas the calculation in the Portfolio Holdings is based on a percentage of net assets. |
| 2 | The fund intends to primarily invest in affiliated Schwab ETFs and may also invest in affiliated Schwab and Laudus mutual funds and unaffiliated third party ETFs and mutual funds (all such ETFs and mutual funds referred to as “underlying funds”). |
| 3 | This list is not a recommendation of any security by the investment adviser. |
| 4 | The holdings listed exclude any temporary liquidity investments. |
| Expense Ratio (Annualized)1,2 | Effective Expense Ratio (Annualized)1,3 | Beginning Account Value at 10/1/17 | Ending Account Value (Net of Expenses) at 3/31/18 | Expenses Paid During Period 10/1/17-3/31/182,4 | Effective Expenses Paid During Period 10/1/17-3/31/183,4 | |
| Schwab Target 2010 Index Fund | ||||||
| Actual Return | 0.03% | 0.08% | $1,000.00 | $1,013.70 | $0.15 | $0.40 |
| Hypothetical 5% Return | 0.03% | 0.08% | $1,000.00 | $1,024.75 | $0.15 | $0.40 |
| Schwab Target 2015 Index Fund | ||||||
| Actual Return | 0.03% | 0.08% | $1,000.00 | $1,014.40 | $0.15 | $0.40 |
| Hypothetical 5% Return | 0.03% | 0.08% | $1,000.00 | $1,024.75 | $0.15 | $0.40 |
| Schwab Target 2020 Index Fund | ||||||
| Actual Return | 0.03% | 0.08% | $1,000.00 | $1,020.50 | $0.15 | $0.40 |
| Hypothetical 5% Return | 0.03% | 0.08% | $1,000.00 | $1,024.75 | $0.15 | $0.40 |
| Schwab Target 2025 Index Fund | ||||||
| Actual Return | 0.04% | 0.08% | $1,000.00 | $1,026.10 | $0.20 | $0.40 |
| Hypothetical 5% Return | 0.04% | 0.08% | $1,000.00 | $1,024.70 | $0.20 | $0.40 |
| Schwab Target 2030 Index Fund | ||||||
| Actual Return | 0.04% | 0.08% | $1,000.00 | $1,032.10 | $0.20 | $0.41 |
| Hypothetical 5% Return | 0.04% | 0.08% | $1,000.00 | $1,024.70 | $0.20 | $0.40 |
| Schwab Target 2035 Index Fund | ||||||
| Actual Return | 0.04% | 0.08% | $1,000.00 | $1,034.10 | $0.20 | $0.41 |
| Hypothetical 5% Return | 0.04% | 0.08% | $1,000.00 | $1,024.70 | $0.20 | $0.40 |
| Schwab Target 2040 Index Fund | ||||||
| Actual Return | 0.03% | 0.08% | $1,000.00 | $1,038.30 | $0.15 | $0.41 |
| Hypothetical 5% Return | 0.03% | 0.08% | $1,000.00 | $1,024.75 | $0.15 | $0.40 |
| Schwab Target 2045 Index Fund | ||||||
| Actual Return | 0.03% | 0.08% | $1,000.00 | $1,041.50 | $0.15 | $0.41 |
| Hypothetical 5% Return | 0.03% | 0.08% | $1,000.00 | $1,024.75 | $0.15 | $0.40 |
| Schwab Target 2050 Index Fund | ||||||
| Actual Return | 0.03% | 0.08% | $1,000.00 | $1,043.30 | $0.15 | $0.41 |
| Hypothetical 5% Return | 0.03% | 0.08% | $1,000.00 | $1,024.75 | $0.15 | $0.40 |
| Schwab Target 2055 Index Fund | ||||||
| Actual Return | 0.03% | 0.08% | $1,000.00 | $1,044.40 | $0.15 | $0.41 |
| Hypothetical 5% Return | 0.03% | 0.08% | $1,000.00 | $1,024.75 | $0.15 | $0.40 |
| Schwab Target 2060 Index Fund | ||||||
| Actual Return | 0.03% | 0.08% | $1,000.00 | $1,043.30 | $0.15 | $0.41 |
| Hypothetical 5% Return | 0.03% | 0.08% | $1,000.00 | $1,024.75 | $0.15 | $0.40 |
| 1 | Based on the most recent six-month expense ratio; may differ from the expense ratio provided in the Financial Highlights which covers a 12-month period. |
| 2 | Excludes acquired fund fees and expenses, which are indirect expenses incurred by the fund through its investments in underlying funds. |
| 3 | Includes acquired fund fees and expenses, which are indirect expenses incurred by the fund through its investments in underlying funds. |
| 4 | Expenses for each fund are equal to its annualized expense ratio, multiplied by the average account value over the period, multiplied by the 182 days of the period, and divided by the 365 days of the fiscal year. |
| 4/1/17– 3/31/181 | 8/25/16 2– 3/31/17 | |||||
| Per-Share Data | ||||||
| Net asset value at beginning of period | $10.15 | $10.00 | ||||
| Income (loss) from investment operations: | ||||||
| Net investment income (loss)3 | 0.22 | 0.12 | ||||
| Net realized and unrealized gains (losses) | 0.34 | 0.10 | ||||
| Total from investment operations | 0.56 | 0.22 | ||||
| Less distributions: | ||||||
| Distributions from net investment income | (0.12) | (0.07) | ||||
| Distributions from net realized gains | (0.00) 4 | — | ||||
| Total distributions | (0.12) | (0.07) | ||||
| Net asset value at end of period | $10.59 | $10.15 | ||||
| Total return | 5.57% | 2.26% 5 | ||||
| Ratios/Supplemental Data | ||||||
| Ratios to average net assets: | ||||||
| Net operating expenses6 | 0.03% | 0.02% 7 | ||||
| Gross operating expenses6 | 0.08% | 0.08% 7 | ||||
| Net investment income (loss) | 2.11% | 1.99% 7 | ||||
| Portfolio turnover rate | 28% | 2% 5 | ||||
| Net assets, end of period (x 1,000) | $14,185 | $955 | ||||
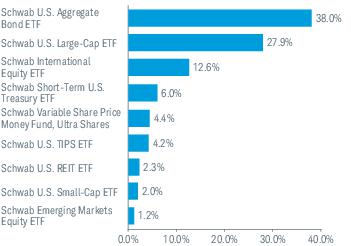
| Security | Number of Shares | Value ($) |
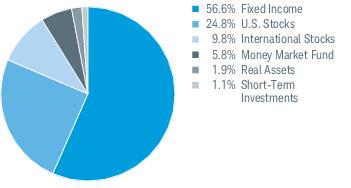
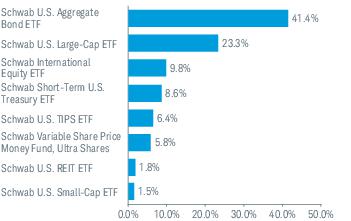
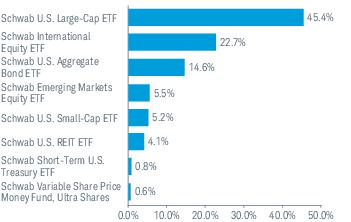
| Affiliated Underlying Funds 98.6% of net assets | ||
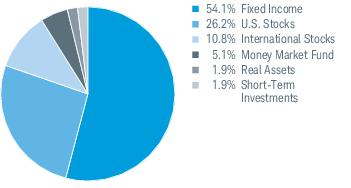
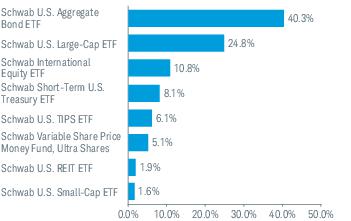
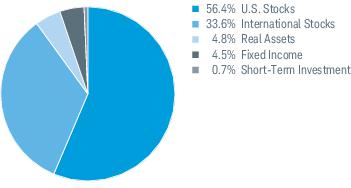
| U.S. Stocks 24.8% | ||
| Large-Cap 23.3% | ||
| Schwab U.S. Large-Cap ETF | 52,422 | 3,306,780 |
| Small-Cap 1.5% | ||
| Schwab U.S. Small-Cap ETF | 2,960 | 204,625 |
| 3,511,405 | ||
| International Stock 9.8% | ||
| Developed-Market Large-Cap 9.8% | ||
| Schwab International Equity ETF | 41,250 | 1,390,537 |
| Real Assets 1.8% | ||
| Real Estate 1.8% | ||
| Schwab U.S. REIT ETF | 6,822 | 260,942 |
| Fixed Income 56.4% | ||
| Inflation-Protected Bond 6.4% | ||
| Schwab U.S. TIPS ETF | 16,444 | 902,447 |
| Intermediate-Term Bond 41.4% | ||
| Schwab U.S. Aggregate Bond ETF | 115,205 | 5,877,759 |
| Treasury Bond 8.6% | ||
| Schwab Short-Term U.S. Treasury ETF | 24,566 | 1,224,369 |
| 8,004,575 | ||
| Security | Number of Shares | Value ($) |
| Money Market Fund 5.8% | ||
| Schwab Variable Share Price Money Fund, Ultra Shares 1.73% (a) | 820,069 | 820,069 |
| Total Affiliated Underlying Funds | ||
| (Cost $13,804,134) | 13,987,528 | |
| Issuer Rate, Maturity Date | Face Amount ($) | Value ($) |
| Short-Term Investments 1.1% of net assets | ||
| Time Deposits 1.1% | ||
| BNP Paribas | ||
| 1.05%, 04/02/18 (b) | 135,572 | 135,572 |
| Brown Brothers Harriman | ||
| 1.05%, 04/02/18 (b) | 16,885 | 16,885 |
| Total Short-Term Investments | ||
| (Cost $152,457) | 152,457 | |
| (a) | The rate shown is the 7-day yield. |
| (b) | The rate shown is the current daily overnight rate. |
| ETF — | Exchange-traded fund |
| REIT — | Real Estate Investment Trust |
| TIPS — | Treasury Inflation Protected Securities |
| Affiliated Underlying Funds | Balance of Shares Held at 03/31/17 | Gross Purchases | Gross Sales | Balance of Shares Held at 03/31/18 | Net Change in Unrealized Appreciation (depreciation) | Realized Gains (Losses) | Distributions Received* |
| Schwab International Equity ETF | 11,460 | 35,949 | (6,159) | 41,250 | $52,898 | $627 | $24,641 |
| Schwab Short-Term U.S. Treasury ETF | 6,099 | 21,614 | (3,147) | 24,566 | (10,404) | (1,376) | 8,324 |
| Schwab U.S. Aggregate Bond ETF | 28,675 | 102,546 | (16,016) | 115,205 | (102,168) | (11,518) | 80,345 |
| Schwab U.S. Large-Cap ETF | 16,013 | 47,539 | (11,130) | 52,422 | 204,170 | 5,449 | 40,576 |
| Schwab U.S. REIT ETF | 922 | 5,900 | — | 6,822 | (13,319) | — | 3,402 |
| Schwab U.S. Small-Cap ETF | 936 | 2,125 | (101) | 2,960 | 11,894 | 45 | 1,991 |
| Schwab U.S. TIPS ETF | 4,102 | 14,427 | (2,085) | 16,444 | (6,695) | (1,651) | 9,457 |
| Schwab Variable Share Price Money Fund, Ultra Shares | 106,157 | 973,840 | (259,928) | 820,069 | (165) | (12) | 4,647 |
| Total | $136,211 | ($8,436) | $173,383 |
| * | Distributions received include distributions from net investment income and capital gains, if any, from the underlying funds. |
| Description | Quoted Prices in Active Markets for Identical Assets (Level 1) | Other Significant Observable Inputs (Level 2) | Significant Unobservable Inputs (Level 3) | Total | |
| Assets | |||||
| Affiliated Underlying Funds1 | $13,987,528 | $— | $— | $13,987,528 | |
| Short-Term Investments1 | — | 152,457 | — | 152,457 | |
| Total | $13,987,528 | $152,457 | $— | $14,139,985 |
| 1 | As categorized in Portfolio Holdings. |
| Assets | ||
| Investments in affiliated underlying funds, at value (cost $13,804,134) | $13,987,528 | |
| Investments in unaffiliated issuers, at value (cost $152,457) | 152,457 | |
| Receivables: | ||
| Fund shares sold | 627,463 | |
| Dividends | 633 | |
| Interest | + | 13 |
| Total assets | 14,768,094 | |
| Liabilities | ||
| Payables: | ||
| Investments bought | 583,173 | |
| Investment adviser fees | + | 318 |
| Total liabilities | 583,491 | |
| Net Assets | ||
| Total assets | 14,768,094 | |
| Total liabilities | – | 583,491 |
| Net assets | $14,184,603 | |
| Net Assets by Source | ||
| Capital received from investors | 13,967,031 | |
| Net investment income not yet distributed | 51,052 | |
| Net realized capital losses | (16,874) | |
| Net unrealized capital appreciation | 183,394 | |
| Net Asset Value (NAV) | ||||
| Net Assets | ÷ | Shares Outstanding | = | NAV |
| $14,184,603 | 1,339,419 | $10.59 | ||
| Investment Income | ||
| Dividends received from affiliated underlying funds | $173,383 | |
| Interest | + | 1,493 |
| Total investment income | 174,876 | |
| Expenses | ||
| Investment adviser and administrator fees | 6,635 | |
| Shareholder service fees: | ||
| Investor Shares1 | + | 204 |
| Total expenses | 6,839 | |
| Expense reduction by CSIM | – | 3,973 |
| Net expenses | – | 2,866 |
| Net investment income | 172,010 | |
| Realized and Unrealized Gains (Losses) | ||
| Net realized losses on sales of affiliated underlying funds | (8,436) | |
| Net change in unrealized appreciation (depreciation) on affiliated underlying funds | + | 136,211 |
| Net realized and unrealized gains | 127,775 | |
| Increase in net assets resulting from operations | $299,785 | |
| 1 | Effective July 24, 2017, the Investor Share class was consolidated into the Institutional Share class, resulting in a single class of shares of the fund (see financial note 1). |
| Operations | ||||
| 4/1/17-3/31/18 | 8/25/16*-3/31/17 | |||
| Net investment income | $172,010 | $17,407 | ||
| Net realized losses | (8,436) | (319) | ||
| Net change in unrealized appreciation (depreciation) | + | 136,211 | 47,183 | |
| Increase in net assets from operations | 299,785 | 64,271 | ||
| Distributions to Shareholders1 | ||||
| Distributions from net investment income | ||||
| Investor Shares | — | (10,172) | ||
| Institutional Shares | + | (134,173) | (742) | |
| Total distributions from net investment income | (134,173) | (10,914) | ||
| Distributions from net realized gains | ||||
| Investor Shares | — | — | ||
| Institutional Shares | + | (1,397) | — | |
| Total distributions from net realized gains | (1,397) | — | ||
| Total distributions | ($135,570) | ($10,914) | ||
| Transactions in Fund Shares1 | ||||||||
| 4/1/17-3/31/18 | 8/25/16*-3/31/17 | |||||||
| SHARES | VALUE | SHARES | VALUE | |||||
| Shares Sold | ||||||||
| Investor Shares | 1,772 | $18,525 | 267,894 | $2,668,599 | ||||
| Institutional Shares | + | 1,491,874 | 15,732,146 | 94,015 | 951,351 | |||
| Total shares sold | 1,493,646 | $15,750,671 | 361,909 | $3,619,950 | ||||
| Shares Reinvested | ||||||||
| Investor Shares | — | $— | 1,030 | $10,172 | ||||
| Institutional Shares | + | 12,301 | 131,502 | 75 | 742 | |||
| Total shares reinvested | 12,301 | $131,502 | 1,105 | $10,914 | ||||
| Shares Redeemed | ||||||||
| Investor Shares | (267,381) | ($2,752,301) | (3,315) | ($33,293) | ||||
| Institutional Shares | + | (258,845) | (2,760,402) | (1) | (10) | |||
| Total shares redeemed | (526,226) | ($5,512,703) | (3,316) | ($33,303) | ||||
| Net transactions in fund shares | 979,721 | $10,369,470 | 359,698 | $3,597,561 | ||||
| Shares Outstanding and Net Assets | ||||||||
| 4/1/17-3/31/18 | 8/25/16*-3/31/17 | |||||||
| SHARES | NET ASSETS | SHARES | NET ASSETS | |||||
| Beginning of period | 359,698 | $3,650,918 | — | $— | ||||
| Total increase | + | 979,721 | 10,533,685 | 359,698 | 3,650,918 | |||
| End of period | 1,339,419 | $14,184,603 | 359,698 | $3,650,918 | ||||
| Net investment income not yet distributed | $51,052 | $6,493 | ||||||
| * | Commencement of operations. |
| 1 | Effective July 24, 2017, there were no outstanding Investor Shares and the Investor Share class was consolidated into the Institutional Share class, resulting in a single class of shares of the fund (see financial note 1). |
| 4/1/17– 3/31/181 | 8/25/16 2– 3/31/17 | |||||
| Per-Share Data | ||||||
| Net asset value at beginning of period | $10.17 | $10.00 | ||||
| Income (loss) from investment operations: | ||||||
| Net investment income (loss)3 | 0.22 | 0.13 | ||||
| Net realized and unrealized gains (losses) | 0.38 | 0.12 | ||||
| Total from investment operations | 0.60 | 0.25 | ||||
| Less distributions: | ||||||
| Distributions from net investment income | (0.15) | (0.08) | ||||
| Distributions from net realized gains | (0.01) | — | ||||
| Total distributions | (0.16) | (0.08) | ||||
| Net asset value at end of period | $10.61 | $10.17 | ||||
| Total return | 5.83% | 2.49% 4 | ||||
| Ratios/Supplemental Data | ||||||
| Ratios to average net assets: | ||||||
| Net operating expenses5 | 0.03% | 0.02% 6 | ||||
| Gross operating expenses5 | 0.08% | 0.08% 6 | ||||
| Net investment income (loss) | 2.06% | 2.15% 6 | ||||
| Portfolio turnover rate | 47% | 15% 4 | ||||
| Net assets, end of period (x 1,000) | $20,229 | $797 | ||||
| Security | Number of Shares | Value ($) |
| Affiliated Underlying Funds 98.7% of net assets | ||
| U.S. Stocks 26.4% | ||
| Large-Cap 24.8% | ||
| Schwab U.S. Large-Cap ETF | 79,509 | 5,015,428 |
| Small-Cap 1.6% | ||
| Schwab U.S. Small-Cap ETF | 4,561 | 315,302 |
| 5,330,730 | ||
| International Stock 10.8% | ||
| Developed-Market Large-Cap 10.8% | ||
| Schwab International Equity ETF | 64,837 | 2,185,655 |
| Real Assets 1.9% | ||
| Real Estate 1.9% | ||
| Schwab U.S. REIT ETF | 10,250 | 392,063 |
| Fixed Income 54.5% | ||
| Inflation-Protected Bond 6.1% | ||
| Schwab U.S. TIPS ETF | 22,373 | 1,227,830 |
| Intermediate-Term Bond 40.3% | ||
| Schwab U.S. Aggregate Bond ETF | 159,635 | 8,144,578 |
| Treasury Bond 8.1% | ||
| Schwab Short-Term U.S. Treasury ETF | 32,941 | 1,641,779 |
| 11,014,187 | ||
| Security | Number of Shares | Value ($) |
| Money Market Fund 5.1% | ||
| Schwab Variable Share Price Money Fund, Ultra Shares 1.73% (a) | 1,033,458 | 1,033,458 |
| Total Affiliated Underlying Funds | ||
| (Cost $19,652,712) | 19,956,093 | |
| Issuer Rate, Maturity Date | Face Amount ($) | Value ($) |
| Short-Term Investments 1.9% of net assets | ||
| Time Deposits 1.9% | ||
| BNP Paribas | ||
| 1.05%, 04/02/18 (b) | 203,084 | 203,084 |
| Citibank | ||
| 1.05%, 04/02/18 (b) | 183,349 | 183,349 |
| Total Short-Term Investments | ||
| (Cost $386,433) | 386,433 | |
| (a) | The rate shown is the 7-day yield. |
| (b) | The rate shown is the current daily overnight rate. |
| ETF — | Exchange-traded fund |
| REIT — | Real Estate Investment Trust |
| TIPS — | Treasury Inflation Protected Securities |
| Affiliated Underlying Funds | Balance of Shares Held at 03/31/17 | Gross Purchases | Gross Sales | Balance of Shares Held at 03/31/18 | Net Change in Unrealized Appreciation (depreciation) | Realized Gains (Losses) | Distributions Received* |
| Schwab International Equity ETF | 19,044 | 61,898 | (16,105) | 64,837 | $73,904 | ($4,216) | $31,549 |
| Schwab Short-Term U.S. Treasury ETF | 9,013 | 30,039 | (6,111) | 32,941 | (10,069) | (2,453) | 10,383 |
| Schwab U.S. Aggregate Bond ETF | 43,640 | 148,666 | (32,671) | 159,635 | (92,443) | (35,559) | 103,902 |
| Schwab U.S. Large-Cap ETF | 26,384 | 78,547 | (25,422) | 79,509 | 245,993 | (826) | 54,297 |
| Schwab U.S. REIT ETF | 1,536 | 9,544 | (830) | 10,250 | (15,248) | (3,032) | 4,551 |
| Schwab U.S. Small-Cap ETF | 1,626 | 3,607 | (672) | 4,561 | 13,081 | (367) | 2,710 |
| Schwab U.S. TIPS ETF | 6,193 | 20,361 | (4,181) | 22,373 | (4,221) | (3,981) | 11,565 |
| Schwab Variable Share Price Money Fund, Ultra Shares | 200,351 | 1,593,727 | (760,620) | 1,033,458 | (109) | (101) | 4,562 |
| Total | $210,888 | ($50,535) | $223,519 |
| * | Distributions received include distributions from net investment income and capital gains, if any, from the underlying funds. |
| Description | Quoted Prices in Active Markets for Identical Assets (Level 1) | Other Significant Observable Inputs (Level 2) | Significant Unobservable Inputs (Level 3) | Total | |
| Assets | |||||
| Affiliated Underlying Funds1 | $19,956,093 | $— | $— | $19,956,093 | |
| Short-Term Investments1 | — | 386,433 | — | 386,433 | |
| Total | $19,956,093 | $386,433 | $— | $20,342,526 |
| 1 | As categorized in Portfolio Holdings. |
| Assets | ||
| Investments in affiliated underlying funds, at value (cost $19,652,712) | $19,956,093 | |
| Investments in unaffiliated issuers, at value (cost $386,433) | 386,433 | |
| Receivables: | ||
| Fund shares sold | 36,582 | |
| Dividends | 580 | |
| Interest | + | 22 |
| Total assets | 20,379,710 | |
| Liabilities | ||
| Payables: | ||
| Investments bought | 63,635 | |
| Investment adviser fees | 544 | |
| Fund shares redeemed | + | 86,289 |
| Total liabilities | 150,468 | |
| Net Assets | ||
| Total assets | 20,379,710 | |
| Total liabilities | – | 150,468 |
| Net assets | $20,229,242 | |
| Net Assets by Source | ||
| Capital received from investors | 19,937,071 | |
| Net investment income not yet distributed | 58,482 | |
| Net realized capital losses | (69,692) | |
| Net unrealized capital appreciation | 303,381 | |
| Net Asset Value (NAV) | ||||
| Net Assets | ÷ | Shares Outstanding | = | NAV |
| $20,229,242 | 1,906,591 | $10.61 | ||
| Investment Income | ||
| Dividends received from affiliated underlying funds | $223,519 | |
| Interest | + | 2,590 |
| Total investment income | 226,109 | |
| Expenses | ||
| Investment adviser and administrator fees | 8,832 | |
| Shareholder service fees: | ||
| Investor Shares1 | + | 347 |
| Total expenses | 9,179 | |
| Expense reduction by CSIM | – | 5,104 |
| Net expenses | – | 4,075 |
| Net investment income | 222,034 | |
| Realized and Unrealized Gains (Losses) | ||
| Net realized losses on sales of affiliated underlying funds | (50,535) | |
| Net change in unrealized appreciation (depreciation) on affiliated underlying funds | + | 210,888 |
| Net realized and unrealized gains | 160,353 | |
| Increase in net assets resulting from operations | $382,387 | |
| 1 | Effective July 24, 2017, the Investor Share class was consolidated into the Institutional Share class, resulting in a single class of shares of the fund (see financial note 1). |
| Operations | ||||
| 4/1/17-3/31/18 | 8/25/16*-3/31/17 | |||
| Net investment income | $222,034 | $37,878 | ||
| Net realized losses | (50,535) | (7,187) | ||
| Net change in unrealized appreciation (depreciation) | + | 210,888 | 92,493 | |
| Increase in net assets from operations | 382,387 | 123,184 | ||
| Distributions to Shareholders1 | ||||
| Distributions from net investment income | ||||
| Investor Shares | — | (23,959) | ||
| Institutional Shares | + | (178,617) | (771) | |
| Total distributions from net investment income | (178,617) | (24,730) | ||
| Distributions from net realized gains | ||||
| Investor Shares | — | — | ||
| Institutional Shares | + | (10,053) | — | |
| Total distributions from net realized gains | (10,053) | — | ||
| Total distributions | ($188,670) | ($24,730) | ||
| Transactions in Fund Shares1 | ||||||||
| 4/1/17-3/31/18 | 8/25/16*-3/31/17 | |||||||
| SHARES | VALUE | SHARES | VALUE | |||||
| Shares Sold | ||||||||
| Investor Shares | 2,735 | $29,447 | 587,984 | $5,884,658 | ||||
| Institutional Shares | + | 2,377,325 | 25,104,047 | 78,248 | 792,672 | |||
| Total shares sold | 2,380,060 | $25,133,494 | 666,232 | $6,677,330 | ||||
| Shares Reinvested | ||||||||
| Investor Shares | — | $— | 2,350 | $23,249 | ||||
| Institutional Shares | + | 17,169 | 183,880 | 78 | 771 | |||
| Total shares reinvested | 17,169 | $183,880 | 2,428 | $24,020 | ||||
| Shares Redeemed | ||||||||
| Investor Shares | (481,541) | ($4,967,260) | (111,528) | ($1,131,266) | ||||
| Institutional Shares | + | (566,228) | (5,983,115) | (1) | (12) | |||
| Total shares redeemed | (1,047,769) | ($10,950,375) | (111,529) | ($1,131,278) | ||||
| Net transactions in fund shares | 1,349,460 | $14,366,999 | 557,131 | $5,570,072 | ||||
| Shares Outstanding and Net Assets | ||||||||
| 4/1/17-3/31/18 | 8/25/16*-3/31/17 | |||||||
| SHARES | NET ASSETS | SHARES | NET ASSETS | |||||
| Beginning of period | 557,131 | $5,668,526 | — | $— | ||||
| Total increase | + | 1,349,460 | 14,560,716 | 557,131 | 5,668,526 | |||
| End of period | 1,906,591 | $20,229,242 | 557,131 | $5,668,526 | ||||
| Net investment income not yet distributed | $58,482 | $13,148 | ||||||
| * | Commencement of operations. |
| 1 | Effective July 24, 2017, all outstanding Investor Shares (23,628 shares valued at $247,966) were consolidated into the Institutional Shares, resulting in a single class of shares of the fund (see financial note 1). |
| 4/1/17– 3/31/181 | 8/25/16 2– 3/31/17 | |||||
| Per-Share Data | ||||||
| Net asset value at beginning of period | $10.30 | $10.00 | ||||
| Income (loss) from investment operations: | ||||||
| Net investment income (loss)3 | 0.23 | 0.16 | ||||
| Net realized and unrealized gains (losses) | 0.52 | 0.21 | ||||
| Total from investment operations | 0.75 | 0.37 | ||||
| Less distributions: | ||||||
| Distributions from net investment income | (0.13) | (0.07) | ||||
| Distributions from net realized gains | (0.00) 4 | — | ||||
| Total distributions | (0.13) | (0.07) | ||||
| Net asset value at end of period | $10.92 | $10.30 | ||||
| Total return | 7.30% | 3.69% 5 | ||||
| Ratios/Supplemental Data | ||||||
| Ratios to average net assets: | ||||||
| Net operating expenses6 | 0.03% | 0.03% 7 | ||||
| Gross operating expenses6 | 0.08% | 0.08% 7 | ||||
| Net investment income (loss) | 2.15% | 2.68% 7 | ||||
| Portfolio turnover rate | 21% | 17% 5 | ||||
| Net assets, end of period (x 1,000) | $70,841 | $5,455 | ||||
| Security | Number of Shares | Value ($) |
| Affiliated Underlying Funds 98.6% of net assets | ||
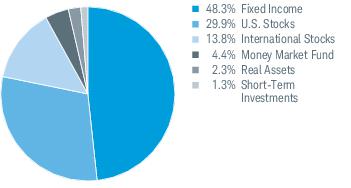
| U.S. Stocks 29.9% | ||
| Large-Cap 27.9% | ||
| Schwab U.S. Large-Cap ETF | 313,673 | 19,786,493 |
| Small-Cap 2.0% | ||
| Schwab U.S. Small-Cap ETF | 20,125 | 1,391,241 |
| 21,177,734 | ||
| International Stocks 13.8% | ||
| Developed-Market Large-Cap 12.6% | ||
| Schwab International Equity ETF | 264,485 | 8,915,789 |
| Emerging-Market 1.2% | ||
| Schwab Emerging Markets Equity ETF | 29,508 | 846,880 |
| 9,762,669 | ||
| Real Assets 2.3% | ||
| Real Estate 2.3% | ||
| Schwab U.S. REIT ETF | 43,224 | 1,653,318 |
| Fixed Income 48.2% | ||
| Inflation-Protected Bond 4.2% | ||
| Schwab U.S. TIPS ETF | 54,639 | 2,998,588 |
| Intermediate-Term Bond 38.0% | ||
| Schwab U.S. Aggregate Bond ETF | 527,041 | 26,889,632 |
| Treasury Bond 6.0% | ||
| Schwab Short-Term U.S. Treasury ETF | 86,024 | 4,287,436 |
| 34,175,656 | ||
| Security | Number of Shares | Value ($) |
| Money Market Fund 4.4% | ||
| Schwab Variable Share Price Money Fund, Ultra Shares 1.73% (a) | 3,106,284 | 3,106,284 |
| Total Affiliated Underlying Funds | ||
| (Cost $68,905,561) | 69,875,661 | |
| Issuer Rate, Maturity Date | Face Amount ($) | Value ($) |
| Short-Term Investments 1.4% of net assets | ||
| Time Deposits 1.4% | ||
| BNP Paribas | ||
| 1.05%, 04/02/18 (b) | 708,096 | 708,096 |
| Citibank | ||
| 1.05%, 04/02/18 (b) | 243,960 | 243,960 |
| Total Short-Term Investments | ||
| (Cost $952,056) | 952,056 | |
| (a) | The rate shown is the 7-day yield. |
| (b) | The rate shown is the current daily overnight rate. |
| ETF — | Exchange-traded fund |
| REIT — | Real Estate Investment Trust |
| TIPS — | Treasury Inflation Protected Securities |
| Affiliated Underlying Funds | Balance of Shares Held at 03/31/17 | Gross Purchases | Gross Sales | Balance of Shares Held at 03/31/18 | Net Change in Unrealized Appreciation (depreciation) | Realized Gains (Losses) | Distributions Received* |
| Schwab Emerging Markets Equity ETF | 4,127 | 25,854 | (473) | 29,508 | $16,006 | ($994) | $8,694 |
| Schwab International Equity ETF | 58,705 | 226,612 | (20,832) | 264,485 | 275,355 | (11,276) | 149,157 |
| Schwab Short-Term U.S. Treasury ETF | 14,493 | 75,323 | (3,792) | 86,024 | (28,005) | (2,641) | 23,886 |
| Schwab U.S. Aggregate Bond ETF | 95,329 | 460,273 | (28,561) | 527,041 | (427,964) | (41,479) | 312,965 |
| Schwab U.S. Large-Cap ETF | 75,839 | 297,533 | (59,699) | 313,673 | 959,314 | 45,403 | 218,255 |
| Schwab U.S. REIT ETF | 4,730 | 39,319 | (825) | 43,224 | (79,597) | (3,619) | 19,424 |
| Schwab U.S. Small-Cap ETF | 5,041 | 18,492 | (3,408) | 20,125 | 62,715 | (1,283) | 12,076 |
| Schwab U.S. TIPS ETF | 8,507 | 47,541 | (1,409) | 54,639 | (16,490) | (1,989) | 21,544 |
| Schwab Variable Share Price Money Fund, Ultra Shares | 257,260 | 3,648,944 | (799,920) | 3,106,284 | (431) | (160) | 13,636 |
| Total | $760,903 | ($18,038) | $779,637 |
| * | Distributions received include distributions from net investment income and capital gains, if any, from the underlying funds. |
| Description | Quoted Prices in Active Markets for Identical Assets (Level 1) | Other Significant Observable Inputs (Level 2) | Significant Unobservable Inputs (Level 3) | Total | |
| Assets | |||||
| Affiliated Underlying Funds1 | $69,875,661 | $— | $— | $69,875,661 | |
| Short-Term Investments1 | — | 952,056 | — | 952,056 | |
| Total | $69,875,661 | $952,056 | $— | $70,827,717 |
| 1 | As categorized in Portfolio Holdings. |
| Assets | ||
| Investments in affiliated underlying funds, at value (cost $68,905,561) | $69,875,661 | |
| Investments in unaffiliated issuers, at value (cost $952,056) | 952,056 | |
| Receivables: | ||
| Fund shares sold | 279,909 | |
| Dividends | 2,200 | |
| Interest | + | 83 |
| Total assets | 71,109,909 | |
| Liabilities | ||
| Payables: | ||
| Investments bought | 233,459 | |
| Investment adviser fees | 1,735 | |
| Fund shares redeemed | + | 33,312 |
| Total liabilities | 268,506 | |
| Net Assets | ||
| Total assets | 71,109,909 | |
| Total liabilities | – | 268,506 |
| Net assets | $70,841,403 | |
| Net Assets by Source | ||
| Capital received from investors | 69,695,315 | |
| Net investment income not yet distributed | 275,138 | |
| Net realized capital losses | (99,150) | |
| Net unrealized capital appreciation | 970,100 | |
| Net Asset Value (NAV) | ||||
| Net Assets | ÷ | Shares Outstanding | = | NAV |
| $70,841,403 | 6,485,215 | $10.92 | ||
| Investment Income | ||
| Dividends received from affiliated underlying funds | $779,637 | |
| Interest | + | 6,900 |
| Total investment income | 786,537 | |
| Expenses | ||
| Investment adviser and administrator fees | 29,234 | |
| Shareholder service fees: | ||
| Investor Shares1 | + | 600 |
| Total expenses | 29,834 | |
| Expense reduction by CSIM and its affiliates | – | 16,781 |
| Net expenses | – | 13,053 |
| Net investment income | 773,484 | |
| Realized and Unrealized Gains (Losses) | ||
| Net realized losses on sales of affiliated underlying funds | (18,038) | |
| Net change in unrealized appreciation (depreciation) on affiliated underlying funds | + | 760,903 |
| Net realized and unrealized gains | 742,865 | |
| Increase in net assets resulting from operations | $1,516,349 | |
| 1 | Effective July 24, 2017, the Investor Share class was consolidated into the Institutional Share class, resulting in a single class of shares of the fund (see financial note 1). |
| Operations | ||||
| 4/1/17-3/31/18 | 8/25/16*-3/31/17 | |||
| Net investment income | $773,484 | $56,207 | ||
| Net realized losses | (18,038) | (12,290) | ||
| Net change in unrealized appreciation (depreciation) | + | 760,903 | 209,197 | |
| Increase in net assets from operations | 1,516,349 | 253,114 | ||
| Distributions to Shareholders1 | ||||
| Distributions from net investment income | ||||
| Investor Shares | — | (24,391) | ||
| Institutional Shares | + | (590,557) | (5,755) | |
| Total distributions from net investment income | (590,557) | (30,146) | ||
| Distributions from net realized gains | ||||
| Investor Shares | — | — | ||
| Institutional Shares | + | (2,672) | — | |
| Total distributions from net realized gains | (2,672) | — | ||
| Total distributions | ($593,229) | ($30,146) | ||
| Transactions in Fund Shares1 | ||||||||
| 4/1/17-3/31/18 | 8/25/16*-3/31/17 | |||||||
| SHARES | VALUE | SHARES | VALUE | |||||
| Shares Sold | ||||||||
| Investor Shares | 57,291 | $591,174 | 917,276 | $9,234,087 | ||||
| Institutional Shares | + | 7,178,794 | 77,999,442 | 532,580 | 5,445,182 | |||
| Total shares sold | 7,236,085 | $78,590,616 | 1,449,856 | $14,679,269 | ||||
| Shares Reinvested | ||||||||
| Investor Shares | — | $— | 2,358 | $23,440 | ||||
| Institutional Shares | + | 52,267 | 575,987 | 578 | 5,755 | |||
| Total shares reinvested | 52,267 | $575,987 | 2,936 | $29,195 | ||||
| Shares Redeemed | ||||||||
| Investor Shares | (839,148) | ($8,769,109) | (137,777) | ($1,396,262) | ||||
| Institutional Shares | + | (1,275,631) | (13,980,383) | (3,373) | (33,998) | |||
| Total shares redeemed | (2,114,779) | ($22,749,492) | (141,150) | ($1,430,260) | ||||
| Net transactions in fund shares | 5,173,573 | $56,417,111 | 1,311,642 | $13,278,204 | ||||
| Shares Outstanding and Net Assets | ||||||||
| 4/1/17-3/31/18 | 8/25/16*-3/31/17 | |||||||
| SHARES | NET ASSETS | SHARES | NET ASSETS | |||||
| Beginning of period | 1,311,642 | $13,501,172 | — | $— | ||||
| Total increase | + | 5,173,573 | 57,340,231 | 1,311,642 | 13,501,172 | |||
| End of period | 6,485,215 | $70,841,403 | 1,311,642 | $13,501,172 | ||||
| Net investment income not yet distributed | $275,138 | $26,061 | ||||||
| * | Commencement of operations. |
| 1 | Effective July 24, 2017, all outstanding Investor Shares (20,500 shares valued at $218,839) were consolidated into the Institutional Shares, resulting in a single class of shares of the fund (see financial note 1). |
| 4/1/17– 3/31/181 | 8/25/16 2– 3/31/17 | |||||
| Per-Share Data | ||||||
| Net asset value at beginning of period | $10.40 | $10.00 | ||||
| Income (loss) from investment operations: | ||||||
| Net investment income (loss)3 | 0.25 | 0.14 | ||||
| Net realized and unrealized gains (losses) | 0.68 | 0.34 | ||||
| Total from investment operations | 0.93 | 0.48 | ||||
| Less distributions: | ||||||
| Distributions from net investment income | (0.15) | (0.08) | ||||
| Distributions from net realized gains | (0.00) 4 | — | ||||
| Total distributions | (0.15) | (0.08) | ||||
| Net asset value at end of period | $11.18 | $10.40 | ||||
| Total return | 8.93% | 4.82% 5 | ||||
| Ratios/Supplemental Data | ||||||
| Ratios to average net assets: | ||||||
| Net operating expenses6 | 0.04% | 0.03% 7 | ||||
| Gross operating expenses6 | 0.08% | 0.08% 7 | ||||
| Net investment income (loss) | 2.22% | 2.41% 7 | ||||
| Portfolio turnover rate | 14% | 6% 5 | ||||
| Net assets, end of period (x 1,000) | $84,235 | $1,649 | ||||
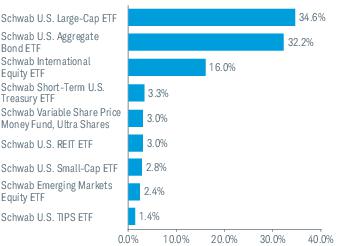
| Security | Number of Shares | Value ($) |
| Affiliated Underlying Funds 98.7% of net assets | ||
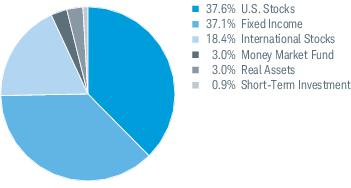
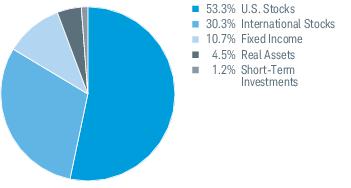
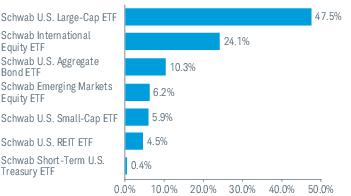
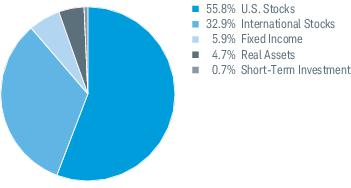
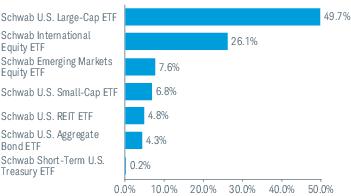
| U.S. Stocks 37.4% | ||
| Large-Cap 34.6% | ||
| Schwab U.S. Large-Cap ETF | 462,658 | 29,184,467 |
| Small-Cap 2.8% | ||
| Schwab U.S. Small-Cap ETF | 34,018 | 2,351,664 |
| 31,536,131 | ||
| International Stocks 18.4% | ||
| Developed-Market Large-Cap 16.0% | ||
| Schwab International Equity ETF | 400,683 | 13,507,024 |
| Emerging-Market 2.4% | ||
| Schwab Emerging Markets Equity ETF | 68,852 | 1,976,052 |
| 15,483,076 | ||
| Real Assets 3.0% | ||
| Real Estate 3.0% | ||
| Schwab U.S. REIT ETF | 65,882 | 2,519,987 |
| Fixed Income 36.9% | ||
| Inflation-Protected Bond 1.4% | ||
| Schwab U.S. TIPS ETF | 21,465 | 1,177,999 |
| Intermediate-Term Bond 32.2% | ||
| Schwab U.S. Aggregate Bond ETF | 532,374 | 27,161,721 |
| Security | Number of Shares | Value ($) |
| Treasury Bond 3.3% | ||
| Schwab Short-Term U.S. Treasury ETF | 55,539 | 2,768,064 |
| 31,107,784 | ||
| Money Market Fund 3.0% | ||
| Schwab Variable Share Price Money Fund, Ultra Shares 1.73% (a) | 2,549,930 | 2,549,930 |
| Total Affiliated Underlying Funds | ||
| (Cost $81,118,425) | 83,196,908 | |
| Issuer Rate, Maturity Date | Face Amount ($) | Value ($) |
| Short-Term Investment 0.9% of net assets | ||
| Time Deposit 0.9% | ||
| BNP Paribas | ||
| 1.05%, 04/02/18 (b) | 738,785 | 738,785 |
| Total Short-Term Investment | ||
| (Cost $738,785) | 738,785 | |
| (a) | The rate shown is the 7-day yield. |
| (b) | The rate shown is the current daily overnight rate. |
| ETF — | Exchange-traded fund |
| REIT — | Real Estate Investment Trust |
| TIPS — | Treasury Inflation Protected Securities |
| Affiliated Underlying Funds | Balance of Shares Held at 03/31/17 | Gross Purchases | Gross Sales | Balance of Shares Held at 03/31/18 | Net Change in Unrealized Appreciation (depreciation) | Realized Gains (Losses) | Distributions Received* |
| Schwab Emerging Markets Equity ETF | 10,610 | 58,242 | — | 68,852 | $38,665 | $— | $19,403 |
| Schwab International Equity ETF | 103,686 | 316,491 | (19,494) | 400,683 | 490,415 | (13,704) | 229,902 |
| Schwab Short-Term U.S. Treasury ETF | 10,631 | 45,726 | (818) | 55,539 | (21,357) | (308) | 16,925 |
| Schwab U.S. Aggregate Bond ETF | 112,471 | 446,993 | (27,090) | 532,374 | (454,254) | (45,492) | 349,302 |
| Schwab U.S. Large-Cap ETF | 127,975 | 401,614 | (66,931) | 462,658 | 1,570,973 | 40,865 | 346,277 |
| Schwab U.S. REIT ETF | 8,164 | 58,610 | (892) | 65,882 | (130,955) | (1,122) | 32,343 |
| Schwab U.S. Small-Cap ETF | 9,550 | 28,443 | (3,975) | 34,018 | 119,115 | 1,106 | 21,851 |
| Schwab U.S. TIPS ETF | 3,494 | 17,971 | — | 21,465 | (7,941) | — | 8,778 |
| Schwab Variable Share Price Money Fund, Ultra Shares | 250,310 | 2,299,620 | — | 2,549,930 | (473) | — | 11,887 |
| Total | $1,604,188 | ($18,655) | $1,036,668 |
| * | Distributions received include distributions from net investment income and capital gains, if any, from the underlying funds. |
| Description | Quoted Prices in Active Markets for Identical Assets (Level 1) | Other Significant Observable Inputs (Level 2) | Significant Unobservable Inputs (Level 3) | Total | |
| Assets | |||||
| Affiliated Underlying Funds1 | $83,196,908 | $— | $— | $83,196,908 | |
| Short-Term Investment1 | — | 738,785 | — | 738,785 | |
| Total | $83,196,908 | $738,785 | $— | $83,935,693 |
| 1 | As categorized in Portfolio Holdings. |
| Assets | ||
| Investments in affiliated underlying funds, at value (cost $81,118,425) | $83,196,908 | |
| Investments in unaffiliated issuers, at value (cost $738,785) | 738,785 | |
| Receivables: | ||
| Investments sold | 250,043 | |
| Fund shares sold | 301,770 | |
| Dividends | 1,968 | |
| Interest | + | 64 |
| Total assets | 84,489,538 | |
| Liabilities | ||
| Payables: | ||
| Investments bought | 248,724 | |
| Investment adviser fees | 2,235 | |
| Fund shares redeemed | + | 4,008 |
| Total liabilities | 254,967 | |
| Net Assets | ||
| Total assets | 84,489,538 | |
| Total liabilities | – | 254,967 |
| Net assets | $84,234,571 | |
| Net Assets by Source | ||
| Capital received from investors | 81,913,874 | |
| Net investment income not yet distributed | 322,596 | |
| Net realized capital losses | (80,382) | |
| Net unrealized capital appreciation | 2,078,483 | |
| Net Asset Value (NAV) | ||||
| Net Assets | ÷ | Shares Outstanding | = | NAV |
| $84,234,571 | 7,531,956 | $11.18 | ||
| Investment Income | ||
| Dividends received from affiliated underlying funds | $1,036,668 | |
| Interest | + | 7,124 |
| Total investment income | 1,043,792 | |
| Expenses | ||
| Investment adviser and administrator fees | 38,191 | |
| Shareholder service fees: | ||
| Investor Shares1 | + | 1,282 |
| Total expenses | 39,473 | |
| Expense reduction by CSIM | – | 21,365 |
| Net expenses | – | 18,108 |
| Net investment income | 1,025,684 | |
| Realized and Unrealized Gains (Losses) | ||
| Net realized losses on sales of affiliated underlying funds | (18,655) | |
| Net change in unrealized appreciation (depreciation) on affiliated underlying funds | + | 1,604,188 |
| Net realized and unrealized gains | 1,585,533 | |
| Increase in net assets resulting from operations | $2,611,217 | |
| 1 | Effective July 24, 2017, the Investor Share class was consolidated into the Institutional Share class, resulting in a single class of shares of the fund (see financial note 1). |
| Operations | ||||
| 4/1/17-3/31/18 | 8/25/16*-3/31/17 | |||
| Net investment income | $1,025,684 | $115,766 | ||
| Net realized losses | (18,655) | (3,902) | ||
| Net change in unrealized appreciation (depreciation) | + | 1,604,188 | 474,295 | |
| Increase in net assets from operations | 2,611,217 | 586,159 | ||
| Distributions to Shareholders1 | ||||
| Distributions from net investment income | ||||
| Investor Shares | — | (70,338) | ||
| Institutional Shares | + | (803,159) | (1,035) | |
| Total distributions from net investment income | (803,159) | (71,373) | ||
| Distributions from net realized gains | ||||
| Investor Shares | — | — | ||
| Institutional Shares | + | (2,147) | — | |
| Total distributions from net realized gains | (2,147) | — | ||
| Total distributions | ($805,306) | ($71,373) | ||
| Transactions in Fund Shares1 | ||||||||
| 4/1/17-3/31/18 | 8/25/16*-3/31/17 | |||||||
| SHARES | VALUE | SHARES | VALUE | |||||
| Shares Sold | ||||||||
| Investor Shares | 109,399 | $1,139,955 | 1,778,012 | $17,975,764 | ||||
| Institutional Shares | + | 8,791,335 | 96,907,954 | 158,407 | 1,636,344 | |||
| Total shares sold | 8,900,734 | $98,047,909 | 1,936,419 | $19,612,108 | ||||
| Shares Reinvested | ||||||||
| Investor Shares | — | $— | 6,970 | $69,634 | ||||
| Institutional Shares | + | 69,443 | 784,018 | 104 | 1,035 | |||
| Total shares reinvested | 69,443 | $784,018 | 7,074 | $70,669 | ||||
| Shares Redeemed | ||||||||
| Investor Shares | (1,763,810) | ($18,662,584) | (130,571) | ($1,341,220) | ||||
| Institutional Shares | + | (1,487,331) | (16,597,009) | (2) | (17) | |||
| Total shares redeemed | (3,251,141) | ($35,259,593) | (130,573) | ($1,341,237) | ||||
| Net transactions in fund shares | 5,719,036 | $63,572,334 | 1,812,920 | $18,341,540 | ||||
| Shares Outstanding and Net Assets | ||||||||
| 4/1/17-3/31/18 | 8/25/16*-3/31/17 | |||||||
| SHARES | NET ASSETS | SHARES | NET ASSETS | |||||
| Beginning of period | 1,812,920 | $18,856,326 | — | $— | ||||
| Total increase | + | 5,719,036 | 65,378,245 | 1,812,920 | 18,856,326 | |||
| End of period | 7,531,956 | $84,234,571 | 1,812,920 | $18,856,326 | ||||
| Net investment income not yet distributed | $322,596 | $44,393 | ||||||
| * | Commencement of operations. |
| 1 | Effective July 24, 2017, all outstanding Investor Shares (20,628 shares valued at $223,890) were consolidated into the Institutional Shares, resulting in a single class of shares of the fund (see financial note 1). |
| 4/1/17– 3/31/181 | 8/25/16 2– 3/31/17 | |||||
| Per-Share Data | ||||||
| Net asset value at beginning of period | $10.46 | $10.00 | ||||
| Income (loss) from investment operations: | ||||||
| Net investment income (loss)3 | 0.26 | 0.15 | ||||
| Net realized and unrealized gains (losses) | 0.80 | 0.41 | ||||
| Total from investment operations | 1.06 | 0.56 | ||||
| Less distributions: | ||||||
| Distributions from net investment income | (0.15) | (0.10) | ||||
| Distributions from net realized gains | (0.00) 4 | — | ||||
| Total distributions | (0.15) | (0.10) | ||||
| Net asset value at end of period | $11.37 | $10.46 | ||||
| Total return | 10.12% | 5.66% 5 | ||||
| Ratios/Supplemental Data | ||||||
| Ratios to average net assets: | ||||||
| Net operating expenses6 | 0.04% | 0.03% 7 | ||||
| Gross operating expenses6 | 0.08% | 0.08% 7 | ||||
| Net investment income (loss) | 2.30% | 2.49% 7 | ||||
| Portfolio turnover rate | 8% | 7% 5 | ||||
| Net assets, end of period (x 1,000) | $109,554 | $3,258 | ||||
| Security | Number of Shares | Value ($) |
| Affiliated Underlying Funds 98.5% of net assets | ||
| U.S. Stocks 42.9% | ||
| Large-Cap 39.3% | ||
| Schwab U.S. Large-Cap ETF | 682,954 | 43,080,739 |
| Small-Cap 3.6% | ||
| Schwab U.S. Small-Cap ETF | 56,564 | 3,910,269 |
| 46,991,008 | ||
| International Stocks 22.0% | ||
| Developed-Market Large-Cap 18.6% | ||
| Schwab International Equity ETF | 604,015 | 20,361,346 |
| Emerging-Market 3.4% | ||
| Schwab Emerging Markets Equity ETF | 130,246 | 3,738,060 |
| 24,099,406 | ||
| Real Assets 3.5% | ||
| Real Estate 3.5% | ||
| Schwab U.S. REIT ETF | 99,945 | 3,822,896 |
| Fixed Income 28.1% | ||
| Intermediate-Term Bond 26.3% | ||
| Schwab U.S. Aggregate Bond ETF | 564,261 | 28,788,596 |
| Treasury Bond 1.8% | ||
| Schwab Short-Term U.S. Treasury ETF | 41,080 | 2,047,427 |
| 30,836,023 | ||
| Security | Number of Shares | Value ($) |
| Money Market Fund 2.0% | ||
| Schwab Variable Share Price Money Fund, Ultra Shares 1.73% (a) | 2,142,501 | 2,142,501 |
| Total Affiliated Underlying Funds | ||
| (Cost $105,807,263) | 107,891,834 | |
| Issuer Rate, Maturity Date | Face Amount ($) | Value ($) |
| Short-Term Investments 1.2% of net assets | ||
| Time Deposits 1.2% | ||
| Australia & New Zealand Banking Group Ltd. | ||
| 1.05%, 04/02/18 (b) | 272,864 | 272,864 |
| Deutsche Bank AG | ||
| 1.05%, 04/02/18 (b) | 1,093,338 | 1,093,338 |
| Total Short-Term Investments | ||
| (Cost $1,366,202) | 1,366,202 | |
| (a) | The rate shown is the 7-day yield. |
| (b) | The rate shown is the current daily overnight rate. |
| ETF — | Exchange-traded fund |
| REIT — | Real Estate Investment Trust |
| Affiliated Underlying Funds | Balance of Shares Held at 03/31/17 | Gross Purchases | Gross Sales | Balance of Shares Held at 03/31/18 | Net Change in Unrealized Appreciation (depreciation) | Realized Gains (Losses) | Distributions Received* |
| Schwab Emerging Markets Equity ETF | 13,339 | 116,907 | — | 130,246 | $45,664 | $— | $31,784 |
| Schwab International Equity ETF | 104,155 | 508,784 | (8,924) | 604,015 | 472,898 | (3,102) | 314,598 |
| Schwab Short-Term U.S. Treasury ETF | 5,371 | 35,709 | — | 41,080 | (14,506) | — | 11,096 |
| Schwab U.S. Aggregate Bond ETF | 79,641 | 487,348 | (2,728) | 564,261 | (483,476) | (4,227) | 316,142 |
| Schwab U.S. Large-Cap ETF | 124,173 | 608,316 | (49,535) | 682,954 | 1,700,821 | 17,580 | 439,854 |
| Schwab U.S. REIT ETF | 8,847 | 91,098 | — | 99,945 | (178,520) | — | 44,836 |
| Schwab U.S. Small-Cap ETF | 10,529 | 51,059 | (5,024) | 56,564 | 154,010 | (3,576) | 31,595 |
| Schwab Variable Share Price Money Fund, Ultra Shares | 45,081 | 2,097,420 | — | 2,142,501 | (462) | — | 9,503 |
| Total | $1,696,429 | $6,675 | $1,199,408 |
| * | Distributions received include distributions from net investment income and capital gains, if any, from the underlying funds. |
| Description | Quoted Prices in Active Markets for Identical Assets (Level 1) | Other Significant Observable Inputs (Level 2) | Significant Unobservable Inputs (Level 3) | Total | |
| Assets | |||||
| Affiliated Underlying Funds1 | $107,891,834 | $— | $— | $107,891,834 | |
| Short-Term Investments1 | — | 1,366,202 | — | 1,366,202 | |
| Total | $107,891,834 | $1,366,202 | $— | $109,258,036 |
| 1 | As categorized in Portfolio Holdings. |
| Assets | ||
| Investments in affiliated underlying funds, at value (cost $105,807,263) | $107,891,834 | |
| Investments in unaffiliated issuers, at value (cost $1,366,202) | 1,366,202 | |
| Receivables: | ||
| Fund shares sold | 866,361 | |
| Dividends | 1,653 | |
| Interest | + | 118 |
| Total assets | 110,126,168 | |
| Liabilities | ||
| Payables: | ||
| Investments bought | 550,738 | |
| Investment adviser fees | 2,883 | |
| Fund shares redeemed | + | 18,541 |
| Total liabilities | 572,162 | |
| Net Assets | ||
| Total assets | 110,126,168 | |
| Total liabilities | – | 572,162 |
| Net assets | $109,554,006 | |
| Net Assets by Source | ||
| Capital received from investors | 107,154,492 | |
| Net investment income not yet distributed | 350,501 | |
| Net realized capital losses | (35,558) | |
| Net unrealized capital appreciation | 2,084,571 | |
| Net Asset Value (NAV) | ||||
| Net Assets | ÷ | Shares Outstanding | = | NAV |
| $109,554,006 | 9,638,907 | $11.37 | ||
| Investment Income | ||
| Dividends received from affiliated underlying funds | $1,199,408 | |
| Interest | + | 7,430 |
| Total investment income | 1,206,838 | |
| Expenses | ||
| Investment adviser and administrator fees | 42,418 | |
| Shareholder service fees: | ||
| Investor Shares1 | + | 958 |
| Total expenses | 43,376 | |
| Expense reduction by CSIM | – | 23,603 |
| Net expenses | – | 19,773 |
| Net investment income | 1,187,065 | |
| Realized and Unrealized Gains (Losses) | ||
| Net realized gains on sales of affiliated underlying funds | 6,675 | |
| Net change in unrealized appreciation (depreciation) on affiliated underlying funds | + | 1,696,429 |
| Net realized and unrealized gains | 1,703,104 | |
| Increase in net assets resulting from operations | $2,890,169 | |
| 1 | Effective July 24, 2017, the Investor Share class was consolidated into the Institutional Share class, resulting in a single class of shares of the fund (see financial note 1). |
| Operations | ||||
| 4/1/17-3/31/18 | 8/25/16*-3/31/17 | |||
| Net investment income | $1,187,065 | $107,012 | ||
| Net realized gains (losses) | 6,675 | (12,184) | ||
| Net change in unrealized appreciation (depreciation) | + | 1,696,429 | 388,142 | |
| Increase in net assets from operations | 2,890,169 | 482,970 | ||
| Distributions to Shareholders1 | ||||
| Distributions from net investment income | ||||
| Investor Shares | — | (61,903) | ||
| Institutional Shares | + | (903,629) | (7,490) | |
| Total distributions from net investment income | (903,629) | (69,393) | ||
| Distributions from net realized gains | ||||
| Investor Shares | — | — | ||
| Institutional Shares | + | (603) | — | |
| Total distributions from net realized gains | (603) | — | ||
| Total distributions | ($904,232) | ($69,393) | ||
| Transactions in Fund Shares1 | ||||||||
| 4/1/17-3/31/18 | 8/25/16*-3/31/17 | |||||||
| SHARES | VALUE | SHARES | VALUE | |||||
| Shares Sold | ||||||||
| Investor Shares | 71,813 | $750,279 | 1,383,363 | $14,060,631 | ||||
| Institutional Shares | + | 10,095,576 | 113,294,038 | 322,973 | 3,328,447 | |||
| Total shares sold | 10,167,389 | $114,044,317 | 1,706,336 | $17,389,078 | ||||
| Shares Reinvested | ||||||||
| Investor Shares | — | $— | 6,106 | $61,060 | ||||
| Institutional Shares | + | 77,310 | 887,531 | 749 | 7,490 | |||
| Total shares reinvested | 77,310 | $887,531 | 6,855 | $68,550 | ||||
| Shares Redeemed | ||||||||
| Investor Shares | (1,322,798) | ($14,088,148) | (138,484) | ($1,403,984) | ||||
| Institutional Shares | + | (845,497) | (9,618,551) | (12,204) | (124,301) | |||
| Total shares redeemed | (2,168,295) | ($23,706,699) | (150,688) | ($1,528,285) | ||||
| Net transactions in fund shares | 8,076,404 | $91,225,149 | 1,562,503 | $15,929,343 | ||||
| Shares Outstanding and Net Assets | ||||||||
| 4/1/17-3/31/18 | 8/25/16*-3/31/17 | |||||||
| SHARES | NET ASSETS | SHARES | NET ASSETS | |||||
| Beginning of period | 1,562,503 | $16,342,920 | — | $— | ||||
| Total increase | + | 8,076,404 | 93,211,086 | 1,562,503 | 16,342,920 | |||
| End of period | 9,638,907 | $109,554,006 | 1,562,503 | $16,342,920 | ||||
| Net investment income not yet distributed | $350,501 | $37,619 | ||||||
| * | Commencement of operations. |
| 1 | Effective July 24, 2017, there were no outstanding Investor Shares and the Investor Share class was consolidated into the Institutional Share class, resulting in a single class of shares of the fund (see financial note 1). |
| 4/1/17– 3/31/181 | 8/25/16 2– 3/31/17 | |||||
| Per-Share Data | ||||||
| Net asset value at beginning of period | $10.54 | $10.00 | ||||
| Income (loss) from investment operations: | ||||||
| Net investment income (loss)3 | 0.26 | 0.12 | ||||
| Net realized and unrealized gains (losses) | 0.90 | 0.52 | ||||
| Total from investment operations | 1.16 | 0.64 | ||||
| Less distributions: | ||||||
| Distributions from net investment income | (0.17) | (0.10) | ||||
| Distributions from net realized gains | (0.00) 4 | — | ||||
| Total distributions | (0.17) | (0.10) | ||||
| Net asset value at end of period | $11.53 | $10.54 | ||||
| Total return | 10.96% | 6.44% 5 | ||||
| Ratios/Supplemental Data | ||||||
| Ratios to average net assets: | ||||||
| Net operating expenses6 | 0.04% | 0.03% 7 | ||||
| Gross operating expenses6 | 0.08% | 0.08% 7 | ||||
| Net investment income (loss) | 2.29% | 2.04% 7 | ||||
| Portfolio turnover rate | 14% | 13% 5 | ||||
| Net assets, end of period (x 1,000) | $62,526 | $1,904 | ||||
| Security | Number of Shares | Value ($) |
| Affiliated Underlying Funds 99.0% of net assets | ||
| U.S. Stocks 47.0% | ||
| Large-Cap 42.5% | ||
| Schwab U.S. Large-Cap ETF | 421,385 | 26,580,966 |
| Small-Cap 4.5% | ||
| Schwab U.S. Small-Cap ETF | 40,161 | 2,776,330 |
| 29,357,296 | ||
| International Stocks 25.1% | ||
| Developed-Market Large-Cap 20.7% | ||
| Schwab International Equity ETF | 383,351 | 12,922,762 |
| Emerging-Market 4.4% | ||
| Schwab Emerging Markets Equity ETF | 96,159 | 2,759,763 |
| 15,682,525 | ||
| Real Assets 3.8% | ||
| Real Estate 3.8% | ||
| Schwab U.S. REIT ETF | 62,299 | 2,382,937 |
| Fixed Income 21.7% | ||
| Intermediate-Term Bond 20.5% | ||
| Schwab U.S. Aggregate Bond ETF | 251,499 | 12,831,479 |
| Treasury Bond 1.2% | ||
| Schwab Short-Term U.S. Treasury ETF | 15,244 | 759,761 |
| 13,591,240 | ||
| Security | Number of Shares | Value ($) |
| Money Market Fund 1.4% | ||
| Schwab Variable Share Price Money Fund, Ultra Shares 1.73% (a) | 870,098 | 870,098 |
| Total Affiliated Underlying Funds | ||
| (Cost $59,908,515) | 61,884,096 | |
| Issuer Rate, Maturity Date | Face Amount ($) | Value ($) |
| Short-Term Investments 1.0% of net assets | ||
| Time Deposits 1.0% | ||
| BNP Paribas | ||
| 1.05%, 04/02/18 (b) | 624,809 | 624,809 |
| Brown Brothers Harriman | ||
| 1.05%, 04/02/18 (b) | 9,635 | 9,635 |
| Total Short-Term Investments | ||
| (Cost $634,444) | 634,444 | |
| (a) | The rate shown is the 7-day yield. |
| (b) | The rate shown is the current daily overnight rate. |
| ETF — | Exchange-traded fund |
| REIT — | Real Estate Investment Trust |
| Affiliated Underlying Funds | Balance of Shares Held at 03/31/17 | Gross Purchases | Gross Sales | Balance of Shares Held at 03/31/18 | Net Change in Unrealized Appreciation (depreciation) | Realized Gains (Losses) | Distributions Received* |
| Schwab Emerging Markets Equity ETF | 14,049 | 84,005 | (1,895) | 96,159 | $53,454 | $161 | $25,972 |
| Schwab International Equity ETF | 95,041 | 311,807 | (23,497) | 383,351 | 435,581 | (5,137) | 213,536 |
| Schwab Short-Term U.S. Treasury ETF | 2,926 | 12,460 | (142) | 15,244 | (5,566) | (45) | 4,415 |
| Schwab U.S. Aggregate Bond ETF | 49,600 | 210,129 | (8,230) | 251,499 | (205,927) | (7,784) | 154,563 |
| Schwab U.S. Large-Cap ETF | 108,718 | 361,937 | (49,270) | 421,385 | 1,271,501 | 19,255 | 298,458 |
| Schwab U.S. REIT ETF | 8,573 | 54,911 | (1,185) | 62,299 | (121,810) | (2,784) | 31,574 |
| Schwab U.S. Small-Cap ETF | 10,291 | 34,391 | (4,521) | 40,161 | 131,412 | (3,497) | 24,076 |
| Schwab Variable Share Price Money Fund, Ultra Shares | — | 870,098 | — | 870,098 | (140) | — | 2,909 |
| Total | $1,558,505 | $169 | $755,503 |
| * | Distributions received include distributions from net investment income and capital gains, if any, from the underlying funds. |
| Description | Quoted Prices in Active Markets for Identical Assets (Level 1) | Other Significant Observable Inputs (Level 2) | Significant Unobservable Inputs (Level 3) | Total | |
| Assets | |||||
| Affiliated Underlying Funds1 | $61,884,096 | $— | $— | $61,884,096 | |
| Short-Term Investments1 | — | 634,444 | — | 634,444 | |
| Total | $61,884,096 | $634,444 | $— | $62,518,540 |
| 1 | As categorized in Portfolio Holdings. |
| Assets | ||
| Investments in affiliated underlying funds, at value (cost $59,908,515) | $61,884,096 | |
| Investments in unaffiliated issuers, at value (cost $634,444) | 634,444 | |
| Receivables: | ||
| Fund shares sold | 378,981 | |
| Dividends | 671 | |
| Interest | + | 55 |
| Total assets | 62,898,247 | |
| Liabilities | ||
| Payables: | ||
| Investments bought | 370,116 | |
| Investment adviser fees | 1,623 | |
| Fund shares redeemed | + | 65 |
| Total liabilities | 371,804 | |
| Net Assets | ||
| Total assets | 62,898,247 | |
| Total liabilities | – | 371,804 |
| Net assets | $62,526,443 | |
| Net Assets by Source | ||
| Capital received from investors | 60,386,605 | |
| Net investment income not yet distributed | 208,673 | |
| Net realized capital losses | (44,416) | |
| Net unrealized capital appreciation | 1,975,581 | |
| Net Asset Value (NAV) | ||||
| Net Assets | ÷ | Shares Outstanding | = | NAV |
| $62,526,443 | 5,421,817 | $11.53 | ||
| Investment Income | ||
| Dividends received from affiliated underlying funds | $755,503 | |
| Interest | + | 4,340 |
| Total investment income | 759,843 | |
| Expenses | ||
| Investment adviser and administrator fees | 27,136 | |
| Shareholder service fees: | ||
| Investor Shares1 | + | 838 |
| Total expenses | 27,974 | |
| Expense reduction by CSIM and its affiliates | – | 15,024 |
| Net expenses | – | 12,950 |
| Net investment income | 746,893 | |
| Realized and Unrealized Gains (Losses) | ||
| Net realized gains on sales of affiliated underlying funds | 169 | |
| Net change in unrealized appreciation (depreciation) on affiliated underlying funds | + | 1,558,505 |
| Net realized and unrealized gains | 1,558,674 | |
| Increase in net assets resulting from operations | $2,305,567 | |
| 1 | Effective July 24, 2017, the Investor Share class was consolidated into the Institutional Share class, resulting in a single class of shares of the fund (see financial note 1). |
| Operations | ||||
| 4/1/17-3/31/18 | 8/25/16*-3/31/17 | |||
| Net investment income | $746,893 | $91,216 | ||
| Net realized gains (losses) | 169 | (8,007) | ||
| Net change in unrealized appreciation (depreciation) | + | 1,558,505 | 417,076 | |
| Increase in net assets from operations | 2,305,567 | 500,285 | ||
| Distributions to Shareholders1 | ||||
| Distributions from net investment income | ||||
| Investor Shares | — | (59,014) | ||
| Institutional Shares | + | (600,404) | (2,983) | |
| Total distributions from net investment income | (600,404) | (61,997) | ||
| Distributions from net realized gains | ||||
| Investor Shares | — | — | ||
| Institutional Shares | + | (3,613) | — | |
| Total distributions from net realized gains | (3,613) | — | ||
| Total distributions | ($604,017) | ($61,997) | ||
| Transactions in Fund Shares1 | ||||||||
| 4/1/17-3/31/18 | 8/25/16*-3/31/17 | |||||||
| SHARES | VALUE | SHARES | VALUE | |||||
| Shares Sold | ||||||||
| Investor Shares | 24,754 | $257,871 | 1,186,207 | $12,040,095 | ||||
| Institutional Shares | + | 5,972,493 | 67,489,185 | 180,408 | 1,883,415 | |||
| Total shares sold | 5,997,247 | $67,747,056 | 1,366,615 | $13,923,510 | ||||
| Shares Reinvested | ||||||||
| Investor Shares | — | $— | 5,816 | $58,332 | ||||
| Institutional Shares | + | 50,896 | 593,447 | 297 | 2,983 | |||
| Total shares reinvested | 50,896 | $593,447 | 6,113 | $61,315 | ||||
| Shares Redeemed | ||||||||
| Investor Shares | (1,108,058) | ($11,891,649) | (108,719) | ($1,112,070) | ||||
| Institutional Shares | + | (782,276) | (8,934,987) | (1) | (17) | |||
| Total shares redeemed | (1,890,334) | ($20,826,636) | (108,720) | ($1,112,087) | ||||
| Net transactions in fund shares | 4,157,809 | $47,513,867 | 1,264,008 | $12,872,738 | ||||
| Shares Outstanding and Net Assets | ||||||||
| 4/1/17-3/31/18 | 8/25/16*-3/31/17 | |||||||
| SHARES | NET ASSETS | SHARES | NET ASSETS | |||||
| Beginning of period | 1,264,008 | $13,311,026 | — | $— | ||||
| Total increase | + | 4,157,809 | 49,215,417 | 1,264,008 | 13,311,026 | |||
| End of period | 5,421,817 | $62,526,443 | 1,264,008 | $13,311,026 | ||||
| Net investment income not yet distributed | $208,673 | $29,219 | ||||||
| * | Commencement of operations. |
| 1 | Effective July 24, 2017, there were no outstanding Investor Shares and the Investor Share class was consolidated into the Institutional Share class, resulting in a single class of shares of the fund (see financial note 1). |
| 4/1/17– 3/31/181 | 8/25/16 2– 3/31/17 | |||||
| Per-Share Data | ||||||
| Net asset value at beginning of period | $10.59 | $10.00 | ||||
| Income (loss) from investment operations: | ||||||
| Net investment income (loss)3 | 0.27 | 0.15 | ||||
| Net realized and unrealized gains (losses) | 1.00 | 0.55 | ||||
| Total from investment operations | 1.27 | 0.70 | ||||
| Less distributions: | ||||||
| Distributions from net investment income | (0.17) | (0.11) | ||||
| Distributions from net realized gains | (0.00) 4 | — | ||||
| Total distributions | (0.17) | (0.11) | ||||
| Net asset value at end of period | $11.69 | $10.59 | ||||
| Total return | 11.97% | 7.09% 5 | ||||
| Ratios/Supplemental Data | ||||||
| Ratios to average net assets: | ||||||
| Net operating expenses6 | 0.04% | 0.03% 7 | ||||
| Gross operating expenses6 | 0.08% | 0.08% 7 | ||||
| Net investment income (loss) | 2.33% | 2.48% 7 | ||||
| Portfolio turnover rate | 15% | 8% 5 | ||||
| Net assets, end of period (x 1,000) | $72,830 | $1,514 | ||||
| Security | Number of Shares | Value ($) |
| Affiliated Underlying Funds 98.9% of net assets | ||
| U.S. Stocks 50.6% | ||
| Large-Cap 45.4% | ||
| Schwab U.S. Large-Cap ETF | 523,634 | 33,030,833 |
| Small-Cap 5.2% | ||
| Schwab U.S. Small-Cap ETF | 55,195 | 3,815,630 |
| 36,846,463 | ||
| International Stocks 28.2% | ||
| Developed-Market Large-Cap 22.7% | ||
| Schwab International Equity ETF | 490,213 | 16,525,080 |
| Emerging-Market 5.5% | ||
| Schwab Emerging Markets Equity ETF | 138,813 | 3,983,933 |
| 20,509,013 | ||
| Real Assets 4.1% | ||
| Real Estate 4.1% | ||
| Schwab U.S. REIT ETF | 78,789 | 3,013,679 |
| Fixed Income 15.4% | ||
| Intermediate-Term Bond 14.6% | ||
| Schwab U.S. Aggregate Bond ETF | 208,398 | 10,632,466 |
| Treasury Bond 0.8% | ||
| Schwab Short-Term U.S. Treasury ETF | 10,935 | 545,000 |
| 11,177,466 | ||
| Security | Number of Shares | Value ($) |
| Money Market Fund 0.6% | ||
| Schwab Variable Share Price Money Fund, Ultra Shares 1.73% (a) | 450,766 | 450,766 |
| Total Affiliated Underlying Funds | ||
| (Cost $69,619,656) | 71,997,387 | |
| Issuer Rate, Maturity Date | Face Amount ($) | Value ($) |
| Short-Term Investments 1.0% of net assets | ||
| Time Deposits 1.0% | ||
| BNP Paribas | ||
| 1.05%, 04/02/18 (b) | 727,515 | 727,515 |
| JPMorgan Chase Bank | ||
| 1.05%, 04/02/18 (b) | 20,301 | 20,301 |
| Total Short-Term Investments | ||
| (Cost $747,816) | 747,816 | |
| (a) | The rate shown is the 7-day yield. |
| (b) | The rate shown is the current daily overnight rate. |
| ETF — | Exchange-traded fund |
| REIT — | Real Estate Investment Trust |
| Affiliated Underlying Funds | Balance of Shares Held at 03/31/17 | Gross Purchases | Gross Sales | Balance of Shares Held at 03/31/18 | Net Change in Unrealized Appreciation (depreciation) | Realized Gains (Losses) | Distributions Received* |
| Schwab Emerging Markets Equity ETF | 17,625 | 122,918 | (1,730) | 138,813 | $79,301 | $516 | $36,785 |
| Schwab International Equity ETF | 103,591 | 421,982 | (35,360) | 490,213 | 532,231 | (7,047) | 263,695 |
| Schwab Short-Term U.S. Treasury ETF | 1,681 | 9,443 | (189) | 10,935 | (3,562) | (50) | 3,008 |
| Schwab U.S. Aggregate Bond ETF | 34,469 | 182,341 | (8,412) | 208,398 | (161,721) | (6,628) | 122,694 |
| Schwab U.S. Large-Cap ETF | 114,817 | 464,000 | (55,183) | 523,634 | 1,501,080 | (7,034) | 363,555 |
| Schwab U.S. REIT ETF | 9,873 | 69,970 | (1,054) | 78,789 | (146,717) | (2,366) | 40,488 |
| Schwab U.S. Small-Cap ETF | 12,263 | 49,228 | (6,296) | 55,195 | 169,627 | (5,807) | 32,381 |
| Schwab Variable Share Price Money Fund, Ultra Shares | — | 650,726 | (199,960) | 450,766 | (65) | (20) | 1,198 |
| Total | $1,970,174 | ($28,436) | $863,804 |
| * | Distributions received include distributions from net investment income and capital gains, if any, from the underlying funds. |
| Description | Quoted Prices in Active Markets for Identical Assets (Level 1) | Other Significant Observable Inputs (Level 2) | Significant Unobservable Inputs (Level 3) | Total | |
| Assets | |||||
| Affiliated Underlying Funds1 | $71,997,387 | $— | $— | $71,997,387 | |
| Short-Term Investments1 | — | 747,816 | — | 747,816 | |
| Total | $71,997,387 | $747,816 | $— | $72,745,203 |
| 1 | As categorized in Portfolio Holdings. |
| Assets | ||
| Investments in affiliated underlying funds, at value (cost $69,619,656) | $71,997,387 | |
| Investments in unaffiliated issuers, at value (cost $747,816) | 747,816 | |
| Receivables: | ||
| Fund shares sold | 370,998 | |
| Dividends | 348 | |
| Interest | + | 65 |
| Total assets | 73,116,614 | |
| Liabilities | ||
| Payables: | ||
| Investments bought | 280,720 | |
| Investment adviser fees | 1,925 | |
| Fund shares redeemed | + | 3,875 |
| Total liabilities | 286,520 | |
| Net Assets | ||
| Total assets | 73,116,614 | |
| Total liabilities | – | 286,520 |
| Net assets | $72,830,094 | |
| Net Assets by Source | ||
| Capital received from investors | 70,286,615 | |
| Net investment income not yet distributed | 215,455 | |
| Net realized capital losses | (49,707) | |
| Net unrealized capital appreciation | 2,377,731 | |
| Net Asset Value (NAV) | ||||
| Net Assets | ÷ | Shares Outstanding | = | NAV |
| $72,830,094 | 6,228,301 | $11.69 | ||
| Investment Income | ||
| Dividends received from affiliated underlying funds | $863,804 | |
| Interest | + | 4,481 |
| Total investment income | 868,285 | |
| Expenses | ||
| Investment adviser and administrator fees | 30,514 | |
| Shareholder service fees: | ||
| Investor Shares1 | + | 838 |
| Total expenses | 31,352 | |
| Expense reduction by CSIM | – | 17,024 |
| Net expenses | – | 14,328 |
| Net investment income | 853,957 | |
| Realized and Unrealized Gains (Losses) | ||
| Net realized losses on sales of affiliated underlying funds | (28,436) | |
| Net change in unrealized appreciation (depreciation) on affiliated underlying funds | + | 1,970,174 |
| Net realized and unrealized gains | 1,941,738 | |
| Increase in net assets resulting from operations | $2,795,695 | |
| 1 | Effective July 24, 2017, the Investor Share class was consolidated into the Institutional Share class, resulting in a single class of shares of the fund (see financial note 1). |
| Operations | ||||
| 4/1/17-3/31/18 | 8/25/16*-3/31/17 | |||
| Net investment income | $853,957 | $87,165 | ||
| Net realized losses | (28,436) | (2,814) | ||
| Net change in unrealized appreciation (depreciation) | + | 1,970,174 | 407,557 | |
| Increase in net assets from operations | 2,795,695 | 491,908 | ||
| Distributions to Shareholders1 | ||||
| Distributions from net investment income | ||||
| Investor Shares | — | (53,782) | ||
| Institutional Shares | + | (684,942) | (2,555) | |
| Total distributions from net investment income | (684,942) | (56,337) | ||
| Distributions from net realized gains | ||||
| Investor Shares | — | — | ||
| Institutional Shares | + | (2,845) | — | |
| Total distributions from net realized gains | (2,845) | — | ||
| Total distributions | ($687,787) | ($56,337) | ||
| Transactions in Fund Shares1 | ||||||||
| 4/1/17-3/31/18 | 8/25/16*-3/31/17 | |||||||
| SHARES | VALUE | SHARES | VALUE | |||||
| Shares Sold | ||||||||
| Investor Shares | 27,967 | $294,780 | 1,192,700 | $12,211,411 | ||||
| Institutional Shares | + | 6,948,851 | 79,414,617 | 157,010 | 1,632,206 | |||
| Total shares sold | 6,976,818 | $79,709,397 | 1,349,710 | $13,843,617 | ||||
| Shares Reinvested | ||||||||
| Investor Shares | — | $— | 5,344 | $53,698 | ||||
| Institutional Shares | + | 57,916 | 684,569 | 254 | 2,556 | |||
| Total shares reinvested | 57,916 | $684,569 | 5,598 | $56,254 | ||||
| Shares Redeemed | ||||||||
| Investor Shares | (1,136,256) | ($12,267,078) | (89,755) | ($932,514) | ||||
| Institutional Shares | + | (921,426) | (10,656,441) | (14,304) | (151,189) | |||
| Total shares redeemed | (2,057,682) | ($22,923,519) | (104,059) | ($1,083,703) | ||||
| Net transactions in fund shares | 4,977,052 | $57,470,447 | 1,251,249 | $12,816,168 | ||||
| Shares Outstanding and Net Assets | ||||||||
| 4/1/17-3/31/18 | 8/25/16*-3/31/17 | |||||||
| SHARES | NET ASSETS | SHARES | NET ASSETS | |||||
| Beginning of period | 1,251,249 | $13,251,739 | — | $— | ||||
| Total increase | + | 4,977,052 | 59,578,355 | 1,251,249 | 13,251,739 | |||
| End of period | 6,228,301 | $72,830,094 | 1,251,249 | $13,251,739 | ||||
| Net investment income not yet distributed | $215,455 | $30,828 | ||||||
| * | Commencement of operations. |
| 1 | Effective July 24, 2017, all outstanding Investor Shares (20,887 shares valued at $223,165) were consolidated into the Institutional Shares, resulting in a single class of shares of the fund (see financial note 1). |
| 4/1/17– 3/31/181 | 8/25/16 2– 3/31/17 | |||||
| Per-Share Data | ||||||
| Net asset value at beginning of period | $10.64 | $10.00 | ||||
| Income (loss) from investment operations: | ||||||
| Net investment income (loss)3 | 0.28 | 0.10 | ||||
| Net realized and unrealized gains (losses) | 1.06 | 0.65 | ||||
| Total from investment operations | 1.34 | 0.75 | ||||
| Less distributions: | ||||||
| Distributions from net investment income | (0.17) | (0.11) | ||||
| Distributions from net realized gains | (0.00) 4 | — | ||||
| Total distributions | (0.17) | (0.11) | ||||
| Net asset value at end of period | $11.81 | $10.64 | ||||
| Total return | 12.57% | 7.51% 5 | ||||
| Ratios/Supplemental Data | ||||||
| Ratios to average net assets: | ||||||
| Net operating expenses6 | 0.03% | 0.02% 7 | ||||
| Gross operating expenses6 | 0.08% | 0.08% 7 | ||||
| Net investment income (loss) | 2.39% | 1.68% 7 | ||||
| Portfolio turnover rate | 11% | 8% 5 | ||||
| Net assets, end of period (x 1,000) | $44,817 | $1,261 | ||||
| Security | Number of Shares | Value ($) |
| Affiliated Underlying Funds 98.9% of net assets | ||
| U.S. Stocks 53.4% | ||
| Large-Cap 47.5% | ||
| Schwab U.S. Large-Cap ETF | 337,491 | 21,288,932 |
| Small-Cap 5.9% | ||
| Schwab U.S. Small-Cap ETF | 37,963 | 2,624,382 |
| 23,913,314 | ||
| International Stocks 30.3% | ||
| Developed-Market Large-Cap 24.1% | ||
| Schwab International Equity ETF | 320,306 | 10,797,515 |
| Emerging-Market 6.2% | ||
| Schwab Emerging Markets Equity ETF | 97,243 | 2,790,874 |
| 13,588,389 | ||
| Real Assets 4.5% | ||
| Real Estate 4.5% | ||
| Schwab U.S. REIT ETF | 53,143 | 2,032,720 |
| Fixed Income 10.7% | ||
| Intermediate-Term Bond 10.3% | ||
| Schwab U.S. Aggregate Bond ETF | 90,058 | 4,594,759 |
| Security | Number of Shares | Value ($) |
| Treasury Bond 0.4% | ||
| Schwab Short-Term U.S. Treasury ETF | 3,713 | 185,056 |
| 4,779,815 | ||
| Total Affiliated Underlying Funds | ||
| (Cost $42,700,119) | 44,314,238 | |
| Issuer Rate, Maturity Date | Face Amount ($) | Value ($) |
| Short-Term Investments 1.2% of net assets | ||
| Time Deposits 1.2% | ||
| BNP Paribas | ||
| 1.05%, 04/02/18 (a) | 447,690 | 447,690 |
| JPMorgan Chase Bank | ||
| 1.05%, 04/02/18 (a) | 83,922 | 83,922 |
| Total Short-Term Investments | ||
| (Cost $531,612) | 531,612 | |
| (a) | The rate shown is the current daily overnight rate. |
| ETF — | Exchange-traded fund |
| REIT — | Real Estate Investment Trust |
| Affiliated Underlying Funds | Balance of Shares Held at 03/31/17 | Gross Purchases | Gross Sales | Balance of Shares Held at 03/31/18 | Net Change in Unrealized Appreciation (depreciation) | Realized Gains (Losses) | Distributions Received* |
| Schwab Emerging Markets Equity ETF | 13,332 | 84,337 | (426) | 97,243 | $55,467 | $59 | $25,936 |
| Schwab International Equity ETF | 72,118 | 262,831 | (14,643) | 320,306 | 350,636 | (7,482) | 178,249 |
| Schwab Short-Term U.S. Treasury ETF | 689 | 3,024 | — | 3,713 | (1,526) | — | 1,137 |
| Schwab U.S. Aggregate Bond ETF | 16,219 | 74,780 | (941) | 90,058 | (76,542) | (1,142) | 53,759 |
| Schwab U.S. Large-Cap ETF | 78,137 | 286,484 | (27,130) | 337,491 | 980,431 | 7,137 | 231,197 |
| Schwab U.S. REIT ETF | 7,077 | 46,321 | (255) | 53,143 | (99,691) | (636) | 26,911 |
| Schwab U.S. Small-Cap ETF | 8,769 | 31,929 | (2,735) | 37,963 | 113,841 | (1,900) | 22,307 |
| Total | $1,322,616 | ($3,964) | $539,496 |
| * | Distributions received include distributions from net investment income and capital gains, if any, from the underlying funds. |
| Description | Quoted Prices in Active Markets for Identical Assets (Level 1) | Other Significant Observable Inputs (Level 2) | Significant Unobservable Inputs (Level 3) | Total | |
| Assets | |||||
| Affiliated Underlying Funds1 | $44,314,238 | $— | $— | $44,314,238 | |
| Short-Term Investments1 | — | 531,612 | — | 531,612 | |
| Total | $44,314,238 | $531,612 | $— | $44,845,850 |
| 1 | As categorized in Portfolio Holdings. |
| Assets | ||
| Investments in affiliated underlying funds, at value (cost $42,700,119) | $44,314,238 | |
| Investments in unaffiliated issuers, at value (cost $531,612) | 531,612 | |
| Receivables: | ||
| Fund shares sold | 160,854 | |
| Interest | + | 46 |
| Total assets | 45,006,750 | |
| Liabilities | ||
| Payables: | ||
| Investments bought | 183,500 | |
| Investment adviser fees | 1,173 | |
| Fund shares redeemed | + | 5,267 |
| Total liabilities | 189,940 | |
| Net Assets | ||
| Total assets | 45,006,750 | |
| Total liabilities | – | 189,940 |
| Net assets | $44,816,810 | |
| Net Assets by Source | ||
| Capital received from investors | 43,094,150 | |
| Net investment income not yet distributed | 130,761 | |
| Net realized capital losses | (22,220) | |
| Net unrealized capital appreciation | 1,614,119 | |
| Net Asset Value (NAV) | ||||
| Net Assets | ÷ | Shares Outstanding | = | NAV |
| $44,816,810 | 3,795,888 | $11.81 | ||
| Investment Income | ||
| Dividends received from affiliated underlying funds | $539,496 | |
| Interest | + | 2,373 |
| Total investment income | 541,869 | |
| Expenses | ||
| Investment adviser and administrator fees | 18,698 | |
| Shareholder service fees: | ||
| Investor Shares1 | + | 589 |
| Total expenses | 19,287 | |
| Expense reduction by CSIM | – | 10,546 |
| Net expenses | – | 8,741 |
| Net investment income | 533,128 | |
| Realized and Unrealized Gains (Losses) | ||
| Net realized losses on sales of affiliated underlying funds | (3,964) | |
| Net change in unrealized appreciation (depreciation) on affiliated underlying funds | + | 1,322,616 |
| Net realized and unrealized gains | 1,318,652 | |
| Increase in net assets resulting from operations | $1,851,780 | |
| 1 | Effective July 24, 2017, the Investor Share class was consolidated into the Institutional Share class, resulting in a single class of shares of the fund (see financial note 1). |
| Operations | ||||
| 4/1/17-3/31/18 | 8/25/16*-3/31/17 | |||
| Net investment income | $533,128 | $59,603 | ||
| Net realized losses | (3,964) | (4,381) | ||
| Net change in unrealized appreciation (depreciation) | + | 1,322,616 | 291,503 | |
| Increase in net assets from operations | 1,851,780 | 346,725 | ||
| Distributions to Shareholders1 | ||||
| Distributions from net investment income | ||||
| Investor Shares | — | (32,949) | ||
| Institutional Shares | + | (434,386) | (7,482) | |
| Total distributions from net investment income | (434,386) | (40,431) | ||
| Distributions from net realized gains | ||||
| Investor Shares | — | — | ||
| Institutional Shares | + | (1,028) | — | |
| Total distributions from net realized gains | (1,028) | — | ||
| Total distributions | ($435,414) | ($40,431) | ||
| Transactions in Fund Shares1 | ||||||||
| 4/1/17-3/31/18 | 8/25/16*-3/31/17 | |||||||
| SHARES | VALUE | SHARES | VALUE | |||||
| Shares Sold | ||||||||
| Investor Shares | 70,062 | $748,563 | 718,567 | $7,368,178 | ||||
| Institutional Shares | + | 3,955,636 | 45,583,166 | 148,641 | 1,532,883 | |||
| Total shares sold | 4,025,698 | $46,331,729 | 867,208 | $8,901,061 | ||||
| Shares Reinvested | ||||||||
| Investor Shares | — | $— | 3,238 | $32,606 | ||||
| Institutional Shares | + | 36,340 | 433,529 | 742 | 7,482 | |||
| Total shares reinvested | 36,340 | $433,529 | 3,980 | $40,088 | ||||
| Shares Redeemed | ||||||||
| Investor Shares | (768,157) | ($8,347,681) | (23,710) | ($244,675) | ||||
| Institutional Shares | + | (314,609) | (3,702,897) | (30,862) | (317,004) | |||
| Total shares redeemed | (1,082,766) | ($12,050,578) | (54,572) | ($561,679) | ||||
| Net transactions in fund shares | 2,979,272 | $34,714,680 | 816,616 | $8,379,470 | ||||
| Shares Outstanding and Net Assets | ||||||||
| 4/1/17-3/31/18 | 8/25/16*-3/31/17 | |||||||
| SHARES | NET ASSETS | SHARES | NET ASSETS | |||||
| Beginning of period | 816,616 | $8,685,764 | — | $— | ||||
| Total increase | + | 2,979,272 | 36,131,046 | 816,616 | 8,685,764 | |||
| End of period | 3,795,888 | $44,816,810 | 816,616 | $8,685,764 | ||||
| Net investment income not yet distributed | $130,761 | $19,172 | ||||||
| * | Commencement of operations. |
| 1 | Effective July 24, 2017, all outstanding Investor Shares (38,619 shares valued at $433,875) were consolidated into the Institutional Shares, resulting in a single class of shares of the fund (see financial note 1). |
| 4/1/17– 3/31/181 | 8/25/16 2– 3/31/17 | |||||
| Per-Share Data | ||||||
| Net asset value at beginning of period | $10.65 | $10.00 | ||||
| Income (loss) from investment operations: | ||||||
| Net investment income (loss)3 | 0.28 | 0.15 | ||||
| Net realized and unrealized gains (losses) | 1.09 | 0.62 | ||||
| Total from investment operations | 1.37 | 0.77 | ||||
| Less distributions: | ||||||
| Distributions from net investment income | (0.17) | (0.12) | ||||
| Distributions from net realized gains | (0.00) 4 | — | ||||
| Total distributions | (0.17) | (0.12) | ||||
| Net asset value at end of period | $11.85 | $10.65 | ||||
| Total return | 12.85% | 7.80% 5 | ||||
| Ratios/Supplemental Data | ||||||
| Ratios to average net assets: | ||||||
| Net operating expenses6 | 0.03% | 0.02% 7 | ||||
| Gross operating expenses6 | 0.08% | 0.08% 7 | ||||
| Net investment income (loss) | 2.37% | 2.54% 7 | ||||
| Portfolio turnover rate | 15% | 4% 5 | ||||
| Net assets, end of period (x 1,000) | $37,619 | $793 | ||||
| Security | Number of Shares | Value ($) |
| Affiliated Underlying Funds 99.0% of net assets | ||
| U.S. Stocks 54.5% | ||
| Large-Cap 48.3% | ||
| Schwab U.S. Large-Cap ETF | 288,072 | 18,171,582 |
| Small-Cap 6.2% | ||
| Schwab U.S. Small-Cap ETF | 33,895 | 2,343,161 |
| 20,514,743 | ||
| International Stocks 31.7% | ||
| Developed-Market Large-Cap 24.9% | ||
| Schwab International Equity ETF | 278,260 | 9,380,144 |
| Emerging-Market 6.8% | ||
| Schwab Emerging Markets Equity ETF | 88,901 | 2,551,459 |
| 11,931,603 | ||
| Real Assets 4.6% | ||
| Real Estate 4.6% | ||
| Schwab U.S. REIT ETF | 45,467 | 1,739,113 |
| Fixed Income 8.2% | ||
| Intermediate-Term Bond 7.8% | ||
| Schwab U.S. Aggregate Bond ETF | 57,561 | 2,936,762 |
| Security | Number of Shares | Value ($) |
| Treasury Bond 0.4% | ||
| Schwab Short-Term U.S. Treasury ETF | 2,734 | 136,263 |
| 3,073,025 | ||
| Total Affiliated Underlying Funds | ||
| (Cost $36,250,402) | 37,258,484 | |
| Issuer Rate, Maturity Date | Face Amount ($) | Value ($) |
| Short-Term Investment 0.9% of net assets | ||
| Time Deposit 0.9% | ||
| BNP Paribas | ||
| 1.05%, 04/02/18 (a) | 330,698 | 330,698 |
| Total Short-Term Investment | ||
| (Cost $330,698) | 330,698 | |
| (a) | The rate shown is the current daily overnight rate. |
| ETF — | Exchange-traded fund |
| REIT — | Real Estate Investment Trust |
| Affiliated Underlying Funds | Balance of Shares Held at 03/31/17 | Gross Purchases | Gross Sales | Balance of Shares Held at 03/31/18 | Net Change in Unrealized Appreciation (depreciation) | Realized Gains (Losses) | Distributions Received* |
| Schwab Emerging Markets Equity ETF | 10,890 | 79,326 | (1,315) | 88,901 | $30,049 | $318 | $19,905 |
| Schwab International Equity ETF | 55,967 | 239,328 | (17,035) | 278,260 | 216,495 | (2,957) | 129,988 |
| Schwab Short-Term U.S. Treasury ETF | 377 | 2,357 | — | 2,734 | (696) | — | 569 |
| Schwab U.S. Aggregate Bond ETF | 9,280 | 50,512 | (2,231) | 57,561 | (40,379) | (1,557) | 30,171 |
| Schwab U.S. Large-Cap ETF | 59,829 | 255,858 | (27,615) | 288,072 | 598,582 | (5,809) | 178,882 |
| Schwab U.S. REIT ETF | 5,499 | 40,183 | (215) | 45,467 | (76,644) | (582) | 21,796 |
| Schwab U.S. Small-Cap ETF | 6,939 | 30,233 | (3,277) | 33,895 | 76,512 | (3,879) | 17,703 |
| Total | $803,919 | ($14,466) | $399,014 |
| * | Distributions received include distributions from net investment income and capital gains, if any, from the underlying funds. |
| Description | Quoted Prices in Active Markets for Identical Assets (Level 1) | Other Significant Observable Inputs (Level 2) | Significant Unobservable Inputs (Level 3) | Total | |
| Assets | |||||
| Affiliated Underlying Funds1 | $37,258,484 | $— | $— | $37,258,484 | |
| Short-Term Investment1 | — | 330,698 | — | 330,698 | |
| Total | $37,258,484 | $330,698 | $— | $37,589,182 |
| 1 | As categorized in Portfolio Holdings. |
| Assets | ||
| Investments in affiliated underlying funds, at value (cost $36,250,402) | $37,258,484 | |
| Investments in unaffiliated issuers, at value (cost $330,698) | 330,698 | |
| Receivables: | ||
| Fund shares sold | 312,547 | |
| Interest | + | 29 |
| Total assets | 37,901,758 | |
| Liabilities | ||
| Payables: | ||
| Investments bought | 271,154 | |
| Investment adviser fees | 952 | |
| Fund shares redeemed | + | 10,308 |
| Total liabilities | 282,414 | |
| Net Assets | ||
| Total assets | 37,901,758 | |
| Total liabilities | – | 282,414 |
| Net assets | $37,619,344 | |
| Net Assets by Source | ||
| Capital received from investors | 36,532,907 | |
| Net investment income not yet distributed | 96,398 | |
| Net realized capital losses | (18,043) | |
| Net unrealized capital appreciation | 1,008,082 | |
| Net Asset Value (NAV) | ||||
| Net Assets | ÷ | Shares Outstanding | = | NAV |
| $37,619,344 | 3,175,762 | $11.85 | ||
| Investment Income | ||
| Dividends received from affiliated underlying funds | $399,014 | |
| Interest | + | 1,484 |
| Total investment income | 400,498 | |
| Expenses | ||
| Investment adviser and administrator fees | 13,953 | |
| Shareholder service fees: | ||
| Investor Shares1 | + | 430 |
| Total expenses | 14,383 | |
| Expense reduction by CSIM | – | 7,977 |
| Net expenses | – | 6,406 |
| Net investment income | 394,092 | |
| Realized and Unrealized Gains (Losses) | ||
| Net realized losses on sales of affiliated underlying funds | (14,466) | |
| Net change in unrealized appreciation (depreciation) on affiliated underlying funds | + | 803,919 |
| Net realized and unrealized gains | 789,453 | |
| Increase in net assets resulting from operations | $1,183,545 | |
| 1 | Effective July 24, 2017, the Investor Share class was consolidated into the Institutional Share class, resulting in a single class of shares of the fund (see financial note 1). |
| Operations | ||||
| 4/1/17-3/31/18 | 8/25/16*-3/31/17 | |||
| Net investment income | $394,092 | $40,488 | ||
| Net realized losses | (14,466) | (1,808) | ||
| Net change in unrealized appreciation (depreciation) | + | 803,919 | 204,163 | |
| Increase in net assets from operations | 1,183,545 | 242,843 | ||
| Distributions to Shareholders1 | ||||
| Distributions from net investment income | ||||
| Investor Shares | — | (24,827) | ||
| Institutional Shares | + | (311,235) | (2,238) | |
| Total distributions from net investment income | (311,235) | (27,065) | ||
| Distributions from net realized gains | ||||
| Investor Shares | — | — | ||
| Institutional Shares | + | (1,651) | — | |
| Total distributions from net realized gains | (1,651) | — | ||
| Total distributions | ($312,886) | ($27,065) | ||
| Transactions in Fund Shares1 | ||||||||
| 4/1/17-3/31/18 | 8/25/16*-3/31/17 | |||||||
| SHARES | VALUE | SHARES | VALUE | |||||
| Shares Sold | ||||||||
| Investor Shares | 39,004 | $420,083 | 574,447 | $5,899,391 | ||||
| Institutional Shares | + | 3,463,797 | 40,274,493 | 75,399 | 791,031 | |||
| Total shares sold | 3,502,801 | $40,694,576 | 649,846 | $6,690,422 | ||||
| Shares Reinvested | ||||||||
| Investor Shares | — | $— | 2,428 | $24,451 | ||||
| Institutional Shares | + | 25,736 | 308,064 | 222 | 2,238 | |||
| Total shares reinvested | 25,736 | $308,064 | 2,650 | $26,689 | ||||
| Shares Redeemed | ||||||||
| Investor Shares | (577,713) | ($6,279,065) | (38,166) | ($394,238) | ||||
| Institutional Shares | + | (388,252) | (4,501,719) | (1,140) | (11,822) | |||
| Total shares redeemed | (965,965) | ($10,780,784) | (39,306) | ($406,060) | ||||
| Net transactions in fund shares | 2,562,572 | $30,221,856 | 613,190 | $6,311,051 | ||||
| Shares Outstanding and Net Assets | ||||||||
| 4/1/17-3/31/18 | 8/25/16*-3/31/17 | |||||||
| SHARES | NET ASSETS | SHARES | NET ASSETS | |||||
| Beginning of period | 613,190 | $6,526,829 | — | $— | ||||
| Total increase | + | 2,562,572 | 31,092,515 | 613,190 | 6,526,829 | |||
| End of period | 3,175,762 | $37,619,344 | 613,190 | $6,526,829 | ||||
| Net investment income not yet distributed | $96,398 | $13,423 | ||||||
| * | Commencement of operations. |
| 1 | Effective July 24, 2017, all outstanding Investor Shares (25,350 shares valued at $285,263) were consolidated into the Institutional Shares, resulting in a single class of shares of the fund (see financial note 1). |
| 4/1/17– 3/31/181 | 8/25/16 2– 3/31/17 | |||||
| Per-Share Data | ||||||
| Net asset value at beginning of period | $10.67 | $10.00 | ||||
| Income (loss) from investment operations: | ||||||
| Net investment income (loss)3 | 0.27 | 0.15 | ||||
| Net realized and unrealized gains (losses) | 1.15 | 0.65 | ||||
| Total from investment operations | 1.42 | 0.80 | ||||
| Less distributions: | ||||||
| Distributions from net investment income | (0.18) | (0.13) | ||||
| Distributions from net realized gains | (0.00) 4 | — | ||||
| Total distributions | (0.18) | (0.13) | ||||
| Net asset value at end of period | $11.91 | $10.67 | ||||
| Total return | 13.25% | 8.03% 5 | ||||
| Ratios/Supplemental Data | ||||||
| Ratios to average net assets: | ||||||
| Net operating expenses6 | 0.03% | 0.02% 7 | ||||
| Gross operating expenses6 | 0.08% | 0.08% 7 | ||||
| Net investment income (loss) | 2.33% | 2.53% 7 | ||||
| Portfolio turnover rate | 23% | 14% 5 | ||||
| Net assets, end of period (x 1,000) | $17,713 | $147 | ||||
| Security | Number of Shares | Value ($) |
| Affiliated Underlying Funds 99.3% of net assets | ||
| U.S. Stocks 55.8% | ||
| Large-Cap 49.3% | ||
| Schwab U.S. Large-Cap ETF | 138,325 | 8,725,541 |
| Small-Cap 6.5% | ||
| Schwab U.S. Small-Cap ETF | 16,723 | 1,156,061 |
| 9,881,602 | ||
| International Stocks 32.9% | ||
| Developed-Market Large-Cap 25.6% | ||
| Schwab International Equity ETF | 134,706 | 4,540,939 |
| Emerging-Market 7.3% | ||
| Schwab Emerging Markets Equity ETF | 45,056 | 1,293,107 |
| 5,834,046 | ||
| Real Assets 4.7% | ||
| Real Estate 4.7% | ||
| Schwab U.S. REIT ETF | 21,966 | 840,199 |
| Fixed Income 5.9% | ||
| Intermediate-Term Bond 5.7% | ||
| Schwab U.S. Aggregate Bond ETF | 19,710 | 1,005,604 |
| Security | Number of Shares | Value ($) |
| Treasury Bond 0.2% | ||
| Schwab Short-Term U.S. Treasury ETF | 704 | 35,088 |
| 1,040,692 | ||
| Total Affiliated Underlying Funds | ||
| (Cost $16,864,188) | 17,596,539 | |
| Issuer Rate, Maturity Date | Face Amount ($) | Value ($) |
| Short-Term Investment 0.7% of net assets | ||
| Time Deposit 0.7% | ||
| BNP Paribas | ||
| 1.05%, 04/02/18 (a) | 119,519 | 119,519 |
| Total Short-Term Investment | ||
| (Cost $119,519) | 119,519 | |
| (a) | The rate shown is the current daily overnight rate. |
| ETF — | Exchange-traded fund |
| REIT — | Real Estate Investment Trust |
| Affiliated Underlying Funds | Balance of Shares Held at 03/31/17 | Gross Purchases | Gross Sales | Balance of Shares Held at 03/31/18 | Net Change in Unrealized Appreciation (depreciation) | Realized Gains (Losses) | Distributions Received* |
| Schwab Emerging Markets Equity ETF | 6,826 | 41,755 | (3,525) | 45,056 | $24,221 | ($4,303) | $11,180 |
| Schwab International Equity ETF | 33,433 | 116,357 | (15,084) | 134,706 | 144,020 | (20,442) | 70,041 |
| Schwab Short-Term U.S. Treasury ETF | 131 | 573 | — | 704 | (277) | — | 215 |
| Schwab U.S. Aggregate Bond ETF | 3,741 | 17,455 | (1,486) | 19,710 | (14,227) | (2,617) | 11,752 |
| Schwab U.S. Large-Cap ETF | 35,193 | 123,276 | (20,144) | 138,325 | 381,910 | (23,479) | 94,870 |
| Schwab U.S. REIT ETF | 3,330 | 20,139 | (1,503) | 21,966 | (39,763) | (5,205) | 11,558 |
| Schwab U.S. Small-Cap ETF | 4,251 | 14,752 | (2,280) | 16,723 | 48,579 | (2,878) | 9,659 |
| Total | $544,463 | ($58,924) | $209,275 |
| * | Distributions received include distributions from net investment income and capital gains, if any, from the underlying funds. |
| Description | Quoted Prices in Active Markets for Identical Assets (Level 1) | Other Significant Observable Inputs (Level 2) | Significant Unobservable Inputs (Level 3) | Total | |
| Assets | |||||
| Affiliated Underlying Funds1 | $17,596,539 | $— | $— | $17,596,539 | |
| Short-Term Investment1 | — | 119,519 | — | 119,519 | |
| Total | $17,596,539 | $119,519 | $— | $17,716,058 |
| 1 | As categorized in Portfolio Holdings. |
| Assets | ||
| Investments in affiliated underlying funds, at value (cost $16,864,188) | $17,596,539 | |
| Investments in unaffiliated issuers, at value (cost $119,519) | 119,519 | |
| Receivables: | ||
| Fund shares sold | + | 109,569 |
| Total assets | 17,825,627 | |
| Liabilities | ||
| Payables: | ||
| Investments bought | 99,511 | |
| Investment adviser fees | 468 | |
| Fund shares redeemed | + | 12,377 |
| Total liabilities | 112,356 | |
| Net Assets | ||
| Total assets | 17,825,627 | |
| Total liabilities | – | 112,356 |
| Net assets | $17,713,271 | |
| Net Assets by Source | ||
| Capital received from investors | 16,997,121 | |
| Net investment income not yet distributed | 47,048 | |
| Net realized capital losses | (63,249) | |
| Net unrealized capital appreciation | 732,351 | |
| Net Asset Value (NAV) | ||||
| Net Assets | ÷ | Shares Outstanding | = | NAV |
| $17,713,271 | 1,487,419 | $11.91 | ||
| Investment Income | ||
| Dividends received from affiliated underlying funds | $209,275 | |
| Interest | + | 524 |
| Total investment income | 209,799 | |
| Expenses | ||
| Investment adviser and administrator fees | 7,485 | |
| Shareholder service fees: | ||
| Investor Shares1 | + | 275 |
| Total expenses | 7,760 | |
| Expense reduction by CSIM | – | 4,334 |
| Net expenses | – | 3,426 |
| Net investment income | 206,373 | |
| Realized and Unrealized Gains (Losses) | ||
| Net realized losses on sales of affiliated underlying funds | (58,924) | |
| Net change in unrealized appreciation (depreciation) on affiliated underlying funds | + | 544,463 |
| Net realized and unrealized gains | 485,539 | |
| Increase in net assets resulting from operations | $691,912 | |
| 1 | Effective July 24, 2017, the Investor Share class was consolidated into the Institutional Share class, resulting in a single class of shares of the fund (see financial note 1). |
| Operations | ||||
| 4/1/17-3/31/18 | 8/25/16*-3/31/17 | |||
| Net investment income | $206,373 | $36,689 | ||
| Net realized losses | (58,924) | (3,430) | ||
| Net change in unrealized appreciation (depreciation) | + | 544,463 | 187,888 | |
| Increase in net assets from operations | 691,912 | 221,147 | ||
| Distributions to Shareholders1 | ||||
| Distributions from net investment income | ||||
| Investor Shares | — | (26,235) | ||
| Institutional Shares | + | (167,658) | (2,347) | |
| Total distributions from net investment income | (167,658) | (28,582) | ||
| Distributions from net realized gains | ||||
| Investor Shares | — | — | ||
| Institutional Shares | + | (669) | — | |
| Total distributions from net realized gains | (669) | — | ||
| Total distributions | ($168,327) | ($28,582) | ||
| Transactions in Fund Shares1 | ||||||||
| 4/1/17-3/31/18 | 8/25/16*-3/31/17 | |||||||
| SHARES | VALUE | SHARES | VALUE | |||||
| Shares Sold | ||||||||
| Investor Shares | 17,867 | $192,529 | 376,557 | $3,828,247 | ||||
| Institutional Shares | + | 1,686,862 | 19,680,707 | 21,287 | 216,514 | |||
| Total shares sold | 1,704,729 | $19,873,236 | 397,844 | $4,044,761 | ||||
| Shares Reinvested | ||||||||
| Investor Shares | — | $— | 2,550 | $25,712 | ||||
| Institutional Shares | + | 13,482 | 162,317 | 233 | 2,347 | |||
| Total shares reinvested | 13,482 | $162,317 | 2,783 | $28,059 | ||||
| Shares Redeemed | ||||||||
| Investor Shares | (356,382) | ($3,887,407) | (40,592) | ($425,647) | ||||
| Institutional Shares | + | (226,707) | (2,717,640) | (7,738) | (80,558) | |||
| Total shares redeemed | (583,089) | ($6,605,047) | (48,330) | ($506,205) | ||||
| Net transactions in fund shares | 1,135,122 | $13,430,506 | 352,297 | $3,566,615 | ||||
| Shares Outstanding and Net Assets | ||||||||
| 4/1/17-3/31/18 | 8/25/16*-3/31/17 | |||||||
| SHARES | NET ASSETS | SHARES | NET ASSETS | |||||
| Beginning of period | 352,297 | $3,759,180 | — | $— | ||||
| Total increase | + | 1,135,122 | 13,954,091 | 352,297 | 3,759,180 | |||
| End of period | 1,487,419 | $17,713,271 | 352,297 | $3,759,180 | ||||
| Net investment income not yet distributed | $47,048 | $8,107 | ||||||
| * | Commencement of operations. |
| 1 | Effective July 24, 2017, there were no outstanding Investor Shares and the Investor Share class was consolidated into the Institutional Share class, resulting in a single class of shares of the fund (see financial note 1). |
| 4/1/17– 3/31/181 | 8/25/16 2– 3/31/17 | |||||
| Per-Share Data | ||||||
| Net asset value at beginning of period | $10.68 | $10.00 | ||||
| Income (loss) from investment operations: | ||||||
| Net investment income (loss)3 | 0.29 | 0.18 | ||||
| Net realized and unrealized gains (losses) | 1.12 | 0.62 | ||||
| Total from investment operations | 1.41 | 0.80 | ||||
| Less distributions: | ||||||
| Distributions from net investment income | (0.17) | (0.12) | ||||
| Distributions from net realized gains | (0.00) 4 | — | ||||
| Total distributions | (0.17) | (0.12) | ||||
| Net asset value at end of period | $11.92 | $10.68 | ||||
| Total return | 13.22% | 8.11% 5 | ||||
| Ratios/Supplemental Data | ||||||
| Ratios to average net assets: | ||||||
| Net operating expenses6 | 0.03% | 0.02% 7 | ||||
| Gross operating expenses6 | 0.08% | 0.08% 7 | ||||
| Net investment income (loss) | 2.43% | 2.94% 7 | ||||
| Portfolio turnover rate | 19% | 0% 5 | ||||
| Net assets, end of period (x 1,000) | $24,224 | $166 | ||||
| Security | Number of Shares | Value ($) |
| Affiliated Underlying Funds 99.5% of net assets | ||
| U.S. Stocks 56.5% | ||
| Large-Cap 49.7% | ||
| Schwab U.S. Large-Cap ETF | 190,996 | 12,048,028 |
| Small-Cap 6.8% | ||
| Schwab U.S. Small-Cap ETF | 23,761 | 1,642,598 |
| 13,690,626 | ||
| International Stocks 33.7% | ||
| Developed-Market Large-Cap 26.1% | ||
| Schwab International Equity ETF | 187,735 | 6,328,547 |
| Emerging-Market 7.6% | ||
| Schwab Emerging Markets Equity ETF | 63,815 | 1,831,490 |
| 8,160,037 | ||
| Real Assets 4.8% | ||
| Real Estate 4.8% | ||
| Schwab U.S. REIT ETF | 30,149 | 1,153,199 |
| Fixed Income 4.5% | ||
| Intermediate-Term Bond 4.3% | ||
| Schwab U.S. Aggregate Bond ETF | 20,623 | 1,052,186 |
| Security | Number of Shares | Value ($) |
| Treasury Bond 0.2% | ||
| Schwab Short-Term U.S. Treasury ETF | 750 | 37,380 |
| 1,089,566 | ||
| Total Affiliated Underlying Funds | ||
| (Cost $23,242,339) | 24,093,428 | |
| Issuer Rate, Maturity Date | Face Amount ($) | Value ($) |
| Short-Term Investment 0.7% of net assets | ||
| Time Deposit 0.7% | ||
| BNP Paribas | ||
| 1.05%, 04/02/18 (a) | 169,292 | 169,292 |
| Total Short-Term Investment | ||
| (Cost $169,292) | 169,292 | |
| (a) | The rate shown is the current daily overnight rate. |
| ETF — | Exchange-traded fund |
| REIT — | Real Estate Investment Trust |
| Affiliated Underlying Funds | Balance of Shares Held at 03/31/17 | Gross Purchases | Gross Sales | Balance of Shares Held at 03/31/18 | Net Change in Unrealized Appreciation (depreciation) | Realized Gains (Losses) | Distributions Received* |
| Schwab Emerging Markets Equity ETF | 9,127 | 56,970 | (2,282) | 63,815 | $23,044 | ($1,641) | $15,592 |
| Schwab International Equity ETF | 45,058 | 158,129 | (15,452) | 187,735 | 158,937 | (8,979) | 93,597 |
| Schwab Short-Term U.S. Treasury ETF | 139 | 611 | — | 750 | (267) | — | 217 |
| Schwab U.S. Aggregate Bond ETF | 4,231 | 17,337 | (945) | 20,623 | (14,652) | (1,634) | 11,717 |
| Schwab U.S. Large-Cap ETF | 47,185 | 166,279 | (22,468) | 190,996 | 442,541 | (16,075) | 122,209 |
| Schwab U.S. REIT ETF | 4,534 | 26,770 | (1,155) | 30,149 | (52,359) | (3,507) | 15,330 |
| Schwab U.S. Small-Cap ETF | 5,758 | 20,477 | (2,474) | 23,761 | 56,273 | (3,433) | 12,710 |
| Total | $613,517 | ($35,269) | $271,372 |
| * | Distributions received include distributions from net investment income and capital gains, if any, from the underlying funds. |
| Description | Quoted Prices in Active Markets for Identical Assets (Level 1) | Other Significant Observable Inputs (Level 2) | Significant Unobservable Inputs (Level 3) | Total | |
| Assets | |||||
| Affiliated Underlying Funds1 | $24,093,428 | $— | $— | $24,093,428 | |
| Short-Term Investment1 | — | 169,292 | — | 169,292 | |
| Total | $24,093,428 | $169,292 | $— | $24,262,720 |
| 1 | As categorized in Portfolio Holdings. |
| Assets | ||
| Investments in affiliated underlying funds, at value (cost $23,242,339) | $24,093,428 | |
| Investments in unaffiliated issuers, at value (cost $169,292) | 169,292 | |
| Receivables: | ||
| Fund shares sold | + | 717,515 |
| Total assets | 24,980,235 | |
| Liabilities | ||
| Payables: | ||
| Investments bought | 751,045 | |
| Investment adviser fees | 604 | |
| Fund shares redeemed | + | 4,957 |
| Total liabilities | 756,606 | |
| Net Assets | ||
| Total assets | 24,980,235 | |
| Total liabilities | – | 756,606 |
| Net assets | $24,223,629 | |
| Net Assets by Source | ||
| Capital received from investors | 23,347,293 | |
| Net investment income not yet distributed | 63,184 | |
| Net realized capital losses | (37,937) | |
| Net unrealized capital appreciation | 851,089 | |
| Net Asset Value (NAV) | ||||
| Net Assets | ÷ | Shares Outstanding | = | NAV |
| $24,223,629 | 2,032,648 | $11.92 | ||
| Investment Income | ||
| Dividends received from affiliated underlying funds | $271,372 | |
| Interest | + | 577 |
| Total investment income | 271,949 | |
| Expenses | ||
| Investment adviser and administrator fees | 9,313 | |
| Shareholder service fees: | ||
| Investor Shares1 | + | 343 |
| Total expenses | 9,656 | |
| Expense reduction by CSIM | – | 5,420 |
| Net expenses | – | 4,236 |
| Net investment income | 267,713 | |
| Realized and Unrealized Gains (Losses) | ||
| Net realized losses on sales of affiliated underlying funds | (35,269) | |
| Net change in unrealized appreciation (depreciation) on affiliated underlying funds | + | 613,517 |
| Net realized and unrealized gains | 578,248 | |
| Increase in net assets resulting from operations | $845,961 | |
| 1 | Effective July 24, 2017, the Investor Share class was consolidated into the Institutional Share class, resulting in a single class of shares of the fund (see financial note 1). |
| Operations | ||||
| 4/1/17-3/31/18 | 8/25/16*-3/31/17 | |||
| Net investment income | $267,713 | $49,550 | ||
| Net realized gains (losses) | (35,269) | — | ||
| Net change in unrealized appreciation (depreciation) | + | 613,517 | 237,572 | |
| Increase in net assets from operations | 845,961 | 287,122 | ||
| Distributions to Shareholders1 | ||||
| Distributions from net investment income | ||||
| Investor Shares | — | (36,773) | ||
| Institutional Shares | + | (216,720) | (1,246) | |
| Total distributions from net investment income | (216,720) | (38,019) | ||
| Distributions from net realized gains | ||||
| Investor Shares | — | — | ||
| Institutional Shares | + | (2,008) | — | |
| Total distributions from net realized gains | (2,008) | — | ||
| Total distributions | ($218,728) | ($38,019) | ||
| Transactions in Fund Shares1 | ||||||||
| 4/1/17-3/31/18 | 8/25/16*-3/31/17 | |||||||
| SHARES | VALUE | SHARES | VALUE | |||||
| Shares Sold | ||||||||
| Investor Shares | 24,825 | $268,264 | 462,701 | $4,699,657 | ||||
| Institutional Shares | + | 2,376,464 | 27,814,838 | 15,408 | 157,668 | |||
| Total shares sold | 2,401,289 | $28,083,102 | 478,109 | $4,857,325 | ||||
| Shares Reinvested | ||||||||
| Investor Shares | — | $— | 3,611 | $36,445 | ||||
| Institutional Shares | + | 17,393 | 209,765 | 124 | 1,246 | |||
| Total shares reinvested | 17,393 | $209,765 | 3,735 | $37,691 | ||||
| Shares Redeemed | ||||||||
| Investor Shares | (480,678) | ($5,239,087) | (10,459) | ($110,053) | ||||
| Institutional Shares | + | (376,711) | (4,491,147) | (30) | (303) | |||
| Total shares redeemed | (857,389) | ($9,730,234) | (10,489) | ($110,356) | ||||
| Net transactions in fund shares | 1,561,293 | $18,562,633 | 471,355 | $4,784,660 | ||||
| Shares Outstanding and Net Assets | ||||||||
| 4/1/17-3/31/18 | 8/25/16*-3/31/17 | |||||||
| SHARES | NET ASSETS | SHARES | NET ASSETS | |||||
| Beginning of period | 471,355 | $5,033,763 | — | $— | ||||
| Total increase | + | 1,561,293 | 19,189,866 | 471,355 | 5,033,763 | |||
| End of period | 2,032,648 | $24,223,629 | 471,355 | $5,033,763 | ||||
| Net investment income not yet distributed | $63,184 | $11,531 | ||||||
| * | Commencement of operations. |
| 1 | Effective July 24, 2017, all outstanding Investor Shares (21,010 shares valued at $237,542) were consolidated into the Institutional Shares, resulting in a single class of shares of the fund (see financial note 1). |
| SCHWAB CAPITAL TRUST (ORGANIZED MAY 7, 1993) | |
| Schwab Target 2010 Index Fund | Schwab Dividend Equity Fund™ |
| Schwab Target 2015 Index Fund | Schwab Large-Cap Growth Fund™ |
| Schwab Target 2020 Index Fund | Schwab Small-Cap Equity Fund™ |
| Schwab Target 2025 Index Fund | Schwab Hedged Equity Fund™ |
| Schwab Target 2030 Index Fund | Schwab Health Care Fund™ |
| Schwab Target 2035 Index Fund | Schwab® International Core Equity Fund |
| Schwab Target 2040 Index Fund | Schwab Target 2010 Fund |
| Schwab Target 2045 Index Fund | Schwab Target 2015 Fund |
| Schwab Target 2050 Index Fund | Schwab Target 2020 Fund |
| Schwab Target 2055 Index Fund | Schwab Target 2025 Fund |
| Schwab Target 2060 Index Fund | Schwab Target 2030 Fund |
| Schwab ® S&P 500 Index Fund | Schwab Target 2035 Fund |
| Schwab Small-Cap Index Fund® | Schwab Target 2040 Fund |
| Schwab Total Stock Market Index Fund® | Schwab Target 2045 Fund |
| Schwab ® U.S. Large-Cap Growth Index Fund | Schwab Target 2050 Fund |
| Schwab ® U.S. Large-Cap Value Index Fund | Schwab Target 2055 Fund |
| Schwab ® U.S. Mid-Cap Index Fund | Schwab Target 2060 Fund |
| Schwab International Index Fund® | Schwab Fundamental US Large Company Index Fund |
| Schwab MarketTrack All Equity Portfolio™ | Schwab Fundamental US Small Company Index Fund |
| Schwab MarketTrack Growth Portfolio™ | Schwab Fundamental International Large Company Index Fund |
| Schwab MarketTrack Balanced Portfolio™ | Schwab Fundamental International Small Company Index Fund |
| Schwab MarketTrack Conservative Portfolio™ | Schwab Fundamental Emerging Markets Large Company Index Fund |
| Laudus Small-Cap MarketMasters Fund™ | Schwab Fundamental Global Real Estate Index Fund |
| Laudus International MarketMasters Fund™ | Schwab® Monthly Income Fund - Moderate Payout |
| Schwab Balanced Fund | Schwab® Monthly Income Fund - Enhanced Payout |
| Schwab Core Equity Fund™ | Schwab ® Monthly Income Fund - Maximum Payout |
2. Significant Accounting Policies:
3. Risk Factors:
4. Affiliates and Affiliated Transactions:
| Underlying Funds | Schwab Target 2010 Index Fund | Schwab Target 2015 Index Fund | Schwab Target 2020 Index Fund | Schwab Target 2025 Index Fund | Schwab Target 2030 Index Fund | Schwab Target 2035 Index Fund | Schwab Target 2040 Index Fund | Schwab Target 2045 Index Fund | Schwab Target 2050 Index Fund | Schwab Target 2055 Index Fund | Schwab Target 2060 Index Fund |
| Schwab Emerging Markets Equity ETF | —% | —% | 0.0%* | 0.0%* | 0.1% | 0.1% | 0.1% | 0.1% | 0.0%* | 0.0%* | 0.0%* |
| Schwab International Equity ETF | 0.0%* | 0.0%* | 0.1% | 0.1% | 0.1% | 0.1% | 0.1% | 0.1% | 0.1% | 0.0%* | 0.0%* |
| Schwab Short-Term U.S. Treasury ETF | 0.1% | 0.1% | 0.2% | 0.1% | 0.1% | 0.0%* | 0.0%* | 0.0%* | 0.0%* | 0.0%* | 0.0%* |
| Schwab U.S. Aggregate Bond ETF | 0.1% | 0.2% | 0.5% | 0.5% | 0.6% | 0.3% | 0.2% | 0.1% | 0.1% | 0.0%* | 0.0%* |
| Schwab U.S. Large-Cap ETF | 0.0%* | 0.0%* | 0.2% | 0.2% | 0.4% | 0.2% | 0.3% | 0.2% | 0.2% | 0.1% | 0.1% |
| Schwab U.S. REIT ETF | 0.0%* | 0.0%* | 0.0%* | 0.1% | 0.1% | 0.1% | 0.1% | 0.1% | 0.0%* | 0.0%* | 0.0%* |
| Schwab U.S. Small-Cap ETF | 0.0%* | 0.0%* | 0.0%* | 0.0%* | 0.1% | 0.0%* | 0.1% | 0.0%* | 0.0%* | 0.0%* | 0.0%* |
| Schwab U.S. TIPS ETF | 0.0%* | 0.0%* | 0.1% | 0.0%* | —% | —% | —% | —% | —% | —% | —% |
| Schwab Variable Share Price Money Fund, Ultra Shares | 0.0%* | 0.1% | 0.2% | 0.1% | 0.1% | 0.1% | 0.0%* | —% | —% | —% | —% |
| * | Less than 0.05% |
5. Board of Trustees:
6. Borrowing from Banks:
7. Purchases and Sales of Investment Securities:
| Purchases of Securities | Sales of Securities | |
| Schwab Target 2010 Index Fund | $12,678,450 | $2,285,286 |
| Schwab Target 2015 Index Fund | 19,484,112 | 5,166,094 |
| Schwab Target 2020 Index Fund | 63,559,724 | 7,454,886 |
| Schwab Target 2025 Index Fund | 70,058,253 | 6,739,079 |
| Schwab Target 2030 Index Fund | 94,437,980 | 4,131,278 |
| Schwab Target 2035 Index Fund | 52,119,308 | 4,801,053 |
| Schwab Target 2040 Index Fund | 62,927,756 | 5,894,212 |
| Schwab Target 2045 Index Fund | 36,965,421 | 2,555,897 |
| Schwab Target 2050 Index Fund | 32,707,043 | 2,698,194 |
| Schwab Target 2055 Index Fund | 15,586,883 | 2,222,343 |
| Schwab Target 2060 Index Fund | 20,755,786 | 2,234,074 |
8. Federal Income Taxes:
| Schwab Target 2010 Index Fund | Schwab Target 2015 Index Fund | Schwab Target 2020 Index Fund | Schwab Target 2025 Index Fund | Schwab Target 2030 Index Fund | Schwab Target 2035 Index Fund | Schwab Target 2040 Index Fund | |||||||
| Tax cost | $13,973,465 | $20,108,837 | $69,956,767 | $81,937,592 | $107,209,023 | $60,587,375 | $70,417,179 | ||||||
| Gross unrealized appreciation | $301,274 | $368,369 | $1,416,216 | $2,635,987 | $2,734,577 | $2,274,027 | $2,647,646 | ||||||
| Gross unrealized depreciation | (134,754) | (134,680) | (545,266) | (637,886) | (685,564) | (342,862) | (319,622) | ||||||
| Net unrealized appreciation (depreciation) | $166,520 | $233,689 | $870,950 | $1,998,101 | $2,049,013 | $1,931,165 | $2,328,024 |
| Schwab Target 2045 Index Fund | Schwab Target 2050 Index Fund | Schwab Target 2055 Index Fund | Schwab Target 2060 Index Fund | ||||
| Tax cost | $43,253,951 | $36,599,143 | $17,046,956 | $23,449,568 | |||
| Gross unrealized appreciation | $1,771,321 | $1,110,189 | $723,794 | $880,350 | |||
| Gross unrealized depreciation | (179,422) | (120,150) | (54,692) | (67,198) | |||
| Net unrealized appreciation (depreciation) | $1,591,899 | $990,039 | $669,102 | $813,152 |
| Schwab Target 2010 Index Fund | Schwab Target 2015 Index Fund | Schwab Target 2020 Index Fund | Schwab Target 2025 Index Fund | Schwab Target 2030 Index Fund | Schwab Target 2035 Index Fund | Schwab Target 2040 Index Fund | |||||||
| Undistributed ordinary income | $51,052 | $58,482 | $275,138 | $322,596 | $350,501 | $208,673 | $215,455 | ||||||
| Undistributed long-term capital gains | — | — | — | — | — | — | — | ||||||
| Net unrealized appreciation (depreciation) on investments | 166,520 | 233,689 | 870,950 | 1,998,101 | 2,049,013 | 1,931,165 | 2,328,024 | ||||||
| Total | $217,572 | $292,171 | $1,146,088 | $2,320,697 | $2,399,514 | $2,139,838 | $2,543,479 |
| Schwab Target 2045 Index Fund | Schwab Target 2050 Index Fund | Schwab Target 2055 Index Fund | Schwab Target 2060 Index Fund | ||||
| Undistributed ordinary income | $130,761 | $96,398 | $47,048 | $63,184 | |||
| Undistributed long-term capital gains | — | — | — | — | |||
| Net unrealized appreciation (depreciation) on investments | 1,591,899 | 990,039 | 669,102 | 813,152 | |||
| Total | $1,722,660 | $1,086,437 | $716,150 | $876,336 |
| Schwab Target 2010 Index Fund | Schwab Target 2015 Index Fund | Schwab Target 2020 Index Fund | Schwab Target 2025 Index Fund | Schwab Target 2030 Index Fund | Schwab Target 2035 Index Fund | Schwab Target 2040 Index Fund | |
| Current period distributions | |||||||
| Ordinary income | $135,570 | $188,670 | $593,229 | $805,306 | $904,232 | $604,017 | $687,787 |
| Long-term capital gains | — | — | — | — | — | — | — |
| Prior period distributions | |||||||
| Ordinary income | $10,914 | $24,730 | $30,146 | $71,373 | $69,393 | $61,997 | $56,337 |
| Long-term capital gains | — | — | — | — | — | — | — |
| Schwab Target 2045 Index Fund | Schwab Target 2050 Index Fund | Schwab Target 2055 Index Fund | Schwab Target 2060 Index Fund | |
| Current period distributions | ||||
| Ordinary income | $435,414 | $312,886 | $168,327 | $218,728 |
| Long-term capital gains | — | — | — | — |
| Prior period distributions | ||||
| Ordinary income | $40,431 | $27,065 | $28,582 | $38,019 |
| Long-term capital gains | — | — | — | — |
| Schwab Target 2010 Index Fund | Schwab Target 2015 Index Fund | Schwab Target 2020 Index Fund | Schwab Target 2025 Index Fund | Schwab Target 2030 Index Fund | Schwab Target 2035 Index Fund | Schwab Target 2040 Index Fund | |
| Capital shares | $— | $— | $— | $— | $— | $— | $— |
| Undistributed net investment income | 6,722 | 1,917 | 66,150 | 55,678 | 29,446 | 32,965 | 15,612 |
| Net realized capital gains (losses) | (6,722) | (1,917) | (66,150) | (55,678) | (29,446) | (32,965) | (15,612) |
| Schwab Target 2045 Index Fund | Schwab Target 2050 Index Fund | Schwab Target 2055 Index Fund | Schwab Target 2060 Index Fund | |
| Capital shares | $— | $— | $— | $— |
| Undistributed net investment income | 12,847 | 118 | 226 | 660 |
| Net realized capital gains (losses) | (12,847) | (118) | (226) | (660) |
9. Subsequent Events:
San Francisco, California
May 17, 2018
| Foreign Tax Credit | Foreign Source Income | |
| Schwab Target 2010 Index Fund | $2,057 | $24,504 |
| Schwab Target 2015 Index Fund | 2,633 | 31,374 |
| Schwab Target 2020 Index Fund | 13,387 | 157,096 |
| Schwab Target 2025 Index Fund | 21,282 | 248,193 |
| Schwab Target 2030 Index Fund | 29,688 | 344,906 |
| Schwab Target 2035 Index Fund | 20,625 | 238,544 |
| Schwab Target 2040 Index Fund | 25,979 | 299,330 |
| Schwab Target 2045 Index Fund | 17,676 | 203,417 |
| Schwab Target 2050 Index Fund | 12,998 | 149,342 |
| Schwab Target 2055 Index Fund | 7,052 | 80,927 |
| Schwab Target 2060 Index Fund | 9,495 | 108,803 |
| Percentage | |
| Schwab Target 2010 Index Fund | 21.58 |
| Schwab Target 2015 Index Fund | 22.40 |
| Schwab Target 2020 Index Fund | 24.99 |
| Schwab Target 2025 Index Fund | 30.72 |
| Schwab Target 2030 Index Fund | 34.64 |
| Schwab Target 2035 Index Fund | 36.69 |
| Schwab Target 2040 Index Fund | 40.17 |
| Schwab Target 2045 Index Fund | 40.76 |
| Schwab Target 2050 Index Fund | 43.62 |
| Schwab Target 2055 Index Fund | 43.79 |
| Schwab Target 2060 Index Fund | 43.37 |
| Schwab Target 2010 Index Fund | $47,163 |
| Schwab Target 2015 Index Fund | 67,749 |
| Schwab Target 2020 Index Fund | 255,526 |
| Schwab Target 2025 Index Fund | 425,782 |
| Schwab Target 2030 Index Fund | 559,091 |
| Schwab Target 2035 Index Fund | 397,515 |
| Schwab Target 2040 Index Fund | 500,202 |
| Schwab Target 2045 Index Fund | 329,488 |
| Schwab Target 2050 Index Fund | 248,125 |
| Schwab Target 2055 Index Fund | 136,047 |
| Schwab Target 2060 Index Fund | 177,500 |
| Independent Trustees | |||
| Name, Year of Birth, and Position(s) with the trust (Terms of office, and length of Time Served1) | Principal Occupations During the Past Five Years | Number of Portfolios in Fund Complex Overseen by the Trustee | Other Directorships |
| Robert W. Burns 1959 Trustee (Trustee of Schwab Strategic Trust since 2009; The Charles Schwab Family of Funds, Schwab Investments, Schwab Capital Trust, Schwab Annuity Portfolios and Laudus Trust since 2016) | Retired/Private Investor (Jan. 2009 – present). Formerly, Managing Director, Pacific Investment Management Company, LLC (PIMCO) (investment management firm) and President, PIMCO Funds. | 108 | Director, PS Business Parks, Inc. (2005 – 2012) |
| John F. Cogan 1947 Trustee (Trustee of The Charles Schwab Family of Funds, Schwab Investments, Schwab Capital Trust and Schwab Annuity Portfolios since 2008; Laudus Trust since 2010; Schwab Strategic Trust since 2016) | Senior Fellow, The Hoover Institution at Stanford University (public policy think tank) (Oct. 1979 – present); Senior Fellow, Stanford Institute for Economic Policy Research (2000 – present); Professor of Public Policy, Stanford University (1994 – 2015). | 108 | Director, Gilead Sciences, Inc. (2005 – present) |
| Stephen Timothy Kochis 1946 Trustee (Trustee of Schwab Strategic Trust since 2012; The Charles Schwab Family of Funds, Schwab Investments, Schwab Capital Trust, Schwab Annuity Portfolios and Laudus Trust since 2016) | CEO and Owner, Kochis Global (wealth management consulting) (May 2012 – present); Chairman and CEO, Aspiriant, LLC (wealth management) (Jan. 2008 – Apr. 2012). | 108 | None |
| David L. Mahoney 1954 Trustee (Trustee of The Charles Schwab Family of Funds, Schwab Investments, Schwab Capital Trust, Schwab Annuity Portfolios and Laudus Trust since 2011; Schwab Strategic Trust since 2016) | Private Investor. | 108 | Director, Symantec Corporation (2003 – present) Director, Corcept Therapeutics Incorporated (2004 – present) Director, Adamas Pharmaceuticals, Inc. (2009 – present) |
| Independent Trustees (continued) | |||
| Name, Year of Birth, and Position(s) with the trust (Terms of office, and length of Time Served1) | Principal Occupations During the Past Five Years | Number of Portfolios in Fund Complex Overseen by the Trustee | Other Directorships |
| Kiran M. Patel 1948 Trustee (Trustee of The Charles Schwab Family of Funds, Schwab Investments, Schwab Capital Trust, Schwab Annuity Portfolios and Laudus Trust since 2011; Schwab Strategic Trust since 2016) | Retired. Executive Vice President and General Manager of Small Business Group, Intuit, Inc. (financial software and services firm for consumers and small businesses) (Dec. 2008 – Sept. 2013). | 108 | Director, KLA-Tencor Corporation (2008 – present) |
| Kimberly S. Patmore 1956 Trustee (Trustee of The Charles Schwab Family of Funds, Schwab Investments, Schwab Capital Trust, Schwab Annuity Portfolios, Schwab Strategic Trust and Laudus Trust since 2016) | Consultant, Patmore Management Consulting (management consulting) (2008 – present). | 108 | None |
| Charles A. Ruffel 1956 Trustee (Trustee of Schwab Strategic Trust since 2009; The Charles Schwab Family of Funds, Schwab Investments, Schwab Capital Trust, Schwab Annuity Portfolios and Laudus Trust since 2015) | Co-Chief Executive Officer, Kudu Investment Management, LLC (financial services) (Jan. 2015 – present); Partner, Kudu Advisors, LLC (financial services) (June 2008 – Jan. 2015); Advisor, Asset International, Inc. (publisher of financial services information) (Aug. 2008 – Jan. 2015). | 108 | None |
| Gerald B. Smith 1950 Trustee (Trustee of The Charles Schwab Family of Funds, Schwab Investments, Schwab Capital Trust and Schwab Annuity Portfolios since 2000; Laudus Trust since 2010; Schwab Strategic Trust since 2016) | Chairman, Chief Executive Officer and Founder of Smith Graham & Co. (investment advisors) (Mar. 1990 – present). | 108 | Director, Eaton (2012 – present) Director and Chairman of the Audit Committee, Oneok Partners LP (2003 – 2013) Director, Oneok, Inc. (2009 – 2013) Lead Independent Director, Board of Cooper Industries (2002 – 2012) |
| Joseph H. Wender 1944 Trustee (Trustee of The Charles Schwab Family of Funds, Schwab Investments, Schwab Capital Trust and Schwab Annuity Portfolios since 2008; Laudus Trust since 2010; Schwab Strategic Trust since 2016) | Senior Consultant, Goldman Sachs & Co., Inc. (investment banking and securities firm) (Jan. 2008 – present); Co-CEO, Colgin Cellars, LLC (vineyards) (Feb. 1998 – present). | 108 | Board Member and Chairman of the Audit Committee, Ionis Pharmaceuticals (1994 – present) Lead Independent Director and Chair of Audit Committee, OUTFRONT Media Inc. (2014 – present) |
| Interested Trustees | |||
| Name, Year of Birth, and Position(s) with the trust (Terms of office, and length of Time Served1) | Principal Occupations During the Past Five Years | Number of Portfolios in Fund Complex Overseen by the Trustee | Other Directorships |
| Walter W. Bettinger II2 1960 Chairman and Trustee (Trustee of The Charles Schwab Family of Funds, Schwab Investments, Schwab Capital Trust and Schwab Annuity Portfolios since 2008; Schwab Strategic Trust since 2009; Laudus Trust since 2010) | Director, President and Chief Executive Officer, The Charles Schwab Corporation (Oct. 2008 – present); President and Chief Executive Officer (Oct. 2008 – present), Director (May 2008 – present), Charles Schwab & Co., Inc.; Director, Charles Schwab Bank (Apr. 2006 – present); Director (May 2008 – present), President and Chief Executive Officer (Aug. 2017 – present), Schwab Holdings, Inc.; and Director, Charles Schwab Investment Management, Inc. (July 2016 – present). | 108 | Director, The Charles Schwab Corporation (2008 – present) |
| Marie A. Chandoha2 1961 Trustee (Trustee of The Charles Schwab Family of Funds, Schwab Investments, Schwab Capital Trust, Schwab Annuity Portfolios, Schwab Strategic Trust and Laudus Trust since 2016) | Director, President and Chief Executive Officer (Dec. 2010 – present), Chief Investment Officer (Sept. 2010 – Oct. 2011), Charles Schwab Investment Management, Inc.; Trustee (Jan. 2016 – present), President, Chief Executive Officer (Dec. 2010 – present), and Chief Investment Officer (Sept. 2010 – Oct. 2011), Schwab Funds, Laudus Funds and Schwab ETFs; Director, Charles Schwab Worldwide Funds plc and Charles Schwab Asset Management (Ireland) Limited (Jan. 2011 – present); Global Head of Fixed Income Business Division, BlackRock, Inc. (formerly Barclays Global Investors) (investment management firm) (Mar. 2007 – Aug. 2010). | 108 | None |
| Joseph R. Martinetto2 1962 Trustee (Trustee of The Charles Schwab Family of Funds, Schwab Investments, Schwab Capital Trust, Schwab Annuity Portfolios, Schwab Strategic Trust and Laudus Trust since 2016) | Chief Operating Officer (Feb. 2018 – present), Senior Executive Vice President (July 2015 – Feb. 2018), The Charles Schwab Corporation; Senior Executive Vice President, Charles Schwab & Co., Inc. (July 2015 – present); Chief Financial Officer (July 2015 – Aug. 2017), Executive Vice President and Chief Financial Officer (May 2007 – July 2015), The Charles Schwab Corporation and Charles Schwab & Co., Inc.; Director, Charles Schwab & Co., Inc. (May 2007 – present); Director (Apr. 2010 – present) and Chief Executive Officer (July 2013 – Apr. 2015), Charles Schwab Bank; Director (May 2007 – present), Chief Financial Officer (May 2007 – Aug. 2017), Senior Executive Vice President (Feb. 2016 – present), and Executive Vice President (May 2007 – Feb. 2016), Schwab Holdings, Inc. | 108 | None |
| Officers of the Trust | |
| Name, Year of Birth, and Position(s) with the trust (Terms of office, and length of Time Served3) | Principal Occupations During the Past Five Years |
| Marie A. Chandoha 1961 President and Chief Executive Officer (Officer of The Charles Schwab Family of Funds, Schwab Investments, Schwab Capital Trust, Schwab Annuity Portfolios, Schwab Strategic Trust and Laudus Trust since 2010) | Director, President and Chief Executive Officer (Dec. 2010 – present), Chief Investment Officer (Sept. 2010 – Oct. 2011), Charles Schwab Investment Management, Inc.; Trustee (Jan. 2016 – present), President, Chief Executive Officer (Dec. 2010 – present), and Chief Investment Officer (Sept. 2010 – Oct. 2011), Schwab Funds, Laudus Funds and Schwab ETFs; Director, Charles Schwab Worldwide Funds plc and Charles Schwab Asset Management (Ireland) Limited (Jan. 2011 – present); Global Head of Fixed Income Business Division, BlackRock, Inc. (formerly Barclays Global Investors) (investment management firm) (Mar. 2007 – Aug. 2010). |
| Officers of the Trust (continued) | |
| Name, Year of Birth, and Position(s) with the trust (Terms of office, and length of Time Served3) | Principal Occupations During the Past Five Years |
| Mark Fischer 1970 Treasurer and Chief Financial Officer (Officer of The Charles Schwab Family of Funds, Schwab Investments, Schwab Capital Trust, Schwab Annuity Portfolios, Schwab Strategic Trust and Laudus Trust since 2013) | Treasurer and Chief Financial Officer, Schwab Funds, Laudus Funds and Schwab ETFs (Jan. 2016 – present); Assistant Treasurer, Schwab Funds and Laudus Funds (Dec. 2013 – Dec. 2015), Schwab ETFs (Nov. 2013 – Dec. 2015); Vice President, Charles Schwab Investment Management, Inc. (Oct. 2013 – present); Executive Director, J.P. Morgan Investor Services (Apr. 2011 – Sept. 2013); Assistant Treasurer, Massachusetts Financial Service Investment Management (May 2005 – Mar. 2011). |
| George Pereira 1964 Senior Vice President and Chief Operating Officer (Officer of The Charles Schwab Family of Funds, Schwab Investments, Schwab Capital Trust and Schwab Annuity Portfolios since 2004; Laudus Trust since 2006; Schwab Strategic Trust since 2009) | Senior Vice President and Chief Financial Officer (Nov. 2004 – present), Chief Operating Officer (Jan. 2011 – present), Charles Schwab Investment Management, Inc.; Senior Vice President and Chief Operating Officer (Jan. 2016 – present), Treasurer and Chief Financial Officer, Laudus Funds (June 2006 – Dec. 2015); Treasurer and Principal Financial Officer, Schwab Funds (Nov. 2004 – Dec. 2015) and Schwab ETFs (Oct. 2009 – Dec. 2015); Director, Charles Schwab Worldwide Funds plc and Charles Schwab Asset Management (Ireland) Limited (Apr. 2005 – present). |
| Omar Aguilar 1970 Senior Vice President and Chief Investment Officer – Equities and Multi-Asset Strategies (Officer of The Charles Schwab Family of Funds, Schwab Investments, Schwab Capital Trust, Schwab Annuity Portfolios, Schwab Strategic Trust and Laudus Trust since 2011) | Senior Vice President and Chief Investment Officer – Equities and Multi-Asset Strategies, Charles Schwab Investment Management, Inc. (Apr. 2011 – present); Senior Vice President and Chief Investment Officer – Equities, Schwab Funds, Laudus Funds and Schwab ETFs (June 2011 – present); Head of the Portfolio Management Group and Vice President of Portfolio Management, Financial Engines, Inc. (investment management firm) (May 2009 – Apr. 2011); Head of Quantitative Equity, ING Investment Management (July 2004 – Jan. 2009). |
| Brett Wander 1961 Senior Vice President and Chief Investment Officer – Fixed Income (Officer of The Charles Schwab Family of Funds, Schwab Investments, Schwab Capital Trust, Schwab Annuity Portfolios, Schwab Strategic Trust and Laudus Trust since 2011) | Senior Vice President and Chief Investment Officer – Fixed Income, Charles Schwab Investment Management, Inc. (Apr. 2011 – present); Senior Vice President and Chief Investment Officer – Fixed Income, Schwab Funds, Laudus Funds and Schwab ETFs (June 2011 – present); Senior Managing Director, Global Head of Active Fixed-Income Strategies, State Street Global Advisors (Jan. 2008 – Oct. 2010); Director of Alpha Strategies Loomis, Sayles & Company (investment management firm) (Apr. 2006 – Jan. 2008). |
| David Lekich 1964 Chief Legal Officer and Secretary, Schwab Funds and Schwab ETFs Vice President and Assistant Clerk, Laudus Funds (Officer of The Charles Schwab Family of Funds, Schwab Investments, Schwab Capital Trust, Schwab Annuity Portfolios, Schwab Strategic Trust and Laudus Trust since 2011) | Senior Vice President (Sept. 2011 – present), Vice President (Mar. 2004 – Sept. 2011), Charles Schwab & Co., Inc.; Senior Vice President and Chief Counsel (Sept. 2011 – present), Vice President (Jan. 2011 – Sept. 2011), Charles Schwab Investment Management, Inc.; Secretary (Apr. 2011 – present) and Chief Legal Officer (Dec. 2011 – present), Schwab Funds; Vice President and Assistant Clerk, Laudus Funds (Apr. 2011 – present); Secretary (May 2011 – present) and Chief Legal Officer (Nov. 2011 – present), Schwab ETFs. |
| Catherine MacGregor 1964 Vice President and Assistant Secretary, Schwab Funds and Schwab ETFs Chief Legal Officer, Vice President and Clerk, Laudus Funds (Officer of The Charles Schwab Family of Funds, Schwab Investments, Schwab Capital Trust, Schwab Annuity Portfolios and Laudus Trust since 2005; Schwab Strategic Trust since 2009) | Vice President, Charles Schwab & Co., Inc., Charles Schwab Investment Management, Inc. (July 2005 – present); Vice President (Dec. 2005 – present), Chief Legal Officer and Clerk (Mar. 2007 – present), Laudus Funds; Vice President (Nov. 2005 – present) and Assistant Secretary (June 2007 – present), Schwab Funds; Vice President and Assistant Secretary, Schwab ETFs (Oct. 2009 – present). |
| 1 | Each Trustee shall hold office until the election and qualification of his or her successor, or until he or she dies, resigns or is removed. The retirement policy requires that each independent trustee retire by December 31 of the year in which the Trustee turns 74 or the Trustee’s twentieth year of service as an independent trustee on any trust in the Fund Complex, whichever occurs first. |
| 2 | Mr. Bettinger, Ms. Chandoha and Mr. Martinetto are Interested Trustees. Mr. Bettinger is an Interested Trustee because he owns stock of The Charles Schwab Corporation (CSC), the parent company of Charles Schwab Investment Management, Inc. (CSIM), the investment adviser for the trusts in the Fund Complex, is an employee and director of Charles Schwab & Co., Inc. (CS&Co), the principal underwriter for The Charles Schwab Family of Funds, Schwab Investments, Schwab Capital Trust and Schwab Annuity Portfolios, and is a director of CSIM. Ms. Chandoha is an Interested Trustee because she owns stock of CSC and is an employee and director of CSIM. Mr. Martinetto is an Interested Trustee because he owns stock of CSC and is an employee and director of CS&Co. |
| 3 | The President, Treasurer and Secretary/Clerk hold office until their respective successors are chosen and qualified or until he or she sooner dies, resigns, is removed or becomes disqualified. Each of the other officers serves at the pleasure of the Board. |
THIS IS NOT PART OF THE SHAREHOLDER REPORT
INFORMATION.
INFORMATION.
Partnership
The Schwab Funds Family®
Member SIPC®
Printed on recycled paper.
| 1 | You could lose money by investing in the Schwab Money Funds. All Schwab Money Funds with the exception of Schwab Variable Share Price Money Fund seek to preserve the value of your investment at $1.00 per share, but cannot guarantee they will do so. Because the share price of Schwab Variable Share Price Money Fund will fluctuate, when you sell your shares they may be worth more or less than what you originally paid for them. All Schwab Money Funds with the exception of Schwab Government Money Fund, Schwab Retirement Government Money Fund, Schwab U.S. Treasury Money Fund, Schwab Treasury Obligations Money Fund and Schwab Government Money Market Portfolio may impose a fee upon the sale of your shares or may temporarily suspend your ability to sell shares if the Fund’s liquidity falls below required minimums because of market conditions or other factors. An investment in the Schwab Money Funds is not insured or guaranteed by the Federal Deposit Insurance Corporation or any other government agency. The Schwab Money Funds’ sponsor has no legal obligation to provide financial support to the Funds, and you should not expect that the sponsor will provide financial support to the Funds at any time. |
00209189
Table of Contents
Item 2: Code of Ethics.
| (a) | Registrant has adopted a code of ethics that applies to its principal executive officer, principal financial officer, and any other persons who perform a similar function, regardless of whether these individuals are employed by Registrant or a third party. | |
| (c) | During the period covered by the report, no amendments were made to the provisions of this code of ethics. | |
| (d) | During the period covered by the report, Registrant did not grant any waivers, including implicit waivers, from the provisions of this code of ethics. | |
| (f)(1) | Registrant has filed this code of ethics as an exhibit pursuant to Item 12(a)(1) of Form N-CSR. | |
Item 3: Audit Committee Financial Expert.
Registrant’s Board of Trustees has determined that Kiran M. Patel, Robert W. Burns and Kimberly S. Patmore, each currently serving on its audit, compliance and valuation committee, are each an “audit committee financial expert,” as such term is defined in Item 3 of Form N-CSR. Each member of Registrant’s audit, compliance and valuation committee is “independent” under the standards set forth in Item 3 of Form N-CSR.
The designation of each of Mr. Patel, Mr. Burns and Ms. Patmore as an “audit committee financial expert” pursuant to Item 3 of Form N-CSR does not (i) impose upon such individual any duties, obligations, or liability that are greater than the duties, obligations and liability imposed upon such individual as a member of Registrant’s audit, compliance and valuation committee or Board of Trustees in the absence of such designation; and (ii) affect the duties, obligations or liability of any other member of Registrant’s audit, compliance and valuation committee or Board of Trustees.
Item 4: Principal Accountant Fees and Services.
Registrant is composed of fifty-two series. Eleven series have a fiscal year-end of March 31, whose annual financial statements are reported in Item 1, three series have a fiscal year-end of December 31, thirty-seven series have a fiscal year-end of October 31, and one series has a fiscal year-end of February 28. Principal accountant fees disclosed in Items 4(a)-(d) and 4(g) include fees billed for services rendered to the forty-nine operational series during 2018 and 2017, based on their respective 2017/2018 and 2016/2017 fiscal years, as applicable.
Table of Contents
The following table presents fees billed by the principal accountant in each of the last two fiscal years for the services rendered to the Funds:
(a) Audit Fees | (b) Audit-Related Fees1 | (c) Tax Fees2 | (d) All Other Fees3 | |||||||||||||||||||||||||
Fiscal Year 2017/2018 | Fiscal Year 2016/2017 | Fiscal Year 2017/2018 | Fiscal Year 2016/2017 | Fiscal Year 2017/2018 | Fiscal Year 2016/2017 | Fiscal Year 2017/2018 | Fiscal Year 2016/2017 | |||||||||||||||||||||
$1,468,821 | $ | 1,309,453 | $ | 90,000 | $ | 0 | $ | 169,346 | $ | 146,355 | $ | 0 | $ | 0 | ||||||||||||||
| 1 | The nature of the services includes assurance and related services reasonably related to the performance of the audit of financial statements not included in Audit Fees. |
| 2 | The nature of the services includes tax compliance, tax advice and tax planning. |
| 3 | The nature of the services include agreed upon procedures relating to Charles Schwab Investment Management., Inc.’s, (“CSIM”) expenses for purposes of Section 15(c) of the Investment Company Act of 1940. |
(e)(1) Registrant’s audit committee does not have pre-approval policies and procedures as described in paragraph (c)(7) of Rule 2-01 of Regulation S-X.
(2) There were no services described in each of paragraphs (b) through (d) above (including services required to be approved by Registrant’s audit committee pursuant to paragraph (c)(7)(ii) of Rule 2-01 of Regulation S-X) that were approved by Registrant’s audit committee pursuant to paragraph (c)(7)(i)(C) of Rule 2-01 of Regulation S-X.
(f) Not applicable.
(g) Below are the aggregate non-audit fees billed in each of the last two fiscal years by Registrant’s principal accountant for services rendered to Registrant, to Registrant’s investment adviser, and to any entity controlling, controlled by, or under common control with Registrant’s investment adviser that provides ongoing services to Registrant.
| 2017/2018: $259,346 | 2016/2017: $146,355 |
Although not required to be included in the amounts disclosed under this paragraph (g) or any other paragraph of this Item 4, below are the aggregate fees billed in each of the last two fiscal years by Registrant’s principal accountant for tax compliance services rendered to U.S. Trust, an entity under common control with Registrant’s investment adviser that does not provide services to Registrant.
Table of Contents
(h) During the past fiscal year, all non-audit services provided by Registrant’s principal accountant to either Registrant’s investment adviser or to any entity controlling, controlled by, or under common control with Registrant’s investment adviser that provides ongoing services to Registrant were pre-approved. Included in the audit committee’s pre-approval was the review and consideration as to whether the provision of these non-audit services is compatible with maintaining the principal accountant’s independence.
Item 5: Audit Committee of Listed Registrants.
Not applicable.
Item 6: Schedule of Investments.
The schedules of investments are included as part of the report to shareholders filed under Item 1 of this Form.
Item 7: Disclosure of Proxy Voting Policies and Procedures for Closed-End Management Investment Companies.
Not applicable.
Item 8: Portfolio Managers of Closed-End Management Investment Companies.
Not applicable.
Item 9: Purchases of Equity Securities by Closed-End Management Investment Company and Affiliated Purchasers.
Not applicable.
Item 10: Submission of Matters to a Vote of Security Holders.
Not applicable.
Item 11: Controls and Procedures.
| (a) | Based on their evaluation of Registrant’s disclosure controls and procedures, as of a date within 90 days of the filing date, Registrant’s Chief Executive Officer, Marie Chandoha and Registrant’s Chief |
Table of Contents
| Financial Officer, Mark Fischer, have concluded that Registrant’s disclosure controls and procedures are: (i) reasonably designed to ensure that information required to be disclosed in this report is appropriately communicated to Registrant’s officers to allow timely decisions regarding disclosures required in this report; (ii) reasonably designed to ensure that information required to be disclosed in this report is recorded, processed, summarized and reported in a timely manner; and (iii) are effective in achieving the goals described in (i) and (ii) above. |
| (b) | During the second fiscal quarter of the period covered by this report, there have been no changes in Registrant’s internal control over financial reporting that the above officers believe to have materially affected, or to be reasonably likely to materially affect, Registrant’s internal control over financial reporting. |
Item 12: Exhibits.
| (a) | (1) | Registrant’s code of ethics (that is the subject of the disclosure required by Item 2(a)) is attached. | ||
| (2) | Separate certifications for Registrant’s principal executive officer and principal financial officer, as required by Rule 30a-2(a) under the 1940 Act, are attached. | |||
| (3) | Not applicable. | |||
| (b) | A certification for Registrant’s principal executive officer and principal financial officer, as required by Rule 30a-2(b) under the 1940 Act, is attached. This certification is being furnished to the Securities and Exchange Commission solely pursuant to 18 U.S.C. section 1350 and is not being filed as part of the Form N-CSR with the Commission. | |||
Pursuant to the requirements of the Securities Exchange Act of 1934 and the Investment Company Act of 1940, the registrant has duly caused this report to be signed on its behalf by the undersigned, thereunto duly authorized.
| (Registrant) Schwab Capital Trust | ||
| By: | /s/ Marie Chandoha | |
| Marie Chandoha | ||
| Chief Executive Officer | ||
| Date: | May 17, 2018 | |
Table of Contents
Pursuant to the requirements of the Securities Exchange Act of 1934 and the Investment Company Act of 1940, this report has been signed below by the following persons on behalf of the registrant and in the capacities and on the dates indicated.
| By: | /s/ Marie Chandoha | |
| Marie Chandoha | ||
| Chief Executive Officer | ||
| Date: | May 17, 2018 | |
| By: | /s/ Mark Fischer | |
| Mark Fischer | ||
| Chief Financial Officer | ||
| Date: | May 17, 2018 | |