UNITED STATES
SECURITIES AND EXCHANGE COMMISSION
Washington, D.C. 20549
FORM N-CSRS
CERTIFIED SHAREHOLDER REPORT OF REGISTERED
MANAGEMENT INVESTMENT COMPANIES
Investment Company Act file number: 811-07704
Schwab Capital Trust
(Exact name of registrant as specified in charter)
211 Main Street, San Francisco, California 94105
(Address of principal executive offices) (Zip code)
Omar Aguilar
Schwab Capital Trust
211 Main Street, San Francisco, California 94105
(Name and address of agent for service)
Registrant’s telephone number, including area code: (415) 636-7000
Date of fiscal year end: October 31
Date of reporting period: April 30, 2024
Item 1: Report(s) to Shareholders.

Index Fund
Index Fund
No Action Required – Notice Regarding Shareholder Report Delivery |
Beginning on July 24, 2024, fund shareholder reports will be streamlined to highlight key information deemed important for investors to assess and monitor their fund investments. Other information, including financial statements, will not appear in the streamlined shareholder reports but will available online and delivered free of charge upon request. |
• If you already receive the full shareholder reports, you will receive the streamlined shareholder reports in the same way that you currently receive the full shareholder reports (either in paper or electronically). |
• If you currently receive a notification when a shareholder report is available on a fund’s website, beginning July 24, 2024, you will begin to receive the streamlined shareholder report (in paper). |
2 | |
3 | |
5 | |
7 | |
9 | |
11 | |
13 | |
15 | |
17 | |
19 | |
21 | |
22 | |
32 | |
46 | |
67 | |
100 | |
110 | |
123 | |
135 | |
147 | |
162 | |
165 |
Total Return for the 6 Months Ended April 30, 2024 | |
Schwab S&P 500 Index Fund (Ticker Symbol: SWPPX) | 20.94% |
S&P 500® Index | 20.98% |
Fund Category: Morningstar Large Blend1 | 19.86% |
Performance Details | pages 5-6 |
Schwab 1000 Index Fund (Ticker Symbol: SNXFX) | 21.39% |
Russell 1000® Index2 | 21.17% |
Schwab 1000 Index® | 21.38% |
Fund Category: Morningstar Large Blend1 | 19.86% |
Performance Details | pages 7-8 |
Schwab Small-Cap Index Fund (Ticker Symbol: SWSSX) | 19.68% |
S&P 500® Index3 | 20.98% |
Russell 2000® Index | 19.66% |
Fund Category: Morningstar Small Blend1 | 18.81% |
Performance Details | pages 9-10 |
Schwab Total Stock Market Index Fund (Ticker Symbol: SWTSX) | 21.23% |
Dow Jones U.S. Total Stock Market IndexSM | 21.22% |
Fund Category: Morningstar Large Blend1 | 19.86% |
Performance Details | pages 11-12 |
Total Return for the 6 Months Ended April 30, 2024 | |
Schwab U.S. Large-Cap Growth Index Fund (Ticker Symbol: SWLGX) | 23.58% |
S&P 500® Index3 | 20.98% |
Russell 1000® Growth Index | 23.56% |
Fund Category: Morningstar Large Growth1 | 24.13% |
Performance Details | pages 13-14 |
Schwab U.S. Large-Cap Value Index Fund (Ticker Symbol: SWLVX) | 18.40% |
S&P 500® Index3 | 20.98% |
Russell 1000® Value Index | 18.42% |
Fund Category: Morningstar Large Value1 | 17.99% |
Performance Details | pages 15-16 |
Schwab U.S. Mid-Cap Index Fund (Ticker Symbol: SWMCX) | 21.98% |
S&P 500® Index3 | 20.98% |
Russell Midcap® Index | 22.00% |
Fund Category: Morningstar Mid-Cap Blend1 | 20.84% |
Performance Details | pages 17-18 |
Schwab International Index Fund4 (Ticker Symbol: SWISX) | 17.14% |
MSCI EAFE® Index (Net)5 | 18.63% |
Fund Category: Morningstar Foreign Large Blend1 | 16.61% |
Performance Details | pages 19-20 |
 | Christopher Bliss, CFA, Managing Director and Head of Passive Equity Strategies for Schwab Asset Management, is responsible for overseeing the investment process and portfolio management of investment strategies for passive equity Schwab Funds and Schwab ETFs, and Schwab Personalized Indexing™ separately managed accounts. Before joining Schwab in 2016, Mr. Bliss spent 12 years at BlackRock (formerly Barclays Global Investors) managing and leading institutional index teams, most recently as a managing director and the head of the Americas institutional index team. In this role, Mr. Bliss was responsible for overseeing a team of portfolio managers managing domestic, developed international and emerging markets index strategies. Prior to BlackRock, he worked as an equity analyst and portfolio manager for Harris Bretall and before that, as a research analyst for JP Morgan. |
 | Jeremy Brown, CFA, Senior Portfolio Manager for Schwab Asset Management, is responsible for the day-to-day co-management of the funds, except for the Schwab International Index Fund. Prior to joining Schwab in 2017, Mr. Brown spent six years with ALPS Advisors, Inc. in Denver, most recently as a senior analyst on the ETF portfolio management and research team where he performed portfolio management, trading, and analytics/research functions for ALPS ETFs and passive funds. Additionally, Mr. Brown led a number of investment research, commentary, industry trend analysis, and sales and marketing support initiatives. |
 | Joselle Duncan, CFA, Portfolio Manager for Schwab Asset Management, is responsible for the day-to-day co-management of the Schwab International Index Fund. Prior to joining Schwab in 2022, Ms. Duncan worked at BlackRock, Inc. for over 20 years as a vice president and portfolio manager focused on international ETFs. Before that, she held several positions at BlackRock (formerly Barclays Global Investors) including portfolio manager for institutional and mutual funds, securities lending trader, and securities lending product specialist. |
 | Jiwei Gu, CFA, Portfolio Manager for Schwab Asset Management, is responsible for the day-to-day co-management of the Schwab International Index Fund. Ms. Gu joined the portfolio management team as an associate portfolio manager in 2018. Prior to joining Schwab, she spent four years at CoBank, most recently as an enterprise risk analyst performing bank-level loan portfolio credit risk analysis, data analytics, and risk management methodology research. Before that, Ms. Gu worked in commercial credit underwriting and capital markets supporting lending activities. |
 | Ferian Juwono, CFA, Senior Portfolio Manager for Schwab Asset Management, is responsible for the oversight and day-to-day co-management of the funds, except for the Schwab International Index Fund. Prior to joining Schwab in 2010, Mr. Juwono worked at BlackRock (formerly Barclays Global Investors) where he spent more than three years as a portfolio manager, managing equity index funds for institutional clients, and two years as a senior business analyst. Prior to that, Mr. Juwono worked for more than four years as a senior financial analyst with Union Bank of California. |
 | David Rios, Portfolio Manager for Schwab Asset Management, is responsible for the day-to-day co-management of the Schwab International Index Fund. Prior to this role, Mr. Rios was an associate portfolio manager on the equity index strategies team for four years. His first role with Schwab Asset Management was as a trade operations specialist. Prior to joining Schwab in 2008, Mr. Rios was a senior fund accountant at Investors Bank & Trust (subsequently acquired by State Street Corporation). |
 | Agnes Zau, CFA, Portfolio Manager for Schwab Asset Management, is responsible for the day-to-day co-management of the funds, except for the Schwab International Index Fund. Prior to joining Schwab in 2018, Ms. Zau was at BlackRock for three years, most recently as a multi-asset portfolio investment consultant where she advised institutional clients on asset allocation and strategy, constructed risk decomposition and portfolio optimization, and conducted scenario analyses for the core multi-asset target risk strategies. She spent the preceding three years as a derivatives specialist at Mellon Capital. |
Fund and Inception Date | 6 Months | 1 Year | 5 Years | 10 Years |
Fund: Schwab S&P 500 Index Fund (5/19/97) | 20.94% | 22.62% | 13.16% | 12.35% |
S&P 500® Index | 20.98% | 22.66% | 13.19% | 12.41% |
Fund Category: Morningstar Large Blend 2 | 19.86% | 20.31% | 11.78% | 10.96% |
Fund Expense Ratio3: 0.02% | ||||
Number of Holdings | 501 |
Weighted Average Market Cap (millions) | $780,890 |
Price/Earnings Ratio (P/E) | 25.1 |
Price/Book Ratio (P/B) | 4.2 |
Portfolio Turnover Rate | 1% 2 |
Fund and Inception Date | 6 Months | 1 Year | 5 Years | 10 Years |
Fund: Schwab 1000 Index Fund (4/2/91) | 21.39% | 22.98% | 12.69% | 11.94% |
Russell 1000® Index 2 | 21.17% | 22.82% | 12.87% | 12.14% |
Schwab 1000 Index® | 21.38% | 23.00% | 12.73% | 12.05% |
Fund Category: Morningstar Large Blend 3 | 19.86% | 20.31% | 11.78% | 10.96% |
Fund Expense Ratio4: 0.05% | ||||
Number of Holdings | 994 2 |
Weighted Average Market Cap (millions) | $711,678 |
Price/Earnings Ratio (P/E) | 24.6 |
Price/Book Ratio (P/B) | 4.1 |
Portfolio Turnover Rate | 1% 3,4 |
Fund and Inception Date | 6 Months | 1 Year | 5 Years | 10 Years |
Fund: Schwab Small-Cap Index Fund (5/19/97) | 19.68% | 13.38% | 5.90% | 7.28% |
S&P 500® Index 2 | 20.98% | 22.66% | 13.19% | 12.41% |
Russell 2000® Index | 19.66% | 13.32% | 5.83% | 7.22% |
Fund Category: Morningstar Small Blend 3 | 18.81% | 13.98% | 7.17% | 7.28% |
Fund Expense Ratio4: 0.04% | ||||
Number of Holdings | 1,943 |
Weighted Average Market Cap (millions) | $4,245 |
Price/Earnings Ratio (P/E) | 15.5 |
Price/Book Ratio (P/B) | 1.9 |
Portfolio Turnover Rate | 5% 2,3 |
Fund and Inception Date | 6 Months | 1 Year | 5 Years | 10 Years |
Fund: Schwab Total Stock Market Index Fund (6/1/99) | 21.23% | 22.42% | 12.30% | 11.70% |
Dow Jones U.S. Total Stock Market IndexSM | 21.22% | 22.42% | 12.32% | 11.73% |
Fund Category: Morningstar Large Blend 2 | 19.86% | 20.31% | 11.78% | 10.96% |
Fund Expense Ratio3: 0.03% | ||||
Number of Holdings | 3,354 |
Weighted Average Market Cap (millions) | $678,994 |
Price/Earnings Ratio (P/E) | 24.1 |
Price/Book Ratio (P/B) | 3.8 |
Portfolio Turnover Rate | 0% 2,3 |

Fund and Inception Date | 6 Months | 1 Year | 5 Years | Since Inception |
Fund: Schwab U.S. Large-Cap Growth Index Fund (12/20/17) | 23.58% | 31.78% | 16.42% | 15.77% |
S&P 500® Index 2 | 20.98% | 22.66% | 13.19% | 12.33% |
Russell 1000® Growth Index | 23.56% | 31.80% | 16.46% | 15.81% |
Fund Category: Morningstar Large Growth 3 | 24.13% | 29.19% | 12.82% | N/A |
Fund Expense Ratio4: 0.035% | ||||
Number of Holdings | 439 |
Weighted Average Market Cap (millions) | $1,183,307 |
Price/Earnings Ratio (P/E) | 32.8 |
Price/Book Ratio (P/B) | 10.9 |
Portfolio Turnover Rate | 2% 2 |
Fund and Inception Date | 6 Months | 1 Year | 5 Years | Since Inception |
Fund: Schwab U.S. Large-Cap Value Index Fund (12/20/17) | 18.40% | 13.38% | 8.53% | 7.71% |
S&P 500® Index 2 | 20.98% | 22.66% | 13.19% | 12.33% |
Russell 1000® Value Index | 18.42% | 13.42% | 8.60% | 7.78% |
Fund Category: Morningstar Large Value 3 | 17.99% | 14.37% | 9.20% | N/A |
Fund Expense Ratio4: 0.035% | ||||
Number of Holdings | 836 |
Weighted Average Market Cap (millions) | $152,173 |
Price/Earnings Ratio (P/E) | 18.7 |
Price/Book Ratio (P/B) | 2.3 |
Portfolio Turnover Rate | 8% 2 |
Fund and Inception Date | 6 Months | 1 Year | 5 Years | Since Inception |
Fund: Schwab U.S. Mid-Cap Index Fund (12/20/17) | 21.98% | 16.32% | 9.02% | 8.69% |
S&P 500® Index 2 | 20.98% | 22.66% | 13.19% | 12.33% |
Russell Midcap® Index | 22.00% | 16.35% | 9.06% | 8.73% |
Fund Category: Morningstar Mid-Cap Blend 3 | 20.84% | 16.38% | 8.79% | N/A |
Fund Expense Ratio4: 0.04% | ||||
Number of Holdings | 798 |
Weighted Average Market Cap (millions) | $26,609 |
Price/Earnings Ratio (P/E) | 20.3 |
Price/Book Ratio (P/B) | 2.8 |
Portfolio Turnover Rate | 3% 2 |
Fund and Inception Date | 6 Months | 1 Year | 5 Years | 10 Years |
Fund: Schwab International Index Fund (5/19/97) | 17.14% | 8.37% | 6.05% | 4.32% |
MSCI EAFE® Index (Net) 3 | 18.63% | 9.28% | 6.18% | 4.38% |
Fund Category: Morningstar Foreign Large Blend 4 | 16.61% | 8.18% | 5.40% | 4.18% |
Fund Expense Ratio5: 0.06% | ||||
Number of Holdings | 768 |
Weighted Average Market Cap (millions) | $98,696 |
Price/Earnings Ratio (P/E) | 15.4 |
Price/Book Ratio (P/B) | 1.9 |
Portfolio Turnover Rate | 5% 2 |
EXPENSE RATIO (ANNUALIZED) 1 | BEGINNING ACCOUNT VALUE AT 11/1/23 | ENDING ACCOUNT VALUE (NET OF EXPENSES) AT 4/30/24 | EXPENSES PAID DURING PERIOD 11/1/23-4/30/24 2 | |
Schwab S&P 500 Index Fund | ||||
Actual Return | 0.02% | $1,000.00 | $1,209.40 | $0.11 |
Hypothetical 5% Return | 0.02% | $1,000.00 | $1,024.76 | $0.10 |
Schwab 1000 Index Fund | ||||
Actual Return | 0.05% | $1,000.00 | $1,213.90 | $0.28 |
Hypothetical 5% Return | 0.05% | $1,000.00 | $1,024.61 | $0.25 |
Schwab Small-Cap Index Fund | ||||
Actual Return | 0.04% | $1,000.00 | $1,196.80 | $0.22 |
Hypothetical 5% Return | 0.04% | $1,000.00 | $1,024.66 | $0.20 |
Schwab Total Stock Market Index Fund | ||||
Actual Return | 0.03% | $1,000.00 | $1,212.30 | $0.17 |
Hypothetical 5% Return | 0.03% | $1,000.00 | $1,024.71 | $0.15 |
Schwab U.S. Large-Cap Growth Index Fund | ||||
Actual Return | 0.035% | $1,000.00 | $1,235.80 | $0.19 |
Hypothetical 5% Return | 0.035% | $1,000.00 | $1,024.69 | $0.18 |
Schwab U.S. Large-Cap Value Index Fund | ||||
Actual Return | 0.035% | $1,000.00 | $1,184.00 | $0.19 |
Hypothetical 5% Return | 0.035% | $1,000.00 | $1,024.69 | $0.18 |
Schwab U.S. Mid-Cap Index Fund | ||||
Actual Return | 0.04% | $1,000.00 | $1,219.80 | $0.22 |
Hypothetical 5% Return | 0.04% | $1,000.00 | $1,024.66 | $0.20 |
Schwab International Index Fund | ||||
Actual Return | 0.06% | $1,000.00 | $1,171.40 | $0.32 |
Hypothetical 5% Return | 0.06% | $1,000.00 | $1,024.57 | $0.30 |
1 | Based on the most recent six-month expense ratio. |
2 | Expenses for each fund are equal to its annualized expense ratio, multiplied by the average account value over the period, multiplied by 182 days in the period, and divided by 366 days in the fiscal year. |
11/1/23– 4/30/24* | 11/1/22– 10/31/23 | 11/1/21– 10/31/22 | 11/1/20– 10/31/21 | 11/1/19– 10/31/20 | 11/1/18– 10/31/19 | |
Per-Share Data | ||||||
Net asset value at beginning of period | $65.03 | $60.02 | $71.21 | $50.75 | $47.17 | $42.41 |
Income (loss) from investment operations: | ||||||
Net investment income (loss)1 | 0.57 | 1.05 | 0.97 | 0.90 | 1.02 | 0.92 |
Net realized and unrealized gains (losses) | 12.95 | 4.94 | (11.23 ) | 20.60 | 3.52 | 4.86 |
Total from investment operations | 13.52 | 5.99 | (10.26 ) | 21.50 | 4.54 | 5.78 |
Less distributions: | ||||||
Distributions from net investment income | (1.05 ) | (0.98 ) | (0.86 ) | (1.04 ) | (0.87 ) | (0.84 ) |
Distributions from net realized gains | — | — | (0.07 ) | — | (0.09 ) | (0.18 ) |
Total distributions | (1.05 ) | (0.98 ) | (0.93 ) | (1.04 ) | (0.96 ) | (1.02 ) |
Net asset value at end of period | $77.50 | $65.03 | $60.02 | $71.21 | $50.75 | $47.17 |
Total return | 20.94 %2 | 10.11 % | (14.63 %) | 42.89 % | 9.69 % | 14.30 % |
Ratios/Supplemental Data | ||||||
Ratios to average net assets: | ||||||
Total expenses | 0.02 %3 | 0.02 %4 | 0.02 %4 | 0.02 % | 0.02 % | 0.02 %5 |
Net investment income (loss) | 1.53 %3 | 1.63 % | 1.49 % | 1.42 % | 2.11 % | 2.11 % |
Portfolio turnover rate | 1 %2 | 2 %6 | 2 % | 3 % | 4 % | 3 % |
Net assets, end of period (x 1,000,000) | $88,328 | $70,062 | $61,068 | $67,401 | $44,184 | $40,232 |
* | Unaudited. |
1 | Calculated based on the average shares outstanding during the period. |
2 | Not annualized. |
3 | Annualized. |
4 | Ratio includes less than 0.005% of non-routine proxy expenses. |
5 | Effective December 20, 2018, the annual operating expense ratio was reduced to 0.02%. The ratio presented for period ended October 31, 2019, is a blended ratio. |
6 | Portfolio turnover rate excludes in-kind transactions. |
SECURITY | NUMBER OF SHARES | VALUE ($) |
COMMON STOCKS 99.6% OF NET ASSETS | ||
Automobiles & Components 1.5% | ||
Aptiv PLC * | 578,442 | 41,069,382 |
BorgWarner, Inc. | 481,064 | 15,764,467 |
Ford Motor Co. | 8,128,638 | 98,762,952 |
General Motors Co. | 2,404,579 | 107,075,903 |
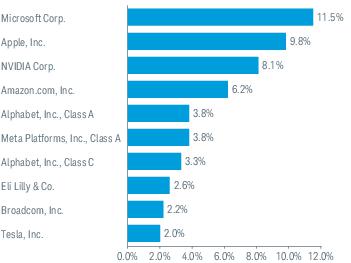
Tesla, Inc. * | 5,770,902 | 1,057,690,918 |
1,320,363,622 | ||
Banks 3.4% | ||
Bank of America Corp. | 14,339,837 | 530,717,367 |
Citigroup, Inc. | 3,963,741 | 243,096,236 |
Citizens Financial Group, Inc. | 967,933 | 33,016,195 |
Comerica, Inc. | 276,713 | 13,882,691 |
Fifth Third Bancorp | 1,412,806 | 51,510,907 |
Huntington Bancshares, Inc. | 3,021,803 | 40,703,686 |
JPMorgan Chase & Co. | 6,021,337 | 1,154,531,156 |
KeyCorp | 1,941,076 | 28,126,191 |
M&T Bank Corp. | 346,304 | 50,002,836 |
PNC Financial Services Group, Inc. | 828,449 | 126,968,094 |
Regions Financial Corp. | 1,929,393 | 37,179,403 |
Truist Financial Corp. | 2,774,705 | 104,190,173 |
U.S. Bancorp | 3,247,050 | 131,927,641 |
Wells Fargo & Co. | 7,495,644 | 444,641,602 |
2,990,494,178 | ||
Capital Goods 5.9% | ||
3M Co. | 1,151,878 | 111,167,746 |
A O Smith Corp. | 256,802 | 21,273,478 |
Allegion PLC | 181,269 | 22,035,060 |
AMETEK, Inc. | 480,170 | 83,866,492 |
Axon Enterprise, Inc. * | 146,955 | 46,093,905 |
Boeing Co. * | 1,194,736 | 200,524,490 |
Builders FirstSource, Inc. * | 257,621 | 47,098,271 |
Carrier Global Corp. | 1,742,831 | 107,166,678 |
Caterpillar, Inc. | 1,060,313 | 354,748,920 |
Cummins, Inc. | 283,609 | 80,116,706 |
Deere & Co. | 542,348 | 212,280,431 |
Dover Corp. | 292,103 | 52,374,068 |
Eaton Corp. PLC | 831,654 | 264,682,202 |
Emerson Electric Co. | 1,192,318 | 128,508,034 |
Fastenal Co. | 1,192,234 | 81,000,378 |
Fortive Corp. | 729,859 | 54,936,487 |
GE Vernova, Inc. * | 566,248 | 87,037,980 |
Generac Holdings, Inc. * | 126,707 | 17,227,084 |
General Dynamics Corp. | 472,412 | 135,624,761 |
General Electric Co. | 2,266,761 | 366,807,265 |
Honeywell International, Inc. | 1,373,076 | 264,632,937 |
Howmet Aerospace, Inc. | 818,026 | 54,603,236 |
Hubbell, Inc., Class B | 112,176 | 41,563,452 |
Huntington Ingalls Industries, Inc. | 83,068 | 23,004,021 |
IDEX Corp. | 157,576 | 34,739,205 |
Illinois Tool Works, Inc. | 566,945 | 138,396,944 |
Ingersoll Rand, Inc. | 844,266 | 78,786,903 |
SECURITY | NUMBER OF SHARES | VALUE ($) |
Johnson Controls International PLC | 1,416,180 | 92,150,833 |
L3Harris Technologies, Inc. | 395,083 | 84,567,516 |
Lockheed Martin Corp. | 447,965 | 208,272,367 |
Masco Corp. | 455,532 | 31,181,165 |
Nordson Corp. | 113,801 | 29,382,280 |
Northrop Grumman Corp. | 293,751 | 142,478,048 |
Otis Worldwide Corp. | 843,960 | 76,969,152 |
PACCAR, Inc. | 1,091,144 | 115,781,290 |
Parker-Hannifin Corp. | 267,709 | 145,877,311 |
Pentair PLC | 345,726 | 27,343,469 |
Quanta Services, Inc. | 303,284 | 78,417,111 |
Rockwell Automation, Inc. | 238,525 | 64,630,734 |
RTX Corp. | 2,763,490 | 280,549,505 |
Snap-on, Inc. | 109,117 | 29,238,991 |
Stanley Black & Decker, Inc. | 316,962 | 28,970,327 |
Textron, Inc. | 408,293 | 34,537,505 |
Trane Technologies PLC | 474,170 | 150,473,108 |
TransDigm Group, Inc. | 115,689 | 144,383,343 |
United Rentals, Inc. | 140,004 | 93,521,272 |
Westinghouse Air Brake Technologies Corp. | 373,009 | 60,084,290 |
WW Grainger, Inc. | 92,121 | 84,875,683 |
Xylem, Inc. | 503,334 | 65,785,754 |
5,179,768,188 | ||
Commercial & Professional Services 1.3% | ||
Automatic Data Processing, Inc. | 855,631 | 206,968,582 |
Broadridge Financial Solutions, Inc. | 244,624 | 47,312,728 |
Cintas Corp. | 179,605 | 118,241,156 |
Copart, Inc. * | 1,817,593 | 98,713,476 |
Dayforce, Inc. * | 321,655 | 19,739,967 |
Equifax, Inc. | 256,702 | 56,523,213 |
Jacobs Solutions, Inc. | 260,773 | 37,428,749 |
Leidos Holdings, Inc. | 284,672 | 39,916,708 |
Paychex, Inc. | 666,722 | 79,213,241 |
Paycom Software, Inc. | 99,546 | 18,712,657 |
Republic Services, Inc., Class A | 424,990 | 81,470,583 |
Robert Half, Inc. | 213,943 | 14,792,019 |
Rollins, Inc. | 580,133 | 25,850,726 |
Veralto Corp. | 458,548 | 42,956,777 |
Verisk Analytics, Inc., Class A | 302,426 | 65,916,771 |
Waste Management, Inc. | 764,396 | 159,009,656 |
1,112,767,009 | ||
Consumer Discretionary Distribution & Retail 5.9% | ||
Amazon.com, Inc. * | 19,038,484 | 3,331,734,700 |
AutoZone, Inc. * | 35,984 | 106,383,098 |
Bath & Body Works, Inc. | 473,761 | 21,518,225 |
Best Buy Co., Inc. | 396,384 | 29,189,718 |
CarMax, Inc. * | 326,342 | 22,181,466 |
eBay, Inc. | 1,084,249 | 55,882,193 |
Etsy, Inc. * | 252,141 | 17,314,522 |
Genuine Parts Co. | 291,574 | 45,838,348 |
Home Depot, Inc. | 2,072,913 | 692,808,983 |
LKQ Corp. | 560,605 | 24,178,894 |
Lowe's Cos., Inc. | 1,197,834 | 273,094,174 |
SECURITY | NUMBER OF SHARES | VALUE ($) |
O'Reilly Automotive, Inc. * | 122,828 | 124,456,699 |
Pool Corp. | 80,766 | 29,280,098 |
Ross Stores, Inc. | 700,124 | 90,701,064 |
TJX Cos., Inc. | 2,373,698 | 223,341,245 |
Tractor Supply Co. | 224,703 | 61,361,895 |
Ulta Beauty, Inc. * | 100,797 | 40,806,657 |
5,190,071,979 | ||
Consumer Durables & Apparel 0.8% | ||
Deckers Outdoor Corp. * | 53,661 | 43,919,919 |
DR Horton, Inc. | 622,557 | 88,708,147 |
Garmin Ltd. | 319,719 | 46,189,804 |
Hasbro, Inc. | 272,899 | 16,728,709 |
Lennar Corp., Class A | 515,105 | 78,100,220 |
Lululemon Athletica, Inc. * | 239,684 | 86,430,050 |
Mohawk Industries, Inc. * | 109,536 | 12,631,691 |
NIKE, Inc., Class B | 2,535,213 | 233,898,751 |
NVR, Inc. * | 6,661 | 49,550,180 |
PulteGroup, Inc. | 442,087 | 49,257,334 |
Ralph Lauren Corp., Class A | 81,347 | 13,311,623 |
Tapestry, Inc. | 477,939 | 19,079,325 |
737,805,753 | ||
Consumer Services 2.1% | ||
Airbnb, Inc., Class A * | 907,236 | 143,860,413 |
Booking Holdings, Inc. | 72,668 | 250,852,116 |
Caesars Entertainment, Inc. * | 449,445 | 16,099,120 |
Carnival Corp. * | 2,109,802 | 31,267,266 |
Chipotle Mexican Grill, Inc., Class A * | 57,060 | 180,286,776 |
Darden Restaurants, Inc. | 248,070 | 38,056,419 |
Domino's Pizza, Inc. | 72,354 | 38,294,802 |
Expedia Group, Inc. * | 272,055 | 36,626,765 |
Hilton Worldwide Holdings, Inc. | 525,615 | 103,693,327 |
Las Vegas Sands Corp. | 770,909 | 34,197,523 |
Marriott International, Inc., Class A | 513,418 | 121,233,392 |
McDonald's Corp. | 1,510,729 | 412,489,446 |
MGM Resorts International * | 565,600 | 22,307,264 |
Norwegian Cruise Line Holdings Ltd. * | 890,311 | 16,844,684 |
Royal Caribbean Cruises Ltd. * | 492,469 | 68,763,446 |
Starbucks Corp. | 2,358,382 | 208,693,223 |
Wynn Resorts Ltd. | 199,405 | 18,275,468 |
Yum! Brands, Inc. | 585,112 | 82,647,070 |
1,824,488,520 | ||
Consumer Staples Distribution & Retail 1.9% | ||
Costco Wholesale Corp. | 924,188 | 668,095,505 |
Dollar General Corp. | 456,691 | 63,566,820 |
Dollar Tree, Inc. * | 431,920 | 51,074,540 |
Kroger Co. | 1,375,020 | 76,148,608 |
Sysco Corp. | 1,038,788 | 77,202,724 |
Target Corp. | 960,424 | 154,609,055 |
Walgreens Boots Alliance, Inc. | 1,480,246 | 26,244,762 |
Walmart, Inc. | 8,915,660 | 529,144,421 |
1,646,086,435 | ||
Energy 4.1% | ||
APA Corp. | 758,909 | 23,860,099 |
Baker Hughes Co., Class A | 2,083,951 | 67,978,482 |
Chevron Corp. | 3,612,480 | 582,584,650 |
ConocoPhillips | 2,453,729 | 308,237,437 |
Coterra Energy, Inc. | 1,571,161 | 42,986,965 |
Devon Energy Corp. | 1,336,908 | 68,422,951 |
Diamondback Energy, Inc. | 372,001 | 74,820,561 |
SECURITY | NUMBER OF SHARES | VALUE ($) |
EOG Resources, Inc. | 1,214,574 | 160,481,663 |
EQT Corp. | 856,487 | 34,336,564 |
Exxon Mobil Corp. | 8,270,724 | 978,178,528 |
Halliburton Co. | 1,858,282 | 69,629,827 |
Hess Corp. | 572,613 | 90,180,821 |
Kinder Morgan, Inc. | 4,025,576 | 73,587,529 |
Marathon Oil Corp. | 1,218,121 | 32,706,549 |
Marathon Petroleum Corp. | 767,557 | 139,480,458 |
Occidental Petroleum Corp. | 1,373,132 | 90,818,950 |
ONEOK, Inc. | 1,214,315 | 96,076,603 |
Phillips 66 | 894,539 | 128,106,930 |
Pioneer Natural Resources Co. | 486,168 | 130,934,766 |
Schlumberger NV | 2,971,236 | 141,074,285 |
Targa Resources Corp. | 462,771 | 52,783,660 |
Valero Energy Corp. | 709,637 | 113,449,667 |
Williams Cos., Inc. | 2,528,675 | 96,999,973 |
3,597,717,918 | ||
Equity Real Estate Investment Trusts (REITs) 2.0% | ||
Alexandria Real Estate Equities, Inc. | 326,825 | 37,869,213 |
American Tower Corp. | 971,855 | 166,731,444 |
AvalonBay Communities, Inc. | 295,035 | 55,929,785 |
Boston Properties, Inc. | 299,879 | 18,559,511 |
Camden Property Trust | 221,733 | 22,102,345 |
Crown Castle, Inc. | 902,608 | 84,646,578 |
Digital Realty Trust, Inc. | 629,818 | 87,406,142 |
Equinix, Inc. | 195,577 | 139,076,760 |
Equity Residential | 715,962 | 46,107,953 |
Essex Property Trust, Inc. | 133,868 | 32,964,995 |
Extra Space Storage, Inc. | 440,385 | 59,134,898 |
Federal Realty Investment Trust | 153,262 | 15,965,302 |
Healthpeak Properties, Inc. | 1,471,642 | 27,387,258 |
Host Hotels & Resorts, Inc. | 1,473,903 | 27,812,550 |
Invitation Homes, Inc. | 1,192,839 | 40,795,094 |
Iron Mountain, Inc. | 609,186 | 47,224,099 |
Kimco Realty Corp. | 1,400,460 | 26,090,570 |
Mid-America Apartment Communities, Inc. | 242,580 | 31,535,400 |
Prologis, Inc. | 1,924,767 | 196,422,472 |
Public Storage | 329,420 | 85,468,019 |
Realty Income Corp. | 1,735,056 | 92,894,898 |
Regency Centers Corp. | 342,544 | 20,285,456 |
SBA Communications Corp., Class A | 224,443 | 41,773,331 |
Simon Property Group, Inc. | 680,098 | 95,574,172 |
UDR, Inc. | 636,851 | 24,251,286 |
Ventas, Inc. | 835,593 | 37,000,058 |
VICI Properties, Inc., Class A | 2,156,811 | 61,576,954 |
Welltower, Inc. | 1,151,356 | 109,701,200 |
Weyerhaeuser Co. | 1,519,372 | 45,839,453 |
1,778,127,196 | ||
Financial Services 7.6% | ||
American Express Co. | 1,191,054 | 278,742,368 |
Ameriprise Financial, Inc. | 209,112 | 86,110,230 |
Bank of New York Mellon Corp. | 1,584,286 | 89,496,316 |
Berkshire Hathaway, Inc., Class B * | 3,789,500 | 1,503,408,335 |
BlackRock, Inc. | 291,248 | 219,787,391 |
Blackstone, Inc. | 1,499,114 | 174,811,684 |
Capital One Financial Corp. | 791,486 | 113,522,837 |
Cboe Global Markets, Inc. | 219,175 | 39,703,551 |
Charles Schwab Corp. (a) | 3,081,146 | 227,850,747 |
CME Group, Inc. | 749,780 | 157,183,879 |
Corpay, Inc. * | 150,518 | 45,477,508 |
Discover Financial Services | 522,361 | 66,198,809 |
FactSet Research Systems, Inc. | 79,674 | 33,215,294 |
SECURITY | NUMBER OF SHARES | VALUE ($) |
Fidelity National Information Services, Inc. | 1,234,436 | 83,842,893 |
Fiserv, Inc. * | 1,250,575 | 190,925,285 |
Franklin Resources, Inc. | 630,207 | 14,393,928 |
Global Payments, Inc. | 542,070 | 66,549,934 |
Goldman Sachs Group, Inc. | 679,220 | 289,829,966 |
Intercontinental Exchange, Inc. | 1,190,909 | 153,341,443 |
Invesco Ltd. | 944,757 | 13,387,207 |
Jack Henry & Associates, Inc. | 151,198 | 24,598,403 |
MarketAxess Holdings, Inc. | 79,357 | 15,878,542 |
Mastercard, Inc., Class A | 1,718,357 | 775,322,678 |
Moody's Corp. | 328,357 | 121,600,448 |
Morgan Stanley | 2,609,287 | 237,027,631 |
MSCI, Inc., Class A | 164,472 | 76,609,413 |
Nasdaq, Inc. | 789,677 | 47,262,168 |
Northern Trust Corp. | 427,646 | 35,233,754 |
PayPal Holdings, Inc. * | 2,232,702 | 151,645,120 |
Raymond James Financial, Inc. | 393,236 | 47,974,792 |
S&P Global, Inc. | 669,198 | 278,272,604 |
State Street Corp. | 626,600 | 45,422,234 |
Synchrony Financial | 851,262 | 37,438,503 |
T Rowe Price Group, Inc. | 464,737 | 50,921,233 |
Visa, Inc., Class A | 3,294,106 | 884,829,813 |
6,677,816,941 | ||
Food, Beverage & Tobacco 2.8% | ||
Altria Group, Inc. | 3,678,302 | 161,146,411 |
Archer-Daniels-Midland Co. | 1,113,676 | 65,328,234 |
Brown-Forman Corp., Class B | 380,530 | 18,208,361 |
Bunge Global SA | 302,624 | 30,795,018 |
Campbell Soup Co. | 414,954 | 18,967,547 |
Coca-Cola Co. | 8,104,252 | 500,599,646 |
Conagra Brands, Inc. | 992,812 | 30,558,753 |
Constellation Brands, Inc., Class A | 335,900 | 85,137,214 |
General Mills, Inc. | 1,185,303 | 83,516,449 |
Hershey Co. | 311,925 | 60,488,496 |
Hormel Foods Corp. | 603,515 | 21,460,993 |
J M Smucker Co. | 220,780 | 25,356,583 |
Kellanova | 546,595 | 31,625,987 |
Keurig Dr Pepper, Inc. | 2,171,204 | 73,169,575 |
Kraft Heinz Co. | 1,660,241 | 64,101,905 |
Lamb Weston Holdings, Inc. | 300,649 | 25,056,088 |
McCormick & Co., Inc. - Non Voting Shares | 523,305 | 39,802,578 |
Molson Coors Beverage Co., Class B | 382,981 | 21,929,492 |
Mondelez International, Inc., Class A | 2,805,424 | 201,822,203 |
Monster Beverage Corp. * | 1,537,043 | 82,154,948 |
PepsiCo, Inc. | 2,862,635 | 503,566,123 |
Philip Morris International, Inc. | 3,233,428 | 306,981,654 |
Tyson Foods, Inc., Class A | 598,329 | 36,288,654 |
2,488,062,912 | ||
Health Care Equipment & Services 5.1% | ||
Abbott Laboratories | 3,615,831 | 383,169,611 |
Align Technology, Inc. * | 148,716 | 41,994,424 |
Baxter International, Inc. | 1,061,947 | 42,870,800 |
Becton Dickinson & Co. | 601,061 | 141,008,911 |
Boston Scientific Corp. * | 3,051,239 | 219,292,547 |
Cardinal Health, Inc. | 508,184 | 52,363,279 |
Cencora, Inc. | 345,510 | 82,594,165 |
Centene Corp. * | 1,111,167 | 81,181,861 |
Cigna Group | 609,222 | 217,516,623 |
Cooper Cos., Inc. | 411,907 | 36,684,437 |
CVS Health Corp. | 2,623,159 | 177,614,096 |
DaVita, Inc. * | 111,461 | 15,494,194 |
Dexcom, Inc. * | 802,812 | 102,270,221 |
SECURITY | NUMBER OF SHARES | VALUE ($) |
Edwards Lifesciences Corp. * | 1,264,780 | 107,088,923 |
Elevance Health, Inc. | 489,368 | 258,670,137 |
GE HealthCare Technologies, Inc. | 882,080 | 67,249,779 |
HCA Healthcare, Inc. | 412,165 | 127,696,960 |
Henry Schein, Inc. * | 268,999 | 18,636,251 |
Hologic, Inc. * | 487,076 | 36,905,749 |
Humana, Inc. | 254,043 | 76,743,850 |
IDEXX Laboratories, Inc. * | 172,738 | 85,118,377 |
Insulet Corp. * | 145,086 | 24,946,087 |
Intuitive Surgical, Inc. * | 733,818 | 271,967,627 |
Laboratory Corp. of America Holdings | 176,907 | 35,623,763 |
McKesson Corp. | 273,952 | 147,169,754 |
Medtronic PLC | 2,769,378 | 222,214,891 |
Molina Healthcare, Inc. * | 120,231 | 41,131,025 |
Quest Diagnostics, Inc. | 230,842 | 31,897,748 |
ResMed, Inc. | 306,665 | 65,623,243 |
Solventum Corp. * | 285,527 | 18,562,110 |
STERIS PLC | 206,584 | 42,258,823 |
Stryker Corp. | 704,282 | 236,990,893 |
Teleflex, Inc. | 98,011 | 20,459,796 |
UnitedHealth Group, Inc. | 1,926,416 | 931,807,419 |
Universal Health Services, Inc., Class B | 128,121 | 21,835,662 |
Zimmer Biomet Holdings, Inc. | 436,479 | 52,499,694 |
4,537,153,730 | ||
Household & Personal Products 1.5% | ||
Church & Dwight Co., Inc. | 512,701 | 55,315,311 |
Clorox Co. | 258,493 | 38,223,360 |
Colgate-Palmolive Co. | 1,713,803 | 157,532,772 |
Estee Lauder Cos., Inc., Class A | 484,061 | 71,016,589 |
Kenvue, Inc. | 3,580,163 | 67,378,668 |
Kimberly-Clark Corp. | 701,654 | 95,796,821 |
Procter & Gamble Co. | 4,900,828 | 799,815,129 |
1,285,078,650 | ||
Insurance 2.1% | ||
Aflac, Inc. | 1,096,129 | 91,691,191 |
Allstate Corp. | 545,798 | 92,818,408 |
American International Group, Inc. | 1,462,196 | 110,117,981 |
Aon PLC, Class A | 416,710 | 117,516,387 |
Arch Capital Group Ltd. * | 770,779 | 72,098,668 |
Arthur J Gallagher & Co. | 452,263 | 106,141,604 |
Assurant, Inc. | 107,901 | 18,817,934 |
Brown & Brown, Inc. | 491,965 | 40,114,826 |
Chubb Ltd. | 844,158 | 209,891,445 |
Cincinnati Financial Corp. | 327,038 | 37,835,026 |
Everest Group Ltd. | 90,268 | 33,075,098 |
Globe Life, Inc. | 178,266 | 13,578,521 |
Hartford Financial Services Group, Inc. | 622,930 | 60,355,688 |
Loews Corp. | 378,555 | 28,448,408 |
Marsh & McLennan Cos., Inc. | 1,024,825 | 204,380,850 |
MetLife, Inc. | 1,278,243 | 90,857,512 |
Principal Financial Group, Inc. | 458,099 | 36,253,955 |
Progressive Corp. | 1,219,052 | 253,867,579 |
Prudential Financial, Inc. | 752,236 | 83,107,033 |
Travelers Cos., Inc. | 475,009 | 100,777,909 |
W R Berkley Corp. | 420,906 | 32,397,135 |
Willis Towers Watson PLC | 213,126 | 53,524,464 |
1,887,667,622 | ||
SECURITY | NUMBER OF SHARES | VALUE ($) |
Materials 2.3% | ||
Air Products & Chemicals, Inc. | 463,684 | 109,587,077 |
Albemarle Corp. | 245,160 | 29,495,200 |
Amcor PLC | 3,021,465 | 27,011,897 |
Avery Dennison Corp. | 167,685 | 36,434,597 |
Ball Corp. | 654,912 | 45,562,228 |
Celanese Corp., Class A | 208,888 | 32,087,286 |
CF Industries Holdings, Inc. | 397,156 | 31,363,409 |
Corteva, Inc. | 1,461,135 | 79,091,237 |
Dow, Inc. | 1,464,974 | 83,357,021 |
DuPont de Nemours, Inc. | 898,692 | 65,155,170 |
Eastman Chemical Co. | 245,047 | 23,142,239 |
Ecolab, Inc. | 528,514 | 119,523,441 |
FMC Corp. | 259,102 | 15,289,609 |
Freeport-McMoRan, Inc. | 2,989,487 | 149,294,981 |
International Flavors & Fragrances, Inc. | 531,114 | 44,958,800 |
International Paper Co. | 684,912 | 23,930,825 |
Linde PLC | 1,009,920 | 445,334,323 |
LyondellBasell Industries NV, Class A | 533,604 | 53,344,392 |
Martin Marietta Materials, Inc. | 128,823 | 75,628,119 |
Mosaic Co. | 676,742 | 21,242,931 |
Newmont Corp. | 2,401,650 | 97,603,056 |
Nucor Corp. | 512,149 | 86,312,471 |
Packaging Corp. of America | 186,351 | 32,234,996 |
PPG Industries, Inc. | 491,077 | 63,348,933 |
Sherwin-Williams Co. | 490,559 | 146,976,382 |
Steel Dynamics, Inc. | 316,299 | 41,156,826 |
Vulcan Materials Co. | 276,931 | 71,345,733 |
Westrock Co. | 535,571 | 25,685,985 |
2,075,499,164 | ||
Media & Entertainment 8.2% | ||
Alphabet, Inc., Class A * | 12,273,829 | 1,997,933,885 |
Alphabet, Inc., Class C * | 10,275,963 | 1,691,834,548 |
Charter Communications, Inc., Class A * | 206,233 | 52,783,274 |
Comcast Corp., Class A | 8,252,839 | 314,515,694 |
Electronic Arts, Inc. | 506,832 | 64,276,434 |
Fox Corp., Class A | 749,250 | 23,234,243 |
Interpublic Group of Cos., Inc. | 798,889 | 24,318,181 |
Live Nation Entertainment, Inc. * | 295,074 | 26,235,029 |
Match Group, Inc. * | 570,153 | 17,572,116 |
Meta Platforms, Inc., Class A | 4,582,220 | 1,971,133,578 |
Netflix, Inc. * | 901,344 | 496,316,060 |
News Corp., Class A | 1,034,728 | 24,626,526 |
Omnicom Group, Inc. | 410,206 | 38,083,525 |
Paramount Global, Class B | 1,013,651 | 11,545,485 |
Take-Two Interactive Software, Inc. * | 329,411 | 47,043,185 |
Walt Disney Co. | 3,820,449 | 424,451,884 |
Warner Bros Discovery, Inc. * | 4,638,147 | 34,136,762 |
7,260,040,409 | ||
Pharmaceuticals, Biotechnology & Life Sciences 7.1% | ||
AbbVie, Inc. | 3,677,227 | 598,064,199 |
Agilent Technologies, Inc. | 610,531 | 83,667,168 |
Amgen, Inc. | 1,114,288 | 305,248,055 |
Biogen, Inc. * | 302,343 | 64,949,323 |
Bio-Rad Laboratories, Inc., Class A * | 43,203 | 11,654,009 |
Bio-Techne Corp. | 328,674 | 20,775,484 |
Bristol-Myers Squibb Co. | 4,239,167 | 186,268,998 |
Catalent, Inc. * | 374,089 | 20,892,871 |
Charles River Laboratories International, Inc. * | 106,370 | 24,358,730 |
Danaher Corp. | 1,369,731 | 337,803,059 |
SECURITY | NUMBER OF SHARES | VALUE ($) |
Eli Lilly & Co. | 1,660,847 | 1,297,287,592 |
Gilead Sciences, Inc. | 2,592,100 | 169,004,920 |
Illumina, Inc. * | 331,414 | 40,780,493 |
Incyte Corp. * | 384,805 | 20,029,100 |
IQVIA Holdings, Inc. * | 379,622 | 87,984,991 |
Johnson & Johnson | 5,013,835 | 724,950,403 |
Merck & Co., Inc. | 5,277,815 | 681,999,254 |
Mettler-Toledo International, Inc. * | 44,863 | 55,168,031 |
Moderna, Inc. * | 691,015 | 76,225,865 |
Pfizer, Inc. | 11,760,242 | 301,297,400 |
Regeneron Pharmaceuticals, Inc. * | 220,088 | 196,023,578 |
Revvity, Inc. | 258,836 | 26,522,925 |
Thermo Fisher Scientific, Inc. | 804,728 | 457,664,908 |
Vertex Pharmaceuticals, Inc. * | 536,746 | 210,839,196 |
Viatris, Inc. | 2,495,287 | 28,870,471 |
Waters Corp. * | 123,696 | 38,227,012 |
West Pharmaceutical Services, Inc. | 153,538 | 54,886,764 |
Zoetis, Inc. | 956,405 | 152,297,932 |
6,273,742,731 | ||
Real Estate Management & Development 0.1% | ||
CBRE Group, Inc., Class A * | 620,325 | 53,900,039 |
CoStar Group, Inc. * | 851,112 | 77,902,282 |
131,802,321 | ||
Semiconductors & Semiconductor Equipment 10.1% | ||
Advanced Micro Devices, Inc. * | 3,365,331 | 533,001,124 |
Analog Devices, Inc. | 1,032,888 | 207,207,662 |
Applied Materials, Inc. | 1,733,003 | 344,261,046 |
Broadcom, Inc. | 916,533 | 1,191,740,364 |
Enphase Energy, Inc. * | 281,339 | 30,598,430 |
First Solar, Inc. * | 221,567 | 39,062,262 |
Intel Corp. | 8,805,998 | 268,318,759 |
KLA Corp. | 281,909 | 194,317,055 |
Lam Research Corp. | 273,059 | 244,226,700 |
Microchip Technology, Inc. | 1,126,335 | 103,600,293 |
Micron Technology, Inc. | 2,299,201 | 259,717,745 |
Monolithic Power Systems, Inc. | 100,225 | 67,083,599 |
NVIDIA Corp. | 5,144,469 | 4,444,924,105 |
NXP Semiconductors NV | 537,639 | 137,737,735 |
ON Semiconductor Corp. * | 890,682 | 62,490,249 |
Qorvo, Inc. * | 199,689 | 23,331,663 |
QUALCOMM, Inc. | 2,324,384 | 385,499,086 |
Skyworks Solutions, Inc. | 335,216 | 35,730,674 |
Teradyne, Inc. | 318,392 | 37,035,358 |
Texas Instruments, Inc. | 1,893,848 | 334,112,664 |
8,943,996,573 | ||
Software & Services 11.3% | ||
Accenture PLC, Class A | 1,305,887 | 392,954,457 |
Adobe, Inc. * | 941,417 | 435,716,030 |
Akamai Technologies, Inc. * | 316,277 | 31,921,838 |
ANSYS, Inc. * | 181,010 | 58,806,529 |
Autodesk, Inc. * | 446,024 | 94,936,208 |
Cadence Design Systems, Inc. * | 567,290 | 156,362,143 |
Cognizant Technology Solutions Corp., Class A | 1,039,583 | 68,279,811 |
EPAM Systems, Inc. * | 121,071 | 28,483,164 |
Fair Isaac Corp. * | 51,768 | 58,670,227 |
Fortinet, Inc. * | 1,326,962 | 83,837,459 |
Gartner, Inc. * | 162,826 | 67,180,379 |
Gen Digital, Inc. | 1,176,150 | 23,687,661 |
International Business Machines Corp. | 1,905,774 | 316,739,639 |
Intuit, Inc. | 583,045 | 364,764,613 |
SECURITY | NUMBER OF SHARES | VALUE ($) |
Microsoft Corp. | 15,475,972 | 6,025,260,179 |
Oracle Corp. | 3,320,734 | 377,733,493 |
Palo Alto Networks, Inc. * | 656,096 | 190,851,765 |
PTC, Inc. * | 248,668 | 44,123,650 |
Roper Technologies, Inc. | 222,126 | 113,608,564 |
Salesforce, Inc. | 2,016,132 | 542,218,540 |
ServiceNow, Inc. * | 426,970 | 296,031,110 |
Synopsys, Inc. * | 317,372 | 168,394,410 |
Tyler Technologies, Inc. * | 88,088 | 40,657,016 |
VeriSign, Inc. * | 183,033 | 31,020,433 |
10,012,239,318 | ||
Technology Hardware & Equipment 7.6% | ||
Amphenol Corp., Class A | 1,248,874 | 150,826,513 |
Apple, Inc. | 30,232,334 | 5,149,473,450 |
Arista Networks, Inc. * | 524,905 | 134,669,627 |
CDW Corp. | 278,179 | 67,280,373 |
Cisco Systems, Inc. | 8,463,331 | 397,607,290 |
Corning, Inc. | 1,596,297 | 53,284,394 |
F5, Inc. * | 121,409 | 20,070,122 |
Hewlett Packard Enterprise Co. | 2,696,861 | 45,846,637 |
HP, Inc. | 1,818,179 | 51,072,648 |
Jabil, Inc. | 265,311 | 31,136,899 |
Juniper Networks, Inc. | 670,406 | 23,343,537 |
Keysight Technologies, Inc. * | 364,882 | 53,980,643 |
Motorola Solutions, Inc. | 346,233 | 117,424,922 |
NetApp, Inc. | 427,571 | 43,702,032 |
Seagate Technology Holdings PLC | 405,735 | 34,856,694 |
Super Micro Computer, Inc. * | 104,601 | 89,831,339 |
TE Connectivity Ltd. | 641,777 | 90,798,610 |
Teledyne Technologies, Inc. * | 98,131 | 37,435,014 |
Trimble, Inc. * | 516,019 | 30,997,261 |
Western Digital Corp. * | 678,502 | 48,058,296 |
Zebra Technologies Corp., Class A * | 106,677 | 33,556,317 |
6,705,252,618 | ||
Telecommunication Services 0.9% | ||
AT&T, Inc. | 14,891,885 | 251,523,938 |
T-Mobile U.S., Inc. | 1,086,346 | 178,345,423 |
Verizon Communications, Inc. | 8,756,578 | 345,797,265 |
775,666,626 | ||
Transportation 1.7% | ||
American Airlines Group, Inc. * | 1,372,805 | 18,546,596 |
CH Robinson Worldwide, Inc. | 245,255 | 17,413,105 |
CSX Corp. | 4,110,994 | 136,567,221 |
Delta Air Lines, Inc. | 1,329,338 | 66,559,954 |
Expeditors International of Washington, Inc. | 301,053 | 33,510,209 |
FedEx Corp. | 478,931 | 125,374,557 |
JB Hunt Transport Services, Inc. | 170,645 | 27,741,758 |
Norfolk Southern Corp. | 471,010 | 108,483,023 |
Old Dominion Freight Line, Inc. | 372,053 | 67,605,751 |
Southwest Airlines Co. | 1,238,760 | 32,133,434 |
Uber Technologies, Inc. * | 4,286,068 | 284,037,726 |
SECURITY | NUMBER OF SHARES | VALUE ($) |
Union Pacific Corp. | 1,270,034 | 301,201,264 |
United Airlines Holdings, Inc. * | 681,029 | 35,045,752 |
United Parcel Service, Inc., Class B | 1,506,386 | 222,161,807 |
1,476,382,157 | ||
Utilities 2.3% | ||
AES Corp. | 1,406,687 | 25,179,697 |
Alliant Energy Corp. | 535,134 | 26,649,673 |
Ameren Corp. | 546,977 | 40,405,191 |
American Electric Power Co., Inc. | 1,095,842 | 94,275,287 |
American Water Works Co., Inc. | 404,959 | 49,534,585 |
Atmos Energy Corp. | 313,257 | 36,933,000 |
CenterPoint Energy, Inc. | 1,310,671 | 38,192,953 |
CMS Energy Corp. | 615,427 | 37,301,030 |
Consolidated Edison, Inc. | 720,520 | 68,017,088 |
Constellation Energy Corp. | 664,706 | 123,595,434 |
Dominion Energy, Inc. | 1,744,977 | 88,958,927 |
DTE Energy Co. | 429,736 | 47,408,476 |
Duke Energy Corp. | 1,608,159 | 158,017,703 |
Edison International | 800,409 | 56,877,064 |
Entergy Corp. | 440,100 | 46,945,467 |
Evergy, Inc. | 475,088 | 24,918,366 |
Eversource Energy | 731,382 | 44,336,377 |
Exelon Corp. | 2,069,758 | 77,781,506 |
FirstEnergy Corp. | 1,071,598 | 41,085,067 |
NextEra Energy, Inc. | 4,273,259 | 286,180,155 |
NiSource, Inc. | 857,812 | 23,898,642 |
NRG Energy, Inc. | 470,337 | 34,179,390 |
PG&E Corp. | 4,446,933 | 76,087,024 |
Pinnacle West Capital Corp. | 233,891 | 17,226,072 |
PPL Corp. | 1,529,487 | 41,999,713 |
Public Service Enterprise Group, Inc. | 1,037,582 | 71,676,165 |
Sempra | 1,308,560 | 93,732,153 |
Southern Co. | 2,274,294 | 167,160,609 |
WEC Energy Group, Inc. | 659,095 | 54,467,611 |
Xcel Energy, Inc. | 1,146,989 | 61,627,719 |
2,054,648,144 | ||
Total Common Stocks (Cost $37,812,019,080) | 87,962,740,714 | |
Total Investments in Securities (Cost $37,812,019,080) | 87,962,740,714 | |
NUMBER OF CONTRACTS | NOTIONAL AMOUNT ($) | CURRENT VALUE/ UNREALIZED DEPRECIATION ($) | |
FUTURES CONTRACTS | |||
Long | |||
S&P 500 Index, e-mini, expires 06/21/24 | 1,180 | 298,953,000 | (1,359,958 ) |
* | Non-income producing security. |
(a) | Issuer is affiliated with the fund’s investment adviser. |
SECURITY | VALUE AT 10/31/23 | PURCHASES | SALES | REALIZED GAINS (LOSSES) | NET CHANGE IN UNREALIZED APPRECIATION (DEPRECIATION) | VALUE AT 4/30/24 | BALANCE OF SHARES HELD AT 4/30/24 | DIVIDENDS RECEIVED |
COMMON STOCKS 0.3% OF NET ASSETS | ||||||||
Financial Services 0.3% | ||||||||
Charles Schwab Corp. | $152,666,938 | $9,895,759 | $— | $— | $65,288,050 | $227,850,747 | 3,081,146 | $1,483,198 |
DESCRIPTION | QUOTED PRICES IN ACTIVE MARKETS FOR IDENTICAL ASSETS (LEVEL 1) | OTHER SIGNIFICANT OBSERVABLE INPUTS (LEVEL 2) | SIGNIFICANT UNOBSERVABLE INPUTS (LEVEL 3) | TOTAL |
Assets | ||||
Common Stocks1 | $87,962,740,714 | $— | $— | $87,962,740,714 |
Liabilities | ||||
Futures Contracts2 | (1,359,958 ) | — | — | (1,359,958 ) |
Total | $87,961,380,756 | $— | $— | $87,961,380,756 |
1 | As categorized in the Portfolio Holdings. |
2 | Futures contracts are reported at cumulative unrealized appreciation or depreciation. |
Assets | ||
Investments in securities, at value - affiliated issuers (cost $106,772,735) | $227,850,747 | |
Investments in securities, at value - unaffiliated issuers (cost $37,705,246,345) | 87,734,889,967 | |
Cash | 217,603,390 | |
Deposit with broker for futures contracts | 20,260,600 | |
Receivables: | ||
Fund shares sold | 116,194,508 | |
Dividends | + | 52,872,868 |
Total assets | 88,369,672,080 | |
Liabilities | ||
Payables: | ||
Fund shares redeemed | 35,429,075 | |
Variation margin on futures contracts | 4,297,723 | |
Investment adviser fees | + | 1,465,280 |
Total liabilities | 41,192,078 | |
Net assets | $88,328,480,002 | |
Net Assets by Source | ||
Capital received from investors | $38,589,667,836 | |
Total distributable earnings | + | 49,738,812,166 |
Net assets | $88,328,480,002 | |
Net Asset Value (NAV) | ||||
Net Assets | ÷ | Shares Outstanding | = | NAV |
$88,328,480,002 | 1,139,686,064 | $77.50 | ||
For the period November 1, 2023 through April 30, 2024; unaudited | ||
Investment Income | ||
Dividends received from securities - unaffiliated issuers (net of foreign withholding tax of $158,849) | $634,678,669 | |
Other interest | 5,064,446 | |
Dividends received from securities - affiliated issuers | 1,483,198 | |
Securities on loan, net | + | 58 |
Total investment income | 641,226,371 | |
Expenses | ||
Investment adviser fees | 8,276,166 | |
Total expenses | – | 8,276,166 |
Net investment income | 632,950,205 | |
REALIZED AND UNREALIZED GAINS (LOSSES) | ||
Net realized losses on sales of securities - unaffiliated issuers | (62,177,689 ) | |
Net realized gains on futures contracts | + | 48,313,617 |
Net realized losses | (13,864,072 ) | |
Net change in unrealized appreciation (depreciation) on securities - affiliated issuers | 65,288,050 | |
Net change in unrealized appreciation (depreciation) on securities - unaffiliated issuers | 14,084,762,680 | |
Net change in unrealized appreciation (depreciation) on futures contracts | + | 4,442,430 |
Net change in unrealized appreciation (depreciation) | + | 14,154,493,160 |
Net realized and unrealized gains | 14,140,629,088 | |
Increase in net assets resulting from operations | $14,773,579,293 | |
OPERATIONS | |||
11/1/23-4/30/24 | 11/1/22-10/31/23 | ||
Net investment income | $632,950,205 | $1,096,359,862 | |
Net realized losses | (13,864,072 ) | (260,101,329 ) | |
Net change in unrealized appreciation (depreciation) | + | 14,154,493,160 | 5,263,994,272 |
Increase in net assets resulting from operations | $14,773,579,293 | $6,100,252,805 | |
DISTRIBUTIONS TO SHAREHOLDERS | |||
Total distributions | ($1,135,808,670 ) | ($999,828,367 ) | |
TRANSACTIONS IN FUND SHARES | |||||
11/1/23-4/30/24 | 11/1/22-10/31/23 | ||||
SHARES | VALUE | SHARES | VALUE | ||
Shares sold | 124,335,713 | $9,350,905,267 | 176,030,065 | $11,382,757,051 | |
Shares reinvested | 13,102,802 | 923,878,457 | 13,335,796 | 802,281,581 | |
Shares redeemed | + | (75,212,567 ) | (5,646,295,745 ) | (129,402,948 ) | (8,291,585,464 ) |
Net transactions in fund shares | 62,225,948 | $4,628,487,979 | 59,962,913 | $3,893,453,168 | |
SHARES OUTSTANDING AND NET ASSETS | |||||
11/1/23-4/30/24 | 11/1/22-10/31/23 | ||||
SHARES | NET ASSETS | SHARES | NET ASSETS | ||
Beginning of period | 1,077,460,116 | $70,062,221,400 | 1,017,497,203 | $61,068,343,794 | |
Total increase | + | 62,225,948 | 18,266,258,602 | 59,962,913 | 8,993,877,606 |
End of period | 1,139,686,064 | $88,328,480,002 | 1,077,460,116 | $70,062,221,400 | |
11/1/23– 4/30/24* | 11/1/22– 10/31/23 | 11/1/21– 10/31/22 | 11/1/20– 10/31/21 | 11/1/19– 10/31/20 | 11/1/18– 10/31/19 | |
Per-Share Data | ||||||
Net asset value at beginning of period | $90.46 | $84.03 | $102.69 | $73.73 | $68.68 | $64.19 |
Income (loss) from investment operations: | ||||||
Net investment income (loss)1 | 0.77 | 1.41 | 1.29 | 1.24 | 1.38 | 1.38 |
Net realized and unrealized gains (losses) | 18.43 | 6.34 | (18.14 ) | 30.02 | 5.81 | 6.73 |
Total from investment operations | 19.20 | 7.75 | (16.85 ) | 31.26 | 7.19 | 8.11 |
Less distributions: | ||||||
Distributions from net investment income | (1.44 ) | (1.32 ) | (1.23 ) | (1.42 ) | (1.29 ) | (1.28 ) |
Distributions from net realized gains | — | — | (0.58 ) | (0.88 ) | (0.85 ) | (2.34 ) |
Total distributions | (1.44 ) | (1.32 ) | (1.81 ) | (2.30 ) | (2.14 ) | (3.62 ) |
Net asset value at end of period | $108.22 | $90.46 | $84.03 | $102.69 | $73.73 | $68.68 |
Total return | 21.39 %2 | 9.35 % | (16.73 %) | 43.16 % | 10.60 % | 14.20 % |
Ratios/Supplemental Data | ||||||
Ratios to average net assets: | ||||||
Total expenses | 0.05 %3 | 0.05 % | 0.05 %4 | 0.05 % | 0.05 % | 0.05 % |
Net investment income (loss) | 1.48 %3 | 1.57 % | 1.40 % | 1.36 % | 1.97 % | 2.15 % |
Portfolio turnover rate | 1 %2,5 | 3 %5 | 2 %5 | 5 %5 | 4 % | 5 % |
Net assets, end of period (x 1,000,000) | $15,402 | $12,811 | $11,888 | $14,222 | $9,774 | $9,346 |
* | Unaudited. |
1 | Calculated based on the average shares outstanding during the period. |
2 | Not annualized. |
3 | Annualized. |
4 | Ratio includes less than 0.005% of non-routine proxy expenses. |
5 | Portfolio turnover rate excludes in-kind transactions. |
SECURITY | NUMBER OF SHARES | VALUE ($) |
COMMON STOCKS 99.7% OF NET ASSETS | ||
Automobiles & Components 1.5% | ||
Aptiv PLC * | 92,010 | 6,532,710 |
Autoliv, Inc. | 24,115 | 2,888,736 |
BorgWarner, Inc. | 74,665 | 2,446,772 |
Ford Motor Co. | 1,288,139 | 15,650,889 |
Fox Factory Holding Corp. * | 13,342 | 519,271 |
General Motors Co. | 380,486 | 16,943,041 |
Gentex Corp. | 75,612 | 2,593,492 |
Harley-Davidson, Inc. | 43,839 | 1,507,623 |
Lear Corp. | 18,528 | 2,332,119 |
Lucid Group, Inc. *(a) | 295,144 | 752,617 |
Rivian Automotive, Inc., Class A *(a) | 222,858 | 1,983,436 |
Tesla, Inc. * | 915,889 | 167,864,136 |
Thor Industries, Inc. | 17,593 | 1,749,096 |
223,763,938 | ||
Banks 3.4% | ||
Bank of America Corp. | 2,275,847 | 84,229,097 |
Bank OZK | 33,342 | 1,488,720 |
BOK Financial Corp. | 8,701 | 772,040 |
Citigroup, Inc. | 629,078 | 38,581,354 |
Citizens Financial Group, Inc. | 155,330 | 5,298,306 |
Columbia Banking System, Inc. | 65,419 | 1,230,531 |
Comerica, Inc. | 42,330 | 2,123,696 |
Commerce Bancshares, Inc. | 39,157 | 2,141,105 |
Cullen/Frost Bankers, Inc. | 21,276 | 2,219,938 |
East West Bancorp, Inc. | 46,075 | 3,432,127 |
Fifth Third Bancorp | 225,149 | 8,208,933 |
First Citizens BancShares, Inc., Class A | 3,916 | 6,605,352 |
First Horizon Corp. | 179,658 | 2,680,497 |
Home BancShares, Inc. | 65,356 | 1,547,630 |
Huntington Bancshares, Inc. | 478,748 | 6,448,736 |
JPMorgan Chase & Co. | 955,635 | 183,233,455 |
KeyCorp | 304,704 | 4,415,161 |
M&T Bank Corp. | 54,921 | 7,930,043 |
New York Community Bancorp, Inc. | 241,285 | 639,405 |
Old National Bancorp | 103,385 | 1,709,988 |
Pinnacle Financial Partners, Inc. | 25,092 | 1,924,556 |
PNC Financial Services Group, Inc. | 131,520 | 20,156,755 |
Popular, Inc. | 23,851 | 2,027,097 |
Prosperity Bancshares, Inc. | 32,453 | 2,011,112 |
Regions Financial Corp. | 303,129 | 5,841,296 |
SouthState Corp. | 25,298 | 1,915,059 |
Synovus Financial Corp. | 47,781 | 1,710,082 |
Truist Financial Corp. | 441,245 | 16,568,750 |
U.S. Bancorp | 512,640 | 20,828,563 |
Valley National Bancorp | 144,582 | 1,013,520 |
Webster Financial Corp. | 58,029 | 2,543,411 |
Wells Fargo & Co. | 1,189,619 | 70,568,199 |
Western Alliance Bancorp | 37,670 | 2,140,786 |
Wintrust Financial Corp. | 20,348 | 1,966,431 |
SECURITY | NUMBER OF SHARES | VALUE ($) |
Zions Bancorp NA | 48,988 | 1,997,731 |
518,149,462 | ||
Capital Goods 6.5% | ||
3M Co. | 182,531 | 17,616,067 |
A O Smith Corp. | 41,151 | 3,408,949 |
AAON, Inc. | 23,231 | 2,185,805 |
Acuity Brands, Inc. | 10,099 | 2,507,582 |
Advanced Drainage Systems, Inc. | 22,285 | 3,498,745 |
AECOM | 44,834 | 4,140,868 |
AGCO Corp. | 20,552 | 2,346,833 |
Air Lease Corp., Class A | 32,864 | 1,651,087 |
Allegion PLC | 29,118 | 3,539,584 |
Allison Transmission Holdings, Inc. | 29,247 | 2,151,117 |
AMETEK, Inc. | 76,292 | 13,325,161 |
API Group Corp. * | 70,021 | 2,700,710 |
Applied Industrial Technologies, Inc. | 12,782 | 2,342,301 |
Atkore, Inc. | 11,990 | 2,101,847 |
Axon Enterprise, Inc. * | 23,284 | 7,303,259 |
AZEK Co., Inc., Class A * | 47,628 | 2,173,742 |
Beacon Roofing Supply, Inc. * | 20,947 | 2,063,908 |
Boeing Co. * | 189,236 | 31,761,370 |
Boise Cascade Co. | 13,601 | 1,799,004 |
Builders FirstSource, Inc. * | 40,496 | 7,403,479 |
BWX Technologies, Inc. | 29,692 | 2,843,603 |
Carlisle Cos., Inc. | 15,896 | 6,171,622 |
Carrier Global Corp. | 275,480 | 16,939,265 |
Caterpillar, Inc. | 168,280 | 56,301,440 |
Chart Industries, Inc. * | 14,266 | 2,055,160 |
Comfort Systems USA, Inc. | 11,771 | 3,642,065 |
Core & Main, Inc., Class A * | 56,947 | 3,215,797 |
Crane Co. | 16,763 | 2,346,988 |
Cummins, Inc. | 44,956 | 12,699,620 |
Curtiss-Wright Corp. | 12,431 | 3,150,264 |
Deere & Co. | 86,073 | 33,689,833 |
Donaldson Co., Inc. | 39,196 | 2,829,951 |
Dover Corp. | 46,300 | 8,301,590 |
Eaton Corp. PLC | 131,953 | 41,995,362 |
EMCOR Group, Inc. | 15,758 | 5,628,285 |
Emerson Electric Co. | 188,978 | 20,368,049 |
Esab Corp. | 18,609 | 1,970,321 |
Fastenal Co. | 188,645 | 12,816,541 |
Ferguson PLC | 67,692 | 14,208,551 |
Flowserve Corp. | 45,133 | 2,128,472 |
Fluor Corp. * | 56,000 | 2,258,480 |
Fortive Corp. | 115,468 | 8,691,276 |
Fortune Brands Innovations, Inc. | 40,928 | 2,991,837 |
Franklin Electric Co., Inc. | 13,152 | 1,266,143 |
GE Vernova, Inc. * | 89,801 | 13,803,312 |
Generac Holdings, Inc. * | 20,602 | 2,801,048 |
General Dynamics Corp. | 75,003 | 21,532,611 |
General Electric Co. | 359,753 | 58,215,230 |
Graco, Inc. | 56,398 | 4,523,120 |
HEICO Corp. | 33,775 | 7,004,935 |
Hexcel Corp. | 26,860 | 1,724,681 |
Honeywell International, Inc. | 217,918 | 41,999,336 |
Howmet Aerospace, Inc. | 129,925 | 8,672,494 |
SECURITY | NUMBER OF SHARES | VALUE ($) |
Hubbell, Inc., Class B | 17,927 | 6,642,312 |
Huntington Ingalls Industries, Inc. | 12,944 | 3,584,582 |
IDEX Corp. | 25,186 | 5,552,506 |
Illinois Tool Works, Inc. | 89,880 | 21,940,607 |
Ingersoll Rand, Inc. | 134,338 | 12,536,422 |
ITT, Inc. | 27,173 | 3,514,556 |
Johnson Controls International PLC | 224,233 | 14,590,841 |
L3Harris Technologies, Inc. | 62,464 | 13,370,419 |
Lennox International, Inc. | 10,474 | 4,853,861 |
Leonardo DRS, Inc. * | 23,668 | 509,335 |
Lincoln Electric Holdings, Inc. | 18,742 | 4,114,431 |
Lockheed Martin Corp. | 70,935 | 32,979,810 |
Masco Corp. | 72,286 | 4,947,977 |
MasTec, Inc. * | 20,500 | 1,818,145 |
Middleby Corp. * | 17,694 | 2,458,935 |
MSC Industrial Direct Co., Inc., Class A | 15,612 | 1,424,439 |
Mueller Industries, Inc. | 37,422 | 2,088,896 |
Nordson Corp. | 18,323 | 4,730,815 |
Northrop Grumman Corp. | 46,589 | 22,597,063 |
nVent Electric PLC | 54,759 | 3,946,481 |
Oshkosh Corp. | 21,664 | 2,432,217 |
Otis Worldwide Corp. | 133,544 | 12,179,213 |
Owens Corning | 29,080 | 4,891,547 |
PACCAR, Inc. | 172,585 | 18,312,994 |
Parker-Hannifin Corp. | 42,410 | 23,109,633 |
Pentair PLC | 54,709 | 4,326,935 |
Plug Power, Inc. *(a) | 178,600 | 412,566 |
Quanta Services, Inc. | 48,025 | 12,417,344 |
RBC Bearings, Inc. * | 9,824 | 2,402,459 |
Regal Rexnord Corp. | 21,541 | 3,476,071 |
Rockwell Automation, Inc. | 37,955 | 10,284,287 |
RTX Corp. | 438,588 | 44,525,454 |
Sensata Technologies Holding PLC | 50,073 | 1,918,297 |
Simpson Manufacturing Co., Inc. | 14,403 | 2,504,538 |
SiteOne Landscape Supply, Inc. * | 14,826 | 2,326,051 |
Snap-on, Inc. | 17,672 | 4,735,389 |
Stanley Black & Decker, Inc. | 50,587 | 4,623,652 |
Textron, Inc. | 64,944 | 5,493,613 |
Timken Co. | 22,462 | 2,004,060 |
Toro Co. | 34,370 | 3,010,468 |
Trane Technologies PLC | 75,220 | 23,870,315 |
TransDigm Group, Inc. | 18,381 | 22,940,039 |
Trex Co., Inc. * | 36,051 | 3,192,316 |
UFP Industries, Inc. | 19,853 | 2,237,433 |
United Rentals, Inc. | 22,154 | 14,798,650 |
Valmont Industries, Inc. | 6,592 | 1,350,042 |
Vertiv Holdings Co., Class A | 116,000 | 10,788,000 |
Watsco, Inc. | 10,296 | 4,609,725 |
Watts Water Technologies, Inc., Class A | 9,019 | 1,789,911 |
WESCO International, Inc. | 14,875 | 2,272,156 |
Westinghouse Air Brake Technologies Corp. | 59,314 | 9,554,299 |
WillScot Mobile Mini Holdings Corp. * | 62,825 | 2,322,012 |
Woodward, Inc. | 20,303 | 3,296,395 |
WW Grainger, Inc. | 14,658 | 13,505,148 |
Xylem, Inc. | 79,162 | 10,346,473 |
Zurn Elkay Water Solutions Corp. | 45,111 | 1,411,072 |
1,006,681,907 | ||
Commercial & Professional Services 1.5% | ||
Automatic Data Processing, Inc. | 135,789 | 32,846,001 |
Booz Allen Hamilton Holding Corp., Class A | 42,515 | 6,278,190 |
Broadridge Financial Solutions, Inc. | 38,998 | 7,542,603 |
CACI International, Inc., Class A * | 7,309 | 2,939,899 |
SECURITY | NUMBER OF SHARES | VALUE ($) |
Casella Waste Systems, Inc., Class A * | 19,413 | 1,754,935 |
Cintas Corp. | 28,380 | 18,683,689 |
Clarivate PLC * | 140,745 | 951,436 |
Clean Harbors, Inc. * | 16,627 | 3,149,985 |
Copart, Inc. * | 289,116 | 15,701,890 |
Dayforce, Inc. * | 52,393 | 3,215,358 |
Dun & Bradstreet Holdings, Inc. | 77,222 | 702,720 |
Equifax, Inc. | 40,626 | 8,945,439 |
ExlService Holdings, Inc. * | 57,872 | 1,678,288 |
Exponent, Inc. | 16,733 | 1,537,930 |
FTI Consulting, Inc. * | 11,315 | 2,419,487 |
Genpact Ltd. | 54,268 | 1,668,198 |
Jacobs Solutions, Inc. | 41,236 | 5,918,603 |
KBR, Inc. | 45,148 | 2,931,911 |
Leidos Holdings, Inc. | 45,453 | 6,373,420 |
Maximus, Inc. | 20,953 | 1,682,107 |
MSA Safety, Inc. | 12,118 | 2,186,087 |
Parsons Corp. * | 13,384 | 1,050,778 |
Paychex, Inc. | 105,857 | 12,576,870 |
Paycom Software, Inc. | 15,879 | 2,984,935 |
Paylocity Holding Corp. * | 14,624 | 2,269,060 |
RB Global, Inc. | 60,772 | 4,350,060 |
Republic Services, Inc., Class A | 67,757 | 12,989,017 |
Robert Half, Inc. | 33,607 | 2,323,588 |
Rollins, Inc. | 91,966 | 4,098,005 |
Science Applications International Corp. | 16,804 | 2,162,675 |
SS&C Technologies Holdings, Inc. | 72,576 | 4,491,729 |
Tetra Tech, Inc. | 18,081 | 3,520,732 |
TransUnion | 64,083 | 4,678,059 |
TriNet Group, Inc. | 10,957 | 1,099,754 |
Veralto Corp. | 72,672 | 6,807,913 |
Verisk Analytics, Inc., Class A | 48,045 | 10,471,888 |
Vestis Corp. | 42,956 | 791,250 |
Waste Management, Inc. | 121,156 | 25,202,871 |
230,977,360 | ||
Consumer Discretionary Distribution & Retail 5.6% | ||
Amazon.com, Inc. * | 3,021,560 | 528,773,000 |
Asbury Automotive Group, Inc. * | 6,775 | 1,424,376 |
AutoNation, Inc. * | 8,856 | 1,427,144 |
AutoZone, Inc. * | 5,707 | 16,872,175 |
Bath & Body Works, Inc. | 73,959 | 3,359,218 |
Best Buy Co., Inc. | 63,008 | 4,639,909 |
Burlington Stores, Inc. * | 21,034 | 3,784,858 |
CarMax, Inc. * | 53,298 | 3,622,665 |
Carvana Co., Class A * | 33,889 | 2,810,076 |
Dick's Sporting Goods, Inc. | 19,258 | 3,869,703 |
Dillard's, Inc., Class A | 1,348 | 590,411 |
eBay, Inc. | 171,088 | 8,817,876 |
Etsy, Inc. * | 40,586 | 2,787,041 |
Five Below, Inc. * | 17,919 | 2,622,266 |
Floor & Decor Holdings, Inc., Class A * | 35,329 | 3,897,849 |
GameStop Corp., Class A *(a) | 88,308 | 979,336 |
Genuine Parts Co. | 46,160 | 7,256,814 |
Home Depot, Inc. | 328,988 | 109,954,369 |
Lithia Motors, Inc., Class A | 9,190 | 2,337,752 |
LKQ Corp. | 89,764 | 3,871,521 |
Lowe's Cos., Inc. | 190,106 | 43,342,267 |
Murphy USA, Inc. | 6,170 | 2,553,269 |
Ollie's Bargain Outlet Holdings, Inc. * | 20,340 | 1,487,668 |
O'Reilly Automotive, Inc. * | 19,571 | 19,830,511 |
Penske Automotive Group, Inc. | 6,451 | 986,422 |
Pool Corp. | 12,878 | 4,668,661 |
RH * | 5,386 | 1,330,611 |
Ross Stores, Inc. | 111,133 | 14,397,280 |
TJX Cos., Inc. | 376,725 | 35,446,055 |
SECURITY | NUMBER OF SHARES | VALUE ($) |
Tractor Supply Co. | 35,738 | 9,759,333 |
Ulta Beauty, Inc. * | 16,030 | 6,489,585 |
Valvoline, Inc. * | 44,057 | 1,873,304 |
Wayfair, Inc., Class A * | 29,647 | 1,486,797 |
Williams-Sonoma, Inc. | 21,158 | 6,067,691 |
863,417,813 | ||
Consumer Durables & Apparel 1.0% | ||
Brunswick Corp. | 22,310 | 1,799,078 |
Capri Holdings Ltd. * | 38,108 | 1,352,072 |
Columbia Sportswear Co. | 10,652 | 848,219 |
Crocs, Inc. * | 19,885 | 2,473,097 |
Deckers Outdoor Corp. * | 8,423 | 6,893,973 |
DR Horton, Inc. | 98,600 | 14,049,514 |
Garmin Ltd. | 50,510 | 7,297,180 |
Hasbro, Inc. | 43,117 | 2,643,072 |
KB Home | 24,375 | 1,578,525 |
Lennar Corp., Class A | 81,701 | 12,387,506 |
Lululemon Athletica, Inc. * | 37,964 | 13,689,818 |
Mattel, Inc. * | 115,874 | 2,122,812 |
Meritage Homes Corp. | 12,145 | 2,012,912 |
Mohawk Industries, Inc. * | 17,641 | 2,034,360 |
Newell Brands, Inc. | 122,925 | 976,024 |
NIKE, Inc., Class B | 402,359 | 37,121,641 |
NVR, Inc. * | 1,053 | 7,833,109 |
Polaris, Inc. | 18,019 | 1,534,498 |
PulteGroup, Inc. | 70,048 | 7,804,748 |
PVH Corp. | 19,857 | 2,160,442 |
Ralph Lauren Corp., Class A | 12,819 | 2,097,701 |
SharkNinja, Inc. | 15,934 | 1,024,237 |
Skechers USA, Inc., Class A * | 43,337 | 2,862,409 |
Tapestry, Inc. | 76,464 | 3,052,443 |
Taylor Morrison Home Corp., Class A * | 36,059 | 2,019,665 |
Tempur Sealy International, Inc. | 57,230 | 2,864,934 |
Toll Brothers, Inc. | 34,426 | 4,100,481 |
TopBuild Corp. * | 10,503 | 4,250,249 |
VF Corp. | 104,918 | 1,307,278 |
Whirlpool Corp. | 18,846 | 1,787,732 |
YETI Holdings, Inc. * | 28,594 | 1,021,378 |
155,001,107 | ||
Consumer Services 2.3% | ||
ADT, Inc. | 88,956 | 578,214 |
Airbnb, Inc., Class A * | 143,858 | 22,811,563 |
Aramark | 88,331 | 2,783,310 |
Booking Holdings, Inc. | 11,533 | 39,812,262 |
Boyd Gaming Corp. | 22,968 | 1,229,018 |
Bright Horizons Family Solutions, Inc. * | 19,834 | 2,056,984 |
Caesars Entertainment, Inc. * | 72,625 | 2,601,427 |
Carnival Corp. * | 331,029 | 4,905,850 |
Chipotle Mexican Grill, Inc., Class A * | 9,066 | 28,644,934 |
Choice Hotels International, Inc. | 8,060 | 953,176 |
Churchill Downs, Inc. | 22,452 | 2,896,308 |
Darden Restaurants, Inc. | 39,472 | 6,055,399 |
Domino's Pizza, Inc. | 11,440 | 6,054,849 |
DoorDash, Inc., Class A * | 100,333 | 12,969,043 |
DraftKings, Inc., Class A * | 154,568 | 6,423,846 |
Duolingo, Inc. * | 11,960 | 2,699,970 |
Expedia Group, Inc. * | 43,118 | 5,804,976 |
H&R Block, Inc. | 45,779 | 2,162,142 |
Hilton Grand Vacations, Inc. * | 23,542 | 980,289 |
Hilton Worldwide Holdings, Inc. | 83,156 | 16,405,016 |
Hyatt Hotels Corp., Class A | 14,630 | 2,176,798 |
Las Vegas Sands Corp. | 121,561 | 5,392,446 |
Light & Wonder, Inc. * | 29,388 | 2,623,173 |
SECURITY | NUMBER OF SHARES | VALUE ($) |
Marriott International, Inc., Class A | 81,700 | 19,291,821 |
McDonald's Corp. | 239,765 | 65,465,436 |
MGM Resorts International * | 90,374 | 3,564,350 |
Norwegian Cruise Line Holdings Ltd. * | 139,998 | 2,648,762 |
Planet Fitness, Inc., Class A * | 29,307 | 1,753,731 |
Royal Caribbean Cruises Ltd. * | 78,568 | 10,970,450 |
Service Corp. International | 48,889 | 3,505,830 |
Starbucks Corp. | 374,253 | 33,117,648 |
Texas Roadhouse, Inc., Class A | 21,673 | 3,484,585 |
Vail Resorts, Inc. | 12,723 | 2,409,354 |
Wingstop, Inc. | 9,621 | 3,702,065 |
Wyndham Hotels & Resorts, Inc. | 27,442 | 2,017,261 |
Wynn Resorts Ltd. | 31,097 | 2,850,040 |
Yum! Brands, Inc. | 93,180 | 13,161,675 |
346,964,001 | ||
Consumer Staples Distribution & Retail 1.8% | ||
Albertsons Cos., Inc., Class A | 135,703 | 2,768,341 |
BJ's Wholesale Club Holdings, Inc. * | 43,065 | 3,216,094 |
Casey's General Stores, Inc. | 12,203 | 3,899,835 |
Costco Wholesale Corp. | 146,676 | 106,032,080 |
Dollar General Corp. | 72,982 | 10,158,365 |
Dollar Tree, Inc. * | 68,280 | 8,074,110 |
Kroger Co. | 218,605 | 12,106,345 |
Performance Food Group Co. * | 50,498 | 3,427,804 |
Sysco Corp. | 164,226 | 12,205,276 |
Target Corp. | 152,339 | 24,523,532 |
U.S. Foods Holding Corp. * | 74,835 | 3,760,459 |
Walgreens Boots Alliance, Inc. | 235,518 | 4,175,734 |
Walmart, Inc. | 1,414,987 | 83,979,479 |
278,327,454 | ||
Energy 4.2% | ||
Antero Midstream Corp. | 113,320 | 1,568,349 |
Antero Resources Corp. * | 92,890 | 3,159,189 |
APA Corp. | 119,125 | 3,745,290 |
Baker Hughes Co., Class A | 330,543 | 10,782,313 |
ChampionX Corp. | 63,418 | 2,128,942 |
Cheniere Energy, Inc. | 78,633 | 12,409,860 |
Chesapeake Energy Corp. | 36,769 | 3,304,798 |
Chevron Corp. | 573,330 | 92,460,929 |
Chord Energy Corp. | 13,795 | 2,441,439 |
Civitas Resources, Inc. | 27,942 | 2,010,706 |
ConocoPhillips | 389,426 | 48,919,694 |
Coterra Energy, Inc. | 249,806 | 6,834,692 |
Devon Energy Corp. | 211,385 | 10,818,684 |
Diamondback Energy, Inc. | 59,281 | 11,923,187 |
DT Midstream, Inc. | 32,329 | 2,010,864 |
EOG Resources, Inc. | 192,489 | 25,433,572 |
EQT Corp. | 135,337 | 5,425,660 |
Exxon Mobil Corp. | 1,312,630 | 155,244,750 |
Halliburton Co. | 294,713 | 11,042,896 |
Hess Corp. | 90,883 | 14,313,164 |
HF Sinclair Corp. | 51,359 | 2,786,226 |
Kinder Morgan, Inc. | 638,134 | 11,665,089 |
Magnolia Oil & Gas Corp., Class A | 61,817 | 1,549,752 |
Marathon Oil Corp. | 193,503 | 5,195,556 |
Marathon Petroleum Corp. | 121,644 | 22,105,148 |
Matador Resources Co. | 36,362 | 2,265,353 |
Murphy Oil Corp. | 48,795 | 2,178,209 |
New Fortress Energy, Inc. | 21,766 | 570,269 |
Noble Corp. PLC | 36,742 | 1,630,610 |
NOV, Inc. | 130,977 | 2,421,765 |
Occidental Petroleum Corp. | 217,134 | 14,361,243 |
ONEOK, Inc. | 192,796 | 15,254,019 |
Ovintiv, Inc. | 83,116 | 4,265,513 |
SECURITY | NUMBER OF SHARES | VALUE ($) |
Patterson-UTI Energy, Inc. | 105,450 | 1,140,969 |
PBF Energy, Inc., Class A | 36,360 | 1,936,897 |
Permian Resources Corp., Class A | 151,843 | 2,543,370 |
Phillips 66 | 141,922 | 20,324,650 |
Pioneer Natural Resources Co. | 77,233 | 20,800,392 |
Range Resources Corp. | 79,999 | 2,872,764 |
Schlumberger NV | 471,831 | 22,402,536 |
SM Energy Co. | 38,363 | 1,860,222 |
Southwestern Energy Co. * | 365,970 | 2,741,115 |
Targa Resources Corp. | 73,596 | 8,394,360 |
TechnipFMC PLC | 143,413 | 3,674,241 |
Texas Pacific Land Corp. | 6,186 | 3,564,992 |
Transocean Ltd. * | 234,013 | 1,221,548 |
Valaris Ltd. * | 20,857 | 1,356,956 |
Valero Energy Corp. | 112,538 | 17,991,450 |
Weatherford International PLC * | 24,203 | 2,991,975 |
Williams Cos., Inc. | 402,534 | 15,441,204 |
643,487,371 | ||
Equity Real Estate Investment Trusts (REITs) 2.2% | ||
Agree Realty Corp. | 33,136 | 1,896,042 |
Alexandria Real Estate Equities, Inc. | 52,041 | 6,029,991 |
American Homes 4 Rent, Class A | 103,423 | 3,702,543 |
American Tower Corp. | 153,871 | 26,398,109 |
Americold Realty Trust, Inc. | 87,894 | 1,931,031 |
Apartment Income REIT Corp. | 48,573 | 1,864,232 |
AvalonBay Communities, Inc. | 46,974 | 8,904,861 |
Boston Properties, Inc. | 47,345 | 2,930,182 |
Brixmor Property Group, Inc. | 98,553 | 2,178,021 |
Camden Property Trust | 35,247 | 3,513,421 |
Crown Castle, Inc. | 142,956 | 13,406,414 |
CubeSmart | 74,329 | 3,005,865 |
Digital Realty Trust, Inc. | 100,189 | 13,904,229 |
EastGroup Properties, Inc. | 15,766 | 2,449,406 |
Equinix, Inc. | 31,023 | 22,060,766 |
Equity LifeStyle Properties, Inc. | 61,225 | 3,691,255 |
Equity Residential | 114,637 | 7,382,623 |
Essex Property Trust, Inc. | 21,194 | 5,219,023 |
Extra Space Storage, Inc. | 69,789 | 9,371,267 |
Federal Realty Investment Trust | 24,366 | 2,538,206 |
First Industrial Realty Trust, Inc. | 42,554 | 1,932,803 |
Gaming & Leisure Properties, Inc. | 88,495 | 3,781,391 |
Healthcare Realty Trust, Inc., Class A | 126,283 | 1,797,007 |
Healthpeak Properties, Inc. | 233,045 | 4,336,968 |
Host Hotels & Resorts, Inc. | 235,403 | 4,442,055 |
Invitation Homes, Inc. | 190,537 | 6,516,365 |
Iron Mountain, Inc. | 96,314 | 7,466,261 |
Kilroy Realty Corp. | 33,831 | 1,143,488 |
Kimco Realty Corp. | 223,284 | 4,159,781 |
Kite Realty Group Trust | 69,528 | 1,515,710 |
Lamar Advertising Co., Class A | 29,602 | 3,429,392 |
Medical Properties Trust, Inc. (a) | 213,887 | 983,880 |
Mid-America Apartment Communities, Inc. | 38,544 | 5,010,720 |
NET Lease Office Properties | 4,763 | 108,882 |
NNN REIT, Inc. | 60,524 | 2,453,038 |
Omega Healthcare Investors, Inc. | 80,246 | 2,440,281 |
Prologis, Inc. | 305,434 | 31,169,540 |
Public Storage | 52,407 | 13,596,996 |
Rayonier, Inc. | 45,598 | 1,352,437 |
Realty Income Corp. | 274,769 | 14,711,132 |
Regency Centers Corp. | 54,256 | 3,213,040 |
Rexford Industrial Realty, Inc. | 69,720 | 2,984,713 |
Ryman Hospitality Properties, Inc. | 20,315 | 2,142,826 |
SBA Communications Corp., Class A | 35,384 | 6,585,670 |
Simon Property Group, Inc. | 107,389 | 15,091,376 |
STAG Industrial, Inc. | 61,000 | 2,097,790 |
SECURITY | NUMBER OF SHARES | VALUE ($) |
Sun Communities, Inc. | 41,138 | 4,579,482 |
Terreno Realty Corp. | 30,843 | 1,676,317 |
UDR, Inc. | 99,840 | 3,801,907 |
Ventas, Inc. | 131,764 | 5,834,510 |
VICI Properties, Inc., Class A | 342,985 | 9,792,222 |
Vornado Realty Trust | 52,846 | 1,375,581 |
Welltower, Inc. | 183,079 | 17,443,767 |
Weyerhaeuser Co. | 241,632 | 7,290,038 |
WP Carey, Inc. | 72,316 | 3,965,809 |
342,600,662 | ||
Financial Services 7.8% | ||
Affiliated Managers Group, Inc. | 11,185 | 1,745,979 |
Affirm Holdings, Inc. * | 78,011 | 2,486,991 |
AGNC Investment Corp. | 231,236 | 2,115,809 |
Ally Financial, Inc. | 89,346 | 3,426,419 |
American Express Co. | 189,030 | 44,238,691 |
Ameriprise Financial, Inc. | 33,051 | 13,610,071 |
Annaly Capital Management, Inc. | 168,818 | 3,163,649 |
Apollo Global Management, Inc. | 144,461 | 15,656,683 |
ARES Management Corp., Class A | 56,448 | 7,512,664 |
Bank of New York Mellon Corp. | 250,506 | 14,151,084 |
Berkshire Hathaway, Inc., Class B * | 601,424 | 238,602,944 |
BlackRock, Inc. | 46,210 | 34,871,914 |
Blackstone, Inc. | 237,182 | 27,657,793 |
Block, Inc. * | 182,536 | 13,325,128 |
Blue Owl Capital, Inc., Class A | 134,078 | 2,532,733 |
Capital One Financial Corp. | 125,819 | 18,046,219 |
Carlyle Group, Inc. | 73,670 | 3,300,416 |
Cboe Global Markets, Inc. | 34,451 | 6,240,799 |
Charles Schwab Corp. (b) | 488,350 | 36,113,483 |
CME Group, Inc. | 118,898 | 24,925,777 |
Coinbase Global, Inc., Class A * | 56,358 | 11,493,087 |
Corebridge Financial, Inc. (a) | 78,962 | 2,097,231 |
Corpay, Inc. * | 23,821 | 7,197,277 |
Credit Acceptance Corp. * | 1,981 | 1,017,679 |
Discover Financial Services | 82,585 | 10,465,997 |
Enact Holdings, Inc. | 10,030 | 298,192 |
Equitable Holdings, Inc. | 104,716 | 3,865,068 |
Essent Group Ltd. | 36,296 | 1,922,599 |
Evercore, Inc., Class A | 11,907 | 2,161,121 |
FactSet Research Systems, Inc. | 12,660 | 5,277,827 |
Fidelity National Information Services, Inc. | 196,666 | 13,357,555 |
Fiserv, Inc. * | 198,224 | 30,262,858 |
Franklin Resources, Inc. | 99,212 | 2,266,002 |
Global Payments, Inc. | 86,073 | 10,567,182 |
Goldman Sachs Group, Inc. | 107,710 | 45,960,934 |
Houlihan Lokey, Inc., Class A | 17,473 | 2,227,633 |
Interactive Brokers Group, Inc., Class A | 35,739 | 4,114,274 |
Intercontinental Exchange, Inc. | 189,417 | 24,389,333 |
Invesco Ltd. | 153,400 | 2,173,678 |
Jack Henry & Associates, Inc. | 24,267 | 3,947,998 |
Janus Henderson Group PLC | 43,807 | 1,367,655 |
Jefferies Financial Group, Inc. | 55,875 | 2,405,978 |
KKR & Co., Inc. | 219,332 | 20,413,229 |
LPL Financial Holdings, Inc. | 24,678 | 6,641,590 |
MarketAxess Holdings, Inc. | 12,292 | 2,459,506 |
Mastercard, Inc., Class A | 272,717 | 123,049,910 |
MGIC Investment Corp. | 85,833 | 1,740,693 |
Moody's Corp. | 52,120 | 19,301,600 |
Morgan Stanley | 414,115 | 37,618,207 |
Morningstar, Inc. | 8,816 | 2,491,842 |
MSCI, Inc., Class A | 26,041 | 12,129,637 |
Nasdaq, Inc. | 125,358 | 7,502,676 |
Northern Trust Corp. | 67,058 | 5,524,909 |
SECURITY | NUMBER OF SHARES | VALUE ($) |
OneMain Holdings, Inc. | 41,911 | 2,183,982 |
PayPal Holdings, Inc. * | 353,676 | 24,021,674 |
Raymond James Financial, Inc. | 62,347 | 7,606,334 |
Remitly Global, Inc. * | 43,486 | 775,355 |
Rithm Capital Corp. | 153,464 | 1,706,520 |
Robinhood Markets, Inc., Class A * | 175,597 | 2,895,595 |
S&P Global, Inc. | 106,207 | 44,164,057 |
SEI Investments Co. | 32,431 | 2,138,824 |
SoFi Technologies, Inc. *(a) | 322,797 | 2,188,564 |
Starwood Property Trust, Inc. | 103,256 | 1,958,766 |
State Street Corp. | 99,600 | 7,220,004 |
Stifel Financial Corp. | 33,344 | 2,664,852 |
Synchrony Financial | 133,663 | 5,878,499 |
T Rowe Price Group, Inc. | 74,323 | 8,143,571 |
Toast, Inc., Class A * | 123,786 | 2,925,063 |
Tradeweb Markets, Inc., Class A | 39,089 | 3,975,742 |
Visa, Inc., Class A | 522,801 | 140,429,577 |
Voya Financial, Inc. | 33,581 | 2,288,881 |
Western Union Co. | 114,054 | 1,532,886 |
WEX, Inc. * | 14,090 | 2,976,653 |
1,209,111,602 | ||
Food, Beverage & Tobacco 2.7% | ||
Altria Group, Inc. | 582,920 | 25,537,725 |
Archer-Daniels-Midland Co. | 177,073 | 10,387,102 |
Brown-Forman Corp., Class B | 60,000 | 2,871,000 |
Bunge Global SA | 48,004 | 4,884,887 |
Campbell Soup Co. | 66,170 | 3,024,631 |
Celsius Holdings, Inc. * | 49,801 | 3,549,317 |
Coca-Cola Co. | 1,286,210 | 79,449,192 |
Coca-Cola Consolidated, Inc. | 1,545 | 1,276,170 |
Conagra Brands, Inc. | 157,208 | 4,838,862 |
Constellation Brands, Inc., Class A | 52,911 | 13,410,822 |
Darling Ingredients, Inc. * | 53,622 | 2,271,964 |
Flowers Foods, Inc. | 62,600 | 1,561,244 |
General Mills, Inc. | 187,373 | 13,202,302 |
Hershey Co. | 49,926 | 9,681,650 |
Hormel Foods Corp. | 95,622 | 3,400,318 |
Ingredion, Inc. | 21,779 | 2,495,656 |
J M Smucker Co. | 35,581 | 4,086,478 |
Kellanova | 86,599 | 5,010,618 |
Keurig Dr Pepper, Inc. | 345,585 | 11,646,214 |
Kraft Heinz Co. | 263,534 | 10,175,048 |
Lamb Weston Holdings, Inc. | 47,615 | 3,968,234 |
Lancaster Colony Corp. | 6,465 | 1,233,587 |
McCormick & Co., Inc. - Non Voting Shares | 84,287 | 6,410,869 |
Molson Coors Beverage Co., Class B | 62,037 | 3,552,239 |
Mondelez International, Inc., Class A | 444,237 | 31,958,410 |
Monster Beverage Corp. * | 243,692 | 13,025,337 |
National Beverage Corp. * | 7,583 | 337,443 |
PepsiCo, Inc. | 454,323 | 79,919,959 |
Philip Morris International, Inc. | 513,171 | 48,720,455 |
Pilgrim's Pride Corp. * | 15,417 | 555,320 |
Post Holdings, Inc. * | 16,104 | 1,709,440 |
Tyson Foods, Inc., Class A | 94,651 | 5,740,583 |
WK Kellogg Co. | 21,231 | 495,532 |
410,388,608 | ||
Health Care Equipment & Services 5.0% | ||
Abbott Laboratories | 573,861 | 60,812,050 |
Acadia Healthcare Co., Inc. * | 30,501 | 2,255,244 |
agilon health, Inc. * | 99,327 | 546,299 |
Align Technology, Inc. * | 23,614 | 6,668,121 |
Baxter International, Inc. | 167,277 | 6,752,972 |
Becton Dickinson & Co. | 95,318 | 22,361,603 |
SECURITY | NUMBER OF SHARES | VALUE ($) |
Boston Scientific Corp. * | 484,308 | 34,807,216 |
Cardinal Health, Inc. | 80,230 | 8,266,899 |
Cencora, Inc. | 54,492 | 13,026,313 |
Centene Corp. * | 176,461 | 12,892,241 |
Chemed Corp. | 4,979 | 2,828,072 |
Cigna Group | 96,575 | 34,481,138 |
Cooper Cos., Inc. | 65,336 | 5,818,824 |
CVS Health Corp. | 415,886 | 28,159,641 |
DaVita, Inc. * | 18,142 | 2,521,919 |
DENTSPLY SIRONA, Inc. | 68,524 | 2,056,405 |
Dexcom, Inc. * | 127,392 | 16,228,467 |
Edwards Lifesciences Corp. * | 200,162 | 16,947,717 |
Elevance Health, Inc. | 77,675 | 41,057,452 |
Encompass Health Corp. | 33,148 | 2,763,880 |
Ensign Group, Inc. | 18,467 | 2,185,754 |
Envista Holdings Corp. * | 60,747 | 1,195,501 |
GE HealthCare Technologies, Inc. | 139,700 | 10,650,728 |
Globus Medical, Inc., Class A * | 37,860 | 1,885,049 |
Haemonetics Corp. * | 16,597 | 1,526,094 |
HCA Healthcare, Inc. | 65,392 | 20,259,749 |
HealthEquity, Inc. * | 29,143 | 2,299,674 |
Henry Schein, Inc. * | 43,535 | 3,016,105 |
Hologic, Inc. * | 77,487 | 5,871,190 |
Humana, Inc. | 40,647 | 12,279,052 |
IDEXX Laboratories, Inc. * | 27,360 | 13,481,914 |
Inspire Medical Systems, Inc. * | 10,288 | 2,486,198 |
Insulet Corp. * | 23,037 | 3,960,982 |
Intuitive Surgical, Inc. * | 116,463 | 43,163,517 |
Laboratory Corp. of America Holdings | 27,748 | 5,587,615 |
Lantheus Holdings, Inc. * | 23,756 | 1,580,724 |
Masimo Corp. * | 15,262 | 2,051,365 |
McKesson Corp. | 43,370 | 23,298,798 |
Medtronic PLC | 439,523 | 35,267,326 |
Molina Healthcare, Inc. * | 19,202 | 6,569,004 |
Neogen Corp. * | 64,750 | 798,368 |
Option Care Health, Inc. * | 56,848 | 1,699,187 |
Penumbra, Inc. * | 12,947 | 2,543,697 |
Quest Diagnostics, Inc. | 36,397 | 5,029,337 |
QuidelOrtho Corp. * | 16,191 | 656,545 |
R1 RCM, Inc. * | 65,068 | 799,686 |
ResMed, Inc. | 48,621 | 10,404,408 |
Shockwave Medical, Inc. * | 12,128 | 4,004,544 |
Solventum Corp. * | 45,632 | 2,966,536 |
STERIS PLC | 32,698 | 6,688,703 |
Stryker Corp. | 111,775 | 37,612,288 |
Surgery Partners, Inc. * | 24,184 | 603,391 |
Teleflex, Inc. | 15,519 | 3,239,591 |
Tenet Healthcare Corp. * | 34,526 | 3,876,925 |
UnitedHealth Group, Inc. | 305,738 | 147,885,471 |
Universal Health Services, Inc., Class B | 19,815 | 3,377,070 |
Veeva Systems, Inc., Class A * | 48,461 | 9,622,416 |
Zimmer Biomet Holdings, Inc. | 69,080 | 8,308,942 |
769,985,917 | ||
Household & Personal Products 1.4% | ||
BellRing Brands, Inc. * | 43,140 | 2,380,034 |
Church & Dwight Co., Inc. | 81,567 | 8,800,264 |
Clorox Co. | 40,870 | 6,043,447 |
Colgate-Palmolive Co. | 271,983 | 25,000,677 |
Coty, Inc., Class A * | 117,200 | 1,340,768 |
elf Beauty, Inc. * | 18,411 | 2,992,340 |
Estee Lauder Cos., Inc., Class A | 77,124 | 11,314,862 |
Inter Parfums, Inc. | 5,918 | 688,737 |
Kenvue, Inc. | 569,709 | 10,721,923 |
Kimberly-Clark Corp. | 111,358 | 15,203,708 |
Procter & Gamble Co. | 777,801 | 126,937,123 |
SECURITY | NUMBER OF SHARES | VALUE ($) |
Reynolds Consumer Products, Inc. | 17,599 | 503,859 |
211,927,742 | ||
Insurance 2.2% | ||
Aflac, Inc. | 173,708 | 14,530,674 |
Allstate Corp. | 86,655 | 14,736,549 |
American Financial Group, Inc. | 21,245 | 2,714,049 |
American International Group, Inc. | 232,062 | 17,476,589 |
Aon PLC, Class A | 66,182 | 18,663,986 |
Arch Capital Group Ltd. * | 121,949 | 11,407,109 |
Arthur J Gallagher & Co. | 71,511 | 16,782,917 |
Assurant, Inc. | 17,184 | 2,996,890 |
Axis Capital Holdings Ltd. | 27,131 | 1,663,944 |
Brown & Brown, Inc. | 77,801 | 6,343,894 |
Chubb Ltd. | 133,692 | 33,241,179 |
Cincinnati Financial Corp. | 52,674 | 6,093,855 |
CNA Financial Corp. | 8,907 | 391,374 |
Erie Indemnity Co., Class A | 8,051 | 3,080,796 |
Everest Group Ltd. | 14,353 | 5,259,083 |
Fidelity National Financial, Inc. | 86,554 | 4,284,423 |
First American Financial Corp. | 34,035 | 1,823,255 |
Globe Life, Inc. | 28,700 | 2,186,079 |
Hartford Financial Services Group, Inc. | 98,510 | 9,544,634 |
Kinsale Capital Group, Inc. | 7,207 | 2,617,943 |
Lincoln National Corp. | 56,360 | 1,536,937 |
Loews Corp. | 61,009 | 4,584,826 |
Markel Group, Inc. * | 4,299 | 6,269,662 |
Marsh & McLennan Cos., Inc. | 162,633 | 32,433,899 |
MetLife, Inc. | 202,918 | 14,423,411 |
Old Republic International Corp. | 85,185 | 2,543,624 |
Primerica, Inc. | 11,281 | 2,389,993 |
Principal Financial Group, Inc. | 72,908 | 5,769,939 |
Progressive Corp. | 193,473 | 40,290,752 |
Prudential Financial, Inc. | 119,050 | 13,152,644 |
Reinsurance Group of America, Inc. | 21,387 | 3,999,155 |
RenaissanceRe Holdings Ltd. | 17,418 | 3,818,896 |
RLI Corp. | 13,544 | 1,914,444 |
Ryan Specialty Holdings, Inc., Class A | 34,191 | 1,686,984 |
Selective Insurance Group, Inc. | 20,045 | 2,037,574 |
Travelers Cos., Inc. | 75,432 | 16,003,653 |
Unum Group | 61,415 | 3,113,741 |
W R Berkley Corp. | 67,986 | 5,232,882 |
Willis Towers Watson PLC | 33,849 | 8,500,838 |
345,543,076 | ||
Materials 2.5% | ||
Air Products & Chemicals, Inc. | 73,370 | 17,340,266 |
Albemarle Corp. | 38,928 | 4,683,428 |
Alcoa Corp. | 61,013 | 2,143,997 |
Amcor PLC | 476,347 | 4,258,542 |
AptarGroup, Inc. | 22,167 | 3,200,471 |
Ashland, Inc. | 16,400 | 1,563,412 |
ATI, Inc. * | 42,313 | 2,526,086 |
Avery Dennison Corp. | 26,748 | 5,811,805 |
Axalta Coating Systems Ltd. * | 73,146 | 2,299,710 |
Balchem Corp. | 10,266 | 1,451,407 |
Ball Corp. | 105,080 | 7,310,416 |
Berry Global Group, Inc. | 38,005 | 2,152,603 |
Celanese Corp., Class A | 32,992 | 5,067,901 |
CF Industries Holdings, Inc. | 63,285 | 4,997,616 |
Chemours Co. | 49,159 | 1,315,003 |
Cleveland-Cliffs, Inc. * | 164,116 | 2,773,560 |
Commercial Metals Co. | 39,389 | 2,116,765 |
Corteva, Inc. | 232,161 | 12,566,875 |
Crown Holdings, Inc. | 39,187 | 3,216,077 |
SECURITY | NUMBER OF SHARES | VALUE ($) |
Dow, Inc. | 231,969 | 13,199,036 |
DuPont de Nemours, Inc. | 141,896 | 10,287,460 |
Eagle Materials, Inc. | 11,430 | 2,865,615 |
Eastman Chemical Co. | 38,578 | 3,643,306 |
Ecolab, Inc. | 83,905 | 18,975,116 |
Element Solutions, Inc. | 73,899 | 1,709,284 |
FMC Corp. | 41,511 | 2,449,564 |
Freeport-McMoRan, Inc. | 473,455 | 23,644,343 |
Graphic Packaging Holding Co. | 99,058 | 2,560,649 |
Huntsman Corp. | 53,525 | 1,277,107 |
International Flavors & Fragrances, Inc. | 85,156 | 7,208,455 |
International Paper Co. | 108,977 | 3,807,656 |
Linde PLC | 160,282 | 70,677,951 |
Louisiana-Pacific Corp. | 21,230 | 1,553,824 |
LyondellBasell Industries NV, Class A | 85,223 | 8,519,743 |
Martin Marietta Materials, Inc. | 20,425 | 11,990,905 |
Mosaic Co. | 107,504 | 3,374,551 |
NewMarket Corp. | 2,270 | 1,196,108 |
Newmont Corp. | 381,822 | 15,517,246 |
Nucor Corp. | 81,222 | 13,688,344 |
Olin Corp. | 40,000 | 2,091,200 |
Packaging Corp. of America | 29,211 | 5,052,919 |
PPG Industries, Inc. | 77,734 | 10,027,686 |
Reliance, Inc. | 18,900 | 5,381,208 |
Royal Gold, Inc. | 21,766 | 2,614,750 |
RPM International, Inc. | 42,756 | 4,571,044 |
Sealed Air Corp. | 49,310 | 1,552,279 |
Sherwin-Williams Co. | 77,842 | 23,322,242 |
Silgan Holdings, Inc. | 27,479 | 1,282,170 |
Sonoco Products Co. | 32,329 | 1,812,040 |
Steel Dynamics, Inc. | 50,872 | 6,619,465 |
Summit Materials, Inc., Class A * | 39,104 | 1,521,146 |
U.S. Steel Corp. | 73,982 | 2,700,343 |
Vulcan Materials Co. | 43,981 | 11,330,825 |
Westlake Corp. | 10,589 | 1,560,395 |
Westrock Co. | 84,636 | 4,059,143 |
390,441,058 | ||
Media & Entertainment 7.8% | ||
Alphabet, Inc., Class A * | 1,947,955 | 317,088,115 |
Alphabet, Inc., Class C * | 1,630,878 | 268,507,754 |
Charter Communications, Inc., Class A * | 32,605 | 8,344,924 |
Comcast Corp., Class A | 1,309,792 | 49,916,173 |
Electronic Arts, Inc. | 80,272 | 10,180,095 |
Endeavor Group Holdings, Inc., Class A | 59,267 | 1,565,241 |
Fox Corp., Class A | 118,292 | 3,668,235 |
IAC, Inc. * | 22,099 | 1,051,028 |
Interpublic Group of Cos., Inc. | 128,100 | 3,899,364 |
Liberty Broadband Corp., Class C * | 37,734 | 1,876,512 |
Liberty Media Corp.-Liberty Formula One, Class C * | 69,221 | 4,843,393 |
Liberty Media Corp.-Liberty SiriusXM, Class C * | 48,500 | 1,166,910 |
Live Nation Entertainment, Inc. * | 46,617 | 4,144,718 |
Match Group, Inc. * | 90,740 | 2,796,607 |
Meta Platforms, Inc., Class A | 727,235 | 312,834,680 |
Netflix, Inc. * | 143,051 | 78,769,603 |
New York Times Co., Class A | 55,761 | 2,399,396 |
News Corp., Class A | 125,773 | 2,993,397 |
Nexstar Media Group, Inc., Class A | 10,622 | 1,700,157 |
Omnicom Group, Inc. | 66,485 | 6,172,467 |
Paramount Global, Class B | 159,144 | 1,812,650 |
Pinterest, Inc., Class A * | 195,637 | 6,544,058 |
SECURITY | NUMBER OF SHARES | VALUE ($) |
ROBLOX Corp., Class A * | 162,958 | 5,794,787 |
Roku, Inc. * | 41,433 | 2,389,027 |
Sirius XM Holdings, Inc. (a) | 214,050 | 629,307 |
Snap, Inc., Class A * | 341,262 | 5,135,993 |
Take-Two Interactive Software, Inc. * | 52,778 | 7,537,226 |
TKO Group Holdings, Inc. | 19,726 | 1,867,460 |
Trade Desk, Inc., Class A * | 147,607 | 12,229,240 |
Walt Disney Co. | 606,336 | 67,363,930 |
Warner Bros Discovery, Inc. * | 732,648 | 5,392,289 |
Warner Music Group Corp., Class A | 45,495 | 1,501,335 |
ZoomInfo Technologies, Inc., Class A * | 102,859 | 1,631,344 |
1,203,747,415 | ||
Pharmaceuticals, Biotechnology & Life Sciences 6.9% | ||
10X Genomics, Inc., Class A * | 34,014 | 995,930 |
AbbVie, Inc. | 583,606 | 94,917,680 |
ACADIA Pharmaceuticals, Inc. * | 39,378 | 658,006 |
Agilent Technologies, Inc. | 96,868 | 13,274,791 |
Alkermes PLC * | 54,557 | 1,338,829 |
Alnylam Pharmaceuticals, Inc. * | 41,618 | 5,990,911 |
Amgen, Inc. | 176,846 | 48,445,193 |
Apellis Pharmaceuticals, Inc. * | 33,214 | 1,467,727 |
Avantor, Inc. * | 225,167 | 5,455,796 |
Biogen, Inc. * | 47,700 | 10,246,914 |
BioMarin Pharmaceutical, Inc. * | 62,902 | 5,079,966 |
Bio-Rad Laboratories, Inc., Class A * | 6,869 | 1,852,913 |
Bio-Techne Corp. | 51,921 | 3,281,926 |
Bridgebio Pharma, Inc. * | 42,564 | 1,090,490 |
Bristol-Myers Squibb Co. | 671,547 | 29,507,775 |
Bruker Corp. | 30,629 | 2,389,368 |
Catalent, Inc. * | 59,744 | 3,336,702 |
Charles River Laboratories International, Inc. * | 16,899 | 3,869,871 |
Danaher Corp. | 217,387 | 53,611,982 |
Elanco Animal Health, Inc. * | 167,897 | 2,209,525 |
Eli Lilly & Co. | 263,590 | 205,890,149 |
Exact Sciences Corp. * | 59,738 | 3,545,450 |
Exelixis, Inc. * | 97,804 | 2,294,482 |
Gilead Sciences, Inc. | 411,508 | 26,830,322 |
Halozyme Therapeutics, Inc. * | 42,934 | 1,635,785 |
Illumina, Inc. * | 52,348 | 6,441,421 |
Incyte Corp. * | 63,360 | 3,297,888 |
Intra-Cellular Therapies, Inc. * | 33,755 | 2,423,947 |
Ionis Pharmaceuticals, Inc. * | 47,141 | 1,945,038 |
IQVIA Holdings, Inc. * | 60,067 | 13,921,729 |
Jazz Pharmaceuticals PLC * | 20,615 | 2,283,111 |
Johnson & Johnson | 795,736 | 115,055,468 |
Medpace Holdings, Inc. * | 7,639 | 2,966,606 |
Merck & Co., Inc. | 837,632 | 108,238,807 |
Mettler-Toledo International, Inc. * | 7,053 | 8,673,074 |
Moderna, Inc. * | 110,385 | 12,176,569 |
Mural Oncology PLC * | 5,455 | 20,184 |
Natera, Inc. * | 37,334 | 3,467,582 |
Neurocrine Biosciences, Inc. * | 32,748 | 4,504,160 |
Organon & Co. | 90,285 | 1,680,204 |
Perrigo Co. PLC | 47,984 | 1,567,157 |
Pfizer, Inc. | 1,866,445 | 47,818,321 |
Regeneron Pharmaceuticals, Inc. * | 34,866 | 31,053,752 |
Repligen Corp. * | 17,121 | 2,811,268 |
Revvity, Inc. | 40,129 | 4,112,019 |
Roivant Sciences Ltd. * | 113,753 | 1,239,908 |
Royalty Pharma PLC, Class A | 127,931 | 3,543,689 |
Sarepta Therapeutics, Inc. * | 31,541 | 3,994,983 |
Sotera Health Co. * | 40,942 | 458,550 |
Thermo Fisher Scientific, Inc. | 127,717 | 72,635,212 |
United Therapeutics Corp. * | 15,453 | 3,621,101 |
Vaxcyte, Inc. * | 32,174 | 1,948,136 |
SECURITY | NUMBER OF SHARES | VALUE ($) |
Vertex Pharmaceuticals, Inc. * | 85,184 | 33,461,127 |
Viatris, Inc. | 398,555 | 4,611,281 |
Waters Corp. * | 19,478 | 6,019,481 |
West Pharmaceutical Services, Inc. | 24,396 | 8,721,082 |
Zoetis, Inc. | 151,709 | 24,158,141 |
1,068,089,479 | ||
Real Estate Management & Development 0.2% | ||
CBRE Group, Inc., Class A * | 99,010 | 8,602,979 |
CoStar Group, Inc. * | 134,692 | 12,328,359 |
Jones Lang LaSalle, Inc. * | 15,868 | 2,867,348 |
Zillow Group, Inc., Class C * | 53,271 | 2,267,746 |
26,066,432 | ||
Semiconductors & Semiconductor Equipment 9.5% | ||
Advanced Micro Devices, Inc. * | 534,105 | 84,591,550 |
Allegro MicroSystems, Inc. * | 23,617 | 701,189 |
Amkor Technology, Inc. | 36,875 | 1,192,906 |
Analog Devices, Inc. | 163,641 | 32,828,021 |
Applied Materials, Inc. | 274,648 | 54,558,825 |
Axcelis Technologies, Inc. * | 10,789 | 1,116,877 |
Broadcom, Inc. | 145,461 | 189,138,575 |
Cirrus Logic, Inc. * | 17,332 | 1,535,095 |
Enphase Energy, Inc. * | 44,730 | 4,864,835 |
Entegris, Inc. | 49,996 | 6,645,468 |
First Solar, Inc. * | 35,018 | 6,173,673 |
GLOBALFOUNDRIES, Inc. *(a) | 27,339 | 1,336,330 |
Intel Corp. | 1,397,583 | 42,584,354 |
KLA Corp. | 44,638 | 30,768,527 |
Lam Research Corp. | 43,269 | 38,700,226 |
Lattice Semiconductor Corp. * | 46,486 | 3,188,940 |
MACOM Technology Solutions Holdings, Inc. * | 18,105 | 1,845,805 |
Marvell Technology, Inc. | 285,718 | 18,831,673 |
Microchip Technology, Inc. | 177,730 | 16,347,606 |
Micron Technology, Inc. | 364,902 | 41,219,330 |
MKS Instruments, Inc. | 20,756 | 2,469,549 |
Monolithic Power Systems, Inc. | 15,876 | 10,626,283 |
NVIDIA Corp. | 816,469 | 705,445,545 |
NXP Semiconductors NV | 85,205 | 21,828,669 |
ON Semiconductor Corp. * | 141,416 | 9,921,747 |
Onto Innovation, Inc. * | 16,132 | 2,992,325 |
Power Integrations, Inc. | 18,172 | 1,212,436 |
Qorvo, Inc. * | 31,677 | 3,701,141 |
QUALCOMM, Inc. | 368,898 | 61,181,733 |
Rambus, Inc. * | 34,506 | 1,891,619 |
Skyworks Solutions, Inc. | 52,505 | 5,596,508 |
SolarEdge Technologies, Inc. * | 18,663 | 1,094,585 |
Teradyne, Inc. | 51,048 | 5,937,903 |
Texas Instruments, Inc. | 300,569 | 53,026,383 |
Universal Display Corp. | 14,402 | 2,275,228 |
Wolfspeed, Inc. * | 40,813 | 1,103,175 |
1,468,474,634 | ||
Software & Services 11.7% | ||
Accenture PLC, Class A | 207,255 | 62,365,102 |
Adobe, Inc. * | 149,410 | 69,151,430 |
Akamai Technologies, Inc. * | 49,423 | 4,988,263 |
Amdocs Ltd. | 39,099 | 3,283,925 |
ANSYS, Inc. * | 28,808 | 9,359,143 |
AppLovin Corp., Class A * | 60,055 | 4,238,081 |
Aspen Technology, Inc. * | 9,171 | 1,805,495 |
Atlassian Corp., Class A * | 52,018 | 8,962,701 |
Autodesk, Inc. * | 70,689 | 15,046,154 |
Bentley Systems, Inc., Class B | 77,096 | 4,049,853 |
SECURITY | NUMBER OF SHARES | VALUE ($) |
Bill Holdings, Inc. * | 32,089 | 2,001,070 |
Cadence Design Systems, Inc. * | 90,013 | 24,810,283 |
CCC Intelligent Solutions Holdings, Inc. * | 89,976 | 1,009,531 |
Cloudflare, Inc., Class A * | 98,473 | 8,606,540 |
Cognizant Technology Solutions Corp., Class A | 164,090 | 10,777,431 |
Confluent, Inc., Class A * | 75,214 | 2,115,018 |
Crowdstrike Holdings, Inc., Class A * | 75,079 | 21,963,611 |
Datadog, Inc., Class A * | 99,882 | 12,535,191 |
DocuSign, Inc., Class A * | 66,944 | 3,789,030 |
Dolby Laboratories, Inc., Class A | 20,643 | 1,603,135 |
DoubleVerify Holdings, Inc. * | 45,456 | 1,331,861 |
Dropbox, Inc., Class A * | 87,988 | 2,037,802 |
Dynatrace, Inc. * | 79,410 | 3,598,067 |
Elastic NV * | 27,292 | 2,789,788 |
EPAM Systems, Inc. * | 19,161 | 4,507,817 |
Fair Isaac Corp. * | 8,227 | 9,323,906 |
Five9, Inc. * | 23,627 | 1,360,206 |
Fortinet, Inc. * | 210,684 | 13,311,015 |
Gartner, Inc. * | 25,923 | 10,695,571 |
Gen Digital, Inc. | 184,741 | 3,720,684 |
Gitlab, Inc., Class A * | 29,932 | 1,570,532 |
GoDaddy, Inc., Class A * | 47,321 | 5,791,144 |
Guidewire Software, Inc. * | 26,933 | 2,973,403 |
HubSpot, Inc. * | 16,749 | 10,130,968 |
Informatica, Inc., Class A * | 14,768 | 457,365 |
International Business Machines Corp. | 302,462 | 50,269,184 |
Intuit, Inc. | 92,534 | 57,891,121 |
Manhattan Associates, Inc. * | 20,142 | 4,150,461 |
Microsoft Corp. | 2,456,161 | 956,257,162 |
MongoDB, Inc., Class A * | 23,748 | 8,672,295 |
Nutanix, Inc., Class A * | 80,359 | 4,877,791 |
Okta, Inc. * | 52,091 | 4,843,421 |
Oracle Corp. | 527,027 | 59,949,321 |
Palantir Technologies, Inc., Class A * | 637,798 | 14,012,422 |
Palo Alto Networks, Inc. * | 104,036 | 30,263,032 |
Procore Technologies, Inc. * | 29,408 | 2,012,095 |
PTC, Inc. * | 39,574 | 7,022,011 |
Qualys, Inc. * | 12,068 | 1,978,066 |
Roper Technologies, Inc. | 35,171 | 17,988,560 |
Salesforce, Inc. | 319,976 | 86,054,346 |
Samsara, Inc., Class A * | 56,840 | 1,985,421 |
ServiceNow, Inc. * | 67,764 | 46,982,814 |
Smartsheet, Inc., Class A * | 44,429 | 1,680,749 |
Snowflake, Inc., Class A * | 108,851 | 16,893,675 |
SPS Commerce, Inc. * | 12,131 | 2,109,217 |
Synopsys, Inc. * | 50,416 | 26,750,226 |
Tenable Holdings, Inc. * | 38,159 | 1,716,010 |
Teradata Corp. * | 34,916 | 1,295,384 |
Twilio, Inc., Class A * | 59,441 | 3,559,327 |
Tyler Technologies, Inc. * | 14,027 | 6,474,162 |
UiPath, Inc., Class A * | 132,050 | 2,504,989 |
Unity Software, Inc. * | 82,348 | 1,998,586 |
VeriSign, Inc. * | 29,075 | 4,927,631 |
Workday, Inc., Class A * | 68,934 | 16,870,218 |
Workiva, Inc., Class A * | 15,581 | 1,227,783 |
Zoom Video Communications, Inc., Class A * | 85,064 | 5,197,410 |
Zscaler, Inc. * | 29,143 | 5,039,990 |
1,799,515,996 | ||
Technology Hardware & Equipment 7.2% | ||
Advanced Energy Industries, Inc. | 12,551 | 1,202,888 |
Amphenol Corp., Class A | 197,707 | 23,877,074 |
Apple, Inc. | 4,798,115 | 817,262,928 |
SECURITY | NUMBER OF SHARES | VALUE ($) |
Arista Networks, Inc. * | 83,311 | 21,374,270 |
Arrow Electronics, Inc. * | 18,162 | 2,318,743 |
Avnet, Inc. | 30,117 | 1,471,818 |
Badger Meter, Inc. | 9,639 | 1,763,166 |
CDW Corp. | 44,538 | 10,771,961 |
Ciena Corp. * | 47,580 | 2,199,623 |
Cisco Systems, Inc. | 1,343,199 | 63,103,489 |
Cognex Corp. | 59,370 | 2,466,230 |
Coherent Corp. * | 42,891 | 2,343,135 |
Corning, Inc. | 253,818 | 8,472,445 |
Dell Technologies, Inc., Class C | 87,870 | 10,952,117 |
F5, Inc. * | 19,159 | 3,167,174 |
Fabrinet * | 11,889 | 2,057,629 |
Hewlett Packard Enterprise Co. | 428,277 | 7,280,709 |
HP, Inc. | 289,437 | 8,130,285 |
Insight Enterprises, Inc. * | 9,153 | 1,671,063 |
IPG Photonics Corp. * | 10,416 | 874,736 |
Jabil, Inc. | 41,703 | 4,894,264 |
Juniper Networks, Inc. | 107,810 | 3,753,944 |
Keysight Technologies, Inc. * | 57,693 | 8,535,102 |
Littelfuse, Inc. | 8,248 | 1,902,319 |
Motorola Solutions, Inc. | 54,782 | 18,579,315 |
NetApp, Inc. | 67,669 | 6,916,449 |
Novanta, Inc. * | 12,177 | 1,905,701 |
Pure Storage, Inc., Class A * | 97,903 | 4,934,311 |
Seagate Technology Holdings PLC | 64,996 | 5,583,806 |
Super Micro Computer, Inc. * | 16,611 | 14,265,527 |
TD SYNNEX Corp. | 25,688 | 3,027,074 |
TE Connectivity Ltd. | 101,906 | 14,417,661 |
Teledyne Technologies, Inc. * | 15,542 | 5,928,962 |
Trimble, Inc. * | 83,066 | 4,989,775 |
Ubiquiti, Inc. | 1,380 | 148,460 |
Vontier Corp. | 51,143 | 2,077,940 |
Western Digital Corp. * | 108,149 | 7,660,194 |
Zebra Technologies Corp., Class A * | 17,243 | 5,423,958 |
1,107,706,245 | ||
Telecommunication Services 0.8% | ||
AT&T, Inc. | 2,361,191 | 39,880,516 |
GCI Liberty, Inc. *(c) | 32,171 | 0 |
Iridium Communications, Inc. | 38,428 | 1,183,198 |
Liberty Global Ltd., Class C * | 63,255 | 1,035,484 |
T-Mobile U.S., Inc. | 172,538 | 28,325,564 |
Verizon Communications, Inc. | 1,389,739 | 54,880,793 |
125,305,555 | ||
Transportation 1.7% | ||
Alaska Air Group, Inc. * | 42,500 | 1,828,350 |
American Airlines Group, Inc. * | 220,708 | 2,981,765 |
Avis Budget Group, Inc. | 6,097 | 581,959 |
CH Robinson Worldwide, Inc. | 38,559 | 2,737,689 |
CSX Corp. | 652,914 | 21,689,803 |
Delta Air Lines, Inc. | 210,433 | 10,536,380 |
Expeditors International of Washington, Inc. | 48,059 | 5,349,447 |
FedEx Corp. | 75,995 | 19,893,971 |
GXO Logistics, Inc. * | 39,400 | 1,956,604 |
Hertz Global Holdings, Inc. * | 44,500 | 202,475 |
JB Hunt Transport Services, Inc. | 26,742 | 4,347,447 |
Joby Aviation, Inc. *(a) | 121,223 | 612,176 |
Kirby Corp. * | 19,590 | 2,137,857 |
Knight-Swift Transportation Holdings, Inc. | 53,305 | 2,464,290 |
Landstar System, Inc. | 11,995 | 2,092,048 |
Lyft, Inc., Class A * | 113,445 | 1,774,280 |
Norfolk Southern Corp. | 74,736 | 17,213,196 |
SECURITY | NUMBER OF SHARES | VALUE ($) |
Old Dominion Freight Line, Inc. | 59,076 | 10,734,700 |
Ryder System, Inc. | 14,269 | 1,738,678 |
Saia, Inc. * | 8,651 | 3,432,976 |
Southwest Airlines Co. | 197,861 | 5,132,514 |
Uber Technologies, Inc. * | 679,442 | 45,026,621 |
U-Haul Holding Co. - Non Voting | 32,657 | 2,002,527 |
Union Pacific Corp. | 201,341 | 47,750,032 |
United Airlines Holdings, Inc. * | 110,589 | 5,690,910 |
United Parcel Service, Inc., Class B | 238,731 | 35,208,048 |
XPO, Inc. * | 38,909 | 4,181,161 |
259,297,904 | ||
Utilities 2.3% | ||
AES Corp. | 220,912 | 3,954,325 |
Alliant Energy Corp. | 84,672 | 4,216,666 |
Ameren Corp. | 86,646 | 6,400,540 |
American Electric Power Co., Inc. | 173,895 | 14,960,187 |
American Water Works Co., Inc. | 64,361 | 7,872,638 |
Atmos Energy Corp. | 49,815 | 5,873,188 |
Avangrid, Inc. | 23,049 | 841,980 |
CenterPoint Energy, Inc. | 208,319 | 6,070,416 |
CMS Energy Corp. | 96,313 | 5,837,531 |
Consolidated Edison, Inc. | 113,712 | 10,734,413 |
Constellation Energy Corp. | 105,312 | 19,581,713 |
Dominion Energy, Inc. | 275,953 | 14,068,084 |
DTE Energy Co. | 68,021 | 7,504,077 |
Duke Energy Corp. | 254,834 | 25,039,989 |
Edison International | 126,604 | 8,996,480 |
Entergy Corp. | 69,751 | 7,440,339 |
Essential Utilities, Inc. | 83,448 | 3,052,528 |
Evergy, Inc. | 76,014 | 3,986,934 |
Eversource Energy | 115,609 | 7,008,218 |
Exelon Corp. | 330,418 | 12,417,108 |
FirstEnergy Corp. | 170,821 | 6,549,277 |
IDACORP, Inc. | 16,635 | 1,576,665 |
National Fuel Gas Co. | 30,539 | 1,621,621 |
NextEra Energy, Inc. | 678,201 | 45,419,121 |
NiSource, Inc. | 136,452 | 3,801,553 |
NRG Energy, Inc. | 74,496 | 5,413,624 |
OGE Energy Corp. | 66,206 | 2,294,038 |
Ormat Technologies, Inc. | 16,991 | 1,084,536 |
PG&E Corp. | 703,684 | 12,040,033 |
Pinnacle West Capital Corp. | 37,505 | 2,762,243 |
Portland General Electric Co. | 33,396 | 1,443,709 |
PPL Corp. | 244,557 | 6,715,535 |
Public Service Enterprise Group, Inc. | 165,546 | 11,435,918 |
Sempra | 208,237 | 14,916,016 |
Southern Co. | 360,633 | 26,506,525 |
SECURITY | NUMBER OF SHARES | VALUE ($) |
Southwest Gas Holdings, Inc. | 20,893 | 1,559,036 |
UGI Corp. | 71,262 | 1,821,457 |
Vistra Corp. | 111,099 | 8,425,748 |
WEC Energy Group, Inc. | 104,461 | 8,632,657 |
Xcel Energy, Inc. | 183,078 | 9,836,781 |
349,713,447 | ||
Total Common Stocks (Cost $3,398,153,785) | 15,354,686,185 | |
SHORT-TERM INVESTMENTS 0.3% OF NET ASSETS | ||
Money Market Funds 0.3% | ||
State Street Institutional U.S. Government Money Market Fund, Premier Class 5.25% (d) | 39,995,410 | 39,995,410 |
State Street Institutional U.S. Government Money Market Fund, Premier Class 5.25% (d)(e) | 11,610,625 | 11,610,625 |
51,606,035 | ||
Total Short-Term Investments (Cost $51,606,035) | 51,606,035 | |
Total Investments in Securities (Cost $3,449,759,820) | 15,406,292,220 | |
NUMBER OF CONTRACTS | NOTIONAL AMOUNT ($) | CURRENT VALUE/ UNREALIZED DEPRECIATION ($) | |
FUTURES CONTRACTS | |||
Long | |||
S&P 500 Index, e-mini, expires 06/21/24 | 188 | 47,629,800 | (1,245,549 ) |
* | Non-income producing security. |
(a) | All or a portion of this security is on loan. Securities on loan were valued at $10,598,858. |
(b) | Issuer is affiliated with the fund’s investment adviser. |
(c) | Fair valued using significant unobservable inputs (see financial note 2(a), Securities for which no quoted value is available, for additional information). |
(d) | The rate shown is the annualized 7-day yield. |
(e) | Security purchased with cash collateral received for securities on loan. |
REIT — | Real Estate Investment Trust |
SECURITY | VALUE AT 10/31/23 | PURCHASES | SALES | REALIZED GAINS (LOSSES) | NET CHANGE IN UNREALIZED APPRECIATION (DEPRECIATION) | VALUE AT 4/30/24 | BALANCE OF SHARES HELD AT 4/30/24 | DIVIDENDS RECEIVED |
COMMON STOCKS 0.2% OF NET ASSETS | ||||||||
Financial Services 0.2% | ||||||||
Charles Schwab Corp. | $25,223,788 | $340,197 | ($97,994 ) | ($8,622 ) | $10,656,114 | $36,113,483 | 488,350 | $243,350 |
DESCRIPTION | QUOTED PRICES IN ACTIVE MARKETS FOR IDENTICAL ASSETS (LEVEL 1) | OTHER SIGNIFICANT OBSERVABLE INPUTS (LEVEL 2) | SIGNIFICANT UNOBSERVABLE INPUTS (LEVEL 3) | TOTAL |
Assets | ||||
Common Stocks1 | $15,229,380,630 | $— | $— | $15,229,380,630 |
Telecommunication Services | 125,305,555 | — | 0 * | 125,305,555 |
Short-Term Investments1 | 51,606,035 | — | — | 51,606,035 |
Liabilities | ||||
Futures Contracts2 | (1,245,549 ) | — | — | (1,245,549 ) |
Total | $15,405,046,671 | $— | $0 | $15,405,046,671 |
* | Level 3 amount shown includes securities determined to have no value at April 30, 2024. |
1 | As categorized in the Portfolio Holdings. |
2 | Futures contracts are reported at cumulative unrealized appreciation or depreciation. |
Assets | ||
Investments in securities, at value - affiliated issuers (cost $4,611,974) | $36,113,483 | |
Investments in securities, at value - unaffiliated issuers (cost $3,445,147,846) including securities on loan of $10,598,858 | 15,370,178,737 | |
Deposit with broker for futures contracts | 2,218,400 | |
Receivables: | ||
Dividends | 9,061,169 | |
Fund shares sold | 1,566,393 | |
Income from securities on loan | + | 28,894 |
Total assets | 15,419,167,076 | |
Liabilities | ||
Collateral held for securities on loan | 11,610,625 | |
Payables: | ||
Fund shares redeemed | 3,885,104 | |
Variation margin on futures contracts | 752,000 | |
Investment adviser fees | + | 641,546 |
Total liabilities | 16,889,275 | |
Net assets | $15,402,277,801 | |
Net Assets by Source | ||
Capital received from investors | $3,404,332,573 | |
Total distributable earnings | + | 11,997,945,228 |
Net assets | $15,402,277,801 | |
Net Asset Value (NAV) | ||||
Net Assets | ÷ | Shares Outstanding | = | NAV |
$15,402,277,801 | 142,321,519 | $108.22 | ||
For the period November 1, 2023 through April 30, 2024; unaudited | ||
Investment Income | ||
Dividends received from securities - unaffiliated issuers (net of foreign withholding tax of $33,573) | $112,750,953 | |
Dividends received from securities - affiliated issuers | 243,350 | |
Other interest | 120,531 | |
Securities on loan, net | + | 247,871 |
Total investment income | 113,362,705 | |
Expenses | ||
Investment adviser fees | 3,707,990 | |
Total expenses | – | 3,707,990 |
Net investment income | 109,654,715 | |
REALIZED AND UNREALIZED GAINS (LOSSES) | ||
Net realized losses on sales of securities - affiliated issuers | (8,622 ) | |
Net realized gains on sales of securities - unaffiliated issuers | 18,609,404 | |
Net realized gains on sales of in-kind redemptions - unaffiliated issuers | 54,227,326 | |
Net realized gains on futures contracts | + | 7,742,689 |
Net realized gains | 80,570,797 | |
Net change in unrealized appreciation (depreciation) on securities - affiliated issuers | 10,656,114 | |
Net change in unrealized appreciation (depreciation) on securities - unaffiliated issuers | 2,531,910,993 | |
Net change in unrealized appreciation (depreciation) on futures contracts | + | 1,979,523 |
Net change in unrealized appreciation (depreciation) | + | 2,544,546,630 |
Net realized and unrealized gains | 2,625,117,427 | |
Increase in net assets resulting from operations | $2,734,772,142 | |
OPERATIONS | |||
11/1/23-4/30/24 | 11/1/22-10/31/23 | ||
Net investment income | $109,654,715 | $200,447,118 | |
Net realized gains | 80,570,797 | 35,256,500 | |
Net change in unrealized appreciation (depreciation) | + | 2,544,546,630 | 867,956,867 |
Increase in net assets resulting from operations | $2,734,772,142 | $1,103,660,485 | |
DISTRIBUTIONS TO SHAREHOLDERS | |||
Total distributions | ($204,576,918 ) | ($187,210,509 ) | |
TRANSACTIONS IN FUND SHARES | |||||
11/1/23-4/30/24 | 11/1/22-10/31/23 | ||||
SHARES | VALUE | SHARES | VALUE | ||
Shares sold | 5,774,089 | $604,012,081 | 10,449,076 | $932,613,677 | |
Shares reinvested | 1,638,307 | 161,356,836 | 1,790,033 | 150,434,406 | |
Shares redeemed | + | (6,700,884 ) | (703,885,057 ) | (12,095,922 ) | (1,077,003,486 ) |
Net transactions in fund shares | 711,512 | $61,483,860 | 143,187 | $6,044,597 | |
SHARES OUTSTANDING AND NET ASSETS | |||||
11/1/23-4/30/24 | 11/1/22-10/31/23 | ||||
SHARES | NET ASSETS | SHARES | NET ASSETS | ||
Beginning of period | 141,610,007 | $12,810,598,717 | 141,466,820 | $11,888,104,144 | |
Total increase | + | 711,512 | 2,591,679,084 | 143,187 | 922,494,573 |
End of period | 142,321,519 | $15,402,277,801 | 141,610,007 | $12,810,598,717 | |
11/1/23– 4/30/24* | 11/1/22– 10/31/23 | 11/1/21– 10/31/22 | 11/1/20– 10/31/21 | 11/1/19– 10/31/20 | 11/1/18– 10/31/19 | |
Per-Share Data | ||||||
Net asset value at beginning of period | $26.99 | $29.87 | $39.97 | $27.18 | $28.84 | $30.48 |
Income (loss) from investment operations: | ||||||
Net investment income (loss)1 | 0.27 | 0.47 | 0.40 | 0.37 | 0.35 | 0.40 |
Net realized and unrealized gains (losses) | 5.02 | (2.98 ) | (7.31 ) | 13.29 | (0.23 ) | 0.54 |
Total from investment operations | 5.29 | (2.51 ) | (6.91 ) | 13.66 | 0.12 | 0.94 |
Less distributions: | ||||||
Distributions from net investment income | (0.49 ) | (0.37 ) | (0.42 ) | (0.38 ) | (0.42 ) | (0.40 ) |
Distributions from net realized gains | — | — | (2.77 ) | (0.49 ) | (1.36 ) | (2.18 ) |
Total distributions | (0.49 ) | (0.37 ) | (3.19 ) | (0.87 ) | (1.78 ) | (2.58 ) |
Net asset value at end of period | $31.79 | $26.99 | $29.87 | $39.97 | $27.18 | $28.84 |
Total return | 19.68 %2 | (8.47 %) | (18.53 %) | 50.82 % | 0.00 % | 4.95 % |
Ratios/Supplemental Data | ||||||
Ratios to average net assets: | ||||||
Total expenses | 0.04 %3 | 0.04 % | 0.04 %4 | 0.04 % | 0.04 % | 0.04 %5 |
Net investment income (loss) | 1.71 %3 | 1.60 % | 1.25 % | 0.98 % | 1.31 % | 1.43 % |
Portfolio turnover rate | 5 %2,6 | 10 %6 | 16 %6 | 19 %6 | 21 % | 14 % |
Net assets, end of period (x 1,000,000) | $5,634 | $4,881 | $5,372 | $6,587 | $3,988 | $4,187 |
* | Unaudited. |
1 | Calculated based on the average shares outstanding during the period. |
2 | Not annualized. |
3 | Annualized. |
4 | Ratio includes less than 0.005% of non-routine proxy expenses. |
5 | Effective December 20, 2018, the annual operating expense ratio was reduced to 0.04%. The ratio presented for period ended October 31, 2019, is a blended ratio. |
6 | Portfolio turnover rate excludes in-kind transactions. |
SECURITY | NUMBER OF SHARES | VALUE ($) |
COMMON STOCKS 99.7% OF NET ASSETS | ||
Automobiles & Components 1.3% | ||
Adient PLC * | 207,684 | 6,203,521 |
American Axle & Manufacturing Holdings, Inc. * | 257,750 | 1,891,885 |
Cooper-Standard Holdings, Inc. * | 37,998 | 586,309 |
Dana, Inc. | 295,762 | 3,676,322 |
Dorman Products, Inc. * | 59,908 | 5,238,954 |
Fox Factory Holding Corp. * | 96,609 | 3,760,022 |
Gentherm, Inc. * | 74,340 | 3,759,374 |
Goodyear Tire & Rubber Co. * | 639,050 | 7,643,038 |
Holley, Inc. * | 121,940 | 490,199 |
LCI Industries | 56,148 | 5,838,269 |
Livewire Group, Inc., Class A *(a) | 44,591 | 298,314 |
Luminar Technologies, Inc., Class A *(a) | 660,724 | 971,264 |
Modine Manufacturing Co. * | 117,006 | 10,838,266 |
Patrick Industries, Inc. | 48,079 | 5,023,775 |
Solid Power, Inc. *(a) | 354,285 | 598,742 |
Standard Motor Products, Inc. | 46,622 | 1,496,566 |
Stoneridge, Inc. * | 60,162 | 901,227 |
Visteon Corp. * | 62,659 | 6,931,965 |
Winnebago Industries, Inc. | 64,315 | 3,960,518 |
Workhorse Group, Inc. * | 500,432 | 75,665 |
XPEL, Inc. * | 51,155 | 2,688,195 |
72,872,390 | ||
Banks 8.4% | ||
1st Source Corp. | 37,232 | 1,846,707 |
ACNB Corp. | 18,584 | 604,723 |
Amalgamated Financial Corp. | 39,633 | 972,594 |
Amerant Bancorp, Inc. | 59,166 | 1,281,536 |
Ameris Bancorp | 150,332 | 7,137,763 |
Ames National Corp. | 19,703 | 379,283 |
Arrow Financial Corp. | 33,859 | 754,040 |
Associated Banc-Corp. | 343,668 | 7,241,085 |
Atlantic Union Bankshares Corp. | 202,249 | 6,425,441 |
Axos Financial, Inc. * | 124,323 | 6,291,987 |
Banc of California, Inc. | 310,918 | 4,256,467 |
BancFirst Corp. | 49,949 | 4,453,952 |
Bancorp, Inc. * | 116,548 | 3,489,447 |
Bank First Corp. | 21,083 | 1,627,397 |
Bank of Hawaii Corp. | 89,266 | 5,060,490 |
Bank of Marin Bancorp | 36,102 | 518,425 |
Bank of NT Butterfield & Son Ltd. | 109,989 | 3,739,626 |
Bank7 Corp. | 8,538 | 233,087 |
BankUnited, Inc. | 168,553 | 4,505,422 |
Bankwell Financial Group, Inc. | 13,580 | 311,389 |
Banner Corp. | 77,626 | 3,386,822 |
Bar Harbor Bankshares | 34,114 | 855,579 |
BayCom Corp. | 24,190 | 478,478 |
BCB Bancorp, Inc. | 33,720 | 317,642 |
Berkshire Hills Bancorp, Inc. | 99,088 | 2,112,556 |
Blue Foundry Bancorp * | 48,725 | 416,112 |
Blue Ridge Bankshares, Inc. * | 40,458 | 101,145 |
Bridgewater Bancshares, Inc. * | 46,748 | 508,618 |
SECURITY | NUMBER OF SHARES | VALUE ($) |
Brookline Bancorp, Inc. | 197,912 | 1,642,670 |
Burke & Herbert Financial Services Corp. (a) | 14,724 | 771,243 |
Business First Bancshares, Inc. | 54,804 | 1,106,493 |
Byline Bancorp, Inc. | 56,111 | 1,215,925 |
C&F Financial Corp. | 7,510 | 294,167 |
Cadence Bank | 414,122 | 11,458,756 |
Cambridge Bancorp | 17,117 | 1,050,470 |
Camden National Corp. | 32,254 | 1,006,970 |
Capital Bancorp, Inc. | 22,071 | 428,177 |
Capital City Bank Group, Inc. | 29,657 | 786,504 |
Capitol Federal Financial, Inc. | 284,753 | 1,358,272 |
Carter Bankshares, Inc. * | 52,321 | 636,747 |
Cathay General Bancorp | 158,142 | 5,446,411 |
Central Pacific Financial Corp. | 60,169 | 1,199,770 |
Chemung Financial Corp. | 8,015 | 337,952 |
ChoiceOne Financial Services, Inc. | 15,973 | 397,089 |
Citizens & Northern Corp. | 33,739 | 575,250 |
Citizens Financial Services, Inc. | 8,765 | 354,106 |
City Holding Co. | 33,162 | 3,350,025 |
Civista Bancshares, Inc. | 35,430 | 505,940 |
CNB Financial Corp. | 46,298 | 879,662 |
Coastal Financial Corp. * | 24,363 | 942,361 |
Codorus Valley Bancorp, Inc. | 20,656 | 458,563 |
Colony Bankcorp, Inc. | 37,758 | 410,429 |
Columbia Financial, Inc. * | 67,008 | 1,112,333 |
Community Bank System, Inc. | 121,161 | 5,236,578 |
Community Trust Bancorp, Inc. | 35,140 | 1,476,231 |
Community West Bancshares | 35,457 | 608,797 |
ConnectOne Bancorp, Inc. | 83,863 | 1,501,986 |
CrossFirst Bankshares, Inc. * | 103,416 | 1,249,265 |
Customers Bancorp, Inc. * | 64,888 | 2,963,435 |
CVB Financial Corp. | 302,949 | 4,950,187 |
Dime Community Bancshares, Inc. | 79,692 | 1,450,394 |
Eagle Bancorp, Inc. | 66,826 | 1,235,613 |
Eastern Bankshares, Inc. | 351,122 | 4,410,092 |
Enterprise Bancorp, Inc. | 22,340 | 542,862 |
Enterprise Financial Services Corp. | 82,274 | 3,127,235 |
Equity Bancshares, Inc., Class A | 32,981 | 1,098,597 |
Esquire Financial Holdings, Inc. | 15,698 | 738,748 |
ESSA Bancorp, Inc. | 19,870 | 321,894 |
Evans Bancorp, Inc. | 11,987 | 306,747 |
Farmers & Merchants Bancorp, Inc. | 29,405 | 602,803 |
Farmers National Banc Corp. | 83,460 | 987,332 |
FB Financial Corp. | 80,454 | 2,948,639 |
Fidelity D&D Bancorp, Inc. | 10,667 | 484,282 |
Financial Institutions, Inc. | 34,817 | 599,549 |
First BanCorp | 379,289 | 6,542,735 |
First Bancorp, Inc. | 22,376 | 494,062 |
First Bancorp/Southern Pines NC | 90,252 | 2,744,563 |
First Bancshares, Inc. | 70,094 | 1,678,050 |
First Bank | 46,604 | 544,335 |
First Busey Corp. | 117,689 | 2,629,172 |
First Business Financial Services, Inc. | 17,986 | 594,797 |
First Commonwealth Financial Corp. | 229,631 | 3,028,833 |
First Community Bankshares, Inc. | 38,762 | 1,286,123 |
First Community Corp. | 16,859 | 278,679 |
First Financial Bancorp | 213,447 | 4,719,313 |
SECURITY | NUMBER OF SHARES | VALUE ($) |
First Financial Bankshares, Inc. | 295,710 | 8,741,188 |
First Financial Corp. | 25,668 | 934,572 |
First Foundation, Inc. | 116,833 | 640,245 |
First Interstate BancSystem, Inc., Class A | 188,205 | 5,025,074 |
First Merchants Corp. | 133,970 | 4,477,277 |
First Mid Bancshares, Inc. | 50,450 | 1,561,932 |
First of Long Island Corp. | 48,848 | 462,591 |
First Western Financial, Inc. * | 18,176 | 302,994 |
Five Star Bancorp | 29,245 | 632,277 |
Flushing Financial Corp. | 64,034 | 705,655 |
FS Bancorp, Inc. | 15,155 | 472,381 |
Fulton Financial Corp. | 365,593 | 6,050,564 |
FVCBankcorp, Inc. * | 36,756 | 423,062 |
German American Bancorp, Inc. | 63,528 | 2,015,743 |
Glacier Bancorp, Inc. | 253,739 | 9,180,277 |
Great Southern Bancorp, Inc. | 19,848 | 1,020,187 |
Greene County Bancorp, Inc. | 16,070 | 472,779 |
Guaranty Bancshares, Inc. | 18,325 | 526,477 |
Hancock Whitney Corp. | 196,875 | 8,936,156 |
Hanmi Financial Corp. | 68,760 | 1,052,028 |
HarborOne Bancorp, Inc. | 91,381 | 925,690 |
HBT Financial, Inc. | 29,948 | 552,690 |
Heartland Financial USA, Inc. | 95,894 | 4,038,096 |
Heritage Commerce Corp. | 133,925 | 1,063,365 |
Heritage Financial Corp. | 78,369 | 1,390,266 |
Hilltop Holdings, Inc. | 105,912 | 3,098,985 |
Hingham Institution For Savings (a) | 3,451 | 582,874 |
Home Bancorp, Inc. | 16,575 | 580,125 |
Home BancShares, Inc. | 429,326 | 10,166,440 |
HomeStreet, Inc. | 41,302 | 505,950 |
HomeTrust Bancshares, Inc. | 33,980 | 873,286 |
Hope Bancorp, Inc. | 261,741 | 2,622,645 |
Horizon Bancorp, Inc. | 97,777 | 1,122,480 |
Independent Bank Corp. | 45,131 | 1,119,700 |
Independent Bank Corp. | 100,624 | 5,055,350 |
Independent Bank Group, Inc. | 82,080 | 3,056,659 |
International Bancshares Corp. | 122,018 | 6,790,302 |
John Marshall Bancorp, Inc. | 28,487 | 470,605 |
Kearny Financial Corp. | 124,974 | 674,860 |
Lakeland Bancorp, Inc. | 141,395 | 1,723,605 |
Lakeland Financial Corp. | 56,311 | 3,309,397 |
LCNB Corp. | 26,189 | 369,265 |
Live Oak Bancshares, Inc. | 76,314 | 2,466,469 |
Macatawa Bank Corp. | 60,449 | 846,286 |
MainStreet Bancshares, Inc. | 15,928 | 243,221 |
Mercantile Bank Corp. | 35,679 | 1,287,298 |
Metrocity Bankshares, Inc. | 41,111 | 944,731 |
Metropolitan Bank Holding Corp. * | 23,800 | 944,860 |
Mid Penn Bancorp, Inc. | 32,620 | 659,903 |
Middlefield Banc Corp. | 17,969 | 385,794 |
Midland States Bancorp, Inc. | 46,816 | 1,025,270 |
MidWestOne Financial Group, Inc. | 32,728 | 660,124 |
MVB Financial Corp. | 25,950 | 466,322 |
National Bank Holdings Corp., Class A | 83,504 | 2,733,086 |
National Bankshares, Inc. | 13,212 | 354,214 |
NBT Bancorp, Inc. | 103,885 | 3,637,014 |
Nicolet Bankshares, Inc. | 29,916 | 2,289,471 |
Northeast Bank | 15,207 | 786,506 |
Northeast Community Bancorp, Inc. | 28,888 | 455,853 |
Northfield Bancorp, Inc. | 89,759 | 748,590 |
Northrim BanCorp, Inc. | 12,105 | 578,619 |
Northwest Bancshares, Inc. | 288,679 | 3,059,997 |
Norwood Financial Corp. | 16,877 | 406,567 |
Oak Valley Bancorp | 15,395 | 371,789 |
OceanFirst Financial Corp. | 131,899 | 1,946,829 |
OFG Bancorp | 104,601 | 3,777,142 |
Old National Bancorp | 715,980 | 11,842,315 |
SECURITY | NUMBER OF SHARES | VALUE ($) |
Old Second Bancorp, Inc. | 98,313 | 1,346,888 |
Orange County Bancorp, Inc. | 11,677 | 504,563 |
Origin Bancorp, Inc. | 66,080 | 1,962,576 |
Orrstown Financial Services, Inc. | 23,501 | 616,196 |
Pacific Premier Bancorp, Inc. | 216,143 | 4,647,075 |
Park National Corp. | 32,481 | 4,278,073 |
Parke Bancorp, Inc. | 23,991 | 394,892 |
Pathward Financial, Inc. | 59,139 | 2,978,831 |
PCB Bancorp | 24,946 | 363,214 |
Peapack-Gladstone Financial Corp. | 38,382 | 858,989 |
Penns Woods Bancorp, Inc. | 15,676 | 274,016 |
Peoples Bancorp, Inc. | 79,469 | 2,307,780 |
Peoples Financial Services Corp. | 15,298 | 579,335 |
Pioneer Bancorp, Inc. * | 26,534 | 234,959 |
Plumas Bancorp | 12,503 | 439,605 |
Ponce Financial Group, Inc. * | 43,138 | 346,830 |
Preferred Bank | 28,910 | 2,188,198 |
Premier Financial Corp. | 80,369 | 1,557,551 |
Primis Financial Corp. | 46,338 | 450,405 |
Princeton Bancorp, Inc. | 11,623 | 338,810 |
Provident Financial Services, Inc. | 166,489 | 2,444,059 |
QCR Holdings, Inc. | 37,292 | 2,049,568 |
RBB Bancorp | 36,921 | 655,717 |
Red River Bancshares, Inc. | 10,667 | 482,255 |
Renasant Corp. | 125,143 | 3,636,656 |
Republic Bancorp, Inc., Class A | 19,108 | 969,158 |
S&T Bancorp, Inc. | 86,408 | 2,605,201 |
Sandy Spring Bancorp, Inc. | 99,339 | 2,031,483 |
Seacoast Banking Corp. of Florida | 190,841 | 4,402,702 |
ServisFirst Bancshares, Inc. | 115,718 | 6,822,733 |
Shore Bancshares, Inc. | 68,451 | 708,468 |
Sierra Bancorp | 31,160 | 617,591 |
Simmons First National Corp., Class A | 282,523 | 4,828,318 |
SmartFinancial, Inc. | 36,269 | 745,328 |
South Plains Financial, Inc. | 25,887 | 670,991 |
Southern First Bancshares, Inc. * | 17,543 | 452,960 |
Southern Missouri Bancorp, Inc. | 21,244 | 851,884 |
Southern States Bancshares, Inc. | 17,156 | 414,661 |
Southside Bancshares, Inc. | 65,117 | 1,736,019 |
SouthState Corp. | 172,937 | 13,091,331 |
Stellar Bancorp, Inc. | 110,463 | 2,452,279 |
Sterling Bancorp, Inc. * | 46,944 | 222,045 |
Stock Yards Bancorp, Inc. | 61,477 | 2,738,800 |
Summit Financial Group, Inc. | 25,643 | 678,770 |
Texas Capital Bancshares, Inc. * | 107,374 | 6,163,268 |
Third Coast Bancshares, Inc. * | 28,701 | 557,373 |
Timberland Bancorp, Inc. | 16,572 | 404,357 |
Tompkins Financial Corp. | 31,414 | 1,381,588 |
Towne Bank | 159,065 | 4,115,012 |
TriCo Bancshares | 70,442 | 2,449,268 |
Triumph Financial, Inc. * | 50,429 | 3,548,184 |
TrustCo Bank Corp. | 42,028 | 1,118,785 |
Trustmark Corp. | 137,950 | 4,083,320 |
UMB Financial Corp. | 100,489 | 8,004,954 |
United Bankshares, Inc. | 297,595 | 9,659,934 |
United Community Banks, Inc. | 262,572 | 6,624,692 |
Unity Bancorp, Inc. | 16,861 | 453,898 |
Univest Financial Corp. | 65,706 | 1,371,284 |
USCB Financial Holdings, Inc. | 24,056 | 267,984 |
Valley National Bancorp | 979,890 | 6,869,029 |
Veritex Holdings, Inc. | 118,922 | 2,316,601 |
Virginia National Bankshares Corp. | 10,808 | 304,894 |
WaFd, Inc. | 153,903 | 4,169,232 |
Washington Trust Bancorp, Inc. | 38,689 | 985,022 |
WesBanco, Inc. | 130,829 | 3,532,383 |
West BanCorp, Inc. | 37,167 | 604,335 |
Westamerica BanCorp | 58,713 | 2,733,090 |
SECURITY | NUMBER OF SHARES | VALUE ($) |
WSFS Financial Corp. | 137,249 | 5,864,650 |
475,621,290 | ||
Capital Goods 12.2% | ||
374Water, Inc. * | 135,387 | 201,727 |
3D Systems Corp. * | 296,113 | 991,979 |
AAON, Inc. | 153,876 | 14,478,193 |
AAR Corp. * | 76,661 | 5,300,342 |
AeroVironment, Inc. * | 61,254 | 9,787,777 |
AerSale Corp. * | 76,485 | 545,338 |
Alamo Group, Inc. | 22,999 | 4,470,546 |
Albany International Corp., Class A | 71,088 | 5,669,268 |
Allient, Inc. | 28,969 | 851,399 |
Alta Equipment Group, Inc. | 52,959 | 588,374 |
Ameresco, Inc., Class A * | 72,448 | 1,516,337 |
American Woodmark Corp. * | 36,373 | 3,349,226 |
Amprius Technologies, Inc. * | 12,291 | 22,984 |
API Group Corp. * | 475,132 | 18,325,841 |
Apogee Enterprises, Inc. | 50,152 | 3,098,391 |
Applied Industrial Technologies, Inc. | 87,654 | 16,062,595 |
Archer Aviation, Inc., Class A *(a) | 348,610 | 1,352,607 |
Arcosa, Inc. | 110,077 | 8,368,053 |
Argan, Inc. | 28,774 | 1,733,921 |
Array Technologies, Inc. * | 342,996 | 4,232,571 |
Astec Industries, Inc. | 51,374 | 2,147,433 |
Astronics Corp. * | 62,899 | 1,054,816 |
Atkore, Inc. | 84,579 | 14,826,699 |
Atmus Filtration Technologies, Inc. * | 191,347 | 5,795,901 |
AZZ, Inc. | 65,403 | 4,684,817 |
Babcock & Wilcox Enterprises, Inc. * | 140,086 | 142,888 |
Barnes Group, Inc. | 111,039 | 3,855,274 |
Beacon Roofing Supply, Inc. * | 143,641 | 14,152,948 |
Blink Charging Co. *(a) | 125,706 | 318,036 |
Bloom Energy Corp., Class A *(a) | 439,070 | 4,886,849 |
Blue Bird Corp. * | 63,294 | 2,085,854 |
BlueLinx Holdings, Inc. * | 19,177 | 2,103,142 |
Boise Cascade Co. | 90,237 | 11,935,648 |
Bowman Consulting Group Ltd., Class A * | 24,296 | 789,377 |
Brookfield Business Corp., Class A | 58,975 | 1,200,141 |
Cadre Holdings, Inc. | 43,847 | 1,462,297 |
Chart Industries, Inc. * | 97,629 | 14,064,434 |
Columbus McKinnon Corp. | 64,069 | 2,644,128 |
Comfort Systems USA, Inc. | 80,404 | 24,877,802 |
Commercial Vehicle Group, Inc. * | 73,434 | 441,338 |
Concrete Pumping Holdings, Inc. * | 55,510 | 369,141 |
Construction Partners, Inc., Class A * | 97,598 | 5,039,961 |
CSW Industrials, Inc. | 34,973 | 8,310,284 |
Custom Truck One Source, Inc. * | 126,519 | 631,330 |
Desktop Metal, Inc., Class A *(a) | 650,004 | 508,563 |
Distribution Solutions Group, Inc. * | 23,080 | 760,948 |
DNOW, Inc. * | 241,644 | 3,409,597 |
Douglas Dynamics, Inc. | 50,983 | 1,154,255 |
Dragonfly Energy Holdings Corp. * | 64,702 | 55,501 |
Ducommun, Inc. * | 30,270 | 1,637,304 |
DXP Enterprises, Inc. * | 29,856 | 1,455,779 |
Dycom Industries, Inc. * | 65,023 | 9,104,520 |
Encore Wire Corp. | 34,202 | 9,554,671 |
Energy Recovery, Inc. * | 125,588 | 1,871,261 |
Energy Vault Holdings, Inc. * | 224,131 | 284,646 |
Enerpac Tool Group Corp., Class A | 123,738 | 4,408,785 |
EnerSys | 92,589 | 8,374,675 |
Enovix Corp. *(a) | 314,610 | 1,969,459 |
Enpro, Inc. | 47,571 | 7,141,834 |
Eos Energy Enterprises, Inc. *(a) | 346,894 | 268,218 |
ESCO Technologies, Inc. | 58,208 | 5,905,202 |
ESS Tech, Inc. * | 201,873 | 152,192 |
SECURITY | NUMBER OF SHARES | VALUE ($) |
Eve Holding, Inc. * | 41,374 | 223,006 |
EVI Industries, Inc. | 14,660 | 300,823 |
Federal Signal Corp. | 136,212 | 11,074,036 |
Fluence Energy, Inc. * | 132,710 | 2,367,546 |
Fluor Corp. * | 323,947 | 13,064,782 |
Franklin Electric Co., Inc. | 105,004 | 10,108,735 |
FTAI Aviation Ltd. | 226,088 | 15,873,638 |
FTC Solar, Inc. * | 145,416 | 66,891 |
FuelCell Energy, Inc. *(a) | 1,023,701 | 949,790 |
GATX Corp. | 80,747 | 9,880,203 |
Gencor Industries, Inc. * | 24,095 | 408,892 |
Gibraltar Industries, Inc. * | 69,566 | 4,971,186 |
Global Industrial Co. | 30,115 | 1,159,729 |
GMS, Inc. * | 90,916 | 8,411,548 |
Gorman-Rupp Co. | 51,958 | 1,723,447 |
GrafTech International Ltd. | 435,411 | 748,907 |
Granite Construction, Inc. | 100,336 | 5,568,648 |
Great Lakes Dredge & Dock Corp. * | 148,593 | 980,714 |
Greenbrier Cos., Inc. | 69,219 | 3,418,726 |
Griffon Corp. | 89,438 | 5,859,978 |
H&E Equipment Services, Inc. | 72,851 | 3,517,975 |
Helios Technologies, Inc. | 75,240 | 3,393,324 |
Herc Holdings, Inc. | 64,303 | 9,197,258 |
Hillenbrand, Inc. | 159,073 | 7,590,964 |
Hillman Solutions Corp. * | 442,341 | 4,228,780 |
Hudson Technologies, Inc. * | 100,472 | 996,682 |
Hyliion Holdings Corp. * | 342,611 | 441,968 |
Hyster-Yale Materials Handling, Inc. | 25,197 | 1,475,788 |
IES Holdings, Inc. * | 18,510 | 2,501,071 |
INNOVATE Corp. * | 55,460 | 38,916 |
Insteel Industries, Inc. | 42,531 | 1,365,245 |
Janus International Group, Inc. * | 192,755 | 2,777,600 |
JELD-WEN Holding, Inc. * | 193,034 | 3,957,197 |
John Bean Technologies Corp. | 72,334 | 6,444,236 |
Kadant, Inc. | 26,537 | 7,265,565 |
Karat Packaging, Inc. | 15,653 | 424,196 |
Kennametal, Inc. | 180,711 | 4,252,130 |
Kratos Defense & Security Solutions, Inc. * | 327,304 | 5,832,557 |
Leonardo DRS, Inc. * | 155,904 | 3,355,054 |
Limbach Holdings, Inc. * | 21,075 | 955,330 |
Lindsay Corp. | 25,083 | 2,913,390 |
LSI Industries, Inc. | 64,536 | 942,226 |
Luxfer Holdings PLC | 59,849 | 576,346 |
Manitowoc Co., Inc. * | 78,393 | 948,555 |
Masonite International Corp. * | 49,761 | 6,595,821 |
Masterbrand, Inc. * | 291,304 | 4,856,038 |
Mayville Engineering Co., Inc. * | 25,193 | 346,656 |
McGrath RentCorp | 56,104 | 5,984,053 |
Microvast Holdings, Inc. * | 496,170 | 194,449 |
Miller Industries, Inc. | 25,190 | 1,227,005 |
Moog, Inc., Class A | 65,564 | 10,429,265 |
MRC Global, Inc. * | 190,319 | 2,137,282 |
Mueller Industries, Inc. | 254,612 | 14,212,442 |
Mueller Water Products, Inc., Class A | 353,036 | 5,592,090 |
MYR Group, Inc. * | 37,350 | 6,209,437 |
National Presto Industries, Inc. | 11,796 | 967,154 |
NEXTracker, Inc., Class A * | 285,835 | 12,230,880 |
Nikola Corp. *(a) | 1,677,189 | 1,040,863 |
Northwest Pipe Co. * | 22,322 | 706,491 |
NuScale Power Corp. *(a) | 126,882 | 735,916 |
Omega Flex, Inc. | 7,464 | 494,565 |
Park Aerospace Corp. | 43,088 | 614,866 |
Park-Ohio Holdings Corp. | 19,087 | 487,291 |
Powell Industries, Inc. | 21,056 | 3,011,008 |
Preformed Line Products Co. | 5,549 | 671,595 |
Primoris Services Corp. | 120,848 | 5,631,517 |
Proto Labs, Inc. * | 58,896 | 1,795,150 |
SECURITY | NUMBER OF SHARES | VALUE ($) |
Quanex Building Products Corp. | 75,348 | 2,503,061 |
Redwire Corp. *(a) | 17,938 | 67,806 |
Resideo Technologies, Inc. * | 332,645 | 6,496,557 |
REV Group, Inc. | 72,327 | 1,581,068 |
Rocket Lab USA, Inc. * | 639,523 | 2,404,606 |
Rush Enterprises, Inc., Class A | 137,793 | 6,051,869 |
Rush Enterprises, Inc., Class B | 20,660 | 845,201 |
SES AI Corp. * | 283,373 | 447,729 |
Shoals Technologies Group, Inc., Class A * | 388,622 | 3,283,856 |
Shyft Group, Inc. | 76,874 | 836,389 |
Simpson Manufacturing Co., Inc. | 97,494 | 16,953,232 |
SKYX Platforms Corp. *(a) | 147,033 | 151,444 |
Southland Holdings, Inc. * | 7,398 | 32,403 |
SPX Technologies, Inc. * | 100,305 | 12,218,152 |
Standex International Corp. | 26,726 | 4,620,391 |
Stem, Inc. *(a) | 326,784 | 601,283 |
Sterling Infrastructure, Inc. * | 68,009 | 6,909,714 |
SunPower Corp. *(a) | 201,271 | 414,618 |
Tennant Co. | 42,163 | 4,911,146 |
Terex Corp. | 150,851 | 8,455,199 |
Terran Orbital Corp. *(a) | 229,525 | 302,973 |
Thermon Group Holdings, Inc. * | 75,769 | 2,419,304 |
Titan International, Inc. * | 116,596 | 1,284,888 |
Titan Machinery, Inc. * | 46,532 | 1,035,802 |
TPI Composites, Inc. *(a) | 96,647 | 307,337 |
Transcat, Inc. * | 18,609 | 1,998,048 |
Trinity Industries, Inc. | 184,947 | 4,812,321 |
Triumph Group, Inc. * | 147,463 | 1,970,106 |
Tutor Perini Corp. * | 97,057 | 1,614,058 |
UFP Industries, Inc. | 136,423 | 15,374,872 |
V2X, Inc. * | 26,004 | 1,263,274 |
Velo3D, Inc. * | 203,467 | 53,837 |
Vicor Corp. * | 50,573 | 1,637,554 |
Virgin Galactic Holdings, Inc. * | 811,192 | 705,818 |
Wabash National Corp. | 104,440 | 2,413,608 |
Watts Water Technologies, Inc., Class A | 62,135 | 12,331,312 |
Willis Lease Finance Corp. * | 6,688 | 325,104 |
Xometry, Inc., Class A *(a) | 77,710 | 1,388,678 |
Zurn Elkay Water Solutions Corp. | 336,381 | 10,521,998 |
687,057,445 | ||
Commercial & Professional Services 4.1% | ||
ABM Industries, Inc. | 143,096 | 6,253,295 |
ACCO Brands Corp. | 209,004 | 1,007,399 |
ACV Auctions, Inc., Class A * | 289,196 | 5,046,470 |
Alight, Inc., Class A * | 939,940 | 8,478,259 |
Aris Water Solutions, Inc., Class A | 68,277 | 957,926 |
ASGN, Inc. * | 104,834 | 10,111,239 |
Asure Software, Inc. * | 53,725 | 397,028 |
Barrett Business Services, Inc. | 14,749 | 1,792,004 |
Blacksky Technology, Inc. * | 288,397 | 348,960 |
BrightView Holdings, Inc. * | 94,209 | 1,059,851 |
Brink's Co. | 101,394 | 8,867,919 |
Casella Waste Systems, Inc., Class A * | 128,276 | 11,596,150 |
CBIZ, Inc. * | 108,751 | 7,740,896 |
CECO Environmental Corp. * | 68,022 | 1,470,636 |
Cimpress PLC * | 40,838 | 3,482,256 |
CompX International, Inc. | 3,409 | 107,349 |
Conduent, Inc. * | 390,621 | 1,230,456 |
CoreCivic, Inc. * | 257,816 | 3,841,458 |
CRA International, Inc. | 15,422 | 2,237,578 |
CSG Systems International, Inc. | 67,220 | 3,175,473 |
Deluxe Corp. | 98,436 | 1,944,111 |
Ennis, Inc. | 57,524 | 1,144,728 |
Enviri Corp. * | 178,440 | 1,388,263 |
ExlService Holdings, Inc. * | 367,548 | 10,658,892 |
SECURITY | NUMBER OF SHARES | VALUE ($) |
Exponent, Inc. | 114,879 | 10,558,529 |
First Advantage Corp. | 122,545 | 1,997,484 |
FiscalNote Holdings, Inc. * | 142,336 | 193,577 |
Forrester Research, Inc. * | 26,356 | 479,416 |
Franklin Covey Co. * | 26,128 | 1,017,424 |
GEO Group, Inc. * | 273,121 | 4,058,578 |
Healthcare Services Group, Inc. * | 168,552 | 1,790,022 |
Heidrick & Struggles International, Inc. | 45,097 | 1,329,460 |
HireQuest, Inc. | 12,249 | 157,032 |
HireRight Holdings Corp. * | 29,756 | 425,511 |
HNI Corp. | 104,635 | 4,389,438 |
Huron Consulting Group, Inc. * | 42,141 | 3,929,227 |
IBEX Holdings Ltd. * | 21,846 | 286,183 |
ICF International, Inc. | 42,551 | 6,139,684 |
Innodata, Inc. *(a) | 60,590 | 353,846 |
Insperity, Inc. | 80,668 | 8,303,157 |
Interface, Inc., Class A | 130,848 | 2,000,666 |
Kelly Services, Inc., Class A | 70,964 | 1,627,914 |
Kforce, Inc. | 42,688 | 2,636,411 |
Korn Ferry | 118,423 | 7,190,645 |
LanzaTech Global, Inc. * | 47,134 | 102,045 |
Legalzoom.com, Inc. * | 303,237 | 3,623,682 |
Li-Cycle Holdings Corp. * | 318,432 | 208,605 |
Liquidity Services, Inc. * | 52,629 | 908,377 |
Matthews International Corp., Class A | 67,744 | 1,827,733 |
Maximus, Inc. | 138,254 | 11,099,031 |
MillerKnoll, Inc. | 167,251 | 4,253,193 |
Mistras Group, Inc. * | 47,603 | 416,526 |
Montrose Environmental Group, Inc. * | 64,050 | 2,781,051 |
NL Industries, Inc. | 18,784 | 154,217 |
NV5 Global, Inc. * | 31,577 | 2,944,239 |
OPENLANE, Inc. * | 242,129 | 4,159,776 |
Parsons Corp. * | 93,680 | 7,354,817 |
Performant Financial Corp. * | 153,846 | 409,230 |
Pitney Bowes, Inc. | 398,652 | 1,698,258 |
Planet Labs PBC * | 391,106 | 660,969 |
Quad/Graphics, Inc. | 70,560 | 316,814 |
Resources Connection, Inc. | 73,695 | 814,330 |
Skillsoft Corp. * | 10,299 | 74,050 |
SP Plus Corp. * | 44,383 | 2,266,196 |
Steelcase, Inc., Class A | 209,470 | 2,519,924 |
Sterling Check Corp. * | 69,347 | 1,049,220 |
TriNet Group, Inc. | 72,833 | 7,310,248 |
TrueBlue, Inc. * | 67,879 | 707,299 |
TTEC Holdings, Inc. | 44,925 | 327,054 |
UniFirst Corp. | 34,128 | 5,464,917 |
Upwork, Inc. * | 283,862 | 3,321,185 |
Verra Mobility Corp., Class A * | 310,594 | 7,323,807 |
Viad Corp. * | 45,927 | 1,583,563 |
VSE Corp. | 29,657 | 2,315,322 |
Willdan Group, Inc. * | 27,961 | 788,221 |
231,986,699 | ||
Consumer Discretionary Distribution & Retail 2.8% | ||
1-800-Flowers.com, Inc., Class A * | 59,555 | 540,164 |
Aaron's Co., Inc. | 70,095 | 484,356 |
Abercrombie & Fitch Co., Class A * | 110,869 | 13,472,801 |
Academy Sports & Outdoors, Inc. | 164,036 | 9,563,299 |
American Eagle Outfitters, Inc. | 414,445 | 10,054,436 |
America's Car-Mart, Inc. * | 13,304 | 761,521 |
Arko Corp. | 181,467 | 780,308 |
Asbury Automotive Group, Inc. * | 47,085 | 9,899,150 |
BARK, Inc. * | 308,341 | 339,175 |
Beyond, Inc. * | 102,750 | 2,068,357 |
Big 5 Sporting Goods Corp. | 49,178 | 174,090 |
Big Lots, Inc. *(a) | 65,069 | 229,043 |
Boot Barn Holdings, Inc. * | 68,605 | 7,304,374 |
SECURITY | NUMBER OF SHARES | VALUE ($) |
Buckle, Inc. | 69,215 | 2,587,949 |
Build-A-Bear Workshop, Inc. | 29,182 | 880,129 |
Caleres, Inc. | 77,068 | 2,838,414 |
Camping World Holdings, Inc., Class A | 94,775 | 1,921,089 |
CarParts.com, Inc. * | 118,534 | 145,797 |
Carvana Co., Class A * | 234,265 | 19,425,254 |
Cato Corp., Class A | 39,806 | 191,865 |
Children's Place, Inc. *(a) | 26,596 | 185,108 |
ContextLogic, Inc., Class A * | 50,734 | 281,574 |
Designer Brands, Inc., Class A | 95,450 | 886,730 |
Destination XL Group, Inc. * | 129,962 | 417,178 |
Dillard's, Inc., Class A | 7,717 | 3,379,969 |
Duluth Holdings, Inc., Class B * | 31,550 | 132,826 |
Envela Corp. * | 17,343 | 74,401 |
EVgo, Inc., Class A *(a) | 235,755 | 426,717 |
Foot Locker, Inc. | 185,933 | 3,876,703 |
Genesco, Inc. * | 25,364 | 641,963 |
Group 1 Automotive, Inc. | 30,979 | 9,108,446 |
GrowGeneration Corp. * | 133,787 | 400,023 |
Guess?, Inc. | 63,822 | 1,709,153 |
Haverty Furniture Cos., Inc. | 33,501 | 1,031,831 |
Hibbett, Inc. | 26,349 | 2,272,338 |
J Jill, Inc. * | 10,402 | 259,218 |
Lands' End, Inc. * | 34,061 | 465,954 |
Lazydays Holdings, Inc. * | 17,977 | 63,639 |
Leslie's, Inc. * | 405,146 | 1,592,224 |
MarineMax, Inc. * | 49,339 | 1,217,193 |
Monro, Inc. | 67,270 | 1,833,107 |
National Vision Holdings, Inc. * | 176,328 | 3,071,634 |
ODP Corp. * | 72,336 | 3,682,626 |
OneWater Marine, Inc., Class A * | 26,450 | 547,780 |
PetMed Express, Inc. | 50,250 | 198,488 |
Qurate Retail, Inc., Class B * | 3,032 | 11,582 |
Rent the Runway, Inc., Class A *(a) | 5,495 | 55,774 |
Revolve Group, Inc. * | 90,330 | 1,798,470 |
Sally Beauty Holdings, Inc. * | 243,393 | 2,640,814 |
Savers Value Village, Inc. * | 58,184 | 961,200 |
Shoe Carnival, Inc. | 41,280 | 1,380,403 |
Signet Jewelers Ltd. | 99,339 | 9,738,202 |
Sleep Number Corp. * | 47,938 | 638,055 |
Sonic Automotive, Inc., Class A | 33,235 | 1,922,312 |
Sportsman's Warehouse Holdings, Inc. * | 86,556 | 276,979 |
Stitch Fix, Inc., Class A * | 204,677 | 433,915 |
ThredUp, Inc., Class A * | 164,143 | 262,629 |
Tile Shop Holdings, Inc. * | 66,888 | 449,487 |
Tilly's, Inc., Class A * | 51,150 | 310,481 |
Torrid Holdings, Inc. *(a) | 27,619 | 140,028 |
Upbound Group, Inc. | 121,322 | 3,762,195 |
Urban Outfitters, Inc. * | 145,049 | 5,651,109 |
Warby Parker, Inc., Class A * | 194,654 | 2,285,238 |
Weyco Group, Inc. | 13,968 | 409,961 |
Winmark Corp. | 6,472 | 2,325,519 |
Zumiez, Inc. * | 36,639 | 630,191 |
157,502,938 | ||
Consumer Durables & Apparel 3.2% | ||
Acushnet Holdings Corp. | 68,651 | 4,186,338 |
Allbirds, Inc., Class A * | 230,876 | 139,287 |
AMMO, Inc. * | 200,967 | 510,456 |
Beazer Homes USA, Inc. * | 67,316 | 1,886,867 |
Cavco Industries, Inc. * | 19,025 | 6,929,095 |
Century Communities, Inc. | 64,695 | 5,131,607 |
Clarus Corp. | 66,909 | 423,534 |
Cricut, Inc., Class A | 110,093 | 585,695 |
Dream Finders Homes, Inc., Class A * | 55,296 | 1,963,008 |
Escalade, Inc. | 22,762 | 283,615 |
Ethan Allen Interiors, Inc. | 51,768 | 1,461,928 |
SECURITY | NUMBER OF SHARES | VALUE ($) |
Figs, Inc., Class A * | 287,789 | 1,470,602 |
Fossil Group, Inc. *(b) | 110,605 | 86,029 |
Funko, Inc., Class A * | 83,510 | 508,576 |
G-III Apparel Group Ltd. * | 93,690 | 2,637,373 |
GoPro, Inc., Class A * | 294,182 | 508,935 |
Green Brick Partners, Inc. * | 59,112 | 3,199,733 |
Hanesbrands, Inc. * | 797,436 | 3,636,308 |
Helen of Troy Ltd. * | 54,081 | 5,013,850 |
Hooker Furnishings Corp. | 23,825 | 405,025 |
Hovnanian Enterprises, Inc., Class A * | 11,125 | 1,644,609 |
Installed Building Products, Inc. | 53,846 | 12,693,118 |
iRobot Corp. * | 60,795 | 520,405 |
JAKKS Pacific, Inc. * | 16,527 | 312,526 |
Johnson Outdoors, Inc., Class A | 12,258 | 502,701 |
KB Home | 155,024 | 10,039,354 |
Kontoor Brands, Inc. | 127,573 | 7,917,180 |
Landsea Homes Corp. * | 44,586 | 514,968 |
Latham Group, Inc. * | 88,803 | 248,648 |
La-Z-Boy, Inc. | 98,427 | 3,232,343 |
Legacy Housing Corp. * | 24,487 | 498,800 |
LGI Homes, Inc. * | 47,417 | 4,264,211 |
Lovesac Co. * | 32,088 | 711,712 |
M/I Homes, Inc. * | 61,168 | 7,108,945 |
Malibu Boats, Inc., Class A * | 45,924 | 1,562,334 |
Marine Products Corp. | 19,228 | 206,701 |
MasterCraft Boat Holdings, Inc. * | 39,108 | 791,155 |
Meritage Homes Corp. | 82,740 | 13,713,328 |
Movado Group, Inc. | 35,097 | 893,921 |
Oxford Industries, Inc. | 33,964 | 3,660,640 |
Purple Innovation, Inc., Class A * | 127,139 | 193,251 |
Rocky Brands, Inc. | 15,946 | 410,928 |
Skyline Champion Corp. * | 122,757 | 9,205,547 |
Smith & Wesson Brands, Inc. | 103,878 | 1,762,810 |
Snap One Holdings Corp. * | 41,194 | 435,833 |
Solo Brands, Inc., Class A * | 44,960 | 84,525 |
Sonos, Inc. * | 281,958 | 4,765,090 |
Steven Madden Ltd. | 167,801 | 6,780,838 |
Sturm Ruger & Co., Inc. | 39,427 | 1,822,710 |
Taylor Morrison Home Corp., Class A * | 235,326 | 13,180,609 |
Topgolf Callaway Brands Corp. * | 327,530 | 5,247,031 |
Traeger, Inc. * | 81,565 | 175,365 |
Tri Pointe Homes, Inc. * | 218,287 | 8,043,876 |
United Homes Group, Inc. * | 14,068 | 93,974 |
Vera Bradley, Inc. * | 59,949 | 395,064 |
Vista Outdoor, Inc. * | 130,923 | 4,594,088 |
Vizio Holding Corp., Class A * | 174,388 | 1,848,513 |
VOXX International Corp., Class A * | 27,479 | 162,126 |
Wolverine World Wide, Inc. | 175,485 | 1,884,709 |
Worthington Enterprises, Inc. | 69,808 | 3,990,225 |
177,082,572 | ||
Consumer Services 3.3% | ||
2U, Inc. * | 182,090 | 45,158 |
Accel Entertainment, Inc., Class A * | 121,826 | 1,308,411 |
Adtalem Global Education, Inc. * | 88,616 | 4,397,126 |
Bally's Corp. * | 66,343 | 871,747 |
Biglari Holdings, Inc., Class B * | 1,689 | 332,919 |
BJ's Restaurants, Inc. * | 51,017 | 1,662,644 |
Bloomin' Brands, Inc. | 199,369 | 5,141,727 |
Bowlero Corp., Class A (a) | 36,617 | 430,250 |
Brinker International, Inc. * | 99,917 | 5,355,551 |
Carriage Services, Inc., Class A | 30,682 | 784,846 |
Carrols Restaurant Group, Inc. | 79,489 | 756,735 |
Century Casinos, Inc. * | 62,870 | 186,724 |
Cheesecake Factory, Inc. | 108,325 | 3,739,379 |
Chegg, Inc. * | 260,207 | 1,345,270 |
Chuy's Holdings, Inc. * | 39,272 | 1,156,953 |
SECURITY | NUMBER OF SHARES | VALUE ($) |
Coursera, Inc. * | 300,107 | 3,067,094 |
Cracker Barrel Old Country Store, Inc. (a) | 50,097 | 2,915,144 |
Dave & Buster's Entertainment, Inc. * | 76,650 | 4,093,110 |
Denny's Corp. * | 115,048 | 922,685 |
Dine Brands Global, Inc. | 35,077 | 1,546,896 |
Duolingo, Inc. * | 67,204 | 15,171,303 |
El Pollo Loco Holdings, Inc. * | 62,215 | 530,072 |
European Wax Center, Inc., Class A * | 76,769 | 902,803 |
Everi Holdings, Inc. * | 184,581 | 1,508,027 |
First Watch Restaurant Group, Inc. * | 50,170 | 1,280,338 |
Frontdoor, Inc. * | 184,410 | 5,659,543 |
Full House Resorts, Inc. * | 75,097 | 382,995 |
Global Business Travel Group I * | 73,773 | 446,327 |
Golden Entertainment, Inc. | 45,804 | 1,468,018 |
Graham Holdings Co., Class B | 7,910 | 5,547,837 |
Hilton Grand Vacations, Inc. * | 179,007 | 7,453,852 |
Inspired Entertainment, Inc. * | 49,619 | 421,762 |
International Game Technology PLC | 247,193 | 4,879,590 |
Jack in the Box, Inc. | 44,824 | 2,558,106 |
Krispy Kreme, Inc. | 198,064 | 2,505,510 |
Kura Sushi USA, Inc., Class A * | 13,281 | 1,461,972 |
Laureate Education, Inc. | 296,954 | 4,305,833 |
Life Time Group Holdings, Inc. * | 101,124 | 1,381,354 |
Light & Wonder, Inc. * | 205,261 | 18,321,597 |
Lincoln Educational Services Corp. * | 54,578 | 581,801 |
Lindblad Expeditions Holdings, Inc. * | 77,761 | 570,766 |
Monarch Casino & Resort, Inc. | 30,524 | 2,068,611 |
Mondee Holdings, Inc., Class A *(a) | 103,793 | 227,307 |
Nathan's Famous, Inc. | 6,447 | 416,541 |
Nerdy, Inc. * | 152,694 | 395,477 |
Noodles & Co., Class A * | 91,768 | 138,570 |
ONE Group Hospitality, Inc. * | 50,200 | 269,072 |
OneSpaWorld Holdings Ltd. * | 189,190 | 2,406,497 |
Papa John's International, Inc. | 74,887 | 4,619,779 |
Perdoceo Education Corp. | 148,177 | 2,711,639 |
PlayAGS, Inc. * | 87,556 | 773,995 |
Portillo's, Inc., Class A * | 102,367 | 1,255,019 |
Potbelly Corp. * | 59,617 | 607,497 |
RCI Hospitality Holdings, Inc. | 19,698 | 999,870 |
Red Robin Gourmet Burgers, Inc. * | 36,084 | 272,434 |
Red Rock Resorts, Inc., Class A | 108,134 | 5,744,078 |
Rush Street Interactive, Inc. * | 144,765 | 925,048 |
Sabre Corp. * | 756,013 | 2,169,757 |
Shake Shack, Inc., Class A * | 85,693 | 9,070,604 |
Six Flags Entertainment Corp. * | 165,400 | 3,900,132 |
Strategic Education, Inc. | 51,516 | 5,916,097 |
Stride, Inc. * | 96,439 | 6,437,303 |
Super Group SGHC Ltd. * | 307,798 | 972,642 |
Sweetgreen, Inc., Class A * | 222,620 | 5,002,271 |
Target Hospitality Corp. * | 70,223 | 781,231 |
Udemy, Inc. * | 203,358 | 2,037,647 |
United Parks & Resorts, Inc. * | 82,393 | 4,187,212 |
Universal Technical Institute, Inc. * | 89,640 | 1,364,321 |
WW International, Inc. * | 127,364 | 230,529 |
Xponential Fitness, Inc., Class A * | 52,765 | 672,754 |
183,973,709 | ||
Consumer Staples Distribution & Retail 0.6% | ||
Andersons, Inc. | 72,943 | 4,007,488 |
Chefs' Warehouse, Inc. * | 79,982 | 2,645,805 |
HF Foods Group, Inc. * | 92,601 | 270,395 |
Ingles Markets, Inc., Class A | 32,274 | 2,315,660 |
Natural Grocers by Vitamin Cottage, Inc. | 21,852 | 357,499 |
PriceSmart, Inc. | 58,017 | 4,675,590 |
SpartanNash Co. | 79,030 | 1,508,683 |
Sprouts Farmers Market, Inc. * | 231,415 | 15,280,332 |
United Natural Foods, Inc. * | 134,836 | 1,204,085 |
SECURITY | NUMBER OF SHARES | VALUE ($) |
Village Super Market, Inc., Class A | 19,625 | 548,911 |
Weis Markets, Inc. | 37,406 | 2,361,441 |
35,175,889 | ||
Energy 7.5% | ||
Amplify Energy Corp. * | 82,931 | 585,493 |
Archrock, Inc. | 315,907 | 6,062,255 |
Ardmore Shipping Corp. | 95,560 | 1,600,630 |
Atlas Energy Solutions, Inc., Class A | 40,906 | 908,522 |
Berry Corp. | 172,629 | 1,465,620 |
Borr Drilling Ltd. * | 499,630 | 2,648,039 |
Bristow Group, Inc. * | 53,462 | 1,406,585 |
Cactus, Inc., Class A | 148,697 | 7,381,319 |
California Resources Corp. | 158,059 | 8,354,999 |
Centrus Energy Corp., Class A * | 27,817 | 1,194,184 |
ChampionX Corp. | 444,727 | 14,929,485 |
Chord Energy Corp. | 95,054 | 16,822,657 |
Civitas Resources, Inc. | 183,654 | 13,215,742 |
Clean Energy Fuels Corp. * | 391,562 | 908,424 |
CNX Resources Corp. * | 355,395 | 8,358,890 |
Comstock Resources, Inc. | 209,604 | 2,108,616 |
CONSOL Energy, Inc. | 69,486 | 5,750,661 |
Core Laboratories, Inc. | 106,957 | 1,689,921 |
Crescent Energy Co., Class A | 174,791 | 1,859,776 |
CVR Energy, Inc. | 67,163 | 2,040,412 |
Delek U.S. Holdings, Inc. | 143,836 | 3,931,038 |
DHT Holdings, Inc. | 307,310 | 3,509,480 |
Diamond Offshore Drilling, Inc. * | 230,656 | 2,823,229 |
DMC Global, Inc. * | 44,001 | 697,416 |
Dorian LPG Ltd. | 78,227 | 3,232,340 |
Dril-Quip, Inc. * | 77,188 | 1,403,278 |
Empire Petroleum Corp. *(a) | 33,956 | 175,892 |
Encore Energy Corp. * | 370,425 | 1,633,574 |
Energy Fuels, Inc. *(a) | 365,880 | 1,895,258 |
Equitrans Midstream Corp. | 992,186 | 13,424,277 |
Evolution Petroleum Corp. | 73,010 | 394,254 |
Excelerate Energy, Inc., Class A | 40,791 | 687,736 |
Expro Group Holdings NV * | 203,037 | 3,808,974 |
FLEX LNG Ltd. | 67,606 | 1,758,432 |
Forum Energy Technologies, Inc. * | 22,424 | 418,208 |
FutureFuel Corp. | 59,766 | 323,932 |
Gevo, Inc. * | 532,289 | 350,672 |
Golar LNG Ltd. | 225,254 | 5,523,228 |
Granite Ridge Resources, Inc. | 77,854 | 507,608 |
Green Plains, Inc. * | 133,470 | 2,758,825 |
Gulfport Energy Corp. * | 24,795 | 3,935,214 |
Hallador Energy Co. * | 52,560 | 268,582 |
Helix Energy Solutions Group, Inc. * | 326,197 | 3,503,356 |
Helmerich & Payne, Inc. | 220,879 | 8,687,171 |
HighPeak Energy, Inc. (a) | 27,792 | 394,924 |
International Seaways, Inc. | 92,524 | 5,115,652 |
Kinetik Holdings, Inc., Class A | 82,617 | 3,167,536 |
KLX Energy Services Holdings, Inc. *(a) | 28,956 | 191,978 |
Kodiak Gas Services, Inc. | 35,888 | 975,436 |
Kosmos Energy Ltd. * | 1,037,627 | 5,883,345 |
Liberty Energy, Inc., Class A | 372,801 | 8,201,622 |
Magnolia Oil & Gas Corp., Class A | 402,137 | 10,081,575 |
Mammoth Energy Services, Inc. * | 53,242 | 173,036 |
Matador Resources Co. | 257,364 | 16,033,777 |
Murphy Oil Corp. | 330,221 | 14,741,065 |
Nabors Industries Ltd. * | 20,974 | 1,510,757 |
NACCO Industries, Inc., Class A | 9,708 | 267,358 |
Newpark Resources, Inc. * | 169,687 | 1,177,628 |
NextDecade Corp. * | 179,248 | 1,150,772 |
Noble Corp. PLC | 255,891 | 11,356,443 |
Nordic American Tankers Ltd. | 464,062 | 1,809,842 |
Northern Oil & Gas, Inc. | 199,697 | 8,145,641 |
SECURITY | NUMBER OF SHARES | VALUE ($) |
Oceaneering International, Inc. * | 228,712 | 5,239,792 |
Oil States International, Inc. * | 141,324 | 563,883 |
Overseas Shipholding Group, Inc., Class A | 131,988 | 802,487 |
Par Pacific Holdings, Inc. * | 125,195 | 3,856,006 |
Patterson-UTI Energy, Inc. | 802,087 | 8,678,581 |
PBF Energy, Inc., Class A | 250,591 | 13,348,983 |
Peabody Energy Corp. | 256,586 | 5,629,497 |
Permian Resources Corp., Class A | 1,035,889 | 17,351,141 |
PrimeEnergy Resources Corp. * | 1,690 | 173,157 |
ProFrac Holding Corp., Class A * | 60,024 | 436,374 |
ProPetro Holding Corp. * | 214,103 | 1,866,978 |
Ranger Energy Services, Inc. | 32,593 | 320,715 |
REX American Resources Corp. * | 35,185 | 1,946,786 |
Riley Exploration Permian, Inc. | 20,223 | 524,382 |
Ring Energy, Inc. * | 269,790 | 512,601 |
RPC, Inc. | 193,461 | 1,294,254 |
SandRidge Energy, Inc. | 72,393 | 991,784 |
Scorpio Tankers, Inc. | 108,397 | 7,626,813 |
SEACOR Marine Holdings, Inc. * | 53,989 | 659,746 |
Seadrill Ltd. * | 106,612 | 5,176,013 |
Select Water Solutions, Inc. | 180,609 | 1,668,827 |
SFL Corp. Ltd. | 261,341 | 3,483,676 |
SilverBow Resources, Inc. * | 52,883 | 1,624,566 |
Sitio Royalties Corp., Class A | 186,240 | 4,328,218 |
SM Energy Co. | 263,171 | 12,761,162 |
Solaris Oilfield Infrastructure, Inc., Class A | 67,085 | 591,019 |
Talos Energy, Inc. * | 315,306 | 4,155,733 |
Teekay Corp. * | 142,441 | 1,042,668 |
Teekay Tankers Ltd., Class A | 54,202 | 3,158,351 |
Tellurian, Inc. * | 1,327,539 | 570,975 |
TETRA Technologies, Inc. * | 284,509 | 1,220,544 |
Tidewater, Inc. * | 105,323 | 9,673,918 |
U.S. Silica Holdings, Inc. * | 170,607 | 2,632,466 |
Uranium Energy Corp. * | 875,255 | 5,907,971 |
VAALCO Energy, Inc. | 238,892 | 1,528,909 |
Valaris Ltd. * | 135,007 | 8,783,555 |
Verde Clean Fuels, Inc. * | 1,285 | 6,296 |
Vertex Energy, Inc. * | 154,976 | 201,469 |
Vital Energy, Inc. * | 52,991 | 2,809,583 |
Vitesse Energy, Inc. | 56,820 | 1,260,836 |
W&T Offshore, Inc. | 221,250 | 497,812 |
Weatherford International PLC * | 161,721 | 19,991,950 |
World Kinect Corp. | 135,669 | 3,188,221 |
423,411,289 | ||
Equity Real Estate Investment Trusts (REITs) 5.0% | ||
Acadia Realty Trust | 227,794 | 3,936,280 |
Alexander & Baldwin, Inc. | 164,573 | 2,710,517 |
Alexander's, Inc. | 4,898 | 1,036,221 |
Alpine Income Property Trust, Inc. | 29,557 | 441,286 |
American Assets Trust, Inc. | 110,762 | 2,364,769 |
Apartment Investment & Management Co., Class A * | 327,332 | 2,618,656 |
Apple Hospitality REIT, Inc. | 489,449 | 7,224,267 |
Armada Hoffler Properties, Inc. | 152,475 | 1,604,037 |
Braemar Hotels & Resorts, Inc. | 149,968 | 409,413 |
Brandywine Realty Trust | 386,322 | 1,753,902 |
Broadstone Net Lease, Inc. | 427,110 | 6,218,722 |
BRT Apartments Corp. | 27,032 | 484,954 |
CareTrust REIT, Inc. | 272,314 | 6,731,602 |
CBL & Associates Properties, Inc. | 61,037 | 1,327,555 |
Centerspace | 34,192 | 2,299,412 |
Chatham Lodging Trust | 109,196 | 1,001,327 |
City Office REIT, Inc. | 89,169 | 415,528 |
Clipper Realty, Inc. | 24,413 | 102,535 |
SECURITY | NUMBER OF SHARES | VALUE ($) |
Community Healthcare Trust, Inc. | 60,406 | 1,602,571 |
COPT Defense Properties | 256,356 | 6,144,853 |
CTO Realty Growth, Inc. | 50,164 | 870,345 |
DiamondRock Hospitality Co. | 476,508 | 4,240,921 |
Diversified Healthcare Trust (b) | 547,139 | 1,291,248 |
Douglas Emmett, Inc. | 367,379 | 5,036,766 |
Easterly Government Properties, Inc., Class A | 216,761 | 2,533,936 |
Elme Communities | 199,426 | 3,023,298 |
Empire Resorts, Inc. *(c) | 8,021 | 19,696 |
Empire State Realty Trust, Inc., Class A | 299,830 | 2,728,453 |
Equity Commonwealth * | 231,394 | 4,331,696 |
Essential Properties Realty Trust, Inc. | 353,812 | 9,319,408 |
Farmland Partners, Inc. | 100,468 | 1,081,036 |
Four Corners Property Trust, Inc. | 206,104 | 4,833,139 |
Getty Realty Corp. | 108,264 | 2,933,954 |
Gladstone Commercial Corp. | 90,967 | 1,216,229 |
Gladstone Land Corp. | 75,247 | 954,132 |
Global Medical REIT, Inc. | 138,036 | 1,119,472 |
Global Net Lease, Inc. | 441,589 | 3,069,044 |
Hudson Pacific Properties, Inc. | 316,228 | 1,834,122 |
Independence Realty Trust, Inc. | 512,038 | 8,074,839 |
Innovative Industrial Properties, Inc. | 63,451 | 6,560,833 |
InvenTrust Properties Corp. | 154,157 | 3,906,338 |
JBG SMITH Properties | 213,136 | 3,199,171 |
Kite Realty Group Trust | 495,009 | 10,791,196 |
LTC Properties, Inc. | 93,058 | 3,080,220 |
LXP Industrial Trust | 658,930 | 5,502,066 |
Macerich Co. | 490,531 | 6,749,707 |
National Health Investors, Inc. | 94,920 | 5,985,655 |
NETSTREIT Corp. | 156,583 | 2,638,424 |
NexPoint Diversified Real Estate Trust | 73,188 | 437,664 |
NexPoint Residential Trust, Inc. | 50,952 | 1,744,596 |
Office Properties Income Trust | 110,253 | 222,711 |
One Liberty Properties, Inc. | 37,206 | 852,389 |
Orion Office REIT, Inc. | 124,684 | 389,014 |
Outfront Media, Inc. | 335,867 | 5,326,851 |
Paramount Group, Inc. | 420,889 | 1,952,925 |
Peakstone Realty Trust | 81,650 | 1,140,651 |
Pebblebrook Hotel Trust | 269,606 | 3,917,375 |
Phillips Edison & Co., Inc. | 272,948 | 8,925,400 |
Piedmont Office Realty Trust, Inc., Class A | 279,072 | 1,922,806 |
Plymouth Industrial REIT, Inc. | 103,631 | 2,163,815 |
Postal Realty Trust, Inc., Class A | 45,528 | 630,563 |
PotlatchDeltic Corp. | 179,610 | 7,186,196 |
Retail Opportunity Investments Corp. | 279,235 | 3,426,213 |
RLJ Lodging Trust | 347,730 | 3,825,030 |
Ryman Hospitality Properties, Inc. | 132,558 | 13,982,218 |
Sabra Health Care REIT, Inc. | 525,527 | 7,315,336 |
Safehold, Inc. | 111,009 | 2,024,804 |
Saul Centers, Inc. | 26,358 | 959,695 |
Service Properties Trust | 373,574 | 2,290,009 |
SITE Centers Corp. | 433,245 | 5,844,475 |
SL Green Realty Corp. | 147,079 | 7,328,947 |
Summit Hotel Properties, Inc. | 239,712 | 1,440,669 |
Sunstone Hotel Investors, Inc. | 468,137 | 4,774,997 |
Tanger, Inc. | 237,610 | 6,736,244 |
Terreno Realty Corp. | 204,045 | 11,089,846 |
UMH Properties, Inc. | 138,207 | 2,200,255 |
Uniti Group, Inc. | 541,376 | 3,112,912 |
Universal Health Realty Income Trust | 28,993 | 1,044,618 |
Urban Edge Properties | 260,417 | 4,356,776 |
Veris Residential, Inc. | 179,650 | 2,588,757 |
Whitestone REIT | 110,366 | 1,269,209 |
Xenia Hotels & Resorts, Inc. | 239,645 | 3,323,876 |
283,101,593 | ||
SECURITY | NUMBER OF SHARES | VALUE ($) |
Financial Services 5.7% | ||
Acacia Research Corp. * | 86,870 | 423,057 |
AFC Gamma, Inc. | 37,292 | 447,504 |
Alerus Financial Corp. | 40,316 | 794,225 |
AlTi Global, Inc. * | 52,822 | 242,981 |
A-Mark Precious Metals, Inc. | 42,834 | 1,716,358 |
Angel Oak Mortgage REIT, Inc. | 27,502 | 289,596 |
Apollo Commercial Real Estate Finance, Inc. | 322,010 | 3,100,956 |
Arbor Realty Trust, Inc. (a) | 418,841 | 5,373,730 |
Ares Commercial Real Estate Corp. | 116,643 | 792,006 |
ARMOUR Residential REIT, Inc. | 112,129 | 2,037,384 |
Artisan Partners Asset Management, Inc., Class A | 139,623 | 5,714,769 |
AssetMark Financial Holdings, Inc. * | 50,010 | 1,690,838 |
Atlanticus Holdings Corp. * | 10,585 | 279,973 |
AvidXchange Holdings, Inc. * | 342,117 | 3,989,084 |
B Riley Financial, Inc. (a) | 47,051 | 1,618,554 |
Bakkt Holdings, Inc. * | 6,496 | 43,588 |
Banco Latinoamericano de Comercio Exterior SA, Class E | 62,625 | 1,779,176 |
BGC Group, Inc., Class A | 813,571 | 6,370,261 |
Blackstone Mortgage Trust, Inc., Class A | 391,166 | 6,900,168 |
Bread Financial Holdings, Inc. | 112,654 | 4,158,059 |
Brightsphere Investment Group, Inc. | 73,508 | 1,634,818 |
BrightSpire Capital, Inc., Class A | 293,422 | 1,845,624 |
Cannae Holdings, Inc. * | 150,343 | 2,924,171 |
Cantaloupe, Inc. * | 130,462 | 755,375 |
Cass Information Systems, Inc. | 31,016 | 1,339,581 |
Chicago Atlantic Real Estate Finance, Inc. | 37,538 | 590,848 |
Chimera Investment Corp. | 516,067 | 2,126,196 |
Claros Mortgage Trust, Inc. | 205,461 | 1,787,511 |
Cohen & Steers, Inc. | 58,934 | 4,053,481 |
Compass Diversified Holdings | 143,403 | 3,150,564 |
Consumer Portfolio Services, Inc. * | 19,828 | 169,728 |
Diamond Hill Investment Group, Inc. | 6,299 | 939,937 |
Donnelley Financial Solutions, Inc. * | 56,082 | 3,520,828 |
Dynex Capital, Inc. | 128,053 | 1,494,379 |
Ellington Financial, Inc. | 171,594 | 1,963,035 |
Enact Holdings, Inc. | 67,604 | 2,009,867 |
Encore Capital Group, Inc. * | 52,798 | 2,169,470 |
Enova International, Inc. * | 64,265 | 3,889,960 |
Essent Group Ltd. | 238,029 | 12,608,396 |
EVERTEC, Inc. | 148,607 | 5,577,221 |
Federal Agricultural Mortgage Corp., Class C | 20,694 | 3,851,774 |
Finance of America Cos., Inc., Class A * | 122,094 | 58,605 |
FirstCash Holdings, Inc. | 85,626 | 9,674,026 |
Flywire Corp. * | 241,793 | 4,956,757 |
Forge Global Holdings, Inc. * | 254,489 | 465,715 |
Franklin BSP Realty Trust, Inc. | 188,616 | 2,355,814 |
GCM Grosvenor, Inc., Class A | 97,500 | 920,400 |
Granite Point Mortgage Trust, Inc. | 117,145 | 502,552 |
Green Dot Corp., Class A * | 106,402 | 931,018 |
Hamilton Lane, Inc., Class A | 82,881 | 9,259,465 |
Hannon Armstrong Sustainable Infrastructure Capital, Inc. | 249,465 | 6,239,120 |
I3 Verticals, Inc., Class A * | 50,950 | 1,157,075 |
International Money Express, Inc. * | 71,439 | 1,445,211 |
Invesco Mortgage Capital, Inc. | 111,001 | 949,059 |
Jackson Financial, Inc., Class A | 181,360 | 12,390,515 |
KKR Real Estate Finance Trust, Inc. | 132,643 | 1,248,171 |
Ladder Capital Corp., Class A | 256,921 | 2,756,762 |
LendingClub Corp. * | 245,118 | 1,843,287 |
LendingTree, Inc. * | 24,153 | 1,165,865 |
MarketWise, Inc. | 72,420 | 112,975 |
SECURITY | NUMBER OF SHARES | VALUE ($) |
Marqeta, Inc., Class A * | 1,071,822 | 5,948,612 |
Merchants Bancorp | 35,756 | 1,442,039 |
MFA Financial, Inc. | 232,253 | 2,459,559 |
Moelis & Co., Class A | 151,597 | 7,440,381 |
Mr Cooper Group, Inc. * | 146,581 | 11,316,053 |
Navient Corp. | 189,118 | 2,840,552 |
Nelnet, Inc., Class A | 29,173 | 2,747,513 |
NerdWallet, Inc., Class A * | 76,330 | 959,468 |
New York Mortgage Trust, Inc. | 205,430 | 1,407,196 |
NewtekOne, Inc. | 53,043 | 572,334 |
Nexpoint Real Estate Finance, Inc. | 18,441 | 238,995 |
NMI Holdings, Inc., Class A * | 181,266 | 5,593,869 |
Ocwen Financial Corp. * | 14,688 | 342,818 |
Open Lending Corp., Class A * | 224,356 | 1,144,216 |
OppFi, Inc. | 25,079 | 66,961 |
Orchid Island Capital, Inc. (a) | 117,160 | 975,943 |
P10, Inc., Class A | 99,806 | 708,623 |
Pagseguro Digital Ltd., Class A * | 451,502 | 5,621,200 |
Patria Investments Ltd., Class A | 125,367 | 1,679,918 |
Payoneer Global, Inc. * | 600,593 | 2,966,929 |
Paysafe Ltd. * | 74,368 | 1,057,513 |
Paysign, Inc. * | 74,618 | 343,243 |
PennyMac Financial Services, Inc. | 58,073 | 4,973,372 |
PennyMac Mortgage Investment Trust | 197,279 | 2,732,314 |
Perella Weinberg Partners, Class A | 94,972 | 1,416,982 |
Piper Sandler Cos. | 39,377 | 7,709,623 |
PJT Partners, Inc., Class A | 54,025 | 5,104,822 |
PRA Group, Inc. * | 88,338 | 2,101,561 |
Priority Technology Holdings, Inc. * | 39,369 | 126,375 |
PROG Holdings, Inc. | 100,490 | 3,340,288 |
Radian Group, Inc. | 349,398 | 10,436,518 |
Ready Capital Corp. | 363,246 | 3,094,856 |
Redwood Trust, Inc. | 298,758 | 1,652,132 |
Regional Management Corp. | 18,664 | 470,519 |
Remitly Global, Inc. * | 309,121 | 5,511,627 |
Repay Holdings Corp., Class A * | 188,293 | 1,914,940 |
Security National Financial Corp., Class A * | 28,551 | 187,866 |
Silvercrest Asset Management Group, Inc., Class A | 21,764 | 318,843 |
StepStone Group, Inc., Class A | 124,789 | 4,501,139 |
StoneCo Ltd., Class A * | 661,819 | 10,324,376 |
StoneX Group, Inc. * | 61,427 | 4,459,600 |
SWK Holdings Corp. * | 8,736 | 151,482 |
TPG RE Finance Trust, Inc. | 156,175 | 1,144,763 |
Two Harbors Investment Corp. | 235,645 | 2,976,196 |
Upstart Holdings, Inc. *(a) | 168,026 | 3,718,415 |
Value Line, Inc. | 2,043 | 73,957 |
Velocity Financial, Inc. * | 19,685 | 337,598 |
Victory Capital Holdings, Inc., Class A | 60,805 | 3,092,542 |
Virtus Investment Partners, Inc. | 15,495 | 3,398,363 |
Walker & Dunlop, Inc. | 72,251 | 6,620,359 |
Waterstone Financial, Inc. | 40,081 | 454,519 |
WisdomTree, Inc. | 313,170 | 2,787,213 |
World Acceptance Corp. * | 9,166 | 1,260,967 |
318,865,485 | ||
Food, Beverage & Tobacco 1.5% | ||
Alico, Inc. | 16,272 | 454,152 |
B&G Foods, Inc. | 176,574 | 1,959,971 |
Benson Hill, Inc. * | 395,910 | 72,650 |
Beyond Meat, Inc. *(a) | 133,218 | 903,218 |
BRC, Inc., Class A *(a) | 91,854 | 358,231 |
Calavo Growers, Inc. | 39,072 | 1,052,990 |
Cal-Maine Foods, Inc. | 93,382 | 5,166,826 |
Coca-Cola Consolidated, Inc. | 10,832 | 8,947,232 |
Dole PLC | 161,789 | 1,968,972 |
SECURITY | NUMBER OF SHARES | VALUE ($) |
Duckhorn Portfolio, Inc. * | 121,441 | 1,028,605 |
Forafric Global PLC * | 11,937 | 122,593 |
Fresh Del Monte Produce, Inc. | 77,003 | 1,968,967 |
Hain Celestial Group, Inc. * | 202,022 | 1,240,415 |
Ispire Technology, Inc. * | 40,909 | 211,500 |
J & J Snack Foods Corp. | 34,321 | 4,711,930 |
John B Sanfilippo & Son, Inc. | 20,310 | 2,024,907 |
Lancaster Colony Corp. | 44,325 | 8,457,653 |
Limoneira Co. | 40,207 | 795,294 |
MGP Ingredients, Inc. | 36,019 | 2,825,330 |
Mission Produce, Inc. * | 109,240 | 1,239,874 |
National Beverage Corp. * | 53,822 | 2,395,079 |
Primo Water Corp. | 355,440 | 6,707,153 |
Seneca Foods Corp., Class A * | 11,041 | 641,372 |
Simply Good Foods Co. * | 206,183 | 7,515,370 |
SunOpta, Inc. * | 212,274 | 1,390,395 |
TreeHouse Foods, Inc. * | 115,045 | 4,319,940 |
Turning Point Brands, Inc. | 38,674 | 1,115,358 |
Universal Corp. | 54,705 | 2,813,478 |
Utz Brands, Inc. | 163,368 | 2,945,525 |
Vector Group Ltd. | 329,891 | 3,414,372 |
Vita Coco Co., Inc. * | 85,591 | 2,074,726 |
Vital Farms, Inc. * | 70,363 | 1,882,914 |
Westrock Coffee Co. *(a) | 65,109 | 660,205 |
Zevia PBC, Class A * | 56,995 | 49,067 |
83,436,264 | ||
Health Care Equipment & Services 5.5% | ||
23andMe Holding Co., Class A * | 705,420 | 354,262 |
Accolade, Inc. * | 156,818 | 1,196,521 |
Accuray, Inc. * | 211,089 | 449,620 |
AdaptHealth Corp., Class A * | 217,000 | 2,137,450 |
Addus HomeCare Corp. * | 35,513 | 3,414,575 |
Agiliti, Inc. * | 68,046 | 690,667 |
AirSculpt Technologies, Inc. *(a) | 28,965 | 159,597 |
Alignment Healthcare, Inc. * | 191,878 | 988,172 |
Alphatec Holdings, Inc. * | 209,145 | 2,639,410 |
American Well Corp., Class A * | 568,020 | 289,974 |
AMN Healthcare Services, Inc. * | 86,757 | 5,203,685 |
AngioDynamics, Inc. * | 84,825 | 491,137 |
Artivion, Inc. * | 89,833 | 1,762,523 |
Astrana Health, Inc. * | 98,328 | 3,652,885 |
AtriCure, Inc. * | 106,030 | 2,557,444 |
Atrion Corp. | 3,094 | 1,309,659 |
Avanos Medical, Inc. * | 104,664 | 1,892,325 |
Aveanna Healthcare Holdings, Inc. * | 116,553 | 262,244 |
Axogen, Inc. * | 93,348 | 598,361 |
Axonics, Inc. * | 112,848 | 7,512,291 |
Beyond Air, Inc. *(a) | 58,597 | 63,285 |
BrightSpring Health Services, Inc. * | 122,342 | 1,307,836 |
Brookdale Senior Living, Inc. * | 422,395 | 2,868,062 |
Butterfly Network, Inc. *(a) | 320,332 | 248,610 |
CareMax, Inc. * | 5,726 | 20,442 |
Castle Biosciences, Inc. * | 56,942 | 1,200,907 |
Cerus Corp. * | 399,731 | 667,551 |
ClearPoint Neuro, Inc. * | 52,401 | 284,537 |
Community Health Systems, Inc. * | 283,193 | 934,537 |
CONMED Corp. | 69,772 | 4,743,101 |
CorVel Corp. * | 19,860 | 4,743,561 |
Cross Country Healthcare, Inc. * | 76,091 | 1,339,202 |
Cutera, Inc. *(a) | 42,386 | 102,574 |
CVRx, Inc. * | 25,423 | 394,311 |
Definitive Healthcare Corp., Class A * | 109,514 | 760,027 |
DocGo, Inc. * | 178,658 | 603,864 |
Embecta Corp. | 130,425 | 1,321,205 |
Enhabit, Inc. * | 113,837 | 1,148,615 |
Ensign Group, Inc. | 123,836 | 14,657,229 |
SECURITY | NUMBER OF SHARES | VALUE ($) |
Evolent Health, Inc., Class A * | 254,968 | 7,072,812 |
Fulgent Genetics, Inc. * | 45,939 | 934,859 |
Glaukos Corp. * | 107,785 | 10,347,360 |
Guardant Health, Inc. * | 257,235 | 4,630,230 |
Haemonetics Corp. * | 114,039 | 10,485,886 |
Health Catalyst, Inc. * | 128,532 | 799,469 |
HealthEquity, Inc. * | 193,156 | 15,241,940 |
HealthStream, Inc. | 55,254 | 1,423,896 |
Hims & Hers Health, Inc. * | 280,538 | 3,515,141 |
Inari Medical, Inc. * | 121,777 | 4,547,153 |
InfuSystem Holdings, Inc. * | 41,516 | 311,785 |
Inmode Ltd. * | 175,932 | 3,024,271 |
Innovage Holding Corp. * | 43,240 | 153,502 |
Inogen, Inc. * | 53,386 | 363,025 |
Integer Holdings Corp. * | 75,313 | 8,407,190 |
iRadimed Corp. | 16,495 | 669,862 |
iRhythm Technologies, Inc. * | 69,604 | 7,627,206 |
Joint Corp. * | 32,546 | 388,599 |
KORU Medical Systems, Inc. * | 79,915 | 173,416 |
Lantheus Holdings, Inc. * | 154,684 | 10,292,673 |
LeMaitre Vascular, Inc. | 44,835 | 2,905,308 |
LifeStance Health Group, Inc. * | 239,364 | 1,479,270 |
LivaNova PLC * | 123,161 | 6,866,226 |
Merit Medical Systems, Inc. * | 128,921 | 9,553,046 |
ModivCare, Inc. * | 28,460 | 667,956 |
Multiplan Corp. * | 852,432 | 553,910 |
Nano-X Imaging Ltd. *(a) | 107,095 | 959,571 |
National HealthCare Corp. | 28,286 | 2,570,349 |
National Research Corp. | 32,471 | 1,112,132 |
Neogen Corp. * | 494,907 | 6,102,203 |
NeoGenomics, Inc. * | 288,603 | 4,017,354 |
Nevro Corp. * | 82,291 | 870,639 |
OmniAb, Inc., Class A *(c) | 12,825 | 0 |
OmniAb, Inc., Class B *(c) | 12,825 | 0 |
Omnicell, Inc. * | 101,945 | 2,733,145 |
OPKO Health, Inc. *(a) | 924,952 | 1,128,441 |
OptimizeRx Corp. * | 36,146 | 368,689 |
Option Care Health, Inc. * | 380,830 | 11,383,009 |
OraSure Technologies, Inc. * | 161,837 | 856,118 |
Orchestra BioMed Holdings, Inc. *(a) | 33,684 | 148,546 |
Orthofix Medical, Inc. * | 79,172 | 1,029,236 |
OrthoPediatrics Corp. * | 35,594 | 1,054,650 |
Outset Medical, Inc. * | 113,729 | 287,734 |
Owens & Minor, Inc. * | 168,202 | 4,161,318 |
P3 Health Partners, Inc. *(a) | 91,086 | 48,931 |
Paragon 28, Inc. * | 98,499 | 908,161 |
Patterson Cos., Inc. | 190,190 | 4,844,139 |
Pediatrix Medical Group, Inc. * | 191,830 | 1,701,532 |
Pennant Group, Inc. * | 64,667 | 1,352,187 |
PetIQ, Inc., Class A * | 62,187 | 1,014,892 |
Phreesia, Inc. * | 120,207 | 2,493,093 |
Privia Health Group, Inc. * | 254,933 | 4,690,767 |
PROCEPT BioRobotics Corp. * | 91,419 | 4,843,379 |
Progyny, Inc. * | 180,497 | 5,786,734 |
Pulmonx Corp. * | 84,365 | 642,018 |
Pulse Biosciences, Inc. *(a) | 36,922 | 272,115 |
Quipt Home Medical Corp. * | 90,817 | 326,941 |
RadNet, Inc. * | 136,744 | 6,632,084 |
RxSight, Inc. * | 64,432 | 3,358,840 |
Sanara Medtech, Inc. * | 8,678 | 276,308 |
Schrodinger, Inc. * | 123,599 | 3,013,344 |
Select Medical Holdings Corp. | 236,028 | 6,696,114 |
Semler Scientific, Inc. * | 10,622 | 271,180 |
Sharecare, Inc. * | 678,098 | 485,450 |
SI-BONE, Inc. * | 90,219 | 1,286,523 |
Sight Sciences, Inc. * | 49,804 | 276,412 |
Silk Road Medical, Inc. * | 86,550 | 1,682,532 |
Simulations Plus, Inc. | 35,912 | 1,628,609 |
SECURITY | NUMBER OF SHARES | VALUE ($) |
STAAR Surgical Co. * | 111,243 | 5,112,728 |
Surgery Partners, Inc. * | 171,163 | 4,270,517 |
Surmodics, Inc. * | 31,610 | 812,061 |
Tactile Systems Technology, Inc. * | 54,396 | 749,033 |
Tela Bio, Inc. * | 36,312 | 163,586 |
TransMedics Group, Inc. * | 72,094 | 6,786,208 |
Treace Medical Concepts, Inc. * | 102,020 | 1,057,947 |
TruBridge, Inc. * | 32,648 | 257,919 |
U.S. Physical Therapy, Inc. | 33,772 | 3,428,196 |
UFP Technologies, Inc. * | 16,053 | 3,305,955 |
Utah Medical Products, Inc. | 7,826 | 518,081 |
Varex Imaging Corp. * | 89,086 | 1,447,648 |
Vicarious Surgical, Inc. * | 260,655 | 73,140 |
Viemed Healthcare, Inc. * | 78,880 | 646,027 |
Zimvie, Inc. * | 59,043 | 897,454 |
Zynex, Inc. *(a) | 42,088 | 461,705 |
310,711,873 | ||
Household & Personal Products 1.2% | ||
Beauty Health Co. * | 180,895 | 584,291 |
BellRing Brands, Inc. * | 299,633 | 16,530,753 |
Central Garden & Pet Co. * | 21,713 | 889,147 |
Central Garden & Pet Co., Class A * | 117,032 | 4,146,444 |
Edgewell Personal Care Co. | 112,957 | 4,249,442 |
elf Beauty, Inc. * | 122,564 | 19,920,327 |
Energizer Holdings, Inc. | 163,311 | 4,690,292 |
Herbalife Ltd. * | 225,478 | 1,950,385 |
Inter Parfums, Inc. | 41,754 | 4,859,330 |
Medifast, Inc. | 24,515 | 674,898 |
Nature's Sunshine Products, Inc. * | 30,185 | 587,098 |
Nu Skin Enterprises, Inc., Class A | 113,767 | 1,337,900 |
Oil-Dri Corp. of America | 11,207 | 776,085 |
USANA Health Sciences, Inc. * | 25,633 | 1,064,282 |
Waldencast PLC, Class A *(a) | 63,202 | 307,794 |
WD-40 Co. | 30,838 | 6,973,397 |
69,541,865 | ||
Insurance 1.9% | ||
Ambac Financial Group, Inc. * | 101,497 | 1,466,632 |
American Coastal Insurance Corp., Class C * | 44,838 | 469,454 |
American Equity Investment Life Holding Co. | 178,800 | 10,032,468 |
AMERISAFE, Inc. | 43,276 | 1,973,386 |
BRP Group, Inc., Class A * | 136,556 | 3,637,852 |
CNO Financial Group, Inc. | 254,376 | 6,697,720 |
Crawford & Co., Class A | 33,123 | 307,381 |
Donegal Group, Inc., Class A | 36,221 | 486,810 |
eHealth, Inc. * | 62,445 | 267,265 |
Employers Holdings, Inc. | 58,053 | 2,472,477 |
Enstar Group Ltd. * | 27,080 | 7,863,220 |
F&G Annuities & Life, Inc. | 42,447 | 1,605,346 |
Fidelis Insurance Holdings Ltd. (a) | 137,444 | 2,553,710 |
Genworth Financial, Inc., Class A * | 1,022,625 | 6,064,166 |
GoHealth, Inc., Class A * | 8,961 | 90,237 |
Goosehead Insurance, Inc., Class A * | 48,973 | 2,787,053 |
Greenlight Capital Re Ltd., Class A * | 58,940 | 714,353 |
Hamilton Insurance Group Ltd., Class B * | 37,837 | 513,826 |
HCI Group, Inc. | 16,535 | 1,887,966 |
Hippo Holdings, Inc. * | 23,956 | 512,419 |
Horace Mann Educators Corp. | 93,204 | 3,435,499 |
Investors Title Co. | 2,791 | 447,760 |
James River Group Holdings Ltd. | 84,640 | 752,450 |
Kingsway Financial Services, Inc. * | 24,339 | 216,617 |
Lemonade, Inc. * | 115,584 | 1,991,512 |
Maiden Holdings Ltd. * | 207,487 | 431,573 |
SECURITY | NUMBER OF SHARES | VALUE ($) |
MBIA, Inc. * | 101,313 | 637,259 |
Mercury General Corp. | 60,797 | 3,177,251 |
National Western Life Group, Inc., Class A | 5,161 | 2,522,800 |
NI Holdings, Inc. * | 18,872 | 280,627 |
Oscar Health, Inc., Class A * | 366,142 | 6,359,887 |
Palomar Holdings, Inc. * | 55,254 | 4,346,832 |
ProAssurance Corp. * | 115,765 | 1,546,620 |
Safety Insurance Group, Inc. | 32,563 | 2,591,038 |
Selective Insurance Group, Inc. | 136,765 | 13,902,162 |
Selectquote, Inc. * | 311,916 | 470,993 |
SiriusPoint Ltd. * | 161,516 | 1,902,659 |
Skyward Specialty Insurance Group, Inc. * | 67,536 | 2,358,357 |
Stewart Information Services Corp. | 60,682 | 3,762,891 |
Tiptree, Inc. | 55,036 | 876,724 |
Trupanion, Inc. *(a) | 89,840 | 2,021,400 |
United Fire Group, Inc. | 47,437 | 1,047,883 |
Universal Insurance Holdings, Inc. | 55,845 | 1,090,094 |
108,574,629 | ||
Materials 4.8% | ||
5E Advanced Materials, Inc. *(a) | 89,888 | 103,371 |
AdvanSix, Inc. | 58,968 | 1,489,532 |
Alpha Metallurgical Resources, Inc. | 26,202 | 8,571,198 |
American Vanguard Corp. | 59,806 | 681,190 |
Arcadium Lithium PLC * | 2,321,042 | 10,212,585 |
Arch Resources, Inc. | 40,891 | 6,492,673 |
Aspen Aerogels, Inc. * | 115,271 | 1,805,144 |
ATI, Inc. * | 292,940 | 17,488,518 |
Avient Corp. | 205,159 | 8,702,845 |
Balchem Corp. | 72,732 | 10,282,850 |
Cabot Corp. | 123,619 | 11,277,761 |
Caledonia Mining Corp. PLC | 38,017 | 372,947 |
Carpenter Technology Corp. | 110,999 | 9,512,614 |
Century Aluminum Co. * | 119,598 | 2,075,025 |
Clearwater Paper Corp. * | 36,891 | 1,661,571 |
Coeur Mining, Inc. * | 812,015 | 3,670,308 |
Commercial Metals Co. | 266,105 | 14,300,483 |
Compass Minerals International, Inc. | 77,054 | 959,322 |
Constellium SE, Class A * | 292,697 | 5,763,204 |
Contango ORE, Inc. * | 17,346 | 362,011 |
Core Molding Technologies, Inc. * | 16,179 | 291,546 |
Dakota Gold Corp. * | 140,374 | 373,395 |
Danimer Scientific, Inc. *(a) | 200,587 | 150,440 |
Ecovyst, Inc. * | 209,332 | 1,974,001 |
Glatfelter Corp. * | 102,934 | 147,196 |
Greif, Inc., Class A | 67,216 | 4,118,996 |
Hawkins, Inc. | 43,890 | 3,325,545 |
Haynes International, Inc. | 28,950 | 1,741,343 |
HB Fuller Co. | 122,732 | 9,169,308 |
Hecla Mining Co. | 1,387,317 | 6,562,009 |
i-80 Gold Corp. * | 444,218 | 524,177 |
Ingevity Corp. * | 82,873 | 4,238,125 |
Innospec, Inc. | 56,649 | 6,797,880 |
Intrepid Potash, Inc. * | 24,005 | 482,981 |
Ivanhoe Electric, Inc. * | 145,572 | 1,470,277 |
Kaiser Aluminum Corp. | 36,154 | 3,271,575 |
Knife River Corp. * | 128,687 | 10,062,037 |
Koppers Holdings, Inc. | 45,755 | 2,346,316 |
Kronos Worldwide, Inc. | 50,645 | 579,885 |
LSB Industries, Inc. * | 123,398 | 1,147,601 |
Materion Corp. | 46,707 | 5,368,503 |
Mativ Holdings, Inc. | 121,825 | 2,224,525 |
Metallus, Inc. * | 96,971 | 1,993,724 |
Minerals Technologies, Inc. | 74,058 | 5,398,088 |
Myers Industries, Inc. | 83,666 | 1,832,285 |
SECURITY | NUMBER OF SHARES | VALUE ($) |
NioCorp Developments Ltd. *(a) | 4,462 | 9,058 |
Novagold Resources, Inc. * | 549,011 | 1,592,132 |
O-I Glass, Inc. * | 353,435 | 5,287,388 |
Olympic Steel, Inc. | 22,428 | 1,425,748 |
Origin Materials, Inc. * | 270,638 | 219,081 |
Orion SA | 125,367 | 2,966,183 |
Pactiv Evergreen, Inc. | 91,898 | 1,400,526 |
Perimeter Solutions SA * | 341,808 | 2,392,656 |
Perpetua Resources Corp. * | 86,353 | 471,487 |
Piedmont Lithium, Inc. * | 41,118 | 503,696 |
PureCycle Technologies, Inc. *(a) | 266,319 | 1,243,710 |
Quaker Chemical Corp. | 31,562 | 5,887,260 |
Radius Recycling, Inc., Class A | 59,670 | 1,039,451 |
Ramaco Resources, Inc., Class A | 50,300 | 788,704 |
Ramaco Resources, Inc., Class B | 10,643 | 118,244 |
Ranpak Holdings Corp., Class A * | 97,831 | 708,296 |
Rayonier Advanced Materials, Inc. * | 146,630 | 546,930 |
Ryerson Holding Corp. | 63,663 | 1,817,579 |
Sensient Technologies Corp. | 95,605 | 7,000,198 |
Stepan Co. | 48,288 | 4,007,421 |
Summit Materials, Inc., Class A * | 271,590 | 10,564,851 |
SunCoke Energy, Inc. | 191,191 | 1,971,179 |
Sylvamo Corp. | 81,554 | 5,097,125 |
Tredegar Corp. | 60,362 | 385,110 |
TriMas Corp. | 94,067 | 2,444,801 |
Trinseo PLC | 80,925 | 211,214 |
Tronox Holdings PLC | 265,272 | 4,506,971 |
U.S. Lime & Minerals, Inc. | 4,684 | 1,452,040 |
Valhi, Inc. | 5,287 | 78,089 |
Warrior Met Coal, Inc. | 117,404 | 8,024,563 |
Worthington Steel, Inc. | 69,751 | 2,147,633 |
267,686,234 | ||
Media & Entertainment 1.7% | ||
Advantage Solutions, Inc. * | 199,682 | 850,645 |
AMC Networks, Inc., Class A * | 69,022 | 733,014 |
Atlanta Braves Holdings, Inc., Class C * | 128,247 | 4,800,285 |
Boston Omaha Corp., Class A * | 53,525 | 826,426 |
Bumble, Inc., Class A * | 229,561 | 2,318,566 |
Cardlytics, Inc. * | 83,036 | 1,017,191 |
Cargurus, Inc. * | 217,167 | 4,877,571 |
Cars.com, Inc. * | 150,998 | 2,523,177 |
Cinemark Holdings, Inc. * | 249,037 | 4,268,494 |
Clear Channel Outdoor Holdings, Inc. * | 848,448 | 1,179,343 |
DHI Group, Inc. * | 101,283 | 237,002 |
EchoStar Corp., Class A * | 276,034 | 4,413,784 |
Emerald Holding, Inc. * | 35,666 | 205,079 |
Entravision Communications Corp., Class A | 138,513 | 289,492 |
Eventbrite, Inc., Class A * | 176,254 | 930,621 |
EverQuote, Inc., Class A * | 49,011 | 988,552 |
EW Scripps Co., Class A * | 132,446 | 497,997 |
fuboTV, Inc. * | 635,608 | 902,563 |
Gambling.com Group Ltd. * | 35,321 | 305,527 |
Gannett Co., Inc. * | 325,497 | 787,703 |
Gray Television, Inc. | 191,057 | 1,098,578 |
Grindr, Inc. * | 94,284 | 923,040 |
iHeartMedia, Inc., Class A * | 233,933 | 491,259 |
IMAX Corp. * | 101,659 | 1,627,561 |
Integral Ad Science Holding Corp. * | 152,805 | 1,465,400 |
John Wiley & Sons, Inc., Class A | 81,682 | 3,068,793 |
Lions Gate Entertainment Corp., Class A * | 386,559 | 3,900,380 |
Loop Media, Inc. * | 83,321 | 25,588 |
Madison Square Garden Entertainment Corp., Class A * | 90,149 | 3,529,333 |
Magnite, Inc. * | 307,714 | 2,717,115 |
SECURITY | NUMBER OF SHARES | VALUE ($) |
Marcus Corp. | 55,333 | 721,542 |
MediaAlpha, Inc., Class A * | 52,514 | 1,063,408 |
Nextdoor Holdings, Inc. * | 344,665 | 703,117 |
Outbrain, Inc. * | 93,813 | 379,943 |
Playstudios, Inc. * | 194,082 | 419,217 |
PubMatic, Inc., Class A * | 94,617 | 2,123,205 |
QuinStreet, Inc. * | 119,430 | 2,160,489 |
Reservoir Media, Inc. * | 45,337 | 405,766 |
Scholastic Corp. | 58,372 | 2,079,211 |
Shutterstock, Inc. | 56,058 | 2,394,237 |
Sinclair, Inc. | 75,799 | 932,328 |
Sphere Entertainment Co. * | 60,387 | 2,346,639 |
Stagwell, Inc., Class A * | 188,403 | 1,120,998 |
System1, Inc. * | 80,049 | 136,884 |
TechTarget, Inc. * | 58,751 | 1,615,652 |
TEGNA, Inc. | 448,649 | 6,119,572 |
Thryv Holdings, Inc. * | 70,155 | 1,614,267 |
Townsquare Media, Inc., Class A | 26,692 | 322,172 |
TrueCar, Inc. * | 197,987 | 522,686 |
Urban One, Inc. * | 23,446 | 36,341 |
Urban One, Inc., Class A * | 24,438 | 48,632 |
Vimeo, Inc. * | 348,077 | 1,249,596 |
Vivid Seats, Inc., Class A * | 169,418 | 891,139 |
WideOpenWest, Inc. * | 117,264 | 418,632 |
Yelp, Inc., Class A * | 151,327 | 6,089,398 |
Ziff Davis, Inc. * | 104,064 | 5,214,647 |
ZipRecruiter, Inc., Class A * | 154,409 | 1,587,325 |
94,517,122 | ||
Pharmaceuticals, Biotechnology & Life Sciences 9.4% | ||
2seventy bio, Inc. * | 116,417 | 530,862 |
4D Molecular Therapeutics, Inc. * | 92,443 | 2,212,161 |
89bio, Inc. * | 179,791 | 1,530,021 |
Aadi Bioscience, Inc. * | 37,075 | 71,184 |
ACADIA Pharmaceuticals, Inc. * | 279,219 | 4,665,749 |
ACELYRIN, Inc. * | 164,696 | 688,429 |
Aclaris Therapeutics, Inc. * | 160,330 | 193,999 |
Acrivon Therapeutics, Inc. * | 27,342 | 248,539 |
Actinium Pharmaceuticals, Inc. * | 63,682 | 490,351 |
Adaptive Biotechnologies Corp. * | 262,202 | 686,969 |
Adicet Bio, Inc. * | 120,076 | 178,913 |
ADMA Biologics, Inc. * | 482,726 | 3,147,374 |
Aerovate Therapeutics, Inc. * | 25,922 | 518,699 |
Agenus, Inc. * | 41,710 | 505,525 |
Agios Pharmaceuticals, Inc. * | 125,878 | 4,091,035 |
Akero Therapeutics, Inc. * | 139,772 | 2,780,065 |
Akoya Biosciences, Inc. *(a) | 51,893 | 198,231 |
Aldeyra Therapeutics, Inc. * | 106,476 | 419,515 |
Alector, Inc. * | 164,054 | 833,394 |
Alkermes PLC * | 376,123 | 9,230,058 |
Allakos, Inc. * | 151,975 | 159,574 |
Allogene Therapeutics, Inc. * | 212,263 | 585,846 |
Allovir, Inc. * | 118,150 | 93,858 |
Alpine Immune Sciences, Inc. * | 87,110 | 5,626,435 |
Altimmune, Inc. * | 122,309 | 801,124 |
ALX Oncology Holdings, Inc. *(a) | 59,761 | 1,017,132 |
Amicus Therapeutics, Inc. * | 658,426 | 6,577,676 |
Amneal Pharmaceuticals, Inc. * | 279,256 | 1,689,499 |
Amphastar Pharmaceuticals, Inc. * | 85,661 | 3,533,516 |
Amylyx Pharmaceuticals, Inc. * | 116,593 | 211,033 |
AnaptysBio, Inc. * | 42,229 | 1,027,854 |
Anavex Life Sciences Corp. *(a) | 168,121 | 613,642 |
ANI Pharmaceuticals, Inc. * | 33,343 | 2,200,638 |
Anika Therapeutics, Inc. * | 33,543 | 868,428 |
Annexon, Inc. * | 152,719 | 694,871 |
Apogee Therapeutics, Inc. * | 94,104 | 4,733,431 |
Arbutus Biopharma Corp. * | 288,534 | 787,698 |
SECURITY | NUMBER OF SHARES | VALUE ($) |
Arcellx, Inc. * | 87,254 | 4,364,445 |
Arcturus Therapeutics Holdings, Inc. * | 52,593 | 1,344,803 |
Arcus Biosciences, Inc. * | 121,518 | 1,850,719 |
Arcutis Biotherapeutics, Inc. * | 181,133 | 1,507,027 |
Ardelyx, Inc. * | 522,919 | 3,346,682 |
ArriVent Biopharma, Inc. * | 22,256 | 367,669 |
Arrowhead Pharmaceuticals, Inc. * | 263,628 | 5,963,265 |
ARS Pharmaceuticals, Inc. * | 55,441 | 482,337 |
Arvinas, Inc. * | 114,199 | 3,628,102 |
Assertio Holdings, Inc. * | 204,683 | 181,165 |
Astria Therapeutics, Inc. * | 113,008 | 1,037,413 |
Atara Biotherapeutics, Inc. * | 235,645 | 162,595 |
Atea Pharmaceuticals, Inc. * | 173,792 | 643,030 |
Aura Biosciences, Inc. * | 80,882 | 598,527 |
Aurinia Pharmaceuticals, Inc. * | 310,029 | 1,578,048 |
Avid Bioservices, Inc. * | 143,075 | 1,091,662 |
Avidity Biosciences, Inc. * | 167,529 | 4,042,475 |
Avita Medical, Inc. * | 57,246 | 480,866 |
Axsome Therapeutics, Inc. * | 80,977 | 5,972,864 |
Beam Therapeutics, Inc. * | 169,919 | 3,605,681 |
BioAtla, Inc. * | 101,115 | 228,014 |
BioCryst Pharmaceuticals, Inc. * | 429,424 | 1,773,521 |
Biohaven Ltd. * | 155,313 | 6,026,144 |
BioLife Solutions, Inc. * | 80,247 | 1,407,532 |
Biomea Fusion, Inc. *(a) | 44,232 | 475,052 |
Biote Corp., Class A * | 32,001 | 176,326 |
BioVie, Inc., Class A * | 29,935 | 14,668 |
Bioxcel Therapeutics, Inc. *(a) | 49,908 | 125,768 |
Bluebird Bio, Inc. * | 434,109 | 385,098 |
Blueprint Medicines Corp. * | 138,042 | 12,608,756 |
Bridgebio Pharma, Inc. * | 264,760 | 6,783,151 |
Bright Green Corp. * | 137,897 | 34,598 |
Cabaletta Bio, Inc. * | 79,079 | 841,796 |
Cara Therapeutics, Inc. * | 107,050 | 80,491 |
CareDx, Inc. * | 117,016 | 908,044 |
Cargo Therapeutics, Inc. *(a) | 48,745 | 931,029 |
Caribou Biosciences, Inc. * | 183,381 | 665,673 |
Carisma Therapeutics, Inc. *(a) | 60,952 | 99,352 |
Cartesian Therapeutics, Inc. *(a) | 8,850 | 195,328 |
Cassava Sciences, Inc. *(a) | 91,379 | 2,024,045 |
Catalyst Pharmaceuticals, Inc. * | 252,520 | 3,800,426 |
Celcuity, Inc. * | 41,824 | 659,564 |
Celldex Therapeutics, Inc. * | 141,281 | 5,286,735 |
Century Therapeutics, Inc. * | 53,526 | 155,761 |
Cerevel Therapeutics Holdings, Inc. * | 162,495 | 6,940,161 |
CG oncology, Inc. * | 52,730 | 2,119,219 |
Citius Pharmaceuticals, Inc. * | 309,894 | 231,274 |
Codexis, Inc. * | 158,691 | 461,791 |
Cogent Biosciences, Inc. * | 188,940 | 1,228,110 |
Coherus Biosciences, Inc. * | 243,185 | 476,643 |
Collegium Pharmaceutical, Inc. * | 74,186 | 2,739,689 |
Compass Therapeutics, Inc. * | 216,166 | 311,279 |
Corcept Therapeutics, Inc. * | 185,422 | 4,324,041 |
CorMedix, Inc. *(a) | 127,039 | 667,590 |
Crinetics Pharmaceuticals, Inc. * | 149,712 | 6,560,380 |
CryoPort, Inc. * | 98,207 | 1,589,971 |
Cue Biopharma, Inc. * | 74,459 | 141,472 |
Cullinan Therapeutics, Inc. * | 57,951 | 1,565,257 |
Cytek Biosciences, Inc. * | 273,935 | 1,646,349 |
Cytokinetics, Inc. * | 216,838 | 13,296,506 |
Day One Biopharmaceuticals, Inc. * | 142,887 | 2,443,368 |
Deciphera Pharmaceuticals, Inc. * | 121,274 | 3,064,594 |
Denali Therapeutics, Inc. * | 271,832 | 4,197,086 |
Design Therapeutics, Inc. * | 74,915 | 263,701 |
Disc Medicine, Inc. * | 21,365 | 594,802 |
Dynavax Technologies Corp. * | 293,722 | 3,339,619 |
Dyne Therapeutics, Inc. * | 134,091 | 3,393,843 |
Eagle Pharmaceuticals, Inc. * | 23,660 | 96,769 |
SECURITY | NUMBER OF SHARES | VALUE ($) |
Edgewise Therapeutics, Inc. * | 130,673 | 2,344,274 |
Editas Medicine, Inc. * | 185,003 | 963,866 |
Emergent BioSolutions, Inc. *(b) | 115,644 | 217,411 |
Enanta Pharmaceuticals, Inc. * | 46,447 | 638,182 |
Enliven Therapeutics, Inc. *(a) | 53,393 | 928,504 |
Entrada Therapeutics, Inc. * | 47,973 | 568,480 |
Erasca, Inc. * | 184,468 | 370,781 |
Evolus, Inc. * | 95,577 | 1,124,941 |
Eyenovia, Inc. *(a) | 63,574 | 47,744 |
EyePoint Pharmaceuticals, Inc. * | 84,704 | 1,490,790 |
Fate Therapeutics, Inc. * | 193,069 | 762,623 |
Fennec Pharmaceuticals, Inc. * | 41,497 | 380,942 |
FibroGen, Inc. * | 209,142 | 234,239 |
Foghorn Therapeutics, Inc. * | 46,468 | 253,715 |
Genelux Corp. *(a) | 42,791 | 133,080 |
Generation Bio Co. * | 103,517 | 292,953 |
Geron Corp. * | 1,160,284 | 4,559,916 |
Gritstone bio, Inc. * | 200,640 | 160,512 |
Halozyme Therapeutics, Inc. * | 294,910 | 11,236,071 |
Harmony Biosciences Holdings, Inc. * | 73,651 | 2,276,552 |
Harrow, Inc. * | 69,252 | 705,678 |
Harvard Bioscience, Inc. * | 88,966 | 339,850 |
Heron Therapeutics, Inc. * | 236,703 | 549,151 |
HilleVax, Inc. * | 59,000 | 778,800 |
Humacyte, Inc. * | 139,698 | 547,616 |
Ideaya Biosciences, Inc. * | 149,456 | 6,075,386 |
IGM Biosciences, Inc. *(a) | 29,613 | 285,173 |
Ikena Oncology, Inc. * | 73,880 | 97,522 |
Immuneering Corp., Class A * | 51,835 | 73,606 |
ImmunityBio, Inc. *(a) | 300,628 | 2,402,018 |
Immunovant, Inc. * | 122,349 | 3,357,257 |
Inhibrx, Inc. * | 77,891 | 2,651,410 |
Innoviva, Inc. * | 132,373 | 2,000,156 |
Inozyme Pharma, Inc. * | 105,656 | 465,943 |
Insmed, Inc. * | 313,531 | 7,750,486 |
Intellia Therapeutics, Inc. * | 204,080 | 4,367,312 |
Intra-Cellular Therapies, Inc. * | 227,853 | 16,362,124 |
Iovance Biotherapeutics, Inc. * | 538,650 | 6,345,297 |
Ironwood Pharmaceuticals, Inc., Class A * | 314,483 | 2,437,243 |
iTeos Therapeutics, Inc. * | 56,509 | 606,907 |
Janux Therapeutics, Inc. * | 39,368 | 2,243,976 |
KalVista Pharmaceuticals, Inc. * | 71,727 | 814,101 |
Karyopharm Therapeutics, Inc. * | 258,909 | 266,676 |
Keros Therapeutics, Inc. * | 58,255 | 3,284,999 |
Kezar Life Sciences, Inc. * | 163,132 | 134,502 |
Kiniksa Pharmaceuticals Ltd., Class A * | 72,960 | 1,365,811 |
Kodiak Sciences, Inc. * | 74,143 | 237,999 |
Krystal Biotech, Inc. * | 49,021 | 7,506,096 |
Kura Oncology, Inc. * | 160,213 | 3,143,379 |
Kymera Therapeutics, Inc. * | 92,536 | 3,111,060 |
Larimar Therapeutics, Inc. * | 58,339 | 401,956 |
LENZ Therapeutics, Inc. | 9,149 | 145,195 |
Lexeo Therapeutics, Inc. * | 23,161 | 288,354 |
Lexicon Pharmaceuticals, Inc. *(a) | 208,977 | 321,825 |
Ligand Pharmaceuticals, Inc. * | 38,220 | 2,671,196 |
Lineage Cell Therapeutics, Inc. * | 297,769 | 324,568 |
Liquidia Corp. * | 114,252 | 1,468,138 |
Longboard Pharmaceuticals, Inc. * | 56,477 | 1,202,960 |
Lyell Immunopharma, Inc. * | 399,765 | 867,490 |
MacroGenics, Inc. * | 138,324 | 2,044,429 |
Madrigal Pharmaceuticals, Inc. * | 33,567 | 6,848,339 |
MannKind Corp. * | 590,502 | 2,426,963 |
Marinus Pharmaceuticals, Inc. * | 124,166 | 175,074 |
MaxCyte, Inc. * | 198,938 | 722,145 |
MeiraGTx Holdings PLC * | 74,544 | 363,775 |
Merrimack Pharmaceuticals, Inc. * | 23,947 | 352,979 |
Mersana Therapeutics, Inc. * | 251,301 | 796,624 |
SECURITY | NUMBER OF SHARES | VALUE ($) |
Mesa Laboratories, Inc. | 11,640 | 1,234,771 |
MiMedx Group, Inc. * | 261,906 | 1,613,341 |
Mineralys Therapeutics, Inc. * | 45,318 | 555,146 |
Mirum Pharmaceuticals, Inc. * | 56,062 | 1,407,717 |
Monte Rosa Therapeutics, Inc. *(a) | 69,530 | 369,900 |
Morphic Holding, Inc. * | 86,544 | 2,360,055 |
Mural Oncology PLC * | 38,728 | 143,294 |
Myriad Genetics, Inc. * | 198,698 | 3,888,520 |
Nautilus Biotechnology, Inc. * | 114,098 | 289,809 |
Neumora Therapeutics, Inc. *(a) | 32,558 | 295,952 |
Nkarta, Inc. * | 69,109 | 461,648 |
Novavax, Inc. *(a) | 257,028 | 1,112,931 |
Nurix Therapeutics, Inc. * | 107,156 | 1,288,015 |
Nuvalent, Inc., Class A * | 60,169 | 4,144,441 |
Nuvation Bio, Inc. * | 332,937 | 995,482 |
Nuvectis Pharma, Inc. *(a) | 17,590 | 106,947 |
Ocean Biomedical, Inc. * | 19,835 | 27,769 |
Ocular Therapeutix, Inc. * | 262,607 | 1,244,757 |
Olema Pharmaceuticals, Inc. * | 60,729 | 617,614 |
Omega Therapeutics, Inc. *(a) | 55,712 | 124,238 |
Omeros Corp. *(a) | 139,171 | 438,389 |
OmniAb, Inc. * | 213,690 | 948,784 |
Optinose, Inc. * | 166,635 | 136,807 |
Organogenesis Holdings, Inc., Class A * | 160,584 | 377,372 |
ORIC Pharmaceuticals, Inc. * | 87,891 | 776,078 |
Outlook Therapeutics, Inc. * | 17,730 | 158,152 |
Ovid therapeutics, Inc. * | 135,487 | 413,235 |
Pacific Biosciences of California, Inc. * | 572,148 | 944,044 |
Pacira BioSciences, Inc. * | 103,459 | 2,715,799 |
PDS Biotechnology Corp. *(a) | 63,925 | 214,149 |
PepGen, Inc. * | 22,976 | 282,145 |
Phathom Pharmaceuticals, Inc. * | 74,192 | 669,954 |
Phibro Animal Health Corp., Class A | 46,720 | 780,224 |
Pliant Therapeutics, Inc. * | 129,245 | 1,527,676 |
PMV Pharmaceuticals, Inc. * | 88,482 | 159,268 |
Poseida Therapeutics, Inc., Class A * | 155,344 | 375,932 |
Precigen, Inc. * | 309,642 | 408,727 |
Prelude Therapeutics, Inc. * | 33,475 | 126,201 |
Prestige Consumer Healthcare, Inc. * | 113,037 | 8,111,535 |
Prime Medicine, Inc. *(a) | 87,329 | 429,659 |
ProKidney Corp. *(a) | 103,938 | 214,632 |
Protagonist Therapeutics, Inc. * | 129,530 | 3,252,498 |
Protalix BioTherapeutics, Inc. * | 153,561 | 175,060 |
Prothena Corp. PLC * | 95,740 | 1,947,352 |
PTC Therapeutics, Inc. * | 163,131 | 5,244,662 |
Quanterix Corp. * | 80,208 | 1,292,953 |
Quantum-Si, Inc. * | 229,457 | 369,426 |
Rallybio Corp. * | 69,890 | 134,189 |
RAPT Therapeutics, Inc. * | 68,425 | 526,873 |
Recursion Pharmaceuticals, Inc., Class A *(a) | 317,072 | 2,479,503 |
REGENXBIO, Inc. * | 92,557 | 1,420,750 |
Relay Therapeutics, Inc. * | 215,065 | 1,402,224 |
Reneo Pharmaceuticals, Inc. * | 30,078 | 50,230 |
Replimune Group, Inc. * | 110,786 | 703,491 |
Revance Therapeutics, Inc. * | 197,529 | 713,080 |
REVOLUTION Medicines, Inc. * | 316,759 | 11,808,776 |
Rhythm Pharmaceuticals, Inc. * | 121,541 | 4,832,470 |
Rigel Pharmaceuticals, Inc. * | 391,223 | 410,784 |
Rocket Pharmaceuticals, Inc. * | 142,296 | 3,062,210 |
Sage Therapeutics, Inc. * | 120,061 | 1,673,650 |
Sagimet Biosciences, Inc., Class A * | 51,869 | 202,289 |
Sana Biotechnology, Inc. * | 217,089 | 1,953,801 |
Sangamo Therapeutics, Inc. * | 334,204 | 172,082 |
Savara, Inc. * | 202,527 | 927,574 |
Scholar Rock Holding Corp. * | 130,501 | 1,914,450 |
Scilex Holding Co. *(c) | 147,603 | 105,022 |
scPharmaceuticals, Inc. * | 64,751 | 289,437 |
SECURITY | NUMBER OF SHARES | VALUE ($) |
Seer, Inc., Class A * | 134,013 | 278,747 |
Seres Therapeutics, Inc. * | 225,395 | 223,276 |
SIGA Technologies, Inc. | 105,114 | 922,901 |
SpringWorks Therapeutics, Inc. * | 155,427 | 7,256,887 |
Stoke Therapeutics, Inc. * | 63,060 | 695,552 |
Summit Therapeutics, Inc. * | 259,842 | 1,021,179 |
Supernus Pharmaceuticals, Inc. * | 111,514 | 3,356,571 |
Sutro Biopharma, Inc. * | 137,495 | 466,796 |
Syndax Pharmaceuticals, Inc. * | 178,505 | 3,771,811 |
Tango Therapeutics, Inc. * | 102,672 | 790,574 |
Taro Pharmaceutical Industries Ltd. * | 18,686 | 793,781 |
Tarsus Pharmaceuticals, Inc. * | 66,484 | 2,089,592 |
Tenaya Therapeutics, Inc. * | 105,724 | 479,987 |
Terns Pharmaceuticals, Inc. * | 97,966 | 494,728 |
TG Therapeutics, Inc. * | 313,968 | 4,288,803 |
Theravance Biopharma, Inc. * | 110,373 | 931,548 |
Third Harmonic Bio, Inc. * | 44,524 | 495,997 |
Travere Therapeutics, Inc. * | 164,359 | 908,905 |
Trevi Therapeutics, Inc. * | 95,150 | 278,790 |
Turnstone Biologics Corp. * | 34,443 | 89,552 |
Twist Bioscience Corp. * | 130,986 | 4,090,693 |
Tyra Biosciences, Inc. *(a) | 31,103 | 531,861 |
UroGen Pharma Ltd. * | 62,880 | 869,002 |
Vanda Pharmaceuticals, Inc. * | 128,172 | 610,099 |
Vaxcyte, Inc. * | 240,910 | 14,587,100 |
Vaxxinity, Inc., Class A * | 97,417 | 11,953 |
Ventyx Biosciences, Inc. * | 106,353 | 397,760 |
Vera Therapeutics, Inc., Class A * | 90,929 | 3,592,605 |
Veracyte, Inc. * | 165,047 | 3,229,970 |
Vericel Corp. * | 108,317 | 4,968,501 |
Verrica Pharmaceuticals, Inc. *(a) | 47,719 | 332,363 |
Verve Therapeutics, Inc. * | 149,635 | 899,306 |
Vigil Neuroscience, Inc. * | 36,733 | 95,873 |
Viking Therapeutics, Inc. * | 232,404 | 18,494,710 |
Vir Biotechnology, Inc. * | 191,899 | 1,623,466 |
Viridian Therapeutics, Inc. * | 112,848 | 1,496,364 |
Vor BioPharma, Inc. * | 86,126 | 148,137 |
Voyager Therapeutics, Inc. * | 89,224 | 697,732 |
WaVe Life Sciences Ltd. * | 166,748 | 822,068 |
X4 Pharmaceuticals, Inc. * | 281,457 | 315,232 |
Xencor, Inc. * | 131,816 | 2,760,227 |
Xeris Biopharma Holdings, Inc. * | 305,453 | 534,543 |
XOMA Corp. * | 16,717 | 423,609 |
Y-mAbs Therapeutics, Inc. * | 82,932 | 1,261,396 |
Zentalis Pharmaceuticals, Inc. * | 131,696 | 1,456,558 |
Zevra Therapeutics, Inc. * | 80,271 | 367,641 |
Zura Bio Ltd., Class A * | 39,744 | 169,707 |
Zymeworks, Inc. * | 125,491 | 1,076,713 |
529,845,320 | ||
Real Estate Management & Development 0.6% | ||
American Realty Investors, Inc. * | 3,281 | 45,212 |
Anywhere Real Estate, Inc. * | 244,231 | 1,186,963 |
Compass, Inc., Class A * | 645,773 | 2,034,185 |
Cushman & Wakefield PLC * | 376,812 | 3,636,236 |
DigitalBridge Group, Inc. | 367,498 | 6,041,667 |
Douglas Elliman, Inc. * | 176,327 | 239,805 |
eXp World Holdings, Inc. (a) | 161,347 | 1,607,016 |
Forestar Group, Inc. * | 42,100 | 1,304,679 |
FRP Holdings, Inc. * | 30,227 | 916,180 |
Kennedy-Wilson Holdings, Inc. | 271,274 | 2,330,244 |
Marcus & Millichap, Inc. | 54,172 | 1,715,627 |
Maui Land & Pineapple Co., Inc. * | 17,243 | 335,894 |
Newmark Group, Inc., Class A | 308,023 | 2,947,780 |
Opendoor Technologies, Inc. * | 1,289,051 | 2,565,212 |
RE/MAX Holdings, Inc., Class A | 39,978 | 280,646 |
Redfin Corp. * | 253,530 | 1,422,303 |
SECURITY | NUMBER OF SHARES | VALUE ($) |
RMR Group, Inc., Class A | 35,070 | 831,860 |
St. Joe Co. | 78,045 | 4,464,174 |
Star Holdings * | 29,626 | 352,253 |
Stratus Properties, Inc. * | 12,884 | 292,209 |
Tejon Ranch Co. * | 47,715 | 800,658 |
Transcontinental Realty Investors, Inc. * | 2,933 | 84,030 |
35,434,833 | ||
Semiconductors & Semiconductor Equipment 3.1% | ||
ACM Research, Inc., Class A * | 111,523 | 2,846,067 |
Aehr Test Systems * | 61,902 | 741,586 |
Alpha & Omega Semiconductor Ltd. * | 53,423 | 1,168,361 |
Ambarella, Inc. * | 87,387 | 4,017,180 |
Amkor Technology, Inc. | 255,488 | 8,265,037 |
Atomera, Inc. *(a) | 52,430 | 243,275 |
Axcelis Technologies, Inc. * | 73,995 | 7,659,962 |
CEVA, Inc. * | 52,650 | 1,067,216 |
Cohu, Inc. * | 105,906 | 3,211,070 |
Credo Technology Group Holding Ltd. * | 282,765 | 5,053,011 |
Diodes, Inc. * | 102,543 | 7,486,664 |
FormFactor, Inc. * | 175,165 | 7,810,607 |
Ichor Holdings Ltd. * | 65,504 | 2,540,245 |
Impinj, Inc. * | 52,973 | 8,442,837 |
indie Semiconductor, Inc., Class A * | 344,181 | 1,934,297 |
inTEST Corp. * | 27,297 | 307,637 |
Kulicke & Soffa Industries, Inc. | 126,147 | 5,838,083 |
MACOM Technology Solutions Holdings, Inc. * | 125,885 | 12,833,976 |
Maxeon Solar Technologies Ltd. *(a) | 67,876 | 132,358 |
MaxLinear, Inc. * | 172,597 | 3,588,292 |
Navitas Semiconductor Corp., Class A * | 260,457 | 1,127,779 |
NVE Corp. | 10,865 | 884,411 |
Onto Innovation, Inc. * | 111,233 | 20,632,609 |
PDF Solutions, Inc. * | 70,357 | 2,116,339 |
Photronics, Inc. * | 138,464 | 3,795,298 |
Power Integrations, Inc. | 128,909 | 8,600,808 |
Rambus, Inc. * | 244,654 | 13,411,932 |
Semtech Corp. * | 144,843 | 5,448,994 |
Silicon Laboratories, Inc. * | 72,047 | 8,752,990 |
SiTime Corp. * | 40,264 | 3,588,328 |
SkyWater Technology, Inc. * | 41,250 | 423,225 |
SMART Global Holdings, Inc. * | 116,958 | 2,136,823 |
Synaptics, Inc. * | 89,603 | 8,060,686 |
Transphorm, Inc. * | 66,481 | 319,109 |
Ultra Clean Holdings, Inc. * | 100,770 | 4,215,209 |
Veeco Instruments, Inc. * | 115,286 | 4,074,207 |
172,776,508 | ||
Software & Services 6.4% | ||
8x8, Inc. * | 277,657 | 613,622 |
A10 Networks, Inc. | 160,404 | 2,094,876 |
ACI Worldwide, Inc. * | 246,161 | 8,394,090 |
Adeia, Inc. | 242,834 | 2,389,487 |
Agilysys, Inc. * | 45,863 | 3,808,922 |
Alarm.com Holdings, Inc. * | 108,768 | 7,233,072 |
Alkami Technology, Inc. * | 92,714 | 2,231,626 |
Altair Engineering, Inc., Class A * | 124,772 | 10,037,907 |
American Software, Inc., Class A | 72,827 | 736,281 |
Amplitude, Inc., Class A * | 156,696 | 1,534,054 |
Appfolio, Inc., Class A * | 43,685 | 9,906,884 |
Appian Corp., Class A * | 93,147 | 3,487,424 |
Applied Digital Corp. *(a) | 197,846 | 535,173 |
Asana, Inc., Class A * | 188,716 | 2,806,207 |
Aurora Innovation, Inc. * | 809,672 | 2,246,840 |
AvePoint, Inc. * | 335,885 | 2,609,826 |
BigBear.ai Holdings, Inc. *(a) | 118,096 | 196,039 |
SECURITY | NUMBER OF SHARES | VALUE ($) |
BigCommerce Holdings, Inc. * | 154,701 | 875,608 |
Bit Digital, Inc. *(a) | 204,171 | 415,488 |
Blackbaud, Inc. * | 98,842 | 7,701,769 |
BlackLine, Inc. * | 129,240 | 7,502,382 |
Box, Inc., Class A * | 319,822 | 8,321,768 |
Braze, Inc., Class A * | 121,761 | 5,101,786 |
Brightcove, Inc. * | 99,091 | 176,382 |
C3.ai, Inc., Class A *(a) | 186,928 | 4,211,488 |
Cerence, Inc. * | 93,889 | 855,329 |
Cipher Mining, Inc. *(a) | 96,211 | 357,905 |
Cleanspark, Inc. * | 437,372 | 7,164,153 |
Clear Secure, Inc., Class A | 188,469 | 3,292,553 |
CommVault Systems, Inc. * | 100,236 | 10,271,183 |
Consensus Cloud Solutions, Inc. * | 42,837 | 498,623 |
CoreCard Corp. * | 16,551 | 198,281 |
Couchbase, Inc. * | 81,086 | 1,957,416 |
CS Disco, Inc. * | 51,204 | 386,590 |
CXApp, Inc. * | 4,459 | 14,982 |
Daily Journal Corp. * | 3,159 | 1,058,897 |
Digimarc Corp. * | 32,271 | 682,209 |
Digital Turbine, Inc. * | 226,986 | 433,543 |
DigitalOcean Holdings, Inc. * | 139,505 | 4,584,134 |
Domo, Inc., Class B * | 72,712 | 547,521 |
E2open Parent Holdings, Inc. * | 392,846 | 1,905,303 |
eGain Corp. * | 48,556 | 301,533 |
Enfusion, Inc., Class A * | 90,271 | 840,423 |
Envestnet, Inc. * | 113,785 | 7,062,635 |
Everbridge, Inc. * | 93,473 | 3,248,187 |
EverCommerce, Inc. * | 53,324 | 479,916 |
Expensify, Inc., Class A * | 126,263 | 202,021 |
Fastly, Inc., Class A * | 277,454 | 3,509,793 |
Freshworks, Inc., Class A * | 367,943 | 6,567,783 |
Grid Dynamics Holdings, Inc. * | 127,745 | 1,248,069 |
Hackett Group, Inc. | 57,333 | 1,243,553 |
Information Services Group, Inc. | 76,739 | 258,610 |
Instructure Holdings, Inc. * | 44,271 | 846,904 |
Intapp, Inc. * | 90,379 | 2,794,519 |
InterDigital, Inc. | 58,504 | 5,776,100 |
Jamf Holding Corp. * | 160,508 | 3,125,091 |
Kaltura, Inc. * | 189,727 | 233,364 |
LivePerson, Inc. * | 181,747 | 91,037 |
LiveRamp Holdings, Inc. * | 147,081 | 4,722,771 |
Marathon Digital Holdings, Inc. * | 508,211 | 8,161,869 |
Matterport, Inc. * | 590,136 | 2,714,626 |
MeridianLink, Inc. * | 57,801 | 964,121 |
MicroStrategy, Inc., Class A * | 33,735 | 35,928,787 |
Mitek Systems, Inc. * | 100,004 | 1,263,051 |
Model N, Inc. * | 87,929 | 2,607,095 |
N-able, Inc. * | 158,392 | 1,941,886 |
NextNav, Inc. *(a) | 128,776 | 1,173,149 |
Olo, Inc., Class A * | 232,716 | 1,117,037 |
ON24, Inc. | 66,316 | 437,022 |
OneSpan, Inc. * | 92,428 | 1,000,071 |
PagerDuty, Inc. * | 202,212 | 4,036,152 |
Perficient, Inc. * | 77,793 | 3,676,497 |
PowerSchool Holdings, Inc., Class A * | 128,953 | 2,233,466 |
Progress Software Corp. | 100,389 | 5,001,380 |
PROS Holdings, Inc. * | 101,417 | 3,321,407 |
Q2 Holdings, Inc. * | 129,280 | 6,643,699 |
Qualys, Inc. * | 84,487 | 13,848,264 |
Rackspace Technology, Inc. * | 147,037 | 252,904 |
Rapid7, Inc. * | 137,728 | 6,170,214 |
Red Violet, Inc. * | 25,499 | 427,873 |
Rimini Street, Inc. * | 114,282 | 303,990 |
Riot Platforms, Inc. * | 450,026 | 4,549,763 |
Sapiens International Corp. NV | 69,612 | 2,144,050 |
SEMrush Holdings, Inc., Class A * | 71,942 | 880,570 |
SolarWinds Corp. | 118,260 | 1,303,225 |
SECURITY | NUMBER OF SHARES | VALUE ($) |
SoundHound AI, Inc., Class A *(a) | 311,211 | 1,319,535 |
SoundThinking, Inc. * | 22,013 | 294,094 |
Sprinklr, Inc., Class A * | 239,914 | 2,804,595 |
Sprout Social, Inc., Class A * | 110,313 | 5,565,291 |
SPS Commerce, Inc. * | 83,357 | 14,493,282 |
Squarespace, Inc., Class A * | 128,625 | 4,483,867 |
Tenable Holdings, Inc. * | 264,362 | 11,888,359 |
Terawulf, Inc. * | 353,643 | 767,405 |
Thoughtworks Holding, Inc. * | 213,772 | 495,951 |
Tucows, Inc., Class A * | 22,699 | 401,091 |
Unisys Corp. * | 149,219 | 810,259 |
Varonis Systems, Inc., Class B * | 247,083 | 10,809,881 |
Verint Systems, Inc. * | 138,720 | 4,200,442 |
Veritone, Inc. *(a) | 59,872 | 195,781 |
Viant Technology, Inc., Class A * | 33,212 | 291,933 |
Weave Communications, Inc. * | 77,987 | 833,681 |
Workiva, Inc., Class A * | 112,766 | 8,885,961 |
Xperi, Inc. * | 97,987 | 1,029,843 |
Yext, Inc. * | 244,558 | 1,342,623 |
Zeta Global Holdings Corp., Class A * | 318,488 | 3,936,512 |
Zuora, Inc., Class A * | 307,896 | 3,035,855 |
361,918,341 | ||
Technology Hardware & Equipment 5.1% | ||
908 Devices, Inc. * | 50,129 | 285,735 |
ADTRAN Holdings, Inc. | 179,986 | 788,339 |
Advanced Energy Industries, Inc. | 85,376 | 8,182,436 |
Aeva Technologies, Inc. * | 36,311 | 113,290 |
Akoustis Technologies, Inc. * | 213,442 | 125,312 |
Arlo Technologies, Inc. * | 203,020 | 2,513,388 |
Aviat Networks, Inc. * | 26,285 | 879,233 |
Badger Meter, Inc. | 66,837 | 12,225,824 |
Bel Fuse, Inc., Class B | 23,641 | 1,388,200 |
Belden, Inc. | 94,552 | 7,684,241 |
Benchmark Electronics, Inc. | 80,218 | 2,423,386 |
Calix, Inc. * | 133,664 | 3,706,503 |
Cambium Networks Corp. * | 27,989 | 94,883 |
Clearfield, Inc. * | 29,269 | 881,582 |
Climb Global Solutions, Inc. | 9,506 | 612,757 |
CommScope Holding Co., Inc. * | 468,537 | 418,872 |
CompoSecure, Inc. *(a) | 37,585 | 261,216 |
Comtech Telecommunications Corp. * | 62,916 | 118,282 |
Corsair Gaming, Inc. * | 82,828 | 919,391 |
CPI Card Group, Inc. * | 9,729 | 167,825 |
CTS Corp. | 70,297 | 3,216,088 |
Daktronics, Inc. * | 86,879 | 821,007 |
Digi International, Inc. * | 80,681 | 2,473,679 |
DZS, Inc. * | 49,884 | 48,891 |
Eastman Kodak Co. * | 126,684 | 570,078 |
ePlus, Inc. * | 60,213 | 4,629,175 |
Evolv Technologies Holdings, Inc. * | 259,500 | 1,014,645 |
Extreme Networks, Inc. * | 286,430 | 3,208,016 |
Fabrinet * | 83,601 | 14,468,825 |
FARO Technologies, Inc. * | 42,407 | 795,131 |
Harmonic, Inc. * | 249,911 | 2,684,044 |
Immersion Corp. | 72,081 | 524,029 |
Infinera Corp. * | 451,699 | 2,177,189 |
Insight Enterprises, Inc. * | 63,891 | 11,664,580 |
Intevac, Inc. * | 58,321 | 246,698 |
IonQ, Inc. *(a) | 372,171 | 3,182,062 |
Iteris, Inc. * | 97,633 | 437,396 |
Itron, Inc. * | 103,620 | 9,545,474 |
Kimball Electronics, Inc. * | 53,790 | 1,125,825 |
Knowles Corp. * | 201,676 | 3,192,531 |
KVH Industries, Inc. * | 42,847 | 205,666 |
Lightwave Logic, Inc. *(a) | 262,754 | 1,003,720 |
Luna Innovations, Inc. * | 72,680 | 149,721 |
SECURITY | NUMBER OF SHARES | VALUE ($) |
Methode Electronics, Inc. | 76,479 | 932,279 |
MicroVision, Inc. *(a) | 442,824 | 642,095 |
Mirion Technologies, Inc., Class A * | 456,179 | 4,958,666 |
Napco Security Technologies, Inc. | 75,330 | 3,065,931 |
NETGEAR, Inc. * | 65,340 | 965,725 |
NetScout Systems, Inc. * | 155,029 | 2,985,859 |
nLight, Inc. * | 101,887 | 1,160,493 |
Novanta, Inc. * | 81,331 | 12,728,301 |
OSI Systems, Inc. * | 36,658 | 4,818,328 |
PAR Technology Corp. * | 61,841 | 2,614,637 |
PC Connection, Inc. | 26,095 | 1,617,107 |
Plexus Corp. * | 62,398 | 6,302,822 |
Presto Automation, Inc. * | 7,273 | 1,226 |
Ribbon Communications, Inc. * | 200,308 | 634,976 |
Richardson Electronics Ltd. | 27,359 | 288,090 |
Rogers Corp. * | 39,232 | 4,672,139 |
Sanmina Corp. * | 125,082 | 7,588,725 |
ScanSource, Inc. * | 56,324 | 2,344,205 |
SmartRent, Inc. * | 426,523 | 989,533 |
Super Micro Computer, Inc. * | 115,543 | 99,228,328 |
TTM Technologies, Inc. * | 231,247 | 3,452,518 |
Turtle Beach Corp. * | 38,012 | 535,969 |
Viavi Solutions, Inc. * | 501,367 | 3,960,799 |
Vishay Intertechnology, Inc. | 288,975 | 6,686,881 |
Vishay Precision Group, Inc. * | 27,936 | 921,888 |
Vuzix Corp. *(a) | 142,266 | 189,214 |
Xerox Holdings Corp. | 265,006 | 3,521,930 |
288,983,829 | ||
Telecommunication Services 0.5% | ||
Anterix, Inc. * | 28,925 | 911,716 |
AST SpaceMobile, Inc., Class A *(a) | 260,177 | 574,991 |
ATN International, Inc. | 24,765 | 472,516 |
Bandwidth, Inc., Class A * | 52,882 | 962,452 |
Cogent Communications Holdings, Inc. | 99,453 | 6,382,894 |
Consolidated Communications Holdings, Inc. * | 170,235 | 735,415 |
Globalstar, Inc. * | 1,644,419 | 2,121,300 |
Gogo, Inc. * | 151,867 | 1,375,915 |
IDT Corp., Class B | 35,116 | 1,248,023 |
Liberty Latin America Ltd., Class C * | 389,690 | 2,938,263 |
Lumen Technologies, Inc. * | 2,289,108 | 2,724,039 |
Ooma, Inc. * | 53,383 | 376,884 |
Shenandoah Telecommunications Co. | 109,792 | 1,407,533 |
Spok Holdings, Inc. | 41,157 | 635,876 |
Telephone & Data Systems, Inc. | 224,529 | 3,513,879 |
26,381,696 | ||
Transportation 1.3% | ||
Air Transport Services Group, Inc. * | 116,910 | 1,498,786 |
Allegiant Travel Co. | 35,829 | 1,954,830 |
ArcBest Corp. | 54,026 | 5,992,024 |
Blade Air Mobility, Inc. * | 140,659 | 448,702 |
Costamare, Inc. | 104,431 | 1,251,083 |
Covenant Logistics Group, Inc., Class A | 19,217 | 868,416 |
Forward Air Corp. | 58,888 | 1,296,714 |
Frontier Group Holdings, Inc. * | 86,836 | 524,489 |
FTAI Infrastructure, Inc. | 225,959 | 1,635,943 |
Genco Shipping & Trading Ltd. | 96,046 | 2,049,622 |
Golden Ocean Group Ltd. | 279,183 | 3,933,689 |
Hawaiian Holdings, Inc. * | 116,106 | 1,474,546 |
Heartland Express, Inc. | 105,486 | 1,048,531 |
Himalaya Shipping Ltd. * | 69,223 | 565,552 |
Hub Group, Inc., Class A | 142,922 | 5,748,323 |
JetBlue Airways Corp. * | 765,447 | 4,347,739 |
Joby Aviation, Inc. *(a) | 632,732 | 3,195,297 |
SECURITY | NUMBER OF SHARES | VALUE ($) |
Marten Transport Ltd. | 131,965 | 2,232,848 |
Matson, Inc. | 78,306 | 8,439,821 |
PAM Transportation Services, Inc. * | 13,871 | 237,610 |
Pangaea Logistics Solutions Ltd. | 83,238 | 599,314 |
Radiant Logistics, Inc. * | 79,045 | 390,482 |
RXO, Inc. * | 264,419 | 5,000,163 |
Safe Bulkers, Inc. | 152,360 | 760,276 |
SkyWest, Inc. * | 91,999 | 6,718,687 |
Spirit Airlines, Inc. (a) | 247,207 | 872,641 |
Sun Country Airlines Holdings, Inc. * | 97,284 | 1,294,850 |
Universal Logistics Holdings, Inc. | 15,506 | 692,808 |
Werner Enterprises, Inc. | 144,114 | 4,928,699 |
70,002,485 | ||
Utilities 2.6% | ||
ALLETE, Inc. | 131,176 | 7,768,243 |
Altus Power, Inc., Class A * | 145,704 | 534,734 |
American States Water Co. | 84,247 | 5,968,057 |
Artesian Resources Corp., Class A | 21,024 | 735,419 |
Avista Corp. | 176,215 | 6,340,216 |
Black Hills Corp. | 155,129 | 8,516,582 |
Brookfield Infrastructure Corp., Class A | 271,978 | 8,287,170 |
Cadiz, Inc. * | 92,704 | 211,365 |
California Water Service Group | 131,372 | 6,452,993 |
Chesapeake Utilities Corp. | 49,778 | 5,269,997 |
Consolidated Water Co. Ltd. | 34,507 | 878,203 |
Genie Energy Ltd., Class B | 44,174 | 675,420 |
Global Water Resources, Inc. | 25,957 | 317,714 |
MGE Energy, Inc. | 82,888 | 6,491,788 |
Middlesex Water Co. | 40,041 | 2,030,879 |
Montauk Renewables, Inc. * | 149,439 | 537,980 |
New Jersey Resources Corp. | 221,122 | 9,660,820 |
Northwest Natural Holding Co. | 83,384 | 3,181,100 |
Northwestern Energy Group, Inc. | 140,015 | 7,062,357 |
ONE Gas, Inc. | 125,267 | 8,082,227 |
Ormat Technologies, Inc. | 122,694 | 7,831,558 |
Otter Tail Corp. | 93,699 | 7,998,147 |
PNM Resources, Inc. | 194,737 | 7,216,953 |
Portland General Electric Co. | 231,217 | 9,995,511 |
Pure Cycle Corp. * | 47,117 | 449,496 |
RGC Resources, Inc. | 18,313 | 377,614 |
SJW Group | 72,397 | 3,942,017 |
Southwest Gas Holdings, Inc. | 141,918 | 10,589,921 |
Spire, Inc. | 118,534 | 7,324,216 |
Sunnova Energy International, Inc. *(a) | 239,852 | 1,009,777 |
Unitil Corp. | 36,065 | 1,837,151 |
York Water Co. | 32,145 | 1,141,469 |
148,717,094 | ||
Total Common Stocks (Cost $4,180,444,745) | 5,615,179,392 | |
SECURITY | NUMBER OF SHARES | VALUE ($) |
RIGHTS 0.0% OF NET ASSETS | ||
Pharmaceuticals, Biotechnology & Life Sciences 0.0% | ||
Aduro Biotech, Inc. CVR *(c) | 27,867 | 72,998 |
Cartesian Therapeutics, Inc. CVR *(c) | 265,512 | 47,792 |
Gtx, Inc. CVR *(c) | 592 | 607 |
Jounce Therapeutics, Inc. CVR *(c) | 100,774 | 3,023 |
Tobira Therapeutics, Inc. CVR *(c) | 14,029 | 60,606 |
185,026 | ||
Total Rights (Cost $44,006) | 185,026 | |
SHORT-TERM INVESTMENTS 1.2% OF NET ASSETS | ||
Money Market Funds 1.2% | ||
State Street Institutional U.S. Government Money Market Fund, Premier Class 5.25% (d)(e) | 68,498,560 | 68,498,560 |
Total Short-Term Investments (Cost $68,498,560) | 68,498,560 | |
Total Investments in Securities (Cost $4,248,987,311) | 5,683,862,978 | |
NUMBER OF CONTRACTS | NOTIONAL AMOUNT ($) | CURRENT VALUE/ UNREALIZED APPRECIATION ($) | |
FUTURES CONTRACTS | |||
Long | |||
Russell 2000 Index, e-mini, expires 06/21/24 | 168 | 16,679,040 | 159,016 |
* | Non-income producing security. |
(a) | All or a portion of this security is on loan. Securities on loan were valued at $62,833,036. |
(b) | Issuer is an affiliated company, as the investment adviser owns at least 5% of the voting securities of such company. |
(c) | Fair valued using significant unobservable inputs (see financial note 2(a), Securities for which no quoted value is available, for additional information). |
(d) | The rate shown is the annualized 7-day yield. |
(e) | Security purchased with cash collateral received for securities on loan. |
CVR — | Contingent Value Rights |
REIT — | Real Estate Investment Trust |
SECURITY | VALUE AT 10/31/23 | PURCHASES | SALES | REALIZED GAINS (LOSSES) | NET CHANGE IN UNREALIZED APPRECIATION (DEPRECIATION) | VALUE AT 4/30/24 | BALANCE OF SHARES HELD AT 4/30/24 | DIVIDENDS RECEIVED |
COMMON STOCKS 0.0% OF NET ASSETS | ||||||||
Consumer Durables & Apparel 0.0% | ||||||||
Fossil Group, Inc. | $— | $— | $— | $— | ($86,515 ) | $86,029 | 110,605 | $— |
Equity Real Estate Investment Trusts (REITs) 0.0% | ||||||||
Diversified Healthcare Trust | — | 28,570 | (56,121 ) | (99,851 ) | 268,912 | 1,291,248 | 547,139 | 10,908 |
Pharmaceuticals, Biotechnology & Life Sciences 0.0% | ||||||||
Emergent BioSolutions, Inc. | — | — | — | — | (24,285 ) | 217,411 | 115,644 | — |
Transportation 0.0% | ||||||||
Daseke, Inc. | — | 98,747 | (889,815 ) | 86,957 | 293,020 | — | — | — |
Total | $— | $127,317 | ($945,936 ) | ($12,894 ) | $451,132 | $1,594,688 | $10,908 | |
DESCRIPTION | QUOTED PRICES IN ACTIVE MARKETS FOR IDENTICAL ASSETS (LEVEL 1) | OTHER SIGNIFICANT OBSERVABLE INPUTS (LEVEL 2) | SIGNIFICANT UNOBSERVABLE INPUTS (LEVEL 3) | TOTAL |
Assets | ||||
Common Stocks1 | $4,802,232,479 | $— | $— | $4,802,232,479 |
Equity Real Estate Investment Trusts (REITs) | 283,081,897 | — | 19,696 | 283,101,593 |
Pharmaceuticals, Biotechnology & Life Sciences | 529,740,298 | — | 105,022 | 529,845,320 |
Rights | ||||
Pharmaceuticals, Biotechnology & Life Sciences | — | — | 185,026 | 185,026 |
Short-Term Investments1 | 68,498,560 | — | — | 68,498,560 |
Futures Contracts2 | 159,016 | — | — | 159,016 |
Total | $5,683,712,250 | $— | $309,744 | $5,684,021,994 |
1 | As categorized in the Portfolio Holdings. |
2 | Futures contracts are reported at cumulative unrealized appreciation or depreciation. |
Assets | ||
Investments in securities, at value - affiliated issuers (cost $8,913,894) | $1,594,688 | |
Investments in securities, at value - unaffiliated issuers (cost $4,240,073,417) including securities on loan of $62,833,036 | 5,682,268,290 | |
Cash | 11,673,287 | |
Deposit with broker for futures contracts | 981,500 | |
Receivables: | ||
Fund shares sold | 7,363,384 | |
Dividends | 1,679,549 | |
Income from securities on loan | + | 555,983 |
Total assets | 5,706,116,681 | |
Liabilities | ||
Collateral held for securities on loan | 68,498,560 | |
Payables: | ||
Fund shares redeemed | 2,392,290 | |
Investments bought | 655,985 | |
Variation margin on futures contracts | 278,401 | |
Investment adviser fees | + | 188,418 |
Total liabilities | 72,013,654 | |
Net assets | $5,634,103,027 | |
Net Assets by Source | ||
Capital received from investors | $4,640,638,117 | |
Total distributable earnings | + | 993,464,910 |
Net assets | $5,634,103,027 | |
Net Asset Value (NAV) | ||||
Net Assets | ÷ | Shares Outstanding | = | NAV |
$5,634,103,027 | 177,212,964 | $31.79 | ||
For the period November 1, 2023 through April 30, 2024; unaudited | ||
Investment Income | ||
Dividends received from securities - unaffiliated issuers (net of foreign withholding tax of $75,115) | $45,786,263 | |
Other interest | 337,178 | |
Dividends received from securities - affiliated issuers | 10,908 | |
Securities on loan, net | + | 3,254,037 |
Total investment income | 49,388,386 | |
Expenses | ||
Investment adviser fees | 1,129,447 | |
Total expenses | – | 1,129,447 |
Net investment income | 48,258,939 | |
REALIZED AND UNREALIZED GAINS (LOSSES) | ||
Net realized losses on sales of securities - affiliated issuers | (12,894 ) | |
Net realized losses on sales of securities - unaffiliated issuers | (29,484,496 ) | |
Net realized gains on sales of in-kind redemptions - unaffiliated issuers | 3,472,124 | |
Net realized gains on futures contracts | + | 1,817,554 |
Net realized losses | (24,207,712 ) | |
Net change in unrealized appreciation (depreciation) on securities - affiliated issuers | 451,132 | |
Net change in unrealized appreciation (depreciation) on securities - unaffiliated issuers | 933,674,953 | |
Net change in unrealized appreciation (depreciation) on futures contracts | + | 923,370 |
Net change in unrealized appreciation (depreciation) | + | 935,049,455 |
Net realized and unrealized gains | 910,841,743 | |
Increase in net assets resulting from operations | $959,100,682 | |
OPERATIONS | |||
11/1/23-4/30/24 | 11/1/22-10/31/23 | ||
Net investment income | $48,258,939 | $85,960,469 | |
Net realized gains (losses) | (24,207,712 ) | 35,197,324 | |
Net change in unrealized appreciation (depreciation) | + | 935,049,455 | (573,316,322 ) |
Increase (decrease) in net assets resulting from operations | $959,100,682 | ($452,158,529 ) | |
DISTRIBUTIONS TO SHAREHOLDERS | |||
Total distributions | ($86,736,454 ) | ($67,319,807 ) | |
TRANSACTIONS IN FUND SHARES | |||||
11/1/23-4/30/24 | 11/1/22-10/31/23 | ||||
SHARES | VALUE | SHARES | VALUE | ||
Shares sold | 15,910,887 | $502,070,824 | 37,521,878 | $1,105,017,562 | |
Shares reinvested | 2,232,953 | 67,256,541 | 1,875,048 | 53,907,613 | |
Shares redeemed | + | (21,789,384 ) | (688,729,515 ) | (38,355,459 ) | (1,130,035,083 ) |
Net transactions in fund shares | (3,645,544 ) | ($119,402,150 ) | 1,041,467 | $28,890,092 | |
SHARES OUTSTANDING AND NET ASSETS | |||||
11/1/23-4/30/24 | 11/1/22-10/31/23 | ||||
SHARES | NET ASSETS | SHARES | NET ASSETS | ||
Beginning of period | 180,858,508 | $4,881,140,949 | 179,817,041 | $5,371,729,193 | |
Total increase (decrease) | + | (3,645,544 ) | 752,962,078 | 1,041,467 | (490,588,244 ) |
End of period | 177,212,964 | $5,634,103,027 | 180,858,508 | $4,881,140,949 | |
11/1/23– 4/30/24* | 11/1/22– 10/31/23 | 11/1/21– 10/31/22 | 11/1/20– 10/31/21 | 11/1/19– 10/31/20 | 11/1/18– 10/31/19 | |
Per-Share Data | ||||||
Net asset value at beginning of period | $71.29 | $66.82 | $81.64 | $57.62 | $53.42 | $48.38 |
Income (loss) from investment operations: | ||||||
Net investment income (loss)1 | 0.62 | 1.13 | 1.05 | 1.00 | 1.07 | 0.99 |
Net realized and unrealized gains (losses) | 14.41 | 4.39 | (14.67 ) | 24.10 | 4.21 | 5.18 |
Total from investment operations | 15.03 | 5.52 | (13.62 ) | 25.10 | 5.28 | 6.17 |
Less distributions: | ||||||
Distributions from net investment income | (1.14 ) | (1.05 ) | (0.96 ) | (1.08 ) | (0.94 ) | (0.90 ) |
Distributions from net realized gains | — | — | (0.24 ) | — | (0.14 ) | (0.23 ) |
Total distributions | (1.14 ) | (1.05 ) | (1.20 ) | (1.08 ) | (1.08 ) | (1.13 ) |
Net asset value at end of period | $85.18 | $71.29 | $66.82 | $81.64 | $57.62 | $53.42 |
Total return | 21.23 %2 | 8.38 % | (16.94 %) | 44.01 % | 9.94 % | 13.37 % |
Ratios/Supplemental Data | ||||||
Ratios to average net assets: | ||||||
Total expenses | 0.03 %3 | 0.03 %4 | 0.03 %4 | 0.03 % | 0.03 % | 0.03 % |
Net investment income (loss) | 1.52 %3 | 1.58 % | 1.44 % | 1.37 % | 1.96 % | 1.99 % |
Portfolio turnover rate | 0 %2,5 | 2 % | 2 % | 3 % | 4 % | 3 % |
Net assets, end of period (x 1,000,000) | $22,249 | $17,787 | $16,046 | $18,232 | $11,487 | $10,220 |
* | Unaudited. |
1 | Calculated based on the average shares outstanding during the period. |
2 | Not annualized. |
3 | Annualized. |
4 | Ratio includes less than 0.005% of non-routine proxy expenses. |
5 | Less than 0.5% |
SECURITY | NUMBER OF SHARES | VALUE ($) |
COMMON STOCKS 99.6% OF NET ASSETS | ||
Automobiles & Components 1.5% | ||
Adient PLC * | 40,665 | 1,214,664 |
American Axle & Manufacturing Holdings, Inc. * | 60,450 | 443,703 |
Aptiv PLC * | 127,397 | 9,045,187 |
Autoliv, Inc. | 33,157 | 3,971,877 |
BorgWarner, Inc. | 105,976 | 3,472,834 |
Canoo, Inc. *(a) | 23,749 | 68,397 |
Cooper-Standard Holdings, Inc. * | 8,444 | 130,291 |
Dana, Inc. | 54,773 | 680,828 |
Dorman Products, Inc. * | 13,443 | 1,175,590 |
Envirotech Vehicles, Inc. * | 9,637 | 20,912 |
Ford Motor Co. | 1,777,163 | 21,592,530 |
Fox Factory Holding Corp. * | 18,890 | 735,199 |
Garrett Motion, Inc. * | 66,397 | 634,755 |
General Motors Co. | 525,925 | 23,419,440 |
Gentex Corp. | 105,044 | 3,603,009 |
Gentherm, Inc. * | 14,378 | 727,095 |
Goodyear Tire & Rubber Co. * | 127,808 | 1,528,584 |
Harley-Davidson, Inc. | 56,679 | 1,949,191 |
Holley, Inc. * | 22,922 | 92,146 |
LCI Industries | 11,790 | 1,225,924 |
Lear Corp. | 26,114 | 3,286,969 |
Lucid Group, Inc. *(a) | 410,570 | 1,046,954 |
Luminar Technologies, Inc., Class A *(a) | 121,127 | 178,057 |
Mobileye Global, Inc., Class A *(a) | 35,165 | 968,796 |
Modine Manufacturing Co. * | 24,298 | 2,250,724 |
Motorcar Parts of America, Inc. * | 7,218 | 40,998 |
Patrick Industries, Inc. | 9,154 | 956,502 |
Phinia, Inc. | 20,144 | 785,616 |
QuantumScape Corp., Class A * | 170,800 | 925,736 |
Rivian Automotive, Inc., Class A * | 308,710 | 2,747,519 |
Standard Motor Products, Inc. | 7,798 | 250,316 |
Stoneridge, Inc. * | 11,655 | 174,592 |
Strattec Security Corp. * | 1,500 | 34,140 |
Superior Industries International, Inc. * | 10,350 | 38,709 |
Tesla, Inc. * | 1,261,222 | 231,156,768 |
Thor Industries, Inc. | 24,055 | 2,391,548 |
Visteon Corp. * | 12,716 | 1,406,771 |
Winnebago Industries, Inc. | 13,059 | 804,173 |
Workhorse Group, Inc. * | 79,433 | 12,010 |
Worksport Ltd. * | 13,921 | 11,624 |
XPEL, Inc. * | 9,832 | 516,672 |
325,717,350 | ||
Banks 3.6% | ||
1895 Bancorp of Wisconsin, Inc. * | 1,526 | 11,064 |
1st Source Corp. | 6,934 | 343,926 |
ACNB Corp. | 3,576 | 116,363 |
Affinity Bancshares, Inc. * | 1,146 | 19,184 |
Amalgamated Financial Corp. | 7,518 | 184,492 |
Amerant Bancorp, Inc. | 10,892 | 235,921 |
SECURITY | NUMBER OF SHARES | VALUE ($) |
Ameris Bancorp | 29,643 | 1,407,450 |
AmeriServ Financial, Inc. | 4,001 | 9,682 |
Ames National Corp. | 4,056 | 78,078 |
Arrow Financial Corp. | 6,961 | 155,021 |
Associated Banc-Corp. | 69,004 | 1,453,914 |
Atlantic Union Bankshares Corp. | 40,437 | 1,284,668 |
Auburn National BanCorp, Inc. | 800 | 14,808 |
Axos Financial, Inc. * | 22,736 | 1,150,669 |
Banc of California, Inc. | 62,790 | 859,595 |
BancFirst Corp. | 6,480 | 577,822 |
Bancorp, Inc. * | 23,768 | 711,614 |
Bank First Corp. | 3,759 | 290,157 |
Bank of America Corp. | 3,131,718 | 115,904,883 |
Bank of Hawaii Corp. | 18,380 | 1,041,962 |
Bank of Marin Bancorp | 6,631 | 95,221 |
Bank of the James Financial Group, Inc. | 2,744 | 27,934 |
Bank OZK | 46,860 | 2,092,299 |
Bank7 Corp. | 2,054 | 56,074 |
BankFinancial Corp. | 3,213 | 31,070 |
BankUnited, Inc. | 36,102 | 965,006 |
Bankwell Financial Group, Inc. | 2,376 | 54,482 |
Banner Corp. | 15,660 | 683,246 |
Bar Harbor Bankshares | 5,903 | 148,047 |
BayCom Corp. | 4,901 | 96,942 |
Bayfirst Financial Corp. | 784 | 10,098 |
BCB Bancorp, Inc. | 7,033 | 66,251 |
Berkshire Hills Bancorp, Inc. | 19,410 | 413,821 |
Blue Foundry Bancorp * | 9,742 | 83,197 |
Bogota Financial Corp. * | 1,050 | 7,109 |
BOK Financial Corp. | 12,146 | 1,077,715 |
Bridgewater Bancshares, Inc. * | 8,542 | 92,937 |
Broadway Financial Corp. * | 2,507 | 12,435 |
Brookline Bancorp, Inc. | 38,717 | 321,351 |
Burke & Herbert Financial Services Corp. | 2,960 | 155,045 |
Business First Bancshares, Inc. | 9,475 | 191,300 |
Byline Bancorp, Inc. | 14,729 | 319,177 |
C&F Financial Corp. | 1,200 | 47,004 |
Cadence Bank | 83,438 | 2,308,729 |
California BanCorp * | 2,455 | 53,274 |
Cambridge Bancorp | 3,535 | 216,943 |
Camden National Corp. | 5,912 | 184,573 |
Capital Bancorp, Inc. | 3,170 | 61,498 |
Capital City Bank Group, Inc. | 5,558 | 147,398 |
Capitol Federal Financial, Inc. | 63,473 | 302,766 |
Carter Bankshares, Inc. * | 9,825 | 119,570 |
Catalyst Bancorp, Inc. * | 1,359 | 15,900 |
Cathay General Bancorp | 32,565 | 1,121,539 |
CB Financial Services, Inc. | 2,090 | 46,419 |
Central Pacific Financial Corp. | 11,311 | 225,541 |
CF Bankshares, Inc. | 2,505 | 46,292 |
Chemung Financial Corp. | 1,306 | 55,068 |
ChoiceOne Financial Services, Inc. | 2,484 | 61,752 |
Citigroup, Inc. | 866,042 | 53,114,356 |
Citizens & Northern Corp. | 5,947 | 101,396 |
Citizens Community Bancorp, Inc. | 3,309 | 36,399 |
Citizens Financial Group, Inc. | 213,390 | 7,278,733 |
SECURITY | NUMBER OF SHARES | VALUE ($) |
Citizens Financial Services, Inc. | 1,994 | 80,558 |
City Holding Co. | 6,363 | 642,790 |
Civista Bancshares, Inc. | 5,755 | 82,181 |
CNB Financial Corp. | 8,219 | 156,161 |
Coastal Financial Corp. * | 5,270 | 203,844 |
Codorus Valley Bancorp, Inc. | 4,360 | 96,792 |
Colony Bankcorp, Inc. | 7,200 | 78,264 |
Columbia Banking System, Inc. | 93,886 | 1,765,996 |
Columbia Financial, Inc. * | 14,396 | 238,974 |
Comerica, Inc. | 61,134 | 3,067,093 |
Commerce Bancshares, Inc. | 52,932 | 2,894,322 |
Community Bank System, Inc. | 25,119 | 1,085,643 |
Community Trust Bancorp, Inc. | 6,370 | 267,604 |
Community West Bancshares | 6,826 | 117,202 |
ConnectOne Bancorp, Inc. | 14,768 | 264,495 |
CrossFirst Bankshares, Inc. * | 17,616 | 212,801 |
Cullen/Frost Bankers, Inc. | 28,859 | 3,011,148 |
Cullman Bancorp, Inc. | 1,374 | 14,386 |
Customers Bancorp, Inc. * | 12,356 | 564,299 |
CVB Financial Corp. | 61,166 | 999,452 |
Dime Community Bancshares, Inc. | 18,909 | 344,144 |
Eagle Bancorp Montana, Inc. | 2,563 | 32,806 |
Eagle Bancorp, Inc. | 13,609 | 251,630 |
East West Bancorp, Inc. | 63,899 | 4,759,837 |
Eastern Bankshares, Inc. | 70,729 | 888,356 |
ECB Bancorp, Inc. * | 4,412 | 51,179 |
Enterprise Bancorp, Inc. | 3,412 | 82,912 |
Enterprise Financial Services Corp. | 16,939 | 643,851 |
Equity Bancshares, Inc., Class A | 6,351 | 211,552 |
Esquire Financial Holdings, Inc. | 3,256 | 153,227 |
ESSA Bancorp, Inc. | 3,176 | 51,451 |
Evans Bancorp, Inc. | 2,622 | 67,097 |
Farmers & Merchants Bancorp, Inc. | 6,004 | 123,082 |
Farmers National Banc Corp. | 14,833 | 175,474 |
FB Financial Corp. | 17,225 | 631,296 |
Fidelity D&D Bancorp, Inc. | 1,779 | 80,767 |
Fifth Third Bancorp | 308,582 | 11,250,900 |
Financial Institutions, Inc. | 6,134 | 105,627 |
Finward Bancorp | 1,806 | 44,229 |
Finwise Bancorp * | 4,562 | 48,403 |
First BanCorp | 76,777 | 1,324,403 |
First Bancorp, Inc. | 3,588 | 79,223 |
First Bancorp/Southern Pines NC | 20,264 | 616,228 |
First Bancshares, Inc. | 11,989 | 287,017 |
First Bank | 9,056 | 105,774 |
First Busey Corp. | 25,293 | 565,046 |
First Business Financial Services, Inc. | 2,713 | 89,719 |
First Capital, Inc. | 1,074 | 29,535 |
First Citizens BancShares, Inc., Class A | 5,438 | 9,172,601 |
First Commonwealth Financial Corp. | 43,700 | 576,403 |
First Community Bankshares, Inc. | 8,451 | 280,404 |
First Community Corp. | 3,520 | 58,186 |
First Financial Bancorp | 42,225 | 933,595 |
First Financial Bankshares, Inc. | 59,024 | 1,744,749 |
First Financial Corp. | 4,167 | 151,720 |
First Financial Northwest, Inc. | 2,960 | 60,295 |
First Foundation, Inc. | 23,207 | 127,174 |
First Guaranty Bancshares, Inc. | 2,887 | 32,421 |
First Hawaiian, Inc. | 58,509 | 1,233,955 |
First Horizon Corp. | 251,327 | 3,749,799 |
First Internet Bancorp | 3,435 | 106,657 |
First Interstate BancSystem, Inc., Class A | 37,307 | 996,097 |
First Merchants Corp. | 28,372 | 948,192 |
First Mid Bancshares, Inc. | 12,345 | 382,201 |
First National Corp. | 2,648 | 39,084 |
First Northwest Bancorp | 3,416 | 35,014 |
SECURITY | NUMBER OF SHARES | VALUE ($) |
First of Long Island Corp. | 9,603 | 90,940 |
First Savings Financial Group, Inc. | 2,389 | 38,296 |
First Seacoast Bancorp, Inc. * | 3,389 | 29,620 |
First U.S. Bancshares, Inc. | 4,841 | 50,056 |
First United Corp. | 2,849 | 64,359 |
First Western Financial, Inc. * | 2,786 | 46,443 |
Five Star Bancorp | 4,893 | 105,787 |
Flushing Financial Corp. | 12,108 | 133,430 |
FNB Corp. | 167,523 | 2,234,757 |
FNCB Bancorp, Inc. | 8,643 | 47,796 |
Franklin Financial Services Corp. | 1,992 | 60,298 |
FS Bancorp, Inc. | 3,171 | 98,840 |
Fulton Financial Corp. | 82,085 | 1,358,507 |
FVCBankcorp, Inc. * | 8,954 | 103,061 |
German American Bancorp, Inc. | 14,939 | 474,014 |
Glacier Bancorp, Inc. | 50,234 | 1,817,466 |
Great Southern Bancorp, Inc. | 4,013 | 206,268 |
Greene County Bancorp, Inc. | 3,212 | 94,497 |
Guaranty Bancshares, Inc. | 3,536 | 101,589 |
Hancock Whitney Corp. | 39,748 | 1,804,162 |
Hanmi Financial Corp. | 13,522 | 206,887 |
HarborOne Bancorp, Inc. | 18,808 | 190,525 |
Hawthorn Bancshares, Inc. | 2,065 | 37,645 |
HBT Financial, Inc. | 5,821 | 107,427 |
Heartland Financial USA, Inc. | 18,495 | 778,824 |
Heritage Commerce Corp. | 26,186 | 207,917 |
Heritage Financial Corp. | 14,372 | 254,959 |
Hilltop Holdings, Inc. | 19,849 | 580,782 |
Hingham Institution For Savings (a) | 707 | 119,412 |
HMN Financial, Inc. | 2,233 | 44,437 |
Home Bancorp, Inc. | 3,387 | 118,545 |
Home BancShares, Inc. | 83,150 | 1,968,992 |
HomeStreet, Inc. | 8,389 | 102,765 |
HomeTrust Bancshares, Inc. | 6,363 | 163,529 |
Hope Bancorp, Inc. | 59,050 | 591,681 |
Horizon Bancorp, Inc. | 16,744 | 192,221 |
Huntington Bancshares, Inc. | 654,417 | 8,814,997 |
IF Bancorp, Inc. | 584 | 9,636 |
Independent Bank Corp. | 9,444 | 234,306 |
Independent Bank Corp. | 19,247 | 966,969 |
Independent Bank Group, Inc. | 17,129 | 637,884 |
International Bancshares Corp. | 24,669 | 1,372,830 |
Investar Holding Corp. | 3,333 | 55,594 |
John Marshall Bancorp, Inc. | 4,443 | 73,398 |
JPMorgan Chase & Co. | 1,315,017 | 252,141,360 |
Kearny Financial Corp. | 30,246 | 163,328 |
KeyCorp | 422,099 | 6,116,215 |
Lakeland Bancorp, Inc. | 27,779 | 338,626 |
Lakeland Financial Corp. | 12,289 | 722,225 |
Landmark Bancorp, Inc. | 2,076 | 37,368 |
LCNB Corp. | 4,732 | 66,721 |
LINKBANCORP, Inc. | 5,773 | 38,275 |
Live Oak Bancshares, Inc. | 14,105 | 455,874 |
M&T Bank Corp. | 75,587 | 10,914,007 |
Macatawa Bank Corp. | 10,493 | 146,902 |
Magyar Bancorp, Inc. | 1,051 | 11,971 |
MainStreet Bancshares, Inc. | 3,000 | 45,810 |
Mercantile Bank Corp. | 5,802 | 209,336 |
Meridian Corp. | 3,846 | 35,614 |
Metrocity Bankshares, Inc. | 7,678 | 176,440 |
Metropolitan Bank Holding Corp. * | 4,799 | 190,520 |
Mid Penn Bancorp, Inc. | 5,597 | 113,227 |
Middlefield Banc Corp. | 3,452 | 74,114 |
Midland States Bancorp, Inc. | 8,785 | 192,392 |
MidWestOne Financial Group, Inc. | 5,792 | 116,825 |
MVB Financial Corp. | 4,605 | 82,752 |
National Bank Holdings Corp., Class A | 16,969 | 555,395 |
SECURITY | NUMBER OF SHARES | VALUE ($) |
National Bankshares, Inc. | 2,506 | 67,186 |
NB Bancorp, Inc. * | 18,000 | 263,160 |
NBT Bancorp, Inc. | 21,649 | 757,932 |
New York Community Bancorp, Inc. | 329,468 | 873,090 |
Nicolet Bankshares, Inc. | 5,917 | 452,828 |
Northeast Bank | 3,001 | 155,212 |
Northeast Community Bancorp, Inc. | 5,675 | 89,552 |
Northfield Bancorp, Inc. | 18,804 | 156,825 |
Northrim BanCorp, Inc. | 2,596 | 124,089 |
Northwest Bancshares, Inc. | 54,295 | 575,527 |
Norwood Financial Corp. | 3,060 | 73,715 |
NSTS Bancorp, Inc. * | 1,610 | 15,440 |
Oak Valley Bancorp | 3,707 | 89,524 |
OceanFirst Financial Corp. | 25,110 | 370,624 |
OFG Bancorp | 23,182 | 837,102 |
Ohio Valley Banc Corp. | 1,400 | 32,900 |
Old National Bancorp | 139,479 | 2,306,990 |
Old Point Financial Corp. | 1,643 | 23,166 |
Old Second Bancorp, Inc. | 17,372 | 237,996 |
OP Bancorp | 5,203 | 47,503 |
Orange County Bancorp, Inc. | 1,662 | 71,815 |
Origin Bancorp, Inc. | 12,052 | 357,944 |
Orrstown Financial Services, Inc. | 4,595 | 120,481 |
Pacific Premier Bancorp, Inc. | 45,517 | 978,616 |
Park National Corp. | 7,007 | 922,892 |
Parke Bancorp, Inc. | 4,518 | 74,366 |
Pathfinder Bancorp, Inc. | 593 | 7,543 |
Pathward Financial, Inc. | 11,847 | 596,733 |
PB Bankshares, Inc. * | 2,277 | 28,144 |
PCB Bancorp | 4,081 | 59,419 |
Peapack-Gladstone Financial Corp. | 6,657 | 148,984 |
Penns Woods Bancorp, Inc. | 2,250 | 39,330 |
Peoples Bancorp of North Carolina, Inc. | 1,896 | 55,155 |
Peoples Bancorp, Inc. | 15,377 | 446,548 |
Peoples Financial Services Corp. | 2,693 | 101,984 |
Pinnacle Financial Partners, Inc. | 34,743 | 2,664,788 |
Pioneer Bancorp, Inc. * | 2,717 | 24,059 |
Plumas Bancorp | 2,267 | 79,708 |
PNC Financial Services Group, Inc. | 181,284 | 27,783,586 |
Ponce Financial Group, Inc. * | 10,983 | 88,303 |
Popular, Inc. | 33,493 | 2,846,570 |
Preferred Bank | 5,696 | 431,130 |
Premier Financial Corp. | 14,638 | 283,684 |
Primis Financial Corp. | 10,278 | 99,902 |
Princeton Bancorp, Inc. | 1,590 | 46,349 |
Prosperity Bancshares, Inc. | 42,545 | 2,636,514 |
Provident Bancorp, Inc. * | 6,035 | 53,681 |
Provident Financial Holdings, Inc. | 3,562 | 46,092 |
Provident Financial Services, Inc. | 32,096 | 471,169 |
QCR Holdings, Inc. | 7,130 | 391,865 |
RBB Bancorp | 6,055 | 107,537 |
Red River Bancshares, Inc. | 1,974 | 89,245 |
Regions Financial Corp. | 419,248 | 8,078,909 |
Renasant Corp. | 26,630 | 773,868 |
Republic Bancorp, Inc., Class A | 3,781 | 191,772 |
Richmond Mutual BanCorp, Inc. | 4,348 | 47,263 |
Riverview Bancorp, Inc. | 6,215 | 23,182 |
S&T Bancorp, Inc. | 16,257 | 490,149 |
Sandy Spring Bancorp, Inc. | 19,518 | 399,143 |
SB Financial Group, Inc. | 3,301 | 44,167 |
Seacoast Banking Corp. of Florida | 37,995 | 876,545 |
ServisFirst Bancshares, Inc. | 22,675 | 1,336,918 |
Shore Bancshares, Inc. | 11,833 | 122,472 |
Sierra Bancorp | 5,854 | 116,026 |
Simmons First National Corp., Class A | 54,646 | 933,900 |
SmartFinancial, Inc. | 6,197 | 127,348 |
SECURITY | NUMBER OF SHARES | VALUE ($) |
Sound Financial Bancorp, Inc. | 596 | 23,834 |
South Plains Financial, Inc. | 5,663 | 146,785 |
Southern California Bancorp * | 5,092 | 71,237 |
Southern First Bancshares, Inc. * | 2,967 | 76,608 |
Southern Missouri Bancorp, Inc. | 4,045 | 162,205 |
Southern States Bancshares, Inc. | 2,910 | 70,335 |
Southside Bancshares, Inc. | 12,464 | 332,290 |
SouthState Corp. | 35,121 | 2,658,660 |
Stellar Bancorp, Inc. | 23,106 | 512,953 |
Sterling Bancorp, Inc. * | 9,738 | 46,061 |
Stock Yards Bancorp, Inc. | 13,389 | 596,480 |
Summit Financial Group, Inc. | 6,235 | 165,040 |
Summit State Bank | 1,071 | 10,678 |
Synovus Financial Corp. | 66,672 | 2,386,191 |
TC Bancshares, Inc. | 3,005 | 41,018 |
Territorial Bancorp, Inc. | 4,386 | 33,027 |
Texas Capital Bancshares, Inc. * | 21,446 | 1,231,000 |
TFS Financial Corp. | 26,645 | 320,006 |
Third Coast Bancshares, Inc. * | 6,287 | 122,094 |
Timberland Bancorp, Inc. | 3,571 | 87,132 |
Tompkins Financial Corp. | 5,291 | 232,698 |
Towne Bank | 31,866 | 824,373 |
TriCo Bancshares | 14,278 | 496,446 |
Triumph Financial, Inc. * | 9,395 | 661,032 |
Truist Financial Corp. | 605,147 | 22,723,270 |
TrustCo Bank Corp. | 7,608 | 202,525 |
Trustmark Corp. | 26,268 | 777,533 |
U.S. Bancorp | 708,230 | 28,775,385 |
UMB Financial Corp. | 19,832 | 1,579,817 |
Union Bankshares, Inc. | 2,125 | 55,675 |
United Bancorp, Inc. | 3,371 | 42,104 |
United Bankshares, Inc. | 60,481 | 1,963,213 |
United Community Banks, Inc. | 53,201 | 1,342,261 |
United Security Bancshares | 6,461 | 46,002 |
Unity Bancorp, Inc. | 2,383 | 64,150 |
Univest Financial Corp. | 12,810 | 267,345 |
USCB Financial Holdings, Inc. | 5,422 | 60,401 |
Valley National Bancorp | 191,195 | 1,340,277 |
Veritex Holdings, Inc. | 23,608 | 459,884 |
Virginia National Bankshares Corp. | 2,256 | 63,642 |
WaFd, Inc. | 33,211 | 899,686 |
Washington Trust Bancorp, Inc. | 7,375 | 187,768 |
Webster Financial Corp. | 78,794 | 3,453,541 |
Wells Fargo & Co. | 1,636,995 | 97,106,543 |
WesBanco, Inc. | 28,444 | 767,988 |
West BanCorp, Inc. | 6,294 | 102,340 |
Westamerica BanCorp | 11,683 | 543,844 |
Western Alliance Bancorp | 48,934 | 2,780,919 |
Western New England Bancorp, Inc. | 10,349 | 62,508 |
William Penn Bancorp | 4,788 | 58,605 |
Wintrust Financial Corp. | 28,405 | 2,745,059 |
WSFS Financial Corp. | 28,278 | 1,208,319 |
Zions Bancorp NA | 66,517 | 2,712,563 |
804,669,651 | ||
Capital Goods 6.7% | ||
374Water, Inc. * | 24,532 | 36,553 |
3D Systems Corp. * | 57,208 | 191,647 |
3M Co. | 250,693 | 24,194,381 |
A O Smith Corp. | 55,488 | 4,596,626 |
AAON, Inc. | 30,751 | 2,893,362 |
AAR Corp. * | 15,508 | 1,072,223 |
Acuity Brands, Inc. | 14,056 | 3,490,105 |
Advanced Drainage Systems, Inc. | 30,856 | 4,844,392 |
AECOM | 62,336 | 5,757,353 |
AeroVironment, Inc. * | 13,018 | 2,080,146 |
AerSale Corp. * | 13,422 | 95,699 |
SECURITY | NUMBER OF SHARES | VALUE ($) |
AGCO Corp. | 28,277 | 3,228,951 |
Air Lease Corp., Class A | 46,954 | 2,358,969 |
Alamo Group, Inc. | 4,523 | 879,181 |
Albany International Corp., Class A | 14,231 | 1,134,922 |
Allegion PLC | 40,284 | 4,896,923 |
Allient, Inc. | 6,061 | 178,133 |
Allison Transmission Holdings, Inc. | 40,814 | 3,001,870 |
Alpha Pro Tech Ltd. * | 5,970 | 35,641 |
Alta Equipment Group, Inc. | 10,115 | 112,378 |
Ameresco, Inc., Class A * | 14,647 | 306,562 |
American Superconductor Corp. * | 15,966 | 197,180 |
American Woodmark Corp. * | 7,275 | 669,882 |
AMETEK, Inc. | 105,210 | 18,375,979 |
Amprius Technologies, Inc. *(a) | 6,864 | 12,836 |
API Group Corp. * | 95,749 | 3,693,039 |
Apogee Enterprises, Inc. | 9,815 | 606,371 |
Applied Industrial Technologies, Inc. | 17,335 | 3,176,639 |
Archer Aviation, Inc., Class A *(a) | 85,720 | 332,594 |
Arcosa, Inc. | 21,785 | 1,656,096 |
Argan, Inc. | 5,730 | 345,290 |
Armstrong World Industries, Inc. | 20,233 | 2,324,367 |
Array Technologies, Inc. * | 67,077 | 827,730 |
Astec Industries, Inc. | 9,833 | 411,019 |
Astronics Corp. * | 12,013 | 201,458 |
Atkore, Inc. | 16,714 | 2,929,964 |
Atmus Filtration Technologies, Inc. * | 37,740 | 1,143,145 |
Axon Enterprise, Inc. * | 32,035 | 10,048,098 |
AZEK Co., Inc., Class A * | 67,533 | 3,082,206 |
AZZ, Inc. | 13,226 | 947,378 |
Barnes Group, Inc. | 24,691 | 857,272 |
Beacon Roofing Supply, Inc. * | 29,289 | 2,885,845 |
Beam Global *(a) | 3,328 | 21,632 |
Bloom Energy Corp., Class A * | 99,158 | 1,103,629 |
Blue Bird Corp. * | 7,221 | 237,968 |
BlueLinx Holdings, Inc. * | 3,850 | 422,230 |
Boeing Co. * | 260,877 | 43,785,596 |
Boise Cascade Co. | 17,746 | 2,347,263 |
Bowman Consulting Group Ltd., Class A * | 6,300 | 204,687 |
Broadwind, Inc. * | 7,298 | 15,472 |
Builders FirstSource, Inc. * | 56,352 | 10,302,273 |
BWX Technologies, Inc. | 41,486 | 3,973,114 |
Byrna Technologies, Inc. * | 8,100 | 100,278 |
Cadre Holdings, Inc. | 8,267 | 275,704 |
Carlisle Cos., Inc. | 21,916 | 8,508,887 |
Carrier Global Corp. | 380,742 | 23,411,826 |
Caterpillar, Inc. | 231,565 | 77,474,702 |
ChargePoint Holdings, Inc. *(a) | 196,893 | 261,868 |
Chart Industries, Inc. * | 18,899 | 2,722,590 |
ClearSign Technologies Corp. * | 25,555 | 20,191 |
CNH Industrial NV * | 442,830 | 5,048,262 |
Columbus McKinnon Corp. | 11,948 | 493,094 |
Comfort Systems USA, Inc. | 16,181 | 5,006,563 |
Commercial Vehicle Group, Inc. * | 13,417 | 80,636 |
Concrete Pumping Holdings, Inc. * | 9,442 | 62,789 |
Construction Partners, Inc., Class A * | 19,811 | 1,023,040 |
Core & Main, Inc., Class A * | 76,992 | 4,347,738 |
CPI Aerostructures, Inc. * | 9,173 | 24,217 |
Crane Co. | 21,790 | 3,050,818 |
CSW Industrials, Inc. | 7,187 | 1,707,775 |
Cummins, Inc. | 62,113 | 17,546,301 |
Curtiss-Wright Corp. | 17,335 | 4,393,036 |
Custom Truck One Source, Inc. * | 24,214 | 120,828 |
Deere & Co. | 118,324 | 46,313,197 |
Desktop Metal, Inc., Class A *(a) | 150,462 | 117,721 |
Distribution Solutions Group, Inc. * | 4,920 | 162,212 |
DNOW, Inc. * | 46,130 | 650,894 |
Donaldson Co., Inc. | 55,044 | 3,974,177 |
SECURITY | NUMBER OF SHARES | VALUE ($) |
Douglas Dynamics, Inc. | 10,577 | 239,463 |
Dover Corp. | 63,291 | 11,348,076 |
Ducommun, Inc. * | 6,692 | 361,970 |
DXP Enterprises, Inc. * | 6,811 | 332,104 |
Dycom Industries, Inc. * | 13,550 | 1,897,271 |
Eastern Co. | 1,809 | 57,508 |
Eaton Corp. PLC | 181,627 | 57,804,609 |
EMCOR Group, Inc. | 21,512 | 7,683,441 |
Emerson Electric Co. | 259,541 | 27,973,329 |
Encore Wire Corp. | 7,016 | 1,959,990 |
Energy Recovery, Inc. * | 23,814 | 354,829 |
Energy Vault Holdings, Inc. *(a) | 35,879 | 45,566 |
Enerpac Tool Group Corp., Class A | 24,176 | 861,391 |
EnerSys | 18,542 | 1,677,124 |
Enovix Corp. *(a) | 65,857 | 412,265 |
Enpro, Inc. | 9,537 | 1,431,790 |
Eos Energy Enterprises, Inc. *(a) | 166,111 | 128,437 |
Esab Corp. | 25,979 | 2,750,657 |
ESCO Technologies, Inc. | 11,966 | 1,213,951 |
ESS Tech, Inc. * | 37,500 | 28,271 |
Eve Holding, Inc. *(a) | 13,706 | 73,875 |
EVI Industries, Inc. | 2,765 | 56,738 |
Fastenal Co. | 259,725 | 17,645,716 |
Federal Signal Corp. | 27,302 | 2,219,653 |
Ferguson PLC | 92,606 | 19,437,999 |
Flowserve Corp. | 59,998 | 2,829,506 |
Fluence Energy, Inc. * | 25,579 | 456,329 |
Fluor Corp. * | 76,171 | 3,071,976 |
Flux Power Holdings, Inc. * | 3,973 | 18,474 |
Fortive Corp. | 159,352 | 11,994,425 |
Fortune Brands Innovations, Inc. | 57,048 | 4,170,209 |
Franklin Electric Co., Inc. | 17,679 | 1,701,957 |
FreightCar America, Inc. * | 5,033 | 17,565 |
FTAI Aviation Ltd. | 46,347 | 3,254,023 |
FuelCell Energy, Inc. *(a) | 245,463 | 227,741 |
Gates Industrial Corp. PLC * | 78,823 | 1,388,861 |
GATX Corp. | 16,085 | 1,968,161 |
GE Vernova, Inc. * | 123,273 | 18,948,293 |
Gencor Industries, Inc. * | 3,418 | 58,003 |
Generac Holdings, Inc. * | 27,474 | 3,735,365 |
General Dynamics Corp. | 103,317 | 29,661,278 |
General Electric Co. | 495,045 | 80,108,182 |
Gibraltar Industries, Inc. * | 13,337 | 953,062 |
Global Industrial Co. | 6,777 | 260,982 |
GMS, Inc. * | 18,841 | 1,743,169 |
Gorman-Rupp Co. | 9,748 | 323,341 |
Graco, Inc. | 77,211 | 6,192,322 |
GrafTech International Ltd. | 88,000 | 151,360 |
Graham Corp. * | 4,043 | 112,557 |
Granite Construction, Inc. | 20,835 | 1,156,342 |
Great Lakes Dredge & Dock Corp. * | 30,154 | 199,016 |
Greenbrier Cos., Inc. | 15,526 | 766,829 |
Griffon Corp. | 17,893 | 1,172,349 |
H&E Equipment Services, Inc. | 14,463 | 698,418 |
Hayward Holdings, Inc. * | 54,969 | 746,479 |
HEICO Corp. | 46,220 | 9,586,028 |
Helios Technologies, Inc. | 16,121 | 727,057 |
Herc Holdings, Inc. | 12,917 | 1,847,519 |
Hexcel Corp. | 37,494 | 2,407,490 |
Hillenbrand, Inc. | 31,846 | 1,519,691 |
Hillman Solutions Corp. * | 86,449 | 826,452 |
Honeywell International, Inc. | 299,870 | 57,793,945 |
Howmet Aerospace, Inc. | 178,259 | 11,898,788 |
Hubbell, Inc., Class B | 24,250 | 8,985,110 |
Hudson Technologies, Inc. * | 17,443 | 173,035 |
Huntington Ingalls Industries, Inc. | 17,977 | 4,978,371 |
Hurco Cos., Inc. | 3,214 | 58,173 |
Hydrofarm Holdings Group, Inc. * | 27,153 | 26,341 |
SECURITY | NUMBER OF SHARES | VALUE ($) |
Hyliion Holdings Corp. * | 54,325 | 70,079 |
Hyster-Yale Materials Handling, Inc. | 4,451 | 260,695 |
Hyzon Motors, Inc. *(a) | 59,135 | 32,229 |
Ideal Power, Inc. * | 3,471 | 27,109 |
IDEX Corp. | 34,223 | 7,544,803 |
IES Holdings, Inc. * | 3,807 | 514,402 |
Illinois Tool Works, Inc. | 123,648 | 30,183,713 |
Ingersoll Rand, Inc. | 184,128 | 17,182,825 |
INNOVATE Corp. *(a) | 23,119 | 16,223 |
Innovative Solutions & Support, Inc. * | 6,865 | 44,485 |
Insteel Industries, Inc. | 8,973 | 288,033 |
Intuitive Machines, Inc. * | 4,780 | 24,187 |
ITT, Inc. | 37,201 | 4,811,577 |
Janus International Group, Inc. * | 42,467 | 611,949 |
JELD-WEN Holding, Inc. * | 41,048 | 841,484 |
John Bean Technologies Corp. | 14,561 | 1,297,239 |
Johnson Controls International PLC | 309,780 | 20,157,385 |
Kadant, Inc. | 5,473 | 1,498,453 |
Karat Packaging, Inc. | 3,014 | 81,679 |
Kennametal, Inc. | 34,295 | 806,961 |
Kratos Defense & Security Solutions, Inc. * | 65,438 | 1,166,105 |
L B Foster Co., Class A * | 5,290 | 122,993 |
L3Harris Technologies, Inc. | 86,130 | 18,436,126 |
Lennox International, Inc. | 14,503 | 6,720,980 |
Leonardo DRS, Inc. * | 30,996 | 667,034 |
Limbach Holdings, Inc. * | 4,683 | 212,280 |
Lincoln Electric Holdings, Inc. | 26,176 | 5,746,417 |
Lindsay Corp. | 4,679 | 543,466 |
Lockheed Martin Corp. | 97,751 | 45,447,372 |
LS Starrett Co., Class A * | 2,865 | 46,155 |
LSI Industries, Inc. | 12,912 | 188,515 |
Luxfer Holdings PLC | 12,212 | 117,602 |
Manitex International, Inc. * | 9,465 | 49,313 |
Manitowoc Co., Inc. * | 15,925 | 192,693 |
Masco Corp. | 99,743 | 6,827,408 |
Masonite International Corp. * | 10,179 | 1,349,226 |
MasTec, Inc. * | 27,749 | 2,461,059 |
Masterbrand, Inc. * | 54,311 | 905,364 |
Matrix Service Co. * | 10,847 | 122,137 |
Mayville Engineering Co., Inc. * | 3,327 | 45,780 |
McGrath RentCorp | 11,233 | 1,198,112 |
MDU Resources Group, Inc. | 92,911 | 2,294,902 |
Mega Matrix Corp. *(a) | 24,173 | 55,840 |
Mercury Systems, Inc. * | 26,411 | 744,790 |
Microvast Holdings, Inc. * | 86,292 | 33,818 |
Middleby Corp. * | 24,472 | 3,400,874 |
Miller Industries, Inc. | 5,104 | 248,616 |
Moog, Inc., Class A | 12,812 | 2,038,005 |
MRC Global, Inc. * | 35,400 | 397,542 |
MSC Industrial Direct Co., Inc., Class A | 21,058 | 1,921,332 |
Mueller Industries, Inc. | 52,122 | 2,909,450 |
Mueller Water Products, Inc., Class A | 73,402 | 1,162,688 |
MYR Group, Inc. * | 7,578 | 1,259,842 |
National Presto Industries, Inc. | 2,215 | 181,608 |
NeoVolta, Inc. * | 12,964 | 29,947 |
Net Power, Inc. * | 11,532 | 125,699 |
NEXTracker, Inc., Class A * | 56,212 | 2,405,311 |
Nikola Corp. *(a) | 475,977 | 295,391 |
NN, Inc. * | 28,401 | 101,108 |
Nordson Corp. | 24,814 | 6,406,727 |
Northrop Grumman Corp. | 64,151 | 31,115,160 |
Northwest Pipe Co. * | 4,286 | 135,652 |
NuScale Power Corp. *(a) | 18,303 | 106,157 |
nVent Electric PLC | 75,960 | 5,474,437 |
Ocean Power Technologies, Inc. * | 48,625 | 9,385 |
Omega Flex, Inc. | 1,422 | 94,222 |
SECURITY | NUMBER OF SHARES | VALUE ($) |
Optex Systems Holdings, Inc. * | 1,633 | 11,627 |
Orion Energy Systems, Inc. * | 16,987 | 14,689 |
Orion Group Holdings, Inc. * | 16,674 | 118,552 |
Oshkosh Corp. | 30,089 | 3,378,092 |
Otis Worldwide Corp. | 184,205 | 16,799,496 |
Owens Corning | 40,347 | 6,786,769 |
PACCAR, Inc. | 237,935 | 25,247,283 |
Palladyne AI Corp. *(a) | 16,115 | 21,755 |
Park Aerospace Corp. | 8,310 | 118,584 |
Parker-Hannifin Corp. | 58,410 | 31,828,193 |
Park-Ohio Holdings Corp. | 3,931 | 100,358 |
Pentair PLC | 75,010 | 5,932,541 |
Perma-Pipe International Holdings, Inc. * | 3,363 | 28,922 |
Plug Power, Inc. *(a) | 257,087 | 593,871 |
Powell Industries, Inc. | 4,127 | 590,161 |
Preformed Line Products Co. | 1,284 | 155,403 |
Primoris Services Corp. | 23,266 | 1,084,196 |
Proto Labs, Inc. * | 11,556 | 352,227 |
Quanex Building Products Corp. | 14,804 | 491,789 |
Quanta Services, Inc. | 66,048 | 17,077,371 |
RBC Bearings, Inc. * | 13,311 | 3,255,205 |
Redwire Corp. *(a) | 10,290 | 38,896 |
Regal Rexnord Corp. | 30,331 | 4,894,513 |
Resideo Technologies, Inc. * | 66,274 | 1,294,331 |
REV Group, Inc. | 17,261 | 377,325 |
Rocket Lab USA, Inc. * | 115,703 | 435,043 |
Rockwell Automation, Inc. | 51,956 | 14,077,998 |
RTX Corp. | 603,527 | 61,270,061 |
Rush Enterprises, Inc., Class A | 27,445 | 1,205,384 |
Rush Enterprises, Inc., Class B | 4,245 | 173,663 |
Sensata Technologies Holding PLC | 71,760 | 2,749,126 |
SES AI Corp. * | 59,899 | 94,640 |
Shoals Technologies Group, Inc., Class A * | 78,954 | 667,161 |
Shyft Group, Inc. | 13,268 | 144,356 |
Simpson Manufacturing Co., Inc. | 19,349 | 3,364,598 |
SiteOne Landscape Supply, Inc. * | 20,317 | 3,187,534 |
SKYX Platforms Corp. *(a) | 16,813 | 17,317 |
Snap-on, Inc. | 23,784 | 6,373,161 |
Southland Holdings, Inc. * | 4,155 | 18,199 |
Spirit AeroSystems Holdings, Inc., Class A * | 53,050 | 1,697,600 |
SPX Technologies, Inc. * | 20,639 | 2,514,037 |
Standex International Corp. | 5,059 | 874,600 |
Stanley Black & Decker, Inc. | 69,413 | 6,344,348 |
Stem, Inc. *(a) | 66,115 | 121,652 |
Sterling Infrastructure, Inc. * | 14,438 | 1,466,901 |
SunPower Corp. *(a) | 35,778 | 73,703 |
Sunrun, Inc. * | 100,949 | 1,038,765 |
Symbotic, Inc. *(a) | 16,004 | 617,274 |
Taylor Devices, Inc. * | 2,017 | 100,124 |
TechPrecision Corp. * | 4,478 | 21,808 |
Tecnoglass, Inc. | 9,961 | 553,334 |
Tennant Co. | 8,134 | 947,448 |
Terex Corp. | 30,889 | 1,731,328 |
Terran Orbital Corp. * | 140,347 | 185,258 |
Textron, Inc. | 89,512 | 7,571,820 |
Thermon Group Holdings, Inc. * | 14,491 | 462,698 |
Timken Co. | 29,679 | 2,647,960 |
Titan International, Inc. * | 20,997 | 231,387 |
Titan Machinery, Inc. * | 8,199 | 182,510 |
Toro Co. | 48,190 | 4,220,962 |
TPI Composites, Inc. * | 21,000 | 66,780 |
Trane Technologies PLC | 103,508 | 32,847,229 |
Transcat, Inc. * | 4,012 | 430,768 |
TransDigm Group, Inc. | 25,329 | 31,611,352 |
Trex Co., Inc. * | 49,341 | 4,369,146 |
SECURITY | NUMBER OF SHARES | VALUE ($) |
Trinity Industries, Inc. | 38,655 | 1,005,803 |
Triumph Group, Inc. * | 38,079 | 508,735 |
Tutor Perini Corp. * | 18,907 | 314,423 |
Twin Disc, Inc. | 5,599 | 90,032 |
UFP Industries, Inc. | 28,460 | 3,207,442 |
Ultralife Corp. * | 6,691 | 78,285 |
United Rentals, Inc. | 30,628 | 20,459,198 |
Urban-Gro, Inc. * | 4,382 | 9,158 |
V2X, Inc. * | 4,770 | 231,727 |
Valmont Industries, Inc. | 9,518 | 1,949,286 |
Vertiv Holdings Co., Class A | 159,479 | 14,831,547 |
Vicor Corp. * | 11,782 | 381,501 |
Virgin Galactic Holdings, Inc. * | 161,816 | 140,796 |
VirTra, Inc. * | 3,586 | 56,515 |
Wabash National Corp. | 19,725 | 455,845 |
Watsco, Inc. | 14,231 | 6,371,503 |
Watts Water Technologies, Inc., Class A | 12,334 | 2,447,806 |
WESCO International, Inc. | 19,943 | 3,046,293 |
Westinghouse Air Brake Technologies Corp. | 81,372 | 13,107,402 |
Westwater Resources, Inc. * | 34,475 | 15,303 |
Willis Lease Finance Corp. * | 1,159 | 56,339 |
WillScot Mobile Mini Holdings Corp. * | 88,444 | 3,268,890 |
Woodward, Inc. | 27,253 | 4,424,797 |
WW Grainger, Inc. | 20,131 | 18,547,697 |
Xometry, Inc., Class A * | 18,299 | 327,003 |
Xylem, Inc. | 109,709 | 14,338,966 |
Zurn Elkay Water Solutions Corp. | 65,405 | 2,045,868 |
1,497,163,702 | ||
Commercial & Professional Services 1.6% | ||
ABM Industries, Inc. | 28,429 | 1,242,347 |
ACCO Brands Corp. | 38,516 | 185,647 |
Acme United Corp. | 1,454 | 59,483 |
ACV Auctions, Inc., Class A * | 61,272 | 1,069,196 |
Alight, Inc., Class A * | 169,421 | 1,528,177 |
ARC Document Solutions, Inc. | 19,042 | 50,271 |
Aris Water Solutions, Inc., Class A | 14,973 | 210,071 |
ASGN, Inc. * | 21,209 | 2,045,608 |
Asure Software, Inc. * | 7,413 | 54,782 |
Automatic Data Processing, Inc. | 186,653 | 45,149,494 |
Barrett Business Services, Inc. | 3,084 | 374,706 |
BGSF, Inc. | 6,465 | 55,405 |
Blacksky Technology, Inc. * | 43,595 | 52,750 |
Booz Allen Hamilton Holding Corp., Class A | 59,085 | 8,725,082 |
Brady Corp., Class A | 19,596 | 1,156,164 |
BrightView Holdings, Inc. * | 19,228 | 216,315 |
Brink's Co. | 19,911 | 1,741,416 |
Broadridge Financial Solutions, Inc. | 53,657 | 10,377,800 |
CACI International, Inc., Class A * | 10,112 | 4,067,350 |
Casella Waste Systems, Inc., Class A * | 25,307 | 2,287,753 |
CBIZ, Inc. * | 23,252 | 1,655,077 |
CECO Environmental Corp. * | 12,430 | 268,737 |
Cimpress PLC * | 8,208 | 699,896 |
Cintas Corp. | 39,194 | 25,802,978 |
Clarivate PLC * | 200,493 | 1,355,333 |
Clean Harbors, Inc. * | 22,979 | 4,353,372 |
Concentrix Corp. | 21,127 | 1,155,013 |
Conduent, Inc. * | 68,566 | 215,983 |
Copart, Inc. * | 396,390 | 21,527,941 |
CoreCivic, Inc. * | 49,662 | 739,964 |
CRA International, Inc. | 2,904 | 421,341 |
CSG Systems International, Inc. | 12,935 | 611,049 |
Dayforce, Inc. * | 71,589 | 4,393,417 |
Deluxe Corp. | 19,740 | 389,865 |
SECURITY | NUMBER OF SHARES | VALUE ($) |
DLH Holdings Corp. * | 3,968 | 42,140 |
Driven Brands Holdings, Inc. * | 31,309 | 448,658 |
Dun & Bradstreet Holdings, Inc. | 103,398 | 940,922 |
Ennis, Inc. | 10,401 | 206,980 |
Enviri Corp. * | 34,248 | 266,449 |
Equifax, Inc. | 56,255 | 12,386,788 |
ExlService Holdings, Inc. * | 75,035 | 2,176,015 |
Exponent, Inc. | 22,633 | 2,080,199 |
First Advantage Corp. | 24,470 | 398,861 |
FiscalNote Holdings, Inc. * | 35,000 | 47,600 |
Forrester Research, Inc. * | 4,414 | 80,291 |
Franklin Covey Co. * | 5,263 | 204,941 |
FTI Consulting, Inc. * | 15,747 | 3,367,181 |
GEE Group, Inc. * | 66,522 | 20,908 |
Genpact Ltd. | 79,064 | 2,430,427 |
GEO Group, Inc. * | 52,634 | 782,141 |
Healthcare Services Group, Inc. * | 33,424 | 354,963 |
Heidrick & Struggles International, Inc. | 8,008 | 236,076 |
HireQuest, Inc. | 1,724 | 22,102 |
HireRight Holdings Corp. * | 8,556 | 122,351 |
HNI Corp. | 20,010 | 839,420 |
Hudson Global, Inc. * | 1,522 | 24,733 |
Huron Consulting Group, Inc. * | 8,075 | 752,913 |
ICF International, Inc. | 7,937 | 1,145,230 |
Innodata, Inc. *(a) | 11,159 | 65,169 |
Insperity, Inc. | 16,296 | 1,677,347 |
Interface, Inc., Class A | 23,118 | 353,474 |
Jacobs Solutions, Inc. | 57,333 | 8,229,005 |
KBR, Inc. | 61,122 | 3,969,263 |
Kelly Services, Inc., Class A | 14,539 | 333,525 |
Kforce, Inc. | 8,111 | 500,935 |
Korn Ferry | 24,435 | 1,483,693 |
LanzaTech Global, Inc. * | 41,157 | 89,105 |
Legalzoom.com, Inc. * | 58,398 | 697,856 |
Leidos Holdings, Inc. | 62,804 | 8,806,377 |
Liquidity Services, Inc. * | 10,485 | 180,971 |
ManpowerGroup, Inc. | 23,037 | 1,738,142 |
Mastech Digital, Inc. * | 3,073 | 27,288 |
Matthews International Corp., Class A | 12,972 | 349,985 |
Maximus, Inc. | 27,241 | 2,186,907 |
MillerKnoll, Inc. | 32,897 | 836,571 |
Mistras Group, Inc. * | 7,028 | 61,495 |
Montrose Environmental Group, Inc. * | 11,954 | 519,043 |
MSA Safety, Inc. | 16,898 | 3,048,399 |
NL Industries, Inc. | 5,834 | 47,897 |
NV5 Global, Inc. * | 6,242 | 582,004 |
Odyssey Marine Exploration, Inc., Class B * | 9,740 | 35,551 |
OPENLANE, Inc. * | 46,068 | 791,448 |
Parsons Corp. * | 19,123 | 1,501,347 |
Paychex, Inc. | 145,747 | 17,316,201 |
Paycom Software, Inc. | 22,108 | 4,155,862 |
Paycor HCM, Inc. * | 29,019 | 504,060 |
Paylocity Holding Corp. * | 20,057 | 3,112,044 |
Performant Financial Corp. * | 24,843 | 66,082 |
Perma-Fix Environmental Services, Inc. * | 5,410 | 61,945 |
Pitney Bowes, Inc. | 72,387 | 308,369 |
Planet Labs PBC * | 85,241 | 144,057 |
Quad/Graphics, Inc. | 10,911 | 48,990 |
Quest Resource Holding Corp. * | 7,972 | 80,836 |
RB Global, Inc. | 82,628 | 5,914,512 |
RCM Technologies, Inc. * | 3,160 | 59,882 |
Republic Services, Inc., Class A | 92,971 | 17,822,541 |
Resources Connection, Inc. | 13,566 | 149,904 |
Robert Half, Inc. | 48,156 | 3,329,506 |
Rollins, Inc. | 126,566 | 5,639,781 |
SECURITY | NUMBER OF SHARES | VALUE ($) |
Science Applications International Corp. | 23,997 | 3,088,414 |
SP Plus Corp. * | 8,590 | 438,605 |
Spire Global, Inc. * | 13,858 | 144,678 |
SS&C Technologies Holdings, Inc. | 97,772 | 6,051,109 |
Steel Connect, Inc. * | 3,096 | 38,669 |
Steelcase, Inc., Class A | 41,203 | 495,672 |
Stericycle, Inc. * | 41,790 | 1,869,267 |
Sterling Check Corp. * | 18,145 | 274,534 |
Team, Inc. * | 2,284 | 16,262 |
Tetra Tech, Inc. | 24,555 | 4,781,350 |
TransUnion | 88,758 | 6,479,334 |
TriNet Group, Inc. | 14,580 | 1,463,395 |
TrueBlue, Inc. * | 14,017 | 146,057 |
TTEC Holdings, Inc. | 8,462 | 61,603 |
UniFirst Corp. | 6,937 | 1,110,822 |
Upwork, Inc. * | 54,356 | 635,965 |
Veralto Corp. | 100,194 | 9,386,174 |
Verisk Analytics, Inc., Class A | 65,884 | 14,360,077 |
Verra Mobility Corp., Class A * | 74,041 | 1,745,887 |
Vestis Corp. | 61,471 | 1,132,296 |
Viad Corp. * | 9,565 | 329,801 |
Virco Mfg. Corp. | 8,190 | 87,387 |
VSE Corp. | 6,424 | 501,522 |
Waste Management, Inc. | 166,483 | 34,631,794 |
Where Food Comes From, Inc. * | 1,066 | 13,090 |
Willdan Group, Inc. * | 5,928 | 167,110 |
359,896,315 | ||
Consumer Discretionary Distribution & Retail 5.5% | ||
1-800-Flowers.com, Inc., Class A * | 11,856 | 107,534 |
1stdibs.com, Inc. * | 9,755 | 55,799 |
Aaron's Co., Inc. | 12,845 | 88,759 |
Abercrombie & Fitch Co., Class A * | 22,890 | 2,781,593 |
Academy Sports & Outdoors, Inc. | 33,236 | 1,937,659 |
Advance Auto Parts, Inc. | 27,690 | 2,020,816 |
Amazon.com, Inc. * | 4,157,869 | 727,627,075 |
AMCON Distributing Co. | 430 | 63,578 |
American Eagle Outfitters, Inc. | 84,396 | 2,047,447 |
America's Car-Mart, Inc. * | 2,651 | 151,743 |
Arhaus, Inc. | 18,293 | 231,589 |
Arko Corp. | 30,423 | 130,819 |
Asbury Automotive Group, Inc. * | 9,220 | 1,938,413 |
AutoNation, Inc. * | 11,624 | 1,873,208 |
AutoZone, Inc. * | 7,859 | 23,234,348 |
BARK, Inc. * | 57,147 | 62,862 |
Barnes & Noble Education, Inc. * | 11,885 | 2,417 |
Bath & Body Works, Inc. | 103,146 | 4,684,891 |
Best Buy Co., Inc. | 87,403 | 6,436,357 |
Beyond, Inc. * | 23,329 | 469,613 |
Big 5 Sporting Goods Corp. | 12,375 | 43,808 |
Big Lots, Inc. *(a) | 11,917 | 41,948 |
Boot Barn Holdings, Inc. * | 14,135 | 1,504,953 |
Buckle, Inc. | 12,881 | 481,621 |
Build-A-Bear Workshop, Inc. | 4,907 | 147,995 |
Burlington Stores, Inc. * | 29,502 | 5,308,590 |
Caleres, Inc. | 14,963 | 551,087 |
Camping World Holdings, Inc., Class A | 17,775 | 360,299 |
CarMax, Inc. * | 72,165 | 4,905,055 |
CarParts.com, Inc. * | 19,856 | 24,423 |
Carvana Co., Class A * | 47,257 | 3,918,550 |
Cato Corp., Class A | 7,948 | 38,309 |
Chewy, Inc., Class A * | 55,098 | 825,919 |
Children's Place, Inc. *(a) | 5,140 | 35,774 |
Citi Trends, Inc. * | 3,328 | 71,352 |
ContextLogic, Inc., Class A * | 9,687 | 53,763 |
SECURITY | NUMBER OF SHARES | VALUE ($) |
Designer Brands, Inc., Class A | 22,662 | 210,530 |
Destination XL Group, Inc. * | 23,026 | 73,913 |
Dick's Sporting Goods, Inc. | 26,889 | 5,403,076 |
Dillard's, Inc., Class A | 1,671 | 731,881 |
Duluth Holdings, Inc., Class B * | 5,930 | 24,965 |
eBay, Inc. | 236,739 | 12,201,528 |
Envela Corp. * | 4,047 | 17,362 |
Etsy, Inc. * | 53,952 | 3,704,884 |
EVgo, Inc., Class A *(a) | 53,220 | 96,328 |
Five Below, Inc. * | 24,848 | 3,636,256 |
Floor & Decor Holdings, Inc., Class A * | 48,495 | 5,350,453 |
Foot Locker, Inc. | 37,695 | 785,941 |
GameStop Corp., Class A *(a) | 122,867 | 1,362,595 |
Gap, Inc. | 97,133 | 1,993,169 |
Genesco, Inc. * | 5,301 | 134,168 |
Genuine Parts Co. | 63,869 | 10,040,846 |
Group 1 Automotive, Inc. | 6,053 | 1,779,703 |
Groupon, Inc., Class A *(a) | 10,000 | 115,600 |
Grove Collaborative Holdings *(a) | 30,520 | 45,780 |
Guess?, Inc. | 12,378 | 331,483 |
Haverty Furniture Cos., Inc. | 5,993 | 184,584 |
Hibbett, Inc. | 5,232 | 451,208 |
Home Depot, Inc. | 452,709 | 151,304,402 |
J Jill, Inc. * | 1,560 | 38,875 |
Kirkland's, Inc. *(a) | 6,028 | 11,513 |
Kohl's Corp. | 51,320 | 1,228,601 |
Lands' End, Inc. * | 4,426 | 60,548 |
Lazydays Holdings, Inc. * | 5,770 | 20,426 |
Leslie's, Inc. * | 81,713 | 321,132 |
Lithia Motors, Inc., Class A | 12,499 | 3,179,496 |
LKQ Corp. | 120,641 | 5,203,246 |
LL Flooring Holdings, Inc. * | 17,182 | 27,148 |
Lowe's Cos., Inc. | 261,599 | 59,641,956 |
Macy's, Inc. | 122,724 | 2,261,803 |
MarineMax, Inc. * | 9,973 | 246,034 |
Monro, Inc. | 13,330 | 363,243 |
Murphy USA, Inc. | 8,739 | 3,616,373 |
National Vision Holdings, Inc. * | 33,045 | 575,644 |
Nordstrom, Inc. | 41,618 | 791,158 |
ODP Corp. * | 14,773 | 752,093 |
Ollie's Bargain Outlet Holdings, Inc. * | 28,375 | 2,075,348 |
OneWater Marine, Inc., Class A * | 4,282 | 88,680 |
O'Reilly Automotive, Inc. * | 26,870 | 27,226,296 |
Penske Automotive Group, Inc. | 8,480 | 1,296,677 |
Petco Health & Wellness Co., Inc., Class A * | 38,893 | 58,340 |
Pool Corp. | 17,535 | 6,356,964 |
Qurate Retail, Inc. * | 147,875 | 121,479 |
RealReal, Inc. *(a) | 43,796 | 167,301 |
Revolve Group, Inc. * | 18,087 | 360,112 |
RH * | 7,107 | 1,755,784 |
Ross Stores, Inc. | 153,196 | 19,846,542 |
RumbleON, Inc., Class B * | 6,108 | 31,517 |
Sally Beauty Holdings, Inc. * | 52,790 | 572,772 |
Savers Value Village, Inc. * | 10,670 | 176,268 |
Shoe Carnival, Inc. | 7,662 | 256,217 |
Signet Jewelers Ltd. | 20,487 | 2,008,341 |
Sleep Number Corp. * | 9,204 | 122,505 |
Sonic Automotive, Inc., Class A | 6,954 | 402,219 |
Sportsman's Warehouse Holdings, Inc. * | 14,642 | 46,854 |
Stitch Fix, Inc., Class A * | 35,867 | 76,038 |
Tandy Leather Factory, Inc. * | 3,329 | 15,813 |
ThredUp, Inc., Class A * | 31,702 | 50,723 |
Tile Shop Holdings, Inc. * | 15,152 | 101,821 |
Tilly's, Inc., Class A * | 9,759 | 59,237 |
TJX Cos., Inc. | 518,734 | 48,807,682 |
Tractor Supply Co. | 48,871 | 13,345,693 |
SECURITY | NUMBER OF SHARES | VALUE ($) |
Ulta Beauty, Inc. * | 22,175 | 8,977,327 |
Upbound Group, Inc. | 18,628 | 577,654 |
Urban Outfitters, Inc. * | 25,860 | 1,007,506 |
Valvoline, Inc. * | 59,157 | 2,515,356 |
Victoria's Secret & Co. * | 39,845 | 702,069 |
Warby Parker, Inc., Class A * | 32,957 | 386,915 |
Wayfair, Inc., Class A * | 41,312 | 2,071,797 |
Weyco Group, Inc. | 3,125 | 91,719 |
Williams-Sonoma, Inc. | 29,292 | 8,400,360 |
Winmark Corp. | 1,442 | 518,139 |
Zumiez, Inc. * | 6,961 | 119,729 |
1,223,375,704 | ||
Consumer Durables & Apparel 1.1% | ||
Acushnet Holdings Corp. | 13,529 | 824,998 |
American Outdoor Brands, Inc. * | 6,310 | 49,344 |
AMMO, Inc. * | 41,078 | 104,338 |
Aterian, Inc. * | 3,271 | 7,425 |
Bassett Furniture Industries, Inc. | 4,101 | 57,332 |
Beazer Homes USA, Inc. * | 12,137 | 340,200 |
Brunswick Corp. | 30,997 | 2,499,598 |
Capri Holdings Ltd. * | 52,409 | 1,859,471 |
Carter's, Inc. | 16,335 | 1,117,477 |
Cavco Industries, Inc. * | 3,534 | 1,287,118 |
Century Communities, Inc. | 12,516 | 992,769 |
Clarus Corp. | 11,806 | 74,732 |
Columbia Sportswear Co. | 15,285 | 1,217,145 |
Cricut, Inc., Class A | 21,338 | 113,518 |
Crocs, Inc. * | 27,679 | 3,442,437 |
Crown Crafts, Inc. | 5,621 | 28,667 |
Culp, Inc. * | 2,586 | 11,792 |
Deckers Outdoor Corp. * | 11,618 | 9,508,984 |
DR Horton, Inc. | 135,495 | 19,306,683 |
Dream Finders Homes, Inc., Class A * | 11,475 | 407,363 |
Escalade, Inc. | 3,803 | 47,385 |
Ethan Allen Interiors, Inc. | 10,573 | 298,582 |
Figs, Inc., Class A * | 52,953 | 270,590 |
Flexsteel Industries, Inc. | 2,656 | 87,542 |
Funko, Inc., Class A * | 14,201 | 86,484 |
Garmin Ltd. | 69,830 | 10,088,340 |
G-III Apparel Group Ltd. * | 17,626 | 496,172 |
GoPro, Inc., Class A * | 54,737 | 94,695 |
Green Brick Partners, Inc. * | 11,324 | 612,968 |
Hamilton Beach Brands Holding Co., Class A | 3,706 | 75,380 |
Hanesbrands, Inc. * | 171,255 | 780,923 |
Hasbro, Inc. | 60,210 | 3,690,873 |
Helen of Troy Ltd. * | 11,293 | 1,046,974 |
Hooker Furnishings Corp. | 5,571 | 94,707 |
Hovnanian Enterprises, Inc., Class A * | 2,021 | 298,764 |
Installed Building Products, Inc. | 10,712 | 2,525,140 |
iRobot Corp. * | 11,608 | 99,364 |
JAKKS Pacific, Inc. * | 5,309 | 100,393 |
Johnson Outdoors, Inc., Class A | 2,681 | 109,948 |
KB Home | 34,561 | 2,238,170 |
Kontoor Brands, Inc. | 23,446 | 1,455,059 |
Lakeland Industries, Inc. | 3,608 | 59,712 |
Landsea Homes Corp. * | 6,542 | 75,560 |
Latham Group, Inc. * | 20,641 | 57,795 |
La-Z-Boy, Inc. | 19,021 | 624,650 |
Legacy Housing Corp. * | 4,652 | 94,761 |
Leggett & Platt, Inc. | 63,973 | 1,155,992 |
Lennar Corp., Class A | 117,606 | 17,831,422 |
Levi Strauss & Co., Class A | 49,226 | 1,044,576 |
LGI Homes, Inc. * | 9,067 | 815,395 |
Lifetime Brands, Inc. | 5,690 | 52,007 |
Live Ventures, Inc. * | 537 | 13,715 |
SECURITY | NUMBER OF SHARES | VALUE ($) |
Lovesac Co. * | 6,938 | 153,885 |
Lululemon Athletica, Inc. * | 52,351 | 18,877,771 |
M/I Homes, Inc. * | 12,695 | 1,475,413 |
Malibu Boats, Inc., Class A * | 8,904 | 302,914 |
Marine Products Corp. | 5,165 | 55,524 |
MasterCraft Boat Holdings, Inc. * | 7,841 | 158,623 |
Mattel, Inc. * | 159,829 | 2,928,067 |
Meritage Homes Corp. | 16,430 | 2,723,108 |
Mohawk Industries, Inc. * | 23,919 | 2,758,339 |
Movado Group, Inc. | 6,936 | 176,660 |
Newell Brands, Inc. | 185,295 | 1,471,242 |
NIKE, Inc., Class B | 553,315 | 51,048,842 |
NVR, Inc. * | 1,457 | 10,838,404 |
Oxford Industries, Inc. | 6,214 | 669,745 |
Peloton Interactive, Inc., Class A * | 158,683 | 493,504 |
PLBY Group, Inc. * | 2,314 | 2,268 |
Polaris, Inc. | 24,306 | 2,069,899 |
PulteGroup, Inc. | 96,729 | 10,777,545 |
Purple Innovation, Inc., Class A * | 27,507 | 41,811 |
PVH Corp. | 27,592 | 3,002,010 |
Ralph Lauren Corp., Class A | 18,131 | 2,966,957 |
Rocky Brands, Inc. | 2,880 | 74,218 |
Skechers USA, Inc., Class A * | 60,769 | 4,013,792 |
Skyline Champion Corp. * | 24,310 | 1,823,007 |
Smith & Wesson Brands, Inc. | 20,549 | 348,717 |
Smith Douglas Homes Corp. * | 4,614 | 134,129 |
Snap One Holdings Corp. * | 8,443 | 89,327 |
Solo Brands, Inc., Class A * | 14,864 | 27,944 |
Sonos, Inc. * | 60,399 | 1,020,743 |
Steven Madden Ltd. | 32,680 | 1,320,599 |
Sturm Ruger & Co., Inc. | 7,968 | 368,361 |
Superior Group of Cos., Inc. | 5,398 | 87,825 |
Tapestry, Inc. | 104,896 | 4,187,448 |
Taylor Morrison Home Corp., Class A * | 48,752 | 2,730,600 |
Tempur Sealy International, Inc. | 78,252 | 3,917,295 |
Toll Brothers, Inc. | 47,320 | 5,636,285 |
TopBuild Corp. * | 14,216 | 5,752,789 |
Topgolf Callaway Brands Corp. * | 68,746 | 1,101,311 |
Traeger, Inc. * | 23,917 | 51,422 |
Tri Pointe Homes, Inc. * | 43,323 | 1,596,453 |
Tupperware Brands Corp. *(a)(b) | 19,817 | 21,006 |
Under Armour, Inc., Class A * | 168,301 | 1,132,666 |
Unifi, Inc. * | 5,875 | 35,074 |
United Homes Group, Inc. * | 3,328 | 22,231 |
Universal Electronics, Inc. * | 5,590 | 63,111 |
Vera Bradley, Inc. * | 11,087 | 73,063 |
VF Corp. | 149,038 | 1,857,014 |
Vista Outdoor, Inc. * | 27,538 | 966,308 |
Vizio Holding Corp., Class A * | 45,618 | 483,551 |
VOXX International Corp., Class A * | 5,522 | 32,580 |
Whirlpool Corp. | 24,663 | 2,339,532 |
Wolverine World Wide, Inc. | 33,611 | 360,982 |
Worthington Enterprises, Inc. | 14,782 | 844,939 |
YETI Holdings, Inc. * | 38,879 | 1,388,758 |
Yunhong Green CTI Ltd. * | 20,213 | 28,096 |
246,599,136 | ||
Consumer Services 2.3% | ||
2U, Inc. * | 79,877 | 19,809 |
Accel Entertainment, Inc., Class A * | 23,774 | 255,333 |
ADT, Inc. | 122,154 | 794,001 |
Adtalem Global Education, Inc. * | 18,877 | 936,677 |
Airbnb, Inc., Class A * | 197,650 | 31,341,360 |
American Public Education, Inc. * | 8,505 | 117,624 |
Aramark | 120,371 | 3,792,890 |
Bally's Corp. * | 11,844 | 155,630 |
Beachbody Co., Inc. * | 1,211 | 11,505 |
SECURITY | NUMBER OF SHARES | VALUE ($) |
Biglari Holdings, Inc., Class B * | 514 | 101,315 |
BJ's Restaurants, Inc. * | 10,196 | 332,288 |
Bloomin' Brands, Inc. | 40,982 | 1,056,926 |
Booking Holdings, Inc. | 15,870 | 54,783,716 |
Bowlero Corp., Class A (a) | 14,987 | 176,097 |
Boyd Gaming Corp. | 30,860 | 1,651,319 |
Bright Horizons Family Solutions, Inc. * | 26,006 | 2,697,082 |
Brinker International, Inc. * | 21,173 | 1,134,873 |
Caesars Entertainment, Inc. * | 97,134 | 3,479,340 |
Canterbury Park Holding Corp. | 1,452 | 33,396 |
Carnival Corp. * | 456,270 | 6,761,921 |
Carriage Services, Inc., Class A | 5,752 | 147,136 |
Carrols Restaurant Group, Inc. | 16,994 | 161,783 |
Cava Group, Inc. * | 6,946 | 499,695 |
Century Casinos, Inc. * | 13,792 | 40,962 |
Cheesecake Factory, Inc. | 20,167 | 696,165 |
Chegg, Inc. * | 50,436 | 260,754 |
Chipotle Mexican Grill, Inc., Class A * | 12,464 | 39,381,254 |
Choice Hotels International, Inc. (a) | 11,454 | 1,354,550 |
Churchill Downs, Inc. | 30,477 | 3,931,533 |
Chuy's Holdings, Inc. * | 8,171 | 240,718 |
Coursera, Inc. * | 45,455 | 464,550 |
Cracker Barrel Old Country Store, Inc. (a) | 11,203 | 651,903 |
Darden Restaurants, Inc. | 54,034 | 8,289,356 |
Dave & Buster's Entertainment, Inc. * | 14,984 | 800,146 |
Denny's Corp. * | 24,016 | 192,608 |
Dine Brands Global, Inc. | 6,725 | 296,572 |
Domino's Pizza, Inc. | 15,720 | 8,320,124 |
DoorDash, Inc., Class A * | 138,168 | 17,859,596 |
DraftKings, Inc., Class A * | 212,161 | 8,817,411 |
Duolingo, Inc. * | 16,464 | 3,716,748 |
Dutch Bros, Inc., Class A * | 33,025 | 929,984 |
El Pollo Loco Holdings, Inc. * | 9,086 | 77,413 |
European Wax Center, Inc., Class A * | 14,659 | 172,390 |
Everi Holdings, Inc. * | 38,486 | 314,431 |
Expedia Group, Inc. * | 59,557 | 8,018,159 |
First Watch Restaurant Group, Inc. * | 10,809 | 275,846 |
Frontdoor, Inc. * | 35,506 | 1,089,679 |
Full House Resorts, Inc. * | 15,255 | 77,800 |
GAN Ltd. * | 31,476 | 37,142 |
Global Business Travel Group I * | 25,286 | 152,980 |
Golden Entertainment, Inc. | 9,398 | 301,206 |
Graham Holdings Co., Class B | 1,610 | 1,129,206 |
Grand Canyon Education, Inc. * | 13,768 | 1,790,115 |
H&R Block, Inc. | 63,338 | 2,991,454 |
Hall of Fame Resort & Entertainment Co. *(a) | 3,096 | 9,660 |
Hilton Grand Vacations, Inc. * | 32,843 | 1,367,583 |
Hilton Worldwide Holdings, Inc. | 114,416 | 22,571,988 |
Hyatt Hotels Corp., Class A | 19,972 | 2,971,634 |
Inspirato, Inc. * | 1,919 | 7,657 |
Inspired Entertainment, Inc. * | 10,938 | 92,973 |
Jack in the Box, Inc. | 8,973 | 512,089 |
Krispy Kreme, Inc. | 37,458 | 473,844 |
Kura Sushi USA, Inc., Class A * | 2,156 | 237,332 |
Las Vegas Sands Corp. | 168,723 | 7,484,552 |
Laureate Education, Inc. | 58,971 | 855,079 |
Life Time Group Holdings, Inc. * | 31,649 | 432,325 |
Light & Wonder, Inc. * | 41,267 | 3,683,492 |
Lincoln Educational Services Corp. * | 10,639 | 113,412 |
Lindblad Expeditions Holdings, Inc. * | 13,166 | 96,638 |
Marriott International, Inc., Class A | 111,932 | 26,430,503 |
Marriott Vacations Worldwide Corp. | 14,742 | 1,416,854 |
McDonald's Corp. | 329,932 | 90,084,633 |
MGM Resorts International * | 124,537 | 4,911,739 |
Mister Car Wash, Inc. * | 47,073 | 314,918 |
SECURITY | NUMBER OF SHARES | VALUE ($) |
Monarch Casino & Resort, Inc. | 5,776 | 391,440 |
Mondee Holdings, Inc., Class A * | 17,472 | 38,264 |
Nathan's Famous, Inc. | 1,235 | 79,793 |
Nerdy, Inc. * | 26,826 | 69,479 |
Noodles & Co., Class A * | 16,309 | 24,627 |
Norwegian Cruise Line Holdings Ltd. * | 193,672 | 3,664,274 |
ONE Group Hospitality, Inc. * | 12,060 | 64,642 |
OneSpaWorld Holdings Ltd. * | 40,012 | 508,953 |
Papa John's International, Inc. | 14,323 | 883,586 |
Penn Entertainment, Inc. * | 66,091 | 1,093,145 |
Perdoceo Education Corp. | 27,838 | 509,435 |
Planet Fitness, Inc., Class A * | 37,940 | 2,270,330 |
Playa Hotels & Resorts NV * | 52,884 | 475,956 |
PlayAGS, Inc. * | 23,905 | 211,320 |
Portillo's, Inc., Class A * | 24,798 | 304,023 |
Potbelly Corp. * | 11,690 | 119,121 |
Rave Restaurant Group, Inc. * | 10,012 | 20,525 |
RCI Hospitality Holdings, Inc. | 3,668 | 186,188 |
Red Robin Gourmet Burgers, Inc. * | 6,715 | 50,698 |
Red Rock Resorts, Inc., Class A | 23,238 | 1,234,403 |
Regis Corp. * | 1,641 | 8,615 |
Royal Caribbean Cruises Ltd. * | 107,414 | 14,998,217 |
Rush Street Interactive, Inc. * | 31,726 | 202,729 |
Sabre Corp. * | 172,600 | 495,362 |
Service Corp. International | 66,430 | 4,763,695 |
Shake Shack, Inc., Class A * | 17,416 | 1,843,484 |
Six Flags Entertainment Corp. * | 32,321 | 762,129 |
Soho House & Co., Inc. * | 16,810 | 87,580 |
Starbucks Corp. | 514,540 | 45,531,645 |
Strategic Education, Inc. | 9,508 | 1,091,899 |
Stride, Inc. * | 17,428 | 1,163,319 |
Sweetgreen, Inc., Class A * | 40,339 | 906,417 |
Target Hospitality Corp. * | 10,745 | 119,538 |
Texas Roadhouse, Inc., Class A | 30,333 | 4,876,940 |
Travel & Leisure Co. | 32,601 | 1,419,448 |
Udemy, Inc. * | 40,027 | 401,071 |
United Parks & Resorts, Inc. * | 16,942 | 860,992 |
Universal Technical Institute, Inc. * | 21,431 | 326,180 |
Vail Resorts, Inc. | 17,201 | 3,257,353 |
Wendy's Co. | 77,071 | 1,540,649 |
Wingstop, Inc. | 13,286 | 5,112,320 |
WW International, Inc. * | 36,376 | 65,841 |
Wyndham Hotels & Resorts, Inc. | 38,347 | 2,818,888 |
Wynn Resorts Ltd. | 43,289 | 3,967,437 |
Xponential Fitness, Inc., Class A * | 9,583 | 122,183 |
Yum! Brands, Inc. | 128,061 | 18,088,616 |
514,216,125 | ||
Consumer Staples Distribution & Retail 1.8% | ||
Albertsons Cos., Inc., Class A | 183,419 | 3,741,748 |
Andersons, Inc. | 13,831 | 759,875 |
BJ's Wholesale Club Holdings, Inc. * | 60,699 | 4,533,001 |
Casey's General Stores, Inc. | 16,757 | 5,355,202 |
Chefs' Warehouse, Inc. * | 17,993 | 595,208 |
Costco Wholesale Corp. | 202,075 | 146,080,017 |
Dollar General Corp. | 99,225 | 13,811,128 |
Dollar Tree, Inc. * | 93,536 | 11,060,632 |
Grocery Outlet Holding Corp. * | 47,258 | 1,227,290 |
Ingles Markets, Inc., Class A | 6,246 | 448,150 |
Kroger Co. | 299,947 | 16,611,065 |
Natural Grocers by Vitamin Cottage, Inc. | 4,452 | 72,835 |
Performance Food Group Co. * | 69,983 | 4,750,446 |
PriceSmart, Inc. | 11,274 | 908,572 |
SpartanNash Co. | 15,368 | 293,375 |
Sprouts Farmers Market, Inc. * | 46,441 | 3,066,499 |
Sysco Corp. | 226,562 | 16,838,088 |
SECURITY | NUMBER OF SHARES | VALUE ($) |
Target Corp. | 209,374 | 33,705,027 |
U.S. Foods Holding Corp. * | 103,706 | 5,211,226 |
United Natural Foods, Inc. * | 25,620 | 228,787 |
Village Super Market, Inc., Class A | 2,371 | 66,317 |
Walgreens Boots Alliance, Inc. | 325,583 | 5,772,587 |
Walmart, Inc. | 1,947,117 | 115,561,394 |
Weis Markets, Inc. | 8,874 | 560,216 |
391,258,685 | ||
Energy 4.2% | ||
Adams Resources & Energy, Inc. | 794 | 23,423 |
Aemetis, Inc. * | 14,199 | 55,376 |
American Resources Corp. *(a) | 38,760 | 55,427 |
Amplify Energy Corp. * | 16,372 | 115,586 |
Antero Midstream Corp. | 151,508 | 2,096,871 |
Antero Resources Corp. * | 127,511 | 4,336,649 |
APA Corp. | 162,885 | 5,121,104 |
Archrock, Inc. | 64,257 | 1,233,092 |
Atlas Energy Solutions, Inc., Class A | 24,182 | 537,082 |
Baker Hughes Co., Class A | 456,343 | 14,885,909 |
Berry Corp. | 27,783 | 235,878 |
Bristow Group, Inc. * | 9,727 | 255,917 |
Cactus, Inc., Class A | 29,031 | 1,441,099 |
California Resources Corp. | 30,067 | 1,589,342 |
Centrus Energy Corp., Class A * | 5,939 | 254,961 |
ChampionX Corp. | 89,262 | 2,996,525 |
Cheniere Energy, Inc. | 108,095 | 17,059,553 |
Chesapeake Energy Corp. | 51,111 | 4,593,857 |
Chevron Corp. | 788,940 | 127,232,354 |
Chord Energy Corp. | 18,990 | 3,360,850 |
Civitas Resources, Inc. | 38,616 | 2,778,807 |
Clean Energy Fuels Corp. * | 78,451 | 182,006 |
CNX Resources Corp. * | 70,699 | 1,662,840 |
Comstock Resources, Inc. | 50,535 | 508,382 |
Comstock, Inc. * | 59,927 | 16,630 |
ConocoPhillips | 535,877 | 67,316,869 |
CONSOL Energy, Inc. | 12,540 | 1,037,810 |
Core Laboratories, Inc. | 20,776 | 328,261 |
Coterra Energy, Inc. | 341,621 | 9,346,751 |
Crescent Energy Co., Class A | 40,522 | 431,154 |
CVR Energy, Inc. | 11,947 | 362,950 |
Delek U.S. Holdings, Inc. | 25,894 | 707,683 |
Devon Energy Corp. | 291,830 | 14,935,859 |
Diamond Offshore Drilling, Inc. * | 43,981 | 538,327 |
Diamondback Energy, Inc. | 81,186 | 16,328,940 |
DMC Global, Inc. * | 8,614 | 136,532 |
Dorian LPG Ltd. | 17,028 | 703,597 |
Dril-Quip, Inc. * | 14,876 | 270,446 |
DT Midstream, Inc. | 43,410 | 2,700,102 |
Empire Petroleum Corp. *(a) | 4,255 | 22,041 |
EOG Resources, Inc. | 265,311 | 35,055,542 |
Epsilon Energy Ltd. | 5,425 | 29,404 |
EQT Corp. | 188,478 | 7,556,083 |
Equitrans Midstream Corp. | 197,327 | 2,669,834 |
Evolution Petroleum Corp. | 15,426 | 83,300 |
Excelerate Energy, Inc., Class A | 7,154 | 120,616 |
Expro Group Holdings NV * | 37,621 | 705,770 |
Exxon Mobil Corp. | 1,806,267 | 213,627,198 |
Forum Energy Technologies, Inc. * | 4,222 | 78,740 |
FutureFuel Corp. | 9,399 | 50,943 |
Geospace Technologies Corp. * | 3,725 | 45,259 |
Granite Ridge Resources, Inc. | 22,980 | 149,830 |
Green Plains, Inc. * | 28,596 | 591,079 |
Gulf Island Fabrication, Inc. * | 6,007 | 41,448 |
Gulfport Energy Corp. * | 4,553 | 722,607 |
Hallador Energy Co. * | 10,747 | 54,917 |
Halliburton Co. | 406,274 | 15,223,087 |
SECURITY | NUMBER OF SHARES | VALUE ($) |
Helix Energy Solutions Group, Inc. * | 60,683 | 651,735 |
Helmerich & Payne, Inc. | 44,341 | 1,743,932 |
Hess Corp. | 125,471 | 19,760,428 |
HF Sinclair Corp. | 70,334 | 3,815,619 |
HighPeak Energy, Inc. (a) | 11,338 | 161,113 |
Houston American Energy Corp. * | 4,107 | 6,612 |
Independence Contract Drilling, Inc. *(a) | 7,301 | 13,653 |
International Seaways, Inc. | 17,558 | 970,782 |
Kinder Morgan, Inc. | 884,070 | 16,160,800 |
Kinetik Holdings, Inc., Class A | 15,778 | 604,929 |
KLX Energy Services Holdings, Inc. *(a) | 8,329 | 55,221 |
Kodiak Gas Services, Inc. | 10,144 | 275,714 |
Kosmos Energy Ltd. * | 217,678 | 1,234,234 |
Liberty Energy, Inc., Class A | 69,697 | 1,533,334 |
Lightbridge Corp. * | 5,562 | 13,794 |
Magnolia Oil & Gas Corp., Class A | 86,005 | 2,156,145 |
Mammoth Energy Services, Inc. * | 10,739 | 34,902 |
Marathon Oil Corp. | 265,610 | 7,131,628 |
Marathon Petroleum Corp. | 167,390 | 30,418,111 |
Matador Resources Co. | 49,925 | 3,110,327 |
Murphy Oil Corp. | 64,788 | 2,892,136 |
Nabors Industries Ltd. * | 3,829 | 275,803 |
NACCO Industries, Inc., Class A | 1,966 | 54,144 |
Natural Gas Services Group, Inc. * | 4,213 | 93,023 |
New Fortress Energy, Inc. | 28,877 | 756,577 |
Newpark Resources, Inc. * | 32,811 | 227,708 |
NextDecade Corp. * | 49,946 | 320,653 |
Nine Energy Service, Inc. *(a) | 5,821 | 12,573 |
Noble Corp. PLC | 49,473 | 2,195,612 |
Northern Oil & Gas, Inc. | 42,384 | 1,728,843 |
NOV, Inc. | 179,177 | 3,312,983 |
Occidental Petroleum Corp. | 299,430 | 19,804,300 |
Oceaneering International, Inc. * | 48,506 | 1,111,272 |
Oil States International, Inc. * | 29,052 | 115,917 |
ONEOK, Inc. | 264,274 | 20,909,359 |
OPAL Fuels, Inc., Class A * | 5,715 | 26,746 |
Overseas Shipholding Group, Inc., Class A | 30,088 | 182,935 |
Ovintiv, Inc. | 114,638 | 5,883,222 |
Par Pacific Holdings, Inc. * | 26,679 | 821,713 |
Patterson-UTI Energy, Inc. | 144,426 | 1,562,689 |
PBF Energy, Inc., Class A | 49,131 | 2,617,208 |
Peabody Energy Corp. | 49,804 | 1,092,700 |
Permian Resources Corp., Class A | 208,522 | 3,492,743 |
Phillips 66 | 195,357 | 27,977,076 |
PHX Minerals, Inc. | 18,580 | 62,243 |
Pioneer Natural Resources Co. | 106,477 | 28,676,386 |
PrimeEnergy Resources Corp. * | 362 | 37,091 |
Profire Energy, Inc. * | 27,669 | 50,081 |
ProFrac Holding Corp., Class A * | 13,542 | 98,450 |
ProPetro Holding Corp. * | 39,887 | 347,815 |
Range Resources Corp. | 109,316 | 3,925,538 |
Ranger Energy Services, Inc. | 5,075 | 49,938 |
REX American Resources Corp. * | 6,150 | 340,280 |
Riley Exploration Permian, Inc. | 1,796 | 46,570 |
Ring Energy, Inc. * | 11,664 | 22,162 |
RPC, Inc. | 36,343 | 243,135 |
SandRidge Energy, Inc. | 12,685 | 173,785 |
Schlumberger NV | 649,331 | 30,830,236 |
SEACOR Marine Holdings, Inc. * | 10,252 | 125,279 |
Select Water Solutions, Inc. | 33,094 | 305,789 |
SilverBow Resources, Inc. * | 5,751 | 176,671 |
Sitio Royalties Corp., Class A | 35,149 | 816,863 |
SM Energy Co. | 52,363 | 2,539,082 |
Smart Sand, Inc. * | 17,439 | 36,448 |
SECURITY | NUMBER OF SHARES | VALUE ($) |
Solaris Oilfield Infrastructure, Inc., Class A | 15,678 | 138,123 |
Southwestern Energy Co. * | 500,626 | 3,749,689 |
Talos Energy, Inc. * | 58,300 | 768,394 |
Targa Resources Corp. | 101,711 | 11,601,157 |
TechnipFMC PLC | 198,635 | 5,089,029 |
Tellurian, Inc. * | 286,293 | 123,135 |
TETRA Technologies, Inc. * | 48,733 | 209,065 |
Texas Pacific Land Corp. | 8,502 | 4,899,703 |
Tidewater, Inc. * | 22,034 | 2,023,823 |
Transocean Ltd. * | 320,856 | 1,674,868 |
U.S. Silica Holdings, Inc. * | 33,313 | 514,020 |
Uranium Energy Corp. * | 180,582 | 1,218,928 |
VAALCO Energy, Inc. | 43,433 | 277,971 |
Valaris Ltd. * | 27,793 | 1,808,213 |
Valero Energy Corp. | 154,882 | 24,760,985 |
Vertex Energy, Inc. * | 44,352 | 57,658 |
Viper Energy, Inc. | 40,000 | 1,526,400 |
Vital Energy, Inc. * | 11,591 | 614,555 |
Vitesse Energy, Inc. | 10,573 | 234,615 |
W&T Offshore, Inc. | 41,992 | 94,482 |
Weatherford International PLC * | 33,365 | 4,124,581 |
Williams Cos., Inc. | 552,847 | 21,207,211 |
World Kinect Corp. | 27,459 | 645,287 |
928,189,181 | ||
Equity Real Estate Investment Trusts (REITs) 2.4% | ||
Acadia Realty Trust | 46,117 | 796,902 |
Agree Realty Corp. | 45,582 | 2,608,202 |
Alexander & Baldwin, Inc. | 35,571 | 585,854 |
Alexander's, Inc. | 964 | 203,944 |
Alexandria Real Estate Equities, Inc. | 72,230 | 8,369,290 |
Alpine Income Property Trust, Inc. | 4,623 | 69,021 |
American Assets Trust, Inc. | 21,772 | 464,832 |
American Healthcare REIT, Inc. | 27,000 | 370,710 |
American Homes 4 Rent, Class A | 145,574 | 5,211,549 |
American Tower Corp. | 211,874 | 36,349,103 |
Americold Realty Trust, Inc. | 123,643 | 2,716,437 |
Apartment Income REIT Corp. | 66,082 | 2,536,227 |
Apartment Investment & Management Co., Class A * | 64,227 | 513,816 |
Apple Hospitality REIT, Inc. | 95,824 | 1,414,362 |
Armada Hoffler Properties, Inc. | 28,123 | 295,854 |
Ashford Hospitality Trust, Inc. *(b) | 12,463 | 14,582 |
AvalonBay Communities, Inc. | 64,240 | 12,177,977 |
Bluerock Homes Trust, Inc. | 1,536 | 25,851 |
Boston Properties, Inc. | 66,270 | 4,101,450 |
Braemar Hotels & Resorts, Inc. | 24,766 | 67,611 |
Brandywine Realty Trust | 80,539 | 365,647 |
Brixmor Property Group, Inc. | 135,990 | 3,005,379 |
Broadstone Net Lease, Inc. | 87,052 | 1,267,477 |
BRT Apartments Corp. | 5,530 | 99,208 |
Camden Property Trust | 48,318 | 4,816,338 |
CareTrust REIT, Inc. | 61,209 | 1,513,087 |
CBL & Associates Properties, Inc. | 10,443 | 227,135 |
Centerspace | 6,268 | 421,523 |
Chatham Lodging Trust | 21,672 | 198,732 |
City Office REIT, Inc. | 16,407 | 76,457 |
Clipper Realty, Inc. | 5,283 | 22,189 |
Community Healthcare Trust, Inc. | 10,035 | 266,229 |
COPT Defense Properties | 51,553 | 1,235,725 |
Cousins Properties, Inc. | 70,257 | 1,611,696 |
Creative Media & Community Trust Corp. | 3,238 | 10,750 |
Crown Castle, Inc. | 196,742 | 18,450,465 |
CTO Realty Growth, Inc. | 7,821 | 135,694 |
CubeSmart | 101,521 | 4,105,509 |
SECURITY | NUMBER OF SHARES | VALUE ($) |
DiamondRock Hospitality Co. | 99,179 | 882,693 |
Digital Realty Trust, Inc. | 138,137 | 19,170,653 |
Diversified Healthcare Trust (b) | 100,000 | 236,000 |
Douglas Emmett, Inc. | 73,469 | 1,007,260 |
Easterly Government Properties, Inc., Class A | 42,425 | 495,948 |
EastGroup Properties, Inc. | 21,981 | 3,414,968 |
Elme Communities | 40,011 | 606,567 |
Empire State Realty Trust, Inc., Class A | 58,131 | 528,992 |
EPR Properties | 35,314 | 1,433,395 |
Equinix, Inc. | 42,703 | 30,366,530 |
Equity Commonwealth * | 45,821 | 857,769 |
Equity LifeStyle Properties, Inc. | 85,698 | 5,166,732 |
Equity Residential | 156,373 | 10,070,421 |
Essential Properties Realty Trust, Inc. | 69,415 | 1,828,391 |
Essex Property Trust, Inc. | 29,324 | 7,221,035 |
Extra Space Storage, Inc. | 96,286 | 12,929,284 |
Farmland Partners, Inc. | 21,207 | 228,187 |
Federal Realty Investment Trust | 33,653 | 3,505,633 |
First Industrial Realty Trust, Inc. | 59,960 | 2,723,383 |
Four Corners Property Trust, Inc. | 42,097 | 987,175 |
Franklin Street Properties Corp., Class C | 36,290 | 67,499 |
Gaming & Leisure Properties, Inc. | 121,084 | 5,173,919 |
Generation Income Properties, Inc. | 894 | 3,379 |
Getty Realty Corp. | 23,634 | 640,481 |
Gladstone Commercial Corp. | 16,360 | 218,733 |
Gladstone Land Corp. | 14,746 | 186,979 |
Global Medical REIT, Inc. | 26,096 | 211,639 |
Global Net Lease, Inc. | 84,810 | 589,430 |
Global Self Storage, Inc. | 1,987 | 8,326 |
Healthcare Realty Trust, Inc., Class A | 173,781 | 2,472,904 |
Healthpeak Properties, Inc. | 326,712 | 6,080,110 |
Highwoods Properties, Inc. | 49,859 | 1,306,306 |
Host Hotels & Resorts, Inc. | 318,406 | 6,008,321 |
Hudson Pacific Properties, Inc. | 56,547 | 327,973 |
Independence Realty Trust, Inc. | 103,075 | 1,625,493 |
Industrial Logistics Properties Trust | 24,875 | 87,560 |
Innovative Industrial Properties, Inc. | 12,910 | 1,334,894 |
InvenTrust Properties Corp. | 29,223 | 740,511 |
Invitation Homes, Inc. | 262,003 | 8,960,503 |
Iron Mountain, Inc. | 132,194 | 10,247,679 |
JBG SMITH Properties | 40,899 | 613,894 |
Kilroy Realty Corp. | 48,504 | 1,639,435 |
Kimco Realty Corp. | 305,865 | 5,698,265 |
Kite Realty Group Trust | 99,353 | 2,165,895 |
Lamar Advertising Co., Class A | 39,410 | 4,565,649 |
LTC Properties, Inc. | 17,442 | 577,330 |
LXP Industrial Trust | 139,647 | 1,166,052 |
Macerich Co. | 99,583 | 1,370,262 |
Medical Properties Trust, Inc. (a) | 278,519 | 1,281,187 |
Mid-America Apartment Communities, Inc. | 52,853 | 6,870,890 |
Modiv Industrial, Inc., Class C | 3,196 | 47,844 |
National Health Investors, Inc. | 20,414 | 1,287,307 |
National Storage Affiliates Trust | 35,246 | 1,235,020 |
NET Lease Office Properties | 6,279 | 143,538 |
NETSTREIT Corp. | 34,339 | 578,612 |
New Century Financial Corp. *(c) | 3,600 | 0 |
NexPoint Diversified Real Estate Trust | 15,748 | 94,173 |
NexPoint Residential Trust, Inc. | 9,644 | 330,211 |
NNN REIT, Inc. | 84,116 | 3,409,222 |
Office Properties Income Trust | 29,171 | 58,925 |
Omega Healthcare Investors, Inc. | 113,277 | 3,444,754 |
One Liberty Properties, Inc. | 6,163 | 141,194 |
Outfront Media, Inc. | 65,718 | 1,042,287 |
Paramount Group, Inc. | 73,678 | 341,866 |
SECURITY | NUMBER OF SHARES | VALUE ($) |
Park Hotels & Resorts, Inc. | 92,416 | 1,490,670 |
Peakstone Realty Trust | 15,426 | 215,501 |
Pebblebrook Hotel Trust | 53,690 | 780,116 |
Phillips Edison & Co., Inc. | 55,440 | 1,812,888 |
Piedmont Office Realty Trust, Inc., Class A | 53,125 | 366,031 |
Plymouth Industrial REIT, Inc. | 16,461 | 343,706 |
Postal Realty Trust, Inc., Class A | 7,337 | 101,617 |
PotlatchDeltic Corp. | 36,149 | 1,446,322 |
Presidio Property Trust, Inc., Class A | 8,865 | 7,619 |
Prologis, Inc. | 420,500 | 42,912,025 |
Public Storage | 72,042 | 18,691,297 |
Rayonier, Inc. | 62,919 | 1,866,178 |
Realty Income Corp. | 377,326 | 20,202,034 |
Regency Centers Corp. | 73,868 | 4,374,463 |
Retail Opportunity Investments Corp. | 53,563 | 657,218 |
Rexford Industrial Realty, Inc. | 95,257 | 4,077,952 |
RLJ Lodging Trust | 69,831 | 768,141 |
Ryman Hospitality Properties, Inc. | 27,387 | 2,888,781 |
Sabra Health Care REIT, Inc. | 104,314 | 1,452,051 |
Safehold, Inc. | 21,044 | 383,843 |
Saul Centers, Inc. | 5,768 | 210,013 |
SBA Communications Corp., Class A | 49,088 | 9,136,259 |
Service Properties Trust | 87,224 | 534,683 |
Simon Property Group, Inc. | 148,246 | 20,833,010 |
SITE Centers Corp. | 84,716 | 1,142,819 |
SL Green Realty Corp. | 28,543 | 1,422,298 |
STAG Industrial, Inc. | 81,841 | 2,814,512 |
Summit Hotel Properties, Inc. | 47,221 | 283,798 |
Sun Communities, Inc. | 56,298 | 6,267,093 |
Sunstone Hotel Investors, Inc. | 90,577 | 923,885 |
Tanger, Inc. | 48,488 | 1,374,635 |
Terreno Realty Corp. | 42,356 | 2,302,049 |
UDR, Inc. | 137,470 | 5,234,858 |
UMH Properties, Inc. | 25,601 | 407,568 |
Uniti Group, Inc. | 117,986 | 678,420 |
Universal Health Realty Income Trust | 5,432 | 195,715 |
Urban Edge Properties | 55,572 | 929,720 |
Ventas, Inc. | 183,879 | 8,142,162 |
Veris Residential, Inc. | 34,121 | 491,684 |
VICI Properties, Inc., Class A | 470,776 | 13,440,655 |
Vornado Realty Trust | 71,356 | 1,857,397 |
Welltower, Inc. | 251,445 | 23,957,680 |
Weyerhaeuser Co. | 330,491 | 9,970,913 |
Whitestone REIT | 20,066 | 230,759 |
WP Carey, Inc. | 98,679 | 5,411,556 |
Xenia Hotels & Resorts, Inc. | 45,844 | 635,856 |
528,448,731 | ||
Financial Services 7.8% | ||
Acacia Research Corp. * | 29,703 | 144,654 |
ACRES Commercial Realty Corp. | 3,144 | 41,815 |
AFC Gamma, Inc. | 8,444 | 101,328 |
Affiliated Managers Group, Inc. | 15,236 | 2,378,340 |
Affirm Holdings, Inc. * | 107,616 | 3,430,798 |
AG Mortgage Investment Trust, Inc. | 13,958 | 77,327 |
AGNC Investment Corp. | 313,416 | 2,867,756 |
Alerus Financial Corp. | 8,490 | 167,253 |
Ally Financial, Inc. | 124,296 | 4,766,752 |
AlTi Global, Inc. * | 9,783 | 45,002 |
A-Mark Precious Metals, Inc. | 8,227 | 329,656 |
American Express Co. | 260,118 | 60,875,416 |
Ameriprise Financial, Inc. | 45,597 | 18,776,389 |
Angel Oak Mortgage REIT, Inc. | 9,942 | 104,689 |
Annaly Capital Management, Inc. | 226,910 | 4,252,293 |
Apollo Commercial Real Estate Finance, Inc. | 61,373 | 591,022 |
SECURITY | NUMBER OF SHARES | VALUE ($) |
Apollo Global Management, Inc. | 198,343 | 21,496,414 |
Arbor Realty Trust, Inc. (a) | 83,347 | 1,069,342 |
Ares Commercial Real Estate Corp. | 22,535 | 153,013 |
ARES Management Corp., Class A | 77,148 | 10,267,627 |
ARMOUR Residential REIT, Inc. | 21,511 | 390,855 |
Artisan Partners Asset Management, Inc., Class A | 31,419 | 1,285,980 |
AssetMark Financial Holdings, Inc. * | 9,288 | 314,027 |
Associated Capital Group, Inc., Class A | 1,818 | 59,067 |
Atlanticus Holdings Corp. * | 2,144 | 56,709 |
AvidXchange Holdings, Inc. * | 75,290 | 877,881 |
B Riley Financial, Inc. (a) | 6,796 | 233,782 |
Bank of New York Mellon Corp. | 345,488 | 19,516,617 |
Berkshire Hathaway, Inc., Class B * | 827,600 | 328,333,748 |
Better Home & Finance Holding Co. * | 212,871 | 84,510 |
BGC Group, Inc., Class A | 171,274 | 1,341,075 |
BlackRock, Inc. | 63,654 | 48,035,855 |
Blackstone Mortgage Trust, Inc., Class A (a) | 78,268 | 1,380,648 |
Blackstone, Inc. | 327,210 | 38,155,958 |
Block, Inc. * | 253,199 | 18,483,527 |
Blue Owl Capital, Inc., Class A | 184,413 | 3,483,562 |
BM Technologies, Inc. * | 10,210 | 16,234 |
Bread Financial Holdings, Inc. | 21,541 | 795,078 |
Bridge Investment Group Holdings, Inc., Class A | 13,376 | 88,014 |
Brightsphere Investment Group, Inc. | 14,000 | 311,360 |
BrightSpire Capital, Inc., Class A | 69,114 | 434,727 |
Cannae Holdings, Inc. * | 25,712 | 500,098 |
Cantaloupe, Inc. * | 26,721 | 154,715 |
Capital One Financial Corp. | 173,250 | 24,849,247 |
Carlyle Group, Inc. | 98,545 | 4,414,816 |
Cass Information Systems, Inc. | 5,702 | 246,269 |
Cboe Global Markets, Inc. | 48,019 | 8,698,642 |
Charles Schwab Corp. (d) | 671,907 | 49,687,523 |
Cherry Hill Mortgage Investment Corp. | 15,001 | 51,603 |
Chicago Atlantic Real Estate Finance, Inc. | 9,254 | 145,658 |
Chimera Investment Corp. | 98,492 | 405,787 |
Claros Mortgage Trust, Inc. | 50,991 | 443,622 |
CME Group, Inc. | 163,992 | 34,379,283 |
Cohen & Steers, Inc. | 11,667 | 802,456 |
Coinbase Global, Inc., Class A * | 77,723 | 15,850,051 |
Consumer Portfolio Services, Inc. * | 5,099 | 43,647 |
Corebridge Financial, Inc. (a) | 109,893 | 2,918,758 |
Corpay, Inc. * | 32,979 | 9,964,275 |
Credit Acceptance Corp. * | 2,821 | 1,449,204 |
Diamond Hill Investment Group, Inc. | 1,364 | 203,536 |
Discover Financial Services | 113,531 | 14,387,784 |
Donnelley Financial Solutions, Inc. * | 11,044 | 693,342 |
Dynex Capital, Inc. | 22,582 | 263,532 |
Ellington Credit Co. | 6,980 | 46,138 |
Ellington Financial, Inc. | 33,849 | 387,233 |
Enact Holdings, Inc. | 14,940 | 444,166 |
Encore Capital Group, Inc. * | 9,929 | 407,983 |
Enova International, Inc. * | 13,316 | 806,017 |
Equitable Holdings, Inc. | 144,040 | 5,316,516 |
Essent Group Ltd. | 47,371 | 2,509,242 |
Euronet Worldwide, Inc. * | 20,230 | 2,077,216 |
Evercore, Inc., Class A | 15,791 | 2,866,066 |
EVERTEC, Inc. | 29,799 | 1,118,356 |
EZCORP, Inc., Class A * | 25,151 | 276,158 |
FactSet Research Systems, Inc. | 17,367 | 7,240,129 |
Federal Agricultural Mortgage Corp., Class C | 4,622 | 860,293 |
SECURITY | NUMBER OF SHARES | VALUE ($) |
Federated Hermes, Inc. | 38,340 | 1,259,469 |
Fidelity National Information Services, Inc. | 269,046 | 18,273,604 |
Finance of America Cos., Inc., Class A * | 18,960 | 9,101 |
FirstCash Holdings, Inc. | 16,707 | 1,887,557 |
Fiserv, Inc. * | 272,653 | 41,625,934 |
Flywire Corp. * | 51,215 | 1,049,908 |
Forge Global Holdings, Inc. * | 45,163 | 82,648 |
Franklin BSP Realty Trust, Inc. | 34,676 | 433,103 |
Franklin Resources, Inc. | 135,716 | 3,099,753 |
GCM Grosvenor, Inc., Class A | 19,770 | 186,629 |
Global Payments, Inc. | 118,501 | 14,548,368 |
Goldman Sachs Group, Inc. | 148,337 | 63,296,881 |
Granite Point Mortgage Trust, Inc. | 23,489 | 100,768 |
Great Ajax Corp. | 9,397 | 32,420 |
Green Dot Corp., Class A * | 20,026 | 175,228 |
Guild Holdings Co., Class A | 4,604 | 62,108 |
Hamilton Lane, Inc., Class A | 16,653 | 1,860,473 |
Hannon Armstrong Sustainable Infrastructure Capital, Inc. | 49,093 | 1,227,816 |
Heritage Global, Inc. * | 16,791 | 41,306 |
Houlihan Lokey, Inc., Class A | 23,392 | 2,982,246 |
I3 Verticals, Inc., Class A * | 10,325 | 234,481 |
Interactive Brokers Group, Inc., Class A | 48,347 | 5,565,707 |
Intercontinental Exchange, Inc. | 260,272 | 33,512,623 |
International Money Express, Inc. * | 18,445 | 373,142 |
Invesco Ltd. | 201,667 | 2,857,621 |
Invesco Mortgage Capital, Inc. | 18,784 | 160,603 |
Jack Henry & Associates, Inc. | 32,952 | 5,360,961 |
Jackson Financial, Inc., Class A | 31,704 | 2,166,017 |
Janus Henderson Group PLC | 59,917 | 1,870,609 |
Jefferies Financial Group, Inc. | 76,607 | 3,298,697 |
Katapult Holdings, Inc. * | 2,511 | 32,982 |
KKR & Co., Inc. | 301,919 | 28,099,601 |
KKR Real Estate Finance Trust, Inc. | 24,272 | 228,400 |
Ladder Capital Corp., Class A | 54,768 | 587,661 |
Lazard, Inc. | 51,551 | 1,984,713 |
LendingClub Corp. * | 46,098 | 346,657 |
LendingTree, Inc. * | 4,315 | 208,285 |
loanDepot, Inc., Class A * | 36,984 | 76,927 |
LPL Financial Holdings, Inc. | 34,013 | 9,153,919 |
Lument Finance Trust, Inc. | 24,035 | 56,723 |
Manhattan Bridge Capital, Inc. | 7,727 | 39,099 |
MarketAxess Holdings, Inc. | 17,632 | 3,527,987 |
Marqeta, Inc., Class A * | 205,057 | 1,138,066 |
Mastercard, Inc., Class A | 375,277 | 169,324,982 |
Medallion Financial Corp. | 6,557 | 48,260 |
Merchants Bancorp | 12,767 | 514,893 |
MFA Financial, Inc. | 47,437 | 502,358 |
MGIC Investment Corp. | 125,438 | 2,543,883 |
Moelis & Co., Class A | 30,835 | 1,513,382 |
Moneylion, Inc. * | 2,380 | 157,818 |
Moody's Corp. | 71,467 | 26,466,374 |
Morgan Stanley | 569,850 | 51,765,174 |
Morningstar, Inc. | 11,728 | 3,314,919 |
Mr Cooper Group, Inc. * | 29,229 | 2,256,479 |
MSCI, Inc., Class A | 35,899 | 16,721,395 |
Nasdaq, Inc. | 172,152 | 10,303,297 |
Navient Corp. | 37,356 | 561,087 |
NCR Atleos Corp. * | 28,535 | 568,703 |
Nelnet, Inc., Class A | 7,716 | 726,693 |
NerdWallet, Inc., Class A * | 22,319 | 280,550 |
New York Mortgage Trust, Inc. | 40,532 | 277,644 |
NewtekOne, Inc. | 11,192 | 120,762 |
Nexpoint Real Estate Finance, Inc. | 5,703 | 73,911 |
Nicholas Financial, Inc. * | 6,032 | 38,665 |
SECURITY | NUMBER OF SHARES | VALUE ($) |
NMI Holdings, Inc., Class A * | 36,089 | 1,113,707 |
Northern Trust Corp. | 93,438 | 7,698,357 |
Ocwen Financial Corp. * | 3,090 | 72,121 |
OneMain Holdings, Inc. | 54,286 | 2,828,843 |
Open Lending Corp., Class A * | 44,911 | 229,046 |
Oportun Financial Corp. * | 13,044 | 41,349 |
Oppenheimer Holdings, Inc., Class A | 3,500 | 140,175 |
OppFi, Inc. | 7,166 | 19,133 |
Orchid Island Capital, Inc. (a) | 30,417 | 253,374 |
P10, Inc., Class A | 29,037 | 206,163 |
Paymentus Holdings, Inc., Class A * | 8,752 | 178,628 |
Payoneer Global, Inc. * | 113,997 | 563,145 |
PayPal Holdings, Inc. * | 488,172 | 33,156,642 |
Paysign, Inc. * | 9,553 | 43,944 |
PennyMac Financial Services, Inc. | 12,693 | 1,087,029 |
PennyMac Mortgage Investment Trust | 37,798 | 523,502 |
Perella Weinberg Partners, Class A | 19,698 | 293,894 |
Piper Sandler Cos. | 7,045 | 1,379,341 |
PJT Partners, Inc., Class A | 10,452 | 987,609 |
PRA Group, Inc. * | 16,584 | 394,533 |
Priority Technology Holdings, Inc. * | 9,469 | 30,395 |
PROG Holdings, Inc. | 19,924 | 662,274 |
Radian Group, Inc. | 71,257 | 2,128,447 |
Raymond James Financial, Inc. | 85,433 | 10,422,826 |
Ready Capital Corp. | 69,762 | 594,372 |
Redwood Trust, Inc. | 69,393 | 383,743 |
Regional Management Corp. | 3,411 | 85,991 |
Remitly Global, Inc. * | 63,447 | 1,131,260 |
Repay Holdings Corp., Class A * | 32,506 | 330,586 |
Rithm Capital Corp. | 214,168 | 2,381,548 |
Robinhood Markets, Inc., Class A * | 237,488 | 3,916,177 |
Rocket Cos., Inc., Class A * | 58,600 | 719,608 |
Ryvyl, Inc. * | 1,042 | 1,386 |
S&P Global, Inc. | 146,148 | 60,772,723 |
Sachem Capital Corp. | 16,351 | 50,688 |
Security National Financial Corp., Class A * | 7,050 | 46,389 |
SEI Investments Co. | 45,583 | 3,006,199 |
Seven Hills Realty Trust | 5,666 | 71,108 |
Sezzle, Inc. * | 1,400 | 70,882 |
Shift4 Payments, Inc., Class A * | 25,975 | 1,502,913 |
Silvercrest Asset Management Group, Inc., Class A | 3,213 | 47,070 |
SLM Corp. | 103,311 | 2,189,160 |
SoFi Technologies, Inc. * | 446,993 | 3,030,613 |
Starwood Property Trust, Inc. | 132,523 | 2,513,961 |
State Street Corp. | 137,859 | 9,993,399 |
StepStone Group, Inc., Class A | 25,199 | 908,928 |
Stifel Financial Corp. | 47,043 | 3,759,677 |
StoneX Group, Inc. * | 12,675 | 920,205 |
SWK Holdings Corp. * | 1,451 | 25,160 |
Synchrony Financial | 183,898 | 8,087,834 |
T Rowe Price Group, Inc. | 101,767 | 11,150,610 |
Toast, Inc., Class A * | 168,491 | 3,981,442 |
TPG RE Finance Trust, Inc. | 24,952 | 182,898 |
TPG, Inc. | 34,397 | 1,482,511 |
Tradeweb Markets, Inc., Class A | 52,904 | 5,380,866 |
Two Harbors Investment Corp. | 51,925 | 655,813 |
U.S. Global Investors, Inc., Class A | 6,234 | 16,707 |
Upstart Holdings, Inc. * | 33,301 | 736,951 |
Usio, Inc. * | 17,787 | 26,325 |
UWM Holdings Corp. | 43,383 | 273,313 |
Velocity Financial, Inc. * | 8,532 | 146,324 |
Victory Capital Holdings, Inc., Class A | 16,586 | 843,564 |
Virtu Financial, Inc., Class A | 42,853 | 929,910 |
Virtus Investment Partners, Inc. | 2,899 | 635,809 |
Visa, Inc., Class A | 719,409 | 193,240,451 |
Voya Financial, Inc. | 47,448 | 3,234,056 |
SECURITY | NUMBER OF SHARES | VALUE ($) |
Walker & Dunlop, Inc. | 14,790 | 1,355,208 |
Waterstone Financial, Inc. | 8,861 | 100,484 |
Western Union Co. | 164,344 | 2,208,783 |
Westwood Holdings Group, Inc. | 2,653 | 33,003 |
WEX, Inc. * | 19,361 | 4,090,205 |
WisdomTree, Inc. | 51,234 | 455,983 |
World Acceptance Corp. * | 1,349 | 185,582 |
1,734,066,346 | ||
Food, Beverage & Tobacco 2.6% | ||
Alico, Inc. | 2,213 | 61,765 |
Altria Group, Inc. | 801,268 | 35,103,551 |
Archer-Daniels-Midland Co. | 242,906 | 14,248,866 |
B&G Foods, Inc. | 42,071 | 466,988 |
Beyond Meat, Inc. *(a) | 28,812 | 195,345 |
Boston Beer Co., Inc., Class A * | 4,323 | 1,203,566 |
BRC, Inc., Class A * | 18,823 | 73,410 |
Brown-Forman Corp., Class B | 108,375 | 5,185,744 |
Bunge Global SA | 65,435 | 6,658,666 |
Calavo Growers, Inc. | 7,291 | 196,492 |
Cal-Maine Foods, Inc. | 18,796 | 1,039,983 |
Campbell Soup Co. | 90,559 | 4,139,452 |
Celsius Holdings, Inc. * | 67,508 | 4,811,295 |
Coca-Cola Co. | 1,771,082 | 109,399,735 |
Coca-Cola Consolidated, Inc. | 2,124 | 1,754,424 |
Conagra Brands, Inc. | 219,655 | 6,760,981 |
Constellation Brands, Inc., Class A | 72,929 | 18,484,584 |
Darling Ingredients, Inc. * | 72,463 | 3,070,257 |
Duckhorn Portfolio, Inc. * | 19,046 | 161,320 |
Farmer Bros Co. * | 11,781 | 36,521 |
Flowers Foods, Inc. | 86,037 | 2,145,763 |
Fresh Del Monte Produce, Inc. | 13,508 | 345,400 |
Freshpet, Inc. * | 21,989 | 2,332,373 |
General Mills, Inc. | 258,267 | 18,197,493 |
Hain Celestial Group, Inc. * | 55,489 | 340,702 |
Hershey Co. | 68,453 | 13,274,406 |
Hormel Foods Corp. | 130,450 | 4,638,802 |
Ingredion, Inc. | 29,234 | 3,349,924 |
J & J Snack Foods Corp. | 7,048 | 967,620 |
J M Smucker Co. | 48,724 | 5,595,951 |
John B Sanfilippo & Son, Inc. | 3,955 | 394,314 |
Kellanova | 120,376 | 6,964,955 |
Keurig Dr Pepper, Inc. | 474,379 | 15,986,572 |
Kraft Heinz Co. | 360,131 | 13,904,658 |
Lamb Weston Holdings, Inc. | 65,349 | 5,446,186 |
Lancaster Colony Corp. | 9,421 | 1,797,621 |
Lifeway Foods, Inc. * | 6,566 | 134,275 |
Limoneira Co. | 7,226 | 142,930 |
Mama's Creations, Inc. * | 7,154 | 42,495 |
McCormick & Co., Inc. - Non Voting Shares | 114,886 | 8,738,229 |
MGP Ingredients, Inc. | 7,544 | 591,751 |
Mission Produce, Inc. * | 18,304 | 207,750 |
Molson Coors Beverage Co., Class B | 84,014 | 4,810,642 |
Mondelez International, Inc., Class A | 612,138 | 44,037,208 |
Monster Beverage Corp. * | 337,483 | 18,038,466 |
National Beverage Corp. * | 9,990 | 444,555 |
PepsiCo, Inc. | 625,179 | 109,975,238 |
Philip Morris International, Inc. | 706,158 | 67,042,641 |
Pilgrim's Pride Corp. * | 19,693 | 709,342 |
Post Holdings, Inc. * | 23,321 | 2,475,524 |
Sadot Group, Inc. * | 27,734 | 7,627 |
Seaboard Corp. | 109 | 360,802 |
Seneca Foods Corp., Class A * | 2,612 | 151,731 |
Simply Good Foods Co. * | 42,953 | 1,565,637 |
Splash Beverage Group, Inc. * | 20,360 | 6,698 |
Tootsie Roll Industries, Inc. | 7,644 | 227,103 |
SECURITY | NUMBER OF SHARES | VALUE ($) |
TreeHouse Foods, Inc. * | 22,159 | 832,070 |
Turning Point Brands, Inc. | 9,980 | 287,823 |
Tyson Foods, Inc., Class A | 129,015 | 7,824,760 |
Universal Corp. | 10,446 | 537,238 |
Utz Brands, Inc. | 29,813 | 537,528 |
Vector Group Ltd. | 56,584 | 585,644 |
Vintage Wine Estates, Inc. * | 29,567 | 6,032 |
Vita Coco Co., Inc. * | 13,490 | 326,998 |
Vital Farms, Inc. * | 11,214 | 300,087 |
Westrock Coffee Co. *(a) | 15,240 | 154,534 |
Whole Earth Brands, Inc. * | 12,768 | 61,542 |
WK Kellogg Co. | 28,636 | 668,364 |
Zevia PBC, Class A * | 20,011 | 17,227 |
580,586,176 | ||
Health Care Equipment & Services 5.0% | ||
Abbott Laboratories | 789,672 | 83,681,542 |
Acadia Healthcare Co., Inc. * | 41,960 | 3,102,522 |
Accolade, Inc. * | 35,923 | 274,092 |
Accuray, Inc. * | 36,635 | 78,033 |
AdaptHealth Corp., Class A * | 43,913 | 432,543 |
Addus HomeCare Corp. * | 7,000 | 673,050 |
Agiliti, Inc. * | 14,918 | 151,418 |
agilon health, Inc. * | 138,167 | 759,918 |
AirSculpt Technologies, Inc. *(a) | 4,242 | 23,373 |
Akili, Inc., Class A * | 8,840 | 3,536 |
Align Technology, Inc. * | 32,528 | 9,185,257 |
Alignment Healthcare, Inc. * | 51,148 | 263,412 |
Alphatec Holdings, Inc. * | 41,583 | 524,777 |
Amedisys, Inc. * | 15,348 | 1,412,783 |
American Well Corp., Class A * | 125,000 | 63,813 |
AMN Healthcare Services, Inc. * | 17,098 | 1,025,538 |
AngioDynamics, Inc. * | 16,851 | 97,567 |
Apyx Medical Corp. * | 12,488 | 17,858 |
Artivion, Inc. * | 17,724 | 347,745 |
Asensus Surgical, Inc. * | 88,725 | 21,880 |
Astrana Health, Inc. * | 19,744 | 733,490 |
AtriCure, Inc. * | 21,692 | 523,211 |
Atrion Corp. | 563 | 238,312 |
Augmedix, Inc. * | 11,589 | 31,406 |
Avanos Medical, Inc. * | 19,723 | 356,592 |
Aveanna Healthcare Holdings, Inc. * | 23,737 | 53,408 |
Axogen, Inc. * | 16,795 | 107,656 |
Axonics, Inc. * | 23,420 | 1,559,069 |
Baxter International, Inc. | 231,470 | 9,344,444 |
Becton Dickinson & Co. | 131,516 | 30,853,654 |
Beyond Air, Inc. *(a) | 14,110 | 15,239 |
Biodesix, Inc. * | 20,622 | 25,571 |
Bioventus, Inc., Class A * | 16,149 | 63,950 |
Boston Scientific Corp. * | 666,369 | 47,891,940 |
BrightSpring Health Services, Inc. * | 25,000 | 267,250 |
Brookdale Senior Living, Inc. * | 96,082 | 652,397 |
Butterfly Network, Inc. *(a) | 79,217 | 61,480 |
Cardinal Health, Inc. | 111,192 | 11,457,224 |
Castle Biosciences, Inc. * | 11,444 | 241,354 |
Cencora, Inc. | 75,121 | 17,957,675 |
Centene Corp. * | 242,765 | 17,736,411 |
Certara, Inc. * | 51,767 | 885,733 |
Cerus Corp. * | 76,254 | 127,344 |
Chemed Corp. | 6,833 | 3,881,144 |
Cigna Group | 133,050 | 47,504,172 |
ClearPoint Neuro, Inc. * | 10,369 | 56,304 |
Clover Health Investments Corp., Class A * | 151,697 | 95,569 |
Community Health Systems, Inc. * | 51,561 | 170,151 |
CONMED Corp. | 14,231 | 967,423 |
Cooper Cos., Inc. | 90,394 | 8,050,490 |
SECURITY | NUMBER OF SHARES | VALUE ($) |
CorVel Corp. * | 4,159 | 993,377 |
Cross Country Healthcare, Inc. * | 14,884 | 261,958 |
CVRx, Inc. * | 5,810 | 90,113 |
CVS Health Corp. | 571,705 | 38,710,146 |
DaVita, Inc. * | 24,484 | 3,403,521 |
Definitive Healthcare Corp., Class A * | 18,692 | 129,722 |
Delcath Systems, Inc. * | 6,977 | 36,280 |
DENTSPLY SIRONA, Inc. | 95,706 | 2,872,137 |
Dexcom, Inc. * | 175,293 | 22,330,575 |
DocGo, Inc. * | 50,278 | 169,940 |
Doximity, Inc., Class A * | 54,666 | 1,327,837 |
Edwards Lifesciences Corp. * | 275,422 | 23,319,981 |
ElectroCore, Inc. * | 3,035 | 18,574 |
Electromed, Inc. * | 3,594 | 62,500 |
Elevance Health, Inc. | 106,898 | 56,504,145 |
Embecta Corp. | 24,775 | 250,971 |
Encompass Health Corp. | 45,879 | 3,825,391 |
Enhabit, Inc. * | 23,015 | 232,221 |
Enovis Corp. * | 22,222 | 1,227,321 |
Ensign Group, Inc. | 25,319 | 2,996,757 |
Envista Holdings Corp. * | 78,934 | 1,553,421 |
enVVeno Medical Corp. * | 2,462 | 13,049 |
Enzo Biochem, Inc. * | 13,471 | 14,010 |
Evolent Health, Inc., Class A * | 52,657 | 1,460,705 |
FONAR Corp. * | 3,312 | 52,131 |
Forian, Inc. * | 7,513 | 19,534 |
Fulgent Genetics, Inc. * | 9,036 | 183,883 |
GE HealthCare Technologies, Inc. | 193,149 | 14,725,680 |
GeneDx Holdings Corp. *(a) | 7,651 | 130,603 |
Glaukos Corp. * | 22,092 | 2,120,832 |
Globus Medical, Inc., Class A * | 52,218 | 2,599,934 |
GoodRx Holdings, Inc., Class A * | 32,958 | 234,002 |
Great Elm Group, Inc. * | 9,772 | 18,665 |
Guardant Health, Inc. * | 54,988 | 989,784 |
Haemonetics Corp. * | 22,522 | 2,070,898 |
HCA Healthcare, Inc. | 90,095 | 27,913,233 |
Health Catalyst, Inc. * | 26,200 | 162,964 |
HealthEquity, Inc. * | 39,669 | 3,130,281 |
HealthStream, Inc. | 10,329 | 266,178 |
HeartBeam, Inc. * | 14,543 | 29,231 |
Henry Schein, Inc. * | 58,847 | 4,076,920 |
Hims & Hers Health, Inc. * | 69,336 | 868,780 |
Hologic, Inc. * | 107,104 | 8,115,270 |
Humana, Inc. | 55,549 | 16,780,797 |
Hyperfine, Inc. * | 14,647 | 11,864 |
ICU Medical, Inc. * | 9,260 | 906,739 |
IDEXX Laboratories, Inc. * | 37,738 | 18,595,777 |
Inari Medical, Inc. * | 22,228 | 829,994 |
InfuSystem Holdings, Inc. * | 10,655 | 80,019 |
Innovage Holding Corp. * | 7,015 | 24,903 |
Inogen, Inc. * | 16,555 | 112,574 |
Inspire Medical Systems, Inc. * | 13,428 | 3,245,010 |
Insulet Corp. * | 31,968 | 5,496,578 |
Integer Holdings Corp. * | 15,173 | 1,693,762 |
Integra LifeSciences Holdings Corp. * | 30,669 | 894,615 |
Intuitive Surgical, Inc. * | 160,261 | 59,395,932 |
iRadimed Corp. | 3,278 | 133,120 |
iRhythm Technologies, Inc. * | 14,107 | 1,545,845 |
Joint Corp. * | 7,452 | 88,977 |
Know Labs, Inc. * | 35,048 | 22,935 |
KORU Medical Systems, Inc. * | 12,813 | 27,804 |
Laboratory Corp. of America Holdings | 38,479 | 7,748,516 |
Lantheus Holdings, Inc. * | 30,497 | 2,029,270 |
LeMaitre Vascular, Inc. | 8,388 | 543,542 |
LENSAR, Inc. * | 11,846 | 36,960 |
LifeMD, Inc. * | 20,209 | 241,093 |
LifeStance Health Group, Inc. * | 40,123 | 247,960 |
LivaNova PLC * | 25,025 | 1,395,144 |
SECURITY | NUMBER OF SHARES | VALUE ($) |
Lucid Diagnostics, Inc. * | 1,998 | 1,800 |
Masimo Corp. * | 20,280 | 2,725,835 |
McKesson Corp. | 59,861 | 32,157,928 |
Medtronic PLC | 604,812 | 48,530,115 |
Merit Medical Systems, Inc. * | 26,082 | 1,932,676 |
Milestone Scientific, Inc. * | 34,400 | 21,328 |
ModivCare, Inc. * | 5,394 | 126,597 |
Molina Healthcare, Inc. * | 26,401 | 9,031,782 |
Multiplan Corp. * | 104,525 | 67,920 |
Myomo, Inc. * | 21,495 | 70,289 |
National HealthCare Corp. | 5,672 | 515,415 |
National Research Corp. | 6,098 | 208,856 |
Neogen Corp. * | 89,023 | 1,097,654 |
NeoGenomics, Inc. * | 59,570 | 829,214 |
NeuroPace, Inc. * | 4,356 | 56,584 |
Nevro Corp. * | 16,500 | 174,570 |
Novocure Ltd. * | 44,300 | 542,232 |
OmniAb, Inc., Class A *(c) | 2,395 | 0 |
OmniAb, Inc., Class B *(c) | 2,395 | 0 |
Omnicell, Inc. * | 21,903 | 587,219 |
OPKO Health, Inc. *(a) | 185,881 | 226,775 |
OptimizeRx Corp. * | 6,885 | 70,227 |
Option Care Health, Inc. * | 82,293 | 2,459,738 |
OraSure Technologies, Inc. * | 30,500 | 161,345 |
Orchestra BioMed Holdings, Inc. *(a) | 5,514 | 24,317 |
Orthofix Medical, Inc. * | 14,213 | 184,769 |
OrthoPediatrics Corp. * | 7,124 | 211,084 |
Outset Medical, Inc. * | 27,235 | 68,905 |
Owens & Minor, Inc. * | 33,542 | 829,829 |
P3 Health Partners, Inc. *(a) | 13,641 | 7,328 |
Paragon 28, Inc. * | 18,302 | 168,744 |
Patterson Cos., Inc. | 41,269 | 1,051,121 |
PAVmed, Inc. * | 5,301 | 10,602 |
Pediatrix Medical Group, Inc. * | 35,753 | 317,129 |
Pennant Group, Inc. * | 13,217 | 276,367 |
Penumbra, Inc. * | 17,472 | 3,432,724 |
PetIQ, Inc., Class A * | 11,858 | 193,523 |
Phreesia, Inc. * | 23,389 | 485,088 |
Premier, Inc., Class A | 55,319 | 1,155,061 |
Privia Health Group, Inc. * | 45,235 | 832,324 |
PROCEPT BioRobotics Corp. * | 19,661 | 1,041,640 |
Pro-Dex, Inc. * | 1,916 | 35,676 |
Progyny, Inc. * | 36,695 | 1,176,442 |
Pulmonx Corp. * | 15,144 | 115,246 |
Pulse Biosciences, Inc. *(a) | 6,773 | 49,917 |
Quest Diagnostics, Inc. | 50,668 | 7,001,304 |
QuidelOrtho Corp. * | 24,067 | 975,917 |
R1 RCM, Inc. * | 95,408 | 1,172,564 |
RadNet, Inc. * | 29,538 | 1,432,593 |
ResMed, Inc. | 66,965 | 14,329,840 |
Rockwell Medical, Inc. * | 7,846 | 11,455 |
RxSight, Inc. * | 11,027 | 574,838 |
Sanara Medtech, Inc. * | 1,654 | 52,663 |
Schrodinger, Inc. * | 25,953 | 632,734 |
Select Medical Holdings Corp. | 48,777 | 1,383,803 |
Semler Scientific, Inc. * | 1,873 | 47,818 |
Senseonics Holdings, Inc. *(a) | 216,699 | 105,532 |
Sensus Healthcare, Inc. * | 6,026 | 22,658 |
Sharecare, Inc. * | 150,000 | 107,385 |
Shockwave Medical, Inc. * | 16,662 | 5,501,626 |
SI-BONE, Inc. * | 19,218 | 274,049 |
Sight Sciences, Inc. * | 12,929 | 71,756 |
Silk Road Medical, Inc. * | 17,297 | 336,254 |
Simulations Plus, Inc. | 7,164 | 324,887 |
Solventum Corp. * | 62,673 | 4,074,372 |
Sonida Senior Living, Inc. * | 1,604 | 50,590 |
STAAR Surgical Co. * | 24,350 | 1,119,126 |
Stereotaxis, Inc. * | 22,696 | 53,336 |
SECURITY | NUMBER OF SHARES | VALUE ($) |
STERIS PLC | 44,948 | 9,194,563 |
Streamline Health Solutions, Inc. * | 29,028 | 8,679 |
Stryker Corp. | 153,810 | 51,757,065 |
Surgery Partners, Inc. * | 32,410 | 808,629 |
Surmodics, Inc. * | 7,188 | 184,660 |
Tactile Systems Technology, Inc. * | 10,021 | 137,989 |
Talkspace, Inc. * | 88,164 | 269,782 |
Tandem Diabetes Care, Inc. * | 29,715 | 1,090,243 |
Tela Bio, Inc. * | 6,599 | 29,729 |
Teladoc Health, Inc. * | 75,644 | 964,461 |
Teleflex, Inc. | 21,317 | 4,449,924 |
Tenet Healthcare Corp. * | 45,818 | 5,144,903 |
TransMedics Group, Inc. * | 15,124 | 1,423,622 |
Treace Medical Concepts, Inc. * | 27,099 | 281,017 |
TruBridge, Inc. * | 6,539 | 51,658 |
U.S. Physical Therapy, Inc. | 7,360 | 747,114 |
UFP Technologies, Inc. * | 3,230 | 665,186 |
UnitedHealth Group, Inc. | 420,716 | 203,500,329 |
Universal Health Services, Inc., Class B | 27,648 | 4,712,049 |
Utah Medical Products, Inc. | 1,365 | 90,363 |
Varex Imaging Corp. * | 17,095 | 277,794 |
Veeva Systems, Inc., Class A * | 66,618 | 13,227,670 |
Viemed Healthcare, Inc. * | 16,000 | 131,040 |
Vivani Medical, Inc. * | 30,017 | 48,628 |
VolitionRX Ltd. * | 15,384 | 13,844 |
Zimmer Biomet Holdings, Inc. | 95,192 | 11,449,694 |
Zimvie, Inc. * | 10,245 | 155,724 |
Zomedica Corp. * | 412,334 | 58,593 |
Zynex, Inc. *(a) | 7,546 | 82,780 |
1,119,572,672 | ||
Household & Personal Products 1.3% | ||
Beauty Health Co. * | 39,541 | 127,717 |
BellRing Brands, Inc. * | 58,908 | 3,249,954 |
Central Garden & Pet Co. * | 4,564 | 186,896 |
Central Garden & Pet Co., Class A * | 25,542 | 904,953 |
Church & Dwight Co., Inc. | 112,205 | 12,105,797 |
Clorox Co. | 56,614 | 8,371,512 |
Colgate-Palmolive Co. | 374,351 | 34,410,344 |
Coty, Inc., Class A * | 168,936 | 1,932,628 |
Edgewell Personal Care Co. | 22,085 | 830,838 |
elf Beauty, Inc. * | 25,089 | 4,077,715 |
Energizer Holdings, Inc. | 31,376 | 901,119 |
Estee Lauder Cos., Inc., Class A | 106,102 | 15,566,224 |
Herbalife Ltd. * | 41,704 | 360,740 |
Honest Co., Inc. * | 29,467 | 88,696 |
Inter Parfums, Inc. | 8,373 | 974,450 |
Kenvue, Inc. | 781,864 | 14,714,681 |
Kimberly-Clark Corp. | 153,342 | 20,935,783 |
Lifevantage Corp. | 7,299 | 44,524 |
Medifast, Inc. | 4,730 | 130,217 |
Natural Alternatives International, Inc. * | 3,654 | 22,838 |
Natural Health Trends Corp. | 6,750 | 45,360 |
Nature's Sunshine Products, Inc. * | 4,762 | 92,621 |
Nu Skin Enterprises, Inc., Class A | 22,078 | 259,637 |
Oil-Dri Corp. of America | 1,961 | 135,799 |
Olaplex Holdings, Inc. * | 49,924 | 69,394 |
Procter & Gamble Co. | 1,070,306 | 174,673,939 |
Reynolds Consumer Products, Inc. | 26,473 | 757,922 |
Safety Shot, Inc. * | 13,500 | 20,655 |
Spectrum Brands Holdings, Inc. | 13,831 | 1,132,344 |
United-Guardian, Inc. | 3,342 | 27,939 |
USANA Health Sciences, Inc. * | 4,815 | 199,919 |
SECURITY | NUMBER OF SHARES | VALUE ($) |
WD-40 Co. | 6,185 | 1,398,614 |
298,751,769 | ||
Insurance 2.3% | ||
Aflac, Inc. | 239,448 | 20,029,825 |
Allstate Corp. | 119,263 | 20,281,866 |
Ambac Financial Group, Inc. * | 18,370 | 265,447 |
American Coastal Insurance Corp., Class C * | 6,372 | 66,715 |
American Equity Investment Life Holding Co. | 28,730 | 1,612,040 |
American Financial Group, Inc. | 29,767 | 3,802,734 |
American International Group, Inc. | 318,803 | 24,009,054 |
AMERISAFE, Inc. | 8,109 | 369,770 |
Aon PLC, Class A | 91,148 | 25,704,648 |
Arch Capital Group Ltd. * | 168,812 | 15,790,674 |
Arthur J Gallagher & Co. | 98,806 | 23,188,780 |
Assurant, Inc. | 23,511 | 4,100,318 |
Assured Guaranty Ltd. | 25,234 | 1,935,448 |
Axis Capital Holdings Ltd. | 35,322 | 2,166,298 |
Brighthouse Financial, Inc. * | 29,722 | 1,434,087 |
Brown & Brown, Inc. | 107,916 | 8,799,471 |
BRP Group, Inc., Class A * | 28,110 | 748,850 |
Chubb Ltd. | 184,522 | 45,879,550 |
Cincinnati Financial Corp. | 71,612 | 8,284,792 |
Citizens, Inc., Class A *(a) | 24,606 | 54,871 |
CNA Financial Corp. | 11,952 | 525,171 |
CNO Financial Group, Inc. | 52,809 | 1,390,461 |
Crawford & Co., Class A | 10,215 | 94,795 |
Donegal Group, Inc., Class A | 6,507 | 87,454 |
eHealth, Inc. * | 13,577 | 58,110 |
Employers Holdings, Inc. | 11,659 | 496,557 |
Enstar Group Ltd. * | 6,194 | 1,798,552 |
Erie Indemnity Co., Class A | 11,261 | 4,309,134 |
Everest Group Ltd. | 19,724 | 7,227,071 |
F&G Annuities & Life, Inc. | 7,820 | 295,752 |
Fidelity National Financial, Inc. | 118,637 | 5,872,532 |
First American Financial Corp. | 47,799 | 2,560,592 |
Genworth Financial, Inc., Class A * | 204,265 | 1,211,291 |
Globe Life, Inc. | 38,517 | 2,933,840 |
GoHealth, Inc., Class A * | 3,311 | 33,342 |
Goosehead Insurance, Inc., Class A * | 11,407 | 649,172 |
Greenlight Capital Re Ltd., Class A * | 9,834 | 119,188 |
Hagerty, Inc., Class A * | 15,234 | 136,344 |
Hanover Insurance Group, Inc. | 16,309 | 2,117,234 |
Hartford Financial Services Group, Inc. | 136,080 | 13,184,791 |
HCI Group, Inc. | 3,137 | 358,183 |
Heritage Insurance Holdings, Inc. * | 10,125 | 103,376 |
Hippo Holdings, Inc. * | 7,344 | 157,088 |
Horace Mann Educators Corp. | 17,846 | 657,804 |
ICC Holdings, Inc. * | 5,650 | 90,287 |
Investors Title Co. | 697 | 111,820 |
James River Group Holdings Ltd. | 28,410 | 252,565 |
Kemper Corp. | 27,177 | 1,584,691 |
Kingsway Financial Services, Inc. * | 5,983 | 53,249 |
Kinsale Capital Group, Inc. | 10,085 | 3,663,376 |
Lemonade, Inc. *(a) | 27,928 | 481,199 |
Lincoln National Corp. | 78,786 | 2,148,494 |
Loews Corp. | 83,533 | 6,277,505 |
Maiden Holdings Ltd. * | 32,952 | 68,540 |
Markel Group, Inc. * | 5,957 | 8,687,689 |
Marsh & McLennan Cos., Inc. | 223,600 | 44,592,548 |
MBIA, Inc. * | 22,069 | 138,814 |
Mercury General Corp. | 11,235 | 587,141 |
MetLife, Inc. | 279,659 | 19,878,162 |
SECURITY | NUMBER OF SHARES | VALUE ($) |
National Western Life Group, Inc., Class A | 978 | 478,066 |
NI Holdings, Inc. * | 3,782 | 56,238 |
Old Republic International Corp. | 117,117 | 3,497,114 |
Oscar Health, Inc., Class A * | 71,396 | 1,240,149 |
Palomar Holdings, Inc. * | 10,660 | 838,622 |
Primerica, Inc. | 16,071 | 3,404,802 |
Principal Financial Group, Inc. | 100,429 | 7,947,951 |
ProAssurance Corp. * | 24,020 | 320,907 |
Progressive Corp. | 266,398 | 55,477,384 |
Prudential Financial, Inc. | 164,024 | 18,121,372 |
Reinsurance Group of America, Inc. | 29,663 | 5,546,684 |
RenaissanceRe Holdings Ltd. | 24,268 | 5,320,759 |
RLI Corp. | 18,179 | 2,569,602 |
Root, Inc., Class A * | 5,666 | 394,637 |
Ryan Specialty Holdings, Inc., Class A | 46,260 | 2,282,468 |
Safety Insurance Group, Inc. | 6,404 | 509,566 |
Selective Insurance Group, Inc. | 27,852 | 2,831,156 |
Selectquote, Inc. * | 53,616 | 80,960 |
SiriusPoint Ltd. * | 44,279 | 521,607 |
Skyward Specialty Insurance Group, Inc. * | 15,421 | 538,501 |
Stewart Information Services Corp. | 12,159 | 753,980 |
Tiptree, Inc. | 9,652 | 153,756 |
Travelers Cos., Inc. | 103,567 | 21,972,775 |
Trupanion, Inc. *(a) | 19,237 | 432,833 |
United Fire Group, Inc. | 9,091 | 200,820 |
Universal Insurance Holdings, Inc. | 11,138 | 217,414 |
Unum Group | 81,676 | 4,140,973 |
W R Berkley Corp. | 92,716 | 7,136,351 |
White Mountains Insurance Group Ltd. | 1,116 | 1,984,404 |
Willis Towers Watson PLC | 46,857 | 11,767,667 |
504,258,670 | ||
Materials 2.6% | ||
AdvanSix, Inc. | 11,778 | 297,512 |
Air Products & Chemicals, Inc. | 101,318 | 23,945,496 |
Albemarle Corp. | 53,735 | 6,464,858 |
Alcoa Corp. | 80,300 | 2,821,742 |
Alpha Metallurgical Resources, Inc. | 5,295 | 1,732,100 |
Alto Ingredients, Inc. * | 33,727 | 63,744 |
Amcor PLC | 659,503 | 5,895,957 |
American Battery Technology Co. *(a) | 32,527 | 42,285 |
American Vanguard Corp. | 11,255 | 128,194 |
Ampco-Pittsburgh Corp. * | 7,848 | 16,088 |
AptarGroup, Inc. | 30,413 | 4,391,029 |
Arcadium Lithium PLC * | 457,292 | 2,012,085 |
Arch Resources, Inc. | 8,577 | 1,361,856 |
Ascent Industries Co. * | 4,646 | 47,714 |
Ashland, Inc. | 23,656 | 2,255,126 |
Aspen Aerogels, Inc. * | 28,080 | 439,733 |
ATI, Inc. * | 57,200 | 3,414,840 |
Avery Dennison Corp. | 36,398 | 7,908,557 |
Avient Corp. | 42,722 | 1,812,267 |
Axalta Coating Systems Ltd. * | 101,891 | 3,203,453 |
Balchem Corp. | 14,605 | 2,064,855 |
Ball Corp. | 143,890 | 10,010,427 |
Berry Global Group, Inc. | 53,362 | 3,022,424 |
Cabot Corp. | 25,607 | 2,336,127 |
Carpenter Technology Corp. | 21,950 | 1,881,115 |
Celanese Corp., Class A | 45,293 | 6,957,458 |
Century Aluminum Co. * | 22,913 | 397,541 |
CF Industries Holdings, Inc. | 86,399 | 6,822,929 |
Chemours Co. | 67,300 | 1,800,275 |
Clearwater Paper Corp. * | 7,639 | 344,061 |
Cleveland-Cliffs, Inc. * | 226,249 | 3,823,608 |
SECURITY | NUMBER OF SHARES | VALUE ($) |
Coeur Mining, Inc. * | 179,585 | 811,724 |
Commercial Metals Co. | 53,599 | 2,880,410 |
Compass Minerals International, Inc. | 14,554 | 181,197 |
Contango ORE, Inc. * | 1,750 | 36,522 |
Core Molding Technologies, Inc. * | 2,885 | 51,988 |
Corteva, Inc. | 320,041 | 17,323,819 |
Crown Holdings, Inc. | 55,207 | 4,530,838 |
Dakota Gold Corp. * | 24,511 | 65,199 |
Danimer Scientific, Inc. *(a) | 37,658 | 28,243 |
Dow, Inc. | 320,353 | 18,228,086 |
DuPont de Nemours, Inc. | 195,764 | 14,192,890 |
Eagle Materials, Inc. | 15,897 | 3,985,537 |
Eastman Chemical Co. | 53,335 | 5,036,957 |
Ecolab, Inc. | 115,242 | 26,061,978 |
Ecovyst, Inc. * | 46,051 | 434,261 |
Element Solutions, Inc. | 99,960 | 2,312,075 |
Flotek Industries, Inc. * | 5,581 | 19,199 |
FMC Corp. | 57,783 | 3,409,775 |
Freeport-McMoRan, Inc. | 652,498 | 32,585,750 |
Friedman Industries, Inc. | 2,834 | 55,065 |
Gatos Silver, Inc. * | 17,898 | 171,284 |
Ginkgo Bioworks Holdings, Inc. *(a) | 585,011 | 521,303 |
Graphic Packaging Holding Co. | 140,335 | 3,627,660 |
Greif, Inc., Class A | 13,364 | 818,946 |
Hawkins, Inc. | 8,063 | 610,934 |
Haynes International, Inc. | 5,389 | 324,148 |
HB Fuller Co. | 24,358 | 1,819,786 |
Hecla Mining Co. | 269,311 | 1,273,841 |
Huntsman Corp. | 73,671 | 1,757,790 |
Hycroft Mining Holding Corp. *(a) | 6,015 | 19,910 |
Idaho Strategic Resources, Inc. * | 4,628 | 39,391 |
Ingevity Corp. * | 14,768 | 755,236 |
Innospec, Inc. | 10,861 | 1,303,320 |
International Flavors & Fragrances, Inc. | 116,149 | 9,832,013 |
International Paper Co. | 148,622 | 5,192,853 |
Intrepid Potash, Inc. * | 3,965 | 79,776 |
Kaiser Aluminum Corp. | 6,881 | 622,662 |
Knife River Corp. * | 26,236 | 2,051,393 |
Koppers Holdings, Inc. | 10,777 | 552,645 |
Kronos Worldwide, Inc. | 9,190 | 105,225 |
Linde PLC | 220,559 | 97,257,697 |
Loop Industries, Inc. * | 9,523 | 27,045 |
Louisiana-Pacific Corp. | 29,673 | 2,171,767 |
LSB Industries, Inc. * | 21,659 | 201,429 |
LyondellBasell Industries NV, Class A | 116,832 | 11,679,695 |
Martin Marietta Materials, Inc. | 28,096 | 16,494,319 |
Materion Corp. | 9,668 | 1,111,240 |
Mativ Holdings, Inc. | 23,942 | 437,181 |
McEwen Mining, Inc. * | 18,704 | 214,348 |
Mercer International, Inc. | 18,274 | 185,116 |
Metallus, Inc. * | 16,743 | 344,236 |
Minerals Technologies, Inc. | 15,242 | 1,110,989 |
Mosaic Co. | 148,210 | 4,652,312 |
MP Materials Corp. * | 70,450 | 1,127,200 |
Myers Industries, Inc. | 15,888 | 347,947 |
NewMarket Corp. | 3,202 | 1,687,198 |
Newmont Corp. | 523,492 | 21,274,715 |
Northern Technologies International Corp. | 2,657 | 47,029 |
Novusterra, Inc. *(a)(c) | 3,229 | 0 |
Nucor Corp. | 111,793 | 18,840,474 |
O-I Glass, Inc. * | 72,227 | 1,080,516 |
Olin Corp. | 54,947 | 2,872,629 |
Olympic Steel, Inc. | 4,090 | 260,001 |
Orion SA | 27,306 | 646,060 |
Packaging Corp. of America | 40,411 | 6,990,295 |
Pactiv Evergreen, Inc. | 23,506 | 358,231 |
SECURITY | NUMBER OF SHARES | VALUE ($) |
Perimeter Solutions SA * | 64,240 | 449,680 |
Piedmont Lithium, Inc. * | 6,862 | 84,059 |
PPG Industries, Inc. | 107,362 | 13,849,698 |
PureCycle Technologies, Inc. *(a) | 74,372 | 347,317 |
Quaker Chemical Corp. | 6,333 | 1,181,294 |
Radius Recycling, Inc., Class A | 11,633 | 202,647 |
Ramaco Resources, Inc., Class A | 15,917 | 249,579 |
Ramaco Resources, Inc., Class B | 2,118 | 23,531 |
Ranpak Holdings Corp., Class A * | 15,372 | 111,293 |
Rayonier Advanced Materials, Inc. * | 26,864 | 100,203 |
Reliance, Inc. | 25,973 | 7,395,033 |
Royal Gold, Inc. | 30,279 | 3,637,416 |
RPM International, Inc. | 58,207 | 6,222,910 |
Ryerson Holding Corp. | 12,949 | 369,694 |
Scotts Miracle-Gro Co. | 19,443 | 1,332,623 |
Sealed Air Corp. | 65,892 | 2,074,280 |
Sensient Technologies Corp. | 19,516 | 1,428,962 |
Sherwin-Williams Co. | 107,115 | 32,092,725 |
Silgan Holdings, Inc. | 37,619 | 1,755,303 |
Smith-Midland Corp. * | 1,800 | 64,296 |
Solitario Resources Corp. * | 44,899 | 34,797 |
Sonoco Products Co. | 44,388 | 2,487,947 |
Steel Dynamics, Inc. | 69,058 | 8,985,827 |
Stepan Co. | 9,304 | 772,139 |
Summit Materials, Inc., Class A * | 53,461 | 2,079,633 |
SunCoke Energy, Inc. | 34,174 | 352,334 |
Sylvamo Corp. | 15,710 | 981,875 |
Tredegar Corp. | 10,770 | 68,713 |
TriMas Corp. | 17,344 | 450,771 |
Trinseo PLC | 19,239 | 50,214 |
Tronox Holdings PLC | 49,611 | 842,891 |
U.S. Antimony Corp. * | 59,275 | 13,040 |
U.S. Gold Corp. * | 7,270 | 30,389 |
U.S. Lime & Minerals, Inc. | 962 | 298,220 |
U.S. Steel Corp. | 103,099 | 3,763,113 |
Universal Stainless & Alloy Products, Inc. * | 5,210 | 136,241 |
Valhi, Inc. | 1,628 | 24,046 |
Vulcan Materials Co. | 60,439 | 15,570,900 |
Warrior Met Coal, Inc. | 24,646 | 1,684,554 |
Westlake Corp. | 14,583 | 2,148,951 |
Westrock Co. | 116,330 | 5,579,187 |
Worthington Steel, Inc. | 12,939 | 398,392 |
582,573,471 | ||
Media & Entertainment 7.6% | ||
Advantage Solutions, Inc. * | 42,984 | 183,112 |
Alphabet, Inc., Class A * | 2,680,517 | 436,334,557 |
Alphabet, Inc., Class C * | 2,244,197 | 369,484,594 |
Altice USA, Inc., Class A * | 102,606 | 198,030 |
AMC Entertainment Holdings, Inc., Class A *(a) | 119,682 | 350,668 |
AMC Networks, Inc., Class A * | 17,154 | 182,175 |
Angi, Inc. * | 46,987 | 99,143 |
Atlanta Braves Holdings, Inc., Class C * | 21,892 | 819,418 |
Boston Omaha Corp., Class A * | 8,359 | 129,063 |
Bumble, Inc., Class A * | 43,395 | 438,289 |
Cable One, Inc. | 2,015 | 793,608 |
Cardlytics, Inc. * | 25,904 | 317,324 |
Cargurus, Inc. * | 38,901 | 873,716 |
Cars.com, Inc. * | 26,286 | 439,239 |
Charter Communications, Inc., Class A * | 44,755 | 11,454,595 |
Cinemark Holdings, Inc. * | 47,010 | 805,751 |
SECURITY | NUMBER OF SHARES | VALUE ($) |
Clear Channel Outdoor Holdings, Inc. * | 153,084 | 212,787 |
Comcast Corp., Class A | 1,802,361 | 68,687,978 |
comScore, Inc. * | 2,302 | 31,814 |
Cumulus Media, Inc., Class A * | 7,422 | 19,520 |
CuriosityStream, Inc. | 23,041 | 24,423 |
DHI Group, Inc. * | 17,605 | 41,196 |
EchoStar Corp., Class A * | 53,476 | 855,081 |
Electronic Arts, Inc. | 110,302 | 13,988,500 |
Emerald Holding, Inc. * | 6,732 | 38,709 |
Endeavor Group Holdings, Inc., Class A | 86,645 | 2,288,294 |
Entravision Communications Corp., Class A | 34,841 | 72,818 |
Eventbrite, Inc., Class A * | 35,982 | 189,985 |
EverQuote, Inc., Class A * | 8,283 | 167,068 |
EW Scripps Co., Class A * | 25,886 | 97,331 |
Fluent, Inc. * | 5,036 | 17,475 |
Fox Corp., Class A | 166,191 | 5,153,583 |
fuboTV, Inc. * | 129,071 | 183,281 |
Gaia, Inc., Class A * | 10,263 | 39,718 |
Gannett Co., Inc. * | 69,602 | 168,437 |
Getty Images Holdings, Inc. * | 18,585 | 68,393 |
Golden Matrix Group, Inc. * | 8,251 | 29,621 |
Gray Television, Inc. | 36,454 | 209,610 |
Grindr, Inc. * | 10,471 | 102,511 |
Harte Hanks, Inc. * | 3,347 | 23,898 |
IAC, Inc. * | 32,541 | 1,547,650 |
Innovid Corp. * | 35,745 | 80,426 |
Integral Ad Science Holding Corp. * | 33,997 | 326,031 |
Interpublic Group of Cos., Inc. | 174,119 | 5,300,182 |
IZEA Worldwide, Inc. * | 8,623 | 24,058 |
John Wiley & Sons, Inc., Class A | 18,846 | 708,044 |
Lee Enterprises, Inc. * | 1,545 | 19,127 |
Liberty Broadband Corp., Class C * | 58,818 | 2,925,019 |
Liberty Media Corp.-Liberty Formula One, Class C * | 104,759 | 7,329,987 |
Liberty Media Corp.-Liberty Live, Class C * | 31,561 | 1,177,857 |
Liberty Media Corp.-Liberty SiriusXM, Class C * | 101,527 | 2,442,740 |
Lions Gate Entertainment Corp., Class A * | 87,853 | 886,437 |
Live Nation Entertainment, Inc. * | 64,432 | 5,728,649 |
LiveOne, Inc. * | 39,793 | 75,607 |
Madison Square Garden Entertainment Corp., Class A * | 18,450 | 722,317 |
Madison Square Garden Sports Corp. * | 7,599 | 1,412,806 |
Magnite, Inc. * | 61,457 | 542,665 |
Marchex, Inc., Class B * | 24,313 | 33,309 |
Marcus Corp. | 10,398 | 135,590 |
Match Group, Inc. * | 124,126 | 3,825,563 |
MediaAlpha, Inc., Class A * | 11,398 | 230,809 |
Meta Platforms, Inc., Class A | 1,000,724 | 430,481,443 |
National CineMedia, Inc. * | 44,303 | 189,617 |
Netflix, Inc. * | 196,847 | 108,391,832 |
New York Times Co., Class A | 74,891 | 3,222,560 |
News Corp., Class A | 227,952 | 5,425,258 |
Nexstar Media Group, Inc., Class A | 14,534 | 2,326,312 |
Nextdoor Holdings, Inc. * | 62,506 | 127,512 |
Omnicom Group, Inc. | 90,165 | 8,370,919 |
Outbrain, Inc. * | 10,250 | 41,513 |
Paramount Global, Class B | 226,245 | 2,576,931 |
Pinterest, Inc., Class A * | 270,201 | 9,038,223 |
Playstudios, Inc. * | 40,501 | 87,482 |
Playtika Holding Corp. | 30,485 | 221,016 |
SECURITY | NUMBER OF SHARES | VALUE ($) |
PodcastOne, Inc. * | 1,895 | 3,714 |
PSQ Holdings, Inc. *(a) | 8,011 | 33,166 |
PubMatic, Inc., Class A * | 19,401 | 435,358 |
QuinStreet, Inc. * | 21,564 | 390,093 |
Reading International, Inc., Class B * | 1,251 | 17,927 |
Reservoir Media, Inc. * | 14,527 | 130,017 |
ROBLOX Corp., Class A * | 224,386 | 7,979,166 |
Roku, Inc. * | 56,658 | 3,266,900 |
Rumble, Inc. *(a) | 34,234 | 241,692 |
Saga Communications, Inc., Class A | 1,989 | 45,329 |
Scholastic Corp. | 12,861 | 458,109 |
Shutterstock, Inc. | 10,396 | 444,013 |
Sinclair, Inc. | 15,351 | 188,817 |
Sirius XM Holdings, Inc. (a) | 296,892 | 872,862 |
Skillz, Inc., Class A * | 6,303 | 38,700 |
Snap, Inc., Class A * | 476,867 | 7,176,848 |
Sphere Entertainment Co. * | 12,111 | 470,633 |
Stagwell, Inc., Class A * | 43,953 | 261,520 |
Take-Two Interactive Software, Inc. * | 72,118 | 10,299,172 |
TechTarget, Inc. * | 11,292 | 310,530 |
TEGNA, Inc. | 88,242 | 1,203,621 |
Thryv Holdings, Inc. * | 12,739 | 293,124 |
TKO Group Holdings, Inc. | 28,064 | 2,656,819 |
Townsquare Media, Inc., Class A | 6,366 | 76,838 |
Trade Desk, Inc., Class A * | 202,483 | 16,775,717 |
Travelzoo * | 4,020 | 35,818 |
TripAdvisor, Inc. * | 50,308 | 1,324,610 |
TrueCar, Inc. * | 41,115 | 108,544 |
Urban One, Inc. * | 6,214 | 9,632 |
Urban One, Inc., Class A * | 6,023 | 11,986 |
Vimeo, Inc. * | 71,535 | 256,811 |
Vivid Seats, Inc., Class A * | 41,337 | 217,433 |
Walt Disney Co. | 834,359 | 92,697,285 |
Warner Bros Discovery, Inc. * | 1,014,092 | 7,463,717 |
Warner Music Group Corp., Class A | 63,189 | 2,085,237 |
WideOpenWest, Inc. * | 23,881 | 85,255 |
Yelp, Inc., Class A * | 31,656 | 1,273,837 |
Zedge, Inc., Class B * | 11,319 | 27,166 |
Ziff Davis, Inc. * | 20,262 | 1,015,329 |
ZipRecruiter, Inc., Class A * | 33,246 | 341,769 |
ZoomInfo Technologies, Inc., Class A * | 140,117 | 2,222,256 |
1,684,838,174 | ||
Pharmaceuticals, Biotechnology & Life Sciences 7.1% | ||
10X Genomics, Inc., Class A * | 46,955 | 1,374,842 |
180 Life Sciences Corp. *(a) | 18,364 | 39,483 |
2seventy bio, Inc. * | 41,139 | 187,594 |
4D Molecular Therapeutics, Inc. * | 16,599 | 397,214 |
89bio, Inc. * | 39,098 | 332,724 |
AbbVie, Inc. | 803,080 | 130,612,931 |
Abeona Therapeutics, Inc. * | 8,850 | 36,639 |
Absci Corp. * | 23,263 | 110,267 |
ACADIA Pharmaceuticals, Inc. * | 55,262 | 923,428 |
ACELYRIN, Inc. * | 13,426 | 56,121 |
Achieve Life Sciences, Inc. * | 8,279 | 36,345 |
Acrivon Therapeutics, Inc. * | 3,170 | 28,815 |
Actinium Pharmaceuticals, Inc. * | 12,526 | 96,450 |
Acumen Pharmaceuticals, Inc. * | 9,845 | 31,701 |
Adaptive Biotechnologies Corp. * | 49,118 | 128,689 |
Adicet Bio, Inc. * | 30,000 | 44,700 |
ADMA Biologics, Inc. * | 104,554 | 681,692 |
Adverum Biotechnologies, Inc. * | 10,713 | 104,130 |
AEON Biopharma, Inc. * | 9,000 | 34,650 |
Aerovate Therapeutics, Inc. * | 6,263 | 125,323 |
Agilent Technologies, Inc. | 133,136 | 18,244,957 |
Agios Pharmaceuticals, Inc. * | 24,055 | 781,788 |
Akebia Therapeutics, Inc. * | 79,804 | 100,553 |
SECURITY | NUMBER OF SHARES | VALUE ($) |
Akero Therapeutics, Inc. * | 30,217 | 601,016 |
Akoya Biosciences, Inc. * | 7,848 | 29,979 |
Alaunos Therapeutics, Inc. *(a) | 7,353 | 9,265 |
Aldeyra Therapeutics, Inc. * | 19,049 | 75,053 |
Alector, Inc. * | 26,074 | 132,456 |
Aligos Therapeutics, Inc. * | 31,383 | 24,008 |
Alkermes PLC * | 75,777 | 1,859,568 |
Allakos, Inc. * | 29,756 | 31,244 |
Allogene Therapeutics, Inc. * | 51,083 | 140,989 |
Allovir, Inc. * | 57,055 | 45,324 |
Alnylam Pharmaceuticals, Inc. * | 56,755 | 8,169,882 |
Alpine Immune Sciences, Inc. * | 21,192 | 1,368,791 |
Altimmune, Inc. * | 20,396 | 133,594 |
ALX Oncology Holdings, Inc. *(a) | 10,211 | 173,791 |
Amgen, Inc. | 243,353 | 66,664,121 |
Amicus Therapeutics, Inc. * | 121,964 | 1,218,420 |
Amneal Pharmaceuticals, Inc. * | 45,474 | 275,118 |
Amphastar Pharmaceuticals, Inc. * | 16,418 | 677,243 |
Amylyx Pharmaceuticals, Inc. * | 17,199 | 31,130 |
AnaptysBio, Inc. * | 7,265 | 176,830 |
Anavex Life Sciences Corp. *(a) | 36,218 | 132,196 |
ANI Pharmaceuticals, Inc. * | 7,569 | 499,554 |
Anika Therapeutics, Inc. * | 5,811 | 150,447 |
Anixa Biosciences, Inc. * | 12,785 | 37,971 |
Annexon, Inc. * | 28,332 | 128,911 |
Apellis Pharmaceuticals, Inc. * | 46,296 | 2,045,820 |
Apogee Therapeutics, Inc. * | 11,749 | 590,975 |
Applied Therapeutics, Inc. * | 24,504 | 108,308 |
Aquestive Therapeutics, Inc. * | 19,078 | 64,102 |
Arbutus Biopharma Corp. * | 50,681 | 138,359 |
ARCA biopharma, Inc. *(a) | 14,988 | 52,308 |
Arcellx, Inc. * | 15,511 | 775,860 |
Arcturus Therapeutics Holdings, Inc. * | 10,133 | 259,101 |
Arcus Biosciences, Inc. * | 24,937 | 379,791 |
Arcutis Biotherapeutics, Inc. * | 45,056 | 374,866 |
Ardelyx, Inc. * | 111,347 | 712,621 |
ArriVent Biopharma, Inc. * | 4,500 | 74,340 |
Arrowhead Pharmaceuticals, Inc. * | 56,099 | 1,268,959 |
ARS Pharmaceuticals, Inc. * | 23,670 | 205,929 |
Arvinas, Inc. * | 31,695 | 1,006,950 |
Assembly Biosciences, Inc. * | 2,704 | 33,719 |
Assertio Holdings, Inc. * | 40,135 | 35,523 |
Astria Therapeutics, Inc. * | 18,061 | 165,800 |
Atara Biotherapeutics, Inc. * | 41,098 | 28,358 |
Atea Pharmaceuticals, Inc. * | 33,404 | 123,595 |
Atossa Therapeutics, Inc. * | 45,962 | 69,403 |
aTyr Pharma, Inc. * | 26,689 | 41,902 |
Aura Biosciences, Inc. * | 25,362 | 187,679 |
Avantor, Inc. * | 306,617 | 7,429,330 |
Avid Bioservices, Inc. * | 27,120 | 206,926 |
Avidity Biosciences, Inc. * | 31,152 | 751,698 |
Avita Medical, Inc. * | 10,054 | 84,454 |
Avrobio, Inc. * | 9,797 | 11,658 |
Axsome Therapeutics, Inc. * | 17,254 | 1,272,655 |
Azenta, Inc. * | 27,177 | 1,425,705 |
Beam Therapeutics, Inc. * | 31,404 | 666,393 |
BioAtla, Inc. * | 18,434 | 41,569 |
BioCryst Pharmaceuticals, Inc. * | 103,077 | 425,708 |
Biogen, Inc. * | 66,054 | 14,189,720 |
Biohaven Ltd. * | 32,798 | 1,272,562 |
BioLife Solutions, Inc. * | 14,953 | 262,276 |
BioMarin Pharmaceutical, Inc. * | 86,302 | 6,969,750 |
Biomea Fusion, Inc. *(a) | 9,488 | 101,901 |
Bionano Genomics, Inc. * | 27,990 | 24,718 |
Biora Therapeutics, Inc. * | 8,398 | 5,504 |
Bio-Rad Laboratories, Inc., Class A * | 9,502 | 2,563,164 |
Biote Corp., Class A * | 7,115 | 39,204 |
Bio-Techne Corp. | 72,336 | 4,572,359 |
SECURITY | NUMBER OF SHARES | VALUE ($) |
Bioxcel Therapeutics, Inc. * | 21,785 | 54,898 |
Black Diamond Therapeutics, Inc. * | 14,484 | 80,676 |
Bluebird Bio, Inc. * | 88,349 | 78,374 |
Blueprint Medicines Corp. * | 27,519 | 2,513,585 |
Bolt Biotherapeutics, Inc. * | 3,417 | 3,776 |
Bridgebio Pharma, Inc. * | 57,654 | 1,477,095 |
Bristol-Myers Squibb Co. | 924,698 | 40,631,230 |
Bruker Corp. | 41,714 | 3,254,109 |
C4 Therapeutics, Inc. *(a) | 21,536 | 135,677 |
Cabaletta Bio, Inc. * | 16,585 | 176,547 |
Capricor Therapeutics, Inc. * | 13,479 | 71,034 |
Cardiff Oncology, Inc. * | 16,399 | 71,500 |
CareDx, Inc. * | 22,269 | 172,807 |
Cargo Therapeutics, Inc. * | 10,982 | 209,756 |
Caribou Biosciences, Inc. * | 40,353 | 146,481 |
Cartesian Therapeutics, Inc. *(a) | 1,993 | 43,990 |
Cassava Sciences, Inc. *(a) | 17,259 | 382,287 |
Catalent, Inc. * | 83,541 | 4,665,765 |
Catalyst Pharmaceuticals, Inc. * | 49,175 | 740,084 |
Celcuity, Inc. * | 4,926 | 77,683 |
Celldex Therapeutics, Inc. * | 28,471 | 1,065,385 |
CEL-SCI Corp. *(a) | 16,481 | 24,062 |
Cerevel Therapeutics Holdings, Inc. * | 41,071 | 1,754,142 |
CG oncology, Inc. * | 9,500 | 381,805 |
Champions Oncology, Inc. * | 6,854 | 34,270 |
Charles River Laboratories International, Inc. * | 23,447 | 5,369,363 |
ChromaDex Corp. * | 24,667 | 87,321 |
Cibus, Inc. * | 7,726 | 131,728 |
Cidara Therapeutics, Inc. * | 1,340 | 16,053 |
Citius Pharmaceuticals, Inc. * | 76,073 | 56,773 |
Clearside Biomedical, Inc. * | 20,216 | 25,472 |
Clene, Inc. * | 25,692 | 11,094 |
Codexis, Inc. * | 45,863 | 133,461 |
Cogent Biosciences, Inc. * | 35,766 | 232,479 |
Cognition Therapeutics, Inc. * | 11,965 | 22,973 |
Coherus Biosciences, Inc. * | 39,420 | 77,263 |
Collegium Pharmaceutical, Inc. * | 14,303 | 528,210 |
Compass Therapeutics, Inc. * | 42,767 | 61,584 |
Corbus Pharmaceuticals Holdings, Inc. * | 4,813 | 178,274 |
Corcept Therapeutics, Inc. * | 42,109 | 981,982 |
CorMedix, Inc. *(a) | 22,604 | 118,784 |
Corvus Pharmaceuticals, Inc. * | 15,668 | 24,285 |
Crinetics Pharmaceuticals, Inc. * | 26,245 | 1,150,056 |
CRISPR Therapeutics AG * | 35,651 | 1,889,146 |
CryoPort, Inc. * | 20,286 | 328,430 |
Cue Biopharma, Inc. * | 17,072 | 32,437 |
Cullinan Therapeutics, Inc. * | 20,998 | 567,156 |
Curis, Inc. * | 2,854 | 43,809 |
Cyteir Therapeutics, Inc. *(c) | 15,972 | 49,513 |
Cytek Biosciences, Inc. * | 46,745 | 280,937 |
Cytokinetics, Inc. * | 44,692 | 2,740,513 |
CytomX Therapeutics, Inc. * | 24,817 | 40,452 |
Danaher Corp. | 299,139 | 73,773,660 |
Dare Bioscience, Inc. * | 30,532 | 9,389 |
Day One Biopharmaceuticals, Inc. * | 25,478 | 435,674 |
Deciphera Pharmaceuticals, Inc. * | 24,491 | 618,888 |
Denali Therapeutics, Inc. * | 55,676 | 859,637 |
DermTech, Inc. * | 11,512 | 7,136 |
DiaMedica Therapeutics, Inc. * | 13,251 | 34,188 |
Dianthus Therapeutics, Inc. * | 1,710 | 36,509 |
Disc Medicine, Inc. * | 5,436 | 151,338 |
Dyadic International, Inc. * | 16,336 | 24,667 |
Dynavax Technologies Corp. * | 58,800 | 668,556 |
Dyne Therapeutics, Inc. * | 27,184 | 688,027 |
Edgewise Therapeutics, Inc. * | 31,611 | 567,101 |
Editas Medicine, Inc. * | 38,967 | 203,018 |
SECURITY | NUMBER OF SHARES | VALUE ($) |
Elanco Animal Health, Inc. * | 221,655 | 2,916,980 |
Eledon Pharmaceuticals, Inc. * | 14,987 | 35,819 |
Eli Lilly & Co. | 362,717 | 283,318,249 |
Elicio Operating Co., Inc. * | 2,363 | 21,740 |
Emergent BioSolutions, Inc. *(b) | 43,373 | 81,541 |
Enanta Pharmaceuticals, Inc. * | 8,668 | 119,098 |
Enliven Therapeutics, Inc. *(a) | 8,344 | 145,102 |
Entrada Therapeutics, Inc. * | 7,643 | 90,570 |
Erasca, Inc. * | 37,301 | 74,975 |
Esperion Therapeutics, Inc. * | 95,770 | 188,667 |
Eton Pharmaceuticals, Inc. * | 13,239 | 46,337 |
Evolus, Inc. * | 17,279 | 203,374 |
Exact Sciences Corp. * | 81,510 | 4,837,618 |
Exelixis, Inc. * | 139,608 | 3,275,204 |
Eyenovia, Inc. * | 12,362 | 9,284 |
EyePoint Pharmaceuticals, Inc. * | 16,619 | 292,494 |
Fate Therapeutics, Inc. * | 38,651 | 152,671 |
FibroGen, Inc. * | 58,027 | 64,990 |
Foghorn Therapeutics, Inc. * | 8,974 | 48,998 |
Fortrea Holdings, Inc. * | 41,466 | 1,517,241 |
Fulcrum Therapeutics, Inc. * | 24,485 | 174,578 |
G1 Therapeutics, Inc. * | 21,516 | 81,115 |
Gain Therapeutics, Inc. * | 7,043 | 20,636 |
Galectin Therapeutics, Inc. * | 17,413 | 61,120 |
Galecto, Inc. * | 15,761 | 10,859 |
Genelux Corp. * | 9,191 | 28,584 |
Generation Bio Co. * | 24,023 | 67,985 |
Geron Corp. * | 235,465 | 925,377 |
Gilead Sciences, Inc. | 566,189 | 36,915,523 |
GlycoMimetics, Inc. * | 22,361 | 40,250 |
Gossamer Bio, Inc. * | 156,778 | 111,312 |
Greenwich Lifesciences, Inc. * | 2,671 | 33,174 |
Gritstone bio, Inc. * | 66,565 | 53,252 |
Gyre Therapeutics, Inc. *(a) | 6,662 | 103,927 |
Halozyme Therapeutics, Inc. * | 58,977 | 2,247,024 |
Harmony Biosciences Holdings, Inc. * | 16,728 | 517,062 |
Harrow, Inc. * | 12,577 | 128,160 |
Harvard Bioscience, Inc. * | 14,274 | 54,527 |
Heron Therapeutics, Inc. * | 69,211 | 160,570 |
HilleVax, Inc. * | 13,917 | 183,704 |
Homology Medicines, Inc. *(c) | 21,971 | 883 |
Hookipa Pharma, Inc. * | 36,285 | 32,196 |
Humacyte, Inc. * | 22,996 | 90,144 |
Ideaya Biosciences, Inc. * | 34,175 | 1,389,214 |
IGM Biosciences, Inc. *(a) | 4,577 | 44,077 |
Ikena Oncology, Inc. * | 12,066 | 15,927 |
Illumina, Inc. * | 72,602 | 8,933,676 |
Immuneering Corp., Class A * | 8,677 | 12,321 |
Immunic, Inc. * | 25,000 | 31,500 |
ImmunityBio, Inc. *(a) | 69,586 | 555,992 |
Immunome, Inc. * | 17,976 | 252,743 |
Immunovant, Inc. * | 26,185 | 718,516 |
IN8bio, Inc. * | 13,105 | 13,367 |
Incyte Corp. * | 85,489 | 4,449,702 |
Inhibrx, Inc. * | 13,459 | 458,144 |
Inmune Bio, Inc. * | 5,159 | 61,083 |
Innoviva, Inc. * | 24,927 | 376,647 |
Inotiv, Inc. * | 10,000 | 38,400 |
Inovio Pharmaceuticals, Inc. * | 11,075 | 126,809 |
Inozyme Pharma, Inc. * | 20,879 | 92,076 |
Insmed, Inc. * | 63,877 | 1,579,039 |
Instil Bio, Inc. * | 2,981 | 32,195 |
Intellia Therapeutics, Inc. * | 41,185 | 881,359 |
Intra-Cellular Therapies, Inc. * | 46,425 | 3,333,779 |
Invivyd, Inc. * | 24,069 | 53,433 |
Ionis Pharmaceuticals, Inc. * | 64,524 | 2,662,260 |
Iovance Biotherapeutics, Inc. * | 108,846 | 1,282,206 |
IQVIA Holdings, Inc. * | 83,022 | 19,242,009 |
SECURITY | NUMBER OF SHARES | VALUE ($) |
Ironwood Pharmaceuticals, Inc., Class A * | 64,385 | 498,984 |
iTeos Therapeutics, Inc. * | 10,503 | 112,802 |
Janux Therapeutics, Inc. *(a) | 10,462 | 596,334 |
Jasper Therapeutics, Inc. * | 5,689 | 135,796 |
Jazz Pharmaceuticals PLC * | 28,508 | 3,157,261 |
Johnson & Johnson | 1,094,986 | 158,324,026 |
KalVista Pharmaceuticals, Inc. * | 8,852 | 100,470 |
Karyopharm Therapeutics, Inc. * | 51,000 | 52,530 |
Keros Therapeutics, Inc. * | 12,434 | 701,153 |
Kezar Life Sciences, Inc. * | 63,358 | 52,239 |
Kineta, Inc. * | 8,000 | 4,515 |
Kiniksa Pharmaceuticals Ltd., Class A * | 12,806 | 239,728 |
Kodiak Sciences, Inc. * | 15,730 | 50,493 |
Korro Bio, Inc. * | 3,147 | 178,718 |
Krystal Biotech, Inc. * | 11,341 | 1,736,534 |
Kura Oncology, Inc. * | 36,794 | 721,898 |
Kymera Therapeutics, Inc. * | 19,183 | 644,932 |
Kyverna Therapeutics, Inc. *(a) | 7,200 | 109,008 |
Lantern Pharma, Inc. * | 657 | 3,351 |
Larimar Therapeutics, Inc. * | 24,670 | 169,976 |
LENZ Therapeutics, Inc. | 2,534 | 40,215 |
Lexeo Therapeutics, Inc. * | 4,200 | 52,290 |
Lexicon Pharmaceuticals, Inc. * | 46,637 | 71,821 |
Lifecore Biomedical, Inc. * | 10,427 | 66,941 |
Ligand Pharmaceuticals, Inc. * | 7,105 | 496,568 |
Lineage Cell Therapeutics, Inc. * | 68,183 | 74,319 |
Lipocine, Inc. * | 2,942 | 13,592 |
Liquidia Corp. * | 20,793 | 267,190 |
Longboard Pharmaceuticals, Inc. * | 11,164 | 237,793 |
Lyell Immunopharma, Inc. * | 61,098 | 132,583 |
Lyra Therapeutics, Inc. * | 9,060 | 46,750 |
MacroGenics, Inc. * | 31,111 | 459,821 |
Madrigal Pharmaceuticals, Inc. * | 7,229 | 1,474,861 |
MannKind Corp. * | 122,373 | 502,953 |
Maravai LifeSciences Holdings, Inc., Class A * | 48,185 | 395,117 |
Marinus Pharmaceuticals, Inc. * | 30,501 | 43,006 |
MaxCyte, Inc. * | 43,954 | 159,553 |
Medpace Holdings, Inc. * | 10,475 | 4,067,966 |
MEI Pharma, Inc. | 4,822 | 14,707 |
Merck & Co., Inc. | 1,152,637 | 148,943,753 |
Merrimack Pharmaceuticals, Inc. * | 5,681 | 83,738 |
Mersana Therapeutics, Inc. * | 44,571 | 141,290 |
Mesa Laboratories, Inc. | 2,222 | 235,710 |
Mettler-Toledo International, Inc. * | 9,810 | 12,063,357 |
MiMedx Group, Inc. * | 51,298 | 315,996 |
Mind Medicine MindMed, Inc. * | 18,372 | 174,901 |
Mineralys Therapeutics, Inc. * | 5,051 | 61,875 |
MiNK Therapeutics, Inc. * | 1,744 | 1,727 |
Mirum Pharmaceuticals, Inc. * | 17,908 | 449,670 |
Moderna, Inc. * | 150,639 | 16,616,988 |
Moleculin Biotech, Inc. * | 366 | 1,837 |
Monte Rosa Therapeutics, Inc. * | 13,679 | 72,772 |
Morphic Holding, Inc. * | 17,544 | 478,425 |
Mural Oncology PLC * | 7,145 | 26,437 |
Myriad Genetics, Inc. * | 41,186 | 806,010 |
Natera, Inc. * | 52,224 | 4,850,565 |
Nautilus Biotechnology, Inc. * | 22,256 | 56,530 |
Nektar Therapeutics, Class A * | 99,411 | 145,140 |
Neumora Therapeutics, Inc. *(a) | 10,690 | 97,172 |
Neurocrine Biosciences, Inc. * | 45,484 | 6,255,869 |
Neurogene, Inc. * | 5,239 | 180,641 |
NextCure, Inc. * | 10,000 | 12,100 |
Nkarta, Inc. * | 20,319 | 135,731 |
Novavax, Inc. *(a) | 53,030 | 229,620 |
NRX Pharmaceuticals, Inc. *(a) | 4,374 | 11,285 |
SECURITY | NUMBER OF SHARES | VALUE ($) |
Nurix Therapeutics, Inc. * | 24,751 | 297,507 |
Nuvalent, Inc., Class A * | 14,627 | 1,007,508 |
Nuvation Bio, Inc. * | 71,002 | 212,296 |
Nuvectis Pharma, Inc. *(a) | 2,330 | 14,166 |
Ocean Biomedical, Inc. * | 6,470 | 9,058 |
Ocugen, Inc. *(a) | 170,254 | 224,735 |
Ocular Therapeutix, Inc. * | 53,864 | 255,315 |
Ocuphire Pharma, Inc. * | 5,599 | 8,874 |
Olema Pharmaceuticals, Inc. * | 26,228 | 266,739 |
Omega Therapeutics, Inc. * | 9,399 | 20,960 |
Omeros Corp. *(a) | 26,846 | 84,565 |
OmniAb, Inc. * | 48,133 | 213,711 |
Oncternal Therapeutics, Inc. * | 1,612 | 13,154 |
Optinose, Inc. * | 36,174 | 29,699 |
Organogenesis Holdings, Inc., Class A * | 29,326 | 68,916 |
Organon & Co. | 121,943 | 2,269,359 |
ORIC Pharmaceuticals, Inc. * | 16,653 | 147,046 |
Ovid therapeutics, Inc. * | 26,321 | 80,279 |
Pacific Biosciences of California, Inc. * | 113,781 | 187,739 |
Pacira BioSciences, Inc. * | 23,777 | 624,146 |
Palatin Technologies, Inc. *(a) | 5,171 | 9,618 |
Passage Bio, Inc. * | 7,891 | 10,179 |
PDS Biotechnology Corp. *(a) | 13,278 | 44,481 |
PepGen, Inc. * | 8,314 | 102,096 |
Perrigo Co. PLC | 61,521 | 2,009,276 |
Personalis, Inc. * | 22,941 | 33,723 |
Perspective Therapeutics, Inc. * | 234,692 | 394,283 |
Pfizer, Inc. | 2,568,353 | 65,801,204 |
PharmaCyte Biotech, Inc. * | 5,947 | 12,786 |
Phathom Pharmaceuticals, Inc. * | 21,562 | 194,705 |
Phibro Animal Health Corp., Class A | 8,185 | 136,690 |
Pliant Therapeutics, Inc. * | 25,045 | 296,032 |
Poseida Therapeutics, Inc., Class A * | 31,911 | 77,225 |
Praxis Precision Medicines, Inc. * | 6,689 | 367,025 |
Precigen, Inc. * | 67,713 | 89,381 |
Prelude Therapeutics, Inc. * | 7,515 | 28,332 |
Prestige Consumer Healthcare, Inc. * | 23,185 | 1,663,756 |
Prime Medicine, Inc. *(a) | 18,724 | 92,122 |
ProKidney Corp. *(a) | 17,259 | 35,640 |
ProPhase Labs, Inc. * | 5,896 | 27,181 |
Protagonist Therapeutics, Inc. * | 28,025 | 703,708 |
Prothena Corp. PLC * | 17,365 | 353,204 |
PTC Therapeutics, Inc. * | 35,678 | 1,147,048 |
Puma Biotechnology, Inc. * | 19,453 | 98,627 |
Pyxis Oncology, Inc. * | 14,524 | 64,632 |
Q32 Bio, Inc. * | 1,221 | 33,445 |
Quanterix Corp. * | 14,993 | 241,687 |
Quantum-Si, Inc. * | 32,018 | 51,549 |
Quince Therapeutics, Inc. * | 11,013 | 12,004 |
Rallybio Corp. * | 7,128 | 13,686 |
Rapid Micro Biosystems, Inc., Class A * | 6,797 | 6,688 |
RAPT Therapeutics, Inc. * | 15,769 | 121,421 |
Recursion Pharmaceuticals, Inc., Class A * | 69,639 | 544,577 |
Regeneron Pharmaceuticals, Inc. * | 48,054 | 42,799,776 |
REGENXBIO, Inc. * | 18,906 | 290,207 |
Regulus Therapeutics, Inc. *(a) | 9,113 | 20,960 |
Relay Therapeutics, Inc. * | 46,087 | 300,487 |
Relmada Therapeutics, Inc. * | 12,505 | 45,518 |
Reneo Pharmaceuticals, Inc. * | 7,425 | 12,400 |
RenovoRx, Inc. * | 49,232 | 62,525 |
Repligen Corp. * | 23,341 | 3,832,592 |
Replimune Group, Inc. * | 24,096 | 153,010 |
Revance Therapeutics, Inc. * | 36,568 | 132,010 |
Reviva Pharmaceuticals Holdings, Inc. * | 4,892 | 14,970 |
SECURITY | NUMBER OF SHARES | VALUE ($) |
REVOLUTION Medicines, Inc. * | 59,315 | 2,211,263 |
Revvity, Inc. | 56,727 | 5,812,816 |
Rezolute, Inc. * | 13,757 | 36,869 |
Rhythm Pharmaceuticals, Inc. * | 22,511 | 895,037 |
Rigel Pharmaceuticals, Inc. * | 65,618 | 68,899 |
Rocket Pharmaceuticals, Inc. * | 31,234 | 672,156 |
Roivant Sciences Ltd. * | 151,710 | 1,653,639 |
Royalty Pharma PLC, Class A | 176,548 | 4,890,380 |
SAB Biotherapeutics, Inc. * | 1,623 | 6,946 |
Sage Therapeutics, Inc. * | 22,552 | 314,375 |
Sana Biotechnology, Inc. * | 52,599 | 473,391 |
Sangamo Therapeutics, Inc. * | 80,106 | 41,247 |
Sarepta Therapeutics, Inc. * | 42,283 | 5,355,565 |
Savara, Inc. * | 40,048 | 183,420 |
Scholar Rock Holding Corp. * | 22,419 | 328,887 |
Scilex Holding Co. *(c) | 30,357 | 21,600 |
scPharmaceuticals, Inc. * | 7,807 | 34,897 |
Seer, Inc., Class A * | 17,867 | 37,163 |
SELLAS Life Sciences Group, Inc. *(a) | 16,238 | 20,135 |
Sera Prognostics, Inc., Class A * | 12,000 | 140,280 |
Shattuck Labs, Inc. * | 20,881 | 218,833 |
SIGA Technologies, Inc. | 17,097 | 150,112 |
Soleno Therapeutics, Inc. * | 7,195 | 321,329 |
Solid Biosciences, Inc. * | 10,276 | 91,148 |
Sotera Health Co. * | 55,885 | 625,912 |
Spero Therapeutics, Inc. * | 28,565 | 40,562 |
SpringWorks Therapeutics, Inc. * | 28,958 | 1,352,049 |
Spruce Biosciences, Inc. * | 15,289 | 10,825 |
Spyre Therapeutics, Inc. * | 15,000 | 495,450 |
Standard BioTools, Inc. * | 111,584 | 276,728 |
Stoke Therapeutics, Inc. * | 12,708 | 140,169 |
Summit Therapeutics, Inc. * | 85,753 | 337,009 |
Supernus Pharmaceuticals, Inc. * | 24,988 | 752,139 |
Sutro Biopharma, Inc. * | 23,381 | 79,379 |
Syndax Pharmaceuticals, Inc. * | 36,496 | 771,160 |
Syros Pharmaceuticals, Inc. * | 4,670 | 25,218 |
Talphera, Inc. * | 6,381 | 6,572 |
Tango Therapeutics, Inc. * | 24,079 | 185,408 |
Tarsus Pharmaceuticals, Inc. * | 14,660 | 460,764 |
Taysha Gene Therapies, Inc. * | 51,462 | 125,053 |
Tenaya Therapeutics, Inc. * | 22,396 | 101,678 |
Terns Pharmaceuticals, Inc. * | 16,643 | 84,047 |
TG Therapeutics, Inc. * | 67,278 | 919,017 |
TherapeuticsMD, Inc. * | 7,060 | 13,273 |
Theravance Biopharma, Inc. * | 21,449 | 181,030 |
Theriva Biologics, Inc. * | 13,566 | 5,460 |
Thermo Fisher Scientific, Inc. | 175,747 | 99,950,834 |
Third Harmonic Bio, Inc. * | 5,232 | 58,284 |
Tourmaline Bio, Inc. (a) | 6,869 | 108,736 |
Travere Therapeutics, Inc. * | 29,285 | 161,946 |
Trevi Therapeutics, Inc. * | 12,557 | 36,792 |
TScan Therapeutics, Inc. * | 22,104 | 170,643 |
Twist Bioscience Corp. * | 25,495 | 796,209 |
Tyra Biosciences, Inc. *(a) | 9,880 | 168,948 |
Ultragenyx Pharmaceutical, Inc. * | 37,627 | 1,600,653 |
uniQure NV * | 23,627 | 104,195 |
United Therapeutics Corp. * | 21,240 | 4,977,169 |
UNITY Biotechnology, Inc. * | 4,595 | 7,076 |
Vanda Pharmaceuticals, Inc. * | 24,287 | 115,606 |
Vaxart, Inc. * | 153,547 | 109,740 |
Vaxcyte, Inc. * | 43,697 | 2,645,853 |
Vaxxinity, Inc., Class A * | 22,917 | 2,812 |
Ventyx Biosciences, Inc. * | 30,926 | 115,663 |
Vera Therapeutics, Inc., Class A * | 19,962 | 788,699 |
Veracyte, Inc. * | 34,001 | 665,400 |
Verastem, Inc. * | 11,159 | 111,367 |
Vericel Corp. * | 22,544 | 1,034,093 |
Verrica Pharmaceuticals, Inc. *(a) | 7,637 | 53,192 |
SECURITY | NUMBER OF SHARES | VALUE ($) |
Vertex Pharmaceuticals, Inc. * | 117,219 | 46,044,795 |
Verve Therapeutics, Inc. * | 30,311 | 182,169 |
Viatris, Inc. | 541,323 | 6,263,107 |
Vigil Neuroscience, Inc. * | 5,235 | 13,663 |
Viking Therapeutics, Inc. * | 49,372 | 3,929,024 |
Vir Biotechnology, Inc. * | 41,660 | 352,444 |
Viridian Therapeutics, Inc. * | 23,657 | 313,692 |
Vistagen Therapeutics, Inc. * | 23,302 | 112,549 |
Vor BioPharma, Inc. * | 17,792 | 30,602 |
Voyager Therapeutics, Inc. * | 25,228 | 197,283 |
Waters Corp. * | 27,071 | 8,366,022 |
WaVe Life Sciences Ltd. * | 39,975 | 197,077 |
Werewolf Therapeutics, Inc. * | 6,982 | 43,568 |
West Pharmaceutical Services, Inc. | 33,667 | 12,035,279 |
X4 Pharmaceuticals, Inc. * | 42,386 | 47,472 |
XBiotech, Inc. * | 10,477 | 80,359 |
Xencor, Inc. * | 25,852 | 541,341 |
Xeris Biopharma Holdings, Inc. * | 60,840 | 106,470 |
Xilio Therapeutics, Inc. * | 11,925 | 12,402 |
XOMA Corp. * | 2,843 | 72,042 |
Y-mAbs Therapeutics, Inc. * | 14,556 | 221,397 |
Zentalis Pharmaceuticals, Inc. * | 24,484 | 270,793 |
Zevra Therapeutics, Inc. * | 11,139 | 51,017 |
Zoetis, Inc. | 208,899 | 33,265,077 |
Zura Bio Ltd., Class A * | 5,513 | 23,541 |
1,580,685,756 | ||
Real Estate Management & Development 0.2% | ||
Altisource Portfolio Solutions SA * | 9,415 | 18,736 |
AMREP Corp. * | 2,361 | 47,891 |
Anywhere Real Estate, Inc. * | 50,250 | 244,215 |
CBRE Group, Inc., Class A * | 135,839 | 11,803,051 |
Compass, Inc., Class A * | 148,596 | 468,078 |
CoStar Group, Inc. * | 185,702 | 16,997,304 |
Cushman & Wakefield PLC * | 82,072 | 791,995 |
DigitalBridge Group, Inc. | 63,571 | 1,045,107 |
Doma Holdings, Inc. * | 1,501 | 9,081 |
Douglas Elliman, Inc. * | 28,072 | 38,178 |
eXp World Holdings, Inc. | 38,506 | 383,520 |
Fathom Holdings, Inc. * | 2,686 | 4,190 |
Forestar Group, Inc. * | 9,724 | 301,347 |
FRP Holdings, Inc. * | 5,956 | 180,526 |
Howard Hughes Holdings, Inc. * | 14,474 | 943,126 |
InterGroup Corp. * | 1,138 | 23,477 |
Jones Lang LaSalle, Inc. * | 21,719 | 3,924,623 |
Kennedy-Wilson Holdings, Inc. | 52,161 | 448,063 |
Marcus & Millichap, Inc. | 11,056 | 350,144 |
Maui Land & Pineapple Co., Inc. * | 3,498 | 68,141 |
Newmark Group, Inc., Class A | 53,804 | 514,904 |
Offerpad Solutions, Inc. * | 8,794 | 68,329 |
Opendoor Technologies, Inc. * | 251,531 | 500,547 |
Rafael Holdings, Inc., Class B * | 1,046 | 1,663 |
RE/MAX Holdings, Inc., Class A | 6,967 | 48,908 |
Redfin Corp. * | 61,840 | 346,922 |
RMR Group, Inc., Class A | 6,145 | 145,759 |
Seritage Growth Properties, Class A * | 16,651 | 155,520 |
St. Joe Co. | 15,558 | 889,918 |
Star Holdings * | 6,000 | 71,340 |
Stratus Properties, Inc. * | 3,398 | 77,067 |
Tejon Ranch Co. * | 11,108 | 186,392 |
Zillow Group, Inc., Class C * | 96,981 | 4,128,481 |
45,226,543 | ||
Semiconductors & Semiconductor Equipment 9.2% | ||
ACM Research, Inc., Class A * | 22,189 | 566,263 |
Advanced Micro Devices, Inc. * | 734,964 | 116,403,598 |
SECURITY | NUMBER OF SHARES | VALUE ($) |
Aehr Test Systems * | 11,116 | 133,170 |
Allegro MicroSystems, Inc. * | 33,142 | 983,986 |
Alpha & Omega Semiconductor Ltd. * | 9,994 | 218,569 |
Ambarella, Inc. * | 18,585 | 854,352 |
Amkor Technology, Inc. | 45,775 | 1,480,821 |
Amtech Systems, Inc. * | 6,347 | 30,593 |
Analog Devices, Inc. | 225,392 | 45,215,889 |
Applied Materials, Inc. | 378,475 | 75,184,059 |
Atomera, Inc. *(a) | 12,488 | 57,944 |
Axcelis Technologies, Inc. * | 14,904 | 1,542,862 |
AXT, Inc. * | 15,887 | 47,661 |
Broadcom, Inc. | 200,164 | 260,267,244 |
CEVA, Inc. * | 10,247 | 207,707 |
Cirrus Logic, Inc. * | 24,858 | 2,201,673 |
Cohu, Inc. * | 20,047 | 607,825 |
Credo Technology Group Holding Ltd. * | 55,656 | 994,573 |
CVD Equipment Corp. * | 3,009 | 13,540 |
Diodes, Inc. * | 20,897 | 1,525,690 |
Enphase Energy, Inc. * | 61,877 | 6,729,742 |
Entegris, Inc. | 68,388 | 9,090,133 |
Everspin Technologies, Inc. * | 8,698 | 64,539 |
First Solar, Inc. * | 48,960 | 8,631,648 |
FormFactor, Inc. * | 35,591 | 1,587,003 |
GSI Technology, Inc. *(a) | 8,052 | 31,644 |
Ichor Holdings Ltd. * | 12,049 | 467,260 |
Impinj, Inc. * | 10,626 | 1,693,572 |
indie Semiconductor, Inc., Class A * | 56,060 | 315,057 |
Intel Corp. | 1,923,167 | 58,598,898 |
inTEST Corp. * | 4,591 | 51,741 |
KLA Corp. | 61,513 | 42,400,296 |
Kopin Corp. * | 40,189 | 31,589 |
Kulicke & Soffa Industries, Inc. | 25,768 | 1,192,543 |
Lam Research Corp. | 59,634 | 53,337,246 |
Lattice Semiconductor Corp. * | 62,353 | 4,277,416 |
MACOM Technology Solutions Holdings, Inc. * | 24,206 | 2,467,802 |
Marvell Technology, Inc. | 393,318 | 25,923,589 |
MaxLinear, Inc. * | 36,453 | 757,858 |
Microchip Technology, Inc. | 245,422 | 22,573,916 |
Micron Technology, Inc. | 502,129 | 56,720,492 |
MKS Instruments, Inc. | 28,534 | 3,394,975 |
Monolithic Power Systems, Inc. | 21,882 | 14,646,279 |
Navitas Semiconductor Corp., Class A * | 53,865 | 233,235 |
NVE Corp. | 1,890 | 153,846 |
NVIDIA Corp. | 1,123,515 | 970,739,430 |
NXP Semiconductors NV | 117,315 | 30,054,930 |
ON Semiconductor Corp. * | 194,019 | 13,612,373 |
Onto Innovation, Inc. * | 22,391 | 4,153,307 |
PDF Solutions, Inc. * | 12,456 | 374,676 |
Photronics, Inc. * | 27,001 | 740,097 |
Pixelworks, Inc. * | 21,959 | 39,307 |
Power Integrations, Inc. | 25,765 | 1,719,041 |
Qorvo, Inc. * | 44,053 | 5,147,152 |
QUALCOMM, Inc. | 507,629 | 84,190,270 |
QuickLogic Corp. * | 7,578 | 117,156 |
Rambus, Inc. * | 48,235 | 2,644,243 |
Rigetti Computing, Inc. * | 30,086 | 38,510 |
Semtech Corp. * | 32,037 | 1,205,232 |
Silicon Laboratories, Inc. * | 14,608 | 1,774,726 |
SiTime Corp. * | 7,974 | 710,643 |
SkyWater Technology, Inc. * | 12,405 | 127,275 |
Skyworks Solutions, Inc. | 72,652 | 7,743,977 |
SMART Global Holdings, Inc. * | 26,108 | 476,993 |
SolarEdge Technologies, Inc. * | 25,758 | 1,510,707 |
Synaptics, Inc. * | 17,731 | 1,595,081 |
Teradyne, Inc. | 69,271 | 8,057,603 |
SECURITY | NUMBER OF SHARES | VALUE ($) |
Texas Instruments, Inc. | 413,786 | 73,000,126 |
Transphorm, Inc. * | 11,592 | 55,642 |
Trio-Tech International * | 2,059 | 12,766 |
Ultra Clean Holdings, Inc. * | 21,314 | 891,565 |
Universal Display Corp. | 20,005 | 3,160,390 |
Veeco Instruments, Inc. * | 24,931 | 881,061 |
Wolfspeed, Inc. * | 56,169 | 1,518,248 |
2,040,202,865 | ||
Software & Services 11.4% | ||
8x8, Inc. * | 46,219 | 102,144 |
A10 Networks, Inc. | 35,602 | 464,962 |
Accenture PLC, Class A | 285,196 | 85,818,328 |
ACI Worldwide, Inc. * | 50,004 | 1,705,136 |
Adeia, Inc. | 47,028 | 462,756 |
Adobe, Inc. * | 205,599 | 95,157,385 |
Agilysys, Inc. * | 10,163 | 844,037 |
Airship AI Holdings, Inc. * | 8,888 | 65,416 |
Akamai Technologies, Inc. * | 68,642 | 6,928,037 |
Alarm.com Holdings, Inc. * | 22,683 | 1,508,419 |
Alkami Technology, Inc. * | 15,859 | 381,726 |
Altair Engineering, Inc., Class A * | 24,227 | 1,949,062 |
American Software, Inc., Class A | 13,798 | 139,498 |
Amplitude, Inc., Class A * | 38,091 | 372,911 |
ANSYS, Inc. * | 39,643 | 12,879,218 |
Appfolio, Inc., Class A * | 9,364 | 2,123,568 |
Appian Corp., Class A * | 17,792 | 666,132 |
Applied Digital Corp. *(a) | 28,011 | 75,770 |
AppLovin Corp., Class A * | 82,468 | 5,819,767 |
Arteris, Inc. * | 9,920 | 65,770 |
Asana, Inc., Class A * | 42,227 | 627,915 |
Aspen Technology, Inc. * | 12,573 | 2,475,247 |
Atlassian Corp., Class A * | 71,282 | 12,281,889 |
AudioEye, Inc. * | 4,308 | 67,205 |
Aurora Innovation, Inc. * | 362,784 | 1,006,726 |
Autodesk, Inc. * | 97,014 | 20,649,430 |
AvePoint, Inc. * | 39,999 | 310,792 |
Backblaze, Inc., Class A * | 18,678 | 173,892 |
Bentley Systems, Inc., Class B | 104,651 | 5,497,317 |
BigBear.ai Holdings, Inc. * | 49,665 | 82,444 |
BigCommerce Holdings, Inc. * | 30,500 | 172,630 |
Bill Holdings, Inc. * | 43,753 | 2,728,437 |
Blackbaud, Inc. * | 19,607 | 1,527,777 |
BlackLine, Inc. * | 23,896 | 1,387,163 |
Blend Labs, Inc., Class A * | 73,956 | 181,192 |
Box, Inc., Class A * | 65,647 | 1,708,135 |
Braze, Inc., Class A * | 22,708 | 951,465 |
Brightcove, Inc. * | 15,409 | 27,428 |
C3.ai, Inc., Class A *(a) | 44,350 | 999,206 |
Cadence Design Systems, Inc. * | 123,751 | 34,109,488 |
Castellum, Inc. * | 34,318 | 9,266 |
CCC Intelligent Solutions Holdings, Inc. * | 131,546 | 1,475,946 |
Cerence, Inc. * | 17,854 | 162,650 |
Cipher Mining, Inc. *(a) | 16,000 | 59,520 |
Cleanspark, Inc. * | 91,601 | 1,500,424 |
Clear Secure, Inc., Class A | 40,011 | 698,992 |
Clearwater Analytics Holdings, Inc., Class A * | 64,999 | 1,025,684 |
Cloudflare, Inc., Class A * | 135,053 | 11,803,632 |
Cognizant Technology Solutions Corp., Class A | 226,305 | 14,863,712 |
CommVault Systems, Inc. * | 20,147 | 2,064,463 |
Confluent, Inc., Class A * | 98,083 | 2,758,094 |
Consensus Cloud Solutions, Inc. * | 14,791 | 172,167 |
CoreCard Corp. * | 2,218 | 26,572 |
Couchbase, Inc. * | 15,315 | 369,704 |
SECURITY | NUMBER OF SHARES | VALUE ($) |
Crowdstrike Holdings, Inc., Class A * | 103,302 | 30,219,967 |
CSP, Inc. | 5,818 | 76,041 |
Daily Journal Corp. * | 412 | 138,102 |
Datadog, Inc., Class A * | 137,163 | 17,213,956 |
Dave, Inc. * | 5,855 | 256,449 |
DecisionPoint Systems, Inc. * | 4,188 | 33,718 |
Digimarc Corp. * | 5,752 | 121,597 |
Digital Turbine, Inc. * | 62,036 | 118,489 |
DigitalOcean Holdings, Inc. * | 24,086 | 791,466 |
DocuSign, Inc., Class A * | 92,645 | 5,243,707 |
Dolby Laboratories, Inc., Class A | 26,426 | 2,052,243 |
Domo, Inc., Class B * | 14,774 | 111,248 |
DoubleVerify Holdings, Inc. * | 63,042 | 1,847,131 |
Dropbox, Inc., Class A * | 115,530 | 2,675,675 |
D-Wave Quantum, Inc. * | 23,310 | 31,935 |
DXC Technology Co. * | 83,184 | 1,621,256 |
Dynatrace, Inc. * | 109,581 | 4,965,115 |
E2open Parent Holdings, Inc. * | 73,998 | 358,890 |
Edgio, Inc. *(a) | 2,928 | 27,904 |
eGain Corp. * | 7,634 | 47,407 |
Elastic NV * | 37,873 | 3,871,378 |
Enfusion, Inc., Class A * | 18,455 | 171,816 |
Envestnet, Inc. * | 23,500 | 1,458,645 |
EPAM Systems, Inc. * | 26,435 | 6,219,098 |
Everbridge, Inc. * | 20,019 | 695,660 |
EverCommerce, Inc. * | 12,868 | 115,812 |
Fair Isaac Corp. * | 11,311 | 12,819,096 |
Fastly, Inc., Class A * | 55,767 | 705,453 |
Five9, Inc. * | 33,968 | 1,955,538 |
Fortinet, Inc. * | 288,771 | 18,244,552 |
Freshworks, Inc., Class A * | 76,129 | 1,358,903 |
Gartner, Inc. * | 35,471 | 14,634,980 |
Gen Digital, Inc. | 253,635 | 5,108,209 |
Gitlab, Inc., Class A * | 41,235 | 2,163,600 |
Glimpse Group, Inc. * | 1,370 | 1,589 |
GoDaddy, Inc., Class A * | 64,112 | 7,846,027 |
Grid Dynamics Holdings, Inc. * | 23,721 | 231,754 |
Guidewire Software, Inc. * | 36,824 | 4,065,370 |
Hackett Group, Inc. | 9,720 | 210,827 |
HashiCorp, Inc., Class A * | 54,776 | 1,778,029 |
HubSpot, Inc. * | 22,887 | 13,843,660 |
Informatica, Inc., Class A * | 19,115 | 591,992 |
Information Services Group, Inc. | 16,112 | 54,297 |
Instructure Holdings, Inc. * | 7,509 | 143,647 |
Intapp, Inc. * | 18,004 | 556,684 |
Intellicheck, Inc. * | 12,962 | 41,608 |
InterDigital, Inc. | 11,325 | 1,118,117 |
International Business Machines Corp. | 416,207 | 69,173,603 |
Intuit, Inc. | 127,333 | 79,662,071 |
Issuer Direct Corp. * | 1,318 | 15,256 |
Jamf Holding Corp. * | 24,817 | 483,187 |
Kaltura, Inc. * | 33,164 | 40,792 |
Klaviyo, Inc., Class A * | 12,810 | 286,944 |
Kyndryl Holdings, Inc. * | 104,768 | 2,059,739 |
LivePerson, Inc. * | 34,901 | 17,482 |
LiveRamp Holdings, Inc. * | 30,335 | 974,057 |
Manhattan Associates, Inc. * | 28,162 | 5,803,062 |
Marathon Digital Holdings, Inc. * | 99,987 | 1,605,791 |
MariaDB PLC * | 13,835 | 7,263 |
Matterport, Inc. * | 108,500 | 499,100 |
MeridianLink, Inc. * | 8,842 | 147,485 |
Microsoft Corp. | 3,379,842 | 1,315,873,886 |
MicroStrategy, Inc., Class A * | 6,910 | 7,359,357 |
Mitek Systems, Inc. * | 18,641 | 235,436 |
Model N, Inc. * | 14,577 | 432,208 |
MongoDB, Inc., Class A * | 32,720 | 11,948,690 |
N-able, Inc. * | 29,867 | 366,169 |
SECURITY | NUMBER OF SHARES | VALUE ($) |
nCino, Inc. * | 26,902 | 784,462 |
NCR Voyix Corp. * | 66,187 | 810,791 |
NextNav, Inc. * | 23,511 | 214,185 |
Nutanix, Inc., Class A * | 109,996 | 6,676,757 |
Okta, Inc. * | 71,752 | 6,671,501 |
Olo, Inc., Class A * | 44,208 | 212,198 |
ON24, Inc. | 17,135 | 112,920 |
OneSpan, Inc. * | 14,940 | 161,651 |
Oracle Corp. | 725,225 | 82,494,344 |
PagerDuty, Inc. * | 40,603 | 810,436 |
Palantir Technologies, Inc., Class A * | 873,588 | 19,192,728 |
Palo Alto Networks, Inc. * | 143,419 | 41,719,153 |
Pegasystems, Inc. | 19,925 | 1,183,943 |
Perficient, Inc. * | 16,274 | 769,109 |
Porch Group, Inc. * | 33,000 | 105,270 |
PowerSchool Holdings, Inc., Class A * | 25,358 | 439,201 |
Procore Technologies, Inc. * | 40,101 | 2,743,710 |
Progress Software Corp. | 20,511 | 1,021,858 |
PROS Holdings, Inc. * | 18,413 | 603,026 |
PTC, Inc. * | 54,229 | 9,622,394 |
Q2 Holdings, Inc. * | 26,451 | 1,359,317 |
Qualys, Inc. * | 16,495 | 2,703,695 |
Quantum Computing, Inc. * | 10,216 | 7,841 |
Rackspace Technology, Inc. * | 28,860 | 49,639 |
Rapid7, Inc. * | 27,867 | 1,248,442 |
Red Violet, Inc. * | 5,306 | 89,035 |
Rekor Systems, Inc. * | 22,007 | 38,952 |
ReposiTrak, Inc. | 6,299 | 99,713 |
Research Solutions, Inc. * | 18,069 | 52,400 |
Rimini Street, Inc. * | 21,843 | 58,102 |
RingCentral, Inc., Class A * | 37,195 | 1,101,716 |
Riot Platforms, Inc. * | 92,769 | 937,895 |
Roper Technologies, Inc. | 48,649 | 24,882,018 |
Salesforce, Inc. | 440,309 | 118,416,702 |
Samsara, Inc., Class A * | 78,756 | 2,750,947 |
SecureWorks Corp., Class A * | 5,067 | 30,858 |
SEMrush Holdings, Inc., Class A * | 17,212 | 210,675 |
SentinelOne, Inc., Class A * | 110,215 | 2,328,843 |
ServiceNow, Inc. * | 93,247 | 64,650,943 |
Smartsheet, Inc., Class A * | 61,516 | 2,327,150 |
Snowflake, Inc., Class A * | 149,616 | 23,220,403 |
SolarWinds Corp. | 20,785 | 229,051 |
SoundHound AI, Inc., Class A *(a) | 100,991 | 428,202 |
SoundThinking, Inc. * | 3,910 | 52,238 |
Sprinklr, Inc., Class A * | 57,049 | 666,903 |
Sprout Social, Inc., Class A * | 22,530 | 1,136,639 |
SPS Commerce, Inc. * | 16,727 | 2,908,323 |
Squarespace, Inc., Class A * | 24,349 | 848,806 |
SRAX, Inc. *(c) | 9,789 | 27 |
Synopsys, Inc. * | 69,302 | 36,770,948 |
Telos Corp. * | 25,409 | 87,407 |
Tenable Holdings, Inc. * | 54,062 | 2,431,168 |
Teradata Corp. * | 44,613 | 1,655,142 |
Terawulf, Inc. * | 50,627 | 109,861 |
Thoughtworks Holding, Inc. * | 49,108 | 113,931 |
Tucows, Inc., Class A * | 4,136 | 73,083 |
Twilio, Inc., Class A * | 81,703 | 4,892,376 |
Tyler Technologies, Inc. * | 18,976 | 8,758,373 |
UiPath, Inc., Class A * | 185,380 | 3,516,659 |
Unisys Corp. * | 28,890 | 156,873 |
Unity Software, Inc. * | 108,279 | 2,627,931 |
Upland Software, Inc. * | 22,775 | 49,194 |
Varonis Systems, Inc., Class B * | 49,694 | 2,174,112 |
Verint Systems, Inc. * | 27,662 | 837,605 |
VeriSign, Inc. * | 40,503 | 6,864,448 |
Vertex, Inc., Class A * | 20,655 | 601,680 |
Viant Technology, Inc., Class A * | 10,390 | 91,328 |
Weave Communications, Inc. * | 12,631 | 135,025 |
SECURITY | NUMBER OF SHARES | VALUE ($) |
WM Technology, Inc. * | 40,927 | 51,773 |
Workday, Inc., Class A * | 94,876 | 23,219,003 |
Workiva, Inc., Class A * | 21,901 | 1,725,799 |
Xperi, Inc. * | 20,285 | 213,195 |
Yext, Inc. * | 46,726 | 256,526 |
Zeta Global Holdings Corp., Class A * | 65,475 | 809,271 |
Zoom Video Communications, Inc., Class A * | 117,756 | 7,194,892 |
Zscaler, Inc. * | 40,551 | 7,012,890 |
Zuora, Inc., Class A * | 61,121 | 602,653 |
2,548,655,119 | ||
Technology Hardware & Equipment 7.0% | ||
908 Devices, Inc. * | 8,267 | 47,122 |
ADTRAN Holdings, Inc. | 33,081 | 144,895 |
Advanced Energy Industries, Inc. | 17,189 | 1,647,394 |
Aeva Technologies, Inc. * | 12,000 | 37,440 |
Airgain, Inc. * | 7,096 | 37,183 |
Amphenol Corp., Class A | 272,853 | 32,952,457 |
Apple, Inc. | 6,602,526 | 1,124,608,254 |
Applied Optoelectronics, Inc. * | 18,315 | 180,403 |
Arista Networks, Inc. * | 114,622 | 29,407,420 |
Arlo Technologies, Inc. * | 40,417 | 500,363 |
Arrow Electronics, Inc. * | 24,597 | 3,140,299 |
AstroNova, Inc. * | 4,083 | 70,513 |
Aviat Networks, Inc. * | 4,936 | 165,109 |
Avnet, Inc. | 41,153 | 2,011,147 |
Badger Meter, Inc. | 13,065 | 2,389,850 |
Bel Fuse, Inc., Class A | 1,180 | 82,600 |
Bel Fuse, Inc., Class B | 4,185 | 245,743 |
Belden, Inc. | 19,416 | 1,577,938 |
Benchmark Electronics, Inc. | 14,875 | 449,374 |
Calix, Inc. * | 27,533 | 763,490 |
CDW Corp. | 60,981 | 14,748,865 |
Ciena Corp. * | 66,154 | 3,058,299 |
Cisco Systems, Inc. | 1,848,331 | 86,834,590 |
Clearfield, Inc. * | 5,453 | 164,244 |
Climb Global Solutions, Inc. | 1,603 | 103,329 |
Coda Octopus Group, Inc. * | 1,343 | 8,944 |
Cognex Corp. | 78,831 | 3,274,640 |
Coherent Corp. * | 61,120 | 3,338,986 |
CommScope Holding Co., Inc. * | 94,667 | 84,632 |
CompoSecure, Inc. *(a) | 5,277 | 36,675 |
Comtech Telecommunications Corp. * | 11,741 | 22,073 |
Corning, Inc. | 348,505 | 11,633,097 |
Corsair Gaming, Inc. * | 26,615 | 295,427 |
CPI Card Group, Inc. * | 1,805 | 31,136 |
Crane NXT Co. | 20,920 | 1,272,145 |
CTS Corp. | 13,417 | 613,828 |
Daktronics, Inc. * | 15,645 | 147,845 |
Dell Technologies, Inc., Class C | 121,364 | 15,126,809 |
Diebold Nixdorf, Inc. * | 17,287 | 547,306 |
Digi International, Inc. * | 17,947 | 550,255 |
Eastman Kodak Co. * | 29,007 | 130,532 |
ePlus, Inc. * | 12,538 | 963,921 |
Evolv Technologies Holdings, Inc. * | 31,854 | 124,549 |
Extreme Networks, Inc. * | 61,060 | 683,872 |
F5, Inc. * | 27,138 | 4,486,183 |
Fabrinet * | 16,202 | 2,804,080 |
FARO Technologies, Inc. * | 8,279 | 155,231 |
Frequency Electronics, Inc. * | 4,719 | 45,302 |
Genasys, Inc. * | 20,918 | 43,928 |
Harmonic, Inc. * | 48,599 | 521,953 |
Hewlett Packard Enterprise Co. | 593,493 | 10,089,381 |
HP, Inc. | 397,617 | 11,169,062 |
Identiv, Inc. * | 8,288 | 41,772 |
Immersion Corp. | 13,101 | 95,244 |
SECURITY | NUMBER OF SHARES | VALUE ($) |
Infinera Corp. * | 103,973 | 501,150 |
Inseego Corp. * | 4,205 | 16,946 |
Insight Enterprises, Inc. * | 12,752 | 2,328,133 |
Intevac, Inc. * | 11,887 | 50,282 |
IonQ, Inc. *(a) | 74,268 | 634,991 |
IPG Photonics Corp. * | 13,349 | 1,121,049 |
Iteris, Inc. * | 21,639 | 96,943 |
Itron, Inc. * | 20,969 | 1,931,664 |
Jabil, Inc. | 58,027 | 6,810,049 |
Juniper Networks, Inc. | 147,851 | 5,148,172 |
Key Tronic Corp. * | 4,943 | 21,354 |
Keysight Technologies, Inc. * | 79,838 | 11,811,234 |
Kimball Electronics, Inc. * | 10,963 | 229,456 |
Knowles Corp. * | 40,205 | 636,445 |
KVH Industries, Inc. * | 5,414 | 25,987 |
Lantronix, Inc. * | 11,128 | 41,841 |
LightPath Technologies, Inc., Class A * | 24,173 | 34,567 |
Lightwave Logic, Inc. * | 49,166 | 187,814 |
Littelfuse, Inc. | 11,080 | 2,555,491 |
Lumentum Holdings, Inc. * | 32,261 | 1,411,741 |
Luna Innovations, Inc. * | 15,596 | 32,128 |
Methode Electronics, Inc. | 15,172 | 184,947 |
MicroVision, Inc. *(a) | 76,762 | 111,305 |
Mirion Technologies, Inc., Class A * | 82,287 | 894,460 |
Motorola Solutions, Inc. | 75,553 | 25,623,800 |
M-Tron Industries, Inc. *(a) | 2,643 | 73,370 |
Napco Security Technologies, Inc. | 15,220 | 619,454 |
Neonode, Inc. * | 4,440 | 10,612 |
NetApp, Inc. | 93,570 | 9,563,790 |
NETGEAR, Inc. * | 13,065 | 193,101 |
NetScout Systems, Inc. * | 32,036 | 617,013 |
nLight, Inc. * | 20,404 | 232,402 |
Novanta, Inc. * | 15,969 | 2,499,149 |
One Stop Systems, Inc. * | 12,911 | 36,667 |
OSI Systems, Inc. * | 7,329 | 963,324 |
Ouster, Inc. * | 11,961 | 108,486 |
PAR Technology Corp. * | 12,016 | 508,037 |
PC Connection, Inc. | 4,459 | 276,324 |
Plexus Corp. * | 12,143 | 1,226,564 |
Powerfleet, Inc. * | 44,255 | 211,981 |
Pure Storage, Inc., Class A * | 135,306 | 6,819,422 |
Red Cat Holdings, Inc. * | 18,398 | 28,149 |
Research Frontiers, Inc. * | 21,870 | 33,899 |
RF Industries Ltd. * | 7,044 | 20,252 |
Ribbon Communications, Inc. * | 38,255 | 121,268 |
Richardson Electronics Ltd. | 5,554 | 58,484 |
Rogers Corp. * | 8,205 | 977,133 |
Sanmina Corp. * | 26,460 | 1,605,328 |
ScanSource, Inc. * | 10,228 | 425,689 |
Seagate Technology Holdings PLC | 87,775 | 7,540,750 |
SmartRent, Inc. * | 88,649 | 205,666 |
Sono-Tek Corp. * | 2,719 | 12,127 |
Super Micro Computer, Inc. * | 22,872 | 19,642,474 |
TD SYNNEX Corp. | 35,206 | 4,148,675 |
TE Connectivity Ltd. | 140,195 | 19,834,789 |
Teledyne Technologies, Inc. * | 21,443 | 8,180,076 |
TransAct Technologies, Inc. * | 3,397 | 18,174 |
Trimble, Inc. * | 112,831 | 6,777,758 |
TTM Technologies, Inc. * | 50,171 | 749,053 |
Turtle Beach Corp. * | 12,904 | 181,946 |
Ubiquiti, Inc. | 1,828 | 196,656 |
Viasat, Inc. * | 39,177 | 623,306 |
Viavi Solutions, Inc. * | 109,669 | 866,385 |
Vishay Intertechnology, Inc. | 59,167 | 1,369,124 |
Vishay Precision Group, Inc. * | 5,394 | 178,002 |
Vontier Corp. | 69,566 | 2,826,467 |
Western Digital Corp. * | 147,374 | 10,438,500 |
Wrap Technologies, Inc. *(a) | 21,515 | 35,930 |
SECURITY | NUMBER OF SHARES | VALUE ($) |
Xerox Holdings Corp. | 54,423 | 723,282 |
Zebra Technologies Corp., Class A * | 23,198 | 7,297,163 |
1,555,225,279 | ||
Telecommunication Services 0.8% | ||
Anterix, Inc. * | 8,567 | 270,032 |
AST SpaceMobile, Inc., Class A *(a) | 49,621 | 109,662 |
AT&T, Inc. | 3,245,111 | 54,809,925 |
ATN International, Inc. | 5,256 | 100,284 |
Bandwidth, Inc., Class A * | 15,306 | 278,569 |
Cogent Communications Holdings, Inc. | 18,826 | 1,208,253 |
Consolidated Communications Holdings, Inc. * | 28,849 | 124,628 |
Frontier Communications Parent, Inc. * | 99,705 | 2,307,174 |
GCI Liberty, Inc. *(c) | 35,715 | 0 |
Globalstar, Inc. * | 393,479 | 507,588 |
Gogo, Inc. * | 27,853 | 252,348 |
IDT Corp., Class B | 8,928 | 317,301 |
Iridium Communications, Inc. | 59,821 | 1,841,889 |
Liberty Global Ltd., Class C * | 166,066 | 2,718,500 |
Liberty Latin America Ltd., Class C * | 78,742 | 593,715 |
Lumen Technologies, Inc. * | 466,434 | 555,056 |
NII Holdings, Inc. Escrow *(c) | 28,127 | 16,876 |
Ooma, Inc. * | 9,711 | 68,560 |
Shenandoah Telecommunications Co. | 21,835 | 279,925 |
Spok Holdings, Inc. | 9,849 | 152,167 |
SurgePays, Inc. * | 2,477 | 9,016 |
Telephone & Data Systems, Inc. | 46,178 | 722,686 |
T-Mobile U.S., Inc. | 236,794 | 38,874,471 |
U.S. Cellular Corp. * | 5,896 | 214,379 |
Verizon Communications, Inc. | 1,912,374 | 75,519,649 |
181,852,653 | ||
Transportation 1.7% | ||
Air Transport Services Group, Inc. * | 23,833 | 305,539 |
Alaska Air Group, Inc. * | 57,126 | 2,457,561 |
Allegiant Travel Co. | 6,715 | 366,370 |
American Airlines Group, Inc. * | 298,086 | 4,027,142 |
ArcBest Corp. | 10,461 | 1,160,230 |
Avis Budget Group, Inc. | 8,421 | 803,784 |
Blade Air Mobility, Inc. * | 26,008 | 82,966 |
CH Robinson Worldwide, Inc. | 52,132 | 3,701,372 |
Covenant Logistics Group, Inc., Class A | 3,394 | 153,375 |
CSX Corp. | 899,474 | 29,880,526 |
Delta Air Lines, Inc. | 290,627 | 14,551,694 |
Expeditors International of Washington, Inc. | 65,856 | 7,330,431 |
FedEx Corp. | 104,452 | 27,343,445 |
Forward Air Corp. | 16,471 | 362,691 |
Frontier Group Holdings, Inc. * | 16,091 | 97,190 |
FTAI Infrastructure, Inc. | 43,117 | 312,167 |
Genco Shipping & Trading Ltd. | 21,083 | 449,911 |
GXO Logistics, Inc. * | 55,079 | 2,735,223 |
Hawaiian Holdings, Inc. * | 23,476 | 298,145 |
Heartland Express, Inc. | 26,008 | 258,520 |
Hertz Global Holdings, Inc. * | 58,859 | 267,808 |
Hub Group, Inc., Class A | 27,438 | 1,103,556 |
JB Hunt Transport Services, Inc. | 37,219 | 6,050,693 |
JetBlue Airways Corp. * | 159,399 | 905,386 |
Joby Aviation, Inc. *(a) | 176,913 | 893,411 |
Kirby Corp. * | 26,767 | 2,921,083 |
SECURITY | NUMBER OF SHARES | VALUE ($) |
Knight-Swift Transportation Holdings, Inc. | 72,797 | 3,365,405 |
Landstar System, Inc. | 16,229 | 2,830,500 |
Lyft, Inc., Class A * | 157,186 | 2,458,389 |
Marten Transport Ltd. | 24,450 | 413,694 |
Matson, Inc. | 15,481 | 1,668,542 |
Mesa Air Group, Inc. * | 12,880 | 11,745 |
Norfolk Southern Corp. | 102,798 | 23,676,435 |
Old Dominion Freight Line, Inc. | 81,290 | 14,771,206 |
PAM Transportation Services, Inc. * | 3,071 | 52,606 |
Pangaea Logistics Solutions Ltd. | 13,298 | 95,746 |
Radiant Logistics, Inc. * | 16,850 | 83,239 |
RXO, Inc. * | 54,429 | 1,029,252 |
Ryder System, Inc. | 19,907 | 2,425,668 |
Saia, Inc. * | 12,101 | 4,802,040 |
Schneider National, Inc., Class B | 16,152 | 334,023 |
SkyWest, Inc. * | 19,023 | 1,389,250 |
Southwest Airlines Co. | 272,830 | 7,077,210 |
Spirit Airlines, Inc. (a) | 47,850 | 168,911 |
Sun Country Airlines Holdings, Inc. * | 20,591 | 274,066 |
Surf Air Mobility, Inc. * | 48,023 | 21,466 |
Uber Technologies, Inc. * | 936,047 | 62,031,835 |
U-Haul Holding Co. * | 4,034 | 255,070 |
U-Haul Holding Co. - Non Voting | 44,912 | 2,754,004 |
Union Pacific Corp. | 277,366 | 65,780,121 |
United Airlines Holdings, Inc. * | 147,914 | 7,611,654 |
United Parcel Service, Inc., Class B | 329,201 | 48,550,563 |
Universal Logistics Holdings, Inc. | 3,300 | 147,444 |
Werner Enterprises, Inc. | 27,633 | 945,049 |
XPO, Inc. * | 53,108 | 5,706,986 |
369,552,338 | ||
Utilities 2.3% | ||
AES Corp. | 306,040 | 5,478,116 |
ALLETE, Inc. | 26,534 | 1,571,343 |
Alliant Energy Corp. | 116,028 | 5,778,194 |
Altus Power, Inc., Class A * | 33,848 | 124,222 |
Ameren Corp. | 119,235 | 8,807,889 |
American Electric Power Co., Inc. | 239,618 | 20,614,337 |
American States Water Co. | 16,953 | 1,200,950 |
American Water Works Co., Inc. | 88,888 | 10,872,780 |
Artesian Resources Corp., Class A | 5,123 | 179,203 |
Atmos Energy Corp. | 69,022 | 8,137,694 |
Avangrid, Inc. | 33,121 | 1,209,910 |
Avista Corp. | 35,541 | 1,278,765 |
Black Hills Corp. | 30,477 | 1,673,187 |
Cadiz, Inc. * | 22,878 | 52,162 |
California Water Service Group | 26,419 | 1,297,701 |
CenterPoint Energy, Inc. | 287,421 | 8,375,448 |
Chesapeake Utilities Corp. | 11,401 | 1,207,024 |
Clearway Energy, Inc., Class C | 49,671 | 1,161,308 |
CMS Energy Corp. | 134,794 | 8,169,864 |
Consolidated Edison, Inc. | 156,924 | 14,813,626 |
Consolidated Water Co. Ltd. | 7,055 | 179,550 |
Constellation Energy Corp. | 145,399 | 27,035,490 |
Dominion Energy, Inc. | 379,611 | 19,352,569 |
DTE Energy Co. | 93,234 | 10,285,575 |
Duke Energy Corp. | 350,914 | 34,480,810 |
Edison International | 175,027 | 12,437,419 |
Entergy Corp. | 95,663 | 10,204,372 |
Essential Utilities, Inc. | 114,012 | 4,170,559 |
Evergy, Inc. | 104,513 | 5,481,707 |
Eversource Energy | 159,616 | 9,675,922 |
Exelon Corp. | 453,850 | 17,055,683 |
FirstEnergy Corp. | 234,611 | 8,994,986 |
Genie Energy Ltd., Class B | 9,550 | 146,019 |
Global Water Resources, Inc. | 4,694 | 57,455 |
SECURITY | NUMBER OF SHARES | VALUE ($) |
Hawaiian Electric Industries, Inc. | 54,493 | 536,756 |
IDACORP, Inc. | 22,760 | 2,157,193 |
MGE Energy, Inc. | 15,717 | 1,230,955 |
Middlesex Water Co. | 7,892 | 400,282 |
Montauk Renewables, Inc. * | 25,936 | 93,370 |
National Fuel Gas Co. | 40,811 | 2,167,064 |
New Jersey Resources Corp. | 43,656 | 1,907,331 |
NextEra Energy, Inc. | 933,305 | 62,503,436 |
NiSource, Inc. | 186,681 | 5,200,933 |
Northwest Natural Holding Co. | 17,565 | 670,105 |
Northwestern Energy Group, Inc. | 27,838 | 1,404,149 |
NRG Energy, Inc. | 102,774 | 7,468,587 |
OGE Energy Corp. | 89,795 | 3,111,397 |
ONE Gas, Inc. | 25,379 | 1,637,453 |
Ormat Technologies, Inc. | 23,704 | 1,513,026 |
Otter Tail Corp. | 19,170 | 1,636,351 |
PG&E Corp. | 968,912 | 16,578,084 |
Pinnacle West Capital Corp. | 51,371 | 3,783,474 |
PNM Resources, Inc. | 40,149 | 1,487,922 |
Portland General Electric Co. | 44,770 | 1,935,407 |
PPL Corp. | 332,815 | 9,139,100 |
Public Service Enterprise Group, Inc. | 226,755 | 15,664,235 |
Pure Cycle Corp. * | 8,445 | 80,565 |
RGC Resources, Inc. | 3,883 | 80,067 |
Sempra | 285,648 | 20,460,966 |
SJW Group | 12,159 | 662,058 |
Southern Co. | 496,408 | 36,485,988 |
Southwest Gas Holdings, Inc. | 27,936 | 2,084,584 |
Spire, Inc. | 24,005 | 1,483,269 |
Spruce Power Holding Corp. * | 8,683 | 38,553 |
Sunnova Energy International, Inc. * | 50,407 | 212,213 |
UGI Corp. | 96,071 | 2,455,575 |
Unitil Corp. | 7,063 | 359,789 |
Via Renewables, Inc., Class A * | 1,312 | 14,288 |
Vistra Corp. | 152,628 | 11,575,307 |
WEC Energy Group, Inc. | 143,364 | 11,847,601 |
Xcel Energy, Inc. | 251,864 | 13,532,653 |
York Water Co. | 6,196 | 220,020 |
505,381,945 | ||
Total Common Stocks (Cost $10,711,489,238) | 22,150,964,356 | |
RIGHTS 0.0% OF NET ASSETS | ||
Pharmaceuticals, Biotechnology & Life Sciences 0.0% | ||
Aduro Biotech, Inc. CVR *(c) | 5,747 | 15,054 |
Cartesian Therapeutics, Inc. CVR *(c) | 59,796 | 10,763 |
Frequency Therapeutics, Inc. CVR *(c) | 23,364 | 15,888 |
F-star Therapeutics, Inc. Agonist CVR *(c) | 975 | 421 |
F-star Therapeutics, Inc. Antagonist CVR *(c) | 975 | 421 |
IMARA, Inc. CVR *(c) | 11,519 | 4,391 |
Magenta Therapeutics, Inc. CVR *(c) | 27,369 | 1,341 |
SECURITY | NUMBER OF SHARES | VALUE ($) |
Miromatrix Medical, Inc. CVR *(c) | 11,036 | 1,545 |
Pardes Biosciences, Inc. CVR *(c) | 19,235 | 577 |
Satsuma Pharmaceuticals, Inc. CVR *(c) | 5,234 | 995 |
Sesen Bio CVR *(c) | 67,895 | 0 |
Surface Oncology, Inc. CVR *(c) | 44,721 | 3,275 |
Zynerba Pharmaceuticals, Inc. CVR *(c) | 37,596 | 7,297 |
61,968 | ||
Total Rights (Cost $33,224) | 61,968 | |
SHORT-TERM INVESTMENTS 0.1% OF NET ASSETS | ||
Money Market Funds 0.1% | ||
State Street Institutional U.S. Government Money Market Fund, Premier Class 5.25% (e)(f) | 27,953,654 | 27,953,654 |
Total Short-Term Investments (Cost $27,953,654) | 27,953,654 | |
Total Investments in Securities (Cost $10,739,476,116) | 22,178,979,978 | |
NUMBER OF CONTRACTS | NOTIONAL AMOUNT ($) | CURRENT VALUE/ UNREALIZED DEPRECIATION ($) | |
FUTURES CONTRACTS | |||
Long | |||
Russell 2000 Index, e-mini, expires 06/21/24 | 146 | 14,494,880 | (275,390 ) |
S&P 500 Index, e-mini, expires 06/21/24 | 316 | 80,058,600 | (1,369,829 ) |
(1,645,219 ) | |||
* | Non-income producing security. |
(a) | All or a portion of this security is on loan. Securities on loan were valued at $25,777,722. |
(b) | Issuer is an affiliated company, as the investment adviser owns at least 5% of the voting securities of such company. |
(c) | Fair valued using significant unobservable inputs (see financial note 2(a), Securities for which no quoted value is available, for additional information). |
(d) | Issuer is affiliated with the fund’s investment adviser. |
(e) | The rate shown is the annualized 7-day yield. |
(f) | Security purchased with cash collateral received for securities on loan. |
CVR — | Contingent Value Rights |
REIT — | Real Estate Investment Trust |
SECURITY | VALUE AT 10/31/23 | PURCHASES | SALES | REALIZED GAINS (LOSSES) | NET CHANGE IN UNREALIZED APPRECIATION (DEPRECIATION) | VALUE AT 4/30/24 | BALANCE OF SHARES HELD AT 4/30/24 | DIVIDENDS RECEIVED |
COMMON STOCKS 0.2% OF NET ASSETS | ||||||||
Consumer Durables & Apparel 0.0% | ||||||||
Fossil Group, Inc. | $— | $— | ($28,752 ) | ($189,786 ) | $187,389 | $— | — | $— |
Tupperware Brands Corp. | — | — | — | — | (19,421 ) | 21,006 | 19,817 | — |
21,006 | ||||||||
Equity Real Estate Investment Trusts (REITs) 0.0% | ||||||||
Ashford Hospitality Trust, Inc. | — | — | — | — | (11,715 ) | 14,582 | 12,463 | — |
Diversified Healthcare Trust | — | — | — | — | 29,000 | 236,000 | 100,000 | 2,000 |
250,582 | ||||||||
Financial Services 0.2% | ||||||||
Charles Schwab Corp. | 33,371,014 | 2,010,037 | — | — | 14,306,472 | 49,687,523 | 671,907 | 325,866 |
Pharmaceuticals, Biotechnology & Life Sciences 0.0% | ||||||||
Emergent BioSolutions, Inc. | — | 92,228 | — | — | (10,687 ) | 81,541 | 43,373 | — |
Transportation 0.0% | ||||||||
Daseke, Inc. | — | — | (158,132 ) | (15,671 ) | 89,212 | — | — | — |
Total | $33,371,014 | $2,102,265 | ($186,884 ) | ($205,457 ) | $14,570,250 | $50,040,652 | $327,866 | |
DESCRIPTION | QUOTED PRICES IN ACTIVE MARKETS FOR IDENTICAL ASSETS (LEVEL 1) | OTHER SIGNIFICANT OBSERVABLE INPUTS (LEVEL 2) | SIGNIFICANT UNOBSERVABLE INPUTS (LEVEL 3) | TOTAL |
Assets | ||||
Common Stocks1 | $15,609,175,954 | $— | $— | $15,609,175,954 |
Equity Real Estate Investment Trusts (REITs) | 528,448,731 | — | 0 * | 528,448,731 |
Health Care Equipment & Services | 1,119,572,672 | — | 0 * | 1,119,572,672 |
Materials | 582,573,471 | — | 0 * | 582,573,471 |
Pharmaceuticals, Biotechnology & Life Sciences | 1,580,613,760 | — | 71,996 | 1,580,685,756 |
Software & Services | 2,548,655,092 | — | 27 | 2,548,655,119 |
Telecommunication Services | 181,835,777 | — | 16,876 * | 181,852,653 |
Rights | ||||
Pharmaceuticals, Biotechnology & Life Sciences | — | — | 61,968 * | 61,968 |
Short-Term Investments1 | 27,953,654 | — | — | 27,953,654 |
Liabilities | ||||
Futures Contracts2 | (1,645,219 ) | — | — | (1,645,219 ) |
Total | $22,177,183,892 | $— | $150,867 | $22,177,334,759 |
* | Level 3 amount shown includes securities determined to have no value at April 30, 2024. |
1 | As categorized in the Portfolio Holdings. |
2 | Futures contracts are reported at cumulative unrealized appreciation or depreciation. |
Assets | ||
Investments in securities, at value - affiliated issuers (cost $26,695,864) including securities on loan of $19,928 | $50,040,652 | |
Investments in securities, at value - unaffiliated issuers (cost $10,712,780,252) including securities on loan of $25,757,794 | 22,128,939,326 | |
Cash | 81,693,041 | |
Deposit with broker for futures contracts | 5,151,700 | |
Receivables: | ||
Dividends | 12,579,901 | |
Fund shares sold | 9,114,937 | |
Income from securities on loan | + | 192,703 |
Total assets | 22,287,712,260 | |
Liabilities | ||
Collateral held for securities on loan | 27,953,654 | |
Payables: | ||
Fund shares redeemed | 8,221,779 | |
Variation margin on futures contracts | 1,566,949 | |
Investment adviser fees | 554,931 | |
Investments bought | + | 211,008 |
Total liabilities | 38,508,321 | |
Net assets | $22,249,203,939 | |
Net Assets by Source | ||
Capital received from investors | $11,046,644,124 | |
Total distributable earnings | + | 11,202,559,815 |
Net assets | $22,249,203,939 | |
Net Asset Value (NAV) | ||||
Net Assets | ÷ | Shares Outstanding | = | NAV |
$22,249,203,939 | 261,210,752 | $85.18 | ||
For the period November 1, 2023 through April 30, 2024; unaudited | ||
Investment Income | ||
Dividends received from securities - unaffiliated issuers (net of foreign withholding tax of $52,731) | $160,761,896 | |
Other interest | 1,405,118 | |
Dividends received from securities - affiliated issuers | 327,866 | |
Securities on loan, net | + | 1,089,144 |
Total investment income | 163,584,024 | |
Expenses | ||
Investment adviser fees | 3,163,690 | |
Total expenses | – | 3,163,690 |
Net investment income | 160,420,334 | |
REALIZED AND UNREALIZED GAINS (LOSSES) | ||
Net realized losses on sales of securities - affiliated issuers | (205,457 ) | |
Net realized losses on sales of securities - unaffiliated issuers | (51,182,999 ) | |
Net realized gains on futures contracts | + | 16,256,342 |
Net realized losses | (35,132,114 ) | |
Net change in unrealized appreciation (depreciation) on securities - affiliated issuers | 14,570,250 | |
Net change in unrealized appreciation (depreciation) on securities - unaffiliated issuers | 3,666,815,221 | |
Net change in unrealized appreciation (depreciation) on futures contracts | + | 1,152,367 |
Net change in unrealized appreciation (depreciation) | + | 3,682,537,838 |
Net realized and unrealized gains | 3,647,405,724 | |
Increase in net assets resulting from operations | $3,807,826,058 | |
OPERATIONS | |||
11/1/23-4/30/24 | 11/1/22-10/31/23 | ||
Net investment income | $160,420,334 | $277,537,921 | |
Net realized losses | (35,132,114 ) | (119,476,059 ) | |
Net change in unrealized appreciation (depreciation) | + | 3,682,537,838 | 1,187,203,918 |
Increase in net assets resulting from operations | $3,807,826,058 | $1,345,265,780 | |
DISTRIBUTIONS TO SHAREHOLDERS | |||
Total distributions | ($286,776,664 ) | ($253,821,250 ) | |
TRANSACTIONS IN FUND SHARES | |||||
11/1/23-4/30/24 | 11/1/22-10/31/23 | ||||
SHARES | VALUE | SHARES | VALUE | ||
Shares sold | 22,911,200 | $1,883,414,775 | 34,717,416 | $2,458,225,307 | |
Shares reinvested | 3,034,125 | 235,903,167 | 2,670,248 | 178,132,255 | |
Shares redeemed | + | (14,244,468 ) | (1,178,070,156 ) | (28,004,932 ) | (1,987,092,998 ) |
Net transactions in fund shares | 11,700,857 | $941,247,786 | 9,382,732 | $649,264,564 | |
SHARES OUTSTANDING AND NET ASSETS | |||||
11/1/23-4/30/24 | 11/1/22-10/31/23 | ||||
SHARES | NET ASSETS | SHARES | NET ASSETS | ||
Beginning of period | 249,509,895 | $17,786,906,759 | 240,127,163 | $16,046,197,665 | |
Total increase | + | 11,700,857 | 4,462,297,180 | 9,382,732 | 1,740,709,094 |
End of period | 261,210,752 | $22,249,203,939 | 249,509,895 | $17,786,906,759 | |
11/1/23– 4/30/24* | 11/1/22– 10/31/23 | 11/1/21– 10/31/22 | 11/1/20– 10/31/21 | 11/1/19– 10/31/20 | 11/1/18– 10/31/19 | |
Per-Share Data | ||||||
Net asset value at beginning of period | $77.88 | $66.09 | $89.23 | $62.76 | $49.06 | $42.37 |
Income (loss) from investment operations: | ||||||
Net investment income (loss)1 | 0.36 | 0.67 | 0.64 | 0.56 | 0.55 | 0.57 |
Net realized and unrealized gains (losses) | 17.94 | 11.71 | (22.20 ) | 26.39 | 13.65 | 6.52 |
Total from investment operations | 18.30 | 12.38 | (21.56 ) | 26.95 | 14.20 | 7.09 |
Less distributions: | ||||||
Distributions from net investment income | (0.60 ) | (0.59 ) | (0.51 ) | (0.48 ) | (0.50 ) | (0.40 ) |
Distributions from net realized gains | — | — | (1.07 ) | — | — | — |
Total distributions | (0.60 ) | (0.59 ) | (1.58 ) | (0.48 ) | (0.50 ) | (0.40 ) |
Net asset value at end of period | $95.58 | $77.88 | $66.09 | $89.23 | $62.76 | $49.06 |
Total return | 23.58 %2 | 18.89 % | (24.63 %) | 43.14 % | 29.16 % | 17.04 % |
Ratios/Supplemental Data | ||||||
Ratios to average net assets: | ||||||
Total expenses | 0.035 %3 | 0.035 % | 0.035 %4 | 0.035 % | 0.035 % | 0.035 %5 |
Net investment income (loss) | 0.79 %3 | 0.91 % | 0.86 % | 0.73 % | 0.97 % | 1.27 % |
Portfolio turnover rate | 2 %2 | 20 %6 | 18 % | 18 % | 41 % | 46 % |
Net assets, end of period (x 1,000,000) | $2,203 | $1,352 | $929 | $881 | $487 | $166 |
* | Unaudited. |
1 | Calculated based on the average shares outstanding during the period. |
2 | Not annualized. |
3 | Annualized. |
4 | Ratio includes less than 0.0005% of non-routine proxy expenses. |
5 | Effective December 20, 2018, the annual operating expense ratio was reduced to 0.035%. The ratio presented for period ended October 31, 2019, is a blended ratio. |
6 | Portfolio turnover rate excludes in-kind transactions. |
SECURITY | NUMBER OF SHARES | VALUE ($) |
COMMON STOCKS 99.5% OF NET ASSETS | ||
Automobiles & Components 2.0% | ||
Tesla, Inc. * | 240,424 | 44,064,911 |
Banks 0.1% | ||
First Citizens BancShares, Inc., Class A | 108 | 182,170 |
NU Holdings Ltd., Class A * | 139,350 | 1,513,341 |
1,695,511 | ||
Capital Goods 2.8% | ||
A O Smith Corp. | 1,120 | 92,781 |
Advanced Drainage Systems, Inc. | 5,803 | 911,071 |
Allegion PLC | 7,026 | 854,081 |
Allison Transmission Holdings, Inc. | 823 | 60,532 |
Armstrong World Industries, Inc. | 1,084 | 124,530 |
Axon Enterprise, Inc. * | 6,131 | 1,923,049 |
Boeing Co. * | 6,678 | 1,120,836 |
BWX Technologies, Inc. | 1,314 | 125,842 |
Caterpillar, Inc. | 33,342 | 11,155,233 |
ChargePoint Holdings, Inc. *(a) | 29,560 | 39,315 |
Deere & Co. | 20,987 | 8,214,522 |
Donaldson Co., Inc. | 4,211 | 304,034 |
EMCOR Group, Inc. | 1,402 | 500,752 |
Fastenal Co. | 37,380 | 2,539,597 |
Ferguson PLC | 1,006 | 211,159 |
Graco, Inc. | 6,019 | 482,724 |
HEICO Corp. | 8,631 | 1,790,069 |
Honeywell International, Inc. | 7,497 | 1,444,897 |
Hubbell, Inc., Class B | 2,134 | 790,690 |
IDEX Corp. | 498 | 109,789 |
Illinois Tool Works, Inc. | 21,215 | 5,178,794 |
Lincoln Electric Holdings, Inc. | 4,532 | 994,910 |
Lockheed Martin Corp. | 18,813 | 8,746,728 |
Northrop Grumman Corp. | 704 | 341,461 |
Otis Worldwide Corp. | 2,160 | 196,992 |
Quanta Services, Inc. | 3,287 | 849,887 |
Rockwell Automation, Inc. | 9,972 | 2,702,013 |
SiteOne Landscape Supply, Inc. * | 1,252 | 196,426 |
Spirit AeroSystems Holdings, Inc., Class A * | 1,211 | 38,752 |
Toro Co. | 8,945 | 783,493 |
Trane Technologies PLC | 5,872 | 1,863,420 |
TransDigm Group, Inc. | 783 | 977,207 |
Trex Co., Inc. * | 9,448 | 836,620 |
United Rentals, Inc. | 1,219 | 814,280 |
Valmont Industries, Inc. | 94 | 19,251 |
Vertiv Holdings Co., Class A | 2,198 | 204,414 |
Watsco, Inc. | 744 | 333,104 |
WillScot Mobile Mini Holdings Corp. * | 3,955 | 146,177 |
WW Grainger, Inc. | 3,846 | 3,543,512 |
Xylem, Inc. | 2,492 | 325,704 |
61,888,648 | ||
SECURITY | NUMBER OF SHARES | VALUE ($) |
Commercial & Professional Services 1.7% | ||
Automatic Data Processing, Inc. | 30,899 | 7,474,159 |
Booz Allen Hamilton Holding Corp., Class A | 11,234 | 1,658,925 |
Broadridge Financial Solutions, Inc. | 8,522 | 1,648,240 |
Cintas Corp. | 6,740 | 4,437,212 |
Copart, Inc. * | 75,122 | 4,079,876 |
Dayforce, Inc. * | 1,112 | 68,243 |
Equifax, Inc. | 7,321 | 1,612,011 |
FTI Consulting, Inc. * | 526 | 112,475 |
Genpact Ltd. | 3,886 | 119,456 |
KBR, Inc. | 4,274 | 277,553 |
MSA Safety, Inc. | 529 | 95,432 |
Paychex, Inc. | 27,959 | 3,321,809 |
Paycom Software, Inc. | 4,487 | 843,466 |
Paycor HCM, Inc. * | 2,666 | 46,308 |
Paylocity Holding Corp. * | 3,669 | 569,282 |
RB Global, Inc. | 12,146 | 869,411 |
Rollins, Inc. | 21,997 | 980,186 |
Tetra Tech, Inc. | 802 | 156,165 |
Verisk Analytics, Inc., Class A | 12,433 | 2,709,897 |
Waste Management, Inc. | 31,847 | 6,624,813 |
37,704,919 | ||
Consumer Discretionary Distribution & Retail 9.5% | ||
Amazon.com, Inc. * | 784,376 | 137,265,800 |
AutoZone, Inc. * | 1,255 | 3,710,282 |
Best Buy Co., Inc. | 2,173 | 160,020 |
Burlington Stores, Inc. * | 5,654 | 1,017,381 |
CarMax, Inc. * | 743 | 50,502 |
Coupang, Inc., Class A * | 95,112 | 2,140,020 |
Dick's Sporting Goods, Inc. | 373 | 74,951 |
eBay, Inc. | 3,221 | 166,010 |
Etsy, Inc. * | 5,893 | 404,672 |
Five Below, Inc. * | 4,727 | 691,749 |
Floor & Decor Holdings, Inc., Class A * | 9,056 | 999,148 |
Home Depot, Inc. | 87,181 | 29,137,634 |
Lowe's Cos., Inc. | 36,891 | 8,410,779 |
Murphy USA, Inc. | 1,610 | 666,250 |
Ollie's Bargain Outlet Holdings, Inc. * | 1,756 | 128,434 |
O'Reilly Automotive, Inc. * | 4,372 | 4,429,973 |
Pool Corp. | 3,374 | 1,223,176 |
RH * | 221 | 54,598 |
Ross Stores, Inc. | 26,831 | 3,475,956 |
TJX Cos., Inc. | 99,399 | 9,352,452 |
Tractor Supply Co. | 9,378 | 2,560,944 |
Ulta Beauty, Inc. * | 4,228 | 1,711,664 |
Valvoline, Inc. * | 3,037 | 129,133 |
Victoria's Secret & Co. * | 2,998 | 52,825 |
Wayfair, Inc., Class A * | 2,543 | 127,531 |
Williams-Sonoma, Inc. | 743 | 213,078 |
208,354,962 | ||
SECURITY | NUMBER OF SHARES | VALUE ($) |
Consumer Durables & Apparel 0.5% | ||
Birkenstock Holding PLC * | 709 | 31,742 |
Brunswick Corp. | 393 | 31,692 |
Crocs, Inc. * | 5,229 | 650,331 |
Deckers Outdoor Corp. * | 2,220 | 1,817,003 |
Lululemon Athletica, Inc. * | 9,677 | 3,489,526 |
NIKE, Inc., Class B | 54,562 | 5,033,890 |
NVR, Inc. * | 23 | 171,094 |
Peloton Interactive, Inc., Class A * | 28,105 | 87,407 |
Polaris, Inc. | 403 | 34,319 |
Skechers USA, Inc., Class A * | 846 | 55,878 |
Tapestry, Inc. | 1,094 | 43,672 |
Tempur Sealy International, Inc. | 2,793 | 139,818 |
TopBuild Corp. * | 176 | 71,222 |
YETI Holdings, Inc. * | 7,549 | 269,650 |
11,927,244 | ||
Consumer Services 2.9% | ||
Airbnb, Inc., Class A * | 36,096 | 5,723,743 |
Booking Holdings, Inc. | 3,041 | 10,497,623 |
Bright Horizons Family Solutions, Inc. * | 589 | 61,085 |
Caesars Entertainment, Inc. * | 7,255 | 259,874 |
Cava Group, Inc. * | 3,278 | 235,819 |
Chipotle Mexican Grill, Inc., Class A * | 2,392 | 7,557,763 |
Choice Hotels International, Inc. | 2,578 | 304,874 |
Churchill Downs, Inc. | 6,126 | 790,254 |
Darden Restaurants, Inc. | 4,844 | 743,118 |
Domino's Pizza, Inc. | 3,043 | 1,610,569 |
DoorDash, Inc., Class A * | 21,128 | 2,731,005 |
DraftKings, Inc., Class A * | 36,430 | 1,514,031 |
Expedia Group, Inc. * | 8,475 | 1,140,989 |
Grand Canyon Education, Inc. * | 710 | 92,314 |
H&R Block, Inc. | 8,133 | 384,122 |
Hilton Worldwide Holdings, Inc. | 9,932 | 1,959,385 |
Las Vegas Sands Corp. | 29,947 | 1,328,449 |
Marriott International, Inc., Class A | 20,915 | 4,938,659 |
McDonald's Corp. | 26,308 | 7,183,136 |
Norwegian Cruise Line Holdings Ltd. * | 8,600 | 162,712 |
Planet Fitness, Inc., Class A * | 3,504 | 209,680 |
Royal Caribbean Cruises Ltd. * | 6,146 | 858,166 |
Service Corp. International | 4,531 | 324,918 |
Starbucks Corp. | 96,843 | 8,569,637 |
Texas Roadhouse, Inc., Class A | 5,781 | 929,469 |
Travel & Leisure Co. | 2,721 | 118,472 |
Vail Resorts, Inc. | 298 | 56,432 |
Wendy's Co. | 14,417 | 288,196 |
Wingstop, Inc. | 2,573 | 990,065 |
Wyndham Hotels & Resorts, Inc. | 396 | 29,110 |
Wynn Resorts Ltd. | 543 | 49,766 |
Yum! Brands, Inc. | 21,502 | 3,037,158 |
64,680,593 | ||
Consumer Staples Distribution & Retail 1.9% | ||
Albertsons Cos., Inc., Class A | 3,424 | 69,850 |
BJ's Wholesale Club Holdings, Inc. * | 3,991 | 298,048 |
Casey's General Stores, Inc. | 488 | 155,955 |
Costco Wholesale Corp. | 38,625 | 27,922,012 |
Dollar General Corp. | 19,087 | 2,656,720 |
Maplebear, Inc. * | 1,387 | 47,338 |
Performance Food Group Co. * | 6,154 | 417,733 |
Sysco Corp. | 43,227 | 3,212,631 |
Target Corp. | 40,159 | 6,464,796 |
41,245,083 | ||
SECURITY | NUMBER OF SHARES | VALUE ($) |
Energy 0.5% | ||
Antero Midstream Corp. | 9,375 | 129,750 |
APA Corp. | 23,223 | 730,131 |
Cheniere Energy, Inc. | 20,875 | 3,294,493 |
Halliburton Co. | 15,666 | 587,005 |
Hess Corp. | 13,556 | 2,134,934 |
New Fortress Energy, Inc. | 5,741 | 150,414 |
ONEOK, Inc. | 2,639 | 208,798 |
Ovintiv, Inc. | 9,928 | 509,505 |
Targa Resources Corp. | 19,197 | 2,189,610 |
Texas Pacific Land Corp. | 1,613 | 929,572 |
10,864,212 | ||
Equity Real Estate Investment Trusts (REITs) 0.7% | ||
American Tower Corp. | 40,516 | 6,950,925 |
Crown Castle, Inc. | 4,025 | 377,465 |
Equinix, Inc. | 4,078 | 2,899,907 |
Equity LifeStyle Properties, Inc. | 5,033 | 303,440 |
Iron Mountain, Inc. | 12,400 | 961,248 |
Lamar Advertising Co., Class A | 5,758 | 667,064 |
Public Storage | 7,920 | 2,054,844 |
SBA Communications Corp., Class A | 976 | 181,653 |
Simon Property Group, Inc. | 6,123 | 860,465 |
Sun Communities, Inc. | 2,257 | 251,249 |
UDR, Inc. | 1,743 | 66,373 |
15,574,633 | ||
Financial Services 5.4% | ||
American Express Co. | 16,610 | 3,887,238 |
Ameriprise Financial, Inc. | 8,738 | 3,598,221 |
Apollo Global Management, Inc. | 45,449 | 4,925,763 |
ARES Management Corp., Class A | 14,497 | 1,929,406 |
Blackstone, Inc. | 62,051 | 7,235,767 |
Block, Inc. * | 17,889 | 1,305,897 |
Blue Owl Capital, Inc., Class A | 5,989 | 113,132 |
Corpay, Inc. * | 5,669 | 1,712,832 |
Equitable Holdings, Inc. | 29,152 | 1,076,000 |
Euronet Worldwide, Inc. * | 1,907 | 195,811 |
FactSet Research Systems, Inc. | 3,333 | 1,389,494 |
Fiserv, Inc. * | 14,271 | 2,178,754 |
Houlihan Lokey, Inc., Class A | 320 | 40,797 |
Jack Henry & Associates, Inc. | 2,066 | 336,118 |
KKR & Co., Inc. | 14,353 | 1,335,834 |
LPL Financial Holdings, Inc. | 6,557 | 1,764,685 |
MarketAxess Holdings, Inc. | 3,204 | 641,088 |
Mastercard, Inc., Class A | 72,402 | 32,667,782 |
Moody's Corp. | 12,621 | 4,673,935 |
Morningstar, Inc. | 2,211 | 624,939 |
MSCI, Inc., Class A | 3,341 | 1,556,204 |
PayPal Holdings, Inc. * | 85,029 | 5,775,170 |
Rocket Cos., Inc., Class A * | 3,691 | 45,325 |
S&P Global, Inc. | 2,296 | 954,746 |
Shift4 Payments, Inc., Class A * | 4,593 | 265,751 |
SLM Corp. | 7,231 | 153,225 |
Toast, Inc., Class A * | 32,004 | 756,255 |
TPG, Inc. | 1,932 | 83,269 |
Tradeweb Markets, Inc., Class A | 3,495 | 355,476 |
UWM Holdings Corp. | 2,410 | 15,183 |
Visa, Inc., Class A | 139,101 | 37,363,920 |
Western Union Co. | 4,639 | 62,348 |
WEX, Inc. * | 1,658 | 350,269 |
XP, Inc., Class A | 2,624 | 53,713 |
119,424,347 | ||
SECURITY | NUMBER OF SHARES | VALUE ($) |
Food, Beverage & Tobacco 1.5% | ||
Boston Beer Co., Inc., Class A * | 768 | 213,819 |
Brown-Forman Corp., Class B | 15,782 | 755,169 |
Celsius Holdings, Inc. * | 12,465 | 888,380 |
Coca-Cola Co. | 168,688 | 10,419,858 |
Constellation Brands, Inc., Class A | 1,424 | 360,927 |
Freshpet, Inc. * | 1,002 | 106,282 |
Hershey Co. | 9,632 | 1,867,837 |
Lamb Weston Holdings, Inc. | 11,884 | 990,413 |
Monster Beverage Corp. * | 64,904 | 3,469,119 |
PepsiCo, Inc. | 83,041 | 14,607,742 |
33,679,546 | ||
Health Care Equipment & Services 3.9% | ||
Abbott Laboratories | 9,545 | 1,011,484 |
agilon health, Inc. * | 23,427 | 128,849 |
Align Technology, Inc. * | 6,665 | 1,882,063 |
Cardinal Health, Inc. | 10,967 | 1,130,040 |
Cencora, Inc. | 14,670 | 3,506,863 |
Certara, Inc. * | 4,131 | 70,681 |
Chemed Corp. | 904 | 513,472 |
Cigna Group | 1,867 | 666,594 |
DaVita, Inc. * | 4,624 | 642,782 |
Dexcom, Inc. * | 33,711 | 4,294,444 |
Doximity, Inc., Class A * | 4,526 | 109,937 |
Edwards Lifesciences Corp. * | 52,415 | 4,437,978 |
Elevance Health, Inc. | 2,736 | 1,446,195 |
Encompass Health Corp. | 536 | 44,692 |
GE HealthCare Technologies, Inc. | 2,692 | 205,238 |
Globus Medical, Inc., Class A * | 2,914 | 145,088 |
HCA Healthcare, Inc. | 3,575 | 1,107,606 |
Humana, Inc. | 4,631 | 1,398,979 |
IDEXX Laboratories, Inc. * | 7,171 | 3,533,582 |
Inspire Medical Systems, Inc. * | 2,536 | 612,850 |
Insulet Corp. * | 6,001 | 1,031,812 |
Intuitive Surgical, Inc. * | 30,444 | 11,283,155 |
Masimo Corp. * | 3,723 | 500,408 |
McKesson Corp. | 4,426 | 2,377,691 |
Molina Healthcare, Inc. * | 2,742 | 938,038 |
Novocure Ltd. * | 9,305 | 113,893 |
Penumbra, Inc. * | 3,174 | 623,596 |
ResMed, Inc. | 12,632 | 2,703,122 |
Shockwave Medical, Inc. * | 3,178 | 1,049,344 |
Stryker Corp. | 7,893 | 2,655,994 |
Tandem Diabetes Care, Inc. * | 808 | 29,646 |
UnitedHealth Group, Inc. | 68,136 | 32,957,383 |
Veeva Systems, Inc., Class A * | 12,618 | 2,505,430 |
85,658,929 | ||
Household & Personal Products 0.7% | ||
Church & Dwight Co., Inc. | 19,015 | 2,051,528 |
Clorox Co. | 10,766 | 1,591,968 |
Estee Lauder Cos., Inc., Class A | 6,323 | 927,647 |
Kenvue, Inc. | 51,067 | 961,081 |
Kimberly-Clark Corp. | 27,582 | 3,765,771 |
Procter & Gamble Co. | 38,704 | 6,316,493 |
15,614,488 | ||
Insurance 0.8% | ||
Arch Capital Group Ltd. * | 4,361 | 407,928 |
Arthur J Gallagher & Co. | 1,064 | 249,710 |
Brighthouse Financial, Inc. * | 635 | 30,639 |
Brown & Brown, Inc. | 8,046 | 656,071 |
Everest Group Ltd. | 500 | 183,205 |
SECURITY | NUMBER OF SHARES | VALUE ($) |
Kinsale Capital Group, Inc. | 1,900 | 690,175 |
Lincoln National Corp. | 1,436 | 39,160 |
Marsh & McLennan Cos., Inc. | 34,642 | 6,908,654 |
Primerica, Inc. | 1,905 | 403,593 |
Progressive Corp. | 38,169 | 7,948,694 |
RenaissanceRe Holdings Ltd. | 1,200 | 263,100 |
RLI Corp. | 747 | 105,589 |
Ryan Specialty Holdings, Inc., Class A | 8,249 | 407,006 |
Willis Towers Watson PLC | 1,117 | 280,523 |
18,574,047 | ||
Materials 0.7% | ||
Ardagh Metal Packaging SA | 12,258 | 48,419 |
Avery Dennison Corp. | 2,276 | 494,529 |
Axalta Coating Systems Ltd. * | 1,772 | 55,712 |
Eagle Materials, Inc. | 1,971 | 494,150 |
Ecolab, Inc. | 16,846 | 3,809,723 |
FMC Corp. | 1,610 | 95,006 |
Ginkgo Bioworks Holdings, Inc. *(a) | 10,975 | 9,780 |
Graphic Packaging Holding Co. | 13,794 | 356,575 |
Linde PLC | 3,984 | 1,756,785 |
PPG Industries, Inc. | 5,169 | 666,801 |
RPM International, Inc. | 2,096 | 224,083 |
Scotts Miracle-Gro Co. | 3,619 | 248,046 |
Sealed Air Corp. | 6,879 | 216,551 |
Sherwin-Williams Co. | 17,276 | 5,176,062 |
Southern Copper Corp. | 7,438 | 867,792 |
Vulcan Materials Co. | 2,572 | 662,624 |
15,182,638 | ||
Media & Entertainment 12.4% | ||
Alphabet, Inc., Class A * | 517,129 | 84,178,258 |
Alphabet, Inc., Class C * | 436,695 | 71,897,465 |
Cable One, Inc. | 58 | 22,843 |
Charter Communications, Inc., Class A * | 8,793 | 2,250,480 |
Liberty Broadband Corp., Class C * | 2,441 | 121,391 |
Live Nation Entertainment, Inc. * | 3,118 | 277,221 |
Match Group, Inc. * | 21,685 | 668,332 |
Meta Platforms, Inc., Class A | 192,792 | 82,933,335 |
Netflix, Inc. * | 37,215 | 20,492,067 |
Nexstar Media Group, Inc., Class A | 997 | 159,580 |
Pinterest, Inc., Class A * | 51,167 | 1,711,536 |
Playtika Holding Corp. | 2,699 | 19,568 |
ROBLOX Corp., Class A * | 41,150 | 1,463,294 |
Roku, Inc. * | 1,345 | 77,553 |
Spotify Technology SA * | 12,261 | 3,438,475 |
TKO Group Holdings, Inc. | 5,439 | 514,910 |
Trade Desk, Inc., Class A * | 38,401 | 3,181,523 |
ZoomInfo Technologies, Inc., Class A * | 13,945 | 221,168 |
273,628,999 | ||
Pharmaceuticals, Biotechnology & Life Sciences 6.7% | ||
10X Genomics, Inc., Class A * | 8,006 | 234,416 |
AbbVie, Inc. | 153,784 | 25,011,430 |
Agilent Technologies, Inc. | 20,636 | 2,827,957 |
Alnylam Pharmaceuticals, Inc. * | 8,735 | 1,257,403 |
Amgen, Inc. | 31,647 | 8,669,379 |
Apellis Pharmaceuticals, Inc. * | 8,780 | 387,988 |
BioMarin Pharmaceutical, Inc. * | 1,873 | 151,263 |
Bio-Techne Corp. | 12,745 | 805,611 |
Bruker Corp. | 8,701 | 678,765 |
Eli Lilly & Co. | 73,756 | 57,610,812 |
Exact Sciences Corp. * | 5,321 | 315,801 |
Exelixis, Inc. * | 20,073 | 470,913 |
ICON PLC, ADR * | 1,040 | 309,795 |
SECURITY | NUMBER OF SHARES | VALUE ($) |
Illumina, Inc. * | 4,044 | 497,614 |
Incyte Corp. * | 12,002 | 624,704 |
Ionis Pharmaceuticals, Inc. * | 10,522 | 434,138 |
IQVIA Holdings, Inc. * | 14,659 | 3,397,516 |
Jazz Pharmaceuticals PLC * | 2,641 | 292,491 |
Maravai LifeSciences Holdings, Inc., Class A * | 5,354 | 43,903 |
Medpace Holdings, Inc. * | 2,034 | 789,904 |
Merck & Co., Inc. | 40,640 | 5,251,501 |
Mettler-Toledo International, Inc. * | 1,860 | 2,287,242 |
Natera, Inc. * | 9,434 | 876,230 |
Neurocrine Biosciences, Inc. * | 8,467 | 1,164,551 |
Regeneron Pharmaceuticals, Inc. * | 633 | 563,788 |
Repligen Corp. * | 2,158 | 354,344 |
Roivant Sciences Ltd. * | 29,714 | 323,883 |
Sarepta Therapeutics, Inc. * | 7,821 | 990,608 |
Sotera Health Co. * | 8,094 | 90,653 |
Thermo Fisher Scientific, Inc. | 20,711 | 11,778,760 |
Ultragenyx Pharmaceutical, Inc. * | 6,913 | 294,079 |
Vertex Pharmaceuticals, Inc. * | 20,554 | 8,073,817 |
Waters Corp. * | 5,107 | 1,578,267 |
West Pharmaceutical Services, Inc. | 6,449 | 2,305,388 |
Zoetis, Inc. | 40,309 | 6,418,805 |
147,163,719 | ||
Real Estate Management & Development 0.1% | ||
CoStar Group, Inc. * | 15,209 | 1,392,080 |
Semiconductors & Semiconductor Equipment 13.6% | ||
Advanced Micro Devices, Inc. * | 79,484 | 12,588,676 |
Allegro MicroSystems, Inc. * | 6,799 | 201,862 |
Applied Materials, Inc. | 61,598 | 12,236,443 |
Broadcom, Inc. | 37,578 | 48,861,546 |
Enphase Energy, Inc. * | 11,567 | 1,258,027 |
Entegris, Inc. | 757 | 100,620 |
KLA Corp. | 11,799 | 8,132,933 |
Lam Research Corp. | 10,872 | 9,724,026 |
Lattice Semiconductor Corp. * | 11,898 | 816,203 |
Microchip Technology, Inc. | 32,976 | 3,033,133 |
Monolithic Power Systems, Inc. | 4,007 | 2,682,005 |
NVIDIA Corp. | 206,909 | 178,773,514 |
QUALCOMM, Inc. | 84,671 | 14,042,685 |
Teradyne, Inc. | 11,257 | 1,309,414 |
Texas Instruments, Inc. | 32,389 | 5,714,067 |
Universal Display Corp. | 1,845 | 291,473 |
299,766,627 | ||
Software & Services 19.1% | ||
Accenture PLC, Class A | 55,096 | 16,578,937 |
Adobe, Inc. * | 39,353 | 18,213,749 |
ANSYS, Inc. * | 6,244 | 2,028,551 |
AppLovin Corp., Class A * | 4,627 | 326,527 |
Atlassian Corp., Class A * | 13,499 | 2,325,878 |
Autodesk, Inc. * | 18,695 | 3,979,231 |
Bentley Systems, Inc., Class B | 15,801 | 830,027 |
Cadence Design Systems, Inc. * | 23,555 | 6,492,465 |
Cloudflare, Inc., Class A * | 25,654 | 2,242,160 |
Confluent, Inc., Class A * | 16,729 | 470,419 |
Crowdstrike Holdings, Inc., Class A * | 18,590 | 5,438,319 |
Datadog, Inc., Class A * | 24,239 | 3,041,994 |
DocuSign, Inc., Class A * | 17,637 | 998,254 |
DoubleVerify Holdings, Inc. * | 12,480 | 365,664 |
Dropbox, Inc., Class A * | 19,632 | 454,677 |
Dynatrace, Inc. * | 22,529 | 1,020,789 |
Elastic NV * | 6,971 | 712,576 |
SECURITY | NUMBER OF SHARES | VALUE ($) |
EPAM Systems, Inc. * | 4,852 | 1,141,481 |
Fair Isaac Corp. * | 2,116 | 2,398,126 |
Five9, Inc. * | 6,274 | 361,194 |
Fortinet, Inc. * | 56,164 | 3,548,441 |
Gartner, Inc. * | 6,591 | 2,719,381 |
Gen Digital, Inc. | 7,331 | 147,646 |
Gitlab, Inc., Class A * | 8,003 | 419,917 |
Globant SA * | 3,588 | 640,781 |
GoDaddy, Inc., Class A * | 7,505 | 918,462 |
HashiCorp, Inc., Class A * | 5,952 | 193,202 |
HubSpot, Inc. * | 4,036 | 2,441,255 |
Informatica, Inc., Class A * | 582 | 18,025 |
Intuit, Inc. | 23,798 | 14,888,505 |
Manhattan Associates, Inc. * | 5,384 | 1,109,427 |
Microsoft Corp. | 648,190 | 252,359,813 |
MongoDB, Inc., Class A * | 5,881 | 2,147,624 |
nCino, Inc. * | 546 | 15,921 |
Nutanix, Inc., Class A * | 5,145 | 312,301 |
Okta, Inc. * | 842 | 78,289 |
Oracle Corp. | 55,305 | 6,290,944 |
Palantir Technologies, Inc., Class A * | 167,451 | 3,678,898 |
Palo Alto Networks, Inc. * | 26,604 | 7,738,838 |
Pegasystems, Inc. | 3,617 | 214,922 |
Procore Technologies, Inc. * | 6,957 | 475,998 |
PTC, Inc. * | 5,251 | 931,737 |
RingCentral, Inc., Class A * | 7,290 | 215,930 |
Salesforce, Inc. | 61,518 | 16,544,651 |
SentinelOne, Inc., Class A * | 2,997 | 63,327 |
ServiceNow, Inc. * | 17,749 | 12,305,914 |
Smartsheet, Inc., Class A * | 11,073 | 418,892 |
Snowflake, Inc., Class A * | 27,415 | 4,254,808 |
Synopsys, Inc. * | 13,245 | 7,027,665 |
Teradata Corp. * | 8,411 | 312,048 |
Twilio, Inc., Class A * | 2,535 | 151,796 |
Tyler Technologies, Inc. * | 2,752 | 1,270,186 |
UiPath, Inc., Class A * | 25,591 | 485,461 |
Unity Software, Inc. * | 10,288 | 249,690 |
VeriSign, Inc. * | 453 | 76,774 |
Workday, Inc., Class A * | 17,488 | 4,279,838 |
Zscaler, Inc. * | 7,681 | 1,328,352 |
419,696,677 | ||
Technology Hardware & Equipment 10.7% | ||
Amphenol Corp., Class A | 25,734 | 3,107,895 |
Apple, Inc. | 1,270,055 | 216,328,468 |
Arista Networks, Inc. * | 21,870 | 5,610,967 |
CDW Corp. | 11,146 | 2,695,772 |
HP, Inc. | 15,678 | 440,395 |
Jabil, Inc. | 6,842 | 802,977 |
Keysight Technologies, Inc. * | 3,966 | 586,730 |
Motorola Solutions, Inc. | 13,261 | 4,497,468 |
NetApp, Inc. | 7,163 | 732,130 |
Pure Storage, Inc., Class A * | 20,034 | 1,009,714 |
Ubiquiti, Inc. | 331 | 35,609 |
Vontier Corp. | 4,574 | 185,842 |
Zebra Technologies Corp., Class A * | 785 | 246,930 |
236,280,897 | ||
Telecommunication Services 0.0% | ||
Iridium Communications, Inc. | 10,141 | 312,241 |
Transportation 1.2% | ||
American Airlines Group, Inc. * | 21,273 | 287,398 |
Avis Budget Group, Inc. | 583 | 55,647 |
CH Robinson Worldwide, Inc. | 7,792 | 553,232 |
SECURITY | NUMBER OF SHARES | VALUE ($) |
CSX Corp. | 19,223 | 638,588 |
Delta Air Lines, Inc. | 2,791 | 139,746 |
Expeditors International of Washington, Inc. | 1,681 | 187,112 |
JB Hunt Transport Services, Inc. | 1,409 | 229,061 |
Landstar System, Inc. | 2,449 | 427,130 |
Lyft, Inc., Class A * | 30,328 | 474,330 |
Old Dominion Freight Line, Inc. | 15,996 | 2,906,633 |
Saia, Inc. * | 261 | 103,573 |
Uber Technologies, Inc. * | 171,479 | 11,363,913 |
U-Haul Holding Co. * | 474 | 29,971 |
U-Haul Holding Co. - Non Voting | 2,998 | 183,838 |
Union Pacific Corp. | 22,752 | 5,395,864 |
United Parcel Service, Inc., Class B | 17,442 | 2,572,346 |
25,548,382 | ||
Utilities 0.1% | ||
AES Corp. | 35,382 | 633,338 |
Vistra Corp. | 8,999 | 682,484 |
1,315,822 | ||
Total Common Stocks (Cost $1,562,313,471) | 2,191,240,155 | |
INVESTMENT COMPANIES 0.1% OF NET ASSETS | ||
Equity Funds 0.1% | ||
iShares Russell 1000 Growth ETF | 9,300 | 3,002,412 |
Total Investment Companies (Cost $2,608,528) | 3,002,412 | |
SHORT-TERM INVESTMENTS 0.4% OF NET ASSETS | ||
Money Market Funds 0.4% | ||
State Street Institutional U.S. Government Money Market Fund, Premier Class 5.25% (b) | 8,889,012 | 8,889,012 |
State Street Institutional U.S. Government Money Market Fund, Premier Class 5.25% (b)(c) | 48,480 | 48,480 |
8,937,492 | ||
Total Short-Term Investments (Cost $8,937,492) | 8,937,492 | |
Total Investments in Securities (Cost $1,573,859,491) | 2,203,180,059 | |
NUMBER OF CONTRACTS | NOTIONAL AMOUNT ($) | CURRENT VALUE/ UNREALIZED APPRECIATION ($) | |
FUTURES CONTRACTS | |||
Long | |||
S&P 500 Index, e-mini, expires 06/21/24 | 28 | 7,093,800 | 42,835 |
* | Non-income producing security. |
(a) | All or a portion of this security is on loan. Securities on loan were valued at $43,581. |
(b) | The rate shown is the annualized 7-day yield. |
(c) | Security purchased with cash collateral received for securities on loan. |
ADR — | American Depositary Receipt |
ETF — | Exchange-Traded Fund |
DESCRIPTION | QUOTED PRICES IN ACTIVE MARKETS FOR IDENTICAL ASSETS (LEVEL 1) | OTHER SIGNIFICANT OBSERVABLE INPUTS (LEVEL 2) | SIGNIFICANT UNOBSERVABLE INPUTS (LEVEL 3) | TOTAL |
Assets | ||||
Common Stocks1 | $2,191,240,155 | $— | $— | $2,191,240,155 |
Investment Companies1 | 3,002,412 | — | — | 3,002,412 |
Short-Term Investments1 | 8,937,492 | — | — | 8,937,492 |
Futures Contracts2 | 42,835 | — | — | 42,835 |
Total | $2,203,222,894 | $— | $— | $2,203,222,894 |
1 | As categorized in the Portfolio Holdings. |
2 | Futures contracts are reported at cumulative unrealized appreciation or depreciation. |
Assets | ||
Investments in securities, at value - unaffiliated issuers (cost $1,573,859,491) including securities on loan of $43,581 | $2,203,180,059 | |
Deposit with broker for futures contracts | 306,800 | |
Receivables: | ||
Fund shares sold | 5,298,526 | |
Dividends | 765,209 | |
Investments sold | 229,894 | |
Income from securities on loan | + | 333 |
Total assets | 2,209,780,821 | |
Liabilities | ||
Collateral held for securities on loan | 48,480 | |
Payables: | ||
Investments bought | 4,243,446 | |
Fund shares redeemed | 1,993,502 | |
Variation margin on futures contracts | 90,133 | |
Investment adviser fees | + | 63,612 |
Total liabilities | 6,439,173 | |
Net assets | $2,203,341,648 | |
Net Assets by Source | ||
Capital received from investors | $1,644,573,382 | |
Total distributable earnings | + | 558,768,266 |
Net assets | $2,203,341,648 | |
Net Asset Value (NAV) | ||||
Net Assets | ÷ | Shares Outstanding | = | NAV |
$2,203,341,648 | 23,051,681 | $95.58 | ||
For the period November 1, 2023 through April 30, 2024; unaudited | ||
Investment Income | ||
Dividends received from securities - unaffiliated issuers (net of foreign withholding tax of $1,134) | $7,723,280 | |
Other interest | 13,854 | |
Securities on loan, net | + | 2,409 |
Total investment income | 7,739,543 | |
Expenses | ||
Investment adviser fees | 327,759 | |
Total expenses | – | 327,759 |
Net investment income | 7,411,784 | |
REALIZED AND UNREALIZED GAINS (LOSSES) | ||
Net realized gains on sales of securities - unaffiliated issuers | 757,599 | |
Net realized gains on futures contracts | + | 1,291,058 |
Net realized gains | 2,048,657 | |
Net change in unrealized appreciation (depreciation) on securities - unaffiliated issuers | 325,858,360 | |
Net change in unrealized appreciation (depreciation) on futures contracts | + | 119,989 |
Net change in unrealized appreciation (depreciation) | + | 325,978,349 |
Net realized and unrealized gains | 328,027,006 | |
Increase in net assets resulting from operations | $335,438,790 | |
OPERATIONS | |||
11/1/23-4/30/24 | 11/1/22-10/31/23 | ||
Net investment income | $7,411,784 | $10,256,291 | |
Net realized gains (losses) | 2,048,657 | (9,170,887 ) | |
Net change in unrealized appreciation (depreciation) | + | 325,978,349 | 176,000,176 |
Increase in net assets resulting from operations | $335,438,790 | $177,085,580 | |
DISTRIBUTIONS TO SHAREHOLDERS | |||
Total distributions | ($11,280,497 ) | ($8,433,385 ) | |
TRANSACTIONS IN FUND SHARES | |||||
11/1/23-4/30/24 | 11/1/22-10/31/23 | ||||
SHARES | VALUE | SHARES | VALUE | ||
Shares sold | 8,060,372 | $747,245,105 | 8,578,433 | $642,610,935 | |
Shares reinvested | 109,605 | 9,527,758 | 108,233 | 7,134,711 | |
Shares redeemed | + | (2,479,694 ) | (229,642,541 ) | (5,382,041 ) | (395,332,838 ) |
Net transactions in fund shares | 5,690,283 | $527,130,322 | 3,304,625 | $254,412,808 | |
SHARES OUTSTANDING AND NET ASSETS | |||||
11/1/23-4/30/24 | 11/1/22-10/31/23 | ||||
SHARES | NET ASSETS | SHARES | NET ASSETS | ||
Beginning of period | 17,361,398 | $1,352,053,033 | 14,056,773 | $928,988,030 | |
Total increase | + | 5,690,283 | 851,288,615 | 3,304,625 | 423,065,003 |
End of period | 23,051,681 | $2,203,341,648 | 17,361,398 | $1,352,053,033 | |
11/1/23– 4/30/24* | 11/1/22– 10/31/23 | 11/1/21– 10/31/22 | 11/1/20– 10/31/21 | 11/1/19– 10/31/20 | 11/1/18– 10/31/19 | |
Per-Share Data | ||||||
Net asset value at beginning of period | $46.50 | $47.51 | $53.65 | $38.09 | $43.06 | $39.51 |
Income (loss) from investment operations: | ||||||
Net investment income (loss)1 | 0.61 | 1.12 | 1.01 | 0.97 | 1.00 | 1.13 |
Net realized and unrealized gains (losses) | 7.83 | (1.04 ) | (4.60 ) | 15.47 | (4.07 ) | 3.10 |
Total from investment operations | 8.44 | 0.08 | (3.59 ) | 16.44 | (3.07 ) | 4.23 |
Less distributions: | ||||||
Distributions from net investment income | (1.18 ) | (1.03 ) | (0.91 ) | (0.88 ) | (1.06 ) | (0.62 ) |
Distributions from net realized gains | (0.14 ) | (0.06 ) | (1.64 ) | — | (0.84 ) | (0.06 ) |
Total distributions | (1.32 ) | (1.09 ) | (2.55 ) | (0.88 ) | (1.90 ) | (0.68 ) |
Net asset value at end of period | $53.62 | $46.50 | $47.51 | $53.65 | $38.09 | $43.06 |
Total return | 18.40 %2 | 0.11 % | (7.04 %) | 43.70 % | (7.69 %) | 11.08 % |
Ratios/Supplemental Data | ||||||
Ratios to average net assets: | ||||||
Total expenses | 0.035 %3 | 0.035 % | 0.035 %4 | 0.035 % | 0.035 % | 0.035 %5 |
Net investment income (loss) | 2.36 %3 | 2.31 % | 2.05 % | 1.97 % | 2.57 % | 2.79 % |
Portfolio turnover rate | 8 %2 | 42 %6 | 15 %6 | 20 % | 50 % | 22 % |
Net assets, end of period (x 1,000) | $697,666 | $592,653 | $647,796 | $575,972 | $331,322 | $212,213 |
* | Unaudited. |
1 | Calculated based on the average shares outstanding during the period. |
2 | Not annualized. |
3 | Annualized. |
4 | Ratio includes less than 0.0005% of non-routine proxy expenses. |
5 | Effective December 20, 2018, the annual operating expense ratio was reduced to 0.035%. The ratio presented for period ended October 31, 2019, is a blended ratio. |
6 | Portfolio turnover rate excludes in-kind transactions. |
SECURITY | NUMBER OF SHARES | VALUE ($) |
COMMON STOCKS 99.4% OF NET ASSETS | ||
Automobiles & Components 0.8% | ||
Aptiv PLC * | 8,982 | 637,722 |
BorgWarner, Inc. | 7,784 | 255,082 |
Ford Motor Co. | 130,186 | 1,581,760 |
General Motors Co. | 38,209 | 1,701,447 |
Gentex Corp. | 7,720 | 264,796 |
Harley-Davidson, Inc. | 4,236 | 145,676 |
Lear Corp. | 1,933 | 243,307 |
Lucid Group, Inc. *(a) | 24,342 | 62,072 |
Phinia, Inc. | 1,533 | 59,787 |
QuantumScape Corp., Class A * | 11,470 | 62,167 |
Rivian Automotive, Inc., Class A * | 22,453 | 199,832 |
Thor Industries, Inc. | 1,701 | 169,113 |
5,382,761 | ||
Banks 7.4% | ||
Bank of America Corp. | 228,679 | 8,463,410 |
Bank OZK | 3,520 | 157,168 |
BOK Financial Corp. | 926 | 82,164 |
Citigroup, Inc. | 63,461 | 3,892,063 |
Citizens Financial Group, Inc. | 15,451 | 527,034 |
Columbia Banking System, Inc. | 6,929 | 130,334 |
Comerica, Inc. | 4,366 | 219,042 |
Commerce Bancshares, Inc. | 3,992 | 218,283 |
Cullen/Frost Bankers, Inc. | 1,968 | 205,341 |
East West Bancorp, Inc. | 4,639 | 345,559 |
Fifth Third Bancorp | 22,501 | 820,386 |
First Citizens BancShares, Inc., Class A | 321 | 541,450 |
First Hawaiian, Inc. | 4,221 | 89,021 |
First Horizon Corp. | 18,351 | 273,797 |
FNB Corp. | 11,726 | 156,425 |
Huntington Bancshares, Inc. | 47,747 | 643,152 |
JPMorgan Chase & Co. | 95,794 | 18,367,541 |
KeyCorp | 30,979 | 448,886 |
M&T Bank Corp. | 5,485 | 791,979 |
New York Community Bancorp, Inc. | 23,715 | 62,845 |
NU Holdings Ltd., Class A * | 24,252 | 263,377 |
Pinnacle Financial Partners, Inc. | 2,509 | 192,440 |
PNC Financial Services Group, Inc. | 13,213 | 2,025,024 |
Popular, Inc. | 2,351 | 199,811 |
Prosperity Bancshares, Inc. | 2,914 | 180,581 |
Regions Financial Corp. | 30,713 | 591,839 |
Synovus Financial Corp. | 4,806 | 172,007 |
TFS Financial Corp. | 1,685 | 20,237 |
Truist Financial Corp. | 44,002 | 1,652,275 |
U.S. Bancorp | 51,682 | 2,099,840 |
Webster Financial Corp. | 5,700 | 249,831 |
Wells Fargo & Co. | 119,506 | 7,089,096 |
Western Alliance Bancorp | 3,605 | 204,872 |
Wintrust Financial Corp. | 2,026 | 195,793 |
Zions Bancorp NA | 4,863 | 198,313 |
51,771,216 | ||
SECURITY | NUMBER OF SHARES | VALUE ($) |
Capital Goods 10.9% | ||
3M Co. | 18,244 | 1,760,728 |
A O Smith Corp. | 3,574 | 296,070 |
Acuity Brands, Inc. | 1,018 | 252,769 |
AECOM | 4,481 | 413,865 |
AGCO Corp. | 2,083 | 237,858 |
Air Lease Corp., Class A | 3,455 | 173,579 |
Allegion PLC | 233 | 28,323 |
Allison Transmission Holdings, Inc. | 2,677 | 196,893 |
AMETEK, Inc. | 7,631 | 1,332,830 |
Armstrong World Industries, Inc. | 1,025 | 117,752 |
AZEK Co., Inc., Class A * | 4,772 | 217,794 |
Boeing Co. * | 16,215 | 2,721,526 |
Builders FirstSource, Inc. * | 4,021 | 735,119 |
BWX Technologies, Inc. | 2,501 | 239,521 |
Carlisle Cos., Inc. | 1,607 | 623,918 |
Carrier Global Corp. | 27,635 | 1,699,276 |
Caterpillar, Inc. | 4,233 | 1,416,235 |
CNH Industrial NV * | 32,442 | 369,839 |
Core & Main, Inc., Class A * | 5,766 | 325,606 |
Crane Co. | 1,595 | 223,316 |
Cummins, Inc. | 4,519 | 1,276,572 |
Curtiss-Wright Corp. | 1,266 | 320,830 |
Deere & Co. | 557 | 218,015 |
Donaldson Co., Inc. | 2,362 | 170,536 |
Dover Corp. | 4,624 | 829,083 |
Eaton Corp. PLC | 13,214 | 4,205,488 |
EMCOR Group, Inc. | 1,002 | 357,884 |
Emerson Electric Co. | 18,936 | 2,040,922 |
Esab Corp. | 1,879 | 198,949 |
Fastenal Co. | 4,736 | 321,764 |
Ferguson PLC | 6,409 | 1,345,249 |
Flowserve Corp. | 4,343 | 204,816 |
Fortive Corp. | 11,713 | 881,638 |
Fortune Brands Innovations, Inc. | 4,197 | 306,801 |
Gates Industrial Corp. PLC * | 5,477 | 96,505 |
GE Vernova, Inc. * | 9,002 | 1,383,697 |
Generac Holdings, Inc. * | 1,985 | 269,881 |
General Dynamics Corp. | 8,121 | 2,331,458 |
General Electric Co. | 35,977 | 5,821,798 |
Graco, Inc. | 3,263 | 261,693 |
Hayward Holdings, Inc. * | 4,349 | 59,059 |
HEICO Corp. | 361 | 74,871 |
Hexcel Corp. | 2,816 | 180,815 |
Honeywell International, Inc. | 19,244 | 3,708,896 |
Howmet Aerospace, Inc. | 12,570 | 839,048 |
Hubbell, Inc., Class B | 964 | 357,181 |
Huntington Ingalls Industries, Inc. | 1,294 | 358,347 |
IDEX Corp. | 2,308 | 508,822 |
Illinois Tool Works, Inc. | 1,831 | 446,965 |
Ingersoll Rand, Inc. | 13,433 | 1,253,568 |
ITT, Inc. | 2,741 | 354,521 |
Johnson Controls International PLC | 22,562 | 1,468,109 |
L3Harris Technologies, Inc. | 6,279 | 1,344,020 |
Lennox International, Inc. | 1,062 | 492,152 |
Lincoln Electric Holdings, Inc. | 118 | 25,905 |
Masco Corp. | 7,466 | 511,048 |
SECURITY | NUMBER OF SHARES | VALUE ($) |
MasTec, Inc. * | 2,044 | 181,282 |
MDU Resources Group, Inc. | 6,626 | 163,662 |
Mercury Systems, Inc. * | 1,834 | 51,719 |
Middleby Corp. * | 1,763 | 245,004 |
MSC Industrial Direct Co., Inc., Class A | 1,548 | 141,240 |
Nordson Corp. | 1,889 | 487,721 |
Northrop Grumman Corp. | 4,425 | 2,146,258 |
nVent Electric PLC | 5,434 | 391,628 |
Oshkosh Corp. | 2,148 | 241,156 |
Otis Worldwide Corp. | 12,913 | 1,177,666 |
Owens Corning | 2,944 | 495,210 |
PACCAR, Inc. | 17,006 | 1,804,507 |
Parker-Hannifin Corp. | 4,239 | 2,309,874 |
Pentair PLC | 5,458 | 431,673 |
Plug Power, Inc. *(a) | 17,544 | 40,527 |
Quanta Services, Inc. | 3,511 | 907,804 |
RBC Bearings, Inc. * | 938 | 229,388 |
Regal Rexnord Corp. | 2,199 | 354,853 |
RTX Corp. | 47,722 | 4,844,737 |
Sensata Technologies Holding PLC | 4,981 | 190,822 |
SiteOne Landscape Supply, Inc. * | 990 | 155,321 |
Snap-on, Inc. | 1,730 | 463,571 |
Spirit AeroSystems Holdings, Inc., Class A * | 3,430 | 109,760 |
Stanley Black & Decker, Inc. | 5,091 | 465,317 |
Sunrun, Inc. * | 6,957 | 71,588 |
Textron, Inc. | 6,504 | 550,173 |
Timken Co. | 2,005 | 178,886 |
Trane Technologies PLC | 5,325 | 1,689,836 |
TransDigm Group, Inc. | 1,460 | 1,822,124 |
United Rentals, Inc. | 1,781 | 1,189,690 |
Valmont Industries, Inc. | 644 | 131,891 |
Vertiv Holdings Co., Class A | 10,549 | 981,057 |
Watsco, Inc. | 841 | 376,533 |
WESCO International, Inc. | 1,470 | 224,543 |
Westinghouse Air Brake Technologies Corp. | 5,913 | 952,466 |
WillScot Mobile Mini Holdings Corp. * | 4,656 | 172,086 |
Woodward, Inc. | 1,990 | 323,096 |
Xylem, Inc. | 6,929 | 905,620 |
75,810,012 | ||
Commercial & Professional Services 1.2% | ||
Automatic Data Processing, Inc. | 1,942 | 469,750 |
Broadridge Financial Solutions, Inc. | 635 | 122,815 |
CACI International, Inc., Class A * | 729 | 293,226 |
Cintas Corp. | 319 | 210,010 |
Clarivate PLC * | 15,448 | 104,428 |
Clean Harbors, Inc. * | 1,671 | 316,571 |
Concentrix Corp. | 1,479 | 80,857 |
Dayforce, Inc. * | 4,510 | 276,779 |
Driven Brands Holdings, Inc. * | 1,939 | 27,786 |
Dun & Bradstreet Holdings, Inc. | 9,178 | 83,520 |
Equifax, Inc. | 1,248 | 274,797 |
FTI Consulting, Inc. * | 895 | 191,378 |
Genpact Ltd. | 4,348 | 133,658 |
Jacobs Solutions, Inc. | 4,175 | 599,238 |
KBR, Inc. | 2,803 | 182,027 |
Leidos Holdings, Inc. | 4,516 | 633,233 |
ManpowerGroup, Inc. | 1,591 | 120,041 |
MSA Safety, Inc. | 1,007 | 181,663 |
Paycor HCM, Inc. * | 1,135 | 19,715 |
RB Global, Inc. | 1,436 | 102,789 |
Republic Services, Inc., Class A | 6,855 | 1,314,103 |
Robert Half, Inc. | 3,400 | 235,076 |
Science Applications International Corp. | 1,719 | 221,235 |
SS&C Technologies Holdings, Inc. | 7,229 | 447,403 |
Stericycle, Inc. * | 3,020 | 135,085 |
Tetra Tech, Inc. | 1,430 | 278,450 |
SECURITY | NUMBER OF SHARES | VALUE ($) |
TransUnion | 6,421 | 468,733 |
Veralto Corp. | 7,289 | 682,833 |
Vestis Corp. | 3,869 | 71,267 |
Waste Management, Inc. | 1,363 | 283,531 |
8,561,997 | ||
Consumer Discretionary Distribution & Retail 1.1% | ||
Advance Auto Parts, Inc. | 1,967 | 143,552 |
AutoNation, Inc. * | 942 | 151,803 |
AutoZone, Inc. * | 94 | 277,902 |
Bath & Body Works, Inc. | 7,501 | 340,695 |
Best Buy Co., Inc. | 5,505 | 405,388 |
CarMax, Inc. * | 4,927 | 334,888 |
Dick's Sporting Goods, Inc. | 1,730 | 347,626 |
eBay, Inc. | 16,132 | 831,443 |
Etsy, Inc. * | 1,735 | 119,142 |
GameStop Corp., Class A *(a) | 9,014 | 99,965 |
Gap, Inc. | 6,395 | 131,225 |
Genuine Parts Co. | 4,652 | 731,341 |
Kohl's Corp. | 3,606 | 86,328 |
Lithia Motors, Inc., Class A | 899 | 228,688 |
LKQ Corp. | 8,799 | 379,501 |
Lowe's Cos., Inc. | 5,122 | 1,167,765 |
Macy's, Inc. | 8,917 | 164,340 |
Murphy USA, Inc. | 34 | 14,070 |
Nordstrom, Inc. | 3,769 | 71,649 |
Ollie's Bargain Outlet Holdings, Inc. * | 1,407 | 102,908 |
O'Reilly Automotive, Inc. * | 298 | 301,951 |
Penske Automotive Group, Inc. | 649 | 99,239 |
Petco Health & Wellness Co., Inc., Class A * | 2,724 | 4,086 |
RH * | 435 | 107,467 |
Ross Stores, Inc. | 731 | 94,701 |
Valvoline, Inc. * | 3,156 | 134,193 |
Victoria's Secret & Co. * | 1,498 | 26,395 |
Wayfair, Inc., Class A * | 1,791 | 89,819 |
Williams-Sonoma, Inc. | 1,839 | 527,388 |
7,515,458 | ||
Consumer Durables & Apparel 1.5% | ||
Birkenstock Holding PLC * | 591 | 26,459 |
Brunswick Corp. | 2,093 | 168,779 |
Capri Holdings Ltd. * | 3,742 | 132,766 |
Carter's, Inc. | 1,198 | 81,955 |
Columbia Sportswear Co. | 1,151 | 91,654 |
DR Horton, Inc. | 10,041 | 1,430,742 |
Garmin Ltd. | 5,095 | 736,075 |
Hasbro, Inc. | 4,336 | 265,797 |
Leggett & Platt, Inc. | 4,462 | 80,628 |
Lennar Corp., Class A | 8,427 | 1,277,702 |
Mattel, Inc. * | 11,680 | 213,978 |
Mohawk Industries, Inc. * | 1,746 | 201,349 |
Newell Brands, Inc. | 12,478 | 99,075 |
NIKE, Inc., Class B | 18,206 | 1,679,685 |
NVR, Inc. * | 88 | 654,619 |
Polaris, Inc. | 1,616 | 137,618 |
PulteGroup, Inc. | 7,102 | 791,305 |
PVH Corp. | 1,962 | 213,466 |
Ralph Lauren Corp., Class A | 1,308 | 214,041 |
Skechers USA, Inc., Class A * | 4,096 | 270,541 |
Tapestry, Inc. | 7,122 | 284,310 |
Tempur Sealy International, Inc. | 4,397 | 220,114 |
Toll Brothers, Inc. | 3,458 | 411,882 |
TopBuild Corp. * | 978 | 395,767 |
Under Armour, Inc., Class A * | 12,746 | 85,781 |
VF Corp. | 11,508 | 143,390 |
SECURITY | NUMBER OF SHARES | VALUE ($) |
Whirlpool Corp. | 1,788 | 169,610 |
10,479,088 | ||
Consumer Services 1.4% | ||
ADT, Inc. | 8,767 | 56,986 |
Aramark | 8,583 | 270,450 |
Boyd Gaming Corp. | 2,360 | 126,284 |
Bright Horizons Family Solutions, Inc. * | 1,654 | 171,536 |
Caesars Entertainment, Inc. * | 4,059 | 145,393 |
Carnival Corp. * | 33,037 | 489,608 |
Cava Group, Inc. * | 351 | 25,251 |
Darden Restaurants, Inc. | 2,103 | 322,621 |
DoorDash, Inc., Class A * | 2,221 | 287,086 |
Expedia Group, Inc. * | 1,177 | 158,460 |
Grand Canyon Education, Inc. * | 713 | 92,704 |
H&R Block, Inc. | 1,685 | 79,583 |
Hilton Worldwide Holdings, Inc. | 4,474 | 882,631 |
Hyatt Hotels Corp., Class A | 1,432 | 213,067 |
Las Vegas Sands Corp. | 803 | 35,621 |
Marriott Vacations Worldwide Corp. | 1,148 | 110,334 |
McDonald's Corp. | 14,207 | 3,879,079 |
MGM Resorts International * | 9,086 | 358,352 |
Mister Car Wash, Inc. * | 2,427 | 16,237 |
Norwegian Cruise Line Holdings Ltd. * | 10,695 | 202,349 |
Penn Entertainment, Inc. * | 4,900 | 81,046 |
Planet Fitness, Inc., Class A * | 1,452 | 86,888 |
Royal Caribbean Cruises Ltd. * | 5,425 | 757,493 |
Service Corp. International | 3,035 | 217,640 |
Travel & Leisure Co. | 1,243 | 54,120 |
Vail Resorts, Inc. | 1,135 | 214,935 |
Wyndham Hotels & Resorts, Inc. | 2,527 | 185,760 |
Wynn Resorts Ltd. | 3,236 | 296,579 |
Yum! Brands, Inc. | 1,142 | 161,308 |
9,979,401 | ||
Consumer Staples Distribution & Retail 1.8% | ||
Albertsons Cos., Inc., Class A | 12,577 | 256,571 |
BJ's Wholesale Club Holdings, Inc. * | 2,891 | 215,900 |
Casey's General Stores, Inc. | 1,052 | 336,198 |
Dollar Tree, Inc. * | 6,812 | 805,519 |
Grocery Outlet Holding Corp. * | 3,106 | 80,663 |
Kroger Co. | 21,660 | 1,199,531 |
Maplebear, Inc. * | 223 | 7,611 |
Performance Food Group Co. * | 2,700 | 183,276 |
U.S. Foods Holding Corp. * | 7,503 | 377,026 |
Walgreens Boots Alliance, Inc. | 23,842 | 422,718 |
Walmart, Inc. | 142,102 | 8,433,754 |
12,318,767 | ||
Energy 8.3% | ||
Antero Midstream Corp. | 7,565 | 104,700 |
Antero Resources Corp. * | 9,352 | 318,062 |
APA Corp. | 3,226 | 101,425 |
Baker Hughes Co., Class A | 33,064 | 1,078,548 |
Chesapeake Energy Corp. | 4,101 | 368,598 |
Chevron Corp. | 57,101 | 9,208,678 |
ConocoPhillips | 39,759 | 4,994,526 |
Coterra Energy, Inc. | 24,759 | 677,406 |
Devon Energy Corp. | 21,285 | 1,089,366 |
Diamondback Energy, Inc. | 5,923 | 1,191,293 |
DT Midstream, Inc. | 3,194 | 198,667 |
EOG Resources, Inc. | 19,501 | 2,576,667 |
EQT Corp. | 11,935 | 478,474 |
Exxon Mobil Corp. | 132,724 | 15,697,268 |
Halliburton Co. | 23,776 | 890,887 |
SECURITY | NUMBER OF SHARES | VALUE ($) |
Hess Corp. | 4,083 | 643,032 |
HF Sinclair Corp. | 5,265 | 285,626 |
Kinder Morgan, Inc. | 65,121 | 1,190,412 |
Marathon Oil Corp. | 19,392 | 520,675 |
Marathon Petroleum Corp. | 12,203 | 2,217,529 |
NOV, Inc. | 13,011 | 240,573 |
Occidental Petroleum Corp. | 22,796 | 1,507,728 |
ONEOK, Inc. | 18,235 | 1,442,753 |
Ovintiv, Inc. | 4,732 | 242,846 |
Phillips 66 | 14,591 | 2,089,577 |
Pioneer Natural Resources Co. | 7,722 | 2,079,689 |
Range Resources Corp. | 7,744 | 278,087 |
Schlumberger NV | 47,275 | 2,244,617 |
Southwestern Energy Co. * | 36,260 | 271,587 |
TechnipFMC PLC | 14,328 | 367,083 |
Valero Energy Corp. | 11,261 | 1,800,296 |
Williams Cos., Inc. | 40,397 | 1,549,629 |
57,946,304 | ||
Equity Real Estate Investment Trusts (REITs) 4.1% | ||
Agree Realty Corp. | 3,298 | 188,712 |
Alexandria Real Estate Equities, Inc. | 5,754 | 666,716 |
American Homes 4 Rent, Class A | 11,033 | 394,981 |
Americold Realty Trust, Inc. | 9,425 | 207,067 |
Apartment Income REIT Corp. | 4,842 | 185,836 |
AvalonBay Communities, Inc. | 4,696 | 890,221 |
Boston Properties, Inc. | 5,196 | 321,580 |
Brixmor Property Group, Inc. | 9,877 | 218,282 |
Camden Property Trust | 3,441 | 342,999 |
Cousins Properties, Inc. | 5,006 | 114,838 |
Crown Castle, Inc. | 12,842 | 1,204,323 |
CubeSmart | 7,420 | 300,065 |
Digital Realty Trust, Inc. | 10,020 | 1,390,576 |
EastGroup Properties, Inc. | 1,522 | 236,458 |
EPR Properties | 2,455 | 99,648 |
Equinix, Inc. | 1,540 | 1,095,109 |
Equity LifeStyle Properties, Inc. | 3,949 | 238,085 |
Equity Residential | 12,370 | 796,628 |
Essex Property Trust, Inc. | 2,121 | 522,296 |
Extra Space Storage, Inc. | 6,926 | 930,023 |
Federal Realty Investment Trust | 2,695 | 280,738 |
First Industrial Realty Trust, Inc. | 4,353 | 197,713 |
Gaming & Leisure Properties, Inc. | 8,493 | 362,906 |
Healthcare Realty Trust, Inc., Class A | 12,668 | 180,266 |
Healthpeak Properties, Inc. | 23,407 | 435,604 |
Highwoods Properties, Inc. | 3,384 | 88,661 |
Host Hotels & Resorts, Inc. | 23,127 | 436,407 |
Invitation Homes, Inc. | 20,272 | 693,302 |
Iron Mountain, Inc. | 4,858 | 376,592 |
Kilroy Realty Corp. | 3,880 | 131,144 |
Kimco Realty Corp. | 21,842 | 406,916 |
Lamar Advertising Co., Class A | 659 | 76,345 |
Medical Properties Trust, Inc. (a) | 19,986 | 91,936 |
Mid-America Apartment Communities, Inc. | 3,859 | 501,670 |
National Storage Affiliates Trust | 2,510 | 87,950 |
NET Lease Office Properties | 473 | 10,813 |
NNN REIT, Inc. | 5,995 | 242,977 |
Omega Healthcare Investors, Inc. | 8,097 | 246,230 |
Park Hotels & Resorts, Inc. | 6,842 | 110,361 |
Prologis, Inc. | 30,614 | 3,124,159 |
Public Storage | 2,181 | 565,860 |
Rayonier, Inc. | 4,819 | 142,932 |
Realty Income Corp. | 27,588 | 1,477,062 |
Regency Centers Corp. | 6,013 | 356,090 |
Rexford Industrial Realty, Inc. | 7,012 | 300,184 |
SBA Communications Corp., Class A | 3,204 | 596,329 |
Simon Property Group, Inc. | 8,425 | 1,183,965 |
SECURITY | NUMBER OF SHARES | VALUE ($) |
STAG Industrial, Inc. | 5,996 | 206,202 |
Sun Communities, Inc. | 3,186 | 354,666 |
UDR, Inc. | 10,299 | 392,186 |
Ventas, Inc. | 13,266 | 587,418 |
VICI Properties, Inc., Class A | 34,256 | 978,009 |
Vornado Realty Trust | 5,840 | 152,015 |
Welltower, Inc. | 18,381 | 1,751,342 |
Weyerhaeuser Co. | 24,274 | 732,347 |
WP Carey, Inc. | 7,167 | 393,038 |
28,596,778 | ||
Financial Services 11.0% | ||
Affiliated Managers Group, Inc. | 1,099 | 171,554 |
Affirm Holdings, Inc. * | 7,515 | 239,578 |
AGNC Investment Corp. | 23,047 | 210,880 |
Ally Financial, Inc. | 8,979 | 344,345 |
American Express Co. | 12,936 | 3,027,412 |
Annaly Capital Management, Inc. | 16,643 | 311,890 |
Bank of New York Mellon Corp. | 25,222 | 1,424,791 |
Berkshire Hathaway, Inc., Class B * | 60,769 | 24,108,885 |
BlackRock, Inc. | 4,933 | 3,722,639 |
Block, Inc. * | 11,481 | 838,113 |
Blue Owl Capital, Inc., Class A | 12,830 | 242,359 |
Capital One Financial Corp. | 12,575 | 1,803,632 |
Carlyle Group, Inc. | 6,987 | 313,018 |
Cboe Global Markets, Inc. | 3,490 | 632,213 |
Charles Schwab Corp. (b) | 49,053 | 3,627,469 |
CME Group, Inc. | 11,914 | 2,497,651 |
Coinbase Global, Inc., Class A * | 5,684 | 1,159,138 |
Corebridge Financial, Inc. (a) | 7,511 | 199,492 |
Corpay, Inc. * | 168 | 50,760 |
Credit Acceptance Corp. * | 205 | 105,313 |
Discover Financial Services | 8,262 | 1,047,043 |
Euronet Worldwide, Inc. * | 710 | 72,903 |
Evercore, Inc., Class A | 1,166 | 211,629 |
Fidelity National Information Services, Inc. | 19,636 | 1,333,677 |
Fiserv, Inc. * | 14,402 | 2,198,753 |
Franklin Resources, Inc. | 9,928 | 226,756 |
Global Payments, Inc. | 8,539 | 1,048,333 |
Goldman Sachs Group, Inc. | 10,467 | 4,466,374 |
Houlihan Lokey, Inc., Class A | 1,566 | 199,649 |
Interactive Brokers Group, Inc., Class A | 3,429 | 394,746 |
Intercontinental Exchange, Inc. | 18,783 | 2,418,499 |
Invesco Ltd. | 11,931 | 169,062 |
Jack Henry & Associates, Inc. | 1,638 | 266,486 |
Janus Henderson Group PLC | 4,416 | 137,868 |
Jefferies Financial Group, Inc. | 5,975 | 257,283 |
KKR & Co., Inc. | 16,593 | 1,544,311 |
Lazard, Inc. | 3,642 | 140,217 |
MGIC Investment Corp. | 9,086 | 184,264 |
Moody's Corp. | 468 | 173,314 |
Morgan Stanley | 38,814 | 3,525,864 |
MSCI, Inc., Class A | 1,275 | 593,882 |
Nasdaq, Inc. | 12,217 | 731,187 |
NCR Atleos Corp. * | 2,113 | 42,112 |
Northern Trust Corp. | 6,718 | 553,496 |
OneMain Holdings, Inc. | 3,751 | 195,465 |
PayPal Holdings, Inc. * | 3,340 | 226,853 |
Raymond James Financial, Inc. | 6,271 | 765,062 |
Rithm Capital Corp. | 15,854 | 176,296 |
Robinhood Markets, Inc., Class A * | 20,917 | 344,921 |
Rocket Cos., Inc., Class A * | 2,497 | 30,663 |
S&P Global, Inc. | 9,640 | 4,008,601 |
SEI Investments Co. | 3,332 | 219,745 |
SLM Corp. | 4,353 | 92,240 |
SoFi Technologies, Inc. * | 31,583 | 214,133 |
Starwood Property Trust, Inc. | 9,803 | 185,963 |
SECURITY | NUMBER OF SHARES | VALUE ($) |
State Street Corp. | 9,997 | 724,683 |
Stifel Financial Corp. | 3,230 | 258,142 |
Synchrony Financial | 13,453 | 591,663 |
T Rowe Price Group, Inc. | 7,310 | 800,957 |
TPG, Inc. | 1,697 | 73,141 |
Tradeweb Markets, Inc., Class A | 2,486 | 252,851 |
UWM Holdings Corp. | 1,931 | 12,165 |
Virtu Financial, Inc., Class A | 2,861 | 62,084 |
Voya Financial, Inc. | 3,211 | 218,862 |
Western Union Co. | 10,174 | 136,739 |
WEX, Inc. * | 775 | 163,726 |
XP, Inc., Class A | 9,878 | 202,203 |
76,925,998 | ||
Food, Beverage & Tobacco 4.1% | ||
Altria Group, Inc. | 59,271 | 2,596,663 |
Archer-Daniels-Midland Co. | 17,736 | 1,040,394 |
Boston Beer Co., Inc., Class A * | 23 | 6,403 |
Brown-Forman Corp., Class B | 1,570 | 75,125 |
Bunge Global SA | 4,807 | 489,160 |
Campbell Soup Co. | 6,320 | 288,887 |
Coca-Cola Co. | 65,141 | 4,023,760 |
Conagra Brands, Inc. | 15,819 | 486,909 |
Constellation Brands, Inc., Class A | 4,812 | 1,219,650 |
Darling Ingredients, Inc. * | 5,248 | 222,358 |
Flowers Foods, Inc. | 6,211 | 154,902 |
Freshpet, Inc. * | 1,057 | 112,116 |
General Mills, Inc. | 18,851 | 1,328,241 |
Hershey Co. | 1,284 | 248,993 |
Hormel Foods Corp. | 9,581 | 340,700 |
Ingredion, Inc. | 2,147 | 246,025 |
J M Smucker Co. | 3,408 | 391,409 |
Kellanova | 8,635 | 499,621 |
Keurig Dr Pepper, Inc. | 31,576 | 1,064,111 |
Kraft Heinz Co. | 26,610 | 1,027,412 |
Lamb Weston Holdings, Inc. | 255 | 21,252 |
McCormick & Co., Inc. - Non Voting Shares | 8,349 | 635,025 |
Molson Coors Beverage Co., Class B | 5,782 | 331,077 |
Mondelez International, Inc., Class A | 45,126 | 3,246,364 |
PepsiCo, Inc. | 14,127 | 2,485,081 |
Philip Morris International, Inc. | 51,499 | 4,889,315 |
Pilgrim's Pride Corp. * | 1,400 | 50,428 |
Post Holdings, Inc. * | 1,695 | 179,924 |
Seaboard Corp. | 7 | 23,171 |
Tyson Foods, Inc., Class A | 9,227 | 559,618 |
WK Kellogg Co. | 2,133 | 49,784 |
28,333,878 | ||
Health Care Equipment & Services 6.4% | ||
Abbott Laboratories | 53,827 | 5,704,047 |
Acadia Healthcare Co., Inc. * | 2,975 | 219,972 |
agilon health, Inc. * | 970 | 5,335 |
Amedisys, Inc. * | 1,047 | 96,376 |
Baxter International, Inc. | 16,766 | 676,843 |
Becton Dickinson & Co. | 9,610 | 2,254,506 |
Boston Scientific Corp. * | 48,535 | 3,488,210 |
Cardinal Health, Inc. | 3,981 | 410,202 |
Centene Corp. * | 17,713 | 1,294,112 |
Certara, Inc. * | 2,550 | 43,631 |
Chemed Corp. | 137 | 77,816 |
Cigna Group | 8,838 | 3,155,520 |
Cooper Cos., Inc. | 6,457 | 575,060 |
CVS Health Corp. | 42,492 | 2,877,133 |
DENTSPLY SIRONA, Inc. | 7,062 | 211,931 |
Doximity, Inc., Class A * | 2,170 | 52,709 |
Elevance Health, Inc. | 6,820 | 3,604,916 |
SECURITY | NUMBER OF SHARES | VALUE ($) |
Encompass Health Corp. | 3,050 | 254,309 |
Enovis Corp. * | 1,747 | 96,487 |
Envista Holdings Corp. * | 5,440 | 107,059 |
GE HealthCare Technologies, Inc. | 12,799 | 975,796 |
Globus Medical, Inc., Class A * | 2,800 | 139,412 |
HCA Healthcare, Inc. | 5,233 | 1,621,288 |
Henry Schein, Inc. * | 4,329 | 299,913 |
Hologic, Inc. * | 7,696 | 583,126 |
Humana, Inc. | 2,295 | 693,297 |
ICU Medical, Inc. * | 658 | 64,431 |
Integra LifeSciences Holdings Corp. * | 2,227 | 64,962 |
Laboratory Corp. of America Holdings | 2,804 | 564,642 |
McKesson Corp. | 2,735 | 1,469,269 |
Medtronic PLC | 44,077 | 3,536,739 |
Molina Healthcare, Inc. * | 872 | 298,311 |
Premier, Inc., Class A | 3,867 | 80,743 |
Quest Diagnostics, Inc. | 3,722 | 514,306 |
QuidelOrtho Corp. * | 1,804 | 73,152 |
R1 RCM, Inc. * | 4,949 | 60,823 |
Solventum Corp. * | 4,538 | 295,015 |
STERIS PLC | 3,291 | 673,207 |
Stryker Corp. | 8,794 | 2,959,181 |
Tandem Diabetes Care, Inc. * | 1,818 | 66,702 |
Teladoc Health, Inc. * | 5,512 | 70,278 |
Teleflex, Inc. | 1,552 | 323,980 |
Tenet Healthcare Corp. * | 3,342 | 375,273 |
UnitedHealth Group, Inc. | 4,905 | 2,372,549 |
Universal Health Services, Inc., Class B | 1,952 | 332,679 |
Zimmer Biomet Holdings, Inc. | 6,965 | 837,750 |
44,552,998 | ||
Household & Personal Products 2.1% | ||
Church & Dwight Co., Inc. | 832 | 89,764 |
Colgate-Palmolive Co. | 27,231 | 2,503,073 |
Coty, Inc., Class A * | 12,333 | 141,090 |
Estee Lauder Cos., Inc., Class A | 5,225 | 766,560 |
Kenvue, Inc. | 38,028 | 715,687 |
Kimberly-Clark Corp. | 651 | 88,881 |
Olaplex Holdings, Inc. * | 4,415 | 6,137 |
Procter & Gamble Co. | 63,439 | 10,353,245 |
Reynolds Consumer Products, Inc. | 1,824 | 52,221 |
Spectrum Brands Holdings, Inc. | 1,017 | 83,262 |
14,799,920 | ||
Insurance 4.0% | ||
Aflac, Inc. | 19,253 | 1,610,513 |
Allstate Corp. | 8,700 | 1,479,522 |
American Financial Group, Inc. | 2,358 | 301,234 |
American International Group, Inc. | 23,287 | 1,753,744 |
Aon PLC, Class A | 6,576 | 1,854,498 |
Arch Capital Group Ltd. * | 10,178 | 952,050 |
Arthur J Gallagher & Co. | 6,711 | 1,575,005 |
Assurant, Inc. | 1,757 | 306,421 |
Assured Guaranty Ltd. | 1,805 | 138,444 |
Axis Capital Holdings Ltd. | 2,553 | 156,575 |
Brighthouse Financial, Inc. * | 1,869 | 90,179 |
Brown & Brown, Inc. | 4,805 | 391,800 |
Chubb Ltd. | 13,474 | 3,350,175 |
Cincinnati Financial Corp. | 5,104 | 590,482 |
CNA Financial Corp. | 896 | 39,370 |
Everest Group Ltd. | 1,226 | 449,219 |
Fidelity National Financial, Inc. | 8,571 | 424,264 |
First American Financial Corp. | 3,291 | 176,299 |
Globe Life, Inc. | 2,847 | 216,856 |
Hanover Insurance Group, Inc. | 1,168 | 151,630 |
Hartford Financial Services Group, Inc. | 9,779 | 947,487 |
SECURITY | NUMBER OF SHARES | VALUE ($) |
Kemper Corp. | 2,000 | 116,620 |
Lincoln National Corp. | 5,068 | 138,204 |
Loews Corp. | 6,064 | 455,710 |
Markel Group, Inc. * | 437 | 637,321 |
Marsh & McLennan Cos., Inc. | 3,273 | 652,734 |
MetLife, Inc. | 20,682 | 1,470,077 |
Old Republic International Corp. | 8,514 | 254,228 |
Primerica, Inc. | 400 | 84,744 |
Principal Financial Group, Inc. | 7,874 | 623,148 |
Progressive Corp. | 4,862 | 1,012,511 |
Prudential Financial, Inc. | 12,047 | 1,330,953 |
Reinsurance Group of America, Inc. | 2,206 | 412,500 |
RenaissanceRe Holdings Ltd. | 1,254 | 274,940 |
RLI Corp. | 1,030 | 145,591 |
Travelers Cos., Inc. | 7,562 | 1,604,354 |
Unum Group | 6,392 | 324,074 |
W R Berkley Corp. | 6,639 | 511,004 |
White Mountains Insurance Group Ltd. | 82 | 145,807 |
Willis Towers Watson PLC | 3,000 | 753,420 |
27,903,707 | ||
Materials 4.8% | ||
Air Products & Chemicals, Inc. | 7,359 | 1,739,226 |
Albemarle Corp. | 3,893 | 468,367 |
Alcoa Corp. | 5,936 | 208,591 |
Amcor PLC | 47,947 | 428,646 |
AptarGroup, Inc. | 2,166 | 312,727 |
Ardagh Metal Packaging SA | 983 | 3,883 |
Ashland, Inc. | 1,641 | 156,437 |
Avery Dennison Corp. | 1,793 | 389,583 |
Axalta Coating Systems Ltd. * | 6,560 | 206,246 |
Ball Corp. | 10,218 | 710,866 |
Berry Global Group, Inc. | 3,839 | 217,441 |
Celanese Corp., Class A | 3,286 | 504,763 |
CF Industries Holdings, Inc. | 6,396 | 505,092 |
Chemours Co. | 4,953 | 132,493 |
Cleveland-Cliffs, Inc. * | 16,488 | 278,647 |
Corteva, Inc. | 23,411 | 1,267,237 |
Crown Holdings, Inc. | 3,516 | 288,558 |
Dow, Inc. | 23,481 | 1,336,069 |
DuPont de Nemours, Inc. | 14,291 | 1,036,098 |
Eagle Materials, Inc. | 380 | 95,270 |
Eastman Chemical Co. | 3,926 | 370,771 |
Ecolab, Inc. | 1,827 | 413,176 |
Element Solutions, Inc. | 7,447 | 172,249 |
FMC Corp. | 3,535 | 208,600 |
Freeport-McMoRan, Inc. | 47,395 | 2,366,906 |
Ginkgo Bioworks Holdings, Inc. *(a) | 48,994 | 43,659 |
Graphic Packaging Holding Co. | 4,713 | 121,831 |
Huntsman Corp. | 5,437 | 129,727 |
International Flavors & Fragrances, Inc. | 8,467 | 716,732 |
International Paper Co. | 11,119 | 388,498 |
Linde PLC | 14,573 | 6,426,110 |
Louisiana-Pacific Corp. | 2,152 | 157,505 |
LyondellBasell Industries NV, Class A | 8,577 | 857,443 |
Martin Marietta Materials, Inc. | 2,049 | 1,202,906 |
Mosaic Co. | 10,812 | 339,389 |
MP Materials Corp. * | 3,417 | 54,672 |
NewMarket Corp. | 208 | 109,599 |
Newmont Corp. | 38,269 | 1,555,252 |
Nucor Corp. | 8,148 | 1,373,182 |
Olin Corp. | 3,962 | 207,133 |
Packaging Corp. of America | 2,941 | 508,734 |
PPG Industries, Inc. | 5,828 | 751,812 |
Reliance, Inc. | 1,898 | 540,399 |
Royal Gold, Inc. | 2,186 | 262,604 |
RPM International, Inc. | 3,415 | 365,098 |
SECURITY | NUMBER OF SHARES | VALUE ($) |
Sealed Air Corp. | 2,114 | 66,549 |
Sherwin-Williams Co. | 1,316 | 394,287 |
Silgan Holdings, Inc. | 2,650 | 123,649 |
Sonoco Products Co. | 3,259 | 182,667 |
SSR Mining, Inc. | 6,742 | 36,137 |
Steel Dynamics, Inc. | 5,053 | 657,496 |
U.S. Steel Corp. | 7,373 | 269,115 |
Vulcan Materials Co. | 3,426 | 882,640 |
Westlake Corp. | 1,062 | 156,496 |
Westrock Co. | 8,399 | 402,816 |
33,102,079 | ||
Media & Entertainment 2.7% | ||
AMC Entertainment Holdings, Inc., Class A *(a) | 7,921 | 23,209 |
Cable One, Inc. | 170 | 66,955 |
Comcast Corp., Class A | 130,727 | 4,982,006 |
Electronic Arts, Inc. | 8,988 | 1,139,858 |
Fox Corp., Class A | 12,112 | 375,593 |
IAC, Inc. * | 2,452 | 116,617 |
Interpublic Group of Cos., Inc. | 12,771 | 388,749 |
Liberty Broadband Corp., Class C * | 3,466 | 172,364 |
Liberty Media Corp.-Liberty Formula One, Class C * | 7,150 | 500,286 |
Liberty Media Corp.-Liberty Live, Class C * | 2,206 | 82,328 |
Liberty Media Corp.-Liberty SiriusXM, Class C * | 7,602 | 182,904 |
Live Nation Entertainment, Inc. * | 4,012 | 356,707 |
Madison Square Garden Sports Corp. * | 609 | 113,225 |
Match Group, Inc. * | 842 | 25,950 |
New York Times Co., Class A | 5,320 | 228,920 |
News Corp., Class A | 16,577 | 394,533 |
Nexstar Media Group, Inc., Class A | 704 | 112,682 |
Omnicom Group, Inc. | 6,560 | 609,030 |
Paramount Global, Class B | 19,837 | 225,943 |
Roku, Inc. * | 3,648 | 210,344 |
Sirius XM Holdings, Inc. (a) | 21,234 | 62,428 |
Take-Two Interactive Software, Inc. * | 5,466 | 780,599 |
TripAdvisor, Inc. * | 3,624 | 95,420 |
Walt Disney Co. | 60,685 | 6,742,104 |
Warner Bros Discovery, Inc. * | 73,233 | 538,995 |
ZoomInfo Technologies, Inc., Class A * | 4,864 | 77,143 |
18,604,892 | ||
Pharmaceuticals, Biotechnology & Life Sciences 7.6% | ||
Agilent Technologies, Inc. | 1,805 | 247,357 |
Alnylam Pharmaceuticals, Inc. * | 810 | 116,599 |
Amgen, Inc. | 5,673 | 1,554,062 |
Avantor, Inc. * | 22,326 | 540,959 |
Azenta, Inc. * | 1,834 | 96,212 |
Biogen, Inc. * | 4,773 | 1,025,336 |
BioMarin Pharmaceutical, Inc. * | 5,484 | 442,888 |
Bio-Rad Laboratories, Inc., Class A * | 683 | 184,239 |
Bio-Techne Corp. | 290 | 18,331 |
Bristol-Myers Squibb Co. | 67,566 | 2,968,850 |
Catalent, Inc. * | 5,964 | 333,089 |
Charles River Laboratories International, Inc. * | 1,678 | 384,262 |
Danaher Corp. | 21,841 | 5,386,427 |
Elanco Animal Health, Inc. * | 16,184 | 212,981 |
Exact Sciences Corp. * | 3,851 | 228,557 |
Exelixis, Inc. * | 2,637 | 61,864 |
Fortrea Holdings, Inc. * | 2,962 | 108,380 |
Gilead Sciences, Inc. | 41,476 | 2,704,235 |
ICON PLC, ADR * | 2,300 | 685,124 |
Illumina, Inc. * | 3,692 | 454,301 |
SECURITY | NUMBER OF SHARES | VALUE ($) |
Incyte Corp. * | 1,573 | 81,875 |
Ionis Pharmaceuticals, Inc. * | 653 | 26,943 |
IQVIA Holdings, Inc. * | 446 | 103,369 |
Jazz Pharmaceuticals PLC * | 982 | 108,757 |
Johnson & Johnson | 79,977 | 11,563,874 |
Maravai LifeSciences Holdings, Inc., Class A * | 1,492 | 12,234 |
Merck & Co., Inc. | 68,783 | 8,888,139 |
Moderna, Inc. * | 11,039 | 1,217,712 |
Organon & Co. | 8,462 | 157,478 |
Perrigo Co. PLC | 4,478 | 146,251 |
Pfizer, Inc. | 187,508 | 4,803,955 |
QIAGEN NV * | 7,323 | 309,983 |
Regeneron Pharmaceuticals, Inc. * | 3,170 | 2,823,392 |
Repligen Corp. * | 1,018 | 167,156 |
Revvity, Inc. | 4,104 | 420,537 |
Roivant Sciences Ltd. * | 689 | 7,510 |
Royalty Pharma PLC, Class A | 12,359 | 342,344 |
Sotera Health Co. * | 1,191 | 13,339 |
Thermo Fisher Scientific, Inc. | 4,916 | 2,795,828 |
United Therapeutics Corp. * | 1,505 | 352,667 |
Vertex Pharmaceuticals, Inc. * | 728 | 285,966 |
Viatris, Inc. | 39,781 | 460,266 |
52,843,628 | ||
Real Estate Management & Development 0.3% | ||
CBRE Group, Inc., Class A * | 10,064 | 874,461 |
CoStar Group, Inc. * | 7,646 | 699,838 |
Howard Hughes Holdings, Inc. * | 1,136 | 74,022 |
Jones Lang LaSalle, Inc. * | 1,564 | 282,615 |
Zillow Group, Inc., Class C * | 6,888 | 293,222 |
2,224,158 | ||
Semiconductors & Semiconductor Equipment 3.8% | ||
Advanced Micro Devices, Inc. * | 22,926 | 3,631,020 |
Analog Devices, Inc. | 16,526 | 3,315,281 |
Applied Materials, Inc. | 4,298 | 853,798 |
Cirrus Logic, Inc. * | 1,770 | 156,769 |
Entegris, Inc. | 4,697 | 624,325 |
First Solar, Inc. * | 3,521 | 620,752 |
GLOBALFOUNDRIES, Inc. * | 2,585 | 126,355 |
Intel Corp. | 140,034 | 4,266,836 |
Lam Research Corp. | 233 | 208,398 |
Marvell Technology, Inc. | 28,347 | 1,868,351 |
Microchip Technology, Inc. | 5,076 | 466,891 |
Micron Technology, Inc. | 36,266 | 4,096,607 |
MKS Instruments, Inc. | 2,189 | 260,447 |
ON Semiconductor Corp. * | 14,281 | 1,001,955 |
Qorvo, Inc. * | 3,241 | 378,678 |
QUALCOMM, Inc. | 4,736 | 785,466 |
Skyworks Solutions, Inc. | 5,265 | 561,196 |
Teradyne, Inc. | 841 | 97,825 |
Texas Instruments, Inc. | 17,833 | 3,146,098 |
Universal Display Corp. | 854 | 134,915 |
Wolfspeed, Inc. * | 4,048 | 109,417 |
26,711,380 | ||
Software & Services 2.8% | ||
Akamai Technologies, Inc. * | 4,969 | 501,521 |
Amdocs Ltd. | 3,817 | 320,590 |
ANSYS, Inc. * | 509 | 165,364 |
AppLovin Corp., Class A * | 4,950 | 349,321 |
Aspen Technology, Inc. * | 905 | 178,167 |
Bentley Systems, Inc., Class B | 475 | 24,952 |
Bill Holdings, Inc. * | 3,415 | 212,959 |
SECURITY | NUMBER OF SHARES | VALUE ($) |
CCC Intelligent Solutions Holdings, Inc. * | 11,184 | 125,484 |
Cognizant Technology Solutions Corp., Class A | 16,668 | 1,094,754 |
Dolby Laboratories, Inc., Class A | 1,956 | 151,903 |
Dropbox, Inc., Class A * | 949 | 21,979 |
DXC Technology Co. * | 6,391 | 124,561 |
Gen Digital, Inc. | 15,480 | 311,767 |
GoDaddy, Inc., Class A * | 1,843 | 225,546 |
Guidewire Software, Inc. * | 2,710 | 299,184 |
HashiCorp, Inc., Class A * | 1,027 | 33,336 |
Informatica, Inc., Class A * | 1,372 | 42,491 |
International Business Machines Corp. | 30,153 | 5,011,429 |
Kyndryl Holdings, Inc. * | 7,468 | 146,821 |
nCino, Inc. * | 2,094 | 61,061 |
NCR Voyix Corp. * | 4,305 | 52,736 |
Nutanix, Inc., Class A * | 6,125 | 371,787 |
Okta, Inc. * | 4,759 | 442,492 |
Oracle Corp. | 30,156 | 3,430,245 |
PTC, Inc. * | 1,806 | 320,457 |
Roper Technologies, Inc. | 3,507 | 1,793,690 |
Salesforce, Inc. | 7,640 | 2,054,702 |
SentinelOne, Inc., Class A * | 6,850 | 144,741 |
Twilio, Inc., Class A * | 4,659 | 278,981 |
Tyler Technologies, Inc. * | 336 | 155,081 |
UiPath, Inc., Class A * | 2,908 | 55,165 |
Unity Software, Inc. * | 5,863 | 142,295 |
VeriSign, Inc. * | 2,793 | 473,358 |
Zoom Video Communications, Inc., Class A * | 8,539 | 521,733 |
19,640,653 | ||
Technology Hardware & Equipment 2.3% | ||
Amphenol Corp., Class A | 9,627 | 1,162,653 |
Arrow Electronics, Inc. * | 1,773 | 226,359 |
Avnet, Inc. | 3,003 | 146,757 |
CDW Corp. | 260 | 62,884 |
Ciena Corp. * | 4,782 | 221,072 |
Cisco Systems, Inc. | 134,567 | 6,321,958 |
Cognex Corp. | 5,717 | 237,484 |
Coherent Corp. * | 4,292 | 234,472 |
Corning, Inc. | 25,212 | 841,577 |
Crane NXT Co. | 1,619 | 98,451 |
F5, Inc. * | 1,966 | 324,999 |
Hewlett Packard Enterprise Co. | 43,013 | 731,221 |
HP, Inc. | 22,823 | 641,098 |
IPG Photonics Corp. * | 974 | 81,796 |
Jabil, Inc. | 1,547 | 181,556 |
Juniper Networks, Inc. | 10,526 | 366,515 |
Keysight Technologies, Inc. * | 4,306 | 637,030 |
Littelfuse, Inc. | 809 | 186,588 |
Lumentum Holdings, Inc. * | 2,185 | 95,616 |
Motorola Solutions, Inc. | 437 | 148,209 |
NetApp, Inc. | 4,096 | 418,652 |
Pure Storage, Inc., Class A * | 2,086 | 105,134 |
TD SYNNEX Corp. | 2,248 | 264,904 |
Teledyne Technologies, Inc. * | 1,546 | 589,768 |
Trimble, Inc. * | 8,188 | 491,853 |
Ubiquiti, Inc. | 21 | 2,259 |
Viasat, Inc. * | 3,939 | 62,669 |
Vontier Corp. | 3,414 | 138,711 |
Western Digital Corp. * | 10,749 | 761,352 |
Zebra Technologies Corp., Class A * | 1,393 | 438,182 |
16,221,779 | ||
SECURITY | NUMBER OF SHARES | VALUE ($) |
Telecommunication Services 1.8% | ||
AT&T, Inc. | 237,582 | 4,012,760 |
Frontier Communications Parent, Inc. * | 8,047 | 186,208 |
GCI Liberty, Inc. *(c) | 2,247 | 0 |
Iridium Communications, Inc. | 260 | 8,005 |
T-Mobile U.S., Inc. | 16,240 | 2,666,121 |
Verizon Communications, Inc. | 139,653 | 5,514,897 |
12,387,991 | ||
Transportation 2.3% | ||
Alaska Air Group, Inc. * | 4,119 | 177,199 |
American Airlines Group, Inc. * | 13,631 | 184,155 |
Avis Budget Group, Inc. | 390 | 37,225 |
CH Robinson Worldwide, Inc. | 843 | 59,853 |
CSX Corp. | 58,206 | 1,933,603 |
Delta Air Lines, Inc. | 20,176 | 1,010,212 |
Expeditors International of Washington, Inc. | 4,161 | 463,161 |
FedEx Corp. | 7,694 | 2,014,135 |
GXO Logistics, Inc. * | 3,899 | 193,624 |
Hertz Global Holdings, Inc. * | 4,382 | 19,938 |
JB Hunt Transport Services, Inc. | 2,189 | 355,866 |
Kirby Corp. * | 1,935 | 211,167 |
Knight-Swift Transportation Holdings, Inc. | 5,139 | 237,576 |
Landstar System, Inc. | 246 | 42,905 |
Norfolk Southern Corp. | 7,538 | 1,736,152 |
Old Dominion Freight Line, Inc. | 459 | 83,405 |
Ryder System, Inc. | 1,442 | 175,708 |
Saia, Inc. * | 787 | 312,305 |
Schneider National, Inc., Class B | 1,842 | 38,093 |
Southwest Airlines Co. | 19,735 | 511,926 |
U-Haul Holding Co. * | 143 | 9,042 |
U-Haul Holding Co. - Non Voting | 2,068 | 126,810 |
Union Pacific Corp. | 11,570 | 2,743,941 |
United Airlines Holdings, Inc. * | 10,850 | 558,341 |
United Parcel Service, Inc., Class B | 17,375 | 2,562,465 |
XPO, Inc. * | 3,762 | 404,265 |
16,203,072 | ||
Utilities 4.9% | ||
AES Corp. | 8,623 | 154,352 |
Alliant Energy Corp. | 8,433 | 419,963 |
Ameren Corp. | 8,690 | 641,930 |
American Electric Power Co., Inc. | 17,469 | 1,502,858 |
American Water Works Co., Inc. | 6,460 | 790,187 |
Atmos Energy Corp. | 5,000 | 589,500 |
Avangrid, Inc. | 2,395 | 87,489 |
Brookfield Renewable Corp., Class A | 4,465 | 103,767 |
CenterPoint Energy, Inc. | 20,950 | 610,483 |
Clearway Energy, Inc., Class C | 3,737 | 87,371 |
CMS Energy Corp. | 9,656 | 585,250 |
Consolidated Edison, Inc. | 11,492 | 1,084,845 |
Constellation Energy Corp. | 10,670 | 1,983,980 |
Dominion Energy, Inc. | 27,738 | 1,414,083 |
DTE Energy Co. | 6,833 | 753,817 |
Duke Energy Corp. | 25,578 | 2,513,294 |
Edison International | 12,536 | 890,808 |
Entergy Corp. | 7,019 | 748,717 |
Essential Utilities, Inc. | 8,293 | 303,358 |
Evergy, Inc. | 7,396 | 387,920 |
Eversource Energy | 11,564 | 701,010 |
Exelon Corp. | 33,005 | 1,240,328 |
FirstEnergy Corp. | 18,066 | 692,650 |
Hawaiian Electric Industries, Inc. | 3,784 | 37,272 |
IDACORP, Inc. | 1,661 | 157,430 |
SECURITY | NUMBER OF SHARES | VALUE ($) |
National Fuel Gas Co. | 2,918 | 154,946 |
NextEra Energy, Inc. | 68,118 | 4,561,863 |
NiSource, Inc. | 13,640 | 380,010 |
NRG Energy, Inc. | 7,447 | 541,174 |
OGE Energy Corp. | 6,590 | 228,344 |
PG&E Corp. | 67,657 | 1,157,611 |
Pinnacle West Capital Corp. | 3,737 | 275,230 |
PPL Corp. | 24,492 | 672,550 |
Public Service Enterprise Group, Inc. | 16,519 | 1,141,133 |
Sempra | 20,902 | 1,497,210 |
Southern Co. | 36,159 | 2,657,687 |
UGI Corp. | 6,859 | 175,316 |
Vistra Corp. | 8,316 | 630,685 |
WEC Energy Group, Inc. | 10,470 | 865,241 |
Xcel Energy, Inc. | 18,251 | 980,626 |
34,402,288 | ||
Total Common Stocks (Cost $519,316,714) | 693,220,203 | |
INVESTMENT COMPANIES 0.1% OF NET ASSETS | ||
Equity Funds 0.1% | ||
iShares Russell 1000 Value ETF | 6,000 | 1,029,000 |
Total Investment Companies (Cost $920,996) | 1,029,000 | |
SHORT-TERM INVESTMENTS 0.4% OF NET ASSETS | ||
Money Market Funds 0.4% | ||
State Street Institutional U.S. Government Money Market Fund, Premier Class 5.25% (d) | 1,960,090 | 1,960,090 |
State Street Institutional U.S. Government Money Market Fund, Premier Class 5.25% (d)(e) | 624,092 | 624,092 |
2,584,182 | ||
Total Short-Term Investments (Cost $2,584,182) | 2,584,182 | |
Total Investments in Securities (Cost $522,821,892) | 696,833,385 | |
NUMBER OF CONTRACTS | NOTIONAL AMOUNT ($) | CURRENT VALUE/ UNREALIZED DEPRECIATION ($) | |
FUTURES CONTRACTS | |||
Long | |||
S&P 500 Index, e-mini, expires 06/21/24 | 11 | 2,786,850 | (38,433 ) |
* | Non-income producing security. |
(a) | All or a portion of this security is on loan. Securities on loan were valued at $577,988. |
(b) | Issuer is affiliated with the fund’s investment adviser. |
(c) | Fair valued using significant unobservable inputs (see financial note 2(a), Securities for which no quoted value is available, for additional information). |
(d) | The rate shown is the annualized 7-day yield. |
(e) | Security purchased with cash collateral received for securities on loan. |
ADR — | American Depositary Receipt |
ETF — | Exchange-Traded Fund |
REIT — | Real Estate Investment Trust |
SECURITY | VALUE AT 10/31/23 | PURCHASES | SALES | REALIZED GAINS (LOSSES) | NET CHANGE IN UNREALIZED APPRECIATION (DEPRECIATION) | VALUE AT 4/30/24 | BALANCE OF SHARES HELD AT 4/30/24 | DIVIDENDS RECEIVED |
COMMON STOCKS 0.5% OF NET ASSETS | ||||||||
Financial Services 0.5% | ||||||||
Charles Schwab Corp. | $2,523,420 | $294,729 | ($226,533 ) | ($19,108 ) | $1,054,961 | $3,627,469 | 49,053 | $23,792 |
DESCRIPTION | QUOTED PRICES IN ACTIVE MARKETS FOR IDENTICAL ASSETS (LEVEL 1) | OTHER SIGNIFICANT OBSERVABLE INPUTS (LEVEL 2) | SIGNIFICANT UNOBSERVABLE INPUTS (LEVEL 3) | TOTAL |
Assets | ||||
Common Stocks1 | $680,832,212 | $— | $— | $680,832,212 |
Telecommunication Services | 12,387,991 | — | 0 * | 12,387,991 |
Investment Companies1 | 1,029,000 | — | — | 1,029,000 |
Short-Term Investments1 | 2,584,182 | — | — | 2,584,182 |
Liabilities | ||||
Futures Contracts2 | (38,433 ) | — | — | (38,433 ) |
Total | $696,794,952 | $— | $0 | $696,794,952 |
* | Level 3 amount shown includes securities determined to have no value at April 30, 2024. |
1 | As categorized in the Portfolio Holdings. |
2 | Futures contracts are reported at cumulative unrealized appreciation or depreciation. |
Assets | ||
Investments in securities, at value - affiliated issuers (cost $2,356,685) | $3,627,469 | |
Investments in securities, at value - unaffiliated issuers (cost $520,465,207) including securities on loan of $577,988 | 693,205,916 | |
Deposit with broker for futures contracts | 177,000 | |
Receivables: | ||
Fund shares sold | 1,041,417 | |
Dividends | 618,108 | |
Income from securities on loan | + | 2,465 |
Total assets | 698,672,375 | |
Liabilities | ||
Collateral held for securities on loan | 624,092 | |
Payables: | ||
Fund shares redeemed | 321,622 | |
Variation margin on futures contracts | 40,016 | |
Investment adviser fees | + | 20,176 |
Total liabilities | 1,005,906 | |
Net assets | $697,666,469 | |
Net Assets by Source | ||
Capital received from investors | $565,894,030 | |
Total distributable earnings | + | 131,772,439 |
Net assets | $697,666,469 | |
Net Asset Value (NAV) | ||||
Net Assets | ÷ | Shares Outstanding | = | NAV |
$697,666,469 | 13,010,287 | $53.62 | ||
For the period November 1, 2023 through April 30, 2024; unaudited | ||
Investment Income | ||
Dividends received from securities - unaffiliated issuers (net of foreign withholding tax of $900) | $7,765,844 | |
Dividends received from securities - affiliated issuers | 23,792 | |
Other interest | 4,680 | |
Securities on loan, net | + | 22,839 |
Total investment income | 7,817,155 | |
Expenses | ||
Investment adviser fees | 114,452 | |
Total expenses | – | 114,452 |
Net investment income | 7,702,703 | |
REALIZED AND UNREALIZED GAINS (LOSSES) | ||
Net realized losses on sales of securities - affiliated issuers | (19,108 ) | |
Net realized losses on sales of securities - unaffiliated issuers | (4,295,544 ) | |
Net realized gains on futures contracts | + | 500,970 |
Net realized losses | (3,813,682 ) | |
Net change in unrealized appreciation (depreciation) on securities - affiliated issuers | 1,054,961 | |
Net change in unrealized appreciation (depreciation) on securities - unaffiliated issuers | 100,110,302 | |
Net change in unrealized appreciation (depreciation) on futures contracts | + | (38,226 ) |
Net change in unrealized appreciation (depreciation) | + | 101,127,037 |
Net realized and unrealized gains | 97,313,355 | |
Increase in net assets resulting from operations | $105,016,058 | |
OPERATIONS | |||
11/1/23-4/30/24 | 11/1/22-10/31/23 | ||
Net investment income | $7,702,703 | $14,590,528 | |
Net realized gains (losses) | (3,813,682 ) | 603,093 | |
Net change in unrealized appreciation (depreciation) | + | 101,127,037 | (11,298,959 ) |
Increase in net assets resulting from operations | $105,016,058 | $3,894,662 | |
DISTRIBUTIONS TO SHAREHOLDERS | |||
Total distributions | ($16,362,330 ) | ($14,210,885 ) | |
TRANSACTIONS IN FUND SHARES | |||||
11/1/23-4/30/24 | 11/1/22-10/31/23 | ||||
SHARES | VALUE | SHARES | VALUE | ||
Shares sold | 2,295,843 | $119,919,742 | 5,801,820 | $283,185,301 | |
Shares reinvested | 261,070 | 12,821,154 | 239,623 | 11,415,609 | |
Shares redeemed | + | (2,290,648 ) | (116,381,084 ) | (6,931,984 ) | (339,427,728 ) |
Net transactions in fund shares | 266,265 | $16,359,812 | (890,541 ) | ($44,826,818 ) | |
SHARES OUTSTANDING AND NET ASSETS | |||||
11/1/23-4/30/24 | 11/1/22-10/31/23 | ||||
SHARES | NET ASSETS | SHARES | NET ASSETS | ||
Beginning of period | 12,744,022 | $592,652,929 | 13,634,563 | $647,795,970 | |
Total increase (decrease) | + | 266,265 | 105,013,540 | (890,541 ) | (55,143,041 ) |
End of period | 13,010,287 | $697,666,469 | 12,744,022 | $592,652,929 | |
11/1/23– 4/30/24* | 11/1/22– 10/31/23 | 11/1/21– 10/31/22 | 11/1/20– 10/31/21 | 11/1/19– 10/31/20 | 11/1/18– 10/31/19 | |
Per-Share Data | ||||||
Net asset value at beginning of period | $50.52 | $51.84 | $64.44 | $44.98 | $44.29 | $39.55 |
Income (loss) from investment operations: | ||||||
Net investment income (loss)1 | 0.51 | 0.89 | 0.79 | 0.69 | 0.72 | 0.70 |
Net realized and unrealized gains (losses) | 10.52 | (1.40 ) | (11.54 ) | 19.54 | 1.09 | 4.54 |
Total from investment operations | 11.03 | (0.51 ) | (10.75 ) | 20.23 | 1.81 | 5.24 |
Less distributions: | ||||||
Distributions from net investment income | (0.88 ) | (0.77 ) | (0.63 ) | (0.77 ) | (0.64 ) | (0.42 ) |
Distributions from net realized gains | — | (0.04 ) | (1.22 ) | — | (0.48 ) | (0.08 ) |
Total distributions | (0.88 ) | (0.81 ) | (1.85 ) | (0.77 ) | (1.12 ) | (0.50 ) |
Net asset value at end of period | $60.67 | $50.52 | $51.84 | $64.44 | $44.98 | $44.29 |
Total return | 21.98 %2 | (1.03 %) | (17.15 %) | 45.35 % | 4.04 % | 13.61 % |
Ratios/Supplemental Data | ||||||
Ratios to average net assets: | ||||||
Total expenses | 0.04 %3 | 0.04 % | 0.04 %4 | 0.04 % | 0.04 % | 0.04 %5 |
Net investment income (loss) | 1.73 %3 | 1.66 % | 1.41 % | 1.19 % | 1.69 % | 1.67 % |
Portfolio turnover rate | 3 %2 | 8 %6 | 11 %6 | 14 % | 29 % | 21 % |
Net assets, end of period (x 1,000,000) | $1,389 | $1,063 | $903 | $891 | $483 | $357 |
* | Unaudited. |
1 | Calculated based on the average shares outstanding during the period. |
2 | Not annualized. |
3 | Annualized. |
4 | Ratio includes less than 0.005% of non-routine proxy expenses. |
5 | Effective December 20, 2018, the annual operating expense ratio was reduced to 0.04%. The ratio presented for period ended October 31, 2019, is a blended ratio. |
6 | Portfolio turnover rate excludes in-kind transactions. |
SECURITY | NUMBER OF SHARES | VALUE ($) |
COMMON STOCKS 99.6% OF NET ASSETS | ||
Automobiles & Components 0.6% | ||
Aptiv PLC * | 34,620 | 2,458,020 |
BorgWarner, Inc. | 29,917 | 980,380 |
Gentex Corp. | 30,043 | 1,030,475 |
Harley-Davidson, Inc. | 16,101 | 553,713 |
Lear Corp. | 7,432 | 935,466 |
Lucid Group, Inc. *(a) | 95,641 | 243,884 |
Phinia, Inc. | 5,916 | 230,724 |
QuantumScape Corp., Class A * | 42,963 | 232,859 |
Rivian Automotive, Inc., Class A * | 86,114 | 766,415 |
Thor Industries, Inc. | 6,523 | 648,517 |
8,080,453 | ||
Banks 2.4% | ||
Bank OZK | 13,562 | 605,543 |
BOK Financial Corp. | 3,547 | 314,725 |
Citizens Financial Group, Inc. | 59,482 | 2,028,931 |
Columbia Banking System, Inc. | 26,472 | 497,938 |
Comerica, Inc. | 16,890 | 847,371 |
Commerce Bancshares, Inc. | 15,406 | 842,400 |
Cullen/Frost Bankers, Inc. | 7,537 | 786,411 |
East West Bancorp, Inc. | 17,976 | 1,339,032 |
Fifth Third Bancorp | 86,812 | 3,165,166 |
First Citizens BancShares, Inc., Class A | 1,388 | 2,341,223 |
First Hawaiian, Inc. | 16,193 | 341,511 |
First Horizon Corp. | 71,259 | 1,063,184 |
FNB Corp. | 45,522 | 607,264 |
Huntington Bancshares, Inc. | 183,943 | 2,477,712 |
KeyCorp | 119,139 | 1,726,324 |
M&T Bank Corp. | 21,154 | 3,054,426 |
New York Community Bancorp, Inc. | 90,791 | 240,596 |
NU Holdings Ltd., Class A * | 298,978 | 3,246,901 |
Pinnacle Financial Partners, Inc. | 9,579 | 734,709 |
Popular, Inc. | 8,959 | 761,426 |
Prosperity Bancshares, Inc. | 11,090 | 687,247 |
Regions Financial Corp. | 118,181 | 2,277,348 |
Synovus Financial Corp. | 18,412 | 658,966 |
TFS Financial Corp. | 6,437 | 77,308 |
Webster Financial Corp. | 21,924 | 960,929 |
Western Alliance Bancorp | 13,765 | 782,265 |
Wintrust Financial Corp. | 7,745 | 748,477 |
Zions Bancorp NA | 18,526 | 755,490 |
33,970,823 | ||
Capital Goods 13.8% | ||
A O Smith Corp. | 15,498 | 1,283,854 |
Acuity Brands, Inc. | 3,955 | 982,026 |
Advanced Drainage Systems, Inc. | 8,570 | 1,345,490 |
AECOM | 17,364 | 1,603,739 |
AGCO Corp. | 8,029 | 916,832 |
Air Lease Corp., Class A | 13,172 | 661,761 |
Allegion PLC | 11,233 | 1,365,483 |
Allison Transmission Holdings, Inc. | 11,367 | 836,043 |
SECURITY | NUMBER OF SHARES | VALUE ($) |
AMETEK, Inc. | 29,420 | 5,138,497 |
Armstrong World Industries, Inc. | 5,582 | 641,260 |
Axon Enterprise, Inc. * | 9,001 | 2,823,254 |
AZEK Co., Inc., Class A * | 18,286 | 834,573 |
Builders FirstSource, Inc. * | 15,513 | 2,836,087 |
BWX Technologies, Inc. | 11,699 | 1,120,413 |
Carlisle Cos., Inc. | 6,188 | 2,402,491 |
Carrier Global Corp. | 106,576 | 6,553,358 |
ChargePoint Holdings, Inc. *(a) | 43,622 | 58,017 |
CNH Industrial NV * | 125,102 | 1,426,163 |
Core & Main, Inc., Class A * | 22,222 | 1,254,876 |
Crane Co. | 6,109 | 855,321 |
Cummins, Inc. | 17,423 | 4,921,823 |
Curtiss-Wright Corp. | 4,885 | 1,237,957 |
Donaldson Co., Inc. | 15,515 | 1,120,183 |
Dover Corp. | 17,840 | 3,198,712 |
EMCOR Group, Inc. | 5,931 | 2,118,375 |
Esab Corp. | 7,184 | 760,642 |
Fastenal Co. | 73,037 | 4,962,134 |
Ferguson PLC | 26,121 | 5,482,798 |
Flowserve Corp. | 16,654 | 785,403 |
Fortive Corp. | 45,232 | 3,404,613 |
Fortune Brands Innovations, Inc. | 16,193 | 1,183,708 |
Gates Industrial Corp. PLC * | 21,022 | 370,408 |
Generac Holdings, Inc. * | 7,674 | 1,043,357 |
Graco, Inc. | 21,366 | 1,713,553 |
Hayward Holdings, Inc. * | 16,802 | 228,171 |
HEICO Corp. | 14,152 | 2,935,125 |
Hexcel Corp. | 10,731 | 689,038 |
Howmet Aerospace, Inc. | 48,505 | 3,237,709 |
Hubbell, Inc., Class B | 6,850 | 2,538,062 |
Huntington Ingalls Industries, Inc. | 5,017 | 1,389,358 |
IDEX Corp. | 9,668 | 2,131,407 |
Ingersoll Rand, Inc. | 51,767 | 4,830,896 |
ITT, Inc. | 10,576 | 1,367,900 |
Lennox International, Inc. | 4,087 | 1,893,998 |
Lincoln Electric Holdings, Inc. | 7,139 | 1,567,225 |
Masco Corp. | 28,752 | 1,968,074 |
MasTec, Inc. * | 7,915 | 701,981 |
MDU Resources Group, Inc. | 25,727 | 635,457 |
Mercury Systems, Inc. * | 6,833 | 192,691 |
Middleby Corp. * | 6,823 | 948,192 |
MSC Industrial Direct Co., Inc., Class A | 5,888 | 537,221 |
Nordson Corp. | 7,313 | 1,888,143 |
nVent Electric PLC | 21,041 | 1,516,425 |
Oshkosh Corp. | 8,360 | 938,577 |
Otis Worldwide Corp. | 52,880 | 4,822,656 |
Owens Corning | 11,323 | 1,904,642 |
PACCAR, Inc. | 65,587 | 6,959,437 |
Parker-Hannifin Corp. | 16,348 | 8,908,189 |
Pentair PLC | 20,983 | 1,659,545 |
Plug Power, Inc. *(a) | 66,485 | 153,580 |
Quanta Services, Inc. | 18,385 | 4,753,626 |
RBC Bearings, Inc. * | 3,600 | 880,380 |
Regal Rexnord Corp. | 8,466 | 1,366,158 |
Rockwell Automation, Inc. | 14,698 | 3,982,570 |
Sensata Technologies Holding PLC | 19,207 | 735,820 |
SiteOne Landscape Supply, Inc. * | 5,703 | 894,744 |
SECURITY | NUMBER OF SHARES | VALUE ($) |
Snap-on, Inc. | 6,655 | 1,783,274 |
Spirit AeroSystems Holdings, Inc., Class A * | 14,664 | 469,248 |
Stanley Black & Decker, Inc. | 19,579 | 1,789,521 |
Sunrun, Inc. * | 27,411 | 282,059 |
Textron, Inc. | 25,025 | 2,116,865 |
Timken Co. | 7,785 | 694,578 |
Toro Co. | 13,335 | 1,168,013 |
Trane Technologies PLC | 29,129 | 9,243,797 |
TransDigm Group, Inc. | 6,777 | 8,457,899 |
Trex Co., Inc. * | 13,907 | 1,231,465 |
United Rentals, Inc. | 8,654 | 5,780,785 |
Valmont Industries, Inc. | 2,641 | 540,877 |
Vertiv Holdings Co., Class A | 43,887 | 4,081,491 |
Watsco, Inc. | 4,301 | 1,925,644 |
WESCO International, Inc. | 5,634 | 860,593 |
Westinghouse Air Brake Technologies Corp. | 22,803 | 3,673,107 |
WillScot Mobile Mini Holdings Corp. * | 23,903 | 883,455 |
Woodward, Inc. | 7,666 | 1,244,652 |
WW Grainger, Inc. | 5,649 | 5,204,706 |
Xylem, Inc. | 30,330 | 3,964,131 |
191,796,361 | ||
Commercial & Professional Services 4.5% | ||
Booz Allen Hamilton Holding Corp., Class A | 16,391 | 2,420,459 |
Broadridge Financial Solutions, Inc. | 14,989 | 2,899,023 |
CACI International, Inc., Class A * | 2,826 | 1,136,702 |
Cintas Corp. | 11,083 | 7,296,382 |
Clarivate PLC * | 59,570 | 402,693 |
Clean Harbors, Inc. * | 6,481 | 1,227,825 |
Concentrix Corp. | 5,591 | 305,660 |
Copart, Inc. * | 109,751 | 5,960,577 |
Dayforce, Inc. * | 19,145 | 1,174,929 |
Driven Brands Holdings, Inc. * | 7,549 | 108,177 |
Dun & Bradstreet Holdings, Inc. | 34,754 | 316,261 |
Equifax, Inc. | 15,585 | 3,431,661 |
FTI Consulting, Inc. * | 4,237 | 905,998 |
Genpact Ltd. | 22,538 | 692,818 |
Jacobs Solutions, Inc. | 16,089 | 2,309,254 |
KBR, Inc. | 17,151 | 1,113,786 |
Leidos Holdings, Inc. | 17,455 | 2,447,540 |
ManpowerGroup, Inc. | 6,178 | 466,130 |
MSA Safety, Inc. | 4,692 | 846,437 |
Paychex, Inc. | 41,219 | 4,897,229 |
Paycom Software, Inc. | 6,617 | 1,243,864 |
Paycor HCM, Inc. * | 8,334 | 144,762 |
Paylocity Holding Corp. * | 5,348 | 829,796 |
RB Global, Inc. | 23,229 | 1,662,732 |
Republic Services, Inc., Class A | 26,420 | 5,064,714 |
Robert Half, Inc. | 13,152 | 909,329 |
Rollins, Inc. | 32,667 | 1,455,642 |
Science Applications International Corp. | 6,598 | 849,163 |
SS&C Technologies Holdings, Inc. | 27,793 | 1,720,109 |
Stericycle, Inc. * | 11,725 | 524,459 |
Tetra Tech, Inc. | 6,785 | 1,321,175 |
TransUnion | 24,694 | 1,802,662 |
Verisk Analytics, Inc., Class A | 18,251 | 3,977,988 |
Vestis Corp. | 14,913 | 274,697 |
62,140,633 | ||
Consumer Discretionary Distribution & Retail 3.3% | ||
Advance Auto Parts, Inc. | 7,560 | 551,729 |
AutoNation, Inc. * | 3,618 | 583,041 |
Bath & Body Works, Inc. | 28,946 | 1,314,727 |
SECURITY | NUMBER OF SHARES | VALUE ($) |
Best Buy Co., Inc. | 24,612 | 1,812,428 |
Burlington Stores, Inc. * | 8,267 | 1,487,564 |
CarMax, Inc. * | 20,218 | 1,374,217 |
Coupang, Inc., Class A * | 140,126 | 3,152,835 |
Dick's Sporting Goods, Inc. | 7,210 | 1,448,777 |
eBay, Inc. | 66,375 | 3,420,967 |
Etsy, Inc. * | 15,278 | 1,049,140 |
Five Below, Inc. * | 7,025 | 1,028,038 |
Floor & Decor Holdings, Inc., Class A * | 13,317 | 1,469,265 |
GameStop Corp., Class A *(a) | 34,517 | 382,793 |
Gap, Inc. | 24,746 | 507,788 |
Genuine Parts Co. | 17,939 | 2,820,190 |
Kohl's Corp. | 14,152 | 338,799 |
Lithia Motors, Inc., Class A | 3,473 | 883,462 |
LKQ Corp. | 34,091 | 1,470,345 |
Macy's, Inc. | 34,451 | 634,932 |
Murphy USA, Inc. | 2,495 | 1,032,481 |
Nordstrom, Inc. | 14,599 | 277,527 |
Ollie's Bargain Outlet Holdings, Inc. * | 7,848 | 574,003 |
Penske Automotive Group, Inc. | 2,494 | 381,357 |
Petco Health & Wellness Co., Inc., Class A * | 9,048 | 13,572 |
Pool Corp. | 4,858 | 1,761,171 |
RH * | 1,984 | 490,147 |
Ross Stores, Inc. | 42,283 | 5,477,763 |
Tractor Supply Co. | 13,821 | 3,774,239 |
Ulta Beauty, Inc. * | 6,202 | 2,510,818 |
Valvoline, Inc. * | 16,521 | 702,473 |
Victoria's Secret & Co. * | 9,726 | 171,372 |
Wayfair, Inc., Class A * | 10,706 | 536,906 |
Williams-Sonoma, Inc. | 8,149 | 2,336,970 |
45,771,836 | ||
Consumer Durables & Apparel 2.8% | ||
Birkenstock Holding PLC *(a) | 3,259 | 145,905 |
Brunswick Corp. | 8,718 | 703,020 |
Capri Holdings Ltd. * | 14,393 | 510,664 |
Carter's, Inc. | 4,577 | 313,113 |
Columbia Sportswear Co. | 4,414 | 351,487 |
Crocs, Inc. * | 7,621 | 947,824 |
Deckers Outdoor Corp. * | 3,271 | 2,677,215 |
DR Horton, Inc. | 38,724 | 5,517,783 |
Garmin Ltd. | 19,650 | 2,838,835 |
Hasbro, Inc. | 16,749 | 1,026,714 |
Leggett & Platt, Inc. | 17,044 | 307,985 |
Lennar Corp., Class A | 32,521 | 4,930,834 |
Mattel, Inc. * | 44,824 | 821,176 |
Mohawk Industries, Inc. * | 6,734 | 776,565 |
Newell Brands, Inc. | 48,879 | 388,099 |
NVR, Inc. * | 372 | 2,767,252 |
Peloton Interactive, Inc., Class A * | 42,236 | 131,354 |
Polaris, Inc. | 6,864 | 584,538 |
PulteGroup, Inc. | 27,397 | 3,052,574 |
PVH Corp. | 7,551 | 821,549 |
Ralph Lauren Corp., Class A | 5,048 | 826,055 |
Skechers USA, Inc., Class A * | 17,066 | 1,127,209 |
Tapestry, Inc. | 29,345 | 1,171,452 |
Tempur Sealy International, Inc. | 21,387 | 1,070,633 |
Toll Brothers, Inc. | 13,279 | 1,581,662 |
TopBuild Corp. * | 4,052 | 1,639,723 |
Under Armour, Inc., Class A * | 48,931 | 329,306 |
VF Corp. | 44,516 | 554,669 |
Whirlpool Corp. | 6,813 | 646,281 |
YETI Holdings, Inc. * | 11,031 | 394,027 |
38,955,503 | ||
SECURITY | NUMBER OF SHARES | VALUE ($) |
Consumer Services 3.7% | ||
ADT, Inc. | 32,493 | 211,205 |
Aramark | 33,345 | 1,050,701 |
Boyd Gaming Corp. | 8,994 | 481,269 |
Bright Horizons Family Solutions, Inc. * | 7,312 | 758,328 |
Caesars Entertainment, Inc. * | 26,387 | 945,182 |
Carnival Corp. * | 127,104 | 1,883,681 |
Cava Group, Inc. * | 6,125 | 440,633 |
Choice Hotels International, Inc. | 3,757 | 444,303 |
Churchill Downs, Inc. | 9,110 | 1,175,190 |
Darden Restaurants, Inc. | 15,244 | 2,338,582 |
Domino's Pizza, Inc. | 4,466 | 2,363,720 |
DoorDash, Inc., Class A * | 39,656 | 5,125,935 |
DraftKings, Inc., Class A * | 53,457 | 2,221,673 |
Expedia Group, Inc. * | 17,006 | 2,289,518 |
Grand Canyon Education, Inc. * | 3,788 | 492,516 |
H&R Block, Inc. | 18,426 | 870,260 |
Hilton Worldwide Holdings, Inc. | 31,869 | 6,287,116 |
Hyatt Hotels Corp., Class A | 5,518 | 821,023 |
Marriott Vacations Worldwide Corp. | 4,456 | 428,266 |
MGM Resorts International * | 35,164 | 1,386,868 |
Mister Car Wash, Inc. * | 9,655 | 64,592 |
Norwegian Cruise Line Holdings Ltd. * | 54,199 | 1,025,445 |
Penn Entertainment, Inc. * | 19,052 | 315,120 |
Planet Fitness, Inc., Class A * | 10,854 | 649,503 |
Royal Caribbean Cruises Ltd. * | 29,933 | 4,179,545 |
Service Corp. International | 18,375 | 1,317,671 |
Texas Roadhouse, Inc., Class A | 8,558 | 1,375,955 |
Travel & Leisure Co. | 9,023 | 392,861 |
Vail Resorts, Inc. | 4,847 | 917,876 |
Wendy's Co. | 21,611 | 432,004 |
Wingstop, Inc. | 3,762 | 1,447,580 |
Wyndham Hotels & Resorts, Inc. | 10,343 | 760,314 |
Wynn Resorts Ltd. | 13,301 | 1,219,037 |
Yum! Brands, Inc. | 35,865 | 5,065,931 |
51,179,403 | ||
Consumer Staples Distribution & Retail 1.2% | ||
Albertsons Cos., Inc., Class A | 53,047 | 1,082,159 |
BJ's Wholesale Club Holdings, Inc. * | 17,031 | 1,271,875 |
Casey's General Stores, Inc. | 4,765 | 1,522,799 |
Dollar Tree, Inc. * | 26,270 | 3,106,427 |
Grocery Outlet Holding Corp. * | 12,212 | 317,146 |
Kroger Co. | 83,467 | 4,622,402 |
Maplebear, Inc. * | 2,675 | 91,298 |
Performance Food Group Co. * | 19,614 | 1,331,398 |
U.S. Foods Holding Corp. * | 28,993 | 1,456,898 |
Walgreens Boots Alliance, Inc. | 91,661 | 1,625,150 |
16,427,552 | ||
Energy 5.2% | ||
Antero Midstream Corp. | 43,170 | 597,473 |
Antero Resources Corp. * | 36,216 | 1,231,706 |
APA Corp. | 46,585 | 1,464,632 |
Baker Hughes Co., Class A | 127,746 | 4,167,075 |
Cheniere Energy, Inc. | 30,653 | 4,837,656 |
Chesapeake Energy Corp. | 15,837 | 1,423,430 |
Coterra Energy, Inc. | 95,471 | 2,612,087 |
Devon Energy Corp. | 81,986 | 4,196,044 |
Diamondback Energy, Inc. | 22,816 | 4,588,982 |
DT Midstream, Inc. | 12,355 | 768,481 |
EQT Corp. | 46,098 | 1,848,069 |
Halliburton Co. | 114,917 | 4,305,940 |
Hess Corp. | 35,550 | 5,598,770 |
HF Sinclair Corp. | 20,484 | 1,111,257 |
SECURITY | NUMBER OF SHARES | VALUE ($) |
Marathon Oil Corp. | 74,680 | 2,005,158 |
New Fortress Energy, Inc. | 8,229 | 215,600 |
NOV, Inc. | 49,954 | 923,649 |
ONEOK, Inc. | 74,419 | 5,888,031 |
Ovintiv, Inc. | 32,823 | 1,684,476 |
Phillips 66 | 56,273 | 8,058,856 |
Range Resources Corp. | 29,998 | 1,077,228 |
Southwestern Energy Co. * | 139,690 | 1,046,278 |
Targa Resources Corp. | 28,270 | 3,224,476 |
TechnipFMC PLC | 55,391 | 1,419,117 |
Texas Pacific Land Corp. | 2,368 | 1,364,678 |
Williams Cos., Inc. | 155,796 | 5,976,335 |
71,635,484 | ||
Equity Real Estate Investment Trusts (REITs) 6.6% | ||
Agree Realty Corp. | 12,621 | 722,174 |
Alexandria Real Estate Equities, Inc. | 22,184 | 2,570,460 |
American Homes 4 Rent, Class A | 42,602 | 1,525,152 |
Americold Realty Trust, Inc. | 36,097 | 793,051 |
Apartment Income REIT Corp. | 18,677 | 716,823 |
AvalonBay Communities, Inc. | 18,127 | 3,436,335 |
Boston Properties, Inc. | 20,090 | 1,243,370 |
Brixmor Property Group, Inc. | 38,118 | 842,408 |
Camden Property Trust | 13,286 | 1,324,348 |
Cousins Properties, Inc. | 19,267 | 441,985 |
CubeSmart | 28,656 | 1,158,849 |
Digital Realty Trust, Inc. | 38,638 | 5,362,182 |
EastGroup Properties, Inc. | 5,826 | 905,127 |
EPR Properties | 9,494 | 385,361 |
Equity LifeStyle Properties, Inc. | 22,743 | 1,371,175 |
Equity Residential | 47,708 | 3,072,395 |
Essex Property Trust, Inc. | 8,164 | 2,010,385 |
Extra Space Storage, Inc. | 26,749 | 3,591,856 |
Federal Realty Investment Trust | 10,364 | 1,079,618 |
First Industrial Realty Trust, Inc. | 16,807 | 763,374 |
Gaming & Leisure Properties, Inc. | 32,746 | 1,399,237 |
Healthcare Realty Trust, Inc., Class A | 48,369 | 688,291 |
Healthpeak Properties, Inc. | 90,328 | 1,681,004 |
Highwoods Properties, Inc. | 13,371 | 350,320 |
Host Hotels & Resorts, Inc. | 89,405 | 1,687,072 |
Invitation Homes, Inc. | 78,168 | 2,673,346 |
Iron Mountain, Inc. | 37,035 | 2,870,953 |
Kilroy Realty Corp. | 14,899 | 503,586 |
Kimco Realty Corp. | 83,946 | 1,563,914 |
Lamar Advertising Co., Class A | 11,128 | 1,289,179 |
Medical Properties Trust, Inc. (a) | 75,815 | 348,749 |
Mid-America Apartment Communities, Inc. | 14,848 | 1,930,240 |
National Storage Affiliates Trust | 9,591 | 336,069 |
NET Lease Office Properties | 1,979 | 45,240 |
NNN REIT, Inc. | 23,102 | 936,324 |
Omega Healthcare Investors, Inc. | 31,394 | 954,692 |
Park Hotels & Resorts, Inc. | 26,466 | 426,897 |
Rayonier, Inc. | 18,691 | 554,375 |
Realty Income Corp. | 106,395 | 5,696,388 |
Regency Centers Corp. | 23,132 | 1,369,877 |
Rexford Industrial Realty, Inc. | 26,967 | 1,154,457 |
SBA Communications Corp., Class A | 13,735 | 2,556,358 |
Simon Property Group, Inc. | 41,507 | 5,832,979 |
STAG Industrial, Inc. | 23,144 | 795,922 |
Sun Communities, Inc. | 15,715 | 1,749,394 |
UDR, Inc. | 41,976 | 1,598,446 |
Ventas, Inc. | 51,097 | 2,262,575 |
VICI Properties, Inc., Class A | 132,282 | 3,776,651 |
Vornado Realty Trust | 22,506 | 585,831 |
Welltower, Inc. | 70,890 | 6,754,399 |
Weyerhaeuser Co. | 93,674 | 2,826,145 |
SECURITY | NUMBER OF SHARES | VALUE ($) |
WP Carey, Inc. | 27,733 | 1,520,878 |
92,036,216 | ||
Financial Services 8.5% | ||
Affiliated Managers Group, Inc. | 4,251 | 663,581 |
Affirm Holdings, Inc. * | 28,880 | 920,694 |
AGNC Investment Corp. | 88,158 | 806,646 |
Ally Financial, Inc. | 34,635 | 1,328,252 |
Ameriprise Financial, Inc. | 12,815 | 5,277,089 |
Annaly Capital Management, Inc. | 64,035 | 1,200,016 |
Apollo Global Management, Inc. | 66,735 | 7,232,739 |
ARES Management Corp., Class A | 21,371 | 2,844,266 |
Bank of New York Mellon Corp. | 97,265 | 5,494,500 |
Block, Inc. * | 70,548 | 5,150,004 |
Blue Owl Capital, Inc., Class A | 58,382 | 1,102,836 |
Carlyle Group, Inc. | 27,016 | 1,210,317 |
Cboe Global Markets, Inc. | 13,450 | 2,436,467 |
Coinbase Global, Inc., Class A * | 21,906 | 4,467,291 |
Corebridge Financial, Inc. (a) | 28,835 | 765,858 |
Corpay, Inc. * | 8,989 | 2,715,936 |
Credit Acceptance Corp. * | 806 | 414,058 |
Discover Financial Services | 31,909 | 4,043,828 |
Equitable Holdings, Inc. | 43,107 | 1,591,079 |
Euronet Worldwide, Inc. * | 5,567 | 571,620 |
Evercore, Inc., Class A | 4,516 | 819,654 |
FactSet Research Systems, Inc. | 4,908 | 2,046,096 |
Fidelity National Information Services, Inc. | 75,727 | 5,143,378 |
Franklin Resources, Inc. | 38,426 | 877,650 |
Global Payments, Inc. | 32,983 | 4,049,323 |
Houlihan Lokey, Inc., Class A | 6,442 | 821,291 |
Interactive Brokers Group, Inc., Class A | 13,258 | 1,526,261 |
Invesco Ltd. | 46,247 | 655,320 |
Jack Henry & Associates, Inc. | 9,306 | 1,513,993 |
Janus Henderson Group PLC | 17,044 | 532,114 |
Jefferies Financial Group, Inc. | 23,225 | 1,000,069 |
KKR & Co., Inc. | 84,870 | 7,898,851 |
Lazard, Inc. | 13,935 | 536,498 |
LPL Financial Holdings, Inc. | 9,637 | 2,593,606 |
MarketAxess Holdings, Inc. | 4,753 | 951,028 |
MGIC Investment Corp. | 35,064 | 711,098 |
Morningstar, Inc. | 3,298 | 932,180 |
MSCI, Inc., Class A | 9,823 | 4,575,455 |
Nasdaq, Inc. | 47,135 | 2,821,030 |
NCR Atleos Corp. * | 8,357 | 166,555 |
Northern Trust Corp. | 25,870 | 2,131,429 |
OneMain Holdings, Inc. | 14,283 | 744,287 |
Raymond James Financial, Inc. | 24,198 | 2,952,156 |
Rithm Capital Corp. | 61,345 | 682,156 |
Robinhood Markets, Inc., Class A * | 80,955 | 1,334,948 |
Rocket Cos., Inc., Class A * | 15,067 | 185,023 |
SEI Investments Co. | 12,894 | 850,359 |
Shift4 Payments, Inc., Class A * | 6,826 | 394,952 |
SLM Corp. | 27,907 | 591,349 |
SoFi Technologies, Inc. * | 121,941 | 826,760 |
Starwood Property Trust, Inc. | 37,520 | 711,754 |
State Street Corp. | 38,560 | 2,795,214 |
Stifel Financial Corp. | 12,538 | 1,002,037 |
Synchrony Financial | 51,804 | 2,278,340 |
T Rowe Price Group, Inc. | 28,211 | 3,091,079 |
Toast, Inc., Class A * | 46,991 | 1,110,397 |
TPG, Inc. | 9,187 | 395,960 |
Tradeweb Markets, Inc., Class A | 14,684 | 1,493,510 |
UWM Holdings Corp. | 11,458 | 72,185 |
Virtu Financial, Inc., Class A | 10,741 | 233,080 |
Voya Financial, Inc. | 12,423 | 846,752 |
Western Union Co. | 46,366 | 623,159 |
SECURITY | NUMBER OF SHARES | VALUE ($) |
WEX, Inc. * | 5,478 | 1,157,282 |
XP, Inc., Class A | 41,458 | 848,645 |
117,761,340 | ||
Food, Beverage & Tobacco 1.7% | ||
Boston Beer Co., Inc., Class A * | 1,210 | 336,876 |
Brown-Forman Corp., Class B | 29,705 | 1,421,384 |
Bunge Global SA | 18,502 | 1,882,764 |
Campbell Soup Co. | 24,360 | 1,113,496 |
Celsius Holdings, Inc. * | 18,390 | 1,310,655 |
Conagra Brands, Inc. | 60,833 | 1,872,440 |
Darling Ingredients, Inc. * | 20,181 | 855,069 |
Flowers Foods, Inc. | 23,927 | 596,739 |
Freshpet, Inc. * | 5,512 | 584,658 |
Hormel Foods Corp. | 37,068 | 1,318,138 |
Ingredion, Inc. | 8,299 | 950,983 |
J M Smucker Co. | 13,140 | 1,509,129 |
Kellanova | 33,229 | 1,922,630 |
Lamb Weston Holdings, Inc. | 18,597 | 1,549,874 |
McCormick & Co., Inc. - Non Voting Shares | 32,139 | 2,444,492 |
Molson Coors Beverage Co., Class B | 22,374 | 1,281,135 |
Pilgrim's Pride Corp. * | 5,168 | 186,151 |
Post Holdings, Inc. * | 6,469 | 686,684 |
Seaboard Corp. | 29 | 95,993 |
Tyson Foods, Inc., Class A | 35,533 | 2,155,077 |
WK Kellogg Co. | 8,323 | 194,259 |
24,268,626 | ||
Health Care Equipment & Services 5.0% | ||
Acadia Healthcare Co., Inc. * | 11,420 | 844,395 |
agilon health, Inc. * | 36,699 | 201,845 |
Align Technology, Inc. * | 9,764 | 2,757,158 |
Amedisys, Inc. * | 4,106 | 377,957 |
Baxter International, Inc. | 64,656 | 2,610,163 |
Cardinal Health, Inc. | 31,548 | 3,250,706 |
Cencora, Inc. | 21,506 | 5,141,009 |
Certara, Inc. * | 15,319 | 262,108 |
Chemed Corp. | 1,882 | 1,068,976 |
Cooper Cos., Inc. | 24,853 | 2,213,408 |
DaVita, Inc. * | 6,877 | 955,972 |
DENTSPLY SIRONA, Inc. | 26,920 | 807,869 |
Dexcom, Inc. * | 49,474 | 6,302,493 |
Doximity, Inc., Class A * | 14,360 | 348,804 |
Encompass Health Corp. | 12,658 | 1,055,424 |
Enovis Corp. * | 6,718 | 371,035 |
Envista Holdings Corp. * | 20,848 | 410,289 |
Globus Medical, Inc., Class A * | 15,090 | 751,331 |
Henry Schein, Inc. * | 16,694 | 1,156,560 |
Hologic, Inc. * | 29,581 | 2,241,352 |
ICU Medical, Inc. * | 2,618 | 256,355 |
IDEXX Laboratories, Inc. * | 10,534 | 5,190,734 |
Inspire Medical Systems, Inc. * | 3,711 | 896,800 |
Insulet Corp. * | 8,871 | 1,525,280 |
Integra LifeSciences Holdings Corp. * | 8,810 | 256,988 |
Laboratory Corp. of America Holdings | 10,843 | 2,183,455 |
Masimo Corp. * | 5,496 | 738,717 |
Molina Healthcare, Inc. * | 7,388 | 2,527,435 |
Novocure Ltd. * | 13,221 | 161,825 |
Penumbra, Inc. * | 4,654 | 914,371 |
Premier, Inc., Class A | 15,302 | 319,506 |
Quest Diagnostics, Inc. | 14,321 | 1,978,876 |
QuidelOrtho Corp. * | 6,806 | 275,983 |
R1 RCM, Inc. * | 19,684 | 241,916 |
ResMed, Inc. | 18,570 | 3,973,794 |
Shockwave Medical, Inc. * | 4,640 | 1,532,082 |
SECURITY | NUMBER OF SHARES | VALUE ($) |
STERIS PLC | 12,685 | 2,594,844 |
Tandem Diabetes Care, Inc. * | 8,182 | 300,198 |
Teladoc Health, Inc. * | 20,950 | 267,112 |
Teleflex, Inc. | 6,018 | 1,256,257 |
Tenet Healthcare Corp. * | 12,926 | 1,451,461 |
Universal Health Services, Inc., Class B | 7,540 | 1,285,042 |
Veeva Systems, Inc., Class A * | 18,523 | 3,677,927 |
Zimmer Biomet Holdings, Inc. | 26,860 | 3,230,721 |
70,166,533 | ||
Household & Personal Products 0.5% | ||
Church & Dwight Co., Inc. | 31,243 | 3,370,807 |
Clorox Co. | 15,816 | 2,338,712 |
Coty, Inc., Class A * | 47,942 | 548,457 |
Olaplex Holdings, Inc. * | 16,821 | 23,381 |
Reynolds Consumer Products, Inc. | 6,938 | 198,635 |
Spectrum Brands Holdings, Inc. | 3,879 | 317,574 |
6,797,566 | ||
Insurance 4.9% | ||
Aflac, Inc. | 74,253 | 6,211,263 |
Allstate Corp. | 33,551 | 5,705,683 |
American Financial Group, Inc. | 9,168 | 1,171,212 |
Arch Capital Group Ltd. * | 45,745 | 4,278,987 |
Arthur J Gallagher & Co. | 27,417 | 6,434,496 |
Assurant, Inc. | 6,775 | 1,181,560 |
Assured Guaranty Ltd. | 6,985 | 535,750 |
Axis Capital Holdings Ltd. | 9,897 | 606,983 |
Brighthouse Financial, Inc. * | 8,095 | 390,584 |
Brown & Brown, Inc. | 30,320 | 2,472,293 |
Cincinnati Financial Corp. | 19,633 | 2,271,342 |
CNA Financial Corp. | 3,293 | 144,694 |
Everest Group Ltd. | 5,479 | 2,007,560 |
Fidelity National Financial, Inc. | 33,179 | 1,642,360 |
First American Financial Corp. | 12,760 | 683,553 |
Globe Life, Inc. | 11,113 | 846,477 |
Hanover Insurance Group, Inc. | 4,519 | 586,657 |
Hartford Financial Services Group, Inc. | 37,761 | 3,658,663 |
Kemper Corp. | 7,664 | 446,888 |
Kinsale Capital Group, Inc. | 2,798 | 1,016,374 |
Lincoln National Corp. | 21,518 | 586,796 |
Loews Corp. | 23,406 | 1,758,961 |
Markel Group, Inc. * | 1,680 | 2,450,112 |
Old Republic International Corp. | 32,989 | 985,052 |
Primerica, Inc. | 4,466 | 946,167 |
Principal Financial Group, Inc. | 30,337 | 2,400,870 |
Prudential Financial, Inc. | 46,444 | 5,131,133 |
Reinsurance Group of America, Inc. | 8,505 | 1,590,350 |
RenaissanceRe Holdings Ltd. | 6,616 | 1,450,558 |
RLI Corp. | 5,121 | 723,853 |
Ryan Specialty Holdings, Inc., Class A | 12,267 | 605,254 |
Unum Group | 24,632 | 1,248,842 |
W R Berkley Corp. | 25,565 | 1,967,738 |
White Mountains Insurance Group Ltd. | 315 | 560,114 |
Willis Towers Watson PLC | 13,227 | 3,321,829 |
68,021,008 | ||
Materials 5.6% | ||
Albemarle Corp. | 14,975 | 1,801,642 |
Alcoa Corp. | 22,828 | 802,176 |
Amcor PLC | 184,284 | 1,647,499 |
AptarGroup, Inc. | 8,379 | 1,209,760 |
Ardagh Metal Packaging SA | 19,179 | 75,757 |
Ashland, Inc. | 6,428 | 612,781 |
Avery Dennison Corp. | 10,325 | 2,243,416 |
SECURITY | NUMBER OF SHARES | VALUE ($) |
Axalta Coating Systems Ltd. * | 28,400 | 892,896 |
Ball Corp. | 39,399 | 2,740,988 |
Berry Global Group, Inc. | 14,890 | 843,370 |
Celanese Corp., Class A | 12,637 | 1,941,170 |
CF Industries Holdings, Inc. | 24,615 | 1,943,847 |
Chemours Co. | 18,928 | 506,324 |
Cleveland-Cliffs, Inc. * | 63,826 | 1,078,659 |
Corteva, Inc. | 90,246 | 4,885,016 |
Crown Holdings, Inc. | 13,597 | 1,115,906 |
DuPont de Nemours, Inc. | 55,024 | 3,989,240 |
Eagle Materials, Inc. | 4,371 | 1,095,853 |
Eastman Chemical Co. | 15,175 | 1,433,127 |
Element Solutions, Inc. | 28,490 | 658,974 |
FMC Corp. | 16,024 | 945,576 |
Ginkgo Bioworks Holdings, Inc. *(a) | 203,868 | 181,667 |
Graphic Packaging Holding Co. | 39,029 | 1,008,900 |
Huntsman Corp. | 21,099 | 503,422 |
International Flavors & Fragrances, Inc. | 32,656 | 2,764,330 |
International Paper Co. | 42,861 | 1,497,563 |
Louisiana-Pacific Corp. | 8,182 | 598,841 |
LyondellBasell Industries NV, Class A | 33,090 | 3,308,007 |
Martin Marietta Materials, Inc. | 7,896 | 4,635,505 |
Mosaic Co. | 41,714 | 1,309,402 |
MP Materials Corp. * | 13,625 | 218,000 |
NewMarket Corp. | 793 | 417,848 |
Nucor Corp. | 31,423 | 5,295,718 |
Olin Corp. | 15,420 | 806,158 |
Packaging Corp. of America | 11,313 | 1,956,923 |
PPG Industries, Inc. | 30,024 | 3,873,096 |
Reliance, Inc. | 7,302 | 2,079,025 |
Royal Gold, Inc. | 8,406 | 1,009,813 |
RPM International, Inc. | 16,262 | 1,738,570 |
Scotts Miracle-Gro Co. | 5,371 | 368,128 |
Sealed Air Corp. | 18,308 | 576,336 |
Silgan Holdings, Inc. | 10,274 | 479,385 |
Sonoco Products Co. | 12,474 | 699,168 |
SSR Mining, Inc. | 25,877 | 138,701 |
Steel Dynamics, Inc. | 19,487 | 2,535,648 |
U.S. Steel Corp. | 28,388 | 1,036,162 |
Vulcan Materials Co. | 16,944 | 4,365,283 |
Westlake Corp. | 4,167 | 614,049 |
Westrock Co. | 32,501 | 1,558,748 |
78,038,373 | ||
Media & Entertainment 3.2% | ||
AMC Entertainment Holdings, Inc., Class A *(a) | 32,370 | 94,844 |
Cable One, Inc. | 720 | 283,572 |
Electronic Arts, Inc. | 34,619 | 4,390,382 |
Fox Corp., Class A | 47,001 | 1,457,501 |
IAC, Inc. * | 9,434 | 448,681 |
Interpublic Group of Cos., Inc. | 49,326 | 1,501,483 |
Liberty Broadband Corp., Class C * | 16,941 | 842,476 |
Liberty Media Corp.-Liberty Formula One, Class C * | 27,498 | 1,924,035 |
Liberty Media Corp.-Liberty Live, Class C * | 8,341 | 311,286 |
Liberty Media Corp.-Liberty SiriusXM, Class C * | 29,076 | 699,569 |
Live Nation Entertainment, Inc. * | 20,010 | 1,779,089 |
Madison Square Garden Sports Corp. * | 2,367 | 440,073 |
Match Group, Inc. * | 34,768 | 1,071,550 |
New York Times Co., Class A | 20,726 | 891,840 |
News Corp., Class A | 64,071 | 1,524,890 |
Nexstar Media Group, Inc., Class A | 4,112 | 658,167 |
Omnicom Group, Inc. | 25,232 | 2,342,539 |
Paramount Global, Class B | 76,191 | 867,815 |
SECURITY | NUMBER OF SHARES | VALUE ($) |
Pinterest, Inc., Class A * | 74,850 | 2,503,732 |
Playtika Holding Corp. | 3,522 | 25,534 |
ROBLOX Corp., Class A * | 60,106 | 2,137,369 |
Roku, Inc. * | 16,039 | 924,809 |
Sirius XM Holdings, Inc. (a) | 82,117 | 241,424 |
Spotify Technology SA * | 17,930 | 5,028,289 |
Take-Two Interactive Software, Inc. * | 21,091 | 3,012,006 |
TKO Group Holdings, Inc. | 7,869 | 744,958 |
Trade Desk, Inc., Class A * | 56,368 | 4,670,089 |
TripAdvisor, Inc. * | 13,690 | 360,458 |
Warner Bros Discovery, Inc. * | 281,825 | 2,074,232 |
ZoomInfo Technologies, Inc., Class A * | 38,318 | 607,723 |
43,860,415 | ||
Pharmaceuticals, Biotechnology & Life Sciences 4.7% | ||
10X Genomics, Inc., Class A * | 11,690 | 342,283 |
Agilent Technologies, Inc. | 37,378 | 5,122,281 |
Alnylam Pharmaceuticals, Inc. * | 16,032 | 2,307,806 |
Apellis Pharmaceuticals, Inc. * | 12,869 | 568,681 |
Avantor, Inc. * | 86,279 | 2,090,540 |
Azenta, Inc. * | 7,006 | 367,535 |
Biogen, Inc. * | 18,429 | 3,958,918 |
BioMarin Pharmaceutical, Inc. * | 23,929 | 1,932,506 |
Bio-Rad Laboratories, Inc., Class A * | 2,620 | 706,745 |
Bio-Techne Corp. | 19,929 | 1,259,712 |
Bruker Corp. | 12,840 | 1,001,648 |
Catalent, Inc. * | 23,030 | 1,286,226 |
Charles River Laboratories International, Inc. * | 6,495 | 1,487,355 |
Elanco Animal Health, Inc. * | 62,401 | 821,197 |
Exact Sciences Corp. * | 22,859 | 1,356,682 |
Exelixis, Inc. * | 39,103 | 917,356 |
Fortrea Holdings, Inc. * | 11,331 | 414,601 |
ICON PLC, ADR * | 10,422 | 3,104,505 |
Illumina, Inc. * | 20,224 | 2,488,563 |
Incyte Corp. * | 23,614 | 1,229,109 |
Ionis Pharmaceuticals, Inc. * | 18,131 | 748,085 |
IQVIA Holdings, Inc. * | 23,274 | 5,394,215 |
Jazz Pharmaceuticals PLC * | 7,774 | 860,971 |
Maravai LifeSciences Holdings, Inc., Class A * | 13,920 | 114,144 |
Medpace Holdings, Inc. * | 2,985 | 1,159,225 |
Mettler-Toledo International, Inc. * | 2,737 | 3,365,689 |
Natera, Inc. * | 13,934 | 1,294,190 |
Neurocrine Biosciences, Inc. * | 12,360 | 1,699,994 |
Organon & Co. | 32,532 | 605,421 |
Perrigo Co. PLC | 17,178 | 561,033 |
QIAGEN NV * | 28,316 | 1,198,616 |
Repligen Corp. * | 7,112 | 1,167,790 |
Revvity, Inc. | 15,863 | 1,625,482 |
Roivant Sciences Ltd. * | 46,305 | 504,725 |
Royalty Pharma PLC, Class A | 47,545 | 1,316,997 |
Sarepta Therapeutics, Inc. * | 11,446 | 1,449,750 |
Sotera Health Co. * | 15,718 | 176,042 |
Ultragenyx Pharmaceutical, Inc. * | 10,010 | 425,825 |
United Therapeutics Corp. * | 5,779 | 1,354,193 |
Viatris, Inc. | 152,980 | 1,769,979 |
Waters Corp. * | 7,489 | 2,314,401 |
West Pharmaceutical Services, Inc. | 9,465 | 3,383,548 |
65,254,564 | ||
Real Estate Management & Development 0.8% | ||
CBRE Group, Inc., Class A * | 38,854 | 3,376,024 |
CoStar Group, Inc. * | 51,708 | 4,732,833 |
Howard Hughes Holdings, Inc. * | 4,288 | 279,406 |
Jones Lang LaSalle, Inc. * | 6,073 | 1,097,391 |
SECURITY | NUMBER OF SHARES | VALUE ($) |
Zillow Group, Inc., Class C * | 26,563 | 1,130,787 |
10,616,441 | ||
Semiconductors & Semiconductor Equipment 2.8% | ||
Allegro MicroSystems, Inc. * | 9,636 | 286,093 |
Cirrus Logic, Inc. * | 6,856 | 607,236 |
Enphase Energy, Inc. * | 17,019 | 1,850,986 |
Entegris, Inc. | 19,094 | 2,537,975 |
First Solar, Inc. * | 13,610 | 2,399,443 |
GLOBALFOUNDRIES, Inc. * | 9,988 | 488,213 |
Lattice Semiconductor Corp. * | 17,444 | 1,196,658 |
Marvell Technology, Inc. | 109,324 | 7,205,545 |
Microchip Technology, Inc. | 67,954 | 6,250,409 |
MKS Instruments, Inc. | 8,509 | 1,012,401 |
Monolithic Power Systems, Inc. | 5,877 | 3,933,652 |
ON Semiconductor Corp. * | 55,154 | 3,869,605 |
Qorvo, Inc. * | 12,527 | 1,463,655 |
Skyworks Solutions, Inc. | 20,333 | 2,167,294 |
Teradyne, Inc. | 19,708 | 2,292,435 |
Universal Display Corp. | 5,994 | 946,932 |
Wolfspeed, Inc. * | 15,940 | 430,858 |
38,939,390 | ||
Software & Services 6.6% | ||
Akamai Technologies, Inc. * | 19,099 | 1,927,662 |
Amdocs Ltd. | 14,740 | 1,238,013 |
ANSYS, Inc. * | 11,100 | 3,606,168 |
AppLovin Corp., Class A * | 25,681 | 1,812,308 |
Aspen Technology, Inc. * | 3,497 | 688,454 |
Bentley Systems, Inc., Class B | 24,901 | 1,308,050 |
Bill Holdings, Inc. * | 13,063 | 814,609 |
CCC Intelligent Solutions Holdings, Inc. * | 43,322 | 486,073 |
Cloudflare, Inc., Class A * | 37,591 | 3,285,453 |
Cognizant Technology Solutions Corp., Class A | 64,207 | 4,217,116 |
Confluent, Inc., Class A * | 24,393 | 685,931 |
Crowdstrike Holdings, Inc., Class A * | 27,303 | 7,987,220 |
Datadog, Inc., Class A * | 35,624 | 4,470,812 |
DocuSign, Inc., Class A * | 25,885 | 1,465,091 |
Dolby Laboratories, Inc., Class A | 7,438 | 577,635 |
DoubleVerify Holdings, Inc. * | 17,911 | 524,792 |
Dropbox, Inc., Class A * | 32,497 | 752,630 |
DXC Technology Co. * | 24,691 | 481,228 |
Dynatrace, Inc. * | 33,034 | 1,496,771 |
Elastic NV * | 10,291 | 1,051,946 |
EPAM Systems, Inc. * | 7,112 | 1,673,169 |
Fair Isaac Corp. * | 3,099 | 3,512,190 |
Five9, Inc. * | 9,209 | 530,162 |
Gartner, Inc. * | 9,666 | 3,988,095 |
Gen Digital, Inc. | 70,895 | 1,427,825 |
Gitlab, Inc., Class A * | 11,576 | 607,393 |
Globant SA * | 5,289 | 944,562 |
GoDaddy, Inc., Class A * | 18,007 | 2,203,697 |
Guidewire Software, Inc. * | 10,448 | 1,153,459 |
HashiCorp, Inc., Class A * | 12,331 | 400,264 |
HubSpot, Inc. * | 5,928 | 3,585,669 |
Informatica, Inc., Class A * | 5,569 | 172,472 |
Kyndryl Holdings, Inc. * | 28,915 | 568,469 |
Manhattan Associates, Inc. * | 7,882 | 1,624,165 |
MongoDB, Inc., Class A * | 8,657 | 3,161,363 |
nCino, Inc. * | 9,093 | 265,152 |
NCR Voyix Corp. * | 16,287 | 199,516 |
Nutanix, Inc., Class A * | 31,065 | 1,885,645 |
Okta, Inc. * | 19,548 | 1,817,573 |
Palantir Technologies, Inc., Class A * | 246,275 | 5,410,662 |
Pegasystems, Inc. | 5,310 | 315,520 |
SECURITY | NUMBER OF SHARES | VALUE ($) |
Procore Technologies, Inc. * | 10,134 | 693,368 |
PTC, Inc. * | 14,650 | 2,599,496 |
RingCentral, Inc., Class A * | 10,598 | 313,913 |
SentinelOne, Inc., Class A * | 30,560 | 645,733 |
Smartsheet, Inc., Class A * | 16,289 | 616,213 |
Teradata Corp. * | 12,374 | 459,075 |
Twilio, Inc., Class A * | 21,675 | 1,297,899 |
Tyler Technologies, Inc. * | 5,323 | 2,456,831 |
UiPath, Inc., Class A * | 48,815 | 926,021 |
Unity Software, Inc. * | 37,370 | 906,970 |
VeriSign, Inc. * | 11,353 | 1,924,106 |
Zoom Video Communications, Inc., Class A * | 32,973 | 2,014,650 |
Zscaler, Inc. * | 11,318 | 1,957,335 |
91,136,594 | ||
Technology Hardware & Equipment 3.7% | ||
Amphenol Corp., Class A | 74,590 | 9,008,234 |
Arrow Electronics, Inc. * | 6,918 | 883,221 |
Avnet, Inc. | 11,570 | 565,426 |
CDW Corp. | 17,288 | 4,181,276 |
Ciena Corp. * | 18,340 | 847,858 |
Cognex Corp. | 22,170 | 920,942 |
Coherent Corp. * | 16,664 | 910,354 |
Corning, Inc. | 97,285 | 3,247,373 |
Crane NXT Co. | 6,200 | 377,022 |
F5, Inc. * | 7,567 | 1,250,901 |
Hewlett Packard Enterprise Co. | 165,949 | 2,821,133 |
HP, Inc. | 110,520 | 3,104,507 |
IPG Photonics Corp. * | 3,802 | 319,292 |
Jabil, Inc. | 15,945 | 1,871,305 |
Juniper Networks, Inc. | 40,737 | 1,418,462 |
Keysight Technologies, Inc. * | 22,301 | 3,299,210 |
Littelfuse, Inc. | 3,081 | 710,602 |
Lumentum Holdings, Inc. * | 8,611 | 376,817 |
NetApp, Inc. | 26,342 | 2,692,416 |
Pure Storage, Inc., Class A * | 36,882 | 1,858,853 |
TD SYNNEX Corp. | 8,685 | 1,023,441 |
Teledyne Technologies, Inc. * | 5,959 | 2,273,239 |
Trimble, Inc. * | 31,508 | 1,892,686 |
Ubiquiti, Inc. | 524 | 56,372 |
Viasat, Inc. * | 15,052 | 239,477 |
Vontier Corp. | 19,816 | 805,124 |
Western Digital Corp. * | 41,471 | 2,937,391 |
Zebra Technologies Corp., Class A * | 6,545 | 2,058,795 |
51,951,729 | ||
Telecommunication Services 0.1% | ||
Frontier Communications Parent, Inc. * | 31,174 | 721,366 |
GCI Liberty, Inc. *(b) | 6,049 | 0 |
Iridium Communications, Inc. | 15,617 | 480,848 |
1,202,214 | ||
Transportation 2.0% | ||
Alaska Air Group, Inc. * | 15,790 | 679,286 |
American Airlines Group, Inc. * | 83,226 | 1,124,383 |
Avis Budget Group, Inc. | 2,409 | 229,939 |
CH Robinson Worldwide, Inc. | 14,741 | 1,046,611 |
Delta Air Lines, Inc. | 82,079 | 4,109,695 |
Expeditors International of Washington, Inc. | 18,510 | 2,060,348 |
GXO Logistics, Inc. * | 14,900 | 739,934 |
Hertz Global Holdings, Inc. * | 17,232 | 78,406 |
JB Hunt Transport Services, Inc. | 10,528 | 1,711,537 |
Kirby Corp. * | 7,504 | 818,911 |
SECURITY | NUMBER OF SHARES | VALUE ($) |
Knight-Swift Transportation Holdings, Inc. | 20,038 | 926,357 |
Landstar System, Inc. | 4,554 | 794,263 |
Lyft, Inc., Class A * | 44,514 | 696,199 |
Old Dominion Freight Line, Inc. | 25,235 | 4,585,452 |
Ryder System, Inc. | 5,569 | 678,583 |
Saia, Inc. * | 3,399 | 1,348,825 |
Schneider National, Inc., Class B | 6,960 | 143,933 |
Southwest Airlines Co. | 76,022 | 1,972,011 |
U-Haul Holding Co. * | 993 | 62,787 |
U-Haul Holding Co. - Non Voting | 12,774 | 783,302 |
United Airlines Holdings, Inc. * | 41,774 | 2,149,690 |
XPO, Inc. * | 14,569 | 1,565,585 |
28,306,037 | ||
Utilities 5.4% | ||
AES Corp. | 85,484 | 1,530,164 |
Alliant Energy Corp. | 32,632 | 1,625,074 |
Ameren Corp. | 33,494 | 2,474,202 |
American Water Works Co., Inc. | 24,923 | 3,048,581 |
Atmos Energy Corp. | 19,264 | 2,271,226 |
Avangrid, Inc. | 9,096 | 332,277 |
Brookfield Renewable Corp., Class A | 17,147 | 398,496 |
CenterPoint Energy, Inc. | 80,718 | 2,352,122 |
Clearway Energy, Inc., Class C | 14,597 | 341,278 |
CMS Energy Corp. | 37,198 | 2,254,571 |
Consolidated Edison, Inc. | 44,386 | 4,190,038 |
Constellation Energy Corp. | 41,151 | 7,651,617 |
DTE Energy Co. | 26,351 | 2,907,042 |
Edison International | 48,347 | 3,435,538 |
Entergy Corp. | 27,072 | 2,887,770 |
Essential Utilities, Inc. | 32,141 | 1,175,718 |
Evergy, Inc. | 28,500 | 1,494,825 |
Eversource Energy | 44,586 | 2,702,803 |
FirstEnergy Corp. | 69,654 | 2,670,534 |
Hawaiian Electric Industries, Inc. | 13,885 | 136,767 |
IDACORP, Inc. | 6,429 | 609,341 |
National Fuel Gas Co. | 11,311 | 600,614 |
NiSource, Inc. | 52,909 | 1,474,045 |
NRG Energy, Inc. | 28,681 | 2,084,248 |
OGE Energy Corp. | 25,458 | 882,120 |
PG&E Corp. | 260,597 | 4,458,815 |
Pinnacle West Capital Corp. | 14,515 | 1,069,030 |
PPL Corp. | 94,403 | 2,592,306 |
Public Service Enterprise Group, Inc. | 63,613 | 4,394,386 |
UGI Corp. | 26,604 | 679,998 |
Vistra Corp. | 45,186 | 3,426,906 |
WEC Energy Group, Inc. | 40,364 | 3,335,681 |
Xcel Energy, Inc. | 70,483 | 3,787,052 |
75,275,185 | ||
Total Common Stocks (Cost $1,127,024,666) | 1,383,590,279 | |
INVESTMENT COMPANIES 0.1% OF NET ASSETS | ||
Equity Funds 0.1% | ||
iShares Russell Mid-Cap ETF | 25,500 | 2,030,310 |
Total Investment Companies (Cost $1,810,650) | 2,030,310 | |
SECURITY | NUMBER OF SHARES | VALUE ($) |
SHORT-TERM INVESTMENTS 0.8% OF NET ASSETS | ||
Money Market Funds 0.8% | ||
State Street Institutional U.S. Government Money Market Fund, Premier Class 5.25% (c) | 8,229,710 | 8,229,710 |
State Street Institutional U.S. Government Money Market Fund, Premier Class 5.25% (c)(d) | 2,391,088 | 2,391,088 |
10,620,798 | ||
Total Short-Term Investments (Cost $10,620,798) | 10,620,798 | |
Total Investments in Securities (Cost $1,139,456,114) | 1,396,241,387 | |
NUMBER OF CONTRACTS | NOTIONAL AMOUNT ($) | CURRENT VALUE/ UNREALIZED DEPRECIATION ($) | |
FUTURES CONTRACTS | |||
Long | |||
S&P 400 Mid-Cap Index, e-mini, expires 06/21/24 | 11 | 3,164,920 | (33,305 ) |
* | Non-income producing security. |
(a) | All or a portion of this security is on loan. Securities on loan were valued at $2,204,365. |
(b) | Fair valued using significant unobservable inputs (see financial note 2(a), Securities for which no quoted value is available, for additional information). |
(c) | The rate shown is the annualized 7-day yield. |
(d) | Security purchased with cash collateral received for securities on loan. |
ADR — | American Depositary Receipt |
ETF — | Exchange-Traded Fund |
REIT — | Real Estate Investment Trust |
DESCRIPTION | QUOTED PRICES IN ACTIVE MARKETS FOR IDENTICAL ASSETS (LEVEL 1) | OTHER SIGNIFICANT OBSERVABLE INPUTS (LEVEL 2) | SIGNIFICANT UNOBSERVABLE INPUTS (LEVEL 3) | TOTAL |
Assets | ||||
Common Stocks1 | $1,382,388,065 | $— | $— | $1,382,388,065 |
Telecommunication Services | 1,202,214 | — | 0 * | 1,202,214 |
Investment Companies1 | 2,030,310 | — | — | 2,030,310 |
Short-Term Investments1 | 10,620,798 | — | — | 10,620,798 |
Liabilities | ||||
Futures Contracts2 | (33,305 ) | — | — | (33,305 ) |
Total | $1,396,208,082 | $— | $0 | $1,396,208,082 |
* | Level 3 amount shown includes securities determined to have no value at April 30, 2024. |
1 | As categorized in the Portfolio Holdings. |
2 | Futures contracts are reported at cumulative unrealized appreciation or depreciation. |
Assets | ||
Investments in securities, at value - unaffiliated issuers (cost $1,139,456,114) including securities on loan of $2,204,365 | $1,396,241,387 | |
Deposit with broker for futures contracts | 347,300 | |
Receivables: | ||
Fund shares sold | 941,202 | |
Dividends | 630,878 | |
Income from securities on loan | + | 9,874 |
Total assets | 1,398,170,641 | |
Liabilities | ||
Collateral held for securities on loan | 2,391,088 | |
Payables: | ||
Investments bought | 5,516,395 | |
Fund shares redeemed | 737,475 | |
Variation margin on futures contracts | 61,002 | |
Investment adviser fees | + | 45,668 |
Total liabilities | 8,751,628 | |
Net assets | $1,389,419,013 | |
Net Assets by Source | ||
Capital received from investors | $1,177,433,103 | |
Total distributable earnings | + | 211,985,910 |
Net assets | $1,389,419,013 | |
Net Asset Value (NAV) | ||||
Net Assets | ÷ | Shares Outstanding | = | NAV |
$1,389,419,013 | 22,900,177 | $60.67 | ||
For the period November 1, 2023 through April 30, 2024; unaudited | ||
Investment Income | ||
Dividends received from securities - unaffiliated issuers (net of foreign withholding tax of $5,220) | $11,181,405 | |
Other interest | 9,289 | |
Securities on loan, net | + | 89,885 |
Total investment income | 11,280,579 | |
Expenses | ||
Investment adviser fees | 255,124 | |
Total expenses | – | 255,124 |
Net investment income | 11,025,455 | |
REALIZED AND UNREALIZED GAINS (LOSSES) | ||
Net realized losses on sales of securities - unaffiliated issuers | (5,259,138 ) | |
Net realized gains on futures contracts | + | 1,150,615 |
Net realized losses | (4,108,523 ) | |
Net change in unrealized appreciation (depreciation) on securities - unaffiliated issuers | 226,387,834 | |
Net change in unrealized appreciation (depreciation) on futures contracts | + | (53,199 ) |
Net change in unrealized appreciation (depreciation) | + | 226,334,635 |
Net realized and unrealized gains | 222,226,112 | |
Increase in net assets resulting from operations | $233,251,567 | |
OPERATIONS | |||
11/1/23-4/30/24 | 11/1/22-10/31/23 | ||
Net investment income | $11,025,455 | $17,187,964 | |
Net realized gains (losses) | (4,108,523 ) | 3,084,904 | |
Net change in unrealized appreciation (depreciation) | + | 226,334,635 | (41,931,352 ) |
Increase (decrease) in net assets resulting from operations | $233,251,567 | ($21,658,484 ) | |
DISTRIBUTIONS TO SHAREHOLDERS | |||
Total distributions | ($18,556,015 ) | ($14,308,048 ) | |
TRANSACTIONS IN FUND SHARES | |||||
11/1/23-4/30/24 | 11/1/22-10/31/23 | ||||
SHARES | VALUE | SHARES | VALUE | ||
Shares sold | 4,143,809 | $246,581,438 | 7,273,631 | $391,888,488 | |
Shares reinvested | 274,351 | 15,325,220 | 225,612 | 11,761,152 | |
Shares redeemed | + | (2,554,427 ) | (150,017,663 ) | (3,886,346 ) | (208,151,675 ) |
Net transactions in fund shares | 1,863,733 | $111,888,995 | 3,612,897 | $195,497,965 | |
SHARES OUTSTANDING AND NET ASSETS | |||||
11/1/23-4/30/24 | 11/1/22-10/31/23 | ||||
SHARES | NET ASSETS | SHARES | NET ASSETS | ||
Beginning of period | 21,036,444 | $1,062,834,466 | 17,423,547 | $903,303,033 | |
Total increase | + | 1,863,733 | 326,584,547 | 3,612,897 | 159,531,433 |
End of period | 22,900,177 | $1,389,419,013 | 21,036,444 | $1,062,834,466 | |
11/1/23– 4/30/24* | 11/1/22– 10/31/23 | 11/1/21– 10/31/22 | 11/1/20– 10/31/21 | 11/1/19– 10/31/20 | 11/1/18– 10/31/19 | |
Per-Share Data | ||||||
Net asset value at beginning of period | $20.39 | $18.17 | $24.45 | $18.56 | $20.48 | $19.00 |
Income (loss) from investment operations: | ||||||
Net investment income (loss)1 | 0.33 | 0.63 | 0.65 | 0.64 | 0.47 | 0.64 |
Net realized and unrealized gains (losses) | 3.13 | 2.13 | (6.14 ) | 5.66 | (1.75 ) | 1.39 |
Total from investment operations | 3.46 | 2.76 | (5.49 ) | 6.30 | (1.28 ) | 2.03 |
Less distributions: | ||||||
Distributions from net investment income | (0.75 ) | (0.54 ) | (0.79 ) | (0.41 ) | (0.64 ) | (0.55 ) |
Net asset value at end of period | $23.10 | $20.39 | $18.17 | $24.45 | $18.56 | $20.48 |
Total return | 17.14 %2 | 15.30 % | (23.12 %) | 34.24 % | (6.56 %) | 11.27 % |
Ratios/Supplemental Data | ||||||
Ratios to average net assets: | ||||||
Total expenses | 0.06 %3 | 0.06 % | 0.06 %4 | 0.06 % | 0.06 % | 0.06 % |
Net investment income (loss) | 2.95 %3 | 2.99 % | 3.12 % | 2.76 % | 2.47 % | 3.32 % |
Portfolio turnover rate | 5 %2 | 13 % | 5 % | 3 % | 7 % | 5 % |
Net assets, end of period (x 1,000,000) | $9,201 | $7,952 | $7,127 | $8,781 | $5,937 | $5,443 |
* | Unaudited. |
1 | Calculated based on the average shares outstanding during the period. |
2 | Not annualized. |
3 | Annualized. |
4 | Ratio includes less than 0.005% of non-routine proxy expenses. |
SECURITY | NUMBER OF SHARES | VALUE ($) |
COMMON STOCKS 98.6% OF NET ASSETS | ||
Australia 7.1% | ||
Ampol Ltd. | 133,836 | 3,160,375 |
ANZ Group Holdings Ltd. | 1,683,718 | 30,380,881 |
APA Group | 719,031 | 3,837,094 |
Aristocrat Leisure Ltd. | 321,427 | 8,202,814 |
ASX Ltd. | 111,056 | 4,536,652 |
Aurizon Holdings Ltd. | 1,016,278 | 2,496,234 |
BHP Group Ltd. | 2,838,556 | 77,850,551 |
BlueScope Steel Ltd. | 252,027 | 3,678,439 |
Brambles Ltd. | 780,902 | 7,346,451 |
CAR Group Ltd. | 199,064 | 4,316,405 |
Cochlear Ltd. | 36,310 | 7,574,555 |
Coles Group Ltd. | 752,919 | 7,852,356 |
Commonwealth Bank of Australia | 941,512 | 68,984,147 |
Computershare Ltd. | 304,476 | 5,349,147 |
CSL Ltd. | 269,733 | 47,925,102 |
Dexus | 594,607 | 2,700,830 |
Endeavour Group Ltd. | 783,846 | 2,695,570 |
Fortescue Ltd. | 942,785 | 15,626,137 |
Goodman Group | 952,115 | 19,232,368 |
GPT Group | 1,082,941 | 2,912,497 |
IDP Education Ltd. | 146,593 | 1,528,509 |
Insurance Australia Group Ltd. | 1,352,881 | 5,604,954 |
James Hardie Industries PLC * | 242,907 | 8,350,646 |
Lottery Corp. Ltd. | 1,224,049 | 3,818,410 |
Macquarie Group Ltd. | 207,771 | 24,878,191 |
Medibank Pvt Ltd. | 1,567,393 | 3,592,243 |
Mineral Resources Ltd. | 96,450 | 4,375,195 |
Mirvac Group | 2,301,362 | 3,015,402 |
National Australia Bank Ltd. | 1,741,695 | 37,755,628 |
Northern Star Resources Ltd. | 640,005 | 6,066,438 |
Orica Ltd. | 266,888 | 3,090,225 |
Origin Energy Ltd. | 961,326 | 6,067,327 |
Pilbara Minerals Ltd. | 1,574,885 | 4,009,505 |
Qantas Airways Ltd. * | 509,239 | 1,921,310 |
QBE Insurance Group Ltd. | 841,092 | 9,621,225 |
Ramsay Health Care Ltd. | 102,855 | 3,447,722 |
REA Group Ltd. | 29,385 | 3,368,345 |
Reece Ltd. | 129,225 | 2,292,407 |
Rio Tinto Ltd. | 204,649 | 17,031,776 |
Santos Ltd. | 1,835,861 | 9,009,238 |
Scentre Group | 2,915,076 | 5,903,174 |
SEEK Ltd. | 198,291 | 3,063,164 |
Seven Group Holdings Ltd. | 94,664 | 2,300,250 |
Sonic Healthcare Ltd. | 250,950 | 4,312,745 |
South32 Ltd. | 2,515,262 | 5,738,522 |
Stockland | 1,336,324 | 3,785,961 |
Suncorp Group Ltd. | 705,053 | 7,530,258 |
Telstra Group Ltd. | 2,239,543 | 5,291,173 |
Transurban Group | 1,712,797 | 13,751,120 |
Treasury Wine Estates Ltd. | 453,382 | 3,516,071 |
Vicinity Ltd. | 2,160,138 | 2,645,238 |
Washington H Soul Pattinson & Co. Ltd. | 134,635 | 2,817,586 |
Wesfarmers Ltd. | 633,533 | 27,140,064 |
SECURITY | NUMBER OF SHARES | VALUE ($) |
Westpac Banking Corp. | 1,954,287 | 32,453,561 |
WiseTech Global Ltd. | 91,970 | 5,418,186 |
Woodside Energy Group Ltd. | 1,054,412 | 18,891,905 |
Woolworths Group Ltd. | 679,868 | 13,948,928 |
Xero Ltd. * | 79,724 | 6,189,627 |
650,200,834 | ||
Austria 0.2% | ||
Erste Group Bank AG | 194,372 | 9,064,553 |
OMV AG | 81,452 | 3,865,012 |
Verbund AG | 37,628 | 2,874,446 |
voestalpine AG | 64,179 | 1,713,905 |
17,517,916 | ||
Belgium 0.9% | ||
Ageas SA | 88,604 | 4,067,062 |
Anheuser-Busch InBev SA | 489,276 | 29,245,876 |
Argenx SE * | 33,076 | 12,355,996 |
D'ieteren Group | 12,348 | 2,663,742 |
Elia Group SA | 16,766 | 1,614,257 |
Groupe Bruxelles Lambert NV | 47,505 | 3,526,295 |
KBC Group NV | 140,426 | 10,431,427 |
Lotus Bakeries NV | 237 | 2,385,097 |
Sofina SA | 8,336 | 1,951,301 |
Syensqo SA * | 41,006 | 3,800,913 |
UCB SA | 69,915 | 9,271,437 |
Umicore SA | 114,477 | 2,535,692 |
Warehouses De Pauw CVA | 99,112 | 2,620,953 |
86,470,048 | ||
Denmark 3.7% | ||
AP Moller - Maersk AS, Class A | 1,811 | 2,568,339 |
AP Moller - Maersk AS, Class B | 2,259 | 3,273,445 |
Carlsberg AS, Class B | 54,925 | 7,388,118 |
Coloplast AS, Class B | 69,549 | 8,385,182 |
Danske Bank AS | 386,447 | 11,124,645 |
Demant AS * | 57,455 | 2,743,589 |
DSV AS | 97,637 | 13,871,229 |
Genmab AS * | 36,909 | 10,247,042 |
Novo Nordisk AS, Class B | 1,825,796 | 234,144,085 |
Novonesis (Novozymes) B, Class B | 209,105 | 11,579,547 |
Orsted AS * | 104,926 | 5,766,556 |
Pandora AS | 46,798 | 7,122,650 |
Rockwool AS, B Shares | 4,990 | 1,626,684 |
Svitzer AS * | 8,140 | 273,531 |
Tryg AS | 196,999 | 3,899,049 |
Vestas Wind Systems AS * | 562,004 | 15,060,939 |
339,074,630 | ||
Finland 1.0% | ||
Elisa OYJ | 77,986 | 3,516,339 |
Fortum OYJ | 256,373 | 3,378,328 |
Kesko OYJ, B Shares | 158,051 | 2,698,306 |
Kone OYJ, B Shares | 190,823 | 9,302,047 |
SECURITY | NUMBER OF SHARES | VALUE ($) |
Metso OYJ | 365,369 | 4,142,225 |
Neste OYJ | 235,108 | 5,329,691 |
Nokia OYJ | 2,978,297 | 10,827,156 |
Nordea Bank Abp | 1,756,819 | 20,586,856 |
Orion OYJ, B Shares | 59,753 | 2,282,272 |
Sampo OYJ, A Shares | 252,492 | 10,246,988 |
Stora Enso OYJ, R Shares | 321,685 | 4,285,046 |
UPM-Kymmene OYJ | 294,163 | 10,308,976 |
Wartsila OYJ Abp | 263,307 | 4,857,354 |
91,761,584 | ||
France 12.0% | ||
Accor SA | 106,011 | 4,646,004 |
Aeroports de Paris SA | 19,435 | 2,468,531 |
Air Liquide SA | 294,069 | 57,513,621 |
Airbus SE | 330,449 | 54,377,938 |
Alstom SA | 166,813 | 2,630,319 |
Amundi SA | 34,265 | 2,390,477 |
ArcelorMittal SA | 294,996 | 7,369,840 |
Arkema SA | 33,318 | 3,437,976 |
AXA SA | 1,022,833 | 35,340,492 |
BioMerieux | 23,113 | 2,457,003 |
BNP Paribas SA | 574,279 | 41,326,186 |
Bollore SE | 411,955 | 2,673,895 |
Bouygues SA | 108,472 | 3,997,767 |
Bureau Veritas SA | 181,258 | 5,286,504 |
Capgemini SE | 86,577 | 18,196,841 |
Carrefour SA | 322,783 | 5,430,251 |
Cie de Saint-Gobain SA | 253,465 | 20,044,682 |
Cie Generale des Etablissements Michelin SCA | 378,743 | 14,550,793 |
Covivio SA | 25,895 | 1,288,953 |
Credit Agricole SA | 590,596 | 9,138,430 |
Danone SA | 360,431 | 22,558,416 |
Dassault Aviation SA | 11,352 | 2,429,881 |
Dassault Systemes SE | 371,909 | 14,598,144 |
Edenred SE | 140,294 | 6,657,212 |
Eiffage SA | 40,776 | 4,350,735 |
Engie SA * | 1,017,886 | 17,671,121 |
EssilorLuxottica SA | 165,704 | 35,333,332 |
Eurazeo SE * | 23,823 | 2,145,919 |
Eurofins Scientific SE | 75,145 | 4,605,542 |
Euronext NV | 48,045 | 4,326,491 |
Gecina SA | 25,380 | 2,591,343 |
Getlink SE | 198,033 | 3,371,253 |
Hermes International SCA | 17,854 | 42,742,301 |
Ipsen SA | 21,442 | 2,608,126 |
Kering SA | 41,504 | 14,545,873 |
Klepierre SA | 123,079 | 3,304,967 |
La Francaise des Jeux SAEM | 57,938 | 2,183,379 |
Legrand SA | 146,623 | 15,067,949 |
L'Oreal SA | 134,251 | 62,944,004 |
LVMH Moet Hennessy Louis Vuitton SE | 153,938 | 126,450,217 |
Orange SA | 1,050,268 | 11,689,780 |
Pernod Ricard SA | 113,813 | 17,213,320 |
Publicis Groupe SA | 126,141 | 13,919,253 |
Remy Cointreau SA | 12,394 | 1,175,815 |
Renault SA | 106,554 | 5,277,975 |
Rexel SA | 122,721 | 3,180,909 |
Safran SA | 192,314 | 41,699,846 |
Sanofi SA | 634,966 | 62,730,231 |
Sartorius Stedim Biotech | 16,604 | 3,575,954 |
Schneider Electric SE | 305,393 | 69,633,689 |
SEB SA | 13,593 | 1,604,304 |
Societe Generale SA | 405,565 | 10,927,970 |
Sodexo SA | 49,028 | 4,269,036 |
SECURITY | NUMBER OF SHARES | VALUE ($) |
STMicroelectronics NV | 380,345 | 15,055,910 |
Teleperformance SE * | 31,410 | 2,845,266 |
Thales SA | 53,293 | 8,956,816 |
TotalEnergies SE | 1,215,685 | 88,257,221 |
Unibail-Rodamco-Westfield * | 67,215 | 5,601,224 |
Veolia Environnement SA | 384,560 | 11,955,083 |
Vinci SA | 281,545 | 32,990,347 |
Vivendi SE | 376,860 | 3,834,057 |
Worldline SA * | 133,552 | 1,385,268 |
1,102,831,982 | ||
Germany 8.1% | ||
adidas AG | 90,034 | 21,696,673 |
Allianz SE | 219,798 | 62,375,382 |
BASF SE | 498,150 | 26,101,342 |
Bayer AG | 547,372 | 15,967,216 |
Bayerische Motoren Werke AG | 177,125 | 19,297,643 |
Bechtle AG | 45,919 | 2,216,034 |
Beiersdorf AG | 56,220 | 8,450,067 |
Brenntag SE | 75,260 | 6,006,003 |
Carl Zeiss Meditec AG, Bearer Shares | 22,012 | 2,322,549 |
Commerzbank AG | 585,631 | 8,703,730 |
Continental AG | 61,267 | 3,970,793 |
Covestro AG * | 106,924 | 5,355,218 |
Daimler Truck Holding AG | 298,285 | 13,451,528 |
Delivery Hero SE * | 101,228 | 2,832,112 |
Deutsche Bank AG | 1,080,982 | 17,266,000 |
Deutsche Boerse AG | 106,144 | 20,463,707 |
Deutsche Lufthansa AG * | 348,156 | 2,491,623 |
Deutsche Post AG | 552,689 | 23,141,048 |
Deutsche Telekom AG | 1,806,939 | 41,388,956 |
E.ON SE | 1,254,839 | 16,616,537 |
Evonik Industries AG | 124,778 | 2,600,456 |
Fresenius Medical Care AG | 116,162 | 4,890,734 |
Fresenius SE & Co. KGaA | 234,428 | 6,995,420 |
GEA Group AG * | 92,105 | 3,717,356 |
Hannover Rueck SE | 33,690 | 8,356,601 |
Heidelberg Materials AG | 72,221 | 7,268,008 |
Henkel AG & Co. KGaA | 54,618 | 3,927,500 |
Infineon Technologies AG | 729,774 | 25,325,375 |
Knorr-Bremse AG | 41,353 | 3,068,622 |
LEG Immobilien SE * | 40,928 | 3,474,310 |
Mercedes-Benz Group AG | 446,834 | 33,798,920 |
Merck KGaA | 72,386 | 11,502,256 |
MTU Aero Engines AG | 29,813 | 7,182,456 |
Muenchener Rueckversicherungs-Gesellschaft AG in Muenchen | 75,993 | 33,422,372 |
Nemetschek SE | 32,032 | 2,830,644 |
Puma SE | 60,686 | 2,801,933 |
Qiagen NV * | 123,296 | 5,147,812 |
Rational AG | 2,983 | 2,544,492 |
Rheinmetall AG | 24,443 | 13,469,189 |
RWE AG | 354,367 | 12,344,564 |
SAP SE | 584,913 | 105,616,068 |
Scout24 SE | 42,169 | 3,097,636 |
Siemens AG | 425,692 | 79,746,371 |
Siemens Energy AG * | 287,879 | 5,911,149 |
Siemens Healthineers AG | 158,550 | 8,792,783 |
Symrise AG, Class A | 73,744 | 7,904,741 |
Talanx AG | 35,946 | 2,703,662 |
Volkswagen AG | 18,164 | 2,564,268 |
Vonovia SE | 409,809 | 11,841,851 |
Zalando SE * | 123,113 | 3,221,284 |
746,182,994 | ||
SECURITY | NUMBER OF SHARES | VALUE ($) |
Hong Kong 1.9% | ||
AIA Group Ltd. | 6,340,400 | 46,439,327 |
BOC Hong Kong Holdings Ltd. | 2,051,090 | 6,286,782 |
CK Asset Holdings Ltd. | 1,096,711 | 4,678,103 |
CK Hutchison Holdings Ltd. | 1,516,025 | 7,362,988 |
CK Infrastructure Holdings Ltd. | 347,500 | 1,963,075 |
CLP Holdings Ltd. | 916,926 | 7,212,597 |
ESR Group Ltd. | 957,134 | 1,048,894 |
Futu Holdings Ltd., ADR * | 31,008 | 1,994,124 |
Galaxy Entertainment Group Ltd. | 1,216,000 | 5,456,061 |
Hang Lung Properties Ltd. | 1,004,000 | 1,108,126 |
Hang Seng Bank Ltd. | 426,840 | 5,628,558 |
Henderson Land Development Co. Ltd. | 805,735 | 2,429,147 |
HKT Trust & HKT Ltd. | 2,099,000 | 2,317,248 |
Hong Kong & China Gas Co. Ltd. | 6,201,696 | 4,715,472 |
Hong Kong Exchanges & Clearing Ltd. | 671,465 | 21,335,404 |
Hongkong Land Holdings Ltd. | 598,001 | 1,910,720 |
Jardine Matheson Holdings Ltd. | 88,617 | 3,400,234 |
Link REIT | 1,442,540 | 6,180,984 |
MTR Corp. Ltd. | 884,860 | 2,908,036 |
Power Assets Holdings Ltd. | 782,938 | 4,491,050 |
Sands China Ltd. * | 1,402,000 | 3,306,819 |
Sino Land Co. Ltd. | 2,204,425 | 2,356,969 |
SITC International Holdings Co. Ltd. | 800,000 | 1,734,875 |
Sun Hung Kai Properties Ltd. | 808,604 | 7,459,337 |
Swire Pacific Ltd., A Shares | 242,590 | 2,054,424 |
Swire Properties Ltd. | 628,400 | 1,299,636 |
Techtronic Industries Co. Ltd. | 774,500 | 10,703,040 |
WH Group Ltd. | 4,787,789 | 3,479,956 |
Wharf Holdings Ltd. | 591,000 | 1,901,458 |
Wharf Real Estate Investment Co. Ltd. | 930,188 | 2,885,920 |
176,049,364 | ||
Ireland 0.4% | ||
AIB Group PLC | 874,775 | 4,527,986 |
Bank of Ireland Group PLC | 594,169 | 6,339,445 |
Kerry Group PLC, Class A | 87,322 | 7,514,790 |
Kingspan Group PLC | 86,756 | 7,716,737 |
Smurfit Kappa Group PLC | 145,625 | 6,309,867 |
32,408,825 | ||
Israel 0.7% | ||
Azrieli Group Ltd. | 23,908 | 1,538,248 |
Bank Hapoalim BM | 705,600 | 6,356,345 |
Bank Leumi Le-Israel BM | 851,946 | 6,638,456 |
Check Point Software Technologies Ltd. * | 52,575 | 7,855,757 |
CyberArk Software Ltd. * | 23,395 | 5,597,254 |
Elbit Systems Ltd. | 14,715 | 2,995,351 |
Global-e Online Ltd. * | 55,716 | 1,868,157 |
ICL Group Ltd. | 422,222 | 1,981,897 |
Israel Discount Bank Ltd., A Shares | 675,813 | 3,466,395 |
Mizrahi Tefahot Bank Ltd. | 84,528 | 3,078,022 |
Monday.com Ltd. * | 16,008 | 3,030,795 |
Nice Ltd. * | 35,795 | 8,004,131 |
Teva Pharmaceutical Industries Ltd., ADR * | 630,039 | 8,852,048 |
Wix.com Ltd. * | 29,969 | 3,562,415 |
64,825,271 | ||
Italy 2.7% | ||
Amplifon SpA | 70,734 | 2,361,547 |
Assicurazioni Generali SpA | 566,160 | 13,804,362 |
Banco BPM SpA | 668,039 | 4,386,104 |
SECURITY | NUMBER OF SHARES | VALUE ($) |
Davide Campari-Milano NV | 347,322 | 3,483,223 |
DiaSorin SpA | 13,747 | 1,388,410 |
Enel SpA | 4,526,029 | 29,747,059 |
Eni SpA | 1,221,500 | 19,619,351 |
Ferrari NV | 70,173 | 28,860,373 |
FinecoBank Banca Fineco SpA | 338,015 | 5,178,309 |
Infrastrutture Wireless Italiane SpA | 180,279 | 1,932,038 |
Intesa Sanpaolo SpA | 8,279,996 | 30,992,069 |
Leonardo SpA | 224,665 | 5,163,262 |
Mediobanca Banca di Credito Finanziario SpA | 312,469 | 4,439,592 |
Moncler SpA | 113,434 | 7,722,833 |
Nexi SpA * | 326,368 | 1,898,860 |
Poste Italiane SpA | 252,540 | 3,208,046 |
Prysmian SpA | 145,137 | 7,874,893 |
Recordati Industria Chimica e Farmaceutica SpA | 60,695 | 3,229,785 |
Snam SpA | 1,162,786 | 5,320,061 |
Stellantis NV | 1,240,217 | 27,441,657 |
Telecom Italia SpA *(a) | 5,362,285 | 1,271,266 |
Tenaris SA | 268,174 | 4,453,620 |
Terna - Rete Elettrica Nazionale | 780,635 | 6,254,378 |
UniCredit SpA | 859,462 | 31,546,008 |
251,577,106 | ||
Japan 22.8% | ||
Advantest Corp. | 430,792 | 13,484,071 |
Aeon Co. Ltd. | 368,400 | 7,702,617 |
AGC, Inc. | 110,893 | 4,100,183 |
Aisin Corp. | 85,900 | 3,267,313 |
Ajinomoto Co., Inc. | 262,900 | 9,775,003 |
ANA Holdings, Inc. | 93,400 | 1,773,853 |
Asahi Group Holdings Ltd. | 267,200 | 9,140,633 |
Asahi Intecc Co. Ltd. | 121,700 | 1,783,232 |
Asahi Kasei Corp. | 709,200 | 4,944,636 |
Astellas Pharma, Inc. | 1,002,450 | 9,621,410 |
Azbil Corp. | 69,200 | 1,932,756 |
Bandai Namco Holdings, Inc. | 332,400 | 6,210,952 |
Bridgestone Corp. | 314,857 | 13,893,689 |
Brother Industries Ltd. | 127,700 | 2,258,880 |
Canon, Inc. | 556,295 | 15,056,286 |
Capcom Co. Ltd. | 200,800 | 3,305,657 |
Central Japan Railway Co. | 431,300 | 9,862,958 |
Chiba Bank Ltd. | 293,000 | 2,474,989 |
Chubu Electric Power Co., Inc. | 357,300 | 4,586,287 |
Chugai Pharmaceutical Co. Ltd. | 375,700 | 11,948,703 |
Concordia Financial Group Ltd. | 586,700 | 3,161,219 |
Dai Nippon Printing Co. Ltd. | 115,048 | 3,350,900 |
Daifuku Co. Ltd. | 166,190 | 3,404,203 |
Dai-ichi Life Holdings, Inc. | 519,900 | 12,041,421 |
Daiichi Sankyo Co. Ltd. | 1,031,000 | 34,701,073 |
Daikin Industries Ltd. | 147,900 | 20,187,062 |
Daito Trust Construction Co. Ltd. | 32,400 | 3,473,096 |
Daiwa House Industry Co. Ltd. | 329,900 | 9,283,023 |
Daiwa Securities Group, Inc. | 737,000 | 5,416,256 |
Denso Corp. | 1,051,400 | 17,919,134 |
Dentsu Group, Inc. | 111,900 | 3,027,250 |
Disco Corp. | 51,500 | 14,669,554 |
East Japan Railway Co. | 509,880 | 9,345,571 |
Eisai Co. Ltd. | 141,700 | 5,819,481 |
ENEOS Holdings, Inc. | 1,604,400 | 7,412,667 |
FANUC Corp. | 531,700 | 15,748,573 |
Fast Retailing Co. Ltd. | 97,800 | 25,571,670 |
Fuji Electric Co. Ltd. | 72,200 | 4,491,121 |
FUJIFILM Holdings Corp. | 625,133 | 13,298,127 |
Fujitsu Ltd. | 982,900 | 15,183,978 |
GLP J-Reit | 2,428 | 1,974,722 |
SECURITY | NUMBER OF SHARES | VALUE ($) |
Hamamatsu Photonics KK | 75,300 | 2,759,118 |
Hankyu Hanshin Holdings, Inc. | 126,900 | 3,327,094 |
Hikari Tsushin, Inc. | 11,693 | 1,900,367 |
Hirose Electric Co. Ltd. | 17,064 | 1,811,271 |
Hitachi Construction Machinery Co. Ltd. | 58,453 | 1,669,551 |
Hitachi Ltd. | 517,115 | 47,709,375 |
Honda Motor Co. Ltd. | 2,576,117 | 29,309,969 |
Hoshizaki Corp. | 60,400 | 2,081,305 |
Hoya Corp. | 195,707 | 22,690,233 |
Hulic Co. Ltd. | 218,500 | 2,013,402 |
Ibiden Co. Ltd. | 65,900 | 2,505,088 |
Idemitsu Kosan Co. Ltd. | 554,315 | 3,755,549 |
Iida Group Holdings Co. Ltd. | 95,300 | 1,216,591 |
Inpex Corp. | 538,400 | 8,065,123 |
Isuzu Motors Ltd. | 333,300 | 4,223,860 |
ITOCHU Corp. | 667,100 | 30,096,038 |
Japan Airlines Co. Ltd. | 76,700 | 1,359,029 |
Japan Exchange Group, Inc. | 283,400 | 6,637,373 |
Japan Metropolitan Fund Invest | 3,872 | 2,337,636 |
Japan Post Bank Co. Ltd. | 815,900 | 8,281,636 |
Japan Post Holdings Co. Ltd. | 1,168,200 | 11,218,572 |
Japan Post Insurance Co. Ltd. | 109,700 | 2,059,516 |
Japan Real Estate Investment Corp. | 722 | 2,448,403 |
Japan Tobacco, Inc. | 667,700 | 17,962,209 |
JFE Holdings, Inc. | 320,200 | 4,779,214 |
Kajima Corp. | 239,900 | 4,595,784 |
Kansai Electric Power Co., Inc. | 391,300 | 5,861,446 |
Kao Corp. | 262,319 | 10,821,236 |
Kawasaki Kisen Kaisha Ltd. | 216,600 | 3,051,868 |
KDDI Corp. | 831,100 | 23,062,009 |
KDX Realty Investment Corp. | 2,349 | 2,316,906 |
Keisei Electric Railway Co. Ltd. | 80,256 | 2,989,770 |
Keyence Corp. | 109,000 | 47,934,886 |
Kikkoman Corp. | 374,885 | 4,466,907 |
Kintetsu Group Holdings Co. Ltd. | 98,400 | 2,529,723 |
Kirin Holdings Co. Ltd. | 432,300 | 6,310,541 |
Kobe Bussan Co. Ltd. | 89,600 | 1,935,116 |
Koito Manufacturing Co. Ltd. | 110,100 | 1,480,926 |
Komatsu Ltd. | 516,109 | 15,409,027 |
Konami Group Corp. | 58,100 | 3,505,598 |
Kubota Corp. | 559,700 | 8,977,434 |
Kyocera Corp. | 718,900 | 8,762,412 |
Kyowa Kirin Co. Ltd. | 149,000 | 2,502,284 |
Lasertec Corp. | 42,400 | 9,145,906 |
LY Corp. | 1,528,400 | 3,672,183 |
M3, Inc. | 253,000 | 2,676,278 |
Makita Corp. | 129,100 | 3,737,558 |
Marubeni Corp. | 801,400 | 14,278,022 |
MatsukiyoCocokara & Co. | 189,700 | 2,690,084 |
Mazda Motor Corp. | 312,900 | 3,541,864 |
McDonald's Holdings Co. Japan Ltd. | 50,000 | 2,199,434 |
MEIJI Holdings Co. Ltd. | 127,000 | 2,841,543 |
Minebea Mitsumi, Inc. | 200,000 | 3,746,068 |
MISUMI Group, Inc. | 154,200 | 2,506,962 |
Mitsubishi Chemical Group Corp. | 705,500 | 4,115,793 |
Mitsubishi Corp. | 1,927,100 | 44,071,944 |
Mitsubishi Electric Corp. | 1,074,900 | 18,735,428 |
Mitsubishi Estate Co. Ltd. | 626,202 | 11,474,967 |
Mitsubishi HC Capital, Inc. | 436,938 | 2,829,629 |
Mitsubishi Heavy Industries Ltd. | 1,786,300 | 15,971,508 |
Mitsubishi UFJ Financial Group, Inc. | 6,206,809 | 61,828,201 |
Mitsui & Co. Ltd. | 721,200 | 34,816,421 |
Mitsui Chemicals, Inc. | 93,300 | 2,655,587 |
Mitsui Fudosan Co. Ltd. | 1,474,131 | 15,002,323 |
Mitsui OSK Lines Ltd. | 195,300 | 6,198,741 |
Mizuho Financial Group, Inc. | 1,347,413 | 26,044,291 |
MonotaRO Co. Ltd. | 150,600 | 1,804,923 |
SECURITY | NUMBER OF SHARES | VALUE ($) |
MS&AD Insurance Group Holdings, Inc. | 722,386 | 12,987,804 |
Murata Manufacturing Co. Ltd. | 958,400 | 17,512,036 |
NEC Corp. | 137,900 | 9,984,234 |
Nexon Co. Ltd. | 190,900 | 2,976,388 |
NIDEC Corp. | 231,100 | 10,823,070 |
Nintendo Co. Ltd. | 579,390 | 28,256,254 |
Nippon Building Fund, Inc. | 871 | 3,327,912 |
NIPPON EXPRESS HOLDINGS, Inc. | 41,300 | 2,112,837 |
Nippon Paint Holdings Co. Ltd. | 548,100 | 3,508,396 |
Nippon Prologis REIT, Inc. | 1,269 | 2,193,383 |
Nippon Sanso Holdings Corp. | 99,900 | 2,967,270 |
Nippon Steel Corp. | 480,141 | 10,764,237 |
Nippon Telegraph & Telephone Corp. | 16,755,875 | 18,090,681 |
Nippon Yusen KK | 260,200 | 7,387,200 |
Nissan Chemical Corp. | 73,166 | 2,494,095 |
Nissan Motor Co. Ltd. | 1,379,296 | 5,047,814 |
Nissin Foods Holdings Co. Ltd. | 111,300 | 2,970,100 |
Nitori Holdings Co. Ltd. | 44,600 | 5,968,954 |
Nitto Denko Corp. | 81,700 | 6,755,415 |
Nomura Holdings, Inc. | 1,683,900 | 9,581,359 |
Nomura Real Estate Holdings, Inc. | 60,900 | 1,705,024 |
Nomura Real Estate Master Fund, Inc. | 2,323 | 2,220,602 |
Nomura Research Institute Ltd. | 213,000 | 5,154,150 |
NTT Data Group Corp. | 357,700 | 5,593,647 |
Obayashi Corp. | 372,500 | 4,157,394 |
Obic Co. Ltd. | 40,000 | 5,138,659 |
Odakyu Electric Railway Co. Ltd. | 171,700 | 1,930,369 |
Olympus Corp. | 667,700 | 9,300,867 |
Omron Corp. | 96,900 | 3,325,838 |
Ono Pharmaceutical Co. Ltd. | 212,500 | 3,060,713 |
Oracle Corp. | 21,200 | 1,590,945 |
Oriental Land Co. Ltd. | 606,700 | 16,739,893 |
ORIX Corp. | 655,500 | 13,415,076 |
Osaka Gas Co. Ltd. | 215,200 | 4,785,159 |
Otsuka Corp. | 126,000 | 2,505,903 |
Otsuka Holdings Co. Ltd. | 236,900 | 10,129,096 |
Pan Pacific International Holdings Corp. | 210,000 | 4,932,065 |
Panasonic Holdings Corp. | 1,241,912 | 10,839,966 |
Rakuten Group, Inc. * | 857,620 | 4,124,674 |
Recruit Holdings Co. Ltd. | 802,300 | 34,552,943 |
Renesas Electronics Corp. | 821,300 | 13,334,423 |
Resona Holdings, Inc. | 1,185,185 | 7,494,807 |
Ricoh Co. Ltd. | 321,000 | 2,769,284 |
Rohm Co. Ltd. | 184,700 | 2,655,034 |
SBI Holdings, Inc. | 141,190 | 3,437,714 |
SCREEN Holdings Co. Ltd. | 44,700 | 4,612,018 |
SCSK Corp. | 85,600 | 1,556,139 |
Secom Co. Ltd. | 118,700 | 8,245,195 |
Seiko Epson Corp. | 164,500 | 2,706,023 |
Sekisui Chemical Co. Ltd. | 207,300 | 3,015,808 |
Sekisui House Ltd. | 328,469 | 7,548,334 |
Seven & i Holdings Co. Ltd. | 1,272,409 | 16,441,044 |
SG Holdings Co. Ltd. | 186,628 | 2,184,497 |
Sharp Corp. * | 142,700 | 749,056 |
Shimadzu Corp. | 129,300 | 3,512,830 |
Shimano, Inc. | 43,000 | 6,988,058 |
Shimizu Corp. | 309,800 | 1,919,042 |
Shin-Etsu Chemical Co. Ltd. | 1,006,400 | 38,956,677 |
Shionogi & Co. Ltd. | 136,300 | 6,365,313 |
Shiseido Co. Ltd. | 221,200 | 5,921,134 |
Shizuoka Financial Group, Inc. | 249,100 | 2,325,061 |
SMC Corp. | 31,900 | 16,759,193 |
SoftBank Corp. | 1,612,000 | 19,443,437 |
SoftBank Group Corp. | 576,600 | 28,357,533 |
Sompo Holdings, Inc. | 497,100 | 9,837,666 |
Sony Group Corp. | 703,300 | 58,128,685 |
SECURITY | NUMBER OF SHARES | VALUE ($) |
Square Enix Holdings Co. Ltd. | 46,700 | 1,688,071 |
Subaru Corp. | 335,800 | 7,498,073 |
SUMCO Corp. | 201,000 | 2,997,574 |
Sumitomo Corp. | 581,300 | 15,286,531 |
Sumitomo Electric Industries Ltd. | 406,700 | 6,286,083 |
Sumitomo Metal Mining Co. Ltd. | 140,000 | 4,677,209 |
Sumitomo Mitsui Financial Group, Inc. | 709,846 | 40,321,932 |
Sumitomo Mitsui Trust Holdings, Inc. | 361,200 | 7,594,165 |
Sumitomo Realty & Development Co. Ltd. | 163,900 | 5,671,579 |
Suntory Beverage & Food Ltd. | 80,100 | 2,606,073 |
Suzuki Motor Corp. | 882,400 | 10,276,236 |
Sysmex Corp. | 279,900 | 4,475,706 |
T&D Holdings, Inc. | 277,300 | 4,524,795 |
Taisei Corp. | 93,700 | 3,430,394 |
Takeda Pharmaceutical Co. Ltd. | 878,590 | 23,091,161 |
TDK Corp. | 219,100 | 9,774,267 |
Terumo Corp. | 751,400 | 12,746,842 |
TIS, Inc. | 121,100 | 2,586,281 |
Tobu Railway Co. Ltd. | 105,500 | 2,093,170 |
Toho Co. Ltd. | 61,208 | 2,050,611 |
Tokio Marine Holdings, Inc. | 1,010,997 | 31,953,961 |
Tokyo Electric Power Co. Holdings, Inc. * | 846,690 | 5,266,648 |
Tokyo Electron Ltd. | 263,700 | 57,841,471 |
Tokyo Gas Co. Ltd. | 207,440 | 4,652,309 |
Tokyu Corp. | 275,200 | 3,257,696 |
TOPPAN Holdings, Inc. | 126,900 | 3,010,568 |
Toray Industries, Inc. | 793,400 | 3,626,409 |
TOTO Ltd. | 79,300 | 2,146,214 |
Toyota Industries Corp. | 81,700 | 7,763,688 |
Toyota Motor Corp. | 5,933,615 | 135,337,303 |
Toyota Tsusho Corp. | 120,369 | 7,653,049 |
Trend Micro, Inc. | 76,800 | 3,784,565 |
Unicharm Corp. | 223,600 | 6,643,856 |
USS Co. Ltd. | 225,600 | 1,723,425 |
West Japan Railway Co. | 240,664 | 4,568,151 |
Yakult Honsha Co. Ltd. | 147,900 | 2,892,885 |
Yamaha Corp. | 74,000 | 1,559,415 |
Yamaha Motor Co. Ltd. | 505,600 | 4,715,841 |
Yamato Holdings Co. Ltd. | 146,300 | 1,932,137 |
Yaskawa Electric Corp. | 132,600 | 5,463,466 |
Yokogawa Electric Corp. | 128,700 | 2,843,730 |
Zensho Holdings Co. Ltd. | 54,100 | 2,096,873 |
ZOZO, Inc. | 76,500 | 1,647,693 |
2,100,155,795 | ||
Netherlands 4.9% | ||
ABN AMRO Bank NV, GDR | 272,024 | 4,357,433 |
Adyen NV * | 12,155 | 14,561,691 |
Aegon Ltd. | 797,671 | 4,967,772 |
AerCap Holdings NV * | 111,797 | 9,445,729 |
Akzo Nobel NV | 94,170 | 6,213,520 |
ASM International NV | 26,143 | 16,444,964 |
ASML Holding NV | 225,637 | 196,532,694 |
ASR Nederland NV | 89,616 | 4,484,339 |
BE Semiconductor Industries NV | 42,778 | 5,675,529 |
Coca-Cola Europacific Partners PLC | 116,507 | 8,390,834 |
DSM-Firmenich AG | 104,094 | 11,674,609 |
EXOR NV | 51,856 | 5,661,403 |
Heineken Holding NV | 73,300 | 5,896,544 |
Heineken NV | 161,915 | 15,757,512 |
IMCD NV * | 32,144 | 4,849,713 |
ING Groep NV | 1,854,628 | 29,322,161 |
JDE Peet's NV | 53,526 | 1,189,325 |
Koninklijke Ahold Delhaize NV | 529,567 | 16,074,576 |
Koninklijke KPN NV | 1,890,969 | 6,872,030 |
SECURITY | NUMBER OF SHARES | VALUE ($) |
Koninklijke Philips NV | 436,450 | 11,590,450 |
NN Group NV | 150,649 | 6,949,571 |
OCI NV | 58,728 | 1,579,582 |
Prosus NV | 811,234 | 27,143,855 |
Randstad NV | 58,640 | 2,940,851 |
Universal Music Group NV | 458,240 | 13,479,214 |
Wolters Kluwer NV | 139,075 | 20,820,429 |
452,876,330 | ||
New Zealand 0.2% | ||
Auckland International Airport Ltd. | 734,923 | 3,399,468 |
EBOS Group Ltd. | 86,836 | 1,793,954 |
Fisher & Paykel Healthcare Corp. Ltd. | 326,714 | 5,471,722 |
Mercury NZ Ltd. | 386,079 | 1,451,431 |
Meridian Energy Ltd. | 683,511 | 2,416,552 |
Spark New Zealand Ltd. | 1,036,536 | 2,913,414 |
17,446,541 | ||
Norway 0.6% | ||
Aker BP ASA | 176,369 | 4,277,502 |
DNB Bank ASA | 509,284 | 8,876,384 |
Equinor ASA | 506,399 | 13,474,450 |
Gjensidige Forsikring ASA | 119,153 | 1,910,415 |
Kongsberg Gruppen ASA | 49,946 | 3,525,843 |
Mowi ASA | 254,134 | 4,461,805 |
Norsk Hydro ASA | 740,264 | 4,549,205 |
Orkla ASA | 401,311 | 2,729,882 |
Salmar ASA | 36,366 | 2,287,824 |
Telenor ASA | 353,539 | 4,070,544 |
Yara International ASA | 91,735 | 2,614,920 |
52,778,774 | ||
Portugal 0.2% | ||
EDP - Energias de Portugal SA * | 1,758,998 | 6,605,331 |
EDP Renovaveis SA | 168,413 | 2,305,604 |
Galp Energia SGPS SA | 256,258 | 5,504,719 |
Jeronimo Martins SGPS SA | 157,896 | 3,248,195 |
17,663,849 | ||
Singapore 1.4% | ||
CapitaLand Ascendas REIT | 2,035,995 | 3,856,625 |
CapitaLand Integrated Commercial Trust | 3,015,510 | 4,298,595 |
CapitaLand Investment Ltd. * | 1,427,549 | 2,760,669 |
City Developments Ltd. | 289,700 | 1,298,416 |
DBS Group Holdings Ltd. | 1,112,682 | 28,325,994 |
Genting Singapore Ltd. | 3,342,400 | 2,230,616 |
Grab Holdings Ltd., Class A * | 1,073,323 | 3,756,631 |
Jardine Cycle & Carriage Ltd. | 54,600 | 1,053,684 |
Keppel Ltd. | 804,300 | 4,023,035 |
Mapletree Logistics Trust | 1,893,728 | 1,858,319 |
Mapletree Pan Asia Commercial Trust | 1,273,700 | 1,167,184 |
Oversea-Chinese Banking Corp. Ltd. | 1,900,401 | 19,729,135 |
Sea Ltd., ADR * | 206,520 | 13,049,999 |
Seatrium Ltd. * | 26,443,325 | 1,888,992 |
Sembcorp Industries Ltd. | 517,000 | 2,020,473 |
Singapore Airlines Ltd. | 813,750 | 3,882,905 |
Singapore Exchange Ltd. | 494,100 | 3,370,515 |
Singapore Technologies Engineering Ltd. | 849,549 | 2,495,534 |
Singapore Telecommunications Ltd. | 4,670,337 | 8,099,645 |
United Overseas Bank Ltd. | 705,733 | 15,660,770 |
SECURITY | NUMBER OF SHARES | VALUE ($) |
Wilmar International Ltd. | 1,066,034 | 2,505,790 |
127,333,526 | ||
Spain 2.6% | ||
Acciona SA | 13,188 | 1,524,613 |
ACS Actividades de Construccion y Servicios SA | 115,572 | 4,628,711 |
Aena SME SA | 42,121 | 7,676,113 |
Amadeus IT Group SA | 250,510 | 15,900,853 |
Banco Bilbao Vizcaya Argentaria SA | 3,252,493 | 35,172,372 |
Banco Santander SA (a) | 9,035,987 | 43,965,787 |
CaixaBank SA | 2,109,271 | 11,123,360 |
Cellnex Telecom SA * | 252,450 | 8,344,658 |
Enagas SA | 137,799 | 2,020,962 |
Endesa SA | 174,227 | 3,177,141 |
Ferrovial SE | 289,046 | 10,395,645 |
Grifols SA * | 183,481 | 1,679,301 |
Iberdrola SA | 3,462,492 | 42,455,609 |
Industria de Diseno Textil SA | 607,950 | 27,680,535 |
Redeia Corp. SA | 226,558 | 3,782,070 |
Repsol SA | 683,579 | 10,729,510 |
Telefonica SA | 2,733,923 | 12,246,870 |
242,504,110 | ||
Sweden 3.0% | ||
Alfa Laval AB | 160,046 | 6,813,919 |
Assa Abloy AB, B Shares | 572,010 | 15,113,307 |
Atlas Copco AB, A Shares | 1,494,459 | 26,177,067 |
Atlas Copco AB, B Shares | 878,213 | 13,168,116 |
Beijer Ref AB (a) | 215,577 | 3,038,204 |
Boliden AB (a) | 151,679 | 4,984,884 |
Epiroc AB, A Shares | 366,194 | 6,769,961 |
Epiroc AB, B Shares | 222,125 | 3,681,939 |
EQT AB | 211,021 | 5,693,210 |
Essity AB, B Shares | 337,127 | 8,411,232 |
Evolution AB | 102,373 | 11,310,696 |
Fastighets AB Balder, B Shares * | 354,296 | 2,233,236 |
Getinge AB, B Shares | 132,855 | 2,796,919 |
H & M Hennes & Mauritz AB, B Shares (a) | 360,839 | 5,735,463 |
Hexagon AB, B Shares | 1,156,681 | 12,100,007 |
Holmen AB, B Shares | 44,602 | 1,737,126 |
Husqvarna AB, B Shares | 196,751 | 1,595,888 |
Industrivarden AB, A Shares | 76,002 | 2,447,532 |
Industrivarden AB, C Shares | 78,960 | 2,538,550 |
Indutrade AB | 148,535 | 3,417,138 |
Investment AB Latour, B Shares | 81,680 | 1,968,129 |
Investor AB, B Shares | 960,383 | 23,522,414 |
L E Lundbergforetagen AB, B Shares | 44,511 | 2,193,850 |
Lifco AB, B Shares | 129,890 | 3,147,051 |
Nibe Industrier AB, B Shares (a) | 842,772 | 3,888,736 |
Saab AB, B Shares | 46,142 | 3,653,003 |
Sagax AB, B Shares | 115,072 | 2,881,640 |
Sandvik AB | 609,954 | 12,158,538 |
Securitas AB, B Shares (a) | 275,103 | 2,756,972 |
Skandinaviska Enskilda Banken AB, A Shares | 887,568 | 11,623,964 |
Skanska AB, B Shares | 191,665 | 3,292,480 |
SKF AB, B Shares | 191,266 | 3,932,058 |
Svenska Cellulosa AB SCA, B Shares | 338,623 | 4,962,608 |
Svenska Handelsbanken AB, A Shares | 817,088 | 7,006,793 |
Swedbank AB, A Shares | 479,262 | 9,164,574 |
Swedish Orphan Biovitrum AB * | 109,897 | 2,846,050 |
Tele2 AB, B Shares | 297,520 | 2,774,986 |
Telefonaktiebolaget LM Ericsson, B Shares | 1,623,379 | 8,238,462 |
SECURITY | NUMBER OF SHARES | VALUE ($) |
Telia Co. AB | 1,317,913 | 3,014,694 |
Volvo AB, A Shares | 113,484 | 2,988,742 |
Volvo AB, B Shares | 840,965 | 21,405,233 |
Volvo Car AB, B Shares * | 409,365 | 1,270,764 |
278,456,135 | ||
Switzerland 9.1% | ||
ABB Ltd. | 891,894 | 43,335,736 |
Adecco Group AG | 88,523 | 3,096,752 |
Alcon, Inc. | 277,478 | 21,276,119 |
Avolta AG * | 54,480 | 2,060,261 |
Bachem Holding AG | 19,156 | 1,662,008 |
Baloise Holding AG | 25,617 | 3,871,058 |
Banque Cantonale Vaudoise | 16,863 | 1,763,441 |
Barry Callebaut AG | 1,921 | 3,104,283 |
BKW AG | 12,413 | 1,842,560 |
Chocoladefabriken Lindt & Spruengli AG | 61 | 7,039,562 |
Chocoladefabriken Lindt & Spruengli AG, Participation Certificates | 526 | 6,058,971 |
Cie Financiere Richemont SA, Class A | 302,075 | 41,754,930 |
Clariant AG * | 131,945 | 1,974,005 |
EMS-Chemie Holding AG | 4,103 | 3,273,518 |
Geberit AG | 18,611 | 9,934,202 |
Givaudan SA | 5,166 | 22,093,786 |
Helvetia Holding AG | 20,836 | 2,725,464 |
Holcim AG | 290,029 | 24,277,661 |
Julius Baer Group Ltd. | 114,211 | 6,128,374 |
Kuehne & Nagel International AG (a) | 30,034 | 7,937,880 |
Logitech International SA | 91,498 | 7,123,776 |
Lonza Group AG | 41,727 | 23,033,021 |
Nestle SA | 1,495,113 | 150,109,581 |
Novartis AG | 1,146,432 | 111,269,796 |
Partners Group Holding AG | 12,721 | 16,366,407 |
Roche Holding AG | 392,383 | 94,020,537 |
Roche Holding AG, Bearer Shares | 18,699 | 4,918,929 |
Sandoz Group AG * | 234,630 | 7,974,345 |
Schindler Holding AG | 12,826 | 3,125,103 |
Schindler Holding AG, Participation Certificates | 22,440 | 5,593,309 |
SGS SA | 84,770 | 7,464,476 |
SIG Group AG | 169,287 | 3,382,921 |
Sika AG | 85,173 | 24,228,430 |
Sonova Holding AG | 28,656 | 7,921,439 |
Straumann Holding AG | 62,086 | 8,253,560 |
Swatch Group AG | 32,748 | 1,357,714 |
Swatch Group AG, Bearer Shares | 15,880 | 3,336,567 |
Swiss Life Holding AG | 16,307 | 11,003,239 |
Swiss Prime Site AG | 42,595 | 3,932,917 |
Swiss Re AG | 167,717 | 18,231,737 |
Swisscom AG | 14,622 | 8,021,725 |
Temenos AG | 35,842 | 2,229,638 |
UBS Group AG | 1,835,120 | 48,196,248 |
VAT Group AG | 14,974 | 7,454,966 |
Zurich Insurance Group AG | 81,655 | 39,524,802 |
833,285,754 | ||
United Kingdom 15.1% | ||
3i Group PLC | 541,403 | 19,342,944 |
abrdn PLC | 1,071,465 | 1,953,903 |
Admiral Group PLC | 143,464 | 4,883,104 |
Anglo American PLC | 707,632 | 23,123,616 |
Antofagasta PLC | 224,490 | 6,158,160 |
Ashtead Group PLC | 245,069 | 17,794,926 |
Associated British Foods PLC | 193,078 | 6,390,434 |
AstraZeneca PLC | 867,217 | 131,165,587 |
SECURITY | NUMBER OF SHARES | VALUE ($) |
Auto Trader Group PLC | 502,156 | 4,353,431 |
Aviva PLC | 1,542,632 | 8,956,751 |
BAE Systems PLC | 1,692,193 | 28,144,922 |
Barclays PLC | 8,458,192 | 21,325,575 |
Barratt Developments PLC | 548,983 | 3,101,820 |
Berkeley Group Holdings PLC | 57,236 | 3,361,219 |
BP PLC | 9,549,071 | 61,549,846 |
British American Tobacco PLC | 1,122,384 | 32,949,010 |
BT Group PLC | 3,647,005 | 4,663,802 |
Bunzl PLC | 191,106 | 7,328,493 |
Burberry Group PLC | 206,814 | 2,959,226 |
Centrica PLC | 2,970,617 | 4,741,912 |
Coca-Cola HBC AG | 124,877 | 4,030,870 |
Compass Group PLC | 954,580 | 26,550,410 |
CRH PLC | 387,568 | 30,013,568 |
Croda International PLC | 74,793 | 4,283,885 |
DCC PLC | 55,439 | 3,785,967 |
Diageo PLC | 1,249,118 | 43,169,107 |
Endeavour Mining PLC | 107,158 | 2,268,869 |
Entain PLC | 355,088 | 3,464,312 |
Experian PLC | 514,020 | 20,732,455 |
Flutter Entertainment PLC * | 99,308 | 18,397,691 |
Glencore PLC | 5,785,689 | 33,664,380 |
GSK PLC | 2,296,533 | 47,645,966 |
Haleon PLC | 3,835,517 | 16,198,691 |
Halma PLC | 209,798 | 5,749,900 |
Hargreaves Lansdown PLC | 203,808 | 2,059,548 |
Hikma Pharmaceuticals PLC | 91,392 | 2,194,374 |
HSBC Holdings PLC | 10,727,685 | 92,987,046 |
Imperial Brands PLC | 471,062 | 10,763,837 |
Informa PLC | 795,529 | 7,875,647 |
InterContinental Hotels Group PLC | 92,752 | 9,046,468 |
Intertek Group PLC | 89,185 | 5,489,027 |
J Sainsbury PLC | 919,672 | 3,016,687 |
JD Sports Fashion PLC | 1,532,604 | 2,194,190 |
Kingfisher PLC | 1,062,737 | 3,273,574 |
Land Securities Group PLC | 399,110 | 3,225,630 |
Legal & General Group PLC | 3,432,951 | 10,077,426 |
Lloyds Banking Group PLC | 35,569,462 | 22,955,914 |
London Stock Exchange Group PLC | 232,459 | 25,626,298 |
M&G PLC | 1,218,103 | 3,049,554 |
Melrose Industries PLC | 749,361 | 5,887,227 |
Mondi PLC | 241,997 | 4,593,264 |
National Grid PLC | 2,073,642 | 27,200,282 |
NatWest Group PLC | 3,184,425 | 12,019,234 |
Next PLC | 68,106 | 7,638,631 |
NMC Health PLC *(b) | 48,950 | 0 |
Ocado Group PLC * | 314,286 | 1,376,014 |
Pearson PLC | 343,212 | 4,164,476 |
Persimmon PLC | 181,686 | 2,942,046 |
Phoenix Group Holdings PLC | 408,826 | 2,490,038 |
Prudential PLC | 1,531,681 | 13,321,562 |
Reckitt Benckiser Group PLC | 396,484 | 22,166,232 |
RELX PLC | 1,055,004 | 43,346,815 |
Rentokil Initial PLC | 1,399,372 | 7,063,992 |
Rio Tinto PLC | 631,853 | 42,751,632 |
Rolls-Royce Holdings PLC * | 4,689,801 | 24,049,412 |
Sage Group PLC | 574,377 | 8,328,982 |
Schroders PLC | 530,247 | 2,324,646 |
Segro PLC | 735,136 | 7,732,250 |
Severn Trent PLC | 150,112 | 4,627,093 |
Shell PLC | 3,636,696 | 129,279,438 |
Smith & Nephew PLC | 486,076 | 5,889,125 |
Smiths Group PLC | 190,010 | 3,830,593 |
Spirax-Sarco Engineering PLC | 42,016 | 4,623,332 |
SSE PLC | 610,979 | 12,700,050 |
St. James's Place PLC | 305,834 | 1,654,958 |
SECURITY | NUMBER OF SHARES | VALUE ($) |
Standard Chartered PLC | 1,268,684 | 10,899,947 |
Taylor Wimpey PLC | 1,957,217 | 3,207,140 |
Tesco PLC | 3,966,584 | 14,644,899 |
Unilever PLC | 1,394,061 | 72,115,900 |
United Utilities Group PLC | 389,909 | 5,082,531 |
Vodafone Group PLC | 12,891,990 | 10,871,833 |
Whitbread PLC | 102,706 | 4,047,929 |
Wise PLC, Class A * | 340,431 | 3,271,693 |
WPP PLC | 601,945 | 6,033,393 |
1,390,216,561 | ||
Total Common Stocks (Cost $6,284,107,538) | 9,071,617,929 | |
PREFERRED STOCKS 0.4% OF NET ASSETS | ||
Germany 0.4% | ||
Bayerische Motoren Werke AG | 34,682 | 3,563,634 |
Dr Ing hc F Porsche AG | 63,211 | 5,627,450 |
Henkel AG & Co. KGaA | 100,368 | 7,973,409 |
Porsche Automobil Holding SE | 85,413 | 4,351,919 |
Sartorius AG | 14,563 | 4,353,697 |
Volkswagen AG | 114,555 | 14,033,572 |
39,903,681 | ||
Total Preferred Stocks (Cost $40,568,855) | 39,903,681 | |
SHORT-TERM INVESTMENTS 0.7% OF NET ASSETS | ||
Money Market Funds 0.7% | ||
State Street Institutional U.S. Government Money Market Fund, Premier Class 5.25% (c)(d) | 62,071,528 | 62,071,528 |
Total Short-Term Investments (Cost $62,071,528) | 62,071,528 | |
Total Investments in Securities (Cost $6,386,747,921) | 9,173,593,138 | |
NUMBER OF CONTRACTS | NOTIONAL AMOUNT ($) | CURRENT VALUE/ UNREALIZED DEPRECIATION ($) | |
FUTURES CONTRACTS | |||
Long | |||
MSCI EAFE Index, expires 06/21/24 | 796 | 90,246,500 | (1,657,151 ) |
* | Non-income producing security. |
(a) | All or a portion of this security is on loan. Securities on loan were valued at $56,674,881. |
(b) | Fair valued using significant unobservable inputs (see financial note 2(a), Securities for which no quoted value is available, for additional information). |
(c) | The rate shown is the annualized 7-day yield. |
(d) | Security purchased with cash collateral received for securities on loan. |
ADR — | American Depositary Receipt |
CVA — | Dutch Certificate |
GDR — | Global Depositary Receipt |
REIT — | Real Estate Investment Trust |
DESCRIPTION | QUOTED PRICES IN ACTIVE MARKETS FOR IDENTICAL ASSETS (LEVEL 1) | OTHER SIGNIFICANT OBSERVABLE INPUTS (LEVEL 2) | SIGNIFICANT UNOBSERVABLE INPUTS (LEVEL 3) | TOTAL |
Assets | ||||
Common Stocks1 | $— | $3,894,173,370 | $— | $3,894,173,370 |
Belgium | 2,385,097 | 84,084,951 | — | 86,470,048 |
Denmark | 273,531 | 338,801,099 | — | 339,074,630 |
Finland | 2,282,272 | 89,479,312 | — | 91,761,584 |
Hong Kong | 5,394,358 | 170,655,006 | — | 176,049,364 |
Israel | 30,766,426 | 34,058,845 | — | 64,825,271 |
Japan | 2,193,383 | 2,097,962,412 | — | 2,100,155,795 |
Netherlands | 17,836,563 | 435,039,767 | — | 452,876,330 |
New Zealand | 11,974,819 | 5,471,722 | — | 17,446,541 |
Norway | 4,070,544 | 48,708,230 | — | 52,778,774 |
Singapore | 16,806,630 | 110,526,896 | — | 127,333,526 |
Sweden | 2,846,050 | 275,610,085 | — | 278,456,135 |
United Kingdom | 4,593,264 | 1,385,623,297 | 0 * | 1,390,216,561 |
Preferred Stocks1 | — | 39,903,681 | — | 39,903,681 |
Short-Term Investments1 | 62,071,528 | — | — | 62,071,528 |
Liabilities | ||||
Futures Contracts2 | (1,657,151 ) | — | — | (1,657,151 ) |
Total | $161,837,314 | $9,010,098,673 | $0 | $9,171,935,987 |
* | Level 3 amount shown includes securities determined to have no value at April 30, 2024. |
1 | As categorized in the Portfolio Holdings. |
2 | Futures contracts are reported at cumulative unrealized appreciation or depreciation. |
Assets | ||
Investments in securities, at value - unaffiliated issuers (cost $6,386,747,921) including securities on loan of $56,674,881 | $9,173,593,138 | |
Cash | 36,428,125 | |
Foreign currency, at value (cost $14,605,668) | 14,557,655 | |
Deposit with broker for futures contracts | 7,618,965 | |
Receivables: | ||
Dividends | 36,390,219 | |
Foreign tax reclaims | 23,941,153 | |
Fund shares sold | 4,273,671 | |
Income from securities on loan | + | 94,246 |
Total assets | 9,296,897,172 | |
Liabilities | ||
Collateral held for securities on loan | 62,071,528 | |
Payables: | ||
Investments bought | 24,816,869 | |
Fund shares redeemed | 6,953,512 | |
Variation margin on futures contracts | 1,233,687 | |
Investment adviser fees | + | 456,391 |
Total liabilities | 95,531,987 | |
Net assets | $9,201,365,185 | |
Net Assets by Source | ||
Capital received from investors | $7,383,451,701 | |
Total distributable earnings | + | 1,817,913,484 |
Net assets | $9,201,365,185 | |
Net Asset Value (NAV) | ||||
Net Assets | ÷ | Shares Outstanding | = | NAV |
$9,201,365,185 | 398,281,283 | $23.10 | ||
For the period November 1, 2023 through April 30, 2024; unaudited | ||
Investment Income | ||
Dividends received from securities - unaffiliated issuers (net of foreign withholding tax of $15,221,312) | $132,529,244 | |
Other interest | 263,262 | |
Securities on loan, net | + | 145,445 |
Total investment income | 132,937,951 | |
Expenses | ||
Investment adviser fees | 2,651,901 | |
Professional fees | + | 19,118 1 |
Total expenses | 2,671,019 | |
Expense reduction | – | 19,118 1 |
Net expenses | – | 2,651,901 |
Net investment income | 130,286,050 | |
REALIZED AND UNREALIZED GAINS (LOSSES) | ||
Net realized losses on sales of securities - unaffiliated issuers | (68,632,986 ) | |
Net realized gains on futures contracts | 8,086,875 | |
Net realized losses on foreign currency transactions | + | (62,073 ) |
Net realized losses | (60,608,184 ) | |
Net change in unrealized appreciation (depreciation) on securities - unaffiliated issuers | 1,280,050,330 | |
Net change in unrealized appreciation (depreciation) on futures contracts | 208,246 | |
Net change in unrealized appreciation (depreciation) on foreign currency translations | + | (676,843 ) |
Net change in unrealized appreciation (depreciation) | + | 1,279,581,733 |
Net realized and unrealized gains | 1,218,973,549 | |
Increase in net assets resulting from operations | $1,349,259,599 | |
1 | Professional fees associated with the filing of foreign withholding tax claims in the European Union are deemed to be non-contingent and non-routine expenses of the fund (see financial notes 2(d) and 4 for additional information). |
OPERATIONS | |||
11/1/23-4/30/24 | 11/1/22-10/31/23 | ||
Net investment income | $130,286,050 | $253,165,280 | |
Net realized losses | (60,608,184 ) | (324,397,418 ) | |
Net change in unrealized appreciation (depreciation) | + | 1,279,581,733 | 1,142,537,840 |
Increase in net assets resulting from operations | $1,349,259,599 | $1,071,305,702 | |
DISTRIBUTIONS TO SHAREHOLDERS | |||
Total distributions | ($284,048,299 ) | ($210,690,877 ) | |
TRANSACTIONS IN FUND SHARES | |||||
11/1/23-4/30/24 | 11/1/22-10/31/23 | ||||
SHARES | VALUE | SHARES | VALUE | ||
Shares sold | 40,844,352 | $926,278,473 | 103,868,172 | $2,222,077,962 | |
Shares reinvested | 9,247,190 | 203,253,237 | 7,715,248 | 151,373,159 | |
Shares redeemed | + | (41,838,932 ) | (945,851,672 ) | (113,838,437 ) | (2,408,660,480 ) |
Net transactions in fund shares | 8,252,610 | $183,680,038 | (2,255,017 ) | ($35,209,359 ) | |
SHARES OUTSTANDING AND NET ASSETS | |||||
11/1/23-4/30/24 | 11/1/22-10/31/23 | ||||
SHARES | NET ASSETS | SHARES | NET ASSETS | ||
Beginning of period | 390,028,673 | $7,952,473,847 | 392,283,690 | $7,127,068,381 | |
Total increase (decrease) | + | 8,252,610 | 1,248,891,338 | (2,255,017 ) | 825,405,466 |
End of period | 398,281,283 | $9,201,365,185 | 390,028,673 | $7,952,473,847 | |
SCHWAB CAPITAL TRUST | |
Schwab S&P 500 Index Fund | Schwab Target 2045 Fund |
Schwab Small-Cap Index Fund | Schwab Target 2050 Fund |
Schwab Total Stock Market Index Fund | Schwab Target 2055 Fund |
Schwab U.S. Large-Cap Growth Index Fund | Schwab Target 2060 Fund |
Schwab U.S. Large-Cap Value Index Fund | Schwab Target 2065 Fund |
Schwab U.S. Mid-Cap Index Fund | Schwab Fundamental US Large Company Index Fund |
Schwab International Index Fund | Schwab Fundamental US Small Company Index Fund |
Schwab MarketTrack All Equity Portfolio™ | Schwab Fundamental International Large Company Index Fund |
Schwab MarketTrack Growth Portfolio™ | Schwab Fundamental International Small Company Index Fund |
Schwab MarketTrack Balanced Portfolio™ | Schwab Fundamental Emerging Markets Large Company Index Fund |
Schwab MarketTrack Conservative Portfolio™ | Schwab Fundamental Global Real Estate Index Fund |
Schwab International Opportunities Fund | Schwab Target 2010 Index Fund |
Schwab Balanced Fund | Schwab Target 2015 Index Fund |
Schwab Core Equity Fund | Schwab Target 2020 Index Fund |
Schwab Dividend Equity Fund | Schwab Target 2025 Index Fund |
Schwab Large-Cap Growth Fund | Schwab Target 2030 Index Fund |
Schwab Small-Cap Equity Fund | Schwab Target 2035 Index Fund |
Schwab Health Care Fund | Schwab Target 2040 Index Fund |
Schwab International Core Equity Fund | Schwab Target 2045 Index Fund |
Schwab Target 2010 Fund | Schwab Target 2050 Index Fund |
Schwab Target 2015 Fund | Schwab Target 2055 Index Fund |
Schwab Target 2020 Fund | Schwab Target 2060 Index Fund |
Schwab Target 2025 Fund | Schwab Target 2065 Index Fund |
Schwab Target 2030 Fund | Schwab Monthly Income Fund – Target Payout |
Schwab Target 2035 Fund | Schwab Monthly Income Fund – Flexible Payout |
Schwab Target 2040 Fund | Schwab Monthly Income Fund – Income Payout |
SCHWAB INVESTMENTS | |
Schwab 1000 Index Fund | Schwab Tax-Free Bond Fund |
Schwab Treasury Inflation Protected Securities Index Fund | Schwab California Tax-Free Bond Fund |
Schwab U.S. Aggregate Bond Index Fund | Schwab Opportunistic Municipal Bond Fund |
Schwab Short-Term Bond Index Fund | Schwab Global Real Estate Fund |
The Schwab 1000 Index Fund’s goal is to match the total return of the Schwab 1000 Index.
The Schwab Small-Cap Index Fund’s goal is to track the performance of a benchmark index that measures the total return of small capitalization U.S. Stocks.
The Schwab Total Stock Market Index Fund’s goal is to track the total return of the entire U.S. stock market, as measured by the Dow Jones U.S. Total Stock Market IndexSM.
The Schwab U.S. Large-Cap Growth Index Fund’s goal is to track the performance of a benchmark index that measures the total return of large capitalization U.S. growth stocks.
The Schwab U.S. Large-Cap Value Index Fund’s goal is to track the performance of a benchmark index that measures the total return of large capitalization U.S. value stocks.
The Schwab U.S. Mid-Cap Index Fund’s goal is to track the performance of a benchmark index that measures the total return of mid capitalization U.S. stocks.
The Schwab International Index Fund’s goal is to track the performance of a benchmark index that measures the total return of large, publicly traded non-U.S. companies from countries with developed equity markets outside of the United States.
2. Significant Accounting Policies:
3. Risk Factors:
4. Affiliates and Affiliated Transactions:
SCHWAB S&P 500 INDEX FUND | SCHWAB 1000 INDEX FUND | SCHWAB SMALL-CAP INDEX FUND | SCHWAB TOTAL STOCK MARKET INDEX FUND | SCHWAB U.S. LARGE-CAP GROWTH INDEX FUND | SCHWAB U.S. LARGE-CAP VALUE INDEX FUND | SCHWAB U.S. MID-CAP INDEX FUND | SCHWAB INTERNATIONAL INDEX FUND |
0.02 % | 0.05 % | 0.04 % | 0.03 % | 0.035 % | 0.035 % | 0.04 % | 0.06 % |
UNDERLYING FUNDS | |||||
SCHWAB S&P 500 INDEX FUND | SCHWAB SMALL-CAP INDEX FUND | SCHWAB U.S. LARGE-CAP GROWTH INDEX FUND | SCHWAB U.S. MID-CAP INDEX FUND | SCHWAB INTERNATIONAL INDEX FUND | |
Schwab MarketTrack All Equity Portfolio | 0.3 % | 1.2 % | 3.4 % | — % | 1.5 % |
Schwab MarketTrack Balanced Portfolio | 0.1 % | 0.4 % | 1.4 % | — % | 0.6 % |
Schwab MarketTrack Conservative Portfolio | 0.0 %* | 0.1 % | 0.3 % | — % | 0.1 % |
Schwab MarketTrack Growth Portfolio | 0.2 % | 1.0 % | 3.0 % | — % | 1.2 % |
Schwab Target 2010 Fund | 0.0 %* | — % | — % | 0.0 %* | — % |
Schwab Target 2015 Fund | 0.0 %* | — % | — % | 0.0 %* | — % |
Schwab Target 2020 Fund | 0.1 % | — % | — % | 0.3 % | — % |
Schwab Target 2025 Fund | 0.1 % | — % | — % | 0.5 % | — % |
Schwab Target 2030 Fund | 0.2 % | — % | — % | 1.0 % | — % |
Schwab Target 2035 Fund | 0.1 % | — % | — % | 0.7 % | — % |
Schwab Target 2040 Fund | 0.2 % | — % | — % | 1.4 % | — % |
Schwab Target 2045 Fund | 0.1 % | — % | — % | 0.4 % | — % |
Schwab Target 2050 Fund | 0.1 % | — % | — % | 0.4 % | — % |
Schwab Target 2055 Fund | 0.0 %* | — % | — % | 0.3 % | — % |
Schwab Target 2060 Fund | 0.0 %* | — % | — % | 0.1 % | — % |
Schwab Target 2065 Fund | 0.0 %* | — % | — % | 0.0 %* | — % |
* | Less than 0.05% |
PURCHASE COST | SALE PROCEEDS | REALIZED GAINS (LOSSES) | |
Schwab S&P 500 Index Fund | $127,203,038 | $111,644,837 | ($18,418,900 ) |
Schwab 1000 Index Fund | 26,734,890 | 15,122,882 | (2,061,699 ) |
Schwab Small-Cap Index Fund | 12,987,000 | 32,891,527 | (4,622,990 ) |
Schwab Total Stock Market Index Fund | 104,893,274 | 17,561,641 | (29,994,370 ) |
Schwab U.S. Large-Cap Growth Index Fund | 11,291,494 | 1,078,081 | (257,174 ) |
Schwab U.S. Large-Cap Value Index Fund | 2,390,500 | 1,981,124 | 9,066 |
Schwab U.S. Mid-Cap Index Fund | 2,140,335 | 6,649,493 | (1,469,836 ) |
Schwab International Index Fund | 112,788 | 49,507,742 | (3,777,362 ) |
5. Board of Trustees:
6. Borrowing from Banks:
7. Derivatives:
EQUITY CONTRACTS | TOTAL | |
Asset Derivatives | ||
Schwab Small-Cap Index Fund | ||
Futures Contracts1 | $159,016 | $159,016 |
Schwab U.S. Large-Cap Growth Index Fund | ||
Futures Contracts1 | 42,835 | 42,835 |
1 | Includes cumulative unrealized appreciation of futures contracts as reported in the fund’s Portfolio Holdings. Only current day’s variation margin on futures contracts is reported in the Statement of Assets and Liabilities. |
Liability Derivatives | ||
Schwab S&P 500 Index Fund | ||
Futures Contracts1 | ($1,359,958 ) | ($1,359,958 ) |
Schwab 1000 Index Fund | ||
Futures Contracts1 | (1,245,549 ) | (1,245,549 ) |
Schwab Total Stock Market Index Fund | ||
Futures Contracts1 | (1,645,219 ) | (1,645,219 ) |
Schwab U.S. Large-Cap Value Index Fund | ||
Futures Contracts1 | (38,433 ) | (38,433 ) |
Schwab U.S. Mid-Cap Index Fund | ||
Futures Contracts1 | (33,305 ) | (33,305 ) |
Schwab International Index Fund | ||
Futures Contracts1 | (1,657,151 ) | (1,657,151 ) |
1 | Includes cumulative unrealized depreciation of futures contracts as reported in each fund’s Portfolio Holdings. Only current day’s variation margin on futures contracts is reported in the Statement of Assets and Liabilities. |
EQUITY CONTRACTS | TOTAL | |
Net Realized Gains (Losses) | ||
Schwab S&P 500 Index Fund | ||
Futures Contracts1 | $48,313,617 | $48,313,617 |
Schwab 1000 Index Fund | ||
Futures Contracts1 | 7,742,689 | 7,742,689 |
Schwab Small-Cap Index Fund | ||
Futures Contracts1 | 1,817,554 | 1,817,554 |
Schwab Total Stock Market Index Fund | ||
Futures Contracts1 | 16,256,342 | 16,256,342 |
Schwab U.S. Large-Cap Growth Index Fund | ||
Futures Contracts1 | 1,291,058 | 1,291,058 |
Schwab U.S. Large-Cap Value Index Fund | ||
Futures Contracts1 | 500,970 | 500,970 |
Schwab U.S. Mid-Cap Index Fund | ||
Futures Contracts1 | 1,150,615 | 1,150,615 |
Schwab International Index Fund | ||
Futures Contracts1 | 8,086,875 | 8,086,875 |
1 | Statement of Operations location: Net realized gains (losses) on futures contracts. |
Net Change in Unrealized Appreciation (Depreciation) | ||
Schwab S&P 500 Index Fund | ||
Futures Contracts1 | $4,442,430 | $4,442,430 |
Schwab 1000 Index Fund | ||
Futures Contracts1 | 1,979,523 | 1,979,523 |
Schwab Small-Cap Index Fund | ||
Futures Contracts1 | 923,370 | 923,370 |
Schwab Total Stock Market Index Fund | ||
Futures Contracts1 | 1,152,367 | 1,152,367 |
Schwab U.S. Large-Cap Growth Index Fund | ||
Futures Contracts1 | 119,989 | 119,989 |
Schwab U.S. Large-Cap Value Index Fund | ||
Futures Contracts1 | (38,226 ) | (38,226 ) |
Schwab U.S. Mid-Cap Index Fund | ||
Futures Contracts1 | (53,199 ) | (53,199 ) |
Schwab International Index Fund | ||
Futures Contracts1 | 208,246 | 208,246 |
1 | Statement of Operations location: Net change in unrealized appreciation (depreciation) on futures contracts. |
NOTIONAL AMOUNTS | NUMBER OF CONTRACTS | |
Schwab S&P 500 Index Fund | $308,621,904 | 1,280 |
Schwab 1000 Index Fund | 67,017,311 | 280 |
Schwab Small-Cap Index Fund | 25,757,151 | 260 |
Schwab Total Stock Market Index Fund | 90,062,054 | 458 |
Schwab U.S. Large-Cap Growth Index Fund | 7,935,675 | 33 |
Schwab U.S. Large-Cap Value Index Fund | 3,086,766 | 13 |
Schwab U.S. Mid-Cap Index Fund | 5,507,683 | 20 |
Schwab International Index Fund | 76,226,526 | 689 |
8. Purchases and Sales of Investment Securities:
PURCHASES OF SECURITIES | SALES OF SECURITIES | |
Schwab S&P 500 Index Fund | $4,578,267,576 | $511,461,176 |
Schwab 1000 Index Fund | 187,878,936 | 94,593,001 |
Schwab Small-Cap Index Fund | 258,143,151 | 310,640,672 |
Schwab Total Stock Market Index Fund | 974,308,274 | 97,318,115 |
Schwab U.S. Large-Cap Growth Index Fund | 560,195,249 | 30,892,144 |
Schwab U.S. Large-Cap Value Index Fund | 62,720,498 | 54,938,504 |
Schwab U.S. Mid-Cap Index Fund | 154,323,919 | 39,906,532 |
Schwab International Index Fund | 455,657,623 | 435,939,411 |
IN-KIND PURCHASES OF SECURITIES | IN-KIND SALES OF SECURITIES | |
Schwab 1000 Index Fund | $— | $59,907,335 |
Schwab Small-Cap Index Fund | — | 4,481,718 |
TAX COST | GROSS UNREALIZED APPRECIATION | GROSS UNREALIZED DEPRECIATION | NET UNREALIZED APPRECIATION (DEPRECIATION) | |
Schwab S&P 500 Index Fund | $38,368,731,524 | $51,046,501,171 | ($1,453,851,939 ) | $49,592,649,232 |
Schwab 1000 Index Fund | 3,477,801,123 | 12,102,307,124 | (175,061,576 ) | 11,927,245,548 |
Schwab Small-Cap Index Fund | 4,568,390,340 | 1,925,396,734 | (809,765,080 ) | 1,115,631,654 |
Schwab Total Stock Market Index Fund | 10,936,844,270 | 11,839,310,322 | (598,819,833 ) | 11,240,490,489 |
Schwab U.S. Large-Cap Growth Index Fund | 1,613,904,104 | 603,683,125 | (14,364,335 ) | 589,318,790 |
Schwab U.S. Large-Cap Value Index Fund | 567,435,044 | 149,270,257 | (19,910,349 ) | 129,359,908 |
Schwab U.S. Mid-Cap Index Fund | 1,182,002,302 | 296,512,581 | (82,306,801 ) | 214,205,780 |
Schwab International Index Fund | 6,774,435,648 | 2,704,377,677 | (306,877,338 ) | 2,397,500,339 |
Schwab S&P 500 Index Fund | $268,609,359 |
Schwab 1000 Index Fund | 106,818,293 |
Schwab Small-Cap Index Fund | 134,895,627 |
Schwab Total Stock Market Index Fund | 109,439,609 |
Schwab U.S. Large-Cap Growth Index Fund | 38,407,381 |
Schwab U.S. Large-Cap Value Index Fund | — |
Schwab U.S. Mid-Cap Index Fund | 11,482,459 |
Schwab International Index Fund | 560,508,636 |
PRIOR FISCAL YEAR END DISTRIBUTIONS | ||
ORDINARY INCOME | LONG-TERM CAPITAL GAINS | |
Schwab S&P 500 Index Fund | $999,828,367 | $— |
Schwab 1000 Index Fund | 187,210,509 | — |
Schwab Small-Cap Index Fund | 67,319,807 | — |
Schwab Total Stock Market Index Fund | 253,821,250 | — |
Schwab U.S. Large-Cap Growth Index Fund | 8,433,385 | — |
Schwab U.S. Large-Cap Value Index Fund | 13,415,952 | 794,933 |
Schwab U.S. Mid-Cap Index Fund | 13,525,251 | 782,797 |
Schwab International Index Fund | 210,690,877 | — |
10. Subsequent Events:
Independent Trustees | |||
Name, Year of Birth, and Position(s) with the trust (Terms of office, and length of Time Served1) | Principal Occupations During the Past Five Years | Number of Portfolios in Fund Complex Overseen by the Trustee | Other Directorships |
Michael J. Beer 1961 Trustee (Trustee of The Charles Schwab Family of Funds, Schwab Investments, Schwab Capital Trust, Schwab Annuity Portfolios, Schwab Strategic Trust and Laudus Trust since 2022) | Retired. Director, President and Chief Executive Officer (Dec. 2016 – Sept. 2019), Principal Funds (investment management). | 106 | Director (2016 – 2019), Principal Funds, Inc. |
Robert W. Burns 1959 Trustee (Trustee of Schwab Strategic Trust since 2009; The Charles Schwab Family of Funds, Schwab Investments, Schwab Capital Trust, Schwab Annuity Portfolios and Laudus Trust since 2016) | Retired/Private Investor. | 106 | None |
Nancy F. Heller 1956 Trustee (Trustee of The Charles Schwab Family of Funds, Schwab Investments, Schwab Capital Trust, Schwab Annuity Portfolios, Schwab Strategic Trust and Laudus Trust since 2018) | Retired. | 106 | None |
David L. Mahoney 1954 Trustee (Trustee of The Charles Schwab Family of Funds, Schwab Investments, Schwab Capital Trust, Schwab Annuity Portfolios and Laudus Trust since 2011; Schwab Strategic Trust since 2016) | Private Investor. | 106 | Director (2004 – present), Corcept Therapeutics Incorporated Director (2009 – 2021), Adamas Pharmaceuticals, Inc. Director (2003 – 2019), Symantec Corporation |
Jane P. Moncreiff 1961 Trustee (Trustee of The Charles Schwab Family of Funds, Schwab Investments, Schwab Capital Trust, Schwab Annuity Portfolios, Schwab Strategic Trust and Laudus Trust since 2019) | Consultant (2018 – present), Fulham Advisers LLC (management consulting); Chief Investment Officer (2009 – 2017), CareGroup Healthcare System, Inc. (healthcare). | 106 | None |
Independent Trustees (continued) | |||
Name, Year of Birth, and Position(s) with the trust (Terms of office, and length of Time Served1) | Principal Occupations During the Past Five Years | Number of Portfolios in Fund Complex Overseen by the Trustee | Other Directorships |
Kimberly S. Patmore 1956 Trustee (Trustee of The Charles Schwab Family of Funds, Schwab Investments, Schwab Capital Trust, Schwab Annuity Portfolios, Schwab Strategic Trust and Laudus Trust since 2016) | Consultant (2008 – present), Patmore Management Consulting (management consulting). | 106 | None |
J. Derek Penn 1957 Trustee (Trustee of The Charles Schwab Family of Funds, Schwab Investments, Schwab Capital Trust, Schwab Annuity Portfolios, Schwab Strategic Trust and Laudus Trust since 2021) | Head of Equity Sales and Trading (2006 – 2018), BNY Mellon (financial services). | 106 | None |
Interested Trustees | |||
Name, Year of Birth, and Position(s) with the trust (Terms of office, and length of Time Served1) | Principal Occupations During the Past Five Years | Number of Portfolios in Fund Complex Overseen by the Trustee | Other Directorships |
Walter W. Bettinger II2 1960 Chairman and Trustee (Trustee of The Charles Schwab Family of Funds, Schwab Investments, Schwab Capital Trust and Schwab Annuity Portfolios since 2008; Schwab Strategic Trust since 2009; Laudus Trust since 2010) | Co-Chairman of the Board (July 2022 – present), Director and Chief Executive Officer (Oct. 2008 – present) and President (Feb. 2007 – Oct. 2021), The Charles Schwab Corporation; President and Chief Executive Officer (Oct. 2008 – Oct. 2021) and Director (May 2008 – Oct. 2021), Charles Schwab & Co., Inc.; Co-Chairman of the Board (July 2022 – present) and Director (Apr. 2006 – present), Charles Schwab Bank, SSB; Co-Chairman of the Board (July 2022 – present) and Director (Nov. 2017 – present), Charles Schwab Premier Bank, SSB; Co-Chairman of the Board (July 2022 – present) and Director (July 2019 – present), Charles Schwab Trust Bank; Director (May 2008 – present), Chief Executive Officer (Aug. 2017 – present) and President (Aug. 2017 – Nov. 2021), Schwab Holdings, Inc.; Manager (Sept. 2023 – present), TD Ameritrade Holding LLC; Director (Oct. 2020 – Aug. 2023), TD Ameritrade Holding Corporation; Director (July 2016 – Oct. 2021), Charles Schwab Investment Management, Inc. | 106 | Director (2008 – present), The Charles Schwab Corporation |
Richard A. Wurster2 1973 Trustee (Trustee of The Charles Schwab Family of Funds, Schwab Investments, Schwab Capital Trust, Schwab Annuity Portfolios, Schwab Strategic Trust and Laudus Trust since 2022) | President (Oct. 2021 – present) and Executive Vice President – Schwab Asset Management Solutions (Apr. 2019 – Oct. 2021), The Charles Schwab Corporation; President, Director (Oct. 2021 – present), Executive Vice President – Schwab Asset Management Solutions (July 2019 – Oct. 2021) and Senior Vice President – Advisory (May 2016 – July 2019), Charles Schwab & Co., Inc.; President (Nov. 2021 – present), Schwab Holdings, Inc.; Director (Oct. 2021 – present) and Chief Executive Officer (Nov. 2019 – Jan. 2022), Charles Schwab Investment Management, Inc.; Director, Chief Executive Officer and President (Mar. 2018 – Oct. 2022), Charles Schwab Investment Advisory, Inc.; Chief Executive Officer (July 2016 – Apr. 2018) and President (Mar. 2017 – Apr. 2018), ThomasPartners, Inc.; Chief Executive Officer (July 2016 – Apr. 2018), Windhaven Investment Management, Inc. | 106 | None |
Officers of the Trust | |
Name, Year of Birth, and Position(s) with the trust (Terms of office, and length of Time Served3) | Principal Occupations During the Past Five Years |
Omar Aguilar 1970 Chief Executive Officer, President and Chief Investment Officer (Officer of The Charles Schwab Family of Funds, Schwab Investments, Schwab Capital Trust, Schwab Annuity Portfolios, Schwab Strategic Trust and Laudus Trust since 2011) | Chief Executive Officer (Jan. 2022 – present), President (Oct. 2023 – present), (Chief Investment Officer (Apr. 2011 – present) and Senior Vice President (Apr. 2011 – Jan. 2022), Charles Schwab Investment Management, Inc.; Director, Chief Executive Officer and President (Oct. 2022 – present), Charles Schwab Investment Advisory, Inc.; Chief Executive Officer (Sept. 2023 – present), President (Oct. 2023 – present), Chief Investment Officer (June 2011 – present) and Vice President (June 2011 – Sept. 2023), Schwab Funds, Laudus Trust and Schwab ETFs. |
Mark Fischer 1970 Chief Operating Officer (Officer of The Charles Schwab Family of Funds, Schwab Investments, Schwab Capital Trust, Schwab Annuity Portfolios, Schwab Strategic Trust and Laudus Trust since 2013) | Chief Operating Officer (Dec. 2020 – present) and Treasurer and Chief Financial Officer (Jan. 2016 – Dec. 2022), Schwab Funds, Laudus Trust and Schwab ETFs; Chief Financial Officer (Mar. 2020 – present), Chief Operating Officer (Oct. 2023 – present), Managing Director (Mar. 2023 – present) and Vice President (Oct. 2013 – Mar. 2023), Charles Schwab Investment Management, Inc. |
Dana Smith 1965 Treasurer and Chief Financial Officer (Officer of The Charles Schwab Family of Funds, Schwab Investments, Schwab Capital Trust, Schwab Annuity Portfolios, Schwab Strategic Trust and Laudus Trust since 2023) | Treasurer and Chief Financial Officer (Jan. 2023 – present) and Assistant Treasurer (Dec. 2015 – Dec. 2022), Schwab Funds, Laudus Trust and Schwab ETFs; Managing Director (Mar. 2023 – present), Vice President (Mar. 2022 – Mar. 2023) and Director (Oct. 2015 – Mar. 2022), Charles Schwab Investment Management, Inc.; Managing Director (May 2022 – present) and Vice President (Apr. 2022 – May 2022), Charles Schwab & Co., Inc. |
Patrick Cassidy 1964 Vice President and Chief Investment Officer (Officer of The Charles Schwab Family of Funds, Schwab Investments, Schwab Capital Trust, Schwab Annuity Portfolios, Schwab Strategic Trust and Laudus Trust since 2018) | Chief Investment Officer (Oct. 2023 – present) and Vice President (Feb. 2018 – present), Schwab Funds, Laudus Trust and Schwab ETFs; Managing Director (Mar. 2023 – present), Chief Investment Officer (Oct. 2023 – present), and Senior Vice President (Oct. 2012 – Mar. 2023), Charles Schwab Investment Management, Inc. |
William P. McMahon, Jr. 1972 Vice President and Chief Investment Officer (Officer of The Charles Schwab Family of Funds, Schwab Investments, Schwab Capital Trust, Schwab Annuity Portfolios, Schwab Strategic Trust and Laudus Trust since 2021) | Managing Director (Mar. 2023 – present), Senior Vice President (Jan. 2020 – Mar. 2023) and Chief Investment Officer (Jan. 2020 – present) Charles Schwab Investment Management, Inc.; Vice President and Chief Investment Officer (June 2021 – present), Schwab Funds, Laudus Trust and Schwab ETFs; Senior Vice President and Chief Investment Officer – ThomasPartners Strategies (Apr. 2018 – Dec. 2019), Charles Schwab Investment Advisory, Inc.; Senior Vice President and Chief Investment Officer (May 2001 – Apr. 2018), ThomasPartners, Inc. |
Catherine MacGregor 1964 Chief Legal Officer and Secretary, Schwab Funds and Schwab ETFs Chief Legal Officer, Vice President and Clerk, Laudus Trust (Officer of The Charles Schwab Family of Funds, Schwab Investments, Schwab Capital Trust, Schwab Annuity Portfolios and Laudus Trust since 2005; Schwab Strategic Trust since 2009) | Chief Legal Officer (Mar. 2022 – present), Managing Director (Mar. 2023 – present) and Vice President (Sept. 2005 – Mar. 2023), Charles Schwab Investment Management, Inc.; Managing Director (May 2022 – present) and Vice President (Aug. 2005 – May 2022), Charles Schwab & Co., Inc.; Vice President (Dec. 2005 – present) and Chief Legal Officer and Clerk (Mar. 2007 – present), Laudus Trust; Chief Legal Officer and Secretary (Oct. 2021 – present), Vice President (Nov. 2005 – Oct. 2021) and Assistant Secretary (June 2007 – Oct. 2021), Schwab Funds; Chief Legal Officer and Secretary (Oct. 2021 – present), Vice President and Assistant Secretary (Oct. 2009 – Oct. 2021), Schwab ETFs. |
Member SIPC®
Printed on recycled paper.

No Action Required – Notice Regarding Shareholder Report Delivery |
Beginning on July 24, 2024, fund shareholder reports will be streamlined to highlight key information deemed important for investors to assess and monitor their fund investments. Other information, including financial statements, will not appear in the streamlined shareholder reports but will available online and delivered free of charge upon request. |
• If you already receive the full shareholder reports, you will receive the streamlined shareholder reports in the same way that you currently receive the full shareholder reports (either in paper or electronically). |
• If you currently receive a notification when a shareholder report is available on a fund’s website, beginning July 24, 2024, you will begin to receive the streamlined shareholder report (in paper). |
2 | |
3 | |
5 | |
7 | |
9 | |
11 | |
13 | |
15 | |
17 | |
18 | |
24 | |
30 | |
36 | |
45 | |
51 | |
58 | |
71 | |
74 |
Total Return for the 6 Months Ended April 30, 2024 | |
Schwab Core Equity Fund (Ticker Symbol: SWANX) | 18.60% |
S&P 500® Index | 20.98% |
Fund Category: Morningstar Large Blend1 | 19.86% |
Performance Details | pages 5-6 |
Schwab Dividend Equity Fund2 (Ticker Symbol: SWDSX) | 14.32% |
S&P 500® Index3 | 20.98% |
Russell 1000® Value Index | 18.42% |
Fund Category: Morningstar Large Value1 | 17.99% |
Performance Details | pages 7-8 |
Schwab Large-Cap Growth Fund (Ticker Symbol: SWLSX) | 22.01% |
S&P 500® Index3 | 20.98% |
Russell 1000® Growth Index | 23.56% |
Fund Category: Morningstar Large Growth1 | 24.13% |
Performance Details | pages 9-10 |
Schwab Small-Cap Equity Fund (Ticker Symbol: SWSCX) | 19.37% |
S&P 500® Index3 | 20.98% |
Russell 2000® Index | 19.66% |
Fund Category: Morningstar Small Blend1 | 18.81% |
Performance Details | pages 11-12 |
Schwab Health Care Fund2 (Ticker Symbol: SWHFX) | 13.49% |
S&P 500® Index3 | 20.98% |
Dow Jones Global Health Care Index | 13.59% |
Fund Category: Morningstar Health1 | 16.87% |
Performance Details | pages 13-14 |
Schwab International Core Equity Fund2 (Ticker Symbol: SICNX) | 19.96% |
MSCI EAFE® Index (Net)4 | 18.63% |
Fund Category: Morningstar Foreign Large Blend1 | 16.61% |
Performance Details | pages 15-16 |
 | Bill McMahon, CFA, Managing Director and Chief Investment Officer of Active Equity Strategies for Schwab Asset Management, is responsible for investment management, research, and portfolio construction for Schwab Asset Management’s active equity strategies and solutions. He is responsible for the day-to-day co-management of the Schwab Large-Cap Growth Fund, Schwab Core Equity Fund, and Schwab Dividend Equity Fund. Mr. McMahon has more than 20 years of experience in the financial services industry. Prior to his current role, Mr. McMahon was an SVP in Charles Schwab Investment Advisory, Inc. (CSIA), serving as CIO and as a member of the portfolio management team for the ThomasPartners Strategies. Mr. McMahon co-founded ThomasPartners, Inc. in 2001 and served as partner of the firm until its acquisition by the Charles Schwab Corporation in 2012 and subsequent merger with CSIA in 2018. Mr. McMahon began his career at State Street Corporation, with the latter half of his tenure with State Street Global Advisors. |
 | Iain Clayton, CFA, FRM, Senior Portfolio Manager and Head of Quantitative Equity Portfolio Management for Schwab Asset Management, is responsible for the day-to-day co-management of the Schwab Core Equity Fund, Schwab International Core Equity Fund, Schwab Small-Cap Equity Fund, and Schwab Health Care Fund. Mr. Clayton also leads Schwab Asset Management’s quantitative investment management team. Prior to joining Schwab in 2013, Mr. Clayton spent more than five years at SSI Investment Management where he was a portfolio manager and the director of quantitative research. In these roles, Mr. Clayton co-managed multiple investment strategies and developed quantitative models and valuation approaches. From 2004 to 2008, he worked as a portfolio manager and director at RCM Capital Management (now known as Allianz Global Investors) and helped manage various equity portfolios and developed fundamental-based stock selection models. Prior to that, he was a vice president at Eureka Investment Advisors for almost three years and also served as a senior quantitative analyst and assistant portfolio manager. He has also worked as a quantitative research analyst at RCM Capital Management. |
 | Brian Hillburn, CFA, Senior Portfolio Manager and Director of Fundamental Equity Research for Schwab Asset Management, is responsible for the day-to-day co-management of the Schwab Core Equity Fund. Mr. Hillburn also provides fundamental equity research coverage for the ThomasPartners Strategies and the Schwab Active Equity Funds. Previously, Mr. Hillburn was a senior equity research analyst for the ThomasPartners Strategies at Schwab Asset Management. Prior to joining the ThomasPartners Strategies, Mr. Hillburn was an equity analyst at Rockland Trust, and earlier positions include equity research analysis roles on mutual fund teams at Wells Capital and Morgan Stanley Investment Management. |
 | Wei Li, Ph.D., CFA, Senior Portfolio Manager for Schwab Asset Management, is responsible for the day-to-day co-management of the Schwab International Core Equity Fund, Schwab Dividend Equity Fund, Schwab Small-Cap Equity Fund, and Schwab Health Care Fund. Prior to joining Schwab in 2012, Ms. Li spent more than 10 years at Barclays Global Investors (now known as BlackRock) where she held a number of positions. From 2001 to 2009, she worked in various roles in the global advanced active group, including portfolio management and quantitative research for both U.S. and international equity markets. After 2009, she worked in the defined contribution research and product development area for almost two years. |
 | Gretchen Novak, CFA, Senior Portfolio Manager for Schwab Asset Management, is responsible for the day-to-day co-management of the Schwab Large-Cap Growth Fund. Ms. Novak also provides fundamental equity research coverage of certain industry sectors for the ThomasPartners Strategies and the Schwab Active Equity Funds. Previously, Ms. Novak was a director and senior equity research analyst for the ThomasPartners Strategies at Schwab Asset Management. Prior to joining the ThomasPartners Strategies, Ms. Novak was a senior portfolio manager at Mazama Capital Management, Inc., where she oversaw the equity research and portfolio management of the firm’s consumer discretionary and staples sectors. Prior to Mazama Capital, Ms. Novak was an equity analyst at Cramer Rosenthal McGlynn, LLC. |
 | Jim Serhant, CFA, Senior Portfolio Manager for Schwab Asset Management, is responsible for the day-to-day co-management of the Schwab Dividend Equity Fund and the ThomasPartners Balanced Strategies. Mr. Serhant also provides fundamental equity research coverage of certain industry sectors for the ThomasPartners Strategies and the Schwab Active Equity Funds. Prior to joining Schwab in 2016, Mr. Serhant was an executive vice president at Hartford Investment Management where he was the head of high yield and a senior portfolio manager, overseeing the credit research and portfolio management of the firm’s high yield strategies. Previously, he was a fixed income analyst at Delaware Investments and JP Morgan. |
 | Holly Emerson, CFA, Senior Portfolio Manager for Schwab Asset Management, is responsible for the day-to-day co-management of the Schwab Large-Cap Growth Fund and Schwab Small-Cap Equity Fund. Prior to joining Schwab in 2014, Ms. Emerson spent nearly 10 years at Algert Coldiron Investors LLC (now known as Algert Global), a quantitative market-neutral hedge fund manager. She held a number of positions at Algert, including assistant portfolio manager and director of operations. In her various roles, she acted as the lead portfolio manager for the Canadian fund, conducted macroeconomic research, and managed relationships with prime brokerage investment banks. |
Fund and Inception Date | 6 Months | 1 Year | 5 Years | 10 Years |
Fund: Schwab Core Equity Fund (7/1/96) | 18.60% | 18.34% | 10.75% | 10.38% |
S&P 500® Index | 20.98% | 22.66% | 13.19% | 12.41% |
Fund Category: Morningstar Large Blend 2 | 19.86% | 20.31% | 11.78% | 10.96% |
Fund Expense Ratio3: 0.73% | ||||
Number of Holdings | 53 |
Weighted Average Market Cap (millions) | $939,793 |
Price/Earnings Ratio (P/E) | 27.0 |
Price/Book Ratio (P/B) | 5.8 |
Portfolio Turnover Rate | 18% 1 |
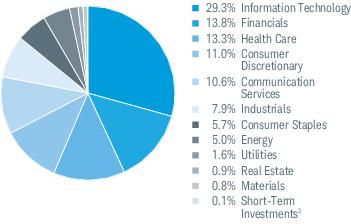
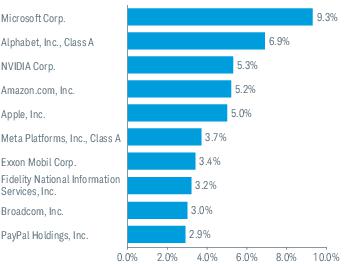
Fund and Inception Date | 6 Months | 1 Year | 5 Years | 10 Years |
Fund: Schwab Dividend Equity Fund (9/2/03) | 14.32% | 8.63% | 6.21% | 6.39% |
S&P 500® Index 3 | 20.98% | 22.66% | 13.19% | 12.41% |
Russell 1000® Value Index | 18.42% | 13.42% | 8.60% | 8.43% |
Dividend Equity Spliced Index | 18.42% | 13.42% | 8.60% | 8.81% |
Fund Category: Morningstar Large Value 4 | 17.99% | 14.37% | 9.20% | 8.57% |
Fund Expense Ratio5: 0.88% | ||||
30-Day SEC Yield | 2.03% |
Number of Holdings | 59 |
Weighted Average Market Cap (millions) | $323,852 |
Price/Earnings Ratio (P/E) | 19.9 |
Price/Book Ratio (P/B) | 3.2 |
Portfolio Turnover Rate | 8% 1 |
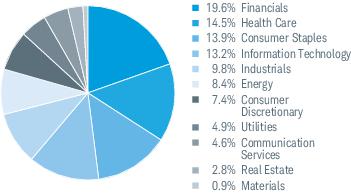
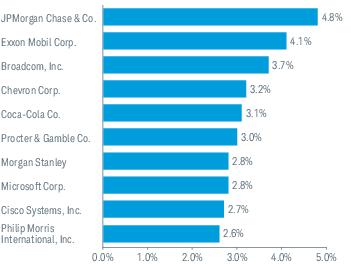
Fund and Inception Date | 6 Months | 1 Year | 5 Years | 10 Years |
Fund: Schwab Large-Cap Growth Fund (10/3/05) | 22.01% | 28.78% | 14.52% | 13.15% |
S&P 500® Index 2 | 20.98% | 22.66% | 13.19% | 12.41% |
Russell 1000® Growth Index | 23.56% | 31.80% | 16.46% | 15.48% |
Fund Category: Morningstar Large Growth 3 | 24.13% | 29.19% | 12.82% | 12.85% |
Fund Expense Ratios4: Net 0.99%; Gross 1.01% | ||||
Number of Holdings | 62 |
Weighted Average Market Cap (millions) | $1,091,780 |
Price/Earnings Ratio (P/E) | 33.0 |
Price/Book Ratio (P/B) | 9.4 |
Portfolio Turnover Rate | 6% 2 |
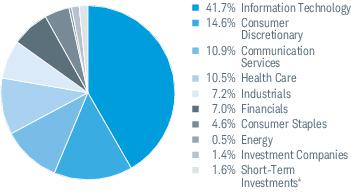
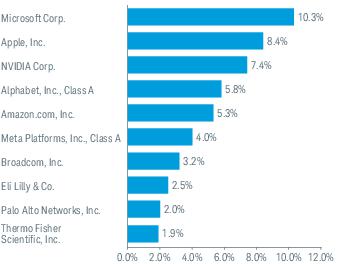
Fund and Inception Date | 6 Months | 1 Year | 5 Years | 10 Years |
Fund: Schwab Small-Cap Equity Fund (7/1/03) | 19.37% | 17.80% | 7.20% | 7.46% |
S&P 500® Index 2 | 20.98% | 22.66% | 13.19% | 12.41% |
Russell 2000® Index | 19.66% | 13.32% | 5.83% | 7.22% |
Fund Category: Morningstar Small Blend 3 | 18.81% | 13.98% | 7.17% | 7.28% |
Fund Expense Ratio4: 1.09% | ||||
Number of Holdings | 308 |
Weighted Average Market Cap (millions) | $4,391 |
Price/Earnings Ratio (P/E) | 13.7 |
Price/Book Ratio (P/B) | 1.9 |
Portfolio Turnover Rate | 46% 2 |
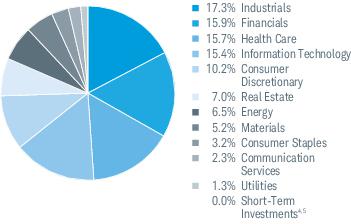
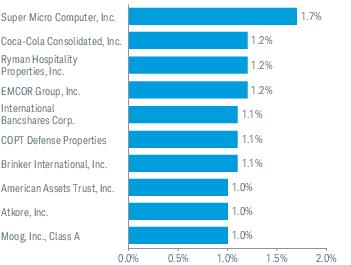
Fund and Inception Date | 6 Months | 1 Year | 5 Years | 10 Years |
Fund: Schwab Health Care Fund (7/3/00) | 13.49% | 6.04% | 9.45% | 9.35% |
S&P 500® Index 3 | 20.98% | 22.66% | 13.19% | 12.41% |
Dow Jones Global Health Care Index | 13.59% | 4.54% | 8.78% | 8.59% |
Fund Category: Morningstar Health 4 | 16.87% | 1.63% | 6.68% | 8.71% |
Fund Expense Ratio5: 0.79% | ||||
Number of Holdings | 85 |
Weighted Average Market Cap (millions) | $227,562 |
Price/Earnings Ratio (P/E) | 32.7 |
Price/Book Ratio (P/B) | 5.5 |
Portfolio Turnover Rate | 30% 1 |
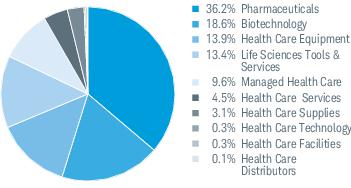
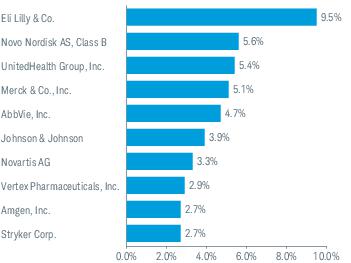
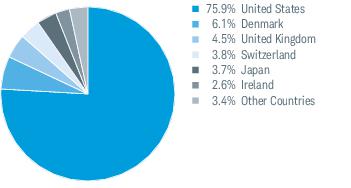
Fund and Inception Date | 6 Months | 1 Year | 5 Years | 10 Years |
Fund: Schwab International Core Equity Fund (5/30/08) | 19.96% | 14.38% | 5.70% | 3.93% |
MSCI EAFE® Index (Net) 3 | 18.63% | 9.28% | 6.18% | 4.38% |
Fund Category: Morningstar Foreign Large Blend 4 | 16.61% | 8.18% | 5.40% | 4.18% |
Fund Expense Ratios5: Net 0.86%; Gross 0.87% | ||||
Number of Holdings | 152 |
Weighted Average Market Cap (millions) | $121,253 |
Price/Earnings Ratio (P/E) | 12.8 |
Price/Book Ratio (P/B) | 1.9 |
Portfolio Turnover Rate | 31% 1 |
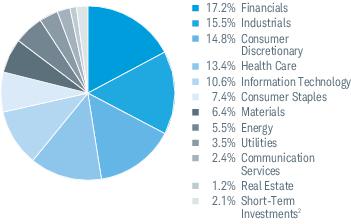
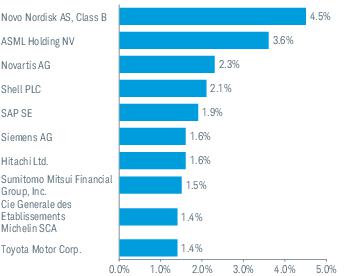
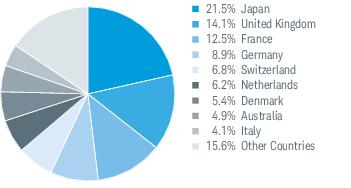
EXPENSE RATIO (ANNUALIZED) 1 | BEGINNING ACCOUNT VALUE AT 11/1/23 | ENDING ACCOUNT VALUE (NET OF EXPENSES) AT 4/30/24 | EXPENSES PAID DURING PERIOD 11/1/23-4/30/24 2 | |
Schwab Core Equity Fund | ||||
Actual Return | 0.73% | $1,000.00 | $1,186.00 | $3.97 |
Hypothetical 5% Return | 0.73% | $1,000.00 | $1,021.23 | $3.67 |
Schwab Dividend Equity Fund | ||||
Actual Return | 0.89% | $1,000.00 | $1,143.20 | $4.74 |
Hypothetical 5% Return | 0.89% | $1,000.00 | $1,020.44 | $4.47 |
Schwab Large-Cap Growth Fund | ||||
Actual Return | 0.99% | $1,000.00 | $1,220.10 | $5.46 |
Hypothetical 5% Return | 0.99% | $1,000.00 | $1,019.94 | $4.97 |
Schwab Small-Cap Equity Fund | ||||
Actual Return | 1.08% | $1,000.00 | $1,193.70 | $5.89 |
Hypothetical 5% Return | 1.08% | $1,000.00 | $1,019.49 | $5.42 |
Schwab Health Care Fund | ||||
Actual Return | 0.79% | $1,000.00 | $1,134.90 | $4.19 |
Hypothetical 5% Return | 0.79% | $1,000.00 | $1,020.93 | $3.97 |
Schwab International Core Equity Fund | ||||
Actual Return | 0.86% | $1,000.00 | $1,199.60 | $4.70 |
Hypothetical 5% Return | 0.86% | $1,000.00 | $1,020.59 | $4.32 |
1 | Based on the most recent six-month expense ratio. |
2 | Expenses for each fund are equal to its annualized expense ratio, multiplied by the average account value over the period, multiplied by 182 days in the period, and divided by 366 days in the fiscal year. |
11/1/23– 4/30/24* | 11/1/22– 10/31/23 | 11/1/21– 10/31/22 | 11/1/20– 10/31/21 | 11/1/19– 10/31/20 | 11/1/18– 10/31/19 | |
Per-Share Data | ||||||
Net asset value at beginning of period | $18.45 | $19.46 | $29.22 | $22.24 | $21.87 | $22.40 |
Income (loss) from investment operations: | ||||||
Net investment income (loss)1 | 0.08 | 0.21 | 0.26 | 0.21 | 0.20 | 0.21 |
Net realized and unrealized gains (losses) | 3.31 | 1.57 | (3.16 ) | 7.90 | 0.82 | 1.99 |
Total from investment operations | 3.39 | 1.78 | (2.90 ) | 8.11 | 1.02 | 2.20 |
Less distributions: | ||||||
Distributions from net investment income | (0.21 ) | (0.27 ) | (0.26 ) | (0.20 ) | (0.20 ) | (0.27 ) |
Distributions from net realized gains | (0.37 ) | (2.52 ) | (6.60 ) | (0.93 ) | (0.45 ) | (2.46 ) |
Total distributions | (0.58 ) | (2.79 ) | (6.86 ) | (1.13 ) | (0.65 ) | (2.73 ) |
Net asset value at end of period | $21.26 | $18.45 | $19.46 | $29.22 | $22.24 | $21.87 |
Total return | 18.60 %2 | 9.99 % | (13.84 %) | 37.62 % | 4.65 % | 12.02 % |
Ratios/Supplemental Data | ||||||
Ratios to average net assets: | ||||||
Net operating expenses | 0.73 %3 | 0.73 %4 | 0.73 %4 | 0.73 % | 0.73 % | 0.73 % |
Gross operating expenses | 0.73 %3 | 0.73 %4 | 0.73 %4 | 0.73 % | 0.73 % | 0.73 % |
Net investment income (loss) | 0.75 %3 | 1.11 % | 1.18 % | 0.81 % | 0.91 % | 1.01 % |
Portfolio turnover rate | 18 %2 | 14 % | 28 % | 86 % | 97 % | 98 % |
Net assets, end of period (x 1,000,000) | $1,321 | $1,199 | $1,268 | $1,860 | $1,957 | $2,182 |
* | Unaudited. |
1 | Calculated based on the average shares outstanding during the period. |
2 | Not annualized. |
3 | Annualized. |
4 | Ratio includes less than 0.005% of non-routine proxy expenses. |
SECURITY | NUMBER OF SHARES | VALUE ($) |
COMMON STOCKS 99.9% OF NET ASSETS | ||
Capital Goods 5.6% | ||
A O Smith Corp. | 189,437 | 15,692,961 |
Caterpillar, Inc. | 52,565 | 17,586,672 |
Fastenal Co. | 122,982 | 8,355,397 |
General Dynamics Corp. | 45,415 | 13,038,192 |
Lockheed Martin Corp. | 15,326 | 7,125,517 |
Parker-Hannifin Corp. | 12,337 | 6,722,555 |
Rockwell Automation, Inc. | 22,358 | 6,058,124 |
74,579,418 | ||
Commercial & Professional Services 2.3% | ||
Republic Services, Inc., Class A | 80,544 | 15,440,285 |
Rollins, Inc. | 334,978 | 14,926,620 |
30,366,905 | ||
Consumer Discretionary Distribution & Retail 8.0% | ||
Amazon.com, Inc. * | 394,176 | 68,980,800 |
Home Depot, Inc. | 36,635 | 12,244,149 |
TJX Cos., Inc. | 261,519 | 24,606,323 |
105,831,272 | ||
Consumer Services 3.0% | ||
McDonald's Corp. | 50,040 | 13,662,922 |
Starbucks Corp. | 295,544 | 26,152,688 |
39,815,610 | ||
Consumer Staples Distribution & Retail 1.3% | ||
Walmart, Inc. | 299,295 | 17,763,158 |
Energy 5.0% | ||
EOG Resources, Inc. | 161,844 | 21,384,448 |
Exxon Mobil Corp. | 377,413 | 44,636,635 |
66,021,083 | ||
Equity Real Estate Investment Trusts (REITs) 0.9% | ||
Public Storage | 46,451 | 12,051,712 |
Financial Services 12.1% | ||
Berkshire Hathaway, Inc., Class B * | 55,625 | 22,068,106 |
CME Group, Inc. | 41,495 | 8,699,012 |
Fidelity National Information Services, Inc. | 630,979 | 42,856,094 |
Morgan Stanley | 123,592 | 11,227,097 |
PayPal Holdings, Inc. * | 563,877 | 38,298,526 |
Visa, Inc., Class A | 134,673 | 36,174,514 |
159,323,349 | ||
SECURITY | NUMBER OF SHARES | VALUE ($) |
Food, Beverage & Tobacco 2.2% | ||
Brown-Forman Corp., Class B | 134,830 | 6,451,616 |
Constellation Brands, Inc., Class A | 91,600 | 23,216,936 |
29,668,552 | ||
Health Care Equipment & Services 6.0% | ||
Abbott Laboratories | 149,554 | 15,848,238 |
Boston Scientific Corp. * | 99,374 | 7,142,009 |
Intuitive Surgical, Inc. * | 76,479 | 28,344,647 |
UnitedHealth Group, Inc. | 56,487 | 27,322,762 |
78,657,656 | ||
Household & Personal Products 2.1% | ||
Kenvue, Inc. | 794,004 | 14,943,155 |
L'Oreal SA, Sponsored ADR | 141,090 | 13,169,341 |
28,112,496 | ||
Insurance 1.8% | ||
Progressive Corp. | 111,528 | 23,225,706 |
Materials 0.8% | ||
Linde PLC | 23,368 | 10,304,353 |
Media & Entertainment 10.6% | ||
Alphabet, Inc., Class A * | 556,341 | 90,561,188 |
Meta Platforms, Inc., Class A | 114,677 | 49,330,605 |
139,891,793 | ||
Pharmaceuticals, Biotechnology & Life Sciences 7.3% | ||
Eli Lilly & Co. | 21,268 | 16,612,435 |
Johnson & Johnson | 215,776 | 31,199,052 |
Mettler-Toledo International, Inc. * | 5,555 | 6,830,983 |
Thermo Fisher Scientific, Inc. | 45,948 | 26,131,546 |
Zoetis, Inc. | 100,749 | 16,043,271 |
96,817,287 | ||
Semiconductors & Semiconductor Equipment 11.2% | ||
ASML Holding NV NY Registry Shares | 20,750 | 18,103,753 |
Broadcom, Inc. | 30,167 | 39,225,245 |
NVIDIA Corp. | 81,338 | 70,277,659 |
QUALCOMM, Inc. | 119,591 | 19,834,167 |
147,440,824 | ||
Software & Services 13.1% | ||
Accenture PLC, Class A | 37,155 | 11,180,311 |
Adobe, Inc. * | 21,000 | 9,719,430 |
Microsoft Corp. | 315,528 | 122,844,516 |
Oracle Corp. | 115,283 | 13,113,442 |
SECURITY | NUMBER OF SHARES | VALUE ($) |
Palo Alto Networks, Inc. * | 55,453 | 16,130,723 |
172,988,422 | ||
Technology Hardware & Equipment 5.0% | ||
Apple, Inc. | 387,826 | 66,058,403 |
Utilities 1.6% | ||
Duke Energy Corp. | 209,354 | 20,571,124 |
Total Common Stocks (Cost $821,262,314) | 1,319,489,123 | |
SHORT-TERM INVESTMENTS 0.2% OF NET ASSETS | ||
Money Market Funds 0.2% | ||
State Street Institutional U.S. Government Money Market Fund, Premier Class 5.25% (a) | 1,955,183 | 1,955,183 |
Total Short-Term Investments (Cost $1,955,183) | 1,955,183 | |
Total Investments in Securities (Cost $823,217,497) | 1,321,444,306 | |
* | Non-income producing security. |
(a) | The rate shown is the annualized 7-day yield. |
ADR — | American Depositary Receipt |
DESCRIPTION | QUOTED PRICES IN ACTIVE MARKETS FOR IDENTICAL ASSETS (LEVEL 1) | OTHER SIGNIFICANT OBSERVABLE INPUTS (LEVEL 2) | SIGNIFICANT UNOBSERVABLE INPUTS (LEVEL 3) | TOTAL |
Assets | ||||
Common Stocks1 | $1,319,489,123 | $— | $— | $1,319,489,123 |
Short-Term Investments1 | 1,955,183 | — | — | 1,955,183 |
Total | $1,321,444,306 | $— | $— | $1,321,444,306 |
1 | As categorized in the Portfolio Holdings. |
Assets | ||
Investments in securities, at value - unaffiliated issuers (cost $823,217,497) | $1,321,444,306 | |
Receivables: | ||
Dividends | 714,046 | |
Foreign tax reclaims | 509,176 | |
Fund shares sold | 55,544 | |
Income from securities on loan | 24 | |
Prepaid expenses | + | 21,751 |
Total assets | 1,322,744,847 | |
Liabilities | ||
Payables: | ||
Fund shares redeemed | 1,016,703 | |
Investment adviser and administrator fees | 521,121 | |
Shareholder service fees | 266,626 | |
Independent trustees’ fees | 12 | |
Accrued expenses | + | 168,335 |
Total liabilities | 1,972,797 | |
Net assets | $1,320,772,050 | |
Net Assets by Source | ||
Capital received from investors | $758,293,588 | |
Total distributable earnings | + | 562,478,462 |
Net assets | $1,320,772,050 | |
Net Asset Value (NAV) | ||||
Net Assets | ÷ | Shares Outstanding | = | NAV |
$1,320,772,050 | 62,117,219 | $21.26 | ||
For the period November 1, 2023 through April 30, 2024; unaudited | ||
Investment Income | ||
Dividends received from securities - unaffiliated issuers (net of foreign withholding tax of $46,289) | $9,703,136 | |
Securities on loan, net | + | 166 |
Total investment income | 9,703,302 | |
Expenses | ||
Investment adviser and administrator fees | 3,091,175 | |
Shareholder service fees | 1,573,859 | |
Portfolio accounting fees | 26,749 | |
Custodian fees | 25,127 | |
Shareholder reports | 18,361 | |
Professional fees | 17,606 | |
Registration fees | 14,147 | |
Independent trustees’ fees | 4,275 | |
Transfer agent fees | 2,375 | |
Other expenses | + | 10,825 |
Total expenses | – | 4,784,499 |
Net investment income | 4,918,803 | |
REALIZED AND UNREALIZED GAINS (LOSSES) | ||
Net realized gains on sales of securities - unaffiliated issuers | 61,967,467 | |
Net change in unrealized appreciation (depreciation) on securities - unaffiliated issuers | + | 152,410,508 |
Net realized and unrealized gains | 214,377,975 | |
Increase in net assets resulting from operations | $219,296,778 | |
OPERATIONS | |||
11/1/23-4/30/24 | 11/1/22-10/31/23 | ||
Net investment income | $4,918,803 | $13,962,790 | |
Net realized gains | 61,967,467 | 23,836,741 | |
Net change in unrealized appreciation (depreciation) | + | 152,410,508 | 84,423,447 |
Increase in net assets resulting from operations | $219,296,778 | $122,222,978 | |
DISTRIBUTIONS TO SHAREHOLDERS | |||
Total distributions | ($37,066,028 ) | ($178,308,221 ) | |
TRANSACTIONS IN FUND SHARES | |||||
11/1/23-4/30/24 | 11/1/22-10/31/23 | ||||
SHARES | VALUE | SHARES | VALUE | ||
Shares sold | 783,764 | $16,396,195 | 1,398,439 | $25,573,378 | |
Shares reinvested | 1,672,817 | 33,188,680 | 9,184,555 | 159,902,917 | |
Shares redeemed | + | (5,342,994 ) | (110,494,328 ) | (10,722,232 ) | (197,774,526 ) |
Net transactions in fund shares | (2,886,413 ) | ($60,909,453 ) | (139,238 ) | ($12,298,231 ) | |
SHARES OUTSTANDING AND NET ASSETS | |||||
11/1/23-4/30/24 | 11/1/22-10/31/23 | ||||
SHARES | NET ASSETS | SHARES | NET ASSETS | ||
Beginning of period | 65,003,632 | $1,199,450,753 | 65,142,870 | $1,267,834,227 | |
Total increase (decrease) | + | (2,886,413 ) | 121,321,297 | (139,238 ) | (68,383,474 ) |
End of period | 62,117,219 | $1,320,772,050 | 65,003,632 | $1,199,450,753 | |
11/1/23– 4/30/24* | 11/1/22– 10/31/23 | 11/1/21– 10/31/22 | 11/1/20– 10/31/21 | 11/1/19– 10/31/20 | 11/1/18– 10/31/19 | |
Per-Share Data | ||||||
Net asset value at beginning of period | $12.80 | $13.92 | $16.92 | $12.14 | $15.07 | $15.43 |
Income (loss) from investment operations: | ||||||
Net investment income (loss)1 | 0.16 | 0.29 | 0.29 | 0.31 | 0.28 | 0.23 |
Net realized and unrealized gains (losses) | 1.67 | (0.48 ) | (0.81 ) | 4.80 | (2.15 ) | 0.93 |
Total from investment operations | 1.83 | (0.19 ) | (0.52 ) | 5.11 | (1.87 ) | 1.16 |
Less distributions: | ||||||
Distributions from net investment income | (0.15 ) | (0.31 ) | (0.29 ) | (0.33 ) | (0.26 ) | (0.24 ) |
Distributions from net realized gains | (0.02 ) | (0.62 ) | (2.19 ) | — | (0.80 ) | (1.28 ) |
Total distributions | (0.17 ) | (0.93 ) | (2.48 ) | (0.33 ) | (1.06 ) | (1.52 ) |
Net asset value at end of period | $14.46 | $12.80 | $13.92 | $16.92 | $12.14 | $15.07 |
Total return | 14.32 %2 | (1.74 %) | (3.96 %) | 42.38 % | (13.30 %) | 8.78 % |
Ratios/Supplemental Data | ||||||
Ratios to average net assets: | ||||||
Net operating expenses | 0.89 %3 | 0.88 % | 0.89 %4 | 0.89 % | 0.89 % | 0.89 % |
Gross operating expenses | 0.89 %3 | 0.88 % | 0.90 %4 | 0.90 % | 0.90 % | 0.89 % |
Net investment income (loss) | 2.22 %3 | 2.17 % | 1.99 % | 2.01 % | 2.16 % | 1.58 % |
Portfolio turnover rate | 8 %2 | 8 % | 27 % | 83 % | 70 % | 70 % |
Net assets, end of period (x 1,000) | $495,488 | $446,084 | $524,330 | $670,765 | $576,701 | $846,955 |
* | Unaudited. |
1 | Calculated based on the average shares outstanding during the period. |
2 | Not annualized. |
3 | Annualized. |
4 | Ratio includes less than 0.005% of non-routine proxy expenses. |
SECURITY | NUMBER OF SHARES | VALUE ($) |
COMMON STOCKS 99.6% OF NET ASSETS | ||
Banks 7.4% | ||
Bank of America Corp. | 250,000 | 9,252,500 |
JPMorgan Chase & Co. | 125,000 | 23,967,500 |
Truist Financial Corp. | 90,000 | 3,379,500 |
36,599,500 | ||
Capital Goods 8.9% | ||
Caterpillar, Inc. | 10,000 | 3,345,700 |
Fastenal Co. | 62,000 | 4,212,280 |
General Dynamics Corp. | 15,000 | 4,306,350 |
Illinois Tool Works, Inc. | 18,500 | 4,516,035 |
Lockheed Martin Corp. | 27,000 | 12,553,110 |
Parker-Hannifin Corp. | 13,000 | 7,083,830 |
RTX Corp. | 43,000 | 4,365,360 |
Watsco, Inc. | 8,000 | 3,581,760 |
43,964,425 | ||
Consumer Discretionary Distribution & Retail 5.3% | ||
Genuine Parts Co. | 35,000 | 5,502,350 |
Home Depot, Inc. | 33,500 | 11,196,370 |
TJX Cos., Inc. | 100,000 | 9,409,000 |
26,107,720 | ||
Consumer Services 2.1% | ||
McDonald's Corp. | 39,000 | 10,648,560 |
Consumer Staples Distribution & Retail 2.5% | ||
Walmart, Inc. | 210,000 | 12,463,500 |
Energy 8.4% | ||
Chevron Corp. | 100,000 | 16,127,000 |
Exxon Mobil Corp. | 170,000 | 20,105,900 |
Kinder Morgan, Inc. | 290,000 | 5,301,200 |
41,534,100 | ||
Equity Real Estate Investment Trusts (REITs) 2.8% | ||
Alexandria Real Estate Equities, Inc. | 16,500 | 1,911,855 |
Crown Castle, Inc. | 30,000 | 2,813,400 |
Lamar Advertising Co., Class A | 40,000 | 4,634,000 |
Public Storage | 17,500 | 4,540,375 |
13,899,630 | ||
Financial Services 9.1% | ||
BlackRock, Inc. | 16,500 | 12,451,560 |
Fidelity National Information Services, Inc. | 175,000 | 11,886,000 |
Morgan Stanley | 155,000 | 14,080,200 |
Visa, Inc., Class A | 25,000 | 6,715,250 |
45,133,010 | ||
SECURITY | NUMBER OF SHARES | VALUE ($) |
Food, Beverage & Tobacco 7.2% | ||
Altria Group, Inc. | 85,000 | 3,723,850 |
Coca-Cola Co. | 245,000 | 15,133,650 |
Constellation Brands, Inc., Class A | 15,000 | 3,801,900 |
Philip Morris International, Inc. | 138,000 | 13,101,720 |
35,761,120 | ||
Health Care Equipment & Services 6.9% | ||
Abbott Laboratories | 77,000 | 8,159,690 |
CVS Health Corp. | 110,000 | 7,448,100 |
Medtronic PLC | 113,000 | 9,067,120 |
UnitedHealth Group, Inc. | 20,000 | 9,674,000 |
34,348,910 | ||
Household & Personal Products 4.1% | ||
Kenvue, Inc. | 280,000 | 5,269,600 |
Procter & Gamble Co. | 91,000 | 14,851,200 |
20,120,800 | ||
Insurance 3.0% | ||
Allstate Corp. | 56,000 | 9,523,360 |
Progressive Corp. | 25,000 | 5,206,250 |
14,729,610 | ||
Materials 0.9% | ||
PPG Industries, Inc. | 35,000 | 4,515,000 |
Media & Entertainment 2.6% | ||
Comcast Corp., Class A | 275,000 | 10,480,250 |
Omnicom Group, Inc. | 26,250 | 2,437,050 |
12,917,300 | ||
Pharmaceuticals, Biotechnology & Life Sciences 7.5% | ||
AbbVie, Inc. | 60,000 | 9,758,400 |
Johnson & Johnson | 72,310 | 10,455,303 |
Merck & Co., Inc. | 30,000 | 3,876,600 |
Pfizer, Inc. | 200,000 | 5,124,000 |
Roche Holding AG | 20,000 | 4,792,284 |
Zoetis, Inc. | 18,750 | 2,985,750 |
36,992,337 | ||
Semiconductors & Semiconductor Equipment 3.7% | ||
Broadcom, Inc. | 14,000 | 18,203,780 |
Software & Services 5.9% | ||
Accenture PLC, Class A | 20,000 | 6,018,200 |
International Business Machines Corp. | 55,000 | 9,141,000 |
Microsoft Corp. | 36,000 | 14,015,880 |
29,175,080 | ||
SECURITY | NUMBER OF SHARES | VALUE ($) |
Technology Hardware & Equipment 3.6% | ||
Apple, Inc. | 26,000 | 4,428,580 |
Cisco Systems, Inc. | 287,500 | 13,506,750 |
17,935,330 | ||
Telecommunication Services 2.0% | ||
Verizon Communications, Inc. | 250,000 | 9,872,500 |
Transportation 0.9% | ||
United Parcel Service, Inc., Class B | 30,000 | 4,424,400 |
SECURITY | NUMBER OF SHARES | VALUE ($) |
Utilities 4.8% | ||
Duke Energy Corp. | 127,500 | 12,528,150 |
Eversource Energy | 80,000 | 4,849,600 |
NextEra Energy, Inc. | 100,000 | 6,697,000 |
24,074,750 | ||
Total Common Stocks (Cost $388,002,949) | 493,421,362 | |
Total Investments in Securities (Cost $388,002,949) | 493,421,362 | |
DESCRIPTION | QUOTED PRICES IN ACTIVE MARKETS FOR IDENTICAL ASSETS (LEVEL 1) | OTHER SIGNIFICANT OBSERVABLE INPUTS (LEVEL 2) | SIGNIFICANT UNOBSERVABLE INPUTS (LEVEL 3) | TOTAL |
Assets | ||||
Common Stocks1 | $456,429,025 | $— | $— | $456,429,025 |
Pharmaceuticals, Biotechnology & Life Sciences | 32,200,053 | 4,792,284 | — | 36,992,337 |
Total | $488,629,078 | $4,792,284 | $— | $493,421,362 |
1 | As categorized in the Portfolio Holdings. |
Assets | ||
Investments in securities, at value - unaffiliated issuers (cost $388,002,949) | $493,421,362 | |
Cash | 1,593,110 | |
Receivables: | ||
Dividends | 786,746 | |
Foreign tax reclaims | 272,369 | |
Fund shares sold | 55,844 | |
Prepaid expenses | + | 11,963 |
Total assets | 496,141,394 | |
Liabilities | ||
Payables: | ||
Investment adviser and administrator fees | 256,122 | |
Fund shares redeemed | 222,779 | |
Shareholder service fees | 98,324 | |
Accrued expenses | + | 76,098 |
Total liabilities | 653,323 | |
Net assets | $495,488,071 | |
Net Assets by Source | ||
Capital received from investors | $390,456,572 | |
Total distributable earnings | + | 105,031,499 |
Net assets | $495,488,071 | |
Net Asset Value (NAV) | ||||
Net Assets | ÷ | Shares Outstanding | = | NAV |
$495,488,071 | 34,272,286 | $14.46 | ||
For the period November 1, 2023 through April 30, 2024; unaudited | ||
Investment Income | ||
Dividends received from securities - unaffiliated issuers (net of foreign withholding tax of $39,522) | $7,582,854 | |
Other interest | + | 14,189 |
Total investment income | 7,597,043 | |
Expenses | ||
Investment adviser and administrator fees | 1,516,713 | |
Shareholder service fees | 574,381 | |
Portfolio accounting fees | 27,928 | |
Professional fees | 16,478 | |
Registration fees | 12,766 | |
Shareholder reports | 11,829 | |
Independent trustees’ fees | 3,421 | |
Transfer agent fees | 1,798 | |
Custodian fees | 926 | |
Other expenses | + | 2,706 |
Total expenses | – | 2,168,946 |
Net investment income | 5,428,097 | |
REALIZED AND UNREALIZED GAINS (LOSSES) | ||
Net realized losses on sales of securities - unaffiliated issuers | (343,300 ) | |
Net realized losses on foreign currency transactions | + | (2,134 ) |
Net realized losses | (345,434 ) | |
Net change in unrealized appreciation (depreciation) on securities - unaffiliated issuers | 58,209,196 | |
Net change in unrealized appreciation (depreciation) on foreign currency translations | + | (12,208 ) |
Net change in unrealized appreciation (depreciation) | + | 58,196,988 |
Net realized and unrealized gains | 57,851,554 | |
Increase in net assets resulting from operations | $63,279,651 | |
OPERATIONS | |||
11/1/23-4/30/24 | 11/1/22-10/31/23 | ||
Net investment income | $5,428,097 | $10,828,133 | |
Net realized gains (losses) | (345,434 ) | 758,540 | |
Net change in unrealized appreciation (depreciation) | + | 58,196,988 | (17,919,252 ) |
Increase (decrease) in net assets resulting from operations | $63,279,651 | ($6,332,579 ) | |
DISTRIBUTIONS TO SHAREHOLDERS | |||
Total distributions | ($5,893,475 ) | ($34,391,214 ) | |
TRANSACTIONS IN FUND SHARES | |||||
11/1/23-4/30/24 | 11/1/22-10/31/23 | ||||
SHARES | VALUE | SHARES | VALUE | ||
Shares sold | 2,224,162 | $31,941,601 | 1,647,548 | $22,504,313 | |
Shares reinvested | 306,816 | 4,419,607 | 1,976,602 | 27,111,544 | |
Shares redeemed | + | (3,112,525 ) | (44,343,211 ) | (6,431,601 ) | (87,138,179 ) |
Net transactions in fund shares | (581,547 ) | ($7,982,003 ) | (2,807,451 ) | ($37,522,322 ) | |
SHARES OUTSTANDING AND NET ASSETS | |||||
11/1/23-4/30/24 | 11/1/22-10/31/23 | ||||
SHARES | NET ASSETS | SHARES | NET ASSETS | ||
Beginning of period | 34,853,833 | $446,083,898 | 37,661,284 | $524,330,013 | |
Total increase (decrease) | + | (581,547 ) | 49,404,173 | (2,807,451 ) | (78,246,115 ) |
End of period | 34,272,286 | $495,488,071 | 34,853,833 | $446,083,898 | |
11/1/23– 4/30/24* | 11/1/22– 10/31/23 | 11/1/21– 10/31/22 | 11/1/20– 10/31/21 | 11/1/19– 10/31/20 | 11/1/18– 10/31/19 | |
Per-Share Data | ||||||
Net asset value at beginning of period | $24.35 | $20.80 | $28.96 | $20.85 | $18.07 | $18.04 |
Income (loss) from investment operations: | ||||||
Net investment income (loss)1 | (0.01 ) | 0.01 | (0.01 ) | (0.06 ) | 0.00 2 | 0.06 |
Net realized and unrealized gains (losses) | 5.37 | 3.95 | (5.97 ) | 8.42 | 3.76 | 1.79 |
Total from investment operations | 5.36 | 3.96 | (5.98 ) | 8.36 | 3.76 | 1.85 |
Less distributions: | ||||||
Distributions from net investment income | (0.01 ) | (0.00 )2 | — | — | (0.03 ) | (0.07 ) |
Distributions from net realized gains | — | (0.41 ) | (2.18 ) | (0.25 ) | (0.95 ) | (1.75 ) |
Total distributions | (0.01 ) | (0.41 ) | (2.18 ) | (0.25 ) | (0.98 ) | (1.82 ) |
Net asset value at end of period | $29.70 | $24.35 | $20.80 | $28.96 | $20.85 | $18.07 |
Total return | 22.01 %3 | 19.37 % | (22.45 %) | 40.41 % | 21.60 % | 12.18 % |
Ratios/Supplemental Data | ||||||
Ratios to average net assets: | ||||||
Net operating expenses | 0.99 %4 | 0.99 % | 0.99 %5 | 0.99 % | 0.99 % | 0.99 % |
Gross operating expenses | 1.00 %4 | 1.01 % | 1.02 %5 | 1.02 % | 1.02 % | 1.03 % |
Net investment income (loss) | (0.05 %)4 | 0.02 % | (0.05 %) | (0.23 %) | 0.01 % | 0.34 % |
Portfolio turnover rate | 6 %3 | 17 % | 19 % | 42 % | 65 % | 67 % |
Net assets, end of period (x 1,000) | $375,589 | $281,640 | $218,329 | $292,447 | $210,033 | $180,809 |
* | Unaudited. |
1 | Calculated based on the average shares outstanding during the period. |
2 | Per-share amount was less than $0.005. |
3 | Not annualized. |
4 | Annualized. |
5 | Ratio includes less than 0.005% of non-routine proxy expenses. |
SECURITY | NUMBER OF SHARES | VALUE ($) |
COMMON STOCKS 95.4% OF NET ASSETS | ||
Automobiles & Components 1.8% | ||
Mobileye Global, Inc., Class A *(a) | 125,550 | 3,458,903 |
Tesla, Inc. * | 17,116 | 3,137,020 |
6,595,923 | ||
Capital Goods 5.2% | ||
Caterpillar, Inc. | 11,998 | 4,014,171 |
Fastenal Co. | 38,044 | 2,584,709 |
Illinois Tool Works, Inc. | 4,799 | 1,171,484 |
Lockheed Martin Corp. | 7,652 | 3,557,644 |
Parker-Hannifin Corp. | 10,673 | 5,815,824 |
Quanta Services, Inc. | 9,885 | 2,555,866 |
19,699,698 | ||
Commercial & Professional Services 1.4% | ||
Paychex, Inc. | 13,902 | 1,651,697 |
Republic Services, Inc., Class A | 17,758 | 3,404,208 |
5,055,905 | ||
Consumer Discretionary Distribution & Retail 8.1% | ||
Amazon.com, Inc. * | 114,359 | 20,012,825 |
Home Depot, Inc. | 12,073 | 4,035,038 |
O'Reilly Automotive, Inc. * | 1,888 | 1,913,035 |
TJX Cos., Inc. | 48,942 | 4,604,953 |
30,565,851 | ||
Consumer Durables & Apparel 1.1% | ||
Deckers Outdoor Corp. * | 1,850 | 1,514,169 |
NIKE, Inc., Class B | 28,300 | 2,610,958 |
4,125,127 | ||
Consumer Services 3.4% | ||
Airbnb, Inc., Class A * | 22,675 | 3,595,575 |
Booking Holdings, Inc. | 535 | 1,846,836 |
McDonald's Corp. | 11,088 | 3,027,468 |
Starbucks Corp. | 48,462 | 4,288,402 |
12,758,281 | ||
Consumer Staples Distribution & Retail 1.4% | ||
Costco Wholesale Corp. | 7,253 | 5,243,194 |
Energy 0.5% | ||
EOG Resources, Inc. | 14,768 | 1,951,296 |
Financial Services 5.2% | ||
American Express Co. | 3,411 | 798,276 |
Fidelity National Information Services, Inc. | 52,980 | 3,598,402 |
Interactive Brokers Group, Inc., Class A | 17,464 | 2,010,456 |
SECURITY | NUMBER OF SHARES | VALUE ($) |
Mastercard, Inc., Class A | 11,969 | 5,400,413 |
MSCI, Inc., Class A | 2,815 | 1,311,199 |
Visa, Inc., Class A | 24,440 | 6,564,828 |
19,683,574 | ||
Food, Beverage & Tobacco 3.2% | ||
Celsius Holdings, Inc. * | 46,463 | 3,311,418 |
Constellation Brands, Inc., Class A | 20,689 | 5,243,834 |
Philip Morris International, Inc. | 34,383 | 3,264,322 |
11,819,574 | ||
Health Care Equipment & Services 3.7% | ||
Edwards Lifesciences Corp. * | 27,680 | 2,343,666 |
IDEXX Laboratories, Inc. * | 3,556 | 1,752,255 |
Intuitive Surgical, Inc. * | 16,517 | 6,121,530 |
UnitedHealth Group, Inc. | 7,413 | 3,585,668 |
13,803,119 | ||
Insurance 1.6% | ||
Arthur J Gallagher & Co. | 13,345 | 3,131,938 |
Progressive Corp. | 14,442 | 3,007,547 |
6,139,485 | ||
Media & Entertainment 10.7% | ||
Alphabet, Inc., Class A * | 134,413 | 21,879,748 |
Meta Platforms, Inc., Class A | 34,877 | 15,003,039 |
Netflix, Inc. * | 6,145 | 3,383,683 |
40,266,470 | ||
Pharmaceuticals, Biotechnology & Life Sciences 6.6% | ||
Eli Lilly & Co. | 12,008 | 9,379,449 |
Thermo Fisher Scientific, Inc. | 12,359 | 7,028,810 |
Vertex Pharmaceuticals, Inc. * | 13,581 | 5,334,753 |
Zoetis, Inc. | 20,079 | 3,197,380 |
24,940,392 | ||
Semiconductors & Semiconductor Equipment 12.9% | ||
Advanced Micro Devices, Inc. * | 21,181 | 3,354,647 |
ASML Holding NV NY Registry Shares | 5,852 | 5,105,694 |
Broadcom, Inc. | 9,252 | 12,030,098 |
NVIDIA Corp. | 32,256 | 27,869,829 |
48,360,268 | ||
Software & Services 19.7% | ||
Accenture PLC, Class A | 16,552 | 4,980,662 |
Adobe, Inc. * | 7,716 | 3,571,196 |
Gartner, Inc. * | 10,548 | 4,351,999 |
Intuit, Inc. | 4,573 | 2,860,960 |
Microsoft Corp. | 99,364 | 38,685,386 |
Oracle Corp. | 34,209 | 3,891,274 |
Palo Alto Networks, Inc. * | 25,239 | 7,341,773 |
SECURITY | NUMBER OF SHARES | VALUE ($) |
Salesforce, Inc. | 6,457 | 1,736,546 |
ServiceNow, Inc. * | 5,128 | 3,555,396 |
Synopsys, Inc. * | 5,560 | 2,950,081 |
73,925,273 | ||
Technology Hardware & Equipment 8.4% | ||
Apple, Inc. | 186,176 | 31,711,358 |
Transportation 0.5% | ||
Uber Technologies, Inc. * | 27,145 | 1,798,899 |
Total Common Stocks (Cost $173,043,088) | 358,443,687 | |
INVESTMENT COMPANIES 1.4% OF NET ASSETS | ||
Equity Funds 1.4% | ||
Invesco S&P 500 Equal Weight ETF (a) | 31,462 | 5,071,674 |
Total Investment Companies (Cost $4,945,908) | 5,071,674 | |
SHORT-TERM INVESTMENTS 1.6% OF NET ASSETS | ||
Money Market Funds 1.6% | ||
State Street Institutional U.S. Government Money Market Fund, Premier Class 5.25% (b)(c) | 6,056,678 | 6,056,678 |
Total Short-Term Investments (Cost $6,056,678) | 6,056,678 | |
Total Investments in Securities (Cost $184,045,674) | 369,572,039 | |
NUMBER OF CONTRACTS | NOTIONAL AMOUNT ($) | CURRENT VALUE/ UNREALIZED DEPRECIATION ($) | |
FUTURES CONTRACTS | |||
Long | |||
S&P 500 Index, e-mini, expires 06/21/24 | 20 | 5,067,000 | (123,987 ) |
* | Non-income producing security. |
(a) | All or a portion of this security is on loan. Securities on loan were valued at $5,833,965. |
(b) | The rate shown is the annualized 7-day yield. |
(c) | Security purchased with cash collateral received for securities on loan. |
ETF — | Exchange-Traded Fund |
DESCRIPTION | QUOTED PRICES IN ACTIVE MARKETS FOR IDENTICAL ASSETS (LEVEL 1) | OTHER SIGNIFICANT OBSERVABLE INPUTS (LEVEL 2) | SIGNIFICANT UNOBSERVABLE INPUTS (LEVEL 3) | TOTAL |
Assets | ||||
Common Stocks1 | $358,443,687 | $— | $— | $358,443,687 |
Investment Companies1 | 5,071,674 | — | — | 5,071,674 |
Short-Term Investments1 | 6,056,678 | — | — | 6,056,678 |
Liabilities | ||||
Futures Contracts2 | (123,987 ) | — | — | (123,987 ) |
Total | $369,448,052 | $— | $— | $369,448,052 |
1 | As categorized in the Portfolio Holdings. |
2 | Futures contracts are reported at cumulative unrealized appreciation or depreciation. |
Assets | ||
Investments in securities, at value - unaffiliated issuers (cost $184,045,674) including securities on loan of $5,833,965 | $369,572,039 | |
Cash | 11,895,595 | |
Deposit with broker for futures contracts | 236,000 | |
Receivables: | ||
Fund shares sold | 378,684 | |
Dividends | 88,478 | |
Foreign tax reclaims | 4,849 | |
Income from securities on loan | 1,512 | |
Prepaid expenses | + | 14,699 |
Total assets | 382,191,856 | |
Liabilities | ||
Collateral held for securities on loan | 6,056,678 | |
Payables: | ||
Investment adviser and administrator fees | 223,775 | |
Fund shares redeemed | 114,241 | |
Variation margin on futures contracts | 80,000 | |
Shareholder service fees | 74,712 | |
Accrued expenses | + | 53,808 |
Total liabilities | 6,603,214 | |
Net assets | $375,588,642 | |
Net Assets by Source | ||
Capital received from investors | $189,596,667 | |
Total distributable earnings | + | 185,991,975 |
Net assets | $375,588,642 | |
Net Asset Value (NAV) | ||||
Net Assets | ÷ | Shares Outstanding | = | NAV |
$375,588,642 | 12,647,624 | $29.70 | ||
For the period November 1, 2023 through April 30, 2024; unaudited | ||
Investment Income | ||
Dividends received from securities - unaffiliated issuers (net of foreign withholding tax of $4,353) | $1,423,856 | |
Other interest | 207,837 | |
Securities on loan, net | + | 1,684 |
Total investment income | 1,633,377 | |
Expenses | ||
Investment adviser and administrator fees | 1,245,624 | |
Shareholder service fees | 411,241 | |
Portfolio accounting fees | 23,623 | |
Professional fees | 17,546 | |
Registration fees | 16,538 | |
Shareholder reports | 7,768 | |
Independent trustees’ fees | 3,206 | |
Transfer agent fees | 1,019 | |
Other expenses | + | 1,841 |
Total expenses | 1,728,406 | |
Expense reduction | – | 15,674 |
Net expenses | – | 1,712,732 |
Net investment loss | (79,355 ) | |
REALIZED AND UNREALIZED GAINS (LOSSES) | ||
Net realized gains on sales of securities - unaffiliated issuers | 3,257,188 | |
Net realized gains on futures contracts | + | 565,084 |
Net realized gains | 3,822,272 | |
Net change in unrealized appreciation (depreciation) on securities - unaffiliated issuers | 58,297,650 | |
Net change in unrealized appreciation (depreciation) on futures contracts | + | 174,997 |
Net change in unrealized appreciation (depreciation) | + | 58,472,647 |
Net realized and unrealized gains | 62,294,919 | |
Increase in net assets resulting from operations | $62,215,564 | |
OPERATIONS | |||
11/1/23-4/30/24 | 11/1/22-10/31/23 | ||
Net investment income (loss) | ($79,355 ) | $58,463 | |
Net realized gains (losses) | 3,822,272 | (3,031,037 ) | |
Net change in unrealized appreciation (depreciation) | + | 58,472,647 | 43,697,995 |
Increase in net assets resulting from operations | $62,215,564 | $40,725,421 | |
DISTRIBUTIONS TO SHAREHOLDERS | |||
Total distributions | ($115,375 ) | ($4,337,314 ) | |
TRANSACTIONS IN FUND SHARES | |||||
11/1/23-4/30/24 | 11/1/22-10/31/23 | ||||
SHARES | VALUE | SHARES | VALUE | ||
Shares sold | 1,975,304 | $57,598,812 | 2,619,801 | $63,452,086 | |
Shares reinvested | 3,498 | 97,194 | 177,666 | 3,755,874 | |
Shares redeemed | + | (895,423 ) | (25,847,629 ) | (1,727,327 ) | (40,285,189 ) |
Net transactions in fund shares | 1,083,379 | $31,848,377 | 1,070,140 | $26,922,771 | |
SHARES OUTSTANDING AND NET ASSETS | |||||
11/1/23-4/30/24 | 11/1/22-10/31/23 | ||||
SHARES | NET ASSETS | SHARES | NET ASSETS | ||
Beginning of period | 11,564,245 | $281,640,076 | 10,494,105 | $218,329,198 | |
Total increase | + | 1,083,379 | 93,948,566 | 1,070,140 | 63,310,878 |
End of period | 12,647,624 | $375,588,642 | 11,564,245 | $281,640,076 | |
11/1/23– 4/30/24* | 11/1/22– 10/31/23 | 11/1/21– 10/31/22 | 11/1/20– 10/31/21 | 11/1/19– 10/31/20 | 11/1/18– 10/31/19 | |
Per-Share Data | ||||||
Net asset value at beginning of period | $16.60 | $18.94 | $23.77 | $15.02 | $16.68 | $20.87 |
Income (loss) from investment operations: | ||||||
Net investment income (loss)1 | 0.07 | 0.07 | 0.03 | 0.02 | 0.03 | 0.02 |
Net realized and unrealized gains (losses) | 3.14 | (0.71 ) | (2.27 ) | 8.76 | (1.67 ) | (0.35 )2 |
Total from investment operations | 3.21 | (0.64 ) | (2.24 ) | 8.78 | (1.64 ) | (0.33 ) |
Less distributions: | ||||||
Distributions from net investment income | (0.07 ) | (0.02 ) | (0.03 ) | (0.03 ) | (0.02 ) | (0.01 ) |
Distributions from net realized gains | — | (1.68 ) | (2.56 ) | — | — | (3.85 ) |
Total distributions | (0.07 ) | (1.70 ) | (2.59 ) | (0.03 ) | (0.02 ) | (3.86 ) |
Net asset value at end of period | $19.74 | $16.60 | $18.94 | $23.77 | $15.02 | $16.68 |
Total return | 19.37 %3 | (3.68 %) | (10.25 %) | 58.55 % | (9.86 %) | 0.08 % |
Ratios/Supplemental Data | ||||||
Ratios to average net assets: | ||||||
Net operating expenses | 1.08 %4 | 1.09 %5 | 1.09 %5 | 1.08 % | 1.09 % | 1.09 % |
Gross operating expenses | 1.08 %4 | 1.09 %5 | 1.09 %5 | 1.08 % | 1.10 % | 1.09 % |
Net investment income (loss) | 0.70 %4 | 0.37 % | 0.13 % | 0.11 % | 0.17 % | 0.09 % |
Portfolio turnover rate | 46 %3 | 43 % | 74 % | 84 % | 113 % | 117 % |
Net assets, end of period (x 1,000) | $555,944 | $482,280 | $542,600 | $669,489 | $491,478 | $579,143 |
* | Unaudited. |
1 | Calculated based on the average shares outstanding during the period. |
2 | The per share amount does not accord with the change in aggregate gains and losses in securities during the period because of the timing of fund transactions in relation to fluctuating market values. |
3 | Not annualized. |
4 | Annualized. |
5 | Ratio includes less than 0.005% of non-routine proxy expenses. |
SECURITY | NUMBER OF SHARES | VALUE ($) |
COMMON STOCKS 95.8% OF NET ASSETS | ||
Automobiles & Components 0.6% | ||
Adient PLC * | 19,412 | 579,837 |
Goodyear Tire & Rubber Co. * | 36,918 | 441,539 |
Modine Manufacturing Co. * | 21,194 | 1,963,200 |
Visteon Corp. * | 2,149 | 237,744 |
3,222,320 | ||
Banks 8.5% | ||
Axos Financial, Inc. * | 76,121 | 3,852,484 |
BankUnited, Inc. | 167,028 | 4,464,658 |
Byline Bancorp, Inc. | 45,040 | 976,017 |
Cathay General Bancorp | 10,760 | 370,574 |
Customers Bancorp, Inc. * | 23,442 | 1,070,596 |
CVB Financial Corp. | 123,534 | 2,018,546 |
Eagle Bancorp, Inc. | 33,074 | 611,538 |
First Financial Corp. | 9,478 | 345,094 |
Great Southern Bancorp, Inc. | 28,686 | 1,474,460 |
Hancock Whitney Corp. | 18,104 | 821,741 |
Hilltop Holdings, Inc. | 16,381 | 479,308 |
HomeTrust Bancshares, Inc. | 44,652 | 1,147,556 |
Hope Bancorp, Inc. | 302,794 | 3,033,996 |
International Bancshares Corp. | 114,611 | 6,378,102 |
Mercantile Bank Corp. | 80,576 | 2,907,182 |
OceanFirst Financial Corp. | 168,407 | 2,485,687 |
Old Second Bancorp, Inc. | 29,615 | 405,726 |
Peapack-Gladstone Financial Corp. | 15,019 | 336,125 |
Premier Financial Corp. | 66,678 | 1,292,220 |
Provident Financial Services, Inc. | 34,761 | 510,292 |
Renasant Corp. | 59,420 | 1,726,745 |
Republic Bancorp, Inc., Class A | 29,304 | 1,486,299 |
Trustmark Corp. | 49,974 | 1,479,230 |
UMB Financial Corp. | 40,165 | 3,199,544 |
Univest Financial Corp. | 38,641 | 806,438 |
WaFd, Inc. | 67,347 | 1,824,430 |
WesBanco, Inc. | 54,069 | 1,459,863 |
46,964,451 | ||
Capital Goods 12.8% | ||
AAR Corp. * | 61,126 | 4,226,252 |
AeroVironment, Inc. * | 11,448 | 1,829,276 |
Allient, Inc. | 30,379 | 892,839 |
Applied Industrial Technologies, Inc. | 8,298 | 1,520,608 |
Array Technologies, Inc. * | 67,368 | 831,321 |
Atkore, Inc. | 32,673 | 5,727,577 |
Blue Bird Corp. * | 51,010 | 1,681,035 |
Boise Cascade Co. | 3,746 | 495,483 |
Cadre Holdings, Inc. | 23,865 | 795,898 |
Comfort Systems USA, Inc. | 9,530 | 2,948,677 |
Ducommun, Inc. * | 7,099 | 383,985 |
EMCOR Group, Inc. | 18,327 | 6,545,855 |
EnerSys | 43,820 | 3,963,519 |
Federal Signal Corp. | 51,208 | 4,163,210 |
Fluor Corp. * | 30,534 | 1,231,436 |
SECURITY | NUMBER OF SHARES | VALUE ($) |
H&E Equipment Services, Inc. | 9,575 | 462,377 |
Herc Holdings, Inc. | 7,473 | 1,068,863 |
IES Holdings, Inc. * | 12,734 | 1,720,618 |
JELD-WEN Holding, Inc. * | 107,803 | 2,209,961 |
Manitowoc Co., Inc. * | 70,672 | 855,131 |
Masterbrand, Inc. * | 90,300 | 1,505,301 |
Moog, Inc., Class A | 35,636 | 5,668,619 |
Mueller Industries, Inc. | 20,694 | 1,155,139 |
NEXTracker, Inc., Class A * | 74,716 | 3,197,098 |
Preformed Line Products Co. | 9,869 | 1,194,445 |
REV Group, Inc. | 49,293 | 1,077,545 |
Shoals Technologies Group, Inc., Class A * | 29,734 | 251,252 |
Simpson Manufacturing Co., Inc. | 8,058 | 1,401,206 |
SPX Technologies, Inc. * | 8,195 | 998,233 |
Sterling Infrastructure, Inc. * | 29,661 | 3,013,558 |
Tennant Co. | 8,530 | 993,574 |
Terex Corp. | 57,028 | 3,196,419 |
Thermon Group Holdings, Inc. * | 38,992 | 1,245,015 |
V2X, Inc. * | 26,832 | 1,303,499 |
Watts Water Technologies, Inc., Class A | 5,805 | 1,152,060 |
70,906,884 | ||
Commercial & Professional Services 2.8% | ||
Brink's Co. | 13,573 | 1,187,095 |
Cimpress PLC * | 27,204 | 2,319,685 |
Conduent, Inc. * | 270,375 | 851,681 |
ExlService Holdings, Inc. * | 113,469 | 3,290,601 |
Huron Consulting Group, Inc. * | 7,064 | 658,647 |
IBEX Holdings Ltd. * | 50,906 | 666,869 |
Legalzoom.com, Inc. * | 131,189 | 1,567,708 |
Maximus, Inc. | 65,813 | 5,283,468 |
15,825,754 | ||
Consumer Discretionary Distribution & Retail 3.7% | ||
Abercrombie & Fitch Co., Class A * | 25,940 | 3,152,229 |
American Eagle Outfitters, Inc. | 160,764 | 3,900,135 |
Build-A-Bear Workshop, Inc. | 66,965 | 2,019,664 |
Caleres, Inc. | 21,837 | 804,257 |
CarParts.com, Inc. * | 319,180 | 392,591 |
Dillard's, Inc., Class A | 4,168 | 1,825,542 |
Group 1 Automotive, Inc. | 7,531 | 2,214,265 |
Nordstrom, Inc. | 102,926 | 1,956,623 |
ODP Corp. * | 12,318 | 627,109 |
Signet Jewelers Ltd. | 15,020 | 1,472,411 |
Urban Outfitters, Inc. * | 58,355 | 2,273,511 |
20,638,337 | ||
Consumer Durables & Apparel 2.1% | ||
Beazer Homes USA, Inc. * | 30,419 | 852,645 |
Crocs, Inc. * | 14,586 | 1,814,061 |
Dream Finders Homes, Inc., Class A * | 13,136 | 466,328 |
Green Brick Partners, Inc. * | 12,785 | 692,052 |
Hovnanian Enterprises, Inc., Class A * | 7,753 | 1,146,126 |
JAKKS Pacific, Inc. * | 31,154 | 589,122 |
KB Home | 14,309 | 926,651 |
SECURITY | NUMBER OF SHARES | VALUE ($) |
M/I Homes, Inc. * | 10,611 | 1,233,210 |
Solo Brands, Inc., Class A * | 150,438 | 282,823 |
Sonos, Inc. * | 132,241 | 2,234,873 |
Taylor Morrison Home Corp., Class A * | 29,262 | 1,638,965 |
11,876,856 | ||
Consumer Services 3.4% | ||
Bloomin' Brands, Inc. | 87,655 | 2,260,623 |
Brinker International, Inc. * | 108,924 | 5,838,326 |
Duolingo, Inc. * | 6,322 | 1,427,192 |
Everi Holdings, Inc. * | 50,705 | 414,260 |
Frontdoor, Inc. * | 97,058 | 2,978,710 |
Inspired Entertainment, Inc. * | 82,270 | 699,295 |
International Game Technology PLC | 58,635 | 1,157,455 |
Light & Wonder, Inc. * | 26,217 | 2,340,129 |
PlayAGS, Inc. * | 173,835 | 1,536,701 |
18,652,691 | ||
Consumer Staples Distribution & Retail 0.7% | ||
Andersons, Inc. | 71,105 | 3,906,509 |
Energy 6.2% | ||
Berry Corp. | 92,086 | 781,810 |
Chord Energy Corp. | 4,511 | 798,357 |
Civitas Resources, Inc. | 28,425 | 2,045,463 |
CONSOL Energy, Inc. | 11,743 | 971,851 |
CVR Energy, Inc. | 16,294 | 495,012 |
DHT Holdings, Inc. | 75,405 | 861,125 |
Liberty Energy, Inc., Class A | 52,190 | 1,148,180 |
Matador Resources Co. | 39,715 | 2,474,244 |
Murphy Oil Corp. | 54,141 | 2,416,854 |
Noble Corp. PLC | 23,949 | 1,062,857 |
Par Pacific Holdings, Inc. * | 57,002 | 1,755,662 |
PBF Energy, Inc., Class A | 16,430 | 875,226 |
Scorpio Tankers, Inc. | 54,323 | 3,822,166 |
Select Water Solutions, Inc. | 132,451 | 1,223,847 |
SM Energy Co. | 49,980 | 2,423,530 |
Teekay Corp. * | 375,819 | 2,750,995 |
Teekay Tankers Ltd., Class A | 55,895 | 3,257,002 |
U.S. Silica Holdings, Inc. * | 36,641 | 565,371 |
VAALCO Energy, Inc. | 254,590 | 1,629,376 |
W&T Offshore, Inc. | 108,409 | 243,920 |
Weatherford International PLC * | 23,787 | 2,940,549 |
34,543,397 | ||
Equity Real Estate Investment Trusts (REITs) 6.3% | ||
American Assets Trust, Inc. | 268,522 | 5,732,945 |
Armada Hoffler Properties, Inc. | 342,157 | 3,599,492 |
Broadstone Net Lease, Inc. | 152,678 | 2,222,992 |
COPT Defense Properties | 254,437 | 6,098,855 |
EastGroup Properties, Inc. | 16,695 | 2,593,735 |
Empire State Realty Trust, Inc., Class A | 268,706 | 2,445,224 |
Innovative Industrial Properties, Inc. | 19,042 | 1,968,943 |
Orion Office REIT, Inc. | 230,986 | 720,676 |
Plymouth Industrial REIT, Inc. | 65,014 | 1,357,492 |
Ryman Hospitality Properties, Inc. | 62,213 | 6,562,227 |
Tanger, Inc. | 64,856 | 1,838,668 |
35,141,249 | ||
Financial Services 6.1% | ||
AssetMark Financial Holdings, Inc. * | 16,401 | 554,518 |
Enact Holdings, Inc. | 93,606 | 2,782,906 |
Enova International, Inc. * | 43,105 | 2,609,146 |
SECURITY | NUMBER OF SHARES | VALUE ($) |
Essent Group Ltd. | 36,634 | 1,940,503 |
Federal Agricultural Mortgage Corp., Class C | 13,308 | 2,477,018 |
Jackson Financial, Inc., Class A | 19,699 | 1,345,836 |
Merchants Bancorp | 61,060 | 2,462,550 |
MGIC Investment Corp. | 58,667 | 1,189,767 |
NMI Holdings, Inc., Class A * | 138,520 | 4,274,727 |
Radian Group, Inc. | 60,648 | 1,811,556 |
Regional Management Corp. | 47,695 | 1,202,391 |
StepStone Group, Inc., Class A | 23,715 | 855,400 |
Stifel Financial Corp. | 18,983 | 1,517,121 |
StoneCo Ltd., Class A * | 206,033 | 3,214,115 |
StoneX Group, Inc. * | 30,757 | 2,232,958 |
Victory Capital Holdings, Inc., Class A | 15,500 | 788,330 |
Virtus Investment Partners, Inc. | 12,939 | 2,837,781 |
34,096,623 | ||
Food, Beverage & Tobacco 2.3% | ||
B&G Foods, Inc. | 126,813 | 1,407,624 |
Coca-Cola Consolidated, Inc. | 8,051 | 6,650,126 |
National Beverage Corp. * | 19,148 | 852,086 |
Primo Water Corp. | 198,053 | 3,737,260 |
12,647,096 | ||
Health Care Equipment & Services 2.9% | ||
AirSculpt Technologies, Inc. *(a) | 44,104 | 243,013 |
Cerus Corp. * | 270,093 | 451,055 |
CONMED Corp. | 25,244 | 1,716,087 |
Health Catalyst, Inc. * | 87,822 | 546,253 |
Hims & Hers Health, Inc. * | 148,085 | 1,855,505 |
Lantheus Holdings, Inc. * | 53,601 | 3,566,611 |
Merit Medical Systems, Inc. * | 36,937 | 2,737,032 |
OmniAb, Inc., Class A *(b) | 5,508 | 0 |
OmniAb, Inc., Class B *(b) | 5,508 | 0 |
Option Care Health, Inc. * | 25,933 | 775,137 |
OraSure Technologies, Inc. * | 190,025 | 1,005,232 |
Tenet Healthcare Corp. * | 8,781 | 986,019 |
UFP Technologies, Inc. * | 2,246 | 462,541 |
Zimvie, Inc. * | 97,895 | 1,488,004 |
15,832,489 | ||
Household & Personal Products 0.1% | ||
Nature's Sunshine Products, Inc. * | 37,813 | 735,463 |
Insurance 0.6% | ||
CNO Financial Group, Inc. | 93,393 | 2,459,037 |
Genworth Financial, Inc., Class A * | 140,700 | 834,351 |
Investors Title Co. | 1,667 | 267,437 |
3,560,825 | ||
Materials 5.0% | ||
Alpha Metallurgical Resources, Inc. | 2,709 | 886,168 |
Cabot Corp. | 12,426 | 1,133,624 |
Carpenter Technology Corp. | 48,050 | 4,117,885 |
Constellium SE, Class A * | 220,404 | 4,339,755 |
Koppers Holdings, Inc. | 33,920 | 1,739,418 |
Mativ Holdings, Inc. | 69,807 | 1,274,676 |
Metallus, Inc. * | 84,970 | 1,746,983 |
Minerals Technologies, Inc. | 55,220 | 4,024,986 |
Orion SA | 109,517 | 2,591,172 |
Quaker Chemical Corp. | 16,828 | 3,138,927 |
SunCoke Energy, Inc. | 197,340 | 2,034,575 |
SECURITY | NUMBER OF SHARES | VALUE ($) |
Worthington Steel, Inc. | 15,490 | 476,937 |
27,505,106 | ||
Media & Entertainment 1.7% | ||
AMC Networks, Inc., Class A * | 85,061 | 903,348 |
Cars.com, Inc. * | 33,273 | 555,992 |
Entravision Communications Corp., Class A | 58,320 | 121,889 |
EW Scripps Co., Class A * | 43,160 | 162,281 |
Gaia, Inc., Class A * | 44,500 | 172,215 |
Gray Television, Inc. | 101,681 | 584,666 |
Lions Gate Entertainment Corp., Class A * | 125,050 | 1,261,754 |
Yelp, Inc., Class A * | 139,462 | 5,611,951 |
9,374,096 | ||
Pharmaceuticals, Biotechnology & Life Sciences 12.2% | ||
2seventy bio, Inc. * | 130,257 | 593,972 |
ACADIA Pharmaceuticals, Inc. * | 227,047 | 3,793,955 |
Alector, Inc. * | 116,604 | 592,348 |
Alkermes PLC * | 191,160 | 4,691,066 |
Amicus Therapeutics, Inc. * | 196,040 | 1,958,440 |
Amneal Pharmaceuticals, Inc. * | 319,232 | 1,931,354 |
Amphastar Pharmaceuticals, Inc. * | 29,157 | 1,202,726 |
Amylyx Pharmaceuticals, Inc. * | 527,822 | 955,358 |
ANI Pharmaceuticals, Inc. * | 45,933 | 3,031,578 |
Anika Therapeutics, Inc. * | 31,735 | 821,619 |
Arcellx, Inc. * | 8,128 | 406,563 |
Arcus Biosciences, Inc. * | 34,564 | 526,410 |
Arrowhead Pharmaceuticals, Inc. * | 13,203 | 298,652 |
Arvinas, Inc. * | 22,446 | 713,109 |
Aurinia Pharmaceuticals, Inc. * | 282,225 | 1,436,525 |
Beam Therapeutics, Inc. * | 21,295 | 451,880 |
BioCryst Pharmaceuticals, Inc. * | 116,784 | 482,318 |
CareDx, Inc. * | 149,284 | 1,158,444 |
Caribou Biosciences, Inc. * | 164,797 | 598,213 |
Catalyst Pharmaceuticals, Inc. * | 131,521 | 1,979,391 |
Collegium Pharmaceutical, Inc. * | 30,994 | 1,144,608 |
Deciphera Pharmaceuticals, Inc. * | 89,616 | 2,264,596 |
Denali Therapeutics, Inc. * | 65,562 | 1,012,277 |
Editas Medicine, Inc. * | 248,474 | 1,294,550 |
Fate Therapeutics, Inc. * | 293,590 | 1,159,680 |
Halozyme Therapeutics, Inc. * | 74,557 | 2,840,622 |
Harmony Biosciences Holdings, Inc. * | 97,414 | 3,011,067 |
Harvard Bioscience, Inc. * | 126,539 | 483,379 |
Ironwood Pharmaceuticals, Inc., Class A * | 185,334 | 1,436,338 |
Kymera Therapeutics, Inc. * | 20,972 | 705,079 |
Medpace Holdings, Inc. * | 12,941 | 5,025,637 |
MiMedx Group, Inc. * | 299,380 | 1,844,181 |
Morphic Holding, Inc. * | 9,921 | 270,546 |
Mural Oncology PLC * | 11,720 | 43,364 |
Myriad Genetics, Inc. * | 39,968 | 782,174 |
Nurix Therapeutics, Inc. * | 199,663 | 2,399,949 |
Organogenesis Holdings, Inc., Class A * | 330,106 | 775,749 |
Phibro Animal Health Corp., Class A | 79,718 | 1,331,291 |
Prestige Consumer Healthcare, Inc. * | 10,201 | 732,024 |
Protagonist Therapeutics, Inc. * | 46,332 | 1,163,396 |
PTC Therapeutics, Inc. * | 27,076 | 870,493 |
Quanterix Corp. * | 37,022 | 596,795 |
Relay Therapeutics, Inc. * | 153,737 | 1,002,365 |
Rigel Pharmaceuticals, Inc. * | 286,774 | 301,113 |
TG Therapeutics, Inc. * | 63,272 | 864,296 |
Vanda Pharmaceuticals, Inc. * | 209,650 | 997,934 |
Veracyte, Inc. * | 107,783 | 2,109,313 |
Vericel Corp. * | 17,575 | 806,165 |
WaVe Life Sciences Ltd. * | 328,247 | 1,618,258 |
SECURITY | NUMBER OF SHARES | VALUE ($) |
Xencor, Inc. * | 60,549 | 1,267,896 |
67,779,056 | ||
Real Estate Management & Development 0.3% | ||
Cushman & Wakefield PLC * | 161,391 | 1,557,423 |
RMR Group, Inc., Class A | 12,431 | 294,863 |
1,852,286 | ||
Semiconductors & Semiconductor Equipment 2.6% | ||
Ambarella, Inc. * | 5,097 | 234,309 |
Amkor Technology, Inc. | 127,258 | 4,116,796 |
Axcelis Technologies, Inc. * | 34,362 | 3,557,154 |
Lattice Semiconductor Corp. * | 57,508 | 3,945,049 |
Photronics, Inc. * | 70,994 | 1,945,946 |
SMART Global Holdings, Inc. * | 48,021 | 877,344 |
14,676,598 | ||
Software & Services 5.6% | ||
8x8, Inc. * | 315,131 | 696,440 |
Alarm.com Holdings, Inc. * | 10,732 | 713,678 |
Alkami Technology, Inc. * | 30,847 | 742,487 |
Appfolio, Inc., Class A * | 22,584 | 5,121,600 |
Asana, Inc., Class A * | 106,904 | 1,589,663 |
BlackLine, Inc. * | 26,944 | 1,564,099 |
CommVault Systems, Inc. * | 16,288 | 1,669,031 |
Domo, Inc., Class B * | 74,301 | 559,487 |
eGain Corp. * | 188,200 | 1,168,722 |
Hackett Group, Inc. | 62,037 | 1,345,583 |
LiveRamp Holdings, Inc. * | 13,038 | 418,650 |
MicroStrategy, Inc., Class A * | 2,148 | 2,287,684 |
PagerDuty, Inc. * | 45,319 | 904,567 |
Q2 Holdings, Inc. * | 50,146 | 2,577,003 |
Qualys, Inc. * | 1,755 | 287,662 |
Rimini Street, Inc. * | 297,878 | 792,356 |
Squarespace, Inc., Class A * | 39,998 | 1,394,330 |
Tenable Holdings, Inc. * | 15,690 | 705,579 |
Unisys Corp. * | 198,588 | 1,078,333 |
Weave Communications, Inc. * | 115,634 | 1,236,127 |
Xperi, Inc. * | 105,053 | 1,104,107 |
Yext, Inc. * | 302,925 | 1,663,058 |
Zeta Global Holdings Corp., Class A * | 74,939 | 926,246 |
Zuora, Inc., Class A * | 66,474 | 655,434 |
31,201,926 | ||
Technology Hardware & Equipment 6.5% | ||
Arlo Technologies, Inc. * | 223,194 | 2,763,142 |
Badger Meter, Inc. | 13,372 | 2,446,006 |
Bel Fuse, Inc., Class B | 26,575 | 1,560,484 |
Belden, Inc. | 18,548 | 1,507,396 |
Calix, Inc. * | 36,265 | 1,005,629 |
CommScope Holding Co., Inc. * | 256,955 | 229,718 |
Daktronics, Inc. * | 151,363 | 1,430,380 |
ePlus, Inc. * | 5,999 | 461,203 |
Extreme Networks, Inc. * | 248,900 | 2,787,680 |
Fabrinet * | 16,503 | 2,856,174 |
Itron, Inc. * | 50,227 | 4,626,911 |
OSI Systems, Inc. * | 15,389 | 2,022,730 |
Sanmina Corp. * | 8,821 | 535,170 |
Super Micro Computer, Inc. * | 11,367 | 9,761,980 |
Xerox Holdings Corp. | 160,058 | 2,127,171 |
36,121,774 | ||
SECURITY | NUMBER OF SHARES | VALUE ($) |
Telecommunication Services 0.5% | ||
Iridium Communications, Inc. | 19,928 | 613,583 |
Liberty Latin America Ltd., Class A * | 317,533 | 2,397,374 |
3,010,957 | ||
Transportation 1.0% | ||
ArcBest Corp. | 7,337 | 813,746 |
Matson, Inc. | 7,717 | 831,738 |
Radiant Logistics, Inc. * | 69,136 | 341,532 |
SkyWest, Inc. * | 45,560 | 3,327,247 |
5,314,263 | ||
Utilities 1.3% | ||
ALLETE, Inc. | 11,993 | 710,225 |
Avista Corp. | 23,026 | 828,476 |
Black Hills Corp. | 36,885 | 2,024,987 |
Chesapeake Utilities Corp. | 5,966 | 631,620 |
Clearway Energy, Inc., Class A | 46,161 | 1,002,155 |
Otter Tail Corp. | 18,121 | 1,546,809 |
Via Renewables, Inc., Class A * | 21,017 | 228,875 |
6,973,147 | ||
Total Common Stocks (Cost $472,996,467) | 532,360,153 | |
SHORT-TERM INVESTMENTS 0.0% OF NET ASSETS | ||
Money Market Funds 0.0% | ||
State Street Institutional U.S. Government Money Market Fund, Premier Class 5.25% (c)(d) | 147,630 | 147,630 |
Total Short-Term Investments (Cost $147,630) | 147,630 | |
Total Investments in Securities (Cost $473,144,097) | 532,507,783 | |
NUMBER OF CONTRACTS | NOTIONAL AMOUNT ($) | CURRENT VALUE/ UNREALIZED DEPRECIATION ($) | |
FUTURES CONTRACTS | |||
Long | |||
Russell 2000 Index, e-mini, expires 06/21/24 | 215 | 21,345,200 | (1,326,948 ) |
* | Non-income producing security. |
(a) | All or a portion of this security is on loan. Securities on loan were valued at $142,709. |
(b) | Fair valued using significant unobservable inputs (see financial note 2(a), Securities for which no quoted value is available, for additional information). |
(c) | The rate shown is the annualized 7-day yield. |
(d) | Security purchased with cash collateral received for securities on loan. |
REIT — | Real Estate Investment Trust |
SECURITY | VALUE AT 10/31/23 | PURCHASES | SALES | REALIZED GAINS (LOSSES) | NET CHANGE IN UNREALIZED APPRECIATION (DEPRECIATION) | VALUE AT 4/30/24 | BALANCE OF SHARES HELD AT 4/30/24 | DIVIDENDS RECEIVED |
COMMON STOCKS 0.0% OF NET ASSETS | ||||||||
Transportation 0.0% | ||||||||
Daseke, Inc. | $— | $— | ($2,010,926 ) | $173,675 | $734,977 | $— | — | $— |
DESCRIPTION | QUOTED PRICES IN ACTIVE MARKETS FOR IDENTICAL ASSETS (LEVEL 1) | OTHER SIGNIFICANT OBSERVABLE INPUTS (LEVEL 2) | SIGNIFICANT UNOBSERVABLE INPUTS (LEVEL 3) | TOTAL |
Assets | ||||
Common Stocks1 | $516,527,664 | $— | $— | $516,527,664 |
Health Care Equipment & Services | 15,832,489 | — | 0 * | 15,832,489 |
Short-Term Investments1 | 147,630 | — | — | 147,630 |
Liabilities | ||||
Futures Contracts2 | (1,326,948 ) | — | — | (1,326,948 ) |
Total | $531,180,835 | $— | $0 | $531,180,835 |
* | Level 3 amount shown includes securities determined to have no value at April 30, 2024. |
1 | As categorized in the Portfolio Holdings. |
2 | Futures contracts are reported at cumulative unrealized appreciation or depreciation. |
Assets | ||
Investments in securities, at value - unaffiliated issuers (cost $473,144,097) including securities on loan of $142,709 | $532,507,783 | |
Cash | 23,232,007 | |
Deposit with broker for futures contracts | 1,397,500 | |
Receivables: | ||
Fund shares sold | 362,128 | |
Dividends | 88,311 | |
Income from securities on loan | 1,289 | |
Prepaid expenses | + | 9,352 |
Total assets | 557,598,370 | |
Liabilities | ||
Collateral held for securities on loan | 147,630 | |
Payables: | ||
Variation margin on futures contracts | 446,125 | |
Investments bought | 398,210 | |
Investment adviser and administrator fees | 375,451 | |
Shareholder service fees | 113,612 | |
Fund shares redeemed | 100,603 | |
Accrued expenses | + | 72,410 |
Total liabilities | 1,654,041 | |
Net assets | $555,944,329 | |
Net Assets by Source | ||
Capital received from investors | $464,974,133 | |
Total distributable earnings | + | 90,970,196 |
Net assets | $555,944,329 | |
Net Asset Value (NAV) | ||||
Net Assets | ÷ | Shares Outstanding | = | NAV |
$555,944,329 | 28,169,673 | $19.74 | ||
For the period November 1, 2023 through April 30, 2024; unaudited | ||
Investment Income | ||
Dividends received from securities - unaffiliated issuers (net of foreign withholding tax of $8,143) | $4,606,330 | |
Other interest | 338,791 | |
Securities on loan, net | + | 15,995 |
Total investment income | 4,961,116 | |
Expenses | ||
Investment adviser and administrator fees | 2,253,565 | |
Shareholder service fees | 682,478 | |
Portfolio accounting fees | 26,249 | |
Professional fees | 18,140 | |
Registration fees | 15,195 | |
Shareholder reports | 10,948 | |
Custodian fees | 4,326 | |
Independent trustees’ fees | 3,479 | |
Transfer agent fees | 1,158 | |
Other expenses | + | 2,691 |
Total expenses | – | 3,018,229 |
Net investment income | 1,942,887 | |
REALIZED AND UNREALIZED GAINS (LOSSES) | ||
Net realized gains on sales of securities - affiliated issuers | 173,675 | |
Net realized gains on sales of securities - unaffiliated issuers | 32,609,723 | |
Net realized gains on futures contracts | + | 1,632,790 |
Net realized gains | 34,416,188 | |
Net change in unrealized appreciation (depreciation) on securities - affiliated issuers | 734,977 | |
Net change in unrealized appreciation (depreciation) on securities - unaffiliated issuers | 56,071,240 | |
Net change in unrealized appreciation (depreciation) on futures contracts | + | 201,432 |
Net change in unrealized appreciation (depreciation) | + | 57,007,649 |
Net realized and unrealized gains | 91,423,837 | |
Increase in net assets resulting from operations | $93,366,724 | |
OPERATIONS | |||
11/1/23-4/30/24 | 11/1/22-10/31/23 | ||
Net investment income | $1,942,887 | $1,941,138 | |
Net realized gains (losses) | 34,416,188 | (2,205,373 ) | |
Net change in unrealized appreciation (depreciation) | + | 57,007,649 | (16,397,779 ) |
Increase (decrease) in net assets resulting from operations | $93,366,724 | ($16,662,014 ) | |
DISTRIBUTIONS TO SHAREHOLDERS | |||
Total distributions | ($2,107,396 ) | ($48,159,983 ) | |
TRANSACTIONS IN FUND SHARES | |||||
11/1/23-4/30/24 | 11/1/22-10/31/23 | ||||
SHARES | VALUE | SHARES | VALUE | ||
Shares sold | 1,146,378 | $22,263,941 | 2,298,167 | $40,190,557 | |
Shares reinvested | 82,244 | 1,578,256 | 2,100,068 | 36,121,156 | |
Shares redeemed | + | (2,104,253 ) | (41,437,135 ) | (4,004,689 ) | (71,810,121 ) |
Net transactions in fund shares | (875,631 ) | ($17,594,938 ) | 393,546 | $4,501,592 | |
SHARES OUTSTANDING AND NET ASSETS | |||||
11/1/23-4/30/24 | 11/1/22-10/31/23 | ||||
SHARES | NET ASSETS | SHARES | NET ASSETS | ||
Beginning of period | 29,045,304 | $482,279,939 | 28,651,758 | $542,600,344 | |
Total increase (decrease) | + | (875,631 ) | 73,664,390 | 393,546 | (60,320,405 ) |
End of period | 28,169,673 | $555,944,329 | 29,045,304 | $482,279,939 | |
11/1/23– 4/30/24* | 11/1/22– 10/31/23 | 11/1/21– 10/31/22 | 11/1/20– 10/31/21 | 11/1/19– 10/31/20 | 11/1/18– 10/31/19 | |
Per-Share Data | ||||||
Net asset value at beginning of period | $24.05 | $26.08 | $30.58 | $26.27 | $25.08 | $25.85 |
Income (loss) from investment operations: | ||||||
Net investment income (loss)1 | 0.11 | 0.20 | 0.20 | 0.21 | 0.26 | 0.26 |
Net realized and unrealized gains (losses) | 3.09 | (1.14 ) | (1.13 ) | 7.09 | 2.11 | 1.27 |
Total from investment operations | 3.20 | (0.94 ) | (0.93 ) | 7.30 | 2.37 | 1.53 |
Less distributions: | ||||||
Distributions from net investment income | (0.22 ) | (0.19 ) | (0.23 ) | (0.23 ) | (0.29 ) | (0.24 ) |
Distributions from net realized gains | (0.69 ) | (0.90 ) | (3.34 ) | (2.76 ) | (0.89 ) | (2.06 ) |
Total distributions | (0.91 ) | (1.09 ) | (3.57 ) | (2.99 ) | (1.18 ) | (2.30 ) |
Net asset value at end of period | $26.34 | $24.05 | $26.08 | $30.58 | $26.27 | $25.08 |
Total return | 13.49 %2 | (4.04 %) | (3.82 %) | 30.02 % | 9.57 % | 6.51 % |
Ratios/Supplemental Data | ||||||
Ratios to average net assets: | ||||||
Net operating expenses | 0.79 %3 | 0.79 %4 | 0.80 %4 | 0.80 % | 0.80 % | 0.80 % |
Gross operating expenses | 0.79 %3 | 0.79 %4 | 0.80 %4 | 0.80 % | 0.80 % | 0.80 % |
Net investment income (loss) | 0.85 %3 | 0.79 % | 0.76 % | 0.76 % | 1.01 % | 1.05 % |
Portfolio turnover rate | 30 %2 | 53 % | 59 % | 70 % | 73 % | 45 % |
Net assets, end of period (x 1,000) | $786,214 | $733,285 | $829,028 | $901,637 | $745,705 | $778,753 |
* | Unaudited. |
1 | Calculated based on the average shares outstanding during the period. |
2 | Not annualized. |
3 | Annualized. |
4 | Ratio includes less than 0.005% of non-routine proxy expenses. |
SECURITY | NUMBER OF SHARES | VALUE ($) |
COMMON STOCKS 99.8% OF NET ASSETS | ||
Australia 0.4% | ||
Cochlear Ltd. | 4,989 | 1,040,745 |
Pro Medicus Ltd. | 29,403 | 2,100,700 |
3,141,445 | ||
Denmark 6.1% | ||
ALK-Abello AS * | 94,892 | 1,759,202 |
Demant AS * | 33,969 | 1,622,087 |
Novo Nordisk AS, Class B | 345,276 | 44,278,952 |
47,660,241 | ||
France 1.2% | ||
BioMerieux | 22,194 | 2,359,310 |
Ipsen SA | 55,093 | 6,701,310 |
9,060,620 | ||
Germany 0.4% | ||
Carl Zeiss Meditec AG, Bearer Shares | 33,440 | 3,528,349 |
Ireland 2.6% | ||
Medtronic PLC | 254,797 | 20,444,911 |
Italy 0.1% | ||
Recordati Industria Chimica e Farmaceutica SpA | 21,963 | 1,168,725 |
Japan 3.7% | ||
Chugai Pharmaceutical Co. Ltd. | 61,000 | 1,940,034 |
Daiichi Sankyo Co. Ltd. | 244,800 | 8,239,401 |
Hoya Corp. | 105,400 | 12,220,056 |
Santen Pharmaceutical Co. Ltd. | 450,000 | 4,346,588 |
Sysmex Corp. | 60,000 | 959,423 |
Terumo Corp. | 70,000 | 1,187,489 |
28,892,991 | ||
Republic of Korea 0.9% | ||
Classys, Inc. | 22,910 | 623,500 |
Hanmi Pharm Co. Ltd. | 4,140 | 943,104 |
Hugel, Inc. * | 7,000 | 1,070,213 |
Samsung Biologics Co. Ltd. * | 8,219 | 4,619,548 |
7,256,365 | ||
Sweden 0.3% | ||
Camurus AB * | 26,173 | 1,173,693 |
Getinge AB, B Shares | 52,784 | 1,111,231 |
2,284,924 | ||
SECURITY | NUMBER OF SHARES | VALUE ($) |
Switzerland 3.8% | ||
Novartis AG | 264,616 | 25,682,961 |
Roche Holding AG | 16,694 | 4,000,119 |
29,683,080 | ||
United Kingdom 4.5% | ||
AstraZeneca PLC | 115,946 | 17,536,701 |
ConvaTec Group PLC | 110,168 | 342,767 |
GSK PLC | 858,161 | 17,804,190 |
35,683,658 | ||
United States 75.8% | ||
Abbott Laboratories | 136,849 | 14,501,889 |
AbbVie, Inc. | 226,017 | 36,759,405 |
Addus HomeCare Corp. * | 10,896 | 1,047,650 |
ADMA Biologics, Inc. * | 161,600 | 1,053,632 |
Agilent Technologies, Inc. | 66,382 | 9,096,989 |
Align Technology, Inc. * | 7,581 | 2,140,723 |
Amgen, Inc. | 78,836 | 21,596,334 |
ANI Pharmaceuticals, Inc. * | 42,012 | 2,772,792 |
Becton Dickinson & Co. | 67,831 | 15,913,153 |
BioMarin Pharmaceutical, Inc. * | 20,180 | 1,629,737 |
Blueprint Medicines Corp. * | 17,979 | 1,642,202 |
Boston Scientific Corp. * | 83,281 | 5,985,405 |
Bruker Corp. | 30,109 | 2,348,803 |
Cardinal Health, Inc. | 30,972 | 3,191,355 |
Cencora, Inc. | 48,967 | 11,705,561 |
Cigna Group | 48,205 | 17,211,113 |
Collegium Pharmaceutical, Inc. * | 32,622 | 1,204,730 |
CONMED Corp. | 5,300 | 360,294 |
Cooper Cos., Inc. | 20,532 | 1,828,580 |
Danaher Corp. | 25,006 | 6,166,980 |
DaVita, Inc. * | 20,872 | 2,901,417 |
DENTSPLY SIRONA, Inc. | 62,612 | 1,878,986 |
Dexcom, Inc. * | 17,646 | 2,247,924 |
Edwards Lifesciences Corp. * | 17,379 | 1,471,480 |
Elanco Animal Health, Inc. * | 326,004 | 4,290,213 |
Elevance Health, Inc. | 25,687 | 13,577,634 |
Eli Lilly & Co. | 95,696 | 74,748,146 |
GE HealthCare Technologies, Inc. | 23,160 | 1,765,718 |
Gilead Sciences, Inc. | 165,282 | 10,776,386 |
HCA Healthcare, Inc. | 14,499 | 4,492,080 |
HealthEquity, Inc. * | 9,733 | 768,031 |
Hologic, Inc. * | 133,177 | 10,090,821 |
IDEXX Laboratories, Inc. * | 13,156 | 6,482,751 |
Intuitive Surgical, Inc. * | 8,917 | 3,304,819 |
IQVIA Holdings, Inc. * | 54,122 | 12,543,856 |
Jazz Pharmaceuticals PLC * | 28,774 | 3,186,720 |
Johnson & Johnson | 209,754 | 30,328,331 |
McKesson Corp. | 39,397 | 21,164,462 |
Medpace Holdings, Inc. * | 18,111 | 7,033,407 |
Merck & Co., Inc. | 311,642 | 40,270,379 |
Merit Medical Systems, Inc. * | 43,083 | 3,192,450 |
Mettler-Toledo International, Inc. * | 9,140 | 11,239,458 |
Neurocrine Biosciences, Inc. * | 44,579 | 6,131,396 |
SECURITY | NUMBER OF SHARES | VALUE ($) |
Option Care Health, Inc. * | 130,599 | 3,903,604 |
Owens & Minor, Inc. * | 58,600 | 1,449,764 |
Prestige Consumer Healthcare, Inc. * | 103,746 | 7,444,813 |
Regeneron Pharmaceuticals, Inc. * | 19,352 | 17,236,052 |
ResMed, Inc. | 8,473 | 1,813,137 |
Stryker Corp. | 63,548 | 21,383,902 |
Thermo Fisher Scientific, Inc. | 22,414 | 12,747,290 |
Twist Bioscience Corp. * | 24,925 | 778,408 |
United Therapeutics Corp. * | 37,155 | 8,706,531 |
UnitedHealth Group, Inc. | 88,185 | 42,655,084 |
Veeva Systems, Inc., Class A * | 37,910 | 7,527,410 |
Veracyte, Inc. * | 39,324 | 769,571 |
SECURITY | NUMBER OF SHARES | VALUE ($) |
Vertex Pharmaceuticals, Inc. * | 58,991 | 23,172,255 |
Zimmer Biomet Holdings, Inc. | 58,903 | 7,084,853 |
Zoetis, Inc. | 46,219 | 7,359,914 |
596,076,780 | ||
Total Common Stocks (Cost $502,927,710) | 784,882,089 | |
Total Investments in Securities (Cost $502,927,710) | 784,882,089 | |
* | Non-income producing security. |
DESCRIPTION | QUOTED PRICES IN ACTIVE MARKETS FOR IDENTICAL ASSETS (LEVEL 1) | OTHER SIGNIFICANT OBSERVABLE INPUTS (LEVEL 2) | SIGNIFICANT UNOBSERVABLE INPUTS (LEVEL 3) | TOTAL |
Assets | ||||
Common Stocks1 | $616,521,691 | $— | $— | $616,521,691 |
Australia | — | 3,141,445 | — | 3,141,445 |
Denmark | — | 47,660,241 | — | 47,660,241 |
France | — | 9,060,620 | — | 9,060,620 |
Germany | — | 3,528,349 | — | 3,528,349 |
Italy | — | 1,168,725 | — | 1,168,725 |
Japan | — | 28,892,991 | — | 28,892,991 |
Republic of Korea | — | 7,256,365 | — | 7,256,365 |
Sweden | — | 2,284,924 | — | 2,284,924 |
Switzerland | — | 29,683,080 | — | 29,683,080 |
United Kingdom | — | 35,683,658 | — | 35,683,658 |
Total | $616,521,691 | $168,360,398 | $— | $784,882,089 |
1 | As categorized in the Portfolio Holdings. |
Assets | ||
Investments in securities, at value - unaffiliated issuers (cost $502,927,710) | $784,882,089 | |
Foreign currency, at value (cost $481,725) | 480,129 | |
Receivables: | ||
Foreign tax reclaims | 1,093,340 | |
Dividends | 587,371 | |
Investments sold | 197,523 | |
Fund shares sold | 97,161 | |
Prepaid expenses | + | 22,535 |
Total assets | 787,360,148 | |
Liabilities | ||
Payables: | ||
Fund shares redeemed | 356,649 | |
Investment adviser and administrator fees | 342,832 | |
Due to custodian | 200,156 | |
Shareholder service fees | 154,891 | |
Independent trustees’ fees | 16 | |
Accrued expenses | + | 91,546 |
Total liabilities | 1,146,090 | |
Net assets | $786,214,058 | |
Net Assets by Source | ||
Capital received from investors | $481,932,468 | |
Total distributable earnings | + | 304,281,590 |
Net assets | $786,214,058 | |
Net Asset Value (NAV) | ||||
Net Assets | ÷ | Shares Outstanding | = | NAV |
$786,214,058 | 29,850,681 | $26.34 | ||
For the period November 1, 2023 through April 30, 2024; unaudited | ||
Investment Income | ||
Dividends received from securities - unaffiliated issuers (net of foreign withholding tax of $285,190) | $6,394,072 | |
Other interest | + | 9,078 |
Total investment income | 6,403,150 | |
Expenses | ||
Investment adviser and administrator fees | 2,080,971 | |
Shareholder service fees | 913,366 | |
Portfolio accounting fees | 27,769 | |
Shareholder reports | 18,792 | |
Professional fees | 17,153 | |
Registration fees | 14,130 | |
Independent trustees’ fees | 3,743 | |
Transfer agent fees | 2,438 | |
Other expenses | + | 5,475 |
Total expenses | – | 3,083,837 |
Net investment income | 3,319,313 | |
REALIZED AND UNREALIZED GAINS (LOSSES) | ||
Net realized gains on sales of securities - unaffiliated issuers | 20,968,500 | |
Net realized gains on foreign currency transactions | + | 60,955 |
Net realized gains | 21,029,455 | |
Net change in unrealized appreciation (depreciation) on securities - unaffiliated issuers | 73,281,928 | |
Net change in unrealized appreciation (depreciation) on foreign currency translations | + | (19,657 ) |
Net change in unrealized appreciation (depreciation) | + | 73,262,271 |
Net realized and unrealized gains | 94,291,726 | |
Increase in net assets resulting from operations | $97,611,039 | |
OPERATIONS | |||
11/1/23-4/30/24 | 11/1/22-10/31/23 | ||
Net investment income | $3,319,313 | $6,396,150 | |
Net realized gains | 21,029,455 | 21,281,179 | |
Net change in unrealized appreciation (depreciation) | + | 73,262,271 | (58,022,517 ) |
Increase (decrease) in net assets resulting from operations | $97,611,039 | ($30,345,188 ) | |
DISTRIBUTIONS TO SHAREHOLDERS | |||
Total distributions | ($27,546,281 ) | ($34,603,137 ) | |
TRANSACTIONS IN FUND SHARES | |||||
11/1/23-4/30/24 | 11/1/22-10/31/23 | ||||
SHARES | VALUE | SHARES | VALUE | ||
Shares sold | 829,193 | $21,663,256 | 1,914,250 | $49,354,082 | |
Shares reinvested | 936,699 | 23,623,551 | 1,116,087 | 30,056,232 | |
Shares redeemed | + | (2,403,554 ) | (62,422,841 ) | (4,324,885 ) | (110,204,717 ) |
Net transactions in fund shares | (637,662 ) | ($17,136,034 ) | (1,294,548 ) | ($30,794,403 ) | |
SHARES OUTSTANDING AND NET ASSETS | |||||
11/1/23-4/30/24 | 11/1/22-10/31/23 | ||||
SHARES | NET ASSETS | SHARES | NET ASSETS | ||
Beginning of period | 30,488,343 | $733,285,334 | 31,782,891 | $829,028,062 | |
Total increase (decrease) | + | (637,662 ) | 52,928,724 | (1,294,548 ) | (95,742,728 ) |
End of period | 29,850,681 | $786,214,058 | 30,488,343 | $733,285,334 | |
11/1/23– 4/30/24* | 11/1/22– 10/31/23 | 11/1/21– 10/31/22 | 11/1/20– 10/31/21 | 11/1/19– 10/31/20 | 11/1/18– 10/31/19 | |
Per-Share Data | ||||||
Net asset value at beginning of period | $9.84 | $8.71 | $11.55 | $9.11 | $10.04 | $9.64 |
Income (loss) from investment operations: | ||||||
Net investment income (loss)1 | 0.12 | 0.27 | 0.34 | 0.21 | 0.14 | 0.24 |
Net realized and unrealized gains (losses) | 1.82 | 1.18 | (2.86 ) | 2.34 | (0.71 ) | 0.41 |
Total from investment operations | 1.94 | 1.45 | (2.52 ) | 2.55 | (0.57 ) | 0.65 |
Less distributions: | ||||||
Distributions from net investment income | (0.29 ) | (0.32 ) | (0.32 ) | (0.11 ) | (0.36 ) | (0.25 ) |
Net asset value at end of period | $11.49 | $9.84 | $8.71 | $11.55 | $9.11 | $10.04 |
Total return | 19.96 %2 | 16.74 % | (22.40 %) | 28.12 % | (6.01 %) | 7.08 % |
Ratios/Supplemental Data | ||||||
Ratios to average net assets: | ||||||
Net operating expenses | 0.86 %3 | 0.86 % | 0.86 %4 | 0.86 % | 0.86 % | 0.86 % |
Gross operating expenses | 0.87 %3 | 0.87 % | 0.89 %4 | 0.86 % | 0.88 % | 0.87 % |
Net investment income (loss) | 2.15 %3 | 2.65 % | 3.40 % | 1.93 % | 1.51 % | 2.44 % |
Portfolio turnover rate | 31 %2 | 62 % | 94 % | 103 % | 97 % | 91 % |
Net assets, end of period (x 1,000) | $584,974 | $511,144 | $507,380 | $692,619 | $664,487 | $975,511 |
* | Unaudited. |
1 | Calculated based on the average shares outstanding during the period. |
2 | Not annualized. |
3 | Annualized. |
4 | Ratio includes less than 0.005% of non-routine proxy expenses. |
SECURITY | NUMBER OF SHARES | VALUE ($) |
COMMON STOCKS 98.0% OF NET ASSETS | ||
Australia 4.9% | ||
ANZ Group Holdings Ltd. | 206,416 | 3,724,555 |
Aristocrat Leisure Ltd. | 153,174 | 3,908,999 |
BHP Group Ltd. | 167,183 | 4,585,179 |
BlueScope Steel Ltd. | 41,000 | 598,412 |
Commonwealth Bank of Australia | 40,263 | 2,950,051 |
Fortescue Ltd. | 93,474 | 1,549,280 |
James Hardie Industries PLC * | 18,000 | 618,803 |
JB Hi-Fi Ltd. | 100,911 | 3,937,758 |
Macquarie Group Ltd. | 23,114 | 2,767,636 |
National Australia Bank Ltd. | 108,648 | 2,355,219 |
Qantas Airways Ltd. * | 216,937 | 818,483 |
Technology One Ltd. | 110,762 | 1,147,185 |
28,961,560 | ||
Austria 0.6% | ||
Erste Group Bank AG | 23,066 | 1,075,685 |
Wienerberger AG | 75,246 | 2,688,939 |
3,764,624 | ||
Belgium 0.8% | ||
Colruyt Group NV | 96,056 | 4,451,028 |
Brazil 0.6% | ||
Vale SA | 301,200 | 3,671,176 |
Canada 2.0% | ||
Barrick Gold Corp. | 66,100 | 1,098,586 |
CGI, Inc. * | 36,109 | 3,658,769 |
Constellation Software, Inc. | 400 | 1,029,828 |
Dollarama, Inc. | 24,500 | 2,043,787 |
Imperial Oil Ltd. | 38,200 | 2,626,397 |
Suncor Energy, Inc. | 27,900 | 1,064,604 |
11,521,971 | ||
China 0.8% | ||
COSCO SHIPPING Holdings Co. Ltd., H Shares | 1,977,500 | 2,558,555 |
Tencent Holdings Ltd. | 48,100 | 2,110,781 |
4,669,336 | ||
Denmark 5.4% | ||
Novo Nordisk AS, Class B | 206,564 | 26,490,221 |
Pandora AS | 26,176 | 3,983,984 |
Rockwool AS, B Shares | 4,210 | 1,372,412 |
31,846,617 | ||
SECURITY | NUMBER OF SHARES | VALUE ($) |
France 12.5% | ||
Airbus SE | 13,000 | 2,139,251 |
BNP Paribas SA | 59,023 | 4,247,405 |
Cie de Saint-Gobain SA | 92,373 | 7,305,101 |
Cie Generale des Etablissements Michelin SCA | 209,497 | 8,048,591 |
Eiffage SA | 43,928 | 4,687,049 |
Engie SA * | 351,374 | 6,100,067 |
Hermes International SCA | 1,695 | 4,057,813 |
Ipsen SA | 45,406 | 5,523,019 |
L'Oreal SA | 15,092 | 7,075,932 |
LVMH Moet Hennessy Louis Vuitton SE | 9,416 | 7,734,641 |
Sanofi SA | 36,351 | 3,591,226 |
Schneider Electric SE | 14,200 | 3,237,790 |
Societe Generale SA | 127,605 | 3,438,323 |
TotalEnergies SE | 80,744 | 5,861,914 |
73,048,122 | ||
Germany 9.0% | ||
Allianz SE | 24,313 | 6,899,666 |
Bayerische Motoren Werke AG | 19,720 | 2,148,480 |
Deutsche Telekom AG | 345,950 | 7,924,180 |
Fresenius SE & Co. KGaA | 38,820 | 1,158,403 |
Heidelberg Materials AG | 77,817 | 7,831,165 |
Henkel AG & Co. KGaA | 4,356 | 313,234 |
Mercedes-Benz Group AG | 57,599 | 4,356,839 |
SAP SE | 60,295 | 10,887,296 |
Siemens AG | 50,250 | 9,413,508 |
Vonovia SE | 52,567 | 1,518,977 |
52,451,748 | ||
Hong Kong 1.3% | ||
China Medical System Holdings Ltd. | 366,000 | 326,783 |
Hong Kong Exchanges & Clearing Ltd. | 78,000 | 2,478,404 |
NetEase, Inc. | 57,000 | 1,068,444 |
PetroChina Co. Ltd., H Shares | 3,942,000 | 3,672,923 |
7,546,554 | ||
Israel 0.4% | ||
Check Point Software Technologies Ltd. * | 15,600 | 2,330,952 |
Italy 4.1% | ||
A2A SpA | 335,375 | 661,411 |
Assicurazioni Generali SpA | 61,244 | 1,493,278 |
Enel SpA | 1,069,993 | 7,032,466 |
Stellantis NV | 297,006 | 6,571,702 |
UniCredit SpA | 102,000 | 3,743,845 |
Unipol Gruppo SpA | 482,074 | 4,321,650 |
23,824,352 | ||
SECURITY | NUMBER OF SHARES | VALUE ($) |
Japan 21.5% | ||
Dai-ichi Life Holdings, Inc. | 69,000 | 1,598,111 |
Daiichi Sankyo Co. Ltd. | 47,500 | 1,598,740 |
Disco Corp. | 10,400 | 2,962,395 |
Fast Retailing Co. Ltd. | 17,600 | 4,601,855 |
Fujikura Ltd. | 138,800 | 2,385,183 |
Hikari Tsushin, Inc. | 3,600 | 585,078 |
Hitachi Ltd. | 101,000 | 9,318,328 |
Honda Motor Co. Ltd. | 297,000 | 3,379,140 |
Hoya Corp. | 57,603 | 6,678,481 |
Inpex Corp. | 348,274 | 5,217,074 |
Japan Exchange Group, Inc. | 178,100 | 4,171,193 |
Japan Post Insurance Co. Ltd. | 49,100 | 921,807 |
Lawson, Inc. | 13,000 | 851,061 |
Makita Corp. | 198,000 | 5,732,273 |
Mitsubishi Corp. | 111,900 | 2,559,105 |
Mitsui Fudosan Co. Ltd. | 399,000 | 4,060,648 |
Nexon Co. Ltd. | 61,000 | 951,072 |
Nintendo Co. Ltd. | 38,000 | 1,853,221 |
Nippon Building Fund, Inc. | 325 | 1,241,758 |
Nippon Yusen KK | 50,000 | 1,419,523 |
Nitto Denko Corp. | 11,600 | 959,153 |
Nomura Holdings, Inc. | 457,800 | 2,604,873 |
Ono Pharmaceutical Co. Ltd. | 208,100 | 2,997,339 |
Oracle Corp. | 38,500 | 2,889,216 |
ORIX Corp. | 328,000 | 6,712,655 |
Panasonic Holdings Corp. | 274,900 | 2,399,451 |
Persol Holdings Co. Ltd. | 473,200 | 654,582 |
Recruit Holdings Co. Ltd. | 105,400 | 4,539,300 |
Renesas Electronics Corp. | 99,900 | 1,621,952 |
SCREEN Holdings Co. Ltd. | 11,000 | 1,134,949 |
Sega Sammy Holdings, Inc. | 53,200 | 696,333 |
Shimamura Co. Ltd. | 21,200 | 1,045,093 |
Sompo Holdings, Inc. | 87,600 | 1,733,614 |
Sony Group Corp. | 37,800 | 3,124,221 |
Sumitomo Mitsui Financial Group, Inc. | 156,100 | 8,867,069 |
Tokio Marine Holdings, Inc. | 59,000 | 1,864,777 |
Tokyo Electron Ltd. | 31,300 | 6,865,522 |
Tokyo Gas Co. Ltd. | 97,000 | 2,175,443 |
Toyo Suisan Kaisha Ltd. | 43,000 | 2,688,973 |
Toyota Motor Corp. | 352,000 | 8,028,618 |
125,689,179 | ||
Netherlands 6.2% | ||
ABN AMRO Bank NV, GDR | 133,499 | 2,138,462 |
ASML Holding NV | 24,119 | 21,007,955 |
Koninklijke Ahold Delhaize NV | 213,659 | 6,485,445 |
Wolters Kluwer NV | 45,695 | 6,840,838 |
36,472,700 | ||
Norway 0.3% | ||
Equinor ASA | 68,221 | 1,815,249 |
Republic of Korea 1.2% | ||
Doosan Bobcat, Inc. | 72,614 | 2,713,942 |
Kia Corp. | 49,750 | 4,214,948 |
6,928,890 | ||
Singapore 0.8% | ||
Jardine Cycle & Carriage Ltd. | 104,500 | 2,016,666 |
Jardine Matheson Holdings Ltd. | 63,600 | 2,440,332 |
4,456,998 | ||
SECURITY | NUMBER OF SHARES | VALUE ($) |
Spain 2.0% | ||
Banco Bilbao Vizcaya Argentaria SA | 249,581 | 2,698,962 |
Banco Santander SA (a) | 1,078,329 | 5,246,752 |
Endesa SA | 85,195 | 1,553,586 |
Industria de Diseno Textil SA (a) | 45,671 | 2,079,443 |
11,578,743 | ||
Sweden 1.8% | ||
Atlas Copco AB, A Shares | 237,205 | 4,154,902 |
Investor AB, B Shares | 67,688 | 1,657,865 |
Nordea Bank Abp | 144,421 | 1,678,782 |
SSAB AB, A Shares | 425,113 | 2,387,063 |
Volvo AB, B Shares | 26,057 | 663,234 |
10,541,846 | ||
Switzerland 6.8% | ||
ABB Ltd. | 57,000 | 2,769,541 |
Holcim AG | 88,926 | 7,443,791 |
Logitech International SA | 17,871 | 1,391,386 |
Nestle SA | 75,127 | 7,542,763 |
Novartis AG | 141,850 | 13,767,603 |
Partners Group Holding AG | 706 | 908,316 |
Roche Holding AG | 14,740 | 3,531,913 |
UBS Group AG | 103,535 | 2,719,167 |
40,074,480 | ||
Taiwan 0.9% | ||
MediaTek, Inc. | 50,000 | 1,507,558 |
Taiwan Semiconductor Manufacturing Co. Ltd. | 148,000 | 3,543,676 |
5,051,234 | ||
United Kingdom 14.1% | ||
AstraZeneca PLC | 17,265 | 2,611,312 |
BAE Systems PLC | 367,128 | 6,106,153 |
Centrica PLC | 2,010,415 | 3,209,168 |
CRH PLC | 17,736 | 1,373,490 |
Games Workshop Group PLC | 28,587 | 3,533,186 |
GSK PLC | 364,163 | 7,555,257 |
Hikma Pharmaceuticals PLC | 105,396 | 2,530,618 |
Howden Joinery Group PLC | 147,564 | 1,606,192 |
HSBC Holdings PLC | 926,192 | 8,028,187 |
Imperial Brands PLC | 271,030 | 6,193,076 |
Investec PLC | 213,214 | 1,350,558 |
Legal & General Group PLC | 830,297 | 2,437,336 |
Man Group PLC | 601,917 | 1,930,289 |
Marks & Spencer Group PLC | 527,881 | 1,681,798 |
NatWest Group PLC | 597,172 | 2,253,955 |
Next PLC | 58,557 | 6,567,635 |
RELX PLC | 72,000 | 2,958,255 |
Rio Tinto PLC | 38,893 | 2,631,529 |
Shell PLC | 339,996 | 12,086,380 |
Tesco PLC | 1,211,334 | 4,472,328 |
Unilever PLC | 28,498 | 1,474,224 |
82,590,926 | ||
Total Common Stocks (Cost $454,034,040) | 573,288,285 | |
SECURITY | NUMBER OF SHARES | VALUE ($) |
SHORT-TERM INVESTMENTS 2.2% OF NET ASSETS | ||
Money Market Funds 2.2% | ||
State Street Institutional U.S. Government Money Market Fund, Premier Class 5.25% (b) | 6,674,828 | 6,674,828 |
State Street Institutional U.S. Government Money Market Fund, Premier Class 5.25% (b)(c) | 5,890,275 | 5,890,275 |
12,565,103 | ||
Total Short-Term Investments (Cost $12,565,103) | 12,565,103 | |
Total Investments in Securities (Cost $466,599,143) | 585,853,388 | |
* | Non-income producing security. |
(a) | All or a portion of this security is on loan. Securities on loan were valued at $5,369,971. |
(b) | The rate shown is the annualized 7-day yield. |
(c) | Security purchased with cash collateral received for securities on loan. |
GDR — | Global Depositary Receipt |
DESCRIPTION | QUOTED PRICES IN ACTIVE MARKETS FOR IDENTICAL ASSETS (LEVEL 1) | OTHER SIGNIFICANT OBSERVABLE INPUTS (LEVEL 2) | SIGNIFICANT UNOBSERVABLE INPUTS (LEVEL 3) | TOTAL |
Assets | ||||
Common Stocks1 | $— | $421,166,981 | $— | $421,166,981 |
Belgium | 4,451,028 | — | — | 4,451,028 |
Brazil | 3,671,176 | — | — | 3,671,176 |
Canada | 11,521,971 | — | — | 11,521,971 |
Israel | 2,330,952 | — | — | 2,330,952 |
Japan | 851,061 | 124,838,118 | — | 125,689,179 |
Singapore | 2,440,332 | 2,016,666 | — | 4,456,998 |
Short-Term Investments1 | 12,565,103 | — | — | 12,565,103 |
Total | $37,831,623 | $548,021,765 | $— | $585,853,388 |
1 | As categorized in the Portfolio Holdings. |
Assets | ||
Investments in securities, at value - unaffiliated issuers (cost $466,599,143) including securities on loan of $5,369,971 | $585,853,388 | |
Foreign currency, at value (cost $1,893,580) | 1,848,373 | |
Receivables: | ||
Dividends | 2,466,460 | |
Foreign tax reclaims | 1,372,690 | |
Fund shares sold | 42,330 | |
Income from securities on loan | 5,153 | |
Prepaid expenses | + | 21,293 |
Total assets | 591,609,687 | |
Liabilities | ||
Collateral held for securities on loan | 5,890,275 | |
Payables: | ||
Investment adviser and administrator fees | 279,838 | |
Shareholder service fees | 113,251 | |
Fund shares redeemed | 107,011 | |
IRS compliance fee for foreign withholding tax claims | 103,830 | |
Accrued expenses | + | 141,172 |
Total liabilities | 6,635,377 | |
Net assets | $584,974,310 | |
Net Assets by Source | ||
Capital received from investors | $543,742,728 | |
Total distributable earnings | + | 41,231,582 |
Net assets | $584,974,310 | |
Net Asset Value (NAV) | ||||
Net Assets | ÷ | Shares Outstanding | = | NAV |
$584,974,310 | 50,910,845 | $11.49 | ||
For the period November 1, 2023 through April 30, 2024; unaudited | ||
Investment Income | ||
Dividends received from securities - unaffiliated issuers (net of foreign withholding tax of $946,312) | $8,519,471 | |
Securities on loan, net | + | 37,495 |
Total investment income | 8,556,966 | |
Expenses | ||
Investment adviser and administrator fees | 1,648,241 | |
Shareholder service fees | 699,794 | |
Professional fees | 37,881 1 | |
Portfolio accounting fees | 35,640 | |
Custodian fees | 27,429 | |
Registration fees | 11,822 | |
Shareholder reports | 7,494 | |
Transfer agent fees | 6,154 | |
Independent trustees’ fees | 3,486 | |
Other expenses | + | 6,677 |
Total expenses | 2,484,618 | |
Expense reduction | – | 40,010 1 |
Net expenses | – | 2,444,608 |
Net investment income | 6,112,358 | |
REALIZED AND UNREALIZED GAINS (LOSSES) | ||
Net realized gains on sales of securities - unaffiliated issuers | 22,970,529 | |
Net realized losses on foreign currency transactions | + | (16,876 ) |
Net realized gains | 22,953,653 | |
Net change in unrealized appreciation (depreciation) on securities - unaffiliated issuers | 71,700,264 | |
Net change in unrealized appreciation (depreciation) on foreign currency translations | + | (86,870 ) |
Net change in unrealized appreciation (depreciation) | + | 71,613,394 |
Net realized and unrealized gains | 94,567,047 | |
Increase in net assets resulting from operations | $100,679,405 | |
1 | Includes professional fees of $17,272 associated with the filing of foreign withholding tax claims in the European Union are deemed to be non-contingent and non-routine expenses of the fund (see financial notes 2(d) and 4 for additional information). |
OPERATIONS | |||
11/1/23-4/30/24 | 11/1/22-10/31/23 | ||
Net investment income | $6,112,358 | $14,362,950 | |
Net realized gains | 22,953,653 | 5,351,934 | |
Net change in unrealized appreciation (depreciation) | + | 71,613,394 | 65,333,356 |
Increase in net assets resulting from operations | $100,679,405 | $85,048,240 | |
DISTRIBUTIONS TO SHAREHOLDERS | |||
Total distributions | ($14,962,629 ) | ($18,031,388 ) | |
TRANSACTIONS IN FUND SHARES | |||||
11/1/23-4/30/24 | 11/1/22-10/31/23 | ||||
SHARES | VALUE | SHARES | VALUE | ||
Shares sold | 1,543,724 | $17,079,990 | 1,846,614 | $18,701,524 | |
Shares reinvested | 1,254,919 | 13,302,138 | 1,694,173 | 16,162,412 | |
Shares redeemed | + | (3,827,985 ) | (42,268,753 ) | (9,868,515 ) | (98,116,676 ) |
Net transactions in fund shares | (1,029,342 ) | ($11,886,625 ) | (6,327,728 ) | ($63,252,740 ) | |
SHARES OUTSTANDING AND NET ASSETS | |||||
11/1/23-4/30/24 | 11/1/22-10/31/23 | ||||
SHARES | NET ASSETS | SHARES | NET ASSETS | ||
Beginning of period | 51,940,187 | $511,144,159 | 58,267,915 | $507,380,047 | |
Total increase (decrease) | + | (1,029,342 ) | 73,830,151 | (6,327,728 ) | 3,764,112 |
End of period | 50,910,845 | $584,974,310 | 51,940,187 | $511,144,159 | |
SCHWAB CAPITAL TRUST | |
Schwab Core Equity Fund | Schwab Target 2045 Fund |
Schwab Dividend Equity Fund | Schwab Target 2050 Fund |
Schwab Large-Cap Growth Fund | Schwab Target 2055 Fund |
Schwab Small-Cap Equity Fund | Schwab Target 2060 Fund |
Schwab Health Care Fund | Schwab Target 2065 Fund |
Schwab International Core Equity Fund | Schwab Fundamental US Large Company Index Fund |
Schwab S&P 500 Index Fund | Schwab Fundamental US Small Company Index Fund |
Schwab Small-Cap Index Fund® | Schwab Fundamental International Large Company Index Fund |
Schwab Total Stock Market Index Fund® | Schwab Fundamental International Small Company Index Fund |
Schwab U.S. Large-Cap Growth Index Fund | Schwab Fundamental Emerging Markets Large Company Index Fund |
Schwab U.S. Large-Cap Value Index Fund | Schwab Fundamental Global Real Estate Index Fund |
Schwab U.S. Mid-Cap Index Fund | Schwab Target 2010 Index Fund |
Schwab International Index Fund® | Schwab Target 2015 Index Fund |
Schwab MarketTrack All Equity Portfolio™ | Schwab Target 2020 Index Fund |
Schwab MarketTrack Growth Portfolio™ | Schwab Target 2025 Index Fund |
Schwab MarketTrack Balanced Portfolio™ | Schwab Target 2030 Index Fund |
Schwab MarketTrack Conservative Portfolio™ | Schwab Target 2035 Index Fund |
Schwab International Opportunities Fund | Schwab Target 2040 Index Fund |
Schwab Balanced Fund | Schwab Target 2045 Index Fund |
Schwab Target 2010 Fund | Schwab Target 2050 Index Fund |
Schwab Target 2015 Fund | Schwab Target 2055 Index Fund |
Schwab Target 2020 Fund | Schwab Target 2060 Index Fund |
Schwab Target 2025 Fund | Schwab Target 2065 Index Fund |
Schwab Target 2030 Fund | Schwab Monthly Income Fund - Target Payout |
Schwab Target 2035 Fund | Schwab Monthly Income Fund - Flexible Payout |
Schwab Target 2040 Fund | Schwab Monthly Income Fund - Income Payout |
The Schwab Dividend Equity Fund seeks current income and capital appreciation.
The Schwab Large-Cap Growth Fund seeks long-term capital growth.
The Schwab Small-Cap Equity Fund seeks long-term capital growth.
The Schwab Health Care Fund seeks long-term capital growth.
The Schwab International Core Equity Fund seeks long-term capital growth.
3. Risk Factors:
4. Affiliates and Affiliated Transactions:
% OF AVERAGE DAILY NET ASSETS | SCHWAB CORE EQUITY FUND | SCHWAB DIVIDEND EQUITY FUND | SCHWAB LARGE-CAP GROWTH FUND | SCHWAB SMALL-CAP EQUITY FUND | SCHWAB INTERNATIONAL CORE EQUITY FUND |
Flat rate | 0.47 % | 0.62 % | 0.72 % | 0.81 % | 0.58 % |
% OF AVERAGE DAILY NET ASSETS | SCHWAB HEALTH CARE FUND |
First $500 million | 0.54 % |
$500 million to $1 billion | 0.515 % |
Over $1 billion | 0.49 % |
SCHWAB CORE EQUITY FUND | SCHWAB DIVIDEND EQUITY FUND | SCHWAB LARGE-CAP GROWTH FUND | SCHWAB SMALL-CAP EQUITY FUND | SCHWAB HEALTH CARE FUND | SCHWAB INTERNATIONAL CORE EQUITY FUND |
0.75 % | 0.89 % | 0.99 % | 1.12 % | 0.82 % | 0.86 % |
UNDERLYING FUNDS | |||
SCHWAB CORE EQUITY FUND | SCHWAB SMALL-CAP EQUITY FUND | SCHWAB INTERNATIONAL CORE EQUITY FUND | |
Schwab Balanced Fund | 12.8 % | 9.7 % | — % |
Schwab Target 2010 Fund | 0.1 % | 0.1 % | 0.2 % |
Schwab Target 2015 Fund | 0.1 % | 0.1 % | 0.3 % |
Schwab Target 2020 Fund | 0.5 % | 0.9 % | 2.2 % |
Schwab Target 2025 Fund | 0.7 % | 1.4 % | 3.6 % |
Schwab Target 2030 Fund | 2.3 % | 4.5 % | 10.4 % |
Schwab Target 2035 Fund | 1.5 % | 3.4 % | 7.3 % |
Schwab Target 2040 Fund | 3.3 % | 8.2 % | 16.9 % |
Schwab Target 2045 Fund | 0.9 % | 2.3 % | 4.4 % |
Schwab Target 2050 Fund | 1.0 % | 2.6 % | 4.7 % |
Schwab Target 2055 Fund | 0.7 % | 1.9 % | 3.4 % |
Schwab Target 2060 Fund | 0.2 % | 0.7 % | 1.2 % |
Schwab Target 2065 Fund | 0.1 % | 0.2 % | 0.3 % |
PURCHASE COST | SALE PROCEEDS | REALIZED GAINS (LOSSES) | |
Schwab Core Equity Fund | $— | $3,448,302 | $444,368 |
Schwab Dividend Equity Fund | — | — | — |
Schwab Large-Cap Growth Fund | — | — | — |
Schwab Small-Cap Equity Fund | — | — | — |
Schwab Health Care Fund | — | — | — |
Schwab International Core Equity Fund | — | — | — |
5. Board of Trustees:
6. Borrowing from Banks:
7. Derivatives:
EQUITY CONTRACTS | TOTAL | |
Liability Derivatives | ||
Schwab Large-Cap Growth Fund | ||
Futures Contracts1 | ($123,987 ) | ($123,987 ) |
Schwab Small-Cap Equity Fund | ||
Futures Contracts1 | (1,326,948 ) | (1,326,948 ) |
1 | Includes cumulative unrealized appreciation of futures contracts as reported in the fund’s Portfolio Holdings. Only current day’s variation margin on futures contracts is reported in the Statement of Assets and Liabilities. |
EQUITY CONTRACTS | TOTAL | |
Net Realized Gains (Losses) | ||
Schwab Large-Cap Growth Fund | ||
Futures Contracts1 | $565,084 | $565,084 |
Schwab Small-Cap Equity Fund | ||
Futures Contracts1 | 1,632,790 | 1,632,790 |
1 | Statement of Operations location: Net realized gains (losses) on futures contracts. |
Net Change in Unrealized Appreciation (Depreciation) | ||
Schwab Large-Cap Growth Fund | ||
Futures Contracts1 | $174,997 | $174,997 |
Schwab Small-Cap Equity Fund | ||
Futures Contracts1 | 201,432 | 201,432 |
1 | Statement of Operations location: Net change in unrealized appreciation (depreciation) on futures contracts. |
NOTIONAL AMOUNTS | NUMBER OF CONTRACTS | |
Schwab Core Equity Fund | $— | — |
Schwab Dividend Equity Fund | — | — |
Schwab Large-Cap Growth Fund | 4,851,250 | 20 |
Schwab Small-Cap Equity Fund | 19,381,829 | 196 |
Schwab Health Care Fund | — | — |
Schwab International Core Equity Fund | — | — |
PURCHASES OF SECURITIES | SALES OF SECURITIES | |
Schwab Core Equity Fund | $228,068,756 | $318,684,399 |
Schwab Dividend Equity Fund | 40,366,368 | 50,154,122 |
Schwab Large-Cap Growth Fund | 58,385,882 | 21,514,206 |
Schwab Small-Cap Equity Fund | 242,780,792 | 263,770,317 |
Schwab Health Care Fund | 233,679,203 | 270,399,847 |
Schwab International Core Equity Fund | 171,423,094 | 191,533,709 |
9. Federal Income Taxes:
TAX COST | GROSS UNREALIZED APPRECIATION | GROSS UNREALIZED DEPRECIATION | NET UNREALIZED APPRECIATION (DEPRECIATION) | |
Schwab Core Equity Fund | $823,240,414 | $533,477,565 | ($35,273,673 ) | $498,203,892 |
Schwab Dividend Equity Fund | 388,869,846 | 120,879,745 | (16,328,229 ) | 104,551,516 |
Schwab Large-Cap Growth Fund | 184,045,674 | 189,517,824 | (4,115,446 ) | 185,402,378 |
Schwab Small-Cap Equity Fund | 473,296,448 | 105,418,985 | (47,534,598 ) | 57,884,387 |
Schwab Health Care Fund | 504,156,671 | 286,999,262 | (6,273,844 ) | 280,725,418 |
Schwab International Core Equity Fund | 466,873,373 | 128,920,090 | (9,940,075 ) | 118,980,015 |
Schwab Core Equity Fund | $— |
Schwab Dividend Equity Fund | — |
Schwab Large-Cap Growth Fund | 3,268,984 |
Schwab Small-Cap Equity Fund | 4,001,364 |
Schwab Health Care Fund | — |
Schwab International Core Equity Fund | 104,519,705 |
PRIOR FISCAL YEAR END DISTRIBUTIONS | ||
ORDINARY INCOME | LONG-TERM CAPITAL GAINS | |
Schwab Core Equity Fund | $17,094,456 | $161,213,765 |
Schwab Dividend Equity Fund | 11,160,645 | 23,230,569 |
Schwab Large-Cap Growth Fund | 45,563 | 4,291,751 |
Schwab Small-Cap Equity Fund | 658,510 | 47,501,473 |
Schwab Health Care Fund | 6,173,136 | 28,430,001 |
Schwab International Core Equity Fund | 18,031,388 | — |
10. Subsequent Events:
Independent Trustees | |||
Name, Year of Birth, and Position(s) with the trust (Terms of office, and length of Time Served1) | Principal Occupations During the Past Five Years | Number of Portfolios in Fund Complex Overseen by the Trustee | Other Directorships |
Michael J. Beer 1961 Trustee (Trustee of The Charles Schwab Family of Funds, Schwab Investments, Schwab Capital Trust, Schwab Annuity Portfolios, Schwab Strategic Trust and Laudus Trust since 2022) | Retired. Director, President and Chief Executive Officer (Dec. 2016 – Sept. 2019), Principal Funds (investment management). | 106 | Director (2016 – 2019), Principal Funds, Inc. |
Robert W. Burns 1959 Trustee (Trustee of Schwab Strategic Trust since 2009; The Charles Schwab Family of Funds, Schwab Investments, Schwab Capital Trust, Schwab Annuity Portfolios and Laudus Trust since 2016) | Retired/Private Investor. | 106 | None |
Nancy F. Heller 1956 Trustee (Trustee of The Charles Schwab Family of Funds, Schwab Investments, Schwab Capital Trust, Schwab Annuity Portfolios, Schwab Strategic Trust and Laudus Trust since 2018) | Retired. | 106 | None |
David L. Mahoney 1954 Trustee (Trustee of The Charles Schwab Family of Funds, Schwab Investments, Schwab Capital Trust, Schwab Annuity Portfolios and Laudus Trust since 2011; Schwab Strategic Trust since 2016) | Private Investor. | 106 | Director (2004 – present), Corcept Therapeutics Incorporated Director (2009 – 2021), Adamas Pharmaceuticals, Inc. Director (2003 – 2019), Symantec Corporation |
Jane P. Moncreiff 1961 Trustee (Trustee of The Charles Schwab Family of Funds, Schwab Investments, Schwab Capital Trust, Schwab Annuity Portfolios, Schwab Strategic Trust and Laudus Trust since 2019) | Consultant (2018 – present), Fulham Advisers LLC (management consulting); Chief Investment Officer (2009 – 2017), CareGroup Healthcare System, Inc. (healthcare). | 106 | None |
Independent Trustees (continued) | |||
Name, Year of Birth, and Position(s) with the trust (Terms of office, and length of Time Served1) | Principal Occupations During the Past Five Years | Number of Portfolios in Fund Complex Overseen by the Trustee | Other Directorships |
Kimberly S. Patmore 1956 Trustee (Trustee of The Charles Schwab Family of Funds, Schwab Investments, Schwab Capital Trust, Schwab Annuity Portfolios, Schwab Strategic Trust and Laudus Trust since 2016) | Consultant (2008 – present), Patmore Management Consulting (management consulting). | 106 | None |
J. Derek Penn 1957 Trustee (Trustee of The Charles Schwab Family of Funds, Schwab Investments, Schwab Capital Trust, Schwab Annuity Portfolios, Schwab Strategic Trust and Laudus Trust since 2021) | Head of Equity Sales and Trading (2006 – 2018), BNY Mellon (financial services). | 106 | None |
Interested Trustees | |||
Name, Year of Birth, and Position(s) with the trust (Terms of office, and length of Time Served1) | Principal Occupations During the Past Five Years | Number of Portfolios in Fund Complex Overseen by the Trustee | Other Directorships |
Walter W. Bettinger II2 1960 Chairman and Trustee (Trustee of The Charles Schwab Family of Funds, Schwab Investments, Schwab Capital Trust and Schwab Annuity Portfolios since 2008; Schwab Strategic Trust since 2009; Laudus Trust since 2010) | Co-Chairman of the Board (July 2022 – present), Director and Chief Executive Officer (Oct. 2008 – present) and President (Feb. 2007 – Oct. 2021), The Charles Schwab Corporation; President and Chief Executive Officer (Oct. 2008 – Oct. 2021) and Director (May 2008 – Oct. 2021), Charles Schwab & Co., Inc.; Co-Chairman of the Board (July 2022 – present) and Director (Apr. 2006 – present), Charles Schwab Bank, SSB; Co-Chairman of the Board (July 2022 – present) and Director (Nov. 2017 – present), Charles Schwab Premier Bank, SSB; Co-Chairman of the Board (July 2022 – present) and Director (July 2019 – present), Charles Schwab Trust Bank; Director (May 2008 – present), Chief Executive Officer (Aug. 2017 – present) and President (Aug. 2017 – Nov. 2021), Schwab Holdings, Inc.; Manager (Sept. 2023 – present), TD Ameritrade Holding LLC; Director (Oct. 2020 – Aug. 2023), TD Ameritrade Holding Corporation; Director (July 2016 – Oct. 2021), Charles Schwab Investment Management, Inc. | 106 | Director (2008 – present), The Charles Schwab Corporation |
Richard A. Wurster2 1973 Trustee (Trustee of The Charles Schwab Family of Funds, Schwab Investments, Schwab Capital Trust, Schwab Annuity Portfolios, Schwab Strategic Trust and Laudus Trust since 2022) | President (Oct. 2021 – present) and Executive Vice President – Schwab Asset Management Solutions (Apr. 2019 – Oct. 2021), The Charles Schwab Corporation; President, Director (Oct. 2021 – present), Executive Vice President – Schwab Asset Management Solutions (July 2019 – Oct. 2021) and Senior Vice President – Advisory (May 2016 – July 2019), Charles Schwab & Co., Inc.; President (Nov. 2021 – present), Schwab Holdings, Inc.; Director (Oct. 2021 – present) and Chief Executive Officer (Nov. 2019 – Jan. 2022), Charles Schwab Investment Management, Inc.; Director, Chief Executive Officer and President (Mar. 2018 – Oct. 2022), Charles Schwab Investment Advisory, Inc.; Chief Executive Officer (July 2016 – Apr. 2018) and President (Mar. 2017 – Apr. 2018), ThomasPartners, Inc.; Chief Executive Officer (July 2016 – Apr. 2018), Windhaven Investment Management, Inc. | 106 | None |
Officers of the Trust | |
Name, Year of Birth, and Position(s) with the trust (Terms of office, and length of Time Served3) | Principal Occupations During the Past Five Years |
Omar Aguilar 1970 Chief Executive Officer, President and Chief Investment Officer (Officer of The Charles Schwab Family of Funds, Schwab Investments, Schwab Capital Trust, Schwab Annuity Portfolios, Schwab Strategic Trust and Laudus Trust since 2011) | Chief Executive Officer (Jan. 2022 – present), President (Oct. 2023 – present), (Chief Investment Officer (Apr. 2011 – present) and Senior Vice President (Apr. 2011 – Jan. 2022), Charles Schwab Investment Management, Inc.; Director, Chief Executive Officer and President (Oct. 2022 – present), Charles Schwab Investment Advisory, Inc.; Chief Executive Officer (Sept. 2023 – present), President (Oct. 2023 – present), Chief Investment Officer (June 2011 – present) and Vice President (June 2011 – Sept. 2023), Schwab Funds, Laudus Trust and Schwab ETFs. |
Mark Fischer 1970 Chief Operating Officer (Officer of The Charles Schwab Family of Funds, Schwab Investments, Schwab Capital Trust, Schwab Annuity Portfolios, Schwab Strategic Trust and Laudus Trust since 2013) | Chief Operating Officer (Dec. 2020 – present) and Treasurer and Chief Financial Officer (Jan. 2016 – Dec. 2022), Schwab Funds, Laudus Trust and Schwab ETFs; Chief Financial Officer (Mar. 2020 – present), Chief Operating Officer (Oct. 2023 – present), Managing Director (Mar. 2023 – present) and Vice President (Oct. 2013 – Mar. 2023), Charles Schwab Investment Management, Inc. |
Dana Smith 1965 Treasurer and Chief Financial Officer (Officer of The Charles Schwab Family of Funds, Schwab Investments, Schwab Capital Trust, Schwab Annuity Portfolios, Schwab Strategic Trust and Laudus Trust since 2023) | Treasurer and Chief Financial Officer (Jan. 2023 – present) and Assistant Treasurer (Dec. 2015 – Dec. 2022), Schwab Funds, Laudus Trust and Schwab ETFs; Managing Director (Mar. 2023 – present), Vice President (Mar. 2022 – Mar. 2023) and Director (Oct. 2015 – Mar. 2022), Charles Schwab Investment Management, Inc.; Managing Director (May 2022 – present) and Vice President (Apr. 2022 – May 2022), Charles Schwab & Co., Inc. |
Patrick Cassidy 1964 Vice President and Chief Investment Officer (Officer of The Charles Schwab Family of Funds, Schwab Investments, Schwab Capital Trust, Schwab Annuity Portfolios, Schwab Strategic Trust and Laudus Trust since 2018) | Chief Investment Officer (Oct. 2023 – present) and Vice President (Feb. 2018 – present), Schwab Funds, Laudus Trust and Schwab ETFs; Managing Director (Mar. 2023 – present), Chief Investment Officer (Oct. 2023 – present), and Senior Vice President (Oct. 2012 – Mar. 2023), Charles Schwab Investment Management, Inc. |
William P. McMahon, Jr. 1972 Vice President and Chief Investment Officer (Officer of The Charles Schwab Family of Funds, Schwab Investments, Schwab Capital Trust, Schwab Annuity Portfolios, Schwab Strategic Trust and Laudus Trust since 2021) | Managing Director (Mar. 2023 – present), Senior Vice President (Jan. 2020 – Mar. 2023) and Chief Investment Officer (Jan. 2020 – present) Charles Schwab Investment Management, Inc.; Vice President and Chief Investment Officer (June 2021 – present), Schwab Funds, Laudus Trust and Schwab ETFs; Senior Vice President and Chief Investment Officer – ThomasPartners Strategies (Apr. 2018 – Dec. 2019), Charles Schwab Investment Advisory, Inc.; Senior Vice President and Chief Investment Officer (May 2001 – Apr. 2018), ThomasPartners, Inc. |
Catherine MacGregor 1964 Chief Legal Officer and Secretary, Schwab Funds and Schwab ETFs Chief Legal Officer, Vice President and Clerk, Laudus Trust (Officer of The Charles Schwab Family of Funds, Schwab Investments, Schwab Capital Trust, Schwab Annuity Portfolios and Laudus Trust since 2005; Schwab Strategic Trust since 2009) | Chief Legal Officer (Mar. 2022 – present), Managing Director (Mar. 2023 – present) and Vice President (Sept. 2005 – Mar. 2023), Charles Schwab Investment Management, Inc.; Managing Director (May 2022 – present) and Vice President (Aug. 2005 – May 2022), Charles Schwab & Co., Inc.; Vice President (Dec. 2005 – present) and Chief Legal Officer and Clerk (Mar. 2007 – present), Laudus Trust; Chief Legal Officer and Secretary (Oct. 2021 – present), Vice President (Nov. 2005 – Oct. 2021) and Assistant Secretary (June 2007 – Oct. 2021), Schwab Funds; Chief Legal Officer and Secretary (Oct. 2021 – present), Vice President and Assistant Secretary (Oct. 2009 – Oct. 2021), Schwab ETFs. |
Member SIPC®
Printed on recycled paper.

US Large Company Index Fund**
US Small Company Index Fund**
Large Company Index Fund**
Small Company Index Fund**
Large Company Index Fund**
FUNDAMENTAL INDEX is a registered trademark of Research Affiliates LLC.
No Action Required – Notice Regarding Shareholder Report Delivery |
Beginning on July 24, 2024, fund shareholder reports will be streamlined to highlight key information deemed important for investors to assess and monitor their fund investments. Other information, including financial statements, will not appear in the streamlined shareholder reports but will available online and delivered free of charge upon request. |
• If you already receive the full shareholder reports, you will receive the streamlined shareholder reports in the same way that you currently receive the full shareholder reports (either in paper or electronically). |
• If you currently receive a notification when a shareholder report is available on a fund’s website, beginning July 24, 2024, you will begin to receive the streamlined shareholder report (in paper). |
2 | |
3 | |
5 | |
7 | |
9 | |
11 | |
13 | |
15 | |
16 | |
28 | |
42 | |
56 | |
76 | |
85 | |
99 | |
102 |
Total Return for the 6 Months Ended April 30, 2024 | |
Schwab Fundamental US Large Company Index Fund1 (Ticker Symbol: SFLNX) | 19.00% |
Russell 1000® Index2 | 21.17% |
Russell RAFITM US Large Company Index3 | 19.12% |
Fund Category: Morningstar Large Value4 | 17.99% |
Performance Details | pages 5-6 |
Schwab Fundamental US Small Company Index Fund1 (Ticker Symbol: SFSNX) | 18.31% |
S&P 500® Index5 | 20.98% |
Russell RAFITM US Small Company Index3 | 18.35% |
Fund Category: Morningstar Small Blend4 | 18.81% |
Performance Details | pages 7-8 |
Schwab Fundamental International Large Company Index Fund1,6 (Ticker Symbol: SFNNX) | 16.29% |
MSCI EAFE® Index (Net)7,8 | 18.63% |
Russell RAFITM Developed ex US Large Company Index (Net)3,7 | 17.82% |
Fund Category: Morningstar Foreign Large Value4 | 15.83% |
Performance Details | pages 9-10 |
Total Return for the 6 Months Ended April 30, 2024 | |
Schwab Fundamental International Small Company Index Fund1,6 (Ticker Symbol: SFILX) | 14.22% |
MSCI EAFE® Index (Net)7,8 | 18.63% |
Russell RAFITM Developed ex US Small Company Index (Net)3,7 | 15.75% |
Fund Category: Morningstar Foreign Small/Mid Value4 | 16.97% |
Performance Details | pages 11-12 |
Schwab Fundamental Emerging Markets Large Company Index Fund1,6 (Ticker Symbol: SFENX) | 16.44% |
MSCI Emerging Markets Index (Net)7,9 | 15.40% |
Russell RAFITM Emerging Markets Large Company Index (Net)3,7 | 18.32% |
Fund Category: Morningstar Diversified Emerging Markets4 | 15.17% |
Performance Details | pages 13-14 |
 | Christopher Bliss, CFA, Managing Director and Head of Passive Equity Strategies for Schwab Asset Management, is responsible for overseeing the investment process and portfolio management of investment strategies for passive equity Schwab Funds and Schwab ETFs, and Schwab Personalized Indexing™ separately managed accounts. Before joining Schwab in 2016, Mr. Bliss spent 12 years at BlackRock (formerly Barclays Global Investors) managing and leading institutional index teams, most recently as a managing director and the head of the Americas institutional index team. In this role, Mr. Bliss was responsible for overseeing a team of portfolio managers managing domestic, developed international and emerging markets index strategies. Prior to BlackRock, he worked as an equity analyst and portfolio manager for Harris Bretall and before that, as a research analyst for JP Morgan. |
 | Jeremy Brown, CFA, Senior Portfolio Manager for Schwab Asset Management, is responsible for the day-to-day co-management of the Schwab Fundamental US Large Company Index Fund and Schwab Fundamental US Small Company Index Fund. Prior to joining Schwab in 2017, Mr. Brown spent six years with ALPS Advisors, Inc. in Denver, most recently as a senior analyst on the ETF portfolio management and research team where he performed portfolio management, trading, and analytics/research functions for ALPS ETFs and passive funds. Additionally, Mr. Brown led a number of investment research, commentary, industry trend analysis, and sales and marketing support initiatives. |
 | Joselle Duncan, CFA, Portfolio Manager for Schwab Asset Management, is responsible for the day-to-day co-management of the Schwab Fundamental International Large Company Index Fund, Schwab Fundamental International Small Company Index Fund, and Schwab Fundamental Emerging Markets Large Company Index Fund. Prior to joining Schwab in 2022, Ms. Duncan worked at BlackRock, Inc. for over 20 years as a vice president and portfolio manager focused on international ETFs. Before that, she held several positions at BlackRock (formerly Barclays Global Investors) including portfolio manager for institutional and mutual funds, securities lending trader, and securities lending product specialist. |
 | Jiwei Gu, CFA, Portfolio Manager for Schwab Asset Management, is responsible for the day-to-day co-management of the Schwab Fundamental International Large Company Index Fund, Schwab Fundamental International Small Company Index Fund, and Schwab Fundamental Emerging Markets Large Company Index Fund. Ms. Gu joined the portfolio management team as an associate portfolio manager in 2018. Prior to joining Schwab, she spent four years at CoBank, most recently as an enterprise risk analyst performing bank-level loan portfolio credit risk analysis, data analytics, and risk management methodology research. Before that, Ms. Gu worked in commercial credit underwriting and capital markets supporting lending activities. |
 | Ferian Juwono, CFA, Senior Portfolio Manager for Schwab Asset Management, is responsible for the oversight and day-to-day co-management of the Schwab Fundamental US Large Company Index Fund and Schwab Fundamental US Small Company Index Fund. Prior to joining Schwab in 2010, Mr. Juwono worked at BlackRock (formerly Barclays Global Investors) where he spent more than three years as a portfolio manager, managing equity index funds for institutional clients, and two years as a senior business analyst. Prior to that, Mr. Juwono worked for more than four years as a senior financial analyst with Union Bank of California. |
 | David Rios, Portfolio Manager for Schwab Asset Management, is responsible for the day-to-day co-management of the Schwab Fundamental International Large Company Index Fund, Schwab Fundamental International Small Company Index Fund, and Schwab Fundamental Emerging Markets Large Company Index Fund. Prior to this role, Mr. Rios was an associate portfolio manager on the equity index strategies team for four years. His first role with Schwab Asset Management was as a trade operations specialist. Prior to joining Schwab in 2008, Mr. Rios was a senior fund accountant at Investors Bank & Trust (subsequently acquired by State Street Corporation). |
 | Agnes Zau, CFA, Portfolio Manager for Schwab Asset Management, is responsible for the day-to-day co-management of the Schwab Fundamental US Large Company Index Fund and Schwab Fundamental US Small Company Index Fund. Prior to joining Schwab in 2018, Ms. Zau was at BlackRock for three years, most recently as a multi-asset portfolio investment consultant where she advised institutional clients on asset allocation and strategy, constructed risk decomposition and portfolio optimization, and conducted scenario analyses for the core multi-asset target risk strategies. She spent the preceding three years as a derivatives specialist at Mellon Capital. |
Fund and Inception Date | 6 Months | 1 Year | 5 Years | 10 Years |
Fund: Schwab Fundamental US Large Company Index Fund (4/2/07)2 | 19.00% | 17.70% | 12.79% | 10.98% |
Russell 1000® Index 3 | 21.17% | 22.82% | 12.87% | 12.14% |
Russell RAFITM US Large Company Index 4 | 19.12% | 17.96% | 13.04% | 11.26% |
Fund Category: Morningstar Large Value 5 | 17.99% | 14.37% | 9.20% | 8.57% |
Fund Expense Ratio6: 0.25% | ||||
Number of Holdings | 729 |
Weighted Average Market Cap (millions) | $407,710 |
Price/Earnings Ratio (P/E) | 17.8 |
Price/Book Ratio (P/B) | 2.3 |
Portfolio Turnover Rate | 4% 2,3 |
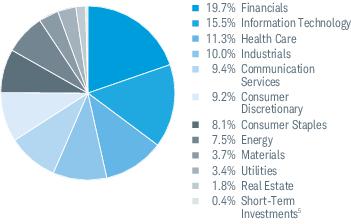
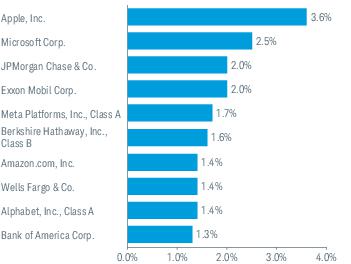
Fund and Inception Date | 6 Months | 1 Year | 5 Years | 10 Years |
Fund: Schwab Fundamental US Small Company Index Fund (4/2/07)2 | 18.31% | 14.09% | 8.35% | 8.15% |
S&P 500® Index 3 | 20.98% | 22.66% | 13.19% | 12.41% |
Russell RAFITM US Small Company Index 4 | 18.35% | 14.27% | 8.52% | 8.36% |
Russell 2000® Index | 19.66% | 13.32% | 5.83% | 7.22% |
Fund Category: Morningstar Small Blend 5 | 18.81% | 13.98% | 7.17% | 7.28% |
Fund Expense Ratio6: 0.25% | ||||
Number of Holdings | 1,009 |
Weighted Average Market Cap (millions) | $5,943 |
Price/Earnings Ratio (P/E) | 15.9 |
Price/Book Ratio (P/B) | 1.5 |
Portfolio Turnover Rate | 16% 2,3 |
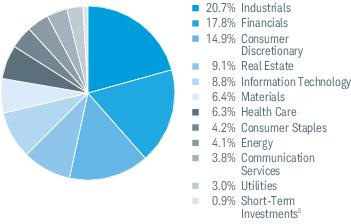
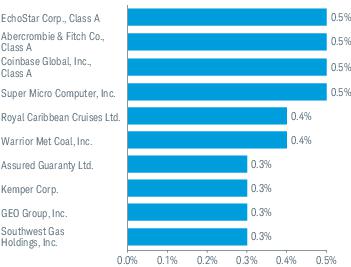
Fund and Inception Date | 6 Months | 1 Year | 5 Years | 10 Years |
Fund: Schwab Fundamental International Large Company Index Fund (4/2/07)3 | 16.29% | 11.52% | 7.39% | 4.65% |
MSCI EAFE® Index (Net) 4,5 | 18.63% | 9.28% | 6.18% | 4.38% |
Russell RAFITM Developed ex US Large Company Index (Net) 4,6 | 17.82% | 12.72% | 7.74% | 4.89% |
Fund Category: Morningstar Foreign Large Value 7 | 15.83% | 9.30% | 5.64% | 3.30% |
Fund Expense Ratio8: 0.25% | ||||
Number of Holdings | 911 |
Weighted Average Market Cap (millions) | $73,654 |
Price/Earnings Ratio (P/E) | 11.7 |
Price/Book Ratio (P/B) | 1.2 |
Portfolio Turnover Rate | 6% 2 |
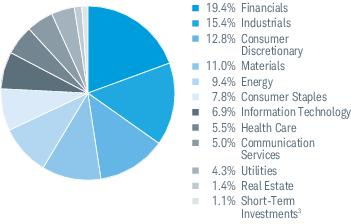
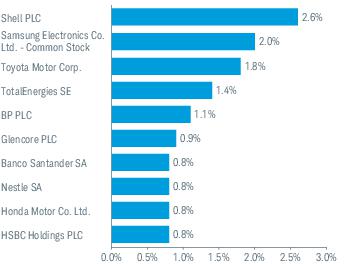
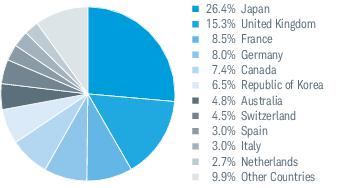
Fund and Inception Date | 6 Months | 1 Year | 5 Years | 10 Years |
Fund: Schwab Fundamental International Small Company Index Fund (1/31/08)3 | 14.22% | 5.05% | 4.00% | 4.32% |
MSCI EAFE® Index (Net) 4,5 | 18.63% | 9.28% | 6.18% | 4.38% |
Russell RAFITM Developed ex US Small Company Index (Net) 4,6 | 15.75% | 6.35% | 4.52% | 4.74% |
S&P Developed ex-U.S. Small Cap Index (Net) 4 | 16.97% | 4.43% | 3.66% | 3.94% |
Fund Category: Morningstar Foreign Small/Mid Value 7 | 16.97% | 11.13% | 6.03% | 4.20% |
Fund Expense Ratio8: 0.39% | ||||
Number of Holdings | 1,788 |
Weighted Average Market Cap (millions) | $3,894 |
Price/Earnings Ratio (P/E) | 12.7 |
Price/Book Ratio (P/B) | 1.1 |
Portfolio Turnover Rate | 15% 2 |
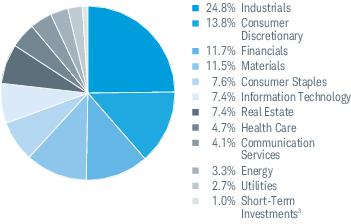
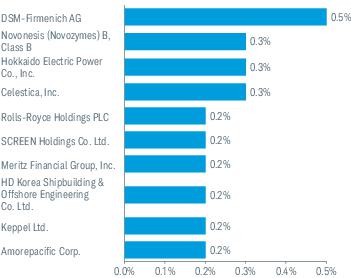
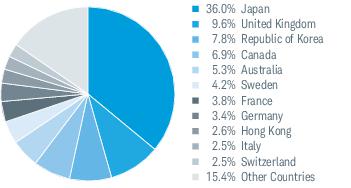
Fund and Inception Date | 6 Months | 1 Year | 5 Years | 10 Years |
Fund: Schwab Fundamental Emerging Markets Large Company Index Fund (1/31/08)3 | 16.44% | 12.79% | 3.97% | 3.86% |
MSCI Emerging Markets Index (Net) 4,5 | 15.40% | 9.88% | 1.89% | 2.96% |
Russell RAFITM Emerging Markets Large Company Index (Net) 4,6 | 18.32% | 15.26% | 4.69% | 4.58% |
Fund Category: Morningstar Diversified Emerging Markets 7 | 15.17% | 10.54% | 2.83% | 2.86% |
Fund Expense Ratio8: 0.39% | ||||
Number of Holdings | 351 |
Weighted Average Market Cap (millions) | $97,786 |
Price/Earnings Ratio (P/E) | 8.9 |
Price/Book Ratio (P/B) | 1.2 |
Portfolio Turnover Rate | 10% 1 |
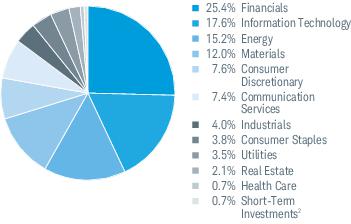
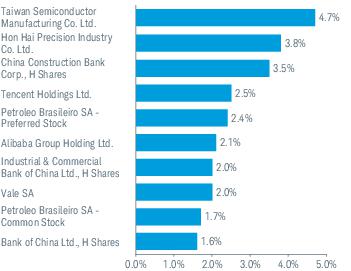
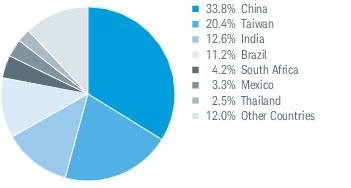
EXPENSE RATIO (ANNUALIZED) 1 | BEGINNING ACCOUNT VALUE AT 11/1/23 | ENDING ACCOUNT VALUE (NET OF EXPENSES) AT 4/30/24 | EXPENSES PAID DURING PERIOD 11/1/23-4/30/24 2 | |
Schwab Fundamental US Large Company Index Fund | ||||
Actual Return | 0.25% | $1,000.00 | $1,190.00 | $1.36 |
Hypothetical 5% Return | 0.25% | $1,000.00 | $1,023.62 | $1.26 |
Schwab Fundamental US Small Company Index Fund | ||||
Actual Return | 0.25% | $1,000.00 | $1,183.10 | $1.36 |
Hypothetical 5% Return | 0.25% | $1,000.00 | $1,023.62 | $1.26 |
Schwab Fundamental International Large Company Index Fund | ||||
Actual Return | 0.25% | $1,000.00 | $1,162.90 | $1.34 |
Hypothetical 5% Return | 0.25% | $1,000.00 | $1,023.62 | $1.26 |
Schwab Fundamental International Small Company Index Fund | ||||
Actual Return | 0.39% | $1,000.00 | $1,142.20 | $2.08 |
Hypothetical 5% Return | 0.39% | $1,000.00 | $1,022.92 | $1.96 |
Schwab Fundamental Emerging Markets Large Company Index Fund | ||||
Actual Return | 0.39% | $1,000.00 | $1,164.40 | $2.10 |
Hypothetical 5% Return | 0.39% | $1,000.00 | $1,022.92 | $1.96 |
1 | Based on the most recent six-month expense ratio. |
2 | Expenses for each fund are equal to its annualized expense ratio, multiplied by the average account value over the period, multiplied by 182 days in the period, and divided by 366 days in the fiscal year. |
11/1/23– 4/30/24* | 11/1/22– 10/31/23 | 11/1/21– 10/31/22 | 11/1/20– 10/31/21 | 11/1/19– 10/31/20 | 11/1/18– 10/31/19 | |
Per-Share Data | ||||||
Net asset value at beginning of period | $21.69 | $21.19 | $23.19 | $16.28 | $17.56 | $17.47 |
Income (loss) from investment operations: | ||||||
Net investment income (loss)1 | 0.25 | 0.45 | 0.43 | 0.39 | 0.42 | 0.42 |
Net realized and unrealized gains (losses) | 3.83 | 0.49 | (1.33 ) | 7.64 | (0.75 ) | 1.08 |
Total from investment operations | 4.08 | 0.94 | (0.90 ) | 8.03 | (0.33 ) | 1.50 |
Less distributions: | ||||||
Distributions from net investment income | (0.45 ) | (0.44 ) | (0.40 ) | (0.44 ) | (0.43 ) | (0.42 ) |
Distributions from net realized gains | — | — | (0.70 ) | (0.68 ) | (0.52 ) | (0.99 ) |
Total distributions | (0.45 ) | (0.44 ) | (1.10 ) | (1.12 ) | (0.95 ) | (1.41 ) |
Net asset value at end of period | $25.32 | $21.69 | $21.19 | $23.19 | $16.28 | $17.56 |
Total return | 19.00 %2 | 4.48 % | (4.18 %) | 51.33 % | (2.33 %) | 10.56 % |
Ratios/Supplemental Data | ||||||
Ratios to average net assets: | ||||||
Total expenses | 0.25 %3 | 0.25 %4 | 0.25 %4 | 0.25 % | 0.25 % | 0.25 % |
Net investment income (loss) | 2.02 %3 | 2.05 % | 1.95 % | 1.87 % | 2.57 % | 2.53 % |
Portfolio turnover rate | 4 %2,5 | 7 %5 | 13 %5 | 16 %5 | 13 % | 20 % |
Net assets, end of period (x 1,000,000) | $8,279 | $6,836 | $6,460 | $6,821 | $4,547 | $5,237 |
* | Unaudited. |
1 | Calculated based on the average shares outstanding during the period. |
2 | Not annualized. |
3 | Annualized. |
4 | Ratio includes less than 0.005% of non-routine proxy expenses. |
5 | Portfolio turnover rate excludes in-kind transactions. |
SECURITY | NUMBER OF SHARES | VALUE ($) |
COMMON STOCKS 99.8% OF NET ASSETS | ||
Automobiles & Components 1.7% | ||
Adient PLC * | 55,436 | 1,655,873 |
Aptiv PLC * | 75,858 | 5,385,918 |
Autoliv, Inc. | 30,923 | 3,704,266 |
BorgWarner, Inc. | 126,413 | 4,142,554 |
Dana, Inc. | 136,609 | 1,698,050 |
Ford Motor Co. | 2,569,712 | 31,222,001 |
General Motors Co. | 1,395,395 | 62,136,939 |
Gentex Corp. | 81,559 | 2,797,474 |
Goodyear Tire & Rubber Co. * | 312,508 | 3,737,596 |
Harley-Davidson, Inc. | 62,062 | 2,134,312 |
Lear Corp. | 44,326 | 5,579,313 |
Tesla, Inc. * | 55,157 | 10,109,175 |
Thor Industries, Inc. | 31,597 | 3,141,374 |
137,444,845 | ||
Banks 7.7% | ||
Bank of America Corp. | 2,956,283 | 109,412,034 |
Citigroup, Inc. | 1,746,416 | 107,107,693 |
Citizens Financial Group, Inc. | 236,687 | 8,073,394 |
Comerica, Inc. | 96,520 | 4,842,408 |
Credicorp Ltd. | 24,806 | 4,108,122 |
East West Bancorp, Inc. | 30,756 | 2,291,014 |
Fifth Third Bancorp | 292,828 | 10,676,509 |
First Citizens BancShares, Inc., Class A | 861 | 1,452,300 |
First Horizon Corp. | 161,344 | 2,407,253 |
Huntington Bancshares, Inc. | 415,088 | 5,591,235 |
JPMorgan Chase & Co. | 878,107 | 168,368,236 |
KeyCorp | 553,405 | 8,018,838 |
M&T Bank Corp. | 54,476 | 7,865,790 |
New York Community Bancorp, Inc. | 212,238 | 562,431 |
PNC Financial Services Group, Inc. | 148,767 | 22,800,030 |
Popular, Inc. | 33,488 | 2,846,145 |
Regions Financial Corp. | 305,729 | 5,891,398 |
Synovus Financial Corp. | 52,645 | 1,884,165 |
Truist Financial Corp. | 488,618 | 18,347,606 |
U.S. Bancorp | 623,581 | 25,336,096 |
Wells Fargo & Co. | 1,982,593 | 117,607,417 |
Zions Bancorp NA | 102,990 | 4,199,932 |
639,690,046 | ||
Capital Goods 6.9% | ||
3M Co. | 276,970 | 26,730,375 |
A O Smith Corp. | 28,290 | 2,343,544 |
Acuity Brands, Inc. | 13,587 | 3,373,652 |
AECOM | 39,077 | 3,609,152 |
AerCap Holdings NV * | 35,230 | 2,976,583 |
AGCO Corp. | 26,029 | 2,972,251 |
Air Lease Corp., Class A | 38,725 | 1,945,544 |
Allegion PLC | 16,259 | 1,976,444 |
Allison Transmission Holdings, Inc. | 47,436 | 3,488,918 |
AMETEK, Inc. | 23,821 | 4,160,576 |
Beacon Roofing Supply, Inc. * | 17,732 | 1,747,134 |
SECURITY | NUMBER OF SHARES | VALUE ($) |
Boeing Co. * | 79,401 | 13,326,664 |
Boise Cascade Co. | 22,493 | 2,975,149 |
Builders FirstSource, Inc. * | 9,580 | 1,751,416 |
Carlisle Cos., Inc. | 11,084 | 4,303,363 |
Carrier Global Corp. | 158,465 | 9,744,013 |
Caterpillar, Inc. | 106,338 | 35,577,505 |
CNH Industrial NV * | 402,047 | 4,583,336 |
Cummins, Inc. | 52,953 | 14,958,693 |
Curtiss-Wright Corp. | 7,922 | 2,007,593 |
Deere & Co. | 47,525 | 18,601,760 |
Donaldson Co., Inc. | 27,224 | 1,965,573 |
Dover Corp. | 30,221 | 5,418,625 |
Eaton Corp. PLC | 67,749 | 21,561,797 |
EMCOR Group, Inc. | 14,037 | 5,013,595 |
Emerson Electric Co. | 135,628 | 14,617,986 |
Fastenal Co. | 83,252 | 5,656,141 |
Fluor Corp. * | 49,079 | 1,979,356 |
Fortive Corp. | 37,890 | 2,851,980 |
Fortune Brands Innovations, Inc. | 43,686 | 3,193,447 |
GE Vernova, Inc. * | 25,632 | 3,939,895 |
Generac Holdings, Inc. * | 11,884 | 1,615,749 |
General Dynamics Corp. | 70,084 | 20,120,416 |
General Electric Co. | 102,854 | 16,643,834 |
Graco, Inc. | 20,115 | 1,613,223 |
Honeywell International, Inc. | 148,286 | 28,579,161 |
Howmet Aerospace, Inc. | 63,901 | 4,265,392 |
Hubbell, Inc., Class B | 7,721 | 2,860,785 |
Huntington Ingalls Industries, Inc. | 14,963 | 4,143,704 |
IDEX Corp. | 9,866 | 2,175,058 |
Illinois Tool Works, Inc. | 51,921 | 12,674,435 |
Ingersoll Rand, Inc. | 27,894 | 2,603,068 |
ITT, Inc. | 17,538 | 2,268,365 |
Johnson Controls International PLC | 187,904 | 12,226,913 |
L3Harris Technologies, Inc. | 61,310 | 13,123,405 |
Lennox International, Inc. | 4,870 | 2,256,855 |
Lincoln Electric Holdings, Inc. | 8,634 | 1,895,422 |
Lockheed Martin Corp. | 58,862 | 27,366,710 |
Masco Corp. | 65,449 | 4,479,984 |
MasTec, Inc. * | 26,205 | 2,324,121 |
MDU Resources Group, Inc. | 82,179 | 2,029,821 |
Middleby Corp. * | 11,113 | 1,544,374 |
MSC Industrial Direct Co., Inc., Class A | 16,965 | 1,547,887 |
Mueller Industries, Inc. | 38,605 | 2,154,931 |
Nordson Corp. | 7,305 | 1,886,078 |
Northrop Grumman Corp. | 35,990 | 17,456,230 |
nVent Electric PLC | 30,541 | 2,201,090 |
Oshkosh Corp. | 32,018 | 3,594,661 |
Otis Worldwide Corp. | 45,810 | 4,177,872 |
Owens Corning | 32,228 | 5,421,072 |
PACCAR, Inc. | 120,114 | 12,745,296 |
Parker-Hannifin Corp. | 18,278 | 9,959,865 |
Pentair PLC | 36,452 | 2,882,989 |
Quanta Services, Inc. | 22,460 | 5,807,258 |
Regal Rexnord Corp. | 16,149 | 2,605,964 |
Resideo Technologies, Inc. * | 87,005 | 1,699,208 |
Rockwell Automation, Inc. | 17,368 | 4,706,033 |
RTX Corp. | 271,476 | 27,560,243 |
Rush Enterprises, Inc., Class A | 34,429 | 1,512,122 |
SECURITY | NUMBER OF SHARES | VALUE ($) |
Sensata Technologies Holding PLC | 55,691 | 2,133,522 |
Snap-on, Inc. | 13,912 | 3,727,859 |
Stanley Black & Decker, Inc. | 73,223 | 6,692,582 |
Textron, Inc. | 63,374 | 5,360,807 |
Timken Co. | 20,788 | 1,854,705 |
Toro Co. | 19,131 | 1,675,684 |
Trane Technologies PLC | 28,851 | 9,155,576 |
TransDigm Group, Inc. | 5,450 | 6,801,763 |
UFP Industries, Inc. | 24,040 | 2,709,308 |
United Rentals, Inc. | 16,086 | 10,745,287 |
Watsco, Inc. | 6,300 | 2,820,636 |
WESCO International, Inc. | 16,608 | 2,536,872 |
Westinghouse Air Brake Technologies Corp. | 32,168 | 5,181,621 |
WW Grainger, Inc. | 6,705 | 6,177,652 |
Xylem, Inc. | 27,090 | 3,540,663 |
575,196,191 | ||
Commercial & Professional Services 1.1% | ||
ABM Industries, Inc. | 40,425 | 1,766,572 |
ASGN, Inc. * | 19,126 | 1,844,703 |
Automatic Data Processing, Inc. | 45,993 | 11,125,247 |
Booz Allen Hamilton Holding Corp., Class A | 22,334 | 3,298,062 |
Broadridge Financial Solutions, Inc. | 14,797 | 2,861,888 |
CACI International, Inc., Class A * | 6,405 | 2,576,283 |
Cintas Corp. | 9,976 | 6,567,600 |
Copart, Inc. * | 40,455 | 2,197,111 |
Equifax, Inc. | 10,973 | 2,416,145 |
Genpact Ltd. | 52,805 | 1,623,226 |
Jacobs Solutions, Inc. | 33,206 | 4,766,057 |
KBR, Inc. | 27,300 | 1,772,862 |
Leidos Holdings, Inc. | 46,207 | 6,479,145 |
ManpowerGroup, Inc. | 62,218 | 4,694,348 |
Maximus, Inc. | 18,434 | 1,479,881 |
Paychex, Inc. | 39,625 | 4,707,846 |
Republic Services, Inc., Class A | 29,976 | 5,746,399 |
Robert Half, Inc. | 42,356 | 2,928,494 |
Science Applications International Corp. | 17,377 | 2,236,420 |
SS&C Technologies Holdings, Inc. | 44,721 | 2,767,783 |
TransUnion | 25,058 | 1,829,234 |
Verisk Analytics, Inc., Class A | 13,376 | 2,915,433 |
Waste Management, Inc. | 66,696 | 13,874,102 |
92,474,841 | ||
Consumer Discretionary Distribution & Retail 4.5% | ||
Academy Sports & Outdoors, Inc. | 28,961 | 1,688,426 |
Advance Auto Parts, Inc. | 56,184 | 4,100,308 |
Amazon.com, Inc. * | 674,380 | 118,016,500 |
American Eagle Outfitters, Inc. | 84,177 | 2,042,134 |
Asbury Automotive Group, Inc. * | 8,563 | 1,800,285 |
AutoNation, Inc. * | 26,586 | 4,284,334 |
AutoZone, Inc. * | 1,718 | 5,079,095 |
Bath & Body Works, Inc. | 79,726 | 3,621,155 |
Best Buy Co., Inc. | 169,888 | 12,510,552 |
Big Lots, Inc. * | 341,234 | 1,201,144 |
Burlington Stores, Inc. * | 10,296 | 1,852,662 |
CarMax, Inc. * | 74,174 | 5,041,607 |
Dick's Sporting Goods, Inc. | 20,412 | 4,101,587 |
eBay, Inc. | 282,166 | 14,542,836 |
Foot Locker, Inc. | 108,004 | 2,251,883 |
Gap, Inc. | 187,979 | 3,857,329 |
Genuine Parts Co. | 34,496 | 5,423,116 |
Group 1 Automotive, Inc. | 11,457 | 3,368,587 |
Home Depot, Inc. | 185,501 | 61,998,144 |
Kohl's Corp. | 308,470 | 7,384,772 |
SECURITY | NUMBER OF SHARES | VALUE ($) |
Lithia Motors, Inc., Class A | 15,585 | 3,964,512 |
LKQ Corp. | 102,429 | 4,417,763 |
Lowe's Cos., Inc. | 143,725 | 32,767,863 |
Macy's, Inc. | 320,294 | 5,903,018 |
Murphy USA, Inc. | 8,107 | 3,354,839 |
Nordstrom, Inc. | 103,067 | 1,959,304 |
ODP Corp. * | 42,536 | 2,165,508 |
O'Reilly Automotive, Inc. * | 7,999 | 8,105,067 |
Penske Automotive Group, Inc. | 11,871 | 1,815,195 |
Pool Corp. | 5,047 | 1,829,689 |
Qurate Retail, Inc. * | 4,976,581 | 4,088,261 |
Ross Stores, Inc. | 46,832 | 6,067,086 |
TJX Cos., Inc. | 176,928 | 16,647,155 |
Tractor Supply Co. | 19,336 | 5,280,275 |
Ulta Beauty, Inc. * | 6,165 | 2,495,839 |
Williams-Sonoma, Inc. | 19,241 | 5,517,934 |
370,545,764 | ||
Consumer Durables & Apparel 1.6% | ||
Brunswick Corp. | 29,348 | 2,366,623 |
Capri Holdings Ltd. * | 51,081 | 1,812,354 |
Carter's, Inc. | 23,957 | 1,638,898 |
Deckers Outdoor Corp. * | 3,197 | 2,616,649 |
DR Horton, Inc. | 91,359 | 13,017,744 |
Garmin Ltd. | 29,283 | 4,230,515 |
Hanesbrands, Inc. * | 479,125 | 2,184,810 |
Hasbro, Inc. | 47,099 | 2,887,169 |
KB Home | 34,630 | 2,242,639 |
Leggett & Platt, Inc. | 86,246 | 1,558,465 |
Lennar Corp., Class A | 94,218 | 14,285,333 |
Lululemon Athletica, Inc. * | 8,096 | 2,919,418 |
Meritage Homes Corp. | 16,100 | 2,668,414 |
Mohawk Industries, Inc. * | 44,720 | 5,157,110 |
Newell Brands, Inc. | 323,419 | 2,567,947 |
NIKE, Inc., Class B | 187,766 | 17,323,291 |
NVR, Inc. * | 762 | 5,668,404 |
Polaris, Inc. | 24,057 | 2,048,694 |
PulteGroup, Inc. | 86,217 | 9,606,298 |
PVH Corp. | 37,771 | 4,109,485 |
Ralph Lauren Corp., Class A | 15,409 | 2,521,529 |
Skechers USA, Inc., Class A * | 33,163 | 2,190,416 |
Tapestry, Inc. | 77,065 | 3,076,435 |
Taylor Morrison Home Corp., Class A * | 49,575 | 2,776,696 |
Tempur Sealy International, Inc. | 35,901 | 1,797,204 |
Toll Brothers, Inc. | 36,338 | 4,328,219 |
TopBuild Corp. * | 4,620 | 1,869,575 |
Tri Pointe Homes, Inc. * | 63,659 | 2,345,834 |
VF Corp. | 277,799 | 3,461,375 |
Whirlpool Corp. | 56,348 | 5,345,171 |
130,622,714 | ||
Consumer Services 1.5% | ||
Aramark | 72,354 | 2,279,875 |
Booking Holdings, Inc. | 4,777 | 16,490,347 |
Caesars Entertainment, Inc. * | 32,926 | 1,179,409 |
Carnival Corp. * | 275,236 | 4,078,997 |
Chipotle Mexican Grill, Inc., Class A * | 1,206 | 3,810,478 |
Darden Restaurants, Inc. | 24,302 | 3,728,170 |
Domino's Pizza, Inc. | 8,522 | 4,510,439 |
Expedia Group, Inc. * | 17,957 | 2,417,551 |
H&R Block, Inc. | 40,216 | 1,899,402 |
Hilton Worldwide Holdings, Inc. | 24,781 | 4,888,796 |
Las Vegas Sands Corp. | 67,179 | 2,980,060 |
Marriott International, Inc., Class A | 31,216 | 7,371,034 |
Marriott Vacations Worldwide Corp. | 15,360 | 1,476,250 |
McDonald's Corp. | 102,053 | 27,864,551 |
SECURITY | NUMBER OF SHARES | VALUE ($) |
MGM Resorts International * | 123,412 | 4,867,369 |
Penn Entertainment, Inc. * | 73,090 | 1,208,909 |
Service Corp. International | 29,235 | 2,096,442 |
Starbucks Corp. | 223,607 | 19,786,983 |
Travel & Leisure Co. | 39,889 | 1,736,767 |
Vail Resorts, Inc. | 6,475 | 1,226,171 |
Yum! Brands, Inc. | 53,957 | 7,621,426 |
123,519,426 | ||
Consumer Staples Distribution & Retail 3.5% | ||
Albertsons Cos., Inc., Class A | 51,395 | 1,048,458 |
Andersons, Inc. | 24,732 | 1,358,776 |
BJ's Wholesale Club Holdings, Inc. * | 23,676 | 1,768,124 |
Casey's General Stores, Inc. | 12,777 | 4,083,274 |
Costco Wholesale Corp. | 74,103 | 53,569,059 |
Dollar General Corp. | 83,022 | 11,555,832 |
Dollar Tree, Inc. * | 53,942 | 6,378,641 |
Kroger Co. | 481,821 | 26,683,247 |
Performance Food Group Co. * | 58,812 | 3,992,159 |
SpartanNash Co. | 82,232 | 1,569,809 |
Sprouts Farmers Market, Inc. * | 45,013 | 2,972,208 |
Sysco Corp. | 119,712 | 8,896,996 |
Target Corp. | 229,003 | 36,864,903 |
U.S. Foods Holding Corp. * | 109,086 | 5,481,571 |
United Natural Foods, Inc. * | 124,696 | 1,113,535 |
Walgreens Boots Alliance, Inc. | 1,210,020 | 21,453,655 |
Walmart, Inc. | 1,689,534 | 100,273,843 |
289,064,090 | ||
Energy 7.5% | ||
Antero Resources Corp. * | 73,482 | 2,499,123 |
APA Corp. | 110,478 | 3,473,428 |
Baker Hughes Co., Class A | 385,679 | 12,580,849 |
Cheniere Energy, Inc. | 22,922 | 3,617,550 |
Chesapeake Energy Corp. | 11,997 | 1,078,290 |
Chevron Corp. | 660,541 | 106,525,447 |
CNX Resources Corp. * | 73,347 | 1,725,121 |
ConocoPhillips | 336,334 | 42,250,277 |
Delek U.S. Holdings, Inc. | 55,533 | 1,517,717 |
Devon Energy Corp. | 160,012 | 8,189,414 |
Diamondback Energy, Inc. | 21,036 | 4,230,971 |
EOG Resources, Inc. | 142,727 | 18,858,519 |
EQT Corp. | 40,155 | 1,609,814 |
Equitrans Midstream Corp. | 172,936 | 2,339,824 |
Exxon Mobil Corp. | 1,407,592 | 166,475,906 |
Halliburton Co. | 184,812 | 6,924,906 |
Hess Corp. | 27,787 | 4,376,175 |
HF Sinclair Corp. | 86,139 | 4,673,041 |
Kinder Morgan, Inc. | 811,666 | 14,837,254 |
Marathon Oil Corp. | 253,445 | 6,804,998 |
Marathon Petroleum Corp. | 219,995 | 39,977,491 |
Murphy Oil Corp. | 49,206 | 2,196,556 |
NOV, Inc. | 122,375 | 2,262,714 |
Occidental Petroleum Corp. | 186,143 | 12,311,498 |
ONEOK, Inc. | 124,984 | 9,888,734 |
Ovintiv, Inc. | 95,927 | 4,922,974 |
PBF Energy, Inc., Class A | 63,710 | 3,393,832 |
Peabody Energy Corp. | 77,543 | 1,701,293 |
Phillips 66 | 254,741 | 36,481,459 |
Pioneer Natural Resources Co. | 42,057 | 11,326,791 |
Schlumberger NV | 240,751 | 11,430,857 |
SM Energy Co. | 38,928 | 1,887,619 |
Southwestern Energy Co. * | 324,381 | 2,429,614 |
Targa Resources Corp. | 37,511 | 4,278,505 |
TechnipFMC PLC | 82,439 | 2,112,087 |
Valero Energy Corp. | 247,352 | 39,544,164 |
SECURITY | NUMBER OF SHARES | VALUE ($) |
Williams Cos., Inc. | 293,256 | 11,249,300 |
World Kinect Corp. | 291,719 | 6,855,396 |
618,839,508 | ||
Equity Real Estate Investment Trusts (REITs) 1.6% | ||
Alexandria Real Estate Equities, Inc. | 22,541 | 2,611,826 |
American Tower Corp. | 51,892 | 8,902,592 |
AvalonBay Communities, Inc. | 21,421 | 4,060,779 |
Boston Properties, Inc. | 61,318 | 3,794,971 |
Brixmor Property Group, Inc. | 78,316 | 1,730,784 |
Camden Property Trust | 16,985 | 1,693,065 |
Crown Castle, Inc. | 77,927 | 7,307,994 |
Digital Realty Trust, Inc. | 45,075 | 6,255,508 |
Equinix, Inc. | 8,149 | 5,794,835 |
Equity Residential | 68,851 | 4,434,004 |
Essex Property Trust, Inc. | 10,350 | 2,548,688 |
Extra Space Storage, Inc. | 20,395 | 2,738,641 |
Gaming & Leisure Properties, Inc. | 35,750 | 1,527,598 |
Healthpeak Properties, Inc. | 163,318 | 3,039,348 |
Host Hotels & Resorts, Inc. | 198,493 | 3,745,563 |
Invitation Homes, Inc. | 68,749 | 2,351,216 |
Iron Mountain, Inc. | 60,242 | 4,669,960 |
Kimco Realty Corp. | 114,669 | 2,136,283 |
Lamar Advertising Co., Class A | 17,442 | 2,020,656 |
Medical Properties Trust, Inc. (a) | 322,686 | 1,484,356 |
Mid-America Apartment Communities, Inc. | 19,262 | 2,504,060 |
Park Hotels & Resorts, Inc. | 157,043 | 2,533,104 |
Prologis, Inc. | 51,032 | 5,207,816 |
Public Storage | 14,865 | 3,856,724 |
Realty Income Corp. | 60,298 | 3,228,355 |
Regency Centers Corp. | 29,849 | 1,767,658 |
SBA Communications Corp., Class A | 7,185 | 1,337,272 |
Simon Property Group, Inc. | 61,678 | 8,667,609 |
SL Green Realty Corp. | 52,239 | 2,603,069 |
Sun Communities, Inc. | 15,592 | 1,735,701 |
UDR, Inc. | 48,810 | 1,858,685 |
Ventas, Inc. | 124,493 | 5,512,550 |
VICI Properties, Inc., Class A | 57,439 | 1,639,883 |
Vornado Realty Trust | 119,812 | 3,118,706 |
Welltower, Inc. | 77,898 | 7,422,121 |
Weyerhaeuser Co. | 243,579 | 7,348,778 |
WP Carey, Inc. | 29,396 | 1,612,077 |
134,802,835 | ||
Financial Services 8.4% | ||
Affiliated Managers Group, Inc. | 18,388 | 2,870,367 |
Ally Financial, Inc. | 286,601 | 10,991,148 |
American Express Co. | 138,825 | 32,489,215 |
Ameriprise Financial, Inc. | 25,930 | 10,677,715 |
Annaly Capital Management, Inc. | 118,707 | 2,224,569 |
Apollo Global Management, Inc. | 32,087 | 3,477,589 |
Bank of New York Mellon Corp. | 351,386 | 19,849,795 |
Berkshire Hathaway, Inc., Class A * | 87 | 52,156,501 |
Berkshire Hathaway, Inc., Class B * | 329,049 | 130,543,610 |
BlackRock, Inc. | 26,001 | 19,621,395 |
Blackstone, Inc. | 69,640 | 8,120,720 |
Block, Inc. * | 20,913 | 1,526,649 |
Bread Financial Holdings, Inc. | 101,023 | 3,728,759 |
Capital One Financial Corp. | 257,957 | 36,998,773 |
Carlyle Group, Inc. | 57,058 | 2,556,198 |
Cboe Global Markets, Inc. | 9,400 | 1,702,810 |
Charles Schwab Corp. (b) | 149,438 | 11,050,940 |
CME Group, Inc. | 32,472 | 6,807,430 |
Corebridge Financial, Inc. (a) | 72,982 | 1,938,402 |
Corpay, Inc. * | 14,764 | 4,460,795 |
SECURITY | NUMBER OF SHARES | VALUE ($) |
Discover Financial Services | 150,155 | 19,029,143 |
Equitable Holdings, Inc. | 106,110 | 3,916,520 |
Evercore, Inc., Class A | 15,619 | 2,834,849 |
Fidelity National Information Services, Inc. | 156,790 | 10,649,177 |
Fiserv, Inc. * | 55,767 | 8,513,948 |
Franklin Resources, Inc. | 167,673 | 3,829,651 |
Global Payments, Inc. | 56,988 | 6,996,417 |
Goldman Sachs Group, Inc. | 110,388 | 47,103,663 |
Intercontinental Exchange, Inc. | 72,004 | 9,271,235 |
Invesco Ltd. | 226,074 | 3,203,469 |
Jack Henry & Associates, Inc. | 11,592 | 1,885,902 |
Jackson Financial, Inc., Class A | 40,367 | 2,757,873 |
Janus Henderson Group PLC | 69,705 | 2,176,190 |
Jefferies Financial Group, Inc. | 88,421 | 3,807,408 |
KKR & Co., Inc. | 89,978 | 8,374,252 |
Lazard, Inc. | 48,545 | 1,868,983 |
LPL Financial Holdings, Inc. | 11,218 | 3,019,100 |
Mastercard, Inc., Class A | 51,168 | 23,087,002 |
MGIC Investment Corp. | 94,517 | 1,916,805 |
Moody's Corp. | 14,411 | 5,336,826 |
Morgan Stanley | 316,782 | 28,776,477 |
MSCI, Inc., Class A | 4,195 | 1,953,989 |
Nasdaq, Inc. | 39,421 | 2,359,347 |
Navient Corp. | 123,097 | 1,848,917 |
Northern Trust Corp. | 70,095 | 5,775,127 |
OneMain Holdings, Inc. | 100,947 | 5,260,348 |
PayPal Holdings, Inc. * | 227,918 | 15,480,191 |
Raymond James Financial, Inc. | 30,425 | 3,711,850 |
Rithm Capital Corp. | 209,642 | 2,331,219 |
S&P Global, Inc. | 23,788 | 9,891,764 |
SEI Investments Co. | 30,160 | 1,989,052 |
SLM Corp. | 159,646 | 3,382,899 |
Starwood Property Trust, Inc. | 94,091 | 1,784,906 |
State Street Corp. | 102,975 | 7,464,658 |
Synchrony Financial | 553,801 | 24,356,168 |
T Rowe Price Group, Inc. | 95,448 | 10,458,237 |
Visa, Inc., Class A | 108,486 | 29,140,424 |
Voya Financial, Inc. | 32,962 | 2,246,690 |
Western Union Co. | 277,825 | 3,733,968 |
695,318,024 | ||
Food, Beverage & Tobacco 3.4% | ||
Altria Group, Inc. | 654,167 | 28,659,056 |
Archer-Daniels-Midland Co. | 308,034 | 18,069,274 |
Bunge Global SA | 88,197 | 8,974,927 |
Campbell Soup Co. | 62,098 | 2,838,500 |
Coca-Cola Co. | 532,500 | 32,892,525 |
Coca-Cola Europacific Partners PLC | 47,613 | 3,429,088 |
Conagra Brands, Inc. | 182,264 | 5,610,086 |
Constellation Brands, Inc., Class A | 26,137 | 6,624,684 |
Darling Ingredients, Inc. * | 43,024 | 1,822,927 |
Flowers Foods, Inc. | 71,341 | 1,779,245 |
General Mills, Inc. | 153,102 | 10,787,567 |
Hershey Co. | 17,760 | 3,444,019 |
Hormel Foods Corp. | 92,145 | 3,276,676 |
Ingredion, Inc. | 30,459 | 3,490,297 |
J M Smucker Co. | 42,730 | 4,907,540 |
Kellanova | 77,276 | 4,471,189 |
Keurig Dr Pepper, Inc. | 190,299 | 6,413,076 |
Kraft Heinz Co. | 263,130 | 10,159,449 |
Lamb Weston Holdings, Inc. | 16,442 | 1,370,276 |
McCormick & Co., Inc. - Non Voting Shares | 39,509 | 3,005,055 |
Molson Coors Beverage Co., Class B | 73,604 | 4,214,565 |
Mondelez International, Inc., Class A | 267,115 | 19,216,253 |
Monster Beverage Corp. * | 66,565 | 3,557,899 |
SECURITY | NUMBER OF SHARES | VALUE ($) |
PepsiCo, Inc. | 223,605 | 39,334,356 |
Philip Morris International, Inc. | 363,921 | 34,550,660 |
Post Holdings, Inc. * | 17,497 | 1,857,307 |
Tyson Foods, Inc., Class A | 289,047 | 17,530,701 |
282,287,197 | ||
Health Care Equipment & Services 5.8% | ||
Abbott Laboratories | 244,090 | 25,866,217 |
Align Technology, Inc. * | 7,883 | 2,226,002 |
Baxter International, Inc. | 188,764 | 7,620,403 |
Becton Dickinson & Co. | 39,844 | 9,347,402 |
Boston Scientific Corp. * | 102,096 | 7,337,639 |
Cardinal Health, Inc. | 60,239 | 6,207,027 |
Cencora, Inc. | 9,694 | 2,317,351 |
Centene Corp. * | 290,288 | 21,208,441 |
Chemed Corp. | 2,686 | 1,525,648 |
Cigna Group | 131,548 | 46,967,898 |
Community Health Systems, Inc. * | 379,449 | 1,252,182 |
Cooper Cos., Inc. | 21,582 | 1,922,093 |
CVS Health Corp. | 934,404 | 63,268,495 |
DaVita, Inc. * | 40,332 | 5,606,551 |
DENTSPLY SIRONA, Inc. | 58,294 | 1,749,403 |
Edwards Lifesciences Corp. * | 44,046 | 3,729,375 |
Elevance Health, Inc. | 81,624 | 43,144,814 |
Encompass Health Corp. | 24,285 | 2,024,883 |
GE HealthCare Technologies, Inc. | 36,985 | 2,819,736 |
HCA Healthcare, Inc. | 57,519 | 17,820,537 |
Henry Schein, Inc. * | 52,097 | 3,609,280 |
Hologic, Inc. * | 45,262 | 3,429,502 |
Humana, Inc. | 49,933 | 15,084,260 |
IDEXX Laboratories, Inc. * | 4,347 | 2,142,028 |
Intuitive Surgical, Inc. * | 15,763 | 5,842,083 |
Laboratory Corp. of America Holdings | 33,294 | 6,704,413 |
McKesson Corp. | 17,134 | 9,204,556 |
Medtronic PLC | 361,276 | 28,988,786 |
Molina Healthcare, Inc. * | 12,023 | 4,113,068 |
Quest Diagnostics, Inc. | 41,393 | 5,719,685 |
ResMed, Inc. | 13,638 | 2,918,396 |
Solventum Corp. * | 68,921 | 4,480,554 |
STERIS PLC | 11,330 | 2,317,665 |
Stryker Corp. | 30,815 | 10,369,247 |
Teleflex, Inc. | 7,503 | 1,566,251 |
Tenet Healthcare Corp. * | 48,866 | 5,487,163 |
UnitedHealth Group, Inc. | 180,773 | 87,439,900 |
Universal Health Services, Inc., Class B | 41,834 | 7,129,769 |
Zimmer Biomet Holdings, Inc. | 36,948 | 4,444,105 |
484,952,808 | ||
Household & Personal Products 1.3% | ||
Church & Dwight Co., Inc. | 36,595 | 3,948,235 |
Clorox Co. | 20,401 | 3,016,696 |
Colgate-Palmolive Co. | 141,038 | 12,964,213 |
Estee Lauder Cos., Inc., Class A | 36,351 | 5,333,055 |
Kimberly-Clark Corp. | 72,399 | 9,884,635 |
Procter & Gamble Co. | 429,062 | 70,022,918 |
105,169,752 | ||
Insurance 3.6% | ||
Aflac, Inc. | 188,006 | 15,726,702 |
Allstate Corp. | 149,603 | 25,441,486 |
American Equity Investment Life Holding Co. | 31,065 | 1,743,057 |
American Financial Group, Inc. | 29,677 | 3,791,237 |
American International Group, Inc. | 354,936 | 26,730,230 |
Aon PLC, Class A | 30,861 | 8,703,111 |
SECURITY | NUMBER OF SHARES | VALUE ($) |
Arch Capital Group Ltd. * | 50,015 | 4,678,403 |
Arthur J Gallagher & Co. | 15,543 | 3,647,787 |
Assurant, Inc. | 13,209 | 2,303,650 |
Brown & Brown, Inc. | 22,398 | 1,826,333 |
Chubb Ltd. | 91,883 | 22,845,789 |
Cincinnati Financial Corp. | 47,864 | 5,537,386 |
CNO Financial Group, Inc. | 105,896 | 2,788,242 |
Everest Group Ltd. | 8,208 | 3,007,493 |
Fidelity National Financial, Inc. | 101,996 | 5,048,802 |
First American Financial Corp. | 56,687 | 3,036,723 |
Genworth Financial, Inc., Class A * | 415,319 | 2,462,842 |
Globe Life, Inc. | 24,373 | 1,856,491 |
Hanover Insurance Group, Inc. | 15,514 | 2,014,027 |
Hartford Financial Services Group, Inc. | 124,188 | 12,032,575 |
Lincoln National Corp. | 180,488 | 4,921,908 |
Loews Corp. | 59,174 | 4,446,926 |
Markel Group, Inc. * | 2,606 | 3,800,590 |
Marsh & McLennan Cos., Inc. | 56,610 | 11,289,732 |
MetLife, Inc. | 314,644 | 22,364,895 |
Old Republic International Corp. | 123,066 | 3,674,751 |
Primerica, Inc. | 8,067 | 1,709,075 |
Principal Financial Group, Inc. | 87,631 | 6,935,117 |
Progressive Corp. | 98,120 | 20,433,490 |
Prudential Financial, Inc. | 190,234 | 21,017,052 |
Reinsurance Group of America, Inc. | 19,146 | 3,580,111 |
Travelers Cos., Inc. | 116,646 | 24,747,615 |
Unum Group | 83,213 | 4,218,899 |
W R Berkley Corp. | 37,574 | 2,892,071 |
Willis Towers Watson PLC | 20,698 | 5,198,096 |
296,452,694 | ||
Materials 3.7% | ||
Air Products & Chemicals, Inc. | 34,562 | 8,168,383 |
Albemarle Corp. | 17,223 | 2,072,099 |
Alcoa Corp. | 131,709 | 4,628,254 |
AptarGroup, Inc. | 12,993 | 1,875,929 |
Arch Resources, Inc. | 7,607 | 1,207,840 |
Avery Dennison Corp. | 17,117 | 3,719,182 |
Axalta Coating Systems Ltd. * | 58,355 | 1,834,681 |
Ball Corp. | 89,298 | 6,212,462 |
Berry Global Group, Inc. | 52,616 | 2,980,170 |
Celanese Corp., Class A | 44,268 | 6,800,008 |
CF Industries Holdings, Inc. | 59,891 | 4,729,592 |
Chemours Co. | 88,863 | 2,377,085 |
Cleveland-Cliffs, Inc. * | 178,536 | 3,017,258 |
Commercial Metals Co. | 46,317 | 2,489,076 |
Corteva, Inc. | 132,285 | 7,160,587 |
Crown Holdings, Inc. | 35,867 | 2,943,605 |
Dow, Inc. | 329,854 | 18,768,693 |
DuPont de Nemours, Inc. | 197,372 | 14,309,470 |
Eagle Materials, Inc. | 8,236 | 2,064,848 |
Eastman Chemical Co. | 72,970 | 6,891,287 |
Ecolab, Inc. | 33,915 | 7,669,877 |
FMC Corp. | 38,291 | 2,259,552 |
Freeport-McMoRan, Inc. | 294,526 | 14,708,628 |
Graphic Packaging Holding Co. | 99,816 | 2,580,244 |
Huntsman Corp. | 131,490 | 3,137,351 |
International Flavors & Fragrances, Inc. | 52,874 | 4,475,784 |
International Paper Co. | 277,791 | 9,706,018 |
Linde PLC | 65,266 | 28,779,695 |
Louisiana-Pacific Corp. | 34,463 | 2,522,347 |
LyondellBasell Industries NV, Class A | 141,702 | 14,165,949 |
Martin Marietta Materials, Inc. | 7,356 | 4,318,487 |
Mosaic Co. | 160,485 | 5,037,624 |
Newmont Corp. | 343,273 | 13,950,615 |
Nucor Corp. | 105,565 | 17,790,869 |
O-I Glass, Inc. * | 104,567 | 1,564,322 |
SECURITY | NUMBER OF SHARES | VALUE ($) |
Olin Corp. | 54,818 | 2,865,885 |
Packaging Corp. of America | 29,822 | 5,158,610 |
PPG Industries, Inc. | 56,894 | 7,339,326 |
Reliance, Inc. | 23,828 | 6,784,308 |
RPM International, Inc. | 26,230 | 2,804,249 |
Sealed Air Corp. | 67,274 | 2,117,786 |
Sherwin-Williams Co. | 21,415 | 6,416,148 |
Sonoco Products Co. | 43,165 | 2,419,398 |
Steel Dynamics, Inc. | 70,144 | 9,127,137 |
U.S. Steel Corp. | 185,385 | 6,766,553 |
Vulcan Materials Co. | 15,663 | 4,035,259 |
Westlake Corp. | 10,545 | 1,553,911 |
Westrock Co. | 227,128 | 10,893,059 |
305,199,500 | ||
Media & Entertainment 6.5% | ||
Alphabet, Inc., Class A * | 695,194 | 113,163,679 |
Alphabet, Inc., Class C * | 610,308 | 100,481,109 |
Charter Communications, Inc., Class A * | 79,296 | 20,295,018 |
Comcast Corp., Class A | 1,614,593 | 61,532,139 |
Electronic Arts, Inc. | 48,797 | 6,188,436 |
Fox Corp., Class A | 194,177 | 6,021,429 |
Interpublic Group of Cos., Inc. | 104,900 | 3,193,156 |
Liberty Media Corp.-Liberty SiriusXM, Class C * | 172,613 | 4,153,069 |
Meta Platforms, Inc., Class A | 327,918 | 141,060,486 |
Netflix, Inc. * | 18,944 | 10,431,324 |
News Corp., Class A | 136,493 | 3,248,533 |
Nexstar Media Group, Inc., Class A | 16,345 | 2,616,181 |
Omnicom Group, Inc. | 72,578 | 6,738,142 |
Paramount Global, Class B | 800,725 | 9,120,258 |
Take-Two Interactive Software, Inc. * | 13,807 | 1,971,778 |
TEGNA, Inc. | 111,839 | 1,525,484 |
Walt Disney Co. | 371,441 | 41,267,095 |
Warner Bros Discovery, Inc. * | 603,684 | 4,443,114 |
537,450,430 | ||
Pharmaceuticals, Biotechnology & Life Sciences 5.4% | ||
AbbVie, Inc. | 266,476 | 43,339,657 |
Agilent Technologies, Inc. | 38,591 | 5,288,511 |
Amgen, Inc. | 134,304 | 36,791,238 |
Avantor, Inc. * | 82,212 | 1,991,997 |
Biogen, Inc. * | 44,420 | 9,542,304 |
Bristol-Myers Squibb Co. | 569,011 | 25,002,343 |
Catalent, Inc. * | 34,529 | 1,928,445 |
Charles River Laboratories International, Inc. * | 6,608 | 1,513,232 |
Danaher Corp. | 53,378 | 13,164,082 |
Eli Lilly & Co. | 25,946 | 20,266,421 |
Gilead Sciences, Inc. | 356,507 | 23,244,256 |
ICON PLC, ADR * | 6,939 | 2,066,989 |
Illumina, Inc. * | 18,120 | 2,229,666 |
IQVIA Holdings, Inc. * | 31,195 | 7,230,065 |
Jazz Pharmaceuticals PLC * | 13,170 | 1,458,578 |
Johnson & Johnson | 521,083 | 75,343,391 |
Merck & Co., Inc. | 393,618 | 50,863,318 |
Mettler-Toledo International, Inc. * | 2,344 | 2,882,417 |
Moderna, Inc. * | 43,477 | 4,795,948 |
Organon & Co. | 305,987 | 5,694,418 |
Perrigo Co. PLC | 79,084 | 2,582,883 |
Pfizer, Inc. | 2,084,008 | 53,392,285 |
Regeneron Pharmaceuticals, Inc. * | 11,978 | 10,668,325 |
Revvity, Inc. | 20,673 | 2,118,362 |
Thermo Fisher Scientific, Inc. | 41,207 | 23,435,245 |
Vertex Pharmaceuticals, Inc. * | 13,517 | 5,309,613 |
Viatris, Inc. | 700,645 | 8,106,463 |
SECURITY | NUMBER OF SHARES | VALUE ($) |
Waters Corp. * | 10,640 | 3,288,186 |
West Pharmaceutical Services, Inc. | 4,581 | 1,637,616 |
Zoetis, Inc. | 36,305 | 5,781,208 |
450,957,462 | ||
Real Estate Management & Development 0.2% | ||
Anywhere Real Estate, Inc. * | 298,633 | 1,451,356 |
CBRE Group, Inc., Class A * | 90,959 | 7,903,428 |
Jones Lang LaSalle, Inc. * | 31,766 | 5,740,116 |
15,094,900 | ||
Semiconductors & Semiconductor Equipment 4.5% | ||
Advanced Micro Devices, Inc. * | 50,740 | 8,036,201 |
Analog Devices, Inc. | 50,964 | 10,223,888 |
Applied Materials, Inc. | 125,701 | 24,970,504 |
Broadcom, Inc. | 39,309 | 51,112,313 |
First Solar, Inc. * | 9,487 | 1,672,558 |
Intel Corp. | 2,561,549 | 78,050,398 |
KLA Corp. | 11,722 | 8,079,857 |
Lam Research Corp. | 18,805 | 16,819,380 |
Marvell Technology, Inc. | 43,926 | 2,895,163 |
Microchip Technology, Inc. | 59,435 | 5,466,831 |
Micron Technology, Inc. | 388,603 | 43,896,595 |
MKS Instruments, Inc. | 15,174 | 1,805,403 |
NVIDIA Corp. | 30,723 | 26,545,286 |
NXP Semiconductors NV | 40,129 | 10,280,648 |
ON Semiconductor Corp. * | 42,274 | 2,965,944 |
Qorvo, Inc. * | 39,821 | 4,652,686 |
QUALCOMM, Inc. | 261,875 | 43,431,969 |
Skyworks Solutions, Inc. | 40,964 | 4,366,353 |
Teradyne, Inc. | 32,871 | 3,823,555 |
Texas Instruments, Inc. | 157,133 | 27,721,404 |
376,816,936 | ||
Software & Services 4.8% | ||
Accenture PLC, Class A | 80,358 | 24,180,526 |
Adobe, Inc. * | 30,764 | 14,238,502 |
Akamai Technologies, Inc. * | 29,335 | 2,960,782 |
Amdocs Ltd. | 38,064 | 3,196,995 |
ANSYS, Inc. * | 5,111 | 1,660,462 |
Autodesk, Inc. * | 9,807 | 2,087,420 |
Cadence Design Systems, Inc. * | 9,732 | 2,682,431 |
Check Point Software Technologies Ltd. * | 18,192 | 2,718,249 |
Cognizant Technology Solutions Corp., Class A | 204,377 | 13,423,481 |
Dropbox, Inc., Class A * | 48,478 | 1,122,750 |
DXC Technology Co. * | 199,397 | 3,886,248 |
EPAM Systems, Inc. * | 5,517 | 1,297,929 |
Fortinet, Inc. * | 28,938 | 1,828,303 |
Gartner, Inc. * | 5,707 | 2,354,651 |
Gen Digital, Inc. | 130,168 | 2,621,583 |
GoDaddy, Inc., Class A * | 15,636 | 1,913,534 |
International Business Machines Corp. | 263,910 | 43,861,842 |
Intuit, Inc. | 14,322 | 8,960,130 |
Kyndryl Holdings, Inc. * | 212,891 | 4,185,437 |
Microsoft Corp. | 523,414 | 203,780,773 |
Oracle Corp. | 254,146 | 28,909,107 |
Palo Alto Networks, Inc. * | 8,355 | 2,430,386 |
Roper Technologies, Inc. | 8,314 | 4,252,278 |
Salesforce, Inc. | 40,379 | 10,859,528 |
ServiceNow, Inc. * | 2,003 | 1,388,740 |
Synopsys, Inc. * | 5,163 | 2,739,436 |
VeriSign, Inc. * | 7,095 | 1,202,461 |
394,743,964 | ||
SECURITY | NUMBER OF SHARES | VALUE ($) |
Technology Hardware & Equipment 6.2% | ||
Amphenol Corp., Class A | 63,363 | 7,652,350 |
Apple, Inc. | 1,747,572 | 297,663,939 |
Arista Networks, Inc. * | 9,451 | 2,424,749 |
Arrow Electronics, Inc. * | 57,497 | 7,340,642 |
Avnet, Inc. | 130,003 | 6,353,247 |
CDW Corp. | 23,064 | 5,578,259 |
Ciena Corp. * | 40,857 | 1,888,819 |
Cisco Systems, Inc. | 1,308,432 | 61,470,135 |
Corning, Inc. | 291,856 | 9,742,153 |
F5, Inc. * | 13,242 | 2,189,035 |
Flex Ltd. * | 166,994 | 4,784,378 |
Hewlett Packard Enterprise Co. | 957,164 | 16,271,788 |
HP, Inc. | 521,943 | 14,661,379 |
Insight Enterprises, Inc. * | 10,539 | 1,924,105 |
Jabil, Inc. | 40,979 | 4,809,295 |
Juniper Networks, Inc. | 131,490 | 4,578,482 |
Keysight Technologies, Inc. * | 17,993 | 2,661,884 |
Motorola Solutions, Inc. | 13,404 | 4,545,967 |
NetApp, Inc. | 65,548 | 6,699,661 |
Sanmina Corp. * | 43,914 | 2,664,262 |
Seagate Technology Holdings PLC | 92,094 | 7,911,796 |
TD SYNNEX Corp. | 18,360 | 2,163,542 |
TE Connectivity Ltd. | 64,920 | 9,184,882 |
Teledyne Technologies, Inc. * | 4,606 | 1,757,097 |
Trimble, Inc. * | 40,453 | 2,430,012 |
Vishay Intertechnology, Inc. | 61,631 | 1,426,141 |
Western Digital Corp. * | 205,846 | 14,580,072 |
Xerox Holdings Corp. | 170,627 | 2,267,633 |
Zebra Technologies Corp., Class A * | 9,272 | 2,916,600 |
510,542,304 | ||
Telecommunication Services 3.0% | ||
AT&T, Inc. | 5,771,693 | 97,483,895 |
Frontier Communications Parent, Inc. * | 90,932 | 2,104,167 |
Liberty Global Ltd., Class C * | 420,147 | 6,877,806 |
Liberty Latin America Ltd., Class C * | 187,841 | 1,416,321 |
Lumen Technologies, Inc. * | 7,881,476 | 9,378,956 |
Telephone & Data Systems, Inc. | 185,446 | 2,902,230 |
T-Mobile U.S., Inc. | 103,163 | 16,936,270 |
Verizon Communications, Inc. | 2,730,465 | 107,826,063 |
244,925,708 | ||
Transportation 1.9% | ||
Avis Budget Group, Inc. | 18,698 | 1,784,724 |
CH Robinson Worldwide, Inc. | 62,708 | 4,452,268 |
CSX Corp. | 557,135 | 18,508,025 |
Delta Air Lines, Inc. | 45,712 | 2,288,800 |
FedEx Corp. | 99,218 | 25,973,288 |
GXO Logistics, Inc. * | 28,850 | 1,432,691 |
Hertz Global Holdings, Inc. * | 66,954 | 304,641 |
Hub Group, Inc., Class A | 36,585 | 1,471,449 |
JB Hunt Transport Services, Inc. | 20,098 | 3,267,332 |
Knight-Swift Transportation Holdings, Inc. | 60,350 | 2,789,980 |
Landstar System, Inc. | 11,336 | 1,977,112 |
Norfolk Southern Corp. | 71,348 | 16,432,871 |
Old Dominion Freight Line, Inc. | 20,234 | 3,676,720 |
Ryder System, Inc. | 42,736 | 5,207,382 |
Southwest Airlines Co. | 68,136 | 1,767,448 |
Uber Technologies, Inc. * | 46,983 | 3,113,563 |
U-Haul Holding Co. * | 622 | 39,329 |
U-Haul Holding Co. - Non Voting | 24,240 | 1,486,397 |
Union Pacific Corp. | 144,645 | 34,304,008 |
United Parcel Service, Inc., Class B | 157,389 | 23,211,730 |
SECURITY | NUMBER OF SHARES | VALUE ($) |
Werner Enterprises, Inc. | 39,772 | 1,360,202 |
ZIM Integrated Shipping Services Ltd. *(a) | 275,794 | 3,654,270 |
158,504,230 | ||
Utilities 3.5% | ||
AES Corp. | 319,414 | 5,717,511 |
Alliant Energy Corp. | 63,246 | 3,149,651 |
Ameren Corp. | 68,565 | 5,064,897 |
American Electric Power Co., Inc. | 159,584 | 13,729,011 |
American Water Works Co., Inc. | 28,266 | 3,457,497 |
Atmos Energy Corp. | 24,878 | 2,933,116 |
CenterPoint Energy, Inc. | 183,594 | 5,349,929 |
CMS Energy Corp. | 82,177 | 4,980,748 |
Consolidated Edison, Inc. | 113,484 | 10,712,890 |
Constellation Energy Corp. | 50,761 | 9,438,500 |
Dominion Energy, Inc. | 298,919 | 15,238,891 |
DTE Energy Co. | 60,084 | 6,628,467 |
Duke Energy Corp. | 261,234 | 25,668,853 |
Edison International | 111,424 | 7,917,789 |
Entergy Corp. | 76,424 | 8,152,148 |
Essential Utilities, Inc. | 37,591 | 1,375,079 |
Evergy, Inc. | 104,679 | 5,490,414 |
Eversource Energy | 111,584 | 6,764,222 |
Exelon Corp. | 390,178 | 14,662,889 |
FirstEnergy Corp. | 206,761 | 7,927,217 |
National Fuel Gas Co. | 29,939 | 1,589,761 |
NextEra Energy, Inc. | 311,827 | 20,883,054 |
NiSource, Inc. | 119,820 | 3,338,185 |
NRG Energy, Inc. | 129,020 | 9,375,883 |
OGE Energy Corp. | 67,280 | 2,331,252 |
PG&E Corp. | 125,716 | 2,151,001 |
Pinnacle West Capital Corp. | 44,444 | 3,273,301 |
Portland General Electric Co. | 35,421 | 1,531,250 |
PPL Corp. | 323,457 | 8,882,129 |
Public Service Enterprise Group, Inc. | 124,818 | 8,622,427 |
Sempra | 130,156 | 9,323,074 |
Southern Co. | 288,297 | 21,189,829 |
UGI Corp. | 162,879 | 4,163,187 |
Vistra Corp. | 147,978 | 11,222,651 |
WEC Energy Group, Inc. | 77,168 | 6,377,164 |
Xcel Energy, Inc. | 152,116 | 8,173,193 |
286,787,060 | ||
Total Common Stocks (Cost $4,957,217,631) | 8,257,403,229 | |
SECURITY | NUMBER OF SHARES | VALUE ($) |
SHORT-TERM INVESTMENTS 0.4% OF NET ASSETS | ||
Money Market Funds 0.4% | ||
State Street Institutional U.S. Government Money Market Fund, Premier Class 5.25% (c) | 28,071,706 | 28,071,706 |
State Street Institutional U.S. Government Money Market Fund, Premier Class 5.25% (c)(d) | 6,924,730 | 6,924,730 |
34,996,436 | ||
Total Short-Term Investments (Cost $34,996,436) | 34,996,436 | |
Total Investments in Securities (Cost $4,992,214,067) | 8,292,399,665 | |
NUMBER OF CONTRACTS | NOTIONAL AMOUNT ($) | CURRENT VALUE/ UNREALIZED APPRECIATION ($) | |
FUTURES CONTRACTS | |||
Long | |||
S&P 500 Index, e-mini, expires 06/21/24 | 85 | 21,534,750 | 8,628 |
* | Non-income producing security. |
(a) | All or a portion of this security is on loan. Securities on loan were valued at $6,682,168. |
(b) | Issuer is affiliated with the fund’s investment adviser. |
(c) | The rate shown is the annualized 7-day yield. |
(d) | Security purchased with cash collateral received for securities on loan. |
ADR — | American Depositary Receipt |
SECURITY | VALUE AT 10/31/23 | PURCHASES | SALES | REALIZED GAINS (LOSSES) | NET CHANGE IN UNREALIZED APPRECIATION (DEPRECIATION) | VALUE AT 4/30/24 | BALANCE OF SHARES HELD AT 4/30/24 | DIVIDENDS RECEIVED |
COMMON STOCKS 0.1% OF NET ASSETS | ||||||||
Financial Services 0.1% | ||||||||
Charles Schwab Corp. | $5,890,928 | $2,553,305 | ($66,439 ) | ($10,996 ) | $2,684,142 | $11,050,940 | 149,438 | $61,597 |
SECURITY | VALUE AT 10/31/23 | PURCHASES | SALES | REALIZED GAINS (LOSSES) | NET CHANGE IN UNREALIZED APPRECIATION (DEPRECIATION) | VALUE AT 4/30/24 | BALANCE OF SHARES HELD AT 4/30/24 | DIVIDENDS RECEIVED |
Transportation 0.0% | ||||||||
Daseke, Inc. | $— | $1,516,053 | ($1,525,241 ) | $9,188 | $— | $— | — | $— |
Total | $5,890,928 | $4,069,358 | ($1,591,680 ) | ($1,808 ) | $2,684,142 | $11,050,940 | $61,597 | |
DESCRIPTION | QUOTED PRICES IN ACTIVE MARKETS FOR IDENTICAL ASSETS (LEVEL 1) | OTHER SIGNIFICANT OBSERVABLE INPUTS (LEVEL 2) | SIGNIFICANT UNOBSERVABLE INPUTS (LEVEL 3) | TOTAL |
Assets | ||||
Common Stocks1 | $8,257,403,229 | $— | $— | $8,257,403,229 |
Short-Term Investments1 | 34,996,436 | — | — | 34,996,436 |
Futures Contracts2 | 8,628 | — | — | 8,628 |
Total | $8,292,408,293 | $— | $— | $8,292,408,293 |
1 | As categorized in the Portfolio Holdings. |
2 | Futures contracts are reported at cumulative unrealized appreciation or depreciation. |
Assets | ||
Investments in securities, at value - affiliated issuers (cost $6,598,357) | $11,050,940 | |
Investments in securities, at value - unaffiliated issuers (cost $4,985,615,710) including securities on loan of $6,682,168 | 8,281,348,725 | |
Deposit with broker for futures contracts | 1,958,800 | |
Receivables: | ||
Dividends | 8,691,944 | |
Fund shares sold | 5,943,225 | |
Income from securities on loan | + | 25,783 |
Total assets | 8,309,019,417 | |
Liabilities | ||
Collateral held for securities on loan | 6,924,730 | |
Payables: | ||
Investments bought | 18,920,339 | |
Fund shares redeemed | 2,235,508 | |
Investment adviser fees | 1,711,375 | |
Variation margin on futures contracts | + | 310,897 |
Total liabilities | 30,102,849 | |
Net assets | $8,278,916,568 | |
Net Assets by Source | ||
Capital received from investors | $4,845,454,985 | |
Total distributable earnings | + | 3,433,461,583 |
Net assets | $8,278,916,568 | |
Net Asset Value (NAV) | ||||
Net Assets | ÷ | Shares Outstanding | = | NAV |
$8,278,916,568 | 326,945,370 | $25.32 | ||
For the period November 1, 2023 through April 30, 2024; unaudited | ||
Investment Income | ||
Dividends received from securities - unaffiliated issuers (net of foreign withholding tax of $16,206) | $88,891,141 | |
Other interest | 65,365 | |
Dividends received from securities - affiliated issuers | 61,597 | |
Securities on loan, net | + | 101,659 |
Total investment income | 89,119,762 | |
Expenses | ||
Investment adviser fees | 9,829,861 | |
Total expenses | – | 9,829,861 |
Net investment income | 79,289,901 | |
REALIZED AND UNREALIZED GAINS (LOSSES) | ||
Net realized losses on sales of securities - affiliated issuers | (1,808 ) | |
Net realized losses on sales of securities - unaffiliated issuers | (19,840,433 ) | |
Net realized gains on sales of in-kind redemptions - unaffiliated issuers | 276,923,955 | |
Net realized gains on futures contracts | + | 5,363,867 |
Net realized gains | 262,445,581 | |
Net change in unrealized appreciation (depreciation) on securities - affiliated issuers | 2,684,142 | |
Net change in unrealized appreciation (depreciation) on securities - unaffiliated issuers | 956,352,585 | |
Net change in unrealized appreciation (depreciation) on futures contracts | + | 1,114,400 |
Net change in unrealized appreciation (depreciation) | + | 960,151,127 |
Net realized and unrealized gains | 1,222,596,708 | |
Increase in net assets resulting from operations | $1,301,886,609 | |
OPERATIONS | |||
11/1/23-4/30/24 | 11/1/22-10/31/23 | ||
Net investment income | $79,289,901 | $139,705,973 | |
Net realized gains | 262,445,581 | 331,984,637 | |
Net change in unrealized appreciation (depreciation) | + | 960,151,127 | (189,595,548 ) |
Increase in net assets resulting from operations | $1,301,886,609 | $282,095,062 | |
DISTRIBUTIONS TO SHAREHOLDERS | |||
Total distributions | ($142,700,838 ) | ($133,865,719 ) | |
TRANSACTIONS IN FUND SHARES | |||||
11/1/23-4/30/24 | 11/1/22-10/31/23 | ||||
SHARES | VALUE | SHARES | VALUE | ||
Shares sold | 50,329,059 | $1,246,586,609 | 85,365,922 | $1,869,192,647 | |
Shares reinvested | 4,359,762 | 101,408,064 | 4,461,960 | 94,504,309 | |
Shares redeemed | + | (42,890,822 ) | (1,064,232,508 ) | (79,488,125 ) | (1,736,335,999 ) |
Net transactions in fund shares | 11,797,999 | $283,762,165 | 10,339,757 | $227,360,957 | |
SHARES OUTSTANDING AND NET ASSETS | |||||
11/1/23-4/30/24 | 11/1/22-10/31/23 | ||||
SHARES | NET ASSETS | SHARES | NET ASSETS | ||
Beginning of period | 315,147,371 | $6,835,968,632 | 304,807,614 | $6,460,378,332 | |
Total increase | + | 11,797,999 | 1,442,947,936 | 10,339,757 | 375,590,300 |
End of period | 326,945,370 | $8,278,916,568 | 315,147,371 | $6,835,968,632 | |
11/1/23– 4/30/24* | 11/1/22– 10/31/23 | 11/1/21– 10/31/22 | 11/1/20– 10/31/21 | 11/1/19– 10/31/20 | 11/1/18– 10/31/19 | |
Per-Share Data | ||||||
Net asset value at beginning of period | $13.80 | $15.22 | $19.32 | $11.97 | $13.85 | $14.68 |
Income (loss) from investment operations: | ||||||
Net investment income (loss)1 | 0.15 | 0.23 | 0.22 | 0.18 | 0.17 | 0.20 |
Net realized and unrealized gains (losses) | 2.37 | (0.67 ) | (2.17 ) | 7.38 | (1.53 ) | 0.32 |
Total from investment operations | 2.52 | (0.44 ) | (1.95 ) | 7.56 | (1.36 ) | 0.52 |
Less distributions: | ||||||
Distributions from net investment income | (0.23 ) | (0.17 ) | (0.24 ) | (0.21 ) | (0.20 ) | (0.22 ) |
Distributions from net realized gains | — | (0.81 ) | (1.91 ) | — | (0.32 ) | (1.13 ) |
Total distributions | (0.23 ) | (0.98 ) | (2.15 ) | (0.21 ) | (0.52 ) | (1.35 ) |
Net asset value at end of period | $16.09 | $13.80 | $15.22 | $19.32 | $11.97 | $13.85 |
Total return | 18.31 %2 | (3.04 %) | (11.37 %) | 63.73 % | (10.42 %) | 5.61 % |
Ratios/Supplemental Data | ||||||
Ratios to average net assets: | ||||||
Total expenses | 0.25 %3 | 0.25 % | 0.25 %4 | 0.25 % | 0.25 % | 0.25 % |
Net investment income (loss) | 1.88 %3 | 1.56 % | 1.35 % | 1.02 % | 1.43 % | 1.50 % |
Portfolio turnover rate | 16 %2,5 | 22 %5 | 35 %5 | 36 %5 | 28 % | 34 % |
Net assets, end of period (x 1,000,000) | $1,836 | $1,524 | $1,631 | $1,945 | $1,394 | $1,908 |
* | Unaudited. |
1 | Calculated based on the average shares outstanding during the period. |
2 | Not annualized. |
3 | Annualized. |
4 | Ratio includes less than 0.005% of non-routine proxy expenses. |
5 | Portfolio turnover rate excludes in-kind transactions. |
SECURITY | NUMBER OF SHARES | VALUE ($) |
COMMON STOCKS 99.7% OF NET ASSETS | ||
Automobiles & Components 1.4% | ||
American Axle & Manufacturing Holdings, Inc. * | 365,584 | 2,683,387 |
Cooper-Standard Holdings, Inc. * | 98,541 | 1,520,488 |
Dorman Products, Inc. * | 20,596 | 1,801,120 |
Fox Factory Holding Corp. * | 17,469 | 679,893 |
Gentherm, Inc. * | 31,386 | 1,587,190 |
LCI Industries | 28,522 | 2,965,718 |
Modine Manufacturing Co. * | 34,848 | 3,227,970 |
Patrick Industries, Inc. | 27,157 | 2,837,635 |
Phinia, Inc. | 67,468 | 2,631,252 |
Standard Motor Products, Inc. | 40,078 | 1,286,504 |
Stoneridge, Inc. * | 46,856 | 701,903 |
Visteon Corp. * | 17,731 | 1,961,580 |
Winnebago Industries, Inc. | 44,713 | 2,753,426 |
26,638,066 | ||
Banks 8.1% | ||
1st Source Corp. | 13,143 | 651,893 |
Ameris Bancorp | 39,193 | 1,860,884 |
Associated Banc-Corp. | 173,162 | 3,648,523 |
Atlantic Union Bankshares Corp. | 12,153 | 386,101 |
Axos Financial, Inc. * | 31,554 | 1,596,948 |
BancFirst Corp. | 7,496 | 668,418 |
Bancorp, Inc. * | 3,462 | 103,652 |
Bank of Hawaii Corp. | 38,574 | 2,186,760 |
Bank of NT Butterfield & Son Ltd. | 51,995 | 1,767,830 |
Bank OZK | 81,142 | 3,622,990 |
BankUnited, Inc. | 153,492 | 4,102,841 |
Banner Corp. | 35,005 | 1,527,268 |
Berkshire Hills Bancorp, Inc. | 8,116 | 173,033 |
BOK Financial Corp. | 22,263 | 1,975,396 |
Brookline Bancorp, Inc. | 78,791 | 653,965 |
Cadence Bank | 120,523 | 3,334,871 |
Capitol Federal Financial, Inc. | 190,169 | 907,106 |
Cathay General Bancorp | 64,240 | 2,212,426 |
Central Pacific Financial Corp. | 38,838 | 774,430 |
City Holding Co. | 7,454 | 753,003 |
Columbia Banking System, Inc. | 165,294 | 3,109,180 |
Commerce Bancshares, Inc. | 62,286 | 3,405,798 |
Community Bank System, Inc. | 33,411 | 1,444,023 |
ConnectOne Bancorp, Inc. | 32,433 | 580,875 |
Cullen/Frost Bankers, Inc. | 31,812 | 3,319,264 |
Customers Bancorp, Inc. * | 25,049 | 1,143,988 |
CVB Financial Corp. | 99,364 | 1,623,608 |
Eagle Bancorp, Inc. | 49,431 | 913,979 |
Eastern Bankshares, Inc. | 69,723 | 875,721 |
Enterprise Financial Services Corp. | 19,588 | 744,540 |
FB Financial Corp. | 4,130 | 151,365 |
First BanCorp | 110,558 | 1,907,126 |
First Bancorp/Southern Pines NC | 19,844 | 603,456 |
First Busey Corp. | 46,488 | 1,038,542 |
First Commonwealth Financial Corp. | 74,003 | 976,100 |
First Financial Bancorp | 81,971 | 1,812,379 |
SECURITY | NUMBER OF SHARES | VALUE ($) |
First Financial Bankshares, Inc. | 43,130 | 1,274,923 |
First Hawaiian, Inc. | 156,687 | 3,304,529 |
First Interstate BancSystem, Inc., Class A | 62,654 | 1,672,862 |
First Merchants Corp. | 43,218 | 1,444,346 |
FNB Corp. | 287,127 | 3,830,274 |
Fulton Financial Corp. | 146,389 | 2,422,738 |
Glacier Bancorp, Inc. | 64,299 | 2,326,338 |
Hancock Whitney Corp. | 73,512 | 3,336,710 |
Hanmi Financial Corp. | 37,596 | 575,219 |
Heartland Financial USA, Inc. | 36,519 | 1,537,815 |
Heritage Financial Corp. | 33,995 | 603,071 |
Hilltop Holdings, Inc. | 66,780 | 1,953,983 |
Home BancShares, Inc. | 26,344 | 623,826 |
HomeStreet, Inc. | 98,105 | 1,201,786 |
Hope Bancorp, Inc. | 177,148 | 1,775,023 |
Independent Bank Corp. | 24,052 | 1,208,372 |
Independent Bank Group, Inc. | 28,606 | 1,065,287 |
International Bancshares Corp. | 33,516 | 1,865,165 |
Kearny Financial Corp. | 86,954 | 469,552 |
Lakeland Bancorp, Inc. | 44,288 | 539,871 |
Lakeland Financial Corp. | 11,702 | 687,727 |
Midland States Bancorp, Inc. | 5,664 | 124,042 |
National Bank Holdings Corp., Class A | 4,506 | 147,481 |
NBT Bancorp, Inc. | 30,729 | 1,075,822 |
Nicolet Bankshares, Inc. | 1,744 | 133,468 |
Northwest Bancshares, Inc. | 111,182 | 1,178,529 |
NU Holdings Ltd., Class A * | 22,330 | 242,504 |
OceanFirst Financial Corp. | 49,330 | 728,111 |
OFG Bancorp | 33,302 | 1,202,535 |
Old National Bancorp | 151,722 | 2,509,482 |
Pacific Premier Bancorp, Inc. | 72,557 | 1,559,976 |
Park National Corp. | 9,535 | 1,255,855 |
Pathward Financial, Inc. | 17,849 | 899,054 |
Peoples Bancorp, Inc. | 5,007 | 145,403 |
Pinnacle Financial Partners, Inc. | 39,771 | 3,050,436 |
Preferred Bank | 2,116 | 160,160 |
Premier Financial Corp. | 34,122 | 661,284 |
Prosperity Bancshares, Inc. | 55,350 | 3,430,040 |
Provident Financial Services, Inc. | 73,926 | 1,085,234 |
S&T Bancorp, Inc. | 31,861 | 960,609 |
Sandy Spring Bancorp, Inc. | 53,201 | 1,087,960 |
Seacoast Banking Corp. of Florida | 6,645 | 153,300 |
Simmons First National Corp., Class A | 128,239 | 2,191,605 |
Southside Bancshares, Inc. | 28,434 | 758,050 |
Texas Capital Bancshares, Inc. * | 33,075 | 1,898,505 |
Tompkins Financial Corp. | 12,366 | 543,857 |
Towne Bank | 49,317 | 1,275,831 |
TriCo Bancshares | 19,363 | 673,252 |
Trustmark Corp. | 67,569 | 2,000,042 |
UMB Financial Corp. | 30,649 | 2,441,499 |
United Bankshares, Inc. | 90,729 | 2,945,063 |
United Community Banks, Inc. | 58,522 | 1,476,510 |
Valley National Bancorp | 347,711 | 2,437,454 |
Veritex Holdings, Inc. | 42,780 | 833,354 |
WaFd, Inc. | 89,006 | 2,411,173 |
Washington Trust Bancorp, Inc. | 22,867 | 582,194 |
Webster Financial Corp. | 76,263 | 3,342,607 |
SECURITY | NUMBER OF SHARES | VALUE ($) |
WesBanco, Inc. | 61,846 | 1,669,842 |
Westamerica BanCorp | 15,429 | 718,220 |
Western Alliance Bancorp | 64,757 | 3,680,140 |
Wintrust Financial Corp. | 36,355 | 3,513,347 |
WSFS Financial Corp. | 31,846 | 1,360,780 |
148,822,309 | ||
Capital Goods 12.3% | ||
AAON, Inc. | 13,772 | 1,295,807 |
AAR Corp. * | 36,349 | 2,513,170 |
Advanced Drainage Systems, Inc. | 15,489 | 2,431,773 |
Alamo Group, Inc. | 6,902 | 1,341,611 |
Albany International Corp., Class A | 20,699 | 1,650,745 |
Ameresco, Inc., Class A * | 6,200 | 129,766 |
American Woodmark Corp. * | 29,515 | 2,717,741 |
API Group Corp. * | 77,251 | 2,979,571 |
Apogee Enterprises, Inc. | 38,004 | 2,347,887 |
Applied Industrial Technologies, Inc. | 21,181 | 3,881,418 |
Arcosa, Inc. | 36,736 | 2,792,671 |
Argan, Inc. | 15,663 | 943,852 |
Armstrong World Industries, Inc. | 34,663 | 3,982,085 |
Astec Industries, Inc. | 38,162 | 1,595,172 |
Atkore, Inc. | 20,640 | 3,618,192 |
AZEK Co., Inc., Class A * | 33,464 | 1,527,297 |
AZZ, Inc. | 30,980 | 2,219,097 |
Barnes Group, Inc. | 74,190 | 2,575,877 |
BlueLinx Holdings, Inc. * | 5,103 | 559,646 |
BWX Technologies, Inc. | 43,839 | 4,198,461 |
Columbus McKinnon Corp. | 26,035 | 1,074,464 |
Comfort Systems USA, Inc. | 13,365 | 4,135,265 |
Construction Partners, Inc., Class A * | 19,332 | 998,304 |
Core & Main, Inc., Class A * | 37,176 | 2,099,329 |
Crane Co. | 25,321 | 3,545,193 |
CSW Industrials, Inc. | 4,205 | 999,192 |
DNOW, Inc. * | 222,158 | 3,134,649 |
Douglas Dynamics, Inc. | 23,779 | 538,357 |
Ducommun, Inc. * | 14,000 | 757,260 |
DXP Enterprises, Inc. * | 24,138 | 1,176,969 |
Dycom Industries, Inc. * | 32,632 | 4,569,133 |
Encore Wire Corp. | 17,076 | 4,770,351 |
Enerpac Tool Group Corp., Class A | 26,419 | 941,309 |
EnerSys | 38,977 | 3,525,470 |
Enpro, Inc. | 11,973 | 1,797,506 |
Esab Corp. | 28,697 | 3,038,438 |
ESCO Technologies, Inc. | 12,408 | 1,258,792 |
Federal Signal Corp. | 27,434 | 2,230,384 |
Flowserve Corp. | 107,903 | 5,088,705 |
Franklin Electric Co., Inc. | 23,694 | 2,281,021 |
FTAI Aviation Ltd. | 42,449 | 2,980,344 |
Gates Industrial Corp. PLC * | 135,438 | 2,386,418 |
GATX Corp. | 31,696 | 3,878,323 |
Gibraltar Industries, Inc. * | 22,551 | 1,611,494 |
Global Industrial Co. | 3,235 | 124,580 |
GMS, Inc. * | 42,596 | 3,940,982 |
GrafTech International Ltd. | 1,237,265 | 2,128,096 |
Granite Construction, Inc. | 60,736 | 3,370,848 |
Great Lakes Dredge & Dock Corp. * | 101,861 | 672,283 |
Greenbrier Cos., Inc. | 70,086 | 3,461,548 |
Griffon Corp. | 30,686 | 2,010,547 |
H&E Equipment Services, Inc. | 38,133 | 1,841,443 |
Hayward Holdings, Inc. * | 21,770 | 295,637 |
HEICO Corp. | 19,279 | 3,998,465 |
Helios Technologies, Inc. | 5,961 | 268,841 |
Herc Holdings, Inc. | 23,835 | 3,409,120 |
Hexcel Corp. | 54,765 | 3,516,461 |
Hillenbrand, Inc. | 57,387 | 2,738,508 |
Hillman Solutions Corp. * | 127,422 | 1,218,154 |
SECURITY | NUMBER OF SHARES | VALUE ($) |
Hyster-Yale Materials Handling, Inc. | 1,972 | 115,500 |
Insteel Industries, Inc. | 6,985 | 224,218 |
JELD-WEN Holding, Inc. * | 215,277 | 4,413,178 |
John Bean Technologies Corp. | 18,051 | 1,608,164 |
Kadant, Inc. | 4,314 | 1,181,130 |
Kennametal, Inc. | 119,883 | 2,820,847 |
Kratos Defense & Security Solutions, Inc. * | 47,431 | 845,220 |
Leonardo DRS, Inc. * | 11,843 | 254,861 |
Lindsay Corp. | 5,967 | 693,067 |
Manitowoc Co., Inc. * | 83,661 | 1,012,298 |
Masonite International Corp. * | 26,982 | 3,576,464 |
Masterbrand, Inc. * | 55,494 | 925,085 |
McGrath RentCorp | 14,489 | 1,545,397 |
Mercury Systems, Inc. * | 31,043 | 875,413 |
Moog, Inc., Class A | 23,231 | 3,695,355 |
MRC Global, Inc. * | 150,203 | 1,686,780 |
Mueller Water Products, Inc., Class A | 114,639 | 1,815,882 |
MYR Group, Inc. * | 13,000 | 2,161,250 |
National Presto Industries, Inc. | 8,453 | 693,061 |
Proto Labs, Inc. * | 30,776 | 938,052 |
Quanex Building Products Corp. | 44,196 | 1,468,191 |
RBC Bearings, Inc. * | 5,572 | 1,362,633 |
REV Group, Inc. | 68,957 | 1,507,400 |
Shyft Group, Inc. | 65,016 | 707,374 |
Simpson Manufacturing Co., Inc. | 18,393 | 3,198,359 |
SiteOne Landscape Supply, Inc. * | 18,645 | 2,925,214 |
Spirit AeroSystems Holdings, Inc., Class A * | 152,925 | 4,893,600 |
SPX Technologies, Inc. * | 13,868 | 1,689,261 |
Standex International Corp. | 7,104 | 1,228,140 |
Sterling Infrastructure, Inc. * | 13,813 | 1,403,401 |
Stratasys Ltd. * | 52,687 | 512,118 |
Sunrun, Inc. * | 9,863 | 101,490 |
Tennant Co. | 13,885 | 1,617,325 |
Terex Corp. | 67,244 | 3,769,026 |
Thermon Group Holdings, Inc. * | 4,978 | 158,948 |
Titan International, Inc. * | 14,093 | 155,305 |
Titan Machinery, Inc. * | 38,433 | 855,519 |
TPI Composites, Inc. *(a) | 186,176 | 592,040 |
Trex Co., Inc. * | 31,263 | 2,768,339 |
Trinity Industries, Inc. | 120,063 | 3,124,039 |
Tutor Perini Corp. * | 314,969 | 5,237,934 |
Valmont Industries, Inc. | 14,692 | 3,008,922 |
Vertiv Holdings Co., Class A | 47,544 | 4,421,592 |
Wabash National Corp. | 74,922 | 1,731,447 |
Watts Water Technologies, Inc., Class A | 12,520 | 2,484,719 |
WillScot Mobile Mini Holdings Corp. * | 43,728 | 1,616,187 |
Woodward, Inc. | 30,234 | 4,908,792 |
Zurn Elkay Water Solutions Corp. | 31,943 | 999,177 |
226,641,736 | ||
Commercial & Professional Services 6.1% | ||
ACCO Brands Corp. | 321,061 | 1,547,514 |
Alight, Inc., Class A * | 64,565 | 582,376 |
Barrett Business Services, Inc. | 6,440 | 782,460 |
BrightView Holdings, Inc. * | 142,241 | 1,600,211 |
Brink's Co. | 32,313 | 2,826,095 |
Casella Waste Systems, Inc., Class A * | 10,243 | 925,967 |
CBIZ, Inc. * | 21,898 | 1,558,700 |
Cimpress PLC * | 20,516 | 1,749,399 |
Clarivate PLC * | 154,863 | 1,046,874 |
Clean Harbors, Inc. * | 22,281 | 4,221,135 |
Concentrix Corp. | 46,888 | 2,563,367 |
Conduent, Inc. * | 480,257 | 1,512,810 |
CoreCivic, Inc. * | 292,935 | 4,364,731 |
CRA International, Inc. | 5,750 | 834,268 |
SECURITY | NUMBER OF SHARES | VALUE ($) |
CSG Systems International, Inc. | 27,879 | 1,317,004 |
Dayforce, Inc. * | 9,432 | 578,842 |
Deluxe Corp. | 135,818 | 2,682,406 |
Dun & Bradstreet Holdings, Inc. | 180,565 | 1,643,142 |
Ennis, Inc. | 41,288 | 821,631 |
Enviri Corp. * | 199,827 | 1,554,654 |
ExlService Holdings, Inc. * | 58,582 | 1,698,878 |
Exponent, Inc. | 13,529 | 1,243,450 |
FTI Consulting, Inc. * | 19,370 | 4,141,887 |
GEO Group, Inc. * | 369,025 | 5,483,711 |
Healthcare Services Group, Inc. * | 199,218 | 2,115,695 |
Heidrick & Struggles International, Inc. | 23,620 | 696,318 |
HNI Corp. | 74,460 | 3,123,597 |
Huron Consulting Group, Inc. * | 8,597 | 801,584 |
ICF International, Inc. | 11,966 | 1,726,574 |
Insperity, Inc. | 17,281 | 1,778,733 |
Interface, Inc., Class A | 120,361 | 1,840,320 |
Kelly Services, Inc., Class A | 173,384 | 3,977,429 |
Kforce, Inc. | 24,304 | 1,501,015 |
Korn Ferry | 58,220 | 3,535,118 |
Matthews International Corp., Class A | 39,639 | 1,069,460 |
MillerKnoll, Inc. | 128,207 | 3,260,304 |
MSA Safety, Inc. | 10,770 | 1,942,908 |
NV5 Global, Inc. * | 6,578 | 613,333 |
OPENLANE, Inc. * | 158,357 | 2,720,573 |
Parsons Corp. * | 21,691 | 1,702,960 |
Paycom Software, Inc. | 7,019 | 1,319,432 |
Pitney Bowes, Inc. | 525,045 | 2,236,692 |
Resources Connection, Inc. | 66,152 | 730,980 |
Rollins, Inc. | 53,419 | 2,380,351 |
SP Plus Corp. * | 14,720 | 751,603 |
Steelcase, Inc., Class A | 260,390 | 3,132,492 |
Stericycle, Inc. * | 62,054 | 2,775,675 |
Tetra Tech, Inc. | 20,890 | 4,067,701 |
TriNet Group, Inc. | 20,278 | 2,035,303 |
TrueBlue, Inc. * | 138,900 | 1,447,338 |
TTEC Holdings, Inc. | 31,997 | 232,938 |
UniFirst Corp. | 16,720 | 2,677,374 |
Veralto Corp. | 48,282 | 4,523,058 |
Verra Mobility Corp., Class A * | 40,531 | 955,721 |
Vestis Corp. | 124,126 | 2,286,401 |
VSE Corp. | 2,242 | 175,033 |
111,415,525 | ||
Consumer Discretionary Distribution & Retail 4.5% | ||
1-800-Flowers.com, Inc., Class A * | 74,213 | 673,112 |
Aaron's Co., Inc. | 156,479 | 1,081,270 |
Abercrombie & Fitch Co., Class A * | 73,081 | 8,880,803 |
America's Car-Mart, Inc. * | 7,990 | 457,348 |
Arko Corp. | 98,397 | 423,107 |
Beyond, Inc. * | 88,942 | 1,790,402 |
Boot Barn Holdings, Inc. * | 15,439 | 1,643,790 |
Buckle, Inc. | 41,746 | 1,560,883 |
Caleres, Inc. | 38,541 | 1,419,465 |
Camping World Holdings, Inc., Class A | 38,057 | 771,415 |
Children's Place, Inc. *(a) | 43,969 | 306,024 |
Citi Trends, Inc. * | 37,933 | 813,284 |
ContextLogic, Inc., Class A * | 200,943 | 1,115,234 |
Coupang, Inc., Class A * | 42,642 | 959,445 |
Designer Brands, Inc., Class A | 146,043 | 1,356,740 |
Dillard's, Inc., Class A | 5,783 | 2,532,896 |
Etsy, Inc. * | 36,324 | 2,494,369 |
Five Below, Inc. * | 12,455 | 1,822,665 |
Floor & Decor Holdings, Inc., Class A * | 23,511 | 2,593,969 |
GameStop Corp., Class A *(a) | 235,381 | 2,610,375 |
Genesco, Inc. * | 51,634 | 1,306,857 |
Guess?, Inc. | 62,394 | 1,670,911 |
SECURITY | NUMBER OF SHARES | VALUE ($) |
Haverty Furniture Cos., Inc. | 38,909 | 1,198,397 |
Hibbett, Inc. | 35,217 | 3,037,114 |
Leslie's, Inc. * | 84,064 | 330,372 |
MarineMax, Inc. * | 59,091 | 1,457,775 |
MercadoLibre, Inc. * | 1,189 | 1,734,394 |
Monro, Inc. | 47,229 | 1,286,990 |
National Vision Holdings, Inc. * | 81,388 | 1,417,779 |
Ollie's Bargain Outlet Holdings, Inc. * | 35,101 | 2,567,287 |
OneWater Marine, Inc., Class A * | 6,657 | 137,866 |
Petco Health & Wellness Co., Inc., Class A * | 238,704 | 358,056 |
PetMed Express, Inc. | 70,858 | 279,889 |
RH * | 8,719 | 2,154,029 |
Sally Beauty Holdings, Inc. * | 277,795 | 3,014,076 |
Shoe Carnival, Inc. | 36,830 | 1,231,595 |
Signet Jewelers Ltd. | 45,470 | 4,457,424 |
Sleep Number Corp. * | 152,404 | 2,028,497 |
Sonic Automotive, Inc., Class A | 50,871 | 2,942,379 |
Sportsman's Warehouse Holdings, Inc. * | 58,999 | 188,797 |
Stitch Fix, Inc., Class A * | 270,174 | 572,769 |
Upbound Group, Inc. | 82,874 | 2,569,923 |
Urban Outfitters, Inc. * | 95,566 | 3,723,251 |
Valvoline, Inc. * | 80,409 | 3,418,991 |
Victoria's Secret & Co. * | 147,742 | 2,603,214 |
Vroom, Inc. *(a) | 26,877 | 300,216 |
Wayfair, Inc., Class A * | 21,681 | 1,087,302 |
Zumiez, Inc. * | 70,571 | 1,213,821 |
83,596,567 | ||
Consumer Durables & Apparel 3.8% | ||
Acushnet Holdings Corp. | 23,121 | 1,409,919 |
Beazer Homes USA, Inc. * | 51,814 | 1,452,346 |
Cavco Industries, Inc. * | 6,208 | 2,261,016 |
Century Communities, Inc. | 39,467 | 3,130,522 |
Columbia Sportswear Co. | 41,968 | 3,341,912 |
Crocs, Inc. * | 30,860 | 3,838,058 |
Ethan Allen Interiors, Inc. | 35,521 | 1,003,113 |
G-III Apparel Group Ltd. * | 128,847 | 3,627,043 |
GoPro, Inc., Class A * | 191,787 | 331,792 |
Green Brick Partners, Inc. * | 4,237 | 229,349 |
Helen of Troy Ltd. * | 28,776 | 2,667,823 |
Hovnanian Enterprises, Inc., Class A * | 1,072 | 158,474 |
Installed Building Products, Inc. | 9,409 | 2,217,984 |
iRobot Corp. * | 73,057 | 625,368 |
Kontoor Brands, Inc. | 36,314 | 2,253,647 |
La-Z-Boy, Inc. | 74,344 | 2,441,457 |
LGI Homes, Inc. * | 24,265 | 2,182,152 |
M/I Homes, Inc. * | 33,668 | 3,912,895 |
Malibu Boats, Inc., Class A * | 5,870 | 199,697 |
Mattel, Inc. * | 172,142 | 3,153,641 |
Movado Group, Inc. | 22,135 | 563,778 |
Oxford Industries, Inc. | 13,865 | 1,494,370 |
Peloton Interactive, Inc., Class A * | 139,239 | 433,033 |
SharkNinja, Inc. | 43,681 | 2,807,815 |
Skyline Champion Corp. * | 29,475 | 2,210,330 |
Smith & Wesson Brands, Inc. | 118,209 | 2,006,007 |
Sonos, Inc. * | 74,912 | 1,266,013 |
Steven Madden Ltd. | 82,531 | 3,335,078 |
Sturm Ruger & Co., Inc. | 30,628 | 1,415,932 |
Topgolf Callaway Brands Corp. * | 100,220 | 1,605,524 |
Tupperware Brands Corp. *(a)(b) | 942,533 | 999,085 |
Under Armour, Inc., Class A * | 438,488 | 2,951,024 |
Vista Outdoor, Inc. * | 69,054 | 2,423,105 |
Wolverine World Wide, Inc. | 237,476 | 2,550,492 |
Worthington Enterprises, Inc. | 42,015 | 2,401,577 |
SECURITY | NUMBER OF SHARES | VALUE ($) |
YETI Holdings, Inc. * | 33,906 | 1,211,122 |
70,112,493 | ||
Consumer Services 5.1% | ||
ADT, Inc. | 423,028 | 2,749,682 |
Adtalem Global Education, Inc. * | 52,741 | 2,617,008 |
Airbnb, Inc., Class A * | 12,274 | 1,946,288 |
Arcos Dorados Holdings, Inc., Class A | 83,581 | 901,003 |
BJ's Restaurants, Inc. * | 25,989 | 846,982 |
Bloomin' Brands, Inc. | 79,838 | 2,059,022 |
Boyd Gaming Corp. | 47,642 | 2,549,323 |
Bright Horizons Family Solutions, Inc. * | 23,443 | 2,431,274 |
Brinker International, Inc. * | 41,527 | 2,225,847 |
Carriage Services, Inc., Class A | 21,912 | 560,509 |
Cheesecake Factory, Inc. | 33,027 | 1,140,092 |
Chegg, Inc. * | 17,396 | 89,937 |
Choice Hotels International, Inc. | 9,896 | 1,170,301 |
Churchill Downs, Inc. | 22,171 | 2,860,059 |
Cracker Barrel Old Country Store, Inc. | 41,185 | 2,396,555 |
Dave & Buster's Entertainment, Inc. * | 32,014 | 1,709,548 |
Denny's Corp. * | 77,075 | 618,141 |
Dine Brands Global, Inc. | 14,764 | 651,092 |
DoorDash, Inc., Class A * | 20,456 | 2,644,143 |
Everi Holdings, Inc. * | 70,993 | 580,013 |
Frontdoor, Inc. * | 33,492 | 1,027,869 |
Golden Entertainment, Inc. | 4,612 | 147,815 |
Graham Holdings Co., Class B | 5,365 | 3,762,850 |
Grand Canyon Education, Inc. * | 29,617 | 3,850,802 |
Hilton Grand Vacations, Inc. * | 45,202 | 1,882,211 |
Hyatt Hotels Corp., Class A | 20,258 | 3,014,188 |
International Game Technology PLC | 95,278 | 1,880,788 |
Jack in the Box, Inc. | 35,003 | 1,997,621 |
Krispy Kreme, Inc. | 11,970 | 151,420 |
Laureate Education, Inc. | 176,446 | 2,558,467 |
Light & Wonder, Inc. * | 41,107 | 3,669,211 |
Papa John's International, Inc. | 11,401 | 703,328 |
Perdoceo Education Corp. | 78,984 | 1,445,407 |
Planet Fitness, Inc., Class A * | 27,272 | 1,631,956 |
Red Rock Resorts, Inc., Class A | 30,582 | 1,624,516 |
Royal Caribbean Cruises Ltd. * | 55,262 | 7,716,233 |
Sabre Corp. * | 402,865 | 1,156,223 |
Six Flags Entertainment Corp. * | 110,620 | 2,608,420 |
Strategic Education, Inc. | 19,440 | 2,232,490 |
Stride, Inc. * | 28,702 | 1,915,858 |
Texas Roadhouse, Inc., Class A | 31,093 | 4,999,133 |
United Parks & Resorts, Inc. * | 21,546 | 1,094,968 |
Wendy's Co. | 131,730 | 2,633,283 |
Wingstop, Inc. | 3,045 | 1,171,686 |
Wyndham Hotels & Resorts, Inc. | 42,479 | 3,122,631 |
Wynn Resorts Ltd. | 40,009 | 3,666,825 |
94,413,018 | ||
Consumer Staples Distribution & Retail 0.6% | ||
Chefs' Warehouse, Inc. * | 25,996 | 859,948 |
Grocery Outlet Holding Corp. * | 67,086 | 1,742,223 |
Ingles Markets, Inc., Class A | 42,618 | 3,057,842 |
PriceSmart, Inc. | 37,528 | 3,024,382 |
Weis Markets, Inc. | 44,834 | 2,830,370 |
11,514,765 | ||
Energy 4.2% | ||
Antero Midstream Corp. | 123,273 | 1,706,098 |
Archrock, Inc. | 135,370 | 2,597,750 |
Berry Corp. | 151,636 | 1,287,390 |
Bristow Group, Inc. * | 5,813 | 152,940 |
SECURITY | NUMBER OF SHARES | VALUE ($) |
Cactus, Inc., Class A | 17,425 | 864,977 |
California Resources Corp. | 56,418 | 2,982,255 |
ChampionX Corp. | 63,214 | 2,122,094 |
Chord Energy Corp. | 10,802 | 1,911,738 |
Civitas Resources, Inc. | 22,098 | 1,590,172 |
Comstock Resources, Inc. | 78,751 | 792,235 |
CONSOL Energy, Inc. | 25,796 | 2,134,877 |
Core Laboratories, Inc. | 43,331 | 684,630 |
Crescent Energy Co., Class A | 17,420 | 185,349 |
CVR Energy, Inc. | 47,576 | 1,445,359 |
DHT Holdings, Inc. | 148,882 | 1,700,232 |
Diamond Offshore Drilling, Inc. * | 49,157 | 601,682 |
Dorian LPG Ltd. | 25,536 | 1,055,148 |
Dril-Quip, Inc. * | 36,497 | 663,515 |
DT Midstream, Inc. | 49,495 | 3,078,589 |
Expro Group Holdings NV * | 11,157 | 209,305 |
Golar LNG Ltd. | 45,150 | 1,107,078 |
Green Plains, Inc. * | 66,932 | 1,383,484 |
Helix Energy Solutions Group, Inc. * | 138,597 | 1,488,532 |
Helmerich & Payne, Inc. | 118,099 | 4,644,834 |
International Seaways, Inc. | 13,943 | 770,908 |
Kosmos Energy Ltd. * | 307,055 | 1,741,002 |
Liberty Energy, Inc., Class A | 126,553 | 2,784,166 |
Magnolia Oil & Gas Corp., Class A | 53,172 | 1,333,022 |
Matador Resources Co. | 48,130 | 2,998,499 |
Nabors Industries Ltd. * | 23,973 | 1,726,775 |
Newpark Resources, Inc. * | 27,300 | 189,462 |
Noble Corp. PLC | 5,176 | 229,711 |
Northern Oil & Gas, Inc. | 8,237 | 335,987 |
Oceaneering International, Inc. * | 63,347 | 1,451,280 |
Oil States International, Inc. * | 109,435 | 436,646 |
Par Pacific Holdings, Inc. * | 28,809 | 887,317 |
Patterson-UTI Energy, Inc. | 335,468 | 3,629,764 |
Permian Resources Corp., Class A | 68,093 | 1,140,558 |
ProPetro Holding Corp. * | 198,028 | 1,726,804 |
Range Resources Corp. | 63,030 | 2,263,407 |
REX American Resources Corp. * | 3,929 | 217,392 |
RPC, Inc. | 103,086 | 689,645 |
Scorpio Tankers, Inc. | 23,222 | 1,633,900 |
Select Water Solutions, Inc. | 96,142 | 888,352 |
SFL Corp. Ltd. | 148,150 | 1,974,840 |
SilverBow Resources, Inc. * | 6,685 | 205,363 |
Talos Energy, Inc. * | 118,842 | 1,566,338 |
Teekay Corp. * | 26,386 | 193,146 |
Teekay Tankers Ltd., Class A | 17,187 | 1,001,487 |
Texas Pacific Land Corp. | 2,636 | 1,519,127 |
Transocean Ltd. * | 402,164 | 2,099,296 |
Tsakos Energy Navigation Ltd. | 37,672 | 971,184 |
U.S. Silica Holdings, Inc. * | 22,761 | 351,202 |
Valaris Ltd. * | 10,721 | 697,508 |
Viper Energy, Inc. | 5,552 | 211,864 |
Vital Energy, Inc. * | 7,472 | 396,165 |
Vitesse Energy, Inc. | 8,884 | 197,136 |
W&T Offshore, Inc. | 51,183 | 115,162 |
Weatherford International PLC * | 11,380 | 1,406,796 |
76,371,474 | ||
Equity Real Estate Investment Trusts (REITs) 8.0% | ||
Acadia Realty Trust | 75,377 | 1,302,515 |
Agree Realty Corp. | 17,409 | 996,143 |
Alexander & Baldwin, Inc. | 95,264 | 1,568,998 |
American Assets Trust, Inc. | 51,215 | 1,093,440 |
American Homes 4 Rent, Class A | 92,066 | 3,295,963 |
Americold Realty Trust, Inc. | 125,578 | 2,758,949 |
Apartment Income REIT Corp. | 100,621 | 3,861,834 |
Apple Hospitality REIT, Inc. | 207,459 | 3,062,095 |
Brandywine Realty Trust | 565,936 | 2,569,349 |
SECURITY | NUMBER OF SHARES | VALUE ($) |
Broadstone Net Lease, Inc. | 56,509 | 822,771 |
CareTrust REIT, Inc. | 7,093 | 175,339 |
CBL & Associates Properties, Inc. | 47,922 | 1,042,303 |
Centerspace | 11,189 | 752,460 |
Chatham Lodging Trust | 70,755 | 648,823 |
COPT Defense Properties | 93,917 | 2,251,190 |
Cousins Properties, Inc. | 130,057 | 2,983,508 |
CubeSmart | 72,422 | 2,928,746 |
DiamondRock Hospitality Co. | 267,013 | 2,376,416 |
Diversified Healthcare Trust (b) | 1,711,246 | 4,038,541 |
Douglas Emmett, Inc. | 250,053 | 3,428,227 |
Easterly Government Properties, Inc., Class A | 78,231 | 914,520 |
EastGroup Properties, Inc. | 8,757 | 1,360,488 |
Elme Communities | 81,725 | 1,238,951 |
Empire State Realty Trust, Inc., Class A | 186,861 | 1,700,435 |
EPR Properties | 57,953 | 2,352,312 |
Equity LifeStyle Properties, Inc. | 56,519 | 3,407,530 |
Essential Properties Realty Trust, Inc. | 29,041 | 764,940 |
Federal Realty Investment Trust | 41,333 | 4,305,659 |
First Industrial Realty Trust, Inc. | 38,736 | 1,759,389 |
Four Corners Property Trust, Inc. | 31,265 | 733,164 |
Getty Realty Corp. | 19,546 | 529,697 |
Global Net Lease, Inc. | 209,437 | 1,455,587 |
Healthcare Realty Trust, Inc., Class A | 201,779 | 2,871,315 |
Highwoods Properties, Inc. | 147,108 | 3,854,230 |
HomeBanc Corp. *(c) | 6,875 | 0 |
Hudson Pacific Properties, Inc. | 492,250 | 2,855,050 |
Independence Realty Trust, Inc. | 63,654 | 1,003,824 |
Industrial Logistics Properties Trust | 331,011 | 1,165,159 |
Innovative Industrial Properties, Inc. | 1,657 | 171,334 |
InvenTrust Properties Corp. | 9,850 | 249,599 |
JBG SMITH Properties | 149,394 | 2,242,404 |
Kilroy Realty Corp. | 107,310 | 3,627,078 |
Kite Realty Group Trust | 73,079 | 1,593,122 |
LTC Properties, Inc. | 23,731 | 785,496 |
LXP Industrial Trust | 179,920 | 1,502,332 |
Macerich Co. | 326,002 | 4,485,787 |
National Health Investors, Inc. | 25,867 | 1,631,173 |
National Storage Affiliates Trust | 30,111 | 1,055,089 |
NNN REIT, Inc. | 75,392 | 3,055,638 |
Office Properties Income Trust | 368,753 | 744,881 |
Omega Healthcare Investors, Inc. | 136,483 | 4,150,448 |
Outfront Media, Inc. | 190,709 | 3,024,645 |
Paramount Group, Inc. | 513,588 | 2,383,048 |
Peakstone Realty Trust (a) | 19,539 | 272,960 |
Pebblebrook Hotel Trust | 116,467 | 1,692,265 |
Phillips Edison & Co., Inc. | 55,445 | 1,813,051 |
Piedmont Office Realty Trust, Inc., Class A | 375,729 | 2,588,773 |
PotlatchDeltic Corp. | 69,639 | 2,786,256 |
Rayonier, Inc. | 86,510 | 2,565,887 |
Retail Opportunity Investments Corp. | 90,303 | 1,108,018 |
Rexford Industrial Realty, Inc. | 27,423 | 1,173,979 |
RLJ Lodging Trust | 250,951 | 2,760,461 |
Ryman Hospitality Properties, Inc. | 17,199 | 1,814,151 |
Sabra Health Care REIT, Inc. | 215,806 | 3,004,019 |
Service Properties Trust | 587,408 | 3,600,811 |
SITE Centers Corp. | 161,392 | 2,177,178 |
STAG Industrial, Inc. | 56,847 | 1,954,968 |
Sunstone Hotel Investors, Inc. | 207,945 | 2,121,039 |
Tanger, Inc. | 66,802 | 1,893,837 |
Terreno Realty Corp. | 14,714 | 799,706 |
Uniti Group, Inc. | 706,637 | 4,063,163 |
Urban Edge Properties | 93,942 | 1,571,650 |
Veris Residential, Inc. | 61,474 | 885,840 |
SECURITY | NUMBER OF SHARES | VALUE ($) |
Xenia Hotels & Resorts, Inc. | 154,820 | 2,147,353 |
147,727,299 | ||
Financial Services 7.3% | ||
AGNC Investment Corp. | 469,212 | 4,293,290 |
A-Mark Precious Metals, Inc. | 72,432 | 2,902,350 |
Apollo Commercial Real Estate Finance, Inc. | 165,230 | 1,591,165 |
Arbor Realty Trust, Inc. (a) | 113,683 | 1,458,553 |
ARES Management Corp., Class A | 18,113 | 2,410,659 |
Artisan Partners Asset Management, Inc., Class A | 62,125 | 2,542,776 |
B Riley Financial, Inc. (a) | 46,213 | 1,589,727 |
BGC Group, Inc., Class A | 267,866 | 2,097,391 |
Blackstone Mortgage Trust, Inc., Class A | 138,406 | 2,441,482 |
Brightsphere Investment Group, Inc. | 94,537 | 2,102,503 |
BrightSpire Capital, Inc., Class A | 112,018 | 704,593 |
Cannae Holdings, Inc. * | 54,605 | 1,062,067 |
Chimera Investment Corp. | 754,160 | 3,107,139 |
Claros Mortgage Trust, Inc. | 22,616 | 196,759 |
Cohen & Steers, Inc. | 16,248 | 1,117,537 |
Coinbase Global, Inc., Class A * | 43,040 | 8,777,147 |
Compass Diversified Holdings | 86,725 | 1,905,348 |
Credit Acceptance Corp. * | 6,974 | 3,582,683 |
Diamond Hill Investment Group, Inc. | 4,152 | 619,561 |
Donnelley Financial Solutions, Inc. * | 19,821 | 1,244,362 |
Encore Capital Group, Inc. * | 46,245 | 1,900,207 |
Enova International, Inc. * | 41,970 | 2,540,444 |
Essent Group Ltd. | 56,457 | 2,990,527 |
Euronet Worldwide, Inc. * | 33,727 | 3,463,088 |
EVERTEC, Inc. | 32,606 | 1,223,703 |
FactSet Research Systems, Inc. | 7,937 | 3,308,856 |
Federal Agricultural Mortgage Corp., Class C | 935 | 174,032 |
FirstCash Holdings, Inc. | 27,520 | 3,109,210 |
Franklin BSP Realty Trust, Inc. | 20,967 | 261,878 |
Granite Point Mortgage Trust, Inc. | 130,073 | 558,013 |
Green Dot Corp., Class A * | 92,204 | 806,785 |
Hamilton Lane, Inc., Class A | 1,347 | 150,487 |
Hannon Armstrong Sustainable Infrastructure Capital, Inc. | 24,203 | 605,317 |
Houlihan Lokey, Inc., Class A | 22,257 | 2,837,545 |
Interactive Brokers Group, Inc., Class A | 13,337 | 1,535,355 |
KKR Real Estate Finance Trust, Inc. | 74,381 | 699,925 |
Ladder Capital Corp., Class A | 131,413 | 1,410,062 |
MarketAxess Holdings, Inc. | 9,310 | 1,862,838 |
MFA Financial, Inc. | 180,259 | 1,908,943 |
Moelis & Co., Class A | 54,662 | 2,682,811 |
Morningstar, Inc. | 6,609 | 1,868,034 |
Mr Cooper Group, Inc. * | 45,394 | 3,504,417 |
Nelnet, Inc., Class A | 12,320 | 1,160,298 |
New York Mortgage Trust, Inc. | 163,289 | 1,118,530 |
NMI Holdings, Inc., Class A * | 37,286 | 1,150,646 |
Pagseguro Digital Ltd., Class A * | 142,048 | 1,768,498 |
PennyMac Financial Services, Inc. | 33,780 | 2,892,919 |
PennyMac Mortgage Investment Trust | 128,824 | 1,784,212 |
Piper Sandler Cos. | 11,587 | 2,268,619 |
PJT Partners, Inc., Class A | 8,768 | 828,488 |
PRA Group, Inc. * | 73,401 | 1,746,210 |
PROG Holdings, Inc. | 117,047 | 3,890,642 |
Radian Group, Inc. | 152,260 | 4,548,006 |
Ready Capital Corp. | 29,294 | 249,585 |
Redwood Trust, Inc. | 158,023 | 873,867 |
Rocket Cos., Inc., Class A * | 19,699 | 241,904 |
StepStone Group, Inc., Class A | 21,097 | 760,969 |
Stifel Financial Corp. | 56,355 | 4,503,892 |
StoneCo Ltd., Class A * | 96,064 | 1,498,598 |
SECURITY | NUMBER OF SHARES | VALUE ($) |
StoneX Group, Inc. * | 2,370 | 172,062 |
Toast, Inc., Class A * | 9,558 | 225,856 |
TPG RE Finance Trust, Inc. | 157,130 | 1,151,763 |
TPG, Inc. | 57,389 | 2,473,466 |
Tradeweb Markets, Inc., Class A | 15,093 | 1,535,109 |
Two Harbors Investment Corp. | 100,876 | 1,274,064 |
Victory Capital Holdings, Inc., Class A | 4,132 | 210,154 |
Virtu Financial, Inc., Class A | 133,080 | 2,887,836 |
Walker & Dunlop, Inc. | 28,714 | 2,631,064 |
WEX, Inc. * | 12,828 | 2,710,043 |
World Acceptance Corp. * | 9,210 | 1,267,020 |
XP, Inc., Class A | 64,672 | 1,323,836 |
134,297,725 | ||
Food, Beverage & Tobacco 2.4% | ||
Adecoagro SA | 151,209 | 1,640,618 |
B&G Foods, Inc. | 227,920 | 2,529,912 |
Boston Beer Co., Inc., Class A * | 5,403 | 1,504,249 |
Brown-Forman Corp., Class B | 62,323 | 2,982,156 |
Calavo Growers, Inc. | 40,900 | 1,102,255 |
Cal-Maine Foods, Inc. | 40,343 | 2,232,178 |
Coca-Cola Consolidated, Inc. | 2,180 | 1,800,680 |
Dole PLC | 215,760 | 2,625,799 |
Fresh Del Monte Produce, Inc. | 120,237 | 3,074,460 |
Hain Celestial Group, Inc. * | 255,507 | 1,568,813 |
J & J Snack Foods Corp. | 9,560 | 1,312,492 |
John B Sanfilippo & Son, Inc. | 10,917 | 1,088,425 |
Lancaster Colony Corp. | 10,779 | 2,056,741 |
MGP Ingredients, Inc. | 1,709 | 134,054 |
Mission Produce, Inc. * | 65,124 | 739,157 |
National Beverage Corp. * | 13,887 | 617,972 |
Nomad Foods Ltd. | 174,569 | 3,152,716 |
Pilgrim's Pride Corp. * | 69,031 | 2,486,497 |
Seneca Foods Corp., Class A * | 21,946 | 1,274,843 |
Simply Good Foods Co. * | 24,802 | 904,033 |
TreeHouse Foods, Inc. * | 73,194 | 2,748,435 |
Universal Corp. | 57,053 | 2,934,236 |
Vector Group Ltd. | 143,087 | 1,480,950 |
WK Kellogg Co. | 71,773 | 1,675,182 |
43,666,853 | ||
Health Care Equipment & Services 4.2% | ||
Acadia Healthcare Co., Inc. * | 44,805 | 3,312,882 |
AdaptHealth Corp., Class A * | 96,758 | 953,066 |
Addus HomeCare Corp. * | 8,607 | 827,563 |
agilon health, Inc. * | 37,867 | 208,269 |
Amedisys, Inc. * | 25,766 | 2,371,760 |
AMN Healthcare Services, Inc. * | 41,221 | 2,472,436 |
Astrana Health, Inc. * | 4,445 | 165,132 |
Avanos Medical, Inc. * | 41,153 | 744,046 |
Brookdale Senior Living, Inc. * | 286,164 | 1,943,054 |
Clover Health Investments Corp., Class A * | 220,397 | 138,850 |
CONMED Corp. | 11,781 | 800,872 |
CorVel Corp. * | 562 | 134,234 |
Cross Country Healthcare, Inc. * | 39,620 | 697,312 |
Dexcom, Inc. * | 16,761 | 2,135,184 |
Embecta Corp. | 162,334 | 1,644,443 |
Enhabit, Inc. * | 167,702 | 1,692,113 |
Enovis Corp. * | 39,080 | 2,158,388 |
Ensign Group, Inc. | 18,379 | 2,175,339 |
Envista Holdings Corp. * | 135,746 | 2,671,481 |
Evolent Health, Inc., Class A * | 4,935 | 136,897 |
Fulgent Genetics, Inc. * | 24,243 | 493,345 |
Globus Medical, Inc., Class A * | 48,258 | 2,402,766 |
Haemonetics Corp. * | 21,527 | 1,979,408 |
SECURITY | NUMBER OF SHARES | VALUE ($) |
HealthEquity, Inc. * | 13,067 | 1,031,117 |
ICU Medical, Inc. * | 15,451 | 1,512,962 |
Inmode Ltd. * | 7,803 | 134,134 |
Insulet Corp. * | 3,172 | 545,394 |
Integer Holdings Corp. * | 20,202 | 2,255,149 |
Integra LifeSciences Holdings Corp. * | 37,172 | 1,084,307 |
LivaNova PLC * | 17,036 | 949,757 |
Masimo Corp. * | 18,240 | 2,451,638 |
Merit Medical Systems, Inc. * | 17,307 | 1,282,449 |
ModivCare, Inc. * | 20,193 | 473,930 |
Multiplan Corp. * | 1,165,270 | 757,193 |
National HealthCare Corp. | 17,023 | 1,546,880 |
Neogen Corp. * | 52,240 | 644,119 |
OmniAb, Inc., Class A *(c) | 2,660 | 0 |
OmniAb, Inc., Class B *(c) | 2,660 | 0 |
Omnicell, Inc. * | 27,237 | 730,224 |
OPKO Health, Inc. *(a) | 479,315 | 584,764 |
Option Care Health, Inc. * | 56,861 | 1,699,575 |
Owens & Minor, Inc. * | 209,420 | 5,181,051 |
Patterson Cos., Inc. | 134,007 | 3,413,158 |
Pediatrix Medical Group, Inc. * | 217,199 | 1,926,555 |
Penumbra, Inc. * | 2,436 | 478,601 |
Premier, Inc., Class A | 155,841 | 3,253,960 |
Privia Health Group, Inc. * | 9,194 | 169,170 |
QuidelOrtho Corp. * | 41,197 | 1,670,538 |
RadNet, Inc. * | 19,108 | 926,738 |
Select Medical Holdings Corp. | 127,144 | 3,607,075 |
Surgery Partners, Inc. * | 7,885 | 196,731 |
Teladoc Health, Inc. * | 60,936 | 776,934 |
U.S. Physical Therapy, Inc. | 6,334 | 642,964 |
Varex Imaging Corp. * | 39,081 | 635,066 |
Veeva Systems, Inc., Class A * | 13,023 | 2,585,847 |
Zimvie, Inc. * | 80,861 | 1,229,087 |
76,635,907 | ||
Household & Personal Products 1.2% | ||
BellRing Brands, Inc. * | 14,495 | 799,689 |
Central Garden & Pet Co., Class A * | 47,343 | 1,677,363 |
Coty, Inc., Class A * | 148,995 | 1,704,503 |
Edgewell Personal Care Co. | 58,499 | 2,200,732 |
Energizer Holdings, Inc. | 56,650 | 1,626,988 |
Herbalife Ltd. * | 269,068 | 2,327,438 |
Inter Parfums, Inc. | 4,921 | 572,706 |
Medifast, Inc. | 21,655 | 596,162 |
Nu Skin Enterprises, Inc., Class A | 190,037 | 2,234,835 |
Reynolds Consumer Products, Inc. | 42,674 | 1,221,757 |
Spectrum Brands Holdings, Inc. | 52,705 | 4,314,958 |
USANA Health Sciences, Inc. * | 27,267 | 1,132,126 |
WD-40 Co. | 4,410 | 997,233 |
21,406,490 | ||
Insurance 2.5% | ||
Ambac Financial Group, Inc. * | 56,227 | 812,480 |
AMERISAFE, Inc. | 5,060 | 230,736 |
Assured Guaranty Ltd. | 74,195 | 5,690,756 |
Axis Capital Holdings Ltd. | 57,601 | 3,532,669 |
CNA Financial Corp. | 33,472 | 1,470,760 |
Employers Holdings, Inc. | 36,902 | 1,571,656 |
Enstar Group Ltd. * | 7,022 | 2,038,978 |
Horace Mann Educators Corp. | 36,736 | 1,354,089 |
James River Group Holdings Ltd. | 62,849 | 558,728 |
Kemper Corp. | 94,051 | 5,484,114 |
Kinsale Capital Group, Inc. | 327 | 118,783 |
Mercury General Corp. | 51,126 | 2,671,845 |
ProAssurance Corp. * | 91,128 | 1,217,470 |
RenaissanceRe Holdings Ltd. | 20,464 | 4,486,732 |
SECURITY | NUMBER OF SHARES | VALUE ($) |
RLI Corp. | 12,469 | 1,762,493 |
Safety Insurance Group, Inc. | 19,033 | 1,514,456 |
Selective Insurance Group, Inc. | 28,987 | 2,946,529 |
Stewart Information Services Corp. | 55,999 | 3,472,498 |
United Fire Group, Inc. | 36,870 | 814,458 |
Universal Insurance Holdings, Inc. | 53,060 | 1,035,731 |
White Mountains Insurance Group Ltd. | 1,916 | 3,406,916 |
46,192,877 | ||
Materials 6.5% | ||
AdvanSix, Inc. | 49,369 | 1,247,061 |
Alpha Metallurgical Resources, Inc. | 8,722 | 2,853,141 |
Alto Ingredients, Inc. * | 506,358 | 957,017 |
American Vanguard Corp. | 46,535 | 530,034 |
Ardagh Metal Packaging SA | 38,181 | 150,815 |
Ashland, Inc. | 43,364 | 4,133,890 |
ATI, Inc. * | 27,412 | 1,636,496 |
Avient Corp. | 93,126 | 3,950,405 |
Balchem Corp. | 11,089 | 1,567,763 |
Cabot Corp. | 43,860 | 4,001,348 |
Carpenter Technology Corp. | 38,598 | 3,307,849 |
Clearwater Paper Corp. * | 39,043 | 1,758,497 |
Coeur Mining, Inc. * | 323,481 | 1,462,134 |
Compass Minerals International, Inc. | 59,321 | 738,546 |
Constellium SE, Class A * | 139,951 | 2,755,635 |
Ecovyst, Inc. * | 96,741 | 912,268 |
Element Solutions, Inc. | 156,872 | 3,628,449 |
Ferroglobe PLC | 27,467 | 144,202 |
Greif, Inc., Class A | 37,459 | 2,295,487 |
Hawkins, Inc. | 13,319 | 1,009,181 |
Haynes International, Inc. | 2,345 | 141,052 |
HB Fuller Co. | 44,012 | 3,288,136 |
Hecla Mining Co. | 297,542 | 1,407,374 |
Ingevity Corp. * | 46,208 | 2,363,077 |
Innospec, Inc. | 20,386 | 2,446,320 |
Kaiser Aluminum Corp. | 29,364 | 2,657,148 |
Knife River Corp. * | 44,501 | 3,479,533 |
Koppers Holdings, Inc. | 32,921 | 1,688,189 |
LSB Industries, Inc. * | 21,510 | 200,043 |
Materion Corp. | 12,282 | 1,411,693 |
Mativ Holdings, Inc. | 109,972 | 2,008,089 |
Mercer International, Inc. | 141,041 | 1,428,745 |
Metallus, Inc. * | 68,217 | 1,402,542 |
Minerals Technologies, Inc. | 39,205 | 2,857,652 |
Myers Industries, Inc. | 40,109 | 878,387 |
NewMarket Corp. | 4,877 | 2,569,789 |
Olympic Steel, Inc. | 23,455 | 1,491,034 |
Orion SA | 65,944 | 1,560,235 |
Pactiv Evergreen, Inc. | 126,182 | 1,923,014 |
Perimeter Solutions SA * | 23,973 | 167,811 |
Quaker Chemical Corp. | 6,270 | 1,169,543 |
Radius Recycling, Inc., Class A | 90,901 | 1,583,495 |
Rayonier Advanced Materials, Inc. * | 75,977 | 283,394 |
Royal Gold, Inc. | 18,867 | 2,266,493 |
Ryerson Holding Corp. | 46,474 | 1,326,833 |
Scotts Miracle-Gro Co. | 61,810 | 4,236,457 |
Sensient Technologies Corp. | 39,976 | 2,927,043 |
Silgan Holdings, Inc. | 20,252 | 944,958 |
Southern Copper Corp. | 43,290 | 5,050,644 |
Stepan Co. | 29,696 | 2,464,471 |
Summit Materials, Inc., Class A * | 79,304 | 3,084,926 |
SunCoke Energy, Inc. | 168,616 | 1,738,431 |
Sylvamo Corp. | 77,809 | 4,863,062 |
TriMas Corp. | 44,555 | 1,157,984 |
Trinseo PLC | 365,952 | 955,135 |
Tronox Holdings PLC | 219,047 | 3,721,609 |
SECURITY | NUMBER OF SHARES | VALUE ($) |
Warrior Met Coal, Inc. | 97,161 | 6,640,954 |
118,825,513 | ||
Media & Entertainment 3.6% | ||
AMC Entertainment Holdings, Inc., Class A *(a) | 59,896 | 175,495 |
AMC Networks, Inc., Class A * | 239,160 | 2,539,879 |
Bumble, Inc., Class A * | 43,485 | 439,198 |
Cable One, Inc. | 5,414 | 2,132,304 |
Cargurus, Inc. * | 39,887 | 895,862 |
Cars.com, Inc. * | 34,572 | 577,698 |
Cinemark Holdings, Inc. * | 113,608 | 1,947,241 |
Clear Channel Outdoor Holdings, Inc. * | 1,288,947 | 1,791,636 |
EchoStar Corp., Class A * | 581,458 | 9,297,513 |
EW Scripps Co., Class A * | 168,335 | 632,940 |
Gannett Co., Inc. * | 486,052 | 1,176,246 |
Gray Television, Inc. | 336,038 | 1,932,218 |
IAC, Inc. * | 43,640 | 2,075,518 |
iHeartMedia, Inc., Class A * | 667,836 | 1,402,456 |
John Wiley & Sons, Inc., Class A | 60,342 | 2,267,049 |
Liberty Broadband Corp., Class C * | 11,591 | 576,420 |
Liberty Media Corp.-Liberty Formula One, Class C * | 36,263 | 2,537,322 |
Lions Gate Entertainment Corp., Class A * | 210,910 | 2,128,082 |
Live Nation Entertainment, Inc. * | 1,899 | 168,840 |
Match Group, Inc. * | 78,218 | 2,410,679 |
New York Times Co., Class A | 68,523 | 2,948,545 |
Pinterest, Inc., Class A * | 55,338 | 1,851,056 |
Roku, Inc. * | 19,206 | 1,107,418 |
Scholastic Corp. | 42,872 | 1,527,101 |
Shutterstock, Inc. | 15,398 | 657,649 |
Sinclair, Inc. | 97,144 | 1,194,871 |
Sirius XM Holdings, Inc. (a) | 570,553 | 1,677,426 |
Spotify Technology SA * | 18,972 | 5,320,508 |
Taboola.com Ltd. * | 170,995 | 718,179 |
Thryv Holdings, Inc. * | 80,125 | 1,843,676 |
TKO Group Holdings, Inc. | 1,973 | 186,784 |
Trade Desk, Inc., Class A * | 12,153 | 1,006,876 |
TripAdvisor, Inc. * | 83,361 | 2,194,895 |
WideOpenWest, Inc. * | 157,887 | 563,657 |
Yelp, Inc., Class A * | 70,201 | 2,824,888 |
Ziff Davis, Inc. * | 43,181 | 2,163,800 |
ZoomInfo Technologies, Inc., Class A * | 44,717 | 709,212 |
65,601,137 | ||
Pharmaceuticals, Biotechnology & Life Sciences 2.2% | ||
Alkermes PLC * | 30,384 | 745,623 |
Amphastar Pharmaceuticals, Inc. * | 2,676 | 110,385 |
Azenta, Inc. * | 19,580 | 1,027,167 |
BioMarin Pharmaceutical, Inc. * | 21,685 | 1,751,281 |
Bio-Rad Laboratories, Inc., Class A * | 9,148 | 2,467,673 |
Bio-Techne Corp. | 27,322 | 1,727,024 |
Bruker Corp. | 34,209 | 2,668,644 |
Corcept Therapeutics, Inc. * | 36,912 | 860,788 |
Elanco Animal Health, Inc. * | 289,711 | 3,812,597 |
Emergent BioSolutions, Inc. *(b) | 700,389 | 1,316,731 |
Exact Sciences Corp. * | 10,847 | 643,769 |
Exelixis, Inc. * | 112,798 | 2,646,241 |
Halozyme Therapeutics, Inc. * | 22,423 | 854,316 |
Incyte Corp. * | 47,948 | 2,495,693 |
Innoviva, Inc. * | 83,702 | 1,264,737 |
Ironwood Pharmaceuticals, Inc., Class A * | 12,037 | 93,287 |
Ligand Pharmaceuticals, Inc. * | 2,080 | 145,371 |
Medpace Holdings, Inc. * | 4,089 | 1,587,963 |
SECURITY | NUMBER OF SHARES | VALUE ($) |
Myriad Genetics, Inc. * | 37,177 | 727,554 |
Neurocrine Biosciences, Inc. * | 9,530 | 1,310,756 |
Pacira BioSciences, Inc. * | 4,718 | 123,847 |
Prestige Consumer Healthcare, Inc. * | 28,700 | 2,059,512 |
Repligen Corp. * | 4,494 | 737,915 |
Royalty Pharma PLC, Class A | 123,370 | 3,417,349 |
Supernus Pharmaceuticals, Inc. * | 27,117 | 816,222 |
United Therapeutics Corp. * | 17,896 | 4,193,570 |
Vir Biotechnology, Inc. * | 16,312 | 138,000 |
39,744,015 | ||
Real Estate Management & Development 1.1% | ||
Compass, Inc., Class A * | 84,113 | 264,956 |
CoStar Group, Inc. * | 41,411 | 3,790,349 |
Cushman & Wakefield PLC * | 281,747 | 2,718,859 |
DigitalBridge Group, Inc. | 310,660 | 5,107,250 |
eXp World Holdings, Inc. | 62,642 | 623,914 |
Howard Hughes Holdings, Inc. * | 15,915 | 1,037,021 |
Kennedy-Wilson Holdings, Inc. | 143,427 | 1,232,038 |
Marcus & Millichap, Inc. | 27,068 | 857,244 |
Newmark Group, Inc., Class A | 191,524 | 1,832,885 |
Opendoor Technologies, Inc. * | 505,683 | 1,006,309 |
Zillow Group, Inc., Class C * | 60,853 | 2,590,512 |
21,061,337 | ||
Semiconductors & Semiconductor Equipment 2.4% | ||
Allegro MicroSystems, Inc. * | 4,455 | 132,269 |
Alpha & Omega Semiconductor Ltd. * | 6,399 | 139,946 |
Amkor Technology, Inc. | 118,776 | 3,842,404 |
Axcelis Technologies, Inc. * | 6,514 | 674,329 |
Cirrus Logic, Inc. * | 47,258 | 4,185,641 |
Cohu, Inc. * | 26,068 | 790,382 |
Diodes, Inc. * | 32,838 | 2,397,502 |
Enphase Energy, Inc. * | 8,554 | 930,333 |
Entegris, Inc. | 32,070 | 4,262,744 |
FormFactor, Inc. * | 33,793 | 1,506,830 |
GLOBALFOUNDRIES, Inc. * | 20,212 | 987,963 |
Ichor Holdings Ltd. * | 27,995 | 1,085,646 |
Kulicke & Soffa Industries, Inc. | 43,425 | 2,009,709 |
Lattice Semiconductor Corp. * | 11,361 | 779,365 |
MaxLinear, Inc. * | 10,645 | 221,309 |
Monolithic Power Systems, Inc. | 3,830 | 2,563,534 |
Onto Innovation, Inc. * | 8,742 | 1,621,554 |
Photronics, Inc. * | 56,326 | 1,543,896 |
Power Integrations, Inc. | 20,997 | 1,400,920 |
Rambus, Inc. * | 3,566 | 195,488 |
Semtech Corp. * | 71,309 | 2,682,645 |
Silicon Laboratories, Inc. * | 24,070 | 2,924,264 |
SMART Global Holdings, Inc. * | 45,249 | 826,699 |
SolarEdge Technologies, Inc. * | 14,305 | 838,988 |
Synaptics, Inc. * | 19,431 | 1,748,013 |
Ultra Clean Holdings, Inc. * | 43,585 | 1,823,160 |
Universal Display Corp. | 7,678 | 1,212,970 |
Wolfspeed, Inc. * | 22,064 | 596,390 |
43,924,893 | ||
Software & Services 2.8% | ||
ACI Worldwide, Inc. * | 75,863 | 2,586,928 |
Alarm.com Holdings, Inc. * | 11,609 | 771,998 |
AppLovin Corp., Class A * | 27,894 | 1,968,480 |
Bentley Systems, Inc., Class B | 23,078 | 1,212,287 |
Blackbaud, Inc. * | 13,365 | 1,041,401 |
Cerence, Inc. * | 38,083 | 346,936 |
CommVault Systems, Inc. * | 21,244 | 2,176,873 |
Consensus Cloud Solutions, Inc. * | 28,695 | 334,010 |
SECURITY | NUMBER OF SHARES | VALUE ($) |
Dolby Laboratories, Inc., Class A | 31,789 | 2,468,734 |
Dynatrace, Inc. * | 3,321 | 150,474 |
Envestnet, Inc. * | 20,572 | 1,276,904 |
Fair Isaac Corp. * | 3,785 | 4,289,654 |
Globant SA * | 6,781 | 1,211,019 |
Guidewire Software, Inc. * | 8,062 | 890,045 |
InterDigital, Inc. | 16,972 | 1,675,646 |
LiveRamp Holdings, Inc. * | 51,593 | 1,656,651 |
Manhattan Associates, Inc. * | 8,431 | 1,737,292 |
NCR Voyix Corp. * | 188,021 | 2,303,257 |
Okta, Inc. * | 2,246 | 208,833 |
Palantir Technologies, Inc., Class A * | 54,766 | 1,203,209 |
Pegasystems, Inc. | 13,478 | 800,863 |
Perficient, Inc. * | 12,443 | 588,056 |
Progress Software Corp. | 15,499 | 772,160 |
PTC, Inc. * | 11,718 | 2,079,242 |
Qualys, Inc. * | 7,400 | 1,212,934 |
RingCentral, Inc., Class A * | 51,426 | 1,523,238 |
Snowflake, Inc., Class A * | 3,826 | 593,795 |
SPS Commerce, Inc. * | 3,478 | 604,720 |
Teradata Corp. * | 74,957 | 2,780,905 |
Twilio, Inc., Class A * | 31,112 | 1,862,987 |
Tyler Technologies, Inc. * | 4,822 | 2,225,594 |
Unisys Corp. * | 239,947 | 1,302,912 |
Verint Systems, Inc. * | 24,678 | 747,250 |
Workday, Inc., Class A * | 7,732 | 1,892,252 |
Zoom Video Communications, Inc., Class A * | 45,011 | 2,750,172 |
51,247,711 | ||
Technology Hardware & Equipment 3.7% | ||
ADTRAN Holdings, Inc. | 98,234 | 430,265 |
Advanced Energy Industries, Inc. | 17,698 | 1,696,176 |
Badger Meter, Inc. | 6,561 | 1,200,138 |
Belden, Inc. | 27,752 | 2,255,405 |
Benchmark Electronics, Inc. | 110,764 | 3,346,180 |
Calix, Inc. * | 5,060 | 140,314 |
Cognex Corp. | 68,093 | 2,828,583 |
CommScope Holding Co., Inc. * | 944,314 | 844,217 |
Comtech Telecommunications Corp. * | 67,150 | 126,242 |
Crane NXT Co. | 27,246 | 1,656,829 |
CTS Corp. | 20,139 | 921,359 |
ePlus, Inc. * | 29,203 | 2,245,127 |
Fabrinet * | 17,818 | 3,083,761 |
IPG Photonics Corp. * | 27,366 | 2,298,197 |
Itron, Inc. * | 26,064 | 2,401,016 |
Kimball Electronics, Inc. * | 12,969 | 271,441 |
Knowles Corp. * | 85,491 | 1,353,323 |
Littelfuse, Inc. | 12,627 | 2,912,291 |
Lumentum Holdings, Inc. * | 51,155 | 2,238,543 |
Methode Electronics, Inc. | 61,320 | 747,491 |
NETGEAR, Inc. * | 100,386 | 1,483,705 |
NetScout Systems, Inc. * | 81,977 | 1,578,877 |
Novanta, Inc. * | 5,480 | 857,620 |
OSI Systems, Inc. * | 12,251 | 1,610,271 |
PC Connection, Inc. | 24,758 | 1,534,253 |
Plexus Corp. * | 33,737 | 3,407,774 |
Pure Storage, Inc., Class A * | 20,200 | 1,018,080 |
Rogers Corp. * | 11,475 | 1,366,558 |
ScanSource, Inc. * | 77,222 | 3,213,980 |
Super Micro Computer, Inc. * | 10,052 | 8,632,658 |
TTM Technologies, Inc. * | 207,634 | 3,099,976 |
Viasat, Inc. * | 104,920 | 1,669,277 |
Viavi Solutions, Inc. * | 166,798 | 1,317,704 |
Vontier Corp. | 85,614 | 3,478,497 |
67,266,128 | ||
SECURITY | NUMBER OF SHARES | VALUE ($) |
Telecommunication Services 0.3% | ||
ATN International, Inc. | 17,406 | 332,106 |
Cogent Communications Holdings, Inc. | 19,186 | 1,231,357 |
Consolidated Communications Holdings, Inc. * | 333,939 | 1,442,617 |
GCI Liberty, Inc. *(c) | 14,650 | 0 |
Iridium Communications, Inc. | 40,028 | 1,232,462 |
Shenandoah Telecommunications Co. | 64,325 | 824,647 |
5,063,189 | ||
Transportation 2.4% | ||
Air Transport Services Group, Inc. * | 117,931 | 1,511,875 |
Alaska Air Group, Inc. * | 38,827 | 1,670,337 |
American Airlines Group, Inc. * | 136,958 | 1,850,303 |
ArcBest Corp. | 30,476 | 3,380,093 |
Costamare, Inc. | 71,586 | 857,600 |
Covenant Logistics Group, Inc., Class A | 16,267 | 735,106 |
Danaos Corp. | 12,285 | 939,925 |
Forward Air Corp. | 36,638 | 806,769 |
Genco Shipping & Trading Ltd. | 47,065 | 1,004,367 |
Global Ship Lease, Inc., Class A | 12,169 | 276,966 |
Heartland Express, Inc. | 69,520 | 691,029 |
JetBlue Airways Corp. * | 229,896 | 1,305,809 |
Kirby Corp. * | 34,208 | 3,733,119 |
Lyft, Inc., Class A * | 96,119 | 1,503,301 |
Marten Transport Ltd. | 67,188 | 1,136,821 |
Matson, Inc. | 10,978 | 1,183,209 |
RXO, Inc. * | 166,412 | 3,146,851 |
Saia, Inc. * | 7,808 | 3,098,449 |
Schneider National, Inc., Class B | 93,945 | 1,942,783 |
SkyWest, Inc. * | 27,219 | 1,987,804 |
Star Bulk Carriers Corp. | 59,797 | 1,454,263 |
United Airlines Holdings, Inc. * | 93,547 | 4,813,929 |
XPO, Inc. * | 47,343 | 5,087,479 |
44,118,187 | ||
Utilities 3.0% | ||
ALLETE, Inc. | 53,120 | 3,145,766 |
American States Water Co. | 14,037 | 994,381 |
Atlantica Sustainable Infrastructure PLC | 88,738 | 1,736,603 |
Avangrid, Inc. | 82,360 | 3,008,611 |
Avista Corp. | 85,323 | 3,069,922 |
Black Hills Corp. | 73,560 | 4,038,444 |
California Water Service Group | 28,818 | 1,415,540 |
Chesapeake Utilities Corp. | 10,035 | 1,062,405 |
Clearway Energy, Inc., Class C | 55,093 | 1,288,074 |
Hawaiian Electric Industries, Inc. | 245,934 | 2,422,450 |
IDACORP, Inc. | 36,065 | 3,418,241 |
MGE Energy, Inc. | 19,418 | 1,520,818 |
New Jersey Resources Corp. | 68,717 | 3,002,246 |
Northwest Natural Holding Co. | 37,044 | 1,413,229 |
SECURITY | NUMBER OF SHARES | VALUE ($) |
Northwestern Energy Group, Inc. | 59,339 | 2,993,059 |
ONE Gas, Inc. | 48,759 | 3,145,931 |
Ormat Technologies, Inc. | 23,141 | 1,477,090 |
Otter Tail Corp. | 22,484 | 1,919,234 |
PNM Resources, Inc. | 78,620 | 2,913,657 |
SJW Group | 14,650 | 797,692 |
Southwest Gas Holdings, Inc. | 73,173 | 5,460,169 |
Spire, Inc. | 55,173 | 3,409,140 |
Unitil Corp. | 15,754 | 802,509 |
54,455,211 | ||
Total Common Stocks (Cost $1,504,322,269) | 1,830,760,425 | |
SHORT-TERM INVESTMENTS 0.9% OF NET ASSETS | ||
Money Market Funds 0.9% | ||
State Street Institutional U.S. Government Money Market Fund, Premier Class 5.25% (d) | 5,263,305 | 5,263,305 |
State Street Institutional U.S. Government Money Market Fund, Premier Class 5.25% (d)(e) | 10,797,191 | 10,797,191 |
16,060,496 | ||
Total Short-Term Investments (Cost $16,060,496) | 16,060,496 | |
Total Investments in Securities (Cost $1,520,382,765) | 1,846,820,921 | |
NUMBER OF CONTRACTS | NOTIONAL AMOUNT ($) | CURRENT VALUE/ UNREALIZED APPRECIATION ($) | |
FUTURES CONTRACTS | |||
Long | |||
Russell 2000 Index, e-mini, expires 06/21/24 | 68 | 6,751,040 | 2,245 |
* | Non-income producing security. |
(a) | All or a portion of this security is on loan. Securities on loan were valued at $9,821,311. |
(b) | Issuer is an affiliated company, as the investment adviser owns at least 5% of the voting securities of such company. |
(c) | Fair valued using significant unobservable inputs (see financial note 2(a), Securities for which no quoted value is available, for additional information). |
(d) | The rate shown is the annualized 7-day yield. |
(e) | Security purchased with cash collateral received for securities on loan. |
REIT — | Real Estate Investment Trust |
SECURITY | VALUE AT 10/31/23 | PURCHASES | SALES | REALIZED GAINS (LOSSES) | NET CHANGE IN UNREALIZED APPRECIATION (DEPRECIATION) | VALUE AT 4/30/24 | BALANCE OF SHARES HELD AT 4/30/24 | DIVIDENDS RECEIVED |
COMMON STOCKS 0.3% OF NET ASSETS | ||||||||
Consumer Durables & Apparel 0.0% | ||||||||
Fossil Group, Inc. | $— | $253,853 | ($454,922 ) | ($957,917 ) | $618,925 | $— | — | $— |
Tupperware Brands Corp. | — | 428,140 | (27,240 ) | (257,359 ) | (616,465 ) | 999,085 | 942,533 | — |
999,085 | ||||||||
Equity Real Estate Investment Trusts (REITs) 0.2% | ||||||||
Ashford Hospitality Trust, Inc. | — | 211,574 | (485,265 ) | (818,022 ) | 574,820 | — | — | — |
Diversified Healthcare Trust | — | 898,324 | (4,487,337 ) | 1,342,349 | 1,374 | 4,038,541 | 1,711,246 | 42,012 |
4,038,541 | ||||||||
Pharmaceuticals, Biotechnology & Life Sciences 0.1% | ||||||||
Emergent BioSolutions, Inc. | — | 1,130,615 | (32,518 ) | (496,935 ) | 212,140 | 1,316,731 | 700,389 | — |
Transportation 0.0% | ||||||||
Daseke, Inc. | — | 571,318 | (4,179,656 ) | 878,111 | 912,606 | — | — | — |
Total | $— | $3,493,824 | ($9,666,938 ) | ($309,773 ) | $1,703,400 | $6,354,357 | $42,012 | |
DESCRIPTION | QUOTED PRICES IN ACTIVE MARKETS FOR IDENTICAL ASSETS (LEVEL 1) | OTHER SIGNIFICANT OBSERVABLE INPUTS (LEVEL 2) | SIGNIFICANT UNOBSERVABLE INPUTS (LEVEL 3) | TOTAL |
Assets | ||||
Common Stocks1 | $1,601,334,030 | $— | $— | $1,601,334,030 |
Equity Real Estate Investment Trusts (REITs) | 147,727,299 | — | 0 * | 147,727,299 |
Health Care Equipment & Services | 76,635,907 | — | 0 * | 76,635,907 |
Telecommunication Services | 5,063,189 | — | 0 * | 5,063,189 |
Short-Term Investments1 | 16,060,496 | — | — | 16,060,496 |
Futures Contracts2 | 2,245 | — | — | 2,245 |
Total | $1,846,823,166 | $— | $0 * | $1,846,823,166 |
* | Level 3 amount shown includes securities determined to have no value at April 30, 2024. |
1 | As categorized in the Portfolio Holdings. |
2 | Futures contracts are reported at cumulative unrealized appreciation or depreciation. |
Assets | ||
Investments in securities, at value - affiliated issuers (cost $8,529,571) including securities on loan of $877,177 | $6,354,357 | |
Investments in securities, at value - unaffiliated issuers (cost $1,511,853,194) including securities on loan of $8,944,134 | 1,840,466,564 | |
Deposit with broker for futures contracts | 539,500 | |
Receivables: | ||
Fund shares sold | 1,301,836 | |
Dividends | 1,097,897 | |
Income from securities on loan | + | 84,296 |
Total assets | 1,849,844,450 | |
Liabilities | ||
Collateral held for securities on loan | 10,797,191 | |
Payables: | ||
Fund shares redeemed | 2,450,416 | |
Investment adviser fees | 383,648 | |
Variation margin on futures contracts | + | 145,554 |
Total liabilities | 13,776,809 | |
Net assets | $1,836,067,641 | |
Net Assets by Source | ||
Capital received from investors | $1,499,883,599 | |
Total distributable earnings | + | 336,184,042 |
Net assets | $1,836,067,641 | |
Net Asset Value (NAV) | ||||
Net Assets | ÷ | Shares Outstanding | = | NAV |
$1,836,067,641 | 114,095,181 | $16.09 | ||
For the period November 1, 2023 through April 30, 2024; unaudited | ||
Investment Income | ||
Dividends received from securities - unaffiliated issuers (net of foreign withholding tax of $5,136) | $18,684,949 | |
Dividends received from securities - affiliated issuers | 42,012 | |
Other interest | 18,771 | |
Securities on loan, net | + | 691,883 |
Total investment income | 19,437,615 | |
Expenses | ||
Investment adviser fees | 2,282,007 | |
Total expenses | – | 2,282,007 |
Net investment income | 17,155,608 | |
REALIZED AND UNREALIZED GAINS (LOSSES) | ||
Net realized losses on sales of securities - affiliated issuers | (1,205,118 ) | |
Net realized losses on sales of securities - unaffiliated issuers | (3,788,756 ) | |
Net realized gains on sales of in-kind redemptions - affiliated issuers | 895,345 | |
Net realized gains on sales of in-kind redemptions - unaffiliated issuers | 95,906,489 | |
Net realized gains on futures contracts | + | 1,323,331 |
Net realized gains | 93,131,291 | |
Net change in unrealized appreciation (depreciation) on securities - affiliated issuers | 1,703,400 | |
Net change in unrealized appreciation (depreciation) on securities - unaffiliated issuers | 169,328,550 | |
Net change in unrealized appreciation (depreciation) on futures contracts | + | 246,940 |
Net change in unrealized appreciation (depreciation) | + | 171,278,890 |
Net realized and unrealized gains | 264,410,181 | |
Increase in net assets resulting from operations | $281,565,789 | |
OPERATIONS | |||
11/1/23-4/30/24 | 11/1/22-10/31/23 | ||
Net investment income | $17,155,608 | $25,716,416 | |
Net realized gains | 93,131,291 | 108,225,267 | |
Net change in unrealized appreciation (depreciation) | + | 171,278,890 | (184,006,297 ) |
Increase (decrease) in net assets resulting from operations | $281,565,789 | ($50,064,614 ) | |
DISTRIBUTIONS TO SHAREHOLDERS | |||
Total distributions | ($25,436,316 ) | ($105,778,873 ) | |
TRANSACTIONS IN FUND SHARES | |||||
11/1/23-4/30/24 | 11/1/22-10/31/23 | ||||
SHARES | VALUE | SHARES | VALUE | ||
Shares sold | 25,913,027 | $417,299,692 | 35,632,360 | $523,918,723 | |
Shares reinvested | 1,165,225 | 17,979,415 | 5,548,590 | 78,789,982 | |
Shares redeemed | + | (23,364,542 ) | (379,125,743 ) | (37,952,579 ) | (554,276,467 ) |
Net transactions in fund shares | 3,713,710 | $56,153,364 | 3,228,371 | $48,432,238 | |
SHARES OUTSTANDING AND NET ASSETS | |||||
11/1/23-4/30/24 | 11/1/22-10/31/23 | ||||
SHARES | NET ASSETS | SHARES | NET ASSETS | ||
Beginning of period | 110,381,471 | $1,523,784,804 | 107,153,100 | $1,631,196,053 | |
Total increase (decrease) | + | 3,713,710 | 312,282,837 | 3,228,371 | (107,411,249 ) |
End of period | 114,095,181 | $1,836,067,641 | 110,381,471 | $1,523,784,804 | |
11/1/23– 4/30/24* | 11/1/22– 10/31/23 | 11/1/21– 10/31/22 | 11/1/20– 10/31/21 | 11/1/19– 10/31/20 | 11/1/18– 10/31/19 | |
Per-Share Data | ||||||
Net asset value at beginning of period | $9.59 | $8.41 | $10.56 | $7.51 | $8.98 | $8.69 |
Income (loss) from investment operations: | ||||||
Net investment income (loss)1 | 0.17 | 0.33 | 0.34 | 0.31 | 0.21 | 0.30 |
Net realized and unrealized gains (losses) | 1.37 | 1.11 | (2.10 ) | 2.96 | (1.35 ) | 0.27 |
Total from investment operations | 1.54 | 1.44 | (1.76 ) | 3.27 | (1.14 ) | 0.57 |
Less distributions: | ||||||
Distributions from net investment income | (0.34 ) | (0.26 ) | (0.39 ) | (0.22 ) | (0.33 ) | (0.28 ) |
Net asset value at end of period | $10.79 | $9.59 | $8.41 | $10.56 | $7.51 | $8.98 |
Total return | 16.29 %2 | 17.40 % | (17.25 %) | 44.03 % | (13.29 %) | 7.04 % |
Ratios/Supplemental Data | ||||||
Ratios to average net assets: | ||||||
Total expenses | 0.25 %3 | 0.25 %4 | 0.25 %4 | 0.25 % | 0.25 % | 0.25 % |
Net investment income (loss) | 3.24 %3 | 3.40 % | 3.56 % | 3.10 % | 2.60 % | 3.51 % |
Portfolio turnover rate | 6 %2 | 15 % | 13 % | 21 % | 14 % | 28 % |
Net assets, end of period (x 1,000,000) | $2,572 | $2,085 | $1,565 | $1,406 | $966 | $1,327 |
* | Unaudited. |
1 | Calculated based on the average shares outstanding during the period. |
2 | Not annualized. |
3 | Annualized. |
4 | Ratio includes less than 0.005% of non-routine proxy expenses. |
SECURITY | NUMBER OF SHARES | VALUE ($) |
COMMON STOCKS 98.1% OF NET ASSETS | ||
Australia 4.9% | ||
AGL Energy Ltd. | 278,152 | 1,694,104 |
Amcor PLC | 197,166 | 1,753,090 |
Ampol Ltd. | 69,373 | 1,638,160 |
ANZ Group Holdings Ltd. | 430,328 | 7,764,806 |
APA Group | 155,806 | 831,456 |
Aristocrat Leisure Ltd. | 32,531 | 830,191 |
Aurizon Holdings Ltd. | 450,371 | 1,106,224 |
BHP Group Ltd. | 694,199 | 19,039,179 |
BlueScope Steel Ltd. | 136,631 | 1,994,186 |
Brambles Ltd. | 171,762 | 1,615,877 |
Coles Group Ltd. | 185,277 | 1,932,294 |
Commonwealth Bank of Australia | 145,136 | 10,634,047 |
Computershare Ltd. | 37,244 | 654,316 |
CSL Ltd. | 16,476 | 2,927,391 |
Downer EDI Ltd. | 307,622 | 923,498 |
Endeavour Group Ltd. | 223,521 | 768,667 |
Fortescue Ltd. | 252,778 | 4,189,655 |
Goodman Group | 44,443 | 897,732 |
Incitec Pivot Ltd. | 361,976 | 649,960 |
Insurance Australia Group Ltd. | 258,775 | 1,072,099 |
James Hardie Industries PLC * | 20,124 | 691,822 |
JB Hi-Fi Ltd. | 23,779 | 927,906 |
Lendlease Corp. Ltd. | 248,045 | 1,022,949 |
Macquarie Group Ltd. | 27,103 | 3,245,273 |
Medibank Pvt Ltd. | 398,975 | 914,394 |
Metcash Ltd. | 317,570 | 805,321 |
Mineral Resources Ltd. | 13,931 | 631,942 |
Mirvac Group | 494,020 | 647,299 |
National Australia Bank Ltd. | 360,110 | 7,806,292 |
Northern Star Resources Ltd. | 54,652 | 518,032 |
Orica Ltd. | 61,398 | 710,911 |
Origin Energy Ltd. | 224,132 | 1,414,590 |
QBE Insurance Group Ltd. | 120,438 | 1,377,686 |
Ramsay Health Care Ltd. | 22,289 | 747,132 |
Rio Tinto Ltd. | 83,331 | 6,935,167 |
Santos Ltd. | 281,271 | 1,380,299 |
Scentre Group | 584,652 | 1,183,949 |
Sims Ltd. | 56,368 | 432,020 |
Sonic Healthcare Ltd. | 61,571 | 1,058,139 |
South32 Ltd. | 899,295 | 2,051,724 |
Stockland | 307,677 | 871,685 |
Suncorp Group Ltd. | 207,854 | 2,219,967 |
Telstra Group Ltd. | 812,429 | 1,919,455 |
Transurban Group | 149,309 | 1,198,721 |
Treasury Wine Estates Ltd. | 81,520 | 632,204 |
Viva Energy Group Ltd. | 268,053 | 586,900 |
Wesfarmers Ltd. | 123,608 | 5,295,271 |
Westpac Banking Corp. | 528,910 | 8,783,261 |
Whitehaven Coal Ltd. | 98,471 | 487,085 |
Woodside Energy Group Ltd. | 131,469 | 2,355,531 |
Woolworths Group Ltd. | 119,432 | 2,450,400 |
Worley Ltd. | 56,537 | 545,763 |
124,766,022 | ||
SECURITY | NUMBER OF SHARES | VALUE ($) |
Austria 0.3% | ||
BAWAG Group AG | 14,592 | 871,300 |
Erste Group Bank AG | 50,022 | 2,332,780 |
OMV AG | 48,862 | 2,318,571 |
Raiffeisen Bank International AG | 49,022 | 905,380 |
voestalpine AG | 51,769 | 1,382,495 |
Wienerberger AG | 23,944 | 855,646 |
8,666,172 | ||
Belgium 0.7% | ||
Ageas SA | 42,044 | 1,929,885 |
Anheuser-Busch InBev SA | 111,457 | 6,662,206 |
Colruyt Group NV | 15,531 | 719,673 |
Groupe Bruxelles Lambert NV | 22,826 | 1,694,374 |
KBC Group NV | 35,124 | 2,609,157 |
Proximus SADP | 100,292 | 740,124 |
Syensqo SA * | 12,155 | 1,126,667 |
UCB SA | 12,372 | 1,640,652 |
Umicore SA | 63,720 | 1,411,412 |
18,534,150 | ||
Canada 7.4% | ||
Agnico Eagle Mines Ltd. | 31,638 | 2,003,560 |
Algonquin Power & Utilities Corp. (a) | 104,531 | 638,583 |
Alimentation Couche-Tard, Inc. | 110,797 | 6,140,857 |
AltaGas Ltd. | 38,077 | 834,754 |
ARC Resources Ltd. | 48,109 | 871,214 |
Atco Ltd., Class I | 23,369 | 637,761 |
B2Gold Corp. | 196,901 | 497,741 |
Bank of Montreal | 67,033 | 5,987,759 |
Bank of Nova Scotia | 189,584 | 8,698,017 |
Barrick Gold Corp. | 243,338 | 4,044,291 |
Bausch Health Cos., Inc. * | 104,986 | 918,956 |
BCE, Inc. | 54,052 | 1,775,885 |
Brookfield Asset Management Ltd., Class A | 1 | 38 |
Brookfield Corp. | 48,607 | 1,949,717 |
Brookfield Infrastructure Corp., Class A | 15,208 | 463,316 |
Canadian Imperial Bank of Commerce | 121,781 | 5,684,558 |
Canadian National Railway Co. | 41,164 | 4,996,254 |
Canadian Natural Resources Ltd. | 117,627 | 8,913,557 |
Canadian Pacific Kansas City Ltd. | 35,545 | 2,788,552 |
Canadian Tire Corp. Ltd., Class A | 13,387 | 1,293,239 |
Cenovus Energy, Inc. | 118,359 | 2,431,404 |
CGI, Inc. * | 19,848 | 2,011,112 |
CI Financial Corp. | 67,472 | 796,931 |
Constellation Software, Inc. | 297 | 764,647 |
Crescent Point Energy Corp. | 96,968 | 855,113 |
Dollarama, Inc. | 11,862 | 989,527 |
Emera, Inc. | 37,610 | 1,268,465 |
Enbridge, Inc. | 278,722 | 9,910,611 |
Fairfax Financial Holdings Ltd. | 2,373 | 2,579,953 |
Finning International, Inc. | 29,588 | 928,272 |
First Quantum Minerals Ltd. | 86,650 | 1,100,238 |
Fortis, Inc. | 61,221 | 2,404,102 |
SECURITY | NUMBER OF SHARES | VALUE ($) |
Franco-Nevada Corp. | 4,476 | 538,817 |
George Weston Ltd. | 15,310 | 2,014,828 |
Gildan Activewear, Inc. | 25,256 | 875,470 |
Great-West Lifeco, Inc. | 28,105 | 831,115 |
Hydro One Ltd. | 30,243 | 847,107 |
iA Financial Corp., Inc. | 10,640 | 645,055 |
Imperial Oil Ltd. | 30,556 | 2,100,843 |
Intact Financial Corp. | 9,360 | 1,538,436 |
Interfor Corp. * | 27,670 | 351,139 |
Keyera Corp. | 31,972 | 820,289 |
Kinross Gold Corp. | 249,273 | 1,607,921 |
Linamar Corp. | 15,137 | 712,840 |
Loblaw Cos. Ltd. | 25,780 | 2,826,970 |
Lundin Mining Corp. | 103,072 | 1,176,982 |
Magna International, Inc. | 101,972 | 4,873,975 |
Manulife Financial Corp. | 242,366 | 5,653,123 |
MEG Energy Corp. * | 27,902 | 634,592 |
Methanex Corp. | 14,459 | 692,360 |
Metro, Inc. | 35,040 | 1,792,407 |
National Bank of Canada | 28,816 | 2,313,820 |
Northland Power, Inc. | 29,867 | 455,821 |
Nutrien Ltd. | 99,737 | 5,259,077 |
Onex Corp. | 33,739 | 2,393,701 |
Open Text Corp. | 22,999 | 812,103 |
Parkland Corp. | 28,050 | 864,127 |
Pembina Pipeline Corp. | 58,863 | 2,071,205 |
Power Corp. of Canada | 76,983 | 2,051,165 |
Restaurant Brands International, Inc. | 16,733 | 1,269,455 |
RioCan Real Estate Investment Trust | 37,109 | 470,113 |
Royal Bank of Canada | 128,692 | 12,450,868 |
Russel Metals, Inc. | 16,594 | 467,330 |
Saputo, Inc. | 45,507 | 875,001 |
SNC-Lavalin Group, Inc. | 22,697 | 871,509 |
Stelco Holdings, Inc. | 12,562 | 364,181 |
Sun Life Financial, Inc. | 54,357 | 2,775,399 |
Suncor Energy, Inc. | 290,834 | 11,097,599 |
TC Energy Corp. | 132,763 | 4,756,381 |
Teck Resources Ltd., Class B | 63,600 | 3,127,218 |
TELUS Corp. | 59,467 | 955,083 |
TFI International, Inc. | 6,338 | 825,393 |
Thomson Reuters Corp. | 7,987 | 1,206,361 |
Toromont Industries Ltd. | 5,970 | 546,413 |
Toronto-Dominion Bank | 179,318 | 10,638,071 |
Tourmaline Oil Corp. | 17,802 | 870,024 |
Vermilion Energy, Inc. | 42,564 | 490,368 |
Waste Connections, Inc. | 10,459 | 1,695,746 |
West Fraser Timber Co. Ltd. | 25,331 | 1,940,145 |
Wheaton Precious Metals Corp. | 13,637 | 710,453 |
WSP Global, Inc. | 7,014 | 1,064,290 |
191,401,673 | ||
Denmark 0.9% | ||
AP Moller - Maersk AS, Class A | 1,253 | 1,776,990 |
AP Moller - Maersk AS, Class B | 2,199 | 3,186,501 |
Carlsberg AS, Class B | 9,212 | 1,239,132 |
Coloplast AS, Class B | 6,248 | 753,291 |
Danske Bank AS | 76,680 | 2,207,386 |
DSV AS | 12,987 | 1,845,055 |
Novo Nordisk AS, Class B | 60,034 | 7,698,892 |
Orsted AS * | 20,147 | 1,107,245 |
Pandora AS | 7,821 | 1,190,355 |
Svitzer AS * | 6,904 | 231,997 |
Vestas Wind Systems AS * | 71,742 | 1,922,588 |
23,159,432 | ||
SECURITY | NUMBER OF SHARES | VALUE ($) |
Finland 1.0% | ||
Elisa OYJ | 15,687 | 707,317 |
Fortum OYJ | 102,265 | 1,347,586 |
Huhtamaki OYJ | 15,359 | 589,425 |
Kesko OYJ, B Shares | 60,286 | 1,029,225 |
Kone OYJ, B Shares | 31,054 | 1,513,789 |
Neste OYJ | 58,577 | 1,327,889 |
Nokia OYJ | 981,175 | 3,566,916 |
Nordea Bank Abp | 459,462 | 5,384,094 |
Outokumpu OYJ | 170,529 | 689,586 |
Sampo OYJ, A Shares | 56,650 | 2,299,051 |
Stora Enso OYJ, R Shares | 145,385 | 1,936,619 |
UPM-Kymmene OYJ | 94,066 | 3,296,554 |
Valmet OYJ | 19,907 | 496,700 |
Wartsila OYJ Abp | 57,287 | 1,056,801 |
25,241,552 | ||
France 8.5% | ||
Accor SA | 15,766 | 690,956 |
Air Liquide SA | 36,796 | 7,196,512 |
Airbus SE | 23,762 | 3,910,221 |
ALD SA | 83,752 | 550,796 |
Alstom SA | 59,419 | 936,923 |
Arkema SA | 16,922 | 1,746,126 |
Atos SE *(a) | 156,170 | 334,099 |
AXA SA | 244,900 | 8,461,681 |
BNP Paribas SA | 218,043 | 15,690,780 |
Bollore SE | 135,013 | 876,335 |
Bouygues SA | 75,930 | 2,798,422 |
Bureau Veritas SA | 22,244 | 648,760 |
Capgemini SE | 12,654 | 2,659,630 |
Carrefour SA | 257,231 | 4,327,455 |
Cie de Saint-Gobain SA | 100,487 | 7,946,777 |
Cie Generale des Etablissements Michelin SCA | 156,005 | 5,993,501 |
Credit Agricole SA | 217,497 | 3,365,382 |
Danone SA | 83,793 | 5,244,381 |
Dassault Systemes SE | 15,409 | 604,833 |
Edenred SE | 9,092 | 431,432 |
Eiffage SA | 18,374 | 1,960,477 |
Elis SA | 38,114 | 855,712 |
Engie SA * | 384,649 | 6,677,741 |
EssilorLuxottica SA | 16,251 | 3,465,227 |
Eurazeo SE * | 10,347 | 932,033 |
Eurofins Scientific SE | 10,924 | 669,518 |
Forvia SE * | 76,368 | 1,215,370 |
Hermes International SCA | 486 | 1,163,479 |
Kering SA | 6,469 | 2,267,185 |
Klepierre SA | 24,843 | 667,094 |
Legrand SA | 18,388 | 1,889,672 |
L'Oreal SA | 11,907 | 5,582,634 |
LVMH Moet Hennessy Louis Vuitton SE | 9,612 | 7,895,643 |
Orange SA | 698,908 | 7,779,044 |
Pernod Ricard SA | 12,474 | 1,886,594 |
Publicis Groupe SA | 25,531 | 2,817,264 |
Renault SA | 102,928 | 5,098,367 |
Rexel SA | 62,887 | 1,630,021 |
Rubis SCA | 34,581 | 1,196,719 |
Safran SA | 17,565 | 3,808,656 |
Sanofi SA | 132,665 | 13,106,381 |
Schneider Electric SE | 35,813 | 8,165,843 |
SCOR SE | 34,990 | 1,141,645 |
SES SA, Class A | 131,998 | 640,386 |
Societe Generale SA | 269,483 | 7,261,233 |
Sodexo SA | 9,992 | 870,038 |
STMicroelectronics NV | 42,050 | 1,664,544 |
SECURITY | NUMBER OF SHARES | VALUE ($) |
Teleperformance SE * | 7,803 | 706,833 |
Thales SA | 7,155 | 1,202,522 |
TotalEnergies SE | 503,200 | 36,531,695 |
Unibail-Rodamco-Westfield * | 11,697 | 974,746 |
Valeo SE | 127,925 | 1,621,258 |
Veolia Environnement SA | 104,514 | 3,249,099 |
Vinci SA | 58,691 | 6,877,183 |
Vivendi SE | 87,310 | 888,265 |
Wendel SE | 7,966 | 812,339 |
219,587,462 | ||
Germany 7.4% | ||
adidas AG | 20,896 | 5,035,583 |
Allianz SE | 54,594 | 15,492,960 |
Aurubis AG | 19,208 | 1,529,989 |
BASF SE | 298,211 | 15,625,228 |
Bayer AG | 178,586 | 5,209,476 |
Bayerische Motoren Werke AG | 89,536 | 9,754,884 |
Beiersdorf AG | 5,415 | 813,894 |
Brenntag SE | 23,299 | 1,859,339 |
Commerzbank AG | 94,431 | 1,403,447 |
Continental AG | 39,766 | 2,577,286 |
Covestro AG * | 67,860 | 3,398,723 |
Daimler Truck Holding AG | 69,994 | 3,156,465 |
Deutsche Bank AG | 275,594 | 4,401,929 |
Deutsche Boerse AG | 7,590 | 1,463,291 |
Deutsche Lufthansa AG * | 109,282 | 782,091 |
Deutsche Post AG | 191,604 | 8,022,446 |
Deutsche Telekom AG | 707,056 | 16,195,516 |
E.ON SE | 382,005 | 5,058,498 |
Evonik Industries AG | 64,053 | 1,334,907 |
Freenet AG | 29,307 | 814,687 |
Fresenius Medical Care AG | 62,410 | 2,627,630 |
Fresenius SE & Co. KGaA | 158,608 | 4,732,922 |
GEA Group AG * | 20,818 | 840,214 |
Hannover Rueck SE | 5,190 | 1,287,348 |
Heidelberg Materials AG | 37,108 | 3,734,388 |
Henkel AG & Co. KGaA | 17,507 | 1,258,903 |
Infineon Technologies AG | 69,527 | 2,412,798 |
K&S AG | 60,801 | 909,579 |
KION Group AG | 24,621 | 1,134,730 |
Kloeckner & Co. SE | 62,174 | 440,670 |
Knorr-Bremse AG | 9,463 | 702,207 |
Lanxess AG | 38,167 | 1,078,715 |
Mercedes-Benz Group AG | 209,246 | 15,827,553 |
Merck KGaA | 8,444 | 1,341,766 |
METRO AG | 93,493 | 500,161 |
MTU Aero Engines AG | 3,633 | 875,251 |
Muenchener Rueckversicherungs-Gesellschaft AG in Muenchen | 11,290 | 4,965,439 |
ProSiebenSat.1 Media SE | 83,520 | 648,688 |
Puma SE | 10,863 | 501,555 |
Rheinmetall AG | 3,064 | 1,688,401 |
RWE AG | 57,917 | 2,017,570 |
Salzgitter AG | 20,911 | 537,017 |
SAP SE | 60,543 | 10,932,076 |
Siemens AG | 67,477 | 12,640,702 |
Siemens Energy AG * | 118,845 | 2,440,298 |
Siemens Healthineers AG | 16,770 | 930,022 |
Symrise AG, Class A | 7,758 | 831,593 |
thyssenkrupp AG | 312,603 | 1,568,855 |
United Internet AG | 40,714 | 984,825 |
Volkswagen AG | 16,169 | 2,282,627 |
Vonovia SE | 85,887 | 2,481,793 |
SECURITY | NUMBER OF SHARES | VALUE ($) |
Zalando SE * | 25,310 | 662,243 |
189,749,178 | ||
Hong Kong 1.6% | ||
AIA Group Ltd. | 775,800 | 5,682,233 |
BOC Hong Kong Holdings Ltd. | 532,500 | 1,632,162 |
CK Asset Holdings Ltd. | 377,500 | 1,610,255 |
CK Hutchison Holdings Ltd. | 1,097,088 | 5,328,307 |
CLP Holdings Ltd. | 277,000 | 2,178,899 |
Galaxy Entertainment Group Ltd. | 122,000 | 547,401 |
Hang Seng Bank Ltd. | 100,300 | 1,322,613 |
Hong Kong & China Gas Co. Ltd. | 1,299,676 | 988,211 |
Hong Kong Exchanges & Clearing Ltd. | 28,906 | 918,471 |
Hongkong Land Holdings Ltd. | 192,111 | 613,829 |
Jardine Matheson Holdings Ltd. | 94,846 | 3,639,241 |
Lenovo Group Ltd. | 1,806,000 | 2,031,316 |
Link REIT | 171,400 | 734,413 |
MTR Corp. Ltd. | 174,147 | 572,323 |
New World Development Co. Ltd. | 753,422 | 800,097 |
Orient Overseas International Ltd. | 48,000 | 700,081 |
Pacific Basin Shipping Ltd. | 1,582,000 | 547,780 |
PCCW Ltd. | 1,145,000 | 572,493 |
SITC International Holdings Co. Ltd. | 243,000 | 526,968 |
Sun Hung Kai Properties Ltd. | 263,064 | 2,426,754 |
Swire Pacific Ltd., A Shares | 162,800 | 1,378,706 |
Techtronic Industries Co. Ltd. | 102,206 | 1,412,414 |
WH Group Ltd. | 4,424,999 | 3,216,266 |
Wharf Real Estate Investment Co. Ltd. | 177,000 | 549,145 |
Xinyi Glass Holdings Ltd. | 474,894 | 507,475 |
40,437,853 | ||
Ireland 0.1% | ||
Bank of Ireland Group PLC | 81,343 | 867,884 |
Glanbia PLC | 30,242 | 575,773 |
Kerry Group PLC, Class A | 13,998 | 1,204,645 |
Kingspan Group PLC | 10,244 | 911,179 |
3,559,481 | ||
Israel 0.2% | ||
Bank Hapoalim BM | 134,052 | 1,207,598 |
Bank Leumi Le-Israel BM | 194,845 | 1,518,254 |
ICL Group Ltd. | 143,688 | 674,467 |
Israel Corp. Ltd. | 1,582 | 377,003 |
Israel Discount Bank Ltd., A Shares | 127,369 | 653,304 |
Oil Refineries Ltd. | 1,031,113 | 298,747 |
Teva Pharmaceutical Industries Ltd. * | 84,365 | 1,179,850 |
5,909,223 | ||
Italy 3.0% | ||
A2A SpA | 388,904 | 766,978 |
Assicurazioni Generali SpA | 218,952 | 5,338,584 |
Banco BPM SpA | 209,009 | 1,372,278 |
BPER Banca SpA | 162,481 | 843,796 |
Enel SpA | 1,742,658 | 11,453,517 |
Eni SpA | 675,047 | 10,842,394 |
Ferrari NV | 2,585 | 1,063,145 |
Hera SpA | 195,202 | 704,773 |
Intesa Sanpaolo SpA | 2,726,245 | 10,204,349 |
Iveco Group NV | 65,831 | 825,437 |
Leonardo SpA | 69,274 | 1,592,058 |
Mediobanca Banca di Credito Finanziario SpA | 67,280 | 955,921 |
Moncler SpA | 7,701 | 524,301 |
Pirelli & C SpA | 103,589 | 654,988 |
SECURITY | NUMBER OF SHARES | VALUE ($) |
Poste Italiane SpA | 64,491 | 819,237 |
Prysmian SpA | 28,239 | 1,532,201 |
Snam SpA | 235,198 | 1,076,095 |
Stellantis NV | 581,733 | 12,871,713 |
Telecom Italia SpA *(a) | 8,075,052 | 1,914,396 |
Tenaris SA | 48,633 | 807,658 |
Terna - Rete Elettrica Nazionale | 111,544 | 893,681 |
UniCredit SpA | 238,546 | 8,755,680 |
Unipol Gruppo SpA | 112,827 | 1,011,460 |
76,824,640 | ||
Japan 26.5% | ||
Advantest Corp. | 26,100 | 816,947 |
Aeon Co. Ltd. | 143,100 | 2,991,977 |
AGC, Inc. | 64,700 | 2,392,232 |
Air Water, Inc. | 57,200 | 858,870 |
Aisin Corp. | 88,400 | 3,362,403 |
Ajinomoto Co., Inc. | 41,100 | 1,528,158 |
Alfresa Holdings Corp. | 103,900 | 1,539,744 |
Alps Alpine Co. Ltd. | 131,900 | 1,190,630 |
Amada Co. Ltd. | 68,200 | 744,885 |
Asahi Group Holdings Ltd. | 80,500 | 2,753,821 |
Asahi Kasei Corp. | 499,800 | 3,484,671 |
Astellas Pharma, Inc. | 242,800 | 2,330,369 |
Bandai Namco Holdings, Inc. | 68,800 | 1,285,540 |
Bridgestone Corp. | 136,876 | 6,039,925 |
Brother Industries Ltd. | 79,200 | 1,400,966 |
Canon, Inc. | 201,500 | 5,453,656 |
Central Japan Railway Co. | 139,000 | 3,178,649 |
Chubu Electric Power Co., Inc. | 258,585 | 3,319,186 |
Chugai Pharmaceutical Co. Ltd. | 37,000 | 1,176,742 |
Chugoku Electric Power Co., Inc. | 122,600 | 841,674 |
Coca-Cola Bottlers Japan Holdings, Inc. | 68,100 | 953,437 |
COMSYS Holdings Corp. | 32,800 | 767,767 |
Cosmo Energy Holdings Co. Ltd. | 41,500 | 1,983,927 |
Dai Nippon Printing Co. Ltd. | 63,400 | 1,846,595 |
Daicel Corp. | 69,300 | 643,665 |
Daido Steel Co. Ltd. | 64,200 | 707,902 |
Daifuku Co. Ltd. | 32,870 | 673,303 |
Dai-ichi Life Holdings, Inc. | 173,500 | 4,018,439 |
Daiichi Sankyo Co. Ltd. | 67,460 | 2,270,547 |
Daikin Industries Ltd. | 25,600 | 3,494,177 |
Daito Trust Construction Co. Ltd. | 16,700 | 1,790,145 |
Daiwa House Industry Co. Ltd. | 192,181 | 5,407,762 |
Daiwa Securities Group, Inc. | 179,600 | 1,319,891 |
Daiwabo Holdings Co. Ltd. | 37,470 | 650,856 |
Denka Co. Ltd. | 38,500 | 570,474 |
Denso Corp. | 327,800 | 5,586,734 |
Dentsu Group, Inc. | 34,601 | 936,067 |
DIC Corp. | 45,200 | 844,769 |
Disco Corp. | 2,900 | 826,053 |
Dowa Holdings Co. Ltd. | 18,370 | 687,901 |
East Japan Railway Co. | 193,054 | 3,538,479 |
Ebara Corp. | 14,200 | 1,170,563 |
EDION Corp. | 57,900 | 598,153 |
Eisai Co. Ltd. | 28,100 | 1,154,040 |
Electric Power Development Co. Ltd. | 80,200 | 1,362,356 |
ENEOS Holdings, Inc. | 2,012,550 | 9,298,406 |
EXEO Group, Inc. | 66,402 | 723,731 |
FANUC Corp. | 86,000 | 2,547,258 |
Fast Retailing Co. Ltd. | 7,100 | 1,856,430 |
Fuji Electric Co. Ltd. | 22,000 | 1,368,486 |
FUJIFILM Holdings Corp. | 169,600 | 3,607,812 |
Fujikura Ltd. | 77,900 | 1,338,658 |
Fujitsu Ltd. | 355,600 | 5,493,359 |
Furukawa Electric Co. Ltd. | 40,000 | 856,435 |
Hakuhodo DY Holdings, Inc. | 78,400 | 729,221 |
SECURITY | NUMBER OF SHARES | VALUE ($) |
Hankyu Hanshin Holdings, Inc. | 30,700 | 804,900 |
Hanwa Co. Ltd. | 23,900 | 919,586 |
Haseko Corp. | 86,900 | 1,049,861 |
Hino Motors Ltd. * | 240,865 | 703,126 |
Hitachi Construction Machinery Co. Ltd. | 27,050 | 772,610 |
Hitachi Ltd. | 151,100 | 13,940,587 |
Honda Motor Co. Ltd. | 1,754,000 | 19,956,270 |
Hoya Corp. | 17,550 | 2,034,744 |
Idemitsu Kosan Co. Ltd. | 719,245 | 4,872,969 |
IHI Corp. | 42,200 | 1,010,443 |
Iida Group Holdings Co. Ltd. | 65,800 | 839,997 |
INFRONEER Holdings, Inc. | 54,200 | 479,978 |
Inpex Corp. | 209,100 | 3,132,276 |
Isetan Mitsukoshi Holdings Ltd. | 71,000 | 997,206 |
Isuzu Motors Ltd. | 157,800 | 1,999,775 |
ITOCHU Corp. | 227,000 | 10,241,044 |
Iwatani Corp. | 15,051 | 854,633 |
Japan Exchange Group, Inc. | 28,500 | 667,485 |
Japan Post Bank Co. Ltd. | 71,600 | 726,762 |
Japan Post Holdings Co. Ltd. | 541,400 | 5,199,225 |
Japan Post Insurance Co. Ltd. | 59,800 | 1,122,690 |
Japan Tobacco, Inc. | 177,800 | 4,783,107 |
JFE Holdings, Inc. | 248,100 | 3,703,070 |
JGC Holdings Corp. | 55,100 | 531,118 |
JSR Corp. * | 4,400 | 120,703 |
JTEKT Corp. | 122,300 | 946,699 |
Kajima Corp. | 118,400 | 2,268,199 |
Kaneka Corp. | 34,000 | 880,669 |
Kansai Electric Power Co., Inc. | 227,100 | 3,401,826 |
Kao Corp. | 80,447 | 3,318,616 |
Kawasaki Heavy Industries Ltd. | 43,600 | 1,349,771 |
Kawasaki Kisen Kaisha Ltd. | 75,000 | 1,056,741 |
KDDI Corp. | 311,500 | 8,643,744 |
Kewpie Corp. | 35,300 | 711,752 |
Keyence Corp. | 4,892 | 2,151,353 |
Kikkoman Corp. | 73,500 | 875,782 |
Kinden Corp. | 39,600 | 755,612 |
Kintetsu Group Holdings Co. Ltd. | 21,000 | 539,880 |
Kirin Holdings Co. Ltd. | 155,400 | 2,268,466 |
Kobe Steel Ltd. | 139,200 | 1,699,011 |
Koito Manufacturing Co. Ltd. | 71,400 | 960,382 |
Komatsu Ltd. | 179,000 | 5,344,250 |
Konica Minolta, Inc. | 335,100 | 1,114,252 |
K's Holdings Corp. | 93,100 | 893,688 |
Kubota Corp. | 191,200 | 3,066,795 |
Kuraray Co. Ltd. | 109,100 | 1,208,731 |
Kurita Water Industries Ltd. | 15,153 | 600,121 |
Kyocera Corp. | 212,900 | 2,594,961 |
Kyushu Electric Power Co., Inc. | 266,500 | 2,472,289 |
Kyushu Railway Co. | 29,400 | 632,568 |
Lixil Corp. | 120,700 | 1,296,405 |
LY Corp. | 307,500 | 738,809 |
Makita Corp. | 44,390 | 1,285,129 |
Marubeni Corp. | 291,600 | 5,195,247 |
MatsukiyoCocokara & Co. | 47,500 | 673,585 |
Mazda Motor Corp. | 302,700 | 3,426,405 |
Medipal Holdings Corp. | 81,272 | 1,274,592 |
MEIJI Holdings Co. Ltd. | 77,600 | 1,736,250 |
Minebea Mitsumi, Inc. | 80,400 | 1,505,919 |
MISUMI Group, Inc. | 40,900 | 664,946 |
Mitsubishi Chemical Group Corp. | 562,200 | 3,279,800 |
Mitsubishi Corp. | 670,500 | 15,334,045 |
Mitsubishi Electric Corp. | 508,200 | 8,857,889 |
Mitsubishi Estate Co. Ltd. | 179,200 | 3,283,787 |
Mitsubishi Gas Chemical Co., Inc. | 61,987 | 1,096,811 |
Mitsubishi Heavy Industries Ltd. | 595,000 | 5,319,961 |
Mitsubishi Materials Corp. | 77,500 | 1,514,549 |
Mitsubishi Motors Corp. | 212,800 | 674,329 |
SECURITY | NUMBER OF SHARES | VALUE ($) |
Mitsubishi UFJ Financial Group, Inc. | 1,251,334 | 12,464,977 |
Mitsui & Co. Ltd. | 243,100 | 11,735,818 |
Mitsui Chemicals, Inc. | 59,500 | 1,693,542 |
Mitsui Fudosan Co. Ltd. | 394,600 | 4,015,869 |
Mitsui Mining & Smelting Co. Ltd. | 25,400 | 796,465 |
Mitsui OSK Lines Ltd. | 60,800 | 1,929,767 |
Mizuho Financial Group, Inc. | 336,521 | 6,504,651 |
Morinaga Milk Industry Co. Ltd. | 28,768 | 563,720 |
MS&AD Insurance Group Holdings, Inc. | 232,770 | 4,184,980 |
Murata Manufacturing Co. Ltd. | 204,800 | 3,742,138 |
Nagase & Co. Ltd. | 48,300 | 835,606 |
Nagoya Railroad Co. Ltd. | 39,900 | 520,442 |
NEC Corp. | 60,500 | 4,380,320 |
NGK Insulators Ltd. | 72,700 | 990,340 |
NH Foods Ltd. | 46,800 | 1,539,542 |
NHK Spring Co. Ltd. | 69,400 | 703,358 |
Nichirei Corp. | 26,600 | 665,973 |
NIDEC Corp. | 51,400 | 2,407,208 |
Nikon Corp. | 79,400 | 820,942 |
Nintendo Co. Ltd. | 90,200 | 4,398,961 |
NIPPON EXPRESS HOLDINGS, Inc. | 7,000 | 358,108 |
Nippon Paint Holdings Co. Ltd. | 67,700 | 433,349 |
Nippon Paper Industries Co. Ltd. | 90,600 | 629,903 |
Nippon Sanso Holdings Corp. | 17,600 | 522,762 |
Nippon Steel Corp. | 264,500 | 5,929,802 |
Nippon Telegraph & Telephone Corp. | 6,536,325 | 7,057,022 |
Nippon Yusen KK | 109,200 | 3,100,239 |
Nissan Chemical Corp. | 13,764 | 469,190 |
Nissan Motor Co. Ltd. | 1,163,500 | 4,258,065 |
Nisshin Seifun Group, Inc. | 68,830 | 897,879 |
Nissin Foods Holdings Co. Ltd. | 19,700 | 525,705 |
Nissui Corp. | 115,457 | 692,769 |
Niterra Co. Ltd. | 41,600 | 1,364,389 |
Nitori Holdings Co. Ltd. | 8,700 | 1,164,348 |
Nitto Denko Corp. | 26,800 | 2,215,975 |
NOK Corp. | 50,800 | 735,179 |
Nomura Holdings, Inc. | 427,500 | 2,432,467 |
Nomura Research Institute Ltd. | 31,000 | 750,134 |
NSK Ltd. | 194,100 | 1,067,430 |
NTT Data Group Corp. | 108,000 | 1,688,884 |
Obayashi Corp. | 235,502 | 2,628,388 |
Oji Holdings Corp. | 437,500 | 1,713,694 |
Olympus Corp. | 94,700 | 1,319,144 |
Omron Corp. | 32,383 | 1,111,461 |
Ono Pharmaceutical Co. Ltd. | 49,400 | 711,526 |
ORIX Corp. | 169,800 | 3,475,027 |
Osaka Gas Co. Ltd. | 122,000 | 2,712,776 |
Otsuka Corp. | 36,800 | 731,883 |
Otsuka Holdings Co. Ltd. | 67,700 | 2,894,638 |
PALTAC Corp. | 19,300 | 584,152 |
Pan Pacific International Holdings Corp. | 36,000 | 845,497 |
Panasonic Holdings Corp. | 737,050 | 6,433,304 |
Persol Holdings Co. Ltd. | 461,000 | 637,706 |
Recruit Holdings Co. Ltd. | 109,400 | 4,711,569 |
Renesas Electronics Corp. | 67,300 | 1,092,666 |
Rengo Co. Ltd. | 93,417 | 700,428 |
Resona Holdings, Inc. | 259,458 | 1,640,746 |
Resonac Holdings Corp. | 67,900 | 1,472,271 |
Ricoh Co. Ltd. | 266,200 | 2,296,522 |
Rohm Co. Ltd. | 47,900 | 688,555 |
Ryohin Keikaku Co. Ltd. | 53,400 | 860,222 |
Sankyu, Inc. | 19,100 | 662,189 |
Sanwa Holdings Corp. | 40,530 | 661,891 |
SBI Holdings, Inc. | 41,100 | 1,000,708 |
Secom Co. Ltd. | 26,000 | 1,806,024 |
Seiko Epson Corp. | 76,400 | 1,256,779 |
Seino Holdings Co. Ltd. | 49,800 | 667,177 |
Sekisui Chemical Co. Ltd. | 99,500 | 1,447,530 |
SECURITY | NUMBER OF SHARES | VALUE ($) |
Sekisui House Ltd. | 149,483 | 3,435,172 |
Seven & i Holdings Co. Ltd. | 464,200 | 5,998,018 |
SG Holdings Co. Ltd. | 92,900 | 1,087,403 |
Shimadzu Corp. | 28,700 | 779,723 |
Shimamura Co. Ltd. | 13,400 | 660,578 |
Shimano, Inc. | 7,700 | 1,251,350 |
Shimizu Corp. | 208,200 | 1,289,686 |
Shin-Etsu Chemical Co. Ltd. | 170,100 | 6,584,391 |
Shionogi & Co. Ltd. | 27,600 | 1,288,941 |
Shiseido Co. Ltd. | 42,500 | 1,137,650 |
SMC Corp. | 3,800 | 1,996,393 |
SoftBank Corp. | 564,300 | 6,806,409 |
SoftBank Group Corp. | 217,800 | 10,711,534 |
Sojitz Corp. | 65,760 | 1,693,113 |
Sompo Holdings, Inc. | 171,400 | 3,392,026 |
Sony Group Corp. | 125,407 | 10,365,056 |
Stanley Electric Co. Ltd. | 41,975 | 742,831 |
Subaru Corp. | 220,800 | 4,930,240 |
SUMCO Corp. | 59,500 | 887,342 |
Sumitomo Chemical Co. Ltd. | 966,500 | 2,064,889 |
Sumitomo Corp. | 230,100 | 6,050,974 |
Sumitomo Electric Industries Ltd. | 326,600 | 5,048,032 |
Sumitomo Forestry Co. Ltd. | 33,000 | 1,016,719 |
Sumitomo Heavy Industries Ltd. | 45,900 | 1,279,082 |
Sumitomo Metal Mining Co. Ltd. | 59,300 | 1,981,132 |
Sumitomo Mitsui Financial Group, Inc. | 166,610 | 9,464,077 |
Sumitomo Mitsui Trust Holdings, Inc. | 94,300 | 1,982,641 |
Sumitomo Realty & Development Co. Ltd. | 59,000 | 2,041,630 |
Sumitomo Rubber Industries Ltd. | 92,200 | 1,119,109 |
Sundrug Co. Ltd. | 19,662 | 570,930 |
Suntory Beverage & Food Ltd. | 27,000 | 878,451 |
Suzuken Co. Ltd. | 47,730 | 1,409,645 |
Suzuki Motor Corp. | 482,200 | 5,615,595 |
Sysmex Corp. | 42,900 | 685,987 |
T&D Holdings, Inc. | 57,850 | 943,957 |
Taiheiyo Cement Corp. | 63,042 | 1,441,928 |
Taisei Corp. | 59,000 | 2,160,013 |
Taiyo Yuden Co. Ltd. | 25,600 | 599,618 |
Takeda Pharmaceutical Co. Ltd. | 245,721 | 6,458,056 |
TDK Corp. | 56,000 | 2,498,215 |
Teijin Ltd. | 118,500 | 1,156,047 |
Terumo Corp. | 94,200 | 1,598,020 |
TIS, Inc. | 33,000 | 704,767 |
Tobu Railway Co. Ltd. | 27,800 | 551,565 |
Toho Gas Co. Ltd. | 37,400 | 960,450 |
Tohoku Electric Power Co., Inc. | 299,000 | 2,308,298 |
Tokio Marine Holdings, Inc. | 198,500 | 6,273,868 |
Tokyo Electric Power Co. Holdings, Inc. * | 1,093,300 | 6,800,631 |
Tokyo Electron Ltd. | 27,500 | 6,032,008 |
Tokyo Gas Co. Ltd. | 124,700 | 2,796,678 |
Tokyu Corp. | 81,600 | 965,945 |
Tokyu Fudosan Holdings Corp. | 136,700 | 1,001,499 |
TOPPAN Holdings, Inc. | 78,900 | 1,871,819 |
Toray Industries, Inc. | 531,300 | 2,428,424 |
Tosoh Corp. | 121,000 | 1,668,121 |
TOTO Ltd. | 32,800 | 887,715 |
Toyo Seikan Group Holdings Ltd. | 55,200 | 853,245 |
Toyo Suisan Kaisha Ltd. | 13,447 | 840,898 |
Toyoda Gosei Co. Ltd. | 32,700 | 633,095 |
Toyota Industries Corp. | 28,000 | 2,660,750 |
Toyota Motor Corp. | 1,968,190 | 44,891,609 |
Toyota Tsusho Corp. | 62,500 | 3,973,744 |
Tsuruha Holdings, Inc. | 10,000 | 631,239 |
UBE Corp. | 54,800 | 1,001,836 |
Unicharm Corp. | 26,600 | 790,369 |
West Japan Railway Co. | 76,126 | 1,444,982 |
Yakult Honsha Co. Ltd. | 25,800 | 504,641 |
SECURITY | NUMBER OF SHARES | VALUE ($) |
Yamada Holdings Co. Ltd. | 421,500 | 1,206,581 |
Yamaha Corp. | 27,700 | 583,727 |
Yamaha Motor Co. Ltd. | 259,900 | 2,424,144 |
Yamato Holdings Co. Ltd. | 113,400 | 1,497,637 |
Yamazaki Baking Co. Ltd. | 33,700 | 815,654 |
Yaskawa Electric Corp. | 20,100 | 828,172 |
Yokogawa Electric Corp. | 34,000 | 751,257 |
Yokohama Rubber Co. Ltd. | 40,500 | 1,060,055 |
680,394,341 | ||
Netherlands 2.7% | ||
Aalberts NV | 15,350 | 729,828 |
ABN AMRO Bank NV, GDR | 88,948 | 1,424,819 |
Aegon Ltd. | 362,123 | 2,255,246 |
Akzo Nobel NV | 48,831 | 3,221,964 |
Aperam SA | 18,808 | 546,873 |
ArcelorMittal SA | 262,594 | 6,560,345 |
ASM International NV | 1,008 | 634,071 |
ASML Holding NV | 10,162 | 8,851,231 |
ASR Nederland NV | 27,537 | 1,377,937 |
EXOR NV | 43,493 | 4,748,369 |
Heineken Holding NV | 19,975 | 1,606,869 |
Heineken NV | 23,827 | 2,318,835 |
IMCD NV * | 3,348 | 505,128 |
ING Groep NV | 533,133 | 8,428,974 |
Koninklijke Ahold Delhaize NV | 317,763 | 9,645,438 |
Koninklijke KPN NV | 534,535 | 1,942,571 |
Koninklijke Philips NV | 185,247 | 4,919,455 |
NN Group NV | 84,872 | 3,915,220 |
Prosus NV | 31,924 | 1,068,176 |
Randstad NV | 41,061 | 2,059,248 |
SBM Offshore NV | 44,290 | 654,323 |
Signify NV | 39,235 | 1,069,996 |
Universal Music Group NV | 5,165 | 151,929 |
Wolters Kluwer NV | 10,643 | 1,593,326 |
70,230,171 | ||
New Zealand 0.1% | ||
Fletcher Building Ltd. | 280,288 | 627,345 |
Spark New Zealand Ltd. | 253,023 | 711,177 |
1,338,522 | ||
Norway 0.7% | ||
Aker BP ASA | 30,340 | 735,840 |
DNB Bank ASA | 134,913 | 2,351,418 |
Equinor ASA | 213,020 | 5,668,114 |
Mowi ASA | 62,401 | 1,095,568 |
Norsk Hydro ASA | 340,564 | 2,092,896 |
Orkla ASA | 127,844 | 869,647 |
Subsea 7 SA * | 50,468 | 811,917 |
Telenor ASA | 193,818 | 2,231,564 |
Yara International ASA | 50,469 | 1,438,626 |
17,295,590 | ||
Poland 0.3% | ||
KGHM Polska Miedz SA | 33,459 | 1,150,309 |
ORLEN SA | 150,640 | 2,456,092 |
PGE Polska Grupa Energetyczna SA * | 314,681 | 469,030 |
Powszechna Kasa Oszczednosci Bank Polski SA | 68,459 | 1,016,419 |
Powszechny Zaklad Ubezpieczen SA | 104,637 | 1,316,950 |
6,408,800 | ||
SECURITY | NUMBER OF SHARES | VALUE ($) |
Portugal 0.2% | ||
EDP - Energias de Portugal SA * | 538,613 | 2,022,582 |
Galp Energia SGPS SA | 117,420 | 2,522,318 |
Jeronimo Martins SGPS SA | 33,847 | 696,291 |
5,241,191 | ||
Republic of Korea 6.1% | ||
BNK Financial Group, Inc. | 121,789 | 735,297 |
CJ CheilJedang Corp. | 4,088 | 990,878 |
CJ Corp. | 15,381 | 1,410,487 |
Coway Co. Ltd. | 16,926 | 678,165 |
DB Insurance Co. Ltd. | 13,232 | 928,157 |
DL E&C Co. Ltd. | 33,501 | 898,064 |
Doosan Enerbility Co. Ltd. * | 55,481 | 669,898 |
E-MART, Inc. | 21,334 | 978,415 |
GS Engineering & Construction Corp. * | 58,862 | 697,758 |
GS Holdings Corp. | 40,637 | 1,313,865 |
Hana Financial Group, Inc. | 83,756 | 3,532,561 |
Hankook Tire & Technology Co. Ltd. | 28,168 | 1,195,232 |
Hanwha Corp. | 50,644 | 993,850 |
Hanwha Solutions Corp. | 23,912 | 435,203 |
HD Hyundai Co. Ltd. | 21,743 | 1,052,643 |
HMM Co. Ltd. | 66,299 | 756,944 |
Hyundai Engineering & Construction Co. Ltd. | 36,634 | 933,258 |
Hyundai Glovis Co. Ltd. | 7,637 | 999,761 |
Hyundai Marine & Fire Insurance Co. Ltd. | 29,237 | 659,997 |
Hyundai Mobis Co. Ltd. | 23,313 | 3,813,990 |
Hyundai Motor Co. | 38,995 | 7,014,260 |
Hyundai Steel Co. | 63,489 | 1,474,273 |
Industrial Bank of Korea | 86,300 | 867,619 |
KB Financial Group, Inc. | 90,715 | 4,920,099 |
Kia Corp. | 72,186 | 6,115,783 |
Korea Electric Power Corp. | 210,598 | 3,215,043 |
Korea Gas Corp. * | 31,556 | 627,806 |
Korea Zinc Co. Ltd. | 2,305 | 767,828 |
Korean Air Lines Co. Ltd. | 43,019 | 648,734 |
KT&G Corp. | 20,980 | 1,351,863 |
Kumho Petrochemical Co. Ltd. | 6,824 | 678,731 |
LG Chem Ltd. | 7,174 | 2,061,436 |
LG Corp. | 10,719 | 611,604 |
LG Display Co. Ltd. * | 212,611 | 1,609,263 |
LG Electronics, Inc. | 51,807 | 3,450,453 |
LG H&H Co. Ltd. | 2,990 | 900,910 |
LG Innotek Co. Ltd. | 4,135 | 657,269 |
LG Uplus Corp. | 138,500 | 983,696 |
Lotte Chemical Corp. | 10,725 | 828,799 |
Lotte Shopping Co. Ltd. | 10,581 | 530,528 |
NAVER Corp. | 7,163 | 944,796 |
POSCO Holdings, Inc. | 27,658 | 7,984,334 |
Samsung C&T Corp. | 19,686 | 2,122,806 |
Samsung Electro-Mechanics Co. Ltd. | 12,363 | 1,379,012 |
Samsung Electronics Co. Ltd. | 928,952 | 51,637,319 |
Samsung Fire & Marine Insurance Co. Ltd. | 8,322 | 1,862,676 |
Samsung Life Insurance Co. Ltd. | 19,469 | 1,226,797 |
Samsung SDI Co. Ltd. | 3,711 | 1,148,439 |
Samsung SDS Co. Ltd. | 9,042 | 1,038,739 |
Shinhan Financial Group Co. Ltd. | 127,425 | 4,281,134 |
SK Hynix, Inc. | 100,470 | 12,398,560 |
SK Innovation Co. Ltd. * | 20,988 | 1,665,007 |
SK, Inc. | 27,053 | 3,223,702 |
S-Oil Corp. | 14,854 | 775,521 |
SECURITY | NUMBER OF SHARES | VALUE ($) |
Woori Financial Group, Inc. | 196,950 | 2,018,291 |
156,697,553 | ||
Singapore 0.7% | ||
ComfortDelGro Corp. Ltd. | 665,100 | 723,441 |
DBS Group Holdings Ltd. | 174,508 | 4,442,521 |
Golden Agri-Resources Ltd. | 692,400 | 139,489 |
Jardine Cycle & Carriage Ltd. | 28,000 | 540,351 |
Olam Group Ltd. | 445,300 | 383,387 |
Oversea-Chinese Banking Corp. Ltd. | 330,044 | 3,426,373 |
Singapore Airlines Ltd. | 133,770 | 638,300 |
Singapore Telecommunications Ltd. | 1,120,786 | 1,943,750 |
United Overseas Bank Ltd. | 121,152 | 2,688,458 |
Venture Corp. Ltd. | 57,500 | 609,226 |
Wilmar International Ltd. | 706,266 | 1,660,129 |
17,195,425 | ||
Spain 3.0% | ||
Acciona SA | 3,743 | 432,714 |
Acerinox SA | 59,520 | 641,246 |
ACS Actividades de Construccion y Servicios SA | 53,018 | 2,123,395 |
Aena SME SA | 4,669 | 850,877 |
Amadeus IT Group SA | 18,497 | 1,174,077 |
Banco Bilbao Vizcaya Argentaria SA | 1,072,603 | 11,599,100 |
Banco de Sabadell SA | 1,174,753 | 2,244,017 |
Banco Santander SA (a) | 4,277,649 | 20,813,466 |
CaixaBank SA | 198,575 | 1,047,196 |
Cellnex Telecom SA * | 11,590 | 383,104 |
Enagas SA | 38,250 | 560,975 |
Endesa SA | 66,692 | 1,216,171 |
Ferrovial SE | 22,981 | 826,520 |
Grifols SA * | 46,985 | 430,028 |
Iberdrola SA | 807,010 | 9,895,215 |
Industria de Diseno Textil SA | 78,275 | 3,563,934 |
Mapfre SA | 277,346 | 669,115 |
Naturgy Energy Group SA | 23,687 | 599,124 |
Redeia Corp. SA | 54,026 | 901,889 |
Repsol SA | 408,155 | 6,406,433 |
Telefonica SA | 2,664,867 | 11,937,527 |
78,316,123 | ||
Sweden 2.0% | ||
Alfa Laval AB | 23,467 | 999,102 |
Assa Abloy AB, B Shares | 76,668 | 2,025,676 |
Atlas Copco AB, A Shares | 130,743 | 2,290,105 |
Atlas Copco AB, B Shares | 78,636 | 1,179,085 |
Boliden AB (a) | 64,767 | 2,128,547 |
Electrolux AB, B Shares *(a) | 78,440 | 682,054 |
Epiroc AB, A Shares | 37,942 | 701,447 |
Epiroc AB, B Shares | 25,879 | 428,970 |
Essity AB, B Shares | 87,329 | 2,178,836 |
H & M Hennes & Mauritz AB, B Shares (a) | 116,377 | 1,849,789 |
Hexagon AB, B Shares | 106,323 | 1,112,242 |
Investor AB, A Shares | 54,152 | 1,318,953 |
Investor AB, B Shares | 179,593 | 4,398,725 |
Sandvik AB | 116,213 | 2,316,536 |
Securitas AB, B Shares (a) | 128,271 | 1,285,481 |
Skandinaviska Enskilda Banken AB, A Shares | 155,084 | 2,031,045 |
Skanska AB, B Shares | 111,373 | 1,913,200 |
SKF AB, B Shares | 80,117 | 1,647,050 |
SSAB AB, A Shares | 62,736 | 352,271 |
SSAB AB, B Shares | 186,986 | 1,046,291 |
SECURITY | NUMBER OF SHARES | VALUE ($) |
Svenska Cellulosa AB SCA, B Shares | 56,036 | 821,222 |
Svenska Handelsbanken AB, A Shares | 189,314 | 1,623,429 |
Swedbank AB, A Shares | 132,634 | 2,536,262 |
Tele2 AB, B Shares | 134,446 | 1,253,986 |
Telefonaktiebolaget LM Ericsson, B Shares | 573,975 | 2,912,857 |
Telia Co. AB | 950,740 | 2,174,795 |
Trelleborg AB, B Shares | 23,535 | 829,431 |
Volvo AB, A Shares | 37,570 | 989,453 |
Volvo AB, B Shares | 252,543 | 6,428,022 |
Volvo Car AB, B Shares * | 164,384 | 510,286 |
51,965,148 | ||
Switzerland 4.5% | ||
ABB Ltd. | 109,644 | 5,327,431 |
Adecco Group AG | 59,995 | 2,098,773 |
Alcon, Inc. | 20,616 | 1,580,768 |
ams-OSRAM AG * | 176,190 | 211,614 |
Baloise Holding AG | 5,162 | 780,045 |
Barry Callebaut AG | 373 | 602,758 |
Chocoladefabriken Lindt & Spruengli AG | 4 | 461,611 |
Chocoladefabriken Lindt & Spruengli AG, Participation Certificates | 50 | 575,948 |
Cie Financiere Richemont SA, Class A | 27,482 | 3,798,755 |
DKSH Holding AG | 8,657 | 564,171 |
Galenica AG | 6,237 | 477,244 |
Geberit AG | 2,280 | 1,217,021 |
Georg Fischer AG | 9,116 | 636,256 |
Givaudan SA | 398 | 1,702,154 |
Holcim AG | 82,043 | 6,867,631 |
Julius Baer Group Ltd. | 17,535 | 940,899 |
Kuehne & Nagel International AG (a) | 4,217 | 1,114,538 |
Logitech International SA | 10,636 | 828,089 |
Lonza Group AG | 2,881 | 1,590,292 |
Nestle SA | 199,374 | 20,017,181 |
Novartis AG | 140,797 | 13,665,401 |
Partners Group Holding AG | 873 | 1,123,172 |
Roche Holding AG | 77,730 | 18,625,211 |
Roche Holding AG, Bearer Shares | 3,411 | 897,292 |
Sandoz Group AG * | 34,131 | 1,160,007 |
Schindler Holding AG | 1,746 | 425,419 |
Schindler Holding AG, Participation Certificates | 3,166 | 789,145 |
SGS SA | 12,631 | 1,112,231 |
Sika AG | 5,580 | 1,587,295 |
Sonova Holding AG | 2,758 | 762,400 |
Swatch Group AG | 8,329 | 345,316 |
Swatch Group AG, Bearer Shares | 4,558 | 957,687 |
Swiss Life Holding AG | 3,041 | 2,051,932 |
Swiss Prime Site AG | 5,915 | 546,149 |
Swiss Re AG | 29,399 | 3,195,829 |
Swisscom AG | 3,504 | 1,922,317 |
UBS Group AG | 348,367 | 9,149,256 |
Zurich Insurance Group AG | 14,988 | 7,254,886 |
116,964,124 | ||
United Kingdom 15.3% | ||
3i Group PLC | 58,289 | 2,082,517 |
abrdn PLC | 598,681 | 1,091,743 |
Admiral Group PLC | 28,063 | 955,184 |
Anglo American PLC | 338,308 | 11,055,046 |
Antofagasta PLC | 45,278 | 1,242,056 |
Ashtead Group PLC | 34,946 | 2,537,495 |
Associated British Foods PLC | 62,880 | 2,081,182 |
AstraZeneca PLC | 61,737 | 9,337,651 |
Aviva PLC | 604,853 | 3,511,866 |
SECURITY | NUMBER OF SHARES | VALUE ($) |
B&M European Value Retail SA | 129,060 | 832,898 |
BAE Systems PLC | 273,711 | 4,552,421 |
Balfour Beatty PLC | 156,956 | 711,792 |
Barclays PLC | 3,728,125 | 9,399,693 |
Barratt Developments PLC | 285,928 | 1,615,527 |
Bellway PLC | 33,502 | 1,052,826 |
Berkeley Group Holdings PLC | 19,110 | 1,122,246 |
BP PLC | 4,381,892 | 28,244,086 |
British American Tobacco PLC | 483,976 | 14,207,731 |
BT Group PLC | 3,142,332 | 4,018,425 |
Bunzl PLC | 36,075 | 1,383,397 |
Burberry Group PLC | 49,971 | 715,017 |
Centrica PLC | 942,370 | 1,504,279 |
Coca-Cola HBC AG | 25,172 | 812,520 |
Compass Group PLC | 145,491 | 4,046,644 |
CRH PLC | 91,052 | 7,051,138 |
Croda International PLC | 10,082 | 577,462 |
Currys PLC * | 1,648,667 | 1,272,041 |
DCC PLC | 29,235 | 1,996,478 |
Diageo PLC | 127,350 | 4,401,174 |
Direct Line Insurance Group PLC | 542,695 | 1,259,977 |
Dowlais Group PLC | 278,122 | 282,676 |
DS Smith PLC | 337,223 | 1,469,123 |
Entain PLC | 61,104 | 596,143 |
Experian PLC | 43,166 | 1,741,055 |
Ferguson PLC | 18,741 | 3,951,649 |
Firstgroup PLC | 379,863 | 769,528 |
Flutter Entertainment PLC * | 4,362 | 808,099 |
Glencore PLC | 4,006,288 | 23,310,828 |
Grafton Group PLC | 46,742 | 549,790 |
GSK PLC | 501,079 | 10,395,842 |
Haleon PLC | 620,945 | 2,622,462 |
Harbour Energy PLC | 147,952 | 528,703 |
Hays PLC | 626,354 | 719,272 |
HSBC Holdings PLC | 2,280,239 | 19,764,999 |
IG Group Holdings PLC | 58,762 | 548,323 |
Imperial Brands PLC | 213,445 | 4,877,250 |
Inchcape PLC | 99,055 | 987,273 |
Informa PLC | 73,103 | 723,712 |
InterContinental Hotels Group PLC | 6,485 | 632,508 |
International Distributions Services PLC * | 544,678 | 1,835,343 |
Intertek Group PLC | 16,545 | 1,018,287 |
ITV PLC | 1,017,701 | 892,908 |
J Sainsbury PLC | 797,621 | 2,616,338 |
John Wood Group PLC * | 526,537 | 976,375 |
Johnson Matthey PLC | 86,044 | 1,887,986 |
Kingfisher PLC | 939,725 | 2,894,657 |
Legal & General Group PLC | 959,312 | 2,816,060 |
Lloyds Banking Group PLC | 13,806,152 | 8,910,251 |
London Stock Exchange Group PLC | 9,547 | 1,052,462 |
M&G PLC | 870,139 | 2,178,417 |
Man Group PLC | 212,855 | 682,605 |
Marks & Spencer Group PLC | 565,000 | 1,800,057 |
Melrose Industries PLC | 132,986 | 1,044,782 |
Mondi PLC | 118,793 | 2,254,770 |
National Grid PLC | 504,658 | 6,619,677 |
NatWest Group PLC | 846,390 | 3,194,599 |
Next PLC | 11,179 | 1,253,814 |
Pearson PLC | 114,021 | 1,383,512 |
Persimmon PLC | 141,532 | 2,291,832 |
Phoenix Group Holdings PLC | 109,492 | 666,883 |
Prudential PLC | 223,196 | 1,941,213 |
Reckitt Benckiser Group PLC | 45,064 | 2,519,393 |
RELX PLC | 86,330 | 3,547,030 |
Rentokil Initial PLC | 103,643 | 523,187 |
Rio Tinto PLC | 246,317 | 16,665,987 |
RS Group PLC | 52,382 | 479,861 |
Sage Group PLC | 54,446 | 789,516 |
SECURITY | NUMBER OF SHARES | VALUE ($) |
Severn Trent PLC | 27,101 | 835,369 |
Shell PLC | 1,847,417 | 65,673,081 |
Smith & Nephew PLC | 94,101 | 1,140,094 |
Smiths Group PLC | 40,934 | 825,228 |
Smurfit Kappa Group PLC | 49,802 | 2,164,020 |
Spectris PLC | 12,911 | 534,040 |
SSE PLC | 169,556 | 3,524,458 |
St. James's Place PLC | 63,167 | 341,815 |
Standard Chartered PLC | 326,633 | 2,806,280 |
Tate & Lyle PLC | 79,726 | 656,507 |
Taylor Wimpey PLC | 1,046,343 | 1,714,561 |
Tesco PLC | 2,332,501 | 8,611,753 |
Travis Perkins PLC | 93,457 | 874,786 |
Unilever PLC | 259,544 | 13,426,421 |
United Utilities Group PLC | 79,281 | 1,033,441 |
Vodafone Group PLC | 15,221,010 | 12,835,899 |
Whitbread PLC | 13,501 | 532,112 |
WPP PLC | 192,017 | 1,924,618 |
394,144,032 | ||
Total Common Stocks (Cost $1,999,528,051) | 2,524,027,858 | |
PREFERRED STOCKS 1.2% OF NET ASSETS | ||
Germany 0.7% | ||
Bayerische Motoren Werke AG | 17,728 | 1,821,582 |
FUCHS SE | 15,573 | 727,248 |
Henkel AG & Co. KGaA | 28,260 | 2,245,024 |
Volkswagen AG | 107,467 | 13,165,256 |
17,959,110 | ||
Italy 0.1% | ||
Telecom Italia SpA * | 4,579,314 | 1,127,285 |
Republic of Korea 0.4% | ||
Hyundai Motor Co. | 6,144 | 699,126 |
Hyundai Motor Co. 2nd | 9,334 | 1,066,575 |
LG Chem Ltd. | 1,008 | 193,457 |
Samsung Electronics Co. Ltd. | 172,464 | 8,052,533 |
10,011,691 | ||
Spain 0.0% | ||
Grifols SA, B Shares * | 46,124 | 294,320 |
Total Preferred Stocks (Cost $28,031,095) | 29,392,406 | |
WARRANTS 0.0% OF NET ASSETS | ||
Canada 0.0% | ||
Constellation Software, Inc. | ||
expires 03/31/40 *(b) | 290 | 1,462 |
Total Warrants (Cost $0) | 1,462 | |
SECURITY | NUMBER OF SHARES | VALUE ($) |
SHORT-TERM INVESTMENTS 1.1% OF NET ASSETS | ||
Money Market Funds 1.1% | ||
State Street Institutional U.S. Government Money Market Fund, Premier Class 5.25% (c)(d) | 29,138,682 | 29,138,682 |
Total Short-Term Investments (Cost $29,138,682) | 29,138,682 | |
Total Investments in Securities (Cost $2,056,697,828) | 2,582,560,408 | |
NUMBER OF CONTRACTS | NOTIONAL AMOUNT ($) | CURRENT VALUE/ UNREALIZED DEPRECIATION ($) | |
FUTURES CONTRACTS | |||
Long | |||
MSCI EAFE Index, expires 06/21/24 | 162 | 18,366,750 | (122,117 ) |
* | Non-income producing security. |
(a) | All or a portion of this security is on loan. Securities on loan were valued at $26,328,208. |
(b) | Fair valued using significant unobservable inputs (see financial note 2(a), Securities for which no quoted value is available, for additional information). |
(c) | The rate shown is the annualized 7-day yield. |
(d) | Security purchased with cash collateral received for securities on loan. |
GDR — | Global Depositary Receipt |
REIT — | Real Estate Investment Trust |
DESCRIPTION | QUOTED PRICES IN ACTIVE MARKETS FOR IDENTICAL ASSETS (LEVEL 1) | OTHER SIGNIFICANT OBSERVABLE INPUTS (LEVEL 2) | SIGNIFICANT UNOBSERVABLE INPUTS (LEVEL 3) | TOTAL |
Assets | ||||
Common Stocks1 | $— | $1,111,325,807 | $— | $1,111,325,807 |
Belgium | 1,459,797 | 17,074,353 | — | 18,534,150 |
Canada | 191,401,673 | — | — | 191,401,673 |
Denmark | 231,997 | 22,927,435 | — | 23,159,432 |
Finland | 589,425 | 24,652,127 | — | 25,241,552 |
Hong Kong | 3,639,241 | 36,798,612 | — | 40,437,853 |
Ireland | 575,773 | 2,983,708 | — | 3,559,481 |
Japan | 711,752 | 679,682,589 | — | 680,394,341 |
New Zealand | 711,177 | 627,345 | — | 1,338,522 |
Norway | 2,231,564 | 15,064,026 | — | 17,295,590 |
Singapore | 139,489 | 17,055,936 | — | 17,195,425 |
United Kingdom | 5,775,638 | 388,368,394 | — | 394,144,032 |
Preferred Stocks1 | — | 29,392,406 | — | 29,392,406 |
Warrants | ||||
Canada | — | — | 1,462 | 1,462 |
Short-Term Investments1 | 29,138,682 | — | — | 29,138,682 |
Liabilities | ||||
Futures Contracts2 | (122,117 ) | — | — | (122,117 ) |
Total | $236,484,091 | $2,345,952,738 | $1,462 | $2,582,438,291 |
1 | As categorized in the Portfolio Holdings. |
2 | Futures contracts are reported at cumulative unrealized appreciation or depreciation. |
Assets | ||
Investments in securities, at value - unaffiliated issuers (cost $2,056,697,828) including securities on loan of $26,328,208 | $2,582,560,408 | |
Cash | 7,099,660 | |
Foreign currency, at value (cost $4,876,920) | 4,860,676 | |
Deposit with broker for futures contracts | 1,457,207 | |
Receivables: | ||
Dividends | 13,000,675 | |
Foreign tax reclaims | 3,097,770 | |
Fund shares sold | 1,555,552 | |
Investments sold | 145,655 | |
Income from securities on loan | + | 24,342 |
Total assets | 2,613,801,945 | |
Liabilities | ||
Collateral held for securities on loan | 29,138,682 | |
Payables: | ||
Investments bought | 8,945,705 | |
Fund shares redeemed | 2,875,946 | |
Investment adviser fees | 529,755 | |
Variation margin on futures contracts | + | 320,571 |
Total liabilities | 41,810,659 | |
Net assets | $2,571,991,286 | |
Net Assets by Source | ||
Capital received from investors | $2,223,422,067 | |
Total distributable earnings | + | 348,569,219 |
Net assets | $2,571,991,286 | |
Net Asset Value (NAV) | ||||
Net Assets | ÷ | Shares Outstanding | = | NAV |
$2,571,991,286 | 238,302,301 | $10.79 | ||
For the period November 1, 2023 through April 30, 2024; unaudited | ||
Investment Income | ||
Dividends received from securities - unaffiliated issuers (net of foreign withholding tax of $5,388,094) | $41,642,662 | |
Other interest | 150,453 | |
Securities on loan, net | + | 92,277 |
Total investment income | 41,885,392 | |
Expenses | ||
Investment adviser fees | 3,001,089 | |
Professional fees | + | 35,066 1 |
Total expenses | 3,036,155 | |
Expense reduction | – | 35,066 1 |
Net expenses | – | 3,001,089 |
Net investment income | 38,884,303 | |
REALIZED AND UNREALIZED GAINS (LOSSES) | ||
Net realized gains on sales of securities - unaffiliated issuers | 7,447,518 | |
Net realized gains on futures contracts | 1,283,067 | |
Net realized gains on foreign currency transactions | + | 77,818 |
Net realized gains | 8,808,403 | |
Net change in unrealized appreciation (depreciation) on securities - unaffiliated issuers | 297,150,928 | |
Net change in unrealized appreciation (depreciation) on futures contracts | 219,765 | |
Net change in unrealized appreciation (depreciation) on foreign currency translations | + | (228,332 ) |
Net change in unrealized appreciation (depreciation) | + | 297,142,361 |
Net realized and unrealized gains | 305,950,764 | |
Increase in net assets resulting from operations | $344,835,067 | |
1 | Professional fees associated with the filing of foreign withholding tax claims in the European Union are deemed to be non-contingent and non-routine expenses of the fund (see financial notes 2(d) and 4 for additional information). |
OPERATIONS | |||
11/1/23-4/30/24 | 11/1/22-10/31/23 | ||
Net investment income | $38,884,303 | $66,540,909 | |
Net realized gains (losses) | 8,808,403 | (33,699,131 ) | |
Net change in unrealized appreciation (depreciation) | + | 297,142,361 | 224,552,707 |
Increase in net assets resulting from operations | $344,835,067 | $257,394,485 | |
DISTRIBUTIONS TO SHAREHOLDERS | |||
Total distributions | ($75,574,529 ) | ($49,119,207 ) | |
TRANSACTIONS IN FUND SHARES | |||||
11/1/23-4/30/24 | 11/1/22-10/31/23 | ||||
SHARES | VALUE | SHARES | VALUE | ||
Shares sold | 34,467,907 | $361,423,633 | 71,601,319 | $703,060,604 | |
Shares reinvested | 5,098,704 | 52,057,764 | 3,661,238 | 32,731,464 | |
Shares redeemed | + | (18,659,790 ) | (196,160,544 ) | (43,832,250 ) | (423,334,845 ) |
Net transactions in fund shares | 20,906,821 | $217,320,853 | 31,430,307 | $312,457,223 | |
SHARES OUTSTANDING AND NET ASSETS | |||||
11/1/23-4/30/24 | 11/1/22-10/31/23 | ||||
SHARES | NET ASSETS | SHARES | NET ASSETS | ||
Beginning of period | 217,395,480 | $2,085,409,895 | 185,965,173 | $1,564,677,394 | |
Total increase | + | 20,906,821 | 486,581,391 | 31,430,307 | 520,732,501 |
End of period | 238,302,301 | $2,571,991,286 | 217,395,480 | $2,085,409,895 | |
11/1/23– 4/30/24* | 11/1/22– 10/31/23 | 11/1/21– 10/31/22 | 11/1/20– 10/31/21 | 11/1/19– 10/31/20 | 11/1/18– 10/31/19 | |
Per-Share Data | ||||||
Net asset value at beginning of period | $11.35 | $10.66 | $15.42 | $11.46 | $12.57 | $12.67 |
Income (loss) from investment operations: | ||||||
Net investment income (loss)1 | 0.16 | 0.30 | 0.30 | 0.27 | 0.22 | 0.29 |
Net realized and unrealized gains (losses) | 1.45 | 0.95 | (4.21 ) | 3.96 | (0.97 ) | 0.25 |
Total from investment operations | 1.61 | 1.25 | (3.91 ) | 4.23 | (0.75 ) | 0.54 |
Less distributions: | ||||||
Distributions from net investment income | (0.40 ) | (0.23 ) | (0.41 ) | (0.27 ) | (0.36 ) | (0.30 ) |
Distributions from net realized gains | — | (0.33 ) | (0.44 ) | — | — | (0.34 ) |
Total distributions | (0.40 ) | (0.56 ) | (0.85 ) | (0.27 ) | (0.36 ) | (0.64 ) |
Net asset value at end of period | $12.56 | $11.35 | $10.66 | $15.42 | $11.46 | $12.57 |
Total return | 14.22 %2 | 11.76 % | (26.61 %) | 37.25 % | (6.28 %) | 5.13 % |
Ratios/Supplemental Data | ||||||
Ratios to average net assets: | ||||||
Total expenses | 0.39 %3 | 0.39 % | 0.39 %4 | 0.39 % | 0.39 % | 0.39 % |
Net investment income (loss) | 2.55 %3 | 2.48 % | 2.37 % | 1.84 % | 1.89 % | 2.44 % |
Portfolio turnover rate | 15 %2 | 23 % | 36 % | 35 % | 25 % | 38 % |
Net assets, end of period (x 1,000) | $566,142 | $524,292 | $530,184 | $708,349 | $576,948 | $775,258 |
* | Unaudited. |
1 | Calculated based on the average shares outstanding during the period. |
2 | Not annualized. |
3 | Annualized. |
4 | Ratio includes less than 0.005% of non-routine proxy expenses. |
SECURITY | NUMBER OF SHARES | VALUE ($) |
COMMON STOCKS 99.1% OF NET ASSETS | ||
Australia 5.3% | ||
Accent Group Ltd. | 18,651 | 22,661 |
Adbri Ltd. * | 206,988 | 419,899 |
ALS Ltd. | 58,218 | 486,762 |
AMP Ltd. | 987,096 | 694,752 |
Ansell Ltd. | 40,748 | 669,942 |
ARB Corp. Ltd. | 7,092 | 174,105 |
ASX Ltd. | 12,996 | 530,888 |
Austal Ltd. | 189,230 | 279,887 |
Bank of Queensland Ltd. | 151,766 | 599,499 |
Bapcor Ltd. (a) | 77,356 | 289,643 |
Beach Energy Ltd. | 501,055 | 513,072 |
Bega Cheese Ltd. | 120,697 | 319,974 |
Bendigo & Adelaide Bank Ltd. | 121,545 | 761,859 |
Boral Ltd. | 102,697 | 377,892 |
Breville Group Ltd. | 14,551 | 239,578 |
Brickworks Ltd. | 1,666 | 28,694 |
CAR Group Ltd. | 13,863 | 300,598 |
Challenger Ltd. | 87,422 | 376,649 |
Champion Iron Ltd. | 73,653 | 333,783 |
Charter Hall Group | 41,621 | 316,079 |
Charter Hall Retail REIT | 49,369 | 105,341 |
Cleanaway Waste Management Ltd. | 309,301 | 535,082 |
Cochlear Ltd. | 2,751 | 573,881 |
Collins Foods Ltd. | 24,987 | 160,179 |
Coronado Global Resources, Inc. | 316,063 | 251,188 |
Credit Corp. Group Ltd. | 10,795 | 112,968 |
Cromwell Property Group | 358,806 | 93,203 |
CSR Ltd. | 142,405 | 812,247 |
Deterra Royalties Ltd. | 8,159 | 25,827 |
Dexus | 125,570 | 570,365 |
Domino's Pizza Enterprises Ltd. | 7,365 | 185,785 |
Eagers Automotive Ltd. | 56,565 | 455,667 |
Elders Ltd. | 57,581 | 312,848 |
Evolution Mining Ltd. | 333,007 | 858,753 |
EVT Ltd. | 19,746 | 151,124 |
FleetPartners Group Ltd. * | 128,820 | 298,278 |
Flight Centre Travel Group Ltd. | 14,286 | 194,176 |
G8 Education Ltd. | 356,075 | 280,259 |
GPT Group | 188,400 | 506,689 |
GrainCorp Ltd., Class A | 103,678 | 569,675 |
GUD Holdings Ltd. | 19,633 | 128,925 |
Harvey Norman Holdings Ltd. | 203,551 | 597,791 |
Healius Ltd. * | 258,070 | 198,803 |
Helia Group Ltd. | 82,753 | 212,406 |
HomeCo Daily Needs REIT | 44,069 | 34,552 |
IDP Education Ltd. | 3,404 | 35,493 |
IGO Ltd. | 42,978 | 214,060 |
Iluka Resources Ltd. | 59,162 | 287,682 |
Inghams Group Ltd. | 69,958 | 165,582 |
Insignia Financial Ltd. | 193,230 | 302,400 |
IRESS Ltd. * | 41,077 | 224,500 |
Johns Lyng Group Ltd. | 6,377 | 22,868 |
Link Administration Holdings Ltd. | 143,504 | 207,096 |
Lottery Corp. Ltd. | 118,609 | 370,000 |
SECURITY | NUMBER OF SHARES | VALUE ($) |
Lynas Rare Earths Ltd. * | 30,810 | 128,827 |
Magellan Financial Group Ltd. | 55,100 | 312,865 |
McMillan Shakespeare Ltd. | 14,919 | 178,080 |
Monadelphous Group Ltd. | 28,203 | 242,261 |
Myer Holdings Ltd. | 56,233 | 27,560 |
National Storage REIT | 73,982 | 102,016 |
New Hope Corp. Ltd. | 28,780 | 83,722 |
nib holdings Ltd. | 78,390 | 374,354 |
Nickel Industries Ltd. | 81,459 | 48,925 |
Nine Entertainment Co. Holdings Ltd. | 284,064 | 276,881 |
NRW Holdings Ltd. | 211,615 | 377,724 |
Nufarm Ltd. | 128,652 | 425,231 |
oOh!media Ltd. | 151,005 | 163,850 |
Orora Ltd. | 344,023 | 482,215 |
Perenti Ltd. | 501,217 | 307,646 |
Perpetual Ltd. | 16,734 | 254,428 |
Perseus Mining Ltd. | 148,569 | 217,315 |
Pilbara Minerals Ltd. | 11,345 | 28,883 |
Platinum Asset Management Ltd. | 233,520 | 160,723 |
Premier Investments Ltd. | 12,261 | 235,848 |
Qantas Airways Ltd. * | 147,100 | 554,994 |
Qube Holdings Ltd. | 227,177 | 483,266 |
Ramelius Resources Ltd. | 183,334 | 243,194 |
REA Group Ltd. | 1,607 | 184,207 |
Reece Ltd. | 21,372 | 379,132 |
Region RE Ltd. | 112,083 | 157,124 |
Regis Resources Ltd. * | 269,509 | 379,624 |
Reliance Worldwide Corp. Ltd. | 121,935 | 400,231 |
Resolute Mining Ltd. * | 131,824 | 35,812 |
Sandfire Resources Ltd. * | 77,854 | 468,916 |
SEEK Ltd. | 25,724 | 397,380 |
Seven Group Holdings Ltd. | 16,252 | 394,909 |
Sigma Healthcare Ltd. | 570,693 | 464,705 |
Silver Lake Resources Ltd. * | 215,584 | 198,939 |
Star Entertainment Group Ltd. * | 1,107,596 | 285,517 |
Steadfast Group Ltd. | 51,480 | 187,357 |
Super Retail Group Ltd. | 47,582 | 442,435 |
Tabcorp Holdings Ltd. | 344,428 | 161,611 |
TPG Telecom Ltd. | 78,336 | 226,410 |
Ventia Services Group Pty. Ltd. | 26,327 | 61,272 |
Vicinity Ltd. | 582,638 | 713,480 |
Virgin Australia Holdings Pty. Ltd. *(a) | 176,214 | 0 |
Washington H Soul Pattinson & Co. Ltd. | 16,282 | 340,743 |
Waypoint REIT Ltd. | 72,393 | 108,627 |
West African Resources Ltd. * | 55,623 | 47,132 |
Westgold Resources Ltd. | 99,743 | 142,496 |
Xero Ltd. * | 400 | 31,055 |
Yancoal Australia Ltd. | 78,919 | 281,736 |
29,993,567 | ||
Austria 0.5% | ||
ANDRITZ AG | 13,430 | 733,057 |
AT&S Austria Technologie & Systemtechnik AG | 7,910 | 175,648 |
EVN AG | 7,932 | 243,779 |
Lenzing AG * | 6,520 | 210,680 |
Mayr Melnhof Karton AG | 2,684 | 321,195 |
SECURITY | NUMBER OF SHARES | VALUE ($) |
Oesterreichische Post AG | 8,307 | 264,638 |
Schoeller-Bleckmann Oilfield Equipment AG | 596 | 28,990 |
UNIQA Insurance Group AG | 27,800 | 243,852 |
Verbund AG | 4,806 | 367,136 |
Vienna Insurance Group AG Wiener Versicherung Gruppe | 10,020 | 311,928 |
2,900,903 | ||
Belgium 1.1% | ||
Ackermans & van Haaren NV | 4,098 | 704,394 |
Aedifica SA | 2,527 | 161,469 |
Azelis Group NV | 3,465 | 83,257 |
Barco NV | 12,942 | 179,544 |
Bekaert SA | 13,558 | 678,384 |
bpost SA | 103,747 | 409,106 |
Cofinimmo SA * | 4,176 | 276,625 |
Deme Group NV | 367 | 58,263 |
D'ieteren Group | 2,727 | 588,275 |
Elia Group SA | 4,523 | 435,482 |
Fagron | 7,658 | 148,578 |
KBC Ancora | 4,446 | 214,242 |
Lotus Bakeries NV | 15 | 150,956 |
Melexis NV | 2,150 | 179,667 |
Ontex Group NV * | 51,076 | 515,649 |
Recticel SA | 12,915 | 170,093 |
Sofina SA | 2,306 | 539,791 |
Solvay SA | 20,030 | 647,039 |
Tessenderlo Group SA | 1,634 | 41,932 |
Warehouses De Pauw CVA | 6,751 | 178,526 |
6,361,272 | ||
Canada 7.0% | ||
ADENTRA, Inc. | 6,551 | 202,623 |
Advantage Energy Ltd. * | 22,277 | 173,795 |
Aecon Group, Inc. | 39,592 | 486,326 |
Ag Growth International, Inc. | 3,019 | 116,251 |
Air Canada * | 22,794 | 336,450 |
Alamos Gold, Inc., Class A | 29,333 | 431,477 |
Algoma Steel Group, Inc. | 70,415 | 538,093 |
Allied Properties Real Estate Investment Trust | 25,580 | 314,582 |
Altus Group Ltd. | 3,926 | 144,076 |
Aritzia, Inc. * | 7,550 | 195,461 |
Artis Real Estate Investment Trust | 42,083 | 198,699 |
Athabasca Oil Corp. * | 10,864 | 37,880 |
ATS Corp. * | 4,414 | 145,215 |
AutoCanada, Inc. * | 15,432 | 270,829 |
Badger Infrastructure Solution | 6,097 | 199,078 |
Baytex Energy Corp. | 103,197 | 382,308 |
Birchcliff Energy Ltd. | 60,090 | 247,056 |
BlackBerry Ltd. * | 34,820 | 97,379 |
Boardwalk Real Estate Investment Trust | 3,376 | 173,797 |
Bombardier, Inc., Class B * | 12,385 | 564,259 |
Boralex, Inc., Class A | 7,561 | 151,753 |
Boyd Group Services, Inc. | 1,682 | 314,530 |
Brookfield Renewable Corp., Class A | 13,481 | 313,168 |
BRP, Inc. | 5,614 | 377,706 |
CAE, Inc. * | 31,160 | 601,176 |
Cameco Corp. | 12,585 | 574,194 |
Canaccord Genuity Group, Inc. | 32,808 | 208,051 |
Canada Goose Holdings, Inc. * | 7,627 | 86,096 |
Canadian Apartment Properties REIT | 15,527 | 483,298 |
Canadian Western Bank | 19,415 | 372,462 |
Canfor Corp. * | 48,027 | 506,208 |
Capital Power Corp. | 22,174 | 578,732 |
SECURITY | NUMBER OF SHARES | VALUE ($) |
Capstone Copper Corp. * | 12,465 | 86,290 |
Cardinal Energy Ltd. | 6,982 | 35,806 |
Cascades, Inc. | 66,589 | 446,942 |
Celestica, Inc. * | 33,671 | 1,457,980 |
Centerra Gold, Inc. | 114,125 | 694,706 |
CES Energy Solutions Corp. | 85,638 | 352,717 |
Chartwell Retirement Residences | 37,416 | 339,466 |
Chemtrade Logistics Income Fund | 41,830 | 267,087 |
Choice Properties Real Estate Investment Trust | 25,140 | 237,768 |
Chorus Aviation, Inc. * | 66,789 | 104,309 |
Cineplex, Inc. * | 21,818 | 137,724 |
Cogeco Communications, Inc. | 4,328 | 171,561 |
Cogeco, Inc. | 5,700 | 212,531 |
Colliers International Group, Inc. | 2,144 | 223,269 |
Crombie Real Estate Investment Trust | 24,259 | 226,440 |
Definity Financial Corp. | 5,278 | 175,940 |
Descartes Systems Group, Inc. * | 2,169 | 201,200 |
Doman Building Materials Group Ltd. | 37,373 | 208,495 |
Dream Industrial Real Estate Investment Trust | 13,582 | 122,437 |
Dundee Precious Metals, Inc. | 29,962 | 226,785 |
Eldorado Gold Corp. * | 26,851 | 382,680 |
Element Fleet Management Corp. | 37,759 | 602,597 |
Enerflex Ltd. | 58,131 | 339,923 |
Enerplus Corp. | 27,702 | 541,906 |
Enghouse Systems Ltd. | 5,497 | 119,032 |
Ensign Energy Services, Inc. * | 118,727 | 219,921 |
EQB, Inc. | 2,247 | 135,654 |
Equinox Gold Corp. * | 34,985 | 189,328 |
ERO Copper Corp. * | 8,116 | 165,486 |
Exchange Income Corp. | 4,309 | 145,172 |
Fiera Capital Corp., Class A | 27,736 | 138,212 |
First Capital Real Estate Investment Trust | 43,095 | 462,677 |
First Majestic Silver Corp. | 6,587 | 43,925 |
FirstService Corp. | 2,299 | 337,673 |
Fortuna Silver Mines, Inc. * | 51,083 | 231,917 |
GFL Environmental, Inc. | 10,004 | 319,236 |
Gibson Energy, Inc. | 44,615 | 731,781 |
goeasy Ltd. | 1,418 | 181,328 |
Granite Real Estate Investment Trust | 3,872 | 191,399 |
H&R Real Estate Investment Trust | 80,738 | 527,834 |
Hudbay Minerals, Inc. | 71,918 | 605,477 |
IAMGOLD Corp. * | 158,745 | 563,878 |
IGM Financial, Inc. | 16,890 | 422,173 |
Innergex Renewable Energy, Inc. | 29,253 | 170,633 |
International Petroleum Corp. * | 19,995 | 247,205 |
Kelt Exploration Ltd. * | 26,585 | 120,696 |
Killam Apartment Real Estate Investment Trust | 12,330 | 153,963 |
Labrador Iron Ore Royalty Corp. | 1,669 | 36,456 |
Laurentian Bank of Canada | 12,818 | 239,572 |
Major Drilling Group International, Inc. * | 4,727 | 32,826 |
Maple Leaf Foods, Inc. | 21,178 | 374,901 |
Martinrea International, Inc. | 54,076 | 449,766 |
Mattr Corp. * | 17,305 | 205,023 |
MDA Ltd. * | 2,522 | 26,051 |
Mullen Group Ltd. | 28,086 | 260,734 |
NFI Group, Inc. * | 42,871 | 351,899 |
North American Construction Group Ltd. | 1,072 | 22,582 |
North West Co., Inc. | 14,407 | 408,354 |
NorthWest Healthcare Properties Real Estate Investment Trust | 49,861 | 182,906 |
NuVista Energy Ltd. * | 26,390 | 238,471 |
Obsidian Energy Ltd. * | 20,321 | 174,330 |
OceanaGold Corp. | 183,025 | 396,190 |
Pan American Silver Corp. | 39,465 | 727,866 |
Paramount Resources Ltd., Class A | 7,200 | 163,179 |
SECURITY | NUMBER OF SHARES | VALUE ($) |
Parex Resources, Inc. | 34,383 | 599,420 |
Pason Systems, Inc. | 13,302 | 151,219 |
Peyto Exploration & Development Corp. | 32,052 | 358,319 |
PrairieSky Royalty Ltd. | 10,236 | 195,032 |
Precision Drilling Corp. * | 5,508 | 386,178 |
Premium Brands Holdings Corp., Class A | 7,037 | 461,074 |
Primo Water Corp. | 32,300 | 609,093 |
Quebecor, Inc., Class B | 13,637 | 282,220 |
RB Global, Inc. | 11,706 | 837,570 |
Richelieu Hardware Ltd. | 8,478 | 239,255 |
Secure Energy Services, Inc. | 53,387 | 452,179 |
Shopify, Inc., Class A * | 8,893 | 624,348 |
Sienna Senior Living, Inc. | 17,978 | 174,994 |
Sleep Country Canada Holdings, Inc. | 9,736 | 193,284 |
SmartCentres Real Estate Investment Trust | 22,835 | 369,567 |
Spartan Delta Corp. | 15,973 | 46,759 |
SSR Mining, Inc. | 46,624 | 249,944 |
Stantec, Inc. | 9,841 | 783,548 |
Stella-Jones, Inc. | 10,829 | 629,138 |
Superior Plus Corp. | 53,020 | 359,334 |
Tamarack Valley Energy Ltd. | 16,494 | 44,690 |
TMX Group Ltd. | 17,685 | 468,251 |
Torex Gold Resources, Inc. * | 34,427 | 485,152 |
TransAlta Corp. | 64,020 | 424,583 |
Transcontinental, Inc., Class A | 54,002 | 535,842 |
Trican Well Service Ltd. | 57,768 | 175,404 |
Tricon Residential, Inc. | 21,161 | 237,027 |
Westshore Terminals Investment Corp. | 7,602 | 146,225 |
Whitecap Resources, Inc. | 41,903 | 317,777 |
Winpak Ltd. | 5,863 | 182,579 |
39,355,278 | ||
Denmark 1.9% | ||
Alm Brand AS | 101,032 | 175,186 |
Ambu AS, Class B * | 1,586 | 25,359 |
D/S Norden AS | 9,063 | 382,139 |
Demant AS * | 8,726 | 416,683 |
Dfds AS | 11,062 | 337,962 |
FLSmidth & Co. AS | 13,248 | 661,118 |
Genmab AS * | 1,803 | 500,567 |
GN Store Nord AS * | 22,384 | 603,832 |
H Lundbeck AS | 69,999 | 340,379 |
ISS AS | 47,883 | 896,533 |
Jyske Bank AS | 7,640 | 618,151 |
Matas AS | 10,266 | 165,370 |
NKT AS * | 4,769 | 395,609 |
Novonesis (Novozymes) B, Class B | 28,106 | 1,556,418 |
Per Aarsleff Holding AS | 7,251 | 339,762 |
Ringkjoebing Landbobank AS | 1,227 | 206,205 |
Rockwool AS, B Shares | 1,580 | 515,062 |
Royal Unibrew AS * | 6,431 | 484,302 |
Scandinavian Tobacco Group AS, A Shares | 19,017 | 306,932 |
Schouw & Co. AS | 4,610 | 369,830 |
Solar AS, B Shares | 2,720 | 127,261 |
Spar Nord Bank AS | 8,853 | 156,633 |
Sydbank AS | 8,351 | 424,644 |
Topdanmark AS | 6,791 | 283,343 |
TORM PLC, Class A | 1,009 | 34,855 |
Tryg AS | 31,617 | 625,771 |
10,949,906 | ||
Finland 1.1% | ||
Cargotec OYJ, B Shares * | 10,725 | 845,881 |
Kemira OYJ | 29,777 | 648,416 |
SECURITY | NUMBER OF SHARES | VALUE ($) |
Kojamo OYJ * | 25,688 | 283,771 |
Konecranes OYJ | 17,342 | 911,415 |
Mandatum OYJ * | 86,958 | 402,988 |
Metsa Board OYJ, B Shares | 45,033 | 323,836 |
Metso OYJ | 50,423 | 571,651 |
Nokian Renkaat OYJ (b) | 102,674 | 895,212 |
Orion OYJ, B Shares | 14,408 | 550,315 |
TietoEVRY OYJ | 25,190 | 475,362 |
Tokmanni Group Corp. | 14,047 | 213,172 |
YIT OYJ | 161,079 | 334,373 |
6,456,392 | ||
France 3.8% | ||
Aeroports de Paris SA | 3,589 | 455,856 |
Air France-KLM *(b) | 40,274 | 410,663 |
Alten SA | 4,031 | 473,724 |
Amundi SA | 13,102 | 914,053 |
Beneteau SACA | 11,321 | 146,597 |
BioMerieux | 4,384 | 466,037 |
Carmila SA | 10,308 | 173,179 |
CGG SA * | 834,956 | 349,353 |
Chargeurs SA | 1,189 | 14,928 |
Cie Plastic Omnium SE | 39,485 | 480,926 |
Clariane SE (b) | 179,783 | 429,292 |
Coface SA | 24,308 | 374,066 |
Covivio SA | 10,817 | 538,428 |
Dassault Aviation SA | 2,094 | 448,218 |
Derichebourg SA | 59,620 | 252,701 |
Elior Group SA * | 157,406 | 432,182 |
Eramet SA (b) | 3,388 | 328,174 |
Euroapi SA * | 4,283 | 13,435 |
Euronext NV | 5,592 | 503,564 |
Eutelsat Communications SACA *(b) | 127,267 | 511,240 |
Fnac Darty SA | 19,409 | 682,827 |
Gaztransport Et Technigaz SA | 2,240 | 312,212 |
Gecina SA | 5,560 | 567,686 |
Getlink SE | 24,535 | 417,676 |
ICADE | 13,685 | 363,849 |
ID Logistics Group SACA * | 72 | 26,563 |
Imerys SA | 18,402 | 591,325 |
Ipsen SA | 4,017 | 488,613 |
IPSOS SA | 9,362 | 626,483 |
JCDecaux SE * | 21,894 | 456,980 |
La Francaise des Jeux SAEM | 8,906 | 335,620 |
Mercialys SA | 30,384 | 328,881 |
Mersen SA | 1,193 | 44,063 |
Metropole Television SA | 29,623 | 418,331 |
Nexans SA | 7,322 | 779,769 |
Nexity SA | 40,067 | 449,395 |
Quadient SA | 17,530 | 335,446 |
Remy Cointreau SA | 2,083 | 197,614 |
Sartorius Stedim Biotech | 872 | 187,800 |
SEB SA | 6,531 | 770,817 |
SMCP SA * | 34,656 | 83,442 |
Societe BIC SA | 8,123 | 571,234 |
SOITEC * | 1,008 | 98,565 |
Sopra Steria Group | 2,963 | 648,773 |
SPIE SA | 24,266 | 882,328 |
Technip Energies NV | 8,113 | 191,061 |
Television Francaise 1 SA | 57,225 | 522,548 |
Trigano SA | 2,036 | 309,514 |
Ubisoft Entertainment SA * | 24,581 | 578,868 |
Vallourec SACA * | 20,701 | 356,404 |
Verallia SA | 13,176 | 507,477 |
Vicat SACA | 9,562 | 353,012 |
Virbac SACA | 535 | 197,712 |
SECURITY | NUMBER OF SHARES | VALUE ($) |
Worldline SA * | 34,397 | 356,783 |
21,756,287 | ||
Germany 3.3% | ||
1&1 AG | 26,709 | 466,767 |
AIXTRON SE | 3,761 | 87,390 |
Aroundtown SA * | 268,409 | 556,430 |
Auto1 Group SE * | 36,476 | 185,711 |
Bechtle AG | 14,555 | 702,419 |
Befesa SA | 7,586 | 216,884 |
Bilfinger SE * | 12,435 | 578,793 |
BRANICKS Group AG *(b) | 36,111 | 63,577 |
CANCOM SE | 11,933 | 372,621 |
Carl Zeiss Meditec AG, Bearer Shares | 2,610 | 275,389 |
Ceconomy AG * | 169,681 | 390,860 |
CompuGroup Medical SE & Co. KGaA | 3,252 | 97,417 |
CTS Eventim AG & Co. KGaA | 2,677 | 236,724 |
Delivery Hero SE * | 7,308 | 204,460 |
Deutsche Pfandbriefbank AG (b) | 54,992 | 260,834 |
Deutsche Wohnen SE | 6,323 | 119,286 |
Deutz AG * | 71,932 | 415,560 |
Duerr AG | 17,020 | 435,398 |
DWS Group GmbH & Co. KGaA | 8,772 | 370,126 |
Encavis AG * | 8,172 | 147,120 |
Evotec SE * | 7,295 | 75,176 |
Fielmann Group AG | 3,880 | 180,918 |
Fraport AG Frankfurt Airport Services Worldwide * | 6,718 | 336,358 |
Gerresheimer AG | 4,444 | 478,605 |
Grand City Properties SA * | 31,821 | 355,367 |
Grenke AG | 6,181 | 143,895 |
Heidelberger Druckmaschinen AG * | 104,626 | 105,399 |
HelloFresh SE * | 29,817 | 199,922 |
Hensoldt AG | 3,202 | 126,149 |
HOCHTIEF AG | 5,519 | 581,147 |
Hornbach Holding AG & Co. KGaA | 7,521 | 590,172 |
Hugo Boss AG | 9,353 | 503,984 |
Jenoptik AG | 7,468 | 200,219 |
Kontron AG | 7,563 | 152,247 |
Krones AG | 3,096 | 408,151 |
LEG Immobilien SE * | 9,364 | 794,895 |
Mutares SE & Co. KGaA | 1,390 | 62,298 |
Nemetschek SE | 1,608 | 142,098 |
Nordex SE * | 17,987 | 253,187 |
Norma Group SE | 19,004 | 376,310 |
Qiagen NV * | 14,142 | 590,452 |
Rational AG | 300 | 255,899 |
RTL Group SA | 18,055 | 556,542 |
SAF-Holland SE | 16,160 | 311,314 |
Sartorius AG | 47 | 10,971 |
Scout24 SE | 5,506 | 404,458 |
Siltronic AG | 5,813 | 453,033 |
Sixt SE | 4,161 | 398,397 |
Stabilus SE | 5,084 | 315,452 |
Stroeer SE & Co. KGaA | 5,555 | 356,219 |
Suedzucker AG | 23,081 | 329,426 |
Synlab AG | 10,559 | 118,162 |
TAG Immobilien AG * | 40,273 | 572,588 |
Talanx AG | 9,897 | 744,398 |
TeamViewer SE * | 6,870 | 90,634 |
Traton SE | 5,256 | 186,662 |
Varta AG *(b) | 1,702 | 16,911 |
Verbio SE | 1,509 | 31,457 |
Vitesco Technologies Group AG, Class A | 3,182 | 216,721 |
Wacker Chemie AG | 3,793 | 406,033 |
18,615,992 | ||
SECURITY | NUMBER OF SHARES | VALUE ($) |
Hong Kong 2.6% | ||
AAC Technologies Holdings, Inc. | 298,000 | 948,425 |
ASMPT Ltd. | 69,600 | 864,967 |
BOC Aviation Ltd. | 40,500 | 322,126 |
Brightoil Petroleum Holdings Ltd. *(a) | 1,150,000 | 0 |
Budweiser Brewing Co. APAC Ltd. | 191,300 | 266,135 |
Cafe de Coral Holdings Ltd. | 40,000 | 41,486 |
Cathay Pacific Airways Ltd. | 261,363 | 281,370 |
Chow Tai Fook Jewellery Group Ltd. | 298,600 | 406,290 |
CITIC Telecom International Holdings Ltd. | 502,000 | 170,245 |
CK Infrastructure Holdings Ltd. | 35,500 | 200,544 |
Cowell e Holdings, Inc. * | 84,000 | 190,576 |
ESR Group Ltd. | 33,800 | 37,040 |
Fortune Real Estate Investment Trust | 254,000 | 124,785 |
Giordano International Ltd. | 142,000 | 36,238 |
Hang Lung Properties Ltd. | 345,000 | 380,781 |
Henderson Land Development Co. Ltd. | 272,000 | 820,031 |
HKBN Ltd. | 436,500 | 131,304 |
Hong Kong Resources Holdings Co. Ltd. * | 5,781 | 702 |
Hysan Development Co. Ltd. | 122,000 | 190,147 |
IGG, Inc. * | 654,900 | 273,009 |
Jinchuan Group International Resources Co. Ltd. | 4,024,000 | 393,047 |
Kerry Properties Ltd. | 396,500 | 768,661 |
L'Occitane International SA | 60,250 | 248,773 |
Luk Fook Holdings International Ltd. | 141,000 | 338,028 |
Man Wah Holdings Ltd. | 417,600 | 304,785 |
Melco International Development Ltd. * | 334,000 | 250,891 |
MMG Ltd. * | 1,344,000 | 609,402 |
Nexteer Automotive Group Ltd. | 618,000 | 325,752 |
NWS Holdings Ltd. | 298,000 | 252,184 |
Powerlong Real Estate Holdings Ltd. *(b) | 5,222,000 | 436,053 |
PRADA SpA | 41,800 | 340,892 |
Samsonite International SA * | 103,457 | 363,720 |
Sands China Ltd. * | 232,000 | 547,205 |
Sino Land Co. Ltd. | 690,000 | 737,747 |
SJM Holdings Ltd. * | 491,500 | 180,383 |
Swire Properties Ltd. | 164,600 | 340,420 |
Texhong International Group Ltd. * | 389,500 | 211,612 |
Theme International Holdings Ltd. | 560,000 | 42,952 |
United Energy Group Ltd. | 1,874,000 | 133,677 |
United Laboratories International Holdings Ltd. | 146,000 | 172,265 |
Vitasoy International Holdings Ltd. | 176,000 | 131,359 |
VSTECS Holdings Ltd. | 652,000 | 415,174 |
VTech Holdings Ltd. | 80,100 | 462,994 |
Wharf Holdings Ltd. | 235,000 | 756,079 |
Wynn Macau Ltd. * | 207,600 | 192,787 |
14,643,043 | ||
Ireland 0.2% | ||
AIB Group PLC | 127,256 | 658,699 |
Cairn Homes PLC | 226,364 | 381,292 |
Dalata Hotel Group PLC | 30,291 | 136,224 |
Glenveagh Properties PLC * | 21,536 | 29,327 |
Irish Continental Group PLC | 24,642 | 131,678 |
1,337,220 | ||
Israel 1.4% | ||
Alony Hetz Properties & Investments Ltd. | 20,375 | 131,531 |
Ashtrom Group Ltd. * | 7,925 | 108,963 |
Azrieli Group Ltd. | 2,802 | 180,282 |
Bezeq The Israeli Telecommunication Corp. Ltd. | 445,614 | 553,556 |
Cellcom Israel Ltd. * | 43,229 | 180,545 |
SECURITY | NUMBER OF SHARES | VALUE ($) |
Clal Insurance Enterprises Holdings Ltd. * | 15,164 | 252,860 |
Danel Adir Yeoshua Ltd. | 324 | 29,355 |
Delek Automotive Systems Ltd. | 27,744 | 156,281 |
Delek Group Ltd. | 2,466 | 289,641 |
Delta Galil Ltd. | 653 | 29,053 |
Elbit Systems Ltd. | 2,176 | 442,942 |
Electra Ltd. | 83 | 31,561 |
Fattal Holdings 1998 Ltd. * | 196 | 23,780 |
FIBI Holdings Ltd. | 5,257 | 218,946 |
First International Bank Of Israel Ltd. | 6,951 | 275,906 |
Formula Systems 1985 Ltd. | 2,298 | 167,274 |
Fox Wizel Ltd. | 413 | 32,792 |
G City Ltd. * | 54,402 | 157,470 |
Harel Insurance Investments & Financial Services Ltd. | 33,076 | 301,547 |
Isracard Ltd. | 39,930 | 146,075 |
Melisron Ltd. | 525 | 36,015 |
Migdal Insurance & Financial Holdings Ltd. | 25,550 | 32,442 |
Mivne Real Estate KD Ltd. | 56,024 | 134,667 |
Mizrahi Tefahot Bank Ltd. | 15,906 | 579,205 |
Nice Ltd. * | 3,032 | 677,986 |
Nova Ltd. * | 207 | 35,031 |
Partner Communications Co. Ltd. * | 31,753 | 148,427 |
Paz Oil Co. Ltd. | 3,944 | 392,933 |
Phoenix Holdings Ltd. | 30,967 | 295,816 |
Rami Levy Chain Stores Hashikma Marketing 2006 Ltd. | 1,932 | 109,933 |
Shikun & Binui Ltd. * | 58,985 | 126,857 |
Shufersal Ltd. | 104,078 | 685,255 |
Strauss Group Ltd. | 8,279 | 152,082 |
Tower Semiconductor Ltd. * | 17,100 | 553,363 |
7,670,372 | ||
Italy 2.5% | ||
ACEA SpA | 18,389 | 318,983 |
Alitalia - Linee Aeree Italiane SpA *(a) | 14,782 | 0 |
Amplifon SpA | 8,380 | 279,777 |
Anima Holding SpA | 87,155 | 408,352 |
Ariston Holding NV | 5,380 | 27,778 |
Azimut Holding SpA | 21,098 | 555,984 |
Banca Generali SpA | 8,389 | 328,563 |
Banca Mediolanum SpA | 39,539 | 427,874 |
Banca Monte dei Paschi di Siena SpA * | 72,626 | 350,295 |
Banca Popolare di Sondrio SpA | 74,039 | 618,578 |
BFF Bank SpA | 23,481 | 301,323 |
Brembo NV | 30,558 | 388,755 |
Brunello Cucinelli SpA | 231 | 23,576 |
Buzzi SpA | 20,576 | 741,360 |
Cementir Holding NV | 15,351 | 162,542 |
Credito Emiliano SpA | 14,136 | 149,325 |
Danieli & C Officine Meccaniche SpA | 1,972 | 68,186 |
Davide Campari-Milano NV | 27,153 | 272,312 |
De' Longhi SpA | 13,565 | 444,830 |
DiaSorin SpA | 2,238 | 226,032 |
doValue SpA (b) | 35,344 | 78,613 |
Enav SpA | 54,190 | 222,861 |
ERG SpA | 9,264 | 249,476 |
Esprinet SpA * | 41,620 | 227,415 |
FinecoBank Banca Fineco SpA | 41,408 | 634,361 |
Infrastrutture Wireless Italiane SpA | 16,388 | 175,629 |
Interpump Group SpA | 8,920 | 388,553 |
Iren SpA | 304,061 | 611,230 |
Italgas SpA | 127,684 | 707,772 |
Maire Tecnimont SpA | 37,413 | 309,842 |
MFE-MediaForEurope NV, Class A | 157,907 | 463,603 |
MFE-MediaForEurope NV, Class B | 48,798 | 196,435 |
SECURITY | NUMBER OF SHARES | VALUE ($) |
Nexi SpA * | 37,056 | 215,598 |
OVS SpA | 96,740 | 252,735 |
Piaggio & C SpA | 45,546 | 132,785 |
Recordati Industria Chimica e Farmaceutica SpA | 9,388 | 499,567 |
Reply SpA | 1,971 | 257,332 |
Saipem SpA * | 134,772 | 309,265 |
Salvatore Ferragamo SpA | 11,462 | 113,736 |
Saras SpA | 408,795 | 767,647 |
Sesa SpA | 225 | 23,398 |
SOL SpA | 1,296 | 49,855 |
Technogym SpA | 16,443 | 155,066 |
Unieuro SpA | 18,822 | 183,833 |
UnipolSai Assicurazioni SpA | 114,682 | 328,370 |
Webuild SpA | 94,518 | 237,245 |
13,886,647 | ||
Japan 36.0% | ||
77 Bank Ltd. | 11,700 | 330,763 |
ABC-Mart, Inc. | 17,600 | 350,562 |
Acom Co. Ltd. | 131,000 | 337,786 |
Activia Properties, Inc. | 73 | 181,182 |
Adastria Co. Ltd. | 10,880 | 236,905 |
ADEKA Corp. | 39,600 | 822,916 |
Advance Residence Investment Corp. | 105 | 227,011 |
Aeon Delight Co. Ltd. | 10,600 | 250,714 |
AEON Financial Service Co. Ltd. | 51,000 | 424,533 |
Aeon Hokkaido Corp. | 23,000 | 135,286 |
Aeon Mall Co. Ltd. | 40,730 | 465,663 |
AEON REIT Investment Corp. | 223 | 195,019 |
Ahresty Corp. | 7,400 | 29,726 |
Ai Holdings Corp. | 7,200 | 110,740 |
Aica Kogyo Co. Ltd. | 18,700 | 433,452 |
Aichi Steel Corp. | 13,300 | 291,705 |
Aida Engineering Ltd. | 23,400 | 132,466 |
Aiful Corp. | 67,700 | 196,650 |
Ain Holdings, Inc. | 14,000 | 529,851 |
Aisan Industry Co. Ltd. | 4,900 | 45,772 |
Alconix Corp. | 25,600 | 223,094 |
Alpen Co. Ltd. | 12,300 | 162,126 |
Amano Corp. | 18,700 | 449,759 |
ANA Holdings, Inc. | 29,200 | 554,566 |
Anritsu Corp. | 49,200 | 375,108 |
AOKI Holdings, Inc. | 24,400 | 171,895 |
Aoyama Trading Co. Ltd. | 37,100 | 381,063 |
Aozora Bank Ltd. (b) | 31,300 | 486,306 |
Arata Corp. | 31,400 | 695,698 |
ARCLANDS Corp. | 15,800 | 194,502 |
Arcs Co. Ltd. | 35,300 | 692,826 |
ARE Holdings, Inc. | 25,300 | 327,017 |
Ariake Japan Co. Ltd. | 3,400 | 110,784 |
Artience Co. Ltd. | 23,300 | 431,807 |
As One Corp. | 8,360 | 137,733 |
Asahi Intecc Co. Ltd. | 9,300 | 136,270 |
Asanuma Corp. | 7,000 | 166,432 |
Asics Corp. | 17,200 | 737,232 |
ASKUL Corp. | 12,900 | 194,820 |
Autobacs Seven Co. Ltd. | 35,100 | 354,900 |
Avex, Inc. | 18,500 | 152,313 |
Awa Bank Ltd. | 8,500 | 144,824 |
Axial Retailing, Inc. | 10,800 | 72,181 |
Azbil Corp. | 22,500 | 628,425 |
Bando Chemical Industries Ltd. | 4,200 | 47,537 |
BayCurrent Consulting, Inc. | 5,500 | 117,079 |
Belc Co. Ltd. | 4,700 | 224,299 |
Bell System24 Holdings, Inc. | 10,500 | 103,167 |
Belluna Co. Ltd. | 40,200 | 161,867 |
SECURITY | NUMBER OF SHARES | VALUE ($) |
Benesse Holdings, Inc. | 4,700 | 77,146 |
Bic Camera, Inc. | 88,900 | 863,243 |
BIPROGY, Inc. | 15,300 | 445,099 |
BML, Inc. | 10,400 | 192,097 |
Bunka Shutter Co. Ltd. | 27,600 | 297,465 |
C Uyemura & Co. Ltd. | 2,100 | 137,459 |
Calbee, Inc. | 24,000 | 524,198 |
Canon Electronics, Inc. | 9,100 | 129,879 |
Canon Marketing Japan, Inc. | 20,400 | 560,538 |
Capcom Co. Ltd. | 16,600 | 273,276 |
Casio Computer Co. Ltd. | 86,700 | 722,321 |
Cawachi Ltd. | 13,400 | 241,825 |
Central Glass Co. Ltd. | 14,900 | 264,598 |
Chiba Bank Ltd. | 78,300 | 661,405 |
Chori Co. Ltd. | 2,200 | 49,088 |
Chudenko Corp. | 12,800 | 258,271 |
Chugin Financial Group, Inc. | 8,000 | 67,370 |
Chugoku Marine Paints Ltd. | 15,600 | 204,162 |
Citizen Watch Co. Ltd. | 94,200 | 625,769 |
CKD Corp. | 19,000 | 355,091 |
Colowide Co. Ltd. | 8,900 | 121,251 |
Comforia Residential REIT, Inc. | 55 | 119,061 |
Concordia Financial Group Ltd. | 182,500 | 983,335 |
Cosmos Pharmaceutical Corp. | 4,970 | 458,507 |
Create SD Holdings Co. Ltd. | 9,400 | 203,146 |
Credit Saison Co. Ltd. | 45,300 | 836,200 |
CTI Engineering Co. Ltd. | 700 | 21,280 |
CyberAgent, Inc. | 110,400 | 687,854 |
Dai-Dan Co. Ltd. | 3,500 | 62,023 |
Daihen Corp. | 6,300 | 382,960 |
Daiho Corp. | 4,600 | 96,355 |
Daiichikosho Co. Ltd. | 20,200 | 235,782 |
Daiki Aluminium Industry Co. Ltd. | 23,200 | 195,819 |
Daikokutenbussan Co. Ltd. | 3,000 | 153,392 |
Daio Paper Corp. | 56,400 | 403,797 |
Daiseki Co. Ltd. | 6,960 | 132,275 |
Daishi Hokuetsu Financial Group, Inc. | 9,100 | 260,827 |
Daiwa House REIT Investment Corp. | 194 | 325,877 |
Daiwa Office Investment Corp. | 29 | 105,731 |
Daiwa Securities Living Investments Corp. | 176 | 119,506 |
DCM Holdings Co. Ltd. | 63,800 | 590,680 |
DeNA Co. Ltd. | 25,586 | 258,064 |
Descente Ltd. | 5,552 | 125,183 |
Dexerials Corp. | 7,100 | 265,942 |
DMG Mori Co. Ltd. | 24,600 | 657,620 |
Doshisha Co. Ltd. | 10,600 | 146,106 |
Doutor Nichires Holdings Co. Ltd. | 12,300 | 164,715 |
DTS Corp. | 9,500 | 259,167 |
Duskin Co. Ltd. | 16,600 | 345,079 |
DyDo Group Holdings, Inc. | 8,900 | 154,047 |
Eagle Industry Co. Ltd. | 16,400 | 190,230 |
Earth Corp. | 7,100 | 197,600 |
Eizo Corp. | 6,550 | 210,463 |
Elecom Co. Ltd. | 12,927 | 122,335 |
Elematec Corp. | 2,400 | 29,290 |
en Japan, Inc. | 6,800 | 113,050 |
eRex Co. Ltd. * | 21,400 | 112,208 |
Exedy Corp. | 26,900 | 492,505 |
Ezaki Glico Co. Ltd. | 22,800 | 588,604 |
Fancl Corp. | 12,900 | 150,667 |
FCC Co. Ltd. | 26,800 | 381,333 |
Ferrotec Holdings Corp. | 13,100 | 248,724 |
Food & Life Cos. Ltd. | 12,700 | 240,041 |
Foster Electric Co. Ltd. | 24,798 | 196,475 |
FP Corp. | 13,660 | 219,795 |
Frontier Real Estate Investment Corp. | 56 | 162,797 |
F-Tech, Inc. | 6,700 | 30,707 |
Fuji Co. Ltd. | 15,400 | 187,777 |
SECURITY | NUMBER OF SHARES | VALUE ($) |
Fuji Corp. | 30,138 | 505,577 |
Fuji Media Holdings, Inc. | 23,200 | 275,741 |
Fuji Oil Co. Ltd. | 78,300 | 238,189 |
Fuji Oil Holdings, Inc. | 24,200 | 356,176 |
Fuji Seal International, Inc. | 25,500 | 327,660 |
Fuji Soft, Inc. | 8,200 | 320,897 |
Fujimi, Inc. | 6,100 | 132,307 |
Fujitec Co. Ltd. | 15,700 | 387,218 |
Fujitsu General Ltd. | 15,210 | 196,199 |
Fukuda Denshi Co. Ltd. | 800 | 33,173 |
Fukuoka Financial Group, Inc. | 26,500 | 703,907 |
Fukuoka REIT Corp. | 110 | 118,152 |
Fukushima Galilei Co. Ltd. | 700 | 27,989 |
Fukuyama Transporting Co. Ltd. | 16,399 | 396,247 |
Furukawa Co. Ltd. | 4,400 | 55,775 |
Furuno Electric Co. Ltd. | 2,000 | 26,578 |
Fuso Chemical Co. Ltd. | 4,400 | 113,006 |
Futaba Industrial Co. Ltd. | 13,800 | 80,930 |
Fuyo General Lease Co. Ltd. | 2,745 | 235,410 |
Gakken Holdings Co. Ltd. | 21,000 | 122,053 |
Geo Holdings Corp. | 22,100 | 277,952 |
GLOBERIDE, Inc. | 11,000 | 140,008 |
Glory Ltd. | 23,300 | 419,825 |
GLP J-Reit | 322 | 261,887 |
GMO internet group, Inc. | 10,200 | 167,475 |
Godo Steel Ltd. | 5,000 | 167,625 |
Goldwin, Inc. | 3,000 | 181,969 |
GS Yuasa Corp. | 41,200 | 777,338 |
G-Tekt Corp. | 23,100 | 315,168 |
GungHo Online Entertainment, Inc. | 9,750 | 143,340 |
Gunma Bank Ltd. | 81,400 | 495,413 |
Gunze Ltd. | 9,400 | 318,606 |
H.U. Group Holdings, Inc. | 29,200 | 443,874 |
H2O Retailing Corp. | 59,500 | 672,305 |
Hachijuni Bank Ltd. | 70,200 | 468,299 |
Hagiwara Electric Holdings Co. Ltd. | 1,300 | 35,732 |
Hakuto Co. Ltd. | 3,300 | 113,955 |
Halows Co. Ltd. | 900 | 26,385 |
Hamamatsu Photonics KK | 12,100 | 443,364 |
Happinet Corp. | 13,500 | 261,471 |
Harmonic Drive Systems, Inc. | 4,300 | 107,392 |
Hazama Ando Corp. | 80,300 | 598,721 |
Heiwa Corp. | 16,000 | 200,432 |
Heiwa Real Estate Co. Ltd. | 5,300 | 146,524 |
Heiwado Co. Ltd. | 29,600 | 456,429 |
Hikari Tsushin, Inc. | 3,750 | 609,457 |
Hirata Corp. | 2,500 | 111,846 |
Hirogin Holdings, Inc. | 10,200 | 73,403 |
Hirose Electric Co. Ltd. | 5,239 | 556,098 |
Hisamitsu Pharmaceutical Co., Inc. | 13,700 | 332,384 |
Hitachi Zosen Corp. | 77,800 | 602,163 |
Hogy Medical Co. Ltd. | 5,100 | 120,525 |
Hokkaido Electric Power Co., Inc. | 207,500 | 1,474,435 |
Hokkoku Financial Holdings, Inc. | 1,100 | 35,311 |
Hokuetsu Corp. (b) | 58,400 | 492,535 |
Hokuhoku Financial Group, Inc. | 39,100 | 479,638 |
Hokuriku Electric Power Co. | 125,300 | 733,046 |
Horiba Ltd. | 8,800 | 853,768 |
Hoshizaki Corp. | 17,800 | 613,365 |
Hosiden Corp. | 38,000 | 474,492 |
Hosokawa Micron Corp. | 4,300 | 120,189 |
House Foods Group, Inc. | 25,600 | 504,392 |
Hulic Co. Ltd. | 71,700 | 660,691 |
Hulic Reit, Inc. | 119 | 113,732 |
Hyakugo Bank Ltd. | 43,200 | 177,664 |
Hyakujushi Bank Ltd. | 7,500 | 137,401 |
Ibiden Co. Ltd. | 15,200 | 577,805 |
Ichikoh Industries Ltd. | 8,700 | 29,444 |
SECURITY | NUMBER OF SHARES | VALUE ($) |
Idec Corp. | 6,900 | 121,793 |
IDOM, Inc. | 30,700 | 271,738 |
Iino Kaiun Kaisha Ltd. | 23,600 | 189,700 |
Inaba Denki Sangyo Co. Ltd. | 26,300 | 613,593 |
Inabata & Co. Ltd. | 31,200 | 636,010 |
Inageya Co. Ltd. | 5,100 | 41,237 |
Industrial & Infrastructure Fund Investment Corp. | 172 | 142,223 |
Integrated Design & Engineering Holdings Co. Ltd. | 7,700 | 228,449 |
Internet Initiative Japan, Inc. | 16,500 | 279,163 |
Invincible Investment Corp. | 335 | 150,094 |
Iriso Electronics Co. Ltd. | 5,800 | 113,417 |
Ishihara Sangyo Kaisha Ltd. | 21,100 | 244,429 |
Ito En Ltd. | 15,200 | 368,832 |
Itochu Enex Co. Ltd. | 43,500 | 421,036 |
Itoham Yonekyu Holdings, Inc. | 28,500 | 743,733 |
Itoki Corp. | 2,600 | 31,060 |
Iyogin Holdings, Inc. | 9,200 | 70,213 |
Izumi Co. Ltd. | 29,500 | 685,358 |
J Front Retailing Co. Ltd. | 74,600 | 649,679 |
Jaccs Co. Ltd. | 8,300 | 298,276 |
JAFCO Group Co. Ltd. | 19,000 | 214,427 |
Japan Airlines Co. Ltd. | 34,400 | 609,525 |
Japan Airport Terminal Co. Ltd. | 3,400 | 120,153 |
Japan Aviation Electronics Industry Ltd. | 17,600 | 282,746 |
Japan Excellent, Inc. | 188 | 153,576 |
Japan Hotel REIT Investment Corp. | 322 | 169,210 |
Japan Lifeline Co. Ltd. | 20,700 | 151,932 |
Japan Logistics Fund, Inc. | 71 | 126,594 |
Japan Metropolitan Fund Invest | 762 | 460,041 |
Japan Petroleum Exploration Co. Ltd. | 11,600 | 489,326 |
Japan Prime Realty Investment Corp. | 98 | 212,059 |
Japan Real Estate Investment Corp. | 133 | 451,022 |
Japan Steel Works Ltd. | 20,300 | 492,759 |
Japan Wool Textile Co. Ltd. | 28,000 | 241,721 |
Jeol Ltd. | 5,300 | 209,983 |
JM Holdings Co. Ltd. | 1,700 | 28,499 |
J-Oil Mills, Inc. | 3,400 | 42,622 |
Joshin Denki Co. Ltd. | 27,800 | 448,444 |
Joyful Honda Co. Ltd. | 31,000 | 440,884 |
Juki Corp. | 34,100 | 116,157 |
Juroku Financial Group, Inc. | 1,700 | 51,059 |
JVCKenwood Corp. | 86,700 | 440,734 |
Kadokawa Corp. | 12,900 | 235,789 |
Kaga Electronics Co. Ltd. | 7,700 | 303,332 |
Kagome Co. Ltd. | 15,000 | 383,443 |
Kakaku.com, Inc. | 17,700 | 203,595 |
Kaken Pharmaceutical Co. Ltd. | 12,482 | 271,322 |
Kameda Seika Co. Ltd. | 4,900 | 129,027 |
Kamei Corp. | 7,400 | 95,290 |
Kamigumi Co. Ltd. | 33,300 | 719,133 |
Kanamoto Co. Ltd. | 21,600 | 363,290 |
Kandenko Co. Ltd. | 67,500 | 752,942 |
Kanematsu Corp. | 53,400 | 868,274 |
Kansai Paint Co. Ltd. | 42,560 | 554,054 |
Kanto Denka Kogyo Co. Ltd. | 25,400 | 173,334 |
Katitas Co. Ltd. | 9,061 | 109,166 |
Kato Sangyo Co. Ltd. | 19,800 | 574,199 |
Kawada Technologies, Inc. | 1,800 | 34,267 |
KDX Realty Investment Corp. | 367 | 361,986 |
Keihan Holdings Co. Ltd. | 18,700 | 391,104 |
Keikyu Corp. | 54,900 | 436,425 |
Keio Corp. | 22,700 | 555,407 |
Keisei Electric Railway Co. Ltd. | 11,100 | 413,507 |
Keiyo Bank Ltd. | 31,000 | 152,415 |
KH Neochem Co. Ltd. | 15,000 | 230,321 |
Kissei Pharmaceutical Co. Ltd. | 6,000 | 137,483 |
SECURITY | NUMBER OF SHARES | VALUE ($) |
Kitz Corp. | 37,500 | 319,191 |
Kiyo Bank Ltd. | 15,700 | 180,358 |
Koa Corp. | 10,600 | 109,327 |
Kobayashi Pharmaceutical Co. Ltd. | 9,400 | 333,229 |
Kobe Bussan Co. Ltd. | 11,400 | 246,209 |
Koei Tecmo Holdings Co. Ltd. | 12,960 | 120,546 |
Kohnan Shoji Co. Ltd. | 16,200 | 457,495 |
Kojima Co. Ltd. | 26,200 | 135,162 |
Kokuyo Co. Ltd. | 33,900 | 579,153 |
Komeri Co. Ltd. | 18,400 | 446,127 |
Komori Corp. | 3,800 | 29,683 |
Konami Group Corp. | 12,100 | 730,081 |
Konishi Co. Ltd. | 4,300 | 36,518 |
Konoike Transport Co. Ltd. | 18,200 | 263,868 |
Kose Corp. | 6,500 | 335,166 |
KPP Group Holdings Co. Ltd. | 36,500 | 171,695 |
Kumagai Gumi Co. Ltd. | 24,300 | 640,625 |
Kumiai Chemical Industry Co. Ltd. | 26,200 | 133,536 |
Kura Sushi, Inc. | 5,000 | 155,198 |
Kureha Corp. | 22,800 | 406,462 |
Kusuri No. Aoki Holdings Co. Ltd. | 10,800 | 201,359 |
KYB Corp. | 10,900 | 372,114 |
Kyoei Steel Ltd. | 16,800 | 239,169 |
Kyokuto Kaihatsu Kogyo Co. Ltd. | 16,700 | 272,368 |
Kyorin Pharmaceutical Co. Ltd. | 16,900 | 196,925 |
Kyoritsu Maintenance Co. Ltd. | 5,800 | 123,689 |
Kyoto Financial Group, Inc. | 23,600 | 420,060 |
Kyowa Kirin Co. Ltd. | 36,300 | 609,617 |
Kyudenko Corp. | 17,900 | 742,919 |
Kyushu Financial Group, Inc. | 58,500 | 391,426 |
LaSalle Logiport REIT | 110 | 110,328 |
Lasertec Corp. | 800 | 172,564 |
Lawson, Inc. | 11,883 | 777,935 |
Life Corp. | 16,000 | 399,700 |
Lintec Corp. | 27,100 | 540,265 |
Lion Corp. | 81,300 | 729,097 |
M3, Inc. | 26,300 | 278,206 |
Mabuchi Motor Co. Ltd. | 29,700 | 459,990 |
Macnica Holdings, Inc. | 16,400 | 723,126 |
Makino Milling Machine Co. Ltd. | 8,250 | 330,930 |
Mandom Corp. | 17,500 | 144,382 |
Marubun Corp. | 14,500 | 133,440 |
Maruha Nichiro Corp. | 34,200 | 667,088 |
Marui Group Co. Ltd. | 33,900 | 517,784 |
Maruichi Steel Tube Ltd. | 18,600 | 478,922 |
MARUKA FURUSATO Corp. | 6,600 | 101,312 |
Maruwa Co. Ltd. | 700 | 147,509 |
Matsuda Sangyo Co. Ltd. | 13,100 | 228,004 |
Max Co. Ltd. | 9,900 | 220,915 |
Maxell Ltd. | 20,700 | 204,232 |
McDonald's Holdings Co. Japan Ltd. | 13,600 | 598,246 |
MCJ Co. Ltd. | 31,400 | 274,108 |
Mebuki Financial Group, Inc. | 223,376 | 790,220 |
Megachips Corp. | 6,200 | 143,745 |
Megmilk Snow Brand Co. Ltd. | 42,500 | 686,366 |
Meidensha Corp. | 22,200 | 491,928 |
Meiko Electronics Co. Ltd. | 7,000 | 228,387 |
Meisei Industrial Co. Ltd. | 3,500 | 29,752 |
MEITEC Group Holdings, Inc. | 15,000 | 279,750 |
Menicon Co. Ltd. | 10,000 | 96,486 |
METAWATER Co. Ltd. | 8,100 | 100,763 |
Mimasu Semiconductor Industry Co. Ltd. | 6,000 | 138,394 |
Mirait One Corp. | 55,200 | 673,992 |
Mirarth Holdings, Inc. | 46,800 | 143,500 |
Mitsuba Corp. | 6,400 | 58,763 |
Mitsubishi HC Capital, Inc. | 81,100 | 525,207 |
Mitsubishi Logisnext Co. Ltd. | 30,300 | 298,837 |
Mitsubishi Logistics Corp. | 18,400 | 610,442 |
SECURITY | NUMBER OF SHARES | VALUE ($) |
Mitsubishi Paper Mills Ltd. | 8,400 | 30,547 |
Mitsubishi Pencil Co. Ltd. | 11,300 | 172,375 |
Mitsubishi Shokuhin Co. Ltd. | 26,500 | 939,646 |
Mitsuboshi Belting Ltd. | 4,500 | 138,018 |
Mitsui DM Sugar Holdings Co. Ltd. | 1,300 | 25,265 |
Mitsui E&S Co. Ltd. | 44,600 | 483,493 |
Mitsui High-Tec, Inc. | 2,270 | 101,641 |
Mitsui Matsushima Holdings Co. Ltd. | 7,100 | 142,803 |
Mitsui-Soko Holdings Co. Ltd. | 11,400 | 336,264 |
Miura Co. Ltd. | 16,800 | 264,319 |
MIXI, Inc. | 19,000 | 289,975 |
Mizuho Leasing Co. Ltd. | 30,000 | 214,303 |
Mizuno Corp. | 9,500 | 461,071 |
Mochida Pharmaceutical Co. Ltd. | 9,600 | 193,662 |
Modec, Inc. | 14,100 | 278,184 |
MonotaRO Co. Ltd. | 16,900 | 202,544 |
Mori Hills REIT Investment Corp. | 117 | 101,816 |
Morinaga & Co. Ltd. | 24,700 | 399,170 |
MOS Food Services, Inc. | 6,000 | 132,708 |
Musashi Seimitsu Industry Co. Ltd. | 25,800 | 273,386 |
Musashino Bank Ltd. | 7,800 | 152,734 |
Nabtesco Corp. | 39,000 | 643,186 |
Nachi-Fujikoshi Corp. | 14,100 | 304,785 |
Nakanishi, Inc. | 8,100 | 124,431 |
Nankai Electric Railway Co. Ltd. | 24,200 | 421,382 |
Nanto Bank Ltd. | 8,800 | 169,134 |
NEC Networks & System Integration Corp. | 19,600 | 325,596 |
NET One Systems Co. Ltd. | 21,748 | 364,524 |
Nexon Co. Ltd. | 34,322 | 535,126 |
Nextage Co. Ltd. | 7,700 | 135,187 |
Nichias Corp. | 23,300 | 638,646 |
Nichicon Corp. | 23,200 | 196,394 |
Nichiha Corp. | 13,100 | 305,454 |
Nichireki Co. Ltd. | 2,000 | 30,511 |
Nifco, Inc. | 23,700 | 572,910 |
Nihon Kohden Corp. | 19,200 | 522,018 |
Nihon M&A Center Holdings, Inc. | 30,700 | 168,031 |
Nihon Parkerizing Co. Ltd. | 33,900 | 260,695 |
Nikkiso Co. Ltd. | 32,900 | 262,746 |
Nikkon Holdings Co. Ltd. | 21,900 | 429,856 |
Nippn Corp. | 27,400 | 422,834 |
Nippon Accommodations Fund, Inc. | 39 | 162,416 |
Nippon Building Fund, Inc. | 142 | 542,553 |
Nippon Carbon Co. Ltd. | 3,700 | 130,460 |
Nippon Chemi-Con Corp. * | 17,600 | 177,879 |
Nippon Denko Co. Ltd. | 63,700 | 125,629 |
Nippon Densetsu Kogyo Co. Ltd. | 19,100 | 262,157 |
Nippon Electric Glass Co. Ltd. | 40,700 | 1,007,085 |
Nippon Gas Co. Ltd. | 22,000 | 358,803 |
Nippon Kanzai Holdings Co. Ltd. | 6,600 | 108,498 |
Nippon Kayaku Co. Ltd. | 69,300 | 564,478 |
Nippon Light Metal Holdings Co. Ltd. | 72,800 | 863,844 |
Nippon Prologis REIT, Inc. | 156 | 269,636 |
NIPPON REIT Investment Corp. | 51 | 115,186 |
Nippon Road Co. Ltd. | 10,400 | 124,671 |
Nippon Seiki Co. Ltd. | 9,200 | 83,659 |
Nippon Sheet Glass Co. Ltd. * | 108,400 | 361,339 |
Nippon Shinyaku Co. Ltd. | 10,100 | 279,470 |
Nippon Shokubai Co. Ltd. | 78,584 | 746,947 |
Nippon Soda Co. Ltd. | 10,000 | 366,836 |
Nippon Thompson Co. Ltd. | 33,000 | 136,747 |
Nippon Yakin Kogyo Co. Ltd. | 7,010 | 207,391 |
Nipro Corp. | 64,700 | 523,481 |
Nishimatsu Construction Co. Ltd. | 12,700 | 367,218 |
Nishimatsuya Chain Co. Ltd. | 15,900 | 220,488 |
Nishi-Nippon Financial Holdings, Inc. | 31,800 | 402,030 |
Nishi-Nippon Railroad Co. Ltd. | 27,600 | 429,981 |
Nishio Holdings Co. Ltd. | 10,300 | 263,183 |
SECURITY | NUMBER OF SHARES | VALUE ($) |
Nissha Co. Ltd. | 24,100 | 259,406 |
Nisshin Oillio Group Ltd. | 14,600 | 469,019 |
Nisshinbo Holdings, Inc. | 85,600 | 648,934 |
Nitta Corp. | 7,200 | 185,773 |
Nittetsu Mining Co. Ltd. | 7,200 | 226,306 |
Nitto Boseki Co. Ltd. | 7,600 | 272,400 |
Nitto Kogyo Corp. | 9,700 | 260,184 |
Noevir Holdings Co. Ltd. | 3,400 | 112,497 |
NOF Corp. | 36,600 | 491,023 |
Nojima Corp. | 55,500 | 663,112 |
Nomura Co. Ltd. | 29,100 | 156,628 |
Nomura Real Estate Holdings, Inc. | 33,900 | 949,102 |
Nomura Real Estate Master Fund, Inc. | 496 | 474,136 |
Noritake Co. Ltd. | 13,400 | 351,770 |
Noritz Corp. | 23,100 | 260,860 |
North Pacific Bank Ltd. | 70,800 | 203,619 |
NPR-RIKEN Corp. | 2,600 | 47,836 |
NS Solutions Corp. | 8,500 | 276,859 |
NS United Kaiun Kaisha Ltd. | 5,400 | 163,401 |
NSD Co. Ltd. | 10,600 | 207,187 |
NTN Corp. | 309,403 | 614,018 |
NTT UD REIT Investment Corp. | 163 | 124,966 |
Obic Co. Ltd. | 2,700 | 346,860 |
Odakyu Electric Railway Co. Ltd. | 49,700 | 558,761 |
Ogaki Kyoritsu Bank Ltd. | 10,700 | 153,257 |
Oiles Corp. | 10,500 | 158,818 |
Okamura Corp. | 28,900 | 437,668 |
Oki Electric Industry Co. Ltd. | 78,100 | 558,159 |
Okinawa Cellular Telephone Co. | 6,800 | 146,111 |
Okinawa Electric Power Co., Inc. | 43,782 | 326,629 |
OKUMA Corp. | 10,000 | 449,139 |
Okumura Corp. | 14,100 | 441,132 |
Onoken Co. Ltd. | 23,600 | 276,105 |
Onward Holdings Co. Ltd. | 55,000 | 211,710 |
Open House Group Co. Ltd. | 18,800 | 571,712 |
Open Up Group, Inc. | 2,000 | 25,336 |
Oracle Corp. | 4,300 | 322,692 |
Organo Corp. | 4,100 | 188,085 |
Orient Corp. | 28,760 | 187,698 |
Oriental Land Co. Ltd. | 21,700 | 598,740 |
Oriental Shiraishi Corp. | 10,200 | 24,475 |
Orix JREIT, Inc. | 300 | 316,224 |
Osaka Soda Co. Ltd. | 4,900 | 287,377 |
OSG Corp. | 27,600 | 355,938 |
Outsourcing, Inc. * | 6,500 | 71,776 |
Pacific Industrial Co. Ltd. | 31,900 | 329,024 |
Pack Corp. | 6,000 | 139,345 |
PAL GROUP Holdings Co. Ltd. | 1,800 | 21,481 |
Paramount Bed Holdings Co. Ltd. | 11,900 | 202,758 |
Park24 Co. Ltd. * | 21,900 | 235,854 |
Pasona Group, Inc. | 11,100 | 155,764 |
Penta-Ocean Construction Co. Ltd. | 140,400 | 704,597 |
PHC Holdings Corp. | 12,600 | 90,907 |
Pigeon Corp. | 31,900 | 290,769 |
Pilot Corp. | 10,600 | 283,706 |
Piolax, Inc. | 8,900 | 151,198 |
Pola Orbis Holdings, Inc. | 25,200 | 231,239 |
Press Kogyo Co. Ltd. | 75,100 | 369,508 |
Pressance Corp. | 2,500 | 28,970 |
Prima Meat Packers Ltd. | 26,400 | 386,166 |
Qol Holdings Co. Ltd. | 13,600 | 152,557 |
Raito Kogyo Co. Ltd. | 17,800 | 231,288 |
Rakuten Group, Inc. * | 133,883 | 643,903 |
Relo Group, Inc. | 17,700 | 153,859 |
Resorttrust, Inc. | 12,188 | 201,716 |
Restar Corp. | 3,500 | 66,230 |
Retail Partners Co. Ltd. | 29,500 | 315,556 |
Riken Technos Corp. | 6,100 | 39,005 |
SECURITY | NUMBER OF SHARES | VALUE ($) |
Rinnai Corp. | 33,800 | 732,361 |
Rohto Pharmaceutical Co. Ltd. | 21,800 | 425,327 |
Round One Corp. | 32,000 | 140,567 |
Ryobi Ltd. | 20,300 | 352,609 |
Ryoyo Ryosan Holdings, Inc. | 23,980 | 422,689 |
S Foods, Inc. | 15,500 | 299,223 |
Saibu Gas Holdings Co. Ltd. | 14,500 | 180,801 |
Saizeriya Co. Ltd. | 5,200 | 175,591 |
Sakai Chemical Industry Co. Ltd. | 14,100 | 183,417 |
Sakai Moving Service Co. Ltd. | 6,700 | 117,938 |
Sakata INX Corp. | 6,800 | 69,064 |
Sakata Seed Corp. | 6,100 | 140,546 |
SAMTY Co. Ltd. | 6,900 | 117,706 |
San-A Co. Ltd. | 9,400 | 282,107 |
San-Ai Obbli Co. Ltd. | 71,400 | 936,677 |
Sangetsu Corp. | 17,200 | 365,650 |
San-In Godo Bank Ltd. | 30,900 | 240,694 |
Sanken Electric Co. Ltd. | 4,200 | 181,328 |
Sanki Engineering Co. Ltd. | 31,200 | 437,976 |
Sankyo Co. Ltd. | 30,400 | 330,205 |
Sanoh Industrial Co. Ltd. | 20,452 | 146,645 |
Santen Pharmaceutical Co. Ltd. | 87,000 | 840,340 |
Sanyo Chemical Industries Ltd. | 7,450 | 194,819 |
Sanyo Denki Co. Ltd. | 3,500 | 165,021 |
Sanyo Special Steel Co. Ltd. | 12,500 | 169,090 |
Sapporo Holdings Ltd. | 14,000 | 506,039 |
Sato Holdings Corp. | 11,700 | 162,124 |
Sawai Group Holdings Co. Ltd. | 2,700 | 100,617 |
SBS Holdings, Inc. | 6,900 | 118,939 |
SCREEN Holdings Co. Ltd. | 11,000 | 1,134,949 |
Scroll Corp. | 20,000 | 118,765 |
SCSK Corp. | 26,528 | 482,258 |
Sega Sammy Holdings, Inc. | 39,700 | 519,632 |
Seibu Holdings, Inc. | 44,755 | 696,571 |
Seiko Group Corp. | 12,900 | 341,220 |
Seiren Co. Ltd. | 13,600 | 226,549 |
Sekisui House Reit, Inc. | 347 | 177,803 |
Sekisui Jushi Corp. | 10,100 | 165,074 |
Senko Group Holdings Co. Ltd. | 70,400 | 515,937 |
Senshu Ikeda Holdings, Inc. | 65,700 | 167,249 |
Seria Co. Ltd. | 22,800 | 386,488 |
Seven Bank Ltd. | 155,100 | 277,253 |
Sharp Corp. * | 124,100 | 651,421 |
Shibaura Machine Co. Ltd. | 7,200 | 161,182 |
Shiga Bank Ltd. | 7,700 | 199,137 |
Shikoku Electric Power Co., Inc. | 109,500 | 907,497 |
Shinagawa Refractories Co. Ltd. | 2,000 | 24,372 |
Shindengen Electric Manufacturing Co. Ltd. | 6,200 | 116,150 |
Shin-Etsu Polymer Co. Ltd. | 12,300 | 120,065 |
Shinko Electric Industries Co. Ltd. | 8,700 | 305,459 |
Shinmaywa Industries Ltd. | 35,400 | 269,897 |
Shinnihon Corp. | 3,500 | 35,131 |
Shinsho Corp. | 1,000 | 43,547 |
Ship Healthcare Holdings, Inc. | 32,900 | 489,483 |
Shizuoka Financial Group, Inc. | 14,700 | 137,208 |
Shizuoka Gas Co. Ltd. | 38,600 | 236,189 |
SHO-BOND Holdings Co. Ltd. | 5,200 | 200,808 |
Shoei Foods Corp. | 4,900 | 133,797 |
Showa Sangyo Co. Ltd. | 3,300 | 73,984 |
Siix Corp. | 21,700 | 223,711 |
Sinfonia Technology Co. Ltd. | 12,300 | 261,014 |
Sintokogio Ltd. | 5,500 | 43,781 |
SKY Perfect JSAT Holdings, Inc. | 51,700 | 304,239 |
Skylark Holdings Co. Ltd. | 43,500 | 619,904 |
Socionext, Inc. | 3,100 | 90,630 |
Sodick Co. Ltd. | 30,400 | 140,762 |
Sohgo Security Services Co. Ltd. | 135,100 | 751,390 |
SECURITY | NUMBER OF SHARES | VALUE ($) |
Sotetsu Holdings, Inc. | 18,200 | 290,120 |
Square Enix Holdings Co. Ltd. | 16,100 | 581,969 |
Star Micronics Co. Ltd. | 12,900 | 153,170 |
Starts Corp., Inc. | 12,900 | 291,011 |
Sugi Holdings Co. Ltd. | 47,300 | 693,998 |
Sumida Corp. | 13,126 | 103,677 |
Sumitomo Bakelite Co. Ltd. | 17,200 | 489,906 |
Sumitomo Densetsu Co. Ltd. | 1,600 | 35,938 |
Sumitomo Mitsui Construction Co. Ltd. | 153,980 | 396,562 |
Sumitomo Osaka Cement Co. Ltd. | 23,200 | 576,013 |
Sumitomo Pharma Co. Ltd. * | 161,331 | 407,152 |
Sumitomo Riko Co. Ltd. | 7,600 | 63,275 |
Sumitomo Seika Chemicals Co. Ltd. | 5,800 | 184,705 |
Sumitomo Warehouse Co. Ltd. | 18,500 | 306,361 |
Sun Frontier Fudousan Co. Ltd. | 10,200 | 126,862 |
Suruga Bank Ltd. | 48,000 | 292,747 |
SWCC Corp. | 12,100 | 319,041 |
Systena Corp. | 55,000 | 91,643 |
Tachibana Eletech Co. Ltd. | 2,700 | 51,508 |
Tachi-S Co. Ltd. | 25,600 | 324,761 |
Tadano Ltd. | 40,500 | 324,991 |
Taikisha Ltd. | 12,700 | 374,582 |
Taiyo Holdings Co. Ltd. | 7,600 | 154,875 |
Takamatsu Construction Group Co. Ltd. | 11,600 | 195,328 |
Takara Holdings, Inc. | 70,663 | 464,214 |
Takara Standard Co. Ltd. | 25,400 | 309,858 |
Takasago Thermal Engineering Co. Ltd. | 21,100 | 707,359 |
Takashimaya Co. Ltd. | 53,600 | 759,796 |
Takeuchi Manufacturing Co. Ltd. | 9,000 | 341,399 |
Takuma Co. Ltd. | 23,700 | 296,576 |
Tama Home Co. Ltd. | 4,110 | 113,727 |
Tamura Corp. | 37,200 | 152,936 |
Tanseisha Co. Ltd. | 27,400 | 152,971 |
TBS Holdings, Inc. | 10,300 | 268,436 |
TechnoPro Holdings, Inc. | 14,800 | 252,094 |
T-Gaia Corp. | 15,200 | 204,792 |
THK Co. Ltd. | 36,500 | 796,397 |
TKC Corp. | 5,800 | 133,475 |
Toa Corp. | 30,800 | 212,807 |
TOA ROAD Corp. | 4,500 | 37,044 |
Toagosei Co. Ltd. | 53,300 | 536,164 |
Tobishima Corp. | 3,600 | 31,256 |
Tocalo Co. Ltd. | 14,500 | 167,085 |
Toda Corp. | 107,300 | 700,832 |
Toei Co. Ltd. | 6,500 | 154,295 |
Toho Co Ltd./Kobe | 1,400 | 28,399 |
Toho Co. Ltd. | 15,300 | 512,586 |
Toho Holdings Co. Ltd. | 41,200 | 987,040 |
Toho Zinc Co. Ltd. * | 17,100 | 112,858 |
Tokai Carbon Co. Ltd. | 81,700 | 542,029 |
TOKAI Holdings Corp. | 59,600 | 366,579 |
Tokai Rika Co. Ltd. | 39,169 | 533,340 |
Tokai Tokyo Financial Holdings, Inc. | 43,400 | 159,040 |
Token Corp. | 6,150 | 421,995 |
Tokuyama Corp. | 49,100 | 1,013,135 |
Tokyo Century Corp. | 48,900 | 486,718 |
Tokyo Kiraboshi Financial Group, Inc. | 1,100 | 32,652 |
Tokyo Ohka Kogyo Co. Ltd. | 16,700 | 442,855 |
Tokyo Seimitsu Co. Ltd. | 7,200 | 468,524 |
Tokyo Steel Manufacturing Co. Ltd. | 24,700 | 262,013 |
Tokyo Tatemono Co. Ltd. | 54,100 | 900,222 |
Tokyo Tekko Co. Ltd. | 900 | 26,269 |
Tokyu Construction Co. Ltd. | 54,400 | 292,744 |
Tomen Devices Corp. | 900 | 38,200 |
Tomy Co. Ltd. | 25,500 | 407,723 |
Topcon Corp. | 28,900 | 339,438 |
Topre Corp. | 35,200 | 568,187 |
Topy Industries Ltd. | 3,300 | 55,969 |
SECURITY | NUMBER OF SHARES | VALUE ($) |
Toridoll Holdings Corp. | 1,000 | 24,030 |
Toshiba TEC Corp. | 11,900 | 239,356 |
Totetsu Kogyo Co. Ltd. | 14,700 | 293,664 |
Towa Pharmaceutical Co. Ltd. | 10,800 | 194,403 |
Toyo Construction Co. Ltd. | 29,400 | 238,213 |
Toyo Tire Corp. | 46,400 | 877,846 |
Toyobo Co. Ltd. | 90,700 | 643,635 |
Toyota Boshoku Corp. | 41,600 | 615,194 |
TPR Co. Ltd. | 27,100 | 400,489 |
Trancom Co. Ltd. | 4,100 | 149,085 |
Transcosmos, Inc. | 14,100 | 304,803 |
Trend Micro, Inc. | 15,600 | 768,740 |
Trusco Nakayama Corp. | 19,100 | 315,958 |
TS Tech Co. Ltd. | 62,100 | 764,646 |
TSI Holdings Co. Ltd. | 51,000 | 284,617 |
Tsubaki Nakashima Co. Ltd. | 25,800 | 138,494 |
Tsubakimoto Chain Co. | 20,100 | 692,003 |
Tsugami Corp. | 18,800 | 162,317 |
Tsumura & Co. | 20,790 | 500,970 |
TV Asahi Holdings Corp. | 13,790 | 180,857 |
UACJ Corp. | 23,230 | 709,691 |
Uchida Yoko Co. Ltd. | 4,400 | 195,010 |
Ulvac, Inc. | 13,200 | 789,304 |
Unipres Corp. | 51,400 | 380,276 |
United Arrows Ltd. | 15,600 | 179,781 |
United Super Markets Holdings, Inc. | 67,200 | 383,542 |
United Urban Investment Corp. | 338 | 323,870 |
Ushio, Inc. | 29,200 | 384,093 |
USS Co. Ltd. | 55,746 | 425,860 |
UT Group Co. Ltd. | 6,300 | 132,110 |
V Technology Co. Ltd. | 8,100 | 130,133 |
Valor Holdings Co. Ltd. | 42,200 | 646,530 |
Valqua Ltd. | 4,400 | 122,988 |
VT Holdings Co. Ltd. | 57,600 | 190,642 |
Wacoal Holdings Corp. | 16,900 | 369,884 |
Wacom Co. Ltd. | 47,600 | 182,809 |
Wakita & Co. Ltd. | 4,000 | 39,690 |
Warabeya Nichiyo Holdings Co. Ltd. | 14,500 | 220,667 |
Welcia Holdings Co. Ltd. | 36,500 | 536,652 |
Workman Co. Ltd. | 6,600 | 162,146 |
World Co. Ltd. | 13,600 | 179,377 |
Xebio Holdings Co. Ltd. | 26,614 | 170,558 |
YAMABIKO Corp. | 20,600 | 272,610 |
Yamaguchi Financial Group, Inc. | 36,700 | 370,729 |
Yamaichi Electronics Co. Ltd. | 1,800 | 31,043 |
Yamato Kogyo Co. Ltd. | 6,300 | 338,494 |
Yamazen Corp. | 56,900 | 499,722 |
Yaoko Co. Ltd. | 7,792 | 421,254 |
Yellow Hat Ltd. | 18,200 | 236,582 |
Yodogawa Steel Works Ltd. | 13,800 | 433,126 |
Yokogawa Bridge Holdings Corp. | 13,500 | 244,855 |
Yokorei Co. Ltd. | 5,300 | 34,951 |
Yokowo Co. Ltd. | 13,600 | 144,407 |
Yoshinoya Holdings Co. Ltd. | 12,100 | 221,598 |
Yuasa Trading Co. Ltd. | 13,000 | 475,056 |
Zenkoku Hosho Co. Ltd. | 5,900 | 207,160 |
Zensho Holdings Co. Ltd. | 9,200 | 356,585 |
Zeon Corp. | 62,500 | 622,883 |
ZERIA Pharmaceutical Co. Ltd. | 8,000 | 106,096 |
Zojirushi Corp. | 13,200 | 128,759 |
ZOZO, Inc. | 11,200 | 241,231 |
204,044,958 | ||
Luxembourg 0.0% | ||
Espirito Santo Financial Group SA *(a) | 69,773 | 0 |
SECURITY | NUMBER OF SHARES | VALUE ($) |
Netherlands 1.8% | ||
Adyen NV * | 486 | 582,228 |
Allfunds Group PLC | 28,828 | 181,169 |
AMG Critical Materials NV | 5,062 | 118,807 |
Arcadis NV | 11,722 | 723,939 |
Basic-Fit NV *(b) | 4,444 | 97,279 |
BE Semiconductor Industries NV | 3,843 | 509,866 |
Corbion NV | 14,320 | 311,006 |
DSM-Firmenich AG | 26,253 | 2,944,392 |
Eurocommercial Properties NV | 9,665 | 219,820 |
Flow Traders Ltd. | 2,975 | 61,244 |
Fugro NV | 19,976 | 484,523 |
JDE Peet's NV | 15,995 | 355,402 |
Just Eat Takeaway.com NV * | 23,658 | 345,584 |
Koninklijke BAM Groep NV | 163,460 | 666,328 |
Koninklijke Heijmans NV * | 16,088 | 301,935 |
Koninklijke Vopak NV | 13,572 | 538,965 |
OCI NV | 20,002 | 537,985 |
PostNL NV | 245,895 | 330,837 |
TKH Group NV * | 10,916 | 470,196 |
Van Lanschot Kempen NV | 5,240 | 185,622 |
Wereldhave NV | 11,143 | 154,703 |
10,121,830 | ||
New Zealand 0.8% | ||
a2 Milk Co. Ltd. * | 102,703 | 404,864 |
Auckland International Airport Ltd. | 63,230 | 292,477 |
Contact Energy Ltd. | 148,442 | 758,360 |
EBOS Group Ltd. | 31,533 | 651,443 |
Fisher & Paykel Healthcare Corp. Ltd. | 42,065 | 704,494 |
Genesis Energy Ltd. | 43,722 | 59,906 |
Infratil Ltd. | 38,724 | 248,637 |
Mainfreight Ltd. | 12,144 | 485,362 |
Mercury NZ Ltd. | 85,812 | 322,603 |
Meridian Energy Ltd. | 176,061 | 622,464 |
Ryman Healthcare Ltd. * | 42,535 | 101,528 |
4,652,138 | ||
Norway 1.6% | ||
Aker ASA, A Shares | 3,180 | 176,540 |
Aker Solutions ASA | 53,552 | 201,853 |
Austevoll Seafood ASA | 45,150 | 360,521 |
Bakkafrost P | 5,472 | 332,337 |
Bluenord ASA * | 753 | 38,570 |
Borregaard ASA | 13,504 | 231,459 |
BW LPG Ltd. | 20,994 | 304,464 |
DNO ASA | 362,795 | 335,843 |
Elkem ASA | 205,174 | 358,504 |
Europris ASA * | 36,040 | 226,825 |
Frontline PLC | 3,516 | 83,312 |
Gjensidige Forsikring ASA | 27,364 | 438,735 |
Golden Ocean Group Ltd. | 7,991 | 112,832 |
Grieg Seafood ASA | 16,814 | 108,980 |
Hafnia Ltd. | 8,136 | 61,343 |
Hoegh Autoliners ASA | 2,555 | 26,818 |
Kongsberg Gruppen ASA | 6,025 | 425,324 |
Leroy Seafood Group ASA | 94,640 | 417,173 |
MPC Container Ships ASA | 41,263 | 66,326 |
Nordic Semiconductor ASA * | 4,688 | 51,252 |
Norske Skog ASA | 17,027 | 56,970 |
Odfjell Drilling Ltd. | 35,376 | 161,244 |
PGS ASA * | 343,843 | 264,232 |
Protector Forsikring ASA | 1,272 | 25,713 |
Salmar ASA | 7,910 | 497,627 |
Scatec ASA * | 4,441 | 32,411 |
SECURITY | NUMBER OF SHARES | VALUE ($) |
Schibsted ASA, A Shares | 8,954 | 256,163 |
Schibsted ASA, B Shares | 11,129 | 311,774 |
SpareBank 1 Nord Norge | 27,506 | 248,553 |
SpareBank 1 SMN | 26,844 | 352,797 |
SpareBank 1 SR-Bank ASA | 28,571 | 345,953 |
Stolt-Nielsen Ltd. | 7,640 | 326,687 |
Storebrand ASA | 68,239 | 655,067 |
TGS ASA | 31,313 | 353,220 |
TOMRA Systems ASA | 23,252 | 284,851 |
Var Energi ASA | 111,175 | 360,932 |
Wallenius Wilhelmsen ASA | 27,340 | 275,383 |
9,168,588 | ||
Poland 1.3% | ||
Alior Bank SA * | 22,226 | 566,213 |
Allegro.eu SA * | 19,364 | 161,421 |
Asseco Poland SA | 23,781 | 467,368 |
Bank Handlowy w Warszawie SA | 914 | 25,185 |
Bank Polska Kasa Opieki SA | 24,207 | 1,002,177 |
Budimex SA | 227 | 38,400 |
CCC SA * | 10,486 | 243,065 |
CD Projekt SA | 3,605 | 104,878 |
Cyfrowy Polsat SA * | 158,843 | 391,457 |
Dino Polska SA * | 2,105 | 201,664 |
Enea SA * | 214,177 | 446,820 |
Eurocash SA | 10,382 | 34,904 |
Grupa Azoty SA * | 44,999 | 243,053 |
Grupa Kety SA | 2,080 | 431,006 |
Jastrzebska Spolka Weglowa SA * | 36,030 | 271,248 |
KRUK SA | 1,536 | 174,598 |
LPP SA | 95 | 366,053 |
mBank SA * | 1,367 | 229,572 |
Orange Polska SA | 292,017 | 564,481 |
Pepco Group NV * | 24,284 | 114,493 |
Santander Bank Polska SA | 3,499 | 479,478 |
Tauron Polska Energia SA * | 716,526 | 514,908 |
7,072,442 | ||
Portugal 0.3% | ||
Banco Comercial Portugues SA, Class R * | 268,749 | 93,834 |
EDP Renovaveis SA | 16,380 | 224,245 |
Navigator Co. SA | 77,474 | 342,187 |
NOS SGPS SA | 91,929 | 317,866 |
REN - Redes Energeticas Nacionais SGPS SA | 101,841 | 245,896 |
Sonae SGPS SA | 545,790 | 546,481 |
1,770,509 | ||
Republic of Korea 7.9% | ||
Amorepacific Corp. | 8,493 | 1,035,171 |
AMOREPACIFIC Group | 16,771 | 404,868 |
Asia Paper Manufacturing Co. Ltd. | 19,945 | 122,519 |
Asiana Airlines, Inc. * | 30,929 | 244,695 |
BGF retail Co. Ltd. | 2,920 | 275,285 |
BH Co. Ltd. | 7,458 | 93,189 |
Binggrae Co. Ltd. | 751 | 38,667 |
Celltrion, Inc. | 5,471 | 742,876 |
Cheil Worldwide, Inc. | 25,775 | 351,547 |
Chong Kun Dang Pharmaceutical Corp. | 2,231 | 167,459 |
CJ ENM Co. Ltd. * | 8,051 | 440,465 |
CJ Logistics Corp. | 6,859 | 605,071 |
Com2uSCorp | 3,777 | 108,419 |
Cosmax, Inc. | 1,471 | 148,411 |
Daeduck Electronics Co. Ltd. | 9,627 | 159,740 |
Daesang Corp. | 19,193 | 303,673 |
SECURITY | NUMBER OF SHARES | VALUE ($) |
Daesang Holdings Co. Ltd. | 19,794 | 123,883 |
Daewoo Engineering & Construction Co. Ltd. * | 158,084 | 435,575 |
Daou Data Corp. | 4,694 | 42,147 |
Daou Technology, Inc. | 20,240 | 287,890 |
DB HiTek Co. Ltd. | 7,841 | 231,706 |
DGB Financial Group, Inc. | 96,209 | 587,678 |
DL Holdings Co. Ltd. | 7,017 | 269,265 |
Dongjin Semichem Co. Ltd. | 3,981 | 123,080 |
Doosan Bobcat, Inc. | 9,264 | 346,241 |
Doosan Co. Ltd. | 5,446 | 594,893 |
E1 Corp. | 1,009 | 50,077 |
Ecopro BM Co. Ltd. * | 172 | 29,237 |
Ecopro Co. Ltd. * | 465 | 35,149 |
F&F Co. Ltd. | 1,260 | 59,644 |
Fila Holdings Corp. | 18,254 | 537,354 |
Gradiant Corp. | 13,728 | 160,765 |
Green Cross Corp. | 1,345 | 110,506 |
Green Cross Holdings Corp. | 11,593 | 134,103 |
GS Global Corp. | 60,823 | 108,046 |
GS Retail Co. Ltd. | 29,871 | 428,193 |
Handsome Co. Ltd. | 12,131 | 171,764 |
Hanjin Transportation Co. Ltd. | 4,167 | 62,561 |
Hanmi Pharm Co. Ltd. | 605 | 137,821 |
Hanon Systems | 58,252 | 233,291 |
Hansol Chemical Co. Ltd. | 1,169 | 162,145 |
Hanwha Aerospace Co. Ltd. | 4,557 | 692,192 |
Hanwha General Insurance Co. Ltd. | 105,489 | 383,649 |
Hanwha Life Insurance Co. Ltd. | 293,355 | 622,264 |
Hanwha Systems Co. Ltd. | 2,130 | 30,098 |
Harim Holdings Co. Ltd. | 57,812 | 274,678 |
HD Hyundai Construction Equipment Co. Ltd. | 6,187 | 243,244 |
HD Hyundai Heavy Industries Co. Ltd. * | 1,480 | 146,372 |
HD Hyundai Infracore Co. Ltd. | 42,993 | 255,777 |
HD HYUNDAI MIPO * | 3,902 | 210,111 |
HD Korea Shipbuilding & Offshore Engineering Co. Ltd. * | 11,517 | 1,087,394 |
HDC Hyundai Development Co-Engineering & Construction, Class E | 46,723 | 592,574 |
Hite Jinro Co. Ltd. | 10,332 | 156,651 |
HL Mando Co. Ltd. | 19,784 | 557,950 |
Hotel Shilla Co. Ltd. | 5,671 | 242,934 |
HYBE Co. Ltd. | 205 | 29,737 |
Hyosung Advanced Materials Corp. | 833 | 219,783 |
Hyosung Corp. | 5,223 | 226,798 |
Hyosung Heavy Industries Corp. | 1,796 | 400,785 |
Hyosung TNC Corp. | 2,507 | 664,247 |
HYUNDAI Corp. | 10,390 | 128,450 |
Hyundai Department Store Co. Ltd. | 9,186 | 347,467 |
Hyundai Elevator Co. Ltd. | 5,981 | 174,362 |
Hyundai Green Food | 23,912 | 210,024 |
Hyundai Rotem Co. Ltd. | 6,923 | 185,612 |
Hyundai Wia Corp. | 13,602 | 566,190 |
Innocean Worldwide, Inc. | 8,876 | 145,572 |
INTOPS Co. Ltd. | 5,749 | 110,292 |
IS Dongseo Co. Ltd. | 7,043 | 136,136 |
JB Financial Group Co. Ltd. | 56,694 | 543,970 |
Kakao Corp. | 14,189 | 492,768 |
Kangwon Land, Inc. | 21,485 | 237,412 |
KCC Corp. | 2,043 | 369,826 |
KCC Glass Corp. | 5,970 | 173,212 |
KEPCO Plant Service & Engineering Co. Ltd. | 8,171 | 207,328 |
KG Chemical Corp. | 25,184 | 103,453 |
KG Dongbusteel | 8,010 | 40,828 |
SECURITY | NUMBER OF SHARES | VALUE ($) |
KISWIRE Ltd. | 9,048 | 167,929 |
KIWOOM Securities Co. Ltd. | 3,563 | 338,355 |
Kolmar Korea Co. Ltd. | 3,371 | 121,698 |
Kolon Industries, Inc. | 15,354 | 441,954 |
Korea Aerospace Industries Ltd. | 5,966 | 222,144 |
Korea Electric Terminal Co. Ltd. | 3,258 | 151,097 |
Korea Investment Holdings Co. Ltd. | 14,314 | 691,846 |
Korea Line Corp. * | 77,760 | 100,597 |
Korea Petrochemical Ind Co. Ltd. | 2,905 | 284,823 |
Korean Reinsurance Co. | 63,386 | 374,653 |
Krafton, Inc. * | 2,353 | 404,967 |
Kukdo Chemical Co. Ltd. | 3,534 | 94,831 |
Kumho Tire Co., Inc. * | 36,086 | 182,721 |
Kwang Dong Pharmaceutical Co. Ltd. | 25,534 | 125,807 |
L&F Co. Ltd. * | 256 | 29,947 |
LG Energy Solution Ltd. * | 1,448 | 402,861 |
LIG Nex1 Co. Ltd. | 269 | 31,142 |
Lotte Chilsung Beverage Co. Ltd. | 1,420 | 129,926 |
Lotte Corp. | 13,786 | 274,789 |
LOTTE Fine Chemical Co. Ltd. | 7,886 | 255,962 |
Lotte Rental Co. Ltd. | 11,375 | 223,164 |
LS Corp. | 9,608 | 949,343 |
LS Electric Co. Ltd. | 5,120 | 646,030 |
LX Hausys Ltd. | 8,748 | 271,998 |
LX International Corp. | 29,307 | 589,700 |
LX Semicon Co. Ltd. | 3,316 | 174,563 |
Mcnex Co. Ltd. | 6,369 | 117,155 |
Meritz Financial Group, Inc. | 19,546 | 1,117,590 |
Mirae Asset Securities Co. Ltd. | 71,809 | 391,365 |
Namyang Dairy Products Co. Ltd. | 67 | 24,998 |
NCSoft Corp. | 3,544 | 447,785 |
Netmarble Corp. * | 3,180 | 127,326 |
Nexen Tire Corp. | 22,805 | 153,218 |
NH Investment & Securities Co. Ltd. | 43,545 | 391,408 |
NHN Corp. | 7,825 | 133,535 |
NongShim Co. Ltd. | 1,049 | 301,209 |
OCI Holdings Co. Ltd. | 4,342 | 295,830 |
Orion Corp. | 4,548 | 304,370 |
Orion Holdings Corp. | 14,456 | 153,665 |
Ottogi Corp. | 167 | 50,202 |
Pan Ocean Co. Ltd. | 91,073 | 269,245 |
Partron Co. Ltd. | 28,550 | 165,073 |
Poongsan Corp. | 13,892 | 649,132 |
POSCO Future M Co. Ltd. | 462 | 92,944 |
Posco International Corp. | 20,712 | 683,114 |
S-1 Corp. | 8,212 | 353,704 |
Samchully Co. Ltd. | 2,787 | 185,074 |
Samsung Biologics Co. Ltd. * | 56 | 31,475 |
Samsung Card Co. Ltd. | 13,070 | 368,151 |
Samsung E&A Co. Ltd. * | 30,202 | 572,609 |
Samsung Heavy Industries Co. Ltd. * | 70,555 | 478,042 |
Samsung Securities Co. Ltd. | 16,718 | 457,336 |
SAMT Co. Ltd. | 63,682 | 168,544 |
Samyang Corp. | 3,492 | 127,284 |
SD Biosensor, Inc. * | 18,221 | 138,290 |
SeAH Besteel Holdings Corp. | 10,489 | 167,733 |
SeAH Steel Corp. | 1,054 | 104,287 |
Sebang Global Battery Co. Ltd. | 4,186 | 307,574 |
Seegene, Inc. | 9,414 | 150,244 |
Seohee Construction Co. Ltd. | 168,184 | 169,170 |
Seoul Semiconductor Co. Ltd. | 20,901 | 147,334 |
Seoyon Co. Ltd. | 3,101 | 20,833 |
Seoyon E-Hwa Co. Ltd. | 8,696 | 114,435 |
SFA Engineering Corp. | 9,436 | 175,113 |
Shinsegae, Inc. | 4,681 | 560,556 |
SIMMTECH Co. Ltd. | 4,845 | 105,691 |
SK Chemicals Co. Ltd. | 4,352 | 189,137 |
SK Discovery Co. Ltd. | 11,445 | 375,385 |
SECURITY | NUMBER OF SHARES | VALUE ($) |
SK Gas Ltd. | 2,131 | 254,561 |
SK Networks Co. Ltd. | 149,262 | 541,824 |
SK Square Co. Ltd. * | 3,356 | 184,387 |
SKC Co. Ltd. * | 3,701 | 292,518 |
SL Corp. | 5,928 | 142,937 |
SNT Motiv Co. Ltd. | 3,708 | 123,752 |
Songwon Industrial Co. Ltd. | 8,620 | 89,341 |
Soulbrain Co. Ltd. | 992 | 214,155 |
Sungwoo Hitech Co. Ltd. | 35,196 | 238,096 |
TKG Huchems Co. Ltd. | 9,120 | 130,127 |
Unid Co. Ltd. | 2,582 | 178,743 |
WONIK IPS Co. Ltd. * | 7,178 | 191,169 |
Young Poong Corp. | 448 | 131,613 |
Youngone Corp. | 11,457 | 317,049 |
Youngone Holdings Co. Ltd. | 3,887 | 238,838 |
Yuhan Corp. | 5,977 | 310,908 |
44,515,239 | ||
Singapore 1.3% | ||
AEM Holdings Ltd. | 13,400 | 22,933 |
CapitaLand Ascendas REIT | 268,121 | 507,880 |
CapitaLand Ascott Trust | 238,404 | 158,346 |
CapitaLand China Trust | 186,700 | 90,692 |
CapitaLand Integrated Commercial Trust | 317,101 | 452,026 |
CapitaLand Investment Ltd. * | 214,998 | 415,774 |
City Developments Ltd. | 80,500 | 360,796 |
ESR-LOGOS REIT | 116,900 | 24,835 |
First Resources Ltd. | 131,900 | 135,885 |
Frasers Logistics & Commercial Trust | 176,100 | 127,564 |
Genting Singapore Ltd. | 729,600 | 486,913 |
Geo Energy Resources Ltd. | 95,900 | 21,427 |
Keppel DC REIT | 21,500 | 26,818 |
Keppel Infrastructure Trust | 763,615 | 264,909 |
Keppel Ltd. | 216,000 | 1,080,412 |
Manulife U.S. Real Estate Investment Trust * | 1,584,300 | 113,024 |
Mapletree Industrial Trust | 128,266 | 212,387 |
Mapletree Logistics Trust | 189,132 | 185,596 |
Mapletree Pan Asia Commercial Trust | 133,492 | 122,328 |
Netlink NBN Trust | 292,400 | 183,145 |
SATS Ltd. * | 104,549 | 192,003 |
Seatrium Ltd. * | 1,505,460 | 107,543 |
Sembcorp Industries Ltd. | 112,500 | 439,658 |
Sheng Siong Group Ltd. | 26,100 | 29,587 |
Singapore Exchange Ltd. | 66,800 | 455,678 |
Singapore Technologies Engineering Ltd. | 220,400 | 647,421 |
Suntec Real Estate Investment Trust | 186,300 | 146,876 |
Thai Beverage PCL | 463,000 | 167,659 |
UOL Group Ltd. | 85,801 | 366,349 |
7,546,464 | ||
Spain 1.1% | ||
Abengoa SA, B Shares *(a) | 66,135,341 | 71 |
Almirall SA | 12,448 | 113,608 |
Applus Services SA | 32,139 | 434,908 |
Atresmedia Corp. de Medios de Comunicacion SA | 29,943 | 150,377 |
Bankinter SA | 92,733 | 732,976 |
Caja de Ahorros del Mediterraneo *(a) | 5,382 | 0 |
Cia de Distribucion Integral Logista Holdings SA | 11,649 | 316,846 |
CIE Automotive SA | 10,150 | 268,294 |
Construcciones y Auxiliar de Ferrocarriles SA | 5,634 | 192,862 |
Corp. ACCIONA Energias Renovables SA | 6,148 | 124,849 |
Ence Energia y Celulosa SA | 33,576 | 119,586 |
SECURITY | NUMBER OF SHARES | VALUE ($) |
Faes Farma SA | 55,957 | 203,041 |
Fluidra SA | 14,539 | 307,764 |
Gestamp Automocion SA | 90,513 | 271,213 |
Indra Sistemas SA | 20,208 | 386,313 |
Inmobiliaria Colonial Socimi SA | 33,991 | 198,803 |
Melia Hotels International SA * | 20,724 | 161,157 |
Merlin Properties Socimi SA | 61,687 | 693,926 |
Obrascon Huarte Lain SA * | 280,346 | 100,990 |
Prosegur Compania de Seguridad SA | 119,272 | 211,471 |
Sacyr SA | 121,119 | 421,110 |
Unicaja Banco SA | 192,235 | 251,108 |
Vidrala SA | 2,902 | 305,158 |
Viscofan SA | 6,865 | 436,472 |
6,402,903 | ||
Sweden 4.2% | ||
AAK AB | 24,201 | 622,487 |
AddLife AB, B Shares | 13,031 | 119,880 |
AddTech AB, B Shares | 10,705 | 222,554 |
AFRY AB | 31,435 | 493,803 |
Alleima AB | 15,952 | 99,147 |
Ambea AB | 34,422 | 198,185 |
Arjo AB, B Shares | 57,501 | 241,332 |
Avanza Bank Holding AB | 6,105 | 130,830 |
Axfood AB | 19,181 | 496,202 |
Beijer Alma AB * | 6,580 | 124,524 |
Beijer Ref AB (b) | 17,646 | 248,691 |
Betsson AB, Class B | 26,492 | 292,826 |
BHG Group AB * | 17,562 | 21,807 |
Bilia AB, A Shares | 41,082 | 515,988 |
Billerud Aktiebolag | 81,890 | 679,166 |
Bonava AB, B Shares * | 328,273 | 298,530 |
Bravida Holding AB | 53,232 | 359,949 |
Castellum AB * | 40,203 | 477,690 |
Clas Ohlson AB, B Shares | 14,863 | 179,371 |
Cloetta AB, B Shares | 82,749 | 123,222 |
Coor Service Management Holding AB | 46,799 | 203,496 |
Corem Property Group AB, B Shares | 29,290 | 21,761 |
Dometic Group AB | 82,061 | 586,418 |
Dustin Group AB * | 137,805 | 156,570 |
Electrolux Professional AB, B Shares | 29,071 | 187,709 |
Elekta AB, B Shares | 59,891 | 426,474 |
Embracer Group AB *(b) | 40,946 | 102,243 |
EQT AB | 11,116 | 299,902 |
Evolution AB | 4,036 | 445,918 |
Fabege AB | 25,789 | 197,242 |
Fastighets AB Balder, B Shares * | 45,364 | 285,943 |
Getinge AB, B Shares | 37,567 | 790,876 |
Granges AB | 34,428 | 406,539 |
Hexpol AB | 48,621 | 550,153 |
Holmen AB, B Shares | 16,047 | 624,987 |
Husqvarna AB, B Shares | 107,260 | 870,008 |
Industrivarden AB, A Shares | 13,039 | 419,902 |
Industrivarden AB, C Shares | 16,757 | 538,735 |
Indutrade AB | 21,155 | 486,684 |
Instalco AB (b) | 29,039 | 102,246 |
Intrum AB (b) | 94,488 | 221,019 |
Investment AB Latour, B Shares | 8,193 | 197,415 |
Inwido AB | 16,362 | 201,521 |
JM AB | 35,481 | 600,864 |
Kinnevik AB, B Shares * | 56,710 | 590,238 |
KNOW IT AB | 1,948 | 25,277 |
L E Lundbergforetagen AB, B Shares | 9,056 | 446,351 |
Lagercrantz Group AB, B Shares | 10,823 | 158,810 |
Lifco AB, B Shares | 11,668 | 282,699 |
Lindab International AB | 15,612 | 313,618 |
Loomis AB | 21,493 | 549,291 |
SECURITY | NUMBER OF SHARES | VALUE ($) |
Munters Group AB | 1,822 | 36,326 |
Mycronic AB | 6,509 | 226,539 |
NCAB Group AB (b) | 6,336 | 41,191 |
NCC AB, B Shares | 49,336 | 600,042 |
New Wave Group AB, B Shares | 16,774 | 152,749 |
Nibe Industrier AB, B Shares (b) | 87,177 | 402,254 |
Nolato AB, B Shares | 40,202 | 197,271 |
Nordnet AB publ | 1,785 | 31,735 |
Nyfosa AB | 3,758 | 32,510 |
Pandox AB | 11,651 | 180,176 |
Peab AB, B Shares | 146,032 | 890,261 |
Ratos AB, B Shares | 103,646 | 359,737 |
Resurs Holding AB | 95,529 | 143,895 |
Saab AB, B Shares | 10,198 | 807,363 |
Sagax AB, B Shares | 5,277 | 132,147 |
Samhallsbyggnadsbolaget i Norden AB | 484,859 | 173,900 |
Samhallsbyggnadsbolaget i Norden AB, D Shares * | 4,738 | 2,489 |
Scandic Hotels Group AB *(b) | 37,325 | 195,691 |
Sinch AB * | 67,178 | 151,888 |
Stillfront Group AB * | 33,083 | 31,440 |
Storskogen Group AB, B Shares | 408,636 | 218,929 |
Sweco AB, B Shares | 32,090 | 343,739 |
Swedish Orphan Biovitrum AB * | 16,490 | 427,049 |
Thule Group AB | 15,357 | 433,525 |
Wihlborgs Fastigheter AB | 28,211 | 236,285 |
23,686,224 | ||
Switzerland 2.5% | ||
Accelleron Industries AG | 7,281 | 283,076 |
Allreal Holding AG | 2,098 | 338,832 |
ALSO Holding AG | 1,115 | 274,644 |
Aryzta AG * | 103,548 | 196,041 |
Autoneum Holding AG | 1,187 | 189,603 |
Avolta AG * | 15,724 | 594,632 |
Banque Cantonale Vaudoise | 2,338 | 244,495 |
Belimo Holding AG | 616 | 285,015 |
BKW AG | 1,868 | 277,282 |
Bucher Industries AG | 1,373 | 527,581 |
Burckhardt Compression Holding AG | 227 | 144,582 |
Cembra Money Bank AG | 4,691 | 358,628 |
Clariant AG * | 51,014 | 763,211 |
Comet Holding AG | 448 | 141,367 |
Daetwyler Holding AG | 774 | 160,820 |
dormakaba Holding AG | 674 | 358,721 |
Emmi AG | 312 | 303,533 |
EMS-Chemie Holding AG | 646 | 515,402 |
Flughafen Zurich AG | 1,743 | 348,950 |
Forbo Holding AG | 212 | 244,858 |
Helvetia Holding AG | 5,385 | 704,388 |
Huber & Suhner AG | 3,763 | 299,345 |
Implenia AG | 4,441 | 162,392 |
Inficon Holding AG | 140 | 194,656 |
Interroll Holding AG | 50 | 160,914 |
Kardex Holding AG | 534 | 141,287 |
Komax Holding AG | 537 | 92,381 |
Landis & Gyr Group AG | 4,041 | 298,969 |
Mobilezone Holding AG | 1,585 | 22,673 |
Mobimo Holding AG | 757 | 211,917 |
OC Oerlikon Corp. AG | 90,453 | 391,346 |
PSP Swiss Property AG | 2,611 | 322,775 |
Schweiter Technologies AG | 426 | 191,393 |
SFS Group AG | 2,870 | 340,402 |
Siegfried Holding AG | 243 | 232,207 |
SIG Group AG | 29,083 | 581,176 |
Softwareone Holding AG | 15,196 | 258,404 |
St. Galler Kantonalbank AG | 244 | 125,543 |
SECURITY | NUMBER OF SHARES | VALUE ($) |
Stadler Rail AG | 6,930 | 205,593 |
Straumann Holding AG | 3,070 | 408,118 |
Sulzer AG | 2,805 | 339,742 |
Tecan Group AG | 724 | 255,417 |
Temenos AG | 5,107 | 317,693 |
u-blox Holding AG | 1,110 | 102,683 |
Valiant Holding AG | 2,035 | 237,758 |
VAT Group AG | 968 | 481,929 |
Vontobel Holding AG | 4,260 | 239,123 |
Zehnder Group AG | 2,496 | 145,525 |
14,017,022 | ||
United Kingdom 9.6% | ||
4imprint Group PLC | 2,552 | 197,239 |
888 Holdings PLC * | 117,577 | 124,587 |
Airtel Africa PLC | 384,732 | 531,297 |
Ashmore Group PLC | 91,445 | 220,989 |
ASOS PLC *(b) | 77,609 | 324,289 |
Assura PLC | 224,307 | 114,838 |
Auto Trader Group PLC | 45,082 | 390,837 |
Babcock International Group PLC | 38,413 | 243,079 |
Bank of Georgia Group PLC | 4,065 | 272,189 |
Beazley PLC | 58,208 | 481,599 |
Big Yellow Group PLC | 12,632 | 169,930 |
Bodycote PLC | 49,952 | 429,672 |
Breedon Group PLC | 18,760 | 84,295 |
British Land Co. PLC | 142,028 | 684,880 |
Britvic PLC | 41,343 | 455,920 |
C&C Group PLC | 148,684 | 304,770 |
Capita PLC * | 715,951 | 120,236 |
Capricorn Energy PLC | 19,392 | 41,193 |
Card Factory PLC * | 146,417 | 200,153 |
Carnival PLC * | 17,494 | 234,568 |
Centamin PLC | 489,465 | 739,128 |
Chemring Group PLC | 44,468 | 208,369 |
Clarkson PLC | 3,516 | 170,684 |
Close Brothers Group PLC | 62,466 | 355,460 |
Coats Group PLC | 325,063 | 331,039 |
Computacenter PLC | 16,493 | 528,773 |
Conduit Holdings Ltd. | 5,604 | 34,866 |
ConvaTec Group PLC | 193,645 | 602,490 |
Cranswick PLC | 15,066 | 809,124 |
Crest Nicholson Holdings PLC | 145,741 | 336,424 |
Deliveroo PLC, Class A *(b) | 105,607 | 176,564 |
Derwent London PLC | 11,112 | 285,476 |
Diploma PLC | 7,088 | 320,382 |
DiscoverIE Group PLC | 14,293 | 124,743 |
Diversified Energy Co. PLC (b) | 7,523 | 104,740 |
Domino's Pizza Group PLC | 33,325 | 135,095 |
Dr Martens PLC | 146,957 | 139,450 |
Drax Group PLC | 118,248 | 765,380 |
Dunelm Group PLC | 16,970 | 213,784 |
easyJet PLC | 72,009 | 482,320 |
Elementis PLC * | 143,325 | 252,013 |
Endeavour Mining PLC | 22,301 | 472,182 |
EnQuest PLC * | 1,606,805 | 336,103 |
Essentra PLC | 153,599 | 338,948 |
FDM Group Holdings PLC | 18,921 | 81,686 |
Ferrexpo PLC * | 581,057 | 369,564 |
Forterra PLC | 85,159 | 175,152 |
Frasers Group PLC * | 25,379 | 258,271 |
Fresnillo PLC | 49,837 | 345,160 |
Future PLC | 14,055 | 116,030 |
Games Workshop Group PLC | 2,508 | 309,974 |
Genuit Group PLC | 52,503 | 283,765 |
Genus PLC | 7,154 | 160,886 |
Georgia Capital PLC * | 2,263 | 38,570 |
SECURITY | NUMBER OF SHARES | VALUE ($) |
Grainger PLC | 71,158 | 228,068 |
Greencore Group PLC * | 257,356 | 420,991 |
Greggs PLC | 13,412 | 453,888 |
Gulf Keystone Petroleum Ltd. * | 86,368 | 127,239 |
Halfords Group PLC | 148,731 | 279,304 |
Halma PLC | 26,577 | 728,392 |
Hammerson PLC | 471,667 | 160,545 |
Hargreaves Lansdown PLC | 47,433 | 479,326 |
Hikma Pharmaceuticals PLC | 31,289 | 751,267 |
Hill & Smith PLC | 12,003 | 281,737 |
Hilton Food Group PLC | 29,695 | 339,885 |
Hiscox Ltd. | 28,290 | 433,852 |
Hochschild Mining PLC * | 181,138 | 349,662 |
Howden Joinery Group PLC | 81,796 | 890,326 |
Hunting PLC | 67,841 | 301,523 |
Ibstock PLC | 107,982 | 199,155 |
IMI PLC | 39,568 | 861,898 |
Intermediate Capital Group PLC | 32,042 | 835,140 |
International Consolidated Airlines Group SA * | 236,362 | 515,116 |
Investec PLC | 85,040 | 538,667 |
IWG PLC * | 312,881 | 722,371 |
J D Wetherspoon PLC * | 17,566 | 159,025 |
JD Sports Fashion PLC | 386,152 | 552,844 |
Jupiter Fund Management PLC | 311,049 | 299,832 |
Just Group PLC | 371,559 | 477,812 |
Keller Group PLC | 46,102 | 632,566 |
Kenmare Resources PLC | 11,792 | 47,740 |
Kier Group PLC | 236,985 | 396,464 |
Lancashire Holdings Ltd. | 19,351 | 147,498 |
Land Securities Group PLC | 98,374 | 795,064 |
Liontrust Asset Management PLC | 3,750 | 31,629 |
LondonMetric Property PLC | 58,433 | 142,630 |
Mapeley Ltd. *(a) | 2,199 | 0 |
Marshalls PLC | 56,818 | 189,938 |
Mears Group PLC | 9,664 | 43,714 |
Mitchells & Butlers PLC * | 82,306 | 247,814 |
Mitie Group PLC | 270,979 | 396,164 |
Mobico Group PLC | 528,324 | 365,733 |
Moneysupermarket.com Group PLC | 87,036 | 233,186 |
Morgan Advanced Materials PLC | 83,928 | 329,299 |
Morgan Sindall Group PLC | 17,149 | 483,527 |
Ninety One PLC | 53,887 | 112,075 |
Ocado Group PLC * | 40,365 | 176,727 |
OSB Group PLC | 82,023 | 420,015 |
Oxford Instruments PLC | 4,807 | 134,920 |
Pagegroup PLC | 95,948 | 533,186 |
Paragon Banking Group PLC | 39,964 | 356,403 |
PayPoint PLC | 4,460 | 29,374 |
Pennon Group PLC | 79,044 | 657,311 |
Petrofac Ltd. *(b) | 410,864 | 53,906 |
Pets at Home Group PLC | 117,733 | 429,865 |
Pinewood Technologies Group PLC | 6,813 | 28,349 |
Playtech PLC * | 72,961 | 483,193 |
Plus500 Ltd. | 31,569 | 853,933 |
Premier Foods PLC | 153,257 | 309,851 |
Primary Health Properties PLC | 100,544 | 115,082 |
PZ Cussons PLC | 24,346 | 30,715 |
QinetiQ Group PLC | 98,937 | 422,232 |
Quilter PLC | 372,229 | 510,700 |
Rathbones Group PLC | 7,635 | 155,453 |
Reach PLC | 193,818 | 178,248 |
Redde Northgate PLC | 120,497 | 576,216 |
Redrow PLC | 105,815 | 850,747 |
Renewi PLC * | 25,948 | 182,543 |
Renishaw PLC | 3,623 | 186,808 |
RHI Magnesita NV | 6,561 | 296,778 |
Rightmove PLC | 41,759 | 267,500 |
SECURITY | NUMBER OF SHARES | VALUE ($) |
Rolls-Royce Holdings PLC * | 251,771 | 1,291,088 |
Rotork PLC | 117,861 | 473,793 |
Safestore Holdings PLC | 15,455 | 148,953 |
Savills PLC | 38,533 | 520,971 |
Schroders PLC | 136,499 | 598,423 |
Segro PLC | 55,108 | 579,633 |
Senior PLC | 27,111 | 55,152 |
Serco Group PLC | 340,526 | 779,524 |
Sirius Real Estate Ltd. | 139,843 | 170,086 |
Softcat PLC | 10,628 | 208,025 |
Spirax-Sarco Engineering PLC | 5,540 | 609,607 |
Spire Healthcare Group PLC | 62,106 | 190,876 |
Spirent Communications PLC | 128,584 | 310,823 |
SSP Group PLC | 128,806 | 315,149 |
SThree PLC | 54,616 | 288,617 |
Synthomer PLC * | 113,093 | 365,999 |
TBC Bank Group PLC | 6,550 | 283,186 |
Telecom Plus PLC | 11,497 | 249,331 |
THG PLC * | 215,108 | 169,578 |
TI Fluid Systems PLC | 226,131 | 389,065 |
TP ICAP Group PLC | 283,995 | 735,160 |
Tritax Big Box REIT PLC | 110,693 | 209,081 |
TUI AG * | 83,336 | 585,236 |
Tullow Oil PLC * | 495,619 | 224,806 |
Tyman PLC | 71,652 | 337,539 |
UNITE Group PLC | 14,959 | 172,934 |
Vanquis Banking Group PLC | 126,984 | 76,004 |
Vesuvius PLC | 84,228 | 502,905 |
Victrex PLC | 18,530 | 293,132 |
Virgin Money U.K. PLC | 176,823 | 470,151 |
Vistry Group PLC * | 61,694 | 916,441 |
Watches of Switzerland Group PLC * | 32,185 | 135,003 |
Weir Group PLC | 33,929 | 865,779 |
WH Smith PLC | 11,703 | 160,077 |
Wickes Group PLC | 135,094 | 245,783 |
Workspace Group PLC | 19,747 | 122,057 |
54,302,083 | ||
Total Common Stocks (Cost $470,675,711) | 561,227,279 | |
PREFERRED STOCKS 0.1% OF NET ASSETS | ||
Germany 0.1% | ||
Sartorius AG | 772 | 230,794 |
Italy 0.0% | ||
Danieli & C Officine Meccaniche SpA | 7,832 | 201,051 |
Total Preferred Stocks (Cost $282,859) | 431,845 | |
SECURITY | NUMBER OF SHARES | VALUE ($) |
WARRANTS 0.0% OF NET ASSETS | ||
Italy 0.0% | ||
Webuild SpA | ||
expires 08/02/30 *(a) | 9,173 | 23,025 |
Total Warrants (Cost $0) | 23,025 | |
SHORT-TERM INVESTMENTS 1.1% OF NET ASSETS | ||
Money Market Funds 1.1% | ||
State Street Institutional U.S. Government Money Market Fund, Premier Class 5.25% (c)(d) | 5,900,613 | 5,900,613 |
Total Short-Term Investments (Cost $5,900,613) | 5,900,613 | |
Total Investments in Securities (Cost $476,859,183) | 567,582,762 | |
NUMBER OF CONTRACTS | NOTIONAL AMOUNT ($) | CURRENT VALUE/ UNREALIZED DEPRECIATION ($) | |
FUTURES CONTRACTS | |||
Long | |||
MSCI EAFE Index, expires 06/21/24 | 46 | 5,215,250 | (125,933 ) |
* | Non-income producing security. |
(a) | Fair valued using significant unobservable inputs (see financial note 2(a), Securities for which no quoted value is available, for additional information). |
(b) | All or a portion of this security is on loan. Securities on loan were valued at $5,385,051. |
(c) | The rate shown is the annualized 7-day yield. |
(d) | Security purchased with cash collateral received for securities on loan. |
CVA — | Dutch Certificate |
REIT — | Real Estate Investment Trust |
DESCRIPTION | QUOTED PRICES IN ACTIVE MARKETS FOR IDENTICAL ASSETS (LEVEL 1) | OTHER SIGNIFICANT OBSERVABLE INPUTS (LEVEL 2) | SIGNIFICANT UNOBSERVABLE INPUTS (LEVEL 3) | TOTAL |
Assets | ||||
Common Stocks1 | $— | $43,273,182 | $— | $43,273,182 |
Australia | 444,109 | 29,259,815 | 289,643 * | 29,993,567 |
Belgium | 1,075,711 | 5,285,561 | — | 6,361,272 |
Canada | 39,355,278 | — | — | 39,355,278 |
Denmark | 590,275 | 10,359,631 | — | 10,949,906 |
Finland | 550,315 | 5,906,077 | — | 6,456,392 |
Hong Kong | 928,488 | 13,714,555 | 0 * | 14,643,043 |
Ireland | 29,327 | 1,307,893 | — | 1,337,220 |
Israel | 890,637 | 6,779,735 | — | 7,670,372 |
Italy | 519,814 | 13,366,833 | 0 * | 13,886,647 |
Japan | 2,565,029 | 201,479,929 | — | 204,044,958 |
Luxembourg | — | — | 0 * | 0 |
Netherlands | 61,244 | 10,060,586 | — | 10,121,830 |
New Zealand | 3,052,211 | 1,599,927 | — | 4,652,138 |
Norway | 1,939,482 | 7,229,106 | — | 9,168,588 |
Poland | 514,908 | 6,557,534 | — | 7,072,442 |
Portugal | 317,866 | 1,452,643 | — | 1,770,509 |
Republic of Korea | 774,772 | 43,740,467 | — | 44,515,239 |
Singapore | 229,407 | 7,317,057 | — | 7,546,464 |
Spain | 434,908 | 5,967,924 | 71 * | 6,402,903 |
Sweden | 1,000,391 | 22,685,833 | — | 23,686,224 |
Switzerland | 589,971 | 13,427,051 | — | 14,017,022 |
United Kingdom | 12,932,670 | 41,369,413 | 0 * | 54,302,083 |
Preferred Stocks1 | — | 431,845 | — | 431,845 |
Warrants | ||||
Italy | — | — | 23,025 | 23,025 |
Short-Term Investments1 | 5,900,613 | — | — | 5,900,613 |
Liabilities | ||||
Futures Contracts2 | (125,933 ) | — | — | (125,933 ) |
Total | $74,571,493 | $492,572,597 | $312,739 | $567,456,829 |
* | Level 3 amount shown includes securities determined to have no value at April 30, 2024. |
1 | As categorized in the Portfolio Holdings. |
2 | Futures contracts are reported at cumulative unrealized appreciation or depreciation. |
Assets | ||
Investments in securities, at value - unaffiliated issuers (cost $476,859,183) including securities on loan of $5,385,051 | $567,582,762 | |
Foreign currency, at value (cost $804,726) | 800,954 | |
Deposit with broker for futures contracts | 225,740 | |
Receivables: | ||
Dividends | 3,348,984 | |
Foreign tax reclaims | 873,374 | |
Investments sold | 561,773 | |
Fund shares sold | 167,228 | |
Income from securities on loan | + | 47,425 |
Total assets | 573,608,240 | |
Liabilities | ||
Collateral held for securities on loan | 5,900,613 | |
Payables: | ||
Fund shares redeemed | 1,015,298 | |
Due to sub-custodian | 291,158 | |
Investment adviser fees | 183,776 | |
Variation margin on futures contracts | 74,847 | |
Investments bought | + | 584 |
Total liabilities | 7,466,276 | |
Net assets | $566,141,964 | |
Net Assets by Source | ||
Capital received from investors | $510,463,802 | |
Total distributable earnings | + | 55,678,162 |
Net assets | $566,141,964 | |
Net Asset Value (NAV) | ||||
Net Assets | ÷ | Shares Outstanding | = | NAV |
$566,141,964 | 45,060,608 | $12.56 | ||
For the period November 1, 2023 through April 30, 2024; unaudited | ||
Investment Income | ||
Dividends received from securities - unaffiliated issuers (net of foreign withholding tax of $1,268,987) | $8,226,880 | |
Other interest | 4,581 | |
Securities on loan, net | + | 157,420 |
Total investment income | 8,388,881 | |
Expenses | ||
Investment adviser fees | 1,111,001 | |
Professional fees | + | 6,591 1 |
Total expenses | 1,117,592 | |
Expense reduction | – | 6,591 1 |
Net expenses | – | 1,111,001 |
Net investment income | 7,277,880 | |
REALIZED AND UNREALIZED GAINS (LOSSES) | ||
Net realized gains on sales of securities - unaffiliated issuers | 11,340,255 | |
Net realized gains on futures contracts | 333,702 | |
Net realized losses on foreign currency transactions | + | (42,699 ) |
Net realized gains | 11,631,258 | |
Net change in unrealized appreciation (depreciation) on securities - unaffiliated issuers | 55,534,441 | |
Net change in unrealized appreciation (depreciation) on futures contracts | 13,289 | |
Net change in unrealized appreciation (depreciation) on foreign currency translations | + | (70,298 ) |
Net change in unrealized appreciation (depreciation) | + | 55,477,432 |
Net realized and unrealized gains | 67,108,690 | |
Increase in net assets resulting from operations | $74,386,570 | |
1 | Professional fees associated with the filing of foreign withholding tax claims in the European Union are deemed to be non-contingent and non-routine expenses of the fund (see financial notes 2(d) and 4 for additional information). |
OPERATIONS | |||
11/1/23-4/30/24 | 11/1/22-10/31/23 | ||
Net investment income | $7,277,880 | $14,358,842 | |
Net realized gains (losses) | 11,631,258 | (1,668,214 ) | |
Net change in unrealized appreciation (depreciation) | + | 55,477,432 | 52,273,567 |
Increase in net assets resulting from operations | $74,386,570 | $64,964,195 | |
DISTRIBUTIONS TO SHAREHOLDERS | |||
Total distributions | ($18,018,592 ) | ($26,973,296 ) | |
TRANSACTIONS IN FUND SHARES | |||||
11/1/23-4/30/24 | 11/1/22-10/31/23 | ||||
SHARES | VALUE | SHARES | VALUE | ||
Shares sold | 3,004,684 | $37,509,393 | 6,830,988 | $81,876,035 | |
Shares reinvested | 1,128,372 | 13,946,682 | 1,831,459 | 20,622,221 | |
Shares redeemed | + | (5,282,712 ) | (65,974,328 ) | (12,204,707 ) | (146,380,570 ) |
Net transactions in fund shares | (1,149,656 ) | ($14,518,253 ) | (3,542,260 ) | ($43,882,314 ) | |
SHARES OUTSTANDING AND NET ASSETS | |||||
11/1/23-4/30/24 | 11/1/22-10/31/23 | ||||
SHARES | NET ASSETS | SHARES | NET ASSETS | ||
Beginning of period | 46,210,264 | $524,292,239 | 49,752,524 | $530,183,654 | |
Total increase (decrease) | + | (1,149,656 ) | 41,849,725 | (3,542,260 ) | (5,891,415 ) |
End of period | 45,060,608 | $566,141,964 | 46,210,264 | $524,292,239 | |
11/1/23– 4/30/24* | 11/1/22– 10/31/23 | 11/1/21– 10/31/22 | 11/1/20– 10/31/21 | 11/1/19– 10/31/20 | 11/1/18– 10/31/19 | |
Per-Share Data | ||||||
Net asset value at beginning of period | $8.02 | $7.35 | $10.24 | $7.51 | $9.25 | $8.60 |
Income (loss) from investment operations: | ||||||
Net investment income (loss)1 | 0.11 | 0.39 | 0.52 | 0.36 | 0.27 | 0.35 |
Net realized and unrealized gains (losses) | 1.18 | 0.71 | (2.96 ) | 2.63 | (1.65 ) | 0.54 |
Total from investment operations | 1.29 | 1.10 | (2.44 ) | 2.99 | (1.38 ) | 0.89 |
Less distributions: | ||||||
Distributions from net investment income | (0.43 ) | (0.43 ) | (0.45 ) | (0.26 ) | (0.36 ) | (0.24 ) |
Net asset value at end of period | $8.88 | $8.02 | $7.35 | $10.24 | $7.51 | $9.25 |
Total return | 16.44 %2 | 15.14 % | (24.86 %) | 40.39 % | (15.68 %) | 10.73 % |
Ratios/Supplemental Data | ||||||
Ratios to average net assets: | ||||||
Total expenses | 0.39 %3 | 0.39 % | 0.39 %4 | 0.39 % | 0.39 % | 0.39 % |
Net investment income (loss) | 2.54 %3 | 4.75 % | 5.83 % | 3.75 % | 3.32 % | 3.93 % |
Portfolio turnover rate | 10 %2 | 20 % | 24 % | 32 % | 32 % | 38 % |
Net assets, end of period (x 1,000) | $824,496 | $695,445 | $604,159 | $707,652 | $550,134 | $670,910 |
* | Unaudited. |
1 | Calculated based on the average shares outstanding during the period. |
2 | Not annualized. |
3 | Annualized. |
4 | Ratio includes less than 0.005% of non-routine proxy expenses. |
SECURITY | NUMBER OF SHARES | VALUE ($) |
COMMON STOCKS 95.8% OF NET ASSETS | ||
Brazil 7.1% | ||
Ambev SA | 785,122 | 1,837,082 |
B3 SA - Brasil Bolsa Balcao | 476,048 | 989,207 |
Banco Bradesco SA | 404,704 | 963,321 |
Banco do Brasil SA | 535,944 | 2,830,101 |
Banco Santander Brasil SA | 147,601 | 821,490 |
Centrais Eletricas Brasileiras SA | 228,101 | 1,663,118 |
Cia de Saneamento Basico do Estado de Sao Paulo SABESP | 72,396 | 1,126,804 |
Cia Energetica de Minas Gerais | 81,121 | 178,721 |
Cia Siderurgica Nacional SA | 313,651 | 840,816 |
Companhia Paranaense de Energia | 23,531 | 37,159 |
Equatorial Energia SA | 126,549 | 745,510 |
Itau Unibanco Holding SA | 92,992 | 489,262 |
JBS SA | 1,173,729 | 5,298,349 |
Klabin SA | 162,241 | 719,877 |
Natura & Co. Holding SA | 261,521 | 835,542 |
Petroleo Brasileiro SA | 1,650,642 | 14,069,525 |
Suzano SA | 125,438 | 1,412,222 |
Telefonica Brasil SA | 154,242 | 1,406,197 |
Ultrapar Participacoes SA | 381,508 | 1,899,238 |
Vale SA | 1,371,702 | 16,718,988 |
Vibra Energia SA | 837,998 | 3,786,048 |
58,668,577 | ||
Chile 0.6% | ||
Banco de Chile | 7,478,198 | 829,569 |
Cencosud SA | 658,733 | 1,128,776 |
Empresas CMPC SA | 477,543 | 943,098 |
Empresas Copec SA | 245,435 | 1,751,446 |
4,652,889 | ||
China 34.1% | ||
Agile Group Holdings Ltd. *(a) | 7,832,000 | 593,723 |
Agricultural Bank of China Ltd., A Shares | 2,142,800 | 1,298,413 |
Agricultural Bank of China Ltd., H Shares | 11,461,600 | 5,110,852 |
Alibaba Group Holding Ltd. | 1,887,292 | 17,670,830 |
Aluminum Corp. of China Ltd., A Shares | 332,800 | 339,204 |
Aluminum Corp. of China Ltd., H Shares | 1,530,000 | 1,014,716 |
Anhui Conch Cement Co. Ltd., A Shares | 170,000 | 537,559 |
Anhui Conch Cement Co. Ltd., H Shares | 845,000 | 1,960,454 |
ANTA Sports Products Ltd. | 87,800 | 993,983 |
BAIC Motor Corp. Ltd., H Shares | 5,380,000 | 1,525,767 |
Baidu, Inc., A Shares * | 275,700 | 3,571,853 |
Bank of China Ltd., A Shares | 1,065,100 | 672,753 |
Bank of China Ltd., H Shares | 29,844,234 | 13,384,842 |
Bank of Communications Co. Ltd., A Shares | 1,057,800 | 1,001,617 |
Bank of Communications Co. Ltd., H Shares | 3,130,000 | 2,253,784 |
Beijing Enterprises Holdings Ltd. | 218,000 | 697,938 |
BYD Co. Ltd., A Shares | 6,100 | 182,826 |
BYD Co. Ltd., H Shares | 37,500 | 1,027,971 |
SECURITY | NUMBER OF SHARES | VALUE ($) |
China CITIC Bank Corp. Ltd., A Shares | 303,000 | 286,757 |
China CITIC Bank Corp. Ltd., H Shares | 4,347,000 | 2,543,140 |
China Coal Energy Co. Ltd., A Shares | 416,500 | 675,064 |
China Coal Energy Co. Ltd., H Shares | 685,000 | 690,027 |
China Communications Services Corp. Ltd., H Shares | 1,984,000 | 948,445 |
China Construction Bank Corp., A Shares | 273,400 | 268,013 |
China Construction Bank Corp., H Shares | 44,703,960 | 28,923,046 |
China Everbright Bank Co. Ltd., A Shares | 1,665,000 | 722,751 |
China Everbright Bank Co. Ltd., H Shares | 1,606,000 | 486,547 |
China Everbright Environment Group Ltd. | 2,539,000 | 1,029,532 |
China Gas Holdings Ltd. | 1,331,400 | 1,246,631 |
China Hongqiao Group Ltd. | 1,346,500 | 1,858,007 |
China Jinmao Holdings Group Ltd. | 7,686,000 | 651,291 |
China Life Insurance Co. Ltd., H Shares | 744,000 | 979,790 |
China Mengniu Dairy Co. Ltd. | 521,000 | 1,079,239 |
China Merchants Bank Co. Ltd., A Shares | 327,100 | 1,540,703 |
China Merchants Bank Co. Ltd., H Shares | 947,150 | 4,101,971 |
China Minsheng Banking Corp. Ltd., A Shares | 1,627,700 | 885,985 |
China Minsheng Banking Corp. Ltd., H Shares | 4,339,910 | 1,587,892 |
China National Building Material Co. Ltd., H Shares | 8,410,000 | 3,254,148 |
China Overseas Land & Investment Ltd. | 2,010,500 | 3,697,053 |
China Pacific Insurance Group Co. Ltd., A Shares | 104,000 | 367,987 |
China Pacific Insurance Group Co. Ltd., H Shares | 638,400 | 1,398,783 |
China Petroleum & Chemical Corp., A Shares | 1,855,700 | 1,619,981 |
China Petroleum & Chemical Corp., H Shares | 21,730,400 | 12,970,910 |
China Railway Group Ltd., A Shares | 752,800 | 678,788 |
China Railway Group Ltd., H Shares | 2,344,000 | 1,156,667 |
China Resources Building Materials Technology Holdings Ltd. | 3,052,000 | 515,117 |
China Resources Gas Group Ltd. | 255,000 | 801,458 |
China Resources Land Ltd. | 881,000 | 3,167,931 |
China Resources Power Holdings Co. Ltd. | 632,000 | 1,571,692 |
China Shenhua Energy Co. Ltd., A Shares | 147,200 | 807,143 |
China Shenhua Energy Co. Ltd., H Shares | 897,500 | 3,725,045 |
China State Construction Engineering Corp. Ltd., A Shares | 1,837,900 | 1,355,237 |
China Taiping Insurance Holdings Co. Ltd. | 924,400 | 845,193 |
China Tower Corp. Ltd., H Shares | 15,578,000 | 1,823,550 |
China United Network Communications Ltd., A Shares | 1,153,750 | 742,797 |
China Vanke Co. Ltd., A Shares | 471,500 | 479,112 |
China Vanke Co. Ltd., H Shares | 1,628,900 | 955,327 |
China Yongda Automobiles Services Holdings Ltd. | 1,926,500 | 522,042 |
CITIC Ltd. | 3,080,000 | 2,914,918 |
COSCO SHIPPING Holdings Co. Ltd., A Shares | 347,700 | 564,185 |
COSCO SHIPPING Holdings Co. Ltd., H Shares | 1,236,000 | 1,599,178 |
SECURITY | NUMBER OF SHARES | VALUE ($) |
Country Garden Holdings Co. Ltd. *(a)(b) | 36,101,289 | 1,776,752 |
CRRC Corp. Ltd., A Shares | 499,130 | 479,767 |
CRRC Corp. Ltd., H Shares | 1,124,000 | 620,440 |
CSPC Pharmaceutical Group Ltd. | 1,286,000 | 1,055,976 |
Dongfeng Motor Group Co. Ltd., H Shares | 2,225,000 | 806,880 |
ENN Energy Holdings Ltd. | 179,200 | 1,526,853 |
Fosun International Ltd. | 1,835,000 | 1,082,634 |
GCL Technology Holdings Ltd. | 5,185,000 | 767,965 |
Geely Automobile Holdings Ltd. | 1,755,000 | 2,112,245 |
Guangzhou R&F Properties Co. Ltd., H Shares * | 7,846,946 | 954,009 |
Haier Smart Home Co. Ltd., A Shares | 79,000 | 328,094 |
Haier Smart Home Co. Ltd., H Shares | 440,000 | 1,629,770 |
Hengan International Group Co. Ltd. | 248,000 | 832,578 |
Huaneng Power International, Inc., A Shares * | 158,300 | 203,921 |
Huaneng Power International, Inc., H Shares * | 1,338,000 | 851,638 |
Industrial & Commercial Bank of China Ltd., A Shares | 1,913,600 | 1,430,909 |
Industrial & Commercial Bank of China Ltd., H Shares | 31,311,172 | 16,789,928 |
Industrial Bank Co. Ltd., A Shares | 523,000 | 1,212,705 |
JD.com, Inc., A Shares | 652,321 | 9,398,883 |
Jiangxi Copper Co. Ltd., A Shares | 119,800 | 428,811 |
Jiangxi Copper Co. Ltd., H Shares | 993,000 | 2,022,374 |
Kingboard Holdings Ltd. | 671,000 | 1,474,706 |
Kunlun Energy Co. Ltd. | 2,260,000 | 2,190,796 |
Kweichow Moutai Co. Ltd., A Shares | 3,300 | 772,394 |
Li Ning Co. Ltd. | 208,000 | 544,516 |
Longfor Group Holdings Ltd. | 1,210,000 | 1,792,185 |
Lufax Holding Ltd., ADR | 200,077 | 878,338 |
Meituan, B Shares * | 138,170 | 1,886,646 |
NetEase, Inc. | 132,443 | 2,482,594 |
Nine Dragons Paper Holdings Ltd. * | 1,516,000 | 669,780 |
People's Insurance Co. Group of China Ltd., A Shares | 163,900 | 118,068 |
People's Insurance Co. Group of China Ltd., H Shares | 1,952,000 | 640,695 |
PetroChina Co. Ltd., A Shares | 879,200 | 1,238,261 |
PetroChina Co. Ltd., H Shares | 10,464,000 | 9,749,739 |
PICC Property & Casualty Co. Ltd., H Shares | 2,276,000 | 2,827,662 |
Ping An Bank Co. Ltd., A Shares | 491,100 | 728,673 |
Ping An Insurance Group Co. of China Ltd., A Shares | 243,600 | 1,382,353 |
Ping An Insurance Group Co. of China Ltd., H Shares | 2,197,500 | 9,959,245 |
Postal Savings Bank of China Co. Ltd., A Shares | 384,400 | 253,952 |
Postal Savings Bank of China Co. Ltd., H Shares | 2,864,000 | 1,483,989 |
Seazen Group Ltd. * | 6,090,000 | 1,050,807 |
Shanghai Pharmaceuticals Holding Co. Ltd., A Shares | 243,900 | 601,879 |
Shanghai Pudong Development Bank Co. Ltd., A Shares | 1,196,800 | 1,266,547 |
Shenzhou International Group Holdings Ltd. | 89,400 | 878,731 |
Sino Biopharmaceutical Ltd. | 1,623,000 | 554,577 |
Sinopharm Group Co. Ltd., H Shares | 817,600 | 2,064,735 |
Sunny Optical Technology Group Co. Ltd. | 106,200 | 513,765 |
Tencent Holdings Ltd. | 464,000 | 20,361,797 |
Tingyi Cayman Islands Holding Corp. | 615,768 | 679,621 |
Vipshop Holdings Ltd., ADR | 104,066 | 1,565,153 |
Weichai Power Co. Ltd., A Shares | 124,000 | 296,976 |
Weichai Power Co. Ltd., H Shares | 588,000 | 1,201,497 |
SECURITY | NUMBER OF SHARES | VALUE ($) |
Xiaomi Corp., B Shares * | 2,263,600 | 4,934,481 |
Yankuang Energy Group Co. Ltd., A Shares | 32,850 | 104,469 |
Yankuang Energy Group Co. Ltd., H Shares | 670,000 | 1,453,479 |
Yum China Holdings, Inc. | 50,400 | 1,886,748 |
Zhongsheng Group Holdings Ltd. | 421,000 | 767,813 |
Zijin Mining Group Co. Ltd., A Shares | 157,500 | 378,538 |
Zijin Mining Group Co. Ltd., H Shares | 628,000 | 1,369,964 |
281,197,459 | ||
Colombia 0.2% | ||
Ecopetrol SA | 2,359,077 | 1,371,067 |
Czech Republic 0.1% | ||
CEZ AS | 26,346 | 972,499 |
Greece 0.4% | ||
Alpha Services & Holdings SA * | 866,065 | 1,462,452 |
Eurobank Ergasias Services & Holdings SA, Class H * | 431,893 | 926,442 |
National Bank of Greece SA * | 92,448 | 745,874 |
3,134,768 | ||
Hungary 0.5% | ||
MOL Hungarian Oil & Gas PLC | 250,141 | 2,052,809 |
OTP Bank Nyrt | 37,359 | 1,851,723 |
3,904,532 | ||
India 12.8% | ||
Axis Bank Ltd. | 152,047 | 2,122,285 |
Bharat Petroleum Corp. Ltd. | 565,472 | 4,114,703 |
Bharti Airtel Ltd. | 167,493 | 2,651,193 |
Bharti Airtel Ltd. - Partly Paid Shares | 9,049 | 101,418 |
Coal India Ltd. | 406,056 | 2,207,703 |
GAIL India Ltd. | 892,963 | 2,230,727 |
Grasim Industries Ltd. | 64,834 | 1,869,368 |
HCL Technologies Ltd. | 99,790 | 1,628,072 |
HDFC Bank Ltd. | 65,059 | 1,181,509 |
Hero MotoCorp Ltd. | 26,626 | 1,445,048 |
Hindalco Industries Ltd. | 432,427 | 3,325,697 |
Hindustan Petroleum Corp. Ltd. | 577,170 | 3,423,611 |
Hindustan Unilever Ltd. | 41,987 | 1,121,352 |
ICICI Bank Ltd. | 75,196 | 1,036,122 |
Indian Oil Corp. Ltd. | 2,607,887 | 5,266,320 |
Infosys Ltd. | 379,798 | 6,412,706 |
ITC Ltd. | 241,497 | 1,259,222 |
JSW Steel Ltd. | 159,681 | 1,682,390 |
Larsen & Toubro Ltd. | 55,415 | 2,382,064 |
Mahindra & Mahindra Ltd. | 99,921 | 2,577,351 |
Maruti Suzuki India Ltd. | 12,478 | 1,914,365 |
NTPC Ltd. | 891,851 | 3,875,925 |
Oil & Natural Gas Corp. Ltd. | 1,923,982 | 6,494,892 |
Petronet LNG Ltd. | 283,561 | 1,052,522 |
Power Finance Corp. Ltd. | 421,682 | 2,222,791 |
Power Grid Corp. of India Ltd. | 570,763 | 2,058,615 |
Rajesh Exports Ltd. * | 413,595 | 1,569,424 |
REC Ltd. | 269,056 | 1,629,859 |
Reliance Industries Ltd. | 327,609 | 11,500,473 |
State Bank of India | 195,621 | 1,932,335 |
Steel Authority of India Ltd. | 783,712 | 1,534,232 |
Sun Pharmaceutical Industries Ltd. | 62,755 | 1,127,404 |
Tata Consultancy Services Ltd. | 91,929 | 4,195,648 |
SECURITY | NUMBER OF SHARES | VALUE ($) |
Tata Motors Ltd. | 274,793 | 3,313,744 |
Tata Motors Ltd., A Shares, DVR | 49,516 | 403,895 |
Tata Steel Ltd. | 2,794,303 | 5,508,080 |
Tech Mahindra Ltd. | 87,035 | 1,311,069 |
UltraTech Cement Ltd. | 7,380 | 880,171 |
UPL Ltd. | 118,982 | 722,104 |
Vedanta Ltd. | 609,405 | 2,908,483 |
Wipro Ltd. | 190,155 | 1,047,206 |
105,242,098 | ||
Indonesia 1.4% | ||
Adaro Energy Indonesia Tbk. PT | 4,803,200 | 798,281 |
Astra International Tbk. PT | 5,970,700 | 1,884,086 |
Bank Central Asia Tbk. PT | 2,539,700 | 1,527,082 |
Bank Mandiri Persero Tbk. PT | 4,685,200 | 1,980,325 |
Bank Rakyat Indonesia Persero Tbk. PT | 6,413,996 | 1,941,539 |
Telkom Indonesia Persero Tbk. PT | 11,108,600 | 2,153,495 |
United Tractors Tbk. PT | 641,600 | 977,859 |
11,262,667 | ||
Kuwait 0.5% | ||
Kuwait Finance House KSCP | 501,046 | 1,168,828 |
Mobile Telecommunications Co. KSCP | 704,762 | 1,113,805 |
National Bank of Kuwait SAKP | 758,292 | 2,125,134 |
4,407,767 | ||
Malaysia 1.6% | ||
Axiata Group Bhd. | 1,923,613 | 1,139,029 |
CIMB Group Holdings Bhd. | 1,278,553 | 1,766,998 |
Genting Bhd. | 884,500 | 836,013 |
Malayan Banking Bhd. | 1,398,640 | 2,849,959 |
Petronas Chemicals Group Bhd. | 619,800 | 880,512 |
Public Bank Bhd. | 1,769,525 | 1,526,228 |
Sime Darby Bhd. | 1,937,300 | 1,134,179 |
Tenaga Nasional Bhd. | 1,391,500 | 3,487,133 |
13,620,051 | ||
Mexico 3.3% | ||
Alfa SAB de CV, A Shares | 2,172,577 | 1,597,973 |
America Movil SAB de CV, Series B | 6,617,889 | 6,300,820 |
Cemex SAB de CV, Series CPO * | 3,898,674 | 3,088,307 |
Fomento Economico Mexicano SAB de CV | 272,538 | 3,188,380 |
Grupo Bimbo SAB de CV, Series A | 284,524 | 1,192,191 |
Grupo Financiero Banorte SAB de CV, O Shares | 363,471 | 3,597,420 |
Grupo Mexico SAB de CV, Series B | 616,259 | 3,807,832 |
Grupo Televisa SAB, Series CPO | 2,210,427 | 1,307,101 |
Ollamani SAB * | 110,243 | 225,753 |
Orbia Advance Corp. SAB de CV | 517,731 | 850,456 |
Wal-Mart de Mexico SAB de CV | 674,445 | 2,516,558 |
27,672,791 | ||
Qatar 0.7% | ||
Ooredoo QPSC | 293,182 | 804,419 |
Qatar Fuel QSC | 309,559 | 1,229,394 |
Qatar Islamic Bank SAQ | 192,888 | 968,668 |
Qatar National Bank QPSC | 650,779 | 2,477,702 |
5,480,183 | ||
Saudi Arabia 2.3% | ||
Al Rajhi Bank | 94,606 | 2,012,199 |
Riyad Bank | 130,558 | 962,660 |
SECURITY | NUMBER OF SHARES | VALUE ($) |
SABIC Agri-Nutrients Co. | 17,764 | 547,405 |
Saudi Arabian Mining Co. * | 54,867 | 739,622 |
Saudi Arabian Oil Co. | 320,136 | 2,565,157 |
Saudi Awwal Bank | 71,764 | 778,776 |
Saudi Basic Industries Corp. | 228,035 | 5,137,700 |
Saudi Electricity Co. | 294,434 | 1,458,728 |
Saudi National Bank | 210,762 | 2,109,824 |
Saudi Telecom Co. | 298,566 | 2,995,894 |
19,307,965 | ||
South Africa 4.3% | ||
Absa Group Ltd. | 268,430 | 2,074,561 |
Anglo American Platinum Ltd. (a) | 24,347 | 848,127 |
Anglogold Ashanti PLC | 86,452 | 1,988,274 |
Bid Corp. Ltd. | 63,688 | 1,460,395 |
Bidvest Group Ltd. | 72,601 | 949,845 |
Exxaro Resources Ltd. | 96,849 | 927,918 |
FirstRand Ltd. | 949,867 | 3,279,083 |
Gold Fields Ltd. | 128,217 | 2,074,251 |
Impala Platinum Holdings Ltd. | 395,832 | 1,762,067 |
MTN Group Ltd. | 775,298 | 3,731,234 |
Naspers Ltd., N Shares | 10,595 | 2,030,688 |
Nedbank Group Ltd. (a) | 135,169 | 1,643,542 |
Old Mutual Ltd. | 1,551,736 | 908,555 |
Sanlam Ltd. | 345,436 | 1,249,573 |
Sappi Ltd. | 442,677 | 1,189,208 |
Sasol Ltd. | 204,815 | 1,438,889 |
Shoprite Holdings Ltd. | 105,149 | 1,402,930 |
Sibanye Stillwater Ltd. | 2,095,357 | 2,391,536 |
Standard Bank Group Ltd. | 318,574 | 2,991,653 |
Vodacom Group Ltd. | 198,474 | 953,814 |
35,296,143 | ||
Taiwan 20.6% | ||
Acer, Inc. | 909,496 | 1,251,424 |
ASE Technology Holding Co. Ltd. | 922,000 | 4,147,706 |
Asia Cement Corp. | 699,000 | 937,504 |
Asustek Computer, Inc. | 251,041 | 3,291,836 |
AUO Corp. | 4,789,440 | 2,678,060 |
Catcher Technology Co. Ltd. | 241,000 | 1,609,802 |
Cathay Financial Holding Co. Ltd. | 1,710,622 | 2,645,228 |
Chailease Holding Co. Ltd. | 146,353 | 771,904 |
China Development Financial Holding Corp. * | 2,885,000 | 1,206,056 |
China Steel Corp. | 3,741,198 | 2,850,126 |
Chunghwa Telecom Co. Ltd. | 601,956 | 2,287,935 |
Compal Electronics, Inc. | 2,587,305 | 2,822,125 |
CTBC Financial Holding Co. Ltd. | 2,645,201 | 2,760,845 |
Delta Electronics, Inc. | 219,590 | 2,150,509 |
E.Sun Financial Holding Co. Ltd. | 1,227,988 | 1,031,881 |
Evergreen Marine Corp. Taiwan Ltd. | 567,000 | 3,299,751 |
Far Eastern New Century Corp. | 1,376,817 | 1,373,433 |
First Financial Holding Co. Ltd. | 1,102,147 | 923,955 |
Formosa Chemicals & Fibre Corp. | 1,210,442 | 2,057,317 |
Formosa Petrochemical Corp. | 429,330 | 948,751 |
Formosa Plastics Corp. | 843,732 | 1,772,627 |
Fubon Financial Holding Co. Ltd. | 1,492,335 | 3,157,062 |
Hon Hai Precision Industry Co. Ltd. | 6,579,572 | 31,321,049 |
Innolux Corp. | 6,086,604 | 2,647,068 |
Inventec Corp. | 974,639 | 1,563,533 |
Largan Precision Co. Ltd. | 16,050 | 1,069,860 |
Lite-On Technology Corp., ADR | 373,167 | 1,129,494 |
MediaTek, Inc. | 167,838 | 5,060,512 |
Mega Financial Holding Co. Ltd. | 1,133,916 | 1,389,513 |
Micro-Star International Co. Ltd. | 161,000 | 783,380 |
Nan Ya Plastics Corp. | 1,477,622 | 2,565,749 |
SECURITY | NUMBER OF SHARES | VALUE ($) |
Novatek Microelectronics Corp. | 95,000 | 1,795,045 |
Pegatron Corp. | 1,325,264 | 3,952,500 |
Pou Chen Corp. | 1,555,267 | 1,721,479 |
Powertech Technology, Inc. | 271,000 | 1,443,175 |
President Chain Store Corp. | 94,237 | 792,498 |
Quanta Computer, Inc. | 448,500 | 3,519,934 |
Realtek Semiconductor Corp. | 55,000 | 867,633 |
Shin Kong Financial Holding Co. Ltd. * | 2,775,000 | 733,317 |
Synnex Technology International Corp. | 591,850 | 1,446,630 |
Taiwan Cement Corp. | 1,405,926 | 1,381,953 |
Taiwan Cooperative Financial Holding Co. Ltd. | 938,155 | 753,927 |
Taiwan Mobile Co. Ltd. | 271,196 | 865,551 |
Taiwan Semiconductor Manufacturing Co. Ltd. | 1,621,803 | 38,832,053 |
Unimicron Technology Corp. | 118,000 | 652,543 |
Uni-President Enterprises Corp. | 1,088,678 | 2,553,609 |
United Microelectronics Corp. | 2,157,965 | 3,315,546 |
Walsin Lihwa Corp. | 865,420 | 977,546 |
Wan Hai Lines Ltd. | 396,000 | 615,093 |
Wistron Corp. | 733,682 | 2,512,171 |
WPG Holdings Ltd. | 828,880 | 2,238,659 |
Yageo Corp. | 66,714 | 1,272,536 |
Yang Ming Marine Transport Corp. | 1,127,000 | 1,801,830 |
Yuanta Financial Holding Co. Ltd. | 1,696,070 | 1,590,974 |
Zhen Ding Technology Holding Ltd. | 255,000 | 902,591 |
170,044,788 | ||
Thailand 2.5% | ||
Advanced Info Service PCL NVDR | 180,175 | 957,277 |
Bangkok Dusit Medical Services PCL NVDR | 852,000 | 665,311 |
Banpu PCL NVDR | 3,637,000 | 542,606 |
Charoen Pokphand Foods PCL NVDR | 2,796,300 | 1,491,389 |
CP ALL PCL NVDR | 771,400 | 1,192,208 |
Kasikornbank PCL NVDR | 496,900 | 1,744,267 |
Krung Thai Bank PCL NVDR | 1,639,500 | 741,482 |
PTT Exploration & Production PCL NVDR | 281,400 | 1,177,180 |
PTT Global Chemical PCL NVDR | 1,352,500 | 1,333,999 |
PTT PCL NVDR | 7,700,970 | 6,979,182 |
SCB X PCL NVDR | 484,400 | 1,387,167 |
Siam Cement PCL NVDR | 274,500 | 1,838,970 |
Thai Oil PCL NVDR | 605,785 | 882,660 |
20,933,698 | ||
Turkey 1.7% | ||
Akbank TAS | 1,331,612 | 2,450,954 |
BIM Birlesik Magazalar AS | 100,193 | 1,197,001 |
Eregli Demir ve Celik Fabrikalari TAS | 818,981 | 1,088,898 |
Haci Omer Sabanci Holding AS * | 437,440 | 1,248,729 |
KOC Holding AS | 215,954 | 1,507,652 |
Turk Hava Yollari AO * | 121,383 | 1,221,841 |
Turkcell Iletisim Hizmetleri AS | 530,563 | 1,323,694 |
Turkiye Is Bankasi AS, Class C | 3,032,883 | 1,283,904 |
Turkiye Petrol Rafinerileri AS | 221,139 | 1,336,957 |
Yapi ve Kredi Bankasi AS | 1,214,989 | 1,216,658 |
13,876,288 | ||
United Arab Emirates 1.1% | ||
Abu Dhabi Commercial Bank PJSC | 462,552 | 1,050,309 |
Dubai Islamic Bank PJSC | 496,202 | 751,146 |
SECURITY | NUMBER OF SHARES | VALUE ($) |
Emaar Properties PJSC * | 991,768 | 2,216,890 |
Emirates NBD Bank PJSC | 54,294 | 251,300 |
Emirates Telecommunications Group Co. PJSC | 554,877 | 2,568,246 |
First Abu Dhabi Bank PJSC | 603,897 | 2,051,957 |
8,889,848 | ||
Total Common Stocks (Cost $633,652,920) | 789,936,078 | |
PREFERRED STOCKS 4.5% OF NET ASSETS | ||
Brazil 4.3% | ||
Banco Bradesco SA | 1,397,692 | 3,768,380 |
Centrais Eletricas Brasileiras SA, B Shares | 45,214 | 361,879 |
Cia Energetica de Minas Gerais | 458,807 | 863,256 |
Companhia Paranaense de Energia, B Shares | 524,190 | 917,630 |
Gerdau SA | 610,069 | 2,145,334 |
Itau Unibanco Holding SA | 982,554 | 5,934,001 |
Metalurgica Gerdau SA | 680,132 | 1,385,779 |
Petroleo Brasileiro SA | 2,431,205 | 19,674,004 |
35,050,263 | ||
Chile 0.1% | ||
Sociedad Quimica y Minera de Chile SA, Class B | 15,067 | 688,181 |
Colombia 0.1% | ||
Bancolombia SA | 150,865 | 1,234,455 |
Total Preferred Stocks (Cost $23,411,673) | 36,972,899 | |
SHORT-TERM INVESTMENTS 0.7% OF NET ASSETS | ||
Money Market Funds 0.7% | ||
State Street Institutional U.S. Government Money Market Fund, Premier Class 5.25% (c)(d) | 5,436,845 | 5,436,845 |
Total Short-Term Investments (Cost $5,436,845) | 5,436,845 | |
Total Investments in Securities (Cost $662,501,438) | 832,345,822 | |
* | Non-income producing security. |
(a) | All or a portion of this security is on loan. Securities on loan were valued at $4,089,789. |
(b) | Fair valued using significant unobservable inputs (see financial note 2(a), Securities for which no quoted value is available, for additional information). |
(c) | The rate shown is the annualized 7-day yield. |
(d) | Security purchased with cash collateral received for securities on loan. |
ADR — | American Depositary Receipt |
DVR — | Differential Voting Rights |
NVDR — | Non-Voting Depositary Receipt |
DESCRIPTION | QUOTED PRICES IN ACTIVE MARKETS FOR IDENTICAL ASSETS (LEVEL 1) | OTHER SIGNIFICANT OBSERVABLE INPUTS (LEVEL 2) | SIGNIFICANT UNOBSERVABLE INPUTS (LEVEL 3) | TOTAL |
Assets | ||||
Common Stocks1 | $— | $161,154,195 | $— | $161,154,195 |
Brazil | 58,668,577 | — | — | 58,668,577 |
Chile | 4,652,889 | — | — | 4,652,889 |
China | 3,007,676 | 276,413,031 | 1,776,752 | 281,197,459 |
Colombia | 1,371,067 | — | — | 1,371,067 |
Czech Republic | 972,499 | — | — | 972,499 |
Greece | 1,672,316 | 1,462,452 | — | 3,134,768 |
Hungary | 2,052,809 | 1,851,723 | — | 3,904,532 |
Malaysia | 4,367,645 | 9,252,406 | — | 13,620,051 |
Mexico | 27,672,791 | — | — | 27,672,791 |
Qatar | 2,033,813 | 3,446,370 | — | 5,480,183 |
South Africa | 12,109,092 | 23,187,051 | — | 35,296,143 |
Taiwan | 3,299,751 | 166,745,037 | — | 170,044,788 |
Turkey | 7,762,946 | 6,113,342 | — | 13,876,288 |
United Arab Emirates | 7,839,539 | 1,050,309 | — | 8,889,848 |
Preferred Stocks1 | 36,972,899 | — | — | 36,972,899 |
Short-Term Investments1 | 5,436,845 | — | — | 5,436,845 |
Total | $179,893,154 | $650,675,916 | $1,776,752 | $832,345,822 |
1 | As categorized in the Portfolio Holdings. |
Assets | ||
Investments in securities, at value - unaffiliated issuers (cost $662,501,438) including securities on loan of $4,089,789 | $832,345,822 | |
Cash | 5,029,647 | |
Foreign currency, at value (cost $1,255,944) | 1,254,653 | |
Deposit with broker for futures contracts | 72,411 | |
Receivables: | ||
Dividends | 2,153,596 | |
Fund shares sold | 199,619 | |
Investments sold | 53,407 | |
Income from securities on loan | + | 36,451 |
Total assets | 841,145,606 | |
Liabilities | ||
Collateral held for securities on loan | 5,436,845 | |
Payables: | ||
Fund shares redeemed | 5,598,136 | |
Foreign capital gains tax | 5,351,976 | |
Investment adviser fees | + | 262,280 |
Total liabilities | 16,649,237 | |
Net assets | $824,496,369 | |
Net Assets by Source | ||
Capital received from investors | $814,946,664 | |
Total distributable earnings | + | 9,549,705 |
Net assets | $824,496,369 | |
Net Asset Value (NAV) | ||||
Net Assets | ÷ | Shares Outstanding | = | NAV |
$824,496,369 | 92,806,677 | $8.88 | ||
For the period November 1, 2023 through April 30, 2024; unaudited | ||
Investment Income | ||
Dividends received from securities - unaffiliated issuers (net of foreign withholding tax of $1,109,811) | $11,186,118 | |
Other interest | 77,885 | |
Securities on loan, net | + | 108,272 |
Total investment income | 11,372,275 | |
Expenses | ||
Investment adviser fees | 1,511,348 | |
Total expenses | – | 1,511,348 |
Net investment income | 9,860,927 | |
REALIZED AND UNREALIZED GAINS (LOSSES) | ||
Net realized gains on sales of securities - unaffiliated issuers (net of foreign capital gains tax paid of $1,212,915) | 7,109,934 | |
Net realized gains on futures contracts | 434,953 | |
Net realized losses on foreign currency transactions | + | (169,661 ) |
Net realized gains | 7,375,226 | |
Net change in unrealized appreciation (depreciation) on securities - unaffiliated issuers (net of change in foreign capital gains tax of ($2,818,754)) | 100,430,597 | |
Net change in unrealized appreciation (depreciation) on futures contracts | 88,056 | |
Net change in unrealized appreciation (depreciation) on foreign currency translations | + | (26,282 ) |
Net change in unrealized appreciation (depreciation) | + | 100,492,371 |
Net realized and unrealized gains | 107,867,597 | |
Increase in net assets resulting from operations | $117,728,524 | |
OPERATIONS | |||
11/1/23-4/30/24 | 11/1/22-10/31/23 | ||
Net investment income | $9,860,927 | $33,974,624 | |
Net realized gains (losses) | 7,375,226 | (3,536,349 ) | |
Net change in unrealized appreciation (depreciation) | + | 100,492,371 | 60,740,349 |
Increase in net assets resulting from operations | $117,728,524 | $91,178,624 | |
DISTRIBUTIONS TO SHAREHOLDERS | |||
Total distributions | ($37,187,563 ) | ($35,727,633 ) | |
TRANSACTIONS IN FUND SHARES | |||||
11/1/23-4/30/24 | 11/1/22-10/31/23 | ||||
SHARES | VALUE | SHARES | VALUE | ||
Shares sold | 12,623,919 | $105,582,703 | 22,274,568 | $182,839,887 | |
Shares reinvested | 3,008,395 | 24,789,176 | 2,947,877 | 22,698,652 | |
Shares redeemed | + | (9,577,632 ) | (81,861,312 ) | (20,616,360 ) | (169,703,400 ) |
Net transactions in fund shares | 6,054,682 | $48,510,567 | 4,606,085 | $35,835,139 | |
SHARES OUTSTANDING AND NET ASSETS | |||||
11/1/23-4/30/24 | 11/1/22-10/31/23 | ||||
SHARES | NET ASSETS | SHARES | NET ASSETS | ||
Beginning of period | 86,751,995 | $695,444,841 | 82,145,910 | $604,158,711 | |
Total increase | + | 6,054,682 | 129,051,528 | 4,606,085 | 91,286,130 |
End of period | 92,806,677 | $824,496,369 | 86,751,995 | $695,444,841 | |
SCHWAB CAPITAL TRUST | |
Schwab Fundamental US Large Company Index Fund | Schwab Target 2015 Fund |
Schwab Fundamental US Small Company Index Fund | Schwab Target 2020 Fund |
Schwab Fundamental International Large Company Index Fund | Schwab Target 2025 Fund |
Schwab Fundamental International Small Company Index Fund | Schwab Target 2030 Fund |
Schwab Fundamental Emerging Markets Large Company Index Fund | Schwab Target 2035 Fund |
Schwab Fundamental Global Real Estate Index Fund | Schwab Target 2040 Fund |
Schwab S&P 500 Index Fund | Schwab Target 2045 Fund |
Schwab Small-Cap Index Fund® | Schwab Target 2050 Fund |
Schwab U.S. Large-Cap Growth Index Fund | Schwab Target 2055 Fund |
Schwab U.S. Large-Cap Value Index Fund | Schwab Target 2060 Fund |
Schwab U.S. Mid-Cap Index Fund | Schwab Target 2065 Fund |
Schwab Total Stock Market Index Fund® | Schwab Target 2010 Index Fund |
Schwab International Index Fund® | Schwab Target 2015 Index Fund |
Schwab MarketTrack All Equity Portfolio™ | Schwab Target 2020 Index Fund |
Schwab MarketTrack Growth Portfolio™ | Schwab Target 2025 Index Fund |
Schwab MarketTrack Balanced Portfolio™ | Schwab Target 2030 Index Fund |
Schwab MarketTrack Conservative Portfolio™ | Schwab Target 2035 Index Fund |
Schwab International Opportunities Fund | Schwab Target 2040 Index Fund |
Schwab Balanced Fund | Schwab Target 2045 Index Fund |
Schwab Core Equity Fund | Schwab Target 2050 Index Fund |
Schwab Dividend Equity Fund | Schwab Target 2055 Index Fund |
Schwab Large-Cap Growth Fund | Schwab Target 2060 Index Fund |
Schwab Small-Cap Equity Fund | Schwab Target 2065 Index Fund |
Schwab Health Care Fund | Schwab Monthly Income Fund - Target Payout |
Schwab International Core Equity Fund | Schwab Monthly Income Fund - Flexible Payout |
Schwab Target 2010 Fund | Schwab Monthly Income Fund - Income Payout |
3. Risk Factors:
4. Affiliates and Affiliated Transactions:
SCHWAB FUNDAMENTAL US LARGE COMPANY INDEX FUND | SCHWAB FUNDAMENTAL US SMALL COMPANY INDEX FUND | SCHWAB FUNDAMENTAL INTERNATIONAL LARGE COMPANY INDEX FUND | SCHWAB FUNDAMENTAL INTERNATIONAL SMALL COMPANY INDEX FUND | SCHWAB FUNDAMENTAL EMERGING MARKETS LARGE COMPANY INDEX FUND |
0.25 % | 0.25 % | 0.25 % | 0.39 % | 0.39 % |
UNDERLYING FUNDS | |||||
SCHWAB FUNDAMENTAL US LARGE COMPANY INDEX FUND | SCHWAB FUNDAMENTAL US SMALL COMPANY INDEX FUND | SCHWAB FUNDAMENTAL INTERNATIONAL LARGE COMPANY INDEX FUND | SCHWAB FUNDAMENTAL INTERNATIONAL SMALL COMPANY INDEX FUND | SCHWAB FUNDAMENTAL EMERGING MARKETS LARGE COMPANY INDEX FUND | |
Schwab MarketTrack All Equity Portfolio | 1.4 % | 1.6 % | 2.3 % | 7.5 % | 5.2 % |
Schwab MarketTrack Balanced Portfolio | 0.6 % | 0.5 % | 0.9 % | 2.5 % | 1.7 % |
Schwab MarketTrack Conservative Portfolio | 0.1 % | 0.1 % | 0.2 % | 0.6 % | 0.4 % |
Schwab MarketTrack Growth Portfolio | 1.3 % | 1.3 % | 1.8 % | 5.3 % | 3.6 % |
Schwab Target 2010 Fund | 0.0 %* | — % | 0.0 %* | — % | — % |
Schwab Target 2015 Fund | 0.0 %* | — % | 0.0 %* | — % | — % |
Schwab Target 2020 Fund | 0.1 % | — % | 0.1 % | — % | — % |
Schwab Target 2025 Fund | 0.1 % | — % | 0.1 % | — % | — % |
Schwab Target 2030 Fund | 0.3 % | — % | 0.3 % | — % | — % |
Schwab Target 2035 Fund | 0.3 % | — % | 0.2 % | — % | — % |
Schwab Target 2040 Fund | 0.6 % | — % | 0.5 % | — % | — % |
Schwab Target 2045 Fund | 0.2 % | — % | 0.1 % | — % | — % |
Schwab Target 2050 Fund | 0.2 % | — % | 0.1 % | — % | — % |
Schwab Target 2055 Fund | 0.1 % | — % | 0.1 % | — % | — % |
Schwab Target 2060 Fund | 0.1 % | — % | 0.0 %* | — % | — % |
Schwab Target 2065 Fund | 0.0 %* | — % | 0.0 %* | — % | — % |
* | Less than 0.05% |
PURCHASE COST | SALE PROCEEDS | REALIZED GAINS (LOSSES) | |
Schwab Fundamental US Large Company Index Fund | $133,451,844 | $95,194,646 | ($5,783,673 ) |
Schwab Fundamental US Small Company Index Fund | 35,138,318 | 58,343,044 | 10,590,699 |
Schwab Fundamental International Large Company Index Fund | 41,085,022 | 40,922,981 | 2,800,469 |
Schwab Fundamental International Small Company Index Fund | 27,835,817 | 16,005,747 | 5,593,520 |
Schwab Fundamental Emerging Markets Large Company Index Fund | 6,732,034 | 3,444,165 | 783,629 |
5. Board of Trustees:
6. Borrowing from Banks:
7. Derivatives:
EQUITY CONTRACTS | TOTAL | |
Asset Derivatives | ||
Schwab Fundamental US Large Company Index Fund | ||
Futures Contracts1 | $8,628 | $8,628 |
Schwab Fundamental US Small Company Index Fund | ||
Futures Contracts1 | 2,245 | 2,245 |
1 | Includes cumulative unrealized appreciation of futures contracts as reported in the fund’s Portfolio Holdings. Only current day’s variation margin on futures contracts is reported in the Statement of Assets and Liabilities. |
Liability Derivatives | ||
Schwab Fundamental International Large Company Index Fund | ||
Futures Contracts1 | ($122,117 ) | ($122,117 ) |
Schwab Fundamental International Small Company Index Fund | ||
Futures Contracts1 | (125,933 ) | (125,933 ) |
1 | Includes cumulative unrealized depreciation of futures contracts as reported in each fund’s Portfolio Holdings. Only current day’s variation margin on futures contracts is reported in the Statement of Assets and Liabilities. |
EQUITY CONTRACTS | TOTAL | |
Net Realized Gains (Losses) | ||
Schwab Fundamental US Large Company Index Fund | ||
Futures Contracts1 | $5,363,867 | $5,363,867 |
Schwab Fundamental US Small Company Index Fund | ||
Futures Contracts1 | 1,323,331 | 1,323,331 |
Schwab Fundamental International Large Company Index Fund | ||
Futures Contracts1 | 1,283,067 | 1,283,067 |
Schwab Fundamental International Small Company Index Fund | ||
Futures Contracts1 | 333,702 | 333,702 |
Schwab Fundamental Emerging Markets Large Company Index Fund | ||
Futures Contracts1 | 434,953 | 434,953 |
1 | Statement of Operations location: Net realized gains (losses) on futures contracts. |
Net Change in Unrealized Appreciation (Depreciation) | ||
Schwab Fundamental US Large Company Index Fund | ||
Futures Contracts1 | $1,114,400 | $1,114,400 |
Schwab Fundamental US Small Company Index Fund | ||
Futures Contracts1 | 246,940 | 246,940 |
Schwab Fundamental International Large Company Index Fund | ||
Futures Contracts1 | 219,765 | 219,765 |
Schwab Fundamental International Small Company Index Fund | ||
Futures Contracts1 | 13,289 | 13,289 |
Schwab Fundamental Emerging Markets Large Company Index Fund | ||
Futures Contracts1 | 88,056 | 88,056 |
1 | Statement of Operations location: Net change in unrealized appreciation (depreciation) on futures contracts. |
NOTIONAL AMOUNTS | NUMBER OF CONTRACTS | |
Schwab Fundamental US Large Company Index Fund | $31,603,459 | 133 |
Schwab Fundamental US Small Company Index Fund | 8,033,229 | 83 |
Schwab Fundamental International Large Company Index Fund | 17,269,511 | 156 |
Schwab Fundamental International Small Company Index Fund | 4,353,711 | 39 |
Schwab Fundamental Emerging Markets Large Company Index Fund | 4,317,201 | 87 |
8. Purchases and Sales of Investment Securities:
PURCHASES OF SECURITIES | SALES OF SECURITIES | |
Schwab Fundamental US Large Company Index Fund | $962,202,253 | $339,924,846 |
Schwab Fundamental US Small Company Index Fund | 487,788,212 | 280,420,771 |
Schwab Fundamental International Large Company Index Fund | 324,380,220 | 145,150,413 |
Schwab Fundamental International Small Company Index Fund | 86,928,406 | 112,010,981 |
Schwab Fundamental Emerging Markets Large Company Index Fund | 103,736,558 | 78,799,802 |
IN-KIND PURCHASES OF SECURITIES | IN-KIND SALES OF SECURITIES | |
Schwab Fundamental US Large Company Index Fund | $— | $371,746,416 |
Schwab Fundamental US Small Company Index Fund | — | 137,948,341 |
TAX COST | GROSS UNREALIZED APPRECIATION | GROSS UNREALIZED DEPRECIATION | NET UNREALIZED APPRECIATION (DEPRECIATION) | |
Schwab Fundamental US Large Company Index Fund | $5,137,367,939 | $3,297,069,086 | ($142,028,732 ) | $3,155,040,354 |
Schwab Fundamental US Small Company Index Fund | 1,613,692,479 | 402,594,247 | (169,463,560 ) | 233,130,687 |
Schwab Fundamental International Large Company Index Fund | 2,206,013,919 | 464,219,942 | (87,795,570 ) | 376,424,372 |
Schwab Fundamental International Small Company Index Fund | 515,935,096 | 96,929,332 | (45,407,599 ) | 51,521,733 |
Schwab Fundamental Emerging Markets Large Company Index Fund | 722,714,978 | 171,680,718 | (62,049,874 ) | 109,630,844 |
Schwab Fundamental US Large Company Index Fund | $43,802,035 |
Schwab Fundamental US Small Company Index Fund | 10,918,954 |
Schwab Fundamental International Large Company Index Fund | 52,818,527 |
Schwab Fundamental International Small Company Index Fund | 2,216,460 |
Schwab Fundamental Emerging Markets Large Company Index Fund | 102,902,372 |
PRIOR FISCAL YEAR END DISTRIBUTIONS | ||
ORDINARY INCOME | LONG-TERM CAPITAL GAINS | |
Schwab Fundamental US Large Company Index Fund | $133,865,719 | $— |
Schwab Fundamental US Small Company Index Fund | 18,239,275 | 87,539,598 |
Schwab Fundamental International Large Company Index Fund | 49,119,207 | — |
Schwab Fundamental International Small Company Index Fund | 11,013,851 | 15,959,445 |
Schwab Fundamental Emerging Markets Large Company Index Fund | 35,727,633 | — |
10. Subsequent Events:
Independent Trustees | |||
Name, Year of Birth, and Position(s) with the trust (Terms of office, and length of Time Served1) | Principal Occupations During the Past Five Years | Number of Portfolios in Fund Complex Overseen by the Trustee | Other Directorships |
Michael J. Beer 1961 Trustee (Trustee of The Charles Schwab Family of Funds, Schwab Investments, Schwab Capital Trust, Schwab Annuity Portfolios, Schwab Strategic Trust and Laudus Trust since 2022) | Retired. Director, President and Chief Executive Officer (Dec. 2016 – Sept. 2019), Principal Funds (investment management). | 106 | Director (2016 – 2019), Principal Funds, Inc. |
Robert W. Burns 1959 Trustee (Trustee of Schwab Strategic Trust since 2009; The Charles Schwab Family of Funds, Schwab Investments, Schwab Capital Trust, Schwab Annuity Portfolios and Laudus Trust since 2016) | Retired/Private Investor. | 106 | None |
Nancy F. Heller 1956 Trustee (Trustee of The Charles Schwab Family of Funds, Schwab Investments, Schwab Capital Trust, Schwab Annuity Portfolios, Schwab Strategic Trust and Laudus Trust since 2018) | Retired. | 106 | None |
David L. Mahoney 1954 Trustee (Trustee of The Charles Schwab Family of Funds, Schwab Investments, Schwab Capital Trust, Schwab Annuity Portfolios and Laudus Trust since 2011; Schwab Strategic Trust since 2016) | Private Investor. | 106 | Director (2004 – present), Corcept Therapeutics Incorporated Director (2009 – 2021), Adamas Pharmaceuticals, Inc. Director (2003 – 2019), Symantec Corporation |
Jane P. Moncreiff 1961 Trustee (Trustee of The Charles Schwab Family of Funds, Schwab Investments, Schwab Capital Trust, Schwab Annuity Portfolios, Schwab Strategic Trust and Laudus Trust since 2019) | Consultant (2018 – present), Fulham Advisers LLC (management consulting); Chief Investment Officer (2009 – 2017), CareGroup Healthcare System, Inc. (healthcare). | 106 | None |
Independent Trustees (continued) | |||
Name, Year of Birth, and Position(s) with the trust (Terms of office, and length of Time Served1) | Principal Occupations During the Past Five Years | Number of Portfolios in Fund Complex Overseen by the Trustee | Other Directorships |
Kimberly S. Patmore 1956 Trustee (Trustee of The Charles Schwab Family of Funds, Schwab Investments, Schwab Capital Trust, Schwab Annuity Portfolios, Schwab Strategic Trust and Laudus Trust since 2016) | Consultant (2008 – present), Patmore Management Consulting (management consulting). | 106 | None |
J. Derek Penn 1957 Trustee (Trustee of The Charles Schwab Family of Funds, Schwab Investments, Schwab Capital Trust, Schwab Annuity Portfolios, Schwab Strategic Trust and Laudus Trust since 2021) | Head of Equity Sales and Trading (2006 – 2018), BNY Mellon (financial services). | 106 | None |
Interested Trustees | |||
Name, Year of Birth, and Position(s) with the trust (Terms of office, and length of Time Served1) | Principal Occupations During the Past Five Years | Number of Portfolios in Fund Complex Overseen by the Trustee | Other Directorships |
Walter W. Bettinger II2 1960 Chairman and Trustee (Trustee of The Charles Schwab Family of Funds, Schwab Investments, Schwab Capital Trust and Schwab Annuity Portfolios since 2008; Schwab Strategic Trust since 2009; Laudus Trust since 2010) | Co-Chairman of the Board (July 2022 – present), Director and Chief Executive Officer (Oct. 2008 – present) and President (Feb. 2007 – Oct. 2021), The Charles Schwab Corporation; President and Chief Executive Officer (Oct. 2008 – Oct. 2021) and Director (May 2008 – Oct. 2021), Charles Schwab & Co., Inc.; Co-Chairman of the Board (July 2022 – present) and Director (Apr. 2006 – present), Charles Schwab Bank, SSB; Co-Chairman of the Board (July 2022 – present) and Director (Nov. 2017 – present), Charles Schwab Premier Bank, SSB; Co-Chairman of the Board (July 2022 – present) and Director (July 2019 – present), Charles Schwab Trust Bank; Director (May 2008 – present), Chief Executive Officer (Aug. 2017 – present) and President (Aug. 2017 – Nov. 2021), Schwab Holdings, Inc.; Manager (Sept. 2023 – present), TD Ameritrade Holding LLC; Director (Oct. 2020 – Aug. 2023), TD Ameritrade Holding Corporation; Director (July 2016 – Oct. 2021), Charles Schwab Investment Management, Inc. | 106 | Director (2008 – present), The Charles Schwab Corporation |
Richard A. Wurster2 1973 Trustee (Trustee of The Charles Schwab Family of Funds, Schwab Investments, Schwab Capital Trust, Schwab Annuity Portfolios, Schwab Strategic Trust and Laudus Trust since 2022) | President (Oct. 2021 – present) and Executive Vice President – Schwab Asset Management Solutions (Apr. 2019 – Oct. 2021), The Charles Schwab Corporation; President, Director (Oct. 2021 – present), Executive Vice President – Schwab Asset Management Solutions (July 2019 – Oct. 2021) and Senior Vice President – Advisory (May 2016 – July 2019), Charles Schwab & Co., Inc.; President (Nov. 2021 – present), Schwab Holdings, Inc.; Director (Oct. 2021 – present) and Chief Executive Officer (Nov. 2019 – Jan. 2022), Charles Schwab Investment Management, Inc.; Director, Chief Executive Officer and President (Mar. 2018 – Oct. 2022), Charles Schwab Investment Advisory, Inc.; Chief Executive Officer (July 2016 – Apr. 2018) and President (Mar. 2017 – Apr. 2018), ThomasPartners, Inc.; Chief Executive Officer (July 2016 – Apr. 2018), Windhaven Investment Management, Inc. | 106 | None |
Officers of the Trust | |
Name, Year of Birth, and Position(s) with the trust (Terms of office, and length of Time Served3) | Principal Occupations During the Past Five Years |
Omar Aguilar 1970 Chief Executive Officer, President and Chief Investment Officer (Officer of The Charles Schwab Family of Funds, Schwab Investments, Schwab Capital Trust, Schwab Annuity Portfolios, Schwab Strategic Trust and Laudus Trust since 2011) | Chief Executive Officer (Jan. 2022 – present), President (Oct. 2023 – present), (Chief Investment Officer (Apr. 2011 – present) and Senior Vice President (Apr. 2011 – Jan. 2022), Charles Schwab Investment Management, Inc.; Director, Chief Executive Officer and President (Oct. 2022 – present), Charles Schwab Investment Advisory, Inc.; Chief Executive Officer (Sept. 2023 – present), President (Oct. 2023 – present), Chief Investment Officer (June 2011 – present) and Vice President (June 2011 – Sept. 2023), Schwab Funds, Laudus Trust and Schwab ETFs. |
Mark Fischer 1970 Chief Operating Officer (Officer of The Charles Schwab Family of Funds, Schwab Investments, Schwab Capital Trust, Schwab Annuity Portfolios, Schwab Strategic Trust and Laudus Trust since 2013) | Chief Operating Officer (Dec. 2020 – present) and Treasurer and Chief Financial Officer (Jan. 2016 – Dec. 2022), Schwab Funds, Laudus Trust and Schwab ETFs; Chief Financial Officer (Mar. 2020 – present), Chief Operating Officer (Oct. 2023 – present), Managing Director (Mar. 2023 – present) and Vice President (Oct. 2013 – Mar. 2023), Charles Schwab Investment Management, Inc. |
Dana Smith 1965 Treasurer and Chief Financial Officer (Officer of The Charles Schwab Family of Funds, Schwab Investments, Schwab Capital Trust, Schwab Annuity Portfolios, Schwab Strategic Trust and Laudus Trust since 2023) | Treasurer and Chief Financial Officer (Jan. 2023 – present) and Assistant Treasurer (Dec. 2015 – Dec. 2022), Schwab Funds, Laudus Trust and Schwab ETFs; Managing Director (Mar. 2023 – present), Vice President (Mar. 2022 – Mar. 2023) and Director (Oct. 2015 – Mar. 2022), Charles Schwab Investment Management, Inc.; Managing Director (May 2022 – present) and Vice President (Apr. 2022 – May 2022), Charles Schwab & Co., Inc. |
Patrick Cassidy 1964 Vice President and Chief Investment Officer (Officer of The Charles Schwab Family of Funds, Schwab Investments, Schwab Capital Trust, Schwab Annuity Portfolios, Schwab Strategic Trust and Laudus Trust since 2018) | Chief Investment Officer (Oct. 2023 – present) and Vice President (Feb. 2018 – present), Schwab Funds, Laudus Trust and Schwab ETFs; Managing Director (Mar. 2023 – present), Chief Investment Officer (Oct. 2023 – present), and Senior Vice President (Oct. 2012 – Mar. 2023), Charles Schwab Investment Management, Inc. |
William P. McMahon, Jr. 1972 Vice President and Chief Investment Officer (Officer of The Charles Schwab Family of Funds, Schwab Investments, Schwab Capital Trust, Schwab Annuity Portfolios, Schwab Strategic Trust and Laudus Trust since 2021) | Managing Director (Mar. 2023 – present), Senior Vice President (Jan. 2020 – Mar. 2023) and Chief Investment Officer (Jan. 2020 – present) Charles Schwab Investment Management, Inc.; Vice President and Chief Investment Officer (June 2021 – present), Schwab Funds, Laudus Trust and Schwab ETFs; Senior Vice President and Chief Investment Officer – ThomasPartners Strategies (Apr. 2018 – Dec. 2019), Charles Schwab Investment Advisory, Inc.; Senior Vice President and Chief Investment Officer (May 2001 – Apr. 2018), ThomasPartners, Inc. |
Catherine MacGregor 1964 Chief Legal Officer and Secretary, Schwab Funds and Schwab ETFs Chief Legal Officer, Vice President and Clerk, Laudus Trust (Officer of The Charles Schwab Family of Funds, Schwab Investments, Schwab Capital Trust, Schwab Annuity Portfolios and Laudus Trust since 2005; Schwab Strategic Trust since 2009) | Chief Legal Officer (Mar. 2022 – present), Managing Director (Mar. 2023 – present) and Vice President (Sept. 2005 – Mar. 2023), Charles Schwab Investment Management, Inc.; Managing Director (May 2022 – present) and Vice President (Aug. 2005 – May 2022), Charles Schwab & Co., Inc.; Vice President (Dec. 2005 – present) and Chief Legal Officer and Clerk (Mar. 2007 – present), Laudus Trust; Chief Legal Officer and Secretary (Oct. 2021 – present), Vice President (Nov. 2005 – Oct. 2021) and Assistant Secretary (June 2007 – Oct. 2021), Schwab Funds; Chief Legal Officer and Secretary (Oct. 2021 – present), Vice President and Assistant Secretary (Oct. 2009 – Oct. 2021), Schwab ETFs. |
Member SIPC®
Printed on recycled paper.

No Action Required – Notice Regarding Shareholder Report Delivery |
Beginning on July 24, 2024, fund shareholder reports will be streamlined to highlight key information deemed important for investors to assess and monitor their fund investments. Other information, including financial statements, will not appear in the streamlined shareholder reports but will available online and delivered free of charge upon request. |
• If you already receive the full shareholder reports, you will receive the streamlined shareholder reports in the same way that you currently receive the full shareholder reports (either in paper or electronically). |
• If you currently receive a notification when a shareholder report is available on a fund’s website, beginning July 24, 2024, you will begin to receive the streamlined shareholder report (in paper). |
Total Return for the 6 Months Ended April 30, 2024 | |
Schwab International Opportunities Fund1 (Ticker Symbol: SWMIX) | 16.38% |
MSCI EAFE® Index (Net)2 | 18.63% |
Fund Category: Morningstar Foreign Large Growth3 | 18.78% |
Performance Details | pages 4-5 |
 | John Greves, CFA, Managing Director and Head of Multi-Asset Strategies for Schwab Asset Management, is responsible for the day-to-day co-management of the fund. Prior to joining Schwab in 2016, Mr. Greves worked at Russell Investment Management Company (Russell Investments) for 13 years, most recently as a portfolio manager for multi-asset solutions where he managed multiple target date funds, chaired the multi-asset advisory team, and co-authored papers on glide path methodology and benchmarking. Prior to that, he served in several roles for Russell Investments including associate portfolio manager for multi-asset solutions and senior portfolio analyst for multi-asset solutions. |
 | Tony Creasy, CFA, Senior Portfolio Manager for Schwab Asset Management, is responsible for the day-to-day co-management of the fund. Prior to his current role, he was a portfolio manager on the Multi-Asset Strategies Team, responsible for the daily management of several multi-asset portfolios. He also spent eight years as lead analyst on the Schwab Asset Management Investment Manager Research Team. Mr. Creasy started his tenure at Schwab in 2005 as an institutional investment analyst for the firm’s retirement investment services group, providing mutual fund analysis. |
 | David Rios, Portfolio Manager for Schwab Asset Management, is responsible for the day-to-day management of the portion of the fund that is invested in accordance with a particular index. Prior to this role, Mr. Rios was an associate portfolio manager on the equity index strategies team for four years. His first role with Schwab Asset Management was as a trade operations specialist. Prior to joining Schwab in 2008, Mr. Rios was a senior fund accountant at Investors Bank & Trust (subsequently acquired by State Street Corporation). |
Fund and Inception Date | 6 Months | 1 Year | 5 Years | 10 Years |
Fund: Schwab International Opportunities Fund (4/2/04)3 | 16.38% | 2.44% | 3.65% | 3.56% |
MSCI EAFE® Index (Net) 4 | 18.63% | 9.28% | 6.18% | 4.38% |
Fund Category: Morningstar Foreign Large Growth 5 | 18.78% | 7.07% | 5.57% | 5.24% |
Fund Expense Ratio6: 0.85% | ||||
Investment Managers | Investment Style | % of Net Assets |
Charles Schwab Investment Management, Inc., dba Schwab Asset Management8 | International Large-Cap Developed | 26.3% |
American Century Investment Management, Inc. | International Small-Cap Growth | 23.1% |
Harris Associates L.P | International Large-Cap Value | 20.3% |
Columbia Management Investment Advisers, LLC | International All-Cap Blend | 18.9% |
Baillie Gifford Overseas Limited | International Growth | 7.9% |
Cash and other assets9 | 3.5% |
Number of Holdings | 935 |
Weighted Average Market Cap (millions) | $91,051 |
Price/Earnings Ratio (P/E) | 18.4 |
Price/Book Ratio (P/B) | 2.2 |
Portfolio Turnover Rate | 26% 2 |
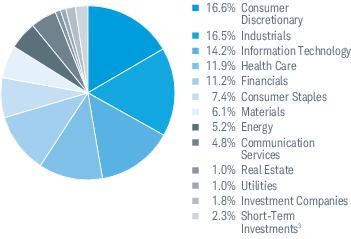
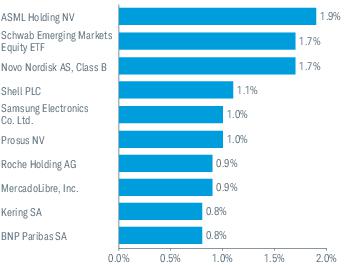
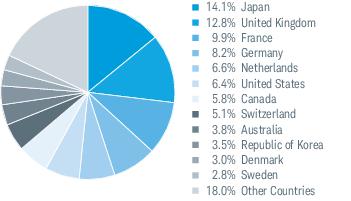
EXPENSE RATIO (ANNUALIZED) 1,2 | BEGINNING ACCOUNT VALUE AT 11/1/23 | ENDING ACCOUNT VALUE (NET OF EXPENSES) AT 4/30/24 | EXPENSES PAID DURING PERIOD 11/1/23-4/30/24 3 | |
Schwab International Opportunities Fund | ||||
Actual Return | 0.84% | $1,000.00 | $1,163.80 | $4.52 |
Hypothetical 5% Return | 0.84% | $1,000.00 | $1,020.69 | $4.22 |
1 | Based on the most recent six-month expense ratio. |
2 | Excludes acquired fund fees and expenses, which are indirect expenses incurred by the fund through its investments in underlying funds. Acquired fund fees and expenses were less than 0.01% during the period November 1, 2023 through April 30, 2024 (see financial note 4, Expense Limitation, for additional information). |
3 | Expenses for the fund are equal to its annualized expense ratio, multiplied by the average account value over the period, multiplied by 182 days in the period, and divided by 366 days in the fiscal year. |
11/1/23– 4/30/24* | 11/1/22– 10/31/23 | 11/1/21– 10/31/22 | 11/1/20– 10/31/21 | 11/1/19– 10/31/20 | 11/1/18– 10/31/191 | |
Per-Share Data | ||||||
Net asset value at beginning of period | $17.49 | $16.90 | $30.60 | $24.37 | $22.89 | $22.89 |
Income (loss) from investment operations: | ||||||
Net investment income (loss)2 | 0.14 | 0.33 | 0.26 | 0.01 | 0.00 3 | 0.31 |
Net realized and unrealized gains (losses) | 2.71 | 0.91 | (9.58 ) | 7.94 | 1.95 | 1.74 |
Total from investment operations | 2.85 | 1.24 | (9.32 ) | 7.95 | 1.95 | 2.05 |
Less distributions: | ||||||
Distributions from net investment income | (0.34 ) | (0.20 ) | (0.28 ) | — | (0.43 ) | (0.29 ) |
Distributions from net realized gains | — | (0.45 ) | (4.10 ) | (1.72 ) | (0.04 ) | (1.76 ) |
Total distributions | (0.34 ) | (0.65 ) | (4.38 ) | (1.72 ) | (0.47 ) | (2.05 ) |
Net asset value at end of period | $20.00 | $17.49 | $16.90 | $30.60 | $24.37 | $22.89 |
Total return | 16.38 %4 | 7.09 % | (34.79 %) | 33.50 % | 8.56 % | 10.50 % |
Ratios/Supplemental Data | ||||||
Ratios to average net assets: | ||||||
Net operating expenses | 0.84 %5,6 | 0.85 %6 | 0.99 %7,8 | 1.25 % | 1.25 % | 1.25 % |
Gross operating expenses | 0.84 %5,6 | 0.85 %6 | 1.08 %8 | 1.47 % | 1.51 % | 1.50 % |
Net investment income (loss) | 1.40 %5 | 1.70 % | 1.24 % | 0.05 % | 0.00 %9 | 1.43 % |
Portfolio turnover rate | 26 %4 | 63 % | 81 % | 59 % | 65 % | 54 % |
Net assets, end of period (x 1,000,000) | $1,002 | $927 | $982 | $1,495 | $1,243 | $1,413 |
* | Unaudited. |
1 | Effective February 26, 2019, the Investor Share class, and the Select Share class were consolidated into a single class of shares of the fund. The financial history as shown in the financial highlights is that of the former Select Shares. |
2 | Calculated based on the average shares outstanding during the period. |
3 | Per-share amount was less than $0.005. |
4 | Not annualized. |
5 | Annualized. |
6 | Ratio excludes less than 0.01% of acquired fund fees and expenses, which are indirect expenses incurred by the fund through its investments in underlying funds and are subject to a contractual expense limitation (see financial note 4, Expense Limitation, for additional information). |
7 | Effective February 25, 2022, the net operating expense limitation was lowered from 1.25% to 0.86%. The ratio presented for the period ended October 31, 2022, is a blended ratio. |
8 | Ratio includes less than 0.005% of non-routine proxy expenses. |
9 | Less than 0.005% |
SECURITY | NUMBER OF SHARES | VALUE ($) |
COMMON STOCKS 94.9% OF NET ASSETS | ||
Australia 3.8% | ||
AGL Energy Ltd. | 14,149 | 86,175 |
ALS Ltd. | 7,059 | 59,020 |
Altium Ltd. | 3,252 | 137,396 |
Alumina Ltd. * | 54,255 | 55,738 |
Amcor PLC | 26,375 | 234,512 |
BHP Group Ltd. | 84,533 | 2,318,411 |
BlueScope Steel Ltd. | 9,036 | 131,884 |
Boral Ltd. | 6,053 | 22,273 |
Brambles Ltd. | 118,937 | 1,118,917 |
CAR Group Ltd. | 125,357 | 2,718,179 |
Charter Hall Group | 9,814 | 74,530 |
Cleanaway Waste Management Ltd. | 33,947 | 58,727 |
Cochlear Ltd. | 1,802 | 375,912 |
Coles Group Ltd. | 27,645 | 288,316 |
Computershare Ltd. | 34,148 | 599,925 |
CSR Ltd. | 11,803 | 67,322 |
Deterra Royalties Ltd. | 11,613 | 36,760 |
Downer EDI Ltd. | 13,233 | 39,726 |
Flight Centre Travel Group Ltd. | 2,700 | 36,698 |
Fortescue Ltd. | 41,375 | 685,768 |
Goodman Group | 55,100 | 1,112,999 |
Harvey Norman Holdings Ltd. | 10,475 | 30,763 |
IDP Education Ltd. | 5,650 | 58,912 |
IGO Ltd. | 15,709 | 78,241 |
Iluka Resources Ltd. | 11,773 | 57,247 |
Incitec Pivot Ltd. | 32,434 | 58,238 |
Insurance Australia Group Ltd. | 78,178 | 323,890 |
James Hardie Industries PLC * | 10,586 | 363,925 |
JB Hi-Fi Ltd. | 2,973 | 116,013 |
Lottery Corp. Ltd. | 40,251 | 125,563 |
Lovisa Holdings Ltd. | 74,504 | 1,501,558 |
Magellan Financial Group Ltd. | 8,083 | 45,896 |
Medibank Pvt Ltd. | 168,852 | 386,985 |
Megaport Ltd. * | 159,589 | 1,366,481 |
Metcash Ltd. | 18,646 | 47,284 |
New Hope Corp. Ltd. | 14,746 | 42,896 |
NEXTDC Ltd. * | 315,938 | 3,353,835 |
Northern Star Resources Ltd. | 420,689 | 3,987,600 |
Origin Energy Ltd. | 36,068 | 227,640 |
Orora Ltd. | 23,052 | 32,312 |
Paladin Energy Ltd. * | 383,316 | 3,401,832 |
Pilbara Minerals Ltd. | 83,672 | 213,021 |
Pro Medicus Ltd. | 29,907 | 2,136,708 |
Qantas Airways Ltd. * | 24,339 | 91,829 |
Qube Holdings Ltd. | 28,355 | 60,319 |
REA Group Ltd. | 1,462 | 167,586 |
Reece Ltd. | 4,685 | 83,110 |
Region RE Ltd. | 36,474 | 51,131 |
Rio Tinto Ltd. | 8,392 | 698,419 |
Santos Ltd. | 660,704 | 3,242,315 |
Seven Group Holdings Ltd. | 105,381 | 2,560,664 |
Star Entertainment Group Ltd. * | 30,008 | 7,735 |
Steadfast Group Ltd. | 41,365 | 150,545 |
Tabcorp Holdings Ltd. | 34,380 | 16,132 |
SECURITY | NUMBER OF SHARES | VALUE ($) |
Transurban Group | 47,586 | 382,042 |
Wesfarmers Ltd. | 30,611 | 1,311,352 |
Whitehaven Coal Ltd. | 20,669 | 102,239 |
Woolworths Group Ltd. | 24,779 | 508,393 |
Worley Ltd. | 7,327 | 70,729 |
Yancoal Australia Ltd. | 4,549 | 16,240 |
37,736,808 | ||
Austria 0.1% | ||
ANDRITZ AG | 1,633 | 89,135 |
Kontron AG | 45,288 | 911,672 |
Mondi PLC | 9,192 | 174,470 |
OMV AG | 4,003 | 189,948 |
Telekom Austria AG | 2,982 | 25,618 |
Verbund AG | 1,843 | 140,789 |
voestalpine AG | 2,431 | 64,920 |
1,596,552 | ||
Belgium 0.3% | ||
Anheuser-Busch InBev SA | 43,200 | 2,582,227 |
Elia Group SA | 635 | 61,139 |
Lotus Bakeries NV | 8 | 80,510 |
Solvay SA | 1,551 | 50,103 |
Syensqo SA * | 1,609 | 149,141 |
Warehouses De Pauw CVA | 2,812 | 74,361 |
2,997,481 | ||
Brazil 1.4% | ||
Direcional Engenharia SA | 287,700 | 1,292,063 |
Embraer SA, ADR * | 76,622 | 1,957,692 |
JBS SA | 182,322 | 823,023 |
MercadoLibre, Inc. * | 6,255 | 9,124,168 |
YDUQS Participacoes SA | 297,800 | 836,749 |
14,033,695 | ||
Canada 5.8% | ||
Alamos Gold, Inc., Class A | 179,335 | 2,637,950 |
Alimentation Couche-Tard, Inc. | 20,875 | 1,156,984 |
Aritzia, Inc. * | 42,541 | 1,101,341 |
ATS Corp. * | 14,898 | 490,125 |
BCE, Inc. | 6,234 | 204,819 |
Boyd Group Services, Inc. | 6,016 | 1,124,976 |
Brookfield Asset Management Ltd., Class A | 16,241 | 620,429 |
Cameco Corp. | 56,544 | 2,580,103 |
Canadian National Railway Co. | 15,359 | 1,864,189 |
Canadian Natural Resources Ltd. | 27,881 | 2,112,771 |
Canadian Pacific Kansas City Ltd. | 15,089 | 1,183,752 |
Capstone Copper Corp. * | 353,593 | 2,447,784 |
Cargojet, Inc. | 14,591 | 1,303,667 |
Celestica, Inc. * | 63,695 | 2,759,904 |
Cenovus Energy, Inc. | 37,597 | 772,341 |
CGI, Inc. * | 3,941 | 399,324 |
Constellation Software, Inc. | 288 | 741,476 |
SECURITY | NUMBER OF SHARES | VALUE ($) |
Descartes Systems Group, Inc. * | 26,096 | 2,420,702 |
Dollarama, Inc. | 6,194 | 516,703 |
Energy Fuels, Inc. * | 143,400 | 742,812 |
ERO Copper Corp. * | 83,289 | 1,698,269 |
FirstService Corp. | 7,486 | 1,100,442 |
Franco-Nevada Corp. | 2,857 | 343,923 |
Hydro One Ltd. | 4,784 | 134,000 |
Imperial Oil Ltd. | 5,101 | 350,713 |
Loblaw Cos. Ltd. | 2,619 | 287,193 |
Lundin Gold, Inc. | 130,341 | 1,771,460 |
Magna International, Inc. | 5,455 | 260,734 |
Metro, Inc. | 4,227 | 216,224 |
Nutrien Ltd. (a) | 9,667 | 509,736 |
Nutrien Ltd. (a) | 19,038 | 1,004,635 |
Open Text Corp. | 90,051 | 3,179,733 |
Pan American Silver Corp. | 59,381 | 1,094,986 |
Primo Water Corp. | 195,988 | 3,698,294 |
Saputo, Inc. | 4,635 | 89,121 |
Shopify, Inc., Class A * | 21,439 | 1,505,018 |
SNC-Lavalin Group, Inc. | 77,205 | 2,964,484 |
Stantec, Inc. | 30,909 | 2,461,000 |
Suncor Energy, Inc. | 33,607 | 1,282,371 |
TELUS Corp. | 7,612 | 122,254 |
Thomson Reuters Corp. | 7,191 | 1,086,133 |
Tourmaline Oil Corp. | 6,732 | 329,008 |
Vermilion Energy, Inc. | 71,336 | 822,504 |
Waste Connections, Inc. | 4,087 | 662,636 |
Wheaton Precious Metals Corp. | 7,576 | 394,690 |
Whitecap Resources, Inc. | 424,534 | 3,219,507 |
57,771,220 | ||
China 1.7% | ||
Alibaba Group Holding Ltd. | 421,440 | 3,945,968 |
Bosideng International Holdings Ltd. | 1,016,000 | 588,129 |
Kanzhun Ltd., ADR | 104,674 | 2,071,499 |
Meituan, B Shares * | 219,690 | 2,999,763 |
PDD Holdings, Inc., ADR * | 11,787 | 1,475,497 |
Silergy Corp. | 91,000 | 1,208,582 |
Tencent Holdings Ltd. | 58,400 | 2,562,778 |
Tongcheng Travel Holdings Ltd. * | 742,000 | 1,952,854 |
16,805,070 | ||
Denmark 3.0% | ||
Ambu AS, Class B * | 75,231 | 1,202,908 |
AP Moller - Maersk AS, Class A | 81 | 114,873 |
AP Moller - Maersk AS, Class B | 134 | 194,175 |
Carlsberg AS, Class B | 2,698 | 362,916 |
DSV AS | 24,370 | 3,462,231 |
Genmab AS * | 7,590 | 2,107,211 |
H Lundbeck AS | 5,437 | 26,438 |
NKT AS * | 33,341 | 2,765,781 |
Novo Nordisk AS, Class B | 129,892 | 16,657,635 |
Novonesis (Novozymes) B, Class B | 7,232 | 400,484 |
Orsted AS * | 4,113 | 226,044 |
Pandora AS | 2,322 | 353,408 |
Rockwool AS, B Shares | 253 | 82,475 |
Royal Unibrew AS * | 16,869 | 1,270,361 |
Svitzer AS * | 430 | 14,450 |
Zealand Pharma AS * | 9,695 | 870,082 |
30,111,472 | ||
Finland 0.5% | ||
Elisa OYJ | 3,358 | 151,410 |
Kesko OYJ, B Shares | 4,807 | 82,067 |
Kone OYJ, B Shares | 9,974 | 486,202 |
SECURITY | NUMBER OF SHARES | VALUE ($) |
Metso OYJ | 10,398 | 117,883 |
Neste OYJ | 10,992 | 249,179 |
Nokia OYJ | 85,325 | 310,186 |
Orion OYJ, B Shares | 3,207 | 122,492 |
UPM-Kymmene OYJ | 93,863 | 3,289,440 |
4,808,859 | ||
France 9.9% | ||
Accor SA | 70,211 | 3,077,045 |
Aeroports de Paris SA | 491 | 62,364 |
Air Liquide SA | 9,628 | 1,883,031 |
Airbus SE | 15,968 | 2,627,658 |
ArcelorMittal SA | 14,159 | 353,732 |
AXA SA | 74,503 | 2,574,196 |
BioMerieux | 1,031 | 109,599 |
BNP Paribas SA | 113,603 | 8,175,083 |
Bollore SE | 16,303 | 105,819 |
Bureau Veritas SA | 5,841 | 170,357 |
Capgemini SE | 12,304 | 2,586,067 |
Cie de Saint-Gobain SA | 41,304 | 3,266,430 |
Cie Generale des Etablissements Michelin SCA | 42,533 | 1,634,060 |
Danone SA | 51,087 | 3,197,399 |
Dassault Aviation SA | 500 | 107,024 |
Edenred SE | 64,144 | 3,043,752 |
Eiffage SA | 31,786 | 3,391,517 |
Elis SA | 178,856 | 4,015,563 |
Engie SA * | 35,021 | 607,986 |
EssilorLuxottica SA | 4,918 | 1,048,673 |
Eurofins Scientific SE | 47,427 | 2,906,741 |
Gaztransport Et Technigaz SA | 16,121 | 2,246,949 |
Hermes International SCA | 2,350 | 5,625,877 |
Ipsen SA | 960 | 116,771 |
JCDecaux SE * | 1,170 | 24,421 |
Kering SA | 23,957 | 8,396,190 |
La Francaise des Jeux SAEM | 2,602 | 98,056 |
Legrand SA | 4,109 | 422,268 |
L'Oreal SA | 9,560 | 4,482,236 |
LVMH Moet Hennessy Louis Vuitton SE | 5,964 | 4,899,044 |
Publicis Groupe SA | 17,892 | 1,974,325 |
Remy Cointreau SA | 410 | 38,897 |
Rexel SA | 5,538 | 143,544 |
Safran SA | 6,904 | 1,497,009 |
Sanofi SA | 68,287 | 6,746,281 |
Sartorius Stedim Biotech | 422 | 90,885 |
Schneider Electric SE | 12,728 | 2,902,154 |
SOITEC * | 461 | 45,078 |
STMicroelectronics NV | 17,021 | 673,774 |
Teleperformance SE * | 1,160 | 105,078 |
Thales SA | 2,004 | 336,807 |
TotalEnergies SE | 94,312 | 6,846,934 |
Valeo SE | 119,673 | 1,516,676 |
Vinci SA | 8,752 | 1,025,525 |
VusionGroup * | 10,675 | 1,742,053 |
Worldline SA * | 183,200 | 1,900,242 |
98,841,170 | ||
Germany 8.1% | ||
adidas AG | 11,480 | 2,766,486 |
Allianz SE | 15,035 | 4,266,708 |
BASF SE | 16,053 | 841,122 |
Bayer AG | 241,723 | 7,051,225 |
Bayerische Motoren Werke AG | 43,431 | 4,731,777 |
Beiersdorf AG | 2,696 | 405,218 |
BioNTech SE, ADR * | 10,848 | 963,519 |
Brenntag SE | 32,170 | 2,567,275 |
SECURITY | NUMBER OF SHARES | VALUE ($) |
Carl Zeiss Meditec AG, Bearer Shares | 827 | 87,259 |
Continental AG | 75,227 | 4,875,559 |
Covestro AG * | 4,088 | 204,745 |
CTS Eventim AG & Co. KGaA | 21,408 | 1,893,082 |
Daimler Truck Holding AG | 80,831 | 3,645,173 |
Delivery Hero SE * | 89,541 | 2,505,138 |
Deutsche Lufthansa AG * | 13,548 | 96,958 |
Deutsche Post AG | 21,515 | 900,832 |
Duerr AG | 34,083 | 871,897 |
DWS Group GmbH & Co. KGaA | 1,221 | 51,519 |
E.ON SE | 174,982 | 2,317,106 |
Evonik Industries AG | 3,866 | 80,570 |
Fielmann Group AG | 464 | 21,636 |
Fresenius Medical Care AG | 140,500 | 5,915,430 |
Fresenius SE & Co. KGaA | 170,600 | 5,090,768 |
FUCHS SE | 1,104 | 40,358 |
GEA Group AG * | 4,315 | 174,153 |
Gerresheimer AG | 17,530 | 1,887,927 |
Heidelberg Materials AG | 2,348 | 236,293 |
Henkel AG & Co. KGaA | 31,058 | 2,233,335 |
HOCHTIEF AG | 408 | 42,962 |
Hugo Boss AG | 13,687 | 737,521 |
KION Group AG | 84,980 | 3,916,549 |
Mercedes-Benz Group AG | 71,694 | 5,422,998 |
MTU Aero Engines AG | 1,105 | 266,213 |
Nemetschek SE | 1,479 | 130,698 |
Rational AG | 153 | 130,509 |
RTL Group SA | 1,131 | 34,863 |
SAP SE | 25,495 | 4,603,559 |
Scout24 SE | 24,673 | 1,812,421 |
Siemens AG | 16,200 | 3,034,803 |
TeamViewer SE * | 75,442 | 995,286 |
thyssenkrupp AG | 239,500 | 1,201,974 |
Wacker Chemie AG | 316 | 33,827 |
Zalando SE * | 67,129 | 1,756,448 |
80,843,699 | ||
Greece 0.6% | ||
Jumbo SA | 78,941 | 2,458,295 |
National Bank of Greece SA * | 452,702 | 3,652,416 |
6,110,711 | ||
Guernsey 0.2% | ||
Burford Capital Ltd. | 153,784 | 2,351,357 |
Hong Kong 0.6% | ||
AAC Technologies Holdings, Inc. | 14,000 | 44,557 |
ASMPT Ltd. | 5,800 | 72,081 |
Budweiser Brewing Co. APAC Ltd. | 48,600 | 67,612 |
Cathay Pacific Airways Ltd. | 15,000 | 16,148 |
Chow Tai Fook Jewellery Group Ltd. | 31,600 | 42,996 |
CK Asset Holdings Ltd. | 38,000 | 162,092 |
CK Infrastructure Holdings Ltd. | 11,000 | 62,140 |
CLP Holdings Ltd. | 33,500 | 263,513 |
ESR Group Ltd. | 63,000 | 69,040 |
First Pacific Co. Ltd. | 44,000 | 20,578 |
Hong Kong & China Gas Co. Ltd. | 221,000 | 168,038 |
Johnson Electric Holdings Ltd. | 9,500 | 12,960 |
Lenovo Group Ltd. | 128,000 | 143,969 |
Link REIT | 70,300 | 301,221 |
L'Occitane International SA | 10,250 | 42,322 |
Man Wah Holdings Ltd. | 40,800 | 29,778 |
NagaCorp Ltd. * | 26,000 | 13,626 |
Nexteer Automotive Group Ltd. | 32,000 | 16,867 |
NWS Holdings Ltd. | 24,000 | 20,310 |
SECURITY | NUMBER OF SHARES | VALUE ($) |
Orient Overseas International Ltd. | 4,000 | 58,340 |
Power Assets Holdings Ltd. | 38,500 | 220,842 |
PRADA SpA | 9,800 | 79,922 |
Samsonite International SA * | 611,400 | 2,149,479 |
Sino Land Co. Ltd. | 53,069 | 56,741 |
SITC International Holdings Co. Ltd. | 37,000 | 80,238 |
Sun Hung Kai Properties Ltd. | 23,500 | 216,786 |
Techtronic Industries Co. Ltd. | 22,500 | 310,934 |
United Energy Group Ltd. | 168,000 | 11,984 |
Vitasoy International Holdings Ltd. | 22,000 | 16,420 |
VTech Holdings Ltd. | 4,500 | 26,011 |
WH Group Ltd. | 1,496,650 | 1,087,825 |
Xinyi Glass Holdings Ltd. | 43,839 | 46,847 |
Yue Yuen Industrial Holdings Ltd. | 17,500 | 30,985 |
5,963,202 | ||
India 2.2% | ||
Axis Bank Ltd. | 111,332 | 1,553,982 |
Honasa Consumer Ltd. * | 222,162 | 1,139,274 |
Kalyan Jewellers India Ltd. | 434,860 | 2,149,554 |
KEI Industries Ltd. | 51,237 | 2,452,372 |
Lemon Tree Hotels Ltd. * | 924,760 | 1,687,067 |
Max Financial Services Ltd. * | 242,986 | 2,940,343 |
Max Healthcare Institute Ltd. | 383,198 | 3,850,736 |
Phoenix Mills Ltd. | 52,655 | 1,985,894 |
Prestige Estates Projects Ltd. | 102,048 | 1,684,270 |
Rainbow Children's Medicare Ltd. | 80,402 | 1,322,457 |
Varun Beverages Ltd. | 68,241 | 1,207,169 |
21,973,118 | ||
Indonesia 0.3% | ||
Ace Hardware Indonesia Tbk. PT | 23,514,400 | 1,349,973 |
Bank Mandiri Persero Tbk. PT | 1,093,100 | 462,028 |
Bank Rakyat Indonesia Persero Tbk. PT | 5,185,900 | 1,569,790 |
3,381,791 | ||
Ireland 0.8% | ||
Bank of Ireland Group PLC | 193,627 | 2,065,890 |
Glanbia PLC | 110,125 | 2,096,654 |
Kerry Group PLC, Class A | 2,454 | 211,187 |
Kingspan Group PLC | 2,869 | 255,191 |
Ryanair Holdings PLC, ADR | 18,521 | 2,522,560 |
Smurfit Kappa Group PLC | 21,100 | 914,254 |
8,065,736 | ||
Israel 1.5% | ||
Airport City Ltd. * | 1,274 | 19,575 |
Amot Investments Ltd. | 4,605 | 19,314 |
Azrieli Group Ltd. | 715 | 46,003 |
Bank Hapoalim BM | 222,896 | 2,007,942 |
Bezeq The Israeli Telecommunication Corp. Ltd. | 55,141 | 68,498 |
Big Shopping Centers Ltd. * | 217 | 22,323 |
Camtek Ltd. | 29,392 | 2,379,870 |
Check Point Software Technologies Ltd. * | 23,899 | 3,570,989 |
CyberArk Software Ltd. * | 13,968 | 3,341,844 |
Delek Group Ltd. | 224 | 26,312 |
Elbit Systems Ltd. | 594 | 120,913 |
Electra Ltd. | 42 | 15,971 |
Fattal Holdings 1998 Ltd. * | 113 | 13,710 |
ICL Group Ltd. | 22,046 | 103,483 |
Israel Corp. Ltd. | 100 | 23,831 |
Melisron Ltd. | 643 | 44,110 |
Mivne Real Estate KD Ltd. | 18,607 | 44,726 |
SECURITY | NUMBER OF SHARES | VALUE ($) |
Nice Ltd. * | 1,784 | 398,921 |
Nova Ltd. *(a) | 805 | 136,231 |
Nova Ltd. *(a) | 14,013 | 2,380,809 |
SolarEdge Technologies, Inc. * | 7,125 | 417,881 |
Strauss Group Ltd. | 1,100 | 20,206 |
Teva Pharmaceutical Industries Ltd. * | 21,877 | 305,951 |
Tower Semiconductor Ltd. * | 3,282 | 106,207 |
15,635,620 | ||
Italy 1.8% | ||
A2A SpA | 44,431 | 87,625 |
Brembo NV | 103,627 | 1,318,330 |
Buzzi SpA | 1,705 | 61,432 |
Enel SpA | 172,646 | 1,134,706 |
Eni SpA | 58,123 | 933,553 |
Ferrari NV | 18,217 | 7,492,190 |
Hera SpA | 20,682 | 74,672 |
Interpump Group SpA | 1,468 | 63,946 |
Intesa Sanpaolo SpA | 1,349,600 | 5,051,560 |
Moncler SpA | 5,505 | 374,792 |
Prysmian SpA | 5,286 | 286,810 |
Reply SpA | 482 | 62,930 |
Stellantis NV | 54,449 | 1,204,765 |
Terna - Rete Elettrica Nazionale | 26,399 | 211,506 |
18,358,817 | ||
Japan 14.0% | ||
ABC-Mart, Inc. | 2,100 | 41,828 |
Acom Co. Ltd. | 12,600 | 32,489 |
Advantest Corp. | 16,900 | 528,981 |
AGC, Inc. | 2,900 | 107,225 |
Aica Kogyo Co. Ltd. | 1,200 | 27,815 |
Air Water, Inc. | 3,000 | 45,046 |
Aisin Corp. | 3,100 | 117,912 |
Amada Co. Ltd. | 8,300 | 90,653 |
Amano Corp. | 2,000 | 48,103 |
Amvis Holdings, Inc. | 45,500 | 620,755 |
ANA Holdings, Inc. | 3,700 | 70,270 |
Anritsu Corp. | 3,500 | 26,685 |
As One Corp. | 1,000 | 16,475 |
Asahi Intecc Co. Ltd. | 3,500 | 51,284 |
Asics Corp. | 53,100 | 2,275,990 |
Astellas Pharma, Inc. | 35,200 | 337,846 |
Azbil Corp. | 3,500 | 97,755 |
Bandai Namco Holdings, Inc. | 16,100 | 300,831 |
BayCurrent Consulting, Inc. | 57,221 | 1,218,073 |
Bridgestone Corp. | 10,500 | 463,333 |
Calbee, Inc. | 2,000 | 43,683 |
Canon Marketing Japan, Inc. | 1,000 | 27,477 |
Canon, Inc. | 14,700 | 397,860 |
Capcom Co. Ltd. | 10,400 | 171,209 |
Chubu Electric Power Co., Inc. | 16,200 | 207,943 |
Chugai Pharmaceutical Co. Ltd. | 13,400 | 426,171 |
Chugoku Electric Power Co., Inc. | 5,600 | 38,445 |
Coca-Cola Bottlers Japan Holdings, Inc. | 165,500 | 2,317,089 |
COMSYS Holdings Corp. | 2,800 | 65,541 |
Cosmo Energy Holdings Co. Ltd. | 1,500 | 71,708 |
Cosmos Pharmaceutical Corp. | 300 | 27,677 |
CyberAgent, Inc. | 404,300 | 2,519,017 |
Dai Nippon Printing Co. Ltd. | 4,300 | 125,242 |
Daicel Corp. | 4,000 | 37,152 |
Daifuku Co. Ltd. | 7,726 | 158,258 |
Daiichikosho Co. Ltd. | 2,000 | 23,345 |
Daito Trust Construction Co. Ltd. | 1,800 | 192,950 |
Denso Corp. | 43,900 | 748,193 |
Dentsu Soken, Inc. | 500 | 16,564 |
SECURITY | NUMBER OF SHARES | VALUE ($) |
Descente Ltd. | 1,000 | 22,547 |
Disco Corp. | 2,100 | 598,176 |
Electric Power Development Co. Ltd. | 3,600 | 61,153 |
ENEOS Holdings, Inc. | 72,200 | 333,579 |
Fancl Corp. | 2,000 | 23,359 |
FANUC Corp. | 28,300 | 838,226 |
Food & Life Cos. Ltd. | 1,700 | 32,131 |
FP Partner, Inc. | 68,500 | 2,181,472 |
Fuji Electric Co. Ltd. | 2,800 | 174,171 |
Fujikura Ltd. | 5,500 | 94,514 |
Fujitsu Ltd. | 185,300 | 2,862,541 |
GMO Payment Gateway, Inc. | 23,600 | 1,079,491 |
Goldwin, Inc. | 1,000 | 60,657 |
GS Yuasa Corp. | 1,100 | 20,754 |
Hakuhodo DY Holdings, Inc. | 4,200 | 39,065 |
Hamamatsu Photonics KK | 2,800 | 102,597 |
Harmonic Drive Systems, Inc. | 1,000 | 24,975 |
Hirose Electric Co. Ltd. | 800 | 84,917 |
Hitachi Ltd. | 41,678 | 3,845,240 |
Honda Motor Co. Ltd. | 81,600 | 928,410 |
Horiba Ltd. | 15,400 | 1,494,094 |
Hoshizaki Corp. | 55,900 | 1,926,241 |
House Foods Group, Inc. | 1,500 | 29,554 |
Hoya Corp. | 8,200 | 950,706 |
Idemitsu Kosan Co. Ltd. | 30,500 | 206,641 |
INFRONEER Holdings, Inc. | 3,800 | 33,652 |
Inpex Corp. | 25,200 | 377,491 |
Internet Initiative Japan, Inc. | 2,800 | 47,373 |
Isetan Mitsukoshi Holdings Ltd. | 6,200 | 87,080 |
Isuzu Motors Ltd. | 12,600 | 159,678 |
ITOCHU Corp. | 103,120 | 4,652,231 |
Iwatani Corp. | 1,334 | 75,748 |
Japan Airlines Co. Ltd. | 3,900 | 69,103 |
Japan Airport Terminal Co. Ltd. | 900 | 31,805 |
Japan Aviation Electronics Industry Ltd. | 700 | 11,246 |
Jeol Ltd. | 800 | 31,696 |
JFE Holdings, Inc. | 10,700 | 159,705 |
JGC Holdings Corp. | 6,300 | 60,727 |
JSR Corp. * | 800 | 21,946 |
JTEKT Corp. | 4,100 | 31,737 |
Justsystems Corp. | 22,265 | 387,825 |
Kakaku.com, Inc. | 3,600 | 41,409 |
Kamigumi Co. Ltd. | 2,800 | 60,468 |
Kandenko Co. Ltd. | 2,600 | 29,002 |
Kansai Electric Power Co., Inc. | 11,900 | 178,255 |
Kansai Paint Co. Ltd. | 4,400 | 57,280 |
Kawasaki Kisen Kaisha Ltd. | 17,100 | 240,937 |
KDDI Corp. | 32,100 | 890,736 |
Kewpie Corp. | 1,800 | 36,293 |
Keyence Corp. | 5,300 | 2,330,779 |
Kikkoman Corp. | 22,000 | 262,139 |
Kinden Corp. | 64,227 | 1,225,523 |
Kintetsu Group Holdings Co. Ltd. | 4,400 | 113,118 |
Kobayashi Pharmaceutical Co. Ltd. | 1,500 | 53,175 |
Kobe Bussan Co. Ltd. | 2,200 | 47,514 |
Koei Tecmo Holdings Co. Ltd. | 3,900 | 36,275 |
Koito Manufacturing Co. Ltd. | 5,800 | 78,014 |
Kokuyo Co. Ltd. | 1,300 | 22,209 |
Komatsu Ltd. | 153,500 | 4,582,919 |
Konami Group Corp. | 1,600 | 96,540 |
Kose Corp. | 700 | 36,095 |
Kotobuki Spirits Co. Ltd. | 3,000 | 30,890 |
Kurita Water Industries Ltd. | 2,500 | 99,010 |
Kyoritsu Maintenance Co. Ltd. | 52,300 | 1,115,331 |
Kyowa Kirin Co. Ltd. | 4,700 | 78,931 |
Kyudenko Corp. | 700 | 29,053 |
Kyushu Electric Power Co., Inc. | 7,300 | 67,721 |
Lasertec Corp. | 1,800 | 388,270 |
SECURITY | NUMBER OF SHARES | VALUE ($) |
Lion Corp. | 5,200 | 46,634 |
M3, Inc. | 83,500 | 883,277 |
Mabuchi Motor Co. Ltd. | 2,600 | 40,269 |
Macnica Holdings, Inc. | 66,601 | 2,936,641 |
Mani, Inc. | 1,200 | 13,902 |
Marubeni Corp. | 28,400 | 505,984 |
Maruichi Steel Tube Ltd. | 1,700 | 43,772 |
MatsukiyoCocokara & Co. | 189,703 | 2,690,126 |
Mazda Motor Corp. | 9,900 | 112,063 |
McDonald's Holdings Co. Japan Ltd. | 2,200 | 96,775 |
Mebuki Financial Group, Inc. | 286,837 | 1,014,721 |
Medipal Holdings Corp. | 3,100 | 48,617 |
MEIJI Holdings Co. Ltd. | 5,800 | 129,771 |
MISUMI Group, Inc. | 7,300 | 118,682 |
Mitsubishi Chemical Group Corp. | 23,100 | 134,762 |
Mitsubishi Corp. | 74,100 | 1,694,635 |
Mitsubishi Electric Corp. | 30,900 | 538,585 |
Mitsubishi Gas Chemical Co., Inc. | 3,200 | 56,622 |
Mitsubishi Logistics Corp. | 1,100 | 36,494 |
Mitsubishi Motors Corp. | 12,600 | 39,927 |
Mitsubishi UFJ Financial Group, Inc. | 432,844 | 4,311,711 |
Mitsui & Co. Ltd. | 31,500 | 1,520,684 |
Mitsui Chemicals, Inc. | 2,900 | 82,542 |
Mitsui Mining & Smelting Co. Ltd. | 800 | 25,086 |
Mitsui OSK Lines Ltd. | 7,100 | 225,351 |
Miura Co. Ltd. | 2,500 | 39,333 |
Money Forward, Inc. * | 56,200 | 1,956,959 |
MonotaRO Co. Ltd. | 6,900 | 82,696 |
Murata Manufacturing Co. Ltd. | 26,100 | 476,903 |
Nabtesco Corp. | 1,900 | 31,335 |
Nagase & Co. Ltd. | 1,600 | 27,681 |
NET One Systems Co. Ltd. | 1,800 | 30,170 |
Nexon Co. Ltd. | 11,700 | 182,419 |
NGK Insulators Ltd. | 4,600 | 62,663 |
NHK Spring Co. Ltd. | 2,500 | 25,337 |
Nifco, Inc. | 1,900 | 45,930 |
Nihon M&A Center Holdings, Inc. | 153,100 | 837,967 |
Nintendo Co. Ltd. | 29,300 | 1,428,931 |
Nippon Kayaku Co. Ltd. | 4,600 | 37,469 |
Nippon Sanso Holdings Corp. | 2,700 | 80,197 |
Nippon Shinyaku Co. Ltd. | 800 | 22,136 |
Nippon Shokubai Co. Ltd. | 3,600 | 34,218 |
Nippon Steel Corp. | 15,200 | 340,767 |
Nippon Telegraph & Telephone Corp. | 458,600 | 495,133 |
Nippon Yusen KK | 12,600 | 357,720 |
Nishi-Nippon Railroad Co. Ltd. | 1,100 | 17,137 |
Nissan Chemical Corp. | 55,914 | 1,906,006 |
Nisshin Seifun Group, Inc. | 4,000 | 52,180 |
Nissin Foods Holdings Co. Ltd. | 5,100 | 136,096 |
Niterra Co. Ltd. | 4,100 | 134,471 |
Nitori Holdings Co. Ltd. | 1,400 | 187,366 |
Nitto Denko Corp. | 4,000 | 330,742 |
Noevir Holdings Co. Ltd. | 400 | 13,235 |
NOF Corp. | 5,700 | 76,471 |
NOK Corp. | 1,900 | 27,497 |
NS Solutions Corp. | 600 | 19,543 |
NSK Ltd. | 7,200 | 39,596 |
Obayashi Corp. | 15,900 | 177,457 |
OBIC Business Consultants Co. Ltd. | 600 | 24,517 |
Obic Co. Ltd. | 1,700 | 218,393 |
OKUMA Corp. | 900 | 40,423 |
Omron Corp. | 3,100 | 106,399 |
Ono Pharmaceutical Co. Ltd. | 8,600 | 123,869 |
Open House Group Co. Ltd. | 2,200 | 66,903 |
Oracle Corp. | 900 | 67,540 |
Oriental Land Co. Ltd. | 24,800 | 684,275 |
Osaka Gas Co. Ltd. | 7,400 | 164,545 |
OSG Corp. | 1,700 | 21,924 |
SECURITY | NUMBER OF SHARES | VALUE ($) |
Otsuka Corp. | 166,814 | 3,317,617 |
PAL GROUP Holdings Co. Ltd. | 72,300 | 862,839 |
PALTAC Corp. | 600 | 18,160 |
Panasonic Holdings Corp. | 33,300 | 290,657 |
Persol Holdings Co. Ltd. | 51,000 | 70,549 |
Pigeon Corp. | 2,400 | 21,876 |
Pola Orbis Holdings, Inc. | 1,800 | 16,517 |
Rakus Co. Ltd. | 2,600 | 26,281 |
Rakuten Bank Ltd. * | 108,700 | 2,202,922 |
Recruit Holdings Co. Ltd. | 70,700 | 3,044,862 |
Relo Group, Inc. | 3,200 | 27,816 |
Resonac Holdings Corp. | 3,300 | 71,554 |
Resorttrust, Inc. | 900 | 14,895 |
Rinnai Corp. | 2,600 | 56,335 |
Rohm Co. Ltd. | 5,600 | 80,499 |
Rohto Pharmaceutical Co. Ltd. | 3,300 | 64,384 |
Round One Corp. | 108,956 | 478,614 |
Ryohin Keikaku Co. Ltd. | 147,500 | 2,376,081 |
Sankyo Co. Ltd. | 389,020 | 4,225,542 |
Sankyu, Inc. | 1,000 | 34,670 |
Sanrio Co. Ltd. | 156,332 | 2,635,827 |
Santen Pharmaceutical Co. Ltd. | 192,900 | 1,863,237 |
Sanwa Holdings Corp. | 26,916 | 439,562 |
SCREEN Holdings Co. Ltd. | 1,500 | 154,766 |
Secom Co. Ltd. | 5,000 | 347,312 |
Sega Sammy Holdings, Inc. | 4,200 | 54,974 |
Seino Holdings Co. Ltd. | 3,200 | 42,871 |
Sekisui Chemical Co. Ltd. | 6,700 | 97,472 |
SG Holdings Co. Ltd. | 12,300 | 143,973 |
SHIFT, Inc. * | 300 | 27,596 |
Shikoku Electric Power Co., Inc. | 2,700 | 22,377 |
Shimadzu Corp. | 7,300 | 198,327 |
Shimamura Co. Ltd. | 46,010 | 2,268,148 |
Shimano, Inc. | 2,200 | 357,529 |
Shimizu Corp. | 9,800 | 60,706 |
Shin-Etsu Chemical Co. Ltd. | 59,600 | 2,307,053 |
Shinko Electric Industries Co. Ltd. | 1,400 | 49,154 |
Shionogi & Co. Ltd. | 6,600 | 308,225 |
Ship Healthcare Holdings, Inc. | 104,395 | 1,553,180 |
SHO-BOND Holdings Co. Ltd. | 1,000 | 38,617 |
SMC Corp. | 1,500 | 788,050 |
SMS Co. Ltd. | 1,400 | 19,372 |
Socionext, Inc. | 53,200 | 1,555,335 |
Sohgo Security Services Co. Ltd. | 6,000 | 33,370 |
Sojitz Corp. | 3,900 | 100,413 |
Square Enix Holdings Co. Ltd. | 2,300 | 83,138 |
Stanley Electric Co. Ltd. | 3,900 | 69,018 |
Subaru Corp. | 17,800 | 397,456 |
Sugi Holdings Co. Ltd. | 2,400 | 35,213 |
SUMCO Corp. | 7,200 | 107,376 |
Sumitomo Bakelite Co. Ltd. | 1,200 | 34,180 |
Sumitomo Chemical Co. Ltd. | 24,500 | 52,343 |
Sumitomo Electric Industries Ltd. | 14,300 | 221,025 |
Sundrug Co. Ltd. | 1,100 | 31,941 |
Suntory Beverage & Food Ltd. | 42,854 | 1,394,265 |
Suzuken Co. Ltd. | 1,500 | 44,301 |
Suzuki Motor Corp. | 37,600 | 437,881 |
Sysmex Corp. | 9,000 | 143,913 |
Taiheiyo Cement Corp. | 60,900 | 1,392,935 |
Takara Holdings, Inc. | 3,500 | 22,993 |
Takeda Pharmaceutical Co. Ltd. | 106,543 | 2,800,170 |
TBS Holdings, Inc. | 25,800 | 672,393 |
TechnoPro Holdings, Inc. | 32,300 | 550,179 |
THK Co. Ltd. | 2,200 | 48,002 |
TIS, Inc. | 5,500 | 117,461 |
Toei Animation Co. Ltd. | 1,000 | 16,550 |
Toho Co. Ltd. | 3,000 | 100,507 |
Toho Gas Co. Ltd. | 2,400 | 61,633 |
SECURITY | NUMBER OF SHARES | VALUE ($) |
Tohoku Electric Power Co., Inc. | 10,300 | 79,517 |
Tokai Carbon Co. Ltd. | 3,300 | 21,893 |
Tokyo Electric Power Co. Holdings, Inc. * | 28,700 | 178,522 |
Tokyo Electron Ltd. | 11,000 | 2,412,803 |
Tokyo Gas Co. Ltd. | 11,800 | 264,642 |
Tokyo Ohka Kogyo Co. Ltd. | 68,600 | 1,819,153 |
TOPPAN Holdings, Inc. | 148,989 | 3,534,606 |
Toyo Suisan Kaisha Ltd. | 32,000 | 2,001,096 |
Toyo Tire Corp. | 132,600 | 2,508,673 |
Toyoda Gosei Co. Ltd. | 1,300 | 25,169 |
Toyota Boshoku Corp. | 1,300 | 19,225 |
Toyota Tsusho Corp. | 5,400 | 343,331 |
Trend Micro, Inc. | 2,400 | 118,268 |
TS Tech Co. Ltd. | 2,900 | 35,708 |
U-Next Holdings Co. Ltd. | 43,100 | 1,204,411 |
Unicharm Corp. | 9,300 | 276,332 |
USS Co. Ltd. | 217,152 | 1,658,888 |
Visional, Inc. * | 26,200 | 1,195,460 |
WealthNavi, Inc. * | 106,000 | 960,779 |
West Japan Railway Co. | 7,400 | 140,463 |
Workman Co. Ltd. | 1,200 | 29,481 |
Yakult Honsha Co. Ltd. | 6,000 | 117,358 |
Yamato Holdings Co. Ltd. | 8,800 | 116,219 |
Yamato Kogyo Co. Ltd. | 1,000 | 53,729 |
Yokogawa Electric Corp. | 5,500 | 121,527 |
Zenkoku Hosho Co. Ltd. | 2,500 | 87,780 |
Zensho Holdings Co. Ltd. | 1,900 | 73,643 |
Zeon Corp. | 2,300 | 22,922 |
ZOZO, Inc. | 2,800 | 60,308 |
140,284,090 | ||
Jersey 0.3% | ||
Arcadium Lithium PLC * | 185,318 | 815,399 |
TP ICAP Group PLC | 874,909 | 2,264,822 |
3,080,221 | ||
Luxembourg 0.0% | ||
Tenaris SA | 13,902 | 230,873 |
Mexico 0.6% | ||
BBB Foods, Inc., Class A * | 61,755 | 1,417,277 |
Corp. Inmobiliaria Vesta SAB de CV, ADR | 64,178 | 2,278,961 |
Vista Energy SAB de CV, ADR * | 61,409 | 2,649,798 |
6,346,036 | ||
Netherlands 6.6% | ||
Adyen NV * | 5,204 | 6,234,392 |
Akzo Nobel NV | 34,000 | 2,243,386 |
ASM International NV | 1,076 | 676,846 |
ASML Holding NV | 22,383 | 19,495,877 |
ASR Nederland NV | 77,756 | 3,890,871 |
BE Semiconductor Industries NV | 9,833 | 1,304,584 |
CTP NV | 2,603 | 44,156 |
DSM-Firmenich AG | 2,687 | 301,359 |
EXOR NV | 31,738 | 3,465,011 |
Heineken Holding NV | 2,182 | 175,529 |
Heineken NV | 28,191 | 2,743,538 |
IMCD NV * | 1,335 | 201,418 |
ING Groep NV | 277,625 | 4,389,325 |
InPost SA * | 155,819 | 2,501,636 |
JDE Peet's NV | 2,275 | 50,549 |
Koninklijke Ahold Delhaize NV | 127,501 | 3,870,189 |
Koninklijke KPN NV | 56,658 | 205,903 |
OCI NV | 3,030 | 81,497 |
SECURITY | NUMBER OF SHARES | VALUE ($) |
Prosus NV | 293,327 | 9,814,709 |
Randstad NV | 3,313 | 166,150 |
Redcare Pharmacy NV * | 18,867 | 2,551,930 |
Universal Music Group NV | 20,388 | 599,717 |
Wolters Kluwer NV | 6,273 | 939,109 |
65,947,681 | ||
New Zealand 0.1% | ||
a2 Milk Co. Ltd. * | 21,909 | 86,367 |
Air New Zealand Ltd. | 44,364 | 14,378 |
EBOS Group Ltd. | 3,825 | 79,021 |
Fisher & Paykel Healthcare Corp. Ltd. | 16,477 | 275,953 |
Mainfreight Ltd. | 2,085 | 83,332 |
Mercury NZ Ltd. | 12,904 | 48,511 |
Meridian Energy Ltd. | 19,055 | 67,369 |
SKYCITY Entertainment Group Ltd. | 17,073 | 17,907 |
Spark New Zealand Ltd. | 40,644 | 114,239 |
787,077 | ||
Norway 0.7% | ||
Aker ASA, A Shares | 1,472 | 81,719 |
AutoStore Holdings Ltd. * | 200,035 | 283,422 |
Bakkafrost P | 28,837 | 1,751,389 |
Equinor ASA | 27,738 | 738,063 |
Norsk Hydro ASA | 38,219 | 234,870 |
Salmar ASA | 27,743 | 1,745,342 |
Schibsted ASA, A Shares | 865 | 24,747 |
Schibsted ASA, B Shares | 1,613 | 45,188 |
Seadrill Ltd. * | 30,953 | 1,502,768 |
TOMRA Systems ASA | 3,593 | 44,016 |
Var Energi ASA | 10,818 | 35,121 |
Yara International ASA | 4,621 | 131,722 |
6,618,367 | ||
Poland 0.0% | ||
Dino Polska SA * | 1,423 | 136,327 |
Portugal 0.1% | ||
EDP - Energias de Portugal SA * | 57,554 | 216,125 |
Galp Energia SGPS SA | 14,223 | 305,526 |
Jeronimo Martins SGPS SA | 7,330 | 150,791 |
672,442 | ||
Republic of Korea 3.1% | ||
BGF retail Co. Ltd. | 224 | 21,118 |
Cheil Worldwide, Inc. | 2,093 | 28,547 |
CosmoAM&T Co. Ltd. * | 381 | 41,147 |
Coupang, Inc., Class A * | 122,646 | 2,759,535 |
Dentium Co. Ltd. | 11,013 | 1,027,497 |
Doosan Bobcat, Inc. | 1,263 | 47,205 |
Douzone Bizon Co. Ltd. | 14,351 | 615,815 |
E-MART, Inc. | 259 | 11,878 |
Eugene Technology Co. Ltd. | 70,692 | 2,689,057 |
F&F Co. Ltd. | 548 | 25,941 |
GS Holdings Corp. | 1,127 | 36,438 |
GS Retail Co. Ltd. | 725 | 10,393 |
Hankook Tire & Technology Co. Ltd. | 42,835 | 1,817,586 |
Hanmi Pharm Co. Ltd. | 139 | 31,665 |
Hanwha Aerospace Co. Ltd. | 565 | 85,822 |
HD Hyundai Infracore Co. Ltd. | 2,184 | 12,993 |
HD HYUNDAI MIPO * | 549 | 29,562 |
HMM Co. Ltd. | 7,851 | 89,636 |
Hotel Shilla Co. Ltd. | 821 | 35,170 |
SECURITY | NUMBER OF SHARES | VALUE ($) |
HYBE Co. Ltd. | 319 | 46,273 |
Hyundai Engineering & Construction Co. Ltd. | 1,199 | 30,545 |
Hyundai Glovis Co. Ltd. | 474 | 62,051 |
Hyundai Mobis Co. Ltd. | 1,526 | 249,652 |
Hyundai Wia Corp. | 276 | 11,489 |
Kangwon Land, Inc. | 3,463 | 38,267 |
KEPCO Plant Service & Engineering Co. Ltd. | 654 | 16,594 |
Kia Corp. | 7,188 | 608,986 |
Korea Aerospace Industries Ltd. | 2,010 | 74,842 |
Korean Air Lines Co. Ltd. | 3,906 | 58,903 |
Krafton, Inc. * | 549 | 94,487 |
KT&G Corp. | 3,079 | 198,398 |
Kumho Petrochemical Co. Ltd. | 14,626 | 1,454,737 |
LG Corp. | 1,768 | 100,878 |
LG Electronics, Inc. | 1,988 | 132,405 |
LG H&H Co. Ltd. | 4,363 | 1,314,606 |
LG Innotek Co. Ltd. | 286 | 45,460 |
LG Uplus Corp. | 3,806 | 27,032 |
LOTTE Fine Chemical Co. Ltd. | 408 | 13,243 |
NAVER Corp. | 25,535 | 3,368,052 |
NCSoft Corp. | 485 | 61,280 |
NongShim Co. Ltd. | 84 | 24,120 |
OCI Holdings Co. Ltd. | 297 | 20,235 |
Orion Corp. | 618 | 41,359 |
Pan Ocean Co. Ltd. | 6,331 | 18,717 |
S-1 Corp. | 463 | 19,942 |
Samsung C&T Corp. | 2,190 | 236,155 |
Samsung E&A Co. Ltd. * | 4,726 | 89,602 |
Samsung Electronics Co. Ltd. | 177,806 | 9,883,638 |
Samsung SDI Co. Ltd. | 1,337 | 413,760 |
Samsung SDS Co. Ltd. | 1,034 | 118,785 |
Shinsegae, Inc. | 119 | 14,250 |
S-Oil Corp. | 689 | 35,972 |
Soop Co. Ltd. | 14,345 | 1,161,107 |
Youngone Corp. | 40,923 | 1,132,459 |
Yuhan Corp. | 1,578 | 82,083 |
30,717,369 | ||
Singapore 0.7% | ||
CapitaLand Ascendas REIT | 64,800 | 122,746 |
City Developments Ltd. | 10,500 | 47,060 |
ComfortDelGro Corp. Ltd. | 53,500 | 58,193 |
DBS Group Holdings Ltd. | 125,436 | 3,193,275 |
DFI Retail Group Holdings Ltd. | 5,300 | 10,291 |
Frasers Logistics & Commercial Trust | 85,800 | 62,152 |
Genting Singapore Ltd. | 150,600 | 100,506 |
Hutchison Port Holdings Trust, Class U | 74,900 | 9,578 |
Jardine Cycle & Carriage Ltd. | 2,500 | 48,246 |
Jardine Matheson Holdings Ltd. | 3,200 | 122,784 |
Keppel DC REIT | 29,800 | 37,170 |
Keppel REIT | 40,300 | 25,876 |
Mapletree Industrial Trust | 29,400 | 48,682 |
Mapletree Logistics Trust | 58,500 | 57,406 |
Mapletree Pan Asia Commercial Trust | 36,400 | 33,356 |
Netlink NBN Trust | 43,900 | 27,497 |
Olam Group Ltd. | 19,600 | 16,875 |
Seatrium Ltd. * | 564,300 | 40,311 |
Singapore Airlines Ltd. | 33,900 | 161,758 |
Singapore Exchange Ltd. | 48,100 | 328,115 |
Singapore Telecommunications Ltd. | 127,600 | 221,293 |
Suntec Real Estate Investment Trust | 36,200 | 28,539 |
Venture Corp. Ltd. | 207,136 | 2,194,654 |
Wilmar International Ltd. | 37,700 | 88,617 |
7,084,980 | ||
SECURITY | NUMBER OF SHARES | VALUE ($) |
South Africa 0.3% | ||
Aspen Pharmacare Holdings Ltd. | 201,632 | 2,402,604 |
Impala Platinum Holdings Ltd. | 73,465 | 327,033 |
2,729,637 | ||
Spain 1.0% | ||
ACS Actividades de Construccion y Servicios SA | 3,527 | 141,258 |
Aena SME SA | 1,559 | 284,112 |
Amadeus IT Group SA | 50,670 | 3,216,224 |
Corp. ACCIONA Energias Renovables SA | 1,339 | 27,191 |
Endesa SA | 7,134 | 130,093 |
Fluidra SA | 54,750 | 1,158,957 |
Iberdrola SA | 118,139 | 1,448,570 |
Indra Sistemas SA | 98,112 | 1,875,590 |
Industria de Diseno Textil SA (b) | 31,307 | 1,425,437 |
International Consolidated Airlines Group SA * | 27,755 | 60,488 |
Naturgy Energy Group SA | 3,723 | 94,167 |
Repsol SA | 34,834 | 546,757 |
10,408,844 | ||
Sweden 2.8% | ||
Assa Abloy AB, B Shares | 17,961 | 474,555 |
Atlas Copco AB, A Shares | 56,902 | 996,700 |
Atlas Copco AB, B Shares | 113,430 | 1,700,794 |
Axfood AB | 2,777 | 71,839 |
Beijer Ref AB | 48,164 | 678,792 |
Boliden AB | 7,912 | 260,025 |
Epiroc AB, A Shares | 10,759 | 198,905 |
Epiroc AB, B Shares | 6,972 | 115,568 |
Evolution AB | 5,495 | 607,116 |
Fortnox AB | 107,054 | 623,797 |
H & M Hennes & Mauritz AB, B Shares | 14,763 | 234,655 |
Hemnet Group AB | 39,400 | 1,023,954 |
Holmen AB, B Shares | 2,011 | 78,323 |
Kinnevik AB, B Shares * | 86,398 | 899,231 |
Lifco AB, B Shares | 4,159 | 100,767 |
Saab AB, B Shares | 32,763 | 2,593,805 |
Sandvik AB | 92,132 | 1,836,516 |
Sinch AB * | 298,464 | 674,822 |
SKF AB, B Shares | 211,419 | 4,346,365 |
Spotify Technology SA * | 21,590 | 6,054,700 |
SSAB AB, A Shares | 6,952 | 39,036 |
SSAB AB, B Shares | 20,063 | 112,264 |
Sweco AB, B Shares | 4,205 | 45,043 |
Swedish Orphan Biovitrum AB * | 3,229 | 83,623 |
Tele2 AB, B Shares | 14,309 | 133,461 |
Telefonaktiebolaget LM Ericsson, B Shares | 54,880 | 278,510 |
Trelleborg AB, B Shares | 31,167 | 1,098,401 |
Volvo AB, A Shares | 3,347 | 88,147 |
Volvo AB, B Shares | 100,592 | 2,560,386 |
Volvo Car AB, B Shares * | 14,182 | 44,024 |
28,054,124 | ||
Switzerland 5.1% | ||
ABB Ltd. | 32,574 | 1,582,720 |
Avolta AG * | 2,533 | 95,790 |
Bachem Holding AG | 802 | 69,583 |
Barry Callebaut AG | 54 | 87,262 |
Belimo Holding AG | 266 | 123,075 |
BKW AG | 419 | 62,195 |
Chocoladefabriken Lindt & Spruengli AG | 3 | 346,208 |
SECURITY | NUMBER OF SHARES | VALUE ($) |
Chocoladefabriken Lindt & Spruengli AG, Participation Certificates | 27 | 311,012 |
Cie Financiere Richemont SA, Class A | 18,191 | 2,514,488 |
Clariant AG * | 4,159 | 62,222 |
Emmi AG | 34 | 33,077 |
EMS-Chemie Holding AG | 218 | 173,928 |
Geberit AG | 988 | 527,376 |
Georg Fischer AG | 1,783 | 124,445 |
Holcim AG | 34,181 | 2,861,213 |
Kuehne & Nagel International AG | 1,510 | 399,088 |
Landis & Gyr Group AG | 22,522 | 1,666,268 |
Logitech International SA | 4,198 | 326,844 |
Lonza Group AG | 1,214 | 670,120 |
Nestle SA | 78,368 | 7,868,160 |
Novartis AG | 77,568 | 7,528,554 |
Partners Group Holding AG | 1,397 | 1,797,333 |
Roche Holding AG | 38,146 | 9,140,323 |
Roche Holding AG, Bearer Shares | 742 | 195,189 |
Sandoz Group AG * | 9,544 | 324,371 |
Schindler Holding AG | 384 | 93,563 |
Schindler Holding AG, Participation Certificates | 5,105 | 1,272,453 |
SGS SA | 3,363 | 296,131 |
Siegfried Holding AG | 1,504 | 1,437,196 |
Sika AG | 3,106 | 883,537 |
Sonova Holding AG | 1,226 | 338,906 |
Swatch Group AG | 1,484 | 61,526 |
Swatch Group AG, Bearer Shares | 11,710 | 2,460,403 |
Swisscom AG | 527 | 289,116 |
Swissquote Group Holding SA | 7,179 | 1,941,735 |
Tecan Group AG | 5,045 | 1,779,806 |
UBS Group AG | 41,793 | 1,097,621 |
VAT Group AG | 750 | 373,395 |
51,216,232 | ||
Taiwan 1.9% | ||
Airtac International Group | 65,000 | 2,301,379 |
ASPEED Technology, Inc. | 21,000 | 1,966,335 |
Elan Microelectronics Corp. | 240,000 | 1,207,976 |
Gold Circuit Electronics Ltd. * | 418,000 | 2,497,047 |
Lotes Co. Ltd. | 51,000 | 2,234,009 |
Nien Made Enterprise Co. Ltd. | 106,000 | 1,238,753 |
Phison Electronics Corp. | 122,000 | 2,604,237 |
Taiwan Semiconductor Manufacturing Co. Ltd. | 149,000 | 3,567,619 |
Wiwynn Corp. | 20,000 | 1,422,781 |
19,040,136 | ||
United Kingdom 12.7% | ||
3i Group PLC | 59,822 | 2,137,287 |
Admiral Group PLC | 12,723 | 433,054 |
Airtel Africa PLC | 23,954 | 33,079 |
Anglo American PLC | 18,982 | 620,284 |
Ashtead Group PLC | 44,924 | 3,262,017 |
AstraZeneca PLC | 26,614 | 4,025,337 |
AstraZeneca PLC, ADR | 84,137 | 6,384,316 |
Auto Trader Group PLC | 23,543 | 204,106 |
B&M European Value Retail SA | 22,829 | 147,329 |
Barratt Developments PLC | 25,405 | 143,541 |
Berkeley Group Holdings PLC | 2,353 | 138,181 |
BP PLC | 414,072 | 2,668,958 |
BT Group PLC | 98,710 | 126,231 |
Bunzl PLC | 15,618 | 598,916 |
Burberry Group PLC | 9,842 | 140,826 |
Centrica PLC | 151,144 | 241,267 |
Coca-Cola HBC AG | 3,129 | 101,000 |
SECURITY | NUMBER OF SHARES | VALUE ($) |
Compass Group PLC | 89,978 | 2,502,622 |
ConvaTec Group PLC | 580,696 | 1,806,726 |
CRH PLC | 15,003 | 1,161,844 |
Croda International PLC | 2,882 | 165,071 |
Darktrace PLC * | 92,980 | 694,082 |
DCC PLC | 47,354 | 3,233,837 |
Diageo PLC | 44,133 | 1,525,222 |
Diploma PLC | 56,672 | 2,561,607 |
DS Smith PLC | 31,428 | 136,917 |
Endeavour Mining PLC | 4,333 | 91,743 |
Experian PLC | 20,255 | 816,964 |
Ferguson PLC | 3,549 | 748,327 |
Flutter Entertainment PLC * | 16,860 | 3,123,465 |
Glencore PLC | 1,043,485 | 6,071,580 |
Greggs PLC | 34,392 | 1,163,893 |
GSK PLC | 114,955 | 2,384,961 |
Haleon PLC | 115,900 | 489,485 |
Halma PLC | 5,676 | 155,561 |
Hargreaves Lansdown PLC | 23,744 | 239,941 |
Hikma Pharmaceuticals PLC | 2,541 | 61,011 |
Howden Joinery Group PLC | 15,038 | 163,684 |
IMI PLC | 4,155 | 90,507 |
Informa PLC | 110,297 | 1,091,928 |
InterContinental Hotels Group PLC | 4,227 | 412,276 |
Intermediate Capital Group PLC | 172,798 | 4,503,790 |
Intertek Group PLC | 3,122 | 192,148 |
J Sainsbury PLC | 37,348 | 122,508 |
JD Sports Fashion PLC | 1,894,487 | 2,712,289 |
John Wood Group PLC * | 167,569 | 310,729 |
Just Group PLC | 713,858 | 917,997 |
Liberty Global Ltd., Class A * | 113,712 | 1,807,452 |
Liberty Global Ltd., Class C * | 141,784 | 2,321,004 |
Lloyds Banking Group PLC | 10,870,810 | 7,015,832 |
Melrose Industries PLC | 299,408 | 2,352,248 |
Next PLC | 2,864 | 321,220 |
Ocado Group PLC * | 284,806 | 1,246,944 |
Persimmon PLC | 61,637 | 998,090 |
Prudential PLC | 692,600 | 6,023,783 |
Reckitt Benckiser Group PLC | 65,731 | 3,674,823 |
RELX PLC | 40,151 | 1,649,679 |
Rightmove PLC | 25,143 | 161,061 |
Rio Tinto PLC | 28,162 | 1,905,461 |
Rolls-Royce Holdings PLC * | 135,581 | 695,263 |
RS Group PLC | 10,590 | 97,013 |
Schroders PLC | 845,441 | 3,706,482 |
Shell PLC | 303,633 | 10,793,727 |
Smith & Nephew PLC | 106,200 | 1,286,682 |
Smiths Group PLC | 70,597 | 1,423,233 |
Smurfit Kappa Group PLC | 6,564 | 285,222 |
Softcat PLC | 89,608 | 1,753,925 |
Spectris PLC | 5,999 | 248,138 |
SSE PLC | 16,717 | 347,486 |
Taylor Wimpey PLC | 96,500 | 158,127 |
TechnipFMC PLC | 65,404 | 1,675,650 |
Tesco PLC | 173,136 | 639,230 |
Unilever PLC | 48,207 | 2,493,787 |
UNITE Group PLC | 7,808 | 90,265 |
United Utilities Group PLC | 10,359 | 135,031 |
Vodafone Group PLC | 3,446,914 | 2,906,787 |
Weir Group PLC | 106,855 | 2,726,658 |
Wise PLC, Class A * | 145,660 | 1,399,857 |
WPP PLC | 382,100 | 3,829,851 |
127,228,455 | ||
United States 2.3% | ||
ACADIA Pharmaceuticals, Inc. * | 5,395 | 90,150 |
CNH Industrial NV * | 568,992 | 6,486,509 |
SECURITY | NUMBER OF SHARES | VALUE ($) |
Ginkgo Bioworks Holdings, Inc. * | 180,171 | 160,550 |
Insmed, Inc. * | 18,815 | 465,107 |
Jazz Pharmaceuticals PLC * | 18,962 | 2,100,041 |
JFrog Ltd. * | 14,712 | 586,715 |
Moderna, Inc. * | 30,002 | 3,309,521 |
NVIDIA Corp. | 7,909 | 6,833,534 |
Parade Technologies Ltd. | 92,000 | 2,088,637 |
Sage Therapeutics, Inc. * | 6,555 | 91,377 |
Tesla, Inc. * | 6,629 | 1,214,963 |
23,427,104 | ||
Total Common Stocks (Cost $834,839,104) | 951,396,373 | |
PREFERRED STOCKS 0.5% OF NET ASSETS | ||
Germany 0.0% | ||
Bayerische Motoren Werke AG | 1,071 | 110,047 |
FUCHS SE | 1,665 | 77,754 |
Henkel AG & Co. KGaA | 2,820 | 224,026 |
411,827 | ||
Republic of Korea 0.5% | ||
Hyundai Motor Co. | 334 | 38,006 |
Hyundai Motor Co. 2nd | 551 | 62,962 |
Samsung Electronics Co. Ltd. | 95,479 | 4,458,019 |
4,558,987 | ||
Total Preferred Stocks (Cost $5,361,230) | 4,970,814 | |
WARRANTS 0.0% OF NET ASSETS | ||
Canada 0.0% | ||
Constellation Software, Inc. | ||
expires 03/31/40 *(c) | 344 | 1,734 |
Total Warrants (Cost $0) | 1,734 | |
SECURITY | NUMBER OF SHARES | VALUE ($) |
INVESTMENT COMPANIES 1.8% OF NET ASSETS | ||
United States 1.8% | ||
iShares MSCI EAFE ETF | 8,568 | 662,049 |
Schwab Emerging Markets Equity ETF (d) | 664,906 | 16,928,507 |
17,590,556 | ||
Total Investment Companies (Cost $20,050,972) | 17,590,556 | |
SHORT-TERM INVESTMENTS 2.3% OF NET ASSETS | ||
Money Market Funds 2.3% | ||
State Street Institutional U.S. Government Money Market Fund, Premier Class 5.25% (e) | 21,943,427 | 21,943,427 |
State Street Institutional U.S. Government Money Market Fund, Premier Class 5.25% (e)(f) | 1,233,750 | 1,233,750 |
23,177,177 | ||
Total Short-Term Investments (Cost $23,177,177) | 23,177,177 | |
Total Investments in Securities (Cost $883,428,483) | 997,136,654 | |
NUMBER OF CONTRACTS | NOTIONAL AMOUNT ($) | CURRENT VALUE/ UNREALIZED DEPRECIATION ($) | |
FUTURES CONTRACTS | |||
Long | |||
MSCI EAFE Index, expires 06/21/24 | 175 | 19,840,625 | (678,081 ) |
SETTLEMENT DATE | COUNTERPARTY | CURRENCY TO BE RECEIVED | AMOUNT OF CURRENCY TO BE RECEIVED | CURRENCY TO BE DELIVERED | AMOUNT OF CURRENCY TO BE DELIVERED | UNREALIZED APPRECIATION (DEPRECIATION) ($) |
FORWARD FOREIGN CURRENCY EXCHANGE CONTRACTS | ||||||
05/13/24 | UBS AG | AUD | 6,100,000 | USD | 4,048,570 | (95,680 ) |
05/13/24 | Barclays Bank PLC | AUD | 1,491,000 | USD | 972,103 | (5,913 ) |
05/13/24 | Morgan Stanley & Co. | CAD | 1,561,000 | USD | 1,154,202 | (20,076 ) |
05/13/24 | Barclays Bank PLC | CHF | 3,692,000 | USD | 4,220,610 | (199,812 ) |
05/13/24 | HSBC Bank USA | DKK | 11,775,000 | USD | 1,730,270 | (44,520 ) |
05/13/24 | Citibank N.A. | EUR | 9,831,000 | USD | 10,781,933 | (286,164 ) |
05/13/24 | Citibank N.A. | EUR | 543,000 | USD | 583,953 | (4,236 ) |
05/13/24 | HSBC Bank USA | GBP | 1,504,000 | USD | 1,924,285 | (44,862 ) |
05/13/24 | Wells Fargo Bank NA | GBP | 310,000 | USD | 388,885 | (1,504 ) |
05/13/24 | Citibank N.A. | JPY | 58,018,000 | USD | 384,735 | (16,265 ) |
05/13/24 | Morgan Stanley & Co. | NOK | 12,626,000 | USD | 1,167,032 | (30,130 ) |
05/13/24 | Morgan Stanley & Co. | NOK | 4,028,000 | USD | 384,688 | (21,989 ) |
05/13/24 | UBS AG | NZD | 5,315,000 | USD | 3,278,079 | (146,232 ) |
05/13/24 | Morgan Stanley & Co. | SEK | 47,125,000 | USD | 4,610,524 | (332,532 ) |
05/13/24 | Citibank N.A. | SEK | 12,301,000 | USD | 1,158,111 | (41,430 ) |
05/13/24 | Barclays Bank PLC | USD | 965,693 | AUD | 1,469,000 | 13,759 |
05/13/24 | HSBC Bank USA | USD | 583,732 | CAD | 798,000 | 3,955 |
05/13/24 | Citibank N.A. | USD | 10,595,687 | CAD | 14,253,000 | 240,344 |
05/13/24 | HSBC Bank USA | USD | 1,355,385 | ILS | 4,908,000 | 43,056 |
05/13/24 | Barclays Bank PLC | USD | 5,387,697 | JPY | 789,497,000 | 373,631 |
05/13/24 | Wells Fargo Bank NA | USD | 561,423 | NOK | 6,165,000 | 6,298 |
05/13/24 | UBS AG | USD | 579,461 | NOK | 6,206,000 | 20,645 |
05/13/24 | Wells Fargo Bank NA | USD | 2,726,784 | SEK | 29,199,000 | 76,108 |
05/13/24 | HSBC Bank USA | USD | 1,155,880 | SGD | 1,556,000 | 15,470 |
05/13/24 | HSBC Bank USA | USD | 4,621,041 | SGD | 6,140,000 | 120,964 |
Net Unrealized Depreciation on Forward Foreign Currency Exchange Contracts | (377,115 ) | |||||
* | Non-income producing security. |
(a) | Security is traded on separate exchanges for the same issuer. |
(b) | All or a portion of this security is on loan. Securities on loan were valued at $1,138,274. |
(c) | Fair valued using significant unobservable inputs (see financial note 2(a), Securities for which no quoted value is available, for additional information). |
(d) | Issuer is affiliated with the fund’s investment adviser. |
(e) | The rate shown is the annualized 7-day yield. |
(f) | Security purchased with cash collateral received for securities on loan. |
ADR — | American Depositary Receipt |
CVA — | Dutch Certificate |
ETF — | Exchange-Traded Fund |
REIT — | Real Estate Investment Trust |
AUD — | Australian Dollar |
CAD — | Canadian Dollar |
CHF — | Swiss Franc |
DKK — | Danish Krone |
EUR — | Euro |
GBP — | British Pound |
ILS — | Israeli Shekel |
JPY — | Japanese Yen |
NOK — | Norwegian Krone |
NZD — | New Zealand Dollar |
SEK — | Swedish Krona |
SGD — | Singapore Dollar |
USD — | U.S. Dollar |
SECURITY | VALUE AT 10/31/23 | PURCHASES | SALES | REALIZED GAINS (LOSSES) | NET CHANGE IN UNREALIZED APPRECIATION (DEPRECIATION) | VALUE AT 4/30/24 | BALANCE OF SHARES HELD AT 4/30/24 | DISTRIBUTIONS RECEIVED(a) |
INVESTMENT COMPANIES 1.7% OF NET ASSETS | ||||||||
United States 1.7% | ||||||||
Schwab Emerging Markets Equity ETF | $35,333,880 | $— | ($21,252,972 ) | ($4,486,837 ) | $7,334,436 | $16,928,507 | 664,906 | $1,254,147 |
(a) | Distributions received include distributions from net investment income and capital gains, if any, from the underlying fund. |
DESCRIPTION | QUOTED PRICES IN ACTIVE MARKETS FOR IDENTICAL ASSETS (LEVEL 1) | OTHER SIGNIFICANT OBSERVABLE INPUTS (LEVEL 2) | SIGNIFICANT UNOBSERVABLE INPUTS (LEVEL 3) | TOTAL |
Assets | ||||
Common Stocks1 | $— | $327,944,239 | $— | $327,944,239 |
Austria | 200,088 | 1,396,464 | — | 1,596,552 |
Belgium | 80,510 | 2,916,971 | — | 2,997,481 |
Brazil | 14,033,695 | — | — | 14,033,695 |
Canada | 57,771,220 | — | — | 57,771,220 |
China | 3,546,996 | 13,258,074 | — | 16,805,070 |
Denmark | 14,450 | 30,097,022 | — | 30,111,472 |
Finland | 122,492 | 4,686,367 | — | 4,808,859 |
Germany | 963,519 | 79,880,180 | — | 80,843,699 |
Greece | 6,110,711 | — | — | 6,110,711 |
Guernsey | 2,351,357 | — | — | 2,351,357 |
Hong Kong | 62,632 | 5,900,570 | — | 5,963,202 |
Ireland | 4,619,214 | 3,446,522 | — | 8,065,736 |
Israel | 12,159,891 | 3,475,729 | — | 15,635,620 |
Japan | 94,140 | 140,189,950 | — | 140,284,090 |
Jersey | 815,399 | 2,264,822 | — | 3,080,221 |
Mexico | 6,346,036 | — | — | 6,346,036 |
New Zealand | 427,792 | 359,285 | — | 787,077 |
Norway | 1,572,703 | 5,045,664 | — | 6,618,367 |
Republic of Korea | 2,759,535 | 27,957,834 | — | 30,717,369 |
Singapore | 150,281 | 6,934,699 | — | 7,084,980 |
South Africa | 2,402,604 | 327,033 | — | 2,729,637 |
Sweden | 6,138,323 | 21,915,801 | — | 28,054,124 |
United Kingdom | 12,499,151 | 114,729,304 | — | 127,228,455 |
United States | 21,338,467 | 2,088,637 | — | 23,427,104 |
Preferred Stocks1 | — | 4,970,814 | — | 4,970,814 |
Warrants | ||||
Canada | — | — | 1,734 | 1,734 |
Investment Companies1 | 17,590,556 | — | — | 17,590,556 |
Short-Term Investments1 | 23,177,177 | — | — | 23,177,177 |
Forward Foreign Currency Exchange Contracts2 | — | 914,230 | — | 914,230 |
Liabilities | ||||
Forward Foreign Currency Exchange Contracts2 | — | (1,291,345 ) | — | (1,291,345 ) |
Futures Contracts2 | (678,081 ) | — | — | (678,081 ) |
Total | $196,670,858 | $799,408,866 | $1,734 | $996,081,458 |
1 | As categorized in the Portfolio Holdings. |
2 | Futures contracts and forward foreign currency exchange contracts are reported at cumulative unrealized appreciation or depreciation. |
Assets | ||
Investments in securities, at value - affiliated issuers (cost $19,426,891) | $16,928,507 | |
Investments in securities, at value - unaffiliated issuers (cost $864,001,592) including securities on loan of $1,138,274 | 980,208,147 | |
Foreign currency, at value (cost $487,145) | 484,344 | |
Deposit with broker for futures contracts | 4,561,920 | |
Receivables: | ||
Investments sold | 3,874,462 | |
Dividends | 3,124,768 | |
Foreign tax reclaims | 1,060,518 | |
Fund shares sold | 7,902 | |
Income from securities on loan | 3,317 | |
Unrealized appreciation on forward foreign currency exchange contracts | 914,230 | |
Prepaid expenses | + | 14,651 |
Total assets | 1,011,182,766 | |
Liabilities | ||
Collateral held for securities on loan | 1,233,750 | |
Payables: | ||
Investments bought | 3,435,332 | |
Foreign capital gains tax | 1,052,460 | |
Investment adviser and administrator fees | 526,347 | |
IRS compliance fee for foreign withholding tax claims | 341,863 | |
Variation margin on futures contracts | 273,000 | |
Shareholder service fees | 119,336 | |
Fund shares redeemed | 55,413 | |
Independent trustees’ fees | 59 | |
Unrealized depreciation on forward foreign currency exchange contracts | 1,291,345 | |
Accrued expenses | + | 400,937 |
Total liabilities | 8,729,842 | |
Net assets | $1,002,452,924 | |
Net Assets by Source | ||
Capital received from investors | $960,740,631 | |
Total distributable earnings | + | 41,712,293 |
Net assets | $1,002,452,924 | |
Net Asset Value (NAV) | ||||
Net Assets | ÷ | Shares Outstanding | = | NAV |
$1,002,452,924 | 50,116,020 | $20.00 | ||
For the period November 1, 2023 through April 30, 2024; unaudited | ||
Investment Income | ||
Dividends received from securities - unaffiliated issuers (net of foreign withholding tax of $1,077,090) | $9,682,784 | |
Dividends received from securities - affiliated issuers | 1,254,147 | |
Other interest | 406,719 | |
Securities on loan, net | + | 7,152 |
Total investment income | 11,350,802 | |
Expenses | ||
Investment adviser and administrator fees | 3,188,865 | |
Shareholder service fees | 735,478 | |
Portfolio accounting fees | 143,217 | |
Custodian fees | 103,369 | |
Professional fees | 23,375 1 | |
Shareholder reports | 15,728 | |
Registration fees | 15,632 | |
Independent trustees’ fees | 4,010 | |
Transfer agent fees | 1,679 | |
Other expenses | + | 30,621 |
Total expenses | 4,261,974 | |
Expense reduction | – | 1,500 1 |
Net expenses | – | 4,260,474 |
Net investment income | 7,090,328 | |
REALIZED AND UNREALIZED GAINS (LOSSES) | ||
Net realized losses on sales of securities - affiliated issuers | (4,486,837 ) | |
Net realized gains on sales of securities - unaffiliated issuers (net of foreign capital gains tax paid of $712,052) | 18,887,346 | |
Net realized gains on futures contracts | 2,278,743 | |
Net realized gains on forward foreign currency exchange contracts | 659,014 | |
Net realized losses on foreign currency transactions | + | (107,676 ) |
Net realized gains | 17,230,590 | |
Net change in unrealized appreciation (depreciation) on securities - affiliated issuers | 7,334,436 | |
Net change in unrealized appreciation (depreciation) on securities - unaffiliated issuers (net of change in foreign capital gains tax of ($356,666)) | 118,840,058 | |
Net change in unrealized appreciation (depreciation) on futures contracts | 708,509 | |
Net change in unrealized appreciation (depreciation) on forward foreign currency exchange contracts | (404,374 ) | |
Net change in unrealized appreciation (depreciation) on foreign currency translations | + | (39,194 ) |
Net change in unrealized appreciation (depreciation) | + | 126,439,435 |
Net realized and unrealized gains | 143,670,025 | |
Increase in net assets resulting from operations | $150,760,353 | |
1 | Includes professional fees of $1,500 associated with the filing of foreign withholding tax claims in the European Union deemed to be non-contingent and non-routine expenses of the fund (see financial notes 2(d) and 4 for additional information). |
OPERATIONS | |||
11/1/23-4/30/24 | 11/1/22-10/31/23 | ||
Net investment income | $7,090,328 | $17,835,889 | |
Net realized gains (losses) | 17,230,590 | (63,619,083 ) | |
Net change in unrealized appreciation (depreciation) | + | 126,439,435 | 133,225,332 |
Increase in net assets resulting from operations | $150,760,353 | $87,442,138 | |
DISTRIBUTIONS TO SHAREHOLDERS | |||
Total distributions | ($18,123,990 ) | ($37,690,344 ) | |
TRANSACTIONS IN FUND SHARES | |||||
11/1/23-4/30/24 | 11/1/22-10/31/23 | ||||
SHARES | VALUE | SHARES | VALUE | ||
Shares sold | 941,992 | $18,603,682 | 3,756,655 | $68,666,016 | |
Shares reinvested | 734,414 | 14,225,597 | 1,624,978 | 30,354,599 | |
Shares redeemed | + | (4,563,494 ) | (90,269,314 ) | (10,451,780 ) | (203,167,707 ) |
Net transactions in fund shares | (2,887,088 ) | ($57,440,035 ) | (5,070,147 ) | ($104,147,092 ) | |
SHARES OUTSTANDING AND NET ASSETS | |||||
11/1/23-4/30/24 | 11/1/22-10/31/23 | ||||
SHARES | NET ASSETS | SHARES | NET ASSETS | ||
Beginning of period | 53,003,108 | $927,256,596 | 58,073,255 | $981,651,894 | |
Total increase (decrease) | + | (2,887,088 ) | 75,196,328 | (5,070,147 ) | (54,395,298 ) |
End of period | 50,116,020 | $1,002,452,924 | 53,003,108 | $927,256,596 | |
SCHWAB CAPITAL TRUST | |
Schwab International Opportunities Fund | Schwab Target 2045 Fund |
Schwab S&P 500 Index Fund | Schwab Target 2050 Fund |
Schwab Small-Cap Index Fund® | Schwab Target 2055 Fund |
Schwab Total Stock Market Index Fund® | Schwab Target 2060 Fund |
Schwab U.S. Large-Cap Growth Index Fund | Schwab Target 2065 Fund |
Schwab U.S. Large-Cap Value Index Fund | Schwab Fundamental US Large Company Index Fund |
Schwab U.S. Mid-Cap Index Fund | Schwab Fundamental US Small Company Index Fund |
Schwab International Index Fund® | Schwab Fundamental International Large Company Index Fund |
Schwab MarketTrack All Equity Portfolio™ | Schwab Fundamental International Small Company Index Fund |
Schwab MarketTrack Growth Portfolio™ | Schwab Fundamental Emerging Markets Large Company Index Fund |
Schwab MarketTrack Balanced Portfolio™ | Schwab Fundamental Global Real Estate Index Fund |
Schwab MarketTrack Conservative Portfolio™ | Schwab Target 2010 Index Fund |
Schwab Balanced Fund | Schwab Target 2015 Index Fund |
Schwab Core Equity Fund | Schwab Target 2020 Index Fund |
Schwab Dividend Equity Fund | Schwab Target 2025 Index Fund |
Schwab Large-Cap Growth Fund | Schwab Target 2030 Index Fund |
Schwab Small-Cap Equity Fund | Schwab Target 2035 Index Fund |
Schwab Health Care Fund | Schwab Target 2040 Index Fund |
Schwab International Core Equity Fund | Schwab Target 2045 Index Fund |
Schwab Target 2010 Fund | Schwab Target 2050 Index Fund |
Schwab Target 2015 Fund | Schwab Target 2055 Index Fund |
Schwab Target 2020 Fund | Schwab Target 2060 Index Fund |
Schwab Target 2025 Fund | Schwab Target 2065 Index Fund |
Schwab Target 2030 Fund | Schwab Monthly Income Fund – Target Payout |
Schwab Target 2035 Fund | Schwab Monthly Income Fund – Flexible Payout |
Schwab Target 2040 Fund | Schwab Monthly Income Fund – Income Payout |
2. Significant Accounting Policies:
3. Risk Factors:
4. Affiliates and Affiliated Transactions:
Schwab Balanced Fund | 6.2 % |
Schwab Target 2010 Fund | 0.2 % |
Schwab Target 2015 Fund | 0.2 % |
Schwab Target 2020 Fund | 1.7 % |
Schwab Target 2025 Fund | 2.9 % |
Schwab Target 2030 Fund | 8.3 % |
Schwab Target 2035 Fund | 5.8 % |
Schwab Target 2040 Fund | 12.5 % |
Schwab Target 2045 Fund | 3.4 % |
Schwab Target 2050 Fund | 3.7 % |
Schwab Target 2055 Fund | 2.7 % |
Schwab Target 2060 Fund | 1.0 % |
Schwab Target 2065 Fund | 0.3 % |
Schwab Emerging Markets Equity ETF | 0.2 % |
5. Board of Trustees:
6. Borrowing from Banks:
7. Purchases and Sales of Investment Securities:
PURCHASES OF SECURITIES | SALES OF SECURITIES |
$252,561,412 | $307,076,789 |
8. Derivatives:
EQUITY CONTRACTS | FOREIGN EXCHANGE CONTRACTS | TOTAL | |
Asset Derivatives | |||
Forward Foreign Currency Exchange Contracts1 | $— | $914,230 | $914,230 |
Liability Derivatives | |||
Futures Contracts2 | ($678,081 ) | $— | ($678,081 ) |
Forward Foreign Currency Exchange Contracts1 | — | (1,291,345 ) | (1,291,345 ) |
1 | Statement of Assets and Liabilities location: Unrealized appreciation on forward foreign currency exchange contracts and Unrealized depreciation on forward foreign currency exchange contracts. |
2 | Includes cumulative unrealized depreciation of futures contracts as reported in the fund’s Portfolio Holdings. Only current day’s variation margin on futures contracts is reported in the Statement of Assets and Liabilities. |
EQUITY CONTRACTS | FOREIGN EXCHANGE CONTRACTS | TOTAL | |
Net Realized Gains (Losses) | |||
Futures Contracts1 | $2,278,743 | $— | $2,278,743 |
Forward Foreign Currency Exchange Contracts1 | — | 659,014 | 659,014 |
Net Change in Unrealized Appreciation (Depreciation) | |||
Futures Contracts2 | $708,509 | $— | $708,509 |
Forward Foreign Currency Exchange Contracts2 | — | (404,374 ) | (404,374 ) |
1 | Statement of Operations location: Net realized gains on futures contracts and net realized gains on forward foreign currency exchange contracts. |
2 | Statement of Operations location: Net change in unrealized appreciation (depreciation) on futures contracts and net change in unrealized appreciation (depreciation) on forward foreign currency exchange contracts. |
NOTIONAL AMOUNT | NUMBER OF CONTRACTS |
$20,605,595 | 188 |
NOTIONAL AMOUNT | UNREALIZED APPRECIATION (DEPRECIATION) |
$68,885,771 | $7,395 |
COUNTERPARTY | GROSS AMOUNTS OF ASSETS PRESENTED IN THE STATEMENT OF ASSETS AND LIABILITIES | FINANCIAL INSTRUMENTS AVAILABLE FOR OFFSET | CASH COLLATERAL PLEDGED | NET AMOUNT(a) |
HSBC Bank USA | $183,445 | ($89,382 ) | $— | $94,063 |
Citibank N.A. | 240,344 | (240,344 ) | — | — |
UBS AG | 20,645 | (20,645 ) | — | — |
Wells Fargo Bank NA | 82,406 | (1,504 ) | — | 80,902 |
Barclays Bank PLC | 387,390 | (205,725 ) | — | 181,665 |
Total | $914,230 | ($557,600 ) | $— | $356,630 |
COUNTERPARTY | GROSS AMOUNTS OF LIABILITIES PRESENTED IN THE STATEMENT OF ASSETS AND LIABILITIES | FINANCIAL INSTRUMENTS AVAILABLE FOR OFFSET | CASH COLLATERAL RECEIVED | NET AMOUNT(a) |
HSBC Bank USA | ($89,382 ) | $89,382 | $— | $— |
Citibank N.A. | (348,095 ) | 240,344 | — | (107,751 ) |
UBS AG | (241,912 ) | 20,645 | — | (221,267 ) |
Wells Fargo Bank NA | (1,504 ) | 1,504 | — | — |
Barclays Bank PLC | (205,725 ) | 205,725 | — | — |
Morgan Stanley & Co. | (404,727 ) | — | — | (404,727 ) |
Total | ($1,291,345 ) | $557,600 | $— | ($733,745 ) |
(a) | Represents the net amount due from/due to the counterparty in the event of default. |
9. Federal Income Taxes:
TAX COST | GROSS UNREALIZED APPRECIATION | GROSS UNREALIZED DEPRECIATION | NET UNREALIZED APPRECIATION (DEPRECIATION) | |
$899,574,845 | $172,522,975 | ($76,016,362 ) | $96,506,613 | |
PRIOR FISCAL YEAR END DISTRIBUTIONS | ||
ORDINARY INCOME | LONG-TERM CAPITAL GAINS | |
$11,433,730 | $26,256,614 | |
10. Subsequent Events:
Independent Trustees | |||
Name, Year of Birth, and Position(s) with the trust (Terms of office, and length of Time Served1) | Principal Occupations During the Past Five Years | Number of Portfolios in Fund Complex Overseen by the Trustee | Other Directorships |
Michael J. Beer 1961 Trustee (Trustee of The Charles Schwab Family of Funds, Schwab Investments, Schwab Capital Trust, Schwab Annuity Portfolios, Schwab Strategic Trust and Laudus Trust since 2022) | Retired. Director, President and Chief Executive Officer (Dec. 2016 – Sept. 2019), Principal Funds (investment management). | 106 | Director (2016 – 2019), Principal Funds, Inc. |
Robert W. Burns 1959 Trustee (Trustee of Schwab Strategic Trust since 2009; The Charles Schwab Family of Funds, Schwab Investments, Schwab Capital Trust, Schwab Annuity Portfolios and Laudus Trust since 2016) | Retired/Private Investor. | 106 | None |
Nancy F. Heller 1956 Trustee (Trustee of The Charles Schwab Family of Funds, Schwab Investments, Schwab Capital Trust, Schwab Annuity Portfolios, Schwab Strategic Trust and Laudus Trust since 2018) | Retired. | 106 | None |
David L. Mahoney 1954 Trustee (Trustee of The Charles Schwab Family of Funds, Schwab Investments, Schwab Capital Trust, Schwab Annuity Portfolios and Laudus Trust since 2011; Schwab Strategic Trust since 2016) | Private Investor. | 106 | Director (2004 – present), Corcept Therapeutics Incorporated Director (2009 – 2021), Adamas Pharmaceuticals, Inc. Director (2003 – 2019), Symantec Corporation |
Jane P. Moncreiff 1961 Trustee (Trustee of The Charles Schwab Family of Funds, Schwab Investments, Schwab Capital Trust, Schwab Annuity Portfolios, Schwab Strategic Trust and Laudus Trust since 2019) | Consultant (2018 – present), Fulham Advisers LLC (management consulting); Chief Investment Officer (2009 – 2017), CareGroup Healthcare System, Inc. (healthcare). | 106 | None |
Independent Trustees (continued) | |||
Name, Year of Birth, and Position(s) with the trust (Terms of office, and length of Time Served1) | Principal Occupations During the Past Five Years | Number of Portfolios in Fund Complex Overseen by the Trustee | Other Directorships |
Kimberly S. Patmore 1956 Trustee (Trustee of The Charles Schwab Family of Funds, Schwab Investments, Schwab Capital Trust, Schwab Annuity Portfolios, Schwab Strategic Trust and Laudus Trust since 2016) | Consultant (2008 – present), Patmore Management Consulting (management consulting). | 106 | None |
J. Derek Penn 1957 Trustee (Trustee of The Charles Schwab Family of Funds, Schwab Investments, Schwab Capital Trust, Schwab Annuity Portfolios, Schwab Strategic Trust and Laudus Trust since 2021) | Head of Equity Sales and Trading (2006 – 2018), BNY Mellon (financial services). | 106 | None |
Interested Trustees | |||
Name, Year of Birth, and Position(s) with the trust (Terms of office, and length of Time Served1) | Principal Occupations During the Past Five Years | Number of Portfolios in Fund Complex Overseen by the Trustee | Other Directorships |
Walter W. Bettinger II2 1960 Chairman and Trustee (Trustee of The Charles Schwab Family of Funds, Schwab Investments, Schwab Capital Trust and Schwab Annuity Portfolios since 2008; Schwab Strategic Trust since 2009; Laudus Trust since 2010) | Co-Chairman of the Board (July 2022 – present), Director and Chief Executive Officer (Oct. 2008 – present) and President (Feb. 2007 – Oct. 2021), The Charles Schwab Corporation; President and Chief Executive Officer (Oct. 2008 – Oct. 2021) and Director (May 2008 – Oct. 2021), Charles Schwab & Co., Inc.; Co-Chairman of the Board (July 2022 – present) and Director (Apr. 2006 – present), Charles Schwab Bank, SSB; Co-Chairman of the Board (July 2022 – present) and Director (Nov. 2017 – present), Charles Schwab Premier Bank, SSB; Co-Chairman of the Board (July 2022 – present) and Director (July 2019 – present), Charles Schwab Trust Bank; Director (May 2008 – present), Chief Executive Officer (Aug. 2017 – present) and President (Aug. 2017 – Nov. 2021), Schwab Holdings, Inc.; Manager (Sept. 2023 – present), TD Ameritrade Holding LLC; Director (Oct. 2020 – Aug. 2023), TD Ameritrade Holding Corporation; Director (July 2016 – Oct. 2021), Charles Schwab Investment Management, Inc. | 106 | Director (2008 – present), The Charles Schwab Corporation |
Richard A. Wurster2 1973 Trustee (Trustee of The Charles Schwab Family of Funds, Schwab Investments, Schwab Capital Trust, Schwab Annuity Portfolios, Schwab Strategic Trust and Laudus Trust since 2022) | President (Oct. 2021 – present) and Executive Vice President – Schwab Asset Management Solutions (Apr. 2019 – Oct. 2021), The Charles Schwab Corporation; President, Director (Oct. 2021 – present), Executive Vice President – Schwab Asset Management Solutions (July 2019 – Oct. 2021) and Senior Vice President – Advisory (May 2016 – July 2019), Charles Schwab & Co., Inc.; President (Nov. 2021 – present), Schwab Holdings, Inc.; Director (Oct. 2021 – present) and Chief Executive Officer (Nov. 2019 – Jan. 2022), Charles Schwab Investment Management, Inc.; Director, Chief Executive Officer and President (Mar. 2018 – Oct. 2022), Charles Schwab Investment Advisory, Inc.; Chief Executive Officer (July 2016 – Apr. 2018) and President (Mar. 2017 – Apr. 2018), ThomasPartners, Inc.; Chief Executive Officer (July 2016 – Apr. 2018), Windhaven Investment Management, Inc. | 106 | None |
Officers of the Trust | |
Name, Year of Birth, and Position(s) with the trust (Terms of office, and length of Time Served3) | Principal Occupations During the Past Five Years |
Omar Aguilar 1970 Chief Executive Officer, President and Chief Investment Officer (Officer of The Charles Schwab Family of Funds, Schwab Investments, Schwab Capital Trust, Schwab Annuity Portfolios, Schwab Strategic Trust and Laudus Trust since 2011) | Chief Executive Officer (Jan. 2022 – present), President (Oct. 2023 – present), (Chief Investment Officer (Apr. 2011 – present) and Senior Vice President (Apr. 2011 – Jan. 2022), Charles Schwab Investment Management, Inc.; Director, Chief Executive Officer and President (Oct. 2022 – present), Charles Schwab Investment Advisory, Inc.; Chief Executive Officer (Sept. 2023 – present), President (Oct. 2023 – present), Chief Investment Officer (June 2011 – present) and Vice President (June 2011 – Sept. 2023), Schwab Funds, Laudus Trust and Schwab ETFs. |
Mark Fischer 1970 Chief Operating Officer (Officer of The Charles Schwab Family of Funds, Schwab Investments, Schwab Capital Trust, Schwab Annuity Portfolios, Schwab Strategic Trust and Laudus Trust since 2013) | Chief Operating Officer (Dec. 2020 – present) and Treasurer and Chief Financial Officer (Jan. 2016 – Dec. 2022), Schwab Funds, Laudus Trust and Schwab ETFs; Chief Financial Officer (Mar. 2020 – present), Chief Operating Officer (Oct. 2023 – present), Managing Director (Mar. 2023 – present) and Vice President (Oct. 2013 – Mar. 2023), Charles Schwab Investment Management, Inc. |
Dana Smith 1965 Treasurer and Chief Financial Officer (Officer of The Charles Schwab Family of Funds, Schwab Investments, Schwab Capital Trust, Schwab Annuity Portfolios, Schwab Strategic Trust and Laudus Trust since 2023) | Treasurer and Chief Financial Officer (Jan. 2023 – present) and Assistant Treasurer (Dec. 2015 – Dec. 2022), Schwab Funds, Laudus Trust and Schwab ETFs; Managing Director (Mar. 2023 – present), Vice President (Mar. 2022 – Mar. 2023) and Director (Oct. 2015 – Mar. 2022), Charles Schwab Investment Management, Inc.; Managing Director (May 2022 – present) and Vice President (Apr. 2022 – May 2022), Charles Schwab & Co., Inc. |
Patrick Cassidy 1964 Vice President and Chief Investment Officer (Officer of The Charles Schwab Family of Funds, Schwab Investments, Schwab Capital Trust, Schwab Annuity Portfolios, Schwab Strategic Trust and Laudus Trust since 2018) | Chief Investment Officer (Oct. 2023 – present) and Vice President (Feb. 2018 – present), Schwab Funds, Laudus Trust and Schwab ETFs; Managing Director (Mar. 2023 – present), Chief Investment Officer (Oct. 2023 – present), and Senior Vice President (Oct. 2012 – Mar. 2023), Charles Schwab Investment Management, Inc. |
William P. McMahon, Jr. 1972 Vice President and Chief Investment Officer (Officer of The Charles Schwab Family of Funds, Schwab Investments, Schwab Capital Trust, Schwab Annuity Portfolios, Schwab Strategic Trust and Laudus Trust since 2021) | Managing Director (Mar. 2023 – present), Senior Vice President (Jan. 2020 – Mar. 2023) and Chief Investment Officer (Jan. 2020 – present) Charles Schwab Investment Management, Inc.; Vice President and Chief Investment Officer (June 2021 – present), Schwab Funds, Laudus Trust and Schwab ETFs; Senior Vice President and Chief Investment Officer – ThomasPartners Strategies (Apr. 2018 – Dec. 2019), Charles Schwab Investment Advisory, Inc.; Senior Vice President and Chief Investment Officer (May 2001 – Apr. 2018), ThomasPartners, Inc. |
Catherine MacGregor 1964 Chief Legal Officer and Secretary, Schwab Funds and Schwab ETFs Chief Legal Officer, Vice President and Clerk, Laudus Trust (Officer of The Charles Schwab Family of Funds, Schwab Investments, Schwab Capital Trust, Schwab Annuity Portfolios and Laudus Trust since 2005; Schwab Strategic Trust since 2009) | Chief Legal Officer (Mar. 2022 – present), Managing Director (Mar. 2023 – present) and Vice President (Sept. 2005 – Mar. 2023), Charles Schwab Investment Management, Inc.; Managing Director (May 2022 – present) and Vice President (Aug. 2005 – May 2022), Charles Schwab & Co., Inc.; Vice President (Dec. 2005 – present) and Chief Legal Officer and Clerk (Mar. 2007 – present), Laudus Trust; Chief Legal Officer and Secretary (Oct. 2021 – present), Vice President (Nov. 2005 – Oct. 2021) and Assistant Secretary (June 2007 – Oct. 2021), Schwab Funds; Chief Legal Officer and Secretary (Oct. 2021 – present), Vice President and Assistant Secretary (Oct. 2009 – Oct. 2021), Schwab ETFs. |
Member SIPC®
Printed on recycled paper.

No Action Required – Notice Regarding Shareholder Report Delivery |
Beginning on July 24, 2024, fund shareholder reports will be streamlined to highlight key information deemed important for investors to assess and monitor their fund investments. Other information, including financial statements, will not appear in the streamlined shareholder reports but will available online and delivered free of charge upon request. |
• If you already receive the full shareholder reports, you will receive the streamlined shareholder reports in the same way that you currently receive the full shareholder reports (either in paper or electronically). |
• If you currently receive a notification when a shareholder report is available on a fund’s website, beginning July 24, 2024, you will begin to receive the streamlined shareholder report (in paper). |
2 | |
4 | |
5 | |
7 | |
9 | |
11 | |
13 | |
15 | |
17 | |
19 | |
21 | |
23 | |
25 | |
27 | |
29 | |
31 | |
37 | |
43 | |
49 | |
55 | |
61 | |
67 | |
73 | |
79 | |
85 | |
91 | |
97 | |
103 | |
112 | |
115 |
Total Return for the 6 Months Ended April 30, 2024 | |
Schwab Target 2010 Fund (Ticker Symbol: SWBRX) | 9.90% |
Dow Jones U.S. Total Stock Market IndexSM | 21.22% |
Target 2010 Composite Index | 9.74% |
Fund Category: Morningstar Target-Date 2000-20101 | 9.06% |
Performance Details | pages 5-6 |
Schwab Target 2015 Fund (Ticker Symbol: SWGRX) | 10.48% |
Dow Jones U.S. Total Stock Market IndexSM | 21.22% |
Target 2015 Composite Index | 10.34% |
Fund Category: Morningstar Target-Date 20151 | 10.04% |
Performance Details | pages 7-8 |
Schwab Target 2020 Fund (Ticker Symbol: SWCRX) | 10.91% |
Dow Jones U.S. Total Stock Market IndexSM | 21.22% |
Target 2020 Composite Index | 10.74% |
Fund Category: Morningstar Target-Date 20201 | 10.91% |
Performance Details | pages 9-10 |
Schwab Target 2025 Fund (Ticker Symbol: SWHRX) | 11.85% |
Dow Jones U.S. Total Stock Market IndexSM | 21.22% |
Target 2025 Composite Index | 11.72% |
Fund Category: Morningstar Target-Date 20251 | 11.73% |
Performance Details | pages 11-12 |
Schwab Target 2030 Fund (Ticker Symbol: SWDRX) | 13.93% |
Dow Jones U.S. Total Stock Market IndexSM | 21.22% |
Target 2030 Composite Index | 13.78% |
Fund Category: Morningstar Target-Date 20301 | 13.30% |
Performance Details | pages 13-14 |
Schwab Target 2035 Fund (Ticker Symbol: SWIRX) | 15.40% |
Dow Jones U.S. Total Stock Market IndexSM | 21.22% |
Target 2035 Composite Index | 15.28% |
Fund Category: Morningstar Target-Date 20351 | 15.01% |
Performance Details | pages 15-16 |
Total Return for the 6 Months Ended April 30, 2024 | |
Schwab Target 2040 Fund (Ticker Symbol: SWERX) | 16.54% |
Dow Jones U.S. Total Stock Market IndexSM | 21.22% |
Target 2040 Composite Index | 16.46% |
Fund Category: Morningstar Target-Date 20401 | 16.51% |
Performance Details | pages 17-18 |
Schwab Target 2045 Fund (Ticker Symbol: SWMRX) | 17.52% |
Dow Jones U.S. Total Stock Market IndexSM | 21.22% |
Target 2045 Composite Index | 17.44% |
Fund Category: Morningstar Target-Date 20451 | 17.64% |
Performance Details | pages 19-20 |
Schwab Target 2050 Fund (Ticker Symbol: SWNRX) | 18.22% |
Dow Jones U.S. Total Stock Market IndexSM | 21.22% |
Target 2050 Composite Index | 18.06% |
Fund Category: Morningstar Target-Date 20501 | 18.27% |
Performance Details | pages 21-22 |
Schwab Target 2055 Fund (Ticker Symbol: SWORX) | 18.50% |
Dow Jones U.S. Total Stock Market IndexSM | 21.22% |
Target 2055 Composite Index | 18.42% |
Fund Category: Morningstar Target-Date 20551 | 18.47% |
Performance Details | pages 23-24 |
Schwab Target 2060 Fund (Ticker Symbol: SWPRX) | 18.73% |
Dow Jones U.S. Total Stock Market IndexSM | 21.22% |
Target 2060 Composite Index | 18.70% |
Fund Category: Morningstar Target-Date 20601 | 18.66% |
Performance Details | pages 25-26 |
Schwab Target 2065 Fund (Ticker Symbol: SWQRX) | 18.90% |
Dow Jones U.S. Total Stock Market IndexSM | 21.22% |
Target 2065 Composite Index | 18.90% |
Fund Category: Morningstar Target-Date 2065+1 | 18.70% |
Performance Details | pages 27-28 |
 | Zifan Tang, Ph.D., CFA, Senior Portfolio Manager for Schwab Asset Management, is responsible for the day-to-day co-management of the funds. Prior to joining Schwab in 2012, Ms. Tang was a product manager at Thomson Reuters and from 1997 to 2009 worked as a portfolio manager at Barclays Global Investors (now known as BlackRock). |
 | Drew Hayes, CFA, Portfolio Manager for Schwab Asset Management, is responsible for the day-to-day co-management of the funds. Mr. Hayes has been with Schwab since 2006. Before becoming a portfolio manager, he spent seven years as a senior fixed income specialist for Schwab Wealth Advisory, Inc. Prior to that, he worked as a bond investment specialist for two years and as a registered representative for two years for Charles Schwab & Co., Inc. |
 | Patrick Kwok, CFA, Portfolio Manager for Schwab Asset Management, is responsible for the day-to-day co-management of the funds. Previously, Mr. Kwok served as an associate portfolio manager from 2012 to 2016. Prior to that, he worked as a fund administration manager, where he was responsible for oversight of sub-advisers, trading, cash management, and fund administration supporting the Charles Schwab Trust Bank Collective Investment Trusts and multi-asset Schwab Funds. Prior to joining Schwab Asset Management in 2008, Mr. Kwok spent two years as an asset operations specialist at Charles Schwab Trust Company. He also worked for one year at State Street Bank & Trust as a portfolio accountant and pricing specialist. |
Fund and Inception Date | 6 Months | 1 Year | 5 Years | 10 Years |
Fund: Schwab Target 2010 Fund (7/1/05) | 9.90% | 6.15% | 3.91% | 4.19% |
Dow Jones U.S. Total Stock Market IndexSM | 21.22% | 22.42% | 12.32% | 11.73% |
Bloomberg US Aggregate Bond Index | 4.97% | -1.47% | -0.16% | 1.20% |
Target 2010 Composite Index | 9.74% | 5.81% | 4.02% | 4.40% |
Fund Category: Morningstar Target-Date 2000-2010 2 | 9.06% | 5.41% | 3.65% | 4.08% |
Fund Expense Ratios3: Net 0.26%; Gross 0.40% | ||||
Number of Holdings | 21 |
Portfolio Turnover Rate | 6% 1 |
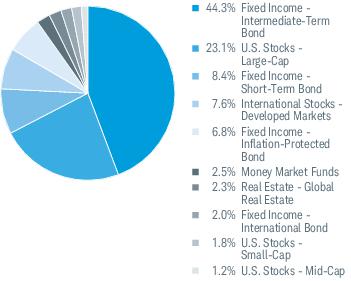
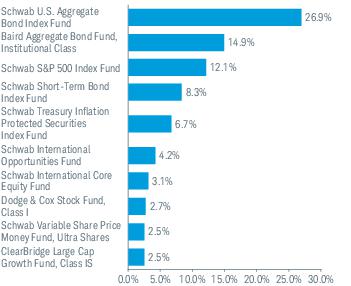
Fund and Inception Date | 6 Months | 1 Year | 5 Years | 10 Years |
Fund: Schwab Target 2015 Fund (3/12/08) | 10.48% | 6.65% | 4.14% | 4.38% |
Dow Jones U.S. Total Stock Market IndexSM | 21.22% | 22.42% | 12.32% | 11.73% |
Bloomberg US Aggregate Bond Index | 4.97% | -1.47% | -0.16% | 1.20% |
Target 2015 Composite Index | 10.34% | 6.44% | 4.32% | 4.63% |
Fund Category: Morningstar Target-Date 2015 2 | 10.04% | 6.14% | 4.21% | 4.58% |
Fund Expense Ratios3: Net 0.28%; Gross 0.40% | ||||
Number of Holdings | 21 |
Portfolio Turnover Rate | 5% 1 |
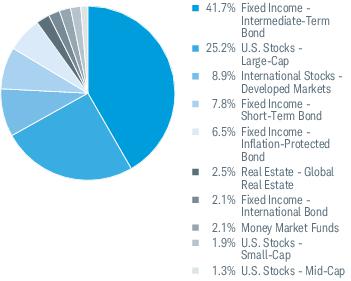
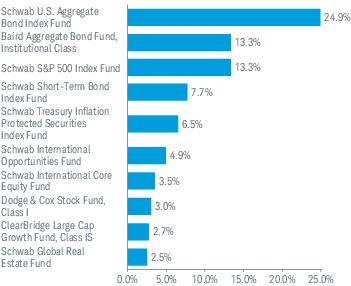
Fund and Inception Date | 6 Months | 1 Year | 5 Years | 10 Years |
Fund: Schwab Target 2020 Fund (7/1/05) | 10.91% | 7.10% | 4.31% | 4.76% |
Dow Jones U.S. Total Stock Market IndexSM | 21.22% | 22.42% | 12.32% | 11.73% |
Bloomberg US Aggregate Bond Index | 4.97% | -1.47% | -0.16% | 1.20% |
Target 2020 Composite Index | 10.74% | 6.86% | 4.53% | 5.07% |
Fund Category: Morningstar Target-Date 2020 2 | 10.91% | 6.81% | 4.46% | 4.92% |
Fund Expense Ratios3: Net 0.29%; Gross 0.32% | ||||
Number of Holdings | 21 |
Portfolio Turnover Rate | 5% 1 |

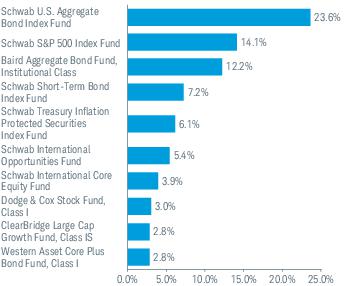
Fund and Inception Date | 6 Months | 1 Year | 5 Years | 10 Years |
Fund: Schwab Target 2025 Fund (3/12/08) | 11.85% | 8.14% | 5.11% | 5.50% |
Dow Jones U.S. Total Stock Market IndexSM | 21.22% | 22.42% | 12.32% | 11.73% |
Bloomberg US Aggregate Bond Index | 4.97% | -1.47% | -0.16% | 1.20% |
Target 2025 Composite Index | 11.72% | 7.92% | 5.44% | 5.90% |
Fund Category: Morningstar Target-Date 2025 2 | 11.73% | 7.49% | 4.88% | 5.29% |
Fund Expense Ratios3: Net 0.34%; Gross 0.36% | ||||
Number of Holdings | 22 |
Portfolio Turnover Rate | 7% 1 |
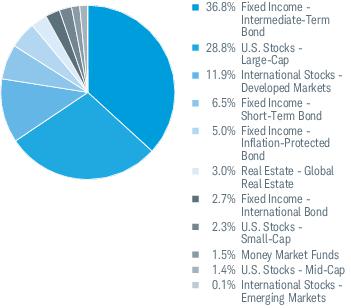
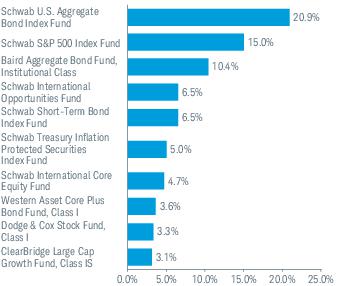
Fund and Inception Date | 6 Months | 1 Year | 5 Years | 10 Years |
Fund: Schwab Target 2030 Fund (7/1/05) | 13.93% | 10.47% | 6.04% | 6.21% |
Dow Jones U.S. Total Stock Market IndexSM | 21.22% | 22.42% | 12.32% | 11.73% |
Bloomberg US Aggregate Bond Index | 4.97% | -1.47% | -0.16% | 1.20% |
Target 2030 Composite Index | 13.78% | 10.15% | 6.42% | 6.66% |
Fund Category: Morningstar Target-Date 2030 2 | 13.30% | 9.17% | 5.81% | 6.04% |
Fund Expense Ratios3: Net 0.41%; Gross 0.42% | ||||
Number of Holdings | 22 |
Portfolio Turnover Rate | 7% 1 |
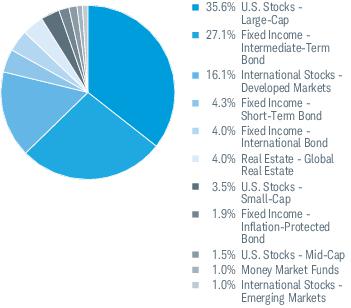
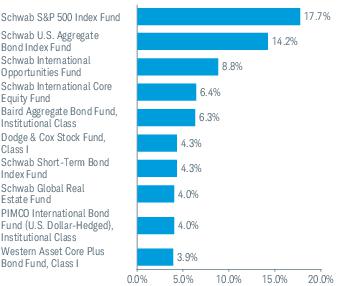
Fund and Inception Date | 6 Months | 1 Year | 5 Years | 10 Years |
Fund: Schwab Target 2035 Fund (3/12/08) | 15.40% | 12.08% | 6.65% | 6.70% |
Dow Jones U.S. Total Stock Market IndexSM | 21.22% | 22.42% | 12.32% | 11.73% |
Bloomberg US Aggregate Bond Index | 4.97% | -1.47% | -0.16% | 1.20% |
Target 2035 Composite Index | 15.28% | 11.71% | 7.13% | 7.22% |
Fund Category: Morningstar Target-Date 2035 2 | 15.01% | 11.15% | 6.73% | 6.71% |
Fund Expense Ratios3: Net 0.46%; Gross 0.48% | ||||
Number of Holdings | 21 |
Portfolio Turnover Rate | 6% 1 |
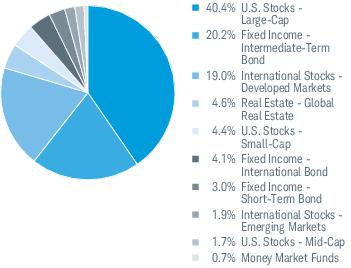
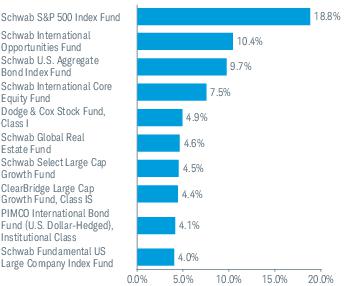
Fund and Inception Date | 6 Months | 1 Year | 5 Years | 10 Years |
Fund: Schwab Target 2040 Fund (7/1/05) | 16.54% | 13.42% | 7.15% | 7.10% |
Dow Jones U.S. Total Stock Market IndexSM | 21.22% | 22.42% | 12.32% | 11.73% |
Bloomberg US Aggregate Bond Index | 4.97% | -1.47% | -0.16% | 1.20% |
Target 2040 Composite Index | 16.46% | 12.89% | 7.67% | 7.68% |
Fund Category: Morningstar Target-Date 2040 2 | 16.51% | 13.06% | 7.54% | 7.29% |
Fund Expense Ratios3: Net 0.50%; Gross 0.51% | ||||
Number of Holdings | 21 |
Portfolio Turnover Rate | 6% 1 |
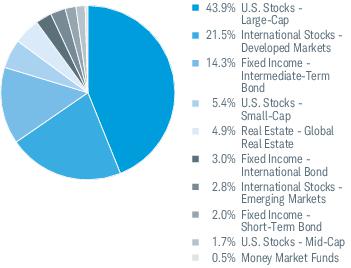
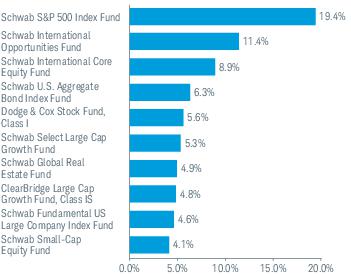
Fund and Inception Date | 6 Months | 1 Year | 5 Years | 10 Years |
Fund: Schwab Target 2045 Fund (1/23/13) | 17.52% | 14.49% | 7.57% | 7.41% |
Dow Jones U.S. Total Stock Market IndexSM | 21.22% | 22.42% | 12.32% | 11.73% |
Bloomberg US Aggregate Bond Index | 4.97% | -1.47% | -0.16% | 1.20% |
Target 2045 Composite Index | 17.44% | 13.85% | 8.14% | 8.03% |
Fund Category: Morningstar Target-Date 2045 2 | 17.64% | 14.43% | 8.09% | 7.60% |
Fund Expense Ratios3: Net 0.53%; Gross 0.57% | ||||
Number of Holdings | 21 |
Portfolio Turnover Rate | 3% 1 |
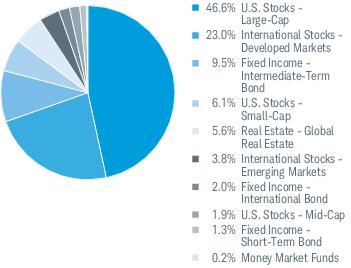
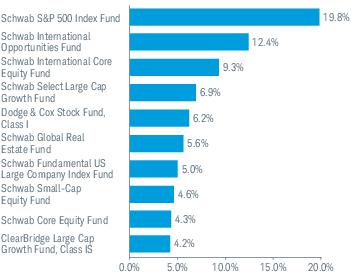
Fund and Inception Date | 6 Months | 1 Year | 5 Years | 10 Years |
Fund: Schwab Target 2050 Fund (1/23/13) | 18.22% | 15.13% | 7.86% | 7.62% |
Dow Jones U.S. Total Stock Market IndexSM | 21.22% | 22.42% | 12.32% | 11.73% |
Bloomberg US Aggregate Bond Index | 4.97% | -1.47% | -0.16% | 1.20% |
Target 2050 Composite Index | 18.06% | 14.44% | 8.40% | 8.23% |
Fund Category: Morningstar Target-Date 2050 2 | 18.27% | 15.11% | 8.28% | 7.75% |
Fund Expense Ratios3: Net 0.56%; Gross 0.60% | ||||
Number of Holdings | 21 |
Portfolio Turnover Rate | 1% 1 |
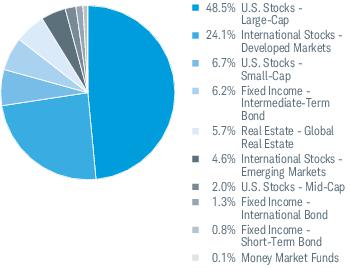
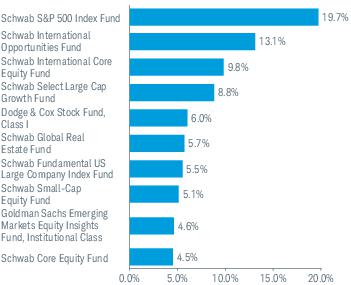
Fund and Inception Date | 6 Months | 1 Year | 5 Years | 10 Years |
Fund: Schwab Target 2055 Fund (1/23/13) | 18.50% | 15.29% | 7.92% | 7.70% |
Dow Jones U.S. Total Stock Market IndexSM | 21.22% | 22.42% | 12.32% | 11.73% |
Bloomberg US Aggregate Bond Index | 4.97% | -1.47% | -0.16% | 1.20% |
Target 2055 Composite Index | 18.42% | 14.77% | 8.55% | 8.37% |
Fund Category: Morningstar Target-Date 2055 2 | 18.47% | 15.34% | 8.38% | 7.78% |
Fund Expense Ratios3: Net 0.57%; Gross 0.62% | ||||
Number of Holdings | 20 |
Portfolio Turnover Rate | 1% 1 |
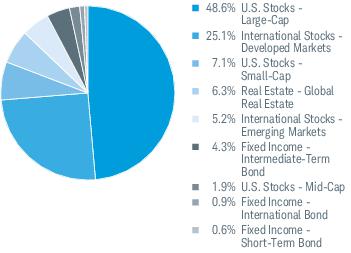
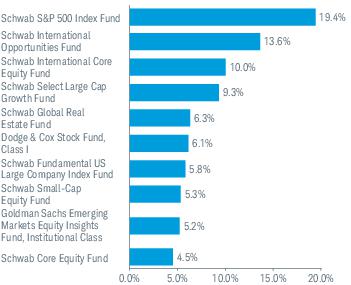
Fund and Inception Date | 6 Months | 1 Year | 5 Years | Since Inception |
Fund: Schwab Target 2060 Fund (8/25/16) | 18.73% | 15.60% | 8.05% | 8.85% |
Dow Jones U.S. Total Stock Market IndexSM | 21.22% | 22.42% | 12.32% | 12.89% |
Bloomberg US Aggregate Bond Index | 4.97% | -1.47% | -0.16% | 0.34% |
Target 2060 Composite Index | 18.70% | 15.05% | 8.70% | 9.45% |
Fund Category: Morningstar Target-Date 2060 2 | 18.66% | 15.60% | 8.50% | N/A |
Fund Expense Ratios3: Net 0.58%; Gross 0.73% | ||||
Number of Holdings | 19 |
Portfolio Turnover Rate | 1% 1 |
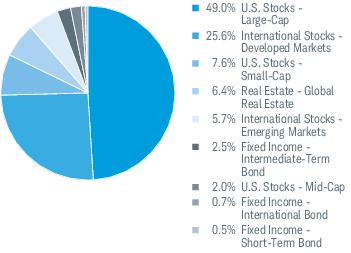
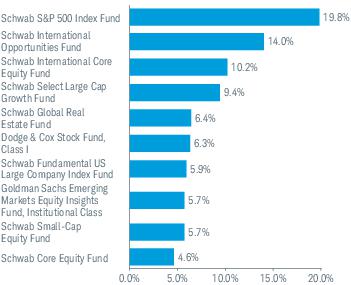
Fund and Inception Date | 6 Months | 1 Year | 3 Years | Since Inception |
Fund: Schwab Target 2065 Fund (2/25/21) | 18.90% | 15.79% | 2.44% | 4.38% |
Dow Jones U.S. Total Stock Market IndexSM | 21.22% | 22.42% | 6.21% | 8.60% |
Bloomberg US Aggregate Bond Index | 4.97% | -1.47% | -3.54% | -3.23% |
Target 2065 Composite Index | 18.90% | 15.25% | 3.75% | 5.36% |
Fund Category: Morningstar Target-Date 2065+ 2 | 18.70% | 15.71% | 3.07% | N/A |
Fund Expense Ratios3: Net 0.59%; Gross 1.29% | ||||
Number of Holdings | 18 |
Portfolio Turnover Rate | 3% 1 |
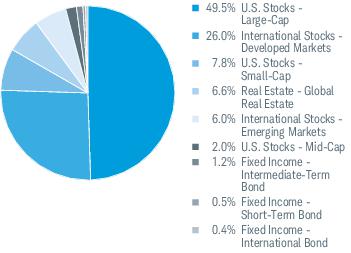
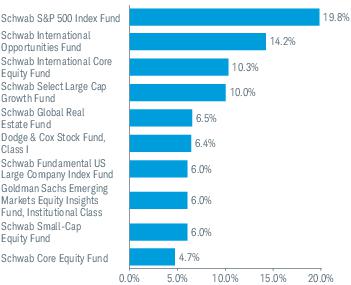
EXPENSE RATIO (ANNUALIZED)1,2 | EFFECTIVE EXPENSE RATIO (ANNUALIZED)3,4 | BEGINNING ACCOUNT VALUE AT 11/1/23 | ENDING ACCOUNT VALUE (NET OF EXPENSES) AT 4/30/242 | EXPENSES PAID DURING PERIOD 11/1/23-4/30/242,5 | EFFECTIVE EXPENSES PAID DURING PERIOD 11/1/23-4/30/244,5 | |
Schwab Target 2010 Fund | ||||||
Actual Return | 0.00% | 0.25% | $1,000.00 | $1,099.00 | $0.00 | $1.30 |
Hypothetical 5% Return | 0.00% | 0.25% | $1,000.00 | $1,024.86 | $0.00 | $1.26 |
Schwab Target 2015 Fund | ||||||
Actual Return | 0.00% | 0.27% | $1,000.00 | $1,104.80 | $0.00 | $1.41 |
Hypothetical 5% Return | 0.00% | 0.27% | $1,000.00 | $1,024.86 | $0.00 | $1.36 |
Schwab Target 2020 Fund | ||||||
Actual Return | 0.00% | 0.28% | $1,000.00 | $1,109.10 | $0.00 | $1.47 |
Hypothetical 5% Return | 0.00% | 0.28% | $1,000.00 | $1,024.86 | $0.00 | $1.41 |
Schwab Target 2025 Fund | ||||||
Actual Return | 0.00% | 0.32% | $1,000.00 | $1,118.50 | $0.00 | $1.69 |
Hypothetical 5% Return | 0.00% | 0.32% | $1,000.00 | $1,024.86 | $0.00 | $1.61 |
Schwab Target 2030 Fund | ||||||
Actual Return | 0.00% | 0.40% | $1,000.00 | $1,139.30 | $0.00 | $2.13 |
Hypothetical 5% Return | 0.00% | 0.40% | $1,000.00 | $1,024.86 | $0.00 | $2.01 |
Schwab Target 2035 Fund | ||||||
Actual Return | 0.00% | 0.45% | $1,000.00 | $1,154.00 | $0.00 | $2.41 |
Hypothetical 5% Return | 0.00% | 0.45% | $1,000.00 | $1,024.86 | $0.00 | $2.26 |
Schwab Target 2040 Fund | ||||||
Actual Return | 0.00% | 0.49% | $1,000.00 | $1,165.40 | $0.00 | $2.64 |
Hypothetical 5% Return | 0.00% | 0.49% | $1,000.00 | $1,024.86 | $0.00 | $2.46 |
Schwab Target 2045 Fund | ||||||
Actual Return | 0.00% | 0.53% | $1,000.00 | $1,175.20 | $0.00 | $2.87 |
Hypothetical 5% Return | 0.00% | 0.53% | $1,000.00 | $1,024.86 | $0.00 | $2.66 |
Schwab Target 2050 Fund | ||||||
Actual Return | 0.00% | 0.55% | $1,000.00 | $1,182.20 | $0.00 | $2.98 |
Hypothetical 5% Return | 0.00% | 0.55% | $1,000.00 | $1,024.86 | $0.00 | $2.77 |
Schwab Target 2055 Fund | ||||||
Actual Return | 0.00% | 0.57% | $1,000.00 | $1,185.00 | $0.00 | $3.10 |
Hypothetical 5% Return | 0.00% | 0.57% | $1,000.00 | $1,024.86 | $0.00 | $2.87 |
EXPENSE RATIO (ANNUALIZED)1,2 | EFFECTIVE EXPENSE RATIO (ANNUALIZED)3,4 | BEGINNING ACCOUNT VALUE AT 11/1/23 | ENDING ACCOUNT VALUE (NET OF EXPENSES) AT 4/30/242 | EXPENSES PAID DURING PERIOD 11/1/23-4/30/242,5 | EFFECTIVE EXPENSES PAID DURING PERIOD 11/1/23-4/30/244,5 | |
Schwab Target 2060 Fund | ||||||
Actual Return | 0.00% | 0.58% | $1,000.00 | $1,187.30 | $0.00 | $3.15 |
Hypothetical 5% Return | 0.00% | 0.58% | $1,000.00 | $1,024.86 | $0.00 | $2.92 |
Schwab Target 2065 Fund | ||||||
Actual Return | 0.00% | 0.58% | $1,000.00 | $1,189.00 | $0.00 | $3.16 |
Hypothetical 5% Return | 0.00% | 0.58% | $1,000.00 | $1,024.86 | $0.00 | $2.92 |
1 | Based on the most recent six-month expense ratio. |
2 | Excludes acquired fund fees and expenses, which are indirect expenses incurred by the fund through its investments in underlying funds. |
3 | Based on the most recent six-month acquired fund fees and expenses and the expense ratio; may differ from the acquired fund fees and expenses and the expense ratio in the prospectus. |
4 | Includes acquired fund fees and expenses, which are indirect expenses incurred by the fund through its investments in underlying funds. |
5 | Expenses for each fund are equal to its annualized expense ratio, multiplied by the average account value over the period, multiplied by 182 days in the period, and divided by 366 days in the fiscal year. |
11/1/23– 4/30/24* | 11/1/22– 10/31/23 | 11/1/21– 10/31/22 | 11/1/20– 10/31/21 | 11/1/19– 10/31/20 | 11/1/18– 10/31/19 | |
Per-Share Data | ||||||
Net asset value at beginning of period | $12.19 | $12.23 | $15.21 | $13.76 | $13.57 | $13.06 |
Income (loss) from investment operations: | ||||||
Net investment income (loss)1 | 0.22 | 0.35 | 0.28 | 0.22 | 0.27 | 0.30 |
Net realized and unrealized gains (losses) | 0.99 | 0.16 | (2.55 ) | 1.61 | 0.57 | 0.97 |
Total from investment operations | 1.21 | 0.51 | (2.27 ) | 1.83 | 0.84 | 1.27 |
Less distributions: | ||||||
Distributions from net investment income | (0.38 ) | (0.30 ) | (0.30 ) | (0.27 ) | (0.34 ) | (0.34 ) |
Distributions from net realized gains | (0.18 ) | (0.25 ) | (0.41 ) | (0.11 ) | (0.31 ) | (0.42 ) |
Total distributions | (0.56 ) | (0.55 ) | (0.71 ) | (0.38 ) | (0.65 ) | (0.76 ) |
Net asset value at end of period | $12.84 | $12.19 | $12.23 | $15.21 | $13.76 | $13.57 |
Total return | 9.90 %2 | 4.24 % | (15.69 %) | 13.46 % | 6.38 % | 10.42 % |
Ratios/Supplemental Data | ||||||
Ratios to average net assets: | ||||||
Net operating expenses3 | 0.00 %4 | 0.00 % | 0.00 %5 | 0.00 % | 0.00 % | 0.00 % |
Gross operating expenses3 | 0.15 %4 | 0.14 % | 0.14 %5 | 0.12 % | 0.14 % | 0.17 % |
Net investment income (loss) | 3.41 %4 | 2.76 % | 2.04 % | 1.50 % | 2.03 % | 2.33 % |
Portfolio turnover rate | 6 %2 | 14 % | 24 % | 21 % | 27 % | 13 % |
Net assets, end of period (x 1,000) | $43,244 | $43,307 | $46,359 | $65,477 | $55,507 | $51,106 |
* | Unaudited. |
1 | Calculated based on the average shares outstanding during the period. |
2 | Not annualized. |
3 | Ratio excludes acquired fund fees and expenses, which are indirect expenses incurred by the fund through its investments in underlying funds. |
4 | Annualized. |
5 | Ratio includes less than 0.005% of non-routine proxy expenses. |
SECURITY | VALUE AT 10/31/23 | PURCHASES | SALES | REALIZED GAINS (LOSSES) | NET CHANGE IN UNREALIZED APPRECIATION (DEPRECIATION) | VALUE AT 4/30/24 | BALANCE OF SHARES HELD AT 4/30/24 | DISTRIBUTIONS RECEIVED(a) |
AFFILIATED UNDERLYING FUNDS 74.5% OF NET ASSETS | ||||||||
U.S. Stocks 20.2% | ||||||||
Large-Cap 17.7% | ||||||||
Schwab Core Equity Fund | $696,522 | $21,896 | ($151,708 ) | $39,152 | $65,817 | $671,679 | 31,594 | $21,896 |
Schwab Fundamental US Large Company Index Fund | 864,797 | 17,978 | (196,251 ) | 14,337 | 126,188 | 827,049 | 32,664 | 17,978 |
Schwab S&P 500 Index Fund | 5,404,074 | 122,968 | (1,279,471 ) | 655,558 | 330,351 | 5,233,480 | 67,529 | 82,968 |
Schwab Select Large Cap Growth Fund * | 922,814 | 158,966 | (231,664 ) | (50,633 ) | 127,755 | 927,238 | 40,297 | 158,966 |
7,659,446 | ||||||||
Mid-Cap 1.2% | ||||||||
Schwab U.S. Mid-Cap Index Fund | 545,289 | 8,855 | (152,246 ) | 16,636 | 89,495 | 508,029 | 8,374 | 8,855 |
Small-Cap 1.3% | ||||||||
Schwab Small-Cap Equity Fund | 615,495 | 42,283 | (186,387 ) | 29,271 | 80,187 | 580,849 | 29,425 | 2,284 |
8,748,324 | ||||||||
International Stocks 7.6% | ||||||||
Developed Markets 7.6% | ||||||||
Schwab Fundamental International Large Company Index Fund | 129,077 | 4,613 | — | — | 16,413 | 150,103 | 13,911 | 4,613 |
Schwab International Core Equity Fund | 1,307,705 | 38,553 | (225,647 ) | 21,089 | 187,107 | 1,328,807 | 115,649 | 38,553 |
Schwab International Opportunities Fund | 1,872,303 | 34,660 | (370,000 ) | (25,521 ) | 286,109 | 1,797,551 | 89,878 | 34,660 |
3,276,461 | ||||||||
Real Estate 2.3% | ||||||||
Global Real Estate 2.3% | ||||||||
Schwab Global Real Estate Fund | 1,033,398 | 52,208 | (195,491 ) | (42,518 ) | 127,272 | 974,869 | 165,794 | 17,209 |
Fixed Income 41.9% | ||||||||
Inflation-Protected Bond 6.7% | ||||||||
Schwab Treasury Inflation Protected Securities Index Fund | 2,904,874 | 79,105 | (130,000 ) | (15,574 ) | 77,463 | 2,915,868 | 291,005 | 43,498 |
Intermediate-Term Bond 26.9% | ||||||||
Schwab U.S. Aggregate Bond Index Fund | 11,197,786 | 677,436 | (581,000 ) | (75,482 ) | 409,153 | 11,627,893 | 1,350,510 | 213,094 |
Short-Term Bond 8.3% | ||||||||
Schwab Short-Term Bond Index Fund | 3,530,392 | 199,975 | (160,000 ) | (10,160 ) | 34,879 | 3,595,086 | 383,271 | 67,120 |
18,138,847 | ||||||||
Money Market Funds 2.5% | ||||||||
Schwab Variable Share Price Money Fund, Ultra Shares, 5.27% (b) | 1,790,671 | 38,808 | (750,000 ) | 235 | (104 ) | 1,079,610 | 1,079,286 | 37,075 |
Total Affiliated Underlying Funds (Cost $28,511,914) | $32,815,197 | $1,498,304 | ($4,609,865 ) | $556,390 | $1,958,085 | $32,218,111 | $748,769 | |
SECURITY | VALUE AT 10/31/23 | PURCHASES | SALES | REALIZED GAINS (LOSSES) | NET CHANGE IN UNREALIZED APPRECIATION (DEPRECIATION) | VALUE AT 4/30/24 | BALANCE OF SHARES HELD AT 4/30/24 | DISTRIBUTIONS RECEIVED(a) |
UNAFFILIATED UNDERLYING FUNDS 24.9% OF NET ASSETS | ||||||||
U.S. Stocks 5.7% | ||||||||
Large-Cap 5.2% | ||||||||
ClearBridge Large Cap Growth Fund, Class IS * | $1,067,005 | 16,270 | ||||||
Dodge & Cox Stock Fund, Class I | 1,194,124 | 4,790 | ||||||
2,261,129 | ||||||||
Small-Cap 0.5% | ||||||||
ClearBridge Small Cap Growth Fund, Class IS * | 193,293 | 4,999 | ||||||
2,454,422 | ||||||||
Fixed Income 19.2% | ||||||||
Intermediate-Term Bond 17.2% | ||||||||
Baird Aggregate Bond Fund, Institutional Class | 6,443,030 | 681,081 | ||||||
Loomis Sayles Investment Grade Bond Fund, Class Y | 320,962 | 33,503 | ||||||
Western Asset Core Plus Bond Fund, Class I | 652,389 | 72,407 | ||||||
7,416,381 | ||||||||
International Bond 2.0% | ||||||||
PIMCO International Bond Fund (U.S. Dollar-Hedged), Institutional Class | 883,036 | 90,198 | ||||||
8,299,417 | ||||||||
Total Unaffiliated Underlying Funds (Cost $10,888,307) | $10,753,839 | |||||||
Total Investments in Securities (Cost $39,400,221) | $42,971,950 | |||||||
* | Non-income producing security. |
(a) | Distributions received include distributions from net investment income and capital gains, if any, from the underlying funds. Amounts shown are only presented for affiliated underlying funds, which are presented in the corresponding line-item in the Statement of Operations, if applicable (see financial note 2(d) for additional information). |
(b) | The rate shown is the annualized 7-day yield. |
Assets | ||
Investments in securities, at value - affiliated issuers (cost $28,511,914) | $32,218,111 | |
Investments in securities, at value - unaffiliated issuers (cost $10,888,307) | 10,753,839 | |
Cash | 334,044 | |
Receivables: | ||
Dividends | 56,906 | |
Fund shares sold | 25,432 | |
Due from investment adviser | 5,213 | |
Prepaid expenses | + | 5,832 |
Total assets | 43,399,377 | |
Liabilities | ||
Payables: | ||
Investments bought | 134,480 | |
Fund shares redeemed | 698 | |
Accrued expenses | + | 19,880 |
Total liabilities | 155,058 | |
Net assets | $43,244,319 | |
Net Assets by Source | ||
Capital received from investors | $39,653,038 | |
Total distributable earnings | + | 3,591,281 |
Net assets | $43,244,319 | |
Net Asset Value (NAV) | ||||
Net Assets | ÷ | Shares Outstanding | = | NAV |
$43,244,319 | 3,368,683 | $12.84 | ||
For the period November 1, 2023 through April 30, 2024; unaudited | ||
Investment Income | ||
Dividends received from securities - affiliated issuers | $575,737 | |
Dividends received from securities - unaffiliated issuers | 172,572 | |
Other interest | + | 3,928 |
Total investment income | 752,237 | |
Expenses | ||
Professional fees | 11,412 | |
Registration fees | 9,992 | |
Portfolio accounting fees | 5,587 | |
Independent trustees’ fees | 2,945 | |
Shareholder reports | 1,212 | |
Transfer agent fees | 552 | |
Other expenses | + | 1,235 |
Total expenses | 32,935 | |
Expense reduction | – | 32,935 |
Net expenses | – | — |
Net investment income | 752,237 | |
REALIZED AND UNREALIZED GAINS (LOSSES) | ||
Realized capital gain distributions received from underlying funds - affiliated issuers | 173,032 | |
Realized capital gain distributions received from underlying funds - unaffiliated issuers | 147,165 | |
Net realized gains on sales of securities - affiliated issuers | 556,390 | |
Net realized losses on sales of securities - unaffiliated issuers | + | (33,426 ) |
Net realized gains | 843,161 | |
Net change in unrealized appreciation (depreciation) on securities - affiliated issuers | 1,958,085 | |
Net change in unrealized appreciation (depreciation) on securities - unaffiliated issuers | + | 682,170 |
Net change in unrealized appreciation (depreciation) | + | 2,640,255 |
Net realized and unrealized gains | 3,483,416 | |
Increase in net assets resulting from operations | $4,235,653 | |
OPERATIONS | |||
11/1/23-4/30/24 | 11/1/22-10/31/23 | ||
Net investment income | $752,237 | $1,291,642 | |
Net realized gains | 843,161 | 263,818 | |
Net change in unrealized appreciation (depreciation) | + | 2,640,255 | 557,010 |
Increase in net assets resulting from operations | $4,235,653 | $2,112,470 | |
DISTRIBUTIONS TO SHAREHOLDERS | |||
Total distributions | ($1,890,752 ) | ($2,099,711 ) | |
TRANSACTIONS IN FUND SHARES | |||||
11/1/23-4/30/24 | 11/1/22-10/31/23 | ||||
SHARES | VALUE | SHARES | VALUE | ||
Shares sold | 75,084 | $967,967 | 387,660 | $4,816,480 | |
Shares reinvested | 116,816 | 1,503,428 | 154,395 | 1,854,287 | |
Shares redeemed | + | (376,780 ) | (4,878,541 ) | (778,380 ) | (9,735,905 ) |
Net transactions in fund shares | (184,880 ) | ($2,407,146 ) | (236,325 ) | ($3,065,138 ) | |
SHARES OUTSTANDING AND NET ASSETS | |||||
11/1/23-4/30/24 | 11/1/22-10/31/23 | ||||
SHARES | NET ASSETS | SHARES | NET ASSETS | ||
Beginning of period | 3,553,563 | $43,306,564 | 3,789,888 | $46,358,943 | |
Total decrease | + | (184,880 ) | (62,245 ) | (236,325 ) | (3,052,379 ) |
End of period | 3,368,683 | $43,244,319 | 3,553,563 | $43,306,564 | |
11/1/23– 4/30/24* | 11/1/22– 10/31/23 | 11/1/21– 10/31/22 | 11/1/20– 10/31/21 | 11/1/19– 10/31/20 | 11/1/18– 10/31/19 | |
Per-Share Data | ||||||
Net asset value at beginning of period | $10.29 | $10.48 | $13.36 | $12.18 | $12.07 | $11.49 |
Income (loss) from investment operations: | ||||||
Net investment income (loss)1 | 0.18 | 0.29 | 0.23 | 0.19 | 0.25 | 0.27 |
Net realized and unrealized gains (losses) | 0.90 | 0.17 | (2.24 ) | 1.54 | 0.50 | 0.86 |
Total from investment operations | 1.08 | 0.46 | (2.01 ) | 1.73 | 0.75 | 1.13 |
Less distributions: | ||||||
Distributions from net investment income | (0.31 ) | (0.26 ) | (0.28 ) | (0.24 ) | (0.31 ) | (0.30 ) |
Distributions from net realized gains | (0.34 ) | (0.39 ) | (0.59 ) | (0.31 ) | (0.33 ) | (0.25 ) |
Total distributions | (0.65 ) | (0.65 ) | (0.87 ) | (0.55 ) | (0.64 ) | (0.55 ) |
Net asset value at end of period | $10.72 | $10.29 | $10.48 | $13.36 | $12.18 | $12.07 |
Total return | 10.48 %2 | 4.53 % | (16.15 %) | 14.54 % | 6.41 % | 10.48 % |
Ratios/Supplemental Data | ||||||
Ratios to average net assets: | ||||||
Net operating expenses3 | 0.00 %4 | 0.00 % | 0.00 %5 | 0.00 % | 0.00 % | 0.00 % |
Gross operating expenses3 | 0.13 %4 | 0.12 % | 0.11 %5 | 0.08 % | 0.10 % | 0.11 % |
Net investment income (loss) | 3.36 %4 | 2.71 % | 1.97 % | 1.47 % | 2.07 % | 2.35 % |
Portfolio turnover rate | 5 %2 | 7 % | 19 % | 14 % | 15 % | 10 % |
Net assets, end of period (x 1,000) | $49,412 | $49,402 | $57,879 | $81,399 | $77,274 | $81,139 |
* | Unaudited. |
1 | Calculated based on the average shares outstanding during the period. |
2 | Not annualized. |
3 | Ratio excludes acquired fund fees and expenses, which are indirect expenses incurred by the fund through its investments in underlying funds. |
4 | Annualized. |
5 | Ratio includes less than 0.005% of non-routine proxy expenses. |
SECURITY | VALUE AT 10/31/23 | PURCHASES | SALES | REALIZED GAINS (LOSSES) | NET CHANGE IN UNREALIZED APPRECIATION (DEPRECIATION) | VALUE AT 4/30/24 | BALANCE OF SHARES HELD AT 4/30/24 | DISTRIBUTIONS RECEIVED(a) |
AFFILIATED UNDERLYING FUNDS 74.7% OF NET ASSETS | ||||||||
U.S. Stocks 22.2% | ||||||||
Large-Cap 19.4% | ||||||||
Schwab Core Equity Fund | $898,561 | $26,800 | ($218,185 ) | $77,102 | $59,842 | $844,120 | 39,705 | $26,800 |
Schwab Fundamental US Large Company Index Fund | 1,070,958 | 21,318 | (227,917 ) | 20,544 | 156,159 | 1,041,062 | 41,116 | 21,318 |
Schwab S&P 500 Index Fund | 6,649,359 | 103,610 | (1,436,529 ) | 1,037,359 | 201,736 | 6,555,535 | 84,588 | 103,610 |
Schwab Select Large Cap Growth Fund * | 1,106,101 | 191,888 | (250,000 ) | (48,137 ) | 146,857 | 1,146,709 | 49,835 | 191,888 |
9,587,426 | ||||||||
Mid-Cap 1.3% | ||||||||
Schwab U.S. Mid-Cap Index Fund | 640,834 | 11,149 | (131,697 ) | 12,167 | 118,547 | 651,000 | 10,730 | 11,149 |
Small-Cap 1.5% | ||||||||
Schwab Small-Cap Equity Fund | 715,135 | 2,932 | (130,000 ) | 32,242 | 101,272 | 721,581 | 36,554 | 2,932 |
10,960,007 | ||||||||
International Stocks 8.8% | ||||||||
Developed Markets 8.8% | ||||||||
Schwab Fundamental International Large Company Index Fund | 185,282 | 6,621 | — | — | 23,560 | 215,463 | 19,969 | 6,621 |
Schwab International Core Equity Fund | 1,765,110 | 50,313 | (358,359 ) | 40,888 | 243,048 | 1,741,000 | 151,523 | 50,313 |
Schwab International Opportunities Fund | 2,343,895 | 44,318 | (316,000 ) | 20,809 | 315,059 | 2,408,081 | 120,404 | 44,318 |
4,364,544 | ||||||||
Real Estate 2.5% | ||||||||
Global Real Estate 2.5% | ||||||||
Schwab Global Real Estate Fund | 1,279,836 | 22,154 | (186,000 ) | (4,276 ) | 110,207 | 1,221,921 | 207,810 | 22,154 |
Fixed Income 39.1% | ||||||||
Inflation-Protected Bond 6.5% | ||||||||
Schwab Treasury Inflation Protected Securities Index Fund | 3,129,036 | 162,220 | (160,000 ) | (15,671 ) | 81,124 | 3,196,709 | 319,033 | 47,220 |
Intermediate-Term Bond 24.9% | ||||||||
Schwab U.S. Aggregate Bond Index Fund | 11,920,212 | 787,170 | (740,000 ) | (108,869 ) | 454,768 | 12,313,281 | 1,430,114 | 228,207 |
Short-Term Bond 7.7% | ||||||||
Schwab Short-Term Bond Index Fund | 3,780,174 | 210,094 | (195,000 ) | (13,036 ) | 39,108 | 3,821,340 | 407,392 | 71,890 |
19,331,330 | ||||||||
Money Market Funds 2.1% | ||||||||
Schwab Variable Share Price Money Fund, Ultra Shares, 5.27% (b) | 2,002,488 | 40,500 | (1,020,000 ) | 449 | (290 ) | 1,023,147 | 1,022,841 | 38,137 |
Total Affiliated Underlying Funds (Cost $32,020,970) | $37,486,981 | $1,681,087 | ($5,369,687 ) | $1,051,571 | $2,050,997 | $36,900,949 | $866,557 | |
SECURITY | VALUE AT 10/31/23 | PURCHASES | SALES | REALIZED GAINS (LOSSES) | NET CHANGE IN UNREALIZED APPRECIATION (DEPRECIATION) | VALUE AT 4/30/24 | BALANCE OF SHARES HELD AT 4/30/24 | DISTRIBUTIONS RECEIVED(a) |
UNAFFILIATED UNDERLYING FUNDS 24.8% OF NET ASSETS | ||||||||
U.S. Stocks 6.1% | ||||||||
Large-Cap 5.7% | ||||||||
ClearBridge Large Cap Growth Fund, Class IS * | $1,331,740 | 20,307 | ||||||
Dodge & Cox Stock Fund, Class I | 1,465,096 | 5,877 | ||||||
2,796,836 | ||||||||
Small-Cap 0.4% | ||||||||
ClearBridge Small Cap Growth Fund, Class IS * | 214,947 | 5,558 | ||||||
3,011,783 | ||||||||
Fixed Income 18.7% | ||||||||
Intermediate-Term Bond 16.6% | ||||||||
Baird Aggregate Bond Fund, Institutional Class | 6,584,612 | 696,048 | ||||||
Loomis Sayles Investment Grade Bond Fund, Class Y | 513,800 | 53,633 | ||||||
Western Asset Core Plus Bond Fund, Class I | 1,120,757 | 124,390 | ||||||
8,219,169 | ||||||||
International Bond 2.1% | ||||||||
PIMCO International Bond Fund (U.S. Dollar-Hedged), Institutional Class | 1,050,768 | 107,331 | ||||||
9,269,937 | ||||||||
Total Unaffiliated Underlying Funds (Cost $12,477,330) | $12,281,720 | |||||||
Total Investments in Securities (Cost $44,498,300) | $49,182,669 | |||||||
* | Non-income producing security. |
(a) | Distributions received include distributions from net investment income and capital gains, if any, from the underlying funds. Amounts shown are only presented for affiliated underlying funds, which are presented in the corresponding line-item in the Statement of Operations, if applicable (see financial note 2(d) for additional information). |
(b) | The rate shown is the annualized 7-day yield. |
Assets | ||
Investments in securities, at value - affiliated issuers (cost $32,020,970) | $36,900,949 | |
Investments in securities, at value - unaffiliated issuers (cost $12,477,330) | 12,281,720 | |
Cash | 228,210 | |
Receivables: | ||
Dividends | 62,170 | |
Due from investment adviser | 5,241 | |
Fund shares sold | 352 | |
Prepaid expenses | + | 13,925 |
Total assets | 49,492,567 | |
Liabilities | ||
Payables: | ||
Investments bought | 59,922 | |
Accrued expenses | + | 20,242 |
Total liabilities | 80,164 | |
Net assets | $49,412,403 | |
Net Assets by Source | ||
Capital received from investors | $43,539,601 | |
Total distributable earnings | + | 5,872,802 |
Net assets | $49,412,403 | |
Net Asset Value (NAV) | ||||
Net Assets | ÷ | Shares Outstanding | = | NAV |
$49,412,403 | 4,610,458 | $10.72 | ||
For the period November 1, 2023 through April 30, 2024; unaudited | ||
Investment Income | ||
Dividends received from securities - affiliated issuers | $657,453 | |
Dividends received from securities - unaffiliated issuers | 197,103 | |
Other interest | + | 2,824 |
Total investment income | 857,380 | |
Expenses | ||
Professional fees | 11,424 | |
Registration fees | 9,213 | |
Portfolio accounting fees | 5,612 | |
Independent trustees’ fees | 2,953 | |
Shareholder reports | 1,175 | |
Transfer agent fees | 767 | |
Other expenses | + | 1,254 |
Total expenses | 32,398 | |
Expense reduction | – | 32,398 |
Net expenses | – | — |
Net investment income | 857,380 | |
REALIZED AND UNREALIZED GAINS (LOSSES) | ||
Realized capital gain distributions received from underlying funds - affiliated issuers | 209,104 | |
Realized capital gain distributions received from underlying funds - unaffiliated issuers | 179,984 | |
Net realized gains on sales of securities - affiliated issuers | 1,051,571 | |
Net realized gains on sales of securities - unaffiliated issuers | + | 53,291 |
Net realized gains | 1,493,950 | |
Net change in unrealized appreciation (depreciation) on securities - affiliated issuers | 2,050,997 | |
Net change in unrealized appreciation (depreciation) on securities - unaffiliated issuers | + | 741,624 |
Net change in unrealized appreciation (depreciation) | + | 2,792,621 |
Net realized and unrealized gains | 4,286,571 | |
Increase in net assets resulting from operations | $5,143,951 | |
OPERATIONS | |||
11/1/23-4/30/24 | 11/1/22-10/31/23 | ||
Net investment income | $857,380 | $1,514,051 | |
Net realized gains | 1,493,950 | 1,489,316 | |
Net change in unrealized appreciation (depreciation) | + | 2,792,621 | (155,511 ) |
Increase in net assets resulting from operations | $5,143,951 | $2,847,856 | |
DISTRIBUTIONS TO SHAREHOLDERS | |||
Total distributions | ($3,052,801 ) | ($3,520,737 ) | |
TRANSACTIONS IN FUND SHARES | |||||
11/1/23-4/30/24 | 11/1/22-10/31/23 | ||||
SHARES | VALUE | SHARES | VALUE | ||
Shares sold | 74,228 | $814,957 | 104,249 | $1,110,701 | |
Shares reinvested | 258,525 | 2,771,391 | 317,518 | 3,213,282 | |
Shares redeemed | + | (524,577 ) | (5,667,291 ) | (1,141,958 ) | (12,128,296 ) |
Net transactions in fund shares | (191,824 ) | ($2,080,943 ) | (720,191 ) | ($7,804,313 ) | |
SHARES OUTSTANDING AND NET ASSETS | |||||
11/1/23-4/30/24 | 11/1/22-10/31/23 | ||||
SHARES | NET ASSETS | SHARES | NET ASSETS | ||
Beginning of period | 4,802,282 | $49,402,196 | 5,522,473 | $57,879,390 | |
Total increase (decrease) | + | (191,824 ) | 10,207 | (720,191 ) | (8,477,194 ) |
End of period | 4,610,458 | $49,412,403 | 4,802,282 | $49,402,196 | |
11/1/23– 4/30/24* | 11/1/22– 10/31/23 | 11/1/21– 10/31/22 | 11/1/20– 10/31/21 | 11/1/19– 10/31/20 | 11/1/18– 10/31/19 | |
Per-Share Data | ||||||
Net asset value at beginning of period | $12.38 | $12.55 | $16.14 | $14.55 | $14.46 | $13.87 |
Income (loss) from investment operations: | ||||||
Net investment income (loss)1 | 0.22 | 0.34 | 0.28 | 0.23 | 0.30 | 0.32 |
Net realized and unrealized gains (losses) | 1.13 | 0.24 | (2.72 ) | 1.94 | 0.58 | 1.04 |
Total from investment operations | 1.35 | 0.58 | (2.44 ) | 2.17 | 0.88 | 1.36 |
Less distributions: | ||||||
Distributions from net investment income | (0.38 ) | (0.31 ) | (0.35 ) | (0.29 ) | (0.36 ) | (0.35 ) |
Distributions from net realized gains | (0.53 ) | (0.44 ) | (0.80 ) | (0.29 ) | (0.43 ) | (0.42 ) |
Total distributions | (0.91 ) | (0.75 ) | (1.15 ) | (0.58 ) | (0.79 ) | (0.77 ) |
Net asset value at end of period | $12.82 | $12.38 | $12.55 | $16.14 | $14.55 | $14.46 |
Total return | 10.91 %2 | 4.68 % | (16.35 %) | 15.27 % | 6.33 % | 10.58 % |
Ratios/Supplemental Data | ||||||
Ratios to average net assets: | ||||||
Net operating expenses3 | 0.00 %4 | 0.00 % | 0.00 %5 | 0.00 % | 0.00 % | 0.00 % |
Gross operating expenses3 | 0.03 %4 | 0.03 % | 0.03 %5 | 0.02 % | 0.02 % | 0.03 % |
Net investment income (loss) | 3.34 %4 | 2.67 % | 1.97 % | 1.47 % | 2.13 % | 2.28 % |
Portfolio turnover rate | 5 %2 | 7 % | 17 % | 10 % | 17 % | 14 % |
Net assets, end of period (x 1,000) | $321,561 | $323,339 | $383,963 | $531,012 | $525,444 | $548,690 |
* | Unaudited. |
1 | Calculated based on the average shares outstanding during the period. |
2 | Not annualized. |
3 | Ratio excludes acquired fund fees and expenses, which are indirect expenses incurred by the fund through its investments in underlying funds. |
4 | Annualized. |
5 | Ratio includes less than 0.005% of non-routine proxy expenses. |
SECURITY | VALUE AT 10/31/23 | PURCHASES | SALES | REALIZED GAINS (LOSSES) | NET CHANGE IN UNREALIZED APPRECIATION (DEPRECIATION) | VALUE AT 4/30/24 | BALANCE OF SHARES HELD AT 4/30/24 | DISTRIBUTIONS RECEIVED(a) |
AFFILIATED UNDERLYING FUNDS 74.9% OF NET ASSETS | ||||||||
U.S. Stocks 23.6% | ||||||||
Large-Cap 20.7% | ||||||||
Schwab Core Equity Fund | $6,574,804 | $191,570 | ($1,570,618 ) | $461,830 | $514,972 | $6,172,558 | 290,337 | $191,570 |
Schwab Fundamental US Large Company Index Fund | 6,754,892 | 140,423 | (851,986 ) | 91,697 | 1,052,549 | 7,187,575 | 283,869 | 140,423 |
Schwab S&P 500 Index Fund | 46,319,918 | 1,063,554 | (10,697,793 ) | 7,955,007 | 648,283 | 45,288,969 | 584,374 | 713,554 |
Schwab Select Large Cap Growth Fund * | 7,895,948 | 1,354,415 | (2,053,153 ) | (437,217 ) | 1,104,467 | 7,864,460 | 341,784 | 1,354,415 |
66,513,562 | ||||||||
Mid-Cap 1.4% | ||||||||
Schwab U.S. Mid-Cap Index Fund | 4,482,021 | 77,974 | (944,436 ) | 93,679 | 827,736 | 4,536,974 | 74,781 | 77,974 |
Small-Cap 1.5% | ||||||||
Schwab Small-Cap Equity Fund | 4,782,101 | 20,914 | (850,000 ) | 181,963 | 740,113 | 4,875,091 | 246,965 | 20,914 |
75,925,627 | ||||||||
International Stocks 9.9% | ||||||||
Developed Markets 9.9% | ||||||||
Schwab Fundamental International Large Company Index Fund | 1,687,098 | 60,289 | (200,000 ) | 6,932 | 198,288 | 1,752,607 | 162,429 | 60,289 |
Schwab International Core Equity Fund | 12,544,720 | 349,505 | (2,272,739 ) | 258,660 | 1,773,745 | 12,653,891 | 1,101,296 | 349,505 |
Schwab International Opportunities Fund | 16,743,158 | 572,477 | (2,527,251 ) | 178,995 | 2,226,979 | 17,194,358 | 859,718 | 322,477 |
31,600,856 | ||||||||
Real Estate 2.7% | ||||||||
Global Real Estate 2.7% | ||||||||
Schwab Global Real Estate Fund | 8,684,495 | 153,669 | (830,000 ) | (176,525 ) | 876,492 | 8,708,131 | 1,480,975 | 153,669 |
Fixed Income 36.9% | ||||||||
Inflation-Protected Bond 6.1% | ||||||||
Schwab Treasury Inflation Protected Securities Index Fund | 19,638,546 | 911,698 | (1,450,000 ) | (152,337 ) | 569,645 | 19,517,552 | 1,947,860 | 300,647 |
Intermediate-Term Bond 23.6% | ||||||||
Schwab U.S. Aggregate Bond Index Fund | 73,955,359 | 2,920,215 | (2,930,000 ) | (452,112 ) | 2,618,167 | 76,111,629 | 8,839,910 | 1,413,981 |
Short-Term Bond 7.2% | ||||||||
Schwab Short-Term Bond Index Fund | 23,322,277 | 1,221,017 | (1,625,000 ) | (98,092 ) | 266,967 | 23,087,169 | 2,461,319 | 444,814 |
118,716,350 | ||||||||
Money Market Funds 1.8% | ||||||||
Schwab Variable Share Price Money Fund, Ultra Shares, 5.27% (b) | 12,045,067 | 240,599 | (6,450,000 ) | 2,773 | (1,710 ) | 5,836,729 | 5,834,979 | 225,655 |
Total Affiliated Underlying Funds (Cost $204,049,378) | $245,430,404 | $9,278,319 | ($35,252,976 ) | $7,915,253 | $13,416,693 | $240,787,693 | $5,769,887 | |
SECURITY | VALUE AT 10/31/23 | PURCHASES | SALES | REALIZED GAINS (LOSSES) | NET CHANGE IN UNREALIZED APPRECIATION (DEPRECIATION) | VALUE AT 4/30/24 | BALANCE OF SHARES HELD AT 4/30/24 | DISTRIBUTIONS RECEIVED(a) |
UNAFFILIATED UNDERLYING FUNDS 24.7% OF NET ASSETS | ||||||||
U.S. Stocks 6.3% | ||||||||
Large-Cap 5.8% | ||||||||
ClearBridge Large Cap Growth Fund, Class IS * | $9,062,770 | 138,194 | ||||||
Dodge & Cox Stock Fund, Class I | 9,830,498 | 39,432 | ||||||
18,893,268 | ||||||||
Small-Cap 0.5% | ||||||||
ClearBridge Small Cap Growth Fund, Class IS * | 1,560,068 | 40,343 | ||||||
20,453,336 | ||||||||
Fixed Income 18.4% | ||||||||
Intermediate-Term Bond 16.3% | ||||||||
Baird Aggregate Bond Fund, Institutional Class | 39,150,748 | 4,138,557 | ||||||
Loomis Sayles Investment Grade Bond Fund, Class Y | 4,085,484 | 426,460 | ||||||
Western Asset Core Plus Bond Fund, Class I | 9,008,150 | 999,795 | ||||||
52,244,382 | ||||||||
International Bond 2.1% | ||||||||
PIMCO International Bond Fund (U.S. Dollar-Hedged), Institutional Class | 6,821,626 | 696,795 | ||||||
59,066,008 | ||||||||
Total Unaffiliated Underlying Funds (Cost $80,934,563) | $79,519,344 | |||||||
Total Investments in Securities (Cost $284,983,941) | $320,307,037 | |||||||
* | Non-income producing security. |
(a) | Distributions received include distributions from net investment income and capital gains, if any, from the underlying funds. Amounts shown are only presented for affiliated underlying funds, which are presented in the corresponding line-item in the Statement of Operations, if applicable (see financial note 2(d) for additional information). |
(b) | The rate shown is the annualized 7-day yield. |
Assets | ||
Investments in securities, at value - affiliated issuers (cost $204,049,378) | $240,787,693 | |
Investments in securities, at value - unaffiliated issuers (cost $80,934,563) | 79,519,344 | |
Cash | 25,018 | |
Receivables: | ||
Investments sold | 1,280,000 | |
Dividends | 394,241 | |
Fund shares sold | 8,817 | |
Due from investment adviser | 7,007 | |
Prepaid expenses | + | 6,618 |
Total assets | 322,028,738 | |
Liabilities | ||
Payables: | ||
Investments bought | 381,682 | |
Fund shares redeemed | 54,378 | |
Independent trustees’ fees | 1 | |
Accrued expenses | + | 31,849 |
Total liabilities | 467,910 | |
Net assets | $321,560,828 | |
Net Assets by Source | ||
Capital received from investors | $276,640,735 | |
Total distributable earnings | + | 44,920,093 |
Net assets | $321,560,828 | |
Net Asset Value (NAV) | ||||
Net Assets | ÷ | Shares Outstanding | = | NAV |
$321,560,828 | 25,074,392 | $12.82 | ||
For the period November 1, 2023 through April 30, 2024; unaudited | ||
Investment Income | ||
Dividends received from securities - affiliated issuers | $4,292,405 | |
Dividends received from securities - unaffiliated issuers | 1,279,635 | |
Other interest | + | 15,588 |
Total investment income | 5,587,628 | |
Expenses | ||
Professional fees | 11,930 | |
Registration fees | 10,999 | |
Portfolio accounting fees | 10,983 | |
Shareholder reports | 4,867 | |
Independent trustees’ fees | 3,275 | |
Transfer agent fees | 1,038 | |
Other expenses | + | 2,018 |
Total expenses | 45,110 | |
Expense reduction | – | 45,110 |
Net expenses | – | — |
Net investment income | 5,587,628 | |
REALIZED AND UNREALIZED GAINS (LOSSES) | ||
Realized capital gain distributions received from underlying funds - affiliated issuers | 1,477,482 | |
Realized capital gain distributions received from underlying funds - unaffiliated issuers | 1,220,824 | |
Net realized gains on sales of securities - affiliated issuers | 7,915,253 | |
Net realized gains on sales of securities - unaffiliated issuers | + | 493,796 |
Net realized gains | 11,107,355 | |
Net change in unrealized appreciation (depreciation) on securities - affiliated issuers | 13,416,693 | |
Net change in unrealized appreciation (depreciation) on securities - unaffiliated issuers | + | 4,837,733 |
Net change in unrealized appreciation (depreciation) | + | 18,254,426 |
Net realized and unrealized gains | 29,361,781 | |
Increase in net assets resulting from operations | $34,949,409 | |
OPERATIONS | |||
11/1/23-4/30/24 | 11/1/22-10/31/23 | ||
Net investment income | $5,587,628 | $9,844,122 | |
Net realized gains | 11,107,355 | 11,876,218 | |
Net change in unrealized appreciation (depreciation) | + | 18,254,426 | (2,087,434 ) |
Increase in net assets resulting from operations | $34,949,409 | $19,632,906 | |
DISTRIBUTIONS TO SHAREHOLDERS | |||
Total distributions | ($22,957,254 ) | ($21,994,178 ) | |
TRANSACTIONS IN FUND SHARES | |||||
11/1/23-4/30/24 | 11/1/22-10/31/23 | ||||
SHARES | VALUE | SHARES | VALUE | ||
Shares sold | 782,193 | $10,158,947 | 965,580 | $12,253,161 | |
Shares reinvested | 1,663,818 | 21,313,508 | 1,686,974 | 20,530,467 | |
Shares redeemed | + | (3,480,141 ) | (45,243,217 ) | (7,129,103 ) | (91,046,134 ) |
Net transactions in fund shares | (1,034,130 ) | ($13,770,762 ) | (4,476,549 ) | ($58,262,506 ) | |
SHARES OUTSTANDING AND NET ASSETS | |||||
11/1/23-4/30/24 | 11/1/22-10/31/23 | ||||
SHARES | NET ASSETS | SHARES | NET ASSETS | ||
Beginning of period | 26,108,522 | $323,339,435 | 30,585,071 | $383,963,213 | |
Total decrease | + | (1,034,130 ) | (1,778,607 ) | (4,476,549 ) | (60,623,778 ) |
End of period | 25,074,392 | $321,560,828 | 26,108,522 | $323,339,435 | |
11/1/23– 4/30/24* | 11/1/22– 10/31/23 | 11/1/21– 10/31/22 | 11/1/20– 10/31/21 | 11/1/19– 10/31/20 | 11/1/18– 10/31/19 | |
Per-Share Data | ||||||
Net asset value at beginning of period | $13.40 | $13.43 | $17.30 | $14.81 | $14.74 | $14.10 |
Income (loss) from investment operations: | ||||||
Net investment income (loss)1 | 0.24 | 0.35 | 0.27 | 0.22 | 0.31 | 0.30 |
Net realized and unrealized gains (losses) | 1.34 | 0.37 | (3.09 ) | 2.74 | 0.55 | 1.10 |
Total from investment operations | 1.58 | 0.72 | (2.82 ) | 2.96 | 0.86 | 1.40 |
Less distributions: | ||||||
Distributions from net investment income | (0.38 ) | (0.30 ) | (0.39 ) | (0.28 ) | (0.35 ) | (0.34 ) |
Distributions from net realized gains | (0.35 ) | (0.45 ) | (0.66 ) | (0.19 ) | (0.44 ) | (0.42 ) |
Total distributions | (0.73 ) | (0.75 ) | (1.05 ) | (0.47 ) | (0.79 ) | (0.76 ) |
Net asset value at end of period | $14.25 | $13.40 | $13.43 | $17.30 | $14.81 | $14.74 |
Total return | 11.85 %2 | 5.46 % | (17.39 %) | 20.25 % | 5.98 % | 10.79 % |
Ratios/Supplemental Data | ||||||
Ratios to average net assets: | ||||||
Net operating expenses3 | 0.00 %4 | 0.00 % | 0.00 %5 | 0.00 % | 0.00 % | 0.00 % |
Gross operating expenses3 | 0.02 %4 | 0.02 % | 0.03 %5 | 0.02 % | 0.02 % | 0.03 % |
Net investment income (loss) | 3.33 %4 | 2.53 % | 1.82 % | 1.33 % | 2.14 % | 2.10 % |
Portfolio turnover rate | 7 %2 | 10 % | 19 % | 16 % | 16 % | 15 % |
Net assets, end of period (x 1,000) | $450,730 | $445,714 | $494,852 | $662,236 | $571,738 | $577,095 |
* | Unaudited. |
1 | Calculated based on the average shares outstanding during the period. |
2 | Not annualized. |
3 | Ratio excludes acquired fund fees and expenses, which are indirect expenses incurred by the fund through its investments in underlying funds. |
4 | Annualized. |
5 | Ratio includes less than 0.005% of non-routine proxy expenses. |
SECURITY | VALUE AT 10/31/23 | PURCHASES | SALES | REALIZED GAINS (LOSSES) | NET CHANGE IN UNREALIZED APPRECIATION (DEPRECIATION) | VALUE AT 4/30/24 | BALANCE OF SHARES HELD AT 4/30/24 | DISTRIBUTIONS RECEIVED(a) |
AFFILIATED UNDERLYING FUNDS 74.2% OF NET ASSETS | ||||||||
U.S. Stocks 25.4% | ||||||||
Large-Cap 22.3% | ||||||||
Schwab Core Equity Fund | $11,017,365 | $334,698 | ($3,228,142 ) | $749,570 | $864,171 | $9,737,662 | 458,027 | $334,698 |
Schwab Fundamental US Large Company Index Fund | 9,970,719 | 207,275 | (762,531 ) | 90,767 | 1,607,187 | 11,113,417 | 438,919 | 207,275 |
Schwab S&P 500 Index Fund | 70,842,643 | 1,079,557 | (17,361,396 ) | 9,446,587 | 3,565,303 | 67,572,694 | 871,906 | 1,079,557 |
Schwab Select Large Cap Growth Fund * | 12,088,560 | 2,102,243 | (3,321,618 ) | (950,388 ) | 1,993,361 | 11,912,158 | 517,695 | 2,102,243 |
100,335,931 | ||||||||
Mid-Cap 1.4% | ||||||||
Schwab U.S. Mid-Cap Index Fund | 5,210,346 | 90,645 | — | — | 1,054,619 | 6,355,610 | 104,757 | 90,645 |
Small-Cap 1.7% | ||||||||
Schwab Small-Cap Equity Fund | 8,210,775 | 35,910 | (1,941,120 ) | 427,111 | 1,127,569 | 7,860,245 | 398,189 | 35,910 |
114,551,786 | ||||||||
International Stocks 11.9% | ||||||||
Developed Markets 11.9% | ||||||||
Schwab Fundamental International Large Company Index Fund | 2,897,948 | 103,559 | (467,311 ) | 18,844 | 329,322 | 2,882,362 | 267,133 | 103,559 |
Schwab International Core Equity Fund | 23,027,458 | 634,936 | (6,131,031 ) | 679,308 | 2,956,080 | 21,166,751 | 1,842,189 | 634,936 |
Schwab International Opportunities Fund | 29,379,192 | 978,512 | (5,210,451 ) | (642,853 ) | 4,838,455 | 29,342,855 | 1,467,143 | 578,513 |
53,391,968 | ||||||||
Real Estate 3.0% | ||||||||
Global Real Estate 3.0% | ||||||||
Schwab Global Real Estate Fund | 14,866,550 | 252,071 | (2,789,684 ) | (663,606 ) | 1,950,138 | 13,615,469 | 2,315,556 | 252,071 |
Fixed Income 32.4% | ||||||||
Inflation-Protected Bond 5.0% | ||||||||
Schwab Treasury Inflation Protected Securities Index Fund | 18,662,483 | 4,346,019 | (700,000 ) | (153,343 ) | 449,291 | 22,604,450 | 2,255,933 | 307,319 |
Intermediate-Term Bond 20.9% | ||||||||
Schwab U.S. Aggregate Bond Index Fund | 85,090,151 | 7,944,021 | (1,125,000 ) | (225,161 ) | 2,495,801 | 94,179,812 | 10,938,422 | 1,683,126 |
Short-Term Bond 6.5% | ||||||||
Schwab Short-Term Bond Index Fund | 26,893,365 | 3,778,937 | (1,570,000 ) | (103,623 ) | 246,448 | 29,245,127 | 3,117,817 | 530,439 |
146,029,389 | ||||||||
Money Market Funds 1.5% | ||||||||
Schwab Variable Share Price Money Fund, Ultra Shares, 5.27% (b) | 13,377,675 | 275,633 | (6,960,000 ) | 1,443 | (242 ) | 6,694,509 | 6,692,501 | 259,525 |
Total Affiliated Underlying Funds (Cost $282,250,876) | $331,535,230 | $22,164,016 | ($51,568,284 ) | $8,674,656 | $23,477,503 | $334,283,121 | $8,199,816 | |
SECURITY | VALUE AT 10/31/23 | PURCHASES | SALES | REALIZED GAINS (LOSSES) | NET CHANGE IN UNREALIZED APPRECIATION (DEPRECIATION) | VALUE AT 4/30/24 | BALANCE OF SHARES HELD AT 4/30/24 | DISTRIBUTIONS RECEIVED(a) |
UNAFFILIATED UNDERLYING FUNDS 25.4% OF NET ASSETS | ||||||||
U.S. Stocks 6.9% | ||||||||
Large-Cap 6.4% | ||||||||
ClearBridge Large Cap Growth Fund, Class IS * | $13,887,244 | 211,760 | ||||||
Dodge & Cox Stock Fund, Class I | 14,938,196 | 59,921 | ||||||
28,825,440 | ||||||||
Small-Cap 0.5% | ||||||||
ClearBridge Small Cap Growth Fund, Class IS * | 2,434,322 | 62,951 | ||||||
31,259,762 | ||||||||
International Stocks 0.1% | ||||||||
Emerging Markets 0.1% | ||||||||
Goldman Sachs Emerging Markets Equity Insights Fund, Institutional Class | 424,185 | 49,439 | ||||||
Fixed Income 18.4% | ||||||||
Intermediate-Term Bond 15.7% | ||||||||
Baird Aggregate Bond Fund, Institutional Class | 46,871,211 | 4,954,673 | ||||||
Loomis Sayles Investment Grade Bond Fund, Class Y | 7,792,016 | 813,363 | ||||||
Western Asset Core Plus Bond Fund, Class I | 16,148,619 | 1,792,300 | ||||||
70,811,846 | ||||||||
International Bond 2.7% | ||||||||
PIMCO International Bond Fund (U.S. Dollar-Hedged), Institutional Class | 12,086,118 | 1,234,537 | ||||||
82,897,964 | ||||||||
Total Unaffiliated Underlying Funds (Cost $115,671,206) | $114,581,911 | |||||||
Total Investments in Securities (Cost $397,922,082) | $448,865,032 | |||||||
* | Non-income producing security. |
(a) | Distributions received include distributions from net investment income and capital gains, if any, from the underlying funds. Amounts shown are only presented for affiliated underlying funds, which are presented in the corresponding line-item in the Statement of Operations, if applicable (see financial note 2(d) for additional information). |
(b) | The rate shown is the annualized 7-day yield. |
Assets | ||
Investments in securities, at value - affiliated issuers (cost $282,250,876) | $334,283,121 | |
Investments in securities, at value - unaffiliated issuers (cost $115,671,206) | 114,581,911 | |
Cash | 1,288,094 | |
Receivables: | ||
Investments sold | 800,000 | |
Dividends | 517,956 | |
Fund shares sold | 67,583 | |
Due from investment adviser | 7,874 | |
Prepaid expenses | + | 16,904 |
Total assets | 451,563,443 | |
Liabilities | ||
Payables: | ||
Investments bought | 504,141 | |
Fund shares redeemed | 294,620 | |
Independent trustees’ fees | 5 | |
Accrued expenses | + | 34,448 |
Total liabilities | 833,214 | |
Net assets | $450,730,229 | |
Net Assets by Source | ||
Capital received from investors | $388,391,044 | |
Total distributable earnings | + | 62,339,185 |
Net assets | $450,730,229 | |
Net Asset Value (NAV) | ||||
Net Assets | ÷ | Shares Outstanding | = | NAV |
$450,730,229 | 31,624,028 | $14.25 | ||
For the period November 1, 2023 through April 30, 2024; unaudited | ||
Investment Income | ||
Dividends received from securities - affiliated issuers | $5,882,557 | |
Dividends received from securities - unaffiliated issuers | 1,825,185 | |
Other interest | + | 26,020 |
Total investment income | 7,733,762 | |
Expenses | ||
Professional fees | 12,150 | |
Registration fees | 11,651 | |
Portfolio accounting fees | 11,396 | |
Shareholder reports | 5,958 | |
Independent trustees’ fees | 3,411 | |
Transfer agent fees | 2,695 | |
Other expenses | + | 2,491 |
Total expenses | 49,752 | |
Expense reduction | – | 49,752 |
Net expenses | – | — |
Net investment income | 7,733,762 | |
REALIZED AND UNREALIZED GAINS (LOSSES) | ||
Realized capital gain distributions received from underlying funds - affiliated issuers | 2,317,259 | |
Realized capital gain distributions received from underlying funds - unaffiliated issuers | 1,959,917 | |
Net realized gains on sales of securities - affiliated issuers | 8,674,656 | |
Net realized gains on sales of securities - unaffiliated issuers | + | 1,017,038 |
Net realized gains | 13,968,870 | |
Net change in unrealized appreciation (depreciation) on securities - affiliated issuers | 23,477,503 | |
Net change in unrealized appreciation (depreciation) on securities - unaffiliated issuers | + | 7,128,916 |
Net change in unrealized appreciation (depreciation) | + | 30,606,419 |
Net realized and unrealized gains | 44,575,289 | |
Increase in net assets resulting from operations | $52,309,051 | |
OPERATIONS | |||
11/1/23-4/30/24 | 11/1/22-10/31/23 | ||
Net investment income | $7,733,762 | $12,451,806 | |
Net realized gains | 13,968,870 | 9,700,474 | |
Net change in unrealized appreciation (depreciation) | + | 30,606,419 | 6,553,982 |
Increase in net assets resulting from operations | $52,309,051 | $28,706,262 | |
DISTRIBUTIONS TO SHAREHOLDERS | |||
Total distributions | ($23,623,785 ) | ($27,021,252 ) | |
TRANSACTIONS IN FUND SHARES | |||||
11/1/23-4/30/24 | 11/1/22-10/31/23 | ||||
SHARES | VALUE | SHARES | VALUE | ||
Shares sold | 1,218,708 | $17,522,747 | 1,826,540 | $25,160,840 | |
Shares reinvested | 1,558,816 | 22,135,186 | 1,957,997 | 25,630,179 | |
Shares redeemed | + | (4,410,385 ) | (63,327,133 ) | (7,373,494 ) | (101,613,524 ) |
Net transactions in fund shares | (1,632,861 ) | ($23,669,200 ) | (3,588,957 ) | ($50,822,505 ) | |
SHARES OUTSTANDING AND NET ASSETS | |||||
11/1/23-4/30/24 | 11/1/22-10/31/23 | ||||
SHARES | NET ASSETS | SHARES | NET ASSETS | ||
Beginning of period | 33,256,889 | $445,714,163 | 36,845,846 | $494,851,658 | |
Total increase (decrease) | + | (1,632,861 ) | 5,016,066 | (3,588,957 ) | (49,137,495 ) |
End of period | 31,624,028 | $450,730,229 | 33,256,889 | $445,714,163 | |
11/1/23– 4/30/24* | 11/1/22– 10/31/23 | 11/1/21– 10/31/22 | 11/1/20– 10/31/21 | 11/1/19– 10/31/20 | 11/1/18– 10/31/19 | |
Per-Share Data | ||||||
Net asset value at beginning of period | $14.36 | $14.39 | $18.88 | $15.67 | $15.79 | $15.24 |
Income (loss) from investment operations: | ||||||
Net investment income (loss)1 | 0.25 | 0.33 | 0.27 | 0.22 | 0.33 | 0.30 |
Net realized and unrealized gains (losses) | 1.75 | 0.58 | (3.53 ) | 3.54 | 0.57 | 1.21 |
Total from investment operations | 2.00 | 0.91 | (3.26 ) | 3.76 | 0.90 | 1.51 |
Less distributions: | ||||||
Distributions from net investment income | (0.37 ) | (0.29 ) | (0.45 ) | (0.27 ) | (0.37 ) | (0.37 ) |
Distributions from net realized gains | (0.30 ) | (0.65 ) | (0.78 ) | (0.28 ) | (0.65 ) | (0.59 ) |
Total distributions | (0.67 ) | (0.94 ) | (1.23 ) | (0.55 ) | (1.02 ) | (0.96 ) |
Net asset value at end of period | $15.69 | $14.36 | $14.39 | $18.88 | $15.67 | $15.79 |
Total return | 13.93 %2 | 6.52 % | (18.51 %) | 24.38 % | 5.81 % | 10.94 % |
Ratios/Supplemental Data | ||||||
Ratios to average net assets: | ||||||
Net operating expenses3 | 0.00 %4 | 0.00 % | 0.00 %5 | 0.00 % | 0.00 % | 0.00 % |
Gross operating expenses3 | 0.01 %4 | 0.01 % | 0.02 %5 | 0.01 % | 0.02 % | 0.02 % |
Net investment income (loss) | 3.22 %4 | 2.26 % | 1.65 % | 1.21 % | 2.15 % | 2.00 % |
Portfolio turnover rate | 7 %2 | 9 % | 16 % | 14 % | 13 % | 17 % |
Net assets, end of period (x 1,000) | $953,102 | $884,929 | $901,007 | $1,166,390 | $965,288 | $998,681 |
* | Unaudited. |
1 | Calculated based on the average shares outstanding during the period. |
2 | Not annualized. |
3 | Ratio excludes acquired fund fees and expenses, which are indirect expenses incurred by the fund through its investments in underlying funds. |
4 | Annualized. |
5 | Ratio includes less than 0.005% of non-routine proxy expenses. |
SECURITY | VALUE AT 10/31/23 | PURCHASES | SALES | REALIZED GAINS (LOSSES) | NET CHANGE IN UNREALIZED APPRECIATION (DEPRECIATION) | VALUE AT 4/30/24 | BALANCE OF SHARES HELD AT 4/30/24 | DISTRIBUTIONS RECEIVED(a) |
AFFILIATED UNDERLYING FUNDS 72.9% OF NET ASSETS | ||||||||
U.S. Stocks 31.6% | ||||||||
Large-Cap 27.4% | ||||||||
Schwab Core Equity Fund | $30,597,308 | $921,469 | ($5,295,266 ) | $1,227,581 | $3,358,860 | $30,809,952 | 1,449,198 | $921,469 |
Schwab Fundamental US Large Company Index Fund | 22,808,021 | 474,142 | — | — | 3,859,102 | 27,141,265 | 1,071,930 | 474,142 |
Schwab S&P 500 Index Fund | 163,455,782 | 2,574,955 | (28,022,617 ) | 14,400,751 | 16,222,196 | 168,631,067 | 2,175,885 | 2,574,955 |
Schwab Select Large Cap Growth Fund * | 35,523,998 | 6,129,004 | (9,859,158 ) | (2,595,487 ) | 5,647,892 | 34,846,249 | 1,514,396 | 6,129,004 |
261,428,533 | ||||||||
Mid-Cap 1.5% | ||||||||
Schwab U.S. Mid-Cap Index Fund | 11,573,644 | 201,347 | — | — | 2,342,605 | 14,117,596 | 232,695 | 201,347 |
Small-Cap 2.7% | ||||||||
Schwab Small-Cap Equity Fund | 24,722,458 | 108,124 | (4,397,976 ) | 911,131 | 3,870,471 | 25,214,208 | 1,277,315 | 108,124 |
300,760,337 | ||||||||
International Stocks 16.0% | ||||||||
Developed Markets 16.0% | ||||||||
Schwab Fundamental International Large Company Index Fund | 7,671,890 | 274,156 | (870,843 ) | 32,175 | 905,485 | 8,012,863 | 742,619 | 274,156 |
Schwab International Core Equity Fund | 57,973,490 | 1,709,157 | (8,487,202 ) | 790,025 | 8,766,465 | 60,751,935 | 5,287,375 | 1,709,157 |
Schwab International Opportunities Fund | 74,970,383 | 1,476,261 | (3,729,286 ) | (581,735 ) | 11,431,870 | 83,567,493 | 4,178,375 | 1,476,261 |
152,332,291 | ||||||||
Real Estate 4.0% | ||||||||
Global Real Estate 4.0% | ||||||||
Schwab Global Real Estate Fund | 35,934,062 | 659,148 | (1,200,000 ) | (369,076 ) | 3,224,609 | 38,248,743 | 6,504,888 | 659,148 |
Fixed Income 20.3% | ||||||||
Inflation-Protected Bond 1.8% | ||||||||
Schwab Treasury Inflation Protected Securities Index Fund | 12,655,801 | 4,902,468 | — | — | 168,023 | 17,726,292 | 1,769,091 | 229,716 |
Intermediate-Term Bond 14.2% | ||||||||
Schwab U.S. Aggregate Bond Index Fund | 115,450,990 | 18,068,390 | (1,100,000 ) | (259,507 ) | 3,103,212 | 135,263,085 | 15,709,998 | 2,364,019 |
Short-Term Bond 4.3% | ||||||||
Schwab Short-Term Bond Index Fund | 35,929,245 | 7,116,386 | (2,600,000 ) | (166,267 ) | 322,488 | 40,601,852 | 4,328,556 | 727,561 |
193,591,229 | ||||||||
Money Market Funds 1.0% | ||||||||
Schwab Variable Share Price Money Fund, Ultra Shares, 5.27% (b) | 18,056,147 | 393,431 | (8,670,000 ) | 2,094 | (404 ) | 9,781,268 | 9,778,335 | 373,410 |
Total Affiliated Underlying Funds (Cost $528,307,905) | $647,323,219 | $45,008,438 | ($74,232,348 ) | $13,391,685 | $63,222,874 | $694,713,868 | $18,222,469 | |
SECURITY | VALUE AT 10/31/23 | PURCHASES | SALES | REALIZED GAINS (LOSSES) | NET CHANGE IN UNREALIZED APPRECIATION (DEPRECIATION) | VALUE AT 4/30/24 | BALANCE OF SHARES HELD AT 4/30/24 | DISTRIBUTIONS RECEIVED(a) |
UNAFFILIATED UNDERLYING FUNDS 26.7% OF NET ASSETS | ||||||||
U.S. Stocks 8.9% | ||||||||
Large-Cap 8.0% | ||||||||
ClearBridge Large Cap Growth Fund, Class IS * | $34,882,086 | 531,901 | ||||||
Dodge & Cox Stock Fund, Class I | 41,525,307 | 166,568 | ||||||
76,407,393 | ||||||||
Small-Cap 0.9% | ||||||||
ClearBridge Small Cap Growth Fund, Class IS * | 8,541,390 | 220,879 | ||||||
84,948,783 | ||||||||
International Stocks 1.0% | ||||||||
Emerging Markets 1.0% | ||||||||
Goldman Sachs Emerging Markets Equity Insights Fund, Institutional Class | 9,494,994 | 1,106,643 | ||||||
Fixed Income 16.8% | ||||||||
Intermediate-Term Bond 12.8% | ||||||||
Baird Aggregate Bond Fund, Institutional Class | 60,361,538 | 6,380,712 | ||||||
Loomis Sayles Investment Grade Bond Fund, Class Y | 24,590,816 | 2,566,891 | ||||||
Western Asset Core Plus Bond Fund, Class I | 36,961,747 | 4,102,303 | ||||||
121,914,101 | ||||||||
International Bond 4.0% | ||||||||
PIMCO International Bond Fund (U.S. Dollar-Hedged), Institutional Class | 37,973,843 | 3,878,840 | ||||||
159,887,944 | ||||||||
Total Unaffiliated Underlying Funds (Cost $251,115,298) | $254,331,721 | |||||||
Total Investments in Securities (Cost $779,423,203) | $949,045,589 | |||||||
* | Non-income producing security. |
(a) | Distributions received include distributions from net investment income and capital gains, if any, from the underlying funds. Amounts shown are only presented for affiliated underlying funds, which are presented in the corresponding line-item in the Statement of Operations, if applicable (see financial note 2(d) for additional information). |
(b) | The rate shown is the annualized 7-day yield. |
Assets | ||
Investments in securities, at value - affiliated issuers (cost $528,307,905) | $694,713,868 | |
Investments in securities, at value - unaffiliated issuers (cost $251,115,298) | 254,331,721 | |
Cash | 2,499,481 | |
Receivables: | ||
Investments sold | 2,100,000 | |
Dividends | 872,849 | |
Fund shares sold | 111,585 | |
Due from investment adviser | 9,706 | |
Prepaid expenses | + | 12,401 |
Total assets | 954,651,611 | |
Liabilities | ||
Payables: | ||
Investments bought | 854,022 | |
Fund shares redeemed | 652,927 | |
Independent trustees’ fees | 15 | |
Accrued expenses | + | 43,124 |
Total liabilities | 1,550,088 | |
Net assets | $953,101,523 | |
Net Assets by Source | ||
Capital received from investors | $761,857,716 | |
Total distributable earnings | + | 191,243,807 |
Net assets | $953,101,523 | |
Net Asset Value (NAV) | ||||
Net Assets | ÷ | Shares Outstanding | = | NAV |
$953,101,523 | 60,750,577 | $15.69 | ||
For the period November 1, 2023 through April 30, 2024; unaudited | ||
Investment Income | ||
Dividends received from securities - affiliated issuers | $11,501,500 | |
Dividends received from securities - unaffiliated issuers | 3,926,271 | |
Other interest | + | 56,833 |
Total investment income | 15,484,604 | |
Expenses | ||
Registration fees | 14,594 | |
Professional fees | 12,919 | |
Portfolio accounting fees | 12,886 | |
Shareholder reports | 11,388 | |
Independent trustees’ fees | 3,917 | |
Transfer agent fees | 1,285 | |
Other expenses | + | 3,884 |
Total expenses | 60,873 | |
Expense reduction | – | 60,873 |
Net expenses | – | — |
Net investment income | 15,484,604 | |
REALIZED AND UNREALIZED GAINS (LOSSES) | ||
Realized capital gain distributions received from underlying funds - affiliated issuers | 6,720,969 | |
Realized capital gain distributions received from underlying funds - unaffiliated issuers | 4,925,762 | |
Net realized gains on sales of securities - affiliated issuers | 13,391,685 | |
Net realized gains on sales of securities - unaffiliated issuers | + | 1,406,286 |
Net realized gains | 26,444,702 | |
Net change in unrealized appreciation (depreciation) on securities - affiliated issuers | 63,222,874 | |
Net change in unrealized appreciation (depreciation) on securities - unaffiliated issuers | + | 17,619,212 |
Net change in unrealized appreciation (depreciation) | + | 80,842,086 |
Net realized and unrealized gains | 107,286,788 | |
Increase in net assets resulting from operations | $122,771,392 | |
OPERATIONS | |||
11/1/23-4/30/24 | 11/1/22-10/31/23 | ||
Net investment income | $15,484,604 | $21,227,359 | |
Net realized gains | 26,444,702 | 15,564,500 | |
Net change in unrealized appreciation (depreciation) | + | 80,842,086 | 23,329,152 |
Increase in net assets resulting from operations | $122,771,392 | $60,121,011 | |
DISTRIBUTIONS TO SHAREHOLDERS | |||
Total distributions | ($40,462,010 ) | ($57,998,012 ) | |
TRANSACTIONS IN FUND SHARES | |||||
11/1/23-4/30/24 | 11/1/22-10/31/23 | ||||
SHARES | VALUE | SHARES | VALUE | ||
Shares sold | 2,981,887 | $46,674,139 | 3,870,873 | $57,220,365 | |
Shares reinvested | 2,477,182 | 38,421,086 | 3,996,448 | 55,590,589 | |
Shares redeemed | + | (6,327,342 ) | (99,231,738 ) | (8,851,702 ) | (131,012,136 ) |
Net transactions in fund shares | (868,273 ) | ($14,136,513 ) | (984,381 ) | ($18,201,182 ) | |
SHARES OUTSTANDING AND NET ASSETS | |||||
11/1/23-4/30/24 | 11/1/22-10/31/23 | ||||
SHARES | NET ASSETS | SHARES | NET ASSETS | ||
Beginning of period | 61,618,850 | $884,928,654 | 62,603,231 | $901,006,837 | |
Total increase (decrease) | + | (868,273 ) | 68,172,869 | (984,381 ) | (16,078,183 ) |
End of period | 60,750,577 | $953,101,523 | 61,618,850 | $884,928,654 | |
11/1/23– 4/30/24* | 11/1/22– 10/31/23 | 11/1/21– 10/31/22 | 11/1/20– 10/31/21 | 11/1/19– 10/31/20 | 11/1/18– 10/31/19 | |
Per-Share Data | ||||||
Net asset value at beginning of period | $14.49 | $14.51 | $19.05 | $15.34 | $15.46 | $14.94 |
Income (loss) from investment operations: | ||||||
Net investment income (loss)1 | 0.25 | 0.31 | 0.25 | 0.20 | 0.31 | 0.28 |
Net realized and unrealized gains (losses) | 1.97 | 0.70 | (3.73 ) | 3.99 | 0.53 | 1.19 |
Total from investment operations | 2.22 | 1.01 | (3.48 ) | 4.19 | 0.84 | 1.47 |
Less distributions: | ||||||
Distributions from net investment income | (0.34 ) | (0.27 ) | (0.48 ) | (0.24 ) | (0.34 ) | (0.36 ) |
Distributions from net realized gains | (0.20 ) | (0.76 ) | (0.58 ) | (0.24 ) | (0.62 ) | (0.59 ) |
Total distributions | (0.54 ) | (1.03 ) | (1.06 ) | (0.48 ) | (0.96 ) | (0.95 ) |
Net asset value at end of period | $16.17 | $14.49 | $14.51 | $19.05 | $15.34 | $15.46 |
Total return | 15.40 %2 | 7.22 % | (19.41 %) | 27.76 % | 5.51 % | 10.90 % |
Ratios/Supplemental Data | ||||||
Ratios to average net assets: | ||||||
Net operating expenses3 | 0.00 %4 | 0.00 % | 0.00 %5 | 0.00 % | 0.00 % | 0.00 % |
Gross operating expenses3 | 0.02 %4 | 0.02 % | 0.03 %5 | 0.02 % | 0.03 % | 0.03 % |
Net investment income (loss) | 3.13 %4 | 2.06 % | 1.55 % | 1.11 % | 2.06 % | 1.87 % |
Portfolio turnover rate | 6 %2 | 10 % | 13 % | 14 % | 12 % | 15 % |
Net assets, end of period (x 1,000) | $565,772 | $498,614 | $482,594 | $612,195 | $476,911 | $483,191 |
* | Unaudited. |
1 | Calculated based on the average shares outstanding during the period. |
2 | Not annualized. |
3 | Ratio excludes acquired fund fees and expenses, which are indirect expenses incurred by the fund through its investments in underlying funds. |
4 | Annualized. |
5 | Ratio includes less than 0.005% of non-routine proxy expenses. |
SECURITY | VALUE AT 10/31/23 | PURCHASES | SALES | REALIZED GAINS (LOSSES) | NET CHANGE IN UNREALIZED APPRECIATION (DEPRECIATION) | VALUE AT 4/30/24 | BALANCE OF SHARES HELD AT 4/30/24 | DISTRIBUTIONS RECEIVED(a) |
AFFILIATED UNDERLYING FUNDS 72.9% OF NET ASSETS | ||||||||
U.S. Stocks 36.0% | ||||||||
Large-Cap 30.9% | ||||||||
Schwab Core Equity Fund | $19,214,257 | $586,798 | ($2,372,941 ) | $219,628 | $2,698,512 | $20,346,254 | 957,020 | $586,798 |
Schwab Fundamental US Large Company Index Fund | 21,285,325 | 442,488 | (2,620,633 ) | 234,073 | 3,317,775 | 22,659,028 | 894,906 | 442,488 |
Schwab S&P 500 Index Fund | 95,209,261 | 1,532,017 | (8,212,125 ) | 2,069,486 | 16,124,168 | 106,722,807 | 1,377,068 | 1,532,017 |
Schwab Select Large Cap Growth Fund * | 23,044,554 | 4,048,250 | (3,759,032 ) | (1,023,114 ) | 3,060,731 | 25,371,389 | 1,102,624 | 4,048,250 |
175,099,478 | ||||||||
Mid-Cap 1.7% | ||||||||
Schwab U.S. Mid-Cap Index Fund | 7,830,282 | 136,223 | — | — | 1,584,917 | 9,551,422 | 157,432 | 136,223 |
Small-Cap 3.4% | ||||||||
Schwab Small-Cap Equity Fund | 16,703,087 | 73,050 | (889,334 ) | 129,971 | 3,085,778 | 19,102,552 | 967,708 | 73,050 |
203,753,452 | ||||||||
International Stocks 18.9% | ||||||||
Developed Markets 18.9% | ||||||||
Schwab Fundamental International Large Company Index Fund | 4,885,973 | 174,601 | — | — | 621,302 | 5,681,876 | 526,587 | 174,601 |
Schwab International Core Equity Fund | 38,431,082 | 1,133,015 | (3,420,799 ) | 287,207 | 6,184,248 | 42,614,753 | 3,708,856 | 1,133,015 |
Schwab International Opportunities Fund | 50,227,617 | 989,044 | — | — | 7,240,363 | 58,457,024 | 2,922,851 | 989,044 |
106,753,653 | ||||||||
Real Estate 4.6% | ||||||||
Global Real Estate 4.6% | ||||||||
Schwab Global Real Estate Fund | 23,523,708 | 435,919 | — | — | 1,831,005 | 25,790,632 | 4,386,162 | 435,919 |
Fixed Income 12.7% | ||||||||
Intermediate-Term Bond 9.7% | ||||||||
Schwab U.S. Aggregate Bond Index Fund | 45,364,622 | 8,685,111 | — | — | 1,054,684 | 55,104,417 | 6,400,048 | 944,651 |
Short-Term Bond 3.0% | ||||||||
Schwab Short-Term Bond Index Fund | 14,351,870 | 2,613,612 | — | — | 67,370 | 17,032,852 | 1,815,869 | 295,556 |
72,137,269 | ||||||||
Money Market Funds 0.7% | ||||||||
Schwab Variable Share Price Money Fund, Ultra Shares, 5.27% (b) | 7,366,320 | 159,706 | (3,610,000 ) | 477 | 227 | 3,916,730 | 3,915,555 | 151,368 |
Total Affiliated Underlying Funds (Cost $322,597,236) | $367,437,958 | $21,009,834 | ($24,884,864 ) | $1,917,728 | $46,871,080 | $412,351,736 | $10,942,980 | |
SECURITY | VALUE AT 10/31/23 | PURCHASES | SALES | REALIZED GAINS (LOSSES) | NET CHANGE IN UNREALIZED APPRECIATION (DEPRECIATION) | VALUE AT 4/30/24 | BALANCE OF SHARES HELD AT 4/30/24 | DISTRIBUTIONS RECEIVED(a) |
UNAFFILIATED UNDERLYING FUNDS 26.6% OF NET ASSETS | ||||||||
U.S. Stocks 10.3% | ||||||||
Large-Cap 9.3% | ||||||||
ClearBridge Large Cap Growth Fund, Class IS * | $24,809,304 | 378,306 | ||||||
Dodge & Cox Stock Fund, Class I | 27,679,828 | 111,030 | ||||||
52,489,132 | ||||||||
Small-Cap 1.0% | ||||||||
ClearBridge Small Cap Growth Fund, Class IS * | 5,979,549 | 154,630 | ||||||
58,468,681 | ||||||||
International Stocks 1.9% | ||||||||
Emerging Markets 1.9% | ||||||||
Goldman Sachs Emerging Markets Equity Insights Fund, Institutional Class | 10,888,392 | 1,269,043 | ||||||
Fixed Income 14.4% | ||||||||
Intermediate-Term Bond 10.3% | ||||||||
Baird Aggregate Bond Fund, Institutional Class | 22,423,710 | 2,370,371 | ||||||
Loomis Sayles Investment Grade Bond Fund, Class Y | 16,300,242 | 1,701,487 | ||||||
Western Asset Core Plus Bond Fund, Class I | 19,763,752 | 2,193,535 | ||||||
58,487,704 | ||||||||
International Bond 4.1% | ||||||||
PIMCO International Bond Fund (U.S. Dollar-Hedged), Institutional Class | 23,027,602 | 2,352,155 | ||||||
81,515,306 | ||||||||
Total Unaffiliated Underlying Funds (Cost $147,042,749) | $150,872,379 | |||||||
Total Investments in Securities (Cost $469,639,985) | $563,224,115 | |||||||
* | Non-income producing security. |
(a) | Distributions received include distributions from net investment income and capital gains, if any, from the underlying funds. Amounts shown are only presented for affiliated underlying funds, which are presented in the corresponding line-item in the Statement of Operations, if applicable (see financial note 2(d) for additional information). |
(b) | The rate shown is the annualized 7-day yield. |
Assets | ||
Investments in securities, at value - affiliated issuers (cost $322,597,236) | $412,351,736 | |
Investments in securities, at value - unaffiliated issuers (cost $147,042,749) | 150,872,379 | |
Cash | 2,619,589 | |
Receivables: | ||
Dividends | 399,711 | |
Fund shares sold | 113,933 | |
Due from investment adviser | 8,836 | |
Prepaid expenses | + | 18,621 |
Total assets | 566,384,805 | |
Liabilities | ||
Payables: | ||
Investments bought | 392,676 | |
Fund shares redeemed | 185,027 | |
Accrued expenses | + | 35,150 |
Total liabilities | 612,853 | |
Net assets | $565,771,952 | |
Net Assets by Source | ||
Capital received from investors | $464,138,058 | |
Total distributable earnings | + | 101,633,894 |
Net assets | $565,771,952 | |
Net Asset Value (NAV) | ||||
Net Assets | ÷ | Shares Outstanding | = | NAV |
$565,771,952 | 34,983,134 | $16.17 | ||
For the period November 1, 2023 through April 30, 2024; unaudited | ||
Investment Income | ||
Dividends received from securities - affiliated issuers | $6,517,763 | |
Dividends received from securities - unaffiliated issuers | 2,188,995 | |
Other interest | + | 34,531 |
Total investment income | 8,741,289 | |
Expenses | ||
Registration fees | 14,150 | |
Professional fees | 12,217 | |
Portfolio accounting fees | 11,538 | |
Shareholder reports | 7,158 | |
Independent trustees’ fees | 3,469 | |
Transfer agent fees | 3,185 | |
Other expenses | + | 2,623 |
Total expenses | 54,340 | |
Expense reduction | – | 54,340 |
Net expenses | – | — |
Net investment income | 8,741,289 | |
REALIZED AND UNREALIZED GAINS (LOSSES) | ||
Realized capital gain distributions received from underlying funds - affiliated issuers | 4,425,217 | |
Realized capital gain distributions received from underlying funds - unaffiliated issuers | 3,185,611 | |
Net realized gains on sales of securities - affiliated issuers | 1,917,728 | |
Net realized losses on sales of securities - unaffiliated issuers | + | (229,162 ) |
Net realized gains | 9,299,394 | |
Net change in unrealized appreciation (depreciation) on securities - affiliated issuers | 46,871,080 | |
Net change in unrealized appreciation (depreciation) on securities - unaffiliated issuers | + | 11,955,090 |
Net change in unrealized appreciation (depreciation) | + | 58,826,170 |
Net realized and unrealized gains | 68,125,564 | |
Increase in net assets resulting from operations | $76,866,853 | |
OPERATIONS | |||
11/1/23-4/30/24 | 11/1/22-10/31/23 | ||
Net investment income | $8,741,289 | $10,668,180 | |
Net realized gains | 9,299,394 | 6,150,686 | |
Net change in unrealized appreciation (depreciation) | + | 58,826,170 | 18,167,515 |
Increase in net assets resulting from operations | $76,866,853 | $34,986,381 | |
DISTRIBUTIONS TO SHAREHOLDERS | |||
Total distributions | ($18,716,572 ) | ($33,982,796 ) | |
TRANSACTIONS IN FUND SHARES | |||||
11/1/23-4/30/24 | 11/1/22-10/31/23 | ||||
SHARES | VALUE | SHARES | VALUE | ||
Shares sold | 1,823,503 | $29,252,414 | 3,295,271 | $49,254,475 | |
Shares reinvested | 1,135,743 | 18,046,967 | 2,360,849 | 32,957,455 | |
Shares redeemed | + | (2,379,714 ) | (38,292,172 ) | (4,502,542 ) | (67,194,797 ) |
Net transactions in fund shares | 579,532 | $9,007,209 | 1,153,578 | $15,017,133 | |
SHARES OUTSTANDING AND NET ASSETS | |||||
11/1/23-4/30/24 | 11/1/22-10/31/23 | ||||
SHARES | NET ASSETS | SHARES | NET ASSETS | ||
Beginning of period | 34,403,602 | $498,614,462 | 33,250,024 | $482,593,744 | |
Total increase | + | 579,532 | 67,157,490 | 1,153,578 | 16,020,718 |
End of period | 34,983,134 | $565,771,952 | 34,403,602 | $498,614,462 | |
11/1/23– 4/30/24* | 11/1/22– 10/31/23 | 11/1/21– 10/31/22 | 11/1/20– 10/31/21 | 11/1/19– 10/31/20 | 11/1/18– 10/31/19 | |
Per-Share Data | ||||||
Net asset value at beginning of period | $15.26 | $15.33 | $20.52 | $16.24 | $16.61 | $16.27 |
Income (loss) from investment operations: | ||||||
Net investment income (loss)1 | 0.26 | 0.30 | 0.26 | 0.20 | 0.32 | 0.28 |
Net realized and unrealized gains (losses) | 2.25 | 0.84 | (4.10 ) | 4.68 | 0.56 | 1.28 |
Total from investment operations | 2.51 | 1.14 | (3.84 ) | 4.88 | 0.88 | 1.56 |
Less distributions: | ||||||
Distributions from net investment income | (0.34 ) | (0.27 ) | (0.54 ) | (0.24 ) | (0.35 ) | (0.39 ) |
Distributions from net realized gains | (0.30 ) | (0.94 ) | (0.81 ) | (0.36 ) | (0.90 ) | (0.83 ) |
Total distributions | (0.64 ) | (1.21 ) | (1.35 ) | (0.60 ) | (1.25 ) | (1.22 ) |
Net asset value at end of period | $17.13 | $15.26 | $15.33 | $20.52 | $16.24 | $16.61 |
Total return | 16.54 %2 | 7.79 % | (20.10 %) | 30.57 % | 5.31 % | 10.90 % |
Ratios/Supplemental Data | ||||||
Ratios to average net assets: | ||||||
Net operating expenses3 | 0.00 %4 | 0.00 % | 0.00 %5 | 0.00 % | 0.00 % | 0.00 % |
Gross operating expenses3 | 0.01 %4 | 0.01 % | 0.02 %5 | 0.01 % | 0.02 % | 0.02 % |
Net investment income (loss) | 3.05 %4 | 1.90 % | 1.49 % | 1.05 % | 2.01 % | 1.78 % |
Portfolio turnover rate | 6 %2 | 9 % | 10 % | 14 % | 10 % | 15 % |
Net assets, end of period (x 1,000) | $1,106,202 | $981,571 | $959,722 | $1,235,538 | $985,325 | $1,011,558 |
* | Unaudited. |
1 | Calculated based on the average shares outstanding during the period. |
2 | Not annualized. |
3 | Ratio excludes acquired fund fees and expenses, which are indirect expenses incurred by the fund through its investments in underlying funds. |
4 | Annualized. |
5 | Ratio includes less than 0.005% of non-routine proxy expenses. |
SECURITY | VALUE AT 10/31/23 | PURCHASES | SALES | REALIZED GAINS (LOSSES) | NET CHANGE IN UNREALIZED APPRECIATION (DEPRECIATION) | VALUE AT 4/30/24 | BALANCE OF SHARES HELD AT 4/30/24 | DISTRIBUTIONS RECEIVED(a) |
AFFILIATED UNDERLYING FUNDS 74.1% OF NET ASSETS | ||||||||
U.S. Stocks 39.1% | ||||||||
Large-Cap 33.3% | ||||||||
Schwab Core Equity Fund | $42,905,831 | $1,348,801 | ($6,622,229 ) | $848,791 | $5,531,737 | $44,012,931 | 2,070,223 | $1,348,801 |
Schwab Fundamental US Large Company Index Fund | 42,471,374 | 882,911 | — | — | 7,186,128 | 50,540,413 | 1,996,067 | 882,911 |
Schwab S&P 500 Index Fund | 196,624,321 | 3,163,889 | (22,311,143 ) | 8,602,348 | 28,821,762 | 214,901,177 | 2,772,918 | 3,163,889 |
Schwab Select Large Cap Growth Fund * | 55,208,972 | 9,736,058 | (10,527,810 ) | (2,783,259 ) | 7,500,500 | 59,134,461 | 2,569,946 | 9,736,058 |
368,588,982 | ||||||||
Mid-Cap 1.7% | ||||||||
Schwab U.S. Mid-Cap Index Fund | 15,551,496 | 270,550 | — | — | 3,147,756 | 18,969,802 | 312,672 | 270,550 |
Small-Cap 4.1% | ||||||||
Schwab Small-Cap Equity Fund | 38,654,439 | 169,056 | (781,389 ) | 106,972 | 7,237,114 | 45,386,192 | 2,299,199 | 169,056 |
432,944,976 | ||||||||
International Stocks 21.4% | ||||||||
Developed Markets 21.4% | ||||||||
Schwab Fundamental International Large Company Index Fund | 10,780,472 | 385,242 | — | — | 1,370,848 | 12,536,562 | 1,161,869 | 385,242 |
Schwab International Core Equity Fund | 84,354,423 | 2,486,912 | (2,435,073 ) | 86,913 | 14,155,091 | 98,648,266 | 8,585,576 | 2,486,912 |
Schwab International Opportunities Fund | 107,881,670 | 2,124,325 | — | — | 15,551,254 | 125,557,249 | 6,277,862 | 2,124,325 |
236,742,077 | ||||||||
Real Estate 4.9% | ||||||||
Global Real Estate 4.9% | ||||||||
Schwab Global Real Estate Fund | 48,984,436 | 907,734 | — | — | 3,812,781 | 53,704,951 | 9,133,495 | 907,734 |
Fixed Income 8.3% | ||||||||
Intermediate-Term Bond 6.3% | ||||||||
Schwab U.S. Aggregate Bond Index Fund | 59,127,698 | 10,317,673 | (1,000,000 ) | (249,710 ) | 1,662,045 | 69,857,706 | 8,113,555 | 1,199,454 |
Short-Term Bond 2.0% | ||||||||
Schwab Short-Term Bond Index Fund | 18,999,539 | 4,226,033 | (1,000,000 ) | (69,516 ) | 143,734 | 22,299,790 | 2,377,376 | 380,026 |
92,157,496 | ||||||||
Money Market Funds 0.4% | ||||||||
Schwab Variable Share Price Money Fund, Ultra Shares, 5.27% (b) | 8,510,295 | 188,579 | (3,800,000 ) | 1,030 | (290 ) | 4,899,614 | 4,898,145 | 179,812 |
Total Affiliated Underlying Funds (Cost $586,900,712) | $730,054,966 | $36,207,763 | ($48,477,644 ) | $6,543,569 | $96,120,460 | $820,449,114 | $23,234,770 | |
SECURITY | VALUE AT 10/31/23 | PURCHASES | SALES | REALIZED GAINS (LOSSES) | NET CHANGE IN UNREALIZED APPRECIATION (DEPRECIATION) | VALUE AT 4/30/24 | BALANCE OF SHARES HELD AT 4/30/24 | DISTRIBUTIONS RECEIVED(a) |
UNAFFILIATED UNDERLYING FUNDS 25.4% OF NET ASSETS | ||||||||
U.S. Stocks 11.7% | ||||||||
Large-Cap 10.4% | ||||||||
ClearBridge Large Cap Growth Fund, Class IS * | $52,979,350 | 807,858 | ||||||
Dodge & Cox Stock Fund, Class I | 61,566,984 | 246,959 | ||||||
114,546,334 | ||||||||
Small-Cap 1.3% | ||||||||
ClearBridge Small Cap Growth Fund, Class IS * | 14,533,517 | 375,834 | ||||||
129,079,851 | ||||||||
International Stocks 2.8% | ||||||||
Emerging Markets 2.8% | ||||||||
Goldman Sachs Emerging Markets Equity Insights Fund, Institutional Class | 31,044,948 | 3,618,292 | ||||||
Fixed Income 10.9% | ||||||||
Intermediate-Term Bond 7.9% | ||||||||
Baird Aggregate Bond Fund, Institutional Class | 30,216,395 | 3,194,122 | ||||||
Loomis Sayles Investment Grade Bond Fund, Class Y | 32,448,483 | 3,387,107 | ||||||
Western Asset Core Plus Bond Fund, Class I | 25,109,042 | 2,786,797 | ||||||
87,773,920 | ||||||||
International Bond 3.0% | ||||||||
PIMCO International Bond Fund (U.S. Dollar-Hedged), Institutional Class | 32,795,095 | 3,349,857 | ||||||
120,569,015 | ||||||||
Total Unaffiliated Underlying Funds (Cost $266,679,700) | $280,693,814 | |||||||
Total Investments in Securities (Cost $853,580,412) | $1,101,142,928 | |||||||
* | Non-income producing security. |
(a) | Distributions received include distributions from net investment income and capital gains, if any, from the underlying funds. Amounts shown are only presented for affiliated underlying funds, which are presented in the corresponding line-item in the Statement of Operations, if applicable (see financial note 2(d) for additional information). |
(b) | The rate shown is the annualized 7-day yield. |
Assets | ||
Investments in securities, at value - affiliated issuers (cost $586,900,712) | $820,449,114 | |
Investments in securities, at value - unaffiliated issuers (cost $266,679,700) | 280,693,814 | |
Cash | 4,778,341 | |
Receivables: | ||
Dividends | 522,214 | |
Fund shares sold | 404,335 | |
Due from investment adviser | 10,827 | |
Prepaid expenses | + | 11,604 |
Total assets | 1,106,870,249 | |
Liabilities | ||
Payables: | ||
Investments bought | 513,452 | |
Fund shares redeemed | 105,187 | |
Independent trustees’ fees | 1 | |
Accrued expenses | + | 49,742 |
Total liabilities | 668,382 | |
Net assets | $1,106,201,867 | |
Net Assets by Source | ||
Capital received from investors | $841,326,061 | |
Total distributable earnings | + | 264,875,806 |
Net assets | $1,106,201,867 | |
Net Asset Value (NAV) | ||||
Net Assets | ÷ | Shares Outstanding | = | NAV |
$1,106,201,867 | 64,566,698 | $17.13 | ||
For the period November 1, 2023 through April 30, 2024; unaudited | ||
Investment Income | ||
Dividends received from securities - affiliated issuers | $12,632,224 | |
Dividends received from securities - unaffiliated issuers | 3,967,253 | |
Other interest | + | 71,264 |
Total investment income | 16,670,741 | |
Expenses | ||
Registration fees | 17,380 | |
Shareholder reports | 15,934 | |
Portfolio accounting fees | 13,198 | |
Professional fees | 13,073 | |
Independent trustees’ fees | 4,027 | |
Transfer agent fees | 1,487 | |
Other expenses | + | 4,140 |
Total expenses | 69,239 | |
Expense reduction | – | 69,239 |
Net expenses | – | — |
Net investment income | 16,670,741 | |
REALIZED AND UNREALIZED GAINS (LOSSES) | ||
Realized capital gain distributions received from underlying funds - affiliated issuers | 10,602,546 | |
Realized capital gain distributions received from underlying funds - unaffiliated issuers | 7,019,224 | |
Net realized gains on sales of securities - affiliated issuers | 6,543,569 | |
Net realized losses on sales of securities - unaffiliated issuers | + | (129,324 ) |
Net realized gains | 24,036,015 | |
Net change in unrealized appreciation (depreciation) on securities - affiliated issuers | 96,120,460 | |
Net change in unrealized appreciation (depreciation) on securities - unaffiliated issuers | + | 25,273,113 |
Net change in unrealized appreciation (depreciation) | + | 121,393,573 |
Net realized and unrealized gains | 145,429,588 | |
Increase in net assets resulting from operations | $162,100,329 | |
OPERATIONS | |||
11/1/23-4/30/24 | 11/1/22-10/31/23 | ||
Net investment income | $16,670,741 | $19,466,074 | |
Net realized gains | 24,036,015 | 17,490,445 | |
Net change in unrealized appreciation (depreciation) | + | 121,393,573 | 38,170,415 |
Increase in net assets resulting from operations | $162,100,329 | $75,126,934 | |
DISTRIBUTIONS TO SHAREHOLDERS | |||
Total distributions | ($40,800,665 ) | ($75,174,911 ) | |
TRANSACTIONS IN FUND SHARES | |||||
11/1/23-4/30/24 | 11/1/22-10/31/23 | ||||
SHARES | VALUE | SHARES | VALUE | ||
Shares sold | 2,896,609 | $49,188,213 | 3,880,454 | $61,126,903 | |
Shares reinvested | 2,371,619 | 39,724,621 | 5,022,820 | 73,483,874 | |
Shares redeemed | + | (5,044,989 ) | (85,581,382 ) | (7,173,346 ) | (112,713,878 ) |
Net transactions in fund shares | 223,239 | $3,331,452 | 1,729,928 | $21,896,899 | |
SHARES OUTSTANDING AND NET ASSETS | |||||
11/1/23-4/30/24 | 11/1/22-10/31/23 | ||||
SHARES | NET ASSETS | SHARES | NET ASSETS | ||
Beginning of period | 64,343,459 | $981,570,751 | 62,613,531 | $959,721,829 | |
Total increase | + | 223,239 | 124,631,116 | 1,729,928 | 21,848,922 |
End of period | 64,566,698 | $1,106,201,867 | 64,343,459 | $981,570,751 | |
11/1/23– 4/30/24* | 11/1/22– 10/31/23 | 11/1/21– 10/31/22 | 11/1/20– 10/31/21 | 11/1/19– 10/31/20 | 11/1/18– 10/31/19 | |
Per-Share Data | ||||||
Net asset value at beginning of period | $13.59 | $13.54 | $17.97 | $13.83 | $13.88 | $13.35 |
Income (loss) from investment operations: | ||||||
Net investment income (loss)1 | 0.23 | 0.24 | 0.22 | 0.16 | 0.25 | 0.22 |
Net realized and unrealized gains (losses) | 2.14 | 0.83 | (3.76 ) | 4.36 | 0.46 | 1.09 |
Total from investment operations | 2.37 | 1.07 | (3.54 ) | 4.52 | 0.71 | 1.31 |
Less distributions: | ||||||
Distributions from net investment income | (0.29 ) | (0.23 ) | (0.49 ) | (0.18 ) | (0.28 ) | (0.31 ) |
Distributions from net realized gains | (0.16 ) | (0.79 ) | (0.40 ) | (0.20 ) | (0.48 ) | (0.47 ) |
Total distributions | (0.45 ) | (1.02 ) | (0.89 ) | (0.38 ) | (0.76 ) | (0.78 ) |
Net asset value at end of period | $15.51 | $13.59 | $13.54 | $17.97 | $13.83 | $13.88 |
Total return | 17.52 %2 | 8.24 % | (20.76 %) | 33.13 % | 5.10 % | 10.91 % |
Ratios/Supplemental Data | ||||||
Ratios to average net assets: | ||||||
Net operating expenses3 | 0.00 %4 | 0.00 % | 0.00 %5 | 0.00 % | 0.00 % | 0.00 % |
Gross operating expenses3 | 0.03 %4 | 0.04 % | 0.05 %5 | 0.04 % | 0.05 % | 0.08 % |
Net investment income (loss) | 2.98 %4 | 1.73 % | 1.46 % | 0.96 % | 1.87 % | 1.65 % |
Portfolio turnover rate | 3 %2 | 5 % | 7 % | 12 % | 6 % | 8 % |
Net assets, end of period (x 1,000) | $274,121 | $234,114 | $206,203 | $252,294 | $177,992 | $162,017 |
* | Unaudited. |
1 | Calculated based on the average shares outstanding during the period. |
2 | Not annualized. |
3 | Ratio excludes acquired fund fees and expenses, which are indirect expenses incurred by the fund through its investments in underlying funds. |
4 | Annualized. |
5 | Ratio includes less than 0.005% of non-routine proxy expenses. |
SECURITY | VALUE AT 10/31/23 | PURCHASES | SALES | REALIZED GAINS (LOSSES) | NET CHANGE IN UNREALIZED APPRECIATION (DEPRECIATION) | VALUE AT 4/30/24 | BALANCE OF SHARES HELD AT 4/30/24 | DISTRIBUTIONS RECEIVED(a) |
AFFILIATED UNDERLYING FUNDS 76.3% OF NET ASSETS | ||||||||
U.S. Stocks 42.5% | ||||||||
Large-Cap 36.0% | ||||||||
Schwab Core Equity Fund | $10,062,252 | $316,320 | $— | $— | $1,555,156 | $11,933,728 | 561,323 | $316,320 |
Schwab Fundamental US Large Company Index Fund | 11,448,767 | 238,001 | — | — | 1,937,124 | 13,623,892 | 538,068 | 238,001 |
Schwab S&P 500 Index Fund | 47,875,368 | 765,832 | (3,566,584 ) | 307,578 | 8,792,236 | 54,174,430 | 699,025 | 765,832 |
Schwab Select Large Cap Growth Fund * | 16,926,076 | 2,998,810 | (2,531,769 ) | (839,553 ) | 2,244,887 | 18,798,451 | 816,969 | 2,998,810 |
98,530,501 | ||||||||
Mid-Cap 1.9% | ||||||||
Schwab U.S. Mid-Cap Index Fund | 4,245,948 | 73,867 | — | — | 859,417 | 5,179,232 | 85,367 | 73,867 |
Small-Cap 4.6% | ||||||||
Schwab Small-Cap Equity Fund | 10,622,768 | 46,459 | — | — | 2,010,698 | 12,679,925 | 642,347 | 46,459 |
116,389,658 | ||||||||
International Stocks 22.8% | ||||||||
Developed Markets 22.8% | ||||||||
Schwab Fundamental International Large Company Index Fund | 2,589,862 | 92,549 | — | — | 329,327 | 3,011,738 | 279,123 | 92,549 |
Schwab International Core Equity Fund | 21,403,189 | 631,003 | — | — | 3,641,929 | 25,676,121 | 2,234,649 | 631,003 |
Schwab International Opportunities Fund | 28,878,682 | 918,657 | — | — | 4,166,071 | 33,963,410 | 1,698,171 | 568,657 |
62,651,269 | ||||||||
Real Estate 5.6% | ||||||||
Global Real Estate 5.6% | ||||||||
Schwab Global Real Estate Fund | 13,017,321 | 1,244,013 | — | — | 982,178 | 15,243,512 | 2,592,434 | 244,012 |
Fixed Income 5.2% | ||||||||
Intermediate-Term Bond 3.9% | ||||||||
Schwab U.S. Aggregate Bond Index Fund | 8,561,779 | 2,427,771 | (450,000 ) | (119,832 ) | 310,272 | 10,729,990 | 1,246,224 | 174,983 |
Short-Term Bond 1.3% | ||||||||
Schwab Short-Term Bond Index Fund | 2,915,054 | 914,862 | (300,000 ) | (31,536 ) | 38,958 | 3,537,338 | 377,115 | 58,013 |
14,267,328 | ||||||||
Money Market Funds 0.2% | ||||||||
Schwab Variable Share Price Money Fund, Ultra Shares, 5.27% (b) | 1,455,186 | 25,796 | (840,000 ) | 135 | (39 ) | 641,078 | 640,886 | 23,843 |
Total Affiliated Underlying Funds (Cost $175,684,278) | $180,002,252 | $10,693,940 | ($7,688,353 ) | ($683,208 ) | $26,868,214 | $209,192,845 | $6,232,349 | |
SECURITY | VALUE AT 10/31/23 | PURCHASES | SALES | REALIZED GAINS (LOSSES) | NET CHANGE IN UNREALIZED APPRECIATION (DEPRECIATION) | VALUE AT 4/30/24 | BALANCE OF SHARES HELD AT 4/30/24 | DISTRIBUTIONS RECEIVED(a) |
UNAFFILIATED UNDERLYING FUNDS 23.2% OF NET ASSETS | ||||||||
U.S. Stocks 11.8% | ||||||||
Large-Cap 10.4% | ||||||||
ClearBridge Large Cap Growth Fund, Class IS * | $11,644,056 | 177,555 | ||||||
Dodge & Cox Stock Fund, Class I | 17,011,671 | 68,238 | ||||||
28,655,727 | ||||||||
Small-Cap 1.4% | ||||||||
ClearBridge Small Cap Growth Fund, Class IS * | 3,792,511 | 98,074 | ||||||
32,448,238 | ||||||||
International Stocks 3.8% | ||||||||
Emerging Markets 3.8% | ||||||||
Goldman Sachs Emerging Markets Equity Insights Fund, Institutional Class | 10,459,866 | 1,219,099 | ||||||
Fixed Income 7.6% | ||||||||
Intermediate-Term Bond 5.6% | ||||||||
Baird Aggregate Bond Fund, Institutional Class | 4,255,782 | 449,871 | ||||||
Loomis Sayles Investment Grade Bond Fund, Class Y | 7,167,206 | 748,143 | ||||||
Western Asset Core Plus Bond Fund, Class I | 3,948,326 | 438,216 | ||||||
15,371,314 | ||||||||
International Bond 2.0% | ||||||||
PIMCO International Bond Fund (U.S. Dollar-Hedged), Institutional Class | 5,387,173 | 550,273 | ||||||
20,758,487 | ||||||||
Total Unaffiliated Underlying Funds (Cost $60,155,585) | $63,666,591 | |||||||
Total Investments in Securities (Cost $235,839,863) | $272,859,436 | |||||||
* | Non-income producing security. |
(a) | Distributions received include distributions from net investment income and capital gains, if any, from the underlying funds. Amounts shown are only presented for affiliated underlying funds, which are presented in the corresponding line-item in the Statement of Operations, if applicable (see financial note 2(d) for additional information). |
(b) | The rate shown is the annualized 7-day yield. |
Assets | ||
Investments in securities, at value - affiliated issuers (cost $175,684,278) | $209,192,845 | |
Investments in securities, at value - unaffiliated issuers (cost $60,155,585) | 63,666,591 | |
Cash | 1,231,170 | |
Receivables: | ||
Dividends | 80,731 | |
Fund shares sold | 54,017 | |
Due from investment adviser | 7,354 | |
Prepaid expenses | + | 15,696 |
Total assets | 274,248,404 | |
Liabilities | ||
Payables: | ||
Investments bought | 79,618 | |
Fund shares redeemed | 17,203 | |
Accrued expenses | + | 30,095 |
Total liabilities | 126,916 | |
Net assets | $274,121,488 | |
Net Assets by Source | ||
Capital received from investors | $233,650,837 | |
Total distributable earnings | + | 40,470,651 |
Net assets | $274,121,488 | |
Net Asset Value (NAV) | ||||
Net Assets | ÷ | Shares Outstanding | = | NAV |
$274,121,488 | 17,671,799 | $15.51 | ||
For the period November 1, 2023 through April 30, 2024; unaudited | ||
Investment Income | ||
Dividends received from securities - affiliated issuers | $3,030,331 | |
Dividends received from securities - unaffiliated issuers | 893,948 | |
Other interest | + | 19,031 |
Total investment income | 3,943,310 | |
Expenses | ||
Registration fees | 12,155 | |
Professional fees | 11,736 | |
Portfolio accounting fees | 10,636 | |
Shareholder reports | 4,986 | |
Independent trustees’ fees | 3,160 | |
Transfer agent fees | 1,709 | |
Other expenses | + | 1,746 |
Total expenses | 46,128 | |
Expense reduction | – | 46,128 |
Net expenses | – | — |
Net investment income | 3,943,310 | |
REALIZED AND UNREALIZED GAINS (LOSSES) | ||
Realized capital gain distributions received from underlying funds - affiliated issuers | 3,202,018 | |
Realized capital gain distributions received from underlying funds - unaffiliated issuers | 1,557,351 | |
Net realized losses on sales of securities - affiliated issuers | (683,208 ) | |
Net realized losses on sales of securities - unaffiliated issuers | + | (137,453 ) |
Net realized gains | 3,938,708 | |
Net change in unrealized appreciation (depreciation) on securities - affiliated issuers | 26,868,214 | |
Net change in unrealized appreciation (depreciation) on securities - unaffiliated issuers | + | 6,095,728 |
Net change in unrealized appreciation (depreciation) | + | 32,963,942 |
Net realized and unrealized gains | 36,902,650 | |
Increase in net assets resulting from operations | $40,845,960 | |
OPERATIONS | |||
11/1/23-4/30/24 | 11/1/22-10/31/23 | ||
Net investment income | $3,943,310 | $4,014,127 | |
Net realized gains | 3,938,708 | 2,428,479 | |
Net change in unrealized appreciation (depreciation) | + | 32,963,942 | 10,270,242 |
Increase in net assets resulting from operations | $40,845,960 | $16,712,848 | |
DISTRIBUTIONS TO SHAREHOLDERS | |||
Total distributions | ($7,761,646 ) | ($15,583,985 ) | |
TRANSACTIONS IN FUND SHARES | |||||
11/1/23-4/30/24 | 11/1/22-10/31/23 | ||||
SHARES | VALUE | SHARES | VALUE | ||
Shares sold | 1,489,994 | $22,723,706 | 2,884,713 | $40,305,680 | |
Shares reinvested | 502,206 | 7,593,347 | 1,176,879 | 15,287,654 | |
Shares redeemed | + | (1,547,111 ) | (23,393,736 ) | (2,066,030 ) | (28,811,539 ) |
Net transactions in fund shares | 445,089 | $6,923,317 | 1,995,562 | $26,781,795 | |
SHARES OUTSTANDING AND NET ASSETS | |||||
11/1/23-4/30/24 | 11/1/22-10/31/23 | ||||
SHARES | NET ASSETS | SHARES | NET ASSETS | ||
Beginning of period | 17,226,710 | $234,113,857 | 15,231,148 | $206,203,199 | |
Total increase | + | 445,089 | 40,007,631 | 1,995,562 | 27,910,658 |
End of period | 17,671,799 | $274,121,488 | 17,226,710 | $234,113,857 | |
11/1/23– 4/30/24* | 11/1/22– 10/31/23 | 11/1/21– 10/31/22 | 11/1/20– 10/31/21 | 11/1/19– 10/31/20 | 11/1/18– 10/31/19 | |
Per-Share Data | ||||||
Net asset value at beginning of period | $13.79 | $13.74 | $18.48 | $14.03 | $14.03 | $13.49 |
Income (loss) from investment operations: | ||||||
Net investment income (loss)1 | 0.22 | 0.24 | 0.22 | 0.16 | 0.25 | 0.21 |
Net realized and unrealized gains (losses) | 2.28 | 0.89 | (3.90 ) | 4.66 | 0.45 | 1.11 |
Total from investment operations | 2.50 | 1.13 | (3.68 ) | 4.82 | 0.70 | 1.32 |
Less distributions: | ||||||
Distributions from net investment income | (0.29 ) | (0.23 ) | (0.53 ) | (0.17 ) | (0.27 ) | (0.31 ) |
Distributions from net realized gains | (0.23 ) | (0.85 ) | (0.53 ) | (0.20 ) | (0.43 ) | (0.47 ) |
Total distributions | (0.52 ) | (1.08 ) | (1.06 ) | (0.37 ) | (0.70 ) | (0.78 ) |
Net asset value at end of period | $15.77 | $13.79 | $13.74 | $18.48 | $14.03 | $14.03 |
Total return | 18.22 %2 | 8.62 % | (21.22 %) | 34.83 % | 4.96 % | 10.87 % |
Ratios/Supplemental Data | ||||||
Ratios to average net assets: | ||||||
Net operating expenses3 | 0.00 %4 | 0.00 % | 0.00 %5 | 0.00 % | 0.00 % | 0.00 % |
Gross operating expenses3 | 0.04 %4 | 0.04 % | 0.05 %5 | 0.04 % | 0.06 % | 0.08 % |
Net investment income (loss) | 2.90 %4 | 1.66 % | 1.44 % | 0.93 % | 1.83 % | 1.54 % |
Portfolio turnover rate | 1 %2 | 5 % | 6 % | 19 % | 5 % | 7 % |
Net assets, end of period (x 1,000) | $282,091 | $235,323 | $203,896 | $245,059 | $181,391 | $161,003 |
* | Unaudited. |
1 | Calculated based on the average shares outstanding during the period. |
2 | Not annualized. |
3 | Ratio excludes acquired fund fees and expenses, which are indirect expenses incurred by the fund through its investments in underlying funds. |
4 | Annualized. |
5 | Ratio includes less than 0.005% of non-routine proxy expenses. |
SECURITY | VALUE AT 10/31/23 | PURCHASES | SALES | REALIZED GAINS (LOSSES) | NET CHANGE IN UNREALIZED APPRECIATION (DEPRECIATION) | VALUE AT 4/30/24 | BALANCE OF SHARES HELD AT 4/30/24 | DISTRIBUTIONS RECEIVED(a) |
AFFILIATED UNDERLYING FUNDS 78.3% OF NET ASSETS | ||||||||
U.S. Stocks 45.5% | ||||||||
Large-Cap 38.5% | ||||||||
Schwab Core Equity Fund | $10,771,769 | $338,625 | $— | $— | $1,664,814 | $12,775,208 | 600,903 | $338,625 |
Schwab Fundamental US Large Company Index Fund | 12,648,413 | 517,746 | — | — | 2,160,465 | 15,326,624 | 605,317 | 267,747 |
Schwab S&P 500 Index Fund | 45,964,192 | 739,611 | — | — | 8,887,308 | 55,591,111 | 717,305 | 739,611 |
Schwab Select Large Cap Growth Fund * | 20,644,563 | 3,699,860 | (1,337,118 ) | (542,560 ) | 2,316,248 | 24,780,993 | 1,076,966 | 3,699,860 |
108,473,936 | ||||||||
Mid-Cap 1.9% | ||||||||
Schwab U.S. Mid-Cap Index Fund | 4,510,975 | 78,478 | — | — | 913,060 | 5,502,513 | 90,696 | 78,478 |
Small-Cap 5.1% | ||||||||
Schwab Small-Cap Equity Fund | 12,038,788 | 52,651 | — | — | 2,278,726 | 14,370,165 | 727,972 | 52,651 |
128,346,614 | ||||||||
International Stocks 24.0% | ||||||||
Developed Markets 24.0% | ||||||||
Schwab Fundamental International Large Company Index Fund | 2,712,446 | 296,929 | — | — | 354,025 | 3,363,400 | 311,715 | 96,930 |
Schwab International Core Equity Fund | 22,664,587 | 976,464 | — | — | 3,884,922 | 27,525,973 | 2,395,646 | 676,464 |
Schwab International Opportunities Fund | 30,970,472 | 1,409,848 | — | — | 4,465,084 | 36,845,404 | 1,842,270 | 609,847 |
67,734,777 | ||||||||
Real Estate 5.7% | ||||||||
Global Real Estate 5.7% | ||||||||
Schwab Global Real Estate Fund | 13,950,532 | 965,592 | — | — | 1,075,408 | 15,991,532 | 2,719,648 | 265,591 |
Fixed Income 3.0% | ||||||||
Intermediate-Term Bond 2.2% | ||||||||
Schwab U.S. Aggregate Bond Index Fund | 5,428,219 | 656,458 | — | — | 157,892 | 6,242,569 | 725,037 | 105,923 |
Short-Term Bond 0.8% | ||||||||
Schwab Short-Term Bond Index Fund | 1,847,955 | 337,827 | — | — | 7,550 | 2,193,332 | 233,831 | 38,589 |
8,435,901 | ||||||||
Money Market Funds 0.1% | ||||||||
Schwab Variable Share Price Money Fund, Ultra Shares, 5.27% (b) | 632,912 | 13,064 | (370,000 ) | 106 | (34 ) | 276,048 | 275,966 | 12,209 |
Total Affiliated Underlying Funds (Cost $186,929,702) | $184,785,823 | $10,083,153 | ($1,707,118 ) | ($542,454 ) | $28,165,468 | $220,784,872 | $6,982,525 | |
SECURITY | VALUE AT 10/31/23 | PURCHASES | SALES | REALIZED GAINS (LOSSES) | NET CHANGE IN UNREALIZED APPRECIATION (DEPRECIATION) | VALUE AT 4/30/24 | BALANCE OF SHARES HELD AT 4/30/24 | DISTRIBUTIONS RECEIVED(a) |
UNAFFILIATED UNDERLYING FUNDS 21.2% OF NET ASSETS | ||||||||
U.S. Stocks 11.4% | ||||||||
Large-Cap 9.8% | ||||||||
ClearBridge Large Cap Growth Fund, Class IS * | $10,537,824 | 160,687 | ||||||
Dodge & Cox Stock Fund, Class I | 17,062,308 | 68,441 | ||||||
27,600,132 | ||||||||
Small-Cap 1.6% | ||||||||
ClearBridge Small Cap Growth Fund, Class IS * | 4,491,286 | 116,144 | ||||||
32,091,418 | ||||||||
International Stocks 4.6% | ||||||||
Emerging Markets 4.6% | ||||||||
Goldman Sachs Emerging Markets Equity Insights Fund, Institutional Class | 12,990,124 | 1,514,001 | ||||||
Fixed Income 5.2% | ||||||||
Intermediate-Term Bond 3.9% | ||||||||
Baird Aggregate Bond Fund, Institutional Class | 2,540,469 | 268,549 | ||||||
Loomis Sayles Investment Grade Bond Fund, Class Y | 5,865,959 | 612,313 | ||||||
Western Asset Core Plus Bond Fund, Class I | 2,623,381 | 291,163 | ||||||
11,029,809 | ||||||||
International Bond 1.3% | ||||||||
PIMCO International Bond Fund (U.S. Dollar-Hedged), Institutional Class | 3,722,949 | 380,281 | ||||||
14,752,758 | ||||||||
Total Unaffiliated Underlying Funds (Cost $55,660,253) | $59,834,300 | |||||||
Total Investments in Securities (Cost $242,589,955) | $280,619,172 | |||||||
* | Non-income producing security. |
(a) | Distributions received include distributions from net investment income and capital gains, if any, from the underlying funds. Amounts shown are only presented for affiliated underlying funds, which are presented in the corresponding line-item in the Statement of Operations, if applicable (see financial note 2(d) for additional information). |
(b) | The rate shown is the annualized 7-day yield. |
Assets | ||
Investments in securities, at value - affiliated issuers (cost $186,929,702) | $220,784,872 | |
Investments in securities, at value - unaffiliated issuers (cost $55,660,253) | 59,834,300 | |
Cash | 1,426,831 | |
Receivables: | ||
Fund shares sold | 55,302 | |
Dividends | 50,421 | |
Due from investment adviser | 7,623 | |
Prepaid expenses | + | 14,978 |
Total assets | 282,174,327 | |
Liabilities | ||
Payables: | ||
Investments bought | 50,050 | |
Fund shares redeemed | 2,064 | |
Accrued expenses | + | 31,110 |
Total liabilities | 83,224 | |
Net assets | $282,091,103 | |
Net Assets by Source | ||
Capital received from investors | $241,220,406 | |
Total distributable earnings | + | 40,870,697 |
Net assets | $282,091,103 | |
Net Asset Value (NAV) | ||||
Net Assets | ÷ | Shares Outstanding | = | NAV |
$282,091,103 | 17,891,959 | $15.77 | ||
For the period November 1, 2023 through April 30, 2024; unaudited | ||
Investment Income | ||
Dividends received from securities - affiliated issuers | $3,065,128 | |
Dividends received from securities - unaffiliated issuers | 851,977 | |
Other interest | + | 20,781 |
Total investment income | 3,937,886 | |
Expenses | ||
Registration fees | 12,144 | |
Professional fees | 11,736 | |
Portfolio accounting fees | 10,629 | |
Shareholder reports | 6,190 | |
Independent trustees’ fees | 3,162 | |
Transfer agent fees | 1,897 | |
Other expenses | + | 1,747 |
Total expenses | 47,505 | |
Expense reduction | – | 47,505 |
Net expenses | – | — |
Net investment income | 3,937,886 | |
REALIZED AND UNREALIZED GAINS (LOSSES) | ||
Realized capital gain distributions received from underlying funds - affiliated issuers | 3,917,397 | |
Realized capital gain distributions received from underlying funds - unaffiliated issuers | 1,479,078 | |
Net realized losses on sales of securities - affiliated issuers | (542,454 ) | |
Net realized losses on sales of securities - unaffiliated issuers | + | (9,820 ) |
Net realized gains | 4,844,201 | |
Net change in unrealized appreciation (depreciation) on securities - affiliated issuers | 28,165,468 | |
Net change in unrealized appreciation (depreciation) on securities - unaffiliated issuers | + | 6,040,438 |
Net change in unrealized appreciation (depreciation) | + | 34,205,906 |
Net realized and unrealized gains | 39,050,107 | |
Increase in net assets resulting from operations | $42,987,993 | |
OPERATIONS | |||
11/1/23-4/30/24 | 11/1/22-10/31/23 | ||
Net investment income | $3,937,886 | $3,837,199 | |
Net realized gains | 4,844,201 | 2,463,370 | |
Net change in unrealized appreciation (depreciation) | + | 34,205,906 | 10,828,600 |
Increase in net assets resulting from operations | $42,987,993 | $17,129,169 | |
DISTRIBUTIONS TO SHAREHOLDERS | |||
Total distributions | ($8,896,272 ) | ($16,148,300 ) | |
TRANSACTIONS IN FUND SHARES | |||||
11/1/23-4/30/24 | 11/1/22-10/31/23 | ||||
SHARES | VALUE | SHARES | VALUE | ||
Shares sold | 1,555,868 | $24,108,864 | 3,268,068 | $46,529,735 | |
Shares reinvested | 563,280 | 8,635,082 | 1,194,885 | 15,724,675 | |
Shares redeemed | + | (1,291,826 ) | (20,067,174 ) | (2,239,251 ) | (31,808,554 ) |
Net transactions in fund shares | 827,322 | $12,676,772 | 2,223,702 | $30,445,856 | |
SHARES OUTSTANDING AND NET ASSETS | |||||
11/1/23-4/30/24 | 11/1/22-10/31/23 | ||||
SHARES | NET ASSETS | SHARES | NET ASSETS | ||
Beginning of period | 17,064,637 | $235,322,610 | 14,840,935 | $203,895,885 | |
Total increase | + | 827,322 | 46,768,493 | 2,223,702 | 31,426,725 |
End of period | 17,891,959 | $282,091,103 | 17,064,637 | $235,322,610 | |
11/1/23– 4/30/24* | 11/1/22– 10/31/23 | 11/1/21– 10/31/22 | 11/1/20– 10/31/21 | 11/1/19– 10/31/20 | 11/1/18– 10/31/19 | |
Per-Share Data | ||||||
Net asset value at beginning of period | $14.00 | $13.97 | $18.74 | $14.11 | $14.15 | $13.60 |
Income (loss) from investment operations: | ||||||
Net investment income (loss)1 | 0.23 | 0.23 | 0.23 | 0.15 | 0.24 | 0.21 |
Net realized and unrealized gains (losses) | 2.35 | 0.92 | (4.05 ) | 4.83 | 0.45 | 1.10 |
Total from investment operations | 2.58 | 1.15 | (3.82 ) | 4.98 | 0.69 | 1.31 |
Less distributions: | ||||||
Distributions from net investment income | (0.29 ) | (0.23 ) | (0.54 ) | (0.16 ) | (0.27 ) | (0.31 ) |
Distributions from net realized gains | (0.23 ) | (0.89 ) | (0.41 ) | (0.19 ) | (0.46 ) | (0.45 ) |
Total distributions | (0.52 ) | (1.12 ) | (0.95 ) | (0.35 ) | (0.73 ) | (0.76 ) |
Net asset value at end of period | $16.06 | $14.00 | $13.97 | $18.74 | $14.11 | $14.15 |
Total return | 18.50 %2 | 8.62 % | (21.54 %) | 35.79 % | 4.86 % | 10.73 % |
Ratios/Supplemental Data | ||||||
Ratios to average net assets: | ||||||
Net operating expenses3 | 0.00 %4 | 0.00 % | 0.00 %5 | 0.00 % | 0.00 % | 0.00 % |
Gross operating expenses3 | 0.04 %4 | 0.05 % | 0.07 %5 | 0.06 % | 0.09 % | 0.13 % |
Net investment income (loss) | 2.90 %4 | 1.59 % | 1.43 % | 0.88 % | 1.78 % | 1.53 % |
Portfolio turnover rate | 1 %2 | 4 % | 4 % | 11 % | 6 % | 6 % |
Net assets, end of period (x 1,000) | $198,289 | $161,654 | $135,741 | $158,223 | $107,401 | $93,743 |
* | Unaudited. |
1 | Calculated based on the average shares outstanding during the period. |
2 | Not annualized. |
3 | Ratio excludes acquired fund fees and expenses, which are indirect expenses incurred by the fund through its investments in underlying funds. |
4 | Annualized. |
5 | Ratio includes less than 0.005% of non-routine proxy expenses. |
SECURITY | VALUE AT 10/31/23 | PURCHASES | SALES | REALIZED GAINS (LOSSES) | NET CHANGE IN UNREALIZED APPRECIATION (DEPRECIATION) | VALUE AT 4/30/24 | BALANCE OF SHARES HELD AT 4/30/24 | DISTRIBUTIONS RECEIVED(a) |
AFFILIATED UNDERLYING FUNDS 79.6% OF NET ASSETS | ||||||||
U.S. Stocks 46.2% | ||||||||
Large-Cap 39.0% | ||||||||
Schwab Core Equity Fund | $7,498,275 | $235,718 | $— | $— | $1,158,886 | $8,892,879 | 418,292 | $235,718 |
Schwab Fundamental US Large Company Index Fund | 9,454,173 | 396,537 | — | — | 1,609,764 | 11,460,474 | 452,625 | 196,537 |
Schwab S&P 500 Index Fund | 31,364,164 | 1,655,883 | (676,000 ) | 56,210 | 6,138,000 | 38,538,257 | 497,268 | 515,883 |
Schwab Select Large Cap Growth Fund * | 15,261,893 | 2,735,193 | (800,000 ) | (373,329 ) | 1,658,773 | 18,482,530 | 803,239 | 2,735,193 |
77,374,140 | ||||||||
Mid-Cap 1.9% | ||||||||
Schwab U.S. Mid-Cap Index Fund | 3,157,764 | 54,936 | — | — | 639,158 | 3,851,858 | 63,489 | 54,936 |
Small-Cap 5.3% | ||||||||
Schwab Small-Cap Equity Fund | 8,507,687 | 483,551 | (123,000 ) | (18,856 ) | 1,671,027 | 10,520,409 | 532,949 | 38,551 |
91,746,407 | ||||||||
International Stocks 24.9% | ||||||||
Developed Markets 24.9% | ||||||||
Schwab Fundamental International Large Company Index Fund | 1,995,714 | 271,317 | — | — | 261,876 | 2,528,907 | 234,375 | 71,317 |
Schwab International Core Equity Fund | 15,984,339 | 1,802,644 | (630,000 ) | (40,456 ) | 2,792,660 | 19,909,187 | 1,732,740 | 482,644 |
Schwab International Opportunities Fund | 21,742,468 | 2,129,950 | — | — | 3,133,248 | 27,005,666 | 1,350,283 | 434,950 |
49,443,760 | ||||||||
Real Estate 6.3% | ||||||||
Global Real Estate 6.3% | ||||||||
Schwab Global Real Estate Fund | 10,063,672 | 1,831,224 | (200,000 ) | (63,886 ) | 801,897 | 12,432,907 | 2,114,440 | 196,223 |
Fixed Income 2.2% | ||||||||
Intermediate-Term Bond 1.6% | ||||||||
Schwab U.S. Aggregate Bond Index Fund | 2,893,538 | 258,808 | — | — | 76,671 | 3,229,017 | 375,031 | 58,523 |
Short-Term Bond 0.6% | ||||||||
Schwab Short-Term Bond Index Fund | 936,183 | 159,964 | — | — | 4,188 | 1,100,335 | 117,306 | 19,875 |
4,329,352 | ||||||||
Total Affiliated Underlying Funds (Cost $136,227,253) | $128,859,870 | $12,015,725 | ($2,429,000 ) | ($440,317 ) | $19,946,148 | $157,952,426 | $5,040,350 | |
SECURITY | VALUE AT 10/31/23 | PURCHASES | SALES | REALIZED GAINS (LOSSES) | NET CHANGE IN UNREALIZED APPRECIATION (DEPRECIATION) | VALUE AT 4/30/24 | BALANCE OF SHARES HELD AT 4/30/24 | DISTRIBUTIONS RECEIVED(a) |
UNAFFILIATED UNDERLYING FUNDS 19.8% OF NET ASSETS | ||||||||
U.S. Stocks 11.0% | ||||||||
Large-Cap 9.3% | ||||||||
ClearBridge Large Cap Growth Fund, Class IS * | $6,300,367 | 96,071 | ||||||
Dodge & Cox Stock Fund, Class I | 12,117,853 | 48,608 | ||||||
18,418,220 | ||||||||
Small-Cap 1.7% | ||||||||
ClearBridge Small Cap Growth Fund, Class IS * | 3,427,915 | 88,645 | ||||||
21,846,135 | ||||||||
International Stocks 5.2% | ||||||||
Emerging Markets 5.2% | ||||||||
Goldman Sachs Emerging Markets Equity Insights Fund, Institutional Class | 10,302,856 | 1,200,799 | ||||||
Fixed Income 3.6% | ||||||||
Intermediate-Term Bond 2.7% | ||||||||
Baird Aggregate Bond Fund, Institutional Class | 635,173 | 67,143 | ||||||
Loomis Sayles Investment Grade Bond Fund, Class Y | 3,263,358 | 340,643 | ||||||
Western Asset Core Plus Bond Fund, Class I | 1,391,116 | 154,397 | ||||||
5,289,647 | ||||||||
International Bond 0.9% | ||||||||
PIMCO International Bond Fund (U.S. Dollar-Hedged), Institutional Class | 1,773,107 | 181,114 | ||||||
7,062,754 | ||||||||
Total Unaffiliated Underlying Funds (Cost $36,598,681) | $39,211,745 | |||||||
Total Investments in Securities (Cost $172,825,934) | $197,164,171 | |||||||
* | Non-income producing security. |
(a) | Distributions received include distributions from net investment income and capital gains, if any, from the underlying funds. Amounts shown are only presented for affiliated underlying funds, which are presented in the corresponding line-item in the Statement of Operations, if applicable (see financial note 2(d) for additional information). |
Assets | ||
Investments in securities, at value - affiliated issuers (cost $136,227,253) | $157,952,426 | |
Investments in securities, at value - unaffiliated issuers (cost $36,598,681) | 39,211,745 | |
Cash | 1,448,242 | |
Receivables: | ||
Fund shares sold | 79,435 | |
Dividends | 25,136 | |
Due from investment adviser | 6,494 | |
Prepaid expenses | + | 13,628 |
Total assets | 198,737,106 | |
Liabilities | ||
Payables: | ||
Investments bought | 425,257 | |
Fund shares redeemed | 541 | |
Accrued expenses | + | 22,603 |
Total liabilities | 448,401 | |
Net assets | $198,288,705 | |
Net Assets by Source | ||
Capital received from investors | $171,771,289 | |
Total distributable earnings | + | 26,517,416 |
Net assets | $198,288,705 | |
Net Asset Value (NAV) | ||||
Net Assets | ÷ | Shares Outstanding | = | NAV |
$198,288,705 | 12,346,762 | $16.06 | ||
For the period November 1, 2023 through April 30, 2024; unaudited | ||
Investment Income | ||
Dividends received from securities - affiliated issuers | $2,153,728 | |
Dividends received from securities - unaffiliated issuers | 573,137 | |
Other interest | + | 15,788 |
Total investment income | 2,742,653 | |
Expenses | ||
Professional fees | 11,605 | |
Registration fees | 11,335 | |
Shareholder reports | 5,984 | |
Portfolio accounting fees | 5,972 | |
Independent trustees’ fees | 3,078 | |
Transfer agent fees | 1,493 | |
Other expenses | + | 1,549 |
Total expenses | 41,016 | |
Expense reduction | – | 41,016 |
Net expenses | – | — |
Net investment income | 2,742,653 | |
REALIZED AND UNREALIZED GAINS (LOSSES) | ||
Realized capital gain distributions received from underlying funds - affiliated issuers | 2,886,622 | |
Realized capital gain distributions received from underlying funds - unaffiliated issuers | 933,013 | |
Net realized losses on sales of securities - affiliated issuers | (440,317 ) | |
Net realized losses on sales of securities - unaffiliated issuers | + | (19,893 ) |
Net realized gains | 3,359,425 | |
Net change in unrealized appreciation (depreciation) on securities - affiliated issuers | 19,946,148 | |
Net change in unrealized appreciation (depreciation) on securities - unaffiliated issuers | + | 4,084,484 |
Net change in unrealized appreciation (depreciation) | + | 24,030,632 |
Net realized and unrealized gains | 27,390,057 | |
Increase in net assets resulting from operations | $30,132,710 | |
OPERATIONS | |||
11/1/23-4/30/24 | 11/1/22-10/31/23 | ||
Net investment income | $2,742,653 | $2,493,786 | |
Net realized gains | 3,359,425 | 2,134,732 | |
Net change in unrealized appreciation (depreciation) | + | 24,030,632 | 6,629,845 |
Increase in net assets resulting from operations | $30,132,710 | $11,258,363 | |
DISTRIBUTIONS TO SHAREHOLDERS | |||
Total distributions | ($6,096,130 ) | ($10,946,566 ) | |
TRANSACTIONS IN FUND SHARES | |||||
11/1/23-4/30/24 | 11/1/22-10/31/23 | ||||
SHARES | VALUE | SHARES | VALUE | ||
Shares sold | 1,430,951 | $22,566,847 | 2,251,549 | $32,480,869 | |
Shares reinvested | 381,713 | 5,958,540 | 801,400 | 10,714,714 | |
Shares redeemed | + | (1,008,527 ) | (15,926,849 ) | (1,223,651 ) | (17,594,557 ) |
Net transactions in fund shares | 804,137 | $12,598,538 | 1,829,298 | $25,601,026 | |
SHARES OUTSTANDING AND NET ASSETS | |||||
11/1/23-4/30/24 | 11/1/22-10/31/23 | ||||
SHARES | NET ASSETS | SHARES | NET ASSETS | ||
Beginning of period | 11,542,625 | $161,653,587 | 9,713,327 | $135,740,764 | |
Total increase | + | 804,137 | 36,635,118 | 1,829,298 | 25,912,823 |
End of period | 12,346,762 | $198,288,705 | 11,542,625 | $161,653,587 | |
11/1/23– 4/30/24* | 11/1/22– 10/31/23 | 11/1/21– 10/31/22 | 11/1/20– 10/31/21 | 11/1/19– 10/31/20 | 11/1/18– 10/31/19 | |
Per-Share Data | ||||||
Net asset value at beginning of period | $12.58 | $12.26 | $16.42 | $12.21 | $12.16 | $11.53 |
Income (loss) from investment operations: | ||||||
Net investment income (loss)1 | 0.20 | 0.20 | 0.19 | 0.12 | 0.20 | 0.16 |
Net realized and unrealized gains (losses) | 2.14 | 0.85 | (3.61 ) | 4.34 | 0.38 | 0.99 |
Total from investment operations | 2.34 | 1.05 | (3.42 ) | 4.46 | 0.58 | 1.15 |
Less distributions: | ||||||
Distributions from net investment income | (0.26 ) | (0.20 ) | (0.47 ) | (0.13 ) | (0.22 ) | (0.26 ) |
Distributions from net realized gains | (0.20 ) | (0.53 ) | (0.27 ) | (0.12 ) | (0.31 ) | (0.26 ) |
Total distributions | (0.46 ) | (0.73 ) | (0.74 ) | (0.25 ) | (0.53 ) | (0.52 ) |
Net asset value at end of period | $14.46 | $12.58 | $12.26 | $16.42 | $12.21 | $12.16 |
Total return | 18.73 %2 | 8.82 % | (21.88 %) | 36.89 % | 4.73 % | 10.85 % |
Ratios/Supplemental Data | ||||||
Ratios to average net assets: | ||||||
Net operating expenses3 | 0.00 %4 | 0.00 % | 0.00 %5 | 0.00 % | 0.00 % | 0.00 % |
Gross operating expenses3 | 0.11 %4 | 0.15 % | 0.20 %5 | 0.22 % | 0.41 % | 0.67 % |
Net investment income (loss) | 2.85 %4 | 1.51 % | 1.35 % | 0.80 % | 1.67 % | 1.42 % |
Portfolio turnover rate | 1 %2 | 4 % | 15 % | 11 % | 8 % | 13 % |
Net assets, end of period (x 1,000) | $70,965 | $54,261 | $39,741 | $40,077 | $21,509 | $15,765 |
* | Unaudited. |
1 | Calculated based on the average shares outstanding during the period. |
2 | Not annualized. |
3 | Ratio excludes acquired fund fees and expenses, which are indirect expenses incurred by the fund through its investments in underlying funds. |
4 | Annualized. |
5 | Ratio includes less than 0.005% of non-routine proxy expenses. |
SECURITY | VALUE AT 10/31/23 | PURCHASES | SALES | REALIZED GAINS (LOSSES) | NET CHANGE IN UNREALIZED APPRECIATION (DEPRECIATION) | VALUE AT 4/30/24 | BALANCE OF SHARES HELD AT 4/30/24 | DISTRIBUTIONS RECEIVED(a) |
AFFILIATED UNDERLYING FUNDS 80.9% OF NET ASSETS | ||||||||
U.S. Stocks 47.4% | ||||||||
Large-Cap 39.7% | ||||||||
Schwab Core Equity Fund | $2,513,046 | $361,942 | $— | $— | $410,216 | $3,285,204 | 154,525 | $81,942 |
Schwab Fundamental US Large Company Index Fund | 3,252,899 | 372,622 | — | — | 551,289 | 4,176,810 | 164,961 | 67,622 |
Schwab S&P 500 Index Fund | 10,798,358 | 1,181,303 | (50,000 ) | 1,805 | 2,097,231 | 14,028,697 | 181,015 | 176,303 |
Schwab Select Large Cap Growth Fund * | 5,231,858 | 1,135,712 | (140,000 ) | (77,707 ) | 545,047 | 6,694,910 | 290,957 | 930,712 |
28,185,621 | ||||||||
Mid-Cap 2.0% | ||||||||
Schwab U.S. Mid-Cap Index Fund | 1,088,306 | 133,934 | — | — | 223,094 | 1,445,334 | 23,823 | 18,933 |
Small-Cap 5.7% | ||||||||
Schwab Small-Cap Equity Fund | 2,964,767 | 633,512 | (150,000 ) | (9,941 ) | 587,646 | 4,025,984 | 203,951 | 13,512 |
33,656,939 | ||||||||
International Stocks 25.4% | ||||||||
Developed Markets 25.4% | ||||||||
Schwab Fundamental International Large Company Index Fund | 638,893 | 134,498 | — | — | 86,007 | 859,398 | 79,648 | 24,498 |
Schwab International Core Equity Fund | 5,604,520 | 649,230 | — | — | 961,820 | 7,215,570 | 627,987 | 165,231 |
Schwab International Opportunities Fund | 7,319,619 | 1,567,816 | — | — | 1,070,267 | 9,957,702 | 497,885 | 148,816 |
18,032,670 | ||||||||
Real Estate 6.4% | ||||||||
Global Real Estate 6.4% | ||||||||
Schwab Global Real Estate Fund | 3,465,840 | 877,608 | (60,000 ) | (26,769 ) | 260,056 | 4,516,735 | 768,152 | 69,608 |
Fixed Income 1.7% | ||||||||
Intermediate-Term Bond 1.2% | ||||||||
Schwab U.S. Aggregate Bond Index Fund | 619,239 | 189,882 | — | — | 13,756 | 822,877 | 95,572 | 13,821 |
Short-Term Bond 0.5% | ||||||||
Schwab Short-Term Bond Index Fund | 281,318 | 71,287 | — | — | 824 | 353,429 | 37,679 | 6,260 |
1,176,306 | ||||||||
Total Affiliated Underlying Funds (Cost $51,542,311) | $43,778,663 | $7,309,346 | ($400,000 ) | ($112,612 ) | $6,807,253 | $57,382,650 | $1,717,258 | |
SECURITY | VALUE AT 10/31/23 | PURCHASES | SALES | REALIZED GAINS (LOSSES) | NET CHANGE IN UNREALIZED APPRECIATION (DEPRECIATION) | VALUE AT 4/30/24 | BALANCE OF SHARES HELD AT 4/30/24 | DISTRIBUTIONS RECEIVED(a) |
UNAFFILIATED UNDERLYING FUNDS 18.6% OF NET ASSETS | ||||||||
U.S. Stocks 10.9% | ||||||||
Large-Cap 9.0% | ||||||||
ClearBridge Large Cap Growth Fund, Class IS * | $1,941,630 | 29,607 | ||||||
Dodge & Cox Stock Fund, Class I | 4,457,926 | 17,882 | ||||||
6,399,556 | ||||||||
Small-Cap 1.9% | ||||||||
ClearBridge Small Cap Growth Fund, Class IS * | 1,330,226 | 34,399 | ||||||
7,729,782 | ||||||||
International Stocks 5.7% | ||||||||
Emerging Markets 5.7% | ||||||||
Goldman Sachs Emerging Markets Equity Insights Fund, Institutional Class | 4,042,688 | 471,176 | ||||||
Fixed Income 2.0% | ||||||||
Intermediate-Term Bond 1.4% | ||||||||
Loomis Sayles Investment Grade Bond Fund, Class Y | 823,922 | 86,004 | ||||||
Western Asset Core Plus Bond Fund, Class I | 146,085 | 16,214 | ||||||
970,007 | ||||||||
International Bond 0.6% | ||||||||
PIMCO International Bond Fund (U.S. Dollar-Hedged), Institutional Class | 453,322 | 46,305 | ||||||
1,423,329 | ||||||||
Total Unaffiliated Underlying Funds (Cost $12,333,712) | $13,195,799 | |||||||
Total Investments in Securities (Cost $63,876,023) | $70,578,449 | |||||||
* | Non-income producing security. |
(a) | Distributions received include distributions from net investment income and capital gains, if any, from the underlying funds. Amounts shown are only presented for affiliated underlying funds, which are presented in the corresponding line-item in the Statement of Operations, if applicable (see financial note 2(d) for additional information). |
Assets | ||
Investments in securities, at value - affiliated issuers (cost $51,542,311) | $57,382,650 | |
Investments in securities, at value - unaffiliated issuers (cost $12,333,712) | 13,195,799 | |
Cash | 588,896 | |
Receivables: | ||
Fund shares sold | 47,222 | |
Dividends | 5,982 | |
Due from investment adviser | 5,726 | |
Prepaid expenses | + | 7,546 |
Total assets | 71,233,821 | |
Liabilities | ||
Payables: | ||
Investments bought | 245,996 | |
Fund shares redeemed | 1,893 | |
Accrued expenses | + | 21,359 |
Total liabilities | 269,248 | |
Net assets | $70,964,573 | |
Net Assets by Source | ||
Capital received from investors | $64,277,822 | |
Total distributable earnings | + | 6,686,751 |
Net assets | $70,964,573 | |
Net Asset Value (NAV) | ||||
Net Assets | ÷ | Shares Outstanding | = | NAV |
$70,964,573 | 4,908,331 | $14.46 | ||
For the period November 1, 2023 through April 30, 2024; unaudited | ||
Investment Income | ||
Dividends received from securities - affiliated issuers | $733,904 | |
Dividends received from securities - unaffiliated issuers | 187,034 | |
Other interest | + | 5,912 |
Total investment income | 926,850 | |
Expenses | ||
Professional fees | 11,419 | |
Registration fees | 10,174 | |
Portfolio accounting fees | 5,603 | |
Shareholder reports | 4,082 | |
Independent trustees’ fees | 2,954 | |
Transfer agent fees | 482 | |
Other expenses | + | 1,261 |
Total expenses | 35,975 | |
Expense reduction | – | 35,975 |
Net expenses | – | — |
Net investment income | 926,850 | |
REALIZED AND UNREALIZED GAINS (LOSSES) | ||
Realized capital gain distributions received from underlying funds - affiliated issuers | 983,354 | |
Realized capital gain distributions received from underlying funds - unaffiliated issuers | 304,351 | |
Net realized losses on sales of securities - affiliated issuers | (112,612 ) | |
Net realized losses on sales of securities - unaffiliated issuers | + | (8,319 ) |
Net realized gains | 1,166,774 | |
Net change in unrealized appreciation (depreciation) on securities - affiliated issuers | 6,807,253 | |
Net change in unrealized appreciation (depreciation) on securities - unaffiliated issuers | + | 1,374,290 |
Net change in unrealized appreciation (depreciation) | + | 8,181,543 |
Net realized and unrealized gains | 9,348,317 | |
Increase in net assets resulting from operations | $10,275,167 | |
OPERATIONS | |||
11/1/23-4/30/24 | 11/1/22-10/31/23 | ||
Net investment income | $926,850 | $744,958 | |
Net realized gains | 1,166,774 | 551,162 | |
Net change in unrealized appreciation (depreciation) | + | 8,181,543 | 1,905,393 |
Increase in net assets resulting from operations | $10,275,167 | $3,201,513 | |
DISTRIBUTIONS TO SHAREHOLDERS | |||
Total distributions | ($2,026,592 ) | ($2,434,558 ) | |
TRANSACTIONS IN FUND SHARES | |||||
11/1/23-4/30/24 | 11/1/22-10/31/23 | ||||
SHARES | VALUE | SHARES | VALUE | ||
Shares sold | 817,394 | $11,629,261 | 1,409,211 | $18,306,037 | |
Shares reinvested | 141,021 | 1,978,525 | 197,532 | 2,368,404 | |
Shares redeemed | + | (364,771 ) | (5,152,940 ) | (533,948 ) | (6,921,007 ) |
Net transactions in fund shares | 593,644 | $8,454,846 | 1,072,795 | $13,753,434 | |
SHARES OUTSTANDING AND NET ASSETS | |||||
11/1/23-4/30/24 | 11/1/22-10/31/23 | ||||
SHARES | NET ASSETS | SHARES | NET ASSETS | ||
Beginning of period | 4,314,687 | $54,261,152 | 3,241,892 | $39,740,763 | |
Total increase | + | 593,644 | 16,703,421 | 1,072,795 | 14,520,389 |
End of period | 4,908,331 | $70,964,573 | 4,314,687 | $54,261,152 | |
11/1/23– 4/30/24* | 11/1/22– 10/31/23 | 11/1/21– 10/31/22 | 2/26/211– 10/31/21 | |||
Per-Share Data | ||||||
Net asset value at beginning of period | $8.94 | $8.63 | $11.33 | $10.00 | ||
Income (loss) from investment operations: | ||||||
Net investment income (loss)2 | 0.14 | 0.12 | 0.11 | 0.03 | ||
Net realized and unrealized gains (losses) | 1.54 | 0.61 | (2.51 ) | 1.30 | ||
Total from investment operations | 1.68 | 0.73 | (2.40 ) | 1.33 | ||
Less distributions: | ||||||
Distributions from net investment income | (0.18 ) | (0.13 ) | (0.30 ) | — | ||
Distributions from net realized gains | (0.15 ) | (0.29 ) | — | — | ||
Total distributions | (0.33 ) | (0.42 ) | (0.30 ) | — | ||
Net asset value at end of period | $10.29 | $8.94 | $8.63 | $11.33 | ||
Total return | 18.90 %3 | 8.75 % | (21.78 %) | 13.30 %3 | ||
Ratios/Supplemental Data | ||||||
Ratios to average net assets: | ||||||
Net operating expenses4 | 0.00 %5 | 0.00 % | 0.00 %6 | 0.00 %5 | ||
Gross operating expenses4 | 0.39 %5 | 0.70 % | 1.10 %6 | 1.90 %5 | ||
Net investment income (loss) | 2.76 %5 | 1.32 % | 1.17 % | 0.35 %5 | ||
Portfolio turnover rate | 3 %3 | 4 % | 26 % | 34 %3 | ||
Net assets, end of period (x 1,000) | $18,677 | $12,391 | $6,611 | $4,489 | ||
* | Unaudited. |
1 | Commencement of operations. |
2 | Calculated based on the average shares outstanding during the period. |
3 | Not annualized. |
4 | Ratio excludes acquired fund fees and expenses, which are indirect expenses incurred by the fund through its investments in underlying funds. |
5 | Annualized. |
6 | Ratio includes less than 0.005% of non-routine proxy expenses. |
SECURITY | VALUE AT 10/31/23 | PURCHASES | SALES | REALIZED GAINS (LOSSES) | NET CHANGE IN UNREALIZED APPRECIATION (DEPRECIATION) | VALUE AT 4/30/24 | BALANCE OF SHARES HELD AT 4/30/24 | DISTRIBUTIONS RECEIVED(a) |
AFFILIATED UNDERLYING FUNDS 81.6% OF NET ASSETS | ||||||||
U.S. Stocks 48.5% | ||||||||
Large-Cap 40.5% | ||||||||
Schwab Core Equity Fund | $582,206 | $190,200 | $— | $— | $95,400 | $867,806 | 40,819 | $20,200 |
Schwab Fundamental US Large Company Index Fund | 748,089 | 273,555 | (30,000 ) | 776 | 133,972 | 1,126,392 | 44,486 | 16,555 |
Schwab S&P 500 Index Fund | 2,486,454 | 811,652 | (100,000 ) | 361 | 499,747 | 3,698,214 | 47,719 | 41,652 |
Schwab Select Large Cap Growth Fund * | 1,244,400 | 591,371 | (90,000 ) | (30,971 ) | 149,625 | 1,864,425 | 81,027 | 229,370 |
7,556,837 | ||||||||
Mid-Cap 2.0% | ||||||||
Schwab U.S. Mid-Cap Index Fund | 261,864 | 64,556 | — | — | 53,709 | 380,129 | 6,266 | 4,556 |
Small-Cap 6.0% | ||||||||
Schwab Small-Cap Equity Fund | 706,178 | 263,369 | — | — | 140,417 | 1,109,964 | 56,229 | 3,368 |
9,046,930 | ||||||||
International Stocks 25.9% | ||||||||
Developed Markets 25.9% | ||||||||
Schwab Fundamental International Large Company Index Fund | 156,185 | 77,980 | — | — | 20,792 | 254,957 | 23,629 | 5,980 |
Schwab International Core Equity Fund | 1,260,255 | 462,693 | (40,000 ) | (98 ) | 235,248 | 1,918,098 | 166,936 | 39,693 |
Schwab International Opportunities Fund | 1,737,438 | 752,260 | (90,000 ) | (39,150 ) | 297,878 | 2,658,426 | 132,921 | 36,261 |
4,831,481 | ||||||||
Real Estate 6.5% | ||||||||
Global Real Estate 6.5% | ||||||||
Schwab Global Real Estate Fund | 791,831 | 376,118 | — | — | 48,941 | 1,216,890 | 206,954 | 18,120 |
Fixed Income 0.7% | ||||||||
Intermediate-Term Bond 0.2% | ||||||||
Schwab U.S. Aggregate Bond Index Fund | 63,104 | 22,436 | (40,000 ) | (1,602 ) | 4,029 | 47,967 | 5,571 | 1,429 |
Short-Term Bond 0.5% | ||||||||
Schwab Short-Term Bond Index Fund | 69,925 | 16,546 | — | — | 258 | 86,729 | 9,246 | 1,540 |
134,696 | ||||||||
Total Affiliated Underlying Funds (Cost $14,523,398) | $10,107,929 | $3,902,736 | ($390,000 ) | ($70,684 ) | $1,680,016 | $15,229,997 | $418,724 | |
SECURITY | VALUE AT 10/31/23 | PURCHASES | SALES | REALIZED GAINS (LOSSES) | NET CHANGE IN UNREALIZED APPRECIATION (DEPRECIATION) | VALUE AT 4/30/24 | BALANCE OF SHARES HELD AT 4/30/24 | DISTRIBUTIONS RECEIVED(a) |
UNAFFILIATED UNDERLYING FUNDS 17.9% OF NET ASSETS | ||||||||
U.S. Stocks 10.6% | ||||||||
Large-Cap 8.8% | ||||||||
ClearBridge Large Cap Growth Fund, Class IS * | $443,605 | 6,764 | ||||||
Dodge & Cox Stock Fund, Class I | 1,193,682 | 4,788 | ||||||
1,637,287 | ||||||||
Small-Cap 1.8% | ||||||||
ClearBridge Small Cap Growth Fund, Class IS * | 347,618 | 8,989 | ||||||
1,984,905 | ||||||||
International Stocks 6.0% | ||||||||
Emerging Markets 6.0% | ||||||||
Goldman Sachs Emerging Markets Equity Insights Fund, Institutional Class | 1,122,162 | 130,788 | ||||||
Fixed Income 1.3% | ||||||||
Intermediate-Term Bond 0.9% | ||||||||
Loomis Sayles Investment Grade Bond Fund, Class Y | 165,911 | 17,318 | ||||||
International Bond 0.4% | ||||||||
PIMCO International Bond Fund (U.S. Dollar-Hedged), Institutional Class | 74,349 | 7,594 | ||||||
240,260 | ||||||||
Total Unaffiliated Underlying Funds (Cost $3,273,323) | $3,347,327 | |||||||
Total Investments in Securities (Cost $17,796,721) | $18,577,324 | |||||||
* | Non-income producing security. |
(a) | Distributions received include distributions from net investment income and capital gains, if any, from the underlying funds. Amounts shown are only presented for affiliated underlying funds, which are presented in the corresponding line-item in the Statement of Operations, if applicable (see financial note 2(d) for additional information). |
Assets | ||
Investments in securities, at value - affiliated issuers (cost $14,523,398) | $15,229,997 | |
Investments in securities, at value - unaffiliated issuers (cost $3,273,323) | 3,347,327 | |
Cash | 216,078 | |
Receivables: | ||
Fund shares sold | 33,400 | |
Due from investment adviser | 5,301 | |
Dividends | 710 | |
Prepaid expenses | + | 13,838 |
Total assets | 18,846,651 | |
Liabilities | ||
Payables: | ||
Investments bought | 134,709 | |
Fund shares redeemed | 14,421 | |
Accrued expenses | + | 20,054 |
Total liabilities | 169,184 | |
Net assets | $18,677,467 | |
Net Assets by Source | ||
Capital received from investors | $17,952,331 | |
Total distributable earnings | + | 725,136 |
Net assets | $18,677,467 | |
Net Asset Value (NAV) | ||||
Net Assets | ÷ | Shares Outstanding | = | NAV |
$18,677,467 | 1,815,081 | $10.29 | ||
For the period November 1, 2023 through April 30, 2024; unaudited | ||
Investment Income | ||
Dividends received from securities - affiliated issuers | $176,377 | |
Dividends received from securities - unaffiliated issuers | 44,895 | |
Other interest | + | 1,774 |
Total investment income | 223,046 | |
Expenses | ||
Professional fees | 11,351 | |
Registration fees | 8,731 | |
Portfolio accounting fees | 5,462 | |
Independent trustees’ fees | 2,908 | |
Shareholder reports | 1,718 | |
Transfer agent fees | 409 | |
Other expenses | + | 1,151 |
Total expenses | 31,730 | |
Expense reduction | – | 31,730 |
Net expenses | – | — |
Net investment income | 223,046 | |
REALIZED AND UNREALIZED GAINS (LOSSES) | ||
Realized capital gain distributions received from underlying funds - affiliated issuers | 242,347 | |
Realized capital gain distributions received from underlying funds - unaffiliated issuers | 71,192 | |
Net realized losses on sales of securities - affiliated issuers | (70,684 ) | |
Net realized gains on sales of securities - unaffiliated issuers | + | 901 |
Net realized gains | 243,756 | |
Net change in unrealized appreciation (depreciation) on securities - affiliated issuers | 1,680,016 | |
Net change in unrealized appreciation (depreciation) on securities - unaffiliated issuers | + | 323,384 |
Net change in unrealized appreciation (depreciation) | + | 2,003,400 |
Net realized and unrealized gains | 2,247,156 | |
Increase in net assets resulting from operations | $2,470,202 | |
OPERATIONS | |||
11/1/23-4/30/24 | 11/1/22-10/31/23 | ||
Net investment income | $223,046 | $133,312 | |
Net realized gains | 243,756 | 94,869 | |
Net change in unrealized appreciation (depreciation) | + | 2,003,400 | 221,731 |
Increase in net assets resulting from operations | $2,470,202 | $449,912 | |
DISTRIBUTIONS TO SHAREHOLDERS | |||
Total distributions | ($492,579 ) | ($358,283 ) | |
TRANSACTIONS IN FUND SHARES | |||||
11/1/23-4/30/24 | 11/1/22-10/31/23 | ||||
SHARES | VALUE | SHARES | VALUE | ||
Shares sold | 595,906 | $6,042,338 | 751,424 | $6,932,354 | |
Shares reinvested | 47,498 | 474,024 | 40,172 | 342,268 | |
Shares redeemed | + | (214,532 ) | (2,207,754 ) | (171,622 ) | (1,585,540 ) |
Net transactions in fund shares | 428,872 | $4,308,608 | 619,974 | $5,689,082 | |
SHARES OUTSTANDING AND NET ASSETS | |||||
11/1/23-4/30/24 | 11/1/22-10/31/23 | ||||
SHARES | NET ASSETS | SHARES | NET ASSETS | ||
Beginning of period | 1,386,209 | $12,391,236 | 766,235 | $6,610,525 | |
Total increase | + | 428,872 | 6,286,231 | 619,974 | 5,780,711 |
End of period | 1,815,081 | $18,677,467 | 1,386,209 | $12,391,236 | |
SCHWAB CAPITAL TRUST | |
Schwab Target 2010 Fund | Schwab Dividend Equity Fund |
Schwab Target 2015 Fund | Schwab Large-Cap Growth Fund |
Schwab Target 2020 Fund | Schwab Small-Cap Equity Fund |
Schwab Target 2025 Fund | Schwab Health Care Fund |
Schwab Target 2030 Fund | Schwab International Core Equity Fund |
Schwab Target 2035 Fund | Schwab Fundamental US Large Company Index Fund |
Schwab Target 2040 Fund | Schwab Fundamental US Small Company Index Fund |
Schwab Target 2045 Fund | Schwab Fundamental International Large Company Index Fund |
Schwab Target 2050 Fund | Schwab Fundamental International Small Company Index Fund |
Schwab Target 2055 Fund | Schwab Fundamental Emerging Markets Large Company Index Fund |
Schwab Target 2060 Fund | Schwab Fundamental Global Real Estate Index Fund |
Schwab Target 2065 Fund | Schwab Target 2010 Index Fund |
Schwab S&P 500 Index Fund | Schwab Target 2015 Index Fund |
Schwab Small-Cap Index Fund® | Schwab Target 2020 Index Fund |
Schwab Total Stock Market Index Fund® | Schwab Target 2025 Index Fund |
Schwab U.S. Large-Cap Growth Index Fund | Schwab Target 2030 Index Fund |
Schwab U.S. Large-Cap Value Index Fund | Schwab Target 2035 Index Fund |
Schwab U.S. Mid-Cap Index Fund | Schwab Target 2040 Index Fund |
Schwab International Index Fund® | Schwab Target 2045 Index Fund |
Schwab MarketTrack All Equity Portfolio™ | Schwab Target 2050 Index Fund |
Schwab MarketTrack Growth Portfolio™ | Schwab Target 2055 Index Fund |
Schwab MarketTrack Balanced Portfolio™ | Schwab Target 2060 Index Fund |
Schwab MarketTrack Conservative Portfolio™ | Schwab Target 2065 Index Fund |
Schwab International Opportunities Fund | Schwab Monthly Income Fund - Target Payout |
Schwab Balanced Fund | Schwab Monthly Income Fund - Flexible Payout |
Schwab Core Equity Fund | Schwab Monthly Income Fund - Income Payout |
2. Significant Accounting Policies:
3. Risk Factors:
4. Affiliates and Affiliated Transactions:
UNDERLYING FUNDS | SCHWAB TARGET 2010 FUND | SCHWAB TARGET 2015 FUND | SCHWAB TARGET 2020 FUND | SCHWAB TARGET 2025 FUND | SCHWAB TARGET 2030 FUND | SCHWAB TARGET 2035 FUND | SCHWAB TARGET 2040 FUND | SCHWAB TARGET 2045 FUND | SCHWAB TARGET 2050 FUND | SCHWAB TARGET 2055 FUND | SCHWAB TARGET 2060 FUND | SCHWAB TARGET 2065 FUND |
Schwab Core Equity Fund | 0.1 % | 0.1 % | 0.5 % | 0.7 % | 2.3 % | 1.5 % | 3.3 % | 0.9 % | 1.0 % | 0.7 % | 0.2 % | 0.1 % |
Schwab Fundamental International Large Company Index Fund | 0.0 %* | 0.0 %* | 0.1 % | 0.1 % | 0.3 % | 0.2 % | 0.5 % | 0.1 % | 0.1 % | 0.1 % | 0.0 %* | 0.0 %* |
Schwab Fundamental US Large Company Index Fund | 0.0 %* | 0.0 %* | 0.1 % | 0.1 % | 0.3 % | 0.3 % | 0.6 % | 0.2 % | 0.2 % | 0.1 % | 0.1 % | 0.0 %* |
Schwab Global Real Estate Fund | 0.4 % | 0.4 % | 3.1 % | 4.9 % | 13.8 % | 9.3 % | 19.4 % | 5.5 % | 5.8 % | 4.5 % | 1.6 % | 0.4 % |
Schwab International Core Equity Fund | 0.2 % | 0.3 % | 2.2 % | 3.6 % | 10.4 % | 7.3 % | 16.9 % | 4.4 % | 4.7 % | 3.4 % | 1.2 % | 0.3 % |
Schwab International Opportunities Fund | 0.2 % | 0.2 % | 1.7 % | 2.9 % | 8.3 % | 5.8 % | 12.5 % | 3.4 % | 3.7 % | 2.7 % | 1.0 % | 0.3 % |
Schwab S&P 500 Index Fund | 0.0 %* | 0.0 %* | 0.1 % | 0.1 % | 0.2 % | 0.1 % | 0.2 % | 0.1 % | 0.1 % | 0.0 %* | 0.0 %* | 0.0 %* |
Schwab Select Large Cap Growth Fund | 0.0 %* | 0.1 % | 0.4 % | 0.6 % | 1.7 % | 1.2 % | 2.9 % | 0.9 % | 1.2 % | 0.9 % | 0.3 % | 0.1 % |
Schwab Short-Term Bond Index Fund | 0.2 % | 0.3 % | 1.6 % | 2.0 % | 2.8 % | 1.2 % | 1.5 % | 0.2 % | 0.2 % | 0.1 % | 0.0 %* | 0.0 %* |
Schwab Small-Cap Equity Fund | 0.1 % | 0.1 % | 0.9 % | 1.4 % | 4.5 % | 3.4 % | 8.2 % | 2.3 % | 2.6 % | 1.9 % | 0.7 % | 0.2 % |
Schwab Treasury Inflation Protected Securities Index Fund | 0.1 % | 0.1 % | 0.8 % | 0.9 % | 0.7 % | — % | — % | — % | — % | — % | — % | — % |
Schwab U.S. Aggregate Bond Index Fund | 0.3 % | 0.3 % | 1.7 % | 2.1 % | 3.0 % | 1.2 % | 1.5 % | 0.2 % | 0.1 % | 0.1 % | 0.0 %* | 0.0 %* |
Schwab U.S. Mid Cap Index Fund | 0.0 %* | 0.0 %* | 0.3 % | 0.5 % | 1.0 % | 0.7 % | 1.4 % | 0.4 % | 0.4 % | 0.3 % | 0.1 % | 0.0 %* |
Schwab Variable Share Price Money Fund, Ultra Shares | 0.0 %* | 0.0 %* | 0.1 % | 0.1 % | 0.2 % | 0.1 % | 0.1 % | 0.0 %* | 0.0 %* | — % | — % | — % |
* | Less than 0.05% |
5. Board of Trustees:
7. Purchases and Sales of Investment Securities:
PURCHASES OF SECURITIES | SALES OF SECURITIES | |
Schwab Target 2010 Fund | $2,477,984 | $5,766,158 |
Schwab Target 2015 Fund | 2,698,493 | 6,776,038 |
Schwab Target 2020 Fund | 15,832,789 | 45,255,098 |
Schwab Target 2025 Fund | 33,977,707 | 69,820,897 |
Schwab Target 2030 Fund | 68,478,428 | 95,904,951 |
Schwab Target 2035 Fund | 36,888,908 | 31,161,312 |
Schwab Target 2040 Fund | 63,442,320 | 66,848,931 |
Schwab Target 2045 Fund | 16,487,321 | 9,218,157 |
Schwab Target 2050 Fund | 15,234,036 | 2,747,118 |
Schwab Target 2055 Fund | 15,547,062 | 2,729,000 |
Schwab Target 2060 Fund | 9,017,754 | 520,000 |
Schwab Target 2065 Fund | 4,772,824 | 460,000 |
8. Federal Income Taxes:
TAX COST | GROSS UNREALIZED APPRECIATION | GROSS UNREALIZED DEPRECIATION | NET UNREALIZED APPRECIATION (DEPRECIATION) | |
Schwab Target 2010 Fund | $40,695,603 | $5,249,921 | ($2,973,574 ) | $2,276,347 |
Schwab Target 2015 Fund | 45,297,886 | 7,383,259 | (3,498,476 ) | 3,884,783 |
Schwab Target 2020 Fund | 289,261,927 | 54,471,471 | (23,426,361 ) | 31,045,110 |
Schwab Target 2025 Fund | 404,050,183 | 73,301,251 | (28,486,402 ) | 44,814,849 |
Schwab Target 2030 Fund | 789,907,596 | 209,978,497 | (50,840,504 ) | 159,137,993 |
Schwab Target 2035 Fund | 472,952,110 | 116,256,750 | (25,984,745 ) | 90,272,005 |
Schwab Target 2040 Fund | 863,699,468 | 275,838,955 | (38,395,495 ) | 237,443,460 |
Schwab Target 2045 Fund | 237,141,471 | 46,167,298 | (10,449,333 ) | 35,717,965 |
Schwab Target 2050 Fund | 245,072,824 | 45,013,836 | (9,467,488 ) | 35,546,348 |
Schwab Target 2055 Fund | 174,518,725 | 29,210,174 | (6,564,728 ) | 22,645,446 |
Schwab Target 2060 Fund | 65,170,795 | 6,887,112 | (1,479,458 ) | 5,407,654 |
Schwab Target 2065 Fund | 18,163,266 | 699,409 | (285,351 ) | 414,058 |
PRIOR FISCAL YEAR END DISTRIBUTIONS | ||
ORDINARY INCOME | LONG-TERM CAPITAL GAINS | |
Schwab Target 2010 Fund | $1,132,493 | $967,218 |
Schwab Target 2015 Fund | 1,400,648 | 2,120,089 |
Schwab Target 2020 Fund | 9,076,587 | 12,917,591 |
Schwab Target 2025 Fund | 10,833,138 | 16,188,114 |
Schwab Target 2030 Fund | 17,801,309 | 40,196,703 |
Schwab Target 2035 Fund | 8,906,155 | 25,076,641 |
Schwab Target 2040 Fund | 16,978,583 | 58,196,328 |
Schwab Target 2045 Fund | 3,497,260 | 12,086,725 |
Schwab Target 2050 Fund | 3,437,553 | 12,710,747 |
Schwab Target 2055 Fund | 2,250,258 | 8,696,308 |
Schwab Target 2060 Fund | 660,373 | 1,774,185 |
Schwab Target 2065 Fund | 122,241 | 236,042 |
9. Subsequent Events:
Independent Trustees | |||
Name, Year of Birth, and Position(s) with the trust (Terms of office, and length of Time Served1) | Principal Occupations During the Past Five Years | Number of Portfolios in Fund Complex Overseen by the Trustee | Other Directorships |
Michael J. Beer 1961 Trustee (Trustee of The Charles Schwab Family of Funds, Schwab Investments, Schwab Capital Trust, Schwab Annuity Portfolios, Schwab Strategic Trust and Laudus Trust since 2022) | Retired. Director, President and Chief Executive Officer (Dec. 2016 – Sept. 2019), Principal Funds (investment management). | 106 | Director (2016 – 2019), Principal Funds, Inc. |
Robert W. Burns 1959 Trustee (Trustee of Schwab Strategic Trust since 2009; The Charles Schwab Family of Funds, Schwab Investments, Schwab Capital Trust, Schwab Annuity Portfolios and Laudus Trust since 2016) | Retired/Private Investor. | 106 | None |
Nancy F. Heller 1956 Trustee (Trustee of The Charles Schwab Family of Funds, Schwab Investments, Schwab Capital Trust, Schwab Annuity Portfolios, Schwab Strategic Trust and Laudus Trust since 2018) | Retired. | 106 | None |
David L. Mahoney 1954 Trustee (Trustee of The Charles Schwab Family of Funds, Schwab Investments, Schwab Capital Trust, Schwab Annuity Portfolios and Laudus Trust since 2011; Schwab Strategic Trust since 2016) | Private Investor. | 106 | Director (2004 – present), Corcept Therapeutics Incorporated Director (2009 – 2021), Adamas Pharmaceuticals, Inc. Director (2003 – 2019), Symantec Corporation |
Jane P. Moncreiff 1961 Trustee (Trustee of The Charles Schwab Family of Funds, Schwab Investments, Schwab Capital Trust, Schwab Annuity Portfolios, Schwab Strategic Trust and Laudus Trust since 2019) | Consultant (2018 – present), Fulham Advisers LLC (management consulting); Chief Investment Officer (2009 – 2017), CareGroup Healthcare System, Inc. (healthcare). | 106 | None |
Independent Trustees (continued) | |||
Name, Year of Birth, and Position(s) with the trust (Terms of office, and length of Time Served1) | Principal Occupations During the Past Five Years | Number of Portfolios in Fund Complex Overseen by the Trustee | Other Directorships |
Kimberly S. Patmore 1956 Trustee (Trustee of The Charles Schwab Family of Funds, Schwab Investments, Schwab Capital Trust, Schwab Annuity Portfolios, Schwab Strategic Trust and Laudus Trust since 2016) | Consultant (2008 – present), Patmore Management Consulting (management consulting). | 106 | None |
J. Derek Penn 1957 Trustee (Trustee of The Charles Schwab Family of Funds, Schwab Investments, Schwab Capital Trust, Schwab Annuity Portfolios, Schwab Strategic Trust and Laudus Trust since 2021) | Head of Equity Sales and Trading (2006 – 2018), BNY Mellon (financial services). | 106 | None |
Interested Trustees | |||
Name, Year of Birth, and Position(s) with the trust (Terms of office, and length of Time Served1) | Principal Occupations During the Past Five Years | Number of Portfolios in Fund Complex Overseen by the Trustee | Other Directorships |
Walter W. Bettinger II2 1960 Chairman and Trustee (Trustee of The Charles Schwab Family of Funds, Schwab Investments, Schwab Capital Trust and Schwab Annuity Portfolios since 2008; Schwab Strategic Trust since 2009; Laudus Trust since 2010) | Co-Chairman of the Board (July 2022 – present), Director and Chief Executive Officer (Oct. 2008 – present) and President (Feb. 2007 – Oct. 2021), The Charles Schwab Corporation; President and Chief Executive Officer (Oct. 2008 – Oct. 2021) and Director (May 2008 – Oct. 2021), Charles Schwab & Co., Inc.; Co-Chairman of the Board (July 2022 – present) and Director (Apr. 2006 – present), Charles Schwab Bank, SSB; Co-Chairman of the Board (July 2022 – present) and Director (Nov. 2017 – present), Charles Schwab Premier Bank, SSB; Co-Chairman of the Board (July 2022 – present) and Director (July 2019 – present), Charles Schwab Trust Bank; Director (May 2008 – present), Chief Executive Officer (Aug. 2017 – present) and President (Aug. 2017 – Nov. 2021), Schwab Holdings, Inc.; Manager (Sept. 2023 – present), TD Ameritrade Holding LLC; Director (Oct. 2020 – Aug. 2023), TD Ameritrade Holding Corporation; Director (July 2016 – Oct. 2021), Charles Schwab Investment Management, Inc. | 106 | Director (2008 – present), The Charles Schwab Corporation |
Richard A. Wurster2 1973 Trustee (Trustee of The Charles Schwab Family of Funds, Schwab Investments, Schwab Capital Trust, Schwab Annuity Portfolios, Schwab Strategic Trust and Laudus Trust since 2022) | President (Oct. 2021 – present) and Executive Vice President – Schwab Asset Management Solutions (Apr. 2019 – Oct. 2021), The Charles Schwab Corporation; President, Director (Oct. 2021 – present), Executive Vice President – Schwab Asset Management Solutions (July 2019 – Oct. 2021) and Senior Vice President – Advisory (May 2016 – July 2019), Charles Schwab & Co., Inc.; President (Nov. 2021 – present), Schwab Holdings, Inc.; Director (Oct. 2021 – present) and Chief Executive Officer (Nov. 2019 – Jan. 2022), Charles Schwab Investment Management, Inc.; Director, Chief Executive Officer and President (Mar. 2018 – Oct. 2022), Charles Schwab Investment Advisory, Inc.; Chief Executive Officer (July 2016 – Apr. 2018) and President (Mar. 2017 – Apr. 2018), ThomasPartners, Inc.; Chief Executive Officer (July 2016 – Apr. 2018), Windhaven Investment Management, Inc. | 106 | None |
Officers of the Trust | |
Name, Year of Birth, and Position(s) with the trust (Terms of office, and length of Time Served3) | Principal Occupations During the Past Five Years |
Omar Aguilar 1970 Chief Executive Officer, President and Chief Investment Officer (Officer of The Charles Schwab Family of Funds, Schwab Investments, Schwab Capital Trust, Schwab Annuity Portfolios, Schwab Strategic Trust and Laudus Trust since 2011) | Chief Executive Officer (Jan. 2022 – present), President (Oct. 2023 – present), (Chief Investment Officer (Apr. 2011 – present) and Senior Vice President (Apr. 2011 – Jan. 2022), Charles Schwab Investment Management, Inc.; Director, Chief Executive Officer and President (Oct. 2022 – present), Charles Schwab Investment Advisory, Inc.; Chief Executive Officer (Sept. 2023 – present), President (Oct. 2023 – present), Chief Investment Officer (June 2011 – present) and Vice President (June 2011 – Sept. 2023), Schwab Funds, Laudus Trust and Schwab ETFs. |
Mark Fischer 1970 Chief Operating Officer (Officer of The Charles Schwab Family of Funds, Schwab Investments, Schwab Capital Trust, Schwab Annuity Portfolios, Schwab Strategic Trust and Laudus Trust since 2013) | Chief Operating Officer (Dec. 2020 – present) and Treasurer and Chief Financial Officer (Jan. 2016 – Dec. 2022), Schwab Funds, Laudus Trust and Schwab ETFs; Chief Financial Officer (Mar. 2020 – present), Chief Operating Officer (Oct. 2023 – present), Managing Director (Mar. 2023 – present) and Vice President (Oct. 2013 – Mar. 2023), Charles Schwab Investment Management, Inc. |
Dana Smith 1965 Treasurer and Chief Financial Officer (Officer of The Charles Schwab Family of Funds, Schwab Investments, Schwab Capital Trust, Schwab Annuity Portfolios, Schwab Strategic Trust and Laudus Trust since 2023) | Treasurer and Chief Financial Officer (Jan. 2023 – present) and Assistant Treasurer (Dec. 2015 – Dec. 2022), Schwab Funds, Laudus Trust and Schwab ETFs; Managing Director (Mar. 2023 – present), Vice President (Mar. 2022 – Mar. 2023) and Director (Oct. 2015 – Mar. 2022), Charles Schwab Investment Management, Inc.; Managing Director (May 2022 – present) and Vice President (Apr. 2022 – May 2022), Charles Schwab & Co., Inc. |
Patrick Cassidy 1964 Vice President and Chief Investment Officer (Officer of The Charles Schwab Family of Funds, Schwab Investments, Schwab Capital Trust, Schwab Annuity Portfolios, Schwab Strategic Trust and Laudus Trust since 2018) | Chief Investment Officer (Oct. 2023 – present) and Vice President (Feb. 2018 – present), Schwab Funds, Laudus Trust and Schwab ETFs; Managing Director (Mar. 2023 – present), Chief Investment Officer (Oct. 2023 – present), and Senior Vice President (Oct. 2012 – Mar. 2023), Charles Schwab Investment Management, Inc. |
William P. McMahon, Jr. 1972 Vice President and Chief Investment Officer (Officer of The Charles Schwab Family of Funds, Schwab Investments, Schwab Capital Trust, Schwab Annuity Portfolios, Schwab Strategic Trust and Laudus Trust since 2021) | Managing Director (Mar. 2023 – present), Senior Vice President (Jan. 2020 – Mar. 2023) and Chief Investment Officer (Jan. 2020 – present) Charles Schwab Investment Management, Inc.; Vice President and Chief Investment Officer (June 2021 – present), Schwab Funds, Laudus Trust and Schwab ETFs; Senior Vice President and Chief Investment Officer – ThomasPartners Strategies (Apr. 2018 – Dec. 2019), Charles Schwab Investment Advisory, Inc.; Senior Vice President and Chief Investment Officer (May 2001 – Apr. 2018), ThomasPartners, Inc. |
Catherine MacGregor 1964 Chief Legal Officer and Secretary, Schwab Funds and Schwab ETFs Chief Legal Officer, Vice President and Clerk, Laudus Trust (Officer of The Charles Schwab Family of Funds, Schwab Investments, Schwab Capital Trust, Schwab Annuity Portfolios and Laudus Trust since 2005; Schwab Strategic Trust since 2009) | Chief Legal Officer (Mar. 2022 – present), Managing Director (Mar. 2023 – present) and Vice President (Sept. 2005 – Mar. 2023), Charles Schwab Investment Management, Inc.; Managing Director (May 2022 – present) and Vice President (Aug. 2005 – May 2022), Charles Schwab & Co., Inc.; Vice President (Dec. 2005 – present) and Chief Legal Officer and Clerk (Mar. 2007 – present), Laudus Trust; Chief Legal Officer and Secretary (Oct. 2021 – present), Vice President (Nov. 2005 – Oct. 2021) and Assistant Secretary (June 2007 – Oct. 2021), Schwab Funds; Chief Legal Officer and Secretary (Oct. 2021 – present), Vice President and Assistant Secretary (Oct. 2009 – Oct. 2021), Schwab ETFs. |
Member SIPC®
Printed on recycled paper.

No Action Required – Notice Regarding Shareholder Report Delivery |
Beginning on July 24, 2024, fund shareholder reports will be streamlined to highlight key information deemed important for investors to assess and monitor their fund investments. Other information, including financial statements, will not appear in the streamlined shareholder reports but will available online and delivered free of charge upon request. |
• If you already receive the full shareholder reports, you will receive the streamlined shareholder reports in the same way that you currently receive the full shareholder reports (either in paper or electronically). |
• If you currently receive a notification when a shareholder report is available on a fund’s website, beginning July 24, 2024, you will begin to receive the streamlined shareholder report (in paper). |
Total Return for the 6 Months Ended April 30, 2024 | |
Schwab Balanced Fund (Ticker Symbol: SWOBX) | 14.04% |
S&P 500® Index | 20.98% |
Balanced Blended Index | 14.05% |
Fund Category: Morningstar Moderate Allocation1 | 13.00% |
Performance Details | pages 4-5 |
 | Zifan Tang, Ph.D., CFA, Senior Portfolio Manager for Schwab Asset Management, is responsible for the day-to-day co-management of the fund. Prior to joining Schwab in 2012, Ms. Tang was a product manager at Thomson Reuters and from 1997 to 2009 worked as a portfolio manager at Barclays Global Investors (now known as BlackRock). |
 | Drew Hayes, CFA, Portfolio Manager for Schwab Asset Management, is responsible for the day-to-day co-management of the fund. Mr. Hayes has been with Schwab since 2006. Before becoming a portfolio manager, he spent seven years as a senior fixed income specialist for Schwab Wealth Advisory, Inc. Prior to that, he worked as a bond investment specialist for two years and as a registered representative for two years for Charles Schwab & Co., Inc. |
 | Patrick Kwok, CFA, Portfolio Manager for Schwab Asset Management, is responsible for the day-to-day co-management of the fund. Previously, Mr. Kwok served as an associate portfolio manager from 2012 to 2016. Prior to that, he worked as a fund administration manager, where he was responsible for oversight of sub-advisers, trading, cash management, and fund administration supporting the Charles Schwab Trust Bank Collective Investment Trusts and multi-asset Schwab Funds. Prior to joining Schwab Asset Management in 2008, Mr. Kwok spent two years as an asset operations specialist at Charles Schwab Trust Company. He also worked for one year at State Street Bank & Trust as a portfolio accountant and pricing specialist. |
Fund and Inception Date | 6 Months | 1 Year | 5 Years | 10 Years |
Fund: Schwab Balanced Fund (11/18/96) | 14.04% | 11.16% | 6.44% | 6.90% |
S&P 500® Index | 20.98% | 22.66% | 13.19% | 12.41% |
Bloomberg US Aggregate Bond Index | 4.97% | -1.47% | -0.16% | 1.20% |
Balanced Blended Index | 14.05% | 10.83% | 7.38% | 7.57% |
Fund Category: Morningstar Moderate Allocation 2 | 13.00% | 10.46% | 6.28% | 6.07% |
Fund Expense Ratios3: Net 0.50%; Gross 0.52% | ||||
Number of Holdings | 7 |
Portfolio Turnover Rate | 6% 1 |
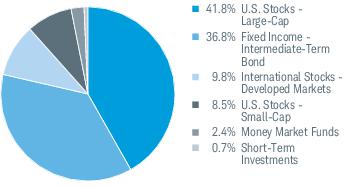
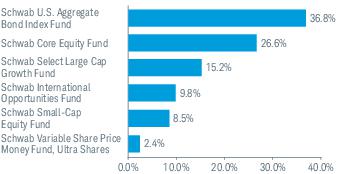
EXPENSE RATIO (ANNUALIZED)1,2 | EFFECTIVE EXPENSE RATIO (ANNUALIZED)3,4 | BEGINNING ACCOUNT VALUE AT 11/1/23 | ENDING ACCOUNT VALUE (NET OF EXPENSES) AT 4/30/24 | EXPENSES PAID DURING PERIOD 11/1/23-4/30/242,5 | EFFECTIVE EXPENSES PAID DURING PERIOD 11/1/23-4/30/244,5 | |
Schwab Balanced Fund | ||||||
Actual Return | 0.00% | 0.51% | $1,000.00 | $1,140.40 | $0.00 | $2.71 |
Hypothetical 5% Return | 0.00% | 0.51% | $1,000.00 | $1,024.86 | $0.00 | $2.56 |
1 | Based on the most recent six-month expense ratio. |
2 | Excludes acquired fund fees and expenses, which are indirect expenses incurred by the fund through its investments in underlying funds. |
3 | Based on the most recent six-month acquired fund fees and expenses and the expense ratio; may differ from the acquired fund fees and expenses and the expense ratio in the prospectus. |
4 | Includes acquired fund fees and expenses, which are indirect expenses incurred by the fund through its investments in underlying funds. |
5 | Expenses for each fund are equal to its annualized expense ratio, multiplied by the average account value over the period, multiplied by 182 days in the period, and divided by 366 days in the fiscal year. |
11/1/23– 4/30/24* | 11/1/22– 10/31/23 | 11/1/21– 10/31/22 | 11/1/20– 10/31/21 | 11/1/19– 10/31/20 | 11/1/18– 10/31/19 | |
Per-Share Data | ||||||
Net asset value at beginning of period | $14.64 | $15.11 | $19.74 | $16.50 | $15.99 | $15.41 |
Income (loss) from investment operations: | ||||||
Net investment income (loss)1 | 0.19 | 0.27 | 0.21 | 0.19 | 0.20 | 0.24 |
Net realized and unrealized gains (losses) | 1.85 | 0.68 | (3.62 ) | 3.58 | 1.13 | 1.32 |
Total from investment operations | 2.04 | 0.95 | (3.41 ) | 3.77 | 1.33 | 1.56 |
Less distributions: | ||||||
Distributions from net investment income | (0.33 ) | (0.24 ) | (0.85 ) | (0.19 ) | (0.22 ) | (0.37 ) |
Distributions from net realized gains | (0.55 ) | (1.18 ) | (0.37 ) | (0.34 ) | (0.60 ) | (0.61 ) |
Total distributions | (0.88 ) | (1.42 ) | (1.22 ) | (0.53 ) | (0.82 ) | (0.98 ) |
Net asset value at end of period | $15.80 | $14.64 | $15.11 | $19.74 | $16.50 | $15.99 |
Total return | 14.04 %2 | 6.74 % | (18.51 %) | 23.20 % | 8.58 % | 11.19 % |
Ratios/Supplemental Data | ||||||
Ratios to average net assets: | ||||||
Net operating expenses3 | 0.00 %4 | 0.00 % | 0.00 %5 | 0.00 % | 0.00 % | 0.00 % |
Gross operating expenses3 | 0.02 %4 | 0.02 % | 0.03 %5 | 0.02 % | 0.03 % | 0.04 % |
Net investment income (loss) | 2.44 %4 | 1.78 % | 1.25 % | 1.01 % | 1.26 % | 1.55 % |
Portfolio turnover rate | 6 %2 | 10 % | 31 % | 6 % | 18 % | 32 % |
Net assets, end of period (x 1,000) | $637,537 | $585,145 | $619,501 | $803,812 | $577,427 | $526,174 |
* | Unaudited. |
1 | Calculated based on the average shares outstanding during the period. |
2 | Not annualized. |
3 | Ratio excludes acquired fund fees and expenses, which are indirect expenses incurred by the fund through its investments in underlying funds. |
4 | Annualized. |
5 | Ratio includes less than 0.005% of non-routine proxy expenses. |
SECURITY | VALUE AT 10/31/23 | PURCHASES | SALES | REALIZED GAINS (LOSSES) | NET CHANGE IN UNREALIZED APPRECIATION (DEPRECIATION) | VALUE AT 4/30/24 | BALANCE OF SHARES HELD AT 4/30/24 | DISTRIBUTIONS RECEIVED(a) |
AFFILIATED UNDERLYING FUNDS 99.4% OF NET ASSETS | ||||||||
U.S. Stocks 50.3% | ||||||||
Large-Cap 41.8% | ||||||||
Schwab Core Equity Fund | $158,280,693 | $5,505,568 | ($18,335,026 ) | ($1,358,432 ) | $25,440,433 | $169,533,236 | 7,974,282 | $4,860,201 |
Schwab Select Large Cap Growth Fund * | 89,425,993 | 15,445,807 | (15,648,778 ) | 1,515,141 | 6,520,856 | 97,259,019 | 4,226,815 | 15,445,807 |
266,792,255 | ||||||||
Small-Cap 8.5% | ||||||||
Schwab Small-Cap Equity Fund | 47,248,487 | 1,106,491 | (3,390,873 ) | 401,729 | 8,578,846 | 53,944,680 | 2,732,760 | 206,641 |
320,736,935 | ||||||||
International Stocks 9.8% | ||||||||
Developed Markets 9.8% | ||||||||
Schwab International Opportunities Fund | 54,828,909 | 1,079,650 | (1,240,786 ) | (216,412 ) | 8,088,735 | 62,540,096 | 3,127,005 | 1,079,650 |
Fixed Income 36.9% | ||||||||
Intermediate-Term Bond 36.9% | ||||||||
Schwab U.S. Aggregate Bond Index Fund | 217,828,565 | 13,862,941 | (2,972,036 ) | (779,290 ) | 6,928,662 | 234,868,842 | 27,278,611 | 4,233,722 |
Money Market Funds 2.4% | ||||||||
Schwab Variable Share Price Money Fund, Ultra Shares, 5.27% (b) | 15,527,816 | 410,883 | (400,000 ) | (120 ) | 86 | 15,538,665 | 15,534,005 | 410,119 |
Total Affiliated Underlying Funds (Cost $612,539,670) | $583,140,463 | $37,411,340 | ($41,987,499 ) | ($437,384 ) | $55,557,618 | $633,684,538 | $26,236,140 | |
UNAFFILIATED UNDERLYING FUNDS 0.6% OF NET ASSETS | ||||||||
Money Market Funds 0.6% | ||||||||
State Street Institutional U.S. Government Money Market Fund, Premier Class, 5.25% (b) | $4,158,046 | 4,158,046 | ||||||
Total Unaffiliated Underlying Funds (Cost $4,158,046) | $4,158,046 | |||||||
Total Investments in Securities (Cost $616,697,716) | $637,842,584 | |||||||
* | Non-income producing security. |
(a) | Distributions received include distributions from net investment income and capital gains, if any, from the underlying funds. Amounts shown are only presented for affiliated underlying funds, which are presented in the corresponding line-item in the Statement of Operations, if applicable (see financial note 2(c) for additional information). |
(b) | The rate shown is the annualized 7-day yield. |
Assets | ||
Investments in securities, at value - affiliated issuers (cost $612,539,670) | $633,684,538 | |
Investments in securities, at value - unaffiliated issuers (cost $4,158,046) | 4,158,046 | |
Receivables: | ||
Dividends | 801,284 | |
Fund shares sold | 463,850 | |
Due from investment adviser | 10,077 | |
Prepaid expenses | + | 15,445 |
Total assets | 639,133,240 | |
Liabilities | ||
Payables: | ||
Fund shares redeemed | 806,438 | |
Investments bought | 747,701 | |
Accrued expenses | + | 41,901 |
Total liabilities | 1,596,040 | |
Net assets | $637,537,200 | |
Net Assets by Source | ||
Capital received from investors | $614,072,204 | |
Total distributable earnings | + | 23,464,996 |
Net assets | $637,537,200 | |
Net Asset Value (NAV) | ||||
Net Assets | ÷ | Shares Outstanding | = | NAV |
$637,537,200 | 40,357,658 | $15.80 | ||
For the period November 1, 2023 through April 30, 2024; unaudited | ||
Investment Income | ||
Dividends received from securities - affiliated issuers | $7,668,073 | |
Dividends received from securities - unaffiliated issuers | + | 85,544 |
Total investment income | 7,753,617 | |
Expenses | ||
Registration fees | 16,014 | |
Shareholder reports | 14,096 | |
Professional fees | 12,224 | |
Portfolio accounting fees | 11,771 | |
Independent trustees’ fees | 3,570 | |
Transfer agent fees | 3,244 | |
Custodian fees | 989 | |
Other expenses | + | 2,958 |
Total expenses | 64,866 | |
Expense reduction | – | 64,866 |
Net expenses | – | — |
Net investment income | 7,753,617 | |
REALIZED AND UNREALIZED GAINS (LOSSES) | ||
Realized capital gain distributions received from underlying funds - affiliated issuers | 18,568,067 | |
Net realized losses on sales of securities - affiliated issuers | + | (437,384 ) |
Net realized gains | 18,130,683 | |
Net change in unrealized appreciation (depreciation) on securities - affiliated issuers | + | 55,557,618 |
Net realized and unrealized gains | 73,688,301 | |
Increase in net assets resulting from operations | $81,441,918 | |
OPERATIONS | |||
11/1/23-4/30/24 | 11/1/22-10/31/23 | ||
Net investment income | $7,753,617 | $11,081,371 | |
Net realized gains | 18,130,683 | 17,355,733 | |
Net change in unrealized appreciation (depreciation) | + | 55,557,618 | 13,050,280 |
Increase in net assets resulting from operations | $81,441,918 | $41,487,384 | |
DISTRIBUTIONS TO SHAREHOLDERS | |||
Total distributions | ($34,752,458 ) | ($56,655,490 ) | |
TRANSACTIONS IN FUND SHARES | |||||
11/1/23-4/30/24 | 11/1/22-10/31/23 | ||||
SHARES | VALUE | SHARES | VALUE | ||
Shares sold | 3,960,755 | $62,811,319 | 4,280,755 | $64,732,121 | |
Shares reinvested | 1,945,108 | 30,324,232 | 3,536,115 | 49,470,251 | |
Shares redeemed | + | (5,522,121 ) | (87,433,178 ) | (8,843,149 ) | (133,389,812 ) |
Net transactions in fund shares | 383,742 | $5,702,373 | (1,026,279 ) | ($19,187,440 ) | |
SHARES OUTSTANDING AND NET ASSETS | |||||
11/1/23-4/30/24 | 11/1/22-10/31/23 | ||||
SHARES | NET ASSETS | SHARES | NET ASSETS | ||
Beginning of period | 39,973,916 | $585,145,367 | 41,000,195 | $619,500,913 | |
Total increase (decrease) | + | 383,742 | 52,391,833 | (1,026,279 ) | (34,355,546 ) |
End of period | 40,357,658 | $637,537,200 | 39,973,916 | $585,145,367 | |
SCHWAB CAPITAL TRUST | |
Schwab Balanced Fund | Schwab Target 2045 Fund |
Schwab S&P 500 Index Fund | Schwab Target 2050 Fund |
Schwab Small-Cap Index Fund® | Schwab Target 2055 Fund |
Schwab Total Stock Market Index Fund® | Schwab Target 2060 Fund |
Schwab U.S. Large-Cap Growth Index Fund | Schwab Target 2065 Fund |
Schwab U.S. Large-Cap Value Index Fund | Schwab Fundamental US Large Company Index Fund |
Schwab U.S. Mid-Cap Index Fund | Schwab Fundamental US Small Company Index Fund |
Schwab International Index Fund® | Schwab Fundamental International Large Company Index Fund |
Schwab MarketTrack All Equity Portfolio™ | Schwab Fundamental International Small Company Index Fund |
Schwab MarketTrack Growth Portfolio™ | Schwab Fundamental Emerging Markets Large Company Index Fund |
Schwab MarketTrack Balanced Portfolio™ | Schwab Fundamental Global Real Estate Index Fund |
Schwab MarketTrack Conservative Portfolio™ | Schwab Target 2010 Index Fund |
Schwab International Opportunities Fund | Schwab Target 2015 Index Fund |
Schwab Core Equity Fund | Schwab Target 2020 Index Fund |
Schwab Dividend Equity Fund | Schwab Target 2025 Index Fund |
Schwab Large-Cap Growth Fund | Schwab Target 2030 Index Fund |
Schwab Small-Cap Equity Fund | Schwab Target 2035 Index Fund |
Schwab Health Care Fund | Schwab Target 2040 Index Fund |
Schwab International Core Equity Fund | Schwab Target 2045 Index Fund |
Schwab Target 2010 Fund | Schwab Target 2050 Index Fund |
Schwab Target 2015 Fund | Schwab Target 2055 Index Fund |
Schwab Target 2020 Fund | Schwab Target 2060 Index Fund |
Schwab Target 2025 Fund | Schwab Target 2065 Index Fund |
Schwab Target 2030 Fund | Schwab Monthly Income Fund – Target Payout |
Schwab Target 2035 Fund | Schwab Monthly Income Fund – Flexible Payout |
Schwab Target 2040 Fund | Schwab Monthly Income Fund – Income Payout |
2. Significant Accounting Policies:
3. Risk Factors:
4. Affiliates and Affiliated Transactions:
Schwab Core Equity Fund | 12.8 % |
Schwab International Opportunities Fund | 6.2 % |
Schwab Select Large Cap Growth Fund | 4.7 % |
Schwab Small-Cap Equity Fund | 9.7 % |
Schwab U.S. Aggregate Bond Index Fund | 5.2 % |
Schwab Variable Share Price Money Fund, Ultra Shares | 0.3 % |
5. Board of Trustees:
6. Borrowing from Banks:
7. Purchases and Sales of Investment Securities:
PURCHASES OF SECURITIES | SALES OF SECURITIES |
$37,411,340 | $41,987,499 |
8. Federal Income Taxes:
TAX COST | GROSS UNREALIZED APPRECIATION | GROSS UNREALIZED DEPRECIATION | NET UNREALIZED APPRECIATION (DEPRECIATION) | |
$634,481,233 | $43,267,868 | ($39,906,517 ) | $3,361,351 | |
PRIOR FISCAL YEAR END DISTRIBUTIONS | ||
ORDINARY INCOME | LONG-TERM CAPITAL GAINS | |
$9,522,266 | $47,133,224 | |
9. Subsequent Events:
Independent Trustees | |||
Name, Year of Birth, and Position(s) with the trust (Terms of office, and length of Time Served1) | Principal Occupations During the Past Five Years | Number of Portfolios in Fund Complex Overseen by the Trustee | Other Directorships |
Michael J. Beer 1961 Trustee (Trustee of The Charles Schwab Family of Funds, Schwab Investments, Schwab Capital Trust, Schwab Annuity Portfolios, Schwab Strategic Trust and Laudus Trust since 2022) | Retired. Director, President and Chief Executive Officer (Dec. 2016 – Sept. 2019), Principal Funds (investment management). | 106 | Director (2016 – 2019), Principal Funds, Inc. |
Robert W. Burns 1959 Trustee (Trustee of Schwab Strategic Trust since 2009; The Charles Schwab Family of Funds, Schwab Investments, Schwab Capital Trust, Schwab Annuity Portfolios and Laudus Trust since 2016) | Retired/Private Investor. | 106 | None |
Nancy F. Heller 1956 Trustee (Trustee of The Charles Schwab Family of Funds, Schwab Investments, Schwab Capital Trust, Schwab Annuity Portfolios, Schwab Strategic Trust and Laudus Trust since 2018) | Retired. | 106 | None |
David L. Mahoney 1954 Trustee (Trustee of The Charles Schwab Family of Funds, Schwab Investments, Schwab Capital Trust, Schwab Annuity Portfolios and Laudus Trust since 2011; Schwab Strategic Trust since 2016) | Private Investor. | 106 | Director (2004 – present), Corcept Therapeutics Incorporated Director (2009 – 2021), Adamas Pharmaceuticals, Inc. Director (2003 – 2019), Symantec Corporation |
Jane P. Moncreiff 1961 Trustee (Trustee of The Charles Schwab Family of Funds, Schwab Investments, Schwab Capital Trust, Schwab Annuity Portfolios, Schwab Strategic Trust and Laudus Trust since 2019) | Consultant (2018 – present), Fulham Advisers LLC (management consulting); Chief Investment Officer (2009 – 2017), CareGroup Healthcare System, Inc. (healthcare). | 106 | None |
Independent Trustees (continued) | |||
Name, Year of Birth, and Position(s) with the trust (Terms of office, and length of Time Served1) | Principal Occupations During the Past Five Years | Number of Portfolios in Fund Complex Overseen by the Trustee | Other Directorships |
Kimberly S. Patmore 1956 Trustee (Trustee of The Charles Schwab Family of Funds, Schwab Investments, Schwab Capital Trust, Schwab Annuity Portfolios, Schwab Strategic Trust and Laudus Trust since 2016) | Consultant (2008 – present), Patmore Management Consulting (management consulting). | 106 | None |
J. Derek Penn 1957 Trustee (Trustee of The Charles Schwab Family of Funds, Schwab Investments, Schwab Capital Trust, Schwab Annuity Portfolios, Schwab Strategic Trust and Laudus Trust since 2021) | Head of Equity Sales and Trading (2006 – 2018), BNY Mellon (financial services). | 106 | None |
Interested Trustees | |||
Name, Year of Birth, and Position(s) with the trust (Terms of office, and length of Time Served1) | Principal Occupations During the Past Five Years | Number of Portfolios in Fund Complex Overseen by the Trustee | Other Directorships |
Walter W. Bettinger II2 1960 Chairman and Trustee (Trustee of The Charles Schwab Family of Funds, Schwab Investments, Schwab Capital Trust and Schwab Annuity Portfolios since 2008; Schwab Strategic Trust since 2009; Laudus Trust since 2010) | Co-Chairman of the Board (July 2022 – present), Director and Chief Executive Officer (Oct. 2008 – present) and President (Feb. 2007 – Oct. 2021), The Charles Schwab Corporation; President and Chief Executive Officer (Oct. 2008 – Oct. 2021) and Director (May 2008 – Oct. 2021), Charles Schwab & Co., Inc.; Co-Chairman of the Board (July 2022 – present) and Director (Apr. 2006 – present), Charles Schwab Bank, SSB; Co-Chairman of the Board (July 2022 – present) and Director (Nov. 2017 – present), Charles Schwab Premier Bank, SSB; Co-Chairman of the Board (July 2022 – present) and Director (July 2019 – present), Charles Schwab Trust Bank; Director (May 2008 – present), Chief Executive Officer (Aug. 2017 – present) and President (Aug. 2017 – Nov. 2021), Schwab Holdings, Inc.; Manager (Sept. 2023 – present), TD Ameritrade Holding LLC; Director (Oct. 2020 – Aug. 2023), TD Ameritrade Holding Corporation; Director (July 2016 – Oct. 2021), Charles Schwab Investment Management, Inc. | 106 | Director (2008 – present), The Charles Schwab Corporation |
Richard A. Wurster2 1973 Trustee (Trustee of The Charles Schwab Family of Funds, Schwab Investments, Schwab Capital Trust, Schwab Annuity Portfolios, Schwab Strategic Trust and Laudus Trust since 2022) | President (Oct. 2021 – present) and Executive Vice President – Schwab Asset Management Solutions (Apr. 2019 – Oct. 2021), The Charles Schwab Corporation; President, Director (Oct. 2021 – present), Executive Vice President – Schwab Asset Management Solutions (July 2019 – Oct. 2021) and Senior Vice President – Advisory (May 2016 – July 2019), Charles Schwab & Co., Inc.; President (Nov. 2021 – present), Schwab Holdings, Inc.; Director (Oct. 2021 – present) and Chief Executive Officer (Nov. 2019 – Jan. 2022), Charles Schwab Investment Management, Inc.; Director, Chief Executive Officer and President (Mar. 2018 – Oct. 2022), Charles Schwab Investment Advisory, Inc.; Chief Executive Officer (July 2016 – Apr. 2018) and President (Mar. 2017 – Apr. 2018), ThomasPartners, Inc.; Chief Executive Officer (July 2016 – Apr. 2018), Windhaven Investment Management, Inc. | 106 | None |
Officers of the Trust | |
Name, Year of Birth, and Position(s) with the trust (Terms of office, and length of Time Served3) | Principal Occupations During the Past Five Years |
Omar Aguilar 1970 Chief Executive Officer, President and Chief Investment Officer (Officer of The Charles Schwab Family of Funds, Schwab Investments, Schwab Capital Trust, Schwab Annuity Portfolios, Schwab Strategic Trust and Laudus Trust since 2011) | Chief Executive Officer (Jan. 2022 – present), President (Oct. 2023 – present), (Chief Investment Officer (Apr. 2011 – present) and Senior Vice President (Apr. 2011 – Jan. 2022), Charles Schwab Investment Management, Inc.; Director, Chief Executive Officer and President (Oct. 2022 – present), Charles Schwab Investment Advisory, Inc.; Chief Executive Officer (Sept. 2023 – present), President (Oct. 2023 – present), Chief Investment Officer (June 2011 – present) and Vice President (June 2011 – Sept. 2023), Schwab Funds, Laudus Trust and Schwab ETFs. |
Mark Fischer 1970 Chief Operating Officer (Officer of The Charles Schwab Family of Funds, Schwab Investments, Schwab Capital Trust, Schwab Annuity Portfolios, Schwab Strategic Trust and Laudus Trust since 2013) | Chief Operating Officer (Dec. 2020 – present) and Treasurer and Chief Financial Officer (Jan. 2016 – Dec. 2022), Schwab Funds, Laudus Trust and Schwab ETFs; Chief Financial Officer (Mar. 2020 – present), Chief Operating Officer (Oct. 2023 – present), Managing Director (Mar. 2023 – present) and Vice President (Oct. 2013 – Mar. 2023), Charles Schwab Investment Management, Inc. |
Dana Smith 1965 Treasurer and Chief Financial Officer (Officer of The Charles Schwab Family of Funds, Schwab Investments, Schwab Capital Trust, Schwab Annuity Portfolios, Schwab Strategic Trust and Laudus Trust since 2023) | Treasurer and Chief Financial Officer (Jan. 2023 – present) and Assistant Treasurer (Dec. 2015 – Dec. 2022), Schwab Funds, Laudus Trust and Schwab ETFs; Managing Director (Mar. 2023 – present), Vice President (Mar. 2022 – Mar. 2023) and Director (Oct. 2015 – Mar. 2022), Charles Schwab Investment Management, Inc.; Managing Director (May 2022 – present) and Vice President (Apr. 2022 – May 2022), Charles Schwab & Co., Inc. |
Patrick Cassidy 1964 Vice President and Chief Investment Officer (Officer of The Charles Schwab Family of Funds, Schwab Investments, Schwab Capital Trust, Schwab Annuity Portfolios, Schwab Strategic Trust and Laudus Trust since 2018) | Chief Investment Officer (Oct. 2023 – present) and Vice President (Feb. 2018 – present), Schwab Funds, Laudus Trust and Schwab ETFs; Managing Director (Mar. 2023 – present), Chief Investment Officer (Oct. 2023 – present), and Senior Vice President (Oct. 2012 – Mar. 2023), Charles Schwab Investment Management, Inc. |
William P. McMahon, Jr. 1972 Vice President and Chief Investment Officer (Officer of The Charles Schwab Family of Funds, Schwab Investments, Schwab Capital Trust, Schwab Annuity Portfolios, Schwab Strategic Trust and Laudus Trust since 2021) | Managing Director (Mar. 2023 – present), Senior Vice President (Jan. 2020 – Mar. 2023) and Chief Investment Officer (Jan. 2020 – present) Charles Schwab Investment Management, Inc.; Vice President and Chief Investment Officer (June 2021 – present), Schwab Funds, Laudus Trust and Schwab ETFs; Senior Vice President and Chief Investment Officer – ThomasPartners Strategies (Apr. 2018 – Dec. 2019), Charles Schwab Investment Advisory, Inc.; Senior Vice President and Chief Investment Officer (May 2001 – Apr. 2018), ThomasPartners, Inc. |
Catherine MacGregor 1964 Chief Legal Officer and Secretary, Schwab Funds and Schwab ETFs Chief Legal Officer, Vice President and Clerk, Laudus Trust (Officer of The Charles Schwab Family of Funds, Schwab Investments, Schwab Capital Trust, Schwab Annuity Portfolios and Laudus Trust since 2005; Schwab Strategic Trust since 2009) | Chief Legal Officer (Mar. 2022 – present), Managing Director (Mar. 2023 – present) and Vice President (Sept. 2005 – Mar. 2023), Charles Schwab Investment Management, Inc.; Managing Director (May 2022 – present) and Vice President (Aug. 2005 – May 2022), Charles Schwab & Co., Inc.; Vice President (Dec. 2005 – present) and Chief Legal Officer and Clerk (Mar. 2007 – present), Laudus Trust; Chief Legal Officer and Secretary (Oct. 2021 – present), Vice President (Nov. 2005 – Oct. 2021) and Assistant Secretary (June 2007 – Oct. 2021), Schwab Funds; Chief Legal Officer and Secretary (Oct. 2021 – present), Vice President and Assistant Secretary (Oct. 2009 – Oct. 2021), Schwab ETFs. |
Member SIPC®
Printed on recycled paper.

All Equity Portfolio™
Growth Portfolio™
Balanced Portfolio™
Conservative Portfolio™
No Action Required – Notice Regarding Shareholder Report Delivery |
Beginning on July 24, 2024, fund shareholder reports will be streamlined to highlight key information deemed important for investors to assess and monitor their fund investments. Other information, including financial statements, will not appear in the streamlined shareholder reports but will available online and delivered free of charge upon request. |
• If you already receive the full shareholder reports, you will receive the streamlined shareholder reports in the same way that you currently receive the full shareholder reports (either in paper or electronically). |
• If you currently receive a notification when a shareholder report is available on a fund’s website, beginning July 24, 2024, you will begin to receive the streamlined shareholder report (in paper). |
2 | |
3 | |
4 | |
6 | |
8 | |
10 | |
12 | |
13 | |
18 | |
24 | |
30 | |
36 | |
46 | |
49 |
Total Return for the 6 Months Ended April 30, 2024 | |
Schwab MarketTrack All Equity Portfolio (Ticker Symbol: SWEGX) | 18.50% |
S&P 500® Index | 20.98% |
All Equity Composite Index | 19.29% |
Fund Category: Morningstar Aggressive Allocation1 | 17.57% |
Performance Details | pages 4-5 |
Schwab MarketTrack Growth Portfolio (Ticker Symbol: SWHGX) | 15.81% |
S&P 500® Index | 20.98% |
Growth Composite Index | 16.44% |
Fund Category: Morningstar Moderately Aggressive Allocation1 | 15.76% |
Performance Details | pages 6-7 |
Schwab MarketTrack Balanced Portfolio (Ticker Symbol: SWBGX) | 12.96% |
S&P 500® Index | 20.98% |
Balanced Composite Index | 13.48% |
Fund Category: Morningstar Moderate Allocation1 | 13.00% |
Performance Details | pages 8-9 |
Schwab MarketTrack Conservative Portfolio (Ticker Symbol: SWCGX) | 10.08% |
S&P 500® Index | 20.98% |
Conservative Composite Index | 10.57% |
Fund Category: Morningstar Moderately Conservative Allocation1 | 10.44% |
Performance Details | pages 10-11 |
 | Zifan Tang, Ph.D., CFA, Senior Portfolio Manager for Schwab Asset Management, is responsible for the day-to-day co-management of the funds. Prior to joining Schwab in 2012, Ms. Tang was a product manager at Thomson Reuters and from 1997 to 2009 worked as a portfolio manager at Barclays Global Investors (now known as BlackRock). |
 | Drew Hayes, CFA, Portfolio Manager for Schwab Asset Management, is responsible for the day-to-day co-management of the funds. Mr. Hayes has been with Schwab since 2006. Before becoming a portfolio manager, he spent seven years as a senior fixed income specialist for Schwab Wealth Advisory, Inc. Prior to that, he worked as a bond investment specialist for two years and as a registered representative for two years for Charles Schwab & Co., Inc. |
 | Patrick Kwok, CFA, Portfolio Manager for Schwab Asset Management, is responsible for the day-to-day co-management of the funds. Previously, Mr. Kwok served as an associate portfolio manager from 2012 to 2016. Prior to that, he worked as a fund administration manager, where he was responsible for oversight of sub-advisers, trading, cash management, and fund administration supporting the Charles Schwab Trust Bank Collective Investment Trusts and multi-asset Schwab Funds. Prior to joining Schwab Asset Management in 2008, Mr. Kwok spent two years as an asset operations specialist at Charles Schwab Trust Company. He also worked for one year at State Street Bank & Trust as a portfolio accountant and pricing specialist. |
Fund and Inception Date | 6 Months | 1 Year | 5 Years | 10 Years |
Fund: Schwab MarketTrack All Equity Portfolio (5/19/98) | 18.50% | 15.37% | 8.90% | 8.25% |
S&P 500® Index | 20.98% | 22.66% | 13.19% | 12.41% |
All Equity Composite Index | 19.29% | 16.33% | 9.46% | 8.84% |
Fund Category: Morningstar Aggressive Allocation 2 | 17.57% | 14.29% | 7.74% | 7.29% |
Fund Expense Ratio3: 0.51% | ||||
Number of Holdings | 10 |
Portfolio Turnover Rate | 13% 1 |
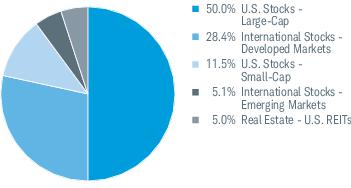
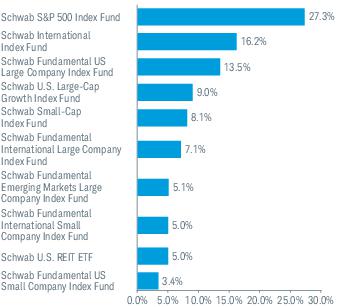
Fund and Inception Date | 6 Months | 1 Year | 5 Years | 10 Years |
Fund: Schwab MarketTrack Growth Portfolio (11/20/95) | 15.81% | 12.53% | 7.50% | 7.18% |
S&P 500® Index | 20.98% | 22.66% | 13.19% | 12.41% |
Bloomberg US Aggregate Bond Index | 4.97% | -1.47% | -0.16% | 1.20% |
Growth Composite Index | 16.44% | 13.36% | 8.06% | 7.74% |
Fund Category: Morningstar Moderately Aggressive Allocation 2 | 15.76% | 12.74% | 7.07% | 6.69% |
Fund Expense Ratio3: 0.50% | ||||
Number of Holdings | 12 |
Portfolio Turnover Rate | 13% 1 |
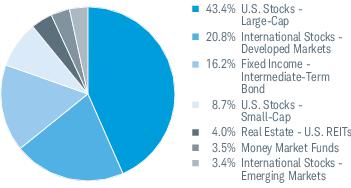
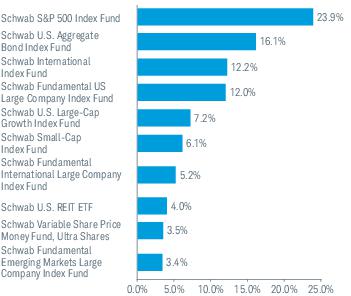
Fund and Inception Date | 6 Months | 1 Year | 5 Years | 10 Years |
Fund: Schwab MarketTrack Balanced Portfolio (11/20/95) | 12.96% | 9.02% | 5.67% | 5.68% |
S&P 500® Index | 20.98% | 22.66% | 13.19% | 12.41% |
Bloomberg US Aggregate Bond Index | 4.97% | -1.47% | -0.16% | 1.20% |
Balanced Composite Index | 13.48% | 9.76% | 6.21% | 6.24% |
Fund Category: Morningstar Moderate Allocation 2 | 13.00% | 10.46% | 6.28% | 6.07% |
Fund Expense Ratio3: 0.48% | ||||
Number of Holdings | 13 |
Portfolio Turnover Rate | 11% 1 |
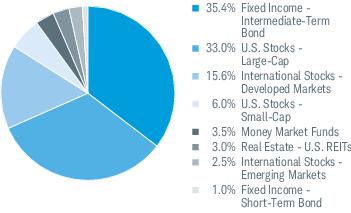
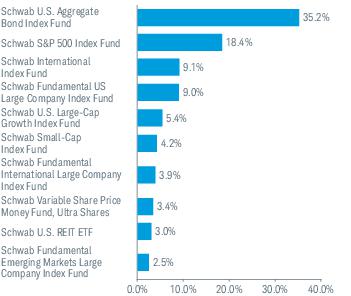
Fund and Inception Date | 6 Months | 1 Year | 5 Years | 10 Years |
Fund: Schwab MarketTrack Conservative Portfolio (11/20/95) | 10.08% | 5.36% | 3.64% | 4.03% |
S&P 500® Index | 20.98% | 22.66% | 13.19% | 12.41% |
Bloomberg US Aggregate Bond Index | 4.97% | -1.47% | -0.16% | 1.20% |
Conservative Composite Index | 10.57% | 6.06% | 4.20% | 4.62% |
Fund Category: Morningstar Moderately Conservative Allocation 2 | 10.44% | 6.33% | 3.80% | 3.95% |
Fund Expense Ratio3: 0.50% | ||||
Number of Holdings | 13 |
Portfolio Turnover Rate | 8% 1 |
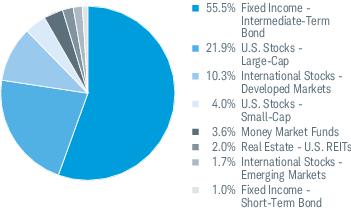
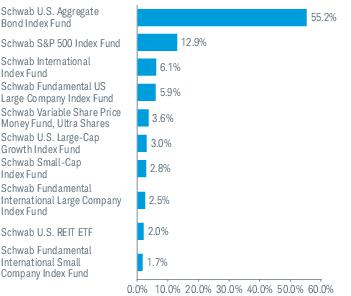
EXPENSE RATIO (ANNUALIZED)1,2 | EFFECTIVE EXPENSE RATIO (ANNUALIZED)3,4 | BEGINNING ACCOUNT VALUE AT 11/1/23 | ENDING ACCOUNT VALUE (NET OF EXPENSES) AT 4/30/24 | EXPENSES PAID DURING PERIOD 11/1/23-4/30/242,5 | EFFECTIVE EXPENSES PAID DURING PERIOD 11/1/23-4/30/244,5 | |
Schwab MarketTrack All Equity Portfolio | ||||||
Actual Return | 0.38% | 0.50% | $1,000.00 | $1,185.00 | $2.06 | $2.72 |
Hypothetical 5% Return | 0.38% | 0.50% | $1,000.00 | $1,022.97 | $1.91 | $2.51 |
Schwab MarketTrack Growth Portfolio | ||||||
Actual Return | 0.39% | 0.50% | $1,000.00 | $1,158.10 | $2.09 | $2.68 |
Hypothetical 5% Return | 0.39% | 0.50% | $1,000.00 | $1,022.92 | $1.96 | $2.51 |
Schwab MarketTrack Balanced Portfolio | ||||||
Actual Return | 0.39% | 0.48% | $1,000.00 | $1,129.60 | $2.07 | $2.54 |
Hypothetical 5% Return | 0.39% | 0.48% | $1,000.00 | $1,022.92 | $1.96 | $2.41 |
Schwab MarketTrack Conservative Portfolio | ||||||
Actual Return | 0.42% | 0.50% | $1,000.00 | $1,100.80 | $2.19 | $2.61 |
Hypothetical 5% Return | 0.42% | 0.50% | $1,000.00 | $1,022.77 | $2.11 | $2.51 |
1 | Based on the most recent six-month expense ratio. |
2 | Excludes acquired fund fees and expenses, which are indirect expenses incurred by the fund through its investments in underlying funds. |
3 | Based on the most recent six-month acquired fund fees and expenses and the expense ratio; may differ from the acquired fund fees and expenses and the expense ratio in the prospectus. |
4 | Includes acquired fund fees and expenses, which are indirect expenses incurred by the fund through its investments in underlying funds. |
5 | Expenses for each fund are equal to its annualized expense ratio, multiplied by the average account value over the period, multiplied by 182 days in the period, and divided by 366 days in the fiscal year. |
11/1/23– 4/30/24* | 11/1/22– 10/31/23 | 11/1/21– 10/31/22 | 11/1/20– 10/31/21 | 11/1/19– 10/31/20 | 11/1/18– 10/31/19 | |
Per-Share Data | ||||||
Net asset value at beginning of period | $19.55 | $19.11 | $23.89 | $17.73 | $19.15 | $18.33 |
Income (loss) from investment operations: | ||||||
Net investment income (loss)1 | 0.41 | 0.32 | 0.37 | 0.29 | 0.37 | 0.31 |
Net realized and unrealized gains (losses) | 3.19 | 1.04 | (4.23 ) | 7.21 | (0.54 ) | 1.30 |
Total from investment operations | 3.60 | 1.36 | (3.86 ) | 7.50 | (0.17 ) | 1.61 |
Less distributions: | ||||||
Distributions from net investment income | (0.40 ) | (0.30 ) | (0.45 ) | (0.21 ) | (0.53 ) | (0.36 ) |
Distributions from net realized gains | (0.29 ) | (0.62 ) | (0.47 ) | (1.13 ) | (0.72 ) | (0.43 ) |
Total distributions | (0.69 ) | (0.92 ) | (0.92 ) | (1.34 ) | (1.25 ) | (0.79 ) |
Net asset value at end of period | $22.46 | $19.55 | $19.11 | $23.89 | $17.73 | $19.15 |
Total return | 18.50 %2 | 7.32 % | (16.89 %) | 43.90 % | (1.35 %) | 9.58 % |
Ratios/Supplemental Data | ||||||
Ratios to average net assets: | ||||||
Net operating expenses3 | 0.38 %4 | 0.39 % | 0.39 %5 | 0.38 % | 0.40 % | 0.40 % |
Gross operating expenses3 | 0.38 %4 | 0.39 % | 0.39 %5 | 0.38 % | 0.40 % | 0.40 % |
Net investment income (loss) | 3.77 %4 | 1.60 % | 1.75 % | 1.33 % | 2.08 % | 1.72 % |
Portfolio turnover rate | 13 %2 | 10 % | 7 % | 6 % | 18 % | 6 % |
Net assets, end of period (x 1,000) | $844,611 | $730,571 | $698,899 | $861,267 | $623,095 | $690,801 |
* | Unaudited. |
1 | Calculated based on the average shares outstanding during the period. |
2 | Not annualized. |
3 | Ratio excludes acquired fund fees and expenses, which are indirect expenses incurred by the fund through its investments in underlying funds. |
4 | Annualized. |
5 | Ratio includes less than 0.005% of non-routine proxy expenses. |
SECURITY | VALUE AT 10/31/23 | PURCHASES | SALES | REALIZED GAINS (LOSSES) | NET CHANGE IN UNREALIZED APPRECIATION (DEPRECIATION) | VALUE AT 4/30/24 | BALANCE OF SHARES HELD AT 4/30/24 | DISTRIBUTIONS RECEIVED(a) |
AFFILIATED UNDERLYING FUNDS 99.7% OF NET ASSETS | ||||||||
U.S. Stocks 61.3% | ||||||||
Large-Cap 49.8% | ||||||||
Schwab Fundamental US Large Company Index Fund | $98,702,616 | $3,925,735 | ($5,193,115 ) | $597,193 | $16,108,437 | $114,140,866 | 4,507,933 | $2,053,890 |
Schwab S&P 500 Index Fund | 229,385,364 | 7,534,168 | (50,365,010 ) | 32,460,251 | 11,779,303 | 230,794,076 | 2,977,988 | 3,660,709 |
Schwab U.S. Large-Cap Growth Index Fund | 36,628,897 | 34,797,923 | (2,994,310 ) | 634,535 | 6,659,274 | 75,726,319 | 792,282 | 278,926 |
420,661,261 | ||||||||
Small-Cap 11.5% | ||||||||
Schwab Fundamental US Small Company Index Fund | 32,760,298 | 1,808,979 | (11,726,893 ) | 2,036,587 | 3,744,808 | 28,623,779 | 1,778,979 | 538,646 |
Schwab Small-Cap Index Fund | 75,238,626 | 6,784,163 | (27,819,389 ) | 2,500,021 | 11,877,761 | 68,581,182 | 2,157,319 | 1,339,213 |
97,204,961 | ||||||||
517,866,222 | ||||||||
International Stocks 33.4% | ||||||||
Developed Markets 28.3% | ||||||||
Schwab Fundamental International Large Company Index Fund | 43,820,399 | 12,813,794 | (2,281,744 ) | 63,866 | 5,726,200 | 60,142,515 | 5,573,912 | 1,565,928 |
Schwab Fundamental International Small Company Index Fund | 36,120,894 | 3,923,351 | (1,412,893 ) | 14,650 | 3,869,235 | 42,515,237 | 3,384,971 | 1,263,436 |
Schwab International Index Fund | 101,336,125 | 24,124,184 | (2,726,714 ) | 30,769 | 13,573,135 | 136,337,499 | 5,902,056 | 3,697,321 |
238,995,251 | ||||||||
Emerging Markets 5.1% | ||||||||
Schwab Fundamental Emerging Markets Large Company Index Fund | 36,509,949 | 5,062,230 | (3,151,934 ) | 140,431 | 4,010,928 | 42,571,604 | 4,794,100 | 1,963,775 |
281,566,855 | ||||||||
Real Estate 5.0% | ||||||||
U.S. REITs 5.0% | ||||||||
Schwab U.S. REIT ETF | 36,755,173 | 4,908,691 | (2,625,283 ) | (245,378 ) | 3,446,834 | 42,240,037 | 2,252,802 | 691,992 |
Total Affiliated Underlying Funds (Cost $478,810,484) | $727,258,341 | $105,683,218 | ($110,297,285 ) | $38,232,925 | $80,795,915 | $841,673,114 | $17,053,836 | |
Total Investments in Securities (Cost $478,810,484) | $841,673,114 | |||||||
(a) | Distributions received include distributions from net investment income and capital gains, if any, from the underlying funds. Amounts shown are only presented for affiliated underlying funds, which are presented in the corresponding line-item in the Statement of Operations, if applicable (see financial note 2(d) for additional information). |
ETF — | Exchange-Traded Fund |
REIT — | Real Estate Investment Trust |
Assets | ||
Investments in securities, at value - affiliated issuers (cost $478,810,484) | $841,673,114 | |
Cash | 3,983,618 | |
Receivables: | ||
Investments sold | 5,434,026 | |
Fund shares sold | 220,956 | |
Prepaid expenses | + | 22,289 |
Total assets | 851,334,003 | |
Liabilities | ||
Payables: | ||
Investments bought | 4,814,266 | |
Fund shares redeemed | 1,610,259 | |
Shareholder service fees | 167,059 | |
Investment adviser and administrator fees | 91,470 | |
Accrued expenses | + | 40,167 |
Total liabilities | 6,723,221 | |
Net assets | $844,610,782 | |
Net Assets by Source | ||
Capital received from investors | $454,055,937 | |
Total distributable earnings | + | 390,554,845 |
Net assets | $844,610,782 | |
Net Asset Value (NAV) | ||||
Net Assets | ÷ | Shares Outstanding | = | NAV |
$844,610,782 | 37,598,301 | $22.46 | ||
For the period November 1, 2023 through April 30, 2024; unaudited | ||
Investment Income | ||
Dividends received from securities - affiliated issuers | $17,053,836 | |
Other interest | + | 53,805 |
Total investment income | 17,107,641 | |
Expenses | ||
Shareholder service fees | 972,327 | |
Investment adviser and administrator fees | 536,174 | |
Shareholder reports | 20,635 | |
Registration fees | 15,731 | |
Portfolio accounting fees | 12,296 | |
Professional fees | 11,395 | |
Independent trustees’ fees | 3,741 | |
Transfer agent fees | 1,947 | |
Other expenses | + | 3,376 |
Total expenses | – | 1,577,622 |
Net investment income | 15,530,019 | |
REALIZED AND UNREALIZED GAINS (LOSSES) | ||
Net realized gains on sales of securities - affiliated issuers | 38,232,925 | |
Net change in unrealized appreciation (depreciation) on securities - affiliated issuers | + | 80,795,915 |
Net realized and unrealized gains | 119,028,840 | |
Increase in net assets resulting from operations | $134,558,859 | |
OPERATIONS | |||
11/1/23-4/30/24 | 11/1/22-10/31/23 | ||
Net investment income | $15,530,019 | $12,121,922 | |
Net realized gains | 38,232,925 | 9,231,924 | |
Net change in unrealized appreciation (depreciation) | + | 80,795,915 | 30,496,738 |
Increase in net assets resulting from operations | $134,558,859 | $51,850,584 | |
DISTRIBUTIONS TO SHAREHOLDERS | |||
Total distributions | ($25,564,421 ) | ($33,442,416 ) | |
TRANSACTIONS IN FUND SHARES | |||||
11/1/23-4/30/24 | 11/1/22-10/31/23 | ||||
SHARES | VALUE | SHARES | VALUE | ||
Shares sold | 1,753,278 | $38,884,464 | 3,710,311 | $74,403,438 | |
Shares reinvested | 1,021,261 | 22,447,317 | 1,577,571 | 29,611,009 | |
Shares redeemed | + | (2,552,082 ) | (56,286,033 ) | (4,493,650 ) | (90,750,860 ) |
Net transactions in fund shares | 222,457 | $5,045,748 | 794,232 | $13,263,587 | |
SHARES OUTSTANDING AND NET ASSETS | |||||
11/1/23-4/30/24 | 11/1/22-10/31/23 | ||||
SHARES | NET ASSETS | SHARES | NET ASSETS | ||
Beginning of period | 37,375,844 | $730,570,596 | 36,581,612 | $698,898,841 | |
Total increase | + | 222,457 | 114,040,186 | 794,232 | 31,671,755 |
End of period | 37,598,301 | $844,610,782 | 37,375,844 | $730,570,596 | |
11/1/23– 4/30/24* | 11/1/22– 10/31/23 | 11/1/21– 10/31/22 | 11/1/20– 10/31/21 | 11/1/19– 10/31/20 | 11/1/18– 10/31/19 | |
Per-Share Data | ||||||
Net asset value at beginning of period | $22.64 | $22.39 | $27.84 | $22.42 | $23.54 | $22.67 |
Income (loss) from investment operations: | ||||||
Net investment income (loss)1 | 0.45 | 0.43 | 0.40 | 0.35 | 0.43 | 0.41 |
Net realized and unrealized gains (losses) | 3.11 | 0.81 | (4.49 ) | 7.03 | (0.20 ) | 1.62 |
Total from investment operations | 3.56 | 1.24 | (4.09 ) | 7.38 | 0.23 | 2.03 |
Less distributions: | ||||||
Distributions from net investment income | (0.50 ) | (0.38 ) | (0.44 ) | (0.39 ) | (0.47 ) | (0.45 ) |
Distributions from net realized gains | (0.49 ) | (0.61 ) | (0.92 ) | (1.57 ) | (0.88 ) | (0.71 ) |
Total distributions | (0.99 ) | (0.99 ) | (1.36 ) | (1.96 ) | (1.35 ) | (1.16 ) |
Net asset value at end of period | $25.21 | $22.64 | $22.39 | $27.84 | $22.42 | $23.54 |
Total return | 15.81 %2 | 5.68 % | (15.52 %) | 34.32 % | 0.74 % | 9.86 % |
Ratios/Supplemental Data | ||||||
Ratios to average net assets: | ||||||
Net operating expenses3 | 0.39 %4 | 0.39 %5 | 0.39 %5 | 0.39 % | 0.39 % | 0.40 % |
Gross operating expenses3 | 0.39 %4 | 0.39 %5 | 0.39 %5 | 0.39 % | 0.40 % | 0.40 % |
Net investment income (loss) | 3.61 %4 | 1.86 % | 1.63 % | 1.33 % | 1.92 % | 1.82 % |
Portfolio turnover rate | 13 %2 | 10 % | 8 % | 8 % | 19 % | 7 % |
Net assets, end of period (x 1,000) | $897,444 | $811,692 | $801,906 | $982,246 | $748,492 | $816,532 |
* | Unaudited. |
1 | Calculated based on the average shares outstanding during the period. |
2 | Not annualized. |
3 | Ratio excludes acquired fund fees and expenses, which are indirect expenses incurred by the fund through its investments in underlying funds. |
4 | Annualized. |
5 | Ratio includes less than 0.005% of non-routine proxy expenses. |
SECURITY | VALUE AT 10/31/23 | PURCHASES | SALES | REALIZED GAINS (LOSSES) | NET CHANGE IN UNREALIZED APPRECIATION (DEPRECIATION) | VALUE AT 4/30/24 | BALANCE OF SHARES HELD AT 4/30/24 | DISTRIBUTIONS RECEIVED(a) |
AFFILIATED UNDERLYING FUNDS 99.5% OF NET ASSETS | ||||||||
U.S. Stocks 51.8% | ||||||||
Large-Cap 43.1% | ||||||||
Schwab Fundamental US Large Company Index Fund | $97,777,220 | $2,905,141 | ($9,642,774 ) | $3,179,005 | $13,251,502 | $107,470,094 | 4,244,474 | $2,006,066 |
Schwab S&P 500 Index Fund | 227,523,315 | 5,003,780 | (61,643,253 ) | 48,859,517 | (5,143,907 ) | 214,599,452 | 2,769,025 | 3,591,807 |
Schwab U.S. Large-Cap Growth Index Fund | 26,965,098 | 36,901,485 | (3,877,857 ) | 1,081,120 | 3,989,363 | 65,059,209 | 680,678 | 201,026 |
387,128,755 | ||||||||
Small-Cap 8.7% | ||||||||
Schwab Fundamental US Small Company Index Fund | 30,747,212 | 1,652,834 | (14,522,753 ) | 2,776,050 | 2,718,577 | 23,371,920 | 1,452,574 | 497,507 |
Schwab Small-Cap Index Fund | 72,026,718 | 4,871,062 | (36,366,174 ) | 9,916,899 | 4,181,769 | 54,630,274 | 1,718,474 | 1,274,556 |
78,002,194 | ||||||||
465,130,949 | ||||||||
International Stocks 24.1% | ||||||||
Developed Markets 20.7% | ||||||||
Schwab Fundamental International Large Company Index Fund | 32,386,077 | 13,654,747 | (3,557,103 ) | 221,572 | 4,085,214 | 46,790,507 | 4,336,470 | 1,134,825 |
Schwab Fundamental International Small Company Index Fund | 26,792,630 | 2,109,516 | (1,797,744 ) | 29,919 | 2,848,354 | 29,982,675 | 2,387,156 | 918,314 |
Schwab International Index Fund | 75,982,989 | 28,577,547 | (5,702,731 ) | 131,456 | 10,020,220 | 109,009,481 | 4,719,025 | 2,729,888 |
185,782,663 | ||||||||
Emerging Markets 3.4% | ||||||||
Schwab Fundamental Emerging Markets Large Company Index Fund | 27,161,846 | 2,531,925 | (2,698,629 ) | 140,802 | 2,896,757 | 30,032,701 | 3,382,061 | 1,442,020 |
215,815,364 | ||||||||
Real Estate 4.0% | ||||||||
U.S. REITs 4.0% | ||||||||
Schwab U.S. REIT ETF | 32,647,783 | 3,445,243 | (3,304,790 ) | (295,260 ) | 3,299,180 | 35,792,156 | 1,908,915 | 603,770 |
Fixed Income 16.1% | ||||||||
Intermediate-Term Bond 16.1% | ||||||||
Schwab U.S. Aggregate Bond Index Fund | 129,720,084 | 16,677,322 | (5,174,898 ) | (990,646 ) | 4,592,975 | 144,824,837 | 16,820,539 | 2,607,300 |
SECURITY | VALUE AT 10/31/23 | PURCHASES | SALES | REALIZED GAINS (LOSSES) | NET CHANGE IN UNREALIZED APPRECIATION (DEPRECIATION) | VALUE AT 4/30/24 | BALANCE OF SHARES HELD AT 4/30/24 | DISTRIBUTIONS RECEIVED(a) |
Money Market Funds 3.5% | ||||||||
Schwab Variable Share Price Money Fund, Ultra Shares, 5.27% (b) | $30,139,471 | $815,726 | $— | $— | ($69 ) | $30,955,128 | 30,945,844 | $816,075 |
Total Affiliated Underlying Funds (Cost $568,414,515) | $809,870,443 | $119,146,328 | ($148,288,706 ) | $65,050,434 | $46,739,935 | $892,518,434 | $17,823,154 | |
Total Investments in Securities (Cost $568,414,515) | $892,518,434 | |||||||
(a) | Distributions received include distributions from net investment income and capital gains, if any, from the underlying funds. Amounts shown are only presented for affiliated underlying funds, which are presented in the corresponding line-item in the Statement of Operations, if applicable (see financial note 2(d) for additional information). |
(b) | The rate shown is the annualized 7-day yield. |
ETF — | Exchange-Traded Fund |
REIT — | Real Estate Investment Trust |
Assets | ||
Investments in securities, at value - affiliated issuers (cost $568,414,515) | $892,518,434 | |
Cash | 5,119,173 | |
Receivables: | ||
Investments sold | 4,429,858 | |
Dividends | 536,692 | |
Fund shares sold | 97,989 | |
Prepaid expenses | + | 15,365 |
Total assets | 902,717,511 | |
Liabilities | ||
Payables: | ||
Investments bought | 4,821,016 | |
Shareholder service fees | 180,868 | |
Fund shares redeemed | 133,637 | |
Investment adviser and administrator fees | 97,121 | |
Accrued expenses | + | 41,126 |
Total liabilities | 5,273,768 | |
Net assets | $897,443,743 | |
Net Assets by Source | ||
Capital received from investors | $511,215,680 | |
Total distributable earnings | + | 386,228,063 |
Net assets | $897,443,743 | |
Net Asset Value (NAV) | ||||
Net Assets | ÷ | Shares Outstanding | = | NAV |
$897,443,743 | 35,592,489 | $25.21 | ||
For the period November 1, 2023 through April 30, 2024; unaudited | ||
Investment Income | ||
Dividends received from securities - affiliated issuers | $17,823,154 | |
Other interest | + | 58,997 |
Total investment income | 17,882,151 | |
Expenses | ||
Shareholder service fees | 1,075,171 | |
Investment adviser and administrator fees | 581,657 | |
Shareholder reports | 19,742 | |
Registration fees | 16,093 | |
Portfolio accounting fees | 12,568 | |
Professional fees | 11,537 | |
Independent trustees’ fees | 3,831 | |
Transfer agent fees | 1,846 | |
Other expenses | + | 3,634 |
Total expenses | – | 1,726,079 |
Net investment income | 16,156,072 | |
REALIZED AND UNREALIZED GAINS (LOSSES) | ||
Net realized gains on sales of securities - affiliated issuers | 65,050,434 | |
Net change in unrealized appreciation (depreciation) on securities - affiliated issuers | + | 46,739,935 |
Net realized and unrealized gains | 111,790,369 | |
Increase in net assets resulting from operations | $127,946,441 | |
OPERATIONS | |||
11/1/23-4/30/24 | 11/1/22-10/31/23 | ||
Net investment income | $16,156,072 | $15,787,804 | |
Net realized gains | 65,050,434 | 15,467,744 | |
Net change in unrealized appreciation (depreciation) | + | 46,739,935 | 14,791,410 |
Increase in net assets resulting from operations | $127,946,441 | $46,046,958 | |
DISTRIBUTIONS TO SHAREHOLDERS | |||
Total distributions | ($35,285,077 ) | ($35,300,600 ) | |
TRANSACTIONS IN FUND SHARES | |||||
11/1/23-4/30/24 | 11/1/22-10/31/23 | ||||
SHARES | VALUE | SHARES | VALUE | ||
Shares sold | 1,404,394 | $35,077,030 | 2,520,611 | $58,610,427 | |
Shares reinvested | 1,282,352 | 31,904,899 | 1,468,211 | 32,256,601 | |
Shares redeemed | + | (2,947,582 ) | (73,891,827 ) | (3,945,752 ) | (91,827,581 ) |
Net transactions in fund shares | (260,836 ) | ($6,909,898 ) | 43,070 | ($960,553 ) | |
SHARES OUTSTANDING AND NET ASSETS | |||||
11/1/23-4/30/24 | 11/1/22-10/31/23 | ||||
SHARES | NET ASSETS | SHARES | NET ASSETS | ||
Beginning of period | 35,853,325 | $811,692,277 | 35,810,255 | $801,906,472 | |
Total increase (decrease) | + | (260,836 ) | 85,751,466 | 43,070 | 9,785,805 |
End of period | 35,592,489 | $897,443,743 | 35,853,325 | $811,692,277 | |
11/1/23– 4/30/24* | 11/1/22– 10/31/23 | 11/1/21– 10/31/22 | 11/1/20– 10/31/21 | 11/1/19– 10/31/20 | 11/1/18– 10/31/19 | |
Per-Share Data | ||||||
Net asset value at beginning of period | $17.42 | $17.36 | $21.53 | $18.38 | $18.75 | $18.24 |
Income (loss) from investment operations: | ||||||
Net investment income (loss)1 | 0.33 | 0.38 | 0.32 | 0.28 | 0.35 | 0.36 |
Net realized and unrealized gains (losses) | 1.92 | 0.38 | (3.45 ) | 4.11 | 0.10 | 1.32 |
Total from investment operations | 2.25 | 0.76 | (3.13 ) | 4.39 | 0.45 | 1.68 |
Less distributions: | ||||||
Distributions from net investment income | (0.42 ) | (0.31 ) | (0.33 ) | (0.32 ) | (0.39 ) | (0.39 ) |
Distributions from net realized gains | (0.37 ) | (0.39 ) | (0.71 ) | (0.92 ) | (0.43 ) | (0.78 ) |
Total distributions | (0.79 ) | (0.70 ) | (1.04 ) | (1.24 ) | (0.82 ) | (1.17 ) |
Net asset value at end of period | $18.88 | $17.42 | $17.36 | $21.53 | $18.38 | $18.75 |
Total return | 12.96 %2 | 4.47 % | (15.32 %) | 24.66 % | 2.37 % | 10.14 % |
Ratios/Supplemental Data | ||||||
Ratios to average net assets: | ||||||
Net operating expenses3 | 0.39 %4 | 0.39 % | 0.40 %5 | 0.39 % | 0.40 % | 0.40 % |
Gross operating expenses3 | 0.39 %4 | 0.39 % | 0.40 %5 | 0.39 % | 0.40 % | 0.40 % |
Net investment income (loss) | 3.54 %4 | 2.10 % | 1.67 % | 1.39 % | 1.91 % | 1.99 % |
Portfolio turnover rate | 11 %2 | 11 % | 11 % | 10 % | 22 % | 11 % |
Net assets, end of period (x 1,000) | $562,592 | $519,615 | $519,474 | $654,876 | $517,619 | $544,554 |
* | Unaudited. |
1 | Calculated based on the average shares outstanding during the period. |
2 | Not annualized. |
3 | Ratio excludes acquired fund fees and expenses, which are indirect expenses incurred by the fund through its investments in underlying funds. |
4 | Annualized. |
5 | Ratio includes less than 0.005% of non-routine proxy expenses. |
SECURITY | VALUE AT 10/31/23 | PURCHASES | SALES | REALIZED GAINS (LOSSES) | NET CHANGE IN UNREALIZED APPRECIATION (DEPRECIATION) | VALUE AT 4/30/24 | BALANCE OF SHARES HELD AT 4/30/24 | DISTRIBUTIONS RECEIVED(a) |
AFFILIATED UNDERLYING FUNDS 99.4% OF NET ASSETS | ||||||||
U.S. Stocks 38.8% | ||||||||
Large-Cap 32.8% | ||||||||
Schwab Fundamental US Large Company Index Fund | $46,872,358 | $1,586,415 | ($5,846,398 ) | $1,985,346 | $5,811,786 | $50,409,507 | 1,990,897 | $949,680 |
Schwab S&P 500 Index Fund | 109,155,717 | 2,692,986 | (29,168,716 ) | 22,560,105 | (1,778,332 ) | 103,461,760 | 1,334,990 | 1,701,788 |
Schwab U.S. Large-Cap Growth Index Fund | 15,816,681 | 13,516,649 | (1,735,851 ) | 612,184 | 2,506,522 | 30,716,185 | 321,366 | 114,928 |
184,587,452 | ||||||||
Small-Cap 6.0% | ||||||||
Schwab Fundamental US Small Company Index Fund | 13,986,352 | 805,590 | (7,187,078 ) | 1,719,839 | 756,548 | 10,081,251 | 626,554 | 223,469 |
Schwab Small-Cap Index Fund | 32,640,716 | 2,680,087 | (18,173,002 ) | 6,415,367 | (38,697 ) | 23,524,471 | 739,996 | 570,349 |
33,605,722 | ||||||||
218,193,174 | ||||||||
International Stocks 18.0% | ||||||||
Developed Markets 15.5% | ||||||||
Schwab Fundamental International Large Company Index Fund | 15,479,171 | 6,285,467 | (1,788,503 ) | 89,994 | 1,945,009 | 22,011,138 | 2,039,957 | 543,557 |
Schwab Fundamental International Small Company Index Fund | 13,044,211 | 973,761 | (1,355,008 ) | 19,945 | 1,379,349 | 14,062,258 | 1,119,607 | 443,125 |
Schwab International Index Fund | 36,384,271 | 13,043,779 | (3,190,000 ) | 89,129 | 4,746,806 | 51,073,985 | 2,210,995 | 1,298,379 |
87,147,381 | ||||||||
Emerging Markets 2.5% | ||||||||
Schwab Fundamental Emerging Markets Large Company Index Fund | 13,042,032 | 995,879 | (1,387,535 ) | 85,063 | 1,365,148 | 14,100,587 | 1,587,904 | 675,259 |
101,247,968 | ||||||||
Real Estate 3.0% | ||||||||
U.S. REITs 3.0% | ||||||||
Schwab U.S. REIT ETF | 15,606,837 | 1,360,232 | (1,634,636 ) | (151,910 ) | 1,607,233 | 16,787,756 | 895,347 | 285,394 |
Fixed Income 36.2% | ||||||||
Intermediate-Term Bond 35.2% | ||||||||
Schwab U.S. Aggregate Bond Index Fund | 181,663,514 | 18,271,077 | (6,954,446 ) | (1,301,828 ) | 6,445,784 | 198,124,101 | 23,010,929 | 3,584,961 |
Short-Term Bond 1.0% | ||||||||
Schwab Short-Term Bond Index Fund | 5,200,206 | 458,458 | — | — | 31,315 | 5,689,979 | 606,608 | 105,018 |
203,814,080 | ||||||||
SECURITY | VALUE AT 10/31/23 | PURCHASES | SALES | REALIZED GAINS (LOSSES) | NET CHANGE IN UNREALIZED APPRECIATION (DEPRECIATION) | VALUE AT 4/30/24 | BALANCE OF SHARES HELD AT 4/30/24 | DISTRIBUTIONS RECEIVED(a) |
Money Market Funds 3.4% | ||||||||
Schwab Variable Share Price Money Fund, Ultra Shares, 5.27% (b) | $18,788,174 | $508,503 | $— | $— | ($43 ) | $19,296,634 | 19,290,847 | $508,720 |
Total Affiliated Underlying Funds (Cost $417,612,736) | $517,680,240 | $63,178,883 | ($78,421,173 ) | $32,123,234 | $24,778,428 | $559,339,612 | $11,004,627 | |
Total Investments in Securities (Cost $417,612,736) | $559,339,612 | |||||||
(a) | Distributions received include distributions from net investment income and capital gains, if any, from the underlying funds. Amounts shown are only presented for affiliated underlying funds, which are presented in the corresponding line-item in the Statement of Operations, if applicable (see financial note 2(d) for additional information). |
(b) | The rate shown is the annualized 7-day yield. |
ETF — | Exchange-Traded Fund |
REIT — | Real Estate Investment Trust |
Assets | ||
Investments in securities, at value - affiliated issuers (cost $417,612,736) | $559,339,612 | |
Cash | 3,901,796 | |
Receivables: | ||
Investments sold | 2,228,336 | |
Dividends | 697,913 | |
Fund shares sold | 247,542 | |
Prepaid expenses | + | 13,756 |
Total assets | 566,428,955 | |
Liabilities | ||
Payables: | ||
Investments bought | 3,529,114 | |
Shareholder service fees | 113,600 | |
Fund shares redeemed | 101,068 | |
Investment adviser and administrator fees | 60,747 | |
Accrued expenses | + | 32,920 |
Total liabilities | 3,837,449 | |
Net assets | $562,591,506 | |
Net Assets by Source | ||
Capital received from investors | $394,525,121 | |
Total distributable earnings | + | 168,066,385 |
Net assets | $562,591,506 | |
Net Asset Value (NAV) | ||||
Net Assets | ÷ | Shares Outstanding | = | NAV |
$562,591,506 | 29,801,254 | $18.88 | ||
For the period November 1, 2023 through April 30, 2024; unaudited | ||
Investment Income | ||
Dividends received from securities - affiliated issuers | $11,004,627 | |
Other interest | + | 41,305 |
Total investment income | 11,045,932 | |
Expenses | ||
Shareholder service fees | 680,149 | |
Investment adviser and administrator fees | 364,993 | |
Registration fees | 16,119 | |
Portfolio accounting fees | 11,566 | |
Shareholder reports | 11,249 | |
Professional fees | 11,090 | |
Independent trustees’ fees | 3,489 | |
Transfer agent fees | 1,273 | |
Other expenses | + | 2,719 |
Total expenses | – | 1,102,647 |
Net investment income | 9,943,285 | |
REALIZED AND UNREALIZED GAINS (LOSSES) | ||
Net realized gains on sales of securities - affiliated issuers | 32,123,234 | |
Net change in unrealized appreciation (depreciation) on securities - affiliated issuers | + | 24,778,428 |
Net realized and unrealized gains | 56,901,662 | |
Increase in net assets resulting from operations | $66,844,947 | |
OPERATIONS | |||
11/1/23-4/30/24 | 11/1/22-10/31/23 | ||
Net investment income | $9,943,285 | $11,385,744 | |
Net realized gains | 32,123,234 | 8,525,472 | |
Net change in unrealized appreciation (depreciation) | + | 24,778,428 | 3,746,756 |
Increase in net assets resulting from operations | $66,844,947 | $23,657,972 | |
DISTRIBUTIONS TO SHAREHOLDERS | |||
Total distributions | ($23,345,576 ) | ($20,946,171 ) | |
TRANSACTIONS IN FUND SHARES | |||||
11/1/23-4/30/24 | 11/1/22-10/31/23 | ||||
SHARES | VALUE | SHARES | VALUE | ||
Shares sold | 1,460,340 | $27,652,811 | 2,705,855 | $48,665,734 | |
Shares reinvested | 1,111,767 | 20,934,579 | 1,106,066 | 18,946,912 | |
Shares redeemed | + | (2,601,617 ) | (49,110,568 ) | (3,904,221 ) | (70,183,048 ) |
Net transactions in fund shares | (29,510 ) | ($523,178 ) | (92,300 ) | ($2,570,402 ) | |
SHARES OUTSTANDING AND NET ASSETS | |||||
11/1/23-4/30/24 | 11/1/22-10/31/23 | ||||
SHARES | NET ASSETS | SHARES | NET ASSETS | ||
Beginning of period | 29,830,764 | $519,615,313 | 29,923,064 | $519,473,914 | |
Total increase (decrease) | + | (29,510 ) | 42,976,193 | (92,300 ) | 141,399 |
End of period | 29,801,254 | $562,591,506 | 29,830,764 | $519,615,313 | |
11/1/23– 4/30/24* | 11/1/22– 10/31/23 | 11/1/21– 10/31/22 | 11/1/20– 10/31/21 | 11/1/19– 10/31/20 | 11/1/18– 10/31/19 | |
Per-Share Data | ||||||
Net asset value at beginning of period | $14.68 | $14.90 | $18.47 | $16.50 | $16.43 | $15.63 |
Income (loss) from investment operations: | ||||||
Net investment income (loss)1 | 0.27 | 0.36 | 0.29 | 0.26 | 0.30 | 0.35 |
Net realized and unrealized gains (losses) | 1.22 | 0.10 | (2.97 ) | 2.27 | 0.27 | 1.18 |
Total from investment operations | 1.49 | 0.46 | (2.68 ) | 2.53 | 0.57 | 1.53 |
Less distributions: | ||||||
Distributions from net investment income | (0.27 ) | (0.36 ) | (0.30 ) | (0.27 ) | (0.31 ) | (0.36 ) |
Distributions from net realized gains | (0.64 ) | (0.32 ) | (0.59 ) | (0.29 ) | (0.19 ) | (0.37 ) |
Total distributions | (0.91 ) | (0.68 ) | (0.89 ) | (0.56 ) | (0.50 ) | (0.73 ) |
Net asset value at end of period | $15.26 | $14.68 | $14.90 | $18.47 | $16.50 | $16.43 |
Total return | 10.08 %2 | 3.01 % | (15.23 %) | 15.50 % | 3.57 % | 10.31 % |
Ratios/Supplemental Data | ||||||
Ratios to average net assets: | ||||||
Net operating expenses3 | 0.42 %4 | 0.42 % | 0.42 %5 | 0.41 % | 0.42 % | 0.43 % |
Gross operating expenses3 | 0.42 %4 | 0.42 % | 0.42 %5 | 0.41 % | 0.42 % | 0.43 % |
Net investment income (loss) | 3.48 %4 | 2.35 % | 1.73 % | 1.45 % | 1.84 % | 2.19 % |
Portfolio turnover rate | 8 %2 | 9 % | 11 % | 13 % | 35 % | 26 % |
Net assets, end of period (x 1,000) | $196,423 | $195,092 | $227,991 | $335,110 | $278,883 | $263,373 |
* | Unaudited. |
1 | Calculated based on the average shares outstanding during the period. |
2 | Not annualized. |
3 | Ratio excludes acquired fund fees and expenses, which are indirect expenses incurred by the fund through its investments in underlying funds. |
4 | Annualized. |
5 | Ratio includes less than 0.005% of non-routine proxy expenses. |
SECURITY | VALUE AT 10/31/23 | PURCHASES | SALES | REALIZED GAINS (LOSSES) | NET CHANGE IN UNREALIZED APPRECIATION (DEPRECIATION) | VALUE AT 4/30/24 | BALANCE OF SHARES HELD AT 4/30/24 | DISTRIBUTIONS RECEIVED(a) |
AFFILIATED UNDERLYING FUNDS 99.6% OF NET ASSETS | ||||||||
U.S. Stocks 25.8% | ||||||||
Large-Cap 21.8% | ||||||||
Schwab Fundamental US Large Company Index Fund | $11,723,493 | $303,179 | ($2,234,880 ) | $760,591 | $1,160,018 | $11,712,401 | 462,575 | $232,503 |
Schwab S&P 500 Index Fund | 27,459,098 | 733,239 | (7,988,438 ) | 6,216,161 | (1,106,034 ) | 25,314,026 | 326,633 | 418,588 |
Schwab U.S. Large-Cap Growth Index Fund | 3,892,867 | 1,824,224 | (650,497 ) | 209,229 | 596,158 | 5,871,981 | 61,435 | 28,447 |
42,898,408 | ||||||||
Small-Cap 4.0% | ||||||||
Schwab Fundamental US Small Company Index Fund | 3,502,371 | 172,738 | (1,977,510 ) | 516,417 | 101,820 | 2,315,836 | 143,930 | 55,015 |
Schwab Small-Cap Index Fund | 8,173,746 | 655,229 | (4,951,965 ) | 2,681,080 | (1,091,755 ) | 5,466,335 | 171,951 | 140,410 |
7,782,171 | ||||||||
50,680,579 | ||||||||
International Stocks 12.0% | ||||||||
Developed Markets 10.3% | ||||||||
Schwab Fundamental International Large Company Index Fund | 3,884,808 | 1,398,600 | (796,835 ) | 61,251 | 446,953 | 4,994,777 | 462,908 | 134,501 |
Schwab Fundamental International Small Company Index Fund | 3,247,055 | 363,799 | (641,745 ) | 42,816 | 309,550 | 3,321,475 | 264,449 | 105,901 |
Schwab International Index Fund | 9,109,825 | 2,969,469 | (1,310,558 ) | 182,140 | 1,012,460 | 11,963,336 | 517,893 | 319,595 |
20,279,588 | ||||||||
Emerging Markets 1.7% | ||||||||
Schwab Fundamental Emerging Markets Large Company Index Fund | 3,266,669 | 168,296 | (516,234 ) | 37,630 | 306,916 | 3,263,277 | 367,486 | 168,296 |
23,542,865 | ||||||||
Real Estate 2.0% | ||||||||
U.S. REITs 2.0% | ||||||||
Schwab U.S. REIT ETF | 3,910,611 | 320,358 | (701,060 ) | (70,382 ) | 441,523 | 3,901,050 | 208,056 | 69,733 |
Fixed Income 56.2% | ||||||||
Intermediate-Term Bond 55.2% | ||||||||
Schwab U.S. Aggregate Bond Index Fund | 107,231,219 | 6,864,949 | (8,832,093 ) | (1,301,374 ) | 4,521,576 | 108,484,277 | 12,599,800 | 2,038,055 |
Short-Term Bond 1.0% | ||||||||
Schwab Short-Term Bond Index Fund | 1,953,161 | 37,976 | — | — | 14,274 | 2,005,411 | 213,797 | 37,782 |
110,489,688 | ||||||||
SECURITY | VALUE AT 10/31/23 | PURCHASES | SALES | REALIZED GAINS (LOSSES) | NET CHANGE IN UNREALIZED APPRECIATION (DEPRECIATION) | VALUE AT 4/30/24 | BALANCE OF SHARES HELD AT 4/30/24 | DISTRIBUTIONS RECEIVED(a) |
Money Market Funds 3.6% | ||||||||
Schwab Variable Share Price Money Fund, Ultra Shares, 5.27% (b) | $7,629,375 | $187,736 | ($800,000 ) | ($240 ) | $224 | $7,017,095 | 7,014,990 | $185,934 |
Total Affiliated Underlying Funds (Cost $168,011,325) | $194,984,298 | $15,999,792 | ($31,401,815 ) | $9,335,319 | $6,713,683 | $195,631,277 | $3,934,760 | |
Total Investments in Securities (Cost $168,011,325) | $195,631,277 | |||||||
(a) | Distributions received include distributions from net investment income and capital gains, if any, from the underlying funds. Amounts shown are only presented for affiliated underlying funds, which are presented in the corresponding line-item in the Statement of Operations, if applicable (see financial note 2(d) for additional information). |
(b) | The rate shown is the annualized 7-day yield. |
ETF — | Exchange-Traded Fund |
REIT — | Real Estate Investment Trust |
Assets | ||
Investments in securities, at value - affiliated issuers (cost $168,011,325) | $195,631,277 | |
Cash | 818,407 | |
Receivables: | ||
Investments sold | 494,216 | |
Dividends | 371,913 | |
Fund shares sold | 48,674 | |
Prepaid expenses | + | 9,397 |
Total assets | 197,373,884 | |
Liabilities | ||
Payables: | ||
Investments bought | 773,874 | |
Fund shares redeemed | 88,374 | |
Shareholder service fees | 40,192 | |
Investment adviser and administrator fees | 21,328 | |
Accrued expenses | + | 27,312 |
Total liabilities | 951,080 | |
Net assets | $196,422,804 | |
Net Assets by Source | ||
Capital received from investors | $164,711,312 | |
Total distributable earnings | + | 31,711,492 |
Net assets | $196,422,804 | |
Net Asset Value (NAV) | ||||
Net Assets | ÷ | Shares Outstanding | = | NAV |
$196,422,804 | 12,867,566 | $15.26 | ||
For the period November 1, 2023 through April 30, 2024; unaudited | ||
Investment Income | ||
Dividends received from securities - affiliated issuers | $3,934,760 | |
Other interest | + | 13,041 |
Total investment income | 3,947,801 | |
Expenses | ||
Shareholder service fees | 246,235 | |
Investment adviser and administrator fees | 131,842 | |
Registration fees | 11,238 | |
Professional fees | 10,588 | |
Portfolio accounting fees | 10,490 | |
Shareholder reports | 5,069 | |
Independent trustees’ fees | 3,123 | |
Transfer agent fees | 688 | |
Other expenses | + | 1,655 |
Total expenses | – | 420,928 |
Net investment income | 3,526,873 | |
REALIZED AND UNREALIZED GAINS (LOSSES) | ||
Net realized gains on sales of securities - affiliated issuers | 9,335,319 | |
Net change in unrealized appreciation (depreciation) on securities - affiliated issuers | + | 6,713,683 |
Net realized and unrealized gains | 16,049,002 | |
Increase in net assets resulting from operations | $19,575,875 | |
OPERATIONS | |||
11/1/23-4/30/24 | 11/1/22-10/31/23 | ||
Net investment income | $3,526,873 | $5,193,590 | |
Net realized gains | 9,335,319 | 6,476,963 | |
Net change in unrealized appreciation (depreciation) | + | 6,713,683 | (3,716,909 ) |
Increase in net assets resulting from operations | $19,575,875 | $7,953,644 | |
DISTRIBUTIONS TO SHAREHOLDERS | |||
Total distributions | ($11,808,826 ) | ($9,825,182 ) | |
TRANSACTIONS IN FUND SHARES | |||||
11/1/23-4/30/24 | 11/1/22-10/31/23 | ||||
SHARES | VALUE | SHARES | VALUE | ||
Shares sold | 540,231 | $8,416,872 | 839,172 | $12,876,136 | |
Shares reinvested | 652,590 | 10,109,124 | 567,726 | 8,497,016 | |
Shares redeemed | + | (1,615,096 ) | (24,961,987 ) | (3,421,970 ) | (52,400,401 ) |
Net transactions in fund shares | (422,275 ) | ($6,435,991 ) | (2,015,072 ) | ($31,027,249 ) | |
SHARES OUTSTANDING AND NET ASSETS | |||||
11/1/23-4/30/24 | 11/1/22-10/31/23 | ||||
SHARES | NET ASSETS | SHARES | NET ASSETS | ||
Beginning of period | 13,289,841 | $195,091,746 | 15,304,913 | $227,990,533 | |
Total increase (decrease) | + | (422,275 ) | 1,331,058 | (2,015,072 ) | (32,898,787 ) |
End of period | 12,867,566 | $196,422,804 | 13,289,841 | $195,091,746 | |
SCHWAB CAPITAL TRUST | |
Schwab MarketTrack All Equity Portfolio | Schwab Target 2045 Fund |
Schwab MarketTrack Growth Portfolio | Schwab Target 2050 Fund |
Schwab MarketTrack Balanced Portfolio | Schwab Target 2055 Fund |
Schwab MarketTrack Conservative Portfolio | Schwab Target 2060 Fund |
Schwab S&P 500 Index Fund | Schwab Target 2065 Fund |
Schwab Small-Cap Index Fund® | Schwab Fundamental US Large Company Index Fund |
Schwab Total Stock Market Index Fund® | Schwab Fundamental US Small Company Index Fund |
Schwab U.S. Large-Cap Growth Index Fund | Schwab Fundamental International Large Company Index Fund |
Schwab U.S. Large-Cap Value Index Fund | Schwab Fundamental International Small Company Index Fund |
Schwab U.S. Mid-Cap Index Fund | Schwab Fundamental Emerging Markets Large Company Index Fund |
Schwab International Index Fund® | Schwab Fundamental Global Real Estate Index Fund |
Schwab International Opportunities Fund | Schwab Target 2010 Index Fund |
Schwab Balanced Fund | Schwab Target 2015 Index Fund |
Schwab Core Equity Fund | Schwab Target 2020 Index Fund |
Schwab Dividend Equity Fund | Schwab Target 2025 Index Fund |
Schwab Large-Cap Growth Fund | Schwab Target 2030 Index Fund |
Schwab Small-Cap Equity Fund | Schwab Target 2035 Index Fund |
Schwab Health Care Fund | Schwab Target 2040 Index Fund |
Schwab International Core Equity Fund | Schwab Target 2045 Index Fund |
Schwab Target 2010 Fund | Schwab Target 2050 Index Fund |
Schwab Target 2015 Fund | Schwab Target 2055 Index Fund |
Schwab Target 2020 Fund | Schwab Target 2060 Index Fund |
Schwab Target 2025 Fund | Schwab Target 2065 Index Fund |
Schwab Target 2030 Fund | Schwab Monthly Income Fund - Target Payout |
Schwab Target 2035 Fund | Schwab Monthly Income Fund - Flexible Payout |
Schwab Target 2040 Fund | Schwab Monthly Income Fund - Income Payout |
Each fund in this report offers one share class. Shares are bought and sold at closing net asset value per share (NAV), which is the price for all outstanding shares of a fund. Each share has a par value of 1/1,000 of a cent, and the funds’ Board of Trustees (the Board) may authorize the issuance of as many shares as necessary.
The Schwab MarketTrack Growth Portfolio seeks high capital growth with less volatility than an all-stock portfolio.
The Schwab MarketTrack Balanced Portfolio seeks both capital growth and income.
The Schwab MarketTrack Conservative Portfolio seeks income and more growth potential than an all-bond portfolio.
3. Risk Factors:
SCHWAB MARKETTRACK ALL EQUITY PORTFOLIO | SCHWAB MARKETTRACK GROWTH PORTFOLIO | SCHWAB MARKETTRACK BALANCED PORTFOLIO | SCHWAB MARKETTRACK CONSERVATIVE PORTFOLIO |
0.50 % | 0.50 % | 0.50 % | 0.50 % |
UNDERLYING FUNDS | SCHWAB MARKETTRACK ALL EQUITY PORTFOLIO | SCHWAB MARKETTRACK GROWTH PORTFOLIO | SCHWAB MARKETTRACK BALANCED PORTFOLIO | SCHWAB MARKETTRACK CONSERVATIVE PORTFOLIO |
Schwab Fundamental Emerging Markets Large Company Index Fund | 5.2 % | 3.6 % | 1.7 % | 0.4 % |
Schwab Fundamental International Large Company Index Fund | 2.3 % | 1.8 % | 0.9 % | 0.2 % |
Schwab Fundamental International Small Company Index Fund | 7.5 % | 5.3 % | 2.5 % | 0.6 % |
Schwab Fundamental US Large Company Index Fund | 1.4 % | 1.3 % | 0.6 % | 0.1 % |
Schwab Fundamental US Small Company Index Fund | 1.6 % | 1.3 % | 0.5 % | 0.1 % |
Schwab International Index Fund | 1.5 % | 1.2 % | 0.6 % | 0.1 % |
Schwab S&P 500 Index Fund | 0.3 % | 0.2 % | 0.1 % | 0.0 %* |
Schwab Short-Term Bond Index Fund | — % | — % | 0.4 % | 0.1 % |
Schwab Small-Cap Index Fund | 1.2 % | 1.0 % | 0.4 % | 0.1 % |
Schwab U.S. Aggregate Bond Index Fund | — % | 3.2 % | 4.4 % | 2.4 % |
Schwab U.S. Large-Cap Growth Index Fund | 3.4 % | 3.0 % | 1.4 % | 0.3 % |
Schwab U.S. REIT ETF | 0.7 % | 0.6 % | 0.3 % | 0.1 % |
Schwab Variable Share Price Money Fund, Ultra Shares | — % | 0.5 % | 0.3 % | 0.1 % |
* | Less than 0.05% |
PURCHASE COST | SALE PROCEEDS | REALIZED GAINS (LOSSES) | |
Schwab MarketTrack All Equity Portfolio | $39,282 | $— | $— |
Schwab MarketTrack Growth Portfolio | 21,777 | — | — |
Schwab MarketTrack Balanced Portfolio | 9,628 | — | — |
Schwab MarketTrack Conservative Portfolio | 2,835 | 103,655 | (5,866 ) |
6. Borrowing from Banks:
7. Purchases and Sales of Investment Securities:
PURCHASES OF SECURITIES | SALES OF SECURITIES | |
Schwab MarketTrack All Equity Portfolio | $105,683,218 | $110,297,285 |
Schwab MarketTrack Growth Portfolio | 119,146,328 | 148,288,706 |
Schwab MarketTrack Balanced Portfolio | 63,178,883 | 78,421,173 |
Schwab MarketTrack Conservative Portfolio | 15,999,792 | 31,401,815 |
8. Federal Income Taxes:
TAX COST | GROSS UNREALIZED APPRECIATION | GROSS UNREALIZED DEPRECIATION | NET UNREALIZED APPRECIATION (DEPRECIATION) | |
Schwab MarketTrack All Equity Portfolio | $491,789,669 | $353,056,904 | ($3,173,459 ) | $349,883,445 |
Schwab MarketTrack Growth Portfolio | 573,100,648 | 339,846,644 | (20,428,858 ) | 319,417,786 |
Schwab MarketTrack Balanced Portfolio | 425,813,407 | 159,801,391 | (26,275,186 ) | 133,526,205 |
Schwab MarketTrack Conservative Portfolio | 174,442,106 | 35,068,282 | (13,879,111 ) | 21,189,171 |
PRIOR FISCAL YEAR END DISTRIBUTIONS | ||
ORDINARY INCOME | LONG-TERM CAPITAL GAINS | |
Schwab MarketTrack All Equity Portfolio | $10,865,426 | $22,576,990 |
Schwab MarketTrack Growth Portfolio | 13,427,485 | 21,873,115 |
Schwab MarketTrack Balanced Portfolio | 9,217,623 | 11,728,548 |
Schwab MarketTrack Conservative Portfolio | 5,105,118 | 4,720,064 |
9. Subsequent Events:
Independent Trustees | |||
Name, Year of Birth, and Position(s) with the trust (Terms of office, and length of Time Served1) | Principal Occupations During the Past Five Years | Number of Portfolios in Fund Complex Overseen by the Trustee | Other Directorships |
Michael J. Beer 1961 Trustee (Trustee of The Charles Schwab Family of Funds, Schwab Investments, Schwab Capital Trust, Schwab Annuity Portfolios, Schwab Strategic Trust and Laudus Trust since 2022) | Retired. Director, President and Chief Executive Officer (Dec. 2016 – Sept. 2019), Principal Funds (investment management). | 106 | Director (2016 – 2019), Principal Funds, Inc. |
Robert W. Burns 1959 Trustee (Trustee of Schwab Strategic Trust since 2009; The Charles Schwab Family of Funds, Schwab Investments, Schwab Capital Trust, Schwab Annuity Portfolios and Laudus Trust since 2016) | Retired/Private Investor. | 106 | None |
Nancy F. Heller 1956 Trustee (Trustee of The Charles Schwab Family of Funds, Schwab Investments, Schwab Capital Trust, Schwab Annuity Portfolios, Schwab Strategic Trust and Laudus Trust since 2018) | Retired. | 106 | None |
David L. Mahoney 1954 Trustee (Trustee of The Charles Schwab Family of Funds, Schwab Investments, Schwab Capital Trust, Schwab Annuity Portfolios and Laudus Trust since 2011; Schwab Strategic Trust since 2016) | Private Investor. | 106 | Director (2004 – present), Corcept Therapeutics Incorporated Director (2009 – 2021), Adamas Pharmaceuticals, Inc. Director (2003 – 2019), Symantec Corporation |
Jane P. Moncreiff 1961 Trustee (Trustee of The Charles Schwab Family of Funds, Schwab Investments, Schwab Capital Trust, Schwab Annuity Portfolios, Schwab Strategic Trust and Laudus Trust since 2019) | Consultant (2018 – present), Fulham Advisers LLC (management consulting); Chief Investment Officer (2009 – 2017), CareGroup Healthcare System, Inc. (healthcare). | 106 | None |
Independent Trustees (continued) | |||
Name, Year of Birth, and Position(s) with the trust (Terms of office, and length of Time Served1) | Principal Occupations During the Past Five Years | Number of Portfolios in Fund Complex Overseen by the Trustee | Other Directorships |
Kimberly S. Patmore 1956 Trustee (Trustee of The Charles Schwab Family of Funds, Schwab Investments, Schwab Capital Trust, Schwab Annuity Portfolios, Schwab Strategic Trust and Laudus Trust since 2016) | Consultant (2008 – present), Patmore Management Consulting (management consulting). | 106 | None |
J. Derek Penn 1957 Trustee (Trustee of The Charles Schwab Family of Funds, Schwab Investments, Schwab Capital Trust, Schwab Annuity Portfolios, Schwab Strategic Trust and Laudus Trust since 2021) | Head of Equity Sales and Trading (2006 – 2018), BNY Mellon (financial services). | 106 | None |
Interested Trustees | |||
Name, Year of Birth, and Position(s) with the trust (Terms of office, and length of Time Served1) | Principal Occupations During the Past Five Years | Number of Portfolios in Fund Complex Overseen by the Trustee | Other Directorships |
Walter W. Bettinger II2 1960 Chairman and Trustee (Trustee of The Charles Schwab Family of Funds, Schwab Investments, Schwab Capital Trust and Schwab Annuity Portfolios since 2008; Schwab Strategic Trust since 2009; Laudus Trust since 2010) | Co-Chairman of the Board (July 2022 – present), Director and Chief Executive Officer (Oct. 2008 – present) and President (Feb. 2007 – Oct. 2021), The Charles Schwab Corporation; President and Chief Executive Officer (Oct. 2008 – Oct. 2021) and Director (May 2008 – Oct. 2021), Charles Schwab & Co., Inc.; Co-Chairman of the Board (July 2022 – present) and Director (Apr. 2006 – present), Charles Schwab Bank, SSB; Co-Chairman of the Board (July 2022 – present) and Director (Nov. 2017 – present), Charles Schwab Premier Bank, SSB; Co-Chairman of the Board (July 2022 – present) and Director (July 2019 – present), Charles Schwab Trust Bank; Director (May 2008 – present), Chief Executive Officer (Aug. 2017 – present) and President (Aug. 2017 – Nov. 2021), Schwab Holdings, Inc.; Manager (Sept. 2023 – present), TD Ameritrade Holding LLC; Director (Oct. 2020 – Aug. 2023), TD Ameritrade Holding Corporation; Director (July 2016 – Oct. 2021), Charles Schwab Investment Management, Inc. | 106 | Director (2008 – present), The Charles Schwab Corporation |
Richard A. Wurster2 1973 Trustee (Trustee of The Charles Schwab Family of Funds, Schwab Investments, Schwab Capital Trust, Schwab Annuity Portfolios, Schwab Strategic Trust and Laudus Trust since 2022) | President (Oct. 2021 – present) and Executive Vice President – Schwab Asset Management Solutions (Apr. 2019 – Oct. 2021), The Charles Schwab Corporation; President, Director (Oct. 2021 – present), Executive Vice President – Schwab Asset Management Solutions (July 2019 – Oct. 2021) and Senior Vice President – Advisory (May 2016 – July 2019), Charles Schwab & Co., Inc.; President (Nov. 2021 – present), Schwab Holdings, Inc.; Director (Oct. 2021 – present) and Chief Executive Officer (Nov. 2019 – Jan. 2022), Charles Schwab Investment Management, Inc.; Director, Chief Executive Officer and President (Mar. 2018 – Oct. 2022), Charles Schwab Investment Advisory, Inc.; Chief Executive Officer (July 2016 – Apr. 2018) and President (Mar. 2017 – Apr. 2018), ThomasPartners, Inc.; Chief Executive Officer (July 2016 – Apr. 2018), Windhaven Investment Management, Inc. | 106 | None |
Officers of the Trust | |
Name, Year of Birth, and Position(s) with the trust (Terms of office, and length of Time Served3) | Principal Occupations During the Past Five Years |
Omar Aguilar 1970 Chief Executive Officer, President and Chief Investment Officer (Officer of The Charles Schwab Family of Funds, Schwab Investments, Schwab Capital Trust, Schwab Annuity Portfolios, Schwab Strategic Trust and Laudus Trust since 2011) | Chief Executive Officer (Jan. 2022 – present), President (Oct. 2023 – present), (Chief Investment Officer (Apr. 2011 – present) and Senior Vice President (Apr. 2011 – Jan. 2022), Charles Schwab Investment Management, Inc.; Director, Chief Executive Officer and President (Oct. 2022 – present), Charles Schwab Investment Advisory, Inc.; Chief Executive Officer (Sept. 2023 – present), President (Oct. 2023 – present), Chief Investment Officer (June 2011 – present) and Vice President (June 2011 – Sept. 2023), Schwab Funds, Laudus Trust and Schwab ETFs. |
Mark Fischer 1970 Chief Operating Officer (Officer of The Charles Schwab Family of Funds, Schwab Investments, Schwab Capital Trust, Schwab Annuity Portfolios, Schwab Strategic Trust and Laudus Trust since 2013) | Chief Operating Officer (Dec. 2020 – present) and Treasurer and Chief Financial Officer (Jan. 2016 – Dec. 2022), Schwab Funds, Laudus Trust and Schwab ETFs; Chief Financial Officer (Mar. 2020 – present), Chief Operating Officer (Oct. 2023 – present), Managing Director (Mar. 2023 – present) and Vice President (Oct. 2013 – Mar. 2023), Charles Schwab Investment Management, Inc. |
Dana Smith 1965 Treasurer and Chief Financial Officer (Officer of The Charles Schwab Family of Funds, Schwab Investments, Schwab Capital Trust, Schwab Annuity Portfolios, Schwab Strategic Trust and Laudus Trust since 2023) | Treasurer and Chief Financial Officer (Jan. 2023 – present) and Assistant Treasurer (Dec. 2015 – Dec. 2022), Schwab Funds, Laudus Trust and Schwab ETFs; Managing Director (Mar. 2023 – present), Vice President (Mar. 2022 – Mar. 2023) and Director (Oct. 2015 – Mar. 2022), Charles Schwab Investment Management, Inc.; Managing Director (May 2022 – present) and Vice President (Apr. 2022 – May 2022), Charles Schwab & Co., Inc. |
Patrick Cassidy 1964 Vice President and Chief Investment Officer (Officer of The Charles Schwab Family of Funds, Schwab Investments, Schwab Capital Trust, Schwab Annuity Portfolios, Schwab Strategic Trust and Laudus Trust since 2018) | Chief Investment Officer (Oct. 2023 – present) and Vice President (Feb. 2018 – present), Schwab Funds, Laudus Trust and Schwab ETFs; Managing Director (Mar. 2023 – present), Chief Investment Officer (Oct. 2023 – present), and Senior Vice President (Oct. 2012 – Mar. 2023), Charles Schwab Investment Management, Inc. |
William P. McMahon, Jr. 1972 Vice President and Chief Investment Officer (Officer of The Charles Schwab Family of Funds, Schwab Investments, Schwab Capital Trust, Schwab Annuity Portfolios, Schwab Strategic Trust and Laudus Trust since 2021) | Managing Director (Mar. 2023 – present), Senior Vice President (Jan. 2020 – Mar. 2023) and Chief Investment Officer (Jan. 2020 – present) Charles Schwab Investment Management, Inc.; Vice President and Chief Investment Officer (June 2021 – present), Schwab Funds, Laudus Trust and Schwab ETFs; Senior Vice President and Chief Investment Officer – ThomasPartners Strategies (Apr. 2018 – Dec. 2019), Charles Schwab Investment Advisory, Inc.; Senior Vice President and Chief Investment Officer (May 2001 – Apr. 2018), ThomasPartners, Inc. |
Catherine MacGregor 1964 Chief Legal Officer and Secretary, Schwab Funds and Schwab ETFs Chief Legal Officer, Vice President and Clerk, Laudus Trust (Officer of The Charles Schwab Family of Funds, Schwab Investments, Schwab Capital Trust, Schwab Annuity Portfolios and Laudus Trust since 2005; Schwab Strategic Trust since 2009) | Chief Legal Officer (Mar. 2022 – present), Managing Director (Mar. 2023 – present) and Vice President (Sept. 2005 – Mar. 2023), Charles Schwab Investment Management, Inc.; Managing Director (May 2022 – present) and Vice President (Aug. 2005 – May 2022), Charles Schwab & Co., Inc.; Vice President (Dec. 2005 – present) and Chief Legal Officer and Clerk (Mar. 2007 – present), Laudus Trust; Chief Legal Officer and Secretary (Oct. 2021 – present), Vice President (Nov. 2005 – Oct. 2021) and Assistant Secretary (June 2007 – Oct. 2021), Schwab Funds; Chief Legal Officer and Secretary (Oct. 2021 – present), Vice President and Assistant Secretary (Oct. 2009 – Oct. 2021), Schwab ETFs. |
Member SIPC®
Printed on recycled paper.
Item 2: Code of Ethics.
Not applicable to this semi-annual report.
Item 3: Audit Committee Financial Expert.
Not applicable to this semi-annual report.
Item 4: Principal Accountant Fees and Services.
Not applicable to this semi-annual report.
Item 5: Audit Committee of Listed Registrants.
Not applicable.
Item 6: Schedule of Investments.
The schedules of investments are included as part of the report to shareholders filed under Item 1 of this Form.
Item 7: Financial Statements and Financial Highlights for Open-End Management Investment Companies.
The financial statements and financial highlights are included as part of the report to shareholders filed under Item 1 of this Form.
Item 8: Changes in and Disagreements with Accountants for Open-End Management Investment Companies.
Not applicable.
Item 9: Proxy Disclosures for Open-End Management Investment Companies.
Not applicable.
Item 10: Remuneration Paid to Directors, Officers, and Others of Open-End Management Investment Companies.
The remuneration paid to directors, officers and others are included as part of the report to shareholders filed under Item 1 of this Form.
Item 11: Statement Regarding Basis for Approval of Investment Advisory Contract.
Not applicable.
Item 12: Disclosure of Proxy Voting Policies and Procedures for Closed-End Management Investment Companies.
Not applicable.
Item 13: Portfolio Managers of Closed-End Management Investment Companies.
Not applicable.
Item 14: Purchases of Equity Securities by Closed-End Management Investment Company and Affiliated Purchasers.
Not applicable.
Item 15: Submission of Matters to a Vote of Security Holders.
Not applicable.
Item 16: Controls and Procedures.
| (a) | Based on their evaluation of Registrant’s disclosure controls and procedures, as of a date within 90 days of the filing date, Registrant’s Principal Executive Officer, Omar Aguilar and Registrant’s Principal Financial Officer, Dana Smith, have concluded that Registrant’s disclosure controls and procedures are: (i) reasonably designed to ensure that information required to be disclosed in this report is appropriately communicated to Registrant’s officers to allow timely decisions regarding disclosures required in this report; (ii) reasonably designed to ensure that information required to be disclosed in this report is recorded, processed, summarized and reported in a timely manner; and (iii) are effective in achieving the goals described in (i) and (ii) above. |
| (b) | During the period covered by this report, there have been no changes in Registrant’s internal control over financial reporting that the above officers believe to have materially affected, or to be reasonably likely to materially affect, Registrant’s internal control over financial reporting. |
Item 17: Disclosure of Securities Lending Activities for Closed-End Management Investment Companies.
Not applicable.
Item 18: Recovery of Erroneously Awarded Compensation.
| (a) | Not applicable. |
| (b) | Not applicable. |
Item 19: Exhibits.
| (a) | (1) Code of ethics – not applicable to this semi-annual report. |
| (2) | Not applicable. |
| (3) |
| (b) |
Pursuant to the requirements of the Securities Exchange Act of 1934 and the Investment Company Act of 1940, the registrant has duly caused this report to be signed on its behalf by the undersigned, thereunto duly authorized.
(Registrant) Schwab Capital Trust
| By: | /s/ Omar Aguilar | |
Omar Aguilar Principal Executive Officer | ||
| Date: June 17, 2024 | ||
Pursuant to the requirements of the Securities Exchange Act of 1934 and the Investment Company Act of 1940, this report has been signed below by the following persons on behalf of the registrant and in the capacities and on the dates indicated.
| By: | /s/ Omar Aguilar | |
Omar Aguilar Principal Executive Officer | ||
| Date: June 17, 2024 | ||
| By: | /s/ Dana Smith | |
Dana Smith Principal Financial Officer | ||
| Date: June 17, 2024 | ||