UNITED STATES
SECURITIES AND EXCHANGE COMMISSION
Washington, D.C. 20549
FORM N-CSR
CERTIFIED SHAREHOLDER REPORT OF REGISTERED MANAGEMENT
INVESTMENT COMPANIES
Investment Company Act file number 811-7762
First Eagle Funds
(Exact name of registrant as specified in charter)
1345 Avenue of the Americas
New York, NY 10105
(Address of principal executive offices) (Zip code)
Sheelyn Michael
First Eagle Funds
1345 Avenue of the Americas
New York, NY 10105
(Name and address of agent for service)
Registrant’s telephone number, including area code: 1-212-632-2700
Date of fiscal year end: October 31
Date of reporting period: October 31, 2023
Form N-CSR is to be used by management investment companies to file reports with the Commission not later than 10 days after the transmission to stockholders of any report that is required to be transmitted to stockholders under Rule 30e-1 under the Investment Company Act of 1940 (17 CFR 270.30e-1). The Commission may use the information provided on Form N-CSR in its regulatory, disclosure review, inspection, and policymaking roles.
A registrant is required to disclose the information specified by Form N-CSR, and the Commission will make this information public. A registrant is not required to respond to the collection of information contained in Form N-CSR unless the Form displays a currently valid Office of Management and Budget (“OMB”) control number. Please direct comments concerning the accuracy of the information collection burden estimate and any suggestions for reducing the burden to Secretary, Securities and Exchange Commission, 450 Fifth Street, NW, Washington, DC 20549-0609. The OMB has reviewed this collection of information under the clearance requirements of 44 U.S.C. § 3507.
| Item 1. | Reports to Stockholders. |
Insert-annual report here.

Annual Report
October 31, 2023
First Eagle Global Fund
First Eagle Overseas Fund
First Eagle U.S. Value Fund
First Eagle Gold Fund
First Eagle Global Income Builder Fund
First Eagle High Income Fund
First Eagle Rising Dividend Fund
(formerly First Eagle Fund of America)
First Eagle Small Cap Opportunity Fund
First Eagle U.S. Smid Cap Opportunity Fund
First Eagle Global Real Assets Fund
Advised by First Eagle Investment Management, LLC

Forward-Looking Statement Disclosure
One of our most important responsibilities as mutual fund managers is to communicate with shareholders in an open and direct manner. Some of our comments in our letters to shareholders are based on current management expectations and are considered "forward-looking statements". Actual future results, however, may prove to be different from our expectations. You can identify forward-looking statements by words such as "may", "will", "believe", "attempt", "seek", "think", "ought", "try" and other similar terms. We cannot promise future returns. Our opinions are a reflection of our best judgment at the time this report is compiled, and we disclaim any obligation to update or alter forward-looking statements as a result of new information, future events, or otherwise.
First Eagle Funds | Annual Report | October 31, 2023
2
Table of Contents
Letter from the President | | | 6 | | |
Management's Discussion of Fund Performance | | | 8 | | |
Performance Chart | | | 16 | | |
First Eagle Global Fund | |
Fund Overview | | | 28 | | |
Consolidated Schedule of Investments | | | 30 | | |
First Eagle Overseas Fund | |
Fund Overview | | | 42 | | |
Consolidated Schedule of Investments | | | 44 | | |
First Eagle U.S. Value Fund | |
Fund Overview | | | 54 | | |
Consolidated Schedule of Investments | | | 56 | | |
First Eagle Gold Fund | |
Fund Overview | | | 62 | | |
Consolidated Schedule of Investments | | | 64 | | |
First Eagle Global Income Builder Fund | |
Fund Overview | | | 68 | | |
Schedule of Investments | | | 70 | | |
First Eagle High Income Fund | |
Fund Overview | | | 86 | | |
Schedule of Investments | | | 88 | | |
First Eagle Rising Dividend (formerly First Eagle Fund of America) | |
Fund Overview | | | 96 | | |
Schedule of Investments | | | 98 | | |
First Eagle Small Cap Opportunity Fund | |
Fund Overview | | | 102 | | |
Schedule of Investments | | | 104 | | |
First Eagle U.S. Smid Cap Opportunity Fund | |
Fund Overview | | | 116 | | |
Schedule of Investments | | | 118 | | |
First Eagle Global Real Assets Fund | |
Fund Overview | | | 124 | | |
Consolidated Schedule of Investments | | | 126 | | |
First Eagle Funds | Annual Report | October 31, 2023
3
Statements of Assets and Liabilities | | | 132 | | |
Statements of Operations | | | 142 | | |
Statements of Changes in Net Assets | | | 152 | | |
Financial Highlights | | | 166 | | |
Notes to Financial Statements | | | 186 | | |
Report of Independent Registered Accounting Firm | | | 223 | | |
Fund Expenses | | | 225 | | |
General Information | | | 232 | | |
Board Considerations for Continuation of Advisory Agreement | | | 233 | | |
Board Review of Management's Liquidity Risk Management Program | | | 238 | | |
Tax Information | | | 239 | | |
Privacy Notice | | | 240 | | |
Additional Information | | | 245 | | |
First Eagle Funds | Annual Report | October 31, 2023
4
This page was intentionally left blank.
Letter from the President

Dear Fellow Shareholders,
Financial market sentiment fluctuated significantly over the 12 months covered by this report, as investors sought to discern the path of global monetary policy while also processing the potential impacts of a range of exogenous shocks, from wars and other geopolitical tensions to bank failures and threats of government shutdowns in the US. Despite these potential headwinds, risk assets generally moved higher over the past year, even if much of the heavy lifting at the index level was done by a small cohort of very large tech-oriented companies tapping into secular growth trends like artificial intelligence.
We have seen indicators of slowing in many Asian and European economies, but the U.S. economy continues to be strong 18 months into a rate-hike cycle that brought the Federal Reserve's policy rate from zero to an upper bound of 5.5%. Such persistence is not guaranteed, however, and it seems likely that conditions will become more challenging as the aggregate impacts of policy tightening mount. And though Fed rhetoric suggests the central bank is still hopeful for a "soft landing," the prospects of such an outcome do not necessarily appear more certain now than they have at any other point since the Fed began squeezing liquidity from the system. Inflation has eased considerably, but it remains above the Fed's target—and the last mile may be the hardest mile. Energy costs, housing prices and tight labor markets are all fighting against the Fed, and it's unclear what it will take to tame them. It may be a bumpy ride from here to the terminal rate.1
Perhaps more concerning, however, is the massive amount of sovereign debt outstanding. It's been our observation that the accumulation of debt in certain pockets of the economy has often served as fertile breeding ground for crises, and we believe sovereign debt is at the epicenter of indebtedness today. We believe fiscal policy has been on an unsustainable trajectory since the global financial crisis, not just in the US but across advanced economies, as governments provided extensive support in response to two large-scale economic dislocations. This federal largesse was supported by very low interest rates that kept interest expenses manageable and by long-lived, large-scale quantitative easing programs that provided ample demand to absorb government debt issuance.
While the ongoing rollback of crisis-era monetary accommodation continues to alter the calculus of government borrowing, indications that near-term fiscal policy will be adjusted to reflect the new math are limited. There are signs that investors have slowly begun demanding greater premia for exposure to government debt, and a meaningful rerating of this risk could have significant and far-reaching impacts.
First Eagle Funds | Annual Report | October 31, 2023
6
Recognizing that the true state of uncertainty is well beyond what one can measure statistically at any given point in time, First Eagle has maintained the distinction between backward-looking quantifiable risks, which can be modeled and thus managed, and the true unknown "risk" of investing. We will continue to look for opportunities where we can find them, but we remain on our guard. Across market cycles, macroeconomic conditions and disruptive events, we remain focused on our goal of delivering long-term shareholder value while avoiding the permanent impairment of your capital.
As always, I want to thank you for entrusting your assets to our stewardship.
Sincerely,

Mehdi Mahmud,
President
December 2023
First Eagle Funds | Annual Report | October 31, 2023
7
Management's Discussion of Fund Performance (unaudited)
Global Equities
Equity-oriented funds managed by the Global Value team, listed below, delivered positive absolute returns in the 12-month period covered in this report, though bias toward growth stocks relative to value stocks in many equity markets served as a headwind to relative performance. Gold and gold-related equities, which many of our funds hold as a potential hedge against extreme risk and market turbulence, played their part effectively despite the rise in real interest rates. We are hopeful that the move toward a more normal policy environment in which money again has a cost may promote the effective allocation of capital across the economy and performance more in line with historical norms. At the same time, we are cognizant of the many persistent vulnerabilities in global financial and political structures. As always, we continue to seek resilience in our funds from the bottom up, searching for cash-flow-generative companies with strong market positions, healthy balance sheets and prudent management teams, and buying these stocks only when available at a discount to our estimate of their intrinsic value.2
First Eagle Global Fund
The net asset value ("NAV") of the fund's Class A shares3 increased 10.36%~ for the 12 months ended October 31, 2023, while the MSCI World Index increased 10.48%. The fund's position in short-term investments4 was 9.7% as of October 31, 2023.
The five largest contributors to the performance of First Eagle Global Fund over the period were gold bullion, Meta Platforms, Inc., Class A (interactive media & services, United States), Oracle Corp. (software, United States), Fomento Economico Mexicano SAB de CV, ADR (beverages, Mexico) and Comcast Corp., Class A (media, United States). Collectively, they accounted for 6.06% of this period's performance.5
The five largest detractors during the first quarter were British American Tobacco PLC (tobacco, United Kingdom), Nutrien Ltd. (chemicals, Canada), Elevance Health, Inc. (health care providers & services, United States), CH Robinson Worldwide, Inc. (air freight & logistics, United States) and Charles Schwab Corp. (capital markets, United States). In aggregate, they detracted 1.22% from fund performance in this period.5
First Eagle Overseas Fund
The NAV of the fund's Class A shares3 increased 11.11% for the 12 months ended October 31, 2023, while the MSCI EAFE Index increased 14.40%. The fund's position in short-term investments4 was 5.0% as of October 31, 2023.
The five largest contributors to the performance of First Eagle Overseas Fund over the period were gold bullion, Fomento Economico Mexicano SAB de CV, ADR (beverages, Mexico), Cie Financiere Richemont SA (Registered) (textiles, apparel & luxury goods, Switzerland), Taiwan Semiconductor Manufacturing Co. Ltd., ADR (semiconductors & semiconductor equipment, Taiwan) and Danone SA (food products, France). Collectively, they accounted for 4.85% of this period's performance.5
First Eagle Funds | Annual Report | October 31, 2023
8
Management's Discussion of Fund Performance
The five largest detractors were Nutrien Ltd. (chemicals, Canada), British American Tobacco PLC (tobacco, United Kingdom), Ambev SA, ADR (beverages, Brazil), As One Corp. (health care providers & services, Japan) and Hirose Electric Co Ltd. (electronic equipment, instruments & components, Japan). In aggregate they detracted 1.41% from fund performance in this period.5
First Eagle U.S. Value Fund
The NAV of the fund's Class A shares3 increased 8.81% for the 12 months ended October 31, 2023, while the S&P 500 Index increased 10.14%. The fund's position in short-term investments4 was 10.3% as of October 31, 2023.
The five largest contributors to the performance of First Eagle U.S. Value Fund over the period were Meta Platforms, Inc., Class A (interactive media & services, United States), gold bullion, Oracle Corp. (software, United States), Comcast Corp., Class A (media, United States), and Microsoft Corp. (software, United States). Collectively, they accounted for 8.36% of this period's performance.5
The five largest detractors during the first quarter were Elevance Health Inc. (health benefits, United States), Nutrien Ltd. (chemicals, Canada), Charles Schwab Corp. (capital markets, United States), CH Robinson Worldwide, Inc. (air freight & logistics, United States) and US Bancorp (banks, United States). In aggregate, they detracted 1.93% from fund performance in this period.5
First Eagle Gold Fund
The NAV of the fund's Class A shares3 increased 15.84% for the 12 months ended October 31, 2023, while the FTSE Gold Mines Index increased 16.27%. The fund's position in short-term investments4 was 8.8% as of October 31, 2023.
The five largest contributors to the performance of First Eagle Gold Fund over the period were gold bullion, Wheaton Precious Metals Corp. (metals & mining, Brazil), Alamos Gold Inc., Class A (metals and mining & Canada) Newcrest Mining Ltd. (metals & mining, Australia) and Dundee Precious Metals, Inc. (metals & mining, Canada). Collectively, they accounted for 13.32% of this period's performance.5
The five largest detractors were MAG Silver Corp. (metals & mining, Canada), Novagold Resources, (metals & mining, Canada), Newmont Corp. (metals & mining, United States), Fresnillo plc (metals & mining, Mexico) and Pan American Silver Corp., CRV (metals & mining, Canada). In aggregate, they detracted 1.18% from fund performance in this period.5
First Eagle Global Income Builder Fund
The NAV of the fund's Class A shares3 increased 6.35% for the 12 months ended October 31, 2023, while the MSCI World Index increased 10.48% and the Bloomberg U.S. Aggregate Bond Index was up 0.36%. The composite index increased 6.44% over the same time period. The fund's position in short-term investments4 was 2.2% as of October 31, 2023.
The five largest contributors to the performance of First Eagle Global Income Builder Fund over the period were gold bullion, Fomento Economico Mexicano SAB de CV, ADR (beverages, Mexico), Comcast Corp., Class A (media, United States),
First Eagle Funds | Annual Report | October 31, 2023
9
Management's Discussion of Fund Performance
Magellan Midstream Partners LP (oil & gas producers, United States) and FUCHS SE (Preference) (chemicals, Germany). Collectively, they accounted for 2.80% of this period's performance.5
The five largest detractors were British American Tobacco plc (tobacco, United Kingdom), US Bancorp (banks, United States), Boston Properties, Inc., REIT (office REITs, United States), Douglas Emmett, Inc., REIT (office REITs, United States) and Fidelity National Information Services, Inc. (financial services, United States). In aggregate, they detracted 1.00% from fund performance in this period.5
First Eagle Rising Dividend Fund
The NAV of the fund's Class A shares3 increased 14.17% for the 12 months ended October 31, 2023, while the S&P 500 Index increased 10.14%. The fund's position in short-term investments4 was 1.3% as of October 31, 2023.
The five largest contributors to the performance of First Eagle Rising Dividend Fund over the period were Meta Platforms, Inc., Class A (interactive media & services, United States), Oracle Corp. (software, United States), Comcast Corp., Class A (media, United States), Alphabet, Inc., Class A (interactive media & services, United States) and Microsoft Corp. (software, United States). Collectively, they accounted for 11.03% of this period's performance.5
The five largest detractors were Medtronic plc (health care equipment & supplies, United States), UnitedHealth Group, Inc. (health care providers & services, United States), Fidelity National Information Services Inc (information technology services, United States), CH Robinson Worldwide, Inc. (air freight & logistics, United States) and Equity Residential, REIT (residential REITs, United States). In aggregate, they detracted 2.08% from fund performance in this period.5
First Eagle Global Real Assets Fund
The NAV of the fund's Class I shares increased 3.53%~ for the 12 months ended October 31, 2023, while the MSCI World Index increased 10.48%. The fund's position in short-term investments4 was 3.0% as of October 31, 2023.
The five largest contributors to the performance of First Eagle Global Real Assets Fund over the period were gold bullion, FUCHS SE (Preference) (chemicals, Germany), United Utilities Group plc (water utilities, United Kingdom), Grupo Mexico SAB de CV, Series B (metals & mining, Mexico) and Schlumberger NV (energy equipment & services, United States). Collectively, they accounted for 4.10% of this period's performance.5
The five largest detractors were UGI Corp. (utilities, United States), Extra Space Storage, Inc., REIT (specialized REITs, United States), Douglass Emmett, Inc., REIT (office REITs, United States), ICL Group Ltd. (chemicals, Israel) and SBA Communications Corp., REIT (specialized REITs, United States). In aggregate, they detracted 2.15% from fund performance in this period.5
Fixed Income
High yield bonds have generally been resilient in the face of the pressures dragging down investment grade bonds over the last 12 months, with lower-quality paper—which one would assume would be most fundamentally challenged by a
First Eagle Funds | Annual Report | October 31, 2023
10
Management's Discussion of Fund Performance
higher cost of capital—leading the way. While it seems logical that a persistently high cost of capital would have a negative impact on the less financially sound companies, we've yet to see evidence in leveraged credit performance. In such an environment, we believe it is wise to focus on seeking to minimize downside risk through shorter-duration, higher-quality, more-liquid issues from companies that we believe have the pricing power to pass along rising input prices. We are comfortable being highly selective, allocating capital countercyclically as spread widening presents idiosyncratic opportunities.
First Eagle High Income Fund
The NAV of the fund's Class I shares increased 5.49% for the 12 months ended October 31, 2023, while the Bloomberg U.S. Corporate High Yield Index increased 6.23%. The fund's short-term investments4 position was 9.3% as of October 31, 2023.
The five largest contributors to the performance of First Eagle High Income Fund over the period were Seg Holding LLC 5.63%. due 10/15/2028 (retail, United States); IHO Verwaltungs GmbH 4.75%, 9/15/2026 (automobile components, Germany); Koppers Inc. 6.0%, due 2/15/2025 (chemicals, United States); Carnival Corp. 5.75%, due 3/1/2027 (hotel, restaurants & leisure, United States) and Mexico Remittances Funding Fiduciary Estate Management Sarl 4.88%, due 1/15/2028 (financial services, Mexico). Collectively, they accounted for 0.67% of this period's performance.5
The five largest detractors Scripps Escrow Ii, Inc., 5.38%, due 1/15/2031 (media, United States); Spirit Loyalty Cayman Ltd., 8.0%, 9/20/2025 (passenger airlines, United States); United Natural Foods, Inc., 6.75%, due 10/15/2028 (consumer staples distribution & retail, United States); Hawaiian Brands intellectual Property Ltd., 5.75%, due 1/20/2026 (passenger airlines, United States); and Hertz Corp., 5.0%, due 12/01/2029 (ground transportation, United States). In aggregate, they detracted 0.84% from fund performance in this period.5
U.S. Small Cap Equities
Historically, smaller companies have led market rebounds, but these stocks have been unable to shake the negative sentiment associated with March's banking turmoil. While the funds managed by the Small Cap team lost ground over the past 12 months as a result, they were able to deliver relative outperformance. Conditions likely will become more challenging as the accumulated impacts of policy tightening continue to reverberate—especially for those smaller businesses with more limited financing options—but our experience has been that such environments often provide us with potential attractive opportunities to move into stocks we consider undervalued relative to their fundamentals. As always, we remain focused on finding what we consider are the best stocks while controlling the one variable that we can—the price we pay for each stock.
First Eagle Small Cap Opportunity Fund
The NAV of the fund's Class I shares decreased 3.08% for the 12 months ended October 31, 2023, while the Russell 2000® Value Index decreased 9.93%. The fund's position in short-term investments4 was 8.3% as of October 31, 2023.
The five largest contributors to the performance of First Eagle Small Cap Opportunity Fund over the period were CIRCOR International, Inc. (machinery,
First Eagle Funds | Annual Report | October 31, 2023
11
Management's Discussion of Fund Performance
United States), Axcelis Technologies, Inc. (semiconductors & semiconductor equipment, United States), Beazer Homes USA, Inc. (household durables, United States), Tactile Systems Technology, Inc. (health care equipment & supplies, United States) and Modine Manufacturing Co. (automotive components, United States). Collectively, they accounted for 2.63% of this period's performance.5
The five largest detractors were Enviva, Inc. (oil, gas & consumable fuels, United States), CareDx, Inc. (biotechnology, United States), ADTRAN Holdings, Inc. (communications equipment, United States), Ameresco, Inc., Class A (construction & engineering , United States) and Barnes Group, Inc. (machinery industrial machinery, United States). In aggregate, they detracted 2.68% from fund performance in this period.5
First Eagle U.S. Smid Cap Opportunity Fund
The NAV of the fund's Class I shares decreased 2.6% for the 12 months ended October 31, 2023, while the Russell 2500TM Value Index decreased 4.94%. The fund's position in short-term investments4 was 5.3% as of October 31, 2023.
The five largest contributors to the performance of First Eagle U.S. Smid Cap Opportunity Fund over the period XPO, Inc. (ground transportation, United States), Beazer Homes USA, Inc. (household durables, United States), Lennox International, Inc. (building products, United States), Onto Innovation, Inc. (semiconductors & semiconductor equipment, United States) and Cardinal Health, Inc. (health care providers & services, United States. Collectively, they accounted for 4.19% of this period's performance.5
The five largest detractors were Ameresco, Inc., Class A (construction & engineering, United States), SM Energy Co. (oil, gas & consumable fuels, United States), Pacira Biosciences, Inc. (pharmaceuticals, United States), CareDx, Inc. (biotechnology, United States) and Cracker Barrel Old Country Store, Inc. (hotels, restaurants & leisure, United States). In aggregate they detracted 3.56% from fund performance in this period.5
1 The terminal rate is the long-term interest rate where prices are stable and full employment is achieved.
2 "Intrinsic value" is based on our judgment of what a prudent and rational business buyer would pay in cash for all of the company in normal markets.
3 Reflects performance for Class A shares without the effect of sales charges and assumes all distributions have been reinvested; if sales charges were included, values would be lower.
4 Includes short-term commercial paper that settles in 90 days or less, long-term commercial paper that settles in 91 days or greater and other short-term investments, such as U.S. treasury bills or money market funds.
5 Exact net returns for individual investments cannot be calculated due to the lack of a mechanism to precisely allocate fees and other expenses to individual investments.
~ The return shown is based on net asset values calculated for shareholder transactions and may differ from the return shown in the financial highlights, which reflect adjustments made to the net asset values in accordance with accounting principles generally accepted in the United States of America.
First Eagle Funds | Annual Report | October 31, 2023
12
Management's Discussion of Fund Performance

| | 
| |
Matthew McLennan
Co-Head of the Global Value Team
Portfolio Manager
Global, Overseas,
Global, Overseas and
U.S. Value Funds | | T. Kimball Brooker, Jr.
Co-Head of the Global Value Team
Portfolio Manager
Global, Overseas,
U.S. Value and
Global Income Builder Funds | |

| | 
| |
Matt Lamphier
Portfolio Manager
U.S. Value Fund
| | Edward Meigs
Portfolio Manager
Global Income Builder and
High Income Funds | |

| | 
| |
Sean Slein
Portfolio Manager
Global Income Builder and
High Income Funds | | Thomas Kertsos
Portfolio Manager
Gold Fund
| |

| | 
| |
Max Belmont
Portfolio Manager
Gold Fund | | Manish Gupta
Portfolio Manager
Global and Rising Dividend Funds | |
First Eagle Funds | Annual Report | October 31, 2023
13
Management's Discussion of Fund Performance

| | 
| |
Christian Heck
Portfolio Manager
Overseas and Rising
Dividend Funds | | Julien Albertini
Portfolio Manager
Global, Global Income Builder and
Rising Dividend Funds | |

| | 
| |
Alan Barr
Portfolio Manager
Overseas Fund | | Mark Wright
Portfolio Manager
U.S. Value Fund | |

| | 
| |
Idanna Appio
Portfolio Manager
Global Income
Builder Fund | | Bill Hench
Portfolio Manager
Small Cap Opportunity and
U.S. Smid Cap Opportunity Funds | |

| | 
| |
Benjamin Bahr
Portfolio Manager
Global Real Assets Fund | | John Masi
Portfolio Manager
Global Real Assets Fund | |
First Eagle Funds | Annual Report | October 31, 2023
14
Management's Discussion of Fund Performance

| | 
| |
George Ross
Portfolio Manager
Global Real Assets Fund | | David Wang
Portfolio Manager
Global Real Assets Fund | |
The performance data quoted herein represents past performance and does not guarantee future results. Market volatility can dramatically impact a fund's short-term performance. Current performance may be lower or higher than figures shown. The investment return and principal value will fluctuate so that an investor's shares, when redeemed, may be worth more or less than their original cost. Past performance data through the most recent month end is available at firsteagle.com or by calling 800.334.2143.
The commentary represents the opinion of Mehdi Mahmud and the Portfolio Management Teams as of December 2023 and is subject to change based on market and other conditions. These materials are provided for informational purposes only. These opinions are not intended to be a forecast of future events, a guarantee of future results, or investment advice. The views expressed herein may change at any time subsequent to the date of issue hereof. The information provided is not to be construed as a recommendation or an offer to buy or sell or the solicitation of an offer to buy or sell any fund or security.
First Eagle Funds | Annual Report | October 31, 2023
15
Performance Chart1 (unaudited)
| | | One
Year | | Three
Years | | Five
Years | | Ten
Years | | Since
Inception | | Inception Date | |
First Eagle Global Fund | |
Class A (SGENX)
without sales charge | | | 10.36 | %~ | | | 7.14 | % | | | 6.27 | % | | | 5.40 | % | | | 12.10 | % | | 01/01/792 | |
with sales charge | | | 4.84 | %~ | | | 5.32 | % | | | 5.18 | % | | | 4.86 | % | | | 11.97 | % | | 01/01/792 | |
Class C (FESGX)
without sales charge | | | 9.53 | % | | | 6.33 | % | | | 5.46 | % | | | 4.61 | % | | | 8.48 | % | | 06/05/00 | |
with sales charge | | | 8.53 | % | | | 6.33 | % | | | 5.46 | % | | | 4.61 | % | | | 8.48 | % | | 06/05/00 | |
| Class I (SGIIX) | | | 10.63 | % | | | 7.41 | % | | | 6.53 | % | | | 5.67 | % | | | 9.49 | % | | 07/31/98 | |
| Class R3 (EARGX) | | | 10.16 | % | | | 6.78 | % | | | 6.01 | % | | | — | | | | 4.67 | % | | 05/01/18 | |
| Class R4 (EAGRX) | | | 10.36 | % | | | 7.15 | % | | | 6.33 | % | | | — | | | | 3.95 | % | | 01/17/18 | |
| Class R5 (FRGLX) | | | 10.43 | %~ | | | 6.93 | % | | | — | | | | — | | | | 4.45 | % | | 07/29/19 | |
| Class R6 (FEGRX) | | | 10.70 | % | | | 7.48 | % | | | 6.61 | % | | | — | | | | 5.47 | % | | 03/01/17 | |
MSCI World Index3 | | | 10.48 | % | | | 8.14 | % | | | 8.27 | % | | | 7.53 | % | | | 9.35 | % | | 01/01/79 | |
First Eagle Overseas Fund | |
Class A (SGOVX)
without sales charge | | | 11.11 | % | | | 3.24 | % | | | 3.74 | % | | | 3.10 | % | | | 8.89 | % | | 08/31/93 | |
with sales charge | | | 5.55 | % | | | 1.49 | % | | | 2.68 | % | | | 2.58 | % | | | 8.70 | % | | 08/31/93 | |
Class C (FESOX)
without sales charge | | | 10.26 | % | | | 2.47 | % | | | 2.97 | % | | | 2.34 | % | | | 7.27 | % | | 06/05/00 | |
with sales charge | | | 9.26 | % | | | 2.47 | % | | | 2.97 | % | | | 2.34 | % | | | 7.27 | % | | 06/05/00 | |
| Class I (SGOIX) | | | 11.36 | % | | | 3.51 | % | | | 4.02 | % | | | 3.38 | % | | | 8.64 | % | | 07/31/98 | |
| Class R3 (EAROX) | | | 10.80 | % | | | 3.00 | % | | | 3.50 | % | | | — | | | | 1.73 | % | | 05/01/18 | |
| Class R4 (FIORX) | | | 11.07 | %~ | | | 3.33 | % | | | 3.84 | % | | | — | | | | 1.22 | % | | 01/17/18 | |
| Class R5 (FEROX) | | | 11.27 | % | | | 3.25 | % | | | — | | | | — | | | | 3.19 | % | | 03/11/19 | |
| Class R6 (FEORX) | | | 11.45 | % | | | 3.59 | % | | | 4.10 | % | | | — | | | | 3.15 | % | | 03/01/17 | |
MSCI EAFE Index4 | | | 14.40 | % | | | 5.73 | % | | | 4.10 | % | | | 3.05 | % | | | 4.64 | % | | 08/31/93 | |
First Eagle Funds | Annual Report | October 31, 2023
16
Performance Chart1 (unaudited)
| | | One
Year | | Three
Years | | Five
Years | | Ten
Years | | Since
Inception | | Inception Date | |
First Eagle U.S. Value Fund | |
Class A (FEVAX)
without sales charge | | | 8.81 | % | | | 9.64 | % | | | 7.12 | % | | | 6.70 | % | | | 8.32 | % | | 09/04/01 | |
with sales charge | | | 3.36 | % | | | 7.79 | % | | | 6.02 | % | | | 6.16 | % | | | 8.06 | % | | 09/04/01 | |
Class C (FEVCX)
without sales charge | | | 8.00 | % | | | 8.81 | % | | | 6.30 | % | | | 5.89 | % | | | 7.50 | % | | 09/04/01 | |
with sales charge | | | 7.00 | % | | | 8.81 | % | | | 6.30 | % | | | 5.89 | % | | | 7.50 | % | | 09/04/01 | |
| Class I (FEVIX) | | | 9.08 | % | | | 9.95 | % | | | 7.41 | % | | | 6.99 | % | | | 8.59 | % | | 09/04/01 | |
| Class R3 (EARVX) | | | 8.46 | % | | | 9.41 | % | | | 6.92 | % | | | — | | | | 6.11 | % | | 05/01/18 | |
| Class R4 (FIVRX) | | | 8.70 | % | | | 9.54 | % | | | — | | | | — | | | | 5.74 | % | | 07/29/19 | |
| Class R5 (FERVX) | | | 9.01 | % | | | 9.76 | % | | | — | | | | — | | | | 5.95 | % | | 07/29/19 | |
| Class R6 (FEVRX) | | | 9.14 | % | | | 10.00 | % | | | 7.45 | % | | | — | | | | 6.62 | % | | 03/01/17 | |
S&P 500 Index5 | | | 10.14 | % | | | 10.36 | % | | | 11.01 | % | | | 11.18 | % | | | 8.16 | % | | 09/04/01 | |
First Eagle Gold Fund | |
Class A (SGGDX)
without sales charge | | | 15.84 | % | | | -4.61 | % | | | 11.76 | % | | | 2.97 | % | | | 5.28 | % | | 08/31/93 | |
with sales charge | | | 10.07 | % | | | -6.22 | % | | | 10.62 | % | | | 2.44 | % | | | 5.10 | % | | 08/31/93 | |
Class C (FEGOX)
without sales charge | | | 14.99 | % | | | -5.32 | % | | | 10.93 | % | | | 2.18 | % | | | 4.61 | % | | 05/15/03 | |
with sales charge | | | 13.99 | % | | | -5.32 | % | | | 10.93 | % | | | 2.18 | % | | | 4.61 | % | | 05/15/03 | |
| Class I (FEGIX) | | | 16.10 | % | | | -4.38 | % | | | 12.05 | % | | | 3.24 | % | | | 5.68 | % | | 05/15/03 | |
| Class R3 (EAURX) | | | 15.50 | %~ | | | -4.83 | % | | | 11.61 | % | | | — | | | | 6.63 | % | | 05/01/18 | |
| Class R4 (FIURX) | | | 15.82 | % | | | -4.55 | % | | | — | | | | — | | | | 5.88 | % | | 07/29/19 | |
| Class R5 (FERUX) | | | 15.93 | % | | | -4.46 | % | | | — | | | | — | | | | 5.93 | % | | 07/29/19 | |
| Class R6 (FEURX) | | | 16.21 | % | | | -4.29 | % | | | 12.15 | % | | | — | | | | 4.68 | % | | 03/01/17 | |
FTSE Gold Mines
Index6 | | | 16.27 | % | | | -12.32 | % | | | 6.77 | % | | | 0.79 | % | | | -0.36 | % | | 08/31/93 | |
MSCI World Index3 | | | 10.48 | % | | | 8.14 | % | | | 8.27 | % | | | 7.53 | % | | | 7.03 | % | | 08/31/93 | |
First Eagle Funds | Annual Report | October 31, 2023
17
Performance Chart1 (unaudited)
| | | One
Year | | Three
Years | | Five
Years | | Ten
Years | | Since
Inception | | Inception Date | |
First Eagle Global Income Builder Fund | |
Class A (FEBAX)
without sales charge | | | 6.35 | % | | | 5.80 | % | | | 4.41 | % | | | 4.01 | % | | | 4.98 | % | | 05/01/12 | |
with sales charge | | | 1.05 | % | | | 4.02 | % | | | 3.34 | % | | | 3.48 | % | | | 4.51 | % | | 05/01/12 | |
Class C (FEBCX)
without sales charge | | | 5.65 | % | | | 5.04 | % | | | 3.62 | % | | | 3.23 | % | | | 4.19 | % | | 05/01/12 | |
with sales charge | | | 4.65 | % | | | 5.04 | % | | | 3.62 | % | | | 3.23 | % | | | 4.19 | % | | 05/01/12 | |
| Class I (FEBIX) | | | 6.69 | % | | | 6.09 | % | | | 4.66 | % | | | 4.28 | % | | | 5.25 | % | | 05/01/12 | |
| Class R3 (FBRRX) | | | 6.01 | % | | | 5.60 | % | | | 4.17 | % | | | — | | | | 3.20 | % | | 05/01/18 | |
| Class R4 (FIBRX) | | | 6.17 | % | | | 5.68 | % | | | — | | | | — | | | | 3.25 | % | | 07/29/19 | |
| Class R5 (EABRX) | | | 6.40 | % | | | 5.83 | % | | | — | | | | — | | | | 3.38 | % | | 07/29/19 | |
| Class R6 (FEBRX) | | | 6.68 | % | | | 6.17 | % | | | 4.71 | % | | | — | | | | 4.31 | % | | 03/01/17 | |
Composite Index7 | | | 6.44 | % | | | 2.69 | % | | | 5.21 | % | | | 5.07 | % | | | 5.87 | % | | 05/01/12 | |
MSCI World Index3 | | | 10.48 | % | | | 8.14 | % | | | 8.27 | % | | | 7.53 | % | | | 8.80 | % | | 05/01/12 | |
Bloomberg
U.S. Aggregate
Bond Index8 | | | 0.36 | % | | | -5.57 | % | | | -0.06 | % | | | 0.88 | % | | | 0.91 | % | | 05/01/12 | |
First Eagle High Income Fund9 | |
Class A (FEHAX)
without sales charge | | | 5.37 | % | | | 0.64 | % | | | 1.96 | % | | | 2.53 | % | | | 3.70 | % | | 01/03/12 | |
with sales charge | | | 0.58 | % | | | -0.89 | % | | | 1.01 | % | | | 2.06 | % | | | 3.30 | % | | 01/03/12 | |
Class C (FEHCX)
without sales charge | | | 4.45 | % | | | -0.11 | % | | | 1.19 | % | | | 1.77 | % | | | 2.92 | % | | 01/03/12 | |
with sales charge | | | 3.45 | % | | | -0.11 | % | | | 1.19 | % | | | 1.77 | % | | | 2.92 | % | | 01/03/12 | |
| Class I (FEHIX) | | | 5.49 | % | | | 0.90 | % | | | 2.23 | % | | | 2.82 | % | | | 6.22 | % | | 11/19/0710 | |
| Class R3 (EARHX) | | | 5.24 | %~ | | | 0.50 | % | | | 1.81 | % | | | — | | | | 1.91 | % | | 05/01/18 | |
| Class R4 (FIHRX) | | | 5.05 | % | | | -0.03 | % | | | — | | | | — | | | | 0.91 | % | | 07/29/19 | |
| Class R5 (FERHX) | | | 5.43 | % | | | 0.70 | % | | | — | | | | — | | | | 1.54 | % | | 07/29/19 | |
| Class R6 (FEHRX) | | | 5.48 | % | | | 0.94 | % | | | 2.23 | % | | | — | | | | 2.54 | % | | 03/01/17 | |
Bloomberg
U.S. Corporate
High Yield Index11 | | | 6.23 | % | | | 1.19 | % | | | 3.05 | % | | | 3.86 | % | | | 5.87 | % | | 11/19/07 | |
First Eagle Funds | Annual Report | October 31, 2023
18
Performance Chart1 (unaudited)
| | | One
Year | | Three
Years | | Five
Years | | Ten
Years | | Since
Inception | | Inception Date | |
First Eagle Rising Dividend Fund
(formerly First Eagle Fund of America)12 | |
Class A (FEFAX)
without sales charge | | | 14.17 | % | | | 6.77 | % | | | 5.24 | % | | | 4.18 | % | | | 7.04 | % | | 11/20/98 | |
with sales charge | | | 8.45 | % | | | 4.96 | % | | | 4.16 | % | | | 3.65 | % | | | 6.82 | % | | 11/20/98 | |
Class C (FEAMX)
without sales charge | | | 13.31 | % | | | 5.97 | % | | | 4.46 | % | | | 3.41 | % | | | 6.30 | % | | 03/02/98 | |
with sales charge | | | 12.31 | % | | | 5.97 | % | | | 4.46 | % | | | 3.41 | % | | | 6.30 | % | | 03/02/98 | |
| Class I (FEAIX) | | | 14.43 | % | | | 7.03 | % | | | 5.52 | % | | | 4.48 | % | | | 5.52 | % | | 03/08/13 | |
| Class R3 (EARFX) | | | 14.04 | % | | | 6.65 | % | | | 5.12 | % | | | — | | | | 2.50 | % | | 05/01/18 | |
| Class R4 (EAFRX) | | | 14.34 | % | | | 6.93 | % | | | — | | | | — | | | | 3.94 | % | | 07/29/19 | |
| Class R5 (FERFX) | | | 14.43 | % | | | 7.03 | % | | | — | | | | — | | | | 4.04 | % | | 07/29/19 | |
| Class R6 (FEFRX) | | | 14.48 | % | | | 7.05 | % | | | 5.54 | % | | | — | | | | 3.77 | % | | 03/01/17 | |
S&P 500 Index5 | | | 10.14 | % | | | 10.36 | % | | | 11.01 | % | | | 11.18 | % | | | 7.49 | % | | 04/10/87 | |
First Eagle Small Cap Opportunity Fund | |
Class A (FESAX)
without sales charge | | | -3.31 | % | | | — | | | | — | | | | — | | | | -8.67 | % | | 07/01/21 | |
with sales charge | | | -8.18 | % | | | — | | | | — | | | | — | | | | -10.64 | % | | 07/01/21 | |
| Class I (FESCX) | | | -3.08 | % | | | — | | | | — | | | | — | | | | -6.74 | % | | 04/27/21 | |
| Class R6 (FESRX) | | | -3.08 | % | | | — | | | | — | | | | — | | | | -8.44 | % | | 07/01/21 | |
Russell 2000®
Value Index13 | | | -9.93 | % | | | — | | | | — | | | | — | | | | -7.36 | % | | 04/27/21 | |
Russell 2000® Index14 | | | -8.56 | % | | | — | | | | — | | | | — | | | | -10.86 | % | | 04/27/21 | |
First Eagle U.S. Smid Cap Opportunity Fund | |
Class A (FEMAX)
without sales charge | | | -2.90 | % | | | — | | | | — | | | | — | | | | -10.78 | % | | 08/15/22 | |
with sales charge | | | -7.73 | % | | | — | | | | — | | | | — | | | | -14.50 | % | | 08/15/22 | |
| Class I (FESMX) | | | -2.60 | % | | | — | | | | — | | | | — | | | | -10.47 | % | | 08/15/22 | |
| Class R6 (FEXRX) | | | -2.64 | % | | | — | | | | — | | | | — | | | | -10.50 | % | | 08/15/22 | |
Russell 2500TM
Value Index15 | | | -4.94 | % | | | — | | | | — | | | | — | | | | -10.74 | % | | 08/15/22 | |
Russell 2500TM Index16 | | | -4.63 | % | | | — | | | | — | | | | — | | | | -10.76 | % | | 08/15/22 | |
First Eagle Funds | Annual Report | October 31, 2023
19
Performance Chart1 (unaudited)
| | | One
Year | | Three
Years | | Five
Years | | Ten
Years | | Since
Inception | | Inception Date | |
First Eagle Global Real Assets Fund | |
Class A (FERAX)
without sales charge | | | 3.17 | % | | | — | | | | — | | | | — | | | | -0.66 | % | | 11/30/21 | |
with sales charge | | | -1.95 | % | | | — | | | | — | | | | — | | | | -3.30 | % | | 11/30/21 | |
| Class I (FEREX) | | | 3.53 | %~ | | | — | | | | — | | | | — | | | | -0.37 | % | | 11/30/21 | |
| Class R6 (FERRX) | | | 3.55 | %~ | | | — | | | | — | | | | — | | | | -0.36 | % | | 11/30/21 | |
MSCI World Index3 | | | 10.48 | % | | | — | | | | — | | | | — | | | | -4.21 | % | | 11/30/21 | |
Consumer Price
Index +400bps17 | | | 7.22 | % | | | — | | | | — | | | | — | | | | 9.45 | % | | 11/30/21 | |
1 The performance data quoted herein represents past performance and does not guarantee future results. Market volatility can dramatically impact the fund's short-term performance. Current performance may be lower or higher than figures shown. The investment return and principal value will fluctuate so that an investor's shares, when redeemed, may be worth more or less than their original cost. Past performance data through the most recent month end is available at firsteagle.com or by calling 800.334.2143.
The average annual returns for Class A Shares "with sales charge" of First Eagle Global Fund, First Eagle Overseas Fund, First Eagle U.S. Value Fund, First Eagle Gold Fund, First Eagle Global Income Builder Fund, First Eagle Rising Dividend Fund, First Eagle Small Cap Opportunity Fund, First Eagle U.S. Smid Cap Opportunity Fund and First Eagle Global Real Assets Fund give effect to the deduction of the maximum sales charge of 5.00%. The average annual returns for Class A Shares "with sales charge" of First Eagle High Income Fund gives effect to the deduction of the maximum sales charge of 4.50%.
The average annual returns for Class C Shares "with sales charge" reflect the maximum contingent deferred sales charge (CDSC), which is charged on the lesser of the original purchase price or the current market value at the time of sale. This pertains to the shares sold or redeemed with the first year of purchase.
For First Eagle Global Fund, First Eagle Overseas Fund, First Eagle U.S. Value Fund, First Eagle Gold Fund, First Eagle Rising Dividend Fund, First Eagle Small Cap Opportunity Fund, First Eagle U.S. Smid Cap Opportunity Fund and First Eagle Global Real Assets Fund, a CDSC of 1.00% may apply on redemptions of Class A shares made within 18 months following a purchase of $1 million or more without an initial sales charge.
With respect to the First Eagle Global Income Builder Fund and the First Eagle High Income Fund, a CDSC of 1.00% may apply on certain redemptions of Class A shares made within 18 months following a purchase of $250,000 or more without an initial sales charge.
Class I Shares of First Eagle Global Fund, First Eagle Overseas Fund, First Eagle U.S. Value Fund, First Eagle Gold Fund, First Eagle Global Income Builder Fund, First Eagle High Income Fund, First Eagle Rising Dividend Fund, First Eagle Small Cap Opportunity Fund, First Eagle U.S. Smid Cap Opportunity Fund and First Eagle Global Real Assets Fund require $1 million minimum investment and are offered without a sales charge.
Class R3 Shares, Class R4 Shares, Class R5 Shares and Class R6 Shares of First Eagle Global Fund, First Eagle Overseas Fund, First Eagle U.S. Value Fund, First Eagle Gold Fund, First Eagle Global Income Builder Fund, First Eagle High Income Fund and First Eagle Rising Dividend Fund are offered without a sales charge. On December 1, 2023, Class R3 Shares, Class R4 Shares, Class R5 Shares of
First Eagle Funds | Annual Report | October 31, 2023
20
Performance Chart1 (unaudited)
the above mentioned Funds were closed to new investors. Please refer to Note 8 Subsequent Events for further details.
Class R6 Shares of First Eagle Small Cap Opportunity Fund, First Eagle U.S. Smid Cap Opportunity Fund and First Eagle Global Real Assets Fund are offered without a sales charge.
~ The returns shown are based on net asset values calculated for shareholder transactions and may differ from the returns shown in the financial highlights, which reflect adjustments made to the net asset values in accordance with accounting principles generally accepted in the United States of America.
2 First Eagle Global Fund commenced operations on April 28, 1970. Performance for periods prior to January 1, 2000, occurred while a prior portfolio manager of the fund was affiliated with another firm. Inception date shown is when this prior portfolio manager assumed portfolio management responsibilities.
3 MSCI World Index (Net) measures the performance of large and midcap securities across 23 developed markets countries around the world. The index provides total returns in US dollars with net dividends reinvested. Indexes are unmanaged and one cannot invest directly in an index.
4 MSCI EAFE Index (Net) measures the performance of large and midcap securities across 21 developed markets countries around the world excluding the US and Canada. A Net Return Index tracks price changes and reinvestment of distribution income net of withholding taxes. Indexes are unmanaged and one cannot invest directly in an index.
5 S&P 500 Index (Gross/Total) is a widely recognized unmanaged index including a representative sample of 500 leading companies in leading sectors of the US economy. Although the S&P 500 Index focuses on the large-cap segment of the market, with approximately 80% coverage of US equities, it is also considered a proxy for the total market. The S&P 500 includes dividends reinvested. A Total Return Index tracks price changes and reinvestment of distribution income. Indexes are unmanaged and one cannot invest directly in an index.
6 FTSE Gold Mines Index (Price) measures the performance of the shares of companies whose principal activity is the mining of gold and encompasses all gold mining companies that have a sustainable, attributable gold production of at least 300,000 ounces a year and that derive 51% or more of their revenue from mined gold in the worldwide market. A Price Return Index only measures price changes. Indexes are unmanaged and one cannot invest directly in an index.
7 The Composite Index consists of 60% of the MSCI World Index and 40% of the Bloomberg U.S. Aggregate Bond Index.
8 Bloomberg U.S. Aggregate Bond Index (Gross/Total) measures the performance of investment grade, US dollar-denominated, fixed-rate taxable bond market, including Treasuries, government-related and corporate securities, MBS (agency fixed-rate and hybrid ARM passthroughs), ABS and CMBS. A Total Return Index tracks price changes and reinvestment of distribution income. A Total Return Index tracks price changes and reinvestment of distribution income. Indexes are unmanaged and one cannot invest directly in an index.
9 Effective on or about December 27, 2023, the Fund is expected to change its name and investment strategy. This is further described at Note 8 to the Financial Statements (See "Note 8 - Subsequent Events").
10 First Eagle High Income Fund commenced operations in its present form on December 30, 2011, and is successor to another mutual fund pursuant to a reorganization on December 30, 2011. Information prior to December 30, 2011 is for this predecessor fund. Immediately after the reorganization, changes in net asset value of the Class I shares were partially impacted by differences in how the Fund and the predecessor fund price portfolio securities.
11 Bloomberg U.S. Corporate High Yield Index (Gross/Total) measures the performance of the US dollar-denominated, high yield, fixed-rate corporate bond market. Securities are classified as high yield if the middle rating of Moody's, Fitch and S&P is Ba1/BB+/BB+ or below. Bonds from issuers with an emerging markets country of risk are excluded. A Total Return Index tracks price changes and reinvestment of distribution income. Indexes are unmanaged and one cannot invest directly in an index.
First Eagle Funds | Annual Report | October 31, 2023
21
Performance Chart1 (unaudited)
12 Effective March 1, 2023, First Eagle Rising Dividend Fund changed its name and principal investment strategy. Prior to August 14, 2020, the Fund pursued a different investment objective and principal investment strategy. Performance for the periods prior to March 1, 2023 and August 14, 2020 shown is based on the investment strategies utilized by the Fund at those times.
13 Russell 2000® Value Index (Gross/Total) measures the performance of the small-cap value segment of the US equity universe. It includes those Russell 2000 companies with relatively lower price-to-book ratios, lower I/B/E/S forecast medium-term growth (two years) and lower sales per share historical growth (five years). A Total Return Index tracks price changes and reinvestment of distribution income. Indexes are unmanaged and one cannot invest directly in an index.
14 The Russell 2000® Index (Gross/Total) measures the performance of the small-cap segment of the US equity universe. It includes approximately 2,000 of the smallest securities based on a combination of their market cap and current index membership. A Total Return Index tracks price changes and reinvestment of distribution income. Indexes are unmanaged and one cannot invest directly in an index.
15 Russell 2500TM Value Index (Gross/Total) measures the performance of small to midcap segment of the US equity universe. It includes those Russell 2500 companies with lower price-to-book ratios and lower forecasted growth values. A Total Return Index tracks price changes and reinvestment of distribution income. Indexes are unmanaged and one cannot invest directly in an index.
16 The Russell 2500TM Index (Gross/Total) measures the performance of the small to midcap segment of the US equity universe, commonly referred to as "smid" cap. It includes approximately 2,500 of the smallest securities based on a combination of their market cap and current index membership. A Total Return Index tracks price changes and reinvestment of distribution income. Indexes are unmanaged and one cannot invest directly in an index.
17 The Consumer Price Index +400bps presents the Consumer Price Index for All Urban Consumers (CPI-U), plus 400 basis points annualized, a measure of the average change over time in the prices paid by urban consumers for consumer goods and services. Indexes are unmanaged and one cannot invest directly in an index.
Expense ratios as stated in the most recent prospectus.
| | | Class A | | Class C | | Class I | | Class R3 | | Class R4 | | Class R5 | | Class R6 | |
First Eagle Global Fund | | | 1.11 | % | | | 1.87 | % | | | 0.86 | % | | | 1.20 | % | | | 1.07 | % | | | 1.11 | % | | | 0.79 | % | |
First Eagle Overseas Fund | | | 1.15 | | | | 1.89 | | | | 0.89 | | | | 1.40 | | | | 1.01 | | | | 1.17 | | | | 0.80 | | |
First Eagle U.S. Value Fund18,19 | | | 1.16 | | | | 1.92 | | | | 0.88 | | | | 1.34 | | | | 1.14 | | | | 1.02 | | | | 0.83 | | |
First Eagle Gold Fund | | | 1.19 | | | | 1.93 | | | | 0.94 | | | | 1.45 | | | | 1.10 | | | | 0.99 | | | | 0.85 | | |
First Eagle Global Income
Builder Fund | | | 1.16 | | | | 1.94 | | | | 0.93 | | | | 1.33 | | | | 1.40 | | | | 1.17 | | | | 0.87 | | |
First Eagle High Income
Fund18,20 | | | 1.13 | | | | 1.88 | | | | 0.86 | | | | 1.28 | | | | 2.36 | | | | 1.12 | | | | 0.78 | | |
First Eagle Rising Dividend
Fund18,21 | | | 1.05 | | | | 1.84 | | | | 0.74 | | | | 1.15 | | | | 1.04 | | | | 1.31 | | | | 0.69 | | |
First Eagle Small Cap
Opportunity Fund18,22 | | | 1.42 | | | | — | | | | 1.18 | | | | — | | | | — | | | | — | | | | 1.29 | | |
First Eagle U.S. Smid Cap
Opportunity Fund18,23 | | | 24.63 | | | | — | | | | 24.38 | | | | — | | | | — | | | | — | | | | 24.38 | | |
First Eagle Global Real
Assets Fund18,24 | | | 5.13 | | | | — | | | | 4.75 | | | | — | | | | — | | | | — | | | | 4.76 | | |
First Eagle Funds | Annual Report | October 31, 2023
22
Performance Chart1 (unaudited)
18 For the First Eagle U.S. Value Fund, First Eagle High Income Fund, First Eagle Rising Dividend Fund, First Eagle Small Cap Opportunity Fund, First Eagle U.S. Smid Cap Opportunity Fund and First Eagle Global Real Assets Fund, had fees not been waived and/or expenses reimbursed, returns would have been lower.
19 These are the actual fund operating expenses prior to the application of fee waivers and/or expense reimbursements. The Adviser has contractually agreed to waive its management fee at an annual rate in the amount of 0.05% of the average daily value of the Fund's net assets for the period through February 29, 2024. This waiver has the effect of reducing the management fee for the term of the waiver from 0.75% to 0.70% on First Eagle U.S. Value Fund.
20 These are the actual fund operating expenses prior to the application of fee waivers and/or expense reimbursements. The Adviser has contractually agreed to waive and/or reimburse certain fees and expenses of Classes A, C, I, R3, R4, R5 and R6 so that the total annual operating expenses (excluding interest, taxes, brokerage commissions, acquired fund fees and expenses, dividend and interest expenses relating to short sales, and extraordinary expenses, if any) ("annual operating expenses") of each class are limited to 0.94%, 1.69%, 0.69%, 1.04%, 0.79%, 0.69% and 0.69% of average net assets, respectively. Each of these undertakings lasts until February 29, 2024 and may not be terminated during its term without the consent of the Board of Trustees. The Fund has agreed that each of Classes A, C, I, R3, R4, R5 and R6 will repay the Adviser for fees and expenses waived or reimbursed for the class provided that repayment does not cause annual operating expenses (after the repayment is taken into account) to exceed the lesser of: (1) 0.94%, 1.69%, 0.69%, 1.04%, 0.79%, 0.69% and 0.69% of the class' average net assets, respectively; or (2) if applicable, the then-current expense limitations. Any such repayment must be made within three years after the year in which the Adviser incurred the expense.
21 These are the actual fund operating expenses prior to the application of fee waivers and/or expense reimbursements. The Adviser has contractually agreed to waive and/or reimburse certain fees and expenses of Classes A, C, I, R3, R4, R5 and R6 so that the total annual operating expenses (excluding interest, taxes, brokerage commissions, acquired fund fees and expenses, dividend and interest expenses relating to short sales, and extraordinary expenses, if any) ("annual operating expenses") of each class are limited to 0.90%, 1.65%, 0.65%, 1.00%, 0.75%, 0.65% and 0.65% of average net assets, respectively. Each of these undertakings lasts until February 29, 2024 and may not be terminated during its term without the consent of the Board of Trustees. The Fund has agreed that each of Classes A, C, I, R3, R4, R5 and R6 will repay the Adviser for fees and expenses waived or reimbursed for the class provided that repayment does not cause annual operating expenses (after the repayment is taken into account) to exceed the lesser of: (1) 0.90%, 1.65%, 0.65%, 1.00%, 0.75%, 0.65% and 0.65% of the class' average net assets, respectively; or (2) if applicable, the then-current expense limitations. Any such repayment must be made within three years after the year in which the Adviser incurred the expense.
22 These are the actual fund operating expenses prior to the application of fee waivers and/or expense reimbursements. The Adviser has contractually agreed to waive and/or reimburse certain fees and expenses of Classes A, I, and R6 so that the total annual operating expenses (excluding interest, taxes, brokerage commissions, acquired fund fees and expenses, dividend and interest expenses relating to short sales, and extraordinary expenses, if any) ("annual operating expenses") of each class are limited to 1.25%, 1.00% and 1.00% of average net assets, respectively. Each of these undertakings lasts until February 29, 2024 and may not be terminated during its term without the consent of the Board of Trustees. The Fund has agreed that each of Classes A, I and R6 will repay the Adviser for fees and expenses waived or reimbursed for the class provided that repayment does not cause annual operating expenses (after the repayment is taken into account) to exceed the lesser of: (1) 1.25%, 1.00% and 1.00% of the class' average net assets, respectively; or (2) if applicable, the then-current expense limitations. Any such repayment must be made within three years after the year in which the Adviser incurred the expense.
23 These are the actual fund operating expenses prior to the application of fee waivers and/or expense reimbursements. The Adviser has contractually agreed to waive and/ or reimburse certain fees and
First Eagle Funds | Annual Report | October 31, 2023
23
Performance Chart1 (unaudited)
expenses of Classes A, I and R6 so that the total annual operating expenses (excluding interest, taxes, brokerage commissions, acquired fund fees and expenses, dividend and interest expenses relating to short sales, and extraordinary expenses, if any) ("annual operating expenses") of each class are limited to 1.20%, 0.95% and 0.95% of average net assets, respectively. Each of these undertakings lasts until February 29, 2024 and may not be terminated during its term without the consent of the Board of Trustees. The Fund has agreed that each of Classes A, I and R6 will repay the Adviser for fees and expenses waived or reimbursed for the class provided that repayment does not cause annual operating expenses (after the repayment is taken into account) to exceed the lesser of: (1) 1.20%, 0.95% and 0.95% of the class' average net assets, respectively; or (2) if applicable, the then-current expense limitations. Any such repayment must be made within three years after the year in which the Adviser incurred the expense.
24 These are the actual fund operating expenses prior to the application of fee waivers and/or expense reimbursements. The Adviser has contractually agreed to waive and/ or reimburse certain fees and expenses of Classes A, I and R6 so that the total annual operating expenses (excluding interest, taxes, brokerage commissions, acquired fund fees and expenses, dividend and interest expenses relating to short sales, and extraordinary expenses, if any) ("annual operating expenses") of each class are limited to 1.10%, 0.85% and 0.85% of average net assets, respectively. Each of these undertakings lasts until February 29, 2024 and may not be terminated during its term without the consent of the Board of Trustees. The Fund has agreed that each of Classes A, I and R6 will repay the Adviser for fees and expenses waived or reimbursed for the class provided that repayment does not cause annual operating expenses (after the repayment is taken into account) to exceed the lesser of: (1) 1.10%, 0.85% and 0.85% of the class' average net assets, respectively; or (2) if applicable, the then-current expense limitations. Any such repayment must be made within three years after the year in which the Adviser incurred the expense.
These expense ratios are presented as of March 1, 2023 and may differ from corresponding ratios shown elsewhere in this report because of differing time periods (and/or, if applicable, because these expense ratios do not include expense credits or waivers).
There are risks associated with investing in funds that invest in securities of foreign companies, such as erratic market conditions, economic and political instability and fluctuations in currency exchange rates. These risks may be more pronounced with respect to investments in emerging markets. Funds whose investments are concentrated in a specific industry or sector may be subject to a higher degree of risk than funds whose investments are diversified and may not be suitable for all investors.
All securities may be subject to adverse market trends. The value and liquidity of a Fund's portfolio holdings may fluctuate in response to events specific to the companies or stock or bond markets in which a Fund invests, as well as economic, political, or social events in the United States or abroad. Markets may be volatile, and prices of individual securities and other investments including those of a particular type, may decline significantly and rapidly. This may cause a Fund's portfolio to be worth less than the price originally paid for it, or less than it was worth at an earlier time. Market risk may affect a single issuer or the market as a whole. Recent market conditions and events, including a global public health crisis, wars and armed conflicts and actions taken by governments in response, may exacerbate volatility and may continue to negatively affect the price and liquidity of individual securities, national economies and global markets generally. Prices of individual securities and other investments, including those of a particular type, may decline significantly in response to adverse issuer, political, regulatory, market, economic or other developments, public perceptions concerning these developments, and adverse investor sentiment or publicity. Rapid changes in value or liquidity, which often are not anticipated and can relate to events not connected to particular investments, may limit the ability of a Fund to dispose of its assets at the price or time of its choosing and can result in losses. Changes in price may be temporary or may last for extended periods. If a Fund sells a portfolio position before it reaches its market peak, it may miss out on opportunities for better performance.
The COVID-19 pandemic and related quarantines and restrictions resulted in high unemployment, disruptions to supply chains and customer activity, and general concern and uncertainty, with corresponding impacts on financial markets worldwide. COVID-19 remains a risk with the potential that new variants could lead to increased government restrictions and consumer caution. Additionally,
First Eagle Funds | Annual Report | October 31, 2023
24
Performance Chart1 (unaudited)
COVID-19 remains a challenge for global supply chain normalization. More recently, a number of major economies, including the United States, are adjusting to reduced levels of market and monetary support following periods of fiscal and monetary interventions, together with rising inflation and increases in interest rate targets by central banks. These circumstances have generated significant market stress and volatility, with market sentiment changing rapidly in response to changes in inflation or interest rate expectations.
To the extent a Fund invests a significant portion of its assets in the securities of companies of a single country or region, it is more likely to be impacted by events or conditions affecting that country or region. For example, political and economic conditions and changes in regulatory, tax, or economic policy in a country could significantly affect the market in that country and in surrounding or related countries and have a negative impact on a Fund's performance. Currency developments or restrictions, political and social instability, and changing economic conditions have resulted in significant market volatility. As of the date of this Annual Report, First Eagle Global Fund has significant exposure to Europe and Japan; the Overseas Fund has significant exposure to Canada, Europe and Japan; the Gold Fund has significant exposure to Brazil and Canada; the Global Income Builder Fund has significant exposure to Europe; and the Real Assets Fund has significant exposure to Canada. A Fund's exposure to a particular county is determined in accordance with the Adviser's "country of risk" assessment. "Country of risk" is based on a multi-factor country of risk assessment determined by the Adviser, including factors such as an issuer's country of domicile, and the country of the stock exchange on which it trades, among others.
Canada is a significant exporter of natural resources, such as oil, natural gas and agricultural products. As a result, the Canadian economy is susceptible to adverse changes in certain commodities markets. It is also heavily dependent on trading with key partners, including the United States, Mexico, and China. Any reduction in trading with these key partners may adversely affect the Canadian economy. Canada's dependency on the economy of the United States, in particular, makes Canada's economy vulnerable to political and regulatory changes affecting the United States economy. These and other factors could negatively affect a Fund's performance.
A Fund's investments may subject it to the risks associated with investing in the European markets, including the risks associated with the United Kingdom's ("UK") exit from the European Union ("Brexit"). Investments in a single region, even though representing a number of different countries within the region, may be affected by common economic forces and other factors. Further, political or economic disruptions in European countries, even in countries in which a Fund is not invested, may adversely affect security values and thus a Fund's holdings.
The Japanese economy is heavily dependent upon international trade and may be subject to considerable degrees of economic, political and social instability, which could negatively affect a Fund. Japan has also experienced natural disasters, such as earthquakes and tidal waves, of varying degrees of severity, which also could negatively affect a Fund.
Investment in Brazilian issuers involves risks that are specific to Brazil, including legal, regulatory, political (including, instability and corruption), currency and economic risks. Brazilian issuers are subject to possible regulatory and economic interventions by the Brazilian government, including the imposition of wage and price controls and the limitation of imports. In addition, the market for Brazilian securities is directly influenced by the flow of international capital and economic and market conditions of certain countries, especially other emerging market countries in Central and South America. The Brazilian economy has historically been exposed to high rates of inflation and unemployment, a high level of debt and violence, each of which may reduce and/or prevent economic growth. Political tensions in Brazil may exacerbate these risks.
The value of a Fund's portfolio holdings may fluctuate in response to the risk that the prices of equity securities, including common stock, rise and fall daily. These price movements may result from factors affecting individual companies, industries or the securities market as a whole. In addition, equity markets tend to move in cycles, which may cause stock prices to fall over short or extended periods of time. Equity securities generally have greater price volatility than debt securities.
By investing in its Subsidiary, each of the First Eagle Global Fund, First Eagle Overseas Fund, First Eagle U.S. Value Fund, First Eagle Gold Fund and First Eagle Global Real Assets Fund is indirectly
First Eagle Funds | Annual Report | October 31, 2023
25
Performance Chart1 (unaudited)
exposed to the risks associated with that Subsidiary's investments. The Subsidiaries are not registered under the 1940 Act and are not subject to all of the investor protections of the 1940 Act. Changes in the laws of the United States and/or the Cayman Islands could result in the inability of a Fund and/or a Subsidiary to operate as expected and could adversely affect the Fund.
In addition to investments in larger companies, each Fund may (and the First Eagle Small Cap Opportunity Fund and First Eagle U.S. Smid Cap Opportunity Fund generally will) invest in small and medium-size companies, which historically have been more volatile in price than larger company securities, especially over the short term. Positions in smaller companies, especially when a Fund is a large holder of a small company's securities, also may be more difficult or expensive to trade. Among the reasons for the greater price volatility are the less certain growth prospects of smaller companies, the lower degree of liquidity in the markets for such securities and the greater sensitivity of smaller companies to changing economic conditions. In addition, smaller companies may lack depth of management, they may be unable to generate funds necessary for growth or development, or they may be developing or marketing new products or services for which markets are not yet established and may never become established. Each Fund (except the First Eagle Small Cap Opportunity Fund and First Eagle U.S. Smid Cap Opportunity Fund) considers small companies to be companies with market capitalizations of less than $1 billion and medium-size companies to have market capitalizations of less than $10 billion. Larger, more established companies may be unable to respond quickly to new competitive challenges like changes in consumer tastes or innovative smaller competitors. The First Eagle Small Cap Opportunity Fund considers small companies to be companies with market capitalizations not greater than that of the largest company in the Russell 2000® Index at the time of investment. The First Eagle U.S. Smid Cap Opportunity Fund considers small and medium companies to be companies with market capitalizations not greater than that of the largest company in the Russell 2500TM Index at the time of investment. Larger companies are sometimes unable to attain the high growth rates of successful, smaller companies, especially during extended periods of economic expansion.
Holding illiquid securities restricts or otherwise limits the ability for a Fund to freely dispose of its investments for specific periods of time. A Fund might not be able to sell illiquid securities at its desired price or time. Changes in the markets or in regulations governing the trading of illiquid instruments can cause rapid changes in the price or ability to sell an illiquid security. The market for lower-quality debt instruments, including junk bonds and leveraged loans, is generally less liquid than the market for higher-quality debt instruments.
Investment in gold and gold-related investments present certain risks, including political and economic risks affecting the price of gold and other precious metals including specific changes in U.S. and foreign regulatory policies, tax, currency or mining laws, increased environmental costs, international monetary and political policies, economic conditions within an individual country, trade imbalances, and trade or currency restrictions between countries. The price of gold, in turn, is likely to affect the market prices of securities of companies mining or processing gold, and accordingly, the value of investments in such securities may also be affected. Gold-related investments as a group have not performed as well as the stock market in general during periods when the U.S. dollar is strong, inflation is low and general economic conditions are stable. In addition, returns on gold-related investments have traditionally been more volatile than investments in broader equity or debt markets.
If one or more investors in a Fund initiate significant redemptions, it may be necessary to dispose of assets to meet the redemption request. This can make ordinary portfolio management and rebalancing decisions more complicated to implement and can result in a Fund's current expenses being allocated over a smaller asset base, which generally results in an increase in a Fund's expense ratio. The impact of these transactions is likely to be greater in highly volatile markets or less liquid markets when a significant investor purchases, redeems or owns a substantial portion of a Fund's shares.
First Eagle High Income and First Eagle Global Income Builder Funds will invest in high yield instruments (commonly known as "high yield" or "junk" bonds) which may be subject to greater levels of interest rate, credit (including issuer default) and liquidity risk than investment grade securities and may experience extreme price fluctuations. The securities of such companies may be considered speculative and the ability of such companies to pay their debts on schedule may be uncertain.
First Eagle Funds | Annual Report | October 31, 2023
26
Performance Chart1 (unaudited)
First Eagle High Income and First Eagle Global Income Builder Funds invest in bank loans. These investments potentially expose a Fund to the credit risk of the underlying borrower, and in certain cases, of the financial institution. A Fund's ability to receive payments in connection with the loan depends primarily on the financial condition of the borrower. The market for bank loans may be illiquid and a Fund may have difficulty selling them, especially in the case of leveraged loans, which can be difficult to value. In addition, bank loans often have contractual restrictions on resale, which can delay the sale and adversely impact the sale price. At times, a Fund may decline to receive non-public information relating to loans, which could disadvantage the Fund relative to other investors.
Funds that invest in bonds are subject to credit and interest rate risk. The value of a Fund's portfolio may fluctuate in response to the risk that the issuer of a bond or other instrument will not be able to make payments of interest and principal when due. In addition, fluctuations in interest rates can affect the value of debt instruments held by a Fund. An increase in interest rates tends to reduce the market value of debt instruments, while a decline in interest rates tends to increase their values. A debt instrument's "duration" is a way of measuring a debt instrument's sensitivity to a potential change in interest rates. Longer duration instruments tend to be more sensitive to interest rate changes than those with shorter durations. Generally, debt instruments with long maturities and low coupons have the longest durations. Recent market conditions and events, including a global public health crisis and actions taken by governments in response, may exacerbate the risk that borrowers will not be able to make payments of interest and principal when due. In addition, there is risk of significant future rate moves and related economic and markets impact.
Income generation and dividends are not guaranteed. If dividend paying stocks in a Fund's portfolio stop paying or reduce dividends, a Fund's ability to generate income will be adversely affected.
First Eagle Global Real Assets Fund will invest in companies operating in various industries related to real assets. To the extent there is a downturn in one or more of these industries, there would be a larger impact on the Fund than if the Fund's portfolio were more broadly diversified. Factors that may affect these industries include, but are not limited to, government regulation or deregulation, energy conservation and supply/demand, raw material prices, commodities regulation, cost of transport, cost of labor, interest rates, and broad economic developments such as growth or contraction in different markets, currency valuation changes and central bank movements.
An investment strategy that employs a "value" approach may pose a risk to a Fund that such investment strategy may not be successfully achieved. In any Fund, an investment made at a perceived "margin of safety" or "discount to intrinsic or fundamental value" can trade at prices substantially lower than when an investment is made, so that any perceived "margin of safety" or "discount to value" is no guarantee against loss. "Value" investments, as a category, or entire industries or sectors associated with such investments, may lose favor with investors as compared to those that are more "growth" oriented. In such an event, a Fund's investment returns would be expected to lag relative to returns associated with more growth-oriented strategies.
All investments involve the risk of loss.
First Eagle Funds | Annual Report | October 31, 2023
27
Data as of October 31, 2023 (unaudited)
Investment Objective
The First Eagle Global Fund seeks long-term growth of capital by investing in a range of asset classes from markets in the United States and throughout the world. This truly global fund is managed with a highly disciplined, bottom-up, value-oriented style.
Average Annual Returns (%) | | | | | | One Year | | Five Years | | Ten Years | |
First Eagle Global Fund | | Class A | | without sales load | | | 10.36 | † | | | 6.27 | | | | 5.40 | | |
| | | | with sales load | | | 4.84 | † | | | 5.18 | | | | 4.86 | | |
MSCI World Index | | | | | | | 10.48 | | | | 8.27 | | | | 7.53 | | |
Consumer Price Index | | | | | | | 3.23 | | | | 4.01 | | | | 2.79 | | |
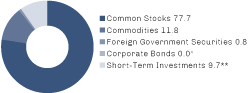
Sectors* (%)
Consumer Staples | | | 13.3 | | |
Commodities | | | 11.8 | | |
Financials | | | 10.6 | | |
Industrials | | | 9.9 | | |
Information Technology | | | 8.5 | | |
Energy | | | 7.5 | | |
Communication Services | | | 7.3 | | |
Health Care | | | 6.5 | | |
Consumer Discretionary | | | 6.2 | | |
Materials | | | 4.4 | | |
Real Estate | | | 3.3 | | |
Foreign Government Securities | | | 0.8 | | |
Utilities | | | 0.2 | | |
Short-Term Investments | | | 9.7 | | |
Countries*~ (%)
United States | | | 55.8 | | |
Japan | | | 6.9 | | |
United Kingdom | | | 5.5 | | |
Canada | | | 3.6 | | |
France | | | 2.6 | | |
Switzerland | | | 2.1 | | |
Mexico | | | 2.0 | | |
Brazil | | | 1.9 | | |
South Korea | | | 1.9 | | |
China | | | 1.7 | | |
Hong Kong | | | 1.5 | | |
Belgium | | | 1.0 | | |
Taiwan | | | 0.9 | | |
Sweden | | | 0.8 | | |
Germany | | | 0.7 | | |
Netherlands | | | 0.4 | | |
Thailand | | | 0.4 | | |
Australia | | | 0.3 | | |
Norway | | | 0.2 | | |
Indonesia | | | 0.1 | | |
Short-Term Investments | | | 9.7 | | |
^ Less than 0.05%.
* Asset Allocation, Sectors and Countries percentages are based on total investments in the portfolio.
** Includes short-term commercial paper (2.5% of total investments) that settles in 90 days or less, long-term commercial paper (7.1% of total investments) that settles in 91 days or greater and other short-term investments (0.1% of total investments), such as U.S. treasury bills or money market funds.
~ Country allocations reflect country of risk (not currency of issue). Bonds of non-U.S. issuers may be U.S. dollar denominated.
† The returns shown are based on net asset values calculated for shareholder transactions and may differ from the returns shown in the financial highlights, which reflect adjustments made to the net asset values in accordance with accounting principles generally accepted in the United States of America.
The Fund's portfolio composition is subject to change at any time.
First Eagle Funds | Annual Report | October 31, 2023
28
First Eagle Global Fund | Fund Overview
Growth of a $10,000 Initial Investment

Performance data quoted herein represents past performance and should not be considered indicative of future results. Performance data quoted herein does not reflect the deduction of taxes that a shareholder would pay on Fund distributions or the sale of Fund shares. The average annual returns shown above are historical and reflect changes in share price, reinvested dividends and are net of expenses.
The average annual returns for Class A shares give effect to the deduction of the maximum sales charge of 5.00%.
The MSCI World Index is a widely followed, unmanaged group of stocks from 23 developed market countries. The index provides total returns in U.S. dollars with net dividends reinvested. One cannot invest directly in an index. The Consumer Price Index (CPI) represents the change in price of all goods and services purchased for consumption by urban households.
Top 10 Holdings* (%)
Gold bullion** (Precious Metal) | | | 11.8 | | |
Oracle Corp. (Software, United States) | | | 3.0 | | |
Meta Platforms, Inc., Class A (Interactive Media & Services, United States) | | | 2.7 | | |
Schlumberger NV (Energy Equipment & Services, United States) | | | 2.4 | | |
Exxon Mobil Corp. (Oil, Gas & Consumable Fuels, United States) | | | 2.2 | | |
Comcast Corp., Class A (Media, United States) | | | 2.0 | | |
HCA Healthcare, Inc. (Health Care Providers & Services, United States) | | | 1.5 | | |
Willis Towers Watson plc (Insurance, United States) | | | 1.5 | | |
Imperial Oil Ltd. (Oil, Gas & Consumable Fuels, Canada) | | | 1.3 | | |
Fomento Economico Mexicano SAB de CV, ADR (Beverages, Mexico) | | | 1.3 | | |
Total | | | 29.7 | | |
* Holdings in cash, short-term commercial paper, long-term commercial paper and other short-term cash equivalents have been excluded.
** The Fund invests in gold and precious metals through investment in a wholly-owned subsidiary of the Fund organized under the laws of the Cayman Islands (the "Subsidiary"). Gold Bullion and commodities include the Fund's investment in the Subsidiary.
Percentages are based on total net assets
First Eagle Funds | Annual Report | October 31, 2023
29
First Eagle Global Fund | Consolidated Schedule of Investments | October 31, 2023
Investments | | Shares | | Value ($) | |
Common Stocks — 77.6% | |
Australia — 0.3% | |
Newcrest Mining Ltd. (a) | | | 9,296,442 | | | | 142,499,893 | | |
Belgium — 1.0% | |
Groupe Bruxelles Lambert NV | | | 6,469,396 | | | | 473,175,466 | | |
Brazil — 1.9% | |
Ambev SA, ADR | | | 149,620,059 | | | | 378,538,749 | | |
Itausa SA* | | | 1,482,691 | | | | 2,523,229 | | |
Itausa SA (Preference) | | | 97,473,480 | | | | 167,039,394 | | |
Wheaton Precious Metals Corp. | | | 7,936,282 | | | | 335,307,915 | | |
| | | | 883,409,287 | | |
Canada — 3.6% | |
Agnico Eagle Mines Ltd. | | | 2,298,700 | | | | 107,811,392 | | |
Barrick Gold Corp. | | | 20,128,459 | | | | 321,652,775 | | |
Franco-Nevada Corp. | | | 769,497 | | | | 93,610,343 | | |
Imperial Oil Ltd. | | | 10,896,401 | | | | 620,978,959 | | |
Nutrien Ltd. | | | 4,461,321 | | | | 239,572,938 | | |
Power Corp. of Canada | | | 12,323,141 | | | | 296,892,836 | | |
| | | | 1,680,519,243 | | |
China — 1.6% | |
Alibaba Group Holding Ltd.* | | | 34,738,392 | | | | 357,634,492 | | |
Prosus NV* | | | 14,526,770 | | | | 406,249,595 | | |
| | | | 763,884,087 | | |
France — 2.6% | |
Danone SA | | | 10,211,219 | | | | 607,470,059 | | |
Legrand SA | | | 1,954,335 | | | | 169,062,453 | | |
LVMH Moet Hennessy Louis Vuitton SE | | | 145,168 | | | | 103,930,210 | | |
Sodexo SA | | | 2,477,142 | | | | 262,152,487 | | |
Wendel SE | | | 867,489 | | | | 64,981,413 | | |
| | | | 1,207,596,622 | | |
Germany — 0.7% | |
Brenntag SE | | | 1,126,149 | | | | 83,742,265 | | |
Henkel AG & Co. KGaA (Preference) | | | 3,516,726 | | | | 253,679,314 | | |
| | | | 337,421,579 | | |
First Eagle Funds | Annual Report | October 31, 2023
30
First Eagle Global Fund | Consolidated Schedule of Investments | October 31, 2023
Investments | | Shares | | Value ($) | |
Hong Kong — 1.5% | |
CK Asset Holdings Ltd. | | | 37,986,500 | | | | 189,868,867 | | |
Guoco Group Ltd. | | | 12,748,580 | | | | 95,763,702 | | |
Hongkong Land Holdings Ltd. | | | 31,759,300 | | | | 100,731,659 | | |
Hysan Development Co. Ltd. | | | 23,322,348 | | | | 42,930,761 | | |
Jardine Matheson Holdings Ltd. | | | 7,051,271 | | | | 285,725,535 | | |
| | | | 715,020,524 | | |
Japan — 6.9% | |
Chofu Seisakusho Co. Ltd. (b) | | | 3,136,200 | | | | 44,698,784 | | |
FANUC Corp. | | | 16,005,400 | | | | 397,196,694 | | |
Hirose Electric Co. Ltd. | | | 1,258,915 | | | | 142,633,965 | | |
Hoshizaki Corp. | | | 5,662,600 | | | | 182,871,718 | | |
Keyence Corp. | | | 263,400 | | | | 101,967,070 | | |
Komatsu Ltd. | | | 6,756,000 | | | | 155,228,551 | | |
Mitsubishi Electric Corp. | | | 24,592,300 | | | | 281,987,885 | | |
Mitsubishi Estate Co. Ltd. | | | 10,704,178 | | | | 137,016,910 | | |
MS&AD Insurance Group Holdings, Inc. | | | 10,476,620 | | | | 383,868,982 | | |
Secom Co. Ltd. | | | 6,337,130 | | | | 440,144,394 | | |
Shimano, Inc. | | | 2,260,590 | | | | 325,312,723 | | |
SMC Corp. | | | 442,156 | | | | 204,171,340 | | |
Sompo Holdings, Inc. | | | 7,121,400 | | | | 308,498,818 | | |
T Hasegawa Co. Ltd. (b) | | | 3,002,800 | | | | 62,909,936 | | |
USS Co. Ltd. | | | 1,298,600 | | | | 22,698,097 | | |
| | | | 3,191,205,867 | | |
Mexico — 1.6% | |
Fomento Economico Mexicano SAB de CV, ADR | | | 5,421,458 | | | | 614,847,552 | | |
Fresnillo plc | | | 5,590,827 | | | | 37,629,591 | | |
Industrias Penoles SAB de CV* | | | 6,401,020 | | | | 71,458,943 | | |
| | | | 723,936,086 | | |
Netherlands — 0.4% | |
Heineken Holding NV | | | 2,538,232 | | | | 193,117,540 | | |
Norway — 0.2% | |
Orkla ASA | | | 16,166,787 | | | | 111,429,514 | | |
First Eagle Funds | Annual Report | October 31, 2023
31
First Eagle Global Fund | Consolidated Schedule of Investments | October 31, 2023
Investments | | Shares | | Value ($) | |
South Korea — 1.7% | |
Hyundai Mobis Co. Ltd. | | | 999,985 | | | | 154,862,440 | | |
KT&G Corp. | | | 5,242,098 | | | | 330,688,753 | | |
Lotte Corp. | | | 478,555 | | | | 9,229,495 | | |
Lotte Wellfood Co. Ltd. | | | 99,845 | | | | 8,438,327 | | |
NAVER Corp. | | | 721,340 | | | | 100,845,622 | | |
Samsung Electronics Co. Ltd. (Preference) | | | 4,049,795 | | | | 161,686,961 | | |
| | | | 765,751,598 | | |
Sweden — 0.8% | |
Investor AB, Class A | | | 4,970,940 | | | | 90,477,739 | | |
Investor AB, Class B | | | 11,255,824 | | | | 206,624,320 | | |
Svenska Handelsbanken AB, Class A | | | 10,429,006 | | | | 88,914,535 | | |
| | | | 386,016,594 | | |
Switzerland — 2.1% | |
Cie Financiere Richemont SA (Registered) | | | 4,644,824 | | | | 547,975,512 | | |
Schindler Holding AG | | | 1,798,637 | | | | 363,905,211 | | |
Schindler Holding AG (Registered) | | | 211,870 | | | | 41,302,143 | | |
| | | | 953,182,866 | | |
Taiwan — 0.9% | |
Taiwan Semiconductor Manufacturing Co. Ltd., ADR | | | 4,606,256 | | | | 397,565,955 | | |
Thailand — 0.4% | |
Bangkok Bank PCL, NVDR | | | 42,690,800 | | | | 187,075,478 | | |
United Kingdom — 5.5% | |
BAE Systems plc | | | 30,239,911 | | | | 406,617,399 | | |
Berkeley Group Holdings plc (b) | | | 6,766,463 | | | | 332,616,729 | | |
British American Tobacco plc | | | 19,154,797 | | | | 572,200,673 | | |
Derwent London plc, REIT | | | 3,383,761 | | | | 75,200,743 | | |
Lloyds Banking Group plc | | | 396,239,696 | | | | 192,849,855 | | |
Reckitt Benckiser Group plc | | | 5,493,332 | | | | 367,542,154 | | |
Unilever plc | | | 12,894,404 | | | | 609,961,312 | | |
| | | | 2,556,988,865 | | |
United States — 43.9% | |
Alphabet, Inc., Class A* | | | 2,694,360 | | | | 334,316,189 | | |
Alphabet, Inc., Class C* | | | 4,503,302 | | | | 564,263,741 | | |
American Express Co. | | | 1,903,714 | | | | 277,999,355 | | |
Analog Devices, Inc. | | | 2,674,970 | | | | 420,853,030 | | |
First Eagle Funds | Annual Report | October 31, 2023
32
First Eagle Global Fund | Consolidated Schedule of Investments | October 31, 2023
Investments | | Shares | | Value ($) | |
United States — 43.9% (continued) | |
Bank of New York Mellon Corp. (The) | | | 11,016,077 | | | | 468,183,272 | | |
Becton Dickinson & Co. | | | 1,130,197 | | | | 285,691,198 | | |
Berkshire Hathaway, Inc., Class A* | | | 675 | | | | 349,531,875 | | |
Boston Properties, Inc., REIT | | | 2,473,129 | | | | 132,485,521 | | |
Brown & Brown, Inc. | | | 3,021,843 | | | | 209,776,341 | | |
CH Robinson Worldwide, Inc. (b) | | | 6,691,967 | | | | 547,603,660 | | |
Charles Schwab Corp. (The) | | | 2,570,105 | | | | 133,748,264 | | |
Colgate-Palmolive Co. | | | 7,218,573 | | | | 542,259,204 | | |
Comcast Corp., Class A | | | 21,961,227 | | | | 906,779,063 | | |
Cummins, Inc. | | | 1,455,755 | | | | 314,879,806 | | |
Deere & Co. | | | 381,724 | | | | 139,466,681 | | |
Dentsply Sirona, Inc. | | | 6,900,950 | | | | 209,857,889 | | |
Douglas Emmett, Inc., REIT (b) | | | 9,162,021 | | | | 102,706,255 | | |
Elevance Health, Inc. | | | 1,258,041 | | | | 566,231,674 | | |
Equity Residential, REIT | | | 5,947,526 | | | | 329,076,614 | | |
Expeditors International of Washington, Inc. | | | 1,875,971 | | | | 204,949,832 | | |
Extra Space Storage, Inc., REIT | | | 1,117,963 | | | | 115,809,787 | | |
Exxon Mobil Corp. | | | 9,538,191 | | | | 1,009,617,517 | | |
Fidelity National Financial, Inc. | | | 4,297,027 | | | | 167,970,785 | | |
Flowserve Corp. (b) | | | 7,892,216 | | | | 289,802,171 | | |
Haleon plc | | | 68,822,768 | | | | 275,847,882 | | |
HCA Healthcare, Inc. | | | 3,109,934 | | | | 703,280,475 | | |
IPG Photonics Corp.* (b) | | | 3,097,302 | | | | 266,058,242 | | |
JG Boswell Co. | | | 2,485 | | | | 1,494,727 | | |
Kraft Heinz Co. (The) | | | 4,471,740 | | | | 140,680,940 | | |
Medtronic plc | | | 6,323,862 | | | | 446,211,703 | | |
Meta Platforms, Inc., Class A* | | | 4,124,147 | | | | 1,242,481,767 | | |
Microsoft Corp. | | | 1,102,682 | | | | 372,827,811 | | |
Mills Music Trust (b) | | | 31,592 | | | | 1,074,444 | | |
Nestle SA (Registered) | | | 3,086,462 | | | | 332,840,298 | | |
Newmont Corp. | | | 7,901,033 | | | | 296,051,706 | | |
Noble Corp. plc | | | 1,830,953 | | | | 85,487,196 | | |
NOV, Inc. (b) | | | 26,905,276 | | | | 537,029,309 | | |
ONEOK, Inc. | | | 2,183,545 | | | | 142,367,134 | | |
Oracle Corp. | | | 13,402,937 | | | | 1,385,863,686 | | |
First Eagle Funds | Annual Report | October 31, 2023
33
First Eagle Global Fund | Consolidated Schedule of Investments | October 31, 2023
Investments | | Shares | | Value ($) | |
United States — 43.9% (continued) | |
Philip Morris International, Inc. | | | 6,664,841 | | | | 594,237,224 | | |
PPG Industries, Inc. | | | 853,547 | | | | 104,789,965 | | |
Ross Stores, Inc. | | | 2,633,277 | | | | 305,381,134 | | |
Royal Gold, Inc. | | | 1,476,988 | | | | 154,094,158 | | |
RPM International, Inc. | | | 850,166 | | | | 77,594,651 | | |
Salesforce, Inc.* | | | 1,385,077 | | | | 278,165,014 | | |
Sanofi SA | | | 4,031,951 | | | | 366,126,234 | | |
Schlumberger NV | | | 19,905,698 | | | | 1,107,951,151 | | |
Texas Instruments, Inc. | | | 2,800,783 | | | | 397,739,194 | | |
UGI Corp. | | | 4,677,898 | | | | 97,300,278 | | |
Universal Health Services, Inc., Class B | | | 3,368,166 | | | | 424,018,418 | | |
US Bancorp | | | 5,965,007 | | | | 190,164,423 | | |
Walmart, Inc. | | | 1,383,386 | | | | 226,059,106 | | |
Walt Disney Co. (The)* | | | 2,946,738 | | | | 240,424,353 | | |
Weyerhaeuser Co., REIT | | | 10,347,140 | | | | 296,859,447 | | |
Willis Towers Watson plc | | | 2,868,912 | | | | 676,747,652 | | |
| | | | 20,391,109,446 | | |
Total Common Stocks
(Cost $26,790,095,470) | | | 36,060,906,510 | | |
| | | Ounces | | | |
Commodities — 11.8% | |
Gold bullion*
(Cost $2,902,970,282) | | | 2,764,801 | | | | 5,488,517,064 | | |
| | | Principal Amount ($) | | | |
Foreign Government Securities — 0.8% | |
Indonesia — 0.1% | |
Republic of Indonesia
8.38%, 3/15/2024 | | IDR | 853,795,000,000 | | | | 54,011,872 | | |
Mexico — 0.4% | |
Mex Bonos Desarr Fix Rt
Series M, 8.00%, 12/7/2023 | | MXN | 911,940,000 | | | | 50,359,786 | | |
Series M, 10.00%, 12/5/2024 | | MXN | 816,590,000 | | | | 44,673,529 | | |
Series M, 5.75%, 3/5/2026 | | MXN | 1,813,230,000 | | | | 90,375,873 | | |
| | | | 185,409,188 | | |
First Eagle Funds | Annual Report | October 31, 2023
34
First Eagle Global Fund | Consolidated Schedule of Investments | October 31, 2023
Investments | | Principal Amount ($) | | Value ($) | |
South Korea — 0.3% | |
Republic of Korea
1.25%, 3/10/2026 | | KRW | 158,937,690,000 | | | | 110,334,384 | | |
Total Foreign Government Securities
(Cost 367,344,007) | | | 349,755,444 | | |
Corporate Bonds — 0.0% (c) | |
United States — 0.0% (c) | |
Bausch & Lomb, Inc.
7.13%, 8/1/2028‡ (Cost $5,154,748) | | | 5,467,000 | | | | 4,954,469 | | |
Short-Term Investments — 9.7% | |
Commercial Paper — 9.6% | |
AES Corp. (The)
6.00%, 11/1/2023 (d) | | | 34,840,000 | | | | 34,834,147 | | |
Alimentation Couche-Tard, Inc.
5.81%, 1/10/2024 (d)(e) | | | 65,185,000 | | | | 64,449,383 | | |
5.78%, 1/16/2024 (d)(e) | | | 47,967,000 | | | | 47,378,714 | | |
5.84%, 2/1/2024 (d)(e) | | | 36,109,000 | | | | 35,571,139 | | |
American Honda Finance Corp.
5.72%, 12/12/2023 (d) | | | 47,000,000 | | | | 46,693,262 | | |
5.73%, 12/19/2023 (d) | | | 50,000,000 | | | | 49,618,163 | | |
BASF SE
5.53%, 11/29/2023 (d) | | | 50,000,000 | | | | 49,777,228 | | |
BP Capital Markets plc
5.61%, 12/27/2023 (d) | | | 75,000,000 | | | | 74,342,837 | | |
Credit Agricole Corporate and Investment Bank
5.27%, 11/1/2023 (d) | | | 16,932,000 | | | | 16,929,494 | | |
Engie Regeneration Apollo Ltd.
5.49%, 12/21/2023 (d) | | | 100,000,000 | | | | 99,233,017 | | |
Engie SA
5.53%, 12/11/2023 (d) | | | 71,850,000 | | | | 71,410,032 | | |
5.65%, 1/12/2024 (d) | | | 150,000,000 | | | | 148,323,838 | | |
5.63%, 1/30/2024 (d) | | | 50,000,000 | | | | 49,294,497 | | |
Entergy Corp.
5.40%, 11/1/2023 (d)(e) | | | 21,743,000 | | | | 21,739,739 | | |
European Investment Bank
5.26%, 12/22/2023 (d) | | | 40,000,000 | | | | 39,690,504 | | |
5.33%, 12/28/2023 (d) | | | 93,000,000 | | | | 92,195,894 | | |
First Eagle Funds | Annual Report | October 31, 2023
35
First Eagle Global Fund | Consolidated Schedule of Investments | October 31, 2023
Investments | | Principal Amount ($) | | Value ($) | |
Commercial Paper — 9.6% (continued) | |
FMS Wertmanagement
5.44%, 11/2/2023 (d)(e) | | | 100,000,000 | | | | 99,970,802 | | |
5.44%, 11/6/2023 (d)(e) | | | 50,000,000 | | | | 49,956,107 | | |
5.51%, 1/16/2024 (d) | | | 100,000,000 | | | | 98,844,715 | | |
5.48%, 1/19/2024 (d)(e) | | | 58,880,000 | | | | 58,173,004 | | |
5.48%, 1/23/2024 (d)(e) | | | 39,253,000 | | | | 38,757,862 | | |
General Motors Financial Co., Inc.
5.45%, 11/1/2023 (d) | | | 107,511,000 | | | | 107,494,658 | | |
Global Payments, Inc.
5.96%, 11/1/2023 (d) | | | 37,110,000 | | | | 37,103,840 | | |
Hydro-Quebec
5.33%, 11/3/2023 (d)(e) | | | 113,000,000 | | | | 112,950,428 | | |
5.40%, 11/27/2023 (d) | | | 80,000,000 | | | | 79,680,440 | | |
John Deere Capital Corp.
5.38%, 11/14/2023 (d) | | | 50,000,000 | | | | 49,896,580 | | |
Kreditanstalt fuer Wiederaufbau
5.33%, 11/21/2023 (d)(e) | | | 78,571,000 | | | | 78,331,293 | | |
5.53%, 1/19/2024 (d) | | | 63,000,000 | | | | 62,236,066 | | |
5.52%, 1/23/2024 (d)(e) | | | 55,000,000 | | | | 54,299,043 | | |
5.52%, 1/26/2024 (d)(e) | | | 75,000,000 | | | | 74,009,288 | | |
LVMH Moet Hennessy Louis Vuitton SE
5.51%, 1/12/2024 (d)(e) | | | 41,300,000 | | | | 40,850,138 | | |
Microsoft Corp.
5.42%, 12/5/2023 (d)(e) | | | 99,400,000 | | | | 98,884,754 | | |
5.40%, 12/11/2023 (d)(e) | | | 37,500,000 | | | | 37,272,208 | | |
5.40%, 12/15/2023 (d)(e) | | | 90,000,000 | | | | 89,399,812 | | |
5.41%, 12/19/2023 (d)(e) | | | 80,000,000 | | | | 79,419,514 | | |
5.41%, 12/20/2023 (d)(e) | | | 47,780,000 | | | | 47,426,295 | | |
5.41%, 1/2/2024 (d)(e) | | | 50,000,000 | | | | 49,534,063 | | |
Nederlandse Waterschapsbank NV
5.42%, 11/1/2023 (d) | | | 125,000,000 | | | | 124,981,517 | | |
NRW Bank
5.41%, 11/8/2023 (d)(e) | | | 40,000,000 | | | | 39,952,967 | | |
5.43%, 11/14/2023 (d) | | | 50,000,000 | | | | 49,896,969 | | |
5.42%, 11/22/2023 (d)(e) | | | 31,429,000 | | | | 31,327,026 | | |
5.46%, 11/27/2023 (d) | | | 85,714,000 | | | | 85,372,258 | | |
5.43%, 11/28/2023 (d) | | | 80,906,000 | | | | 80,571,397 | | |
First Eagle Funds | Annual Report | October 31, 2023
36
First Eagle Global Fund | Consolidated Schedule of Investments | October 31, 2023
Investments | | Principal Amount ($) | | Value ($) | |
Commercial Paper — 9.6% (continued) | |
5.47%, 12/8/2023 (d)(e) | | | 100,000,000 | | | | 99,436,024 | | |
5.44%, 12/12/2023 (d)(e) | | | 70,000,000 | | | | 69,562,724 | | |
Oesterreichische Kontrollbank AG
5.46%, 11/30/2023 (d) | | | 49,200,000 | | | | 48,980,240 | | |
5.50%, 1/22/2024 (d) | | | 55,000,000 | | | | 54,313,897 | | |
5.56%, 2/5/2024 (d) | | | 68,072,000 | | | | 67,075,573 | | |
Ontario Teachers' Finance Trust
5.38%, 11/6/2023 (d)(e) | | | 9,155,000 | | | | 9,146,887 | | |
5.39%, 11/17/2023 (d)(e) | | | 3,400,000 | | | | 3,391,430 | | |
5.54%, 2/8/2024 (d)(e) | | | 56,691,000 | | | | 55,834,651 | | |
Oracle Corp.
5.57%, 11/3/2023 (d)(e) | | | 35,000,000 | | | | 34,984,179 | | |
5.56%, 11/8/2023 (d)(e) | | | 76,700,000 | | | | 76,607,360 | | |
5.58%, 11/15/2023 (d)(e) | | | 75,000,000 | | | | 74,829,000 | | |
5.62%, 12/20/2023 (d)(e) | | | 44,815,000 | | | | 44,465,401 | | |
Philip Morris International, Inc.
5.49%, 11/13/2023 (d) | | | 64,286,000 | | | | 64,161,397 | | |
5.38%, 11/16/2023 (d) | | | 34,000,000 | | | | 33,918,858 | | |
5.39%, 11/17/2023 (d)(e) | | | 25,400,000 | | | | 25,335,598 | | |
5.51%, 12/1/2023 (d) | | | 75,000,000 | | | | 74,652,563 | | |
5.48%, 12/4/2023 (d) | | | 90,000,000 | | | | 89,542,814 | | |
Province of Quebec
5.40%, 11/20/2023 (d)(e) | | | 70,000,000 | | | | 69,793,241 | | |
PSP Capital, Inc.
5.43%, 11/7/2023 (d)(e) | | | 74,250,000 | | | | 74,173,193 | | |
5.40%, 11/9/2023 (d)(e) | | | 66,700,000 | | | | 66,611,231 | | |
5.52%, 1/17/2024 (d)(e) | | | 100,000,000 | | | | 98,832,167 | | |
5.48%, 1/29/2024 (d)(e) | | | 100,000,000 | | | | 98,652,500 | | |
Siemens Capital Co. LLC
5.43%, 1/18/2024 (d)(e) | | | 70,000,000 | | | | 69,181,407 | | |
5.41%, 2/1/2024 (d) | | | 60,600,000 | | | | 59,762,927 | | |
United Parcel Service, Inc.
5.48%, 1/22/2024 (d)(e) | | | 50,000,000 | | | | 49,379,998 | | |
5.47%, 1/26/2024 (d)(e) | | | 37,800,000 | | | | 37,308,080 | | |
Vulcan Materials Co.
5.62%, 11/29/2023 (d) | | | 32,970,000 | | | | 32,822,482 | | |
First Eagle Funds | Annual Report | October 31, 2023
37
First Eagle Global Fund | Consolidated Schedule of Investments | October 31, 2023
Investments | | Principal Amount ($) | | Value ($) | |
Commercial Paper — 9.6% (continued) | |
Walt Disney Co. (The)
5.50%, 1/3/2024 (d)(e) | | | 90,000,000 | | | | 89,133,227 | | |
Total Commercial Paper
(Cost $4,470,591,460) | | | 4,469,963,981 | | |
U.S. Treasury Obligations — 0.1% | |
U.S. Treasury Bills
5.33%, 11/16/2023 (d) | | | 20,000,000 | | | | 19,956,094 | | |
5.34%, 12/14/2023 (d) | | | 20,000,000 | | | | 19,873,568 | | |
Total U.S. Treasury Obligations
(Cost $39,831,155) | | | 39,829,662 | | |
| | | Shares | | | |
Investment Companies — 0.0% (c) | |
JP Morgan U.S. Government Money Market Fund,
Capital Shares 5.37% (f) (Cost $331,992) | | | 331,992 | | | | 331,992 | | |
Total Short-Term Investments
(Cost $4,510,754,607) | | | 4,510,125,635 | | |
Total Investments — 99.9%
(Cost $34,576,319,114) | | | 46,414,259,122 | | |
Other Assets Less Liabilities — 0.1% | | | 67,764,828 | | |
Net Assets — 100.0% | | | 46,482,023,950 | | |
* Non-income producing security.
‡ Value determined using significant unobservable inputs.
(a) Security fair valued as of October 31, 2023 in accordance with procedures approved by the Board of Trustees. Total value of all such securities at October 31, 2023 amounted to $142,499,893, which represents approximately 0.31% of net assets of the Fund.
(b) Affiliated company as defined under the Investment Company Act of 1940.
(c) Represents less than 0.05% of net assets.
(d) The rate shown was the current yield as of October 31, 2023.
(e) Securities exempt from registration under Rule 144A or section 4(a)2 of the Securities Act of 1933. Total value of all such securities at October 31, 2023 amounted to $2,396,311,877, which represents approximately 5.16% of net assets of the Fund.
(f) Represents 7-day effective yield as of October 31, 2023.
First Eagle Funds | Annual Report | October 31, 2023
38
First Eagle Global Fund | Consolidated Schedule of Investments | October 31, 2023
As of October 31, 2023, the gross unrealized appreciation (depreciation) of investments based on the aggregate cost of investment securities and derivative instruments, if applicable, for federal income tax purposes was as follows:
Aggregate gross unrealized appreciation | | $ | 14,155,250,017 | | |
Aggregate gross unrealized depreciation | | | (2,745,806,565 | ) | |
Net unrealized appreciation | | $ | 11,409,443,452 | | |
Federal income tax cost | | $ | 35,050,422,870 | | |
Forward Foreign Currency Exchange Contracts outstanding as of October 31, 2023
Currency
Purchased | | Currency Sold | | Counterparty | | Settlement
Date | | Unrealized
Appreciation
(Depreciation) | |
USD | 203,967,511 | | | EUR | 181,448,000 | | | Bank of New York Mellon | | 11/15/2023 | | $ | 11,874,082 | | |
USD | 89,809,702 | | | JPY | 12,204,420,000 | | | Bank of New York Mellon | | 11/15/2023 | | | 9,121,460 | | |
USD | 189,230,950 | | | EUR | 172,420,000 | | | Goldman Sachs | | 12/20/2023 | | | 6,371,435 | | |
USD | 65,891,578 | | | GBP | 51,704,000 | | | Goldman Sachs | | 12/20/2023 | | | 3,023,143 | | |
USD | 75,914,511 | | | JPY | 10,850,461,000 | | | Goldman Sachs | | 12/20/2023 | | | 3,727,175 | | |
USD | 200,497,087 | | | EUR | 185,316,000 | | | JPMorgan Chase Bank | | 01/24/2024 | | | 3,620,549 | | |
USD | 107,711,215 | | | GBP | 86,296,000 | | | JPMorgan Chase Bank | | 01/24/2024 | | | 2,750,063 | | |
USD | 96,186,951 | | | JPY | 13,887,472,000 | | | JPMorgan Chase Bank | | 01/24/2024 | | | 3,255,294 | | |
USD | 180,084,137 | | | EUR | 168,788,000 | | | UBS AG | | 02/21/2024 | | | 529,887 | | |
USD | 78,960,114 | | | JPY | 11,505,223,000 | | | UBS AG | | 02/21/2024 | | | 1,622,167 | | |
Total unrealized appreciation | | | | | | | | | 45,895,255 | | |
EUR | 33,670,000 | | | USD | 36,028,752 | | | JPMorgan Chase Bank | | 01/24/2024 | | | (258,322 | ) | |
GBP | 9,226,000 | | | USD | 11,251,245 | | | JPMorgan Chase Bank | | 01/24/2024 | | | (29,733 | ) | |
Total unrealized depreciation | | | | | | | | | (288,055 | ) | |
Net unrealized appreciation | | | | | | | | $ | 45,607,200 | | |
Abbreviations
ADR — American Depositary Receipt
EUR — Euro
Fix Rt — Fixed Rate
GBP — British Pound
IDR — Indonesian Rupiah
JPY — Japanese Yen
KRW — South Korean Won
MXN — Mexican Peso
NVDR — Non-Voting Depositary Receipt
Preference — A special type of equity investment that shares in the earnings of the company, has limited voting rights, and may have a dividend preference. Preference shares may also have liquidation preference.
REIT — Real Estate Investment Trust
USD — United States Dollar
First Eagle Funds | Annual Report | October 31, 2023
39
First Eagle Global Fund | Consolidated Schedule of Investments | October 31, 2023
Affiliated Securities
Security Description | | Shares at
October 31, 2023 | | Market Value
October 31, 2022 | | Purchases at
Cost | | Proceeds from
Sales | |
Common Stocks — 4.7% | |
Japan — 0.2% | |
Chofu Seisakusho Co. Ltd. | | | 3,136,200 | | | $ | 44,031,237 | | | $ | — | | | $ | (1,561,269 | ) | |
T Hasegawa Co. Ltd. | | | 3,002,800 | | | | 63,875,515 | | | | — | | | | — | | |
| | | | | | 107,906,752 | | | | — | | | | (1,561,269 | ) | |
United Kingdom — 0.7% | |
Berkeley Group Holdings plc | | | 6,766,463 | | | | 269,219,704 | | | | — | | | | — | | |
United States — 3.7% | |
CH Robinson Worldwide, Inc. | | | 6,691,967 | | | | 725,720,121 | | | | — | | | | (77,227,324 | ) | |
Douglas Emmett, Inc., REIT | | | 9,162,021 | | | | 144,503,046 | | | | 15,559,889 | | | | — | | |
Flowserve Corp. | | | 7,892,216 | | | | 226,348,755 | | | | — | | | | — | | |
IPG Photonics Corp.* | | | 3,097,302 | | | | 265,314,889 | | | | — | | | | — | | |
Mills Music Trust | | | 31,592 | | | | 1,200,812 | | | | — | | | | — | | |
NOV, Inc. | | | 26,905,276 | | | | 602,678,182 | | | | — | | | | — | | |
| | | | | | 1,965,765,805 | | | | 15,559,889 | | | | (77,227,324 | ) | |
Total Common Stocks | | | | | 2,342,892,261 | | | | 15,559,889 | | | | (78,788,593 | ) | |
Total | | | | $ | 2,342,892,261 | | | $ | 15,559,889 | | | $ | (78,788,593 | ) | |
First Eagle Funds | Annual Report | October 31, 2023
40
First Eagle Global Fund | Consolidated Schedule of Investments | October 31, 2023
Affiliated Securities (continued)
Security Description | | Net Realized
Gains
(Loss) | | Change in
Unrealized
Appreciation/
Depreciation | | Market Value
October 31, 2023 | | Dividend
Income | |
Common Stocks — 4.7% | |
Japan — 0.2% | |
Chofu Seisakusho Co. Ltd. | | $ | (307,179 | ) | | $ | 2,535,995 | | | $ | 44,698,784 | | | $ | 835,640 | | |
T Hasegawa Co. Ltd. | | | — | | | | (965,579 | ) | | | 62,909,936 | | | | 1,211,937 | | |
| | | | (307,179 | ) | | | 1,570,416 | | | | 107,608,720 | | | | 2,047,577 | | |
United Kingdom — 0.7% | |
Berkeley Group Holdings plc | | | — | | | | 63,397,025 | | | | 332,616,729 | | | | 10,729,483 | | |
United States — 3.7% | |
CH Robinson Worldwide, Inc. | | | 16,286,445 | | | | (117,175,582 | ) | | | 547,603,660 | | | | 16,959,736 | | |
Douglas Emmett, Inc., REIT | | | — | | | | (57,356,680 | ) | | | 102,706,255 | | | | 6,783,215 | | |
Flowserve Corp. | | | — | | | | 63,453,416 | | | | 289,802,171 | | | | 6,313,773 | | |
IPG Photonics Corp.* | | | — | | | | 743,353 | | | | 266,058,242 | | | | — | | |
Mills Music Trust | | | — | | | | (126,368 | ) | | | 1,074,444 | | | | 98,721 | | |
NOV, Inc. | | | — | | | | (65,648,873 | ) | | | 537,029,309 | | | | 5,381,055 | | |
| | | | 16,286,445 | | | | (176,110,734 | ) | | | 1,744,274,081 | | | | 35,536,500 | | |
Total Common Stocks | | | 15,979,266 | | | | (111,143,293 | ) | | | 2,184,499,530 | | | | 48,313,560 | | |
Total | | $ | 15,979,266 | | | $ | (111,143,293 | ) | | $ | 2,184,499,530 | | | $ | 48,313,560 | | |
* Non-income producing security.
See Notes to Financial Statements.
First Eagle Funds | Annual Report | October 31, 2023
41
First Eagle Overseas Fund
Data as of October 31, 2023 (unaudited)
Investment Objective
The First Eagle Overseas Fund seeks long-term growth of capital by investing primarily in equities issued by non-U.S. corporations. Management's research-driven process focuses on seeking securities that may be undervalued.
Average Annual Returns (%) | | | | | | One Year | | Five Years | | Ten Years | |
First Eagle Overseas Fund | | Class A | | without sales load | | | 11.11 | | | | 3.74 | | | | 3.10 | | |
| | | | with sales load | | | 5.55 | | | | 2.68 | | | | 2.58 | | |
MSCI EAFE Index | | | | | | | 14.40 | | | | 4.10 | | | | 3.05 | | |
Consumer Price Index | | | | | | | 3.23 | | | | 4.01 | | | | 2.79 | | |

Sectors* (%) | |
Consumer Staples | | | 20.2 | | |
Financials | | | 13.8 | | |
Industrials | | | 13.6 | | |
Commodities | | | 12.2 | | |
Consumer Discretionary | | | 8.5 | | |
Materials | | | 7.5 | | |
Energy | | | 6.0 | | |
Real Estate | | | 3.6 | | |
Health Care | | | 3.5 | | |
Information Technology | | | 3.2 | | |
Foreign Government Securities | | | 1.8 | | |
Communication Services | | | 1.1 | | |
Short-Term Investments | | | 5.0 | | |
Countries*~ (%)
United States | | | 19.3 | | |
Japan | | | 15.8 | | |
United Kingdom | | | 9.2 | | |
Canada | | | 7.2 | | |
France | | | 4.9 | | |
South Korea | | | 4.3 | | |
Mexico | | | 3.7 | | |
Hong Kong | | | 3.6 | | |
Netherlands | | | 3.6 | | |
Brazil | | | 3.2 | | |
Switzerland | | | 3.1 | | |
Sweden | | | 2.6 | | |
China | | | 2.5 | | |
Singapore | | | 2.3 | | |
Germany | | | 2.1 | | |
Belgium | | | 1.8 | | |
Taiwan | | | 1.8 | | |
Thailand | | | 0.9 | | |
Chile | | | 0.9 | | |
Norway | | | 0.9 | | |
Turkey | | | 0.6 | | |
Faroe Islands | | | 0.3 | | |
Australia | | | 0.3 | | |
Indonesia | | | 0.1 | | |
Short-Term Investments | | | 5.0 | | |
* Asset Allocation, Sectors and Countries percentages are based on total investments in the portfolio.
** Includes short-term commercial paper (1.5% of total investments) that settles in 90 days or less, long-term commercial paper (3.3% of total investments) that settles in 91 days or greater and other short-term investments (0.2% of total investments), such as U.S. treasury bills or money market funds.
~ Country allocations reflect country of risk (not currency of issue). Bonds of non-U.S. issuers may be U.S. dollar denominated.
The Fund's portfolio composition is subject to change at any time.
First Eagle Funds | Annual Report | October 31, 2023
42
First Eagle Overseas Fund | Fund Overview
Growth of a $10,000 Initial Investment
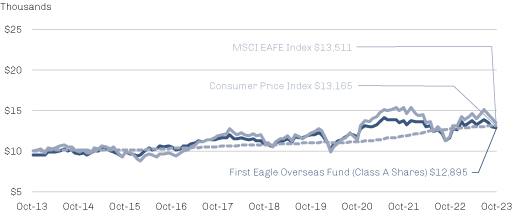
Performance data quoted herein represents past performance and should not be considered indicative of future results. Performance data quoted herein does not reflect the deduction of taxes that a shareholder would pay on Fund distributions or the sale of Fund shares. The average annual returns shown above are historical and reflect changes in share price, reinvested dividends and are net of expenses.
The average annual returns for Class A shares give effect to the deduction of the maximum sales charge of 5.00%.
The MSCI EAFE Index is an unmanaged total return index, reported in U.S. dollars, based on share prices and reinvested net dividends of companies from 21 developed market countries, excluding the United States and Canada. One cannot invest directly in an index. The Consumer Price Index (CPI) represents the change in price of all goods and services purchased for consumption in urban households.
Top 10 Holdings* (%)
Gold bullion** (Precious Metal) | | | 12.1 | | |
Imperial Oil Ltd. (Oil, Gas & Consumable Fuels, Canada) | | | 3.6 | | |
Fomento Economico Mexicano SAB de CV, ADR (Beverages, Mexico) | | | 2.5 | | |
Willis Towers Watson plc (Insurance, United States) | | | 2.5 | | |
Danone SA (Food Products, France) | | | 2.4 | | |
Shell plc (Oil, Gas & Consumable Fuels, Netherlands) | | | 2.4 | | |
Unilever plc (Personal Care Products, United Kingdom) | | | 2.0 | | |
British American Tobacco plc (Tobacco, United Kingdom) | | | 1.9 | | |
Groupe Bruxelles Lambert NV (Financial Services, Belgium) | | | 1.8 | | |
Secom Co. Ltd. (Commercial Services & Supplies, Japan) | | | 1.8 | | |
Total | | | 33.0 | | |
* Holdings in cash, short-term commercial paper, long-term commercial paper and other short-term cash equivalents have been excluded.
** The Fund invests in gold and precious metals through investment in a wholly-owned subsidiary of the Fund organized under the laws of the Cayman Islands (the "Subsidiary"). Gold Bullion and commodities include the Fund's investment in the Subsidiary.
Percentages are based on total net assets.
First Eagle Funds | Annual Report | October 31, 2023
43
First Eagle Overseas Fund | Consolidated Schedule of Investments | October 31, 2023
Investments | | Shares | | Value ($) | |
Common Stocks — 81.0% | |
Australia — 0.3% | |
Newcrest Mining Ltd. (a) | | | 2,048,366 | | | | 31,398,242 | | |
Belgium — 1.8% | |
Groupe Bruxelles Lambert NV | | | 2,922,262 | | | | 213,735,978 | | |
Brazil — 3.1% | |
Ambev SA, ADR | | | 74,789,315 | | | | 189,216,967 | | |
Itausa SA* | | | 738,082 | | | | 1,256,061 | | |
Itausa SA (Preference) | | | 48,522,263 | | | | 83,152,150 | | |
Wheaton Precious Metals Corp. | | | 2,364,552 | | | | 99,902,322 | | |
| | | | 373,527,500 | | |
Canada — 7.2% | |
Agnico Eagle Mines Ltd. | | | 717,589 | | | | 33,655,661 | | |
Barrick Gold Corp. | | | 5,379,581 | | | | 85,965,704 | | |
Franco-Nevada Corp. | | | 194,071 | | | | 23,608,998 | | |
Imperial Oil Ltd. | | | 7,543,865 | | | | 429,920,066 | | |
Nutrien Ltd. | | | 2,436,243 | | | | 130,826,249 | | |
Power Corp. of Canada | | | 6,216,607 | | | | 149,772,374 | | |
| | | | 853,749,052 | | |
Chile — 0.9% | |
Cia Cervecerias Unidas SA, ADR (b) | | | 9,392,572 | | | | 105,666,435 | | |
China — 2.5% | |
Alibaba Group Holding Ltd.* | | | 13,666,828 | | | | 140,701,075 | | |
Prosus NV* | | | 5,606,068 | | | | 156,776,961 | | |
| | | | 297,478,036 | | |
Faroe Islands — 0.3% | |
Bakkafrost P/F | | | 801,656 | | | | 36,186,436 | | |
France — 5.0% | |
Danone SA | | | 4,768,985 | | | | 283,709,085 | | |
Laurent-Perrier (b) | | | 558,938 | | | | 69,786,652 | | |
Legrand SA | | | 812,472 | | | | 70,284,014 | | |
LVMH Moet Hennessy Louis Vuitton SE | | | 33,358 | | | | 23,882,012 | | |
Sodexo SA | | | 970,202 | | | | 102,675,126 | | |
Wendel SE | | | 439,181 | | | | 32,897,941 | | |
| | | | 583,234,830 | | |
First Eagle Funds | Annual Report | October 31, 2023
44
First Eagle Overseas Fund | Consolidated Schedule of Investments | October 31, 2023
Investments | | Shares | | Value ($) | |
Germany — 2.1% | |
Brenntag SE | | | 628,298 | | | | 46,721,258 | | |
FUCHS SE (Preference) | | | 2,322,615 | | | | 94,333,104 | | |
Henkel AG & Co. KGaA (Preference) | | | 1,476,257 | | | | 106,489,918 | | |
| | | | 247,544,280 | | |
Hong Kong — 3.6% | |
CK Asset Holdings Ltd. | | | 19,475,000 | | | | 97,342,376 | | |
Great Eagle Holdings Ltd. | | | 22,777,700 | | | | 37,120,421 | �� | |
Guoco Group Ltd. | | | 7,806,340 | | | | 58,639,003 | | |
Hongkong Land Holdings Ltd. | | | 15,883,500 | | | | 50,378,040 | | |
Hysan Development Co. Ltd. | | | 17,500,405 | | | | 32,213,983 | | |
Jardine Matheson Holdings Ltd. | | | 3,779,100 | | | | 153,133,438 | | |
| | | | 428,827,261 | | |
Japan — 15.7% | |
As One Corp. | | | 1,378,380 | | | | 43,928,824 | | |
Chofu Seisakusho Co. Ltd. | | | 1,704,600 | | | | 24,294,862 | | |
Daiichikosho Co. Ltd. (b) | | | 5,732,560 | | | | 84,735,608 | | |
FANUC Corp. | | | 6,945,600 | | | | 172,364,912 | | |
Hirose Electric Co. Ltd. | | | 758,730 | | | | 85,963,444 | | |
Hoshizaki Corp. | | | 2,554,200 | | | | 82,487,010 | | |
Kansai Paint Co. Ltd. | | | 8,320,730 | | | | 121,771,472 | | |
Keyence Corp. | | | 74,800 | | | | 28,956,480 | | |
Komatsu Ltd. | | | 3,814,300 | | | | 87,638,879 | | |
Mitsubishi Electric Corp. | | | 11,266,300 | | | | 129,185,156 | | |
Mitsubishi Estate Co. Ltd. | | | 7,062,358 | | | | 90,400,447 | | |
MS&AD Insurance Group Holdings, Inc. | | | 4,583,300 | | | | 167,934,573 | | |
Nagaileben Co. Ltd. | | | 1,687,224 | | | | 23,283,442 | | |
Nihon Kohden Corp. | | | 2,470,100 | | | | 58,340,696 | | |
Pilot Corp. | | | 477,500 | | | | 16,204,206 | | |
Secom Co. Ltd. | | | 3,010,200 | | | | 209,072,980 | | |
Shimano, Inc. | | | 976,470 | | | | 140,520,004 | | |
SK Kaken Co. Ltd. | | | 437,805 | | | | 20,507,442 | | |
SMC Corp. | | | 208,990 | | | | 96,503,877 | | |
Sompo Holdings, Inc. | | | 2,964,000 | | | | 128,400,384 | | |
First Eagle Funds | Annual Report | October 31, 2023
45
First Eagle Overseas Fund | Consolidated Schedule of Investments | October 31, 2023
Investments | | Shares | | Value ($) | |
Japan — 15.7% (continued) | |
T Hasegawa Co. Ltd. | | | 1,906,436 | | | | 39,940,644 | | |
USS Co. Ltd. | | | 560,300 | | | | 9,793,427 | | |
| | | | 1,862,228,769 | | |
Mexico — 3.0% | |
Fomento Economico Mexicano SAB de CV, ADR | | | 2,613,173 | | | | 296,359,950 | | |
Fresnillo plc | | | 1,426,722 | | | | 9,602,688 | | |
Grupo Mexico SAB de CV, Series B | | | 6,905,948 | | | | 28,165,420 | | |
Industrias Penoles SAB de CV* | | | 2,246,692 | | | | 25,081,352 | | |
| | | | 359,209,410 | | |
Netherlands — 3.6% | |
HAL Trust | | | 644,459 | | | | 72,593,966 | | |
Heineken Holding NV | | | 973,676 | | | | 74,080,665 | | |
Shell plc | | | 8,552,371 | | | | 279,385,716 | | |
| | | | 426,060,347 | | |
Norway — 0.9% | |
Orkla ASA | | | 14,829,598 | | | | 102,212,944 | | |
Singapore — 1.6% | |
Haw Par Corp. Ltd. (b) | | | 19,447,213 | | | | 135,861,236 | | |
UOL Group Ltd. | | | 14,128,300 | | | | 60,848,250 | | |
| | | | 196,709,486 | | |
South Korea — 4.0% | |
Fursys, Inc. (b) | | | 872,463 | | | | 18,766,466 | | |
Hyundai Mobis Co. Ltd. | | | 505,396 | | | | 78,268,032 | | |
KT&G Corp. | | | 2,451,893 | | | | 154,673,461 | | |
Lotte Corp. | | | 404,901 | | | | 7,808,991 | | |
Lotte Wellfood Co. Ltd. | | | 64,551 | | | | 5,455,481 | | |
NAVER Corp. | | | 286,676 | | | | 40,078,215 | | |
NongShim Co. Ltd. | | | 203,663 | | | | 66,983,765 | | |
Samsung Electronics Co. Ltd. (Preference) | | | 2,345,824 | | | | 93,656,383 | | |
| | | | 465,690,794 | | |
Sweden — 2.6% | |
Industrivarden AB, Class A | | | 123,708 | | | | 3,200,996 | | |
Industrivarden AB, Class C | | | 1,572,517 | | | | 40,554,123 | | |
Investor AB, Class A | | | 1,982,447 | | | | 36,083,180 | | |
Investor AB, Class B | | | 8,384,352 | | | | 153,912,413 | | |
First Eagle Funds | Annual Report | October 31, 2023
46
First Eagle Overseas Fund | Consolidated Schedule of Investments | October 31, 2023
Investments | | Shares | | Value ($) | |
Sweden — 2.6% (continued) | |
L E Lundbergforetagen AB, Class B | | | 296,080 | | | | 12,091,907 | | |
Svenska Handelsbanken AB, Class A | | | 6,838,494 | | | | 58,302,921 | | |
| | | | 304,145,540 | | |
Switzerland — 3.1% | |
Cie Financiere Richemont SA (Registered) | | | 1,767,922 | | | | 208,571,512 | | |
Schindler Holding AG | | | 724,861 | | | | 146,655,882 | | |
Schindler Holding AG (Registered) | | | 82,435 | | | | 16,069,959 | | |
| | | | 371,297,353 | | |
Taiwan — 1.8% | |
Taiwan Secom Co. Ltd. | | | 8,545,694 | | | | 31,125,991 | | |
Taiwan Semiconductor Manufacturing Co. Ltd., ADR | | | 2,075,542 | | | | 179,140,030 | | |
| | | | 210,266,021 | | |
Thailand — 1.0% | |
Bangkok Bank PCL, NVDR | | | 20,440,959 | | | | 89,574,385 | | |
Thai Beverage PCL | | | 52,214,985 | | | | 20,623,929 | | |
| | | | 110,198,314 | | |
Turkey — 0.6% | |
AG Anadolu Grubu Holding A/S | | | 9,784,125 | | | | 70,964,424 | | |
United Kingdom — 9.2% | |
BAE Systems plc | | | 13,135,620 | | | | 176,626,566 | | |
Berkeley Group Holdings plc | | | 2,497,480 | | | | 122,767,778 | | |
Big Yellow Group plc, REIT | | | 2,602,379 | | | | 30,265,907 | | |
British American Tobacco plc | | | 7,639,941 | | | | 228,223,738 | | |
Great Portland Estates plc, REIT | | | 4,895,618 | | | | 23,206,478 | | |
Lloyds Banking Group plc | | | 189,904,219 | | | | 92,426,381 | | |
Reckitt Benckiser Group plc | | | 2,577,229 | | | | 172,434,562 | | |
Unilever plc | | | 5,122,575 | | | | 242,320,046 | | |
| | | | 1,088,271,456 | | |
United States — 7.1% | |
Haleon plc | | | 26,953,694 | | | | 108,032,844 | | |
Legris Industries SA*‡ (a)(b)(c) | | | 905,366 | | | | 15,384,962 | | |
Nestle SA (Registered) | | | 1,236,148 | | | | 133,304,693 | | |
Newmont Corp. | | | 2,665,290 | | | | 99,868,416 | | |
Royal Gold, Inc. | | | 454,973 | | | | 47,467,333 | | |
First Eagle Funds | Annual Report | October 31, 2023
47
First Eagle Overseas Fund | Consolidated Schedule of Investments | October 31, 2023
Investments | | Shares | | Value ($) | |
United States — 7.1% (continued) | |
Sanofi SA | | | 1,679,882 | | | | 152,543,736 | | |
Willis Towers Watson plc | | | 1,237,899 | | | | 292,007,995 | | |
| | | | 848,609,979 | | |
Total Common Stocks
(Cost $7,922,012,650) | | | 9,587,212,887 | | |
| | | Ounces | | | |
Commodities — 12.1% | |
Gold bullion*
(Cost $663,216,747) | | | 724,971 | | | | 1,439,169,397 | | |
| | | Principal Amount ($) | | | |
Foreign Government Securities — 1.7% | |
Indonesia — 0.1% | |
Republic of Indonesia
8.38%, 3/15/2024 | | IDR | 267,431,000,000 | | | | 16,917,936 | | |
Mexico — 0.6% | |
Mex Bonos Desarr Fix Rt
Series M, 8.00%, 12/7/2023 | | MXN | 377,210,000 | | | | 20,830,553 | | |
Series M, 10.00%, 12/5/2024 | | MXN | 388,030,000 | | | | 21,228,119 | | |
Series M, 5.75%, 3/5/2026 | | MXN | 665,860,000 | | | | 33,188,111 | | |
| | | | 75,246,783 | | |
Singapore — 0.6% | |
Republic of Singapore
1.25%, 11/1/2026 | | SGD | 108,048,000 | | | | 73,841,810 | | |
South Korea — 0.4% | |
Republic of Korea
1.25%, 3/10/2026 | | KRW | 59,926,230,000 | | | | 41,600,729 | | |
Total Foreign Government Securities
(Cost $214,674,072) | | | 207,607,258 | | |
Short-Term Investments — 5.0% | |
Commercial Paper — 4.8% | |
AES Corp. (The)
6.00%, 11/1/2023 (d) | | | 21,250,000 | | | | 21,246,430 | | |
Alimentation Couche-Tard, Inc.
5.78%, 1/16/2024 (d)(e) | | | 13,133,000 | | | | 12,971,932 | | |
First Eagle Funds | Annual Report | October 31, 2023
48
First Eagle Overseas Fund | Consolidated Schedule of Investments | October 31, 2023
Investments | | Principal Amount ($) | | Value ($) | |
Commercial Paper — 4.8% (continued) | |
5.84%, 2/1/2024 (d)(e) | | | 3,891,000 | | | | 3,833,041 | | |
BP Capital Markets plc
5.61%, 12/27/2023 (d) | | | 25,000,000 | | | | 24,780,946 | | |
Credit Agricole Corporate and Investment Bank
5.27%, 11/1/2023 (d) | | | 10,248,000 | | | | 10,246,483 | | |
Engie Regeneration Apollo Ltd.
5.49%, 12/21/2023 (d) | | | 40,000,000 | | | | 39,693,207 | | |
Entergy Corp.
5.40%, 11/1/2023 (d)(e) | | | 13,357,000 | | | | 13,354,996 | | |
European Investment Bank
5.26%, 12/22/2023 (d) | | | 35,000,000 | | | | 34,729,191 | | |
5.33%, 12/28/2023 (d) | | | 57,000,000 | | | | 56,507,161 | | |
FMS Wertmanagement
5.48%, 1/19/2024 (d)(e) | | | 16,120,000 | | | | 15,926,441 | | |
5.48%, 1/23/2024 (d)(e) | | | 10,747,000 | | | | 10,611,437 | | |
General Motors Financial Co., Inc.
5.45%, 11/1/2023 (d) | | | 65,570,000 | | | | 65,560,033 | | |
Global Payments, Inc.
5.96%, 11/1/2023 (d) | | | 22,665,000 | | | | 22,661,238 | | |
Hydro-Quebec
5.33%, 11/3/2023 (d)(e) | | | 7,000,000 | | | | 6,996,929 | | |
5.40%, 11/27/2023 (d) | | | 15,200,000 | | | | 15,139,284 | | |
5.42%, 12/18/2023 (d)(e) | | | 49,940,000 | | | | 49,584,960 | | |
Kreditanstalt fuer Wiederaufbau
5.33%, 11/21/2023 (d)(e) | | | 21,429,000 | | | | 21,363,624 | | |
Microsoft Corp.
5.40%, 12/11/2023 (d)(e) | | | 12,500,000 | | | | 12,424,069 | | |
NRW Bank
5.41%, 11/8/2023 (d)(e) | | | 20,000,000 | | | | 19,976,483 | | |
5.42%, 11/22/2023 (d)(e) | | | 8,571,000 | | | | 8,543,191 | | |
5.46%, 11/27/2023 (d) | | | 14,286,000 | | | | 14,229,042 | | |
5.43%, 11/28/2023 (d) | | | 19,094,000 | | | | 19,015,033 | | |
Oesterreichische Kontrollbank AG
5.46%, 11/30/2023 (d) | | | 20,000,000 | | | | 19,910,666 | | |
5.50%, 1/22/2024 (d) | | | 20,000,000 | | | | 19,750,508 | | |
5.56%, 2/5/2024 (d) | | | 10,000,000 | | | | 9,853,622 | | |
Ontario Teachers' Finance Trust
5.38%, 11/6/2023 (d)(e) | | | 10,000,000 | | | | 9,991,138 | | |
First Eagle Funds | Annual Report | October 31, 2023
49
First Eagle Overseas Fund | Consolidated Schedule of Investments | October 31, 2023
Investments | | Principal Amount ($) | | Value ($) | |
Commercial Paper — 4.8% (continued) | |
5.54%, 2/8/2024 (d)(e) | | | 6,109,000 | | | | 6,016,720 | | |
Philip Morris International, Inc.
5.49%, 11/13/2023 (d) | | | 10,714,000 | | | | 10,693,233 | | |
Total Commercial Paper
(Cost $575,714,594) | | | 575,611,038 | | |
U.S. Treasury Obligations — 0.2% | |
U.S. Treasury Bills
5.33%, 11/16/2023 (d) | | | 10,000,000 | | | | 9,978,047 | | |
5.34%, 12/14/2023 (d) | | | 10,000,000 | | | | 9,936,784 | | |
Total U.S. Treasury Obligations
(Cost $19,915,578) | | | 19,914,831 | | |
| | | Shares | | | |
Investment Companies — 0.0% (f) | |
JP Morgan U.S. Government Money Market Fund,
Capital Shares 5.37% (g) (Cost $63,532) | | | 63,532 | | | | 63,532 | | |
Total Short-Term Investments
(Cost $595,693,704) | | | 595,589,401 | | |
Total Investments — 99.8%
(Cost $9,395,597,173) | | | 11,829,578,943 | | |
Other Assets Less Liabilities — 0.2% | | | 22,887,113 | | |
Net Assets — 100.0% | | | 11,852,466,056 | | |
* Non-income producing security.
‡ Value determined using significant unobservable inputs.
(a) Security fair valued as of October 31, 2023 in accordance with procedures approved by the Board of Trustees. Total value of all such securities at October 31, 2023 amounted to $46,783,204, which represents approximately 0.39% of net assets of the Fund.
(b) Affiliated company as defined under the Investment Company Act of 1940.
(c) Represents a security that is subject to legal or contractual restrictions on resale.
Restricted Securities | | Acquisition Date | | Cost | | Carrying Value
Per
Share/Principal | |
Legris Industries SE | | 04/30/04 | | $ | 23,433,066 | | | $ | 16.99 | | |
(d) The rate shown was the current yield as of October 31, 2023.
(e) Securities exempt from registration under Rule 144A or section 4(a)2 of the Securities Act of 1933. Total value of all such securities at October 31, 2023 amounted to $191,594,961, which represents approximately 1.62% of net assets of the Fund.
First Eagle Funds | Annual Report | October 31, 2023
50
First Eagle Overseas Fund | Consolidated Schedule of Investments | October 31, 2023
(f) Represents less than 0.05% of net assets.
(g) Represents 7-day effective yield as of October 31, 2023.
As of October 31, 2023, the gross unrealized appreciation (depreciation) of investments based on the aggregate cost of investment securities and derivative instruments, if applicable, for federal income tax purposes was as follows:
Aggregate gross unrealized appreciation | | $ | 3,295,098,499 | | |
Aggregate gross unrealized depreciation | | | (1,309,832,997 | ) | |
Net unrealized appreciation | | $ | 1,985,265,502 | | |
Federal income tax cost | | $ | 9,869,653,328 | | |
Forward Foreign Currency Exchange Contracts outstanding as of October 31, 2023
Currency
Purchased | | Currency Sold | | Counterparty | | Settlement
Date | | Unrealized
Appreciation
(Depreciation) | |
USD | 112,757,226 | | | EUR | 100,308,000 | | | Bank of New York Mellon | | 11/15/2023 | | $ | 6,564,225 | | |
USD | 52,874,960 | | | JPY | 7,185,284,000 | | | Bank of New York Mellon | | 11/15/2023 | | | 5,370,209 | | |
USD | 105,974,600 | | | EUR | 96,560,000 | | | Goldman Sachs | | 12/20/2023 | | | 3,568,181 | | |
USD | 26,060,206 | | | GBP | 20,449,000 | | | Goldman Sachs | | 12/20/2023 | | | 1,195,657 | | |
USD | 48,573,204 | | | JPY | 6,942,568,000 | | | Goldman Sachs | | 12/20/2023 | | | 2,384,799 | | |
USD | 113,529,111 | | | EUR | 104,933,000 | | | JPMorgan Chase Bank | | 01/24/2024 | | | 2,050,093 | | |
USD | 44,926,271 | | | GBP | 35,994,000 | | | JPMorgan Chase Bank | | 01/24/2024 | | | 1,147,049 | | |
USD | 55,304,253 | | | JPY | 7,984,828,000 | | | JPMorgan Chase Bank | | 01/24/2024 | | | 1,871,684 | | |
USD | 101,500,843 | | | EUR | 95,134,000 | | | UBS AG | | 02/21/2024 | | | 298,660 | | |
USD | 43,864,496 | | | JPY | 6,391,465,000 | | | UBS AG | | 02/21/2024 | | | 901,158 | | |
Total unrealized appreciation | | | | | | | | | 25,351,715 | | |
GBP | 3,670,000 | | | USD | 4,475,620 | | | JPMorgan Chase Bank | | 01/24/2024 | | | (11,828 | ) | |
Total unrealized depreciation | | | | | | | | | (11,828 | ) | |
Net unrealized appreciation | | | | | | | | $ | 25,339,887 | | |
Abbreviations
ADR — American Depositary Receipt
EUR — Euro
Fix Rt — Fixed Rate
GBP — British Pound
IDR — Indonesian Rupiah
JPY — Japanese Yen
KRW — South Korean Won
MXN — Mexican Peso
NVDR — Non-Voting Depositary Receipt
Preference — A special type of equity investment that shares in the earnings of the company, has limited voting rights, and may have a dividend preference. Preference shares may also have liquidation preference.
REIT — Real Estate Investment Trust
SGD — Singapore Dollar
USD — United States Dollar
First Eagle Funds | Annual Report | October 31, 2023
51
First Eagle Overseas Fund | Consolidated Schedule of Investments | October 31, 2023
Affiliated Securities
Security Description | | Shares at
October 31, 2023 | | Market Value
October 31, 2022 | | Purchases at
Cost | | Proceeds from
Sales | |
Common Stocks — 3.8% | |
Belgium — 0.1% | |
Legris Industries SA*‡ (a)(b) | | | 905,366 | | | $ | 14,924,062 | | | $ | — | | | $ | — | | |
Chile — 0.9% | |
Cia Cervecerias Unidas SA, ADR | | | 9,392,572 | | | | 101,533,703 | | | | — | | | | — | | |
France — 0.6% | |
Laurent-Perrier | | | 558,938 | | | | 54,469,274 | | | | — | | | | — | | |
Japan — 0.9% | |
Chofu Seisakusho Co. Ltd.^ | | | 1,704,600 | | | | 24,979,077 | | | | — | | | | (2,208,873 | ) | |
Daiichikosho Co. Ltd. | | | 5,732,560 | | | | 82,184,041 | | | | — | | | | — | | |
| | | | | | 107,163,118 | | | | — | | | | (2,208,873 | ) | |
Singapore — 1.1% | |
Haw Par Corp. Ltd. | | | 19,447,213 | | | | 129,829,745 | | | | — | | | | — | | |
South Korea — 0.2% | |
Fursys, Inc. | | | 872,463 | | | | 16,775,972 | | | | — | | | | — | | |
Namyang Dairy Products Co.
Ltd. (Preference)^ | | | — | | | | 2,237,746 | | | | — | | | | (3,232,535 | ) | |
| | | | | | 19,013,718 | | | | — | | | | (3,232,535 | ) | |
Total Common Stocks | | | | | 426,933,620 | | | | — | | | | (5,441,408 | ) | |
Total | | | | $ | 426,933,620 | | | $ | — | | | $ | (5,441,408 | ) | |
First Eagle Funds | Annual Report | October 31, 2023
52
First Eagle Overseas Fund | Consolidated Schedule of Investments | October 31, 2023
Affiliated Securities (continued)
Security Description | | Net Realized
Gains
(Loss) | | Change in
Unrealized
Appreciation/
Depreciation | | Market Value
October 31, 2023 | | Dividend
Income | |
Common Stocks — 3.8% | |
Belgium — 0.1% | |
Legris Industries SA*‡ (a)(b) | | $ | — | | | $ | 460,900 | | | $ | 15,384,962 | | | $ | — | | |
Chile — 0.9% | |
Cia Cervecerias Unidas SA, ADR | | | — | | | | 4,132,732 | | | | 105,666,435 | | | | 2,449,848 | | |
France — 0.6% | |
Laurent-Perrier | | | — | | | | 15,317,378 | | | | 69,786,652 | | | | 1,244,364 | | |
Japan — 0.9% | |
Chofu Seisakusho Co. Ltd.^ | | | (186,207 | ) | | | 1,710,865 | | | | 24,294,862 | | | | 472,686 | | |
Daiichikosho Co. Ltd. | | | — | | | | 2,551,567 | | | | 84,735,608 | | | | 2,077,190 | | |
| | | | (186,207 | ) | | | 4,262,432 | | | | 109,030,470 | | | | 2,549,876 | | |
Singapore — 1.1% | |
Haw Par Corp. Ltd. | | | — | | | | 6,031,491 | | | | 135,861,236 | | | | 5,066,729 | | |
South Korea — 0.2% | |
Fursys, Inc. | | | — | | | | 1,990,494 | | | | 18,766,466 | | | | 592,152 | | |
Namyang Dairy Products Co.
Ltd. (Preference)^ | | | 3,055,025 | | | | (2,060,236 | ) | | | — | | | | 10,187 | | |
| | | | 3,055,025 | | | | (69,742 | ) | | | 18,766,466 | | | | 602,339 | | |
Total Common Stocks | | | 2,868,818 | | | | 30,135,191 | | | | 454,496,221 | | | | 11,913,156 | | |
Total | | $ | 2,868,818 | | | $ | 30,135,191 | | | $ | 454,496,221 | | | $ | 11,913,156 | | |
* Non-income producing security.
‡ Value determined using significant unobservable inputs.
^ Represents an unaffiliated issuer as of October 31, 2023.
(a) Security fair valued as of October 31, 2023 in accordance with procedures approved by the Board of Trustees. Total value of all such securities at October 31, 2023 amounted to $15,384,962, which represents approximately 0.13% of net assets of the Fund.
(b) Represents a security that is subject to legal or contractual restrictions on resale.
See Notes to Financial Statements.
First Eagle Funds | Annual Report | October 31, 2023
53
First Eagle U.S. Value Fund
Data as of October 31, 2023 (unaudited)
Investment Objective
The First Eagle U.S. Value Fund seeks long-term growth of capital by investing, under normal market conditions, at least 80% of its net assets (plus any borrowings for investment purposes) in domestic equity and debt securities. Management utilizes a highly disciplined, bottom-up, value-oriented approach in seeking to achieve its investment objective.
Average Annual Returns^ (%) | | | | | | One Year | | Five Years | | Ten Years | |
First Eagle U.S. Value Fund | | Class A | | without sales charge | | | 8.81 | | | | 7.12 | | | | 6.70 | | |
| | | | with sales charge | | | 3.36 | | | | 6.02 | | | | 6.16 | | |
S&P 500 Index | | | | | | | 10.14 | | | | 11.01 | | | | 11.18 | | |
Consumer Price Index | | | | | | | 3.23 | | | | 4.01 | | | | 2.79 | | |
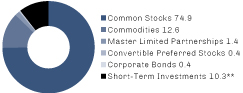
Sectors* (%)
Commodities | | | 12.6 | | |
Communication Services | | | 12.2 | | |
Information Technology | | | 11.7 | | |
Health Care | | | 10.9 | | |
Financials | | | 10.8 | | |
Energy | | | 9.2 | | |
Consumer Staples | | | 6.8 | | |
Industrials | | | 6.3 | | |
Materials | | | 4.2 | | |
Real Estate | | | 3.6 | | |
Consumer Discretionary | | | 1.0 | | |
Utilities | | | 0.4 | | |
Short-Term Investments | | | 10.3 | | |
^ Performance figures reflect certain fee waivers and/or expense limitations, without which returns may have been lower.
* Asset Allocation and Sectors percentages are based on total investments in the portfolio.
** Includes short-term commercial paper (0.7% of total investments) that settles in 90 days or less, long-term commercial paper (6.7% of total investments) that settles in 91 days or greater and other short-term investments (2.9% of total investments), such as U.S. treasury bills or money market funds.
The Fund's portfolio composition is subject to change at any time.
First Eagle Funds | Annual Report | October 31, 2023
54
First Eagle U.S. Value Fund | Fund Overview
Growth of a $10,000 Initial Investment

Performance data quoted herein represents past performance and should not be considered indicative of future results. Performance data quoted herein does not reflect the deduction of taxes that a shareholder would pay on Fund distributions or the sale of Fund shares. The average annual returns shown above are historical and reflect changes in share price, reinvested dividends and are net of expenses.
The average annual returns for Class A shares give effect to the deduction of the maximum sales charge of 5.00%.
The S&P 500 Index is a widely recognized unmanaged index including a representative sample of 500 leading companies in leading sectors of the U.S. economy. Although the S&P 500 Index focuses on the large-cap segment of the market, with approximately 80% coverage of U.S. equities, it is also considered a proxy for the total market. The S&P 500 Index includes dividends reinvested. One cannot invest directly in an index. The Consumer Price Index (CPI) represents the change in price of all goods and services purchased for consumption by urban households.
Top 10 Holdings* (%)
Gold bullion** (Precious Metal) | | | 12.6 | | |
Meta Platforms, Inc., Class A (Interactive Media & Services, United States) | | | 4.5 | | |
Oracle Corp. (Software, United States) | | | 3.9 | | |
Comcast Corp., Class A (Media, United States) | | | 3.3 | | |
HCA Healthcare, Inc. (Health Care Providers & Services, United States) | | | 3.1 | | |
Exxon Mobil Corp. (Oil, Gas & Consumable Fuels, United States) | | | 3.0 | | |
Philip Morris International, Inc. (Tobacco, United States) | | | 2.9 | | |
Elevance Health, Inc. (Health Care Providers & Services, United States) | | | 2.5 | | |
Colgate-Palmolive Co. (Household Products, United States) | | | 2.5 | | |
Schlumberger NV (Energy Equipment & Services, United States) | | | 2.3 | | |
Total | | | 40.6 | | |
* Holdings in cash, short-term commercial paper, long-term commercial paper and other short-term cash equivalents have been excluded.
** The Fund invests in gold and precious metals through investment in a wholly-owned subsidiary of the Fund organized under the laws of the Cayman Islands (the "Subsidiary"). Gold Bullion and commodities include the Fund's investment in the Subsidiary.
Percentages are based on total net assets.
First Eagle Funds | Annual Report | October 31, 2023
55
First Eagle U.S. Value Fund | Consolidated Schedule of Investments | October 31, 2023
Investments | | Shares | | Value ($) | |
Common Stocks — 75.1% | |
Air Freight & Logistics — 3.0% | |
CH Robinson Worldwide, Inc. | | | 294,701 | | | | 24,115,383 | | |
Expeditors International of Washington, Inc. | | | 94,942 | | | | 10,372,413 | | |
| | | | 34,487,796 | | |
Banks — 0.9% | |
US Bancorp | | | 330,658 | | | | 10,541,377 | | |
Capital Markets — 2.9% | |
Bank of New York Mellon Corp. (The) | | | 589,455 | | | | 25,051,837 | | |
Charles Schwab Corp. (The) | | | 143,493 | | | | 7,467,376 | | |
| | | | 32,519,213 | | |
Chemicals — 1.4% | |
Nutrien Ltd. (Canada) | | | 158,929 | | | | 8,534,487 | | |
PPG Industries, Inc. | | | 37,210 | | | | 4,568,272 | | |
RPM International, Inc. | | | 30,241 | | | | 2,760,096 | | |
| | | | 15,862,855 | | |
Consumer Finance — 1.0% | |
American Express Co. | | | 78,997 | | | | 11,535,932 | | |
Consumer Staples Distribution & Retail — 0.8% | |
Walmart, Inc. | | | 58,370 | | | | 9,538,242 | | |
Electronic Equipment, Instruments & Components — 1.3% | |
IPG Photonics Corp.* | | | 172,551 | | | | 14,822,131 | | |
Energy Equipment & Services — 4.3% | |
Noble Corp. plc | | | 67,617 | | | | 3,157,038 | | |
NOV, Inc. | | | 999,361 | | | | 19,947,245 | | |
Schlumberger NV | | | 471,530 | | | | 26,245,360 | | |
| | | | 49,349,643 | | |
Entertainment — 0.8% | |
Walt Disney Co. (The)* | | | 109,127 | | | | 8,903,672 | | |
Financial Services — 1.7% | |
Berkshire Hathaway, Inc., Class A* | | | 37 | | | | 19,159,525 | | |
Food Products — 0.6% | |
Kraft Heinz Co. (The) | | | 206,681 | | | | 6,502,184 | | |
Gas Utilities — 0.4% | |
UGI Corp. | | | 194,116 | | | | 4,037,613 | | |
First Eagle Funds | Annual Report | October 31, 2023
56
First Eagle U.S. Value Fund | Consolidated Schedule of Investments | October 31, 2023
Investments | | Shares | | Value ($) | |
Health Care Equipment & Supplies — 3.4% | |
Becton Dickinson & Co. | | | 44,564 | | | | 11,264,888 | | |
Dentsply Sirona, Inc. | | | 350,379 | | | | 10,655,025 | | |
Medtronic plc | | | 233,051 | | | | 16,444,079 | | |
| | | | 38,363,992 | | |
Health Care Providers & Services — 7.5% | |
Elevance Health, Inc. | | | 63,028 | | | | 28,368,273 | | |
HCA Healthcare, Inc. | | | 157,427 | | | | 35,600,542 | | |
Universal Health Services, Inc., Class B | | | 170,425 | | | | 21,454,803 | | |
| | | | 85,423,618 | | |
Household Products — 2.5% | |
Colgate-Palmolive Co. | | | 376,279 | | | | 28,266,078 | | |
Insurance — 3.7% | |
Brown & Brown, Inc. | | | 167,967 | | | | 11,660,269 | | |
Fidelity National Financial, Inc. | | | 158,855 | | | | 6,209,642 | | |
Willis Towers Watson plc | | | 104,185 | | | | 24,576,200 | | |
| | | | 42,446,111 | | |
Interactive Media & Services — 8.2% | |
Alphabet, Inc., Class A* | | | 145,960 | | | | 18,110,717 | | |
Alphabet, Inc., Class C* | | | 188,322 | | | | 23,596,746 | | |
Meta Platforms, Inc., Class A* | | | 169,755 | | | | 51,142,089 | | |
| | | | 92,849,552 | | |
Machinery — 3.3% | |
Cummins, Inc. | | | 73,903 | | | | 15,985,219 | | |
Deere & Co. | | | 20,543 | | | | 7,505,590 | | |
Flowserve Corp. | | | 378,708 | | | | 13,906,158 | | |
| | | | 37,396,967 | | |
Media — 3.3% | |
Comcast Corp., Class A | | | 920,308 | | | | 37,999,517 | | |
Metals & Mining — 2.8% | |
Agnico Eagle Mines Ltd. (Canada) | | | 82,024 | | | | 3,847,009 | | |
Barrick Gold Corp. (Canada) | | | 522,110 | | | | 8,343,318 | | |
Franco-Nevada Corp. (Canada) | | | 21,527 | | | | 2,618,788 | | |
Newcrest Mining Ltd. (Australia) (a) | | | 236,346 | | | | 3,622,814 | | |
First Eagle Funds | Annual Report | October 31, 2023
57
First Eagle U.S. Value Fund | Consolidated Schedule of Investments | October 31, 2023
Investments | | Shares | | Value ($) | |
Metals & Mining — 2.8% (continued) | |
Newmont Corp. | | | 252,516 | | | | 9,461,775 | | |
Royal Gold, Inc. | | | 38,764 | | | | 4,044,248 | | |
| | | | 31,937,952 | | |
Office REITs — 0.8% | |
Boston Properties, Inc., REIT | | | 102,688 | | | | 5,500,996 | | |
Douglas Emmett, Inc., REIT | | | 359,380 | | | | 4,028,650 | | |
| | | | 9,529,646 | | |
Oil, Gas & Consumable Fuels — 3.4% | |
Exxon Mobil Corp. | | | 317,531 | | | | 33,610,656 | | |
ONEOK, Inc. | | | 80,792 | | | | 5,267,639 | | |
| | | | 38,878,295 | | |
Residential REITs — 1.4% | |
Equity Residential, REIT | | | 278,138 | | | | 15,389,376 | | |
Semiconductors & Semiconductor Equipment — 3.5% | |
Analog Devices, Inc. | | | 132,445 | | | | 20,837,572 | | |
Texas Instruments, Inc. | | | 137,787 | | | | 19,567,132 | | |
| | | | 40,404,704 | | |
Software — 6.9% | |
Microsoft Corp. | | | 64,625 | | | | 21,850,359 | | |
Oracle Corp. | | | 425,031 | | | | 43,948,205 | | |
Salesforce, Inc.* | | | 61,730 | | | | 12,397,236 | | |
| | | | 78,195,800 | | |
Specialized REITs — 1.4% | |
Extra Space Storage, Inc., REIT | | | 41,479 | | | | 4,296,809 | | |
Weyerhaeuser Co., REIT | | | 401,701 | | | | 11,524,802 | | |
| | | | 15,821,611 | | |
Specialty Retail — 1.0% | |
Ross Stores, Inc. | | | 100,220 | | | | 11,622,513 | | |
Tobacco — 2.9% | |
Philip Morris International, Inc. | | | 372,296 | | | | 33,193,911 | | |
Total Common Stocks
(Cost $532,198,898) | | | 854,979,826 | | |
First Eagle Funds | Annual Report | October 31, 2023
58
First Eagle U.S. Value Fund | Consolidated Schedule of Investments | October 31, 2023
Investments | | Ounces | | Value ($) | |
Commodities — 12.6% | |
Gold bullion*
(Cost $78,780,493) | | | 72,529 | | | | 143,979,658 | | |
| | | Shares | | | |
Master Limited Partnerships — 1.4% | |
Oil, Gas & Consumable Fuels — 1.4% | |
Enterprise Products Partners LP
(Cost $12,353,309) | | | 623,041 | | | | 16,223,988 | | |
| | | Principal Amount ($) | | | |
Convertible Preferred Stocks — 0.4% | |
Banks — 0.4% | |
Bank of America Corp.
Series L, 7.25%, (b) (Cost $5,693,463) | | | 4,250 | | | | 4,476,100 | | |
Corporate Bonds — 0.4% | |
Financial Services — 0.3% | |
Mexico Remittances Funding Fiduciary Estate
Management Sarl
4.88%, 1/15/2028 (c) | | | 3,512,200 | | | | 3,104,552 | | |
Food Products — 0.1% | |
Post Holdings, Inc.
5.75%, 3/1/2027 (c) | | | 666,000 | | | | 634,902 | | |
Health Care Equipment & Supplies — 0.0% (d) | |
Bausch & Lomb, Inc.
7.13%, 8/1/2028‡ | | | 600,000 | | | | 543,750 | | |
Total Corporate Bonds
(Cost $4,250,257) | | | 4,283,204 | | |
Short-Term Investments — 10.3% | |
Commercial Paper — 7.4% | |
AES Corp. (The)
6.00%, 11/1/2023 (e) | | | 1,298,000 | | | | 1,297,782 | | |
Credit Agricole Corporate and Investment Bank
5.27%, 11/1/2023 (e) | | | 626,000 | | | | 625,907 | | |
Entergy Corp.
5.40%, 11/1/2023 (c)(e) | | | 816,000 | | | | 815,878 | | |
General Motors Financial Co., Inc.
5.45%, 11/1/2023 (e) | | | 4,006,000 | | | | 4,005,391 | | |
First Eagle Funds | Annual Report | October 31, 2023
59
First Eagle U.S. Value Fund | Consolidated Schedule of Investments | October 31, 2023
Investments | | Principal Amount ($) | | Value ($) | |
Commercial Paper — 7.4% (continued) | |
Global Payments, Inc.
5.96%, 11/1/2023 (e) | | | 1,383,000 | | | | 1,382,770 | | |
Johnson & Johnson
5.35%, 11/7/2023 (c)(e) | | | 10,000,000 | | | | 9,989,714 | | |
5.38%, 11/21/2023 (c)(e) | | | 10,000,000 | | | | 9,969,095 | | |
Microsoft Corp.
5.40%, 12/15/2023 (c)(e) | | | 10,000,000 | | | | 9,933,312 | | |
Oracle Corp.
5.76%, 1/25/2024 (e) | | | 10,000,000 | | | | 9,864,200 | | |
PepsiCo, Inc.
5.25%, 11/13/2023 (c)(e) | | | 8,500,000 | | | | 8,483,855 | | |
United Parcel Service, Inc.
5.19%, 12/12/2023 (e) | | | 10,000,000 | | | | 9,937,770 | | |
Walt Disney Co. (The)
5.50%, 1/3/2024 (c)(e) | | | 10,000,000 | | | | 9,903,692 | | |
5.61%, 1/4/2024 (c)(e) | | | 8,150,000 | | | | 8,070,292 | | |
Total Commercial Paper
(Cost $84,293,745) | | | 84,279,658 | | |
| | | Shares | | | |
Investment Companies — 0.0% (d) | |
JP Morgan U.S. Government Money Market Fund,
Capital Shares 5.37% (f) (Cost $26,191) | | | 26,191 | | | | 26,191 | | |
| | | Principal Amount ($) | | | |
U.S. Treasury Obligations — 2.9% | |
U.S. Treasury Bills
5.33%, 11/16/2023 (e) | | | 5,000,000 | | | | 4,989,023 | | |
5.34%, 12/14/2023 (e) | | | 5,000,000 | | | | 4,968,392 | | |
5.33%, 1/4/2024 (e) | | | 5,000,000 | | | | 4,952,889 | | |
First Eagle Funds | Annual Report | October 31, 2023
60
First Eagle U.S. Value Fund | Consolidated Schedule of Investments | October 31, 2023
Investments | | Principal Amount ($) | | Value ($) | |
U.S. Treasury Obligations — 2.9% (continued) | |
5.42%, 1/23/2024 (e) | | | 9,000,000 | | | | 8,889,688 | | |
5.43%, 3/21/2024 (e) | | | 9,100,000 | | | | 8,910,253 | | |
Total U.S. Treasury Obligations
(Cost $32,712,306) | | | 32,710,245 | | |
Total Short-Term Investments
(Cost $117,032,242) | | | 117,016,094 | | |
Total Investments — 100.2%
(Cost $750,308,662) | | | 1,140,958,870 | | |
Liabilities in Excess of Other Assets — (0.2%) | | | (1,824,590 | ) | |
Net Assets — 100.0% | | | 1,139,134,280 | | |
* Non-income producing security.
‡ Value determined using significant unobservable inputs.
(a) Security fair valued as of October 31, 2023 in accordance with procedures approved by the Board of Trustees. Total value of all such securities at October 31, 2023 amounted to $3,622,814, which represents approximately 0.32% of net assets of the Fund.
(b) Perpetual security. The rate reflected was the rate in effect on October 31, 2023. The maturity date reflects the next call date.
(c) Securities exempt from registration under Rule 144A or section 4(a)2 of the Securities Act of 1933. Total value of all such securities at October 31, 2023 amounted to $60,905,292, which represents approximately 5.35% of net assets of the Fund.
(d) Represents less than 0.05% of net assets.
(e) The rate shown was the current yield as of October 31, 2023.
(f) Represents 7-day effective yield as of October 31, 2023.
As of October 31, 2023, the gross unrealized appreciation (depreciation) of investments based on the aggregate cost of investment securities and derivative instruments, if applicable, for federal income tax purposes was as follows:
Aggregate gross unrealized appreciation | | $ | 427,266,656 | | |
Aggregate gross unrealized depreciation | | | (32,921,830 | ) | |
Net unrealized appreciation | | $ | 394,344,826 | | |
Federal income tax cost | | $ | 746,614,044 | | |
Abbreviations
REIT — Real Estate Investment Trust
See Notes to Financial Statements.
First Eagle Funds | Annual Report | October 31, 2023
61
Data as of October 31, 2023 (unaudited)
Investment Objective
The First Eagle Gold Fund is a non-diversified fund that seeks to provide investors the opportunity to participate in the investment characteristics of gold (and to a limited extent other precious metals) for a portion of their overall investment portfolio. In seeking to achieve its objective, the Fund invests at least 80% of its net assets (plus any borrowings for investment purposes) in gold, and/or securities directly related to gold or issuers principally engaged in the gold industry.
Average Annual Returns (%) | | | | | | One Year | | Five Years | | Ten Years | |
First Eagle Gold Fund | | Class A | | without sales load | | | 15.84 | | | | 11.76 | | | | 2.97 | | |
| | | | with sales load | | | 10.07 | | | | 10.62 | | | | 2.44 | | |
FTSE Gold Mines Index | | | | | | | 16.27 | | | | 6.77 | | | | 0.79 | | |
MSCI World Index | | | | | | | 10.48 | | | | 8.27 | | | | 7.53 | | |
Consumer Price Index | | | | | | | 3.23 | | | | 4.01 | | | | 2.79 | | |
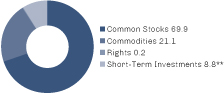
Sectors* (%)
Materials | | | 70.1 | | |
Commodities | | | 21.1 | | |
Short-Term Investments | | | 8.8 | | |
Countries*~ (%)
Canada | | | 34.0 | | |
United States | | | 33.2 | | |
Brazil | | | 12.5 | | |
Australia | | | 8.3 | | |
Mexico | | | 2.1 | | |
United Kingdom | | | 1.1 | | |
Short-Term Investments | | | 8.8 | | |
* Asset Allocation, Sectors and Countries percentages are based on total investments in the portfolio.
** Includes short-term commercial paper (8.1% of total investments) that settles in 90 days or less, long-term commercial paper (0.7% of total investments) that settles in 91 days or greater and other short-term investments (0.0% of total investments), such as U.S. treasury bills or money market funds.
~ Country allocations reflect country of risk (not currency of issue). Bonds of non-U.S. issuers may be U.S. dollar denominated.
The Fund's portfolio composition is subject to change at any time.
First Eagle Funds | Annual Report | October 31, 2023
62
First Eagle Gold Fund | Fund Overview
Growth of a $10,000 Initial Investment
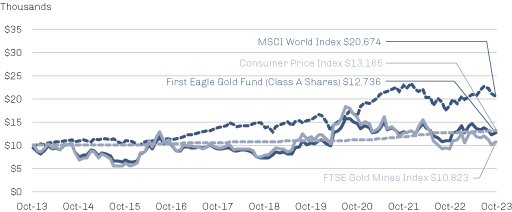
Performance data quoted herein represents past performance and should not be considered indicative of future results. Performance data quoted herein does not reflect the deduction of taxes that a shareholder would pay on Fund distributions or the sale of Fund shares. The average annual returns shown above are historical and reflect changes in share price, reinvested dividends and are net of expenses.
The average annual returns for Class A shares give effect to the deduction of the maximum sales charge of 5.00%.
The MSCI World Index is a widely followed, unmanaged group of stocks from 23 developed market countries. The index provides total returns in U.S. dollars with dividends reinvested. The FTSE Gold Mines Index is designed to reflect the performance of the worldwide market in the shares of companies whose principal activity is the mining of gold. The FTSE Gold Mines Index encompasses all gold mining companies that have a sustainable, attributable gold production of at least 300,000 ounces a year and that derive 51% or more of their revenue from mined gold. The index is unmanaged and includes dividends reinvested. One cannot invest directly in an index. The Consumer Price Index (CPI) represents the change in price of all goods and services purchased for consumption by urban households.
Top 10 Holdings* (%)
Gold bullion** (Precious Metal) | | | 16.1 | | |
Wheaton Precious Metals Corp. (Metals & Mining, Brazil) | | | 12.4 | | |
Barrick Gold Corp. (Metals & Mining, Canada) | | | 8.7 | | |
Newmont Corp. (Metals & Mining, United States) | | | 7.4 | | |
Silver bullion** (Precious Metal) | | | 4.9 | | |
Alamos Gold, Inc., Class A (Metals & Mining, Canada) | | | 4.8 | | |
Agnico Eagle Mines Ltd. (Metals & Mining, Canada) | | | 4.6 | | |
Royal Gold, Inc. (Metals & Mining, United States) | | | 4.5 | | |
Newcrest Mining Ltd. (Metals & Mining, Australia) | | | 4.4 | | |
Franco-Nevada Corp. (Metals & Mining, Canada) | | | 4.3 | | |
Total | | | 72.1 | | |
* Holdings in cash, short-term commercial paper, long-term commercial paper and other short-term cash equivalents have been excluded.
** The Fund invests in gold and precious metals through investment in a wholly-owned subsidiary of the Fund organized under the laws of the Cayman Islands (the "Subsidiary"). Gold Bullion and commodities include the Fund's investment in the Subsidiary.
Percentages are based on total net assets.
First Eagle Funds | Annual Report | October 31, 2023
63
First Eagle Gold Fund | Consolidated Schedule of Investments | October 31, 2023
Investments | | Shares | | Value ($) | |
Common Stocks — 69.4% | |
Australia — 8.2% | |
Newcrest Mining Ltd. (a) | | | 6,262,689 | | | | 95,997,212 | | |
Northern Star Resources Ltd. | | | 11,077,071 | | | | 81,115,003 | | |
| | | | 177,112,215 | | |
Brazil — 12.4% | |
Wheaton Precious Metals Corp. | | | 6,340,844 | | | | 267,900,659 | | |
Canada — 33.6% | |
Agnico Eagle Mines Ltd. | | | 2,134,524 | | | | 100,111,369 | | |
Alamos Gold, Inc., Class A | | | 8,311,143 | | | | 102,904,147 | | |
B2Gold Corp. | | | 3,110,042 | | | | 9,957,517 | | |
Barrick Gold Corp. | | | 11,780,585 | | | | 188,253,748 | | |
Dundee Precious Metals, Inc. (b) | | | 14,240,008 | | | | 93,341,751 | | |
Franco-Nevada Corp. | | | 768,800 | | | | 93,525,552 | | |
MAG Silver Corp.* (b) | | | 5,431,222 | | | | 54,322,011 | | |
Novagold Resources, Inc.* (b) | | | 17,740,710 | | | | 62,447,299 | | |
Orla Mining Ltd.* | | | 6,508,741 | | | | 19,947,467 | | |
| | | | 724,810,861 | | |
Mexico — 2.1% | |
Fresnillo plc | | | 4,277,558 | | | | 28,790,510 | | |
Industrias Penoles SAB de CV* | | | 1,403,600 | | | | 15,669,342 | | |
| | | | 44,459,852 | | |
United Kingdom — 1.1% | |
Anglogold Ashanti plc | | | 1,377,003 | | | | 24,565,733 | | |
United States — 12.0% | |
Newmont Corp. | | | 4,288,765 | | | | 160,700,024 | | |
Royal Gold, Inc. | | | 930,778 | | | | 97,108,069 | | |
| | | | 257,808,093 | | |
Total Common Stocks
(Cost $1,146,994,410) | | | 1,496,657,413 | | |
First Eagle Funds | Annual Report | October 31, 2023
64
First Eagle Gold Fund | Consolidated Schedule of Investments | October 31, 2023
Investments | | Ounces | | Value ($) | |
Commodities — 20.9% | |
Gold bullion* | | | 174,689 | | | | 346,781,982 | | |
Silver bullion* | | | 4,596,472 | | | | 105,169,108 | | |
Total Commodities
(Cost $265,746,632) | | | 451,951,090 | | |
| | | Number of Rights | | | |
Rights — 0.2% | |
Canada — 0.2% | |
Pan American Silver Corp., CVR, expiring 2/22/2029*
(Cost $45,973,716) | | | 6,835,667 | | | | 3,455,430 | | |
| | | Principal Amount ($) | | | |
Short-Term Investments — 8.8% | |
Commercial Paper — 8.8% | |
AES Corp. (The)
6.00%, 11/1/2023 (c) | | | 21,099,000 | | | | 21,095,455 | | |
Alimentation Couche-Tard, Inc.
5.81%, 1/10/2024 (c)(d) | | | 14,815,000 | | | | 14,647,812 | | |
Credit Agricole Corporate and Investment Bank
5.27%, 11/1/2023 (c) | | | 10,176,000 | | | | 10,174,494 | | |
Entergy Corp.
5.40%, 11/1/2023 (c)(d) | | | 13,262,000 | | | | 13,260,011 | | |
General Motors Financial Co., Inc.
5.45%, 11/1/2023 (c) | | | 65,105,000 | | | | 65,095,104 | | |
Global Payments, Inc.
5.96%, 11/1/2023 (c) | | | 22,473,000 | | | | 22,469,269 | | |
Henkel Corp.
5.42%, 11/14/2023 (c)(d) | | | 15,000,000 | | | | 14,968,939 | | |
Oracle Corp.
5.62%, 12/20/2023 (c)(d) | | | 10,185,000 | | | | 10,105,548 | | |
Vulcan Materials Co.
5.62%, 11/29/2023 (c) | | | 17,030,000 | | | | 16,953,802 | | |
Total Commercial Paper
(Cost $188,799,807) | | | 188,770,434 | | |
First Eagle Funds | Annual Report | October 31, 2023
65
First Eagle Gold Fund | Consolidated Schedule of Investments | October 31, 2023
Investments | | Shares | | Value ($) | |
Investment Companies — 0.0% (e) | |
JP Morgan U.S. Government Money Market Fund,
Capital Shares 5.37% (f) (Cost $138,274) | | | 138,274 | | | | 138,274 | | |
Total Short-Term Investments
(Cost $188,938,081) | | | 188,908,708 | | |
Total Investments — 99.3%
(Cost $1,647,652,839) | | | 2,140,972,641 | | |
Other Assets Less Liabilities — 0.7% | | | 16,605,443 | | |
Net Assets — 100.0% | | | 2,157,578,084 | | |
* Non-income producing security.
(a) Security fair valued as of October 31, 2023 in accordance with procedures approved by the Board of Trustees. Total value of all such securities at October 31, 2023 amounted to $95,997,212, which represents approximately 4.45% of net assets of the Fund.
(b) Affiliated company as defined under the Investment Company Act of 1940.
(c) The rate shown was the current yield as of October 31, 2023.
(d) Securities exempt from registration under Rule 144A or section 4(a)2 of the Securities Act of 1933. Total value of all such securities at October 31, 2023 amounted to $52,982,310, which represents approximately 2.46% of net assets of the Fund.
(e) Represents less than 0.05% of net assets.
(f) Represents 7-day effective yield as of October 31, 2023.
Abbreviations
CVR — Contingent Value Rights
As of October 31, 2023, the gross unrealized appreciation (depreciation) of investments based on the aggregate cost of investment securities and derivative instruments, if applicable, for federal income tax purposes was as follows:
Aggregate gross unrealized appreciation | | $ | 573,351,377 | | |
Aggregate gross unrealized depreciation | | | (158,621,291 | ) | |
Net unrealized appreciation | | $ | 414,730,086 | | |
Federal income tax cost | | $ | 1,726,242,555 | | |
Affiliated Securities
Security Description | | Shares at
October 31, 2023 | | Market Value
October 31, 2022 | | Purchases at
Cost | | Proceeds from
Sales | |
Common Stocks — 9.7% | |
Canada — 9.7% | |
Dundee Precious Metals,
Inc. | | | 14,240,008 | | | $ | 62,596,607 | | | $ | 2,015,396 | | | $ | — | | |
MAG Silver Corp.* | | | 5,431,222 | | | | 65,062,216 | | | | 6,279,404 | | | | — | | |
Novagold Resources, Inc.* | | | 17,740,710 | | | | 83,460,385 | | | | — | | | | (1,813,442 | ) | |
Total Common Stocks | | | | $ | 211,119,208 | | | $ | 8,294,800 | | | $ | (1,813,442 | ) | |
Total | | | | $ | 211,119,208 | | | $ | 8,294,800 | | | $ | (1,813,442 | ) | |
First Eagle Funds | Annual Report | October 31, 2023
66
First Eagle Gold Fund | Consolidated Schedule of Investments | October 31, 2023
Affiliated Securities (continued)
Security Description | | Net Realized
Gains
(Loss) | | Change in
Unrealized
Appreciation/
Depreciation | | Market Value
October 31,
2023 | | Dividend
Income | |
Common Stocks — 9.7% | |
Canada — 9.7% | |
Dundee Precious Metals,
Inc. | | $ | — | | | $ | 28,729,748 | | | $ | 93,341,751 | | | $ | 1,895,288 | | |
MAG Silver Corp.* | | | — | | | | (17,019,609 | ) | | | 54,322,011 | | | | — | | |
Novagold Resources, Inc.* | | | (1,319,109 | ) | | | (17,880,535 | ) | | | 62,447,299 | | | | — | | |
Total Common Stocks | | $ | (1,319,109 | ) | | $ | (6,170,396 | ) | | $ | 210,111,061 | | | $ | 1,895,288 | | |
Total | | $ | (1,319,109 | ) | | $ | (6,170,396 | ) | | $ | 210,111,061 | | | $ | 1,895,288 | | |
* Non-income producing security.
See Notes to Financial Statements.
First Eagle Funds | Annual Report | October 31, 2023
67
First Eagle Global Income Builder Fund
Data as of October 31, 2023 (unaudited)
Investment Objective
The First Eagle Global Income Builder Fund seeks current income generation and long-term growth of capital. Fundamental research drives the identification of income-producing investment opportunities across all market environments.
Average Annual Returns^ (%) | | | | | | One Year | | Five Years | | Ten Years | |
First Eagle Global Income Builder Fund | | Class A | | without sales load | | | 6.35 | | | | 4.41 | | | | 4.01 | | |
| | | | with sales load | | | 1.05 | | | | 3.34 | | | | 3.48 | | |
Composite Index | | | | | | | 6.44 | | | | 5.21 | | | | 5.07 | | |
MSCI World Index | | | | | | | 10.48 | | | | 8.27 | | | | 7.53 | | |
Bloomberg U.S. Aggregate
Bond Index | | | | | | | 0.36 | | | | -0.06 | | | | 0.88 | | |
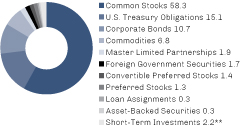
Sectors* (%)
Consumer Staples | | | 22.7 | | |
U.S. Treasury Obligations | | | 15.1 | | |
Financials | | | 11.3 | | |
Energy | | | 8.2 | | |
Industrials | | | 7.7 | | |
Commodities | | | 6.8 | | |
Health Care | | | 6.3 | | |
Real Estate | | | 4.5 | | |
Materials | | | 4.2 | | |
Consumer Discretionary | | | 4.1 | | |
Information Technology | | | 3.1 | | |
Foreign Government Securities | | | 1.7 | | |
Communication Services | | | 1.5 | | |
Utilities | | | 0.4 | | |
Asset-Backed Securities | | | 0.2 | | |
Short-Term Investments | | | 2.2 | | |
Countries*~ (%)
United States | | | 59.5 | | |
United Kingdom | | | 7.3 | | |
Canada | | | 4.3 | | |
Mexico | | | 3.9 | | |
Hong Kong | | | 3.3 | | |
Japan | | | 3.2 | | |
South Korea | | | 2.3 | | |
Brazil | | | 2.3 | | |
Switzerland | | | 1.9 | | |
Germany | | | 1.9 | | |
France | | | 1.7 | | |
Chile | | | 1.2 | | |
Norway | | | 0.9 | | |
Singapore | | | 0.9 | | |
Thailand | | | 0.8 | | |
Netherlands | | | 0.8 | | |
Sweden | | | 0.5 | | |
Italy | | | 0.3 | | |
Taiwan | | | 0.3 | | |
Australia | | | 0.2 | | |
Colombia | | | 0.2 | | |
Saudi Arabia | | | 0.1 | | |
Poland | | | 0.0 | *** | |
Short-Term Investments | | | 2.2 | | |
^ Performance figures reflect certain fee waivers and/or expense limitations, without which returns may have been lower.
* Asset Allocation, Sectors and Countries percentages are based on total investments in the portfolio.
** Includes short-term commercial paper (2.2% of total investments) that settles in 90 days or less, long-term commercial paper (0.0% of total investments) that settles in 91 days or greater and other short-term investments (0.0% of total investments), such as U.S. treasury bills or money market funds.
*** Less than 0.05%.
~ Country allocations reflect country of risk (not currency of issue). Bonds of non-U.S. issuers may be U.S. dollar denominated.
The Fund's portfolio composition is subject to change at any time.
First Eagle Funds | Annual Report | October 31, 2023
68
First Eagle Global Income Builder Fund | Fund Overview
Growth of a $10,000 Initial Investment

Performance data quoted herein represents past performance and should not be considered indicative of future results. Performance data quoted herein does not reflect the deduction of taxes that a shareholder would pay on Fund distributions or the sale of Fund shares. The returns shown above are historical and reflect changes in share price, reinvested dividends and are net of expenses.
The average annual returns for Class A shares give effect to the deduction of the maximum sales charge of 5.00%.
The Composite Index consists of 60% of the MSCI World Index and 40% of the Bloomberg U.S. Aggregate Bond Index. The MSCI World Index is a widely followed, unmanaged group of stocks from 23 developed market countries. The MSCI World Index provides total returns in U.S. dollars with net dividends reinvested. The Bloomberg U.S. Aggregate Bond Index is an unmanaged broad-based benchmark that measures the investment grade, U.S. dollar-denominated, fixed-rate taxable bond market, including Treasuries, government-related and corporate securities, MBS (agency fixed-rate and hybrid ARM passthroughs), ABS and CMBS. One cannot invest directly in an index.
Top 10 Holdings* (%)
Gold bullion (Precious Metal) | | | 6.8 | | |
Exxon Mobil Corp. (Oil, Gas & Consumable Fuels, United States) | | | 2.7 | | |
Unilever plc (Personal Care Products, United Kingdom) | | | 2.5 | | |
Nestle SA (Registered) (Food Products, United States) | | | 2.2 | | |
British American Tobacco plc (Tobacco, United Kingdom) | | | 2.1 | | |
Enterprise Products Partners LP (Oil, Gas & Consumable Fuels, United States) | | | 1.9 | | |
Philip Morris International, Inc. (Tobacco, United States) | | | 1.7 | | |
Colgate-Palmolive Co. (Household Products, United States) | | | 1.7 | | |
Jardine Matheson Holdings Ltd. (Industrial Conglomerates, Hong Kong) | | | 1.7 | | |
KT&G Corp. (Tobacco, South Korea) | | | 1.6 | | |
Total | | | 24.9 | | |
* Holdings in cash, short-term commercial paper, long-term commercial paper and other short-term cash equivalents have been excluded.
Percentages are based on total net assets.
First Eagle Funds | Annual Report | October 31, 2023
69
First Eagle Global Income Builder Fund | Schedule of Investments | October 31, 2023
Investments | | Shares | | Value ($) | |
Common Stocks — 58.3% | |
Brazil — 2.0% | |
Ambev SA, ADR | | | 6,045,675 | | | | 15,295,558 | | |
Itausa SA* | | | 52,397 | | | | 89,169 | | |
Itausa SA (Preference) | | | 3,444,779 | | | | 5,903,285 | | |
Wheaton Precious Metals Corp. | | | 281,516 | | | | 11,894,051 | | |
| | | | 33,182,063 | | |
Canada — 3.1% | |
Agnico Eagle Mines Ltd. | | | 16,806 | | | | 788,219 | | |
Barrick Gold Corp. | | | 90,496 | | | | 1,446,126 | | |
Franco-Nevada Corp. | | | 42,649 | | | | 5,188,308 | | |
Franco-Nevada Corp. | | | 32,962 | | | | 4,006,531 | | |
Imperial Oil Ltd. | | | 238,922 | | | | 13,616,013 | | |
Nutrien Ltd. (a) | | | 87,298 | | | | 4,687,902 | | |
Power Corp. of Canada | | | 883,284 | | | | 21,280,345 | | |
| | | | 51,013,444 | | |
Chile — 1.2% | |
Cia Cervecerias Unidas SA, ADR | | | 1,232,370 | | | | 13,864,163 | | |
Quinenco SA | | | 2,083,758 | | | | 5,639,883 | | |
| | | | 19,504,046 | | |
France — 1.5% | |
Danone SA | | | 291,291 | | | | 17,329,034 | | |
Sodexo SA | | | 59,517 | | | | 6,298,601 | | |
Wendel SE | | | 19,995 | | | | 1,497,775 | | |
| | | | 25,125,410 | | |
Germany — 1.6% | |
Brenntag SE | | | 103,547 | | | | 7,699,923 | | |
FUCHS SE (Preference) | | | 319,659 | | | | 12,982,963 | | |
Henkel AG & Co. KGaA (Preference) | | | 81,279 | | | | 5,863,067 | | |
| | | | 26,545,953 | | |
Hong Kong — 3.3% | |
CK Asset Holdings Ltd. | | | 2,483,000 | | | | 12,410,840 | | |
Great Eagle Holdings Ltd. | | | 1,662,774 | | | | 2,709,794 | | |
Hongkong Land Holdings Ltd. | | | 2,370,400 | | | | 7,518,249 | | |
Hysan Development Co. Ltd. | | | 1,277,083 | | | | 2,350,799 | | |
First Eagle Funds | Annual Report | October 31, 2023
70
First Eagle Global Income Builder Fund | Schedule of Investments | October 31, 2023
Investments | | Shares | | Value ($) | |
Hong Kong — 3.3% (continued) | |
Jardine Matheson Holdings Ltd. | | | 675,500 | | | | 27,372,030 | | |
Mandarin Oriental International Ltd. | | | 1,047,200 | | | | 1,570,800 | | |
| | | | 53,932,512 | | |
Japan — 3.2% | |
FANUC Corp. | | | 294,600 | | | | 7,310,917 | | |
MS&AD Insurance Group Holdings, Inc. | | | 242,700 | | | | 8,892,658 | | |
Nagaileben Co. Ltd. | | | 22,700 | | | | 313,257 | | |
Nohmi Bosai Ltd. | | | 70,300 | | | | 846,482 | | |
Secom Co. Ltd. | | | 203,100 | | | | 14,106,279 | | |
Shimano, Inc. | | | 87,400 | | | | 12,577,394 | | |
Sompo Holdings, Inc. | | | 104,800 | | | | 4,539,933 | | |
USS Co. Ltd. | | | 214,900 | | | | 3,756,215 | | |
| | | | 52,343,135 | | |
Mexico — 2.8% | |
Bolsa Mexicana de Valores SAB de CV | | | 403,523 | | | | 629,155 | | |
Coca-Cola Femsa SAB de CV, ADR | | | 203,819 | | | | 15,494,320 | | |
Fomento Economico Mexicano SAB de CV, ADR | | | 167,196 | | | | 18,961,698 | | |
GMexico Transportes SAB de CV (b) | | | 1,116,309 | | | | 2,302,089 | | |
Grupo Mexico SAB de CV, Series B | | | 2,026,562 | | | | 8,265,190 | | |
| | | | 45,652,452 | | |
Netherlands — 0.8% | |
HAL Trust | | | 40,521 | | | | 4,564,418 | | |
Heineken Holding NV | | | 113,543 | | | | 8,638,747 | | |
| | | | 13,203,165 | | |
Norway — 0.9% | |
Orkla ASA | | | 2,142,238 | | | | 14,765,367 | | |
Singapore — 0.6% | |
United Overseas Bank Ltd. | | | 292,600 | | | | 5,771,447 | | |
UOL Group Ltd. | | | 764,200 | | | | 3,291,283 | | |
| | | | 9,062,730 | | |
South Korea — 2.1% | |
KT&G Corp. | | | 419,335 | | | | 26,453,029 | | |
Samsung Electronics Co. Ltd. (Preference) | | | 204,402 | | | | 8,160,694 | | |
| | | | 34,613,723 | | |
First Eagle Funds | Annual Report | October 31, 2023
71
First Eagle Global Income Builder Fund | Schedule of Investments | October 31, 2023
Investments | | Shares | | Value ($) | |
Sweden — 0.5% | |
Svenska Handelsbanken AB, Class A | | | 891,201 | | | | 7,598,109 | | |
Switzerland — 1.9% | |
Cie Financiere Richemont SA (Registered) | | | 151,851 | | | | 17,914,700 | | |
Schindler Holding AG | | | 61,668 | | | | 12,476,840 | | |
Schindler Holding AG (Registered) | | | 7,544 | | | | 1,470,635 | | |
| | | | 31,862,175 | | |
Taiwan — 0.3% | |
Taiwan Semiconductor Manufacturing Co. Ltd., ADR | | | 47,844 | | | | 4,129,416 | | |
Thailand — 0.8% | |
Bangkok Bank PCL, NVDR | | | 1,467,900 | | | | 6,432,489 | | |
Thai Beverage PCL | | | 17,954,100 | | | | 7,091,529 | | |
| | | | 13,524,018 | | |
United Kingdom — 7.1% | |
BAE Systems plc | | | 807,624 | | | | 10,859,621 | | |
Berkeley Group Holdings plc | | | 222,665 | | | | 10,945,468 | | |
British American Tobacco plc | | | 1,181,438 | | | | 35,292,445 | | |
Great Portland Estates plc, REIT | | | 327,228 | | | | 1,551,144 | | |
Lloyds Banking Group plc | | | 7,973,632 | | | | 3,880,767 | | |
Reckitt Benckiser Group plc | | | 193,995 | | | | 12,979,616 | | |
Unilever plc | | | 871,901 | | | | 41,244,704 | | |
| | | | 116,753,765 | | |
United States — 24.6% | |
Analog Devices, Inc. | | | 73,648 | | | | 11,587,040 | | |
Bank of New York Mellon Corp. (The) (a) | | | 336,334 | | | | 14,294,195 | | |
Becton Dickinson & Co. (a) | | | 63,027 | | | | 15,931,965 | | |
Boston Properties, Inc., REIT | | | 125,907 | | | | 6,744,838 | | |
CH Robinson Worldwide, Inc. | | | 107,646 | | | | 8,808,672 | | |
Colgate-Palmolive Co. (a) | | | 368,873 | | | | 27,709,740 | | |
Comcast Corp., Class A (a) | | | 541,473 | | | | 22,357,420 | | |
Douglas Emmett, Inc., REIT | | | 366,396 | | | | 4,107,299 | | |
Elevance Health, Inc. (a) | | | 17,617 | | | | 7,929,236 | | |
Equity Residential, REIT (a) | | | 340,956 | | | | 18,865,095 | | |
Exxon Mobil Corp. (a) | | | 412,370 | | | | 43,649,364 | | |
First Eagle Funds | Annual Report | October 31, 2023
72
First Eagle Global Income Builder Fund | Schedule of Investments | October 31, 2023
Investments | | Shares | | Value ($) | |
United States — 24.6% (continued) | |
Fidelity National Financial, Inc. | | | 84,603 | | | | 3,307,131 | | |
Fidelity National Information Services, Inc. | | | 51,600 | | | | 2,534,076 | | |
General Dynamics Corp. | | | 7,297 | | | | 1,760,839 | | |
Haleon plc | | | 4,109,584 | | | | 16,471,585 | | |
HCA Healthcare, Inc. (a) | | | 75,005 | | | | 16,961,631 | | |
IDACORP, Inc. | | | 52,533 | | | | 4,975,400 | | |
Kraft Heinz Co. (The) | | | 133,886 | | | | 4,212,054 | | |
Linde plc (a) | | | 6,853 | | | | 2,618,942 | | |
Medtronic plc | | | 224,887 | | | | 15,868,027 | | |
Nestle SA (Registered) | | | 331,974 | | | | 35,799,671 | | |
ONEOK, Inc. | | | 52,140 | | | | 3,399,528 | | |
Oracle Corp. | | | 29,638 | | | | 3,064,569 | | |
Philip Morris International, Inc. (a) | | | 318,886 | | | | 28,431,876 | | |
Royal Gold, Inc. | | | 90,423 | | | | 9,433,832 | | |
RPM International, Inc. (a) | | | 26,018 | | | | 2,374,663 | | |
Sanofi SA | | | 161,273 | | | | 14,644,592 | | |
Schlumberger NV (a) | | | 153,224 | | | | 8,528,448 | | |
Texas Instruments, Inc. | | | 121,579 | | | | 17,265,434 | | |
Truist Financial Corp. | | | 69,044 | | | | 1,958,088 | | |
UGI Corp. | | | 74,789 | | | | 1,555,611 | | |
Union Pacific Corp. | | | 6,500 | | | | 1,349,465 | | |
Universal Health Services, Inc., Class B | | | 19,258 | | | | 2,424,390 | | |
US Bancorp | | | 318,298 | | | | 10,147,340 | | |
Walmart, Inc. (a) | | | 56,972 | | | | 9,309,794 | | |
Weyerhaeuser Co., REIT (a) | | | 129,131 | | | | 3,704,768 | | |
| | | | 404,086,618 | | |
Total Common Stocks
(Cost $936,748,768) | | | 956,898,101 | | |
First Eagle Funds | Annual Report | October 31, 2023
73
First Eagle Global Income Builder Fund | Schedule of Investments | October 31, 2023
Investments | | Principal Amount ($) | | Value ($) | |
U.S. Treasury Obligations — 15.0% | |
U.S. Treasury Bonds
6.63%, 2/15/2027 | | | 7,350,000 | | | | 7,725,539 | | |
6.13%, 11/15/2027 | | | 21,467,400 | | | | 22,440,142 | | |
U.S. Treasury Inflation Linked Notes
0.63%, 1/15/2024 | | | 11,840,000 | | | | 15,439,573 | | |
0.13%, 7/15/2024 | | | 13,800,000 | | | | 17,431,078 | | |
0.25%, 1/15/2025 | | | 6,900,000 | | | | 8,611,299 | | |
0.38%, 7/15/2025 | | | 12,175,000 | | | | 15,098,355 | | |
0.13%, 4/15/2027 | | | 14,230,800 | | | | 14,173,418 | | |
1.25%, 4/15/2028 | | | 13,225,000 | | | | 12,796,806 | | |
U.S. Treasury Notes
2.63%, 12/31/2023 | | | 25,735,700 | | | | 25,615,020 | | |
2.50%, 1/31/2024 | | | 14,953,900 | | | | 14,845,835 | | |
1.75%, 6/30/2024 | | | 4,317,000 | | | | 4,211,604 | | |
3.00%, 7/31/2024 | | | 13,200,000 | | | | 12,959,203 | | |
1.75%, 12/31/2024 | | | 12,947,000 | | | | 12,420,522 | | |
1.75%, 3/15/2025 | | | 8,680,000 | | | | 8,277,533 | | |
2.75%, 6/30/2025 | | | 17,750,000 | | | | 17,070,508 | | |
0.38%, 12/31/2025 | | | 21,807,700 | | | | 19,760,672 | | |
1.75%, 12/31/2026 | | | 1,860,000 | | | | 1,690,638 | | |
4.63%, 9/30/2028 | | | 3,350,000 | | | | 3,319,641 | | |
3.38%, 5/15/2033 | | | 12,050,000 | | | | 10,654,836 | | |
3.88%, 8/15/2033 | | | 2,700,000 | | | | 2,485,266 | | |
| | | | 247,027,488 | | |
Total U.S. Treasury Obligations
(Cost 252,363,567) | | | 247,027,488 | | |
Corporate Bonds — 10.7% | |
Australia — 0.2% | |
Coronado Finance Pty. Ltd.
10.75%, 5/15/2026 (c) | | | 1,459,000 | | | | 1,507,975 | | |
Nufarm Australia Ltd.
5.00%, 1/27/2030 (c) | | | 2,595,000 | | | | 2,251,136 | | |
| | | | 3,759,111 | | |
First Eagle Funds | Annual Report | October 31, 2023
74
First Eagle Global Income Builder Fund | Schedule of Investments | October 31, 2023
Investments | | Principal Amount ($) | | Value ($) | |
Canada — 1.2% | |
Nutrien Ltd.
4.90%, 3/27/2028 | | | 866,000 | | | | 829,585 | | |
Open Text Corp.
3.88%, 2/15/2028 (c) | | | 1,106,000 | | | | 961,197 | | |
Open Text Holdings, Inc.
4.13%, 2/15/2030 (c) | | | 6,065,000 | | | | 5,025,453 | | |
TransCanada PipeLines Ltd.
(United States SOFR Compounded Index + 1.52%),
6.87%, 3/9/2026 (d) | | | 4,400,000 | | | | 4,412,009 | | |
Transcanada Trust
Series 16-A, (ICE LIBOR USD 3 Month + 4.64%),
5.88%, 8/15/2076 (d) | | | 9,142,000 | | | | 8,188,664 | | |
| | | | 19,416,908 | | |
Germany — 0.3% | |
IHO Verwaltungs GmbH
4.75%, (4.75% Cash or 5.50% PIK), 9/15/2026 (c)(e) | | | 3,879,000 | | | | 3,604,871 | | |
6.00%, (6.00% Cash or 6.75% PIK), 5/15/2027 (c)(e) | | | 1,336,632 | | | | 1,243,749 | | |
| | | | 4,848,620 | | |
Mexico — 0.7% | |
Mexico Remittances Funding Fiduciary
Estate Management Sarl
4.88%, 1/15/2028 (c) | | | 13,413,000 | | | | 11,856,203 | | |
Poland — 0.0% (f) | |
Canpack SA
3.13%, 11/1/2025 (c) | | | 420,000 | | | | 385,031 | | |
United Kingdom — 0.2% | |
BAT Capital Corp.
3.22%, 9/6/2026 | | | 2,425,000 | | | | 2,245,847 | | |
United States — 8.1% | |
ACCO Brands Corp.
4.25%, 3/15/2029 (c) | | | 5,958,000 | | | | 4,944,192 | | |
American Airlines, Inc.
5.50%, 4/20/2026 (c) | | | 3,556,528 | | | | 3,458,540 | | |
5.75%, 4/20/2029 (c) | | | 502,000 | | | | 452,832 | | |
American Tower Corp.
REIT, 2.40%, 3/15/2025 | | | 115,000 | | | | 109,208 | | |
AMN Healthcare, Inc.
4.63%, 10/1/2027 (c) | | | 2,959,000 | | | | 2,655,525 | | |
First Eagle Funds | Annual Report | October 31, 2023
75
First Eagle Global Income Builder Fund | Schedule of Investments | October 31, 2023
Investments | | Principal Amount ($) | | Value ($) | |
United States — 8.1% (continued) | |
Ball Corp.
6.88%, 3/15/2028 | | | 1,552,000 | | | | 1,547,402 | | |
Bank of New York Mellon Corp. (The)
Series I, (US Treasury Yield Curve Rate T Note
Constant Maturity 5 Year + 2.63%),
3.75%, 12/20/2026 (d)(g) | | | 7,689,000 | | | | 5,951,333 | | |
Boston Properties LP
REIT, 3.20%, 1/15/2025 | | | 1,817,000 | | | | 1,738,716 | | |
Carnival Corp.
4.00%, 8/1/2028 (c) | | | 1,206,000 | | | | 1,049,003 | | |
Centene Corp.
4.25%, 12/15/2027 | | | 2,873,000 | | | | 2,644,022 | | |
4.63%, 12/15/2029 | | | 450,000 | | | | 401,967 | | |
Charles River Laboratories International, Inc.
4.25%, 5/1/2028 (c) | | | 2,282,000 | | | | 2,027,648 | | |
3.75%, 3/15/2029 (c) | | | 1,522,000 | | | | 1,284,675 | | |
CITGO Petroleum Corp.
7.00%, 6/15/2025 (c) | | | 9,457,000 | | | | 9,292,686 | | |
6.38%, 6/15/2026 (c) | | | 5,182,000 | | | | 5,091,090 | | |
CVS Health Corp.
3.88%, 7/20/2025 | | | 875,000 | | | | 846,449 | | |
1.30%, 8/21/2027 | | | 1,000,000 | | | | 843,465 | | |
4.30%, 3/25/2028 | | | 850,000 | | | | 796,354 | | |
DCP Midstream Operating LP
6.45%, 11/3/2036 (c) | | | 773,000 | | | | 737,780 | | |
Delta Air Lines, Inc.
4.50%, 10/20/2025 (c) | | | 4,101,200 | | | | 3,986,268 | | |
DT Midstream, Inc.
4.13%, 6/15/2029 (c) | | | 2,910,000 | | | | 2,502,044 | | |
Edgewell Personal Care Co.
5.50%, 6/1/2028 (c) | | | 1,770,000 | | | | 1,615,417 | | |
4.13%, 4/1/2029 (c) | | | 1,557,000 | | | | 1,302,041 | | |
Embecta Corp.
5.00%, 2/15/2030 (c) | | | 3,893,000 | | | | 3,091,315 | | |
6.75%, 2/15/2030 (c) | | | 2,292,000 | | | | 1,900,068 | | |
GE HealthCare Technologies, Inc.
5.60%, 11/15/2025 | | | 1,700,000 | | | | 1,690,680 | | |
First Eagle Funds | Annual Report | October 31, 2023
76
First Eagle Global Income Builder Fund | Schedule of Investments | October 31, 2023
Investments | | Principal Amount ($) | | Value ($) | |
United States — 8.1% (continued) | |
HCA, Inc.
5.38%, 2/1/2025 | | | 4,401,000 | | | | 4,354,301 | | |
5.88%, 2/15/2026 | | | 2,649,000 | | | | 2,625,692 | | |
3.50%, 9/1/2030 | | | 1,588,000 | | | | 1,314,298 | | |
Iron Mountain, Inc.
REIT, 4.88%, 9/15/2027 (c) | | | 3,609,000 | | | | 3,299,086 | | |
REIT, 5.25%, 3/15/2028 (c) | | | 1,005,000 | | | | 919,215 | | |
REIT, 5.00%, 7/15/2028 (c) | | | 1,596,000 | | | | 1,428,225 | | |
REIT, 4.88%, 9/15/2029 (c) | | | 1,322,000 | | | | 1,151,543 | | |
KeyBank NA
4.15%, 8/8/2025 | | | 1,000,000 | | | | 930,009 | | |
KFC Holding Co.
4.75%, 6/1/2027 (c) | | | 1,472,000 | | | | 1,391,114 | | |
Kinder Morgan Energy Partners LP
4.15%, 2/1/2024 | | | 3,116,000 | | | | 3,099,493 | | |
Kraft Heinz Foods Co.
3.00%, 6/1/2026 | | | 1,800,000 | | | | 1,682,031 | | |
Laboratory Corp. of America Holdings
3.60%, 2/1/2025 | | | 1,800,000 | | | | 1,747,900 | | |
Lamb Weston Holdings, Inc.
4.13%, 1/31/2030 (c) | | | 2,583,000 | | | | 2,191,217 | | |
Manufacturers & Traders Trust Co.
4.70%, 1/27/2028 | | | 2,825,000 | | | | 2,559,951 | | |
Mileage Plus Holdings LLC
6.50%, 6/20/2027 (c) | | | 4,079,674 | | | | 4,030,218 | | |
MSCI, Inc.
4.00%, 11/15/2029 (c) | | | 3,825,000 | | | | 3,292,708 | | |
Post Holdings, Inc.
5.75%, 3/1/2027 (c) | | | 2,867,000 | | | | 2,733,131 | | |
PRA Group, Inc.
7.38%, 9/1/2025 (c) | | | 2,123,000 | | | | 1,985,005 | | |
Roller Bearing Co. of America, Inc.
4.38%, 10/15/2029 (c) | | | 4,405,000 | | | | 3,735,484 | | |
Scripps Escrow II, Inc.
5.38%, 1/15/2031 (c) | | | 1,202,000 | | | | 746,346 | | |
SEG Holding LLC
5.63%, 10/15/2028 (c) | | | 5,461,000 | | | | 5,470,448 | | |
First Eagle Funds | Annual Report | October 31, 2023
77
First Eagle Global Income Builder Fund | Schedule of Investments | October 31, 2023
Investments | | Principal Amount ($) | | Value ($) | |
United States — 8.1% (continued) | |
Service Corp. International
4.63%, 12/15/2027 | | | 699,000 | | | | 646,547 | | |
5.13%, 6/1/2029 | | | 857,000 | | | | 784,155 | | |
Taylor Morrison Communities, Inc.
5.13%, 8/1/2030 (c) | | | 2,000,000 | | | | 1,680,807 | | |
Teleflex, Inc.
4.63%, 11/15/2027 | | | 2,919,000 | | | | 2,670,885 | | |
4.25%, 6/1/2028 (c) | | | 782,000 | | | | 690,116 | | |
Truist Financial Corp.
Series N, (US Treasury Yield Curve Rate T Note
Constant Maturity 5 Year + 3.00%),
4.80%, 9/1/2024 (d)(g) | | | 12,882,000 | | | | 10,556,959 | | |
VICI Properties LP
REIT, 5.63%, 5/1/2024 (c) | | | 1,586,000 | | | | 1,575,126 | | |
WESCO Distribution, Inc.
7.25%, 6/15/2028 (c) | | | 2,136,000 | | | | 2,122,437 | | |
| | | | 133,375,167 | | |
Total Corporate Bonds
(Cost 186,686,901) | | | 175,886,887 | | |
| | | Ounces | | | |
Commodities — 6.8% | |
Gold bullion*
(Cost $69,007,802) | | | 55,892 | | | | 110,952,542 | | |
| | | Shares | | | |
Master Limited Partnerships — 1.9% | |
United States — 1.9% | |
Enterprise Products Partners LP
(Cost $25,415,226) | | | 1,203,180 | | | | 31,330,807 | | |
| | | Principal Amount ($) | | | |
Foreign Government Securities — 1.7% | |
Brazil — 0.2% | |
Notas do Tesouro Nacional
10.00%, 1/1/2025 | | BRL | 21,000,000 | | | | 4,114,194 | | |
First Eagle Funds | Annual Report | October 31, 2023
78
First Eagle Global Income Builder Fund | Schedule of Investments | October 31, 2023
Investments | | Principal Amount ($) | | Value ($) | |
Colombia — 0.2% | |
Republic of Colombia
3.00%, 1/30/2030 | | | 4,290,000 | | | | 3,298,545 | | |
Italy — 0.3% | |
Republic of Italy
2.38%, 10/17/2024 | | | 4,300,000 | | | | 4,152,467 | | |
Mexico — 0.4% | |
Mex Bonos Desarr Fix Rt
Series M, 8.00%, 12/7/2023 | | MXN | 68,770,000 | | | | 3,797,665 | | |
Series M, 5.75%, 3/5/2026 | | MXN | 56,800,000 | | | | 2,831,053 | | |
| | | | 6,628,718 | | |
Saudi Arabia — 0.1% | |
Kingdom of Saudi Arabia
4.75%, 1/18/2028 (c) | | | 1,750,000 | | | | 1,693,125 | | |
Singapore ��� 0.3% | |
Republic of Singapore
1.25%, 11/1/2026 | | SGD | 7,592,000 | | | | 5,188,500 | | |
South Korea — 0.2% | |
Republic of Korea
1.25%, 3/10/2026 | | KRW | 4,480,550,000 | | | | 3,110,393 | | |
Total Foreign Government Securities
(Cost 29,020,214) | | | 28,185,942 | | |
| | | Shares | | | |
Preferred Stocks — 1.4% | |
United States — 1.4% | |
Charles Schwab Corp. (The)
Series D, 5.95% (g) | | | 46,239 | | | | 1,045,464 | | |
General American Investors Co., Inc.
Series B, 5.95% (g) | | | 4,712 | | | | 114,832 | | |
MetLife, Inc.
Series A, (SOFR USD 3 Month + 1.00%, 4.00% Floor),
6.67% (d)(g) | | | 128,986 | | | | 2,922,823 | | |
Northern Trust Corp.
Series E, 4.70% (g) | | | 135,349 | | | | 2,625,771 | | |
State Street Corp.
Series G, (ICE LIBOR USD 3 Month + 3.71%), 5.35% (d)(g) | | | 100,371 | | | | 2,195,114 | | |
First Eagle Funds | Annual Report | October 31, 2023
79
First Eagle Global Income Builder Fund | Schedule of Investments | October 31, 2023
Investments | | Shares | | Value ($) | |
United States — 1.4% (continued) | |
Truist Financial Corp.
Series R, 4.75% (g) | | | 383,073 | | | | 6,830,191 | | |
US Bancorp
Series B, (CME Term SOFR 3 Month + 0.86%, 1.02% Floor),
6.26% (d)(g) | | | 140,375 | | | | 2,709,237 | | |
Series A, (CME Term SOFR 3 Month + 1.28%), 6.68% (d)(g) | | | 5,200 | | | | 3,847,376 | | |
Total Preferred Stocks
(Cost 26,374,893) | | | 22,290,808 | | |
| | | Principal Amount ($) | | | |
Convertible Preferred Stocks — 1.4% | |
United States — 1.4% | |
Bank of America Corp.
Series L, 7.25% (g) | | | 10,496 | | | | 11,054,387 | | |
Wells Fargo & Co.
Series L, 7.50% (g) | | | 11,123 | | | | 11,749,225 | | |
| | | | 22,803,612 | | |
Total Convertible Preferred Stocks
(Cost 30,438,618) | | | 22,803,612 | | |
Loan Assignments — 0.3% | |
United States — 0.3% | |
Aramark Intermediate HoldCo Corp., Term
Loan B-5 (SOFR 1 month + 2.50%), 7.94%, 4/6/2028 (d) | | | 2,500,000 | | | | 2,500,525 | | |
SBA Senior Finance II LLC, Term Loan
(CME Term SOFR USD 1 Month + 1.75%), 7.18%, 4/11/2025 (d) | | | 1,745,395 | | | | 1,746,521 | | |
| | | | 4,247,046 | | |
Total Loan Assignments
(Cost 4,247,075) | | | 4,247,046 | | |
Asset-Backed Securities — 0.2% | |
United States — 0.2% | |
United Airlines Pass-Through Trust
Series 2020-1, Class A,
5.88%, 10/15/2027 (Cost $4,282,065) | | | 4,299,207 | | | | 4,232,743 | | |
First Eagle Funds | Annual Report | October 31, 2023
80
First Eagle Global Income Builder Fund | Schedule of Investments | October 31, 2023
Investments | | Principal Amount ($) | | Value ($) | |
Short-Term Investments — 2.2% | |
Commercial Paper — 2.2% | |
AES Corp. (The)
6.00%, 11/1/2023 (h) | | | 5,717,000 | | | | 5,716,039 | | |
Credit Agricole Corporate and Investment Bank
5.27%, 11/1/2023 (h) | | | 2,757,000 | | | | 2,756,592 | | |
Entergy Corp.
5.40%, 11/1/2023 (c)(h) | | | 3,594,000 | | | | 3,593,461 | | |
General Motors Financial Co., Inc.
5.45%, 11/1/2023 (h) | | | 17,641,000 | | | | 17,638,319 | | |
Global Payments, Inc.
5.96%, 11/1/2023 (h) | | | 6,089,000 | | | | 6,087,989 | | |
Total Commercial Paper
(Cost $35,798,000) | | | 35,792,400 | | |
| | | Shares | | | |
Investment Companies — 0.0% (f) | |
JP Morgan U.S. Government Money Market Fund,
Capital Shares 5.37% (i) (Cost $16,392) | | | 16,392 | | | | 16,392 | | |
Total Short-Term Investments
(Cost $35,814,392) | | | 35,808,792 | | |
Total Investments — 99.9%
(Cost $1,600,399,521) | | | 1,639,664,768 | | |
Other Assets Less Liabilities — 0.1% | | | 1,927,302 | | |
Net Assets — 100.0% | | | 1,641,592,070 | | |
* Non-income producing security.
(a) All or a portion of the security pledged as collateral for call options written.
(b) Security exempt from registration pursuant to Regulation S under the Securities Act of 1933. Regulation S applies to securities offerings that are made outside of the United States and do not involve direct selling efforts in the United States and as such may have restrictions on resale.
(c) Securities exempt from registration under Rule 144A or section 4(a)2 of the Securities Act of 1933. Total value of all such securities at October 31, 2023 amounted to $115,955,551, which represents approximately 7.06% of net assets of the Fund.
(d) Variable or floating rate security, linked to the referenced benchmark. The interest rate shown is the rate in effect as of October 31, 2023.
(e) Security has the ability to pay in kind ("PIK") or pay income in cash. When applicable, separate rates of such payments are disclosed.
(f) Represents less than 0.05% of net assets.
(g) Perpetual security. The rate reflected was the rate in effect on October 31, 2023. The maturity date reflects the next call date.
First Eagle Funds | Annual Report | October 31, 2023
81
First Eagle Global Income Builder Fund | Schedule of Investments | October 31, 2023
(h) The rate shown was the current yield as of October 31, 2023.
(i) Represents 7-day effective yield as of October 31, 2023.
As of October 31, 2023, the gross unrealized appreciation (depreciation) of investments based on the aggregate cost of investment securities and derivative instruments, if applicable, for federal income tax purposes was as follows:
Aggregate gross unrealized appreciation | | $ | 176,620,595 | | |
Aggregate gross unrealized depreciation | | | (134,342,956 | ) | |
Net unrealized appreciation | | $ | 42,277,639 | | |
Federal income tax cost | | $ | 1,598,255,456 | | |
Forward Foreign Currency Exchange Contracts outstanding as of October 31, 2023
Currency
Purchased | | Currency Sold | | Counterparty | | Settlement
Date | | Unrealized
Appreciation
(Depreciation) | |
USD | 6,867,188 | | | EUR | 6,109,000 | | | Bank of New York Mellon | | 11/15/2023 | | $ | 399,777 | | |
USD | 1,419,259 | | | JPY | 192,866,000 | | | Bank of New York Mellon | | 11/15/2023 | | | 144,146 | | |
USD | 7,084,363 | | | EUR | 6,455,000 | | | Goldman Sachs | | 12/20/2023 | | | 238,532 | | |
USD | 1,786,709 | | | GBP | 1,402,000 | | | Goldman Sachs | | 12/20/2023 | | | 81,975 | | |
USD | 1,327,202 | | | JPY | 189,697,000 | | | Goldman Sachs | | 12/20/2023 | | | 65,162 | | |
USD | 6,296,774 | | | EUR | 5,820,000 | | | JPMorgan Chase Bank | | 01/24/2024 | | | 113,706 | | |
USD | 2,854,542 | | | GBP | 2,287,000 | | | JPMorgan Chase Bank | | 01/24/2024 | | | 72,882 | | |
USD | 1,455,541 | | | JPY | 210,151,000 | | | JPMorgan Chase Bank | | 01/24/2024 | | | 49,260 | | |
USD | 5,864,887 | | | EUR | 5,497,000 | | | UBS AG | | 02/21/2024 | | | 17,257 | | |
USD | 1,104,391 | | | JPY | 160,920,000 | | | UBS AG | | 02/21/2024 | | | 22,689 | | |
Total unrealized appreciation | | | | | | | | | 1,205,386 | | |
EUR | 1,286,000 | | | USD | 1,373,165 | | | Goldman Sachs | | 12/20/2023 | | | (9,302 | ) | |
Total unrealized depreciation | | | | | | | | | (9,302 | ) | |
Net unrealized appreciation | | | | | | | | $ | 1,196,084 | | |
Abbreviations
ADR — American Depositary Receipt
BRL — Brazilian Real
EUR — Euro
Fix Rt — Fixed Rate
GBP — British Pound
ICE — Intercontinental Exchange
JPY — Japanese Yen
KRW — South Korean Won
LIBOR — London Interbank Offered Rate
MXN — Mexican Peso
NVDR — Non-Voting Depositary Receipt
PIK — Pay in Kind
Preference — A special type of equity investment that shares in the earnings of the company, has limited voting rights, and may have a dividend preference. Preference shares may also have liquidation preference.
REIT — Real Estate Investment Trust
First Eagle Funds | Annual Report | October 31, 2023
82
First Eagle Global Income Builder Fund | Schedule of Investments | October 31, 2023
SGD — Singapore Dollar
SOFR — Secured Overnight Financing Rate
USD — United States Dollar
Written Call Options Contracts as of October 31, 2023:
Description | | Counterparty | | Number of
Contracts | | Notional
Amount | | Exercise
Price | | Expiration
Date | | Value ($) | |
Bank of New York
Mellon Corp. (The) | | Exchange Traded | | | 382 | | | USD | (1,623,500 | ) | | USD | 50.00 | | | 12/15/2023 | | | (5,730 | ) | |
Bank of New York
Mellon Corp. (The) | | Exchange Traded | | | 395 | | | USD | (1,678,750 | ) | | USD | 50.00 | | | 01/19/2024 | | | (9,875 | ) | |
Becton Dickinson &
Co. | | Exchange Traded | | | 69 | | | USD | (1,744,182 | ) | | USD | 290.00 | | | 12/15/2023 | | | (2,932 | ) | |
Becton Dickinson &
Co. | | Exchange Traded | | | 62 | | | USD | (1,567,236 | ) | | USD | 320.00 | | | 12/15/2023 | | | (8,370 | ) | |
Becton Dickinson &
Co. | | Exchange Traded | | | 62 | | | USD | (1,567,236 | ) | | USD | 320.00 | | | 01/19/2024 | | | (4,650 | ) | |
Colgate-Palmolive
Co. | | Exchange Traded | | | 220 | | | USD | (1,652,640 | ) | | USD | 85.00 | | | 11/17/2023 | | | (660 | ) | |
Comcast Corp.,
Class A | | Exchange Traded | | | 446 | | | USD | (1,841,534 | ) | | USD | 45.00 | | | 01/19/2024 | | | (20,070 | ) | |
Comcast Corp.,
Class A | | Exchange Traded | | | 380 | | | USD | (1,569,020 | ) | | USD | 60.00 | | | 01/19/2024 | | | (760 | ) | |
Elevance Health,
Inc. | | Exchange Traded | | | 39 | | | USD | (1,755,351 | ) | | USD | 500.00 | | | 12/15/2023 | | | (5,265 | ) | |
Elevance Health,
Inc. | | Exchange Traded | | | 39 | | | USD | (1,755,351 | ) | | USD | 530.00 | | | 12/15/2023 | | | (2,243 | ) | |
Equity Residential,
REIT | | Exchange Traded | | | 536 | | | USD | (2,965,688 | ) | | USD | 75.00 | | | 12/15/2023 | | | (40,200 | ) | |
Equity Residential,
REIT | | Exchange Traded | | | 275 | | | USD | (1,521,575 | ) | | USD | 80.00 | | | 12/15/2023 | | | (20,625 | ) | |
Equity Residential,
REIT | | Exchange Traded | | | 258 | | | USD | (1,427,514 | ) | | USD | 80.00 | | | 01/19/2024 | | | (1,935 | ) | |
Exxon Mobil Corp. | | Exchange Traded | | | 148 | | | USD | (1,566,580 | ) | | USD | 125.00 | | | 11/17/2023 | | | (444 | ) | |
Exxon Mobil Corp. | | Exchange Traded | | | 148 | | | USD | (1,566,580 | ) | | USD | 130.00 | | | 11/17/2023 | | | (148 | ) | |
Exxon Mobil Corp. | | Exchange Traded | | | 148 | | | USD | (1,566,580 | ) | | USD | 135.00 | | | 12/15/2023 | | | (592 | ) | |
Exxon Mobil Corp. | | Exchange Traded | | | 161 | | | USD | (1,704,185 | ) | | USD | 135.00 | | | 01/19/2024 | | | (3,059 | ) | |
Exxon Mobil Corp. | | Exchange Traded | | | 161 | | | USD | (1,704,185 | ) | | USD | 140.00 | | | 01/19/2024 | | | (1,932 | ) | |
Exxon Mobil Corp. | | Exchange Traded | | | 159 | | | USD | (1,683,015 | ) | | USD | 150.00 | | | 01/19/2024 | | | (795 | ) | |
HCA Healthcare,
Inc. | | Exchange Traded | | | 66 | | | USD | (1,492,524 | ) | | USD | 290.00 | | | 11/17/2023 | | | (660 | ) | |
Linde plc | | Exchange Traded | | | 68 | | | USD | (2,598,688 | ) | | USD | 375.00 | | | 01/19/2024 | | | (146,200 | ) | |
Nutrien Ltd. | | Exchange Traded | | | 269 | | | USD | (1,444,530 | ) | | USD | 90.00 | | | 12/15/2023 | | | (4,035 | ) | |
First Eagle Funds | Annual Report | October 31, 2023
83
First Eagle Global Income Builder Fund | Schedule of Investments | October 31, 2023
Written Call Options Contracts as of October 31, 2023: (continued)
Description | | Counterparty | | Number of
Contracts | | Notional
Amount | | Exercise
Price | | Expiration
Date | | Value ($) | |
Nutrien Ltd. | | Exchange Traded | | | 269 | | | USD | (1,444,530 | ) | | USD | 95.00 | | | 01/19/2024 | | | (2,690 | ) | |
Philip Morris
International, Inc. | | Exchange Traded | | | 184 | | | USD | (1,640,544 | ) | | USD | 110.00 | | | 01/19/2024 | | | (1,472 | ) | |
Philip Morris
International, Inc. | | Exchange Traded | | | 178 | | | USD | (1,587,048 | ) | | USD | 120.00 | | | 01/19/2024 | | | (1,780 | ) | |
RPM International,
Inc. | | Exchange Traded | | | 200 | | | USD | (1,825,400 | ) | | USD | 100.00 | | | 11/17/2023 | | | (3,000 | ) | |
Schlumberger NV | | Exchange Traded | | | 326 | | | USD | (1,814,516 | ) | | USD | 70.00 | | | 11/17/2023 | | | (1,304 | ) | |
Schlumberger NV | | Exchange Traded | | | 356 | | | USD | (1,981,496 | ) | | USD | 70.00 | | | 01/19/2024 | | | (11,748 | ) | |
Schlumberger NV | | Exchange Traded | | | 306 | | | USD | (1,703,196 | ) | | USD | 75.00 | | | 01/19/2024 | | | (4,896 | ) | |
Walmart, Inc. | | Exchange Traded | | | 113 | | | USD | (1,846,533 | ) | | USD | 175.00 | | | 12/15/2023 | | | (8,927 | ) | |
Weyerhaeuser Co.,
REIT | | Exchange Traded | | | 560 | | | USD | (1,606,640 | ) | | USD | 35.00 | | | 01/19/2024 | | | (5,600 | ) | |
Weyerhaeuser Co.,
REIT | | Exchange Traded | | | 516 | | | USD | (1,480,404 | ) | | USD | 40.00 | | | 01/19/2024 | | | (5,160 | ) | |
| | | | | | | | | | | | | | (327,757 | ) | |
Total Written Options Contracts (Premiums Received ($722,046)) | | | | | | | | | | | | | (327,757 | ) | |
See Notes to Financial Statements.
First Eagle Funds | Annual Report | October 31, 2023
84
This page was intentionally left blank.
First Eagle High Income Fund
Data as of October 31, 2023 (unaudited)
Investment Objective
The First Eagle High Income Fund seeks to provide investors with a high level of current income. To pursue this objective, the Fund normally invests at least 80% of its net assets (plus any borrowings for investment purposes) in high yield, below investment-grade instruments.
Average Annual Returns^ (%) | | | | One Year | | Five Years | | Ten Years | |
First Eagle High Income Fund | | Class I | | | 5.49 | | | | 2.23 | | | | 2.82 | | |
Bloomberg U.S. Corporate High Yield Index | | | | | 6.23 | | | | 3.05 | | | | 3.86 | | |
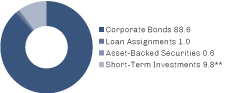
Sectors* (%) | |
Industrials | | | 15.9 | | |
Financials | | | 11.9 | | |
Consumer Discretionary | | | 11.7 | | |
Energy | | | 10.8 | | |
Consumer Staples | | | 9.9 | | |
Health Care | | | 9.1 | | |
Materials | | | 6.1 | | |
Information Technology | | | 5.4 | | |
Communication Services | | | 5.2 | | |
Real Estate | | | 3.6 | | |
Asset-Backed Securities | | | 0.6 | | |
Short-Term Investments | | | 9.8 | | |
Countries*~ (%)
United States | | | 79.2 | | |
Canada | | | 4.4 | | |
Mexico | | | 2.7 | | |
Germany | | | 2.1 | | |
Poland | | | 1.3 | | |
Australia | | | 0.5 | | |
Short-Term Investments | | | 9.8 | | |
^ Performance figures reflect certain fee waivers and/or expense limitations, without which returns may have been lower.
* Asset Allocation, Sectors and Countries percentages are based on total investments in the portfolio.
** Includes short-term commercial paper (9.8% of total investments) that settles in 90 days or less, long-term commercial paper (0.0% of total investments) that settles in 91 days or greater and other short-term investments (0.0% of total investments), such as U.S. treasury bills or money market funds.
~ Country allocations reflect country of risk (not currency of issue). Bonds of non-U.S. issuers may be U.S. dollar denominated.
The Fund's portfolio composition is subject to change at any time.
First Eagle Funds | Annual Report | October 31, 2023
86
First Eagle High Income Fund | Fund Overview
Growth of a $1,000,000 Initial Investment
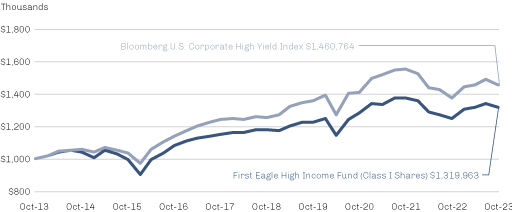
Performance data quoted herein represents past performance and should not be considered indicative of future results. Performance data quoted herein does not reflect the deduction of taxes that a shareholder would pay on Fund distributions or the sale of Fund shares. The average annual returns shown above are historical and reflect changes in share price, reinvested dividends and are net of expenses.
Class I Shares require $1 million minimum investment and are offered without a sales charge. If a sales charge was included values would be lower.
The Bloomberg U.S. Corporate High Yield Index is composed of fixed-rate, publicly issued, non-investment grade debt and is unmanaged, with dividends reinvested. The index includes both corporate and non-corporate sectors. The corporate sectors are Industrial, Utility, and Finance, which include both U.S. and non-U.S. corporations. One cannot invest directly in an index.
Top 10 Holdings* (%)
CITGO Petroleum Corp. (Oil, Gas & Consumable Fuels, United States) | | | 2.5 | | |
Ford Motor Credit Co. LLC (Consumer Finance, United States) | | | 2.2 | | |
Mexico Remittances Funding Fiduciary Estate Management Sarl (Financial Services, Mexico) | | | 1.9 | | |
Carnival Corp. (Hotels, Restaurants & Leisure, United States) | | | 1.9 | | |
Ford Motor Credit Co. LLC (Consumer Finance, United States) | | | 1.6 | | |
Caesars Entertainment, Inc. (Hotels, Restaurants & Leisure, United States) | | | 1.6 | | |
Mileage Plus Holdings LLC (Passenger Airlines, United States) | | | 1.6 | | |
AMN Healthcare, Inc. (Professional Services, United States) | | | 1.5 | | |
Interface, Inc. (Commercial Services & Supplies, United States) | | | 1.5 | | |
Cheplapharm Arzneimittel GmbH (Pharmaceuticals, Germany) | | | 1.5 | | |
Total | | | 17.8 | | |
* Holdings in cash, short-term commercial paper, long-term commercial paper and other short-term cash equivalents have been excluded.
Percentages are based on total net assets.
First Eagle Funds | Annual Report | October 31, 2023
87
First Eagle High Income Fund | Schedule of Investments | October 31, 2023
Investments | | Principal Amount ($) | | Value ($) | |
Corporate Bonds — 83.4% | |
Australia — 0.5% | |
Nufarm Australia Ltd.
5.00%, 1/27/2030 (a) | | | 859,000 | | | | 745,174 | | |
Canada — 4.1% | |
Kronos Acquisition Holdings, Inc.
5.00%, 12/31/2026 (a) | | | 2,000,000 | | | | 1,809,103 | | |
Open Text Corp.
3.88%, 2/15/2028 (a) | | | 2,190,000 | | | | 1,903,274 | | |
Open Text Holdings, Inc.
4.13%, 2/15/2030 (a) | | | 393,000 | | | | 325,639 | | |
Precision Drilling Corp.
6.88%, 1/15/2029 (a) | | | 1,944,000 | | | | 1,799,956 | | |
Ritchie Bros Holdings, Inc.
7.75%, 3/15/2031 (a) | | | 500,000 | | | | 501,250 | | |
| | | | 6,339,222 | | |
Germany — 2.0% | |
Cheplapharm Arzneimittel GmbH
5.50%, 1/15/2028 (a) | | | 2,640,000 | | | | 2,341,645 | | |
IHO Verwaltungs GmbH
6.00% (6.00% Cash or 6.75% PIK) 5/15/2027 (a)(b) | | | 780,244 | | | | 726,025 | | |
| | | | 3,067,670 | | |
Mexico — 2.5% | |
Mexico Remittances Funding Fiduciary Estate
Management Sarl
4.88%, 1/15/2028 (a) | | | 3,351,550 | | | | 2,962,548 | | |
Petroleos Mexicanos
6.70%, 2/16/2032 | | | 1,200,000 | | | | 884,779 | | |
| | | | 3,847,327 | | |
Poland — 1.2% | |
Canpack SA
3.13%, 11/1/2025 (a) | | | 200,000 | | | | 183,348 | | |
3.88%, 11/15/2029 (a) | | | 2,147,000 | | | | 1,685,395 | | |
| | | | 1,868,743 | | |
United States — 73.1% | |
ACCO Brands Corp.
4.25%, 3/15/2029 (a) | | | 1,964,000 | | | | 1,629,808 | | |
First Eagle Funds | Annual Report | October 31, 2023
88
First Eagle High Income Fund | Schedule of Investments | October 31, 2023
Investments | | Principal Amount ($) | | Value ($) | |
United States — 73.1% (continued) | |
American Airlines, Inc.
5.50%, 4/20/2026 (a) | | | 1,042,778 | | | | 1,014,048 | | |
5.75%, 4/20/2029 (a) | | | 185,000 | | | | 166,880 | | |
AMN Healthcare, Inc.
4.63%, 10/1/2027 (a) | | | 2,626,000 | | | | 2,356,678 | | |
4.00%, 4/15/2029 (a) | | | 609,000 | | | | 504,362 | | |
Antero Midstream Partners LP
7.88%, 5/15/2026 (a) | | | 615,000 | | | | 619,338 | | |
5.38%, 6/15/2029 (a) | | | 1,294,000 | | | | 1,175,014 | | |
Antero Resources Corp.
8.38%, 7/15/2026‡ (a) | | | 604,000 | | | | 621,196 | | |
Arcosa, Inc.
4.38%, 4/15/2029 (a) | | | 163,000 | | | | 142,217 | | |
Ashland, Inc.
3.38%, 9/1/2031 (a) | | | 1,500,000 | | | | 1,149,864 | | |
Avantor Funding, Inc.
3.88%, 11/1/2029 (a) | | | 2,000,000 | | | | 1,673,872 | | |
B&G Foods, Inc.
8.00%, 9/15/2028 (a) | | | 1,000,000 | | | | 974,492 | | |
Ball Corp.
6.88%, 3/15/2028 | | | 367,000 | | | | 365,913 | | |
6.00%, 6/15/2029 | | | 500,000 | | | | 479,415 | | |
Boyd Gaming Corp.
4.75%, 12/1/2027 | | | 872,000 | | | | 793,516 | | |
4.75%, 6/15/2031 (a) | | | 162,000 | | | | 134,443 | | |
BWX Technologies, Inc.
4.13%, 6/30/2028 (a) | | | 1,000,000 | | | | 879,985 | | |
4.13%, 4/15/2029 (a) | | | 653,000 | | | | 558,315 | | |
Caesars Entertainment, Inc.
6.25%, 7/1/2025 (a) | | | 2,500,000 | | | | 2,459,718 | | |
Carnival Corp.
5.75%, 3/1/2027 (a) | | | 3,242,000 | | | | 2,894,658 | | |
4.00%, 8/1/2028 (a) | | | 424,000 | | | | 368,804 | | |
CCO Holdings LLC
5.00%, 2/1/2028 (a) | | | 2,500,000 | | | | 2,244,843 | | |
Centene Corp.
4.25%, 12/15/2027 | | | 641,000 | | | | 589,912 | | |
4.63%, 12/15/2029 | | | 809,000 | | | | 722,648 | | |
First Eagle Funds | Annual Report | October 31, 2023
89
First Eagle High Income Fund | Schedule of Investments | October 31, 2023
Investments | | Principal Amount ($) | | Value ($) | |
United States — 73.1% (continued) | |
Charles River Laboratories International, Inc.
4.25%, 5/1/2028 (a) | | | 857,000 | | | | 761,479 | | |
3.75%, 3/15/2029 (a) | | | 1,182,000 | | | | 997,691 | | |
Cinemark USA, Inc.
8.75%, 5/1/2025 (a) | | | 963,000 | | | | 973,150 | | |
CITGO Petroleum Corp.
7.00%, 6/15/2025 (a) | | | 3,956,000 | | | | 3,887,265 | | |
6.38%, 6/15/2026 (a) | | | 802,000 | | | | 787,930 | | |
CNX Resources Corp.
7.38%, 1/15/2031 (a) | | | 250,000 | | | | 238,869 | | |
Cogent Communications Group, Inc.
3.50%, 5/1/2026 (a) | | | 648,000 | | | | 586,600 | | |
Conduent Business Services LLC
6.00%, 11/1/2029 (a) | | | 2,000,000 | | | | 1,648,663 | | |
Crown Americas LLC
4.75%, 2/1/2026 | | | 1,844,000 | | | | 1,773,222 | | |
Dana, Inc.
5.38%, 11/15/2027 | | | 1,255,000 | | | | 1,154,600 | | |
Delta Air Lines, Inc.
4.50%, 10/20/2025 (a) | | | 1,597,862 | | | | 1,553,084 | | |
DT Midstream, Inc.
4.13%, 6/15/2029 (a) | | | 1,243,000 | | | | 1,068,743 | | |
Edgewell Personal Care Co.
5.50%, 6/1/2028 (a) | | | 618,000 | | | | 564,027 | | |
4.13%, 4/1/2029 (a) | | | 669,000 | | | | 559,451 | | |
Embecta Corp.
5.00%, 2/15/2030 (a) | | | 801,000 | | | | 636,050 | | |
6.75%, 2/15/2030 (a) | | | 693,000 | | | | 574,497 | | |
Energizer Holdings, Inc.
4.75%, 6/15/2028 (a) | | | 8,000 | | | | 6,833 | | |
4.38%, 3/31/2029 (a) | | | 871,000 | | | | 711,017 | | |
EnLink Midstream LLC
6.50%, 9/1/2030 (a) | | | 1,000,000 | | | | 959,869 | | |
Entegris Escrow Corp.
4.75%, 4/15/2029 (a) | | | 1,000,000 | | | | 895,544 | | |
EquipmentShare.com, Inc.
9.00%, 5/15/2028 (a) | | | 1,500,000 | | | | 1,410,000 | | |
Fair Isaac Corp.
4.00%, 6/15/2028 (a) | | | 2,169,000 | | | | 1,931,468 | | |
First Eagle Funds | Annual Report | October 31, 2023
90
First Eagle High Income Fund | Schedule of Investments | October 31, 2023
Investments | | Principal Amount ($) | | Value ($) | |
United States — 73.1% (continued) | |
Ford Motor Credit Co. LLC
3.81%, 1/9/2024 | | | 2,500,000 | | | | 2,487,607 | | |
5.58%, 3/18/2024 | | | 3,418,000 | | | | 3,402,353 | | |
Fortrea Holdings, Inc.
7.50%, 7/1/2030 (a) | | | 1,000,000 | | | | 965,000 | | |
G-III Apparel Group Ltd.
7.88%, 8/15/2025 (a) | | | 2,000,000 | | | | 1,981,705 | | |
Gray Escrow II, Inc.
5.38%, 11/15/2031 (a) | | | 1,000,000 | | | | 630,251 | | |
Hawaiian Brand Intellectual Property Ltd.
5.75%, 1/20/2026 (a) | | | 1,240,000 | | | | 916,198 | | |
Hertz Corp. (The)
5.00%, 12/1/2029 (a) | | | 2,000,000 | | | | 1,435,809 | | |
Howard Hughes Corp. (The)
4.38%, 2/1/2031 (a) | | | 62,000 | | | | 47,194 | | |
Imola Merger Corp.
4.75%, 5/15/2029 (a) | | | 1,184,000 | | | | 1,032,203 | | |
Ingles Markets, Inc.
4.00%, 6/15/2031 (a) | | | 500,000 | | | | 397,500 | | |
Interface, Inc.
5.50%, 12/1/2028 (a) | | | 2,794,000 | | | | 2,348,944 | | |
International Game Technology plc
5.25%, 1/15/2029 (a) | | | 967,000 | | | | 879,854 | | |
IQVIA, Inc.
5.00%, 10/15/2026 (a) | | | 800,000 | | | | 762,654 | | |
5.00%, 5/15/2027 (a) | | | 1,075,000 | | | | 1,011,342 | | |
6.50%, 5/15/2030 (a) | | | 250,000 | | | | 242,500 | | |
Iron Mountain, Inc.
REIT, 4.88%, 9/15/2027 (a) | | | 763,000 | | | | 697,479 | | |
REIT, 5.25%, 3/15/2028 (a) | | | 621,000 | | | | 567,992 | | |
REIT, 5.00%, 7/15/2028 (a) | | | 220,000 | | | | 196,873 | | |
REIT, 4.88%, 9/15/2029 (a) | | | 870,000 | | | | 757,824 | | |
ITT Holdings LLC
6.50%, 8/1/2029 (a) | | | 1,250,000 | | | | 1,045,313 | | |
Kaiser Aluminum Corp.
4.63%, 3/1/2028 (a) | | | 1,312,000 | | | | 1,093,247 | | |
Lamb Weston Holdings, Inc.
4.88%, 5/15/2028 (a) | | | 581,000 | | | | 536,487 | | |
4.13%, 1/31/2030 (a) | | | 1,117,000 | | | | 947,576 | | |
First Eagle Funds | Annual Report | October 31, 2023
91
First Eagle High Income Fund | Schedule of Investments | October 31, 2023
Investments | | Principal Amount ($) | | Value ($) | |
United States — 73.1% (continued) | |
Macy's Retail Holdings LLC
5.88%, 3/15/2030 (a) | | | 250,000 | | | | 211,497 | | |
6.13%, 3/15/2032 (a) | | | 500,000 | | | | 412,930 | | |
MGIC Investment Corp.
5.25%, 8/15/2028 | | | 612,000 | | | | 562,535 | | |
Mileage Plus Holdings LLC
6.50%, 6/20/2027 (a) | | | 2,457,671 | | | | 2,427,878 | | |
Moog, Inc.
4.25%, 12/15/2027 (a) | | | 155,000 | | | | 137,990 | | |
MSCI, Inc.
4.00%, 11/15/2029 (a) | | | 1,000,000 | | | | 860,839 | | |
Mueller Water Products, Inc.
4.00%, 6/15/2029 (a) | | | 646,000 | | | | 552,330 | | |
NCR Atleos Escrow Corp.
9.50%, 4/1/2029 (a) | | | 500,000 | | | | 490,115 | | |
PennyMac Financial Services, Inc.
5.75%, 9/15/2031 (a) | | | 1,000,000 | | | | 815,337 | | |
Post Holdings, Inc.
5.75%, 3/1/2027 (a) | | | 1,786,000 | | | | 1,702,606 | | |
PRA Group, Inc.
7.38%, 9/1/2025 (a) | | | 2,426,000 | | | | 2,268,310 | | |
Radian Group, Inc.
4.50%, 10/1/2024 | | | 645,000 | | | | 628,552 | | |
Range Resources Corp.
4.75%, 2/15/2030 (a) | | | 1,000,000 | | | | 888,150 | | |
Roller Bearing Co. of America, Inc.
4.38%, 10/15/2029 (a) | | | 1,019,000 | | | | 864,122 | | |
Royal Caribbean Cruises Ltd.
11.50%, 6/1/2025 (a) | | | 214,000 | | | | 226,164 | | |
5.50%, 8/31/2026 (a) | | | 1,000,000 | | | | 943,680 | | |
5.38%, 7/15/2027 (a) | | | 100,000 | | | | 92,158 | | |
8.25%, 1/15/2029 (a) | | | 500,000 | | | | 512,561 | | |
SBA Communications Corp.
REIT, 3.88%, 2/15/2027 | | | 609,000 | | | | 554,613 | | |
Scripps Escrow II, Inc.
5.38%, 1/15/2031 (a) | | | 2,452,000 | | | | 1,522,496 | | |
Sealed Air Corp.
4.00%, 12/1/2027 (a) | | | 1,252,000 | | | | 1,100,549 | | |
6.13%, 2/1/2028 (a) | | | 250,000 | | | | 237,955 | | |
First Eagle Funds | Annual Report | October 31, 2023
92
First Eagle High Income Fund | Schedule of Investments | October 31, 2023
Investments | | Principal Amount ($) | | Value ($) | |
United States — 73.1% (continued) | |
Service Corp. International
4.63%, 12/15/2027 | | | 124,000 | | | | 114,695 | | |
5.13%, 6/1/2029 | | | 125,000 | | | | 114,375 | | |
Shea Homes LP
4.75%, 2/15/2028 | | | 668,000 | | | | 587,093 | | |
Spirit Loyalty Cayman Ltd.
8.00%, 9/20/2025 (a) | | | 1,000,000 | | | | 737,500 | | |
Starwood Property Trust, Inc.
REIT, 5.50%, 11/1/2023 (a) | | | 2,000,000 | | | | 2,000,000 | | |
REIT, 3.75%, 12/31/2024 (a) | | | 1,000,000 | | | | 945,000 | | |
Sunoco LP
4.50%, 4/30/2030 | | | 2,000,000 | | | | 1,708,248 | | |
Teleflex, Inc.
4.63%, 11/15/2027 | | | 1,005,000 | | | | 919,575 | | |
4.25%, 6/1/2028 (a) | | | 1,026,000 | | | | 905,446 | | |
Triton Water Holdings, Inc.
6.25%, 4/1/2029 (a) | | | 2,138,000 | | | | 1,762,107 | | |
Turning Point Brands, Inc.
5.63%, 2/15/2026 (a) | | | 1,830,000 | | | | 1,679,025 | | |
United Airlines, Inc.
4.38%, 4/15/2026 (a) | | | 343,000 | | | | 318,172 | | |
4.63%, 4/15/2029 (a) | | | 229,000 | | | | 193,437 | | |
United Natural Foods, Inc.
6.75%, 10/15/2028 (a) | | | 1,530,000 | | | | 1,203,926 | | |
United Wholesale Mortgage LLC
5.50%, 4/15/2029 (a) | | | 326,000 | | | | 273,025 | | |
VICI Properties LP
REIT, 5.75%, 2/1/2027 (a) | | | 2,415,000 | | | | 2,311,188 | | |
WESCO Distribution, Inc.
7.25%, 6/15/2028 (a) | | | 1,850,000 | | | | 1,838,253 | | |
White Cap Parent LLC
8.25% (8.25% Cash or 9.00% PIK) 3/15/2026 (a)(b) | | | 1,972,000 | | | | 1,850,605 | | |
Ziff Davis, Inc.
4.63%, 10/15/2030 (a) | | | 1,588,000 | | | | 1,329,503 | | |
ZipRecruiter, Inc.
5.00%, 1/15/2030 (a) | | | 1,000,000 | | | | 781,030 | | |
| | | | 112,169,466 | | |
Total Corporate Bonds
(Cost 141,634,688) | | | 128,037,602 | | |
First Eagle Funds | Annual Report | October 31, 2023
93
First Eagle High Income Fund | Schedule of Investments | October 31, 2023
Investments | | Principal Amount ($) | | Value ($) | |
Loan Assignments — 0.9% | |
United States — 0.9% | |
BJ's Wholesale Club, Inc., 1st Lien Term Loan B
(SOFR 1 month + 2.00%), 7.35%, 2/5/2029 (c)
(Cost $1,450,933) | | | 1,451,211 | | | | 1,455,521 | | |
Asset-Backed Securities — 0.5% | |
United States — 0.5% | |
United Airlines Pass-Through Trust
Series 2020-1, Class A, 5.88%, 10/15/2027
(Cost $823,399) | | | 826,845 | | | | 814,063 | | |
Short-Term Investments — 9.3% | |
Commercial Paper — 9.3% | |
AES Corp. (The)
6.00%, 11/1/2023 (d) | | | 2,271,000 | | | | 2,270,618 | | |
Credit Agricole Corporate and Investment Bank
5.27%, 11/1/2023 (d) | | | 1,095,000 | | | | 1,094,838 | | |
Entergy Corp.
5.40%, 11/1/2023 (a)(d) | | | 1,428,000 | | | | 1,427,786 | | |
General Motors Financial Co., Inc.
5.45%, 11/1/2023 (d) | | | 7,007,000 | | | | 7,005,935 | | |
Global Payments, Inc.
5.96%, 11/1/2023 (d) | | | 2,419,000 | | | | 2,418,598 | | |
Total Commercial Paper
(Cost $14,220,000) | | | 14,217,775 | | |
| | | Shares | | | |
Investment Companies — 0.0% (e) | |
JP Morgan U.S. Government Money Market Fund,
Capital Shares 5.37% (f) (Cost $7,164) | | | 7,164 | | | | 7,164 | | |
Total Short-Term Investments
(Cost $14,227,164) | | | 14,224,939 | | |
Total Investments — 94.1%
(Cost $158,136,184) | | | 144,532,125 | | |
Other Assets Less Liabilities — 5.9% | | | 9,052,091 | | |
Net Assets — 100.0% | | | 153,584,216 | | |
First Eagle Funds | Annual Report | October 31, 2023
94
First Eagle High Income Fund | Schedule of Investments | October 31, 2023
‡ Value determined using significant unobservable inputs.
(a) Securities exempt from registration under Rule 144A or section 4(a)2 of the Securities Act of 1933. Total value of all such securities at October 31, 2023 amounted to $111,621,737, which represents approximately 72.68% of net assets of the Fund.
(b) Security has the ability to pay in kind ("PIK") or pay income in cash. When applicable, separate rates of such payments are disclosed.
(c) Variable or floating rate security, linked to the referenced benchmark. The interest rate shown is the rate in effect as of October 31, 2023.
(d) The rate shown was the current yield as of October 31, 2023.
(e) Represents less than 0.05% of net assets.
(f) Represents 7-day effective yield as of October 31, 2023.
As of October 31, 2023, the gross unrealized appreciation (depreciation) of investments based on the aggregate cost of investment securities and derivative instruments, if applicable, for federal income tax purposes was as follows:
Aggregate gross unrealized appreciation | | $ | 153,639 | | |
Aggregate gross unrealized depreciation | | | (13,671,711 | ) | |
Net unrealized depreciation | | $ | (13,518,072 | ) | |
Federal income tax cost | | $ | 158,050,197 | | |
Abbreviations
PIK — Pay in Kind
REIT — Real Estate Investment Trust
SOFR — Secured Overnight Financing Rate
See Notes to Financial Statements.
First Eagle Funds | Annual Report | October 31, 2023
95
First Eagle Rising Dividend Fund (formerly First Eagle Fund of America)
Data as of October 31, 2023 (unaudited)
Investment Objective
The First Eagle Rising Dividend Fund is a non-diversified domestic fund that seeks capital appreciation and current income by investing primarily in domestic stocks and, to a lesser extent, in debt and foreign equity instruments. Normally, at least 80% of the Fund's net assets (plus any borrowings for investment purposes) are invested in dividends paying equity securities where the dividends are expected to increase over time.
Average Annual Returns^ (%) | | | | | | One Year | | Five Years | | Ten Years | |
First Eagle Rising Dividend Fund | | Class A | | without sales charge | | | 14.17 | | | | 5.24 | | | | 4.18 | | |
| | | | with sales charge | | | 8.45 | | | | 4.16 | | | | 3.65 | | |
S&P 500 Index | | | | | | | | | | | 10.14 | | | | 11.01 | | | | 11.18 | | |

Sectors* (%)
Information Technology | | | 19.9 | | |
Health Care | | | 18.8 | | |
Communication Services | | | 16.6 | | |
Consumer Staples | | | 11.9 | | |
Industrials | | | 8.9 | | |
Consumer Discretionary | | | 8.6 | | |
Energy | | | 7.6 | | |
Financials | | | 3.6 | | |
Real Estate | | | 2.3 | | |
Materials | | | 0.5 | | |
Short-Term Investments | | | 1.3 | | |
^ Performance figures reflect certain fee waivers and/or expense limitations, without which returns may have been lower.
* Asset Allocation and Sectors percentages are based on total investments in the portfolio.
** Includes short-term commercial paper (1.3% of total investments) that settles in 90 days or less, long-term commercial paper (0.0% of total investments) that settles in 91 days or greater and other short-term investments (0.0% of total investments), such as U.S. treasury bills or money market funds.
The Fund's portfolio composition is subject to change at any time.
First Eagle Funds | Annual Report | October 31, 2023
96
First Eagle Rising Dividend Fund | Fund Overview
Growth of a $10,000 Initial Investment

Performance data quoted herein represents past performance and should not be considered indicative of future results. Performance data quoted herein does not reflect the deduction of taxes that a shareholder would pay on Fund distributions or the sale of Fund shares.
The average annual returns shown above are historical and reflect changes in share price, reinvested dividends and are net of expenses.
The average annual returns for Class A shares give effect to the deduction of the maximum sales charge of 5.00%
The S&P 500 Index is a widely recognized unmanaged index including a representative sample of 500 leading companies in leading sectors of the U.S. economy. Although the S&P 500 Index focuses on the large-cap segment of the market, with approximately 80% coverage of U.S. equities, it is also considered a proxy for the total market. The S&P 500 Index includes dividends reinvested. One cannot invest directly in an index.
Top 10 Holdings* (%)
Oracle Corp. (Software, United States) | | | 6.9 | | |
Comcast Corp., Class A (Media, United States) | | | 6.6 | | |
Texas Instruments, Inc. (Semiconductors & Semiconductor Equipment, United States) | | | 6.0 | | |
Alphabet, Inc., Class A (Interactive Media & Services, United States) | | | 5.9 | | |
Medtronic plc (Health Care Equipment & Supplies, United States) | | | 5.9 | | |
UnitedHealth Group, Inc. (Health Care Providers & Services, United States) | | | 5.8 | | |
Philip Morris International, Inc. (Tobacco, United States) | | | 4.9 | | |
Home Depot, Inc. (The) (Specialty Retail, United States) | | | 4.5 | | |
TE Connectivity Ltd. (Electronic Equipment, Instruments & Components, United States) | | | 4.3 | | |
Becton Dickinson & Co. (Health Care Equipment & Supplies, United States) | | | 4.0 | | |
Total | | | 54.8 | | |
* Holdings in cash, short-term commercial paper, long-term commercial paper and other short-term cash equivalents have been excluded.
Percentages are based on total net assets.
First Eagle Funds | Annual Report | October 31, 2023
97
First Eagle Rising Dividend Fund | Schedule of Investments | October 31, 2023
Investments | | Shares | | Value ($) | |
Common Stocks — 96.0% | |
Air Freight & Logistics — 5.0% | |
CH Robinson Worldwide, Inc. | | | 94,860 | | | | 7,762,394 | | |
Expeditors International of Washington, Inc. | | | 91,739 | | | | 10,022,486 | | |
| | | | 17,784,880 | | |
Beverages — 2.9% | |
PepsiCo, Inc. | | | 63,773 | | | | 10,412,855 | | |
Capital Markets — 2.3% | |
Bank of New York Mellon Corp. (The) | | | 188,714 | | | | 8,020,345 | | |
Chemicals — 0.5% | |
RPM International, Inc. | | | 19,424 | | | | 1,772,829 | | |
Electronic Equipment, Instruments & Components — 4.3% | |
TE Connectivity Ltd. | | | 130,279 | | | | 15,353,380 | | |
Food Products — 0.5% | |
Nestle SA (Registered) | | | 16,940 | | | | 1,826,789 | | |
Health Care Equipment & Supplies — 9.9% | |
Becton Dickinson & Co. | | | 56,162 | | | | 14,196,630 | | |
Medtronic plc | | | 293,507 | | | | 20,709,854 | | |
| | | | 34,906,484 | | |
Health Care Providers & Services — 9.0% | |
HCA Healthcare, Inc. | | | 48,599 | | | | 10,990,178 | | |
UnitedHealth Group, Inc. | | | 38,640 | | | | 20,694,038 | | |
| | | | 31,684,216 | | |
Hotels, Restaurants & Leisure — 1.3% | |
Starbucks Corp. | | | 50,670 | | | | 4,673,801 | | |
Household Products — 3.6% | |
Colgate-Palmolive Co. | | | 168,063 | | | | 12,624,893 | | |
Insurance — 1.3% | |
Fidelity National Financial, Inc. | | | 115,348 | | | | 4,508,953 | | |
Interactive Media & Services — 9.9% | |
Alphabet, Inc., Class A* | | | 167,713 | | | | 20,809,829 | | |
Meta Platforms, Inc., Class A* | | | 46,882 | | | | 14,124,140 | | |
| | | | 34,933,969 | | |
IT Services — 0.2% | |
Accenture plc, Class A | | | 2,700 | | | | 802,143 | | |
First Eagle Funds | Annual Report | October 31, 2023
98
First Eagle Rising Dividend Fund | Schedule of Investments | October 31, 2023
Investments | | Shares | | Value ($) | |
Machinery — 3.9% | |
Schindler Holding AG (Switzerland) | | | 67,900 | | | | 13,737,716 | | |
Media — 6.6% | |
Comcast Corp., Class A | | | 569,727 | | | | 23,524,028 | | |
Oil, Gas & Consumable Fuels — 5.0% | |
Exxon Mobil Corp. | | | 108,154 | | | | 11,448,101 | | |
ONEOK, Inc. | | | 94,148 | | | | 6,138,450 | | |
| | | | 17,586,551 | | |
Semiconductors & Semiconductor Equipment — 7.0% | |
Taiwan Semiconductor Manufacturing Co. Ltd., ADR (Taiwan) | | | 44,119 | | | | 3,807,911 | | |
Texas Instruments, Inc. | | | 148,753 | | | | 21,124,413 | | |
| | | | 24,932,324 | | |
Software — 8.3% | |
Microsoft Corp. | | | 15,282 | | | | 5,166,997 | | |
Oracle Corp. | | | 234,447 | | | | 24,241,820 | | |
| | | | 29,408,817 | | |
Specialized REITs — 2.3% | |
Extra Space Storage, Inc., REIT | | | 79,075 | | | | 8,191,379 | | |
Specialty Retail — 7.3% | |
Home Depot, Inc. (The) | | | 55,873 | | | | 15,906,484 | | |
Ross Stores, Inc. | | | 85,002 | | | | 9,857,682 | | |
| | | | 25,764,166 | | |
Tobacco — 4.9% | |
Philip Morris International, Inc. | | | 193,418 | | | | 17,245,149 | | |
Total Common Stocks
(Cost $304,003,712) | | | 339,695,667 | | |
Master Limited Partnerships — 2.6% | |
Oil, Gas & Consumable Fuels — 2.6% | |
Enterprise Products Partners LP
(Cost $8,799,898) | | | 352,314 | | | | 9,174,256 | | |
| | | Principal Amount ($) | | | |
Short-Term Investments — 1.3% | |
Commercial Paper — 1.3% | |
AES Corp. (The)
6.00%, 11/1/2023 (a) | | | 760,000 | | | | 759,872 | | |
First Eagle Funds | Annual Report | October 31, 2023
99
First Eagle Rising Dividend Fund | Schedule of Investments | October 31, 2023
Investments | | Principal Amount ($) | | Value ($) | |
Commercial Paper — 1.3% (continued) | |
Credit Agricole Corporate and Investment Bank
5.27%, 11/1/2023 (a) | | | 366,000 | | | | 365,946 | | |
Entergy Corp.
5.40%, 11/1/2023 (a)(b) | | | 478,000 | | | | 477,928 | | |
General Motors Financial Co., Inc.
5.45%, 11/1/2023 (a) | | | 2,344,000 | | | | 2,343,644 | | |
Global Payments, Inc.
5.96%, 11/1/2023 (a) | | | 809,000 | | | | 808,866 | | |
Total Commercial Paper
(Cost $4,757,000) | | | 4,756,256 | | |
| | | Shares | | | |
Investment Companies — 0.0% (c) | |
JP Morgan U.S. Government Money Market Fund,
Capital Shares 5.37% (d) (Cost $3,291) | | | 3,291 | | | | 3,291 | | |
Total Short-Term Investments
(Cost $4,760,291) | | | 4,759,547 | | |
Total Investments — 99.9%
(Cost $317,563,901) | | | 353,629,470 | | |
Other Assets Less Liabilities — 0.1% | | | 185,461 | | |
Net Assets — 100.0% | | | 353,814,931 | | |
* Non-income producing security.
(a) The rate shown was the current yield as of October 31, 2023.
(b) Securities exempt from registration under Rule 144A or section 4(a)2 of the Securities Act of 1933. Total value of all such securities at October 31, 2023 amounted to $477,928, which represents approximately 0.14% of net assets of the Fund.
(c) Represents less than 0.05% of net assets.
(d) Represents 7-day effective yield as of October 31, 2023.
Abbreviations
ADR — American Depositary Receipt
REIT — Real Estate Investment Trust
As of October 31, 2023, the gross unrealized appreciation (depreciation) of investments based on the aggregate cost of investment securities and derivative instruments, if applicable, for federal income tax purposes was as follows:
Aggregate gross unrealized appreciation | | $ | 46,973,648 | | |
Aggregate gross unrealized depreciation | | | (10,996,464 | ) | |
Net unrealized appreciation | | $ | 35,977,184 | | |
Federal income tax cost | | $ | 317,652,286 | | |
See Notes to Financial Statements.
First Eagle Funds | Annual Report | October 31, 2023
100
This page was intentionally left blank.
First Eagle Small Cap Opportunity Fund
Data as of October 31, 2023 (unaudited)
Investment Objective
The First Eagle Small Cap Opportunity Fund seeks long-term growth of capital.
Average Annual Returns^ (%) | | | | One-Year | | Since
Inception
(4/27/21) | |
First Eagle Small Cap Opportunity Fund | | Class I | | | -3.08 | | | | -6.74 | | |
Russell 2000® Value Index | | | | | -9.93 | | | | -7.36 | | |
Russell 2000® Index | | | | | -8.56 | | | | -10.86 | | |
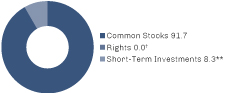
Sectors* (%)
Industrials | | | 22.3 | | |
Information Technology | | | 15.5 | | |
Consumer Discretionary | | | 13.0 | | |
Health Care | | | 11.0 | | |
Materials | | | 8.6 | | |
Financials | | | 8.3 | | |
Energy | | | 6.9 | | |
Real Estate | | | 2.4 | | |
Consumer Staples | | | 2.2 | | |
Communication Services | | | 0.9 | | |
Utilities | | | 0.6 | | |
Short-Term Investments | | | 8.3 | | |
^ Performance figures reflect certain fee waivers and/or expense limitations, without which returns may have been lower.
† Less than 0.05%.
* Asset Allocation and Sectors percentages are based on total investments in the portfolio.
** Includes short-term commercial paper (0.0% of total investments) that settles in 90 days or less, long-term commercial paper (0.0% of total investments) that settles in 91 days or greater and other short-term investments (8.3% of total investments), such as U.S. treasury bills or money market funds.
The Fund's portfolio composition is subject to change at any time.
First Eagle Funds | Annual Report | October 31, 2023
102
First Eagle Small Cap Opportunity Fund | Fund Overview
Growth of a $1,000,000 Initial Investment
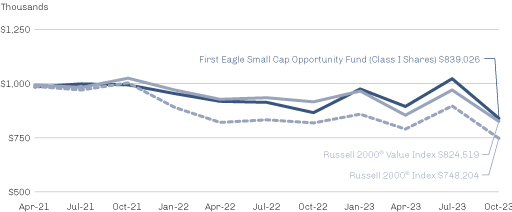
Performance data quoted herein represents past performance and should not be considered indicative of future results. Performance data quoted herein does not reflect the deduction of taxes that a shareholder would pay on Fund distributions or the sale of Fund shares. The average annual returns shown above are historical and reflect changes in share price, reinvested dividends and are net of expenses.
Class I Shares require $1 million minimum investment and are offered without a sales charge. If a sales charge was included values would be lower.
The Russell 2000® Value Index is a widely followed, unmanaged index that measures the performance of small-cap value segment of the U.S. equity universe. It includes those Russell 2000® companies with lower price-to-book ratios and lower forecasted growth values. The Russell 2000® Value Index is completely reconstituted annually. One cannot invest directly in an index.
The Russell 2000® Index is a widely followed, unmanaged index that measures the performance of the small-cap segment of the U.S. equity universe. The Russell 2000® Index is a subset of the Russell 3000® Index representing approximately 10% of the total market capitalization of that index. It includes approximately 2,000 of the smallest securities based on a combination of their market cap and current index membership. The Russell 2000® Index is completely reconstituted annually. One cannot invest directly in an index.
Top 10 Holdings* (%)
Ducommun, Inc. (Aerospace & Defense, United States) | | | 0.8 | | |
Stewart Information Services Corp. (Insurance, United States) | | | 0.8 | | |
Matador Resources Co. (Oil, Gas & Consumable Fuels, United States) | | | 0.8 | | |
Air Lease Corp. (Trading Companies & Distributors, United States) | | | 0.8 | | |
Old Republic International Corp. (Insurance, United States) | | | 0.8 | | |
Callon Petroleum Co. (Oil, Gas & Consumable Fuels, United States) | | | 0.8 | | |
AAR Corp. (Aerospace & Defense, United States) | | | 0.8 | | |
Goodyear Tire & Rubber Co. (The) (Automobile Components, United States) | | | 0.7 | | |
FTAI Aviation Ltd. (Trading Companies & Distributors, United States) | | | 0.7 | | |
QuidelOrtho Corp. (Health Care Equipment & Supplies, United States) | | | 0.7 | | |
Total | | | 7.7 | | |
* Holdings in cash, short-term commercial paper, long-term commercial paper and other short-term cash equivalents have been excluded.
Percentages are based on total net assets.
First Eagle Funds | Annual Report | October 31, 2023
103
First Eagle Small Cap Opportunity Fund | Schedule of Investments | October 31, 2023
Investments | | Shares | | Value ($) | |
Common Stocks — 91.5% | |
Aerospace & Defense — 4.6% | |
AAR Corp.* | | | 169,893 | | | | 10,084,849 | | |
Astronics Corp.* | | | 315,229 | | | | 4,832,461 | | |
Curtiss-Wright Corp. | | | 38,151 | | | | 7,584,800 | | |
Ducommun, Inc.* | | | 232,051 | | | | 11,101,320 | | |
Hexcel Corp. | | | 111,458 | | | | 6,901,479 | | |
Kratos Defense & Security Solutions, Inc.* | | | 98,502 | | | | 1,679,459 | | |
Leonardo DRS, Inc.* | | | 257,834 | | | | 4,916,894 | | |
Triumph Group, Inc.* | | | 612,174 | | | | 4,566,818 | | |
V2X, Inc.* | | | 171,700 | | | | 8,768,719 | | |
| | | | 60,436,799 | | |
Air Freight & Logistics — 0.6% | |
GXO Logistics, Inc.* | | | 117,346 | | | | 5,927,146 | | |
Radiant Logistics, Inc.* | | | 406,410 | | | | 2,381,563 | | |
| | | | 8,308,709 | | |
Automobile Components — 1.2% | |
Goodyear Tire & Rubber Co. (The)* | | | 844,878 | | | | 10,054,048 | | |
Modine Manufacturing Co.* | | | 160,526 | | | | 6,340,777 | | |
| | | | 16,394,825 | | |
Banks — 2.1% | |
Ameris Bancorp | | | 175,921 | | | | 6,561,853 | | |
Axos Financial, Inc.* | | | 142,109 | | | | 5,120,187 | | |
Dime Community Bancshares, Inc. | | | 159,397 | | | | 2,931,311 | | |
Old National Bancorp | | | 318,017 | | | | 4,356,833 | | |
Seacoast Banking Corp. of Florida | | | 352,966 | | | | 7,133,443 | | |
Valley National Bancorp | | | 172,893 | | | | 1,345,108 | | |
| | | | 27,448,735 | | |
Biotechnology — 1.0% | |
CareDx, Inc.* | | | 1,012,996 | | | | 5,480,308 | | |
Ironwood Pharmaceuticals, Inc.* | | | 783,363 | | | | 7,026,766 | | |
| | | | 12,507,074 | | |
Building Products — 2.5% | |
AZEK Co., Inc. (The)* | | | 147,059 | | | | 3,852,946 | | |
Gibraltar Industries, Inc.* | | | 83,583 | | | | 5,086,861 | | |
First Eagle Funds | Annual Report | October 31, 2023
104
First Eagle Small Cap Opportunity Fund | Schedule of Investments | October 31, 2023
Investments | | Shares | | Value ($) | |
Building Products — 2.5% (continued) | |
Insteel Industries, Inc. | | | 209,912 | | | | 5,858,644 | | |
Janus International Group, Inc.* | | | 451,480 | | | | 4,225,853 | | |
JELD-WEN Holding, Inc.* | | | 185,438 | | | | 2,101,013 | | |
Masonite International Corp.* | | | 28,266 | | | | 2,236,971 | | |
PGT Innovations, Inc.* | | | 109,993 | | | | 3,293,190 | | |
Quanex Building Products Corp. | | | 228,191 | | | | 6,126,928 | | |
| | | | 32,782,406 | | |
Capital Markets — 1.2% | |
B Riley Financial, Inc. | | | 72,543 | | | | 2,626,782 | | |
Evercore, Inc., Class A | | | 52,627 | | | | 6,850,983 | | |
Moelis & Co., Class A | | | 89,723 | | | | 3,736,066 | | |
Perella Weinberg Partners | | | 208,189 | | | | 2,042,334 | | |
| | | | 15,256,165 | | |
Chemicals — 3.8% | |
AdvanSix, Inc. | | | 292,471 | | | | 8,057,576 | | |
Ashland, Inc. | | | 35,507 | | | | 2,720,901 | | |
Huntsman Corp. | | | 407,776 | | | | 9,513,414 | | |
Ingevity Corp.* | | | 88,071 | | | | 3,547,500 | | |
Intrepid Potash, Inc.* | | | 333,813 | | | | 6,639,541 | | |
LSB Industries, Inc.* | | | 882,772 | | | | 8,042,053 | | |
Mativ Holdings, Inc. | | | 188,119 | | | | 2,464,359 | | |
Minerals Technologies, Inc. | | | 52,434 | | | | 2,834,582 | | |
Stepan Co. | | | 4,673 | | | | 349,540 | | |
Tronox Holdings plc, Class A | | | 584,627 | | | | 6,249,663 | | |
| | | | 50,419,129 | | |
Commercial Services & Supplies — 2.2% | |
ARC Document Solutions, Inc. | | | 92,937 | | | | 258,365 | | |
CECO Environmental Corp.* | | | 415,741 | | | | 6,726,689 | | |
Performant Financial Corp.* | | | 1,937,139 | | | | 4,513,534 | | |
Quest Resource Holding Corp.* | | | 336,805 | | | | 2,441,836 | | |
Stericycle, Inc.* | | | 196,338 | | | | 8,096,979 | | |
VSE Corp. | | | 117,593 | | | | 6,326,504 | | |
| | | | 28,363,907 | | |
First Eagle Funds | Annual Report | October 31, 2023
105
First Eagle Small Cap Opportunity Fund | Schedule of Investments | October 31, 2023
Investments | | Shares | | Value ($) | |
Communications Equipment — 2.5% | |
ADTRAN Holdings, Inc. | | | 1,106,961 | | | | 7,272,734 | | |
Aviat Networks, Inc.* | | | 181,294 | | | | 4,840,550 | | |
Ceragon Networks Ltd. (Israel)* | | | 500,514 | | | | 850,874 | | |
Comtech Telecommunications Corp. | | | 401,535 | | | | 4,898,727 | | |
Digi International, Inc.* | | | 169,556 | | | | 4,269,420 | | |
Lantronix, Inc.* | | | 475,760 | | | | 2,174,223 | | |
NETGEAR, Inc.* | | | 9,346 | | | | 118,133 | | |
NetScout Systems, Inc.* | | | 126,954 | | | | 2,771,406 | | |
PCTEL, Inc. | | | 349,971 | | | | 2,397,301 | | |
Viavi Solutions, Inc.* | | | 429,118 | | | | 3,338,538 | | |
| | | | 32,931,906 | | |
Construction & Engineering — 1.2% | |
Ameresco, Inc., Class A* | | | 282,431 | | | | 7,385,571 | | |
Arcosa, Inc. | | | 91,457 | | | | 6,316,935 | | |
Orion Group Holdings, Inc.* | | | 497,325 | | | | 2,387,160 | | |
| | | | 16,089,666 | | |
Consumer Staples Distribution & Retail — 0.7% | |
Chefs' Warehouse, Inc. (The)* | | | 424,197 | | | | 8,072,469 | | |
Natural Grocers by Vitamin Cottage, Inc. | | | 91,795 | | | | 1,153,863 | | |
| | | | 9,226,332 | | |
Containers & Packaging — 0.6% | |
Sealed Air Corp. | | | 247,370 | | | | 7,616,522 | | |
Diversified Consumer Services — 0.7% | |
Chegg, Inc.* | | | 123,841 | | | | 932,523 | | |
Lincoln Educational Services Corp.* | | | 460,145 | | | | 3,934,240 | | |
Regis Corp.* | | | 1,049,553 | | | | 612,939 | | |
Universal Technical Institute, Inc.* | | | 400,153 | | | | 3,493,335 | | |
| | | | 8,973,037 | | |
Diversified REITs — 0.8% | |
Alexander & Baldwin, Inc., REIT | | | 158,507 | | | | 2,504,411 | | |
Armada Hoffler Properties, Inc., REIT | | | 783,540 | | | | 7,804,058 | | |
| | | | 10,308,469 | | |
First Eagle Funds | Annual Report | October 31, 2023
106
First Eagle Small Cap Opportunity Fund | Schedule of Investments | October 31, 2023
Investments | | Shares | | Value ($) | |
Electrical Equipment — 1.0% | |
EnerSys | | | 46,956 | | | | 4,018,494 | | |
Generac Holdings, Inc.* | | | 60,924 | | | | 5,121,881 | | |
GrafTech International Ltd. | | | 414,236 | | | | 1,429,114 | | |
LSI Industries, Inc. | | | 194,116 | | | | 2,888,446 | | |
Orion Energy Systems, Inc.* | | | 328,368 | | | | 328,368 | | |
| | | | 13,786,303 | | |
Electronic Equipment, Instruments & Components — 4.8% | |
Advanced Energy Industries, Inc. | | | 83,901 | | | | 7,321,201 | | |
Airgain, Inc.* | | | 409,766 | | | | 1,356,325 | | |
Avnet, Inc. | | | 152,226 | | | | 7,052,631 | | |
Belden, Inc. | | | 72,175 | | | | 5,117,208 | | |
Benchmark Electronics, Inc. | | | 259,501 | | | | 6,282,519 | | |
Coherent Corp.* | | | 158,425 | | | | 4,689,380 | | |
Fabrinet (Thailand)* | | | 6,914 | | | | 1,071,670 | | |
Iteris, Inc.* | | | 423,553 | | | | 1,872,104 | | |
Kimball Electronics, Inc.* | | | 211,714 | | | | 5,546,907 | | |
Plexus Corp.* | | | 67,746 | | | | 6,660,787 | | |
Sanmina Corp.* | | | 181,548 | | | | 9,235,347 | | |
SmartRent, Inc.* | | | 562,712 | | | | 1,356,136 | | |
TTM Technologies, Inc.* | | | 495,741 | | | | 5,696,064 | | |
| | | | 63,258,279 | | |
Energy Equipment & Services — 2.5% | |
Bristow Group, Inc.* | | | 21,962 | | | | 574,087 | | |
DMC Global, Inc.* | | | 106,596 | | | | 2,019,994 | | |
Helix Energy Solutions Group, Inc.* | | | 264,570 | | | | 2,592,786 | | |
Helmerich & Payne, Inc. | | | 55,260 | | | | 2,186,638 | | |
Liberty Energy, Inc., Class A | | | 151,334 | | | | 2,981,280 | | |
Newpark Resources, Inc * | | | 75,062 | | | | 519,429 | | |
NOV, Inc. | | | 167,788 | | | | 3,349,048 | | |
Oil States International, Inc.* | | | 770,496 | | | | 5,593,801 | | |
Patterson-UTI Energy, Inc. | | | 128,160 | | | | 1,627,632 | | |
ProPetro Holding Corp.* | | | 524,449 | | | | 5,496,225 | | |
First Eagle Funds | Annual Report | October 31, 2023
107
First Eagle Small Cap Opportunity Fund | Schedule of Investments | October 31, 2023
Investments | | Shares | | Value ($) | |
Energy Equipment & Services — 2.5% (continued) | |
RPC, Inc. | | | 253,074 | | | | 2,105,576 | | |
US Silica Holdings, Inc.* | | | 266,611 | | | | 3,217,995 | | |
| | | | 32,264,491 | | |
Financial Services — 2.0% | |
International Money Express, Inc.* | | | 170,827 | | | | 2,726,399 | | |
MGIC Investment Corp. | | | 503,721 | | | | 8,482,662 | | |
NMI Holdings, Inc., Class A* | | | 296,873 | | | | 8,119,476 | | |
Radian Group, Inc. | | | 299,141 | | | | 7,580,233 | | |
| | | | 26,908,770 | | |
Food Products — 1.5% | |
Hain Celestial Group, Inc. (The)* | | | 542,078 | | | | 5,989,962 | | |
Ingredion, Inc. | | | 80,730 | | | | 7,554,714 | | |
Real Good Food Co., Inc. (The), Class A* | | | 330,786 | | | | 774,039 | | |
Utz Brands, Inc. | | | 400,201 | | | | 4,878,450 | | |
| | | | 19,197,165 | | |
Ground Transportation — 1.1% | |
Daseke, Inc.* | | | 788,533 | | | | 3,501,086 | | |
Heartland Express, Inc. | | | 430,671 | | | | 5,021,624 | | |
Werner Enterprises, Inc. | | | 163,080 | | | | 5,923,066 | | |
| | | | 14,445,776 | | |
Health Care Equipment & Supplies — 3.1% | |
Accuray, Inc.* | | | 859,996 | | | | 2,270,389 | | |
Artivion, Inc.* | | | 496,419 | | | | 6,324,378 | | |
Embecta Corp. | | | 466,010 | | | | 7,046,071 | | |
Enovis Corp.* | | | 171,903 | | | | 7,890,348 | | |
Neuronetics, Inc.* | | | 719,563 | | | | 827,498 | | |
QuidelOrtho Corp.* | | | 159,201 | | | | 9,723,997 | | |
Varex Imaging Corp.* | | | 286,809 | | | | 5,176,902 | | |
Zimvie, Inc.* | | | 270,715 | | | | 1,911,248 | | |
| | | | 41,170,831 | | |
Health Care Providers & Services — 5.5% | |
Acadia Healthcare Co., Inc.* | | | 127,496 | | | | 9,372,231 | | |
AdaptHealth Corp.* | | | 382,536 | | | | 2,803,989 | | |
First Eagle Funds | Annual Report | October 31, 2023
108
First Eagle Small Cap Opportunity Fund | Schedule of Investments | October 31, 2023
Investments | | Shares | | Value ($) | |
Health Care Providers & Services — 5.5% (continued) | |
Addus HomeCare Corp.* | | | 43,119 | | | | 3,402,089 | | |
Amedisys, Inc.* | | | 62,689 | | | | 5,735,417 | | |
Brookdale Senior Living, Inc.* | | | 902,236 | | | | 3,527,743 | | |
Community Health Systems, Inc.* | | | 1,462,860 | | | | 3,130,520 | | |
InfuSystem Holdings, Inc.* | | | 450,844 | | | | 4,319,085 | | |
Option Care Health, Inc.* | | | 98,864 | | | | 2,741,499 | | |
Owens & Minor, Inc.* | | | 225,584 | | | | 3,232,619 | | |
Patterson Cos., Inc. | | | 195,642 | | | | 5,959,255 | | |
Pennant Group, Inc. (The)* | | | 364,996 | | | | 3,967,506 | | |
Quipt Home Medical Corp.* | | | 590,498 | | | | 2,793,056 | | |
RadNet, Inc.* | | | 57,913 | | | | 1,561,334 | | |
Select Medical Holdings Corp. | | | 154,526 | | | | 3,512,376 | | |
Surgery Partners, Inc.* | | | 254,343 | | | | 5,882,954 | | |
Tenet Healthcare Corp.* | | | 179,204 | | | | 9,623,255 | | |
| | | | 71,564,928 | | |
Health Care REITs — 0.6% | |
Physicians Realty Trust, REIT | | | 737,025 | | | | 8,004,091 | | |
Health Care Technology — 1.2% | |
HealthStream, Inc. | | | 338,096 | | | | 8,587,638 | | |
iCAD, Inc.* | | | 618,456 | | | | 828,731 | | |
NextGen Healthcare, Inc.* | | | 246,256 | | | | 5,890,444 | | |
| | | | 15,306,813 | | |
Hotels, Restaurants & Leisure — 4.7% | |
BJ's Restaurants, Inc. | | | 176,577 | | | | 4,541,560 | | |
Bloomin' Brands, Inc. | | | 112,627 | | | | 2,628,714 | | |
Cheesecake Factory, Inc. (The) | | | 297,182 | | | | 9,233,445 | | |
Chuy's Holdings, Inc.* | | | 234,128 | | | | 7,880,749 | | |
Cracker Barrel Old Country Store, Inc. | | | 97,973 | | | | 6,501,488 | | |
Denny's Corp.* | | | 800,293 | | | | 6,898,526 | | |
Dine Brands Global, Inc. | | | 161,735 | | | | 7,971,918 | | |
ONE Group Hospitality, Inc. (The)* | | | 697,186 | | | | 3,074,590 | | |
Potbelly Corp.* | | | 726,506 | | | | 6,393,253 | | |
Red Robin Gourmet Burgers, Inc.* | | | 764,990 | | | | 6,188,769 | | |
| | | | 61,313,012 | | |
First Eagle Funds | Annual Report | October 31, 2023
109
First Eagle Small Cap Opportunity Fund | Schedule of Investments | October 31, 2023
Investments | | Shares | | Value ($) | |
Household Durables — 3.1% | |
Beazer Homes USA, Inc.* | | | 180,023 | | | | 4,354,756 | | |
Cavco Industries, Inc.* | | | 8,405 | | | | 2,097,132 | | |
Century Communities, Inc. | | | 56,567 | | | | 3,478,870 | | |
Dixie Group, Inc. (The)* | | | 213,275 | | | | 113,249 | | |
Helen of Troy Ltd.* | | | 61,017 | | | | 5,999,191 | | |
Installed Building Products, Inc. | | | 33,519 | | | | 3,743,067 | | |
LGI Homes, Inc.* | | | 46,242 | | | | 4,370,331 | | |
MDC Holdings, Inc. | | | 78,223 | | | | 2,968,563 | | |
Skyline Champion Corp.* | | | 47,420 | | | | 2,780,235 | | |
Snap One Holdings Corp.* | | | 161,469 | | | | 1,209,403 | | |
Sonos, Inc.* | | | 369,551 | | | | 3,983,760 | | |
Toll Brothers, Inc. | | | 18,961 | | | | 1,340,732 | | |
Universal Electronics, Inc.* | | | 153,893 | | | | 1,208,060 | | |
Vizio Holding Corp., Class A* | | | 577,523 | | | | 2,939,592 | | |
| | | | 40,586,941 | | |
Insurance — 2.9% | |
Citizens, Inc.* | | | 104,386 | | | | 312,114 | | |
First American Financial Corp. | | | 138,746 | | | | 7,137,094 | | |
Kemper Corp. | | | 172,631 | | | | 6,884,524 | | |
Lincoln National Corp. | | | 145,884 | | | | 3,175,895 | | |
Old Republic International Corp. | | | 377,006 | | | | 10,322,425 | | |
Stewart Information Services Corp. | | | 242,697 | | | | 10,598,578 | | |
| | | | 38,430,630 | | |
Interactive Media & Services — 0.8% | |
Cars.com, Inc.* | | | 199,695 | | | | 3,041,355 | | |
DHI Group, Inc.* | | | 89,486 | | | | 245,192 | | |
EverQuote, Inc., Class A* | | | 410,157 | | | | 3,523,249 | | |
QuinStreet, Inc.* | | | 332,653 | | | | 3,762,305 | | |
| | | | 10,572,101 | | |
IT Services — 0.3% | |
Backblaze, Inc., Class A* | | | 501,719 | | | | 2,613,956 | | |
Squarespace, Inc., Class A* | | | 26,628 | | | | 756,501 | | |
| | | | 3,370,457 | | |
First Eagle Funds | Annual Report | October 31, 2023
110
First Eagle Small Cap Opportunity Fund | Schedule of Investments | October 31, 2023
Investments | | Shares | | Value ($) | |
Leisure Products — 0.4% | |
Clarus Corp. | | | 348,344 | | | | 2,016,912 | | |
Topgolf Callaway Brands Corp.* | | | 239,829 | | | | 2,930,710 | | |
| | | | 4,947,622 | | |
Machinery — 4.0% | |
Astec Industries, Inc. | | | 163,729 | | | | 6,555,709 | | |
Barnes Group, Inc. | | | 312,408 | | | | 6,494,962 | | |
Columbus McKinnon Corp. | | | 147,132 | | | | 4,497,825 | | |
EnPro Industries, Inc. | | | 56,501 | | | | 6,275,001 | | |
Gencor Industries, Inc.* | | | 59,592 | | | | 846,207 | | |
Graham Corp.* | | | 245,358 | | | | 3,825,131 | | |
John Bean Technologies Corp. | | | 62,673 | | | | 6,519,246 | | |
Luxfer Holdings plc (United Kingdom) | | | 211,082 | | | | 1,745,648 | | |
Manitex International, Inc.* | | | 276,030 | | | | 1,106,880 | | |
Park-Ohio Holdings Corp. | | | 96,841 | | | | 2,196,354 | | |
Shyft Group, Inc. (The) | | | 297,404 | | | | 3,265,496 | | |
Trinity Industries, Inc. | | | 419,244 | | | | 8,732,853 | | |
| | | | 52,061,312 | | |
Media — 0.0% (a) | |
Marchex, Inc., Class B* | | | 408,647 | | | | 535,328 | | |
Metals & Mining — 3.5% | |
Carpenter Technology Corp. | | | 123,377 | | | | 7,738,205 | | |
Century Aluminum Co.* | | | 811,580 | | | | 5,364,544 | | |
Coeur Mining, Inc.* | | | 1,856,825 | | | | 4,660,631 | | |
Commercial Metals Co. | | | 116,997 | | | | 4,947,803 | | |
Ferroglobe plc* | | | 1,259,905 | | | | 5,732,568 | | |
Haynes International, Inc. | | | 149,945 | | | | 6,451,384 | | |
Hecla Mining Co. | | | 949,878 | | | | 3,866,003 | | |
Kaiser Aluminum Corp. | | | 114,350 | | | | 6,495,080 | | |
| | | | 45,256,218 | | |
Multi-Utilities — 0.6% | |
Black Hills Corp. | | | 157,086 | | | | 7,595,108 | | |
Oil, Gas & Consumable Fuels — 4.4% | |
Callon Petroleum Co.* | | | 270,784 | | | | 10,113,782 | | |
Dorian LPG Ltd. | | | 203,424 | | | | 6,503,465 | | |
First Eagle Funds | Annual Report | October 31, 2023
111
First Eagle Small Cap Opportunity Fund | Schedule of Investments | October 31, 2023
Investments | | Shares | | Value ($) | |
Oil, Gas & Consumable Fuels — 4.4% (continued) | |
Earthstone Energy, Inc., Class A* | | | 320,602 | | | | 6,787,144 | | |
Matador Resources Co. | | | 171,166 | | | | 10,559,231 | | |
Navigator Holdings Ltd. | | | 461,133 | | | | 6,478,919 | | |
PBF Energy, Inc., Class A | | | 108,819 | | | | 5,172,167 | | |
Permian Resources Corp. | | | 86,469 | | | | 1,259,853 | | |
Riley Exploration Permian, Inc. | | | 11,904 | | | | 376,762 | | |
SM Energy Co. | | | 78,761 | | | | 3,175,644 | | |
Vertex Energy, Inc.* | | | 704,987 | | | | 3,038,494 | | |
Vital Energy, Inc.* | | | 80,825 | | | | 4,044,483 | | |
| | | | 57,509,944 | | |
Paper & Forest Products — 0.7% | |
Louisiana-Pacific Corp. | | | 187,429 | | | | 9,611,359 | | |
Passenger Airlines — 1.0% | |
Alaska Air Group, Inc.* | | | 261,711 | | | | 8,277,919 | | |
Allegiant Travel Co. | | | 26,907 | | | | 1,792,544 | | |
JetBlue Airways Corp.* | | | 668,942 | | | | 2,515,222 | | |
| | | | 12,585,685 | | |
Pharmaceuticals — 0.3% | |
Pacira BioSciences, Inc.* | | | 107,540 | | | | 3,039,081 | | |
Societal CDMO, Inc.* | | | 1,509,197 | | | | 520,069 | | |
| | | | 3,559,150 | | |
Professional Services — 0.3% | |
Asure Software, Inc.* | | | 109,530 | | | | 926,624 | | |
GEE Group, Inc.* | | | 928,552 | | | | 498,633 | | |
Heidrick & Struggles International, Inc. | | | 110,107 | | | | 2,680,004 | | |
| | | | 4,105,261 | | |
Retail REITs — 0.9% | |
Macerich Co. (The), REIT | | | 165,395 | | | | 1,607,640 | | |
Tanger Factory Outlet Centers, Inc., REIT | | | 63,927 | | | | 1,441,554 | | |
Whitestone REIT, REIT | | | 875,813 | | | | 8,714,339 | | |
| | | | 11,763,533 | | |
Semiconductors & Semiconductor Equipment — 6.3% | |
Alpha & Omega Semiconductor Ltd.* | | | 307,007 | | | | 7,282,206 | | |
Amkor Technology, Inc. | | | 363,647 | | | | 7,585,676 | | |
First Eagle Funds | Annual Report | October 31, 2023
112
First Eagle Small Cap Opportunity Fund | Schedule of Investments | October 31, 2023
Investments | | Shares | | Value ($) | |
Semiconductors & Semiconductor Equipment — 6.3% (continued) | |
Amtech Systems, Inc.* | | | 547,911 | | | | 3,925,782 | | |
Axcelis Technologies, Inc.* | | | 6,729 | | | | 857,947 | | |
Cohu, Inc.* | | | 150,240 | | | | 4,528,234 | | |
Diodes, Inc.* | | | 83,973 | | | | 5,464,963 | | |
Everspin Technologies, Inc.* | | | 166,856 | | | | 1,613,497 | | |
FormFactor, Inc.* | | | 129,727 | | | | 4,395,151 | | |
Ichor Holdings Ltd.* | | | 319,829 | | | | 7,759,052 | | |
inTEST Corp.* | | | 366,458 | | | | 4,738,302 | | |
Kulicke & Soffa Industries, Inc. (Singapore) | | | 152,258 | | | | 6,335,455 | | |
MKS Instruments, Inc. | | | 112,919 | | | | 7,414,262 | | |
Onto Innovation, Inc.* | | | 35,518 | | | | 3,991,158 | | |
SMART Global Holdings, Inc.* | | | 262,721 | | | | 3,599,278 | | |
Ultra Clean Holdings, Inc.* | | | 310,354 | | | | 7,405,046 | | |
Veeco Instruments, Inc.* | | | 240,106 | | | | 5,748,138 | | |
| | | | 82,644,147 | | |
Software — 1.6% | |
Everbridge, Inc.* | | | 241,149 | | | | 4,970,081 | | |
SecureWorks Corp., Class A* | | | 799,344 | | | | 4,700,143 | | |
Synchronoss Technologies, Inc.* | | | 890,045 | | | | 409,421 | | |
Upland Software, Inc.* | | | 661,528 | | | | 2,209,504 | | |
Yext, Inc.* | | | 542,217 | | | | 3,269,568 | | |
Zeta Global Holdings Corp., Class A* | | | 618,488 | | | | 4,824,206 | | |
| | | | 20,382,923 | | |
Specialized REITs — 0.1% | |
Outfront Media, Inc., REIT | | | 98,502 | | | | 961,379 | | |
Specialty Retail — 2.1% | |
CarParts.com, Inc.* | | | 689,592 | | | | 1,951,545 | | |
Citi Trends, Inc.* | | | 96,561 | | | | 2,327,120 | | |
Container Store Group, Inc. (The)* | | | 738,995 | | | | 1,367,141 | | |
Lithia Motors, Inc., Class A | | | 10,445 | | | | 2,529,884 | | |
RH* | | | 6,664 | | | | 1,452,485 | | |
Shoe Carnival, Inc. | | | 335,476 | | | | 7,675,691 | | |
Tile Shop Holdings, Inc.* | | | 294,806 | | | | 1,618,485 | | |
First Eagle Funds | Annual Report | October 31, 2023
113
First Eagle Small Cap Opportunity Fund | Schedule of Investments | October 31, 2023
Investments | | Shares | | Value ($) | |
Specialty Retail — 2.1% (continued) | |
Tilly's, Inc., Class A* | | | 317,509 | | | | 2,571,823 | | |
Zumiez, Inc.* | | | 372,496 | | | | 6,120,109 | | |
| | | | 27,614,283 | | |
Textiles, Apparel & Luxury Goods — 0.8% | |
Steven Madden Ltd. | | | 204,166 | | | | 6,694,603 | | |
Unifi, Inc.* | | | 609,151 | | | | 4,093,495 | | |
| | | | 10,788,098 | | |
Trading Companies & Distributors — 3.7% | |
Air Lease Corp. | | | 302,896 | | | | 10,489,289 | | |
FTAI Aviation Ltd. | | | 259,897 | | | | 9,774,726 | | |
H&E Equipment Services, Inc. | | | 209,450 | | | | 8,528,804 | | |
Herc Holdings, Inc. | | | 85,874 | | | | 9,170,484 | | |
NOW, Inc.* | | | 232,047 | | | | 2,557,158 | | |
Titan Machinery, Inc.* | | | 178,349 | | | | 4,430,189 | | |
WESCO International, Inc. | | | 32,856 | | | | 4,212,139 | | |
| | | | 49,162,789 | | |
Total Common Stocks
(Cost $1,301,355,106) | | | 1,198,328,408 | | |
| | | Number of Rights | | | |
Rights — 0.0% | |
IT Services — 0.0% | |
Flexion, Inc., CVR*‡ (b)
(Cost $27,801) | | | 44,841 | | | | — | | |
| | | Shares | | | |
Short-Term Investments — 8.3% | |
Investment Companies — 8.3% | |
JP Morgan U.S. Government Money Market Fund,
Capital Shares 5.37% (d) (Cost $108,206,140) | | | 108,206,140 | | | | 108,206,140 | | |
Total Investments — 99.8%
(Cost $1,409,589,047) | | | 1,306,534,548 | | |
Other Assets Less Liabilities — 0.2% | | | 3,162,435 | | |
Net Assets — 100.0% | | | 1,309,696,983 | | |
First Eagle Funds | Annual Report | October 31, 2023
114
First Eagle Small Cap Opportunity Fund | Schedule of Investments | October 31, 2023
* Non-income producing security.
‡ Value determined using significant unobservable inputs.
(a) Represents less than 0.05% of net assets.
(b) Security fair valued as of October 31, 2023 in accordance with procedures approved by the Board of Trustees. Total value of all such securities at October 31, 2023 amounted to $0, which represents approximately 0.00% of net assets of the Fund.
(d) Represents 7-day effective yield as of October 31, 2023.
Abbreviations
CVR — Contingent Value Rights
REIT — Real Estate Investment Trust
As of October 31, 2023, the gross unrealized appreciation (depreciation) of investments based on the aggregate cost of investment securities and derivative instruments, if applicable, for federal income tax purposes was as follows:
Aggregate gross unrealized appreciation | | $ | 78,763,720 | | |
Aggregate gross unrealized depreciation | | | (192,318,853 | ) | |
Net unrealized depreciation | | $ | (113,555,133 | ) | |
Federal income tax cost | | $ | 1,420,089,681 | | |
See Notes to Financial Statements.
First Eagle Funds | Annual Report | October 31, 2023
115
First Eagle U.S. Smid Cap Opportunity Fund
Data as of October 31, 2023 (unaudited)
Investment Objective
The First Eagle U.S. Smid Cap Opportunity Fund seeks long-term growth of capital.
Average Annual Returns^ (%) | | | | One Year | | Since
Inception
(8/15/22) | |
First Eagle U.S. Smid Cap Opportunity Fund | | Class I | | | -2.60 | | | | -10.47 | | |
Russell 2500TM Value Index | | | | | -4.94 | | | | -10.74 | | |
Russell 2500TM Index | | | | | -4.63 | | | | -10.76 | | |
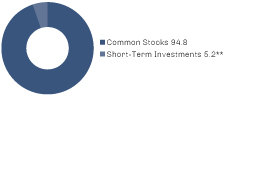
Sectors* (%)
Industrials | | | 21.4 | | |
Health Care | | | 15.6 | | |
Consumer Discretionary | | | 14.9 | | |
Information Technology | | | 12.6 | | |
Financials | | | 8.9 | | |
Energy | | | 8.4 | | |
Materials | | | 6.9 | | |
Consumer Staples | | | 6.1 | | |
Short-Term Investments | | | 5.2 | | |
^ Performance figures reflect certain fee waivers and/or expense limitations, without which returns may have been lower.
* Asset Allocation and Sectors percentages are based on total investments in the portfolio.
** Includes short-term commercial paper (0.0% of total investments) that settles in 90 days or less, long-term commercial paper (0.0% of total investments) that settles in 91 days or greater and other short-term investments (5.2% of total investments), such as U.S. treasury bills or money market funds.
The Fund's portfolio composition is subject to change at any time.
First Eagle Funds | Annual Report | October 31, 2023
116
First Eagle U.S. Smid Cap Opportunity Fund | Fund Overview
Growth of a $1,000,000 Initial Investment
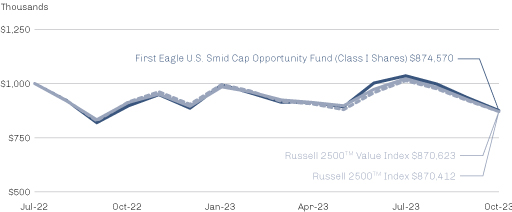
Performance data quoted herein represents past performance and should not be considered indicative of future results. Performance data quoted herein does not reflect the deduction of taxes that a shareholder would pay on Fund distributions or the sale of Fund shares. The average annual returns shown above are historical and reflect changes in share price, reinvested dividends and are net of expenses.
Class I Shares require $1 million minimum investment and are offered without a sales charge. If a sales charge was included values would be lower.
The Russell 2500TM Value Index is a widely followed, unmanaged index that measures the performance of the small- to mid-cap value segment of the U.S. equity universe, commonly referred to as "smid" cap. It includes those Russell 2500TM companies with relatively low price-to-book ratios and lower forecasted growth values. The Russell 2500TM Value Index is completely reconstituted annually. One cannot invest directly in an index.
The Russell 2500TM Index is a widely followed, unmanaged index that measures the performance of the smid cap segment of the U.S. equity universe. The Russell 2500TM Index is a subset of the Russell 3000® Index. It includes approximately 2,500 of the smallest securities based on a combination of their market cap and current index membership. The Russell 2500TM Index is completely reconstituted annually. One cannot invest directly in an index.
Top 10 Holdings* (%)
Curtiss-Wright Corp. (Aerospace & Defense, United States) | | | 2.6 | | |
Cardinal Health, Inc. (Health Care Providers & Services, United States) | | | 2.6 | | |
Matador Resources Co. (Oil, Gas & Consumable Fuels, United States) | | | 2.4 | | |
Chesapeake Energy Corp. (Oil, Gas & Consumable Fuels, United States) | | | 2.2 | | |
XPO, Inc. (Ground Transportation, United States) | | | 2.2 | | |
Performance Food Group Co. (Consumer Staples Distribution & Retail, United States) | | | 2.2 | | |
HF Sinclair Corp. (Oil, Gas & Consumable Fuels, United States) | | | 2.1 | | |
Tenet Healthcare Corp. (Health Care Providers & Services, United States) | | | 2.0 | | |
Air Lease Corp. (Trading Companies & Distributors, United States) | | | 1.9 | | |
Westlake Corp. (Chemicals, United States) | | | 1.9 | | |
Total | | | 22.1 | | |
* Holdings in cash, short-term commercial paper, long-term commercial paper and other short-term cash equivalents have been excluded.
Percentages are based on total net assets.
First Eagle Funds | Annual Report | October 31, 2023
117
First Eagle U.S. Smid Cap Opportunity Fund | Schedule of Investments | October 31, 2023
Investments | | Shares | | Value ($) | |
Common Stocks — 95.7% | |
Aerospace & Defense — 4.0% | |
AAR Corp* | | | 6,768 | | | | 401,748 | | |
Curtiss-Wright Corp. | | | 3,596 | | | | 714,921 | | |
| | | | 1,116,669 | | |
Air Freight & Logistics — 1.2% | |
GXO Logistics, Inc.* | | | 6,548 | | | | 330,740 | | |
Automobile Components — 1.5% | |
Goodyear Tire & Rubber Co. (The)* | | | 33,899 | | | | 403,398 | | |
Biotechnology — 2.1% | |
CareDx, Inc.* | | | 17,115 | | | | 92,592 | | |
Exelixis, Inc.* | | | 24,460 | | | | 503,632 | | |
| | | | 596,224 | | |
Building Products — 2.2% | |
AZEK Co., Inc. (The)* | | | 6,250 | | | | 163,750 | | |
Lennox International, Inc. | | | 1,237 | | | | 458,358 | | |
| | | | 622,108 | | |
Capital Markets — 2.9% | |
Evercore, Inc., Class A | | | 3,790 | | | | 493,382 | | |
Raymond James Financial, Inc. | | | 3,155 | | | | 301,113 | | |
| | | | 794,495 | | |
Chemicals — 4.3% | |
FMC Corp. | | | 4,052 | | | | 215,566 | | |
Huntsman Corp. | | | 11,117 | | | | 259,360 | | |
International Flavors & Fragrances, Inc. | | | 3,027 | | | | 206,895 | | |
Westlake Corp. | | | 4,502 | | | | 519,351 | | |
| | | | 1,201,172 | | |
Construction & Engineering — 1.4% | |
Ameresco, Inc., Class A* | | | 14,463 | | | | 378,208 | | |
Consumer Staples Distribution & Retail — 4.5% | |
Casey's General Stores, Inc. | | | 1,773 | | | | 482,097 | | |
Chefs' Warehouse, Inc. (The)* | | | 8,175 | | | | 155,570 | | |
First Eagle Funds | Annual Report | October 31, 2023
118
First Eagle U.S. Smid Cap Opportunity Fund | Schedule of Investments | October 31, 2023
Investments | | Shares | | Value ($) | |
Consumer Staples Distribution & Retail — 4.5% (continued) | |
Performance Food Group Co.* | | | 10,450 | | | | 603,592 | | |
| | | | 1,241,259 | | |
Containers & Packaging — 1.0% | |
Sealed Air Corp. | | | 9,062 | | | | 279,019 | | |
Electrical Equipment — 2.8% | |
EnerSys | | | 6,021 | | | | 515,277 | | |
Generac Holdings, Inc.* | | | 3,249 | | | | 273,144 | | |
| | | | 788,421 | | |
Electronic Equipment, Instruments & Components — 4.4% | |
Avnet, Inc. | | | 6,328 | | | | 293,176 | | |
Belden, Inc. | | | 4,325 | | | | 306,642 | | |
Coherent Corp.* | | | 5,756 | | | | 170,378 | | |
Flex Ltd.* | | | 11,848 | | | | 304,731 | | |
Trimble, Inc.* | | | 3,053 | | | | 143,888 | | |
| | | | 1,218,815 | | |
Financial Services — 3.7% | |
MGIC Investment Corp. | | | 15,325 | | | | 258,073 | | |
Radian Group, Inc. | | | 20,031 | | | | 507,586 | | |
Rocket Cos., Inc., Class A* | | | 34,621 | | | | 255,849 | | |
| | | | 1,021,508 | | |
Food Products — 1.6% | |
Ingredion, Inc. | | | 4,862 | | | | 454,986 | | |
Ground Transportation — 2.8% | |
Knight-Swift Transportation Holdings, Inc. | | | 3,179 | | | | 155,421 | | |
XPO, Inc.* | | | 8,117 | | | | 615,350 | | |
| | | | 770,771 | | |
Health Care Equipment & Supplies — 3.1% | |
Enovis Corp.* | | | 2,708 | | | | 124,297 | | |
QuidelOrtho Corp.* | | | 4,050 | | | | 247,374 | | |
Zimmer Biomet Holdings, Inc. | | | 4,627 | | | | 483,105 | | |
| | | | 854,776 | | |
First Eagle Funds | Annual Report | October 31, 2023
119
First Eagle U.S. Smid Cap Opportunity Fund | Schedule of Investments | October 31, 2023
Investments | | Shares | | Value ($) | |
Health Care Providers & Services — 7.9% | |
Amedisys, Inc * | | | 4,720 | | | | 431,833 | | |
Cardinal Health, Inc. | | | 7,829 | | | | 712,439 | | |
Quest Diagnostics, Inc. | | | 3,735 | | | | 485,924 | | |
Tenet Healthcare Corp.* | | | 10,376 | | | | 557,191 | | |
| | | | 2,187,387 | | |
Hotels, Restaurants & Leisure — 6.7% | |
Aramark | | | 11,485 | | | | 309,291 | | |
Cheesecake Factory, Inc. (The) | | | 14,115 | | | | 438,553 | | |
Chuy's Holdings, Inc.* | | | 10,133 | | | | 341,077 | | |
Cracker Barrel Old Country Store, Inc. | | | 4,477 | | | | 297,093 | | |
Denny's Corp.* | | | 30,848 | | | | 265,910 | | |
Vail Resorts, Inc. | | | 911 | | | | 193,360 | | |
| | | | 1,845,284 | | |
Household Durables — 3.0% | |
Beazer Homes USA, Inc * | | | 9,812 | | | | 237,352 | | |
LGI Homes, Inc * | | | 2,489 | | | | 235,235 | | |
Skyline Champion Corp.* | | | 1,395 | | | | 81,789 | | |
Toll Brothers, Inc. | | | 3,891 | | | | 275,133 | | |
| | | | 829,509 | | |
Insurance — 2.5% | |
First American Financial Corp. | | | 3,908 | | | | 201,027 | | |
Old Republic International Corp. | | | 18,060 | | | | 494,483 | | |
| | | | 695,510 | | |
IT Services — 0.7% | |
Amdocs Ltd. | | | 2,376 | | | | 190,460 | | |
Leisure Products — 0.4% | |
Topgolf Callaway Brands Corp.* | | | 8,696 | | | | 106,265 | | |
Life Sciences Tools & Services — 1.9% | |
Avantor, Inc.* | | | 15,414 | | | | 268,666 | | |
Bio-Rad Laboratories, Inc., Class A* | | | 216 | | | | 59,460 | | |
Revvity, Inc. | | | 2,494 | | | | 206,628 | | |
| | | | 534,754 | | |
First Eagle Funds | Annual Report | October 31, 2023
120
First Eagle U.S. Smid Cap Opportunity Fund | Schedule of Investments | October 31, 2023
Investments | | Shares | | Value ($) | |
Machinery — 5.2% | |
Donaldson Co., Inc. | | | 8,121 | | | | 468,257 | | |
Dover Corp. | | | 3,726 | | | | 484,193 | | |
Ingersoll Rand, Inc. | | | 8,179 | | | | 496,302 | | |
| | | | 1,448,752 | | |
Metals & Mining — 1.7% | |
Cleveland-Cliffs, Inc.* | | | 27,653 | | | | 464,017 | | |
Oil, Gas & Consumable Fuels — 8.5% | |
Chesapeake Energy Corp. | | | 7,224 | | | | 621,842 | | |
HF Sinclair Corp. | | | 10,323 | | | | 571,688 | | |
Matador Resources Co. | | | 10,737 | | | | 662,366 | | |
Permian Resources Corp. | | | 33,671 | | | | 490,586 | | |
| | | | 2,346,482 | | |
Pharmaceuticals — 0.7% | |
Pacira BioSciences, Inc.* | | | 7,244 | | | | 204,715 | | |
Semiconductors & Semiconductor Equipment — 7.6% | |
Amkor Technology, Inc. | | | 19,176 | | | | 400,011 | | |
Entegris, Inc. | | | 3,966 | | | | 349,167 | | |
MKS Instruments, Inc. | | | 7,147 | | | | 469,272 | | |
ON Semiconductor Corp.* | | | 7,007 | | | | 438,919 | | |
Onto Innovation, Inc.* | | | 4,093 | | | | 459,930 | | |
| | | | 2,117,299 | | |
Specialty Retail — 2.3% | |
Chewy, Inc., Class A* | | | 7,051 | | | | 136,296 | | |
Lithia Motors, Inc., Class A | | | 1,749 | | | | 423,625 | | |
RH* | | | 409 | | | | 89,146 | | |
| | | | 649,067 | | |
Textiles, Apparel & Luxury Goods — 1.2% | |
Deckers Outdoor Corp.* | | | 113 | | | | 67,468 | | |
Steven Madden Ltd. | | | 8,378 | | | | 274,714 | | |
| | | | 342,182 | | |
Trading Companies & Distributors — 1.9% | |
Air Lease Corp. | | | 15,592 | | | | 539,951 | | |
Total Common Stocks
(Cost $27,409,137) | | | 26,574,203 | | |
First Eagle Funds | Annual Report | October 31, 2023
121
First Eagle U.S. Smid Cap Opportunity Fund | Schedule of Investments | October 31, 2023
Investments | | Shares | | Value ($) | |
Short-Term Investments — 5.3% | |
Investment Companies — 5.3% | |
JP Morgan U.S. Government Money Market Fund,
Capital Shares 5.37% (a) (Cost $1,458,654) | | | 1,458,654 | | | | 1,458,654 | | |
Total Investments — 101.0%
(Cost $28,867,791) | | | 28,032,857 | | |
Liabilities in Excess of Other Assets — (1.0%) | | | (277,953 | ) | |
Net Assets — 100.0% | | | 27,754,904 | | |
* Non-income producing security.
(a) Represents 7-day effective yield as of October 31, 2023.
As of October 31, 2023, the gross unrealized appreciation (depreciation) of investments based on the aggregate cost of investments for federal income tax purposes was as follows:
Aggregate gross unrealized appreciation | | $ | 1,897,442 | | |
Aggregate gross unrealized depreciation | | | (2,732,532 | ) | |
Net unrealized depreciation | | $ | (835,090 | ) | |
Federal income tax cost of investments | | $ | 28,867,947 | | |
See Notes to Financial Statements.
First Eagle Funds | Annual Report | October 31, 2023
122
This page was intentionally left blank.
First Eagle Global Real Assets Fund
Data as of October 31, 2023 (unaudited)
Investment Objective
The First Eagle Global Real Assets Fund seeks long-term growth of capital.
Average Annual Returns^ (%) | | | | One Year | | Since
Inception
(11/30/21) | |
First Eagle Global Real Assets Fund | | Class I | | | 3.53 | | | | -0.37 | | |
MSCI World Index | | | | | 10.48 | | | | -4.21 | | |
Consumer Price Index +400bps | | | | | 7.22 | | | | 9.45 | | |
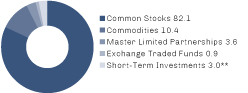
Sectors* (%)
Energy | | | 23.1 | | |
Real Estate | | | 19.2 | | |
Materials | | | 18.8 | | |
Commodities | | | 10.4 | | |
Industrials | | | 9.4 | | |
Utilities | | | 6.4 | | |
Communication Services | | | 2.9 | | |
Consumer Staples | | | 2.4 | | |
Health Care | | | 1.6 | | |
Information Technology | | | 1.0 | | |
Consumer Discretionary | | | 0.9 | | |
Investment Funds | | | 0.9 | | |
Short-Term Investments | | | 3.0 | | |
Countries*~ (%)
United States | | | 54.0 | | |
Canada | | | 8.3 | | |
United Kingdom | | | 6.0 | | |
Mexico | | | 4.1 | | |
Hong Kong | | | 3.9 | | |
Japan | | | 3.4 | | |
Netherlands | | | 2.9 | | |
Australia | | | 2.4 | | |
Singapore | | | 2.4 | | |
Germany | | | 2.0 | | |
Brazil | | | 1.8 | | |
Spain | | | 1.4 | | |
France | | | 1.0 | | |
Belgium | | | 1.0 | | |
South Korea | | | 1.0 | | |
Faroe Islands | | | 0.9 | | |
Israel | | | 0.5 | | |
Russia | | | 0.0 | | |
Short-Term Investments | | | 3.0 | | |
^ Performance figures reflect certain fee waivers and/or expense limitations, without which returns may have been lower.
* Asset Allocation, Sectors and Countries percentages are based on total investments in the portfolio.
** Includes short-term commercial paper (0.0% of total investments) that settles in 90 days or less, long-term commercial paper (0.0% of total investments) that settles in 91 days or greater and other short-term investments (3.0% of total investments), such as U.S. treasury bills or money market funds.
~ Country allocations reflect country of risk (not currency of issue). Bonds of non-U.S. issuers may be U.S. dollar denominated.
The Fund's portfolio composition is subject to change at any time.
First Eagle Funds | Annual Report | October 31, 2023
124
First Eagle Global Real Assets Fund | Fund Overview
Growth of a $1,000,000 Initial Investment
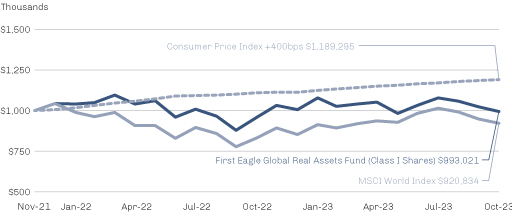
Performance data quoted herein represents past performance and should not be considered indicative of future results. Performance data quoted herein does not reflect the deduction of taxes that a shareholder would pay on Fund distributions or the sale of Fund shares. The average annual returns shown above are historical and reflect changes in share price, reinvested dividends and are net of expenses.
Class I Shares require $1 million minimum investment and are offered without a sales charge. If a sales charge was included values would be lower.
The MSCI World Index is a widely followed, unmanaged group of stocks from 23 developed market countries. The index provides total returns in U.S. dollars with net dividends reinvested. One cannot invest directly in an index. The Consumer Price Index (CPI) represents the change in price of all goods and services purchased for consumption by urban households.
Top 10 Holdings* (%)
Gold bullion** (Precious Metal) | | | 10.6 | | |
NOV, Inc. (Energy Equipment & Services, United States) | | | 3.0 | | |
United Utilities Group plc (Water Utilities, United Kingdom) | | | 3.0 | | |
Shell plc (Oil, Gas & Consumable Fuels, Netherlands) | | | 2.9 | | |
Schlumberger NV (Energy Equipment & Services, United States) | | | 2.7 | | |
Imperial Oil Ltd. (Oil, Gas & Consumable Fuels, Canada) | | | 2.7 | | |
Exxon Mobil Corp. (Oil, Gas & Consumable Fuels, United States) | | | 2.6 | | |
Enterprise Products Partners LP (Oil, Gas & Consumable Fuels, United States) | | | 2.5 | | |
Glencore plc (Metals & Mining, Australia) | | | 2.4 | | |
FUCHS SE (Preference) (Chemicals, Germany) | | | 2.1 | | |
Total | | | 34.5 | | |
* Holdings in cash, short-term commercial paper, long-term commercial paper and other short-term cash equivalents have been excluded.
** The Fund invests in gold and precious metals through investment in a wholly-owned subsidiary of the Fund organized under the laws of the Cayman Islands (the "Subsidiary"). Gold Bullion and commodities include the Fund's investment in the Subsidiary.
Percentages are based on total net assets.
First Eagle Funds | Annual Report | October 31, 2023
125
First Eagle Global Real Assets Fund | Consolidated Schedule of Investments | October 31, 2023
Investments | | Shares | | Value ($) | |
Common Stocks — 83.3% | |
Australia — 2.4% | |
Glencore plc | | | 51,904 | | | | 274,927 | | |
Belgium — 1.0% | |
Shurgard Self Storage Ltd., REIT | | | 3,107 | | | | 116,279 | | |
Brazil — 1.8% | |
Wheaton Precious Metals Corp. | | | 4,945 | | | | 208,854 | | |
Canada — 8.4% | |
Canadian National Railway Co. | | | 1,630 | | | | 172,468 | | |
Canadian Pacific Kansas City Ltd. | | | 2,255 | | | | 160,106 | | |
Franco-Nevada Corp. | | | 452 | | | | 54,986 | | |
Imperial Oil Ltd. | | | 5,340 | | | | 304,324 | | |
Nutrien Ltd. | | | 3,653 | | | | 196,197 | | |
StorageVault Canada, Inc. | | | 20,498 | | | | 63,560 | | |
| | | | 951,641 | | |
Faroe Islands — 0.9% | |
Bakkafrost P/F | | | 2,268 | | | | 102,377 | | |
France — 1.1% | |
Air Liquide SA | | | 693 | | | | 118,747 | | |
Germany — 2.1% | |
FUCHS SE (Preference) | | | 5,800 | | | | 235,567 | | |
Hong Kong — 4.0% | |
CK Asset Holdings Ltd. | | | 33,500 | | | | 167,444 | | |
Guoco Group Ltd. | | | 11,000 | | | | 82,629 | | |
Hongkong Land Holdings Ltd. | | | 37,200 | | | | 117,988 | | |
Hysan Development Co. Ltd. | | | 43,000 | | | | 79,152 | | |
| | | | 447,213 | | |
Israel — 0.5% | |
ICL Group Ltd. | | | 12,182 | | | | 58,839 | | |
Japan — 3.4% | |
Kansai Paint Co. Ltd. | | | 10,800 | | | | 158,055 | | |
Komatsu Ltd. | | | 7,500 | | | | 172,323 | | |
Shin-Etsu Chemical Co. Ltd. | | | 1,900 | | | | 56,816 | | |
| | | | 387,194 | | |
First Eagle Funds | Annual Report | October 31, 2023
126
First Eagle Global Real Assets Fund | Consolidated Schedule of Investments | October 31, 2023
Investments | | Shares | | Value ($) | |
Mexico — 4.2% | |
| GMexico Transportes SAB de CV (a) | | | 58,964 | | | | 121,598 | | |
| Grupo Mexico SAB de CV, Series B | | | 43,495 | | | | 177,391 | | |
| Prologis Property Mexico SA de CV, REIT | | | 47,689 | | | | 170,902 | | |
| | | | 469,891 | | |
Netherlands — 2.9% | |
Shell plc | | | 10,130 | | | | 330,923 | | |
Russia — 0.0% | |
Alrosa PJSC‡ (b) | | | 48,132 | | | | — | | |
Singapore — 2.4% | |
Sheng Siong Group Ltd. | | | 94,500 | | | | 106,982 | | |
UOL Group Ltd. | | | 38,300 | | | | 164,952 | | |
| | | | 271,934 | | |
South Korea — 1.0% | |
Samsung Electronics Co. Ltd. (Preference) | | | 2,736 | | | | 109,234 | | |
Spain — 1.5% | |
Aena SME SA (a) | | | 1,139 | | | | 165,270 | | |
United Kingdom — 6.1% | |
Ashtead Group plc | | | 997 | | | | 57,180 | | |
Berkeley Group Holdings plc | | | 2,030 | | | | 99,788 | | |
Big Yellow Group plc, REIT | | | 10,309 | | | | 119,895 | | |
Great Portland Estates plc, REIT | | | 5,837 | | | | 27,669 | | |
United Utilities Group plc | | | 26,149 | | | | 338,201 | | |
Victrex plc | | | 3,042 | | | | 50,913 | | |
| | | | 693,646 | | |
United States — 39.6% | |
American Homes 4 Rent, Class A, REIT | | | 6,472 | | | | 211,893 | | |
American Water Works Co., Inc. | | | 861 | | | | 101,297 | | |
Ball Corp. | | | 698 | | | | 33,609 | | |
Boston Properties, Inc., REIT | | | 3,294 | | | | 176,460 | | |
Charter Communications, Inc., Class A* | | | 529 | | | | 213,081 | | |
Comcast Corp., Class A | | | 3,015 | | | | 124,489 | | |
CRH plc | | | 1,593 | | | | 85,491 | | |
Cummins, Inc. | | | 467 | | | | 101,012 | | |
Deere & Co. | | | 136 | | | | 49,689 | | |
First Eagle Funds | Annual Report | October 31, 2023
127
First Eagle Global Real Assets Fund | Consolidated Schedule of Investments | October 31, 2023
Investments | | Shares | | Value ($) | |
United States — 39.6% (continued) | |
Diamond Offshore Drilling, Inc.* | | | 6,086 | | | | 75,527 | | |
Douglas Emmett, Inc., REIT | | | 11,179 | | | | 125,317 | | |
EOG Resources, Inc. | | | 463 | | | | 58,454 | | |
Equinix, Inc., REIT | | | 80 | | | | 58,371 | | |
Equity Residential, REIT | | | 3,525 | | | | 195,038 | | |
Extra Space Storage, Inc., REIT | | | 1,848 | | | | 191,434 | | |
Exxon Mobil Corp. | | | 2,780 | | | | 294,263 | | |
HCA Healthcare, Inc. | | | 823 | | | | 186,113 | | |
IDACORP, Inc. | | | 1,792 | | | | 169,720 | | |
Ivanhoe Electric, Inc.* | | | 2,366 | | | | 24,228 | | |
Noble Corp. plc | | | 2,777 | | | | 129,658 | | |
NOV, Inc. | | | 17,105 | | | | 341,416 | | |
ONEOK, Inc. | | | 2,739 | | | | 178,583 | | |
PPG Industries, Inc. | | | 664 | | | | 81,519 | | |
Royal Gold, Inc. | | | 1,526 | | | | 159,208 | | |
RPM International, Inc. | | | 2,040 | | | | 186,191 | | |
SBA Communications Corp., REIT | | | 846 | | | | 176,501 | | |
Schlumberger NV | | | 5,474 | | | | 304,683 | | |
Terreno Realty Corp., REIT | | | 875 | | | | 46,620 | | |
UGI Corp. | | | 5,900 | | | | 122,720 | | |
Walmart, Inc. | | | 420 | | | | 68,632 | | |
Williams Cos., Inc. (The) | | | 6,124 | | | | 210,666 | | |
| | | | 4,481,883 | | |
Total Common Stocks
(Cost $10,036,909) | | | 9,424,419 | | |
| | | Ounces | | | |
Commodities — 10.6% | |
Gold bullion*
(Cost $1,072,789) | | | 602 | | | | 1,194,168 | | |
First Eagle Funds | Annual Report | October 31, 2023
128
First Eagle Global Real Assets Fund | Consolidated Schedule of Investments | October 31, 2023
Investments | | Shares | | Value ($) | |
Master Limited Partnerships — 3.7% | |
United States — 3.7% | |
Black Stone Minerals LP | | | 7,482 | | | | 134,676 | | |
Enterprise Products Partners LP | | | 10,900 | | | | 283,836 | | |
Total Master Limited Partnerships
(Cost 375,096) | | | 418,512 | | |
Exchange Traded Funds — 0.9% | |
United States | |
iShares Gold Trust
(Cost $98,643) | | | 2,614 | | | | 98,260 | | |
Short-Term Investment — 3.0% | |
Investment Companies — 3.0% | |
JP Morgan U.S. Government Money Market Fund,
Capital Shares 5.37% (c) (Cost $342,979) | | | 342,979 | | | | 342,979 | | |
Total Investments — 101.5%
(Cost $11,926,416) | | | 11,478,338 | | |
Liabilities in Excess of Other Assets — (1.5)% | | | (174,836 | ) | |
Net Assets — 100.0% | | | 11,303,502 | | |
* Non-income producing security.
‡ Value determined using significant unobservable inputs.
(a) Security exempt from registration pursuant to Regulation S under the Securities Act of 1933. Regulation S applies to securities offerings that are made outside of the United States and do not involve direct selling efforts in the United States and as such may have restrictions on resale.
(b) Security fair valued as of October 31, 2023 in accordance with procedures approved by the Board of Trustees. Total value of all such securities at October 31, 2023 amounted to $0, which represents approximately 0.00% of net assets of the Fund.
(c) Represents 7-day effective yield as of October 31, 2023.
As of October 31, 2023, the gross unrealized appreciation (depreciation) of investments based on the aggregate cost of investment securities and derivative instruments, if applicable, for federal income tax purposes was as follows:
Aggregate gross unrealized appreciation | | $ | 874,865 | | |
Aggregate gross unrealized depreciation | | | (1,351,781 | ) | |
Net unrealized depreciation | | $ | (476,916 | ) | |
Federal income tax cost | | $ | 11,955,254 | | |
First Eagle Funds | Annual Report | October 31, 2023
129
First Eagle Global Real Assets Fund | Consolidated Schedule of Investments | October 31, 2023
Abbreviations
PJSC — Public Joint Stock Company
Preference — A special type of equity investment that shares in the earnings of the company, has limited voting rights, and may have a dividend preference. Preference shares may also have liquidation preference.
REIT — Real Estate Investment Trust
See Notes to Financial Statements.
First Eagle Funds | Annual Report | October 31, 2023
130
This page was intentionally left blank.
Statements of Assets and Liabilities
| | | First Eagle
Global Fund* | | First Eagle
Overseas Fund* | |
Assets | |
Investments, at Cost (Note 1) | |
Investments in non-affiliates | | $ | 29,254,299,834 | | | $ | 8,405,325,550 | | |
Investments in affiliates | | | 2,419,048,998 | | | | 327,054,876 | | |
Gold bullion | | | 2,902,970,282 | | | | 663,216,747 | | |
Silver bullion | | | — | | | | — | | |
Investments, at Value (Note 1) | |
Investments in non-affiliates | | | 38,741,242,528 | | | | 9,960,208,187 | | |
Investments in affiliates | | | 2,184,499,530 | | | | 430,201,359 | | |
Gold bullion | | | 5,488,517,064 | | | | 1,439,169,397 | | |
Silver bullion | | | — | | | | — | | |
Unrealized appreciation on forward foreign currency exchange contracts | | | 45,895,255 | | | | 25,351,715 | | |
Receivable for investment securities sold | | | 2,730,210 | | | | 1,255,530 | | |
Foreign tax reclaims receivable | | | 42,948,782 | | | | 20,417,298 | | |
Receivable for Fund shares sold | | | 36,064,837 | | | | 10,795,969 | | |
Accrued interest and dividends receivable | | | 79,186,231 | | | | 32,582,193 | | |
Investment for trustee deferred compensation plan (Note 2) | | | 6,891,564 | | | | 3,501,761 | | |
Due from adviser | | | — | | | | — | | |
Other assets | | | 397,265 | | | | 107,823 | | |
Total Assets | | | 46,628,373,266 | | | | 11,923,591,232 | | |
Liabilities | |
Investment advisory fees payable (Note 2) | | | 29,892,451 | | | | 7,627,767 | | |
Due to custodian | | | 241,401 | | | | 63,326 | | |
Payable for investment securities purchased | | | 31,687,156 | | | | 2,083,620 | | |
Distribution fees payable (Note 3) | | | 3,754,017 | | | | 339,639 | | |
Administrative fees payable (Note 2) | | | 242,840 | | | | — | | |
Trustee deferred compensation plan (Note 2) | | | 6,891,564 | | | | 3,501,761 | | |
Service fees payable (Note 3) | | | 323,261 | | | | 16,148 | | |
Trustee fees payable | | | 163,753 | | | | 42,424 | | |
IRS compliance fees for foreign withholding tax claims payable | | | 20,941,890 | | | | 37,211,235 | | |
Unrealized depreciation on forward foreign currency exchange contracts | | | 288,055 | | | | 11,828 | | |
Payable for Fund shares redeemed | | | 38,223,031 | | | | 15,655,698 | | |
Accrued expenses and other liabilities | | | 13,699,897 | | | | 4,571,730 | | |
Total Liabilities | | | 146,349,316 | | | | 71,125,176 | | |
Net Assets | | $ | 46,482,023,950 | | | $ | 11,852,466,056 | | |
Net Assets Consist of | |
Capital stock (par value, $0.001 per share) | | | 772,382 | | | | 507,676 | | |
Capital surplus | | | 33,451,428,627 | | | | 9,608,934,980 | | |
Total distributable earnings (losses) | | | 13,029,822,941 | | | | 2,243,023,400 | | |
Net Assets | | $ | 46,482,023,950 | | | $ | 11,852,466,056 | | |
First Eagle Funds | Annual Report | October 31, 2023
132
October 31, 2023
| | | First Eagle
U.S. Value Fund* | | First Eagle
Gold Fund* | |
Assets | |
Investments, at Cost (Note 1) | |
Investments in non-affiliates | | $ | 671,528,169 | | | $ | 1,179,277,163 | | |
Investments in affiliates | | | — | | | | 202,629,044 | | |
Gold bullion | | | 78,780,493 | | | | 188,211,352 | | |
Silver bullion | | | — | | | | 77,535,280 | | |
Investments, at Value (Note 1) | |
Investments in non-affiliates | | | 996,979,212 | | | | 1,478,910,490 | | |
Investments in affiliates | | | — | | | | 210,111,061 | | |
Gold bullion | | | 143,979,658 | | | | 346,781,982 | | |
Silver bullion | | | — | | | | 105,169,108 | | |
Unrealized appreciation on forward foreign currency exchange contracts | | | — | | | | — | | |
Receivable for investment securities sold | | | — | | | | 18,627,528 | | |
Foreign tax reclaims receivable | | | — | | | | — | | |
Receivable for Fund shares sold | | | 523,400 | | | | 2,608,300 | | |
Accrued interest and dividends receivable | | | 1,113,735 | | | | 552 | | |
Investment for trustee deferred compensation plan (Note 2) | | | 3,802,561 | | | | 276,821 | | |
Due from adviser | | | 48,969 | | | | — | | |
Other assets | | | 11,029 | | | | 21,234 | | |
Total Assets | | | 1,146,458,564 | | | | 2,162,507,076 | | |
Liabilities | |
Investment advisory fees payable (Note 2) | | | 735,190 | | | | 1,370,384 | | |
Due to custodian | | | 14,370 | | | | 17,049 | | |
Payable for investment securities purchased | | | 1,343,182 | | | | 447 | | |
Distribution fees payable (Note 3) | | | 134,471 | | | | 185,699 | | |
Administrative fees payable (Note 2) | | | — | | | | — | | |
Trustee deferred compensation plan (Note 2) | | | 3,802,561 | | | | 276,821 | | |
Service fees payable (Note 3) | | | 6,341 | | | | 23,113 | | |
Trustee fees payable | | | 4,669 | | | | 6,279 | | |
IRS compliance fees for foreign withholding tax claims payable | | | — | | | | — | | |
Unrealized depreciation on forward foreign currency exchange contracts | | | — | | | | — | | |
Payable for Fund shares redeemed | | | 822,289 | | | | 2,150,006 | | |
Accrued expenses and other liabilities | | | 461,211 | | | | 899,194 | | |
Total Liabilities | | | 7,324,284 | | | | 4,928,992 | | |
Net Assets | | $ | 1,139,134,280 | | | $ | 2,157,578,084 | | |
Net Assets Consist of | |
Capital stock (par value, $0.001 per share) | | | 60,795 | | | | 94,985 | | |
Capital surplus | | | 671,045,183 | | | | 2,332,716,835 | | |
Total distributable earnings (losses) | | | 468,028,302 | | | | (175,233,736 | ) | |
Net Assets | | $ | 1,139,134,280 | | | $ | 2,157,578,084 | | |
First Eagle Funds | Annual Report | October 31, 2023
133
Statements of Assets and Liabilities (continued)
| | | First Eagle
Global Fund* | | First Eagle
Overseas Fund* | |
Class A | |
Net assets | | $ | 12,976,288,412 | | | $ | 1,360,488,147 | | |
Shares outstanding | | | 216,362,656 | | | | 59,656,595 | | |
Net asset value per share and redemption proceeds per share | | $ | 59.97 | | | $ | 22.81 | | |
Offering price per share (NAV per share plus maximum sales charge)** | | $ | 63.13 | (1) | | $ | 24.01 | (1) | |
Class C | |
Net assets | | $ | 1,488,095,096 | | | $ | 74,231,344 | | |
Shares outstanding | | | 26,084,098 | | | | 3,444,418 | | |
Net asset value per share and redemption proceeds per share | | $ | 57.05 | | | $ | 21.55 | | |
Redemption proceeds per share (NAV per share less maximum contingent
deferred sale charge)(2) | | $ | 56.48 | | | $ | 21.33 | | |
Class I | |
Net assets | | $ | 29,941,638,774 | | | $ | 9,122,327,316 | | |
Shares outstanding | | | 495,595,080 | | | | 389,313,607 | | |
Net asset value per share and redemption proceeds per share | | $ | 60.42 | | | $ | 23.43 | | |
Class R3 | |
Net assets | | $ | 12,327,776 | | | $ | 397,185 | | |
Shares outstanding | | | 205,968 | | | | 17,092 | | |
Net asset value per share and redemption proceeds per share | | $ | 59.85 | | | $ | 23.24 | | |
Class R4 | |
Net assets | | $ | 1,758,192 | | | $ | 5,057,697 | | |
Shares outstanding | | | 29,134 | | | | 216,836 | | |
Net asset value per share and redemption proceeds per share | | $ | 60.35 | | | $ | 23.32 | | |
Class R5 | |
Net assets | | $ | 206,467 | | | $ | 39,447 | | |
Shares outstanding | | | 3,470 | | | | 1,689 | | |
Net asset value per share and redemption proceeds per share | | $ | 59.48 | (3) | | $ | 23.36 | | |
Class R6 | |
Net assets | | $ | 2,061,709,233 | | | $ | 1,289,924,920 | | |
Shares outstanding | | | 34,101,190 | | | | 55,025,651 | | |
Net asset value per share and redemption proceeds per share | | $ | 60.46 | | | $ | 23.44 | | |
* First Eagle Global Fund, First Eagle Overseas Fund, First Eagle U.S. Value Fund and First Eagle Gold Fund financial statements are shown on a consolidated basis and includes the balances of the First Eagle Global Cayman Fund, Ltd., First Eagle Overseas Cayman Fund, Ltd., First Eagle U.S. Value Cayman Fund, Ltd., and First Eagle Gold Cayman Fund, Ltd., respectively.
** A contingent deferred sales charge (CDSC) of 1.00% may apply on redemptions of Class A shares made within 18 months following a purchase of $1,000,000 or more without an initial sales charge.
(1) The maximum sales charge is 5.00% for Class A shares. Classes C, I, R3, R4 and R6 have no frontend sales charges.
(2) The maximum CDSC is 1.00% for Class C shares, which is charged on the lesser of the original purchase price or the current market value at the time of sale. This pertains to shares sold or redeemed within the first year of purchase.
(3) Net asset value may not recalculate due to rounding of fractional share.
See Notes to Financial Statements.
First Eagle Funds | Annual Report | October 31, 2023
134
October 31, 2023
| | | First Eagle
U.S. Value Fund* | | First Eagle
Gold Fund* | |
Class A | |
Net assets | | $ | 536,104,893 | | | $ | 549,711,664 | | |
Shares outstanding | | | 28,915,983 | | | | 24,654,077 | | |
Net asset value per share and redemption proceeds per share | | $ | 18.54 | | | $ | 22.30 | | |
Offering price per share (NAV per share plus maximum sales charge)** | | $ | 19.52 | (1) | | $ | 23.47 | (1) | |
Class C | |
Net assets | | $ | 29,229,993 | | | $ | 108,058,362 | | |
Shares outstanding | | | 1,679,875 | | | | 5,376,559 | | |
Net asset value per share and redemption proceeds per share | | $ | 17.40 | | | $ | 20.10 | | |
Redemption proceeds per share (NAV per share less maximum contingent
deferred sale charge)(2) | | $ | 17.23 | | | $ | 19.90 | | |
Class I | |
Net assets | | $ | 541,194,657 | | | $ | 1,349,359,425 | | |
Shares outstanding | | | 28,483,950 | | | | 58,456,099 | | |
Net asset value per share and redemption proceeds per share | | $ | 19.00 | | | $ | 23.08 | | |
Class R3 | |
Net assets | | $ | 70,610 | | | $ | 1,275,379 | | |
Shares outstanding | | | 3,737 | | | | 55,925 | | |
Net asset value per share and redemption proceeds per share | | $ | 18.89 | | | $ | 22.81 | | |
Class R4 | |
Net assets | | $ | 43,060 | | | $ | 1,575,155 | | |
Shares outstanding | | | 2,281 | | | | 68,292 | | |
Net asset value per share and redemption proceeds per share | | $ | 18.88 | | | $ | 23.06 | (3) | |
Class R5 | |
Net assets | | $ | 86,199 | | | $ | 464,711 | | |
Shares outstanding | | | 4,552 | | | | 20,143 | | |
Net asset value per share and redemption proceeds per share | | $ | 18.94 | | | $ | 23.07 | | |
Class R6 | |
Net assets | | $ | 32,404,868 | | | $ | 147,133,388 | | |
Shares outstanding | | | 1,705,115 | | | | 6,353,503 | | |
Net asset value per share and redemption proceeds per share | | $ | 19.00 | | | $ | 23.16 | | |
First Eagle Funds | Annual Report | October 31, 2023
135
Statements of Assets and Liabilities (continued)
| | | First Eagle
Global Income
Builder Fund | | First Eagle
High Income Fund | |
Assets | |
Investments, at Cost (Note 1) | |
Investments in non-affiliates | | $ | 1,531,391,719 | | | $ | 158,136,184 | | |
Gold bullion | | | 69,007,802 | | | | — | | |
Investments, at Value (Note 1) | |
Investments in non-affiliates | | | 1,528,712,226 | | | | 144,532,125 | | |
Gold bullion | | | 110,952,542 | | | | — | | |
Cash | | | 7,434 | | | | 45,955 | | |
Unrealized appreciation on forward foreign currency exchange contracts | | | 1,205,386 | | | | — | | |
Receivable for investment securities sold | | | 49,710 | | | | 9,069,980 | | |
Foreign tax reclaims receivable | | | 1,920,894 | | | | — | | |
Receivable for Fund shares sold | | | 1,817,974 | | | | 94,855 | | |
Accrued interest and dividends receivable | | | 7,834,178 | | | | 2,133,172 | | |
Investment for trustee deferred compensation plan (Note 2) | | | 650,092 | | | | 249,625 | | |
Due from adviser | | | 385 | | | | 25,898 | | |
Other assets | | | 14,785 | | | | 2,422 | | |
Total Assets | | | 1,653,165,606 | | | | 156,154,032 | | |
Liabilities | |
Investment advisory fees payable (Note 2) | | | 1,059,555 | | | | 59,408 | | |
Option contracts written, at value (premiums received $722,046, $—, $— and
$—, respectively) | | | 327,757 | | | | — | | |
Due to custodian | | | — | | | | — | | |
Payable for investment securities purchased | | | 3,974,847 | | | | 1,500,000 | | |
Distribution fees payable (Note 3) | | | 186,585 | | | | 17,237 | | |
Administrative fees payable (Note 2) | | | 70,639 | | | | 6,598 | | |
Trustee deferred compensation plan (Note 2) | | | 650,092 | | | | 249,625 | | |
Service fees payable (Note 3) | | | 17,755 | | | | 1,131 | | |
Trustee fees payable | | | 5,539 | | | | 861 | | |
IRS compliance fees for foreign withholding tax claims payable | | | 276,252 | | | | — | | |
Payable for dividends to shareholders | | | 146,063 | | | | 82,411 | | |
Unrealized depreciation on forward foreign currency exchange contracts | | | 9,302 | | | | — | | |
Payable for Fund shares redeemed | | | 4,330,703 | | | | 398,923 | | |
Accrued expenses and other liabilities | | | 518,447 | | | | 253,622 | | |
Total Liabilities | | | 11,573,536 | | | | 2,569,816 | | |
Net Assets | | $ | 1,641,592,070 | | | $ | 153,584,216 | | |
Net Assets Consist of | |
Capital stock (par value, $0.001 per share) | | | 138,346 | | | | 19,744 | | |
Capital surplus | | | 1,599,618,254 | | | | 291,641,372 | | |
Total distributable earnings (losses) | | | 41,835,470 | | | | (138,076,900 | ) | |
Net Assets | | $ | 1,641,592,070 | | | $ | 153,584,216 | | |
First Eagle Funds | Annual Report | October 31, 2023
136
October 31, 2023
| | | First Eagle
Rising
Dividend Fund** | | First Eagle
Small Cap
Opportunity Fund | |
Assets | |
Investments, at Cost (Note 1) | |
Investments in non-affiliates | | $ | 317,563,901 | | | $ | 1,409,589,047 | | |
Gold bullion | | | — | | | | — | | |
Investments, at Value (Note 1) | |
Investments in non-affiliates | | | 353,629,470 | | | | 1,306,534,548 | | |
Gold bullion | | | — | | | | — | | |
Cash | | | — | | | | — | | |
Unrealized appreciation on forward foreign currency exchange contracts | | | — | | | | — | | |
Receivable for investment securities sold | | | 17,739,571 | | | | 1,745,675 | | |
Foreign tax reclaims receivable | | | 117,339 | | | | — | | |
Receivable for Fund shares sold | | | 104,667 | | | | 14,135,562 | | |
Accrued interest and dividends receivable | | | 777,557 | | | | 1,069,546 | | |
Investment for trustee deferred compensation plan (Note 2) | | | 1,641,025 | | | | 453,685 | | |
Due from adviser | | | 73,786 | | | | 257,449 | | |
Other assets | | | 4,263 | | | | 7,996 | | |
Total Assets | | | 374,087,678 | | | | 1,324,204,461 | | |
Liabilities | |
Investment advisory fees payable (Note 2) | | | 153,771 | | | | 954,662 | | |
Option contracts written, at value (premiums received $722,046, $—, $— and
$—, respectively) | | | — | | | | — | | |
Due to custodian | | | — | | | | 79,982 | | |
Payable for investment securities purchased | | | 17,843,833 | | | | 9,996,787 | | |
Distribution fees payable (Note 3) | | | 58,431 | | | | 13,019 | | |
Administrative fees payable (Note 2) | | | 8,858 | | | | 90,710 | | |
Trustee deferred compensation plan (Note 2) | | | 1,641,025 | | | | 453,685 | | |
Service fees payable (Note 3) | | | 1,850 | | | | — | | |
Trustee fees payable | | | 1,519 | | | | 1,504 | | |
IRS compliance fees for foreign withholding tax claims payable | | | — | | | | — | | |
Payable for dividends to shareholders | | | — | | | | — | | |
Unrealized depreciation on forward foreign currency exchange contracts | | | — | | | | — | | |
Payable for Fund shares redeemed | | | 223,843 | | | | 2,713,143 | | |
Accrued expenses and other liabilities | | | 339,617 | | | | 203,986 | | |
Total Liabilities | | | 20,272,747 | | | | 14,507,478 | | |
Net Assets | | $ | 353,814,931 | | | $ | 1,309,696,983 | | |
Net Assets Consist of | |
Capital stock (par value, $0.001 per share) | | | 15,798 | | | | 159,156 | | |
Capital surplus | | | 290,864,495 | | | | 1,469,218,540 | | |
Total distributable earnings (losses) | | | 62,934,638 | | | | (159,680,713 | ) | |
Net Assets | | $ | 353,814,931 | | | $ | 1,309,696,983 | | |
First Eagle Funds | Annual Report | October 31, 2023
137
Statements of Assets and Liabilities (continued)
| | | First Eagle
Global Income
Builder Fund | | First Eagle
High Income Fund | |
Class A | |
Net assets | | $ | 622,235,652 | | | $ | 63,823,568 | | |
Shares outstanding | | | 52,313,628 | | | | 8,207,087 | | |
Net asset value per share and redemption proceeds per share | | $ | 11.89 | | | $ | 7.78 | | |
Offering price per share (NAV per share plus maximum sales charge)* | | $ | 12.52 | (1) | | $ | 8.15 | (2) | |
Class C | |
Net assets | | $ | 82,141,363 | | | $ | 4,956,751 | | |
Shares outstanding | | | 6,859,097 | | | | 637,855 | | |
Net asset value per share and redemption proceeds per share | | $ | 11.98 | | | $ | 7.77 | | |
Redemption proceeds per share (NAV per share less maximum contingent
deferred sale charge)(3) | | $ | 11.86 | | | $ | 7.69 | | |
Class I | |
Net assets | | $ | 874,529,588 | | | $ | 76,481,541 | | |
Shares outstanding | | | 73,870,683 | | | | 9,828,992 | | |
Net asset value per share and redemption proceeds per share | | $ | 11.84 | | | $ | 7.78 | | |
Class R3 | |
Net assets | | $ | 59,490 | | | $ | 478,520 | | |
Shares outstanding | | | 5,010 | | | | 61,473 | | |
Net asset value per share and redemption proceeds per share | | $ | 11.87 | | | $ | 7.78 | | |
Class R4 | |
Net assets | | $ | 58,069 | | | $ | 10,400 | | |
Shares outstanding | | | 4,899 | | | | 1,336 | | |
Net asset value per share and redemption proceeds per share | | $ | 11.85 | | | $ | 7.78 | | |
Class R5 | |
Net assets | | $ | 11,518 | | | $ | 10,672 | | |
Shares outstanding | | | 973 | | | | 1,373 | | |
Net asset value per share and redemption proceeds per share | | $ | 11.84 | | | $ | 7.78 | (4) | |
Class R6 | |
Net assets | | $ | 62,556,390 | | | $ | 7,822,764 | | |
Shares outstanding | | | 5,292,142 | | | | 1,005,589 | | |
Net asset value per share and redemption proceeds per share | | $ | 11.82 | | | $ | 7.78 | | |
* A contingent deferred sales charge (CDSC) of 1.00% may apply on redemptions of Class A shares made within 18 months following a purchase of $1,000,000 or more without an initial sales charge. With respect to the First Eagle Global Income Builder Fund and the First Eagle High Income Fund, a contingent deferred sales charge of 1.00% may apply on certain redemptions of Class A shares made within 18 months following a purchase of $250,000 or more without an initial sales charge.
** First Eagle Rising Dividend Fund was known as First Eagle Fund of America prior to March 1, 2023.
(1) The maximum sales charge is 5.00% for Class A shares. Classes C, I, R3, R4, R5 and R6 have no front-end sales charges.
(2) The maximum sales charge is 4.50% for Class A shares. Classes C, I, R3, R4, R5 and R6 have no front-end sales charges.
(3) The maximum CDSC is 1.00% for Class C shares, which is charged on the lesser of the original purchase price or the current market value at the time of sale. This pertains to shares sold or redeemed within the first year of purchase.
(4) Net asset value may not recalculate due to rounding of fractional share.
See Notes to Financial Statements.
First Eagle Funds | Annual Report | October 31, 2023
138
October 31, 2023
| | | First Eagle
Rising
Dividend Fund** | | First Eagle
Small Cap
Opportunity Fund | |
Class A | |
Net assets | | $ | 243,724,320 | | | $ | 61,379,186 | | |
Shares outstanding | | | 10,885,417 | | | | 7,490,976 | | |
Net asset value per share and redemption proceeds per share | | $ | 22.39 | | | $ | 8.19 | | |
Offering price per share (NAV per share plus maximum sales charge)* | | $ | 23.57 | (1) | | $ | 8.62 | (1) | |
Class C | |
Net assets | | $ | 8,097,702 | | | $ | — | | |
Shares outstanding | | | 594,264 | | | | — | | |
Net asset value per share and redemption proceeds per share | | $ | 13.63 | | | $ | — | | |
Redemption proceeds per share (NAV per share less maximum contingent
deferred sale charge)(3) | | $ | 13.49 | | | $ | — | | |
Class I | |
Net assets | | $ | 95,458,434 | | | $ | 1,183,672,057 | | |
Shares outstanding | | | 4,041,364 | | | | 143,815,321 | | |
Net asset value per share and redemption proceeds per share | | $ | 23.62 | | | $ | 8.23 | | |
Class R3 | |
Net assets | | $ | 57,290 | | | $ | — | | |
Shares outstanding | | | 2,445 | | | | — | | |
Net asset value per share and redemption proceeds per share | | $ | 23.44 | (4) | | $ | — | | |
Class R4 | |
Net assets | | $ | 38,193 | | | $ | — | | |
Shares outstanding | | | 1,619 | | | | — | | |
Net asset value per share and redemption proceeds per share | | $ | 23.59 | | | $ | — | | |
Class R5 | |
Net assets | | $ | 11,837 | | | $ | — | | |
Shares outstanding | | | 501 | | | | — | | |
Net asset value per share and redemption proceeds per share | | $ | 23.60 | (4) | | $ | — | | |
Class R6 | |
Net assets | | $ | 6,427,155 | | | $ | 64,645,740 | | |
Shares outstanding | | | 272,124 | | | | 7,850,147 | | |
Net asset value per share and redemption proceeds per share | | $ | 23.62 | | | $ | 8.23 | | |
First Eagle Funds | Annual Report | October 31, 2023
139
Statements of Assets and Liabilities (continued)
| | | First Eagle
U.S. Smid Cap
Opportunity Fund | | First Eagle
Global Real
Assets Fund* | |
Assets | |
Investments, at Cost (Note 1) | |
Investments in non-affiliates | | $ | 28,867,791 | | | $ | 10,853,627 | | |
Gold bullion | | | — | | | | 1,072,789 | | |
Investments, at Value (Note 1) | |
Investments in non-affiliates | | | 28,032,857 | | | | 10,284,170 | | |
Gold bullion | | | — | | | | 1,194,168 | | |
Receivable for investment securities sold | | | — | | | | 92,790 | | |
Foreign tax reclaims receivable | | | — | | | | 3,252 | | |
Receivable for Fund shares sold | | | — | | | | — | | |
Accrued interest and dividends receivable | | | 13,675 | | | | 18,766 | | |
Investment for trustee deferred compensation plan (Note 2) | | | 15,108 | | | | 64,801 | | |
Due from adviser | | | 5,268 | | | | 71,818 | | |
Other assets | | | 651 | | | | 1,073 | | |
Total Assets | | | 28,067,559 | | | | 11,730,838 | | |
Liabilities | |
Investment advisory fees payable (Note 2) | | | 70,326 | | | | 7,273 | | |
Due to custodian | | | — | | | | 7 | | |
Payable for investment securities purchased | | | 69,237 | | | | 152,764 | | |
Distribution fees payable (Note 3) | | | 17 | | | | 361 | | |
Administrative fees payable (Note 2) | | | 6,485 | | | | 29,864 | | |
Trustee deferred compensation plan (Note 2) | | | 15,108 | | | | 64,801 | | |
Trustee fees payable | | | — | | | | 1,113 | | |
Accrued expenses and other liabilities | | | 151,482 | | | | 171,153 | | |
Total Liabilities | | | 312,655 | | | | 427,336 | | |
Net Assets | | $ | 27,754,904 | | | $ | 11,303,502 | | |
Net Assets Consist of | |
Capital stock (par value, $0.001 per share) | | | 3,185 | | | | 1,160 | | |
Capital surplus | | | 28,588,722 | | | | 11,621,340 | | |
Total distributable earnings (losses) | | | (837,003 | ) | | | (318,998 | ) | |
Net Assets | | $ | 27,754,904 | | | $ | 11,303,502 | | |
First Eagle Funds | Annual Report | October 31, 2023
140
| | | First Eagle
U.S. Smid Cap
Opportunity Fund | | First Eagle
Global Real
Assets Fund* | |
Class A | |
Net assets | | $ | 78,090 | | | $ | 1,700,487 | | |
Shares outstanding | | | 8,975 | | | | 173,842 | | |
Net asset value per share and redemption proceeds per share | | $ | 8.70 | | | $ | 9.78 | | |
Offering price per share (NAV per share plus maximum
sales charge)** | | $ | 9.16 | (1) | | $ | 10.29 | (1) | |
Class I | |
Net assets | | $ | 27,633,118 | | | $ | 8,573,634 | | |
Shares outstanding | | | 3,170,551 | | | | 880,735 | | |
Net asset value per share and redemption proceeds per share | | $ | 8.72 | | | $ | 9.73 | | |
Class R6 | |
Net assets | | $ | 43,696 | | | $ | 1,029,381 | | |
Shares outstanding | | | 5,019 | | | | 105,765 | | |
Net asset value per share and redemption proceeds per share | | $ | 8.71 | | | $ | 9.73 | | |
* First Eagle Global Real Assets Fund financial statements are shown on a consolidated basis and includes the balances of the First Eagle Global Real Asset Cayman Fund, Ltd.
** A contingent deferred sales charge (CDSC) of 1.00% may apply on redemptions of Class A shares made within 18 months following a purchase of $1,000,000 or more without an initial sales charge.
(1) The maximum sales charge is 5.00% for Class A shares. Classes C and R6 have no front-end sales charges.
See Notes to Financial Statements.
First Eagle Funds | Annual Report | October 31, 2023
141
| | | First Eagle
Global Fund* | | First Eagle
Overseas Fund* | |
Investment Income | |
Interest (net of $489,163, $134,189, $— and $— foreign taxes withheld) | | $ | 249,085,773 | | | $ | 46,606,140 | | |
Dividends from: | | | | | |
Non-affiliates (net of $53,452,548, $27,555,917, $108,581 and $2,629,439
foreign taxes withheld) | | | 871,830,328 | | | | 279,771,036 | | |
Affiliated issuers (net of $227,796, $2,152,390, $— and $334,463 foreign
taxes withheld) | | | 48,313,560 | | | | 11,913,156 | | |
Total Income | | | 1,169,229,661 | | | | 338,290,332 | | |
Expenses | |
Investment advisory fees (Note 2) | | | 355,670,111 | | | | 93,443,422 | | |
Distributions fees (Note 3) | | | | | |
Class A | | | 33,956,224 | | | | 3,680,932 | | |
Class C | | | 12,870,929 | | | | 674,494 | | |
Class R3 | | | 13,733 | | | | 961 | | |
Class R4 | | | 1,517 | | | | 7,387 | | |
Shareholder servicing agent fees | | | 33,978,744 | | | | 10,025,457 | | |
Service fees (Note 3) | | | | | |
Class C | | | 4,290,309 | | | | 224,831 | | |
Class R3 | | | 5,493 | | | | 384 | | |
Administrative fees (Note 2) | | | 3,393,719 | | | | 863,458 | | |
Professional fees | | | 859,244 | | | | 522,866 | | |
Custodian and accounting fees | | | 6,447,438 | | | | 2,281,604 | | |
Shareholder reporting fees | | | 2,096,856 | | | | 681,568 | | |
Trustees' fees | | | 2,171,692 | | | | 578,958 | | |
Registration and filing fees | | | 765,294 | | | | 355,775 | | |
Other expenses | | | 803,370 | | | | 234,874 | | |
Total Expenses | | | 457,324,673 | | | | 113,576,971 | | |
Expense waiver (Note 2) | | | — | | | | — | | |
Expense reductions due to earnings credits (Note 1) | | | (1,028,105 | ) | | | (152,391 | ) | |
Net Expenses | | | 456,296,568 | | | | 113,424,580 | | |
Net Investment Income (Note 1) | | | 712,933,093 | | | | 224,865,752 | | |
Realized and Unrealized Gains ( Losses) on Investments and Foreign
Currency Related Transactions (Note 1) | |
Net realized gains (losses) on: | |
Transactions from investments in non-affiliates | | | 1,051,558,439 | | | | 47,743,771 | | |
Transactions from investments in affiliates | | | 15,979,266 | | | | 2,868,818 | | |
Commodity related transactions | | | 3,291,763 | | | | 1,112,290 | | |
Settlement of foreign currency and foreign currency transactions | | | (3,424,767 | ) | | | (1,704,373 | ) | |
Settlement of forward foreign currency exchange contracts | | | 4,837,211 | | | | 5,058,952 | | |
| | | 1,072,241,912 | | | | 55,079,458 | | |
First Eagle Funds | Annual Report | October 31, 2023
142
October 31, 2023
| | | First Eagle
U.S. Value Fund* | | First Eagle
Gold Fund* | |
Investment Income | |
Interest (net of $489,163, $134,189, $— and $— foreign taxes withheld) | | $ | 7,034,359 | | | $ | 7,636,746 | | |
Dividends from: | | | | | |
Non-affiliates (net of $53,452,548, $27,555,917, $108,581 and $2,629,439
foreign taxes withheld) | | | 20,113,703 | | | | 35,472,745 | | |
Affiliated issuers (net of $227,796, $2,152,390, $— and $334,463 foreign
taxes withheld) | | | — | | | | 1,895,288 | | |
Total Income | | | 27,148,062 | | | | 45,004,779 | | |
Expenses | |
Investment advisory fees (Note 2) | | | 8,874,426 | | | | 16,835,453 | | |
Distributions fees (Note 3) | | | | | |
Class A | | | 1,399,483 | | | | 1,489,822 | | |
Class C | | | 251,796 | | | | 905,870 | | |
Class R3 | | | 178 | | | | 5,357 | | |
Class R4 | | | 41 | | | | 1,640 | | |
Shareholder servicing agent fees | | | 893,545 | | | | 2,181,710 | | |
Service fees (Note 3) | | | | | |
Class C | | | 83,932 | | | | 301,957 | | |
Class R3 | | | 71 | | | | 2,143 | | |
Administrative fees (Note 2) | | | 196,369 | | | | 253,006 | | |
Professional fees | | | 204,821 | | | | 259,200 | | |
Custodian and accounting fees | | | 271,100 | | | | 886,784 | | |
Shareholder reporting fees | | | 86,101 | | | | 217,901 | | |
Trustees' fees | | | 55,706 | | | | 101,584 | | |
Registration and filing fees | | | 129,099 | | | | 157,064 | | |
Other expenses | | | 45,801 | | | | 66,608 | | |
Total Expenses | | | 12,492,469 | | | | 23,666,099 | | |
Expense waiver (Note 2) | | | (591,646 | ) | | | — | | |
Expense reductions due to earnings credits (Note 1) | | | (71,602 | ) | | | (92,766 | ) | |
Net Expenses | | | 11,829,221 | | | | 23,573,333 | | |
Net Investment Income (Note 1) | | | 15,318,841 | | | | 21,431,446 | | |
Realized and Unrealized Gains ( Losses) on Investments and Foreign
Currency Related Transactions (Note 1) | |
Net realized gains (losses) on: | |
Transactions from investments in non-affiliates | | | 64,145,378 | | | | 23,475,012 | | |
Transactions from investments in affiliates | | | — | | | | (1,319,109 | ) | |
Commodity related transactions | | | 5 | | | | (5,382,082 | ) | |
Settlement of foreign currency and foreign currency transactions | | | (1,917 | ) | | | (62,356 | ) | |
Settlement of forward foreign currency exchange contracts | | | — | | | | — | | |
| | | 64,143,466 | | | | 16,711,465 | | |
First Eagle Funds | Annual Report | October 31, 2023
143
Statements of Operations (continued)
| | | First Eagle
Global Fund* | | First Eagle
Overseas Fund* | |
Changes in unrealized appreciation (depreciation) on: | |
Investment in non-affiliates and commodity related transactions (net of decrease
in deferred capital gain country tax accruals of $1,415,825, $471,590, $— and $—) | | $ | 2,748,812,299 | | | $ | 913,642,703 | | |
Investment in affiliates | | | (111,143,293 | ) | | | 30,135,191 | | |
Foreign currency and foreign currency translations | | | 3,564,142 | | | | 1,905,424 | | |
Forward foreign currency exchange contracts | | | 46,203,713 | | | | 25,593,315 | | |
| | | 2,687,436,861 | | | | 971,276,633 | | |
Net realized and unrealized gains (losses) on investments, commodity, foreign
currency and forward contract related transactions | | | 3,759,678,773 | | | | 1,026,356,091 | | |
Net Increase in Net Assets Resulting from Operations | | $ | 4,472,611,866 | | | $ | 1,251,221,843 | | |
* First Eagle Global Fund, First Eagle Overseas Fund, First Eagle U.S. Value Fund and First Eagle Gold Fund financial statements are shown on a consolidated basis and includes the balances of the First Eagle Global Cayman Fund, Ltd., First Eagle Overseas Cayman Fund, Ltd., First Eagle U.S. Value Cayman Fund, Ltd., and First Eagle Gold Cayman Fund, Ltd., respectively.
See Notes to Financial Statements.
First Eagle Funds | Annual Report | October 31, 2023
144
October 31, 2023
| | | First Eagle
U.S. Value Fund* | | First Eagle
Gold Fund* | |
Changes in unrealized appreciation (depreciation) on: | |
Investment in non-affiliates and commodity related transactions (net of decrease
in deferred capital gain country tax accruals of $1,415,825, $471,590, $— and $—) | | $ | 21,683,493 | | | $ | 238,572,089 | | |
Investment in affiliates | | | — | | | | (6,170,396 | ) | |
Foreign currency and foreign currency translations | | | — | | | | 5,474 | | |
Forward foreign currency exchange contracts | | | — | | | | — | | |
| | | 21,683,493 | | | | 232,407,167 | | |
Net realized and unrealized gains (losses) on investments, commodity, foreign
currency and forward contract related transactions | | | 85,826,959 | | | | 249,118,632 | | |
Net Increase in Net Assets Resulting from Operations | | $ | 101,145,800 | | | $ | 270,550,078 | | |
First Eagle Funds | Annual Report | October 31, 2023
145
Statements of Operations (continued)
| | | First Eagle
Global Income
Builder Fund | | First Eagle
High Income Fund | |
Investment Income | |
Interest (net of $3,441, $—, $— and $— foreign taxes withheld) | | $ | 21,679,522 | | | $ | 10,755,478 | | |
Dividends from: | | | | | |
Non-affiliates (net of $3,106,808, $—, $71,741 and $— foreign taxes withheld) | | | 41,190,595 | | | | 2,793 | | |
Total Income | | | 62,870,117 | | | | 10,758,271 | | |
Expenses | |
Investment advisory fees (Note 2) | | | 12,435,699 | | | | 790,978 | | |
Distributions fees (Note 3) | | | | | |
Class A | | | 1,567,812 | | | | 170,460 | | |
Class C | | | 720,326 | | | | 48,469 | | |
Class R3 | | | 153 | | | | 1,119 | | |
Class R4 | | | 56 | | | | 11 | | |
Shareholder servicing agent fees | | | 1,086,569 | | | | 180,630 | | |
Service fees (Note 3) | |
Class C | | | 240,109 | | | | 16,156 | | |
Class R3 | | | 61 | | | | 448 | | |
Administrative fees (Note 2) | | | 829,071 | | | | 87,889 | | |
Professional fees | | | 504,838 | | | | 179,820 | | |
Custodian and accounting fees | | | 421,846 | | | | 176,246 | | |
Shareholder reporting fees | | | 130,516 | | | | 42,400 | | |
Trustees' fees | | | 73,657 | | | | 8,808 | | |
Registration and filing fees | | | 218,632 | | | | 68,496 | | |
Other expenses | | | 51,451 | | | | 29,407 | | |
Total Expenses | | | 18,280,796 | | | | 1,801,337 | | |
Expense waiver (Note 2) | | | — | | | | (257,606 | ) | |
Expense reductions due to earnings credits (Note 1) | | | (45,051 | ) | | | (30,122 | ) | |
Net Expenses | | | 18,235,745 | | | | 1,513,609 | | |
Net Investment Income (Note 1) | | | 44,634,372 | | | | 9,244,662 | | |
Realized and Unrealized Gains (Losses) on Investments and Foreign
Currency Related Transactions (Note 1) | |
Net realized gains (losses) on: | |
Transactions from investments in non-affiliates | | | 9,092,491 | | | | (5,689,578 | ) | |
Commodity related transactions | | | 359,658 | | | | — | | |
Settlement of foreign currency and foreign currency transactions | | | (79,343 | ) | | | — | | |
Settlement of forward foreign currency exchange contracts | | | (160,464 | ) | | | — | | |
Expiration or closing of option contracts written | | | 5,211,627 | | | | — | | |
| | | 14,423,969 | | | | (5,689,578 | ) | |
First Eagle Funds | Annual Report | October 31, 2023
146
October 31, 2023
| | | First Eagle
Rising
Dividend Fund** | | First Eagle
Small Cap
Opportunity Fund | |
Investment Income | |
Interest (net of $3,441, $—, $— and $— foreign taxes withheld) | | $ | 247,581 | | | $ | — | | |
Dividends from: | | | | | |
Non-affiliates (net of $3,106,808, $—, $71,741 and $— foreign taxes withheld) | | | 8,950,941 | | | | 13,092,595 | | |
Total Income | | | 9,198,522 | | | | 13,092,595 | | |
Expenses | |
Investment advisory fees (Note 2) | | | 1,872,616 | | | | 8,472,827 | | |
Distributions fees (Note 3) | | | | | |
Class A | | | 643,060 | | | | 136,618 | | |
Class C | | | 92,796 | | | | — | | |
Class R3 | | | 143 | | | | — | | |
Class R4 | | | 36 | | | | — | | |
Shareholder servicing agent fees | | | 428,114 | | | | 1,145,919 | | |
Service fees (Note 3) | |
Class C | | | 30,932 | | | | — | | |
Class R3 | | | 57 | | | | — | | |
Administrative fees (Note 2) | | | 221,819 | | | | 466,842 | | |
Professional fees | | | 214,429 | | | | 200,988 | | |
Custodian and accounting fees | | | 162,256 | | | | 173,114 | | |
Shareholder reporting fees | | | 77,712 | | | | 97,562 | | |
Trustees' fees | | | — | | | | 33,353 | | |
Registration and filing fees | | | 101,396 | | | | 244,197 | | |
Other expenses | | | 28,186 | | | | 40,406 | | |
Total Expenses | | | 3,873,552 | | | | 11,011,826 | | |
Expense waiver (Note 2) | | | (612,469 | ) | | | (869,382 | ) | |
Expense reductions due to earnings credits (Note 1) | | | (60,726 | ) | | | (15,385 | ) | |
Net Expenses | | | 3,200,357 | | | | 10,127,059 | | |
Net Investment Income (Note 1) | | | 5,998,165 | | | | 2,965,536 | | |
Realized and Unrealized Gains (Losses) on Investments and Foreign
Currency Related Transactions (Note 1) | |
Net realized gains (losses) on: | |
Transactions from investments in non-affiliates | | | 25,026,977 | | | | (46,405,081 | ) | |
Commodity related transactions | | | — | | | | — | | |
Settlement of foreign currency and foreign currency transactions | | | (41,836 | ) | | | — | | |
Settlement of forward foreign currency exchange contracts | | | — | | | | — | | |
Expiration or closing of option contracts written | | | — | | | | — | | |
| | | 24,985,141 | | | | (46,405,081 | ) | |
First Eagle Funds | Annual Report | October 31, 2023
147
Statements of Operations (continued)
| | | First Eagle
Global Income
Builder Fund | | First Eagle
High Income Fund | |
Changes in unrealized appreciation (depreciation) on: | |
Investment in non-affiliates and commodity related transactions (net of decrease
in deferred capital gain country tax accruals of $22,388, $—, $— and $—) | | $ | 27,557,576 | | | $ | 6,112,959 | | |
Foreign currency and foreign currency translations | | | 172,576 | | | | — | | |
Forward foreign currency exchange contracts | | | 1,213,151 | | | | — | | |
Option contracts written | | | 1,930,458 | | | | — | | |
| | | 30,873,761 | | | | 6,112,959 | | |
Net realized and unrealized gains (losses) on investments, commodity, foreign
currency and forward contract related transactions and option contracts written | | | 45,297,730 | | | | 423,381 | | |
Net Increase (Decrease) in Net Assets Resulting from Operations | | $ | 89,932,102 | | | $ | 9,668,043 | | |
** First Eagle Rising Dividend Fund was known as First Eagle Fund of America prior to March 1, 2023.
See Notes to Financial Statements.
First Eagle Funds | Annual Report | October 31, 2023
148
October 31, 2023
| | | First Eagle
Rising
Dividend Fund** | | First Eagle
Small Cap
Opportunity Fund | |
Changes in unrealized appreciation (depreciation) on: | |
Investment in non-affiliates and commodity related transactions (net of decrease
in deferred capital gain country tax accruals of $22,388, $—, $— and $—) | | $ | 19,182,969 | | | $ | (60,991,729 | ) | |
Foreign currency and foreign currency translations | | | (10,772 | ) | | | — | | |
Forward foreign currency exchange contracts | | | — | | | | — | | |
Option contracts written | | | — | | | | — | | |
| | | 19,172,197 | | | | (60,991,729 | ) | |
Net realized and unrealized gains (losses) on investments, commodity, foreign
currency and forward contract related transactions and option contracts written | | | 44,157,338 | | | | (107,396,810 | ) | |
Net Increase (Decrease) in Net Assets Resulting from Operations | | $ | 50,155,503 | | | $ | (104,431,274 | ) | |
First Eagle Funds | Annual Report | October 31, 2023
149
Statements of Operations (continued)
| | | First Eagle
U.S. Smid Cap
Opportunity Fund | | First Eagle
Global Real
Assets Fund* | |
Investment Income | |
Interest (net of $— and $— foreign taxes withheld) | | $ | — | | | $ | 3,809 | | |
Dividends from: | | | | | |
Non-affiliates (net of $— and $13,027 foreign taxes withheld) | | | 251,526 | | | | 325,560 | | |
Total Income | | | 251,526 | | | | 329,369 | | |
Expenses | |
Investment advisory fees (Note 2) | | | 134,562 | | | | 74,433 | | |
Distributions fees (Note 3) | |
Class A | | | 153 | | | | 3,979 | | |
Shareholder servicing agent fees | | | 2,813 | | | | 5,371 | | |
Administrative fees (Note 2) | | | 19,627 | | | | 89,715 | | |
Professional fees | | | 180,922 | | | | 240,218 | | |
Custodian and accounting fees | | | 86,026 | | | | 131,369 | | |
Shareholder reporting fees | | | 50,848 | | | | 15,958 | | |
Trustees' fees | | | 1,015 | | | | 9,306 | | |
Registration and filing fees | | | 59,027 | | | | 35,294 | | |
Other expenses | | | 3,582 | | | | 27,338 | | |
Total Expenses | | | 538,575 | | | | 632,981 | | |
Expense waiver (Note 2) | | | (365,641 | ) | | | (529,902 | ) | |
Expense reductions due to earnings credits (Note 1) | | | (1,557 | ) | | | (1,695 | ) | |
Net Expenses | | | 171,377 | | | | 101,384 | | |
Net Investment Income (Note 1) | | | 80,149 | | | | 227,985 | | |
Realized and Unrealized Gains (Losses) on
Investments and Foreign Currency Related
Transactions (Note 1) | |
Net realized gains (losses) on: | |
Transactions from investments in non-affiliates | | | (71,616 | ) | | | (34,919 | ) | |
Settlement of foreign currency and foreign currency
transactions | | | — | | | | (1,120 | ) | |
| | | | (71,616 | ) | | | (36,039 | ) | |
Changes in unrealized appreciation (depreciation) on: | |
Investment in non-affiliates and commodity related
transactions (net of decrease in deferred capital gain
country tax accruals of $— and $—) | | | (716,756 | ) | | | 74,512 | | |
Foreign currency and foreign currency translations | | | — | | | | 47 | | |
| | | | (716,756 | ) | | | 74,559 | | |
Net realized and unrealized gains (losses) on investments,
commodity, foreign currency related transactions | | | (788,372 | ) | | | 38,520 | | |
Net Increase (Decrease) in Net Assets Resulting
from Operations | | $ | (708,223 | ) | | $ | 266,505 | | |
* First Eagle Global Real Assets Fund financial statements are shown on a consolidated basis and includes the balances of the First Eagle Global Real Asset Cayman Fund, Ltd.
See Notes to Financial Statements.
First Eagle Funds | Annual Report | October 31, 2023
150
This page was intentionally left blank.
Statements of Changes in Net Assets
| | | First Eagle
Global Fund* | | First Eagle
Overseas Fund* | |
| | | For the
Year Ended
October 31, 2023 | | For the
Year Ended
October 31, 2022 | | For the
Year Ended
October 31, 2023 | | For the
Year Ended
October 31, 2022 | |
Operations | |
Net investment income | | $ | 712,933,093 | | | $ | 457,314,720 | | | $ | 224,865,752 | | | $ | 189,690,854 | | |
Net realized gain (loss) on investments, commodity, foreign currency
and forward contract related transactions | | | 1,072,241,912 | | | | 1,946,747,824 | | | | 55,079,458 | | | | 560,679,922 | | |
Change in unrealized appreciation (depreciation) on investments,
commodity, foreign currency and forward contract related translations | | | 2,687,436,861 | | | | (8,317,863,790 | ) | | | 971,276,633 | | | | (2,854,703,672 | ) | |
Net increase (decrease) in net assets resulting from operations | | | 4,472,611,866 | | | | (5,913,801,246 | ) | | | 1,251,221,843 | | | | (2,104,332,896 | ) | |
Distributions to Shareholders | |
Distributable earnings: | |
Class A | | | (532,262,215 | ) | | | (887,753,790 | ) | | | (51,515,550 | ) | | | (102,137,338 | ) | |
Class C | | | (73,844,904 | ) | | | (132,799,923 | ) | | | (3,499,629 | ) | | | (7,259,256 | ) | |
Class I | | | (1,201,145,307 | ) | | | (1,844,356,025 | ) | | | (330,889,508 | ) | | | (614,760,402 | ) | |
Class R3 | | | (300,468 | ) | | | (67,027 | ) | | | (10,928 | ) | | | (19,902 | ) | |
Class R4 | | | (52,892 | ) | | | (120,800 | ) | | | (516,040 | ) | | | (576,641 | ) | |
Class R5 | | | (4,292 | ) | | | (6,725 | ) | | | (1,389 | ) | | | (3,821 | ) | |
Class R6 | | | (78,042,283 | ) | | | (131,255,084 | ) | | | (51,189,271 | ) | | | (88,673,786 | ) | |
Decrease in net assets resulting from distributions | | | (1,885,652,361 | ) | | | (2,996,359,374 | ) | | | (437,622,315 | ) | | | (813,431,146 | ) | |
Fund Share Transactions | |
Class A | | | | | | | | | |
Net proceeds from shares sold | | | 932,378,681 | | | | 1,182,824,369 | | | | 129,738,590 | | | | 194,202,849 | | |
Net asset value of shares issued for reinvested dividends and distributions | | | 462,969,675 | | | | 771,492,296 | | | | 46,987,934 | | | | 93,004,480 | | |
Cost of shares redeemed | | | (1,756,209,796 | ) | | | (1,866,821,008 | ) | | | (315,584,580 | ) | | | (412,816,545 | ) | |
Increase (decrease) in net assets from Fund share transactions | | | (360,861,440 | ) | | | 87,495,657 | | | | (138,858,056 | ) | | | (125,609,216 | ) | |
Class C | | | | | | | | | |
Net proceeds from shares sold | | | 159,243,316 | | | | 167,583,781 | | | | 10,028,422 | | | | 8,129,789 | | |
Net asset value of shares issued for reinvested dividends and distributions | | | 69,690,281 | | | | 124,431,035 | | | | 3,306,288 | | | | 6,746,821 | | |
Cost of shares redeemed | | | (577,794,408 | ) | | | (761,341,546 | ) | | | (38,244,224 | ) | | | (51,235,080 | ) | |
Decrease in net assets from Fund share transactions | | | (348,860,811 | ) | | | (469,326,730 | ) | | | (24,909,514 | ) | | | (36,358,470 | ) | |
Class I | | | | | | | | | |
Net proceeds from shares sold | | | 5,159,536,258 | | | | 5,297,637,292 | | | | 2,516,370,739 | | | | 2,452,117,096 | | |
Net asset value of shares issued for reinvested dividends and distributions | | | 1,040,505,108 | | | | 1,581,825,307 | | | | 293,043,001 | | | | 551,561,993 | | |
Cost of shares redeemed | | | (4,792,999,401 | ) | | | (4,764,010,265 | ) | | | (2,754,833,013 | ) | | | (3,417,433,001 | ) | |
Increase (decrease) in net assets from Fund share transactions | | | 1,407,041,965 | | | | 2,115,452,334 | | | | 54,580,727 | | | | (413,753,912 | ) | |
Class R3 | | | | | | | | | |
Net proceeds from shares sold | | | 9,928,674 | | | | 8,283,108 | | | | 96,333 | | | | 89,417 | | |
Net asset value of shares issued for reinvested dividends and distributions | | | 300,468 | | | | 67,027 | | | | 10,928 | | | | 19,902 | | |
Cost of shares redeemed | | | (5,240,478 | ) | | | (1,396,981 | ) | | | (24,725 | ) | | | (111,375 | ) | |
Increase (decrease) in net assets from Fund share transactions | | | 4,988,664 | | | | 6,953,154 | | | | 82,536 | | | | (2,056 | ) | |
First Eagle Funds | Annual Report | October 31, 2023
152
| | | First Eagle
U.S. Value Fund* | | First Eagle
Gold Fund* | |
| | | For the
Year Ended
October 31, 2023 | | For the
Year Ended
October 31, 2022 | | For the
Year Ended
October 31, 2023 | | For the
Year Ended
October 31, 2022 | |
Operations | |
Net investment income | | $ | 15,318,841 | | | $ | 9,225,295 | | | $ | 21,431,446 | | | $ | 7,788,278 | | |
Net realized gain (loss) on investments, commodity, foreign currency
and forward contract related transactions | | | 64,143,466 | | | | 87,821,395 | | | | 16,711,465 | | | | (6,051,841 | ) | |
Change in unrealized appreciation (depreciation) on investments,
commodity, foreign currency and forward contract related translations | | | 21,683,493 | | | | (211,933,175 | ) | | | 232,407,167 | | | | (338,058,322 | ) | |
Net increase (decrease) in net assets resulting from operations | | | 101,145,800 | | | | (114,886,485 | ) | | | 270,550,078 | | | | (336,321,885 | ) | |
Distributions to Shareholders | |
Distributable earnings: | |
Class A | | | (42,377,864 | ) | | | (53,052,982 | ) | | | — | | | | (5,573,400 | ) | |
Class C | | | (2,657,277 | ) | | | (4,233,440 | ) | | | — | | | | (343,996 | ) | |
Class I | | | (42,529,115 | ) | | | (49,533,778 | ) | | | — | | | | (15,999,745 | ) | |
Class R3 | | | (4,891 | ) | | | (5,774 | ) | | | — | | | | (11,410 | ) | |
Class R4 | | | (2,596 | ) | | | (1,055 | ) | | | — | | | | (9,117 | ) | |
Class R5 | | | (5,988 | ) | | | (6,233 | ) | | | — | | | | (4,694 | ) | |
Class R6 | | | (2,106,071 | ) | | | (2,212,723 | ) | | | — | | | | (1,358,289 | ) | |
Decrease in net assets resulting from distributions | | | (89,683,802 | ) | | | (109,045,985 | ) | | | — | | | | (23,300,651 | ) | |
Fund Share Transactions | |
Class A | | | | | | | | | |
Net proceeds from shares sold | | | 31,596,683 | | | | 47,475,322 | | | | 119,158,024 | | | | 136,526,999 | | |
Net asset value of shares issued for reinvested dividends and distributions | | | 37,419,319 | | | | 46,028,292 | | | | — | | | | 5,272,465 | | |
Cost of shares redeemed | | | (78,260,209 | ) | | | (83,546,172 | ) | | | (141,281,427 | ) | | | (127,981,717 | ) | |
Increase (decrease) in net assets from Fund share transactions | | | (9,244,207 | ) | | | 9,957,442 | | | | (22,123,403 | ) | | | 13,817,747 | | |
Class C | | | | | | | | | |
Net proceeds from shares sold | | | 4,437,835 | | | | 5,432,456 | | | | 16,654,612 | | | | 19,039,520 | | |
Net asset value of shares issued for reinvested dividends and distributions | | | 2,429,213 | | | | 3,904,705 | | | | — | | | | 318,229 | | |
Cost of shares redeemed | | | (12,768,012 | ) | | | (19,670,181 | ) | | | (29,044,356 | ) | | | (38,215,792 | ) | |
Decrease in net assets from Fund share transactions | | | (5,900,964 | ) | | | (10,333,020 | ) | | | (12,389,744 | ) | | | (18,858,043 | ) | |
Class I | | | | | | | | | |
Net proceeds from shares sold | | | 90,166,671 | | | | 125,720,994 | | | | 511,516,624 | | | | 452,464,455 | | |
Net asset value of shares issued for reinvested dividends and distributions | | | 28,326,301 | | | | 30,253,156 | | | | — | | | | 14,000,367 | | |
Cost of shares redeemed | | | (121,635,227 | ) | | | (99,876,278 | ) | | | (398,085,068 | ) | | | (522,992,298 | ) | |
Increase (decrease) in net assets from Fund share transactions | | | (3,142,255 | ) | | | 56,097,872 | | | | 113,431,556 | | | | (56,527,476 | ) | |
Class R3 | | | | | | | | | |
Net proceeds from shares sold | | | 765 | | | | 270 | | | | 1,343,375 | | | | 813,440 | | |
Net asset value of shares issued for reinvested dividends and distributions | | | 4,890 | | | | 5,774 | | | | — | | | | 11,410 | | |
Cost of shares redeemed | | | (67 | ) | | | (8 | ) | | | (1,292,873 | ) | | | (980,977 | ) | |
Increase (decrease) in net assets from Fund share transactions | | | 5,588 | | | | 6,036 | | | | 50,502 | | | | (156,127 | ) | |
First Eagle Funds | Annual Report | October 31, 2023
153
Statements of Changes in Net Assets (continued)
| | | First Eagle
Global Fund* | | First Eagle
Overseas Fund* | |
| | | For the
Year Ended
October 31, 2023 | | For the
Year Ended
October 31, 2022 | | For the
Year Ended
October 31, 2023 | | For the
Year Ended
October 31, 2022 | |
Class R4 | | | | | | | | | |
Net proceeds from shares sold | | | 578,415 | | | | 1,038,726 | | | | 1,937,720 | | | | 13,912,646 | | |
Net asset value of shares issued for reinvested dividends and distributions | | | 52,892 | | | | 120,800 | | | | 516,040 | | | | 576,641 | | |
Cost of shares redeemed | | | (216,094 | ) | | | (1,544,248 | ) | | | (11,386,911 | ) | | | (8,452,427 | ) | |
Increase (decrease) in net assets from Fund share transactions | | | 415,213 | | | | (384,722 | ) | | | (8,933,151 | ) | | | 6,036,860 | | |
Class R5 | | | | | | | | | |
Net proceeds from shares sold | | | 137,361 | | | | 4,311 | | | | 14,664 | | | | 78,964 | | |
Net asset value of shares issued for reinvested dividends and distributions | | | 4,292 | | | | 6,725 | | | | 1,389 | | | | 1,541 | | |
Cost of shares redeemed | | | (37,471 | ) | | | (848 | ) | | | (17,469 | ) | | | (102,209 | ) | |
Increase (decrease) in net assets from Fund share transactions | | | 104,182 | | | | 10,188 | | | | (1,416 | ) | | | (21,704 | ) | |
Class R6 | | | | | | | | | |
Net proceeds from shares sold | | | 519,884,403 | | | | 591,696,468 | | | | 201,676,513 | | | | 148,248,855 | | |
Net asset value of shares issued for reinvested dividends and distributions | | | 69,480,659 | | | | 118,445,610 | | | | 50,566,252 | | | | 88,413,667 | | |
Cost of shares redeemed | | | (326,508,848 | ) | | | (717,034,874 | ) | | | (313,273,802 | ) | | | (233,216,655 | ) | |
Increase (decrease) in net assets from Fund share transactions | | | 262,856,214 | | | | (6,892,796 | ) | | | (61,031,037 | ) | | | 3,445,867 | | |
Increase (decrease) in net assets from Fund share transactions | | | 965,683,987 | | | | 1,733,307,085 | | | | (179,069,911 | ) | | | (566,262,631 | ) | |
Net increase (decrease) in net assets | | | 3,552,643,492 | | | | (7,176,853,535 | ) | | | 634,529,617 | | | | (3,484,026,673 | ) | |
Net Assets (Note 1) | |
Beginning of period | | | 42,929,380,458 | | | | 50,106,233,993 | | | | 11,217,936,439 | | | | 14,701,963,112 | | |
End of period | | $ | 46,482,023,950 | | | $ | 42,929,380,458 | | | $ | 11,852,466,056 | | | $ | 11,217,936,439 | | |
Changes in Shares Outstanding | |
Class A | |
Shares outstanding, beginning of period | | | 222,066,205 | | | | 220,800,407 | | | | 65,581,973 | | | | 70,974,129 | | |
Shares sold | | | 15,270,294 | | | | 19,157,991 | | | | 5,528,830 | | | | 8,142,552 | | |
Shares issued on reinvestment of distributions | | | 7,841,628 | | | | 12,524,226 | | | | 2,061,779 | | | | 3,814,786 | | |
Shares redeemed | | | (28,815,471 | ) | | | (30,416,419 | ) | | | (13,515,987 | ) | | | (17,349,494 | ) | |
Shares outstanding, end of period | | | 216,362,656 | | | | 222,066,205 | | | | 59,656,595 | | | | 65,581,973 | | |
Class C | |
Shares outstanding, beginning of period | | | 32,037,627 | | | | 39,993,648 | | | | 4,564,760 | | | | 6,180,394 | | |
Shares sold | | | 2,722,928 | | | | 2,805,075 | | | | 449,507 | | | | 347,938 | | |
Shares issued on reinvestment of distributions | | | 1,232,366 | | | | 2,091,278 | | | | 152,504 | | | | 288,449 | | |
Shares redeemed | | | (9,908,823 | ) | | | (12,852,374 | ) | | | (1,722,353 | ) | | | (2,252,021 | ) | |
Shares outstanding, end of period | | | 26,084,098 | | | | 32,037,627 | | | | 3,444,418 | | | | 4,564,760 | | |
Class I | |
Shares outstanding, beginning of period | | | 472,421,232 | | | | 439,008,116 | | | | 387,720,084 | | | | 404,269,481 | | |
Shares sold | | | 83,957,617 | | | | 85,489,726 | | | | 104,305,822 | | | | 101,298,361 | | |
Shares issued on reinvestment of distributions | | | 17,531,678 | | | | 25,550,401 | | | | 12,544,649 | | | | 22,088,987 | | |
Shares redeemed | | | (78,315,447 | ) | | | (77,627,011 | ) | | | (115,256,948 | ) | | | (139,936,745 | ) | |
Shares outstanding, end of period | | | 495,595,080 | | | | 472,421,232 | | | | 389,313,607 | | | | 387,720,084 | | |
First Eagle Funds | Annual Report | October 31, 2023
154
| | | First Eagle
U.S. Value Fund* | | First Eagle
Gold Fund* | |
| | | For the
Year Ended
October 31, 2023 | | For the
Year Ended
October 31, 2022 | | For the
Year Ended
October 31, 2023 | | For the
Year Ended
October 31, 2022 | |
Class R4 | | | | | | | | | |
Net proceeds from shares sold | | | 7,615 | | | | 20,612 | | | | 398,418 | | | | 1,311,538 | | |
Net asset value of shares issued for reinvested dividends and distributions | | | 2,596 | | | | 1,055 | | | | — | | | | 9,117 | | |
Cost of shares redeemed | | | (53 | ) | | | (8 | ) | | | (343,359 | ) | | | (543,647 | ) | |
Increase (decrease) in net assets from Fund share transactions | | | 10,158 | | | | 21,659 | | | | 55,059 | | | | 777,008 | | |
Class R5 | | | | | | | | | |
Net proceeds from shares sold | | | 11,188 | | | | 24,565 | | | | 188,286 | | | | 298,054 | | |
Net asset value of shares issued for reinvested dividends and distributions | | | 928 | | | | 1,075 | | | | — | | | | 4,550 | | |
Cost of shares redeemed | | | (1,937 | ) | | | (11,379 | ) | | | (408,878 | ) | | | (26,344 | ) | |
Increase (decrease) in net assets from Fund share transactions | | | 10,179 | | | | 14,261 | | | | (220,592 | ) | | | 276,260 | | |
Class R6 | | | | | | | | | |
Net proceeds from shares sold | | | 10,454,050 | | | | 9,424,409 | | | | 61,445,816 | | | | 53,488,559 | | |
Net asset value of shares issued for reinvested dividends and distributions | | | 2,096,998 | | | | 2,189,977 | | | | — | | | | 1,340,795 | | |
Cost of shares redeemed | | | (6,373,402 | ) | | | (6,717,531 | ) | | | (35,549,281 | ) | | | (31,213,306 | ) | |
Increase (decrease) in net assets from Fund share transactions | | | 6,177,646 | | | | 4,896,855 | | | | 25,896,535 | | | | 23,616,048 | | |
Increase (decrease) in net assets from Fund share transactions | | | (12,083,855 | ) | | | 60,661,105 | | | | 104,699,913 | | | | (37,054,583 | ) | |
Net increase (decrease) in net assets | | | (621,857 | ) | | | (163,271,365 | ) | | | 375,249,991 | | | | (396,677,119 | ) | |
Net Assets (Note 1) | |
Beginning of period | | | 1,139,756,137 | | | | 1,303,027,502 | | | | 1,782,328,093 | | | | 2,179,005,212 | | |
End of period | | $ | 1,139,134,280 | | | $ | 1,139,756,137 | | | $ | 2,157,578,084 | | | $ | 1,782,328,093 | | |
Changes in Shares Outstanding | |
Class A | |
Shares outstanding, beginning of period | | | 29,351,025 | | | | 28,742,223 | | | | 25,679,365 | | | | 25,243,851 | | |
Shares sold | | | 1,704,389 | | | | 2,428,210 | | | | 5,013,496 | | | | 5,983,477 | | |
Shares issued on reinvestment of distributions | | | 2,066,224 | | | | 2,393,567 | | | | — | | | | 239,982 | | |
Shares redeemed | | | (4,205,655 | ) | | | (4,212,975 | ) | | | (6,038,784 | ) | | | (5,787,945 | ) | |
Shares outstanding, end of period | | | 28,915,983 | | | | 29,351,025 | | | | 24,654,077 | | | | 25,679,365 | | |
Class C | |
Shares outstanding, beginning of period | | | 2,009,999 | | | | 2,557,732 | | | | 5,969,493 | | | | 6,938,928 | | |
Shares sold | | | 253,839 | | | | 296,957 | | | | 769,747 | | | | 913,518 | | |
Shares issued on reinvestment of distributions | | | 141,976 | | | | 213,488 | | | | — | | | | 15,840 | | |
Shares redeemed | | | (725,939 | ) | | | (1,058,178 | ) | | | (1,362,681 | ) | | | (1,898,793 | ) | |
Shares outstanding, end of period | | | 1,679,875 | | | | 2,009,999 | | | | 5,376,559 | | | | 5,969,493 | | |
Class I | |
Shares outstanding, beginning of period | | | 28,579,801 | | | | 25,734,780 | | | | 54,080,450 | | | | 56,991,845 | | |
Shares sold | | | 4,743,922 | | | | 6,336,739 | | | | 20,867,430 | | | | 19,631,559 | | |
Shares issued on reinvestment of distributions | | | 1,529,498 | | | | 1,541,169 | | | | — | | | | 618,391 | | |
Shares redeemed | | | (6,369,271 | ) | | | (5,032,887 | ) | | | (16,491,781 | ) | | | (23,161,345 | ) | |
Shares outstanding, end of period | | | 28,483,950 | | | | 28,579,801 | | | | 58,456,099 | | | | 54,080,450 | | |
First Eagle Funds | Annual Report | October 31, 2023
155
Statements of Changes in Net Assets (continued)
| | | First Eagle
Global Fund* | | First Eagle
Overseas Fund* | |
| | | For the
Year Ended
October 31, 2023 | | For the
Year Ended
October 31, 2022 | | For the
Year Ended
October 31, 2023 | | For the
Year Ended
October 31, 2022 | |
Class R3 | |
Shares outstanding, beginning of period | | | 126,209 | | | | 18,803 | | | | 13,692 | | | | 14,036 | | |
Shares sold | | | 161,680 | | | | 129,610 | | | | 3,975 | | | | 3,580 | | |
Shares issued on reinvestment of distributions | | | 5,091 | | | | 1,088 | | | | 469 | | | | 798 | | |
Shares redeemed | | | (87,012 | ) | | | (23,292 | ) | | | (1,044 | ) | | | (4,722 | ) | |
Shares outstanding, end of period | | | 205,968 | | | | 126,209 | | | | 17,092 | | | | 13,692 | | |
Class R4 | |
Shares outstanding, beginning of period | | | 22,267 | | | | 30,042 | | | | 576,504 | | | | 375,210 | | |
Shares sold | | | 9,476 | | | | 16,282 | | | | 81,848 | | | | 559,606 | | |
Shares issued on reinvestment of distributions | | | 890 | | | | 1,951 | | | | 22,138 | | | | 23,149 | | |
Shares redeemed | | | (3,499 | ) | | | (26,008 | ) | | | (463,654 | ) | | | (381,461 | ) | |
Shares outstanding, end of period | | | 29,134 | | | | 22,267 | | | | 216,836 | | | | 576,504 | | |
Class R5 | |
Shares outstanding, beginning of period | | | 1,782 | | | | 1,616 | | | | 1,735 | | | | 2,583 | | |
Shares sold | | | 2,209 | | | | 70 | | | | 604 | | | | 3,086 | | |
Shares issued on reinvestment of distributions | | | 73 | | | | 110 | | | | 60 | | | | 62 | | |
Shares redeemed | | | (594 | ) | | | (14 | ) | | | (710 | ) | | | (3,996 | ) | |
Shares outstanding, end of period | | | 3,470 | | | | 1,782 | | | | 1,689 | | | | 1,735 | | |
Class R6 | |
Shares outstanding, beginning of period | | | 29,816,528 | | | | 30,779,066 | | | | 57,482,854 | | | | 57,163,246 | | |
Shares sold | | | 8,429,172 | | | | 9,537,442 | | | | 8,315,489 | | | | 6,184,889 | | |
Shares issued on reinvestment of distributions | | | 1,170,694 | | | | 1,913,190 | | | | 2,165,578 | | | | 3,542,214 | | |
Shares redeemed | | | (5,315,204 | ) | | | (12,413,170 | ) | | | (12,938,270 | ) | | | (9,407,495 | ) | |
Shares outstanding, end of period | | | 34,101,190 | | | | 29,816,528 | | | | 55,025,651 | | | | 57,482,854 | | |
* First Eagle Global Fund, First Eagle Overseas Fund, First Eagle U.S. Value Fund and First Eagle Gold Fund financial statements are shown on a consolidated basis and includes the balances of the First Eagle Global Cayman Fund, Ltd., First Eagle Overseas Cayman Fund, Ltd., First Eagle U.S. Value Cayman Fund, Ltd., and First Eagle Gold Cayman Fund, Ltd., respectively.
See Notes to Financial Statements.
First Eagle Funds | Annual Report | October 31, 2023
156
| | | First Eagle
U.S. Value Fund* | | First Eagle
Gold Fund* | |
| | | For the
Year Ended
October 31, 2023 | | For the
Year Ended
October 31, 2022 | | For the
Year Ended
October 31, 2023 | | For the
Year Ended
October 31, 2022 | |
Class R3 | |
Shares outstanding, beginning of period | | | 3,437 | | | | 3,130 | | | | 51,308 | | | | 57,335 | | |
Shares sold | | | 40 | | | | 13 | | | | 59,899 | | | | 34,672 | | |
Shares issued on reinvestment of distributions | | | 264 | | | | 294 | | | | — | | | | 505 | | |
Shares redeemed | | | (4 | ) | | | — | | | | (55,282 | ) | | | (41,204 | ) | |
Shares outstanding, end of period | | | 3,737 | | | | 3,437 | | | | 55,925 | | | | 51,308 | | |
Class R4 | |
Shares outstanding, beginning of period | | | 1,735 | | | | 568 | | | | 66,536 | | | | 34,208 | | |
Shares sold | | | 408 | | | | 1,113 | | | | 15,900 | | | | 57,045 | | |
Shares issued on reinvestment of distributions | | | 141 | | | | 54 | | | | — | | | | 401 | | |
Shares redeemed | | | (3 | ) | | | — | | | | (14,144 | ) | | | (25,118 | ) | |
Shares outstanding, end of period | | | 2,281 | | | | 1,735 | | | | 68,292 | | | | 66,536 | | |
Class R5 | |
Shares outstanding, beginning of period | | | 4,005 | | | | 3,298 | | | | 29,137 | | | | 18,471 | | |
Shares sold | | | 594 | | | | 1,214 | | | | 7,209 | | | | 11,622 | | |
Shares issued on reinvestment of distributions | | | 50 | | | | 55 | | | | — | | | | 201 | | |
Shares redeemed | | | (97 | ) | | | (562 | ) | | | (16,203 | ) | | | (1,157 | ) | |
Shares outstanding, end of period | | | 4,552 | | | | 4,005 | | | | 20,143 | | | | 29,137 | | |
Class R6 | |
Shares outstanding, beginning of period | | | 1,375,767 | | | | 1,130,595 | | | | 5,291,172 | | | | 4,347,949 | | |
Shares sold | | | 546,773 | | | | 470,343 | | | | 2,500,821 | | | | 2,269,800 | | |
Shares issued on reinvestment of distributions | | | 113,290 | | | | 111,620 | | | | — | | | | 59,118 | | |
Shares redeemed | | | (330,715 | ) | | | (336,791 | ) | | | (1,438,490 | ) | | | (1,385,695 | ) | |
Shares outstanding, end of period | | | 1,705,115 | | | | 1,375,767 | | | | 6,353,503 | | | | 5,291,172 | | |
First Eagle Funds | Annual Report | October 31, 2023
157
Statements of Changes in Net Assets (continued)
| | | First Eagle
Global Income Builder Fund | | First Eagle
High Income Fund | |
| | | For the
Year Ended
October 31, 2023 | | For the
Year Ended
October 31, 2022 | | For the
Year Ended
October 31, 2023 | | For the
Year Ended
October 31, 2022 | |
Operations | |
Net investment income (loss) | | $ | 44,634,372 | | | $ | 30,681,489 | | | $ | 9,244,662 | | | $ | 9,023,686 | | |
Net realized gain (loss) on investments, commodity, foreign currency
and forward contract related transactions and option contracts written | | | 14,423,969 | | | | 30,060,613 | | | | (5,689,578 | ) | | | (4,500,753 | ) | |
Change in unrealized appreciation (depreciation) on investments,
commodity, foreign currency and forward contract related translations
and option contracts written | | | 30,873,761 | | | | (179,390,272 | ) | | | 6,112,959 | | | | (24,985,566 | ) | |
Net increase (decrease) in net assets resulting from operations | | | 89,932,102 | | | | (118,648,170 | ) | | | 9,668,043 | | | | (20,462,633 | ) | |
Distributions to Shareholders | |
Distributable earnings: | |
Class A | | | (23,879,471 | ) | | | (31,633,200 | ) | | | (3,483,395 | ) | | | (3,347,056 | ) | |
Class C | | | (2,938,884 | ) | | | (6,507,996 | ) | | | (280,628 | ) | | | (377,549 | ) | |
Class I | | | (35,201,941 | ) | | | (45,872,345 | ) | | | (5,193,256 | ) | | | (5,163,847 | ) | |
Class R3 | | | (2,189 | ) | | | (3,661 | ) | | | (22,398 | ) | | | (17,682 | ) | |
Class R4 | | | (2,016 | ) | | | (1,847 | ) | | | (458 | ) | | | (375 | ) | |
Class R5 | | | (456 | ) | | | (747 | ) | | | (561 | ) | | | (456 | ) | |
Class R6 | | | (2,430,376 | ) | | | (1,981,325 | ) | | | (190,124 | ) | | | (47,703 | ) | |
Class Y | | | — | | | | — | | | | — | | | | — | | |
Decrease in net assets resulting from distributions | | | (64,455,333 | ) | | | (86,001,121 | ) | | | (9,170,820 | ) | | | (8,954,668 | ) | |
Fund Share Transactions | |
Class A | | | | | | | | | |
Net proceeds from shares sold | | | 158,702,246 | | | | 191,100,234 | | | | 12,149,183 | | | | 14,920,601 | | |
Net asset value of shares issued for reinvested dividends and distributions | | | 21,600,036 | | | | 28,735,474 | | | | 3,349,892 | | | | 3,210,190 | | |
Cost of shares redeemed | | | (108,924,372 | ) | | | (94,392,245 | ) | | | (20,147,817 | ) | | | (22,274,378 | ) | |
Increase (decrease) in net assets from Fund share transactions | | | 71,377,910 | | | | 125,443,463 | | | | (4,648,742 | ) | | | (4,143,587 | ) | |
Class C | | | | | | | | | |
Net proceeds from shares sold | | | 14,625,134 | | | | 13,101,415 | | | | 1,457,329 | | | | 764,680 | | |
Net asset value of shares issued for reinvested dividends and distributions | | | 2,788,213 | | | | 6,183,312 | | | | 279,899 | | | | 376,204 | | |
Cost of shares redeemed | | | (37,629,227 | ) | | | (56,197,995 | ) | | | (4,216,419 | ) | | | (7,307,331 | ) | |
Decrease in net assets from Fund share transactions | | | (20,215,880 | ) | | | (36,913,268 | ) | | | (2,479,191 | ) | | | (6,166,447 | ) | |
Class I | | | | | | | | | |
Net proceeds from shares sold | | | 286,707,410 | | | | 281,489,340 | | | | 17,071,435 | | | | 13,244,198 | | |
Net asset value of shares issued for reinvested dividends and distributions | | | 31,611,236 | | | | 38,792,769 | | | | 4,336,097 | | | | 4,219,117 | | |
Cost of shares redeemed | | | (206,948,702 | ) | | | (132,835,519 | ) | | | (44,744,552 | ) | | | (33,855,594 | ) | |
Increase (decrease) in net assets from Fund share transactions | | | 111,369,944 | | | | 187,446,590 | | | | (23,337,020 | ) | | | (16,392,279 | ) | |
Class Y^ | | | | | | | | | |
Net proceeds from shares sold | | | — | | | | — | | | | — | | | | — | | |
Net asset value of shares issued for reinvested dividends and distributions | | | — | | | | — | | | | — | | | | — | | |
Cost of shares redeemed | | | — | | | | — | | | | — | | | | — | | |
Decrease in net assets from Fund share transactions | | | — | | | | — | | | | — | | | | — | | |
First Eagle Funds | Annual Report | October 31, 2023
158
| | | First Eagle
Rising Dividend Fund** | | First Eagle
Small Cap Opportunity Fund | |
| | | For the
Year Ended
October 31, 2023 | | For the
Year Ended
October 31, 2022 | | For the
Year Ended
October 31, 2023 | | For the
Year Ended
October 31, 2022 | |
Operations | |
Net investment income (loss) | | $ | 5,998,165 | | | $ | 2,892,440 | | | $ | 2,965,536 | | | $ | (30,091 | ) | |
Net realized gain (loss) on investments, commodity, foreign currency
and forward contract related transactions and option contracts written | | | 24,985,141 | | | | 8,893,058 | | | | (46,405,081 | ) | | | (12,290,978 | ) | |
Change in unrealized appreciation (depreciation) on investments,
commodity, foreign currency and forward contract related translations
and option contracts written | | | 19,172,197 | | | | (124,003,382 | ) | | | (60,991,729 | ) | | | (43,272,599 | ) | |
Net increase (decrease) in net assets resulting from operations | | | 50,155,503 | | | | (112,217,884 | ) | | | (104,431,274 | ) | | | (55,593,668 | ) | |
Distributions to Shareholders | |
Distributable earnings: | |
Class A | | | (8,920,725 | ) | | | (28,960,882 | ) | | | — | | | | — | | |
Class C | | | (717,656 | ) | | | (6,438,710 | ) | | | — | | | | — | | |
Class I | | | (3,513,420 | ) | | | (18,554,874 | ) | | | (580,596 | ) | | | — | | |
Class R3 | | | (1,757 | ) | | | (7,565 | ) | | | — | | | | — | | |
Class R4 | | | (1,175 | ) | | | (1,612 | ) | | | — | | | | — | | |
Class R5 | | | (399 | ) | | | (1,584 | ) | | | — | | | | — | | |
Class R6 | | | (203,647 | ) | | | (844,134 | ) | | | (27,517 | ) | | | — | | |
Class Y | | | — | | | | (14,342,072 | ) | | | — | | | | — | | |
Decrease in net assets resulting from distributions | | | (13,358,779 | ) | | | (69,151,433 | ) | | | (608,113 | ) | | | — | | |
Fund Share Transactions | |
Class A | | | | | | | | | |
Net proceeds from shares sold | | | 18,109,802 | | | | 124,325,543 | | | | 33,971,074 | | | | 34,689,417 | | |
Net asset value of shares issued for reinvested dividends and distributions | | | 8,391,015 | | | | 27,071,267 | | | | — | | | | — | | |
Cost of shares redeemed | | | (54,121,330 | ) | | | (51,621,626 | ) | | | (6,191,272 | ) | | | (3,412,636 | ) | |
Increase (decrease) in net assets from Fund share transactions | | | (27,620,513 | ) | | | 99,775,184 | | | | 27,779,802 | | | | 31,276,781 | | |
Class C | | | | | | | | | |
Net proceeds from shares sold | | | 415,939 | | | | 852,632 | | | | — | | | | — | | |
Net asset value of shares issued for reinvested dividends and distributions | | | 712,791 | | | | 6,416,617 | | | | — | | | | — | | |
Cost of shares redeemed | | | (10,293,049 | ) | | | (15,866,782 | ) | | | — | | | | — | | |
Decrease in net assets from Fund share transactions | | | (9,164,319 | ) | | | (8,597,533 | ) | | | — | | | | — | | |
Class I | | | | | | | | | |
Net proceeds from shares sold | | | 6,842,143 | | | | 9,732,803 | | | | 1,026,258,605 | | | | 557,173,815 | | |
Net asset value of shares issued for reinvested dividends and distributions | | | 1,945,418 | | | | 10,757,623 | | | | 551,566 | | | | — | | |
Cost of shares redeemed | | | (20,221,706 | ) | | | (36,713,178 | ) | | | (248,023,159 | ) | | | (98,007,637 | ) | |
Increase (decrease) in net assets from Fund share transactions | | | (11,434,145 | ) | | | (16,222,752 | ) | | | 778,787,012 | | | | 459,166,178 | | |
Class Y^ | | | | | | | | | |
Net proceeds from shares sold | | | — | | | | 384,358 | | | | — | | | | — | | |
Net asset value of shares issued for reinvested dividends and distributions | | | — | | | | 13,462,427 | | | | — | | | | — | | |
Cost of shares redeemed | | | — | | | | (112,753,811 | ) | | | — | | | | — | | |
Decrease in net assets from Fund share transactions | | | — | | | | (98,907,026 | ) | | | — | | | | — | | |
First Eagle Funds | Annual Report | October 31, 2023
159
Statements of Changes in Net Assets (continued)
| | | First Eagle
Global Income Builder Fund | | First Eagle
High Income Fund | |
| | | For the
Year Ended
October 31, 2023 | | For the
Year Ended
October 31, 2022 | | For the
Year Ended
October 31, 2023 | | For the
Year Ended
October 31, 2022 | |
Class R3 | | | | | | | | | |
Net proceeds from shares sold | | | — | | | | — | | | | 56,063 | | | | 50,017 | | |
Net asset value of shares issued for reinvested dividends and distributions | | | 2,189 | | | | 3,661 | | | | 22,383 | | | | 17,677 | | |
Cost of shares redeemed | | | — | | | | — | | | | (760 | ) | | | (46,715 | ) | |
Increase in net assets from Fund share transactions | | | 2,189 | | | | 3,661 | | | | 77,686 | | | | 20,979 | | |
Class R4 | | | | | | | | | |
Net proceeds from shares sold | | | 6,730 | | | | 23,922 | | | | — | | | | — | | |
Net asset value of shares issued for reinvested dividends and distributions | | | 2,016 | | | | 1,847 | | | | 458 | | | | 375 | | |
Cost of shares redeemed | | | (97 | ) | | | (52 | ) | | | — | | | | — | | |
Increase in net assets from Fund share transactions | | | 8,649 | | | | 25,717 | | | | 458 | | | | 375 | | |
Class R5 | | | | | | | | | |
Net asset value of shares issued for reinvested dividends and distributions | | | 456 | | | | 746 | | | | 561 | | | | 456 | | |
Increase in net assets from Fund share transactions | | | 456 | | | | 746 | | | | 561 | | | | 456 | | |
Class R6 | | | | | | | | | |
Net proceeds from shares sold | | | 28,315,324 | | | | 32,031,477 | | | | 7,992,381 | | | | 178,703 | | |
Net asset value of shares issued for reinvested dividends and distributions | | | 2,421,057 | | | | 1,967,018 | | | | 189,821 | | | | 47,695 | | |
Cost of shares redeemed | | | (14,429,131 | ) | | | (7,431,039 | ) | | | (1,193,607 | ) | | | (149,320 | ) | |
Increase in net assets from Fund share transactions | | | 16,307,250 | | | | 26,567,456 | | | | 6,988,595 | | | | 77,078 | | |
Increase (decrease) in net assets from Fund share transactions | | | 178,850,518 | | | | 302,574,365 | | | | (23,397,653 | ) | | | (26,603,425 | ) | |
Net increase (decrease) in net assets | | | 204,327,287 | | | | 97,925,074 | | | | (22,900,430 | ) | | | (56,020,726 | ) | |
Net Assets (Note 1) | |
Beginning of period | | | 1,437,264,783 | | | | 1,339,339,709 | | | | 176,484,646 | | | | 232,505,372 | | |
End of period | | $ | 1,641,592,070 | | | $ | 1,437,264,783 | | | $ | 153,584,216 | | | $ | 176,484,646 | | |
Changes in Shares Outstanding | |
Class A | |
Shares outstanding, beginning of period | | | 46,560,925 | | | | 36,430,773 | | | | 8,796,579 | | | | 9,337,274 | | |
Shares sold | | | 12,771,686 | | | | 15,433,507 | | | | 1,538,050 | | | | 1,768,389 | | |
Shares issued on reinvestment of distributions | | | 1,754,983 | | | | 2,308,259 | | | | 422,540 | | | | 390,328 | | |
Shares redeemed | | | (8,773,966 | ) | | | (7,611,614 | ) | | | (2,550,082 | ) | | | (2,699,412 | ) | |
Shares outstanding, end of period | | | 52,313,628 | | | | 46,560,925 | | | | 8,207,087 | | | | 8,796,579 | | |
Class C | |
Shares outstanding, beginning of period | | | 8,456,225 | | | | 11,404,016 | | | | 949,515 | | | | 1,686,722 | | |
Shares sold | | | 1,173,224 | | | | 1,050,747 | | | | 185,200 | | | | 90,401 | | |
Shares issued on reinvestment of distributions | | | 225,272 | | | | 491,852 | | | | 35,330 | | | | 45,503 | | |
Shares redeemed | | | (2,995,624 | ) | | | (4,490,390 | ) | | | (532,190 | ) | | | (873,111 | ) | |
Shares outstanding, end of period | | | 6,859,097 | | | | 8,456,225 | | | | 637,855 | | | | 949,515 | | |
First Eagle Funds | Annual Report | October 31, 2023
160
| | | First Eagle
Rising Dividend Fund** | | First Eagle
Small Cap Opportunity Fund | |
| | | For the
Year Ended
October 31, 2023 | | For the
Year Ended
October 31, 2022 | | For the
Year Ended
October 31, 2023 | | For the
Year Ended
October 31, 2022 | |
Class R3 | | | | | | | | | |
Net proceeds from shares sold | | | — | | | | — | | | | — | | | | — | | |
Net asset value of shares issued for reinvested dividends and distributions | | | 1,757 | | | | 7,565 | | | | — | | | | — | | |
Cost of shares redeemed | | | — | | | | — | | | | — | | | | — | | |
Increase in net assets from Fund share transactions | | | 1,757 | | | | 7,565 | | | | — | | | | — | | |
Class R4 | | | | | | | | | |
Net proceeds from shares sold | | | 3,450 | | | | 20,612 | | | | — | | | | — | | |
Net asset value of shares issued for reinvested dividends and distributions | | | 1,175 | | | | 1,612 | | | | — | | | | — | | |
Cost of shares redeemed | | | (40 | ) | | | (8 | ) | | | — | | | | — | | |
Increase in net assets from Fund share transactions | | | 4,585 | | | | 22,216 | | | | — | | | | — | | |
Class R5 | | | | | | | | | |
Net asset value of shares issued for reinvested dividends and distributions | | | 399 | | | | 1,584 | | | | — | | | | — | | |
Increase in net assets from Fund share transactions | | | 399 | | | | 1,584 | | | | — | | | | — | | |
Class R6 | | | | | | | | | |
Net proceeds from shares sold | | | 1,655,761 | | | | 1,692,266 | | | | 54,252,946 | | | | 23,931,613 | | |
Net asset value of shares issued for reinvested dividends and distributions | | | 199,816 | | | | 822,187 | | | | 27,517 | | | | — | | |
Cost of shares redeemed | | | (1,177,419 | ) | | | (2,019,488 | ) | | | (7,415,134 | ) | | | (1,967,426 | ) | |
Increase in net assets from Fund share transactions | | | 678,158 | | | | 494,965 | | | | 46,865,329 | | | | 21,964,187 | | |
Increase (decrease) in net assets from Fund share transactions | | | (47,534,078 | ) | | | (23,425,797 | ) | | | 853,432,143 | | | | 512,407,146 | | |
Net increase (decrease) in net assets | | | (10,737,354 | ) | | | (204,795,114 | ) | | | 748,392,756 | | | | 456,813,478 | | |
Net Assets (Note 1) | |
Beginning of period | | | 364,552,285 | | | | 569,347,399 | | | | 561,304,227 | | | | 104,490,749 | | |
End of period | | $ | 353,814,931 | | | $ | 364,552,285 | | | $ | 1,309,696,983 | | | $ | 561,304,227 | | |
Changes in Shares Outstanding | |
Class A | |
Shares outstanding, beginning of period | | | 12,125,113 | | | | 7,916,180 | | | | 4,392,441 | | | | 1,030,504 | | |
Shares sold | | | 797,792 | | | | 5,331,190 | | | | 3,798,896 | | | | 3,746,248 | | |
Shares issued on reinvestment of distributions | | | 383,785 | | | | 1,079,146 | | | | — | | | | — | | |
Shares redeemed | | | (2,421,273 | ) | | | (2,201,403 | ) | | | (700,361 | ) | | | (384,311 | ) | |
Shares outstanding, end of period | | | 10,885,417 | | | | 12,125,113 | | | | 7,490,976 | | | | 4,392,441 | | |
Class C | |
Shares outstanding, beginning of period | | | 1,267,183 | | | | 1,886,112 | | | | — | | | | — | | |
Shares sold | | | 29,623 | | | | 59,765 | | | | — | | | | — | | |
Shares issued on reinvestment of distributions | | | 53,658 | | | | 406,254 | | | | — | | | | — | | |
Shares redeemed | | | (756,200 | ) | | | (1,084,948 | ) | | | — | | | | — | | |
Shares outstanding, end of period | | | 594,264 | | | | 1,267,183 | | | | — | | | | — | | |
First Eagle Funds | Annual Report | October 31, 2023
161
Statements of Changes in Net Assets (continued)
| | | First Eagle
Global Income Builder Fund | | First Eagle
High Income Fund | |
| | | For the
Year Ended
October 31, 2023 | | For the
Year Ended
October 31, 2022 | | For the
Year Ended
October 31, 2023 | | For the
Year Ended
October 31, 2022 | |
Class I | |
Shares outstanding, beginning of period | | | 64,970,999 | | | | 49,589,679 | | | | 12,765,238 | | | | 14,699,977 | | |
Shares sold | | | 23,208,393 | | | | 23,089,982 | | | | 2,150,591 | | | | 1,571,583 | | |
Shares issued on reinvestment of distributions | | | 2,579,194 | | | | 3,133,723 | | | | 546,360 | | | | 512,337 | | |
Shares redeemed | | | (16,887,903 | ) | | | (10,842,385 | ) | | | (5,633,197 | ) | | | (4,018,659 | ) | |
Shares outstanding, end of period | | | 73,870,683 | | | | 64,970,999 | | | | 9,828,992 | | | | 12,765,238 | | |
Class Y^ | |
Shares outstanding, beginning of period | | | — | | | | — | | | | — | | | | — | | |
Shares sold | | | — | | | | — | | | | — | | | | — | | |
Shares issued on reinvestment of distributions | | | — | | | | — | | | | — | | | | — | | |
Shares redeemed | | | — | | | | — | | | | — | | | | — | | |
Shares outstanding, end of period | | | — | | | | — | | | | — | | | | — | | |
Class R3 | |
Shares outstanding, beginning of period | | | 4,832 | | | | 4,538 | | | | 51,721 | | | | 49,309 | | |
Shares sold | | | — | | | | — | | | | 7,027 | | | | 5,981 | | |
Shares issued on reinvestment of distributions | | | 178 | | | | 294 | | | | 2,821 | | | | 2,152 | | |
Shares redeemed | | | — | | | | — | | | | (96 | ) | | | (5,721 | ) | |
Shares outstanding, end of period | | | 5,010 | | | | 4,832 | | | | 61,473 | | | | 51,721 | | |
Class R4 | |
Shares outstanding, beginning of period | | | 4,202 | | | | 2,034 | | | | 1,278 | | | | 1,233 | | |
Shares sold | | | 541 | | | | 2,023 | | | | — | | | | — | | |
Shares issued on reinvestment of distributions | | | 164 | | | | 149 | | | | 58 | | | | 45 | | |
Shares redeemed | | | (8 | ) | | | (4 | ) | | | — | | | | — | | |
Shares outstanding, end of period | | | 4,899 | | | | 4,202 | | | | 1,336 | | | | 1,278 | | |
Class R5 | |
Shares outstanding, beginning of period | | | 936 | | | | 876 | | | | 1,302 | | | | 1,246 | | |
Shares issued on reinvestment of distributions | | | 37 | | | | 60 | | | | 71 | | | | 56 | | |
Shares outstanding, end of period | | | 973 | | | | 936 | | | | 1,373 | | | | 1,302 | | |
Class R6 | |
Shares outstanding, beginning of period | | | 3,973,194 | | | | 1,818,684 | | | | 128,496 | | | | 118,716 | | |
Shares sold | | | 2,285,965 | | | | 2,605,580 | | | | 1,004,508 | | | | 22,336 | | |
Shares issued on reinvestment of distributions | | | 197,819 | | | | 159,638 | | | | 23,948 | | | | 5,816 | | |
Shares redeemed | | | (1,164,836 | ) | | | (610,708 | ) | | | (151,363 | ) | | | (18,372 | ) | |
Shares outstanding, end of period | | | 5,292,142 | | | | 3,973,194 | | | | 1,005,589 | | | | 128,496 | | |
^ On February 28, 2022, First Eagle Fund of America's Class Y shares converted into Class A shares. As a result, Class Y shares were terminated.
** First Eagle Rising Dividend Fund was known as First Eagle Fund of America prior to March 1, 2023.
See Notes to Financial Statements.
First Eagle Funds | Annual Report | October 31, 2023
162
| | | First Eagle
Rising Dividend Fund** | | First Eagle
Small Cap Opportunity Fund | |
| | | For the
Year Ended
October 31, 2023 | | For the
Year Ended
October 31, 2022 | | For the
Year Ended
October 31, 2023 | | For the
Year Ended
October 31, 2022 | |
Class I | |
Shares outstanding, beginning of period | | | 4,542,657 | | | | 5,200,341 | | | | 58,977,677 | | | | 9,541,918 | | |
Shares sold | | | 283,305 | | | | 382,965 | | | | 112,506,979 | | | | 60,695,082 | | |
Shares issued on reinvestment of distributions | | | 84,287 | | | | 406,411 | | | | 61,765 | | | | — | | |
Shares redeemed | | | (868,885 | ) | | | (1,447,060 | ) | | | (27,731,100 | ) | | | (11,259,323 | ) | |
Shares outstanding, end of period | | | 4,041,364 | | | | 4,542,657 | | | | 143,815,321 | | | | 58,977,677 | | |
Class Y^ | |
Shares outstanding, beginning of period | | | — | | | | 4,092,457 | | | | — | | | | — | | |
Shares sold | | | — | | | | 14,302 | | | | — | | | | — | | |
Shares issued on reinvestment of distributions | | | — | | | | 509,680 | | | | — | | | | — | | |
Shares redeemed | | | — | | | | (4,616,439 | ) | | | — | | | | — | | |
Shares outstanding, end of period | | | — | | | | — | | | | — | | | | — | | |
Class R3 | |
Shares outstanding, beginning of period | | | 2,368 | | | | 2,080 | | | | — | | | | — | | |
Shares sold | | | — | | | | — | | | | — | | | | — | | |
Shares issued on reinvestment of distributions | | | 77 | | | | 288 | | | | — | | | | — | | |
Shares redeemed | | | — | | | | — | | | | — | | | | — | | |
Shares outstanding, end of period | | | 2,445 | | | | 2,368 | | | | — | | | | — | | |
Class R4 | |
Shares outstanding, beginning of period | | | 1,425 | | | | 423 | | | | — | | | | — | | |
Shares sold | | | 145 | | | | 940 | | | | — | | | | — | | |
Shares issued on reinvestment of distributions | | | 51 | | | | 62 | | | | — | | | | — | | |
Shares redeemed | | | (2 | ) | | | — | | | | — | | | | — | | |
Shares outstanding, end of period | | | 1,619 | | | | 1,425 | | | | — | | | | — | | |
Class R5 | |
Shares outstanding, beginning of period | | | 484 | | | | 424 | | | | — | | | | — | | |
Shares issued on reinvestment of distributions | | | 17 | | | | 60 | | | | — | | | | — | | |
Shares outstanding, end of period | | | 501 | | | | 484 | | | | — | | | | — | | |
Class R6 | |
Shares outstanding, beginning of period | | | 243,545 | | | | 226,370 | | | | 2,688,408 | | | | 126,466 | | |
Shares sold | | | 69,896 | | | | 69,668 | | | | 5,983,392 | | | | 2,791,232 | | |
Shares issued on reinvestment of distributions | | | 8,628 | | | | 31,109 | | | | 3,078 | | | | — | | |
Shares redeemed | | | (49,945 | ) | | | (83,602 | ) | | | (824,731 | ) | | | (229,290 | ) | |
Shares outstanding, end of period | | | 272,124 | | | | 243,545 | | | | 7,850,147 | | | | 2,688,408 | | |
First Eagle Funds | Annual Report | October 31, 2023
163
Statements of Changes in Net Assets (continued)
| | | First Eagle U.S. Smid Cap
Opportunity Fund | | First Eagle Global Real
Assets Fund* | |
| | | For the
Year Ended
October 31, 2023 | | For the Period
8/15/22 † -
10/31/22 | | For the
Year Ended
October 31, 2023 | | For the Period
11/30/21† -
10/31/22 | |
Operations | |
Net investment income | | $ | 80,149 | | | $ | 1,307 | | | $ | 227,985 | | | $ | 137,271 | | |
Net realized gain (loss) on
investments and foreign
currency related transactions | | | (71,616 | ) | | | (8,329 | ) | | | (36,039 | ) | | | (80,111 | ) | |
Change in unrealized appreciation
(depreciation) on investments,
commodity and foreign currency
related translations | | | (716,756 | ) | | | (118,178 | ) | | | 74,559 | | | | (522,772 | ) | |
Net increase (decrease) in net
assets resulting from operations | | | (708,223 | ) | | | (125,200 | ) | | | 266,505 | | | | (465,612 | ) | |
Distributions to Shareholders | |
Distributable earnings: | |
Class A | | | (60 | ) | | | — | | | | (13,695 | ) | | | — | | |
Class I | | | (3,378 | ) | | | — | | | | (145,313 | ) | | | — | | |
Class R6 | | | (180 | ) | | | — | | | | (20,751 | ) | | | — | | |
Decrease in net assets resulting
from distributions | | | (3,618 | ) | | | — | | | | (179,759 | ) | | | — | | |
Fund Share Transactions | |
Class A | |
Net proceeds from shares sold | | | 34,770 | | | | 53,566 | | | | 394,672 | | | | 1,321,434 | | |
Net asset value of shares issued
for reinvested dividends and
distributions | | | 60 | | | | — | | | | 13,695 | | | | — | | |
Cost of shares redeemed | | | — | | | | — | | | | (3,430 | ) | | | (7,237 | ) | |
Increase in net assets from Fund
share transactions | | | 34,830 | | | | 53,566 | | | | 404,937 | | | | 1,314,197 | | |
Class I | |
Net proceeds from shares sold | | | 27,289,152 | | | | 1,161,000 | | | | 2,749,565 | | | | 7,488,585 | | |
Net asset value of shares issued
for reinvested dividends and
distributions | | | 3,378 | | | | — | | | | 145,313 | | | | — | | |
Cost of shares redeemed | | | (161 | ) | | | — | | | | (1,458,613 | ) | | | (21,770 | ) | |
Increase in net assets from Fund
share transactions | | | 27,292,369 | | | | 1,161,000 | | | | 1,436,265 | | | | 7,466,815 | | |
Class R6 | |
Net proceeds from shares sold | | | — | | | | 50,000 | | | | 4,549 | | | | 1,044,995 | | |
Net asset value of shares issued
for reinvested dividends and
distributions | | | 180 | | | | — | | | | 20,751 | | | | — | | |
Cost of shares redeemed | | | — | | | | — | | | | (10,141 | ) | | | — | | |
Increase in net assets from Fund
share transactions | | | 180 | | | | 50,000 | | | | 15,159 | | | | 1,044,995 | | |
First Eagle Funds | Annual Report | October 31, 2023
164
| | | First Eagle U.S. Smid Cap
Opportunity Fund | | First Eagle Global Real
Assets Fund* | |
| | | For the
Year Ended
October 31, 2023 | | For the Period
8/15/22† -
10/31/22 | | For the
Year Ended
October 31, 2023 | | For the Period
11/30/21† -
10/31/22 | |
Increase in net assets from Fund
share transactions | | | 27,327,379 | | | | 1,264,566 | | | | 1,856,361 | | | | 9,826,007 | | |
Net increase in net assets | | | 26,615,538 | | | | 1,139,366 | | | | 1,943,107 | | | | 9,360,395 | | |
Net Assets (Note 1) | |
Beginning of period | | | 1,139,366 | | | | — | | | | 9,360,395 | | | | — | | |
End of period | | $ | 27,754,904 | | | $ | 1,139,366 | | | $ | 11,303,502 | | | $ | 9,360,395 | | |
Changes in Shares Outstanding | |
Class A | |
Shares outstanding, beginning of
period | | | 5,413 | | | | — | | | | 134,467 | | | | — | | |
Shares sold | | | 3,556 | | | | 5,413 | | | | 38,372 | | | | 135,216 | | |
Shares issued on reinvestment of
distributions | | | 6 | | | | — | | | | 1,338 | | | | — | | |
Shares redeemed | | | — | | | | — | | | | (335 | ) | | | (749 | ) | |
Shares outstanding, end of period | | | 8,975 | | | | 5,413 | | | | 173,842 | | | | 134,467 | | |
Class I | |
Shares outstanding, beginning of
period | | | 116,486 | | | | — | | | | 737,628 | | | | — | | |
Shares sold | | | 3,053,725 | | | | 116,486 | | | | 276,322 | | | | 739,870 | | |
Shares issued on reinvestment of
distributions | | | 357 | | | | — | | | | 14,288 | | | | — | | |
Shares redeemed | | | (17 | ) | | | — | | | | (147,503 | ) | | | (2,242 | ) | |
Shares outstanding, end of period | | | 3,170,551 | | | | 116,486 | | | | 880,735 | | | | 737,628 | | |
Class R6 | |
Shares outstanding, beginning of
period | | | 5,000 | | | | — | | | | 104,276 | | | | — | | |
Shares sold | | | — | | | | 5,000 | | | | 447 | | | | 104,276 | | |
Shares issued on reinvestment of
distributions | | | 19 | | | | — | | | | 2,040 | | | | — | | |
Shares redeemed | | | — | | | | — | | | | (998 | ) | | | — | | |
Shares outstanding, end of period | | | 5,019 | | | | 5,000 | | | | 105,765 | | | | 104,276 | | |
* First Eagle Global Real Assets Fund financial statements are shown on a consolidated basis and includes the balances of the First Eagle Global Real Asset Cayman Fund, Ltd.
† Inception date.
See Notes to Financial Statements.
First Eagle Funds | Annual Report | October 31, 2023
165
| | | Per share operating performance* | |
| | | | | Change in net assets resulting
from operations | | Less dividends and distributions | |
Selected per
share data for
the period ended: | | Net asset
value,
beginning
of year | | Net
investment
income/
loss | | Net
realized
and
unrealized
gains
(losses) on
investments | | Total
investment
operations | | From net
investment
income | | From
capital
gains | | Return of
capital | | Total
distributions | |
First Eagle Global Fund Class A*** | |
October 31, 2023 | | $ | 56.57 | | | | 0.84 | | | | 4.98 | | | | 5.82 | | | | (0.06 | ) | | | (2.36 | ) | | | — | | | | (2.42 | ) | |
October 31, 2022 | | $ | 68.42 | | | | 0.51 | | | | (8.32 | ) | | | (7.81 | ) | | | (1.24 | ) | | | (2.80 | ) | | | — | | | | (4.04 | ) | |
October 31, 2021 | | $ | 55.42 | | | | 0.67 | (d) | | | 13.79 | | | | 14.46 | | | | (0.51 | ) | | | (0.95 | ) | | | — | | | | (1.46 | ) | |
October 31, 2020 | | $ | 59.15 | | | | 0.48 | | | | (1.03 | ) | | | (0.55 | ) | | | (0.73 | ) | | | (2.45 | ) | | | — | | | | (3.18 | ) | |
October 31, 2019 | | $ | 56.37 | | | | 0.64 | | | | 5.37 | | | | 6.01 | | | | (0.43 | ) | | | (2.80 | ) | | | — | | | | (3.23 | ) | |
First Eagle Global Fund Class C*** | |
October 31, 2023 | | $ | 54.26 | | | | 0.35 | | | | 4.80 | | | | 5.15 | | | | — | | | | (2.36 | ) | | | — | | | | (2.36 | ) | |
October 31, 2022 | | $ | 65.60 | | | | 0.04 | | | | (7.99 | ) | | | (7.95 | ) | | | (0.59 | ) | | | (2.80 | ) | | | — | | | | (3.39 | ) | |
October 31, 2021 | | $ | 53.12 | | | | 0.15 | (d) | | | 13.28 | | | | 13.43 | | | | — | | | | (0.95 | ) | | | — | | | | (0.95 | ) | |
October 31, 2020 | | $ | 56.69 | | | | 0.07 | | | | (1.01 | ) | | | (0.94 | ) | | | (0.18 | ) | | | (2.45 | ) | | | — | | | | (2.63 | ) | |
October 31, 2019 | | $ | 54.11 | | | | 0.18 | | | | 5.20 | | | | 5.38 | | | | — | | | | (2.80 | ) | | | — | | | | (2.80 | ) | |
First Eagle Global Fund Class I*** | |
October 31, 2023 | | $ | 56.98 | | | | 0.99 | | | | 5.02 | | | | 6.01 | | | | (0.21 | ) | | | (2.36 | ) | | | — | | | | (2.57 | ) | |
October 31, 2022 | | $ | 68.90 | | | | 0.67 | | | | (8.38 | ) | | | (7.71 | ) | | | (1.41 | ) | | | (2.80 | ) | | | — | | | | (4.21 | ) | |
October 31, 2021 | | $ | 55.79 | | | | 0.85 | (d) | | | 13.87 | | | | 14.72 | | | | (0.66 | ) | | | (0.95 | ) | | | — | | | | (1.61 | ) | |
October 31, 2020 | | $ | 59.52 | | | | 0.63 | | | | (1.03 | ) | | | (0.40 | ) | | | (0.88 | ) | | | (2.45 | ) | | | — | | | | (3.33 | ) | |
October 31, 2019 | | $ | 56.73 | | | | 0.78 | | | | 5.41 | | | | 6.19 | | | | (0.60 | ) | | | (2.80 | ) | | | — | | | | (3.40 | ) | |
First Eagle Global Fund Class R3*** | |
October 31, 2023 | | $ | 56.52 | | | | 0.71 | | | | 5.00 | | | | 5.71 | | | | (0.02 | ) | | | (2.36 | ) | | | — | | | | (2.38 | ) | |
October 31, 2022 | | $ | 68.23 | | | | 0.51 | | | | (8.37 | ) | | | (7.86 | ) | | | (1.05 | ) | | | (2.80 | ) | | | — | | | | (3.85 | ) | |
October 31, 2021 | | $ | 55.47 | | | | 0.23 | (d) | | | 13.78 | | | | 14.01 | | | | (0.30 | ) | | | (0.95 | ) | | | — | | | | (1.25 | ) | |
October 31, 2020 | | $ | 59.34 | | | | 0.48 | | | | (1.07 | ) | | | (0.59 | ) | | | (0.83 | ) | | | (2.45 | ) | | | — | | | | (3.28 | ) | |
October 31, 2019 | | $ | 56.62 | | | | 0.60 | | | | 5.38 | | | | 5.98 | | | | (0.46 | ) | | | (2.80 | ) | | | — | | | | (3.26 | ) | |
First Eagle Global Fund Class R4*** | |
October 31, 2023 | | $ | 56.86 | | | | 0.84 | | | | 5.02 | | | | 5.86 | | | | (0.01 | ) | | | (2.36 | ) | | | — | | | | (2.37 | ) | |
October 31, 2022 | | $ | 68.70 | | | | 0.56 | | | | (8.39 | ) | | | (7.83 | ) | | | (1.21 | ) | | | (2.80 | ) | | | — | | | | (4.01 | ) | |
October 31, 2021 | | $ | 55.72 | | | | 0.67 | (d) | | | 13.86 | | | | 14.53 | | | | (0.60 | ) | | | (0.95 | ) | | | — | | | | (1.55 | ) | |
October 31, 2020 | | $ | 59.48 | | | | 0.57 | | | | (1.02 | ) | | | (0.45 | ) | | | (0.86 | ) | | | (2.45 | ) | | | — | | | | (3.31 | ) | |
October 31, 2019 | | $ | 56.70 | | | | 0.74 | | | | 5.36 | | | | 6.10 | | | | (0.52 | ) | | | (2.80 | ) | | | — | | | | (3.32 | ) | |
First Eagle Global Fund Class R5*** | |
October 31, 2023 | | $ | 56.09 | | | | 0.86 | | | | 4.94 | | | | 5.80 | | | | (0.05 | ) | | | (2.36 | ) | | | — | | | | (2.41 | ) | |
October 31, 2022 | | $ | 68.00 | | | | 0.51 | | | | (8.26 | ) | | | (7.75 | ) | | | (1.36 | ) | | | (2.80 | ) | | | — | | | | (4.16 | ) | |
October 31, 2021 | | $ | 54.98 | | | | 0.91 | (d) | | | 13.06 | | | | 13.97 | | | | — | | | | (0.95 | ) | | | — | | | | (0.95 | ) | |
October 31, 2020 | | $ | 59.47 | | | | (0.16 | ) | | | (1.06 | ) | | | (1.22 | ) | | | (0.82 | ) | | | (2.45 | ) | | | — | | | | (3.27 | ) | |
For The Period
7/29/19^-10/31/19 | | $ | 58.99 | | | | 0.12 | | | | 0.36 | | | | 0.48 | | | | — | | | | — | | | | — | | | | — | | |
First Eagle Funds | Annual Report | October 31, 2023
166
| | | | | | | | | Ratios/Supplemental data | | | |
| | | | | | | | | Ratios to Average Net Assets of: | | | |
Selected per
share data for
the period ended: | | Net asset
value, end
of period | | Total
return(a) | | Net assets,
end of
period
(thousands) | | Operating
expenses
excluding
earnings
credits
and/or fee
waivers | | Operating
expenses
including
earnings
credits
and/or fee
waivers | | Net
investment
income
excluding
earnings
credits
and/or fee
waivers | | Net
investment
income
including
earnings
credits
and/or fee
waivers | | Portfolio
turnover
rate | |
First Eagle Global Fund Class A*** | |
October 31, 2023 | | $ | 59.97 | | | | 10.35 | % | | $ | 12,976,288 | | | | 1.10 | % | | | 1.10 | % | | | 1.36 | % | | | 1.37 | % | | | 6.00 | % | |
October 31, 2022 | | $ | 56.57 | | | | (11.90 | )% | | $ | 12,562,351 | | | | 1.11 | % | | | 1.11 | % | | | 0.84 | % | | | 0.84 | % | | | 10.87 | % | |
October 31, 2021 | | $ | 68.42 | | | | 26.49 | %(g) | | $ | 15,108,210 | | | | 1.11 | % | | | 1.11 | % | | | 1.03 | %(d) | | | 1.03 | %(d) | | | 7.29 | % | |
October 31, 2020 | | $ | 55.42 | | | | (1.12 | )% | | $ | 12,112,205 | | | | 1.11 | % | | | 1.11 | % | | | 0.87 | % | | | 0.87 | % | | | 10.84 | % | |
October 31, 2019 | | $ | 59.15 | | | | 11.44 | % | | $ | 13,638,545 | | | | 1.11 | % | | | 1.11 | % | | | 1.13 | % | | | 1.13 | % | | | 10.26 | % | |
First Eagle Global Fund Class C*** | |
October 31, 2023 | | $ | 57.05 | | | | 9.53 | % | | $ | 1,488,095 | | | | 1.86 | % | | | 1.86 | % | | | 0.59 | % | | | 0.60 | % | | | 6.00 | % | |
October 31, 2022 | | $ | 54.26 | | | | (12.57 | )% | | $ | 1,738,497 | | | | 1.87 | % | | | 1.87 | % | | | 0.06 | % | | | 0.06 | % | | | 10.87 | % | |
October 31, 2021 | | $ | 65.60 | | | | 25.53 | %(g) | | $ | 2,623,491 | | | | 1.87 | % | | | 1.87 | % | | | 0.24 | %(d) | | | 0.24 | %(d) | | | 7.29 | % | |
October 31, 2020 | | $ | 53.12 | | | | (1.86 | )% | | $ | 3,423,967 | | | | 1.87 | % | | | 1.87 | % | | | 0.13 | % | | | 0.13 | % | | | 10.84 | % | |
October 31, 2019 | | $ | 56.69 | | | | 10.58 | % | | $ | 5,619,288 | | | | 1.87 | % | | | 1.86 | % | | | 0.33 | % | | | 0.33 | % | | | 10.26 | % | |
First Eagle Global Fund Class I*** | |
October 31, 2023 | | $ | 60.42 | | | | 10.63 | % | | $ | 29,941,639 | | | | 0.86 | % | | | 0.86 | % | | | 1.60 | % | | | 1.61 | % | | | 6.00 | % | |
October 31, 2022 | | $ | 56.98 | | | | (11.69 | )% | | $ | 26,919,899 | | | | 0.86 | % | | | 0.86 | % | | | 1.09 | % | | | 1.09 | % | | | 10.87 | % | |
October 31, 2021 | | $ | 68.90 | | | | 26.82 | %(g) | | $ | 30,248,818 | | | | 0.86 | % | | | 0.86 | % | | | 1.29 | %(d) | | | 1.29 | %(d) | | | 7.29 | % | |
October 31, 2020 | | $ | 55.79 | | | | (0.86 | )% | | $ | 24,274,791 | | | | 0.86 | % | | | 0.86 | % | | | 1.14 | % | | | 1.14 | % | | | 10.84 | % | |
October 31, 2019 | | $ | 59.52 | | | | 11.72 | % | | $ | 30,133,165 | | | | 0.85 | % | | | 0.85 | % | | | 1.38 | % | | | 1.38 | % | | | 10.26 | % | |
First Eagle Global Fund Class R3*** | |
October 31, 2023 | | $ | 59.85 | | | | 10.16 | % | | $ | 12,328 | | | | 1.27 | % | | | 1.27 | % | | | 1.17 | % | | | 1.18 | % | | | 6.00 | % | |
October 31, 2022 | | $ | 56.52 | | | | (11.99 | )% | | $ | 7,134 | | | | 1.20 | % | | | 1.20 | % | | | 0.84 | % | | | 0.84 | % | | | 10.87 | % | |
October 31, 2021 | | $ | 68.23 | | | | 25.57 | %(g) | | $ | 1,283 | | | | 1.51 | % | | | 1.51 | % | | | 0.36 | %(d) | | | 0.36 | %(d) | | | 7.29 | % | |
October 31, 2020 | | $ | 55.47 | | | | (1.21 | )% | | $ | 4,503 | | | | 1.18 | % | | | 1.18 | % | | | 0.86 | % | | | 0.87 | % | | | 10.84 | % | |
October 31, 2019 | | $ | 59.34 | | | | 11.31 | % | | $ | 11,813 | | | | 1.14 | % | | | 1.14 | % | | | 1.03 | % | | | 1.03 | % | | | 10.26 | % | |
First Eagle Global Fund Class R4*** | |
October 31, 2023 | | $ | 60.35 | | | | 10.36 | % | | $ | 1,758 | | | | 1.10 | % | | | 1.10 | % | | | 1.36 | % | | | 1.37 | % | | | 6.00 | % | |
October 31, 2022 | | $ | 56.86 | | | | (11.88 | )% | | $ | 1,266 | | | | 1.07 | % | | | 1.07 | % | | | 0.90 | % | | | 0.90 | % | | | 10.87 | % | |
October 31, 2021 | | $ | 68.70 | | | | 26.51 | %(g) | | $ | 2,064 | | | | 1.10 | % | | | 1.10 | % | | | 1.02 | %(d) | | | 1.02 | %(d) | | | 7.29 | % | |
October 31, 2020 | | $ | 55.72 | | | | (0.95 | )% | | $ | 2,162 | | | | 0.96 | % | | | 0.96 | % | | | 1.04 | % | | | 1.04 | % | | | 10.84 | % | |
October 31, 2019 | | $ | 59.48 | | | | 11.53 | % | | $ | 1,825 | | | | 0.97 | % | | | 0.97 | % | | | 1.28 | % | | | 1.28 | % | | | 10.26 | % | |
First Eagle Global Fund Class R5*** | |
October 31, 2023 | | $ | 59.48 | | | | 10.41 | % | | $ | 206 | | | | 1.05 | % | | | 1.04 | % | | | 1.40 | % | | | 1.40 | % | | | 6.00 | % | |
October 31, 2022 | | $ | 56.09 | | | | (11.90 | )% | | $ | 100 | | | | 1.11 | % | | | 1.11 | % | | | 0.84 | % | | | 0.84 | % | | | 10.87 | % | |
October 31, 2021 | | $ | 68.00 | | | | 25.65 | %(g) | | $ | 110 | | | | 1.11 | % | | | 1.11 | % | | | 1.36 | %(d) | | | 1.36 | %(d) | | | 7.29 | % | |
October 31, 2020 | | $ | 54.98 | | | | (2.32 | )% | | $ | 10 | | | | 2.29 | % | | | 2.29 | % | | | (0.28 | )% | | | (0.28 | )% | | | 10.84 | % | |
For The Period
7/29/19^-10/31/19 | | $ | 59.47 | | | | 0.81 | %(b) | | $ | 10 | | | | 1.35 | %(c) | | | 1.35 | %(c) | | | 0.82 | %(c) | | | 0.82 | %(c) | | | 10.26 | %(b) | |
First Eagle Funds | Annual Report | October 31, 2023
167
| | | Per share operating performance* | |
| | | | | Change in net assets resulting
from operations | | Less dividends and distributions | |
Selected per
share data for
the period ended: | | Net asset
value,
beginning
of year | | Net
investment
income/
loss | | Net
realized
and
unrealized
gains
(losses) on
investments | | Total
investment
operations | | From net
investment
income | | From
capital
gains | | Return of
capital | | Total
distributions | |
First Eagle Global Fund Class R6*** | |
October 31, 2023 | | $ | 57.02 | | | | 1.04 | | | | 5.01 | | | | 6.05 | | | | (0.25 | ) | | | (2.36 | ) | | | — | | | | (2.61 | ) | |
October 31, 2022 | | $ | 68.95 | | | | 0.71 | | | | (8.38 | ) | | | (7.67 | ) | | | (1.46 | ) | | | (2.80 | ) | | | — | | | | (4.26 | ) | |
October 31, 2021 | | $ | 55.83 | | | | 0.90 | (d) | | | 13.87 | | | | 14.77 | | | | (0.70 | ) | | | (0.95 | ) | | | — | | | | (1.65 | ) | |
October 31, 2020 | | $ | 59.55 | | | | 0.64 | | | | (0.99 | ) | | | (0.35 | ) | | | (0.92 | ) | | | (2.45 | ) | | | — | | | | (3.37 | ) | |
October 31, 2019 | | $ | 56.76 | | | | 0.82 | | | | 5.41 | | | | 6.23 | | | | (0.64 | ) | | | (2.80 | ) | | | — | | | | (3.44 | ) | |
First Eagle Overseas Fund Class A*** | |
October 31, 2023 | | $ | 21.26 | | | | 0.37 | | | | 1.99 | | | | 2.36 | | | | (0.02 | ) | | | (0.79 | ) | | | — | | | | (0.81 | ) | |
October 31, 2022 | | $ | 26.71 | | | | 0.30 | | | | (4.30 | ) | | | (4.00 | ) | | | (0.87 | ) | | | (0.58 | ) | | | — | | | | (1.45 | ) | |
October 31, 2021 | | $ | 22.80 | | | | 0.31 | (e) | | | 3.65 | | | | 3.96 | | | | (0.05 | ) | | | — | | | | — | | | | (0.05 | ) | |
October 31, 2020 | | $ | 24.65 | | | | 0.19 | | | | (0.71 | ) | | | (0.52 | ) | | | (0.50 | ) | | | (0.83 | ) | | | — | | | | (1.33 | ) | |
October 31, 2019 | | $ | 22.71 | | | | 0.32 | | | | 2.28 | | | | 2.60 | | | | (0.27 | ) | | | (0.39 | ) | | | — | | | | (0.66 | ) | |
First Eagle Overseas Fund Class C*** | |
October 31, 2023 | | $ | 20.26 | | | | 0.18 | | | | 1.90 | | | | 2.08 | | | | — | | | | (0.79 | ) | | | — | | | | (0.79 | ) | |
October 31, 2022 | | $ | 25.44 | | | | 0.11 | | | | (4.09 | ) | | | (3.98 | ) | | | (0.62 | ) | | | (0.58 | ) | | | — | | | | (1.20 | ) | |
October 31, 2021 | | $ | 21.83 | | | | 0.10 | (e) | | | 3.51 | | | | 3.61 | | | | — | | | | — | | | | — | | | | — | | |
October 31, 2020 | | $ | 23.58 | | | | 0.02 | | | | (0.69 | ) | | | (0.67 | ) | | | (0.25 | ) | | | (0.83 | ) | | | — | | | | (1.08 | ) | |
October 31, 2019 | | $ | 21.73 | | | | 0.11 | | | | 2.22 | | | | 2.33 | | | | (0.09 | ) | | | (0.39 | ) | | | — | | | | (0.48 | ) | |
First Eagle Overseas Fund Class I*** | |
October 31, 2023 | | $ | 21.83 | | | | 0.44 | | | | 2.03 | | | | 2.47 | | | | (0.08 | ) | | | (0.79 | ) | | | — | | | | (0.87 | ) | |
October 31, 2022 | | $ | 27.39 | | | | 0.37 | | | | (4.40 | ) | | | (4.03 | ) | | | (0.95 | ) | | | (0.58 | ) | | | — | | | | (1.53 | ) | |
October 31, 2021 | | $ | 23.38 | | | | 0.40 | (e) | | | 3.73 | | | | 4.13 | | | | (0.12 | ) | | | — | | | | — | | | | (0.12 | ) | |
October 31, 2020 | | $ | 25.24 | | | | 0.26 | | | | (0.72 | ) | | | (0.46 | ) | | | (0.57 | ) | | | (0.83 | ) | | | — | | | | (1.40 | ) | |
October 31, 2019 | | $ | 23.26 | | | | 0.39 | | | | 2.33 | | | | 2.72 | | | | (0.35 | ) | | | (0.39 | ) | | | — | | | | (0.74 | ) | |
First Eagle Overseas Fund Class R3*** | |
October 31, 2023 | | $ | 21.69 | | | | 0.32 | | | | 2.02 | | | | 2.34 | | | | — | | | | (0.79 | ) | | | — | | | | (0.79 | ) | |
October 31, 2022 | | $ | 27.24 | | | | 0.24 | | | | (4.38 | ) | | | (4.14 | ) | | | (0.83 | ) | | | (0.58 | ) | | | — | | | | (1.41 | ) | |
October 31, 2021 | | $ | 23.29 | | | | 0.31 | (e) | | | 3.69 | | | | 4.00 | | | | (0.05 | ) | | | — | | | | — | | | | (0.05 | ) | |
October 31, 2020 | | $ | 25.13 | | | | 0.15 | | | | (0.74 | ) | | | (0.59 | ) | | | (0.42 | ) | | | (0.83 | ) | | | — | | | | (1.25 | ) | |
October 31, 2019 | | $ | 23.22 | | | | 0.44 | | | | 2.16 | | | | 2.60 | | | | (0.30 | ) | | | (0.39 | ) | | | — | | | | (0.69 | ) | |
First Eagle Overseas Fund Class R4*** | |
October 31, 2023 | | $ | 21.76 | | | | 0.32 | | | | 2.07 | | | | 2.39 | | | | (0.04 | ) | | | (0.79 | ) | | | — | | | | (0.83 | ) | |
October 31, 2022 | | $ | 27.29 | | | | 0.38 | | | | (4.42 | ) | | | (4.04 | ) | | | (0.91 | ) | | | (0.58 | ) | | | — | | | | (1.49 | ) | |
October 31, 2021 | | $ | 23.34 | | | | 0.35 | (e) | | | 3.73 | | | | 4.08 | | | | (0.13 | ) | | | — | | | | — | | | | (0.13 | ) | |
October 31, 2020 | | $ | 25.20 | | | | 0.16 | | | | (0.66 | ) | | | (0.50 | ) | | | (0.53 | ) | | | (0.83 | ) | | | — | | | | (1.36 | ) | |
October 31, 2019 | | $ | 23.23 | | | | 0.35 | | | | 2.33 | | | | 2.68 | | | | (0.32 | ) | | | (0.39 | ) | | | — | | | | (0.71 | ) | |
First Eagle Funds | Annual Report | October 31, 2023
168
| | | | | | | | | Ratios/Supplemental data | | | |
| | | | | | | | | Ratios to Average Net Assets of: | | | |
Selected per
share data for
the period ended: | | Net asset
value, end
of period | | Total
return(a) | | Net assets,
end of
period
(thousands) | | Operating
expenses
excluding
earnings
credits
and/or fee
waivers | | Operating
expenses
including
earnings
credits
and/or fee
waivers | | Net
investment
income
excluding
earnings
credits
and/or fee
waivers | | Net
investment
income
including
earnings
credits
and/or fee
waivers | | Portfolio
turnover
rate | |
First Eagle Global Fund Class R6*** | |
October 31, 2023 | | $ | 60.46 | | | | 10.70 | % | | $ | 2,061,709 | | | | 0.79 | % | | | 0.79 | % | | | 1.68 | % | | | 1.68 | % | | | 6.00 | % | |
October 31, 2022 | | $ | 57.02 | | | | (11.62 | )% | | $ | 1,700,134 | | | | 0.79 | % | | | 0.79 | % | | | 1.15 | % | | | 1.15 | % | | | 10.87 | % | |
October 31, 2021 | | $ | 68.95 | | | | 26.91 | %(g) | | $ | 2,122,258 | | | | 0.78 | % | | | 0.78 | % | | | 1.38 | %(d) | | | 1.38 | %(d) | | | 7.29 | % | |
October 31, 2020 | | $ | 55.83 | | | | (0.79 | )% | | $ | 1,555,290 | | | | 0.79 | % | | | 0.79 | % | | | 1.15 | % | | | 1.15 | % | | | 10.84 | % | |
October 31, 2019 | | $ | 59.55 | | | | 11.79 | % | | $ | 944,249 | | | | 0.79 | % | | | 0.79 | % | | | 1.44 | % | | | 1.44 | % | | | 10.26 | % | |
First Eagle Overseas Fund Class A*** | |
October 31, 2023 | | $ | 22.81 | | | | 11.11 | % | | $ | 1,360,488 | | | | 1.15 | % | | | 1.15 | % | | | 1.56 | % | | | 1.56 | % | | | 3.98 | % | |
October 31, 2022 | | $ | 21.26 | | | | (15.62 | )% | | $ | 1,394,388 | | | | 1.15 | % | | | 1.15 | % | | | 1.24 | % | | | 1.24 | % | | | 8.99 | % | |
October 31, 2021 | | $ | 26.71 | | | | 17.35 | %(h) | | $ | 1,895,378 | | | | 1.16 | % | | | 1.16 | % | | | 1.20 | %(e) | | | 1.20 | %(e) | | | 9.93 | % | |
October 31, 2020 | | $ | 22.80 | | | | (2.35 | )% | | $ | 1,742,861 | | | | 1.15 | % | | | 1.15 | % | | | 0.82 | % | | | 0.82 | % | | | 13.20 | % | |
October 31, 2019 | | $ | 24.65 | | | | 11.82 | % | | $ | 2,125,742 | | | | 1.15 | % | | | 1.15 | % | | | 1.38 | % | | | 1.38 | % | | | 6.99 | % | |
First Eagle Overseas Fund Class C*** | |
October 31, 2023 | | $ | 21.55 | | | | 10.26 | % | | $ | 74,231 | | | | 1.88 | % | | | 1.88 | % | | | 0.82 | % | | | 0.82 | % | | | 3.98 | % | |
October 31, 2022 | | $ | 20.26 | | | | (16.23 | )% | | $ | 92,476 | | | | 1.89 | % | | | 1.89 | % | | | 0.48 | % | | | 0.48 | % | | | 8.99 | % | |
October 31, 2021 | | $ | 25.44 | | | | 16.49 | %(h) | | $ | 157,203 | | | | 1.89 | % | | | 1.89 | % | | | 0.41 | %(e) | | | 0.41 | %(e) | | | 9.93 | % | |
October 31, 2020 | | $ | 21.83 | | | | (3.07 | )% | | $ | 228,072 | | | | 1.89 | % | | | 1.89 | % | | | 0.08 | % | | | 0.08 | % | | | 13.20 | % | |
October 31, 2019 | | $ | 23.58 | | | | 10.98 | % | | $ | 378,755 | | | | 1.89 | % | | | 1.89 | % | | | 0.50 | % | | | 0.50 | % | | | 6.99 | % | |
First Eagle Overseas Fund Class I*** | |
October 31, 2023 | | $ | 23.43 | | | | 11.36 | % | | $ | 9,122,327 | | | | 0.88 | % | | | 0.88 | % | | | 1.84 | % | | | 1.84 | % | | | 3.98 | % | |
October 31, 2022 | | $ | 21.83 | | | | (15.40 | )% | | $ | 8,462,922 | | | | 0.89 | % | | | 0.89 | % | | | 1.49 | % | | | 1.49 | % | | | 8.99 | % | |
October 31, 2021 | | $ | 27.39 | | | | 17.71 | %(h) | | $ | 11,072,223 | | | | 0.88 | % | | | 0.88 | % | | | 1.49 | %(e) | | | 1.49 | %(e) | | | 9.93 | % | |
October 31, 2020 | | $ | 23.38 | | | | (2.06 | )% | | $ | 9,698,986 | | | | 0.87 | % | | | 0.87 | % | | | 1.11 | % | | | 1.11 | % | | | 13.20 | % | |
October 31, 2019 | | $ | 25.24 | | | | 12.12 | % | | $ | 10,694,125 | | | | 0.86 | % | | | 0.86 | % | | | 1.64 | % | | | 1.64 | % | | | 6.99 | % | |
First Eagle Overseas Fund Class R3*** | |
October 31, 2023 | | $ | 23.24 | | | | 10.80 | % | | $ | 397 | | | | 1.41 | % | | | 1.41 | % | | | 1.32 | % | | | 1.32 | % | | | 3.98 | % | |
October 31, 2022 | | $ | 21.69 | | | | (15.85 | )% | | $ | 297 | | | | 1.40 | % | | | 1.40 | % | | | 1.00 | % | | | 1.00 | % | | | 8.99 | % | |
October 31, 2021 | | $ | 27.24 | | | | 17.18 | %(h) | | $ | 382 | | | | 1.34 | % | | | 1.34 | % | | | 1.16 | %(e) | | | 1.16 | %(e) | | | 9.93 | % | |
October 31, 2020 | | $ | 23.29 | | | | (2.56 | )% | | $ | 183 | | | | 1.36 | % | | | 1.36 | % | | | 0.65 | % | | | 0.65 | % | | | 13.20 | % | |
October 31, 2019 | | $ | 25.13 | | | | 11.59 | % | | $ | 96 | | | | 1.32 | % | | | 1.32 | % | | | 1.84 | % | | | 1.84 | % | | | 6.99 | % | |
First Eagle Overseas Fund Class R4*** | |
October 31, 2023 | | $ | 23.32 | | | | 11.02 | % | | $ | 5,058 | | | | 1.16 | % | | | 1.15 | % | | | 1.36 | % | | | 1.36 | % | | | 3.98 | % | |
October 31, 2022 | | $ | 21.76 | | | | (15.49 | )% | | $ | 12,543 | | | | 1.01 | % | | | 1.01 | % | | | 1.58 | % | | | 1.58 | % | | | 8.99 | % | |
October 31, 2021 | | $ | 27.29 | | | | 17.53 | %(h) | | $ | 10,239 | | | | 1.06 | % | | | 1.06 | % | | | 1.29 | %(e) | | | 1.29 | %(e) | | | 9.93 | % | |
October 31, 2020 | | $ | 23.34 | | | | (2.22 | )% | | $ | 7,326 | | | | 0.91 | % | | | 0.91 | % | | | 0.69 | % | | | 0.69 | % | | | 13.20 | % | |
October 31, 2019 | | $ | 25.20 | | | | 11.92 | % | | $ | 91 | | | | 1.04 | % | | | 1.04 | % | | | 1.48 | % | | | 1.48 | % | | | 6.99 | % | |
First Eagle Funds | Annual Report | October 31, 2023
169
| | | Per share operating performance* | |
| | | | | Change in net assets resulting
from operations | | Less dividends and distributions | |
Selected per
share data for
the period ended: | | Net asset
value,
beginning
of year | | Net
investment
income/
loss | | Net
realized
and
unrealized
gains
(losses) on
investments | | Total
investment
operations | | From net
investment
income | | From
capital
gains | | Return of
capital | | Total
distributions | |
First Eagle Overseas Fund Class R5*** | |
October 31, 2023 | | $ | 21.71 | | | | 0.40 | | | | 2.04 | | | | 2.44 | | | | — | | | | (0.79 | ) | | | — | | | | (0.79 | ) | |
October 31, 2022 | | $ | 27.27 | | | | 0.23 | | | | (4.33 | ) | | | (4.10 | ) | | | (0.88 | ) | | | (0.58 | ) | | | — | | | | (1.46 | ) | |
October 31, 2021 | | $ | 23.27 | | | | 0.33 | (e) | | | 3.70 | | | | 4.03 | | | | (0.03 | ) | | | — | | | | — | | | | (0.03 | ) | |
October 31, 2020 | | $ | 25.20 | | | | 0.18 | | | | (0.75 | ) | | | (0.57 | ) | | | (0.53 | ) | | | (0.83 | ) | | | — | | | | (1.36 | ) | |
For The Period
3/11/19^-10/31/19 | | $ | 23.37 | | | | 0.28 | | | | 1.55 | | | | 1.83 | | | | — | | | | — | | | | — | | | | — | | |
First Eagle Overseas Fund Class R6*** | |
October 31, 2023 | | $ | 21.84 | | | | 0.46 | | | | 2.03 | | | | 2.49 | | | | (0.10 | ) | | | (0.79 | ) | | | — | | | | (0.89 | ) | |
October 31, 2022 | | $ | 27.40 | | | | 0.39 | | | | (4.40 | ) | | | (4.01 | ) | | | (0.97 | ) | | | (0.58 | ) | | | — | | | | (1.55 | ) | |
October 31, 2021 | | $ | 23.39 | | | | 0.45 | (e) | | | 3.70 | | | | 4.15 | | | | (0.14 | ) | | | — | | | | — | | | | (0.14 | ) | |
October 31, 2020 | | $ | 25.25 | | | | 0.28 | | | | (0.72 | ) | | | (0.44 | ) | | | (0.59 | ) | | | (0.83 | ) | | | — | | | | (1.42 | ) | |
October 31, 2019 | | $ | 23.27 | | | | 0.41 | | | | 2.33 | | | | 2.74 | | | | (0.37 | ) | | | (0.39 | ) | | | — | | | | (0.76 | ) | |
First Eagle U.S. Value Fund Class A*** | |
October 31, 2023 | | $ | 18.41 | | | | 0.22 | | | | 1.37 | | | | 1.59 | | | | (0.10 | ) | | | (1.36 | ) | | | — | | | | (1.46 | ) | |
October 31, 2022 | | $ | 22.23 | | | | 0.13 | | | | (2.08 | ) | | | (1.95 | ) | | | (0.17 | ) | | | (1.70 | ) | | | — | | | | (1.87 | ) | |
October 31, 2021 | | $ | 16.97 | | | | 0.09 | | | | 5.49 | | | | 5.58 | | | | (0.20 | ) | | | (0.12 | ) | | | — | | | | (0.32 | ) | |
October 31, 2020 | | $ | 18.84 | | | | 0.14 | | | | (0.48 | ) | | | (0.34 | ) | | | (0.16 | ) | | | (1.37 | ) | | | — | | | | (1.53 | ) | |
October 31, 2019 | | $ | 19.89 | | | | 0.16 | | | | 1.44 | | | | 1.60 | | | | (0.12 | ) | | | (2.53 | ) | | | — | | | | (2.65 | ) | |
First Eagle U.S. Value Fund Class C*** | |
October 31, 2023 | | $ | 17.39 | | | | 0.08 | | | | 1.29 | | | | 1.37 | | | | — | | | | (1.36 | ) | | | — | | | | (1.36 | ) | |
October 31, 2022 | | $ | 21.08 | | | | (0.02 | ) | | | (1.97 | ) | | | (1.99 | ) | | | — | | | | (1.70 | ) | | | — | | | | (1.70 | ) | |
October 31, 2021 | | $ | 16.06 | | | | (0.06 | ) | | | 5.22 | | | | 5.16 | | | | (0.02 | ) | | | (0.12 | ) | | | — | | | | (0.14 | ) | |
October 31, 2020 | | $ | 17.89 | | | | 0.01 | | | | (0.47 | ) | | | (0.46 | ) | | | — | | | | (1.37 | ) | | | — | | | | (1.37 | ) | |
October 31, 2019 | | $ | 19.03 | | | | 0.02 | | | | 1.37 | | | | 1.39 | | | | — | | | | (2.53 | ) | | | — | | | | (2.53 | ) | |
First Eagle U.S. Value Fund Class I*** | |
October 31, 2023 | | $ | 18.84 | | | | 0.28 | | | | 1.39 | | | | 1.67 | | | | (0.15 | ) | | | (1.36 | ) | | | — | | | | (1.51 | ) | |
October 31, 2022 | | $ | 22.71 | | | | 0.19 | | | | (2.13 | ) | | | (1.94 | ) | | | (0.23 | ) | | | (1.70 | ) | | | — | | | | (1.93 | ) | |
October 31, 2021 | | $ | 17.32 | | | | 0.15 | | | | 5.61 | | | | 5.76 | | | | (0.25 | ) | | | (0.12 | ) | | | — | | | | (0.37 | ) | |
October 31, 2020 | | $ | 19.21 | | | | 0.20 | | | | (0.51 | ) | | | (0.31 | ) | | | (0.21 | ) | | | (1.37 | ) | | | — | | | | (1.58 | ) | |
October 31, 2019 | | $ | 20.23 | | | | 0.21 | | | | 1.48 | | | | 1.69 | | | | (0.18 | ) | | | (2.53 | ) | | | — | | | | (2.71 | ) | |
First Eagle U.S. Value Fund Class R3*** | |
October 31, 2023 | | $ | 18.75 | | | | 0.17 | | | | 1.39 | | | | 1.56 | | | | (0.06 | ) | | | (1.36 | ) | | | — | | | | (1.42 | ) | |
October 31, 2022 | | $ | 22.61 | | | | 0.09 | | | | (2.11 | ) | | | (2.02 | ) | | | (0.14 | ) | | | (1.70 | ) | | | — | | | | (1.84 | ) | |
October 31, 2021 | | $ | 17.25 | | | | 0.07 | | | | 5.58 | | | | 5.65 | | | | (0.17 | ) | | | (0.12 | ) | | | — | | | | (0.29 | ) | |
October 31, 2020 | | $ | 19.15 | | | | 0.11 | | | | (0.50 | ) | | | (0.39 | ) | | | (0.14 | ) | | | (1.37 | ) | | | — | | | | (1.51 | ) | |
October 31, 2019 | | $ | 20.20 | | | | 0.14 | | | | 1.48 | | | | 1.62 | | | | (0.14 | ) | | | (2.53 | ) | | | — | | | | (2.67 | ) | |
First Eagle Funds | Annual Report | October 31, 2023
170
| | | | | | | | | Ratios/Supplemental data | | | |
| | | | | | | | | Ratios to Average Net Assets of: | | | |
Selected per
share data for
the period ended: | | Net asset
value, end
of period | | Total
return(a) | | Net assets,
end of
period
(thousands) | | Operating
expenses
excluding
earnings
credits
and/or fee
waivers | | Operating
expenses
including
earnings
credits
and/or fee
waivers | | Net
investment
income
excluding
earnings
credits
and/or fee
waivers | | Net
investment
income
including
earnings
credits
and/or fee
waivers | | Portfolio
turnover
rate | |
First Eagle Overseas Fund Class R5*** | |
October 31, 2023 | | $ | 23.36 | | | | 11.27 | % | | $ | 39 | | | | 1.00 | % | | | 0.99 | % | | | 1.64 | % | | | 1.65 | % | | | 3.98 | % | |
October 31, 2022 | | $ | 21.71 | | | | (15.70 | )% | | $ | 38 | | | | 1.17 | % | | | 1.17 | % | | | 0.94 | % | | | 0.94 | % | | | 8.99 | % | |
October 31, 2021 | | $ | 27.27 | | | | 17.33 | %(h) | | $ | 70 | | | | 1.20 | % | | | 1.20 | % | | | 1.23 | %(e) | | | 1.23 | %(e) | | | 9.93 | % | |
October 31, 2020 | | $ | 23.27 | | | | (2.51 | )% | | $ | 27 | | | | 1.31 | % | | | 1.31 | % | | | 0.77 | % | | | 0.77 | % | | | 13.20 | % | |
For The Period
3/11/19^-10/31/19 | | $ | 25.20 | | | | 7.83 | %(b) | | $ | 16 | | | | 1.12 | %(c) | | | 1.12 | %(c) | | | 1.79 | %(c) | | | 1.79 | %(c) | | | 6.99 | %(b) | |
First Eagle Overseas Fund Class R6*** | |
October 31, 2023 | | $ | 23.44 | | | | 11.45 | % | | $ | 1,289,925 | | | | 0.80 | % | | | 0.80 | % | | | 1.91 | % | | | 1.92 | % | | | 3.98 | % | |
October 31, 2022 | | $ | 21.84 | | | | (15.32 | )% | | $ | 1,255,272 | | | | 0.80 | % | | | 0.80 | % | | | 1.58 | % | | | 1.58 | % | | | 8.99 | % | |
October 31, 2021 | | $ | 27.40 | | | | 17.78 | %(h) | | $ | 1,566,467 | | | | 0.79 | % | | | 0.79 | % | | | 1.65 | %(e) | | | 1.65 | %(e) | | | 9.93 | % | |
October 31, 2020 | | $ | 23.39 | | | | (1.99 | )% | | $ | 919,645 | | | | 0.80 | % | | | 0.80 | % | | | 1.19 | % | | | 1.19 | % | | | 13.20 | % | |
October 31, 2019 | | $ | 25.25 | | | | 12.21 | % | | $ | 759,773 | | | | 0.80 | % | | | 0.80 | % | | | 1.74 | % | | | 1.74 | % | | | 6.99 | % | |
First Eagle U.S. Value Fund Class A*** | |
October 31, 2023 | | $ | 18.54 | | | | 8.81 | % | | $ | 536,105 | | | | 1.16 | % | | | 1.10 | % | | | 1.14 | % | | | 1.19 | % | | | 6.62 | % | |
October 31, 2022 | | $ | 18.41 | | | | (9.12 | )% | | $ | 540,287 | | | | 1.16 | % | | | 1.11 | % | | | 0.60 | % | | | 0.65 | % | | | 10.33 | % | |
October 31, 2021 | | $ | 22.23 | | | | 33.28 | % | | $ | 638,937 | | | | 1.16 | % | | | 1.11 | % | | | 0.40 | % | | | 0.45 | % | | | 4.02 | % | |
October 31, 2020 | | $ | 16.97 | | | | (2.23 | )% | | $ | 485,589 | | | | 1.18 | % | | | 1.13 | % | | | 0.78 | % | | | 0.83 | % | | | 10.30 | % | |
October 31, 2019 | | $ | 18.84 | | | | 9.43 | % | | $ | 613,548 | | | | 1.16 | % | | | 1.11 | % | | | 0.81 | % | | | 0.86 | % | | | 8.65 | % | |
First Eagle U.S. Value Fund Class C*** | |
October 31, 2023 | | $ | 17.40 | | | | 8.00 | % | | $ | 29,230 | | | | 1.91 | % | | | 1.86 | % | | | 0.37 | % | | | 0.43 | % | | | 6.62 | % | �� |
October 31, 2022 | | $ | 17.39 | | | | (9.82 | )% | | $ | 34,953 | | | | 1.92 | % | | | 1.87 | % | | | (0.18 | )% | | | (0.13 | )% | | | 10.33 | % | |
October 31, 2021 | | $ | 21.08 | | | | 32.29 | % | | $ | 53,912 | | | | 1.95 | % | | | 1.90 | % | | | (0.38 | )% | | | (0.33 | )% | | | 4.02 | % | |
October 31, 2020 | | $ | 16.06 | | | | (3.00 | )% | | $ | 101,600 | | | | 1.94 | % | | | 1.89 | % | | | 0.03 | % | | | 0.08 | % | | | 10.30 | % | |
October 31, 2019 | | $ | 17.89 | | | | 8.59 | % | | $ | 194,380 | | | | 1.92 | % | | | 1.87 | % | | | 0.06 | % | | | 0.11 | % | | | 8.65 | % | |
First Eagle U.S. Value Fund Class I*** | |
October 31, 2023 | | $ | 19.00 | | | | 9.08 | % | | $ | 541,195 | | | | 0.91 | % | | | 0.86 | % | | | 1.38 | % | | | 1.44 | % | | | 6.62 | % | |
October 31, 2022 | | $ | 18.84 | | | | (8.88 | )% | | $ | 538,424 | | | | 0.88 | % | | | 0.83 | % | | | 0.88 | % | | | 0.93 | % | | | 10.33 | % | |
October 31, 2021 | | $ | 22.71 | | | | 33.72 | % | | $ | 584,344 | | | | 0.89 | % | | | 0.84 | % | | | 0.68 | % | | | 0.73 | % | | | 4.02 | % | |
October 31, 2020 | | $ | 17.32 | | | | (2.01 | )% | | $ | 505,997 | | | | 0.89 | % | | | 0.84 | % | | | 1.08 | % | | | 1.13 | % | | | 10.30 | % | |
October 31, 2019 | | $ | 19.21 | | | | 9.79 | % | | $ | 749,245 | | | | 0.88 | % | | | 0.83 | % | | | 1.09 | % | | | 1.14 | % | | | 8.65 | % | |
First Eagle U.S. Value Fund Class R3*** | |
October 31, 2023 | | $ | 18.89 | | | | 8.46 | % | | $ | 71 | | | | 1.46 | % | | | 1.41 | % | | | 0.83 | % | | | 0.89 | % | | | 6.62 | % | |
October 31, 2022 | | $ | 18.75 | | | | (9.28 | )% | | $ | 64 | | | | 1.34 | % | | | 1.29 | % | | | 0.42 | % | | | 0.47 | % | | | 10.33 | % | |
October 31, 2021 | | $ | 22.61 | | | | 33.10 | % | | $ | 71 | | | | 1.31 | % | | | 1.26 | % | | | 0.26 | % | | | 0.31 | % | | | 4.02 | % | |
October 31, 2020 | | $ | 17.25 | | | | (2.46 | )% | | $ | 53 | | | | 1.36 | % | | | 1.31 | % | | | 0.59 | % | | | 0.64 | % | | | 10.30 | % | |
October 31, 2019 | | $ | 19.15 | | | | 9.37 | % | | $ | 54 | | | | 1.26 | % | | | 1.21 | % | | | 0.71 | % | | | 0.76 | % | | | 8.65 | % | |
First Eagle Funds | Annual Report | October 31, 2023
171
| | | Per share operating performance* | |
| | | | | Change in net assets resulting
from operations | | Less dividends and distributions | |
Selected per
share data for
the period ended: | | Net asset
value,
beginning
of year | | Net
investment
income/
loss | | Net
realized
and
unrealized
gains
(losses) on
investments | | Total
investment
operations | | From net
investment
income | | From
capital
gains | | Return of
capital | | Total
distributions | |
First Eagle U.S. Value Fund Class R4*** | |
October 31, 2023 | | $ | 18.76 | | | | 0.22 | | | | 1.38 | | | | 1.60 | | | | (0.12 | ) | | | (1.36 | ) | | | — | | | | (1.48 | ) | |
October 31, 2022 | | $ | 22.61 | | | | 0.14 | | | | (2.14 | ) | | | (2.00 | ) | | | (0.15 | ) | | | (1.70 | ) | | | — | | | | (1.85 | ) | |
October 31, 2021 | | $ | 17.25 | | | | 0.09 | | | | 5.56 | | | | 5.65 | | | | (0.17 | ) | | | (0.12 | ) | | | — | | | | (0.29 | ) | |
October 31, 2020 | | $ | 19.18 | | | | 0.13 | | | | (0.51 | ) | | | (0.38 | ) | | | (0.18 | ) | | | (1.37 | ) | | | — | | | | (1.55 | ) | |
For The Period
7/29/19^-10/31/19 | | $ | 19.40 | | | | 0.02 | | | | (0.24 | ) | | | (0.22 | ) | | | — | | | | — | | | | — | | | | — | | |
First Eagle U.S. Value Fund Class R5*** | |
October 31, 2023 | | $ | 18.77 | | | | 0.26 | | | | 1.40 | | | | 1.66 | | | | (0.13 | ) | | | (1.36 | ) | | | — | | | | (1.49 | ) | |
October 31, 2022 | | $ | 22.62 | | | | 0.16 | | | | (2.13 | ) | | | (1.97 | ) | | | (0.18 | ) | | | (1.70 | ) | | | — | | | | (1.88 | ) | |
October 31, 2021 | | $ | 17.28 | | | | 0.10 | | | | 5.59 | | | | 5.69 | | | | (0.23 | ) | | | (0.12 | ) | | | — | | | | (0.35 | ) | |
October 31, 2020 | | $ | 19.18 | | | | 0.12 | | | | (0.46 | ) | | | (0.34 | ) | | | (0.19 | ) | | | (1.37 | ) | | | — | | | | (1.56 | ) | |
For The Period
7/29/19^-10/31/19 | | $ | 19.40 | | | | 0.03 | | | | (0.25 | ) | | | (0.22 | ) | | | — | | | | — | | | | — | | | | — | | |
First Eagle U.S. Value Fund Class R6*** | |
October 31, 2023 | | $ | 18.84 | | | | 0.29 | | | | 1.39 | | | | 1.68 | | | | (0.16 | ) | | | (1.36 | ) | | | — | | | | (1.52 | ) | |
October 31, 2022 | | $ | 22.71 | | | | 0.20 | | | | (2.13 | ) | | | (1.93 | ) | | | (0.24 | ) | | | (1.70 | ) | | | — | | | | (1.94 | ) | |
October 31, 2021 | | $ | 17.32 | | | | 0.16 | | | | 5.61 | | | | 5.77 | | | | (0.26 | ) | | | (0.12 | ) | | | — | | | | (0.38 | ) | |
October 31, 2020 | | $ | 19.22 | | | | 0.19 | | | | (0.50 | ) | | | (0.31 | ) | | | (0.22 | ) | | | (1.37 | ) | | | — | | | | (1.59 | ) | |
October 31, 2019 | | $ | 20.24 | | | | 0.21 | | | | 1.49 | | | | 1.70 | | | | (0.19 | ) | | | (2.53 | ) | | | — | | | | (2.72 | ) | |
First Eagle Gold Fund Class A*** | |
October 31, 2023 | | $ | 19.25 | | | | 0.19 | | | | 2.86 | | | | 3.05 | | | | — | | | | — | | | | — | | | | — | | |
October 31, 2022 | | $ | 22.94 | | | | 0.05 | | | | (3.52 | ) | | | (3.47 | ) | | | (0.22 | ) | | | — | | | | — | | | | (0.22 | ) | |
October 31, 2021 | | $ | 26.28 | | | | (0.01 | ) | | | (3.01 | ) | | | (3.02 | ) | | | (0.32 | ) | | | — | | | | — | | | | (0.32 | ) | |
October 31, 2020 | | $ | 18.66 | | | | (0.12 | ) | | | 7.74 | | | | 7.62 | | | | — | | | | — | | | | — | | | | — | | |
October 31, 2019 | | $ | 13.08 | | | | (0.04 | ) | | | 5.62 | | | | 5.58 | | | | — | | | | — | | | | — | | | | — | | |
First Eagle Gold Fund Class C*** | |
October 31, 2023 | | $ | 17.48 | | | | 0.01 | | | | 2.61 | | | | 2.62 | | | | — | | | | — | | | | — | | | | — | | |
October 31, 2022 | | $ | 20.82 | | | | (0.10 | ) | | | (3.19 | ) | | | (3.29 | ) | | | (0.05 | ) | | | — | | | | — | | | | (0.05 | ) | |
October 31, 2021 | | $ | 23.92 | | | | (0.17 | ) | | | (2.76 | ) | | | (2.93 | ) | | | (0.17 | ) | | | — | | | | — | | | | (0.17 | ) | |
October 31, 2020 | | $ | 17.11 | | | | (0.26 | ) | | | 7.07 | | | | 6.81 | | | | — | | | | — | | | | — | | | | — | | |
October 31, 2019 | | $ | 12.09 | | | | (0.15 | ) | | | 5.17 | | | | 5.02 | | | | — | | | | — | | | | — | | | | — | | |
First Eagle Gold Fund Class I*** | |
October 31, 2023 | | $ | 19.88 | | | | 0.26 | | | | 2.94 | | | | 3.20 | | | | — | | | | — | | | | — | | | | — | | |
October 31, 2022 | | $ | 23.68 | | | | 0.12 | | | | (3.64 | ) | | | (3.52 | ) | | | (0.28 | ) | | | — | | | | — | | | | (0.28 | ) | |
October 31, 2021 | | $ | 27.13 | | | | 0.06 | | | | (3.13 | ) | | | (3.07 | ) | | | (0.38 | ) | | | — | | | | — | | | | (0.38 | ) | |
October 31, 2020 | | $ | 19.22 | | | | (0.06 | ) | | | 7.99 | | | | 7.93 | | | | (0.02 | ) | | | — | | | | — | | | | (0.02 | ) | |
October 31, 2019 | | $ | 13.44 | | | | 0.00 | ** | | | 5.78 | | | | 5.78 | | | | — | | | | — | | | | — | | | | — | | |
First Eagle Funds | Annual Report | October 31, 2023
172
| | | | | | | | | Ratios/Supplemental data | | | |
| | | | | | | | | Ratios to Average Net Assets of: | | | |
Selected per
share data for
the period ended: | | Net asset
value, end
of period | | Total
return(a) | | Net assets,
end of
period
(thousands) | | Operating
expenses
excluding
earnings
credits
and/or fee
waivers | | Operating
expenses
including
earnings
credits
and/or fee
waivers | | Net
investment
income
excluding
earnings
credits
and/or fee
waivers | | Net
investment
income
including
earnings
credits
and/or fee
waivers | | Portfolio
turnover
rate | |
First Eagle U.S. Value Fund Class R4*** | |
October 31, 2023 | | $ | 18.88 | | | | 8.70 | % | | $ | 43 | | | | 1.24 | % | | | 1.18 | % | | | 1.07 | % | | | 1.12 | % | | | 6.62 | % | |
October 31, 2022 | | $ | 18.76 | | | | (9.17 | )% | | $ | 33 | | | | 1.14 | % | | | 1.09 | % | | | 0.66 | % | | | 0.71 | % | | | 10.33 | % | |
October 31, 2021 | | $ | 22.61 | | | | 33.13 | % | | $ | 13 | | | | 1.21 | % | | | 1.16 | % | | | 0.35 | % | | | 0.41 | % | | | 4.02 | % | |
October 31, 2020 | | $ | 17.25 | | | | (2.39 | )% | | $ | 10 | | | | 1.24 | % | | | 1.20 | % | | | 0.70 | % | | | 0.74 | % | | | 10.30 | % | |
For The Period
7/29/19^-10/31/19 | | $ | 19.18 | | | | (1.13 | )%(b) | | $ | 10 | | | | 1.51 | %(c) | | | 1.47 | %(c) | | | 0.39 | %(c) | | | 0.43 | %(c) | | | 8.65 | %(b) | |
First Eagle U.S. Value Fund Class R5*** | |
October 31, 2023 | | $ | 18.94 | | | | 9.01 | % | | $ | 86 | | | | 1.00 | % | | | 0.95 | % | | | 1.29 | % | | | 1.35 | % | | | 6.62 | % | |
October 31, 2022 | | $ | 18.77 | | | | (9.03 | )% | | $ | 75 | | | | 1.02 | % | | | 0.97 | % | | | 0.74 | % | | | 0.79 | % | | | 10.33 | % | |
October 31, 2021 | | $ | 22.62 | | | | 33.35 | % | | $ | 75 | | | | 1.13 | % | | | 1.08 | % | | | 0.43 | % | | | 0.48 | % | | | 4.02 | % | |
October 31, 2020 | | $ | 17.28 | | | | (2.18 | )% | | $ | 53 | | | | 1.09 | % | | | 1.05 | % | | | 0.67 | % | | | 0.71 | % | | | 10.30 | % | |
For The Period
7/29/19^-10/31/19 | | $ | 19.18 | | | | (1.13 | )%(b) | | $ | 10 | | | | 1.40 | %(c) | | | 1.36 | %(c) | | | 0.50 | %(c) | | | 0.54 | %(c) | | | 8.65 | %(b) | |
First Eagle U.S. Value Fund Class R6*** | |
October 31, 2023 | | $ | 19.00 | | | | 9.14 | % | | $ | 32,405 | | | | 0.84 | % | | | 0.79 | % | | | 1.46 | % | | | 1.51 | % | | | 6.62 | % | |
October 31, 2022 | | $ | 18.84 | | | | (8.83 | )% | | $ | 25,921 | | | | 0.83 | % | | | 0.78 | % | | | 0.94 | % | | | 0.99 | % | | | 10.33 | % | |
October 31, 2021 | | $ | 22.71 | | | | 33.78 | % | | $ | 25,676 | | | | 0.84 | % | | | 0.79 | % | | | 0.72 | % | | | 0.77 | % | | | 4.02 | % | |
October 31, 2020 | | $ | 17.32 | | | | (2.02 | )% | | $ | 15,058 | | | | 0.86 | % | | | 0.81 | % | | | 1.03 | % | | | 1.08 | % | | | 10.30 | % | |
October 31, 2019 | | $ | 19.22 | | | | 9.83 | % | | $ | 15,949 | | | | 0.83 | % | | | 0.78 | % | | | 1.09 | % | | | 1.14 | % | | | 8.65 | % | |
First Eagle Gold Fund Class A*** | |
October 31, 2023 | | $ | 22.30 | | | | 15.84 | % | | $ | 549,712 | | | | 1.19 | % | | | 1.18 | % | | | 0.81 | % | | | 0.81 | % | | | 16.39 | % | |
October 31, 2022 | | $ | 19.25 | | | | (15.24 | )% | | $ | 494,372 | | | | 1.19 | % | | | 1.19 | % | | | 0.24 | % | | | 0.24 | % | | | 17.78 | % | |
October 31, 2021 | | $ | 22.94 | | | | (11.60 | )% | | $ | 578,968 | | | | 1.22 | % | | | 1.22 | % | | | (0.03 | )% | | | (0.03 | )% | | | 5.13 | % | |
October 31, 2020 | | $ | 26.28 | | | | 40.84 | % | | $ | 643,945 | | | | 1.21 | % | | | 1.21 | % | | | (0.52 | )% | | | (0.52 | )% | | | 3.34 | % | |
October 31, 2019 | | $ | 18.66 | | | | 42.66 | % | | $ | 386,633 | | | | 1.29 | % | | | 1.29 | % | | | (0.27 | )% | | | (0.27 | )% | | | 20.01 | % | |
First Eagle Gold Fund Class C*** | |
October 31, 2023 | | $ | 20.10 | | | | 14.99 | % | | $ | 108,058 | | | | 1.92 | % | | | 1.92 | % | | | 0.06 | % | | | 0.07 | % | | | 16.39 | % | |
October 31, 2022 | | $ | 17.48 | | | | (15.87 | )% | | $ | 104,359 | | | | 1.93 | % | | | 1.93 | % | | | (0.51 | )% | | | (0.51 | )% | | | 17.78 | % | |
October 31, 2021 | | $ | 20.82 | | | | (12.25 | )% | | $ | 144,502 | | | | 1.95 | % | | | 1.95 | % | | | (0.77 | )% | | | (0.77 | )% | | | 5.13 | % | |
October 31, 2020 | | $ | 23.92 | | | | 39.80 | % | | $ | 179,978 | | | | 1.95 | % | | | 1.95 | % | | | (1.25 | )% | | | (1.25 | )% | | | 3.34 | % | |
October 31, 2019 | | $ | 17.11 | | | | 41.52 | % | | $ | 115,624 | | | | 2.05 | % | | | 2.05 | % | | | (1.02 | )% | | | (1.02 | )% | | | 20.01 | % | |
First Eagle Gold Fund Class I*** | |
October 31, 2023 | | $ | 23.08 | | | | 16.10 | % | | $ | 1,349,359 | | | | 0.94 | % | | | 0.94 | % | | | 1.07 | % | | | 1.07 | % | | | 16.39 | % | |
October 31, 2022 | | $ | 19.88 | | | | (15.00 | )% | | $ | 1,075,242 | | | | 0.94 | % | | | 0.94 | % | | | 0.50 | % | | | 0.50 | % | | | 17.78 | % | |
October 31, 2021 | | $ | 23.68 | | | | (11.41 | )% | | $ | 1,349,701 | | | | 0.96 | % | | | 0.96 | % | | | 0.23 | % | | | 0.23 | % | | | 5.13 | % | |
October 31, 2020 | | $ | 27.13 | | | | 41.29 | % | | $ | 1,424,181 | | | | 0.92 | % | | | 0.92 | % | | | (0.25 | )% | | | (0.25 | )% | | | 3.34 | % | |
October 31, 2019 | | $ | 19.22 | | | | 43.01 | % | | $ | 553,633 | | | | 0.99 | % | | | 0.99 | % | | | 0.01 | % | | | 0.01 | % | | | 20.01 | % | |
First Eagle Funds | Annual Report | October 31, 2023
173
| | | Per share operating performance* | |
| | | | | Change in net assets resulting
from operations | | Less dividends and distributions | |
Selected per
share data for
the period ended: | | Net asset
value,
beginning
of year | | Net
investment
income/
loss | | Net
realized
and
unrealized
gains
(losses) on
investments | | Total
investment
operations | | From net
investment
income | | From
capital
gains | | Return of
capital | | Total
distributions | |
First Eagle Gold Fund Class R3*** | |
October 31, 2023 | | $ | 19.74 | | | | 0.13 | | | | 2.94 | | | | 3.07 | | | | — | | | | — | | | | — | | | | — | | |
October 31, 2022 | | $ | 23.56 | | | | 0.00 | ** | | | (3.62 | ) | | | (3.62 | ) | | | (0.20 | ) | | | — | | | | — | | | | (0.20 | ) | |
October 31, 2021 | | $ | 26.99 | | | | (0.01 | ) | | | (3.13 | ) | | | (3.14 | ) | | | (0.29 | ) | | | — | | | | — | | | | (0.29 | ) | |
October 31, 2020 | | $ | 19.17 | | | | (0.12 | ) | | | 7.95 | | | | 7.83 | | | | (0.01 | ) | | | — | | | | — | | | | (0.01 | ) | |
October 31, 2019 | | $ | 13.44 | | | | (0.09 | ) | | | 5.82 | | | | 5.73 | | | | — | | | | — | | | | — | | | | — | | |
First Eagle Gold Fund Class R4*** | |
October 31, 2023 | | $ | 19.91 | | | | 0.21 | | | | 2.94 | | | | 3.15 | | | | — | | | | — | | | | — | | | | — | | |
October 31, 2022 | | $ | 23.72 | | | | 0.07 | | | | (3.63 | ) | | | (3.56 | ) | | | (0.25 | ) | | | — | | | | — | | | | (0.25 | ) | |
October 31, 2021 | | $ | 27.19 | | | | 0.02 | | | | (3.12 | ) | | | (3.10 | ) | | | (0.37 | ) | | | — | | | | — | | | | (0.37 | ) | |
October 31, 2020 | | $ | 19.26 | | | | (0.08 | ) | | | 8.01 | | | | 7.93 | | | | — | | | | — | | | | — | | | | — | | |
For The Period
7/29/19^-10/31/19 | | $ | 18.54 | | | | (0.04 | ) | | | 0.76 | | | | 0.72 | | | | — | | | | — | | | | — | | | | — | | |
First Eagle Gold Fund Class R5*** | |
October 31, 2023 | | $ | 19.90 | | | | 0.22 | | | | 2.95 | | | | 3.17 | | | | — | | | | — | | | | — | | | | — | | |
October 31, 2022 | | $ | 23.68 | | | | 0.11 | | | | (3.64 | ) | | | (3.53 | ) | | | (0.25 | ) | | | — | | | | — | | | | (0.25 | ) | |
October 31, 2021 | | $ | 27.16 | | | | 0.04 | | | | (3.14 | ) | | | (3.10 | ) | | | (0.38 | ) | | | — | | | | — | | | | (0.38 | ) | |
October 31, 2020 | | $ | 19.28 | | | | (0.09 | ) | | | 7.99 | | | | 7.90 | | | | (0.02 | ) | | | — | | | | — | | | | (0.02 | ) | |
For The Period
7/29/19^-10/31/19 | | $ | 18.54 | | | | (0.03 | ) | | | 0.77 | | | | 0.74 | | | | — | | | | — | | | | — | | | | — | | |
First Eagle Gold Fund Class R6*** | |
October 31, 2023 | | $ | 19.93 | | | | 0.29 | | | | 2.94 | | | | 3.23 | | | | — | | | | — | | | | — | | | | — | | |
October 31, 2022 | | $ | 23.74 | | | | 0.13 | | | | (3.63 | ) | | | (3.50 | ) | | | (0.31 | ) | | | — | | | | — | | | | (0.31 | ) | |
October 31, 2021 | | $ | 27.19 | | | | 0.08 | | | | (3.13 | ) | | | (3.05 | ) | | | (0.40 | ) | | | — | | | | — | | | | (0.40 | ) | |
October 31, 2020 | | $ | 19.26 | | | | (0.03 | ) | | | 7.99 | | | | 7.96 | | | | (0.03 | ) | | | — | | | | — | | | | (0.03 | ) | |
October 31, 2019 | | $ | 13.46 | | | | 0.01 | | | | 5.79 | | | | 5.80 | | | | — | | | | — | | | | — | | | | — | | |
First Eagle Global Income Builder Fund Class A | |
October 31, 2023 | | $ | 11.62 | | | | 0.32 | | | | 0.43 | | | | 0.75 | | | | (0.29 | ) | | | (0.19 | ) | | | — | | | | (0.48 | ) | |
October 31, 2022 | | $ | 13.52 | | | | 0.27 | | | | (1.34 | ) | | | (1.07 | ) | | | (0.26 | ) | | | (0.57 | ) | | | — | | | | (0.83 | ) | |
October 31, 2021 | | $ | 11.47 | | | | 0.27 | (f) | | | 2.17 | | | | 2.44 | | | | (0.26 | ) | | | (0.13 | ) | | | — | | | | (0.39 | ) | |
October 31, 2020 | | $ | 12.15 | | | | 0.22 | | | | (0.64 | ) | | | (0.42 | ) | | | (0.22 | ) | | | (0.04 | ) | | | — | | | | (0.26 | ) | |
October 31, 2019 | | $ | 11.45 | | | | 0.25 | | | | 0.70 | | | | 0.95 | | | | (0.25 | ) | | | — | | | | — | | | | (0.25 | ) | |
First Eagle Global Income Builder Fund Class C | |
October 31, 2023 | | $ | 11.70 | | | | 0.23 | | | | 0.44 | | | | 0.67 | | | | (0.20 | ) | | | (0.19 | ) | | | — | | | | (0.39 | ) | |
October 31, 2022 | | $ | 13.47 | | | | 0.17 | | | | (1.34 | ) | | | (1.17 | ) | | | (0.03 | ) | | | (0.57 | ) | | | — | | | | (0.60 | ) | |
October 31, 2021 | | $ | 11.44 | | | | 0.16 | (f) | | | 2.17 | | | | 2.33 | | | | (0.17 | ) | | | (0.13 | ) | | | — | | | | (0.30 | ) | |
October 31, 2020 | | $ | 12.11 | | | | 0.13 | | | | (0.63 | ) | | | (0.50 | ) | | | (0.13 | ) | | | (0.04 | ) | | | — | | | | (0.17 | ) | |
October 31, 2019 | | $ | 11.42 | | | | 0.16 | | | | 0.69 | | | | 0.85 | | | | (0.16 | ) | | | — | | | | — | | | | (0.16 | ) | |
First Eagle Funds | Annual Report | October 31, 2023
174
| | | | | | | | | Ratios/Supplemental data | | | |
| | | | | | | | | Ratios to Average Net Assets of: | | | |
Selected per
share data for
the period ended: | | Net asset
value, end
of period | | Total
return(a) | | Net assets,
end of
period
(thousands) | | Operating
expenses
excluding
earnings
credits
and/or fee
waivers | | Operating
expenses
including
earnings
credits
and/or fee
waivers | | Net
investment
income
excluding
earnings
credits
and/or fee
waivers | | Net
investment
income
including
earnings
credits
and/or fee
waivers | | Portfolio
turnover
rate | |
First Eagle Gold Fund Class R3*** | |
October 31, 2023 | | $ | 22.81 | | | | 15.55 | % | | $ | 1,275 | | | | 1.40 | % | | | 1.40 | % | | | 0.51 | % | | | 0.52 | % | | | 16.39 | % | |
October 31, 2022 | | $ | 19.74 | | | | (15.46 | )% | | $ | 1,013 | | | | 1.45 | % | | | 1.45 | % | | | (0.01 | )% | | | (0.01 | )% | | | 17.78 | % | |
October 31, 2021 | | $ | 23.56 | | | | (11.72 | )% | | $ | 1,351 | | | | 1.34 | % | | | 1.34 | % | | | (0.04 | )% | | | (0.04 | )% | | | 5.13 | % | |
October 31, 2020 | | $ | 26.99 | | | | 40.84 | % | | $ | 471 | | | | 1.25 | % | | | 1.25 | % | | | (0.52 | )% | | | (0.52 | )% | | | 3.34 | % | |
October 31, 2019 | | $ | 19.17 | | | | 42.63 | % | | $ | 491 | | | | 1.25 | % | | | 1.25 | % | | | (0.51 | )% | | | (0.51 | )% | | | 20.01 | % | |
First Eagle Gold Fund Class R4*** | |
October 31, 2023 | | $ | 23.06 | | | | 15.82 | % | | $ | 1,575 | | | | 1.15 | % | | | 1.15 | % | | | 0.85 | % | | | 0.85 | % | | | 16.39 | % | |
October 31, 2022 | | $ | 19.91 | | | | (15.14 | )% | | $ | 1,325 | | | | 1.10 | % | | | 1.10 | % | | | 0.32 | % | | | 0.32 | % | | | 17.78 | % | |
October 31, 2021 | | $ | 23.72 | | | | (11.52 | )% | | $ | 811 | | | | 1.11 | % | | | 1.11 | % | | | 0.08 | % | | | 0.08 | % | | | 5.13 | % | |
October 31, 2020 | | $ | 27.19 | | | | 41.17 | % | | $ | 935 | | | | 1.00 | % | | | 1.00 | % | | | (0.32 | )% | | | (0.32 | )% | | | 3.34 | % | |
For The Period
7/29/19^-10/31/19 | | $ | 19.26 | | | | 3.88 | %(b) | | $ | 10 | | | | 1.49 | %(c) | | | 1.49 | %(c) | | | (0.84 | )%(c) | | | (0.84 | )%(c) | | | 20.01 | %(b) | |
First Eagle Gold Fund Class R5*** | |
October 31, 2023 | | $ | 23.07 | | | | 15.93 | % | | $ | 465 | | | | 1.06 | % | | | 1.05 | % | | | 0.91 | % | | | 0.91 | % | | | 16.39 | % | |
October 31, 2022 | | $ | 19.90 | | | | (15.02 | )% | | $ | 580 | | | | 0.99 | % | | | 0.99 | % | | | 0.47 | % | | | 0.47 | % | | | 17.78 | % | |
October 31, 2021 | | $ | 23.68 | | | | (11.49 | )% | | $ | 437 | | | | 1.03 | % | | | 1.03 | % | | | 0.16 | % | | | 0.16 | % | | | 5.13 | % | |
October 31, 2020 | | $ | 27.16 | | | | 40.94 | % | | $ | 677 | | | | 0.98 | % | | | 0.98 | % | | | (0.35 | )% | | | (0.35 | )% | | | 3.34 | % | |
For The Period
7/29/19^-10/31/19 | | $ | 19.28 | | | | 3.99 | %(b) | | $ | 166 | | | | 0.96 | %(c) | | | 0.96 | %(c) | | | (0.65 | )%(c) | | | (0.64 | )%(c) | | | 20.01 | %(b) | |
First Eagle Gold Fund Class R6*** | |
October 31, 2023 | | $ | 23.16 | | | | 16.21 | % | | $ | 147,133 | | | | 0.85 | % | | | 0.84 | % | | | 1.18 | % | | | 1.19 | % | | | 16.39 | % | |
October 31, 2022 | | $ | 19.93 | | | | (14.91 | )% | | $ | 105,438 | | | | 0.85 | % | | | 0.85 | % | | | 0.59 | % | | | 0.59 | % | | | 17.78 | % | |
October 31, 2021 | | $ | 23.74 | | | | (11.33 | )% | | $ | 103,234 | | | | 0.85 | % | | | 0.85 | % | | | 0.31 | % | | | 0.31 | % | | | 0.00 | % | |
October 31, 2020 | | $ | 27.19 | | | | 41.42 | % | | $ | 209,208 | | | | 0.85 | % | | | 0.85 | % | | | (0.14 | )% | | | (0.14 | )% | | | 3.34 | % | |
October 31, 2019 | | $ | 19.26 | | | | 43.09 | % | | $ | 163,259 | | | | 0.89 | % | | | 0.89 | % | | | 0.03 | % | | | 0.03 | % | | | 20.01 | % | |
First Eagle Global Income Builder Fund Class A | |
October 31, 2023 | | $ | 11.89 | | | | 6.35 | % | | $ | 622,236 | | | | 1.18 | % | | | 1.18 | % | | | 2.60 | % | | | 2.60 | % | | | 20.41 | % | |
October 31, 2022 | | $ | 11.62 | | | | (8.23 | )% | | $ | 541,002 | | | | 1.16 | % | | | 1.16 | % | | | 2.17 | % | | | 2.18 | % | | | 13.76 | % | |
October 31, 2021 | | $ | 13.52 | | | | 21.36 | %(i) | | $ | 492,402 | | | | 1.17 | % | | | 1.17 | % | | | 2.04 | %(f) | | | 2.04 | %(f) | | | 22.80 | % | |
October 31, 2020 | | $ | 11.47 | | | | (3.38 | )% | | $ | 359,442 | | | | 1.19 | % | | | 1.19 | % | | | 1.87 | % | | | 1.87 | % | | | 28.98 | % | |
October 31, 2019 | | $ | 12.15 | | | | 8.40 | % | | $ | 392,942 | | | | 1.18 | % | | | 1.18 | % | | | 2.10 | % | | | 2.10 | % | | | 25.54 | % | |
First Eagle Global Income Builder Fund Class C | |
October 31, 2023 | | $ | 11.98 | | | | 5.65 | % | | $ | 82,141 | | | | 1.94 | % | | | 1.94 | % | | | 1.79 | % | | | 1.79 | % | | | 20.41 | % | |
October 31, 2022 | | $ | 11.70 | | | | (8.95 | )% | | $ | 98,977 | | | | 1.94 | % | | | 1.94 | % | | | 1.38 | % | | | 1.38 | % | | | 13.76 | % | |
October 31, 2021 | | $ | 13.47 | | | | 20.48 | %(i) | | $ | 153,654 | | | | 1.94 | % | | | 1.94 | % | | | 1.25 | %(f) | | | 1.25 | %(f) | | | 22.80 | % | |
October 31, 2020 | | $ | 11.44 | | | | (4.15 | )% | | $ | 186,154 | | | | 1.95 | % | | | 1.95 | % | | | 1.11 | % | | | 1.11 | % | | | 28.98 | % | |
October 31, 2019 | | $ | 12.11 | | | | 7.53 | % | | $ | 289,037 | | | | 1.94 | % | | | 1.94 | % | | | 1.36 | % | | | 1.36 | % | | | 25.54 | % | |
First Eagle Funds | Annual Report | October 31, 2023
175
| | | Per share operating performance* | |
| | | | | Change in net assets resulting
from operations | | Less dividends and distributions | |
Selected per
share data for
the period ended: | | Net asset
value,
beginning
of year | | Net
investment
income/
loss | | Net
realized
and
unrealized
gains
(losses) on
investments | | Total
investment
operations | | From net
investment
income | | From
capital
gains | | Return of
capital | | Total
distributions | |
First Eagle Global Income Builder Fund Class I | |
October 31, 2023 | | $ | 11.56 | | | | 0.35 | | | | 0.43 | | | | 0.78 | | | | (0.31 | ) | | | (0.19 | ) | | | — | | | | (0.50 | ) | |
October 31, 2022 | | $ | 13.48 | | | | 0.30 | | | | (1.34 | ) | | | (1.04 | ) | | | (0.31 | ) | | | (0.57 | ) | | | — | | | | (0.88 | ) | |
October 31, 2021 | | $ | 11.45 | | | | 0.30 | (f) | | | 2.15 | | | | 2.45 | | | | (0.29 | ) | | | (0.13 | ) | | | — | | | | (0.42 | ) | |
October 31, 2020 | | $ | 12.12 | | | | 0.25 | | | | (0.63 | ) | | | (0.38 | ) | | | (0.25 | ) | | | (0.04 | ) | | | — | | | | (0.29 | ) | |
October 31, 2019 | | $ | 11.43 | | | | 0.28 | | | | 0.69 | | | | 0.97 | | | | (0.28 | ) | | | — | | | | — | | | | (0.28 | ) | |
First Eagle Global Income Builder Fund Class R3 | |
October 31, 2023 | | $ | 11.61 | | | | 0.29 | | | | 0.42 | | | | 0.71 | | | | (0.26 | ) | | | (0.19 | ) | | | — | | | | (0.45 | ) | |
October 31, 2022 | | $ | 13.48 | | | | 0.25 | | | | (1.33 | ) | | | (1.08 | ) | | | (0.22 | ) | | | (0.57 | ) | | | — | | | | (0.79 | ) | |
October 31, 2021 | | $ | 11.45 | | | | 0.25 | (f) | | | 2.15 | | | | 2.40 | | | | (0.24 | ) | | | (0.13 | ) | | | — | | | | (0.37 | ) | |
October 31, 2020 | | $ | 12.12 | | | | 0.18 | | | | (0.62 | ) | | | (0.44 | ) | | | (0.19 | ) | | | (0.04 | ) | | | — | | | | (0.23 | ) | |
October 31, 2019 | | $ | 11.43 | | | | 0.23 | | | | 0.69 | | | | 0.92 | | | | (0.23 | ) | | | — | | | | — | | | | (0.23 | ) | |
First Eagle Global Income Builder Fund Class R4 | |
October 31, 2023 | | $ | 11.57 | | | | 0.30 | | | | 0.42 | | | | 0.72 | | | | (0.25 | ) | | | (0.19 | ) | | | — | | | | (0.44 | ) | |
October 31, 2022 | | $ | 13.48 | | | | 0.23 | | | | (1.32 | ) | | | (1.09 | ) | | | (0.25 | ) | | | (0.57 | ) | | | — | | | | (0.82 | ) | |
October 31, 2021 | | $ | 11.44 | | | | 0.27 | (f) | | | 2.15 | | | | 2.42 | | | | (0.25 | ) | | | (0.13 | ) | | | — | | | | (0.38 | ) | |
October 31, 2020 | | $ | 12.11 | | | | 0.21 | | | | (0.63 | ) | | | (0.42 | ) | | | (0.21 | ) | | | (0.04 | ) | | | — | | | | (0.25 | ) | |
For The Period
7/29/19^-10/31/19 | | $ | 12.08 | | | | 0.04 | | | | 0.03 | | | | 0.07 | | | | (0.04 | ) | | | — | | | | — | | | | (0.04 | ) | |
First Eagle Global Income Builder Fund Class R5 | |
October 31, 2023 | | $ | 11.57 | | | | 0.33 | | | | 0.42 | | | | 0.75 | | | | (0.29 | ) | | | (0.19 | ) | | | — | | | | (0.48 | ) | |
October 31, 2022 | | $ | 13.47 | | | | 0.27 | | | | (1.34 | ) | | | (1.07 | ) | | | (0.26 | ) | | | (0.57 | ) | | | — | | | | (0.83 | ) | |
October 31, 2021 | | $ | 11.44 | | | | 0.27 | (f) | | | 2.15 | | | | 2.42 | | | | (0.26 | ) | | | (0.13 | ) | | | — | | | | (0.39 | ) | |
October 31, 2020 | | $ | 12.11 | | | | 0.23 | | | | (0.64 | ) | | | (0.41 | ) | | | (0.22 | ) | | | (0.04 | ) | | | — | | | | (0.26 | ) | |
For The Period
7/29/19^-10/31/19 | | $ | 12.08 | | | | 0.04 | | | | 0.03 | | | | 0.07 | | | | (0.04 | ) | | | — | | | | — | | | | (0.04 | ) | |
First Eagle Global Income Builder Fund Class R6 | |
October 31, 2023 | | $ | 11.55 | | | | 0.36 | | | | 0.42 | | | | 0.78 | | | | (0.32 | ) | | | (0.19 | ) | | | — | | | | (0.51 | ) | |
October 31, 2022 | | $ | 13.47 | | | | 0.31 | | | | (1.33 | ) | | | (1.02 | ) | | | (0.33 | ) | | | (0.57 | ) | | | — | | | | (0.90 | ) | |
October 31, 2021 | | $ | 11.44 | | | | 0.31 | (f) | | | 2.15 | | | | 2.46 | | | | (0.30 | ) | | | (0.13 | ) | | | — | | | | (0.43 | ) | |
October 31, 2020 | | $ | 12.11 | | | | 0.24 | | | | (0.62 | ) | | | (0.38 | ) | | | (0.25 | ) | | | (0.04 | ) | | | — | | | | (0.29 | ) | |
October 31, 2019 | | $ | 11.42 | | | | 0.27 | | | | 0.70 | | | | 0.97 | | | | (0.28 | ) | | | — | | | | — | | | | (0.28 | ) | |
First Eagle High Income Fund Class A | |
October 31, 2023 | | $ | 7.77 | | | | 0.41 | | | | 0.01 | | | | 0.42 | | | | (0.41 | ) | | | — | | | | — | | | | (0.41 | ) | |
October 31, 2022 | | $ | 8.98 | | | | 0.36 | | | | (1.21 | ) | | | (0.85 | ) | | | (0.36 | ) | | | — | | | | — | | | | (0.36 | ) | |
October 31, 2021 | | $ | 8.71 | | | | 0.33 | | | | 0.27 | | | | 0.60 | | | | (0.33 | ) | | | — | | | | — | | | | (0.33 | ) | |
October 31, 2020 | | $ | 8.71 | | | | 0.37 | | | | (0.01 | ) | | | 0.36 | | | | (0.36 | ) | | | — | | | | — | | | | (0.36 | ) | |
October 31, 2019 | | $ | 8.81 | | | | 0.41 | | | | (0.11 | ) | | | 0.30 | | | | (0.40 | ) | | | — | | | | — | | | | (0.40 | ) | |
First Eagle Funds | Annual Report | October 31, 2023
176
| | | | | | | | | Ratios/Supplemental data | | | |
| | | | | | | | | Ratios to Average Net Assets of: | | | |
Selected per
share data for
the period ended: | | Net asset
value, end
of period | | Total
return(a) | | Net assets,
end of
period
(thousands) | | Operating
expenses
excluding
earnings
credits
and/or fee
waivers | | Operating
expenses
including
earnings
credits
and/or fee
waivers | | Net
investment
income
excluding
earnings
credits
and/or fee
waivers | | Net
investment
income
including
earnings
credits
and/or fee
waivers | | Portfolio
turnover
rate | |
First Eagle Global Income Builder Fund Class I | |
October 31, 2023 | | $ | 11.84 | | | | 6.69 | % | | $ | 874,530 | | | | 0.97 | % | | | 0.97 | % | | | 2.83 | % | | | 2.84 | % | | | 20.41 | % | |
October 31, 2022 | | $ | 11.56 | | | | (7.98 | )% | | $ | 751,297 | | | | 0.93 | % | | | 0.93 | % | | | 2.43 | % | | | 2.43 | % | | | 13.76 | % | |
October 31, 2021 | | $ | 13.48 | | | | 21.62 | %(i) | | $ | 668,678 | | | | 0.93 | % | | | 0.93 | % | | | 2.26 | %(f) | | | 2.26 | %(f) | | | 22.80 | % | |
October 31, 2020 | | $ | 11.45 | | | | (3.14 | )% | | $ | 630,351 | | | | 0.94 | % | | | 0.94 | % | | | 2.11 | % | | | 2.11 | % | | | 28.98 | % | |
October 31, 2019 | | $ | 12.12 | | | | 8.60 | % | | $ | 793,440 | | | | 0.93 | % | | | 0.93 | % | | | 2.36 | % | | | 2.36 | % | | | 25.54 | % | |
First Eagle Global Income Builder Fund Class R3 | |
October 31, 2023 | | $ | 11.87 | | | | 6.01 | % | | $ | 59 | | | | 1.48 | % | | | 1.47 | % | | | 2.31 | % | | | 2.31 | % | | | 20.41 | % | |
October 31, 2022 | | $ | 11.61 | | | | (8.29 | )% | | $ | 56 | | | | 1.33 | % | | | 1.33 | % | | | 2.02 | % | | | 2.02 | % | | | 13.76 | % | |
October 31, 2021 | | $ | 13.48 | | | | 21.12 | %(i) | | $ | 61 | | | | 1.32 | % | | | 1.32 | % | | | 1.88 | %(f) | | | 1.88 | %(f) | | | 22.80 | % | |
October 31, 2020 | | $ | 11.45 | | | | (3.67 | )% | | $ | 50 | | | | 1.49 | % | | | 1.49 | % | | | 1.58 | % | | | 1.58 | % | | | 28.98 | % | |
October 31, 2019 | | $ | 12.12 | | | | 8.12 | % | | $ | 52 | | | | 1.37 | % | | | 1.37 | % | | | 1.92 | % | | | 1.92 | % | | | 25.54 | % | |
First Eagle Global Income Builder Fund Class R4 | |
October 31, 2023 | | $ | 11.85 | | | | 6.17 | % | | $ | 58 | | | | 1.39 | % | | | 1.39 | % | | | 2.41 | % | | | 2.41 | % | | | 20.41 | % | |
October 31, 2022 | | $ | 11.57 | | | | (8.37 | )% | | $ | 49 | | | | 1.41 | % | | | 1.40 | % | | | 1.86 | % | | | 1.86 | % | | | 13.76 | % | |
October 31, 2021 | | $ | 13.48 | | | | 21.34 | %(i) | | $ | 27 | | | | 1.17 | % | | | 1.17 | % | | | 2.05 | %(f) | | | 2.05 | %(f) | | | 22.80 | % | |
October 31, 2020 | | $ | 11.44 | | | | (3.51 | )% | | $ | 10 | | | | 1.25 | % | | | 1.25 | % | | | 1.84 | % | | | 1.84 | % | | | 28.98 | % | |
For The Period
7/29/19^-10/31/19 | | $ | 12.11 | | | | 0.59 | %(b) | | $ | 10 | | | | 1.49 | %(c) | | | 1.49 | %(c) | | | 1.34 | %(c) | | | 1.34 | %(c) | | | 25.54 | %(b) | |
First Eagle Global Income Builder Fund Class R5 | |
October 31, 2023 | | $ | 11.84 | | | | 6.40 | % | | $ | 12 | | | | 1.16 | % | | | 1.16 | % | | | 2.64 | % | | | 2.64 | % | | | 20.41 | % | |
October 31, 2022 | | $ | 11.57 | | | | (8.20 | )% | | $ | 11 | | | | 1.17 | % | | | 1.17 | % | | | 2.19 | % | | | 2.19 | % | | | 13.76 | % | |
October 31, 2021 | | $ | 13.47 | | | | 21.34 | %(i) | | $ | 12 | | | | 1.16 | % | | | 1.16 | % | | | 2.04 | %(f) | | | 2.04 | %(f) | | | 22.80 | % | |
October 31, 2020 | | $ | 11.44 | | | | (3.40 | )% | | $ | 10 | | | | 1.14 | % | | | 1.14 | % | | | 1.94 | % | | | 1.94 | % | | | 28.98 | % | |
For The Period
7/29/19^-10/31/19 | | $ | 12.11 | | | | 0.62 | %(b) | | $ | 10 | | | | 1.38 | %(c) | | | 1.38 | %(c) | | | 1.45 | %(c) | | | 1.45 | %(c) | | | 25.54 | %(b) | |
First Eagle Global Income Builder Fund Class R6 | |
October 31, 2023 | | $ | 11.82 | | | | 6.68 | % | | $ | 62,556 | | | | 0.89 | % | | | 0.89 | % | | | 2.92 | % | | | 2.93 | % | | | 20.41 | % | |
October 31, 2022 | | $ | 11.55 | | | | (7.85 | )% | | $ | 45,873 | | | | 0.87 | % | | | 0.87 | % | | | 2.49 | % | | | 2.49 | % | | | 13.76 | % | |
October 31, 2021 | | $ | 13.47 | | | | 21.72 | %(i) | | $ | 24,506 | | | | 0.87 | % | | | 0.87 | % | | | 2.35 | %(f) | | | 2.35 | %(f) | | | 22.80 | % | |
October 31, 2020 | | $ | 11.44 | | | | (3.14 | )% | | $ | 15,649 | | | | 0.90 | % | | | 0.90 | % | | | 2.01 | % | | | 2.01 | % | | | 28.98 | % | |
October 31, 2019 | | $ | 12.11 | | | | 8.62 | % | | $ | 1,233 | | | | 0.93 | % | | | 0.93 | % | | | 2.31 | % | | | 2.31 | % | | | 25.54 | % | |
First Eagle High Income Fund Class A | |
October 31, 2023 | | $ | 7.78 | | | | 5.37 | % | | $ | 63,824 | | | | 1.14 | % | | | 0.98 | % | | | 4.98 | % | | | 5.15 | % | | | 24.60 | % | |
October 31, 2022 | | $ | 7.77 | | | | (9.59 | )% | | $ | 68,391 | | | | 1.13 | % | | | 1.13 | % | | | 4.37 | % | | | 4.37 | % | | | 28.00 | % | |
October 31, 2021 | | $ | 8.98 | | | | 7.01 | % | | $ | 83,819 | | | | 1.23 | % | | | 1.16 | % | | | 3.56 | % | | | 3.63 | % | | | 64.11 | % | |
October 31, 2020 | | $ | 8.71 | | | | 4.39 | % | | $ | 73,112 | | | | 1.33 | % | | | 1.23 | % | | | 4.27 | % | | | 4.37 | % | | | 55.38 | % | |
October 31, 2019 | | $ | 8.71 | | | | 3.54 | % | | $ | 73,567 | | | | 1.34 | % | | | 1.24 | % | | | 4.55 | % | | | 4.65 | % | | | 24.19 | % | |
First Eagle Funds | Annual Report | October 31, 2023
177
| | | Per share operating performance* | |
| | | | | Change in net assets resulting
from operations | | Less dividends and distributions | |
Selected per
share data for
the period ended: | | Net asset
value,
beginning
of year | | Net
investment
income/
loss | | Net
realized
and
unrealized
gains
(losses) on
investments | | Total
investment
operations | | From net
investment
income | | From
capital
gains | | Return of
capital | | Total
distributions | |
First Eagle High Income Fund Class C | |
October 31, 2023 | | $ | 7.77 | | | | 0.35 | | | | 0.00 | ** | | | 0.35 | | | | (0.35 | ) | | | — | | | | — | | | | (0.35 | ) | |
October 31, 2022 | | $ | 8.97 | | | | 0.30 | | | | (1.19 | ) | | | (0.89 | ) | | | (0.31 | ) | | | — | | | | — | | | | (0.31 | ) | |
October 31, 2021 | | $ | 8.70 | | | | 0.26 | | | | 0.28 | | | | 0.54 | | | | (0.27 | ) | | | — | | | | — | | | | (0.27 | ) | |
October 31, 2020 | | $ | 8.70 | | | | 0.31 | | | | (0.01 | ) | | | 0.30 | | | | (0.30 | ) | | | — | | | | — | | | | (0.30 | ) | |
October 31, 2019 | | $ | 8.80 | | | | 0.34 | | | | (0.10 | ) | | | 0.24 | | | | (0.34 | ) | | | — | | | | — | | | | (0.34 | ) | |
First Eagle High Income Fund Class I | |
October 31, 2023 | | $ | 7.78 | | | | 0.43 | | | | (0.01 | ) | | | 0.42 | | | | (0.42 | ) | | | — | | | | — | | | | (0.42 | ) | |
October 31, 2022 | | $ | 8.98 | | | | 0.39 | | | | (1.21 | ) | | | (0.82 | ) | | | (0.38 | ) | | | — | | | | — | | | | (0.38 | ) | |
October 31, 2021 | | $ | 8.71 | | | | 0.35 | | | | 0.28 | | | | 0.63 | | | | (0.36 | ) | | | — | | | | — | | | | (0.36 | ) | |
October 31, 2020 | | $ | 8.71 | | | | 0.39 | | | | 0.00 | ** | | | 0.39 | | | | (0.39 | ) | | | — | | | | — | | | | (0.39 | ) | |
October 31, 2019 | | $ | 8.81 | | | | 0.43 | | | | (0.10 | ) | | | 0.33 | | | | (0.43 | ) | | | — | | | | — | | | | (0.43 | ) | |
First Eagle High Income Fund Class R3 | |
October 31, 2023 | | $ | 7.78 | | | | 0.40 | | | | 0.00 | ** | | | 0.40 | | | | (0.40 | ) | | | — | | | | — | | | | (0.40 | ) | |
October 31, 2022 | | $ | 8.99 | | | | 0.35 | | | | (1.21 | ) | | | (0.86 | ) | | | (0.35 | ) | | | — | | | | — | | | | (0.35 | ) | |
October 31, 2021 | | $ | 8.72 | | | | 0.31 | | | | 0.28 | | | | 0.59 | | | | (0.32 | ) | | | — | | | | — | | | | (0.32 | ) | |
October 31, 2020 | | $ | 8.72 | | | | 0.35 | | | | 0.00 | ** | | | 0.35 | | | | (0.35 | ) | | | — | | | | — | | | | (0.35 | ) | |
October 31, 2019 | | $ | 8.82 | | | | 0.40 | | | | (0.11 | ) | | | 0.29 | | | | (0.39 | ) | | | — | | | | — | | | | (0.39 | ) | |
First Eagle High Income Fund Class R4 | |
October 31, 2023 | | $ | 7.74 | | | | 0.40 | | | | (0.01 | ) | | | 0.39 | | | | (0.35 | ) | | | — | | | | — | | | | (0.35 | ) | |
October 31, 2022 | | $ | 8.98 | | | | 0.26 | | | | (1.20 | ) | | | (0.94 | ) | | | (0.30 | ) | | | — | | | | — | | | | (0.30 | ) | |
October 31, 2021 | | $ | 8.72 | | | | 0.29 | | | | 0.26 | | | | 0.55 | | | | (0.29 | ) | | | — | | | | — | | | | (0.29 | ) | |
October 31, 2020 | | $ | 8.72 | | | | 0.33 | | | | (0.01 | ) | | | 0.32 | | | | (0.32 | ) | | | — | | | | — | | | | (0.32 | ) | |
For The Period
7/29/19^-10/31/19 | | $ | 8.78 | | | | 0.08 | | | | (0.06 | ) | | | 0.02 | | | | (0.08 | ) | | | — | | | | — | | | | (0.08 | ) | |
First Eagle High Income Fund Class R5 | |
October 31, 2023 | | $ | 7.78 | | | | 0.43 | | | | (0.01 | ) | | | 0.42 | | | | (0.42 | ) | | | — | | | | — | | | | (0.42 | ) | |
October 31, 2022 | | $ | 8.98 | | | | 0.36 | | | | (1.20 | ) | | | (0.84 | ) | | | (0.36 | ) | | | — | | | | — | | | | (0.36 | ) | |
October 31, 2021 | | $ | 8.71 | | | | 0.33 | | | | 0.27 | | | | 0.60 | | | | (0.33 | ) | | | — | | | | — | | | | (0.33 | ) | |
October 31, 2020 | | $ | 8.71 | | | | 0.37 | | | | 0.00 | ** | | | 0.37 | | | | (0.37 | ) | | | — | | | | — | | | | (0.37 | ) | |
For The Period
7/29/19^-10/31/19 | | $ | 8.78 | | | | 0.08 | | | | (0.07 | ) | | | 0.01 | | | | (0.08 | ) | | | — | | | | — | | | | (0.08 | ) | |
First Eagle High Income Fund Class R6 | |
October 31, 2023 | | $ | 7.78 | | | | 0.43 | | | | (0.01 | ) | | | 0.42 | | | | (0.42 | ) | | | — | | | | — | | | | (0.42 | ) | |
October 31, 2022 | | $ | 8.98 | | | | 0.39 | | | | (1.19 | ) | | | (0.80 | ) | | | (0.40 | ) | | | — | | | | — | | | | (0.40 | ) | |
October 31, 2021 | | $ | 8.71 | | | | 0.35 | | | | 0.28 | | | | 0.63 | | | | (0.36 | ) | | | — | | | | — | | | | (0.36 | ) | |
October 31, 2020 | | $ | 8.71 | | | | 0.39 | | | | (0.01 | ) | | | 0.38 | | | | (0.38 | ) | | | — | | | | — | | | | (0.38 | ) | |
October 31, 2019 | | $ | 8.82 | | | | 0.43 | | | | (0.11 | ) | | | 0.32 | | | | (0.43 | ) | | | — | | | | — | | | | (0.43 | ) | |
First Eagle Funds | Annual Report | October 31, 2023
178
| | | | | | | | | Ratios/Supplemental data | | | |
| | | | | | | | | Ratios to Average Net Assets of: | | | |
Selected per
share data for
the period ended: | | Net asset
value, end
of period | | Total
return(a) | | Net assets,
end of
period
(thousands) | | Operating
expenses
excluding
earnings
credits
and/or fee
waivers | | Operating
expenses
including
earnings
credits
and/or fee
waivers | | Net
investment
income
excluding
earnings
credits
and/or fee
waivers | | Net
investment
income
including
earnings
credits
and/or fee
waivers | | Portfolio
turnover
rate | |
First Eagle High Income Fund Class C | |
October 31, 2023 | | $ | 7.77 | | | | 4.45 | % | | $ | 4,957 | | | | 1.89 | % | | | 1.74 | % | | | 4.24 | % | | | 4.39 | % | | | 24.60 | % | |
October 31, 2022 | | $ | 7.77 | | | | (10.15 | )% | | $ | 7,376 | | | | 1.88 | % | | | 1.88 | % | | | 3.55 | % | | | 3.55 | % | | | 28.00 | % | |
October 31, 2021 | | $ | 8.97 | | | | 6.20 | % | | $ | 15,129 | | | | 2.01 | % | | | 1.94 | % | | | 2.81 | % | | | 2.88 | % | | | 64.11 | % | |
October 31, 2020 | | $ | 8.70 | | | | 3.60 | % | | $ | 31,972 | | | | 2.10 | % | | | 2.00 | % | | | 3.53 | % | | | 3.63 | % | | | 55.38 | % | |
October 31, 2019 | | $ | 8.70 | | | | 2.77 | % | | $ | 50,100 | | | | 2.10 | % | | | 2.00 | % | | | 3.83 | % | | | 3.93 | % | | | 24.19 | % | |
First Eagle High Income Fund Class I | |
October 31, 2023 | | $ | 7.78 | | | | 5.49 | % | | $ | 76,482 | | | | 0.89 | % | | | 0.73 | % | | | 5.23 | % | | | 5.39 | % | | | 24.60 | % | |
October 31, 2022 | | $ | 7.78 | | | | (9.23 | )% | | $ | 99,295 | | | | 0.86 | % | | | 0.86 | % | | | 4.62 | % | | | 4.62 | % | | | 28.00 | % | |
October 31, 2021 | | $ | 8.98 | | | | 7.29 | % | | $ | 132,026 | | | | 0.97 | % | | | 0.90 | % | | | 3.82 | % | | | 3.89 | % | | | 64.11 | % | |
October 31, 2020 | | $ | 8.71 | | | | 4.68 | % | | $ | 126,527 | | | | 1.04 | % | | | 0.94 | % | | | 4.54 | % | | | 4.64 | % | | | 55.38 | % | |
October 31, 2019 | | $ | 8.71 | | | | 3.84 | % | | $ | 144,532 | | | | 1.05 | % | | | 0.95 | % | | | 4.86 | % | | | 4.96 | % | | | 24.19 | % | |
First Eagle High Income Fund Class R3 | |
October 31, 2023 | | $ | 7.78 | | | | 5.10 | % | | $ | 479 | | | | 1.29 | % | | | 1.08 | % | | | 4.84 | % | | | 5.04 | % | | | 24.60 | % | |
October 31, 2022 | | $ | 7.78 | | | | (9.72 | )% | | $ | 402 | | | | 1.28 | % | | | 1.28 | % | | | 4.22 | % | | | 4.23 | % | | | 28.00 | % | |
October 31, 2021 | | $ | 8.99 | | | | 6.83 | % | | $ | 443 | | | | 1.40 | % | | | 1.33 | % | | | 3.39 | % | | | 3.46 | % | | | 64.11 | % | |
October 31, 2020 | | $ | 8.72 | | | | 4.21 | % | | $ | 453 | | | | 1.45 | % | | | 1.35 | % | | | 4.04 | % | | | 4.14 | % | | | 55.38 | % | |
October 31, 2019 | | $ | 8.72 | | | | 3.44 | % | | $ | 52 | | | | 1.44 | % | | | 1.34 | % | | | 4.44 | % | | | 4.54 | % | | | 24.19 | % | |
First Eagle High Income Fund Class R4 | |
October 31, 2023 | | $ | 7.78 | | | | 5.05 | % | | $ | 10 | | | | 1.81 | % | | | 1.08 | % | | | 4.32 | % | | | 5.05 | % | | | 24.60 | % | |
October 31, 2022 | | $ | 7.74 | | | | (10.61 | )% | | $ | 10 | | | | 2.36 | % | | | 2.36 | % | | | 3.14 | % | | | 3.14 | % | | | 28.00 | % | |
October 31, 2021 | | $ | 8.98 | | | | 6.38 | % | | $ | 11 | | | | 1.66 | % | | | 1.59 | % | | | 3.12 | % | | | 3.19 | % | | | 64.11 | % | |
October 31, 2020 | | $ | 8.72 | | | | 3.81 | % | | $ | 10 | | | | 1.84 | % | | | 1.74 | % | | | 3.74 | % | | | 3.84 | % | | | 55.38 | % | |
For The Period
7/29/19^-10/31/19 | | $ | 8.72 | | | | 0.24 | %(b) | | $ | 10 | | | | 1.70 | %(c) | | | 1.59 | %(c) | | | 3.43 | %(c) | | | 3.54 | %(c) | | | 24.19 | %(b) | |
First Eagle High Income Fund Class R5 | |
October 31, 2023 | | $ | 7.78 | | | | 5.43 | % | | $ | 11 | | | | 0.95 | % | | | 0.74 | % | | | 5.18 | % | | | 5.39 | % | | | 24.60 | % | |
October 31, 2022 | | $ | 7.78 | | | | (9.50 | )% | | $ | 10 | | | | 1.13 | % | | | 1.12 | % | | | 4.38 | % | | | 4.38 | % | | | 28.00 | % | |
October 31, 2021 | | $ | 8.98 | | | | 7.01 | % | | $ | 11 | | | | 1.20 | % | | | 1.13 | % | | | 3.58 | % | | | 3.65 | % | | | 64.11 | % | |
October 31, 2020 | | $ | 8.71 | | | | 4.41 | % | | $ | 10 | | | | 1.25 | % | | | 1.15 | % | | | 4.33 | % | | | 4.43 | % | | | 55.38 | % | |
For The Period
7/29/19^-10/31/19 | | $ | 8.71 | | | | 0.11 | %(b) | | $ | 10 | | | | 1.59 | %(c) | | | 1.48 | %(c) | | | 3.54 | %(c) | | | 3.65 | %(c) | | | 24.19 | %(b) | |
First Eagle High Income Fund Class R6 | |
October 31, 2023 | | $ | 7.78 | | | | 5.48 | % | | $ | 7,823 | | | | 0.81 | % | | | 0.70 | % | | | 5.32 | % | | | 5.44 | % | | | 24.60 | % | |
October 31, 2022 | | $ | 7.78 | | | | (9.16 | )% | | $ | 1,000 | | | | 0.78 | % | | | 0.78 | % | | | 4.74 | % | | | 4.74 | % | | | 28.00 | % | |
October 31, 2021 | | $ | 8.98 | | | | 7.34 | % | | $ | 1,066 | | | | 0.92 | % | | | 0.85 | % | | | 3.87 | % | | | 3.94 | % | | | 64.11 | % | |
October 31, 2020 | | $ | 8.71 | | | | 4.64 | % | | $ | 1,033 | | | | 1.07 | % | | | 0.97 | % | | | 4.47 | % | | | 4.57 | % | | | 55.38 | % | |
October 31, 2019 | | $ | 8.71 | | | | 3.75 | % | | $ | 1,907 | | | | 1.02 | % | | | 0.92 | % | | | 4.78 | % | | | 4.89 | % | | | 24.19 | % | |
First Eagle Funds | Annual Report | October 31, 2023
179
| | | Per share operating performance* | |
| | | | | Change in net assets resulting
from operations | | Less dividends and distributions | |
Selected per
share data for
the period ended: | | Net asset
value,
beginning
of year | | Net
investment
income/
loss | | Net
realized
and
unrealized
gains
(losses) on
investments | | Total
investment
operations | | From net
investment
income | | From
capital
gains | | Return of
capital | | Total
distributions | |
First Eagle Rising Dividend Fund Class A (formerly named First Eagle Fund of America) | |
October 31, 2023 | | $ | 20.30 | | | | 0.35 | | | | 2.50 | (j) | | | 2.85 | | | | (0.26 | ) | | | (0.50 | ) | | | — | | | | (0.76 | ) | |
October 31, 2022 | | $ | 29.80 | | | | 0.16 | | | | (6.00 | ) | | | (5.84 | ) | | | (0.12 | ) | | | (3.54 | ) | | | — | | | | (3.66 | ) | |
October 31, 2021 | | $ | 25.84 | | | | 0.09 | | | | 8.37 | | | | 8.46 | | | | (0.06 | ) | | | (4.44 | ) | | | — | | | | (4.50 | ) | |
October 31, 2020 | | $ | 26.45 | | | | 0.01 | | | | (0.38 | ) | | | (0.37 | ) | | | (0.01 | ) | | | (0.23 | ) | | | — | | | | (0.24 | ) | |
October 31, 2019 | | $ | 30.53 | | | | 0.03 | | | | 1.50 | | | | 1.53 | | | | — | | | | (5.61 | ) | | | — | | | | (5.61 | ) | |
First Eagle Rising Dividend Fund Class C (formerly named First Eagle Fund of America) | |
October 31, 2023 | | $ | 12.63 | | | | 0.10 | | | | 1.56 | (j) | | | 1.66 | | | | (0.16 | ) | | | (0.50 | ) | | | — | | | | (0.66 | ) | |
October 31, 2022 | | $ | 20.00 | | | | (0.03 | ) | | | (3.76 | ) | | | (3.79 | ) | | | (0.04 | ) | | | (3.54 | ) | | | — | | | | (3.58 | ) | |
October 31, 2021 | | $ | 18.74 | | | | (0.07 | ) | | | 5.77 | | | | 5.70 | | | | — | | | | (4.44 | ) | | | — | | | | (4.44 | ) | |
October 31, 2020 | | $ | 19.37 | | | | (0.14 | ) | | | (0.26 | ) | | | (0.40 | ) | | | — | | | | (0.23 | ) | | | — | | | | (0.23 | ) | |
October 31, 2019 | | $ | 24.09 | | | | (0.12 | ) | | | 1.01 | | | | 0.89 | | | | — | | | | (5.61 | ) | | | — | | | | (5.61 | ) | |
First Eagle Rising Dividend Fund Class I (formerly named First Eagle Fund of America) | |
October 31, 2023 | | $ | 21.38 | | | | 0.43 | | | | 2.62 | (j) | | | 3.05 | | | | (0.31 | ) | | | (0.50 | ) | | | — | | | | (0.81 | ) | |
October 31, 2022 | | $ | 31.17 | | | | 0.21 | | | | (6.29 | ) | | | (6.08 | ) | | | (0.17 | ) | | | (3.54 | ) | | | — | | | | (3.71 | ) | |
October 31, 2021 | | $ | 26.91 | | | | 0.17 | | | | 8.72 | | | | 8.89 | | | | (0.19 | ) | | | (4.44 | ) | | | — | | | | (4.63 | ) | |
October 31, 2020 | | $ | 27.54 | | | | 0.09 | | | | (0.37 | ) | | | (0.28 | ) | | | (0.12 | ) | | | (0.23 | ) | | | — | | | | (0.35 | ) | |
October 31, 2019 | | $ | 31.46 | | | | 0.13 | | | | 1.56 | | | | 1.69 | | | | — | | | | (5.61 | ) | | | — | | | | (5.61 | ) | |
First Eagle Rising Dividend Fund Class R3 (formerly named First Eagle Fund of America) | |
October 31, 2023 | | $ | 21.22 | | | | 0.35 | | | | 2.60 | (j) | | | 2.95 | | | | (0.23 | ) | | | (0.50 | ) | | | — | | | | (0.73 | ) | |
October 31, 2022 | | $ | 30.97 | | | | 0.13 | | | | (6.25 | ) | | | (6.12 | ) | | | (0.09 | ) | | | (3.54 | ) | | | — | | | | (3.63 | ) | |
October 31, 2021 | | $ | 26.71 | | | | 0.07 | | | | 8.66 | | | | 8.73 | | | | (0.03 | ) | | | (4.44 | ) | | | — | | | | (4.47 | ) | |
October 31, 2020 | | $ | 27.37 | | | | (0.04 | ) | | | (0.38 | ) | | | (0.42 | ) | | | (0.01 | ) | | | (0.23 | ) | | | — | | | | (0.24 | ) | |
October 31, 2019 | | $ | 31.40 | | | | 0.02 | | | | 1.56 | | | | 1.58 | | | | — | | | | (5.61 | ) | | | — | | | | (5.61 | ) | |
First Eagle Rising Dividend Fund Class R4 (formerly named First Eagle Fund of America) | |
October 31, 2023 | | $ | 21.35 | | | | 0.41 | | | | 2.62 | (j) | | | 3.03 | | | | (0.29 | ) | | | (0.50 | ) | | | — | | | | (0.79 | ) | |
October 31, 2022 | | $ | 31.14 | | | | 0.20 | | | | (6.30 | ) | | | (6.10 | ) | | | (0.15 | ) | | | (3.54 | ) | | | — | | | | (3.69 | ) | |
October 31, 2021 | | $ | 26.85 | | | | 0.14 | | | | 8.72 | | | | 8.86 | | | | (0.13 | ) | | | (4.44 | ) | | | — | | | | (4.57 | ) | |
October 31, 2020 | | $ | 27.52 | | | | 0.04 | | | | (0.40 | ) | | | (0.36 | ) | | | (0.08 | ) | | | (0.23 | ) | | | — | | | | (0.31 | ) | |
For The Period
7/29/19^-10/31/19 | | $ | 28.16 | | | | (0.02 | ) | | | (0.62 | ) | | | (0.64 | ) | | | — | | | | — | | | | — | | | | — | | |
First Eagle Rising Dividend Fund Class R5 (formerly named First Eagle Fund of America) | |
October 31, 2023 | | $ | 21.36 | | | | 0.44 | | | | 2.61 | (j) | | | 3.05 | | | | (0.31 | ) | | | (0.50 | ) | | | — | | | | (0.81 | ) | |
October 31, 2022 | | $ | 31.15 | | | | 0.22 | | | | (6.30 | ) | | | (6.08 | ) | | | (0.17 | ) | | | (3.54 | ) | | | — | | | | (3.71 | ) | |
October 31, 2021 | | $ | 26.88 | | | | 0.17 | | | | 8.72 | | | | 8.89 | | | | (0.18 | ) | | | (4.44 | ) | | | — | | | | (4.62 | ) | |
October 31, 2020 | | $ | 27.53 | | | | 0.06 | | | | (0.39 | ) | | | (0.33 | ) | | | (0.09 | ) | | | (0.23 | ) | | | — | | | | (0.32 | ) | |
For The Period
7/29/19^-10/31/19 | | $ | 28.16 | | | | (0.01 | ) | | | (0.62 | ) | | | (0.63 | ) | | | — | | | | — | | | | — | | | | — | | |
First Eagle Funds | Annual Report | October 31, 2023
180
| | | | | | | | | Ratios/Supplemental data | | | |
| | | | | | | | | Ratios to Average Net Assets of: | | | |
Selected per
share data for
the period ended: | | Net asset
value, end
of period | | Total
return(a) | | Net assets,
end of
period
(thousands) | | Operating
expenses
excluding
earnings
credits
and/or fee
waivers | | Operating
expenses
including
earnings
credits
and/or fee
waivers | | Net
investment
income
excluding
earnings
credits
and/or fee
waivers | | Net
investment
income
including
earnings
credits
and/or fee
waivers | | Portfolio
turnover
rate | |
First Eagle Rising Dividend Fund Class A (formerly named First Eagle Fund of America) | |
October 31, 2023 | | $ | 22.39 | | | | 14.17 | %(k) | | $ | 243,724 | | | | 1.10 | % | | | 0.90 | % | | | 1.36 | % | | | 1.56 | % | | | 30.98 | % | |
October 31, 2022 | | $ | 20.30 | | | | (21.94 | )% | | $ | 246,151 | | | | 1.05 | % | | | 0.90 | % | | | 0.54 | % | | | 0.69 | % | | | 10.87 | % | |
October 31, 2021 | | $ | 29.80 | | | | 36.58 | % | | $ | 235,888 | | | | 1.04 | % | | | 0.90 | % | | | 0.20 | % | | | 0.34 | % | | | 40.70 | % | |
October 31, 2020 | | $ | 25.84 | | | | (1.43 | )% | | $ | 203,581 | | | | 1.34 | % | | | 1.28 | % | | | (0.04 | )% | | | 0.02 | % | | | 97.86 | % | |
October 31, 2019 | | $ | 26.45 | | | | 7.58 | % | | $ | 273,446 | | | | 1.38 | % | | | 1.37 | % | | | 0.11 | % | | | 0.13 | % | | | 26.42 | % | |
First Eagle Rising Dividend Fund Class C (formerly named First Eagle Fund of America) | |
October 31, 2023 | | $ | 13.63 | | | | 13.31 | %(k) | | $ | 8,098 | | | | 1.82 | % | | | 1.65 | % | | | 0.57 | % | | | 0.74 | % | | | 30.98 | % | |
October 31, 2022 | | $ | 12.63 | | | | (22.50 | )% | | $ | 16,002 | | | | 1.84 | % | | | 1.65 | % | | | (0.36 | )% | | | (0.17 | )% | | | 10.87 | % | |
October 31, 2021 | | $ | 20.00 | | | | 35.52 | % | | $ | 37,722 | | | | 1.79 | % | | | 1.65 | % | | | (0.54 | )% | | | (0.40 | )% | | | 40.70 | % | |
October 31, 2020 | | $ | 18.74 | | | | (2.12 | )% | | $ | 62,901 | | | | 2.09 | % | | | 2.03 | % | | | (0.79 | )% | | | (0.73 | )% | | | 97.86 | % | |
October 31, 2019 | | $ | 19.37 | | | | 6.77 | % | | $ | 115,146 | | | | 2.12 | % | | | 2.10 | % | | | (0.61 | )% | | | (0.60 | )% | | | 26.42 | % | |
First Eagle Rising Dividend Fund Class I (formerly named First Eagle Fund of America) | |
October 31, 2023 | | $ | 23.62 | | | | 14.43 | %(k) | | $ | 95,458 | | | | 0.77 | % | | | 0.65 | % | | | 1.68 | % | | | 1.81 | % | | | 30.98 | % | |
October 31, 2022 | | $ | 21.38 | | | | (21.71 | )% | | $ | 97,103 | | | | 0.74 | % | | | 0.65 | % | | | 0.77 | % | | | 0.86 | % | | | 10.87 | % | |
October 31, 2021 | | $ | 31.17 | | | | 36.88 | % | | $ | 162,113 | | | | 0.70 | % | | | 0.65 | % | | | 0.53 | % | | | 0.58 | % | | | 40.70 | % | |
October 31, 2020 | | $ | 26.91 | | | | (1.09 | )% | | $ | 167,093 | | | | 1.01 | % | | | 0.96 | % | | | 0.28 | % | | | 0.33 | % | | | 97.86 | % | |
October 31, 2019 | | $ | 27.54 | | | | 7.88 | % | | $ | 384,510 | | | | 1.05 | % | | | 1.03 | % | | | 0.45 | % | | | 0.46 | % | | | 26.42 | % | |
First Eagle Rising Dividend Fund Class R3 (formerly named First Eagle Fund of America) | |
October 31, 2023 | | $ | 23.44 | | | | 14.04 | %(k) | | $ | 57 | | | | 1.24 | % | | | 1.00 | % | | | 1.22 | % | | | 1.47 | % | | | 30.98 | % | |
October 31, 2022 | | $ | 21.22 | | | | (22.01 | )% | | $ | 50 | | | | 1.15 | % | | | 1.00 | % | | | 0.38 | % | | | 0.54 | % | | | 10.87 | % | |
October 31, 2021 | | $ | 30.97 | | | | 36.40 | % | | $ | 64 | | | | 1.12 | % | | | 0.99 | % | | | 0.12 | % | | | 0.25 | % | | | 40.70 | % | |
October 31, 2020 | | $ | 26.71 | | | | (1.56 | )% | | $ | 47 | | | | 1.50 | % | | | 1.44 | % | | | (0.20 | )% | | | (0.14 | )% | | | 97.86 | % | |
October 31, 2019 | | $ | 27.37 | | | | 7.48 | % | | $ | 48 | | | | 1.44 | % | | | 1.42 | % | | | 0.04 | % | | | 0.06 | % | | | 26.42 | % | |
First Eagle Rising Dividend Fund Class R4 (formerly named First Eagle Fund of America) | |
October 31, 2023 | | $ | 23.59 | | | | 14.34 | %(k) | | $ | 38 | | | | 1.05 | % | | | 0.75 | % | | | 1.43 | % | | | 1.72 | % | | | 30.98 | % | |
October 31, 2022 | | $ | 21.35 | | | | (21.81 | )% | | $ | 30 | | | | 1.04 | % | | | 0.75 | % | | | 0.56 | % | | | 0.85 | % | | | 10.87 | % | |
October 31, 2021 | | $ | 31.14 | | | | 36.76 | % | | $ | 13 | | | | 1.08 | % | | | 0.75 | % | | | 0.16 | % | | | 0.49 | % | | | 40.70 | % | |
October 31, 2020 | | $ | 26.85 | | | | (1.35 | )% | | $ | 10 | | | | 1.36 | % | | | 1.16 | % | | | (0.06 | )% | | | 0.13 | % | | | 97.86 | % | |
For The Period
7/29/19^-10/31/19 | | $ | 27.52 | | | | (2.27 | )%(b) | | $ | 10 | | | | 1.66 | %(c) | | | 1.62 | %(c) | | | (0.25 | )%(c) | | | (0.22 | )%(c) | | | 26.42 | %(b) | |
First Eagle Rising Dividend Fund Class R5 (formerly named First Eagle Fund of America) | |
October 31, 2023 | | $ | 23.60 | | | | 14.43 | %(k) | | $ | 12 | | | | 0.94 | % | | | 0.63 | % | | | 1.53 | % | | | 1.83 | % | | | 30.98 | % | |
October 31, 2022 | | $ | 21.36 | | | | (21.73 | )% | | $ | 10 | | | | 1.31 | % | | | 0.65 | % | | | 0.22 | % | | | 0.88 | % | | | 10.87 | % | |
October 31, 2021 | | $ | 31.15 | | | | 36.88 | % | | $ | 13 | | | | 1.35 | % | | | 0.65 | % | | | (0.11 | )% | | | 0.59 | % | | | 40.70 | % | |
October 31, 2020 | | $ | 26.88 | | | | (1.25 | )% | | $ | 10 | | | | 1.26 | % | | | 1.06 | % | | | 0.04 | % | | | 0.24 | % | | | 97.86 | % | |
For The Period
7/29/19^-10/31/19 | | $ | 27.53 | | | | (2.24 | )%(b) | | $ | 10 | | | | 1.55 | %(c) | | | 1.51 | %(c) | | | (0.14 | )%(c) | | | (0.10 | )%(c) | | | 26.42 | %(b) | |
First Eagle Funds | Annual Report | October 31, 2023
181
| | | Per share operating performance* | |
| | | | | Change in net assets resulting
from operations | | Less dividends and distributions | |
Selected per
share data for
the period ended: | | Net asset
value,
beginning
of year | | Net
investment
income/
loss | | Net
realized
and
unrealized
gains
(losses) on
investments | | Total
investment
operations | | From net
investment
income | | From
capital
gains | | Return of
capital | | Total
distributions | |
First Eagle Rising Dividend Fund Class R6 (formerly named First Eagle Fund of America) | |
October 31, 2023 | | $ | 21.37 | | | | 0.43 | | | | 2.63 | (j) | | | 3.06 | | | | (0.31 | ) | | | (0.50 | ) | | | — | | | | (0.81 | ) | |
October 31, 2022 | | $ | 31.17 | | | | 0.21 | | | | (6.30 | ) | | | (6.09 | ) | | | (0.17 | ) | | | (3.54 | ) | | | — | | | | (3.71 | ) | |
October 31, 2021 | | $ | 26.92 | | | | 0.17 | | | | 8.74 | | | | 8.91 | | | | (0.22 | ) | | | (4.44 | ) | | | — | | | | (4.66 | ) | |
October 31, 2020 | | $ | 27.57 | | | | 0.07 | | | | (0.37 | ) | | | (0.30 | ) | | | (0.12 | ) | | | (0.23 | ) | | | — | | | | (0.35 | ) | |
October 31, 2019 | | $ | 31.46 | | | | 0.09 | | | | 1.63 | | | | 1.72 | | | | — | | | | (5.61 | ) | | | — | | | | (5.61 | ) | |
First Eagle Small Cap Opportunity Fund Class A | |
October 31, 2023 | | $ | 8.47 | | | | 0.01 | | | | (0.29 | ) | | | (0.28 | ) | | | — | | | | — | | | | — | | | | — | | |
October 31, 2022 | | $ | 9.76 | | | | (0.02 | ) | | | (1.27 | ) | | | (1.29 | ) | | | — | | | | — | | | | — | | | | — | | |
For The Period
7/01/21^-10/31/21 | | $ | 10.12 | | | | (0.02 | ) | | | (0.34 | ) | | | (0.36 | ) | | | — | | | | — | | | | — | | | | — | | |
First Eagle Small Cap Opportunity Fund Class I | |
October 31, 2023 | | $ | 8.50 | | | | 0.03 | | | | (0.29 | ) | | | (0.26 | ) | | | (0.01 | ) | | | — | | | | — | | | | (0.01 | ) | |
October 31, 2022 | | $ | 9.77 | | | | 0.00 | ** | | | (1.27 | ) | | | (1.27 | ) | | | — | | | | — | | | | — | | | | — | | |
For The Period
4/27/21^-10/31/21 | | $ | 10.00 | | | | (0.02 | ) | | | (0.02 | ) | | | (0.04 | ) | | | (0.00 | )** | | | (0.19 | ) | | | (0.00 | )** | | | (0.19 | ) | |
First Eagle Small Cap Opportunity Fund Class R6 | |
October 31, 2023 | | $ | 8.50 | | | | 0.03 | | | | (0.29 | ) | | | (0.26 | ) | | | (0.01 | ) | | | — | | | | — | | | | (0.01 | ) | |
October 31, 2022 | | $ | 9.77 | | | | 0.00 | ** | | | (1.27 | ) | | | (1.27 | ) | | | — | | | | — | | | | — | | | | — | | |
For The Period
7/01/21^-10/31/21 | | $ | 10.12 | | | | (0.01 | ) | | | (0.34 | ) | | | (0.35 | ) | | | — | | | | — | | | | — | | | | — | | |
First Eagle U.S. Smid Cap Opportunity Fund Class A | |
October 31, 2023 | | $ | 8.97 | | | | 0.03 | | | | (0.29 | ) | | | (0.26 | ) | | | (0.01 | ) | | | — | | | | — | | | | (0.01 | ) | |
For The Period
8/15/22^-10/31/22 | | $ | 10.00 | | | | 0.01 | | | | (1.04 | ) | | | (1.03 | ) | | | — | | | | — | | | | — | | | | — | | |
First Eagle U.S. Smid Cap Opportunity Fund Class I | |
October 31, 2023 | | $ | 8.98 | | | | 0.04 | | | | (0.27 | ) | | | (0.23 | ) | | | (0.03 | ) | | | — | | | | — | | | | (0.03 | ) | |
For The Period
8/15/22^-10/31/22 | | $ | 10.00 | | | | 0.01 | | | | (1.03 | ) | | | (1.02 | ) | | | — | | | | — | | | | — | | | | — | | |
First Eagle U.S. Smid Cap Opportunity Fund Class R6 | |
October 31, 2023 | | $ | 8.98 | | | | 0.06 | | | | (0.29 | ) | | | (0.23 | ) | | | (0.04 | ) | | | — | | | | — | | | | (0.04 | ) | |
For The Period
8/15/22^-10/31/22 | | $ | 10.00 | | | | 0.01 | | | | (1.03 | ) | | | (1.02 | ) | | | — | | | | — | | | | — | | | | — | | |
First Eagle Global Real Assets Fund Class A*** | |
October 31, 2023 | | $ | 9.57 | | | | 0.19 | | | | 0.12 | | | | 0.31 | | | | (0.10 | ) | | | — | | | | — | | | | (0.10 | ) | |
For The Period
11/30/21^-10/31/22 | | $ | 10.00 | | | | 0.13 | | | | (0.56 | ) | | | (0.43 | ) | | | — | | | | — | | | | — | | | | — | | |
First Eagle Funds | Annual Report | October 31, 2023
182
| | | | | | | | | Ratios/Supplemental data | | | |
| | | | | | | | | Ratios to Average Net Assets of: | | | |
Selected per
share data for
the period ended: | | Net asset
value, end
of period | | Total
return(a) | | Net assets,
end of
period
(thousands) | | Operating
expenses
excluding
earnings
credits
and/or fee
waivers | | Operating
expenses
including
earnings
credits
and/or fee
waivers | | Net
investment
income
excluding
earnings
credits
and/or fee
waivers | | Net
investment
income
including
earnings
credits
and/or fee
waivers | | Portfolio
turnover
rate | |
First Eagle Rising Dividend Fund Class R6 (formerly named First Eagle Fund of America) | |
October 31, 2023 | | $ | 23.62 | | | | 14.48 | %(k) | | $ | 6,427 | | | | 0.74 | % | | | 0.65 | % | | | 1.73 | % | | | 1.82 | % | | | 30.98 | % | |
October 31, 2022 | | $ | 21.37 | | | | (21.75 | )% | | $ | 5,206 | | | | 0.69 | % | | | 0.65 | % | | | 0.84 | % | | | 0.88 | % | | | 10.87 | % | |
October 31, 2021 | | $ | 31.17 | | | | 36.93 | % | | $ | 7,056 | | | | 0.67 | % | | | 0.65 | % | | | 0.57 | % | | | 0.59 | % | | | 40.70 | % | |
October 31, 2020 | | $ | 26.92 | | | | (1.13 | )% | | $ | 5,471 | | | | 1.00 | % | | | 0.95 | % | | | 0.20 | % | | | 0.26 | % | | | 97.86 | % | |
October 31, 2019 | | $ | 27.57 | | | | 8.00 | % | | $ | 2,656 | | | | 1.00 | % | | | 0.99 | % | | | 0.32 | % | | | 0.32 | % | | | 26.42 | % | |
First Eagle Small Cap Opportunity Fund Class A | |
October 31, 2023 | | $ | 8.19 | | | | (3.31 | )% | | $ | 61,379 | | | | 1.32 | % | | | 1.25 | % | | | (0.01 | )% | | | 0.06 | % | | | 41.12 | % | |
October 31, 2022 | | $ | 8.47 | | | | (13.22 | )% | | $ | 37,220 | | | | 1.41 | % | | | 1.25 | % | | | (0.42 | )% | | | (0.26 | )% | | | 45.84 | % | |
For The Period
7/01/21^-10/31/21 | | $ | 9.76 | | | | (3.56 | )%(b) | | $ | 10,060 | | | | 1.95 | %(c) | | | 1.25 | %(c) | | | (1.30 | )%(c) | | | (0.60 | )%(c) | | | 13.63 | %(b) | |
First Eagle Small Cap Opportunity Fund Class I | |
October 31, 2023 | | $ | 8.23 | | | | (3.08 | )% | | $ | 1,183,672 | | | | 1.09 | % | | | 1.00 | % | | | 0.22 | % | | | 0.31 | % | | | 41.12 | % | |
October 31, 2022 | | $ | 8.50 | | | | (13.00 | )% | | $ | 501,227 | | | | 1.17 | % | | | 1.00 | % | | | (0.16 | )% | | | 0.01 | % | | | 45.84 | % | |
For The Period
4/27/21^-10/31/21 | | $ | 9.77 | | | | (0.47 | )%(b) | | $ | 93,195 | | | | 2.07 | %(c) | | | 1.00 | %(c) | | | (1.37 | )%(c) | | | (0.30 | )%(c) | | | 13.63 | %(b) | |
First Eagle Small Cap Opportunity Fund Class R6 | |
October 31, 2023 | | $ | 8.23 | | | | (3.08 | )% | | $ | 64,646 | | | | 1.02 | % | | | 1.00 | % | | | 0.29 | % | | | 0.31 | % | | | 41.12 | % | |
October 31, 2022 | | $ | 8.50 | | | | (13.00 | )% | | $ | 22,857 | | | | 1.28 | % | | | 1.00 | % | | | (0.23 | )% | | | 0.04 | % | | | 45.84 | % | |
For The Period
7/01/21^-10/31/21 | | $ | 9.77 | | | | (3.46 | )%(b) | | $ | 1,236 | | | | 1.98 | %(c) | | | 1.00 | %(c) | | | (1.29 | )%(c) | | | (0.31 | )%(c) | | | 13.63 | %(b) | |
First Eagle U.S. Smid Cap Opportunity Fund Class A | |
October 31, 2023 | | $ | 8.70 | | | | (2.90 | )% | | $ | 78 | | | | 7.08 | % | | | 1.20 | % | | | (5.56 | )% | | | 0.31 | % | | | 30.48 | % | |
For The Period
8/15/22^-10/31/22 | | $ | 8.97 | | | | (10.30 | )%(b) | | $ | 49 | | | | 57.34 | %(c) | | | 1.18 | %(c) | | | (55.81 | )%(c) | | | 0.35 | %(c) | | | 4.00 | %(b) | |
First Eagle U.S. Smid Cap Opportunity Fund Class I | |
October 31, 2023 | | $ | 8.72 | | | | (2.60 | )% | | $ | 27,633 | | | | 2.96 | % | | | 0.95 | % | | | (1.56 | )% | | | 0.44 | % | | | 30.48 | % | |
For The Period
8/15/22^-10/31/22 | | $ | 8.98 | | | | (10.20 | )%(b) | | $ | 1,046 | | | | 46.97 | %(c) | | | 0.95 | %(c) | | | (45.46 | )%(c) | | | 0.56 | %(c) | | | 4.00 | %(b) | |
First Eagle U.S. Smid Cap Opportunity Fund Class R6 | |
October 31, 2023 | | $ | 8.71 | | | | (2.64 | )% | | $ | 44 | | | | 8.96 | % | | | 0.95 | % | | | (7.42 | )% | | | 0.60 | % | | | 30.48 | % | |
For The Period
8/15/22^-10/31/22 | | $ | 8.98 | | | | (10.20 | )%(b) | | $ | 45 | | | | 47.13 | %(c) | | | 0.94 | %(c) | | | (45.59 | )%(c) | | | 0.60 | %(c) | | | 4.00 | %(b) | |
First Eagle Global Real Assets Fund Class A*** | |
October 31, 2023 | | $ | 9.78 | | | | 3.17 | % | | $ | 1,700 | | | | 5.91 | % | | | 1.09 | % | | | (3.00 | )% | | | 1.82 | % | | | 39.01 | % | |
For The Period
11/30/21^-10/31/22 | | $ | 9.57 | | | | (4.30 | )%(b) | | $ | 1,286 | | | | 5.23 | %(c) | | | 1.09 | %(c) | | | (2.78 | )%(c) | | | 1.37 | %(c) | | | 12.37 | %(b) | |
First Eagle Funds | Annual Report | October 31, 2023
183
| | | Per share operating performance* | |
| | | | | Change in net assets resulting
from operations | | Less dividends and distributions | |
Selected per
share data for
the period ended: | | Net asset
value,
beginning
of year | | Net
investment
income/
loss | | Net
realized
and
unrealized
gains
(losses) on
investments | | Total
investment
operations | | From net
investment
income | | From
capital
gains | | Return of
capital | | Total
distributions | |
First Eagle Global Real Assets Fund Class I*** | |
October 31, 2023 | | $ | 9.59 | | | | 0.20 | | | | 0.14 | | | | 0.34 | | | | (0.20 | ) | | | — | | | | — | | | | (0.20 | ) | |
For The Period
11/30/21^-10/31/22 | | $ | 10.00 | | | | 0.15 | | | | (0.56 | ) | | | (0.41 | ) | | | — | | | | — | | | | — | | | | — | | |
First Eagle Global Real Assets Fund Class R6*** | |
October 31, 2023 | | $ | 9.59 | | | | 0.21 | | | | 0.13 | | | | 0.34 | | | | (0.20 | ) | | | — | | | | — | | | | (0.20 | ) | |
For The Period
11/30/21^-10/31/22 | | $ | 10.00 | | | | 0.15 | | | | (0.56 | ) | | | (0.41 | ) | | | — | | | | — | | | | — | | | | — | | |
^ Inception date.
* Per share amounts have been calculated using the average shares method.
** Amount represents less than $0.01 per share.
*** First Eagle Global Fund, First Eagle Overseas Fund, First Eagle U.S. Value Fund, First Eagle Gold Fund and First Eagle Global Real Assets Fund financial statements are shown on a consolidated basis and includes the balances of the First Eagle Global Cayman Fund, Ltd., First Eagle Overseas Cayman Fund, Ltd., First Eagle U.S. Value Cayman Fund, Ltd., First Eagle Gold Cayman Fund, Ltd., and First Eagle Global Real Assets Cayman Fund, Ltd., respectively.
(a) Does not take into account the sales charge of 5.00% for Class A shares for all Funds, except First Eagle High Income Fund, which has a sales charge of 4.50% and the maximum contingent deferred sales charge (CDSC) of 1.00% for Class C shares. A contingent deferred sales charge of 1.00% may apply on redemptions of Class A shares made within 18 months following a purchase of $1,000,000 or more without an initial sales charge for all funds, except First Eagle Income Builder Fund and First Eagle High Income Fund. With respect to the First Eagle Global Income Builder Fund and the First Eagle High Income Fund, a CDSC of 1.00% may apply on certain redemptions of Class A shares made within 18 months following a purchase of $250,000 or more without an initial sales charge.
(b) Not annualized.
(c) Annualized.
(d) Net investment income/loss includes income from foreign withholding tax claims less IRS compliance fees. Without these proceeds, the net investment income per share for First Eagle Global Fund would have been 0.44, (0.15), 0.62, 0.00, 0.41, 0.80, and 0.67 for Class A, Class C, Class I, Class R3, Class R4, Class R5 and Class R6 shares, respectively. The net investment income excluding earnings credits and/or fee waivers income and net investment income including earnings credits and/or fee waivers ratios would have been 0.68%, (0.12)%, 0.93%, 0.00%, 0.66%, 1.01%, and 1.02% for Class A, Class C, Class I, Class R3, Class R4, Class R5 and Class R6 shares, respectively.
(e) Net investment income/loss includes income from foreign withholding tax claims less IRS compliance fees. Without these proceeds, the net investment income per share for First Eagle Overseas Fund would have been 0.20, (0.03), 0.29, 0.22, 0.26, 0.25, and 0.35 for Class A, Class C, Class I, Class R3, Class R4, Class R5 and Class R6 shares, respectively. The net investment income excluding earnings credits and/or fee waivers income and net investment income including earnings credits and/or fee waivers ratios would have been 0.82%, 0.03%, 1.12%, 0.79%, 0.92%, 0.86%, and 1.28% for Class A, Class C, Class I, Class R3, Class R4, Class R5 and Class R6 shares, respectively.
First Eagle Funds | Annual Report | October 31, 2023
184
| | | | | | | | | Ratios/Supplemental data | | | |
| | | | | | | | | Ratios to Average Net Assets of: | | | |
Selected per
share data for
the period ended: | | Net asset
value, end
of period | | Total
return(a) | | Net assets,
end of
period
(thousands) | | Operating
expenses
excluding
earnings
credits
and/or fee
waivers | | Operating
expenses
including
earnings
credits
and/or fee
waivers | | Net
investment
income
excluding
earnings
credits
and/or fee
waivers | | Net
investment
income
including
earnings
credits
and/or fee
waivers | | Portfolio
turnover
rate | |
First Eagle Global Real Assets Fund Class I*** | |
October 31, 2023 | | $ | 9.73 | | | | 3.43 | % | | $ | 8,574 | | | | 5.46 | % | | | 0.85 | % | | | (2.59 | )% | | | 2.01 | % | | | 39.01 | % | |
For The Period
11/30/21^-10/31/22 | | $ | 9.59 | | | | (4.10 | )%(b) | | $ | 7,074 | | | | 4.85 | %(c) | | | 0.85 | %(c) | | | (2.34 | )%(c) | | | 1.65 | %(c) | | | 12.37 | %(b) | |
First Eagle Global Real Assets Fund Class R6*** | |
October 31, 2023 | | $ | 9.73 | | | | 3.45 | % | | $ | 1,029 | | | | 5.51 | % | | | 0.85 | % | | | (2.63 | )% | | | 2.03 | % | | | 39.01 | % | |
For The Period
11/30/21^-10/31/22 | | $ | 9.59 | | | | (4.10 | )%(b) | | $ | 1,000 | | | | 4.86 | %(c) | | | 0.85 | %(c) | | | (2.38 | )%(c) | | | 1.63 | %(c) | | | 12.37 | %(b) | |
(f) Net investment income/loss includes income from foreign withholding tax claims less IRS compliance fees. Without these proceeds, the net investment income per share for First Eagle Global Income Builder Fund would have been 0.24, 0.13, 0.28, 0.23, 0.25, 0.24, and 0.29 for Class A, Class C, Class I, Class R3, Class R4, Class R5 and Class R6 shares, respectively. The net investment income excluding earnings credits and/or fee waivers ratios and net investment income including earnings credits and/or fee waivers would have been 1.85%, 1.06%, 2.08%, 1.70%, 1.86%, 1.85%, and 2.16% for Class A, Class C, Class I, Class R3, Class R4, Class R5 and Class R6 shares, respectively.
(g) Total return includes income from foreign withholding tax claims less IRS compliance fees. Without these proceeds, the total returns for First Eagle Global Fund would have been 26.05%, 24.96%, 26.38%, 25.14%, 26.01%, 25.45%, and 26.48% for Class A, Class C, Class I, Class R3, Class R4, Class R5 and Class R6 shares, respectively.
(h) Total return includes income from foreign withholding tax claims less IRS compliance fees. Without these proceeds, the total returns for First Eagle Overseas Fund would have been 16.90%, 15.94%, 17.24%, 16.80%, 17.14%, 16.99%, and 17.35% for Class A, Class C, Class I, Class R3, Class R4, Class R5 and Class R6 shares, respectively.
(i) Total return includes income from foreign withholding tax claims less IRS compliance fees. Without these proceeds, the total returns for First Eagle Global Income Builder Fund would have been 21.09%, 20.21%, 21.44%, 20.94%, 21.16%, 21.07%, and 21.54% for Class A, Class C, Class I, Class R3, Class R4, Class R5 and Class R6 shares, respectively.
(j) Net realized and unrealized gains (losses) includes litigation proceeds. Without these proceeds, the net realized and unrealized gains (losses) per share for First Eagle Rising Dividend Fund would have been 2.13, 1.23, 2.24, 2.23, 2.27, 2.24 and 2.27 for Class A, Class C, Class I, Class R3, Class R4, Class R5 and Class R6 shares, respectively.
(k) Total return includes litigation proceeds. Without these proceeds, the total returns for First Eagle Rising Dividend Fund would have been 12.28%, 10.57%, 12.58%, 12.24%, 12.64%, 12.64% and 12.73% for Class A, Class C, Class I, Class R3, Class R4, Class R5 and Class R6 shares, respectively.
See Notes to Financial Statements.
First Eagle Funds | Annual Report | October 31, 2023
185
Notes to Financial Statements
Note 1 — Significant Accounting Policies
First Eagle Funds (the "Trust"), is an open-end management investment company registered under the Investment Company Act of 1940, as amended ("1940 Act"). As of October 31, 2023, the Trust consists of ten separate portfolios, the First Eagle Global Fund, First Eagle Overseas Fund, First Eagle U.S. Value Fund, First Eagle Gold Fund, First Eagle Global Income Builder Fund, First Eagle High Income Fund, First Eagle Rising Dividend Fund (formerly named First Eagle Fund of America), First Eagle Small Cap Opportunity Fund, First Eagle U.S. Smid Cap Opportunity Fund and First Eagle Global Real Assets Fund (each individually a "Fund" or collectively the "Funds"). All the Funds are diversified mutual funds except for First Eagle Gold Fund and First Eagle Rising Dividend Fund, which are non-diversified. The Trust is a Delaware statutory trust. The First Eagle Global Fund seeks long-term growth of capital by investing in a range of asset classes from markets in the United States and throughout the world. The First Eagle Overseas Fund seeks long-term growth of capital by investing primarily in equities issued by non-U.S. corporations. The First Eagle U.S. Value Fund seeks long-term growth of capital by investing, under normal market conditions, at least 80% of its net assets (plus any borrowings for investment purposes) in domestic equity and debt securities. The First Eagle Gold Fund seeks to provide investors the opportunity to participate in the investment characteristics of gold (and to a limited extent other precious metals) for a portion of their overall investment portfolio. The First Eagle Global Income Builder Fund seeks current income generation and long-term growth of capital. The First Eagle High Income Fund seeks to provide investors with a high level of current income. The First Eagle Rising Dividend Fund seeks capital appreciation and current income by investing primarily in domestic stocks and, to a lesser extent, in debt and foreign equity instruments. The First Eagle Small Cap Opportunity Fund seeks long-term growth of capital. The First Eagle U.S. Smid Cap Opportunity Fund seeks long-term growth of capital by investing, under normal circumstances, in equity securities of small- and mid-cap ("smid cap") companies in an attempt to take advantage of what the Adviser believes are opportunistic situations for undervalued securities. The First Eagle Global Real Assets Fund seeks long-term growth of capital.
The Funds offer seven share classes, Class A shares, Class C shares, Class I shares, Class R3 shares, Class R4 shares, Class R5 shares and Class R6 shares, except for the First Eagle Small Cap Opportunity Fund, First Eagle U.S. Smid Cap Opportunity Fund and First Eagle Global Real Assets Fund, which offer Class A shares, Class I shares and Class R6 shares only. On February 28, 2022, First Eagle Rising Dividend Fund's Class Y shares converted into Class A shares. As a result, Class Y shares were terminated. On December 1, 2023, Class R3 Shares, Class R4 Shares, Class R5 Shares of the Funds were closed to new investors. Please refer to Note 8 Subsequent Events for further details.
First Eagle Investment Management, LLC (the "Adviser"), a subsidiary of First Eagle Holdings, Inc. ("First Eagle Holdings"), manages the Funds. A controlling interest in First Eagle Holdings is owned by BCP CC Holdings L.P., a Delaware limited partnership ("BCP CC Holdings"). BCP CC Holdings GP L.L.C., a Delaware limited
First Eagle Funds | Annual Report | October 31, 2023
186
Notes to Financial Statements
liability company ("BCP CC Holdings GP"), is the general partner of BCP CC Holdings and has two managing members, Blackstone Capital Partners VI L.P. ("BCP VI") and Corsair IV Financial Services Capital Partners L.P. ("Corsair IV"). BCP VI and Corsair IV are indirectly controlled by Blackstone Inc. ("Blackstone") and Corsair Capital LLC ("Corsair"), respectively. Investment vehicles indirectly controlled by Blackstone and Corsair and certain co-investors own a majority economic interest in First Eagle Holdings and the Adviser through BCP CC Holdings.
The following is a summary of significant accounting policies that are adhered to by the Funds. The Funds are investment companies and, accordingly, follow the investment company accounting and reporting guidance of the Financial Accounting Standards Board Accounting Standards Codification Topic 946 — Investment Companies, which is part of U.S. generally accepted accounting principles ("GAAP").
a) Investments in Subsidiaries — The First Eagle Global Fund (the "Global Fund"), First Eagle Overseas Fund (the "Overseas Fund"), First Eagle U.S. Value Fund (the "U.S. Value Fund"), First Eagle Gold Fund (the "Gold Fund") and First Eagle Global Real Assets Fund (the "Global Real Assets Fund") may invest in certain precious metals through their investment in the First Eagle Global Cayman Fund, Ltd., First Eagle Overseas Cayman Fund, Ltd., First Eagle U.S. Value Cayman Fund, Ltd., First Eagle Gold Cayman Fund, Ltd., and First Eagle Global Real Assets Cayman Fund, Ltd., respectively, each a wholly owned subsidiary (each referred to herein as a "Subsidiary" or collectively "the Subsidiaries"). Each Fund may invest up to 25% of its total assets in shares of its respective Subsidiary. Each Subsidiary has the ability to invest in commodities and securities consistent with the investment objective of its respective Fund. Substantially all of each Subsidiary's assets represent physical gold bullion, and First Eagle Gold Cayman Fund, Ltd. also holds physical silver. Trading in bullion directly by the Funds presents the risk of tax consequences (e.g., a change in the Funds' tax status subjecting the Funds to be taxed at the Fund level on all of their income if the Funds' "non-qualifying income" exceeds 10% of the Funds' gross income in any taxable year). Trading in bullion by the Subsidiaries generally does not present the same tax risks.
The First Eagle Global Cayman Fund, Ltd., established on October 18, 2013, is an exempted company under the laws of the Cayman Islands. The consolidated financial statements include the accounts of the Global Fund and the First Eagle Global Cayman Fund, Ltd. All intercompany transactions and balances have been eliminated. As of October 31, 2023, the First Eagle Global Cayman Fund, Ltd. has $4,883,313,596 in net assets, representing 10.51% of the Global Fund's net assets.
The First Eagle Overseas Cayman Fund, Ltd., established on October 18, 2013, is an exempted company under the laws of the Cayman Islands. The consolidated financial statements include the accounts of the Overseas Fund and the First Eagle Overseas Cayman Fund, Ltd. All intercompany transactions and
First Eagle Funds | Annual Report | October 31, 2023
187
Notes to Financial Statements
balances have been eliminated. As of October 31, 2023, the First Eagle Overseas Cayman Fund, Ltd. has $1,043,056,532 in net assets, representing 8.80% of the Overseas Fund's net assets.
The First Eagle U.S. Value Cayman Fund, Ltd., established on January 24, 2012, is an exempted company under the laws of the Cayman Islands. The consolidated financial statements include the accounts of the U.S. Value Fund and the First Eagle U.S. Value Cayman Fund, Ltd. All intercompany transactions and balances have been eliminated. As of October 31, 2023, the First Eagle U.S. Value Cayman Fund, Ltd. has $143,966,846 in net assets, representing 12.64% of the U.S. Value Fund's net assets.
The First Eagle Gold Cayman Fund, Ltd., established on May 28, 2010, is an exempted company under the laws of the Cayman Islands. The consolidated financial statements include the accounts of the Gold Fund and the First Eagle Gold Cayman Fund, Ltd. All intercompany transactions and balances have been eliminated. As of October 31, 2023, the First Eagle Gold Cayman Fund, Ltd. has $451,776,644 in net assets, representing 20.94% of the Gold Fund's net assets.
The First Eagle Global Real Assets Cayman Fund, Ltd., established on September 9, 2021, is an exempted company under the laws of the Cayman Islands. The consolidated financial statements include the accounts of the Global Real Assets Fund and the First Eagle Global Real Assets Cayman Fund, Ltd. All intercompany transactions and balances have been eliminated. As of October 31, 2023, the First Eagle Global Real Assets Cayman Fund, Ltd. has $1,303,563 in net assets, representing 11.53% of the Global Real Assets Fund's net assets.
b) Investment Valuation — Each Fund computes its net asset value once daily as of the close of trading on each day the New York Stock Exchange ("NYSE") is open for trading. The net asset value per share is computed by dividing the total current value of the assets of a Fund, less its liabilities, by the total number of shares outstanding at the time of such computation.
A portfolio security (including an option or warrant), other than a bond, which is traded on a U.S. national securities exchange or a securities exchange abroad is generally valued at the price of the official close (last quoted sales price if an official closing price is not available) as of the local market close on the primary exchange. If there are no round lot sales on such date, such security will be valued at the mean between the closing bid and asked prices (and if there is only a bid or only an asked price on such date, valuation will be at such bid or asked price for long or short positions, respectively). Securities, other than bonds, traded in the over-the-counter market are valued at the mean between the last bid and asked prices prior to the time of valuation (and if there is only a bid or only an asked price on such date, valuation will be at such bid or asked price for long or short positions, respectively), except if such unlisted security is traded on the NASDAQ in which case it is valued at the NASDAQ Official Closing Price. Such prices are provided by approved pricing vendors or other independent pricing sources.
First Eagle Funds | Annual Report | October 31, 2023
188
Notes to Financial Statements
All bonds, whether listed on an exchange or traded in the over-counter-market for which market quotations are readily available are generally priced at the evaluated bid price provided by an approved pricing service as of the close of the NYSE (normally 4:00 p.m. Eastern Time), or dealers in the over-the-counter markets in the United States or abroad. Pricing services and broker-dealers use multiple valuation techniques to determine value. In instances where sufficient market activity exists, dealers or pricing services utilize a market-based approach through which quotes from market makers are used to determine fair value. In instances where sufficient market activity may not exist or is limited, the dealers or pricing services also utilize proprietary valuation models which may consider market transactions in comparable securities and the various relationships between securities in determining value and/or market characteristics such as benchmark yield curves, option-adjusted spreads, credit spreads, estimated default rates, coupon rates, anticipated timing of principal repayments, underlying collateral, and other unique security features in order to estimate the relevant cash flows, which are then discounted to calculate the fair values. The Adviser's Valuation Committee, at least annually, will review the pricing service's inputs, methods, models and assumptions for its evaluated prices. Short-term debt maturing in 60 days or less is valued at evaluated bid prices.
Commodities (such as physical metals) are valued at a calculated evaluated mean price, as provided by an independent price source as of the close of the NYSE.
Forward foreign currency exchange contracts are valued at the current cost of covering or offsetting such contracts, by reference to forward currency rates at the time the NYSE closes, as provided by an independent pricing source.
The spot exchange rates, as provided by an independent price source as of the close of the NYSE, are used to convert foreign security prices into U.S. dollars.
Any security that is listed or traded on more than one exchange (or traded in multiple markets) is valued at the official close on the primary exchange or market on which they are traded. In the absence of such a quotation, a security may be valued at the last quoted sales price on the most active exchange or market as determined by the independent pricing agent. The Funds use pricing services to identify the market prices of publicly traded securities in their portfolios. When market prices are determined to be "stale" as a result of limited market activity for a particular holding or have been materially affected by events occurring after the close of trading on the exchange or market on which the security is principally traded but before the Fund's NAV is calculated, or in other circumstances when market quotations are not readily available within the meaning of applicable regulations, such as for private placements, or determined to be unreliable for a particular holding, such holdings may be "fair valued" in accordance with procedures adopted by the Board of Trustees ("Board") . The values assigned to a Fund's holdings therefore may differ on occasion from reported market values.
First Eagle Funds | Annual Report | October 31, 2023
189
Notes to Financial Statements
Additionally, trading of foreign equity securities on most foreign markets is completed before the close in trading in the U.S. markets. The Funds have implemented fair value pricing on a daily basis for all foreign securities, as available, to account for the market movement between the close of the foreign market and the close of the NYSE. The fair value pricing utilizes factors provided by an independent pricing service. The values assigned to a Fund's holdings therefore may differ on occasion from reported market values, especially during periods of higher market price volatility. The Board and the Adviser believe relying on the procedures as just described will result in prices that are more reflective of the actual market value of portfolio securities held by the Funds than relying solely on reported market values.
The Funds adopted provisions surrounding fair value measurements and disclosures that define fair value, establish a framework for measuring fair value in GAAP and expand disclosures about fair value measurements. This applies to fair value measurements that are already required or permitted by other accounting standards and is intended to increase consistency of those measurements and applies broadly to securities and other types of assets and liabilities.
The Funds disclose the fair value of their investments in a hierarchy that prioritizes the inputs or assumptions to valuation techniques used to measure fair value. These inputs are used in determining the value of the Funds' investments and are summarized in the following fair value hierarchy:
Level 1 — Quoted prices in active markets for identical securities.
Level 2 — Other significant observable inputs (including quoted prices for similar securities, interest rates, prepayment speeds, credit risk, etc.).
Level 3 — Other significant unobservable inputs (including the Fund's own assumption in determining the fair value of investments).
The significant unobservable inputs that may be used in determining valuations for investments identified within Level 3 are market comparables and the enterprise value of a company. Indications of value and quotations may be observable at any given time, but are currently treated by the Funds as unobservable. Significant changes in any of the unobservable inputs may significantly impact the fair value measurement. The impact is based on the relationship between each unobservable input and the fair value measurement.
Significant increases (decreases) in enterprise multiples may increase (decrease) the fair value measurement. Significant increases (decreases) in the discount for marketability, probability of insolvency and probability of default may decrease (increase) the fair value measurement.
Fair valuation of securities, other financial investments or other assets (collectively, "securities") held by the Funds are determined in good faith by the Adviser as "valuation designee" under the oversight of the Board. The Board
First Eagle Funds | Annual Report | October 31, 2023
190
Notes to Financial Statements
Valuation, Liquidity and Allocations Committee (the "Committee") oversees the execution of the valuation and liquidity procedures for the Funds. In accordance with Rule 2a-5 under the 1940 Act, the Funds' Board has designated the Adviser the "valuation designee" to perform the Fund's fair value determinations. The Adviser's fair valuation process is subject to Board oversight and certain reporting and other requirements.
The following is a summary of the Funds' inputs used to value the Funds' investments as of October 31, 2023:
First Eagle Global Fund
Description† | | Level 1 | | Level 2 | | Level 3‡ | | Total | |
Assets: | |
Common Stocks | | $ | 23,469,271,163 | | | $ | 12,591,635,347 | (a) | | $ | — | | | $ | 36,060,906,510 | | |
Corporate Bonds | | | — | | | | — | | | | 4,954,469 | (b) | | | 4,954,469 | | |
Commodities* | | | — | | | | 5,488,517,064 | | | | — | | | | 5,488,517,064 | | |
Foreign Government Securities | | | — | | | | 349,755,444 | | | | — | | | | 349,755,444 | | |
Short-Term Investments | | | 331,992 | | | | 4,509,793,643 | | | | — | | | | 4,510,125,635 | | |
Forward Foreign Currency
Exchange Contracts** | | | — | | | | 45,895,255 | | | | — | | | | 45,895,255 | | |
Total | | $ | 23,469,603,155 | | | $ | 22,985,596,753 | | | $ | 4,954,469 | | | $ | 46,460,154,377 | | |
Liabilities: | |
Forward Foreign Currency
Exchange Contracts** | | $ | — | | | $ | (288,055 | ) | | $ | — | | | $ | (288,055 | ) | |
Total | | $ | — | | | $ | (288,055 | ) | | $ | — | | | $ | (288,055 | ) | |
(a) The Fund has implemented fair value pricing on a daily basis for all foreign securities, as available, to account for the market movement between the close of the foreign market and the close of the NYSE. See Note 1(b) for additional details.
(b) These investments are valued by brokers and pricing services. The inputs for these investments are not readily available or cannot be reasonably estimated and are generally those inputs described in Note 1(b).
† See Consolidated Schedule of Investments for additional detailed categorizations.
‡ Value determined using significant unobservable inputs.
* Represents gold bullion.
** Forward Foreign Currency Exchange Contracts are valued at net unrealized appreciation (depreciation) on the contracts.
First Eagle Funds | Annual Report | October 31, 2023
191
Notes to Financial Statements
Fair Value Level 3 activity for the year ended October 31, 2023 was as follows:
First Eagle Global Fund (continued)
| | | Corporate Bonds | | Foreign
Government
Securities | | Total | |
Beginning Balance — market value | | $ | 5,207,318 | | | $ | 131,252,430 | | | $ | 136,459,748 | | |
Purchases(1) | | | — | | | | — | | | | — | | |
Sales(2) | | | — | | | | (147,050,116 | ) | | | (147,050,116 | ) | |
Transfer In — Level 3 | | | — | | | | — | | | | — | | |
Transfer Out — Level 3 | | | — | | | | — | | | | — | | |
Accrued discounts/(premiums) | | | 51,358 | | | | (1,212,842 | ) | | | (1,161,484 | ) | |
Realized Gains (Losses) | | | — | | | | (56,576,978 | ) | | | (56,576,978 | ) | |
Change in Unrealized Appreciation (Depreciation) | | | (304,207 | ) | | | 73,587,506 | | | | 73,283,299 | | |
Ending Balance — market value | | $ | 4,954,469 | | | $ | — | | | $ | 4,954,469 | | |
Change in unrealized gains or (losses) relating to
assets still held at reporting date | | $ | (304,207 | ) | | $ | — | | | $ | (304,207 | ) | |
(1) Purchases include all purchases of securities and securities received in corporate actions.
(2) Sales include all sales of securities, maturities, paydowns and securities tendered in corporate actions.
First Eagle Overseas Fund
Description† | | Level 1 | | Level 2 | | Level 3‡ | | Total | |
Assets: | |
Common Stocks | | $ | 2,661,041,906 | | | $ | 6,910,786,019 | (a) | | $ | 15,384,962 | | | $ | 9,587,212,887 | | |
Commodities* | | | — | | | | 1,439,169,397 | | | | — | | | | 1,439,169,397 | | |
Foreign Government Securities | | | — | | | | 207,607,258 | | | | — | | | | 207,607,258 | | |
Short-Term Investments | | | 63,532 | | | | 595,525,869 | | | | — | | | | 595,589,401 | | |
Forward Foreign Currency
Exchange Contracts** | | | — | | | | 25,351,715 | | | | — | | | | 25,351,715 | | |
Total | | $ | 2,661,105,438 | | | $ | 9,178,440,258 | | | $ | 15,384,962 | | | $ | 11,854,930,658 | | |
Liabilities: | |
Forward Foreign Currency
Exchange Contracts** | | $ | — | | | $ | (11,828 | ) | | $ | — | | | $ | (11,828 | ) | |
Total | | $ | — | | | $ | (11,828 | ) | | $ | — | | | $ | (11,828 | ) | |
(a) The Fund has implemented fair value pricing on a daily basis for all foreign securities, as available, to account for the market movement between the close of the foreign market and the close of the NYSE. See Note 1(b) for additional details.
First Eagle Funds | Annual Report | October 31, 2023
192
Notes to Financial Statements
† See Consolidated Schedule of Investments for additional detailed categorizations.
‡ Value determined using significant unobservable inputs.
* Represents gold bullion.
** Forward Foreign Currency Exchange Contracts are valued at net unrealized appreciation (depreciation) on the contracts.
Fair Value Level 3 activity for the year ended October 31, 2023 was as follows:
First Eagle Overseas Fund (continued)
| | | Common Stocks | | Foreign
Government
Security | |
Total | |
Beginning Balance — market value | | $ | 14,924,062 | | | $ | 128,237,726 | | | $ | 143,161,788 | | |
Purchases(1) | | | — | | | | — | | | | — | | |
Sales(2) | | | — | | | | (64,309,808 | ) | | | (64,309,808 | ) | |
Transfer In — Level 3 | | | — | | | | — | | | | — | | |
Transfer Out — Level 3 | | | — | | | | (70,831,127 | )(a) | | | (70,831,127 | ) | |
Accrued discounts/(premiums) | | | — | | | | (484,564 | ) | | | (484,564 | ) | |
Realized Gains (Losses) | | | — | | | | (25,493,559 | ) | | | (25,493,559 | ) | |
Change in Unrealized Appreciation (Depreciation) | | | 460,900 | | | | 32,881,332 | | | | 33,342,232 | | |
Ending Balance — market value | | $ | 15,384,962 | | | $ | — | | | $ | 15,384,962 | | |
Change in unrealized gains or (losses) relating to
assets still held at reporting date | | $ | 460,900 | | | $ | — | | | $ | 460,900 | | |
(a) Transfers from Level 3 to Level 2 are due to an increase in market activity, e.g., frequency of trades, which resulted in an increase in available market inputs to determine the price.
(1) Purchases include all purchases of securities and securities received in corporate actions.
(2) Sales include all sales of securities, maturities, paydowns and securities tendered in corporate actions.
Quantitative Information about Level 3 Fair Value Measurements | |
| | Fair Value as of
October 31, 2023 | | Valuation
Technique(s) | | Unobservable
Input | | Range
(Weighted
Average) | | Direction
Change in Fair
Value Resulting
from Increase
in Unobservable
Input(a) | |
| Common Stock | | $ | 15,384,962 | | | Market
Comparable
Companies | | Enterprise
Value
Multiple | | | 0.33
11.92x (3.55x) | x - | | Increase | |
(a) This column represents the direction change in the fair value of level 3 securities that would result from an increase to the corresponding unobservable inputs. A decrease to the unobservable input would have the opposite effect. Significant increases and decreases of these inputs could result in significantly higher or lower fair value determination.
First Eagle Funds | Annual Report | October 31, 2023
193
Notes to Financial Statements
First Eagle U.S. Value Fund
Description† | | Level 1 | | Level 2 | | Level 3‡ | | Total | |
Assets: | |
Common Stocks | | $ | 851,357,012 | | | $ | 3,622,814 | (a) | | $ | — | | | $ | 854,979,826 | | |
Convertible Preferred Stocks | | | 4,476,100 | | | | — | | | | — | | | | 4,476,100 | | |
Corporate Bonds | | | — | | | | 3,739,454 | | | | 543,750 | (b) | | | 4,283,204 | | |
Commodities* | | | — | | | | 143,979,658 | | | | — | | | | 143,979,658 | | |
Master Limited Partnerships | | | 16,223,988 | | | | — | | | | — | | | | 16,223,988 | | |
Short-Term Investments | | | 26,191 | | | | 116,989,903 | | | | — | | | | 117,016,094 | | |
Total | | $ | 872,083,291 | | | $ | 268,331,829 | | | $ | 543,750 | | | $ | 1,140,958,870 | | |
(a) The Fund has implemented fair value pricing on a daily basis for all foreign securities, as available, to account for the market movement between the close of the foreign market and the close of the NYSE. See Note 1(b) for additional details.
(b) These investments are valued by brokers and pricing services. The inputs for these investments are not readily available or cannot be reasonably estimated and are generally those inputs described in Note 1(b).
† See Consolidated Schedule of Investments for additional detailed categorizations.
‡ Value determined using significant unobservable inputs.
* Represents gold bullion.
Fair Value Level 3 activity for the year ended October 31, 2023 was as follows:
| | | Corporate Bonds | |
Beginning Balance — market value | | $ | 3,954,544 | | |
Purchases(1) | | | — | | |
Sales(2) | | | — | | |
Transfer In — Level 3 | | | — | | |
Transfer Out — Level 3 | | | (3,383,044 | )(a) | |
Accrued discounts/(premiums) | | | 5,905 | | |
Realized Gains (Losses) | | | — | | |
Change in Unrealized Appreciation (Depreciation) | | | (33,655 | ) | |
Ending Balance — market value | | $ | 543,750 | | |
Change in unrealized gains or (losses) relating to assets still held at reporting date | | $ | (33,655 | ) | |
(a) Transfers from Level 3 to Level 2 are due to an increase in market activity, e.g., frequency of trades, which resulted in an increase in available market inputs to determine the price.
(1) Purchases include all purchases of securities and securities received in corporate actions.
(2) Sales include all sales of securities, maturities, paydowns and securities tendered in corporate actions.
First Eagle Funds | Annual Report | October 31, 2023
194
Notes to Financial Statements
First Eagle Gold Fund
Description† | | Level 1 | | Level 2 | | Level 3 | | Total | |
Assets: | |
Common Stocks | | $ | 1,290,754,688 | | | $ | 205,902,725 | (a) | | $ | — | | | $ | 1,496,657,413 | | |
Commodities* | | | — | | | | 451,951,090 | | | | — | | | | 451,951,090 | | |
Rights | | | 3,455,430 | | | | — | | | | — | | | | 3,455,430 | | |
Short-Term Investments | | | 138,274 | | | | 188,770,434 | | | | — | | | | 188,908,708 | | |
Total | | $ | 1,294,348,392 | | | $ | 846,624,249 | | | $ | — | | | $ | 2,140,972,641 | | |
(a) The Fund has implemented fair value pricing on a daily basis for all foreign securities, as available, to account for the market movement between the close of the foreign market and the close of the NYSE. See Note 1(b) for additional details.
† See Consolidated Schedule of Investments for additional detailed categorizations.
* Represents gold and silver bullion.
First Eagle Global Income Builder Fund
Description† | | Level 1 | | Level 2 | | Level 3 | | Total | |
Assets: | |
Common Stocks | | $ | 493,774,135 | | | $ | 463,123,966 | (a) | | $ | — | | | $ | 956,898,101 | | |
Convertible Preferred Stocks | | | 22,803,612 | | | | — | | | | — | | | | 22,803,612 | | |
Corporate Bonds | | | — | | | | 175,886,887 | | | | — | | | | 175,886,887 | | |
Asset-Backed Securities | | | — | | | | 4,232,743 | | | | — | | | | 4,232,743 | | |
Commodities* | | | — | | | | 110,952,542 | | | | — | | | | 110,952,542 | | |
Foreign Government Securities | | | — | | | | 28,185,942 | | | | — | | | | 28,185,942 | | |
Loan Assignments | | | — | | | | 4,247,046 | | | | — | | | | 4,247,046 | | |
Master Limited Partnerships | | | 31,330,807 | | | | — | | | | — | | | | 31,330,807 | | |
Preferred Stocks | | | 22,290,808 | | | | — | | | | — | | | | 22,290,808 | | |
U.S. Treasury Obligations | | | — | | | | 247,027,488 | | | | — | | | | 247,027,488 | | |
Short-Term Investments | | | 16,392 | | | | 35,792,400 | | | | — | | | | 35,808,792 | | |
Forward Foreign Currency
Exchange Contracts** | | | — | | | | 1,205,386 | | | | — | | | | 1,205,386 | | |
Total | | $ | 570,215,754 | | | $ | 1,070,654,400 | | | $ | — | | | $ | 1,640,870,154 | | |
Liabilities: | |
Forward Foreign Currency
Exchange Contracts** | | $ | — | | | $ | (9,302 | ) | | $ | — | | | $ | (9,302 | ) | |
Options Written | | | (327,757 | ) | | | — | | | | — | | | | (327,757 | ) | |
Total | | $ | (327,757 | ) | | $ | (9,302 | ) | | $ | — | | | $ | (337,059 | ) | |
First Eagle Funds | Annual Report | October 31, 2023
195
Notes to Financial Statements
(a) The Fund has implemented fair value pricing on a daily basis for all foreign securities, as available, to account for the market movement between the close of the foreign market and the close of the NYSE. See Note 1(b) for additional details.
† See Schedule of Investments for additional detailed categorizations.
* Represents gold bullion.
** Forward Foreign Currency Exchange Contracts are valued at net unrealized appreciation (depreciation) on the contracts.
Fair Value Level 3 activity for the year ended October 31, 2023 was as follows:
First Eagle Global Income Builder Fund (continued)
| | | Corporate Bonds | | Foreign
Government
Securities | |
Total | |
Beginning Balance — market value | | $ | 10,795,940 | | | $ | 7,890,932 | | | $ | 18,686,872 | | |
Purchases(1) | | | — | | | | — | | | | — | | |
Sales(2) | | | — | | | | (3,259,825 | ) | | | (3,259,825 | ) | |
Transfer In — Level 3 | | | — | | | | — | | | | — | | |
Transfer Out — Level 3 | | | (10,795,940 | )(a) | | | (4,976,954 | )(a) | | | (15,772,894 | ) | |
Accrued discounts/(premiums) | | | — | | | | 16,871 | | | | 16,871 | | |
Realized Gains (Losses) | | | — | | | | (1,651,416 | ) | | | (1,651,416 | ) | |
Change in Unrealized Appreciation (Depreciation) | | | — | | | | 1,980,392 | | | | 1,980,392 | | |
Ending Balance — market value | | $ | — | | | $ | — | | | $ | — | | |
Change in unrealized gains or (losses) relating to
assets still held at reporting date | | $ | — | | | $ | — | | | $ | — | | |
(a) Transfers from Level 3 to Level 2 are due to an increase in market activity, e.g., frequency of trades, which resulted in an increase in available market inputs to determine the price.
(1) Purchases include all purchases of securities and securities received in corporate actions.
(2) Sales include all sales of securities, maturities, paydowns and securities tendered in corporate actions.
First Eagle High Income Fund
Description† | | Level 1 | | Level 2 | | Level 3‡ | | Total | |
Assets: | |
Corporate Bonds | | $ | — | | | $ | 127,416,406 | | | $ | 621,196 | (b) | | $ | 128,037,602 | | |
Asset-Backed Securities | | | — | | | | 814,063 | | | | — | | | | 814,063 | | |
Loan Assignments | | | — | | | | 1,455,521 | | | | — | | | | 1,455,521 | | |
Short-Term Investments | | | 7,164 | | | | 14,217,775 | | | | — | | | | 14,224,939 | | |
Total | | $ | 7,164 | | | $ | 143,903,765 | | | $ | 621,196 | | | $ | 144,532,125 | | |
First Eagle Funds | Annual Report | October 31, 2023
196
Notes to Financial Statements
(b) These investments are valued by brokers and pricing services. The inputs for these investments are not readily available or cannot be reasonably estimated and are generally those inputs described in Note 1 (b).
† See Schedule of Investments for additional detailed categorizations.
‡ Value determined using significant unobservable inputs.
Fair Value Level 3 activity for the year ended October 31, 2023 was as follows:
First Eagle High Income Fund (continued)
| | | Corporate Bonds | |
Beginning Balance — market value | | $ | 2,968,761 | | |
Purchases(1) | | | — | | |
Sales(2) | | | — | | |
Transfer In — Level 3 | | | 639,479 | (a) | |
Transfer Out — Level 3 | | | (2,968,761 | )(b) | |
Accrued discounts/(premiums) | | | — | | |
Realized Gains (Losses) | | | — | | |
Change in Unrealized Appreciation (Depreciation) | | | (18,283 | ) | |
Ending Balance — market value | | $ | 621,196 | | |
Change in unrealized gains or (losses) relating to assets still held at reporting date | | $ | (18,283 | ) | |
(a) Transfers from level 2 into Level 3 are due to a decrease in market activity, e.g. frequency of trades, which resulted in a decrease in available market inputs to determine the price.
(b) Transfers from Level 3 to Level 2 are due to an increase in market activity, e.g., frequency of trades, which resulted in an increase in available market inputs to determine the price.
(1) Purchases include all purchases of securities and securities received in corporate actions.
(2) Sales include all sales of securities, maturities, paydowns and securities tendered in corporate actions.
First Eagle Rising Dividend Fund
Description† | | Level 1 | | Level 2 | | Level 3 | | Total | |
Assets: | |
Common Stocks | | $ | 324,131,162 | | | $ | 15,564,505 | (a) | | $ | — | | | $ | 339,695,667 | | |
Master Limited Partnerships | | | 9,174,256 | | | | — | | | | — | | | | 9,174,256 | | |
Short-Term Investments | | | 3,291 | | | | 4,756,256 | | | | — | | | | 4,759,547 | | |
Total | | $ | 333,308,709 | | | $ | 20,320,761 | | | $ | — | | | $ | 353,629,470 | | |
(a) The Fund has implemented fair value pricing on a daily basis for all foreign securities, as available, to account for the market movement between the close of the foreign market and the close of the NYSE. See Note 1 for additional details.
† See Schedule of Investments for additional detailed categorizations.
First Eagle Funds | Annual Report | October 31, 2023
197
Notes to Financial Statements
First Eagle Small Cap Opportunity Fund
Description† | | Level 1 | | Level 2 | | Level 3‡ | | Total | |
Assets: | |
Common Stocks | | $ | 1,198,328,408 | | | $ | — | | | $ | — | | | $ | 1,198,328,408 | | |
Rights | | | — | | | | — | | | | — | ^ | | | — | | |
Short-Term Investments | | | 108,206,140 | | | | — | | | | — | | | | 108,206,140 | | |
Total | | $ | 1,306,534,548 | | | $ | — | | | $ | — | | | $ | 1,306,534,548 | | |
† See Schedule of Investments for additional detailed categorizations.
‡ Value determined using significant unobservable inputs.
^ Fair value represents zero.
Fair Value Level 3 activity for the year ended October 31, 2023 was as follows:
| | | Rights | |
Beginning Balance — market value | | $ | — | ^ | |
Purchases(1) | | | — | | |
Sales(2) | | | — | | |
Transfer In — Level 3 | | | — | | |
Transfer Out — Level 3 | | | — | | |
Accrued discounts/(premiums) | | | — | | |
Realized Gains (Losses) | | | — | | |
Change in Unrealized Appreciation (Depreciation) | | | — | | |
Ending Balance — market value | | $ | — | ^ | |
Change in unrealized gains or (losses) relating to assets still held at reporting date | | $ | — | | |
(1) Purchases include all purchases of securities and securities received in corporate actions.
(2) Sales include all sales of securities, maturities, paydowns and securities tendered in corporate actions.
^ Fair value represents zero.
Quantitative Information about Level 3 Fair Value Measurements | |
| | Fair Value as of
October 31, 2023 | | Valuation
Technique(s) | | Unobservable
Input | | Range
(Weighted
Average) | | Direction
Change in Fair
Value Resulting
from Increase
in Unobservable
Input(a) | |
| Rights | | $ | — | ^ | | Discounted
Cash Flow | | Estimated probability
of the company hitting
specified milestones | | | 0 | % (0%) | | Increase | |
^ Fair value represents zero
(a) This column represents the direction change in the fair value of level 3 securities thta would result from an increase to the corresponding unobservable inputs. A decrease to the unobservable input would have the opposite effect. Significant increases and decreases of these inputs could result in significantly higher or lower fair value determination.
First Eagle Funds | Annual Report | October 31, 2023
198
Notes to Financial Statements
First Eagle U.S. Smid Cap Opportunity Fund
Description† | | Level 1 | | Level 2 | | Level 3 | | Total | |
Assets: | |
Common Stocks | | $ | 26,574,203 | | | $ | — | | | $ | — | | | $ | 26,574,203 | | |
Short-Term Investments | | | 1,458,654 | | | | — | | | | — | | | | 1,458,654 | | |
Total | | $ | 28,032,857 | | | $ | — | | | $ | — | | | $ | 28,032,857 | | |
† See Schedule of Investments for additional detailed categorizations.
First Eagle Global Real Assets Fund
Description† | | Level 1 | | Level 2 | | Level 3‡ | | Total | |
Assets: | |
Common Stocks | | $ | 6,271,181 | | | $ | 3,153,238 | (a) | | $ | — | ^ | | $ | 9,424,419 | | |
Commodities* | | | — | | | | 1,194,168 | | | | — | | | | 1,194,168 | | |
Exchange-Traded Funds | | | 98,260 | | | | — | | | | — | | | | 98,260 | | |
Master Limited Partnerships | | | 418,512 | | | | — | | | | — | | | | 418,512 | | |
Short-Term Investments | | | 342,979 | | | | — | | | | — | | | | 342,979 | | |
Total | | $ | 7,130,932 | | | $ | 4,347,406 | | | $ | — | | | $ | 11,478,338 | | |
(a) The Fund has implemented fair value pricing on a daily basis for all foreign securities, as available, to account for the market movement between the close of the foreign market and the close of the NYSE. See Note 1(b) for additional details.
† See Consolidated Schedule of Investments for additional detailed categorizations.
‡ Value determined using significant unobservable inputs.
* Represents gold bullion.
^ Fair value represents zero.
Fair Value Level 3 activity for the year ended October 31, 2023 was as follows:
| | | Common Stocks | |
Beginning Balance — market value | | $ | — | ^ | |
Purchases(1) | | | — | | |
Sales(2) | | | — | | |
Transfer In — Level 3 | | | — | | |
Transfer Out — Level 3 | | | — | | |
Accrued discounts/(premiums) | | | — | | |
Realized Gains (Losses) | | | — | | |
Change in Unrealized Appreciation (Depreciation) | | | — | | |
Ending Balance — market value | | $ | — | ^ | |
Change in unrealized gains or (losses) relating to assets still held at reporting date | | $ | — | | |
First Eagle Funds | Annual Report | October 31, 2023
199
Notes to Financial Statements
(1) Purchases include all purchases of securities and securities received in corporate actions.
(2) Sales include all sales of securities, maturities, paydowns and securities tendered in corporate actions.
^ Fair value represents zero.
Quantitative Information about Level 3 Fair Value Measurements | |
| | | Fair Value as of
October 31, 2023 | | Valuation
Technique(s) | | Unobservable
Input | | Range
(Weighted
Average) | | Direction
Change in Fair
Value Resulting
from Increase in
Unobservable
Input(a) | |
| Common Stock | | $ | — | ^ | | Discounted
Cash Flow | | Estimated
Recoverability | | | 0 | % (0%) | | Increase | |
^ Fair value represents zero
(a) This column represents the direction change in the fair value of level 3 securities thta would result from an increase to the corresponding unobservable inputs. A decrease to the unobservable input would have the opposite effect. Significant increases and decreases of these inputs could result in significantly higher or lower fair value determination.
c) Investment Transactions and Income — Investment transactions are accounted for on a trade date basis. The specific identification method is used in determining realized gains and losses from investment transactions. Dividend income is recorded on the ex-dividend date, except for certain dividends on foreign securities, which are recorded as soon as the Fund is informed after the ex-dividend date. The Funds may be subject to withholding tax on income, capital gains or repatriation taxes imposed by certain countries, a portion of which may be recoverable. Foreign taxes are recorded in accordance with the applicable foreign tax regulations and rates that exist in the foreign jurisdictions in which a Fund invests. Investment income is recorded net of foreign withholding taxes. Foreign taxes are accrued based on gains realized by a Fund as a result of certain foreign security sales. In certain circumstances, estimated taxes are accrued based on unrealized appreciation of such securities. Interest income is recorded daily on the accrual basis. In computing investment income, each Fund accretes discounts and amortizes premiums on debt obligations using the effective yield method. Investment income is allocated to each Fund's share class in proportion to its relative net assets. Payments received from certain investments held by the Funds may be comprised of dividends, capital gains and return of capital. The Funds originally estimate the expected classification of such payments. The amounts may subsequently be reclassified upon receipt of information from the issuer.
d) Expenses — Expenses arising in connection with a Fund are charged directly to that Fund. Expenses common to all Funds may be allocated to each Fund in proportion to its relative net assets. Certain expenses are shared with the First Eagle Variable Funds, an affiliated fund group, and certain other funds also
First Eagle Funds | Annual Report | October 31, 2023
200
Notes to Financial Statements
managed by the Adviser. Generally, expenses that do not pertain specifically to a Fund are allocated to each Fund based upon the percentage of net assets a Fund bears to the total net assets of all the Funds that share the expense. Earnings credits may reduce shareholder servicing agent fees by the amount of interest earned on balances with such service provider.
e) Foreign Currency Translation — The books and records of the Funds are maintained in U.S. dollars. The market values of securities which are not traded in U.S. currency are recorded in the financial statements after translation to U.S. dollars based on the applicable exchange rates at the end of the period. The costs of such securities are translated at exchange rates prevailing when acquired. Related interest, dividends and withholding taxes are accrued at the rates of exchange prevailing on the respective dates of such transactions.
The net assets of each of the Funds are presented at the foreign exchange rates and market values at the close of the period. The Funds do not isolate that portion of gains and losses on investments which is due to changes in foreign exchange rates from that which is due to changes in market prices of the securities. Accordingly, such foreign currency gains (losses) are included in the reported net realized and unrealized gains (losses) on investment transactions on the Statements of Operations. However, for federal income tax purposes each Fund does isolate the effect of changes in foreign exchange rates from the changes in market prices for realized gains and losses on debt obligations.
f) Forward Foreign Currency Exchange Contracts — In connection with portfolio purchases and sales of securities denominated in foreign currencies, each Fund may enter into forward foreign currency exchange contracts. The First Eagle Global Fund, First Eagle Overseas Fund, First Eagle Global Income Builder Fund and First Eagle High Income Fund enter into forward foreign currency exchange contracts primarily to manage and/or gain exposure to certain foreign currencies. The Funds' currency transactions include portfolio hedging on portfolio positions. Portfolio hedging is the use of a forward foreign currency exchange contract (or other cash management position) with respect to one or more portfolio security positions denominated or quoted in a particular currency. Currency exchange transactions involve currencies of different countries that the Funds invest in and serve as hedges against possible variations in the exchange rates between these currencies and the U.S. dollar. Each Fund may engage in portfolio hedging with respect to the currency of a particular country in amounts approximating actual or anticipated positions in securities denominated in that currency. Hedging can reduce exposure to currency exchange movements, but cannot eliminate that exposure. It is possible to lose money under a hedge.
Funds investing in forward foreign currency exchange contracts are exposed to risk if the value of the currency changes unfavorably, if the counterparties to the contracts are unable to meet the terms of their contracts or if the Fund is unable to enter into a closing position. Forward foreign currency exchange contracts
First Eagle Funds | Annual Report | October 31, 2023
201
Notes to Financial Statements
outstanding at period end, if any, are listed after each Fund's portfolio. For the year ended October 31, 2023, the average monthly outstanding currency purchased or sold in U.S. dollars for forward foreign currency exchange contracts held by the Funds were as follows:
| | | First Eagle
Global
Fund | | First Eagle
Overseas
Fund | | First Eagle
Global
Income
Builder
Fund | |
Forward Foreign Currency Exchange Contracts: | |
Average Settlement Value — Purchased | | $ | 23,792,853 | | | $ | 6,055,967 | | | $ | 667,044 | | |
Average Settlement Value — Sold | | | 764,815,799 | | | | 403,020,201 | | | | 23,634,648 | | |
The Funds adopted provisions surrounding disclosures of derivative instruments and hedging activities which require qualitative disclosures about objectives and strategies for using derivatives, quantitative disclosures about fair value amounts of gains and losses on derivative instruments, and disclosures about currency-risk-related contingent features in derivative agreements.
In order to better define its contractual rights and to secure rights that may help the Funds mitigate counterparty risk, the Funds may enter into an International Swaps and Derivatives Association, Inc. Master Agreement ("ISDA Master Agreement") or similar agreement with derivative contract counterparties. An ISDA Master Agreement is a bilateral agreement between a Fund and a counterparty that governs over-the-counter ("OTC") derivatives and forward foreign currency exchange contracts and typically contains, among other things, collateral posting terms and netting provisions in the event of a default and/or termination event. Under an ISDA Master Agreement, the Funds may, under certain circumstances, offset with the counterparty certain derivative financial instrument's payables and/or receivables with collateral held and/or posted and create one single net payment. With respect to certain counterparties, in accordance with the terms of the ISDA Master Agreement, the Funds may be required to post or receive collateral in the form of cash or debt securities issued by the U.S. Government or related agencies. Daily movement of cash collateral is subject to minimum threshold amounts. Cash collateral that has been pledged to cover obligations of a Fund, if any, is reported separately on the Statements of Assets and Liabilities as cash pledged. Non-cash collateral pledged by a Fund, if any, is noted in the Schedules of Investments. Collateral received by the Funds is held in a segregated account at the Funds' custodian bank. These amounts are not reflected on the Funds' Statements of Assets and Liabilities and are disclosed in the table below. The provisions of the ISDA Master Agreement typically permit a single net payment in the event of default (close-out netting) including the bankruptcy or insolvency of the counterparty. Note, however, that bankruptcy or insolvency laws of a particular jurisdiction may impose restrictions on or prohibitions against the right of offset in bankruptcy, insolvency or other events.
First Eagle Funds | Annual Report | October 31, 2023
202
Notes to Financial Statements
For financial reporting purposes, the Funds do not offset derivative assets and derivative liabilities that are subject to netting arrangements in the Statements of Asset and Liabilities.
At October 31, 2023, the Funds had the following forward foreign currency exchange contracts grouped into appropriate risk categories illustrated below:
First Eagle Global Fund
| | | | | | | Gain or (Loss)
Derivative Recognized
in Income | |
Risk Type | | Asset Derivative
Fair Value(1) | | Liability Derivative
Fair Value(2) | | Net realized
Gains
(Losses)(3) | | Change in
Appreciation
(Depreciation)(4) | |
Foreign currency | | $ | 45,895,255 | | | $ | 288,055 | | | $ | 4,837,211 | | | $ | 46,203,713 | | |
First Eagle Overseas Fund
| | | | | | | Gain or (Loss)
Derivative Recognized
in Income | |
Risk Type | | Asset Derivative
Fair Value(1) | | Liability Derivative
Fair Value(2) | | Net realized
Gains
(Losses)(3) | | Change in
Appreciation
(Depreciation)(4) | |
Foreign currency | | $ | 25,351,715 | | | $ | 11,828 | | | $ | 5,058,952 | | | $ | 25,593,315 | | |
First Eagle Global Income Builder Fund
| | | | | | | Gain or (Loss)
Derivative Recognized
in Income | |
Risk Type | | Asset Derivative
Fair Value(1) | | Liability Derivative
Fair Value(2) | | Net realized
Gains
(Losses)(3) | | Change in
Appreciation
(Depreciation)(4) | |
Foreign currency | | $ | 1,205,386 | | | $ | 9,302 | | | $ | (160,464 | ) | | $ | 1,213,151 | | |
(1) Statement of Assets and Liabilities location: Unrealized appreciation on forward foreign currency exchange contracts.
(2) Statement of Assets and Liabilities location: Unrealized depreciation on forward foreign currency exchange contracts.
(3) Statement of Operations location: Net realized gains (losses) from settlement of forward foreign currency exchange contracts.
(4) Statement of Operations location: Changes in unrealized appreciation (depreciation) of forward foreign currency exchange contracts.
First Eagle Funds | Annual Report | October 31, 2023
203
Notes to Financial Statements
The following tables present each Fund's gross derivative assets and liabilities by counterparty net of amounts available for offset under netting arrangements and any related collateral received or pledged by each fund as of October 31, 2023:
First Eagle Global Fund
Counterparty | | Gross Amount
of Assets
Presented in
the Statement of
Assets and
Liabilities | | Derivatives
Available for
Offset | | Collateral
Received* | | Net Amount
(Not Less
Than $0) | |
Bank of New York Mellon | | $ | 20,995,542 | | | $ | — | | | $ | (20,995,542 | ) | | $ | — | | |
Goldman Sachs | | | 13,121,753 | | | | — | | | | (13,121,753 | ) | | | — | | |
JPMorgan Chase Bank | | | 9,625,906 | | | | (288,055 | ) | | | (9,337,851 | ) | | | — | | |
UBS AG | | | 2,152,054 | | | | — | | | | (2,152,054 | ) | | | — | | |
| | | $ | 45,895,255 | | | $ | (288,055 | ) | | $ | (45,607,200 | ) | | $ | — | | |
Counterparty | | Gross Amount
of Liabilities
Presented in
the Statement of
Assets and
Liabilities | | Derivatives
Available for
Offset | | Collateral
Pledged* | | Net Amount
(Not Less
Than $0) | |
JPMorgan Chase Bank | | $ | 288,055 | | | $ | (288,055 | ) | | $ | — | | | $ | — | | |
First Eagle Overseas Fund
Counterparty | | Gross Amount
of Assets
Presented in
the Statement of
Assets and
Liabilities | | Derivatives
Available for
Offset | | Collateral
Received* | | Net Amount
(Not Less
Than $0) | |
Bank of New York Mellon | | $ | 11,934,434 | | | $ | — | | | $ | (11,934,434 | ) | | $ | — | | |
Goldman Sachs | | | 7,148,637 | | | | — | | | | (7,148,637 | ) | | | — | | |
JPMorgan Chase Bank | | | 5,068,826 | | | | (11,828 | ) | | | (5,056,998 | ) | | | — | | |
UBS AG | | | 1,199,818 | | | | — | | | | (1,199,818 | ) | | | — | | |
| | | $ | 25,351,715 | | | $ | (11,828 | ) | | $ | (25,339,887 | ) | | $ | — | | |
Counterparty | | Gross Amount
of Liabilities
Presented in
the Statement of
Assets and
Liabilities | | Derivatives
Available for
Offset | | Collateral
Pledged* | | Net Amount
(Not Less
Than $0) | |
JPMorgan Chase Bank | | $ | 11,828 | | | $ | (11,828 | ) | | $ | — | | | $ | — | | |
First Eagle Funds | Annual Report | October 31, 2023
204
Notes to Financial Statements
First Eagle Global Income Builder Fund
Counterparty | | Gross Amount
of Assets
Presented in
the Statement of
Assets and
Liabilities | | Derivatives
Available for
Offset | | Collateral
Received* | | Net Amount
(Not Less
Than $0) | |
Bank of New York Mellon | | $ | 543,923 | | | $ | — | | | $ | (478,179 | ) | | $ | 65,744 | | |
Goldman Sachs | | | 385,669 | | | | (9,302 | ) | | | (300,000 | ) | | | 76,367 | | |
JPMorgan Chase Bank | | | 235,848 | | | | — | | | | (206,669 | ) | | | 29,179 | | |
UBS AG | | | 39,946 | | | | — | | | | — | | | | 39,946 | | |
| | | $ | 1,205,386 | | | $ | (9,302 | ) | | $ | (984,848 | ) | | $ | 211,236 | | |
Counterparty | | Gross Amount
of Liabilities
Presented in
the Statement of
Assets and
Liabilities | | Derivatives
Available for
Offset | | Collateral
Pledged* | | Net Amount
(Not Less
Than $0) | |
Goldman Sachs | | $ | 9,302 | | | $ | (9,302 | ) | | $ | — | | | $ | — | | |
* The actual collateral received/pledged may be more than the amount reported due to over collateralization.
g) Options — In order to seek to produce incremental earnings or protect against declines in the value of portfolio securities, each Fund may write "covered" call options on portfolio securities. The Funds may also use options for speculative purposes, although they generally do not employ options for this purpose.
Options contracts are valued daily based upon the official closing price on the relevant exchange on which the option is traded. If there is no official closing price, the mean between the last bid and asked prices may be used. When an option is exercised, the proceeds on the sale of a written call option are adjusted by the amount of premium received or paid. When a written option expires, the Funds will realize a gain equal to the amount of the premium received. When the Funds enter into a closing purchase transaction, the Funds will realize a gain (or loss, if the cost of the closing purchase transaction exceeds the premium received when the option was written) without regard to any unrealized gain or loss on the underlying security and the liability related to such option is eliminated.
In general, a call option is covered if a Fund holds, on a share-for-share basis, either the underlying shares or a call on the same security as the call written where the exercise price of the call held is equal to or less than the exercise price of the call written (or greater than the exercise price of the call written if the difference is maintained by the Funds in cash, Treasury bills or other high grade short-term obligations earmarked with its custodian). One reason for writing options is to attempt to realize, through the receipt of premiums, a
First Eagle Funds | Annual Report | October 31, 2023
205
Notes to Financial Statements
greater return than would be realized on the securities alone. Another reason for writing options is to hedge against a moderate decline in the value of securities owned by a Fund in the case of a call option. If an increase occurs in the underlying security or stock index sufficient to result in the exercise of a call written by a Fund, it may be required to deliver securities or cash and may thereby forego some or all of the gain that otherwise may have been realized on the securities underlying the call option. This "opportunity cost" may be partially or wholly offset by the premium received for the covered call written by a Fund. The risk in writing a covered call option is that a Fund gives up the opportunity for profit if the market price of the underlying security increases and the option is exercised. A Fund also has the additional risk of not being able to enter into a closing transaction if a liquid secondary market does not exist.
A Fund may also write over-the-counter options where the completion of the obligation is dependent upon the credit standing of the counterparty.
Rule 18f-4 under the 1940 Act permits the Funds to enter into Derivatives Transactions (as defined below) and certain other transactions notwithstanding the restrictions on the issuance of "senior securities" under Section 18 of the 1940 Act. Section 18 of the 1940 Act, among other things, prohibits open-end funds, including the Funds, from issuing or selling any "senior security," other than borrowing from a bank (subject to a requirement to maintain 300% "asset coverage").
Under Rule 18f-4, "Derivatives Transactions" include the following: (1) any swap, security-based swap (including a contract for differences), futures contract, forward contract, option (excluding purchased options), any combination of the foregoing, or any similar instrument, under which a Fund is or may be required to make any payment or delivery of cash or other assets during the life of the instrument or at maturity or early termination, whether as margin or settlement payment or otherwise; (2) any short sale borrowing; (3) reverse repurchase agreements and similar financing transactions (e.g., recourse and nonrecourse tender option bonds, and borrowed bonds), if a Fund elects to treat these transactions as Derivatives Transactions under Rule 18f-4; and (4) when issued or forward-settling securities (e.g., firm and standby commitments, including to-be-announced ("TBA") commitments, and dollar rolls) and nonstandard settlement cycle securities, unless a Fund intends to physically settle the transaction and the transaction will settle within 35 days of its trade date.
Unless a fund is relying on the Limited Derivatives User Exception (as defined below), a fund must comply with Rule 18f-4 with respect to its Derivatives Transactions. Rule 18f-4, among other things, requires a fund to adopt and implement a comprehensive written derivatives risk management program ("DRMP") and comply with a relative or absolute limit on fund leverage risk calculated based on value-at-risk ("VaR"). The DRMP is administered by a
First Eagle Funds | Annual Report | October 31, 2023
206
Notes to Financial Statements
"derivatives risk manager," who is appointed by the Board, including a majority of Independent Trustees, and periodically reviews the DRMP and reports to the Board.
Rule 18f-4 provides an exception from the DRMP, VaR limit and certain other requirements if the Fund's "derivatives exposure" (as defined in Rule 18f-4) is limited to 10% of its net assets (as calculated in accordance with Rule 18f-4) and the Fund adopts and implements written policies and procedures reasonably designed to manage its derivatives risks (the "Limited Derivatives User Exception"). As of the date hereof, each Fund is relying on the Limited Derivatives User Exception.
As of October 31, 2023, portfolio securities valued at $54,778,094 were earmarked to cover collateral requirements for written options for First Eagle Global Income Builder Fund.
For the year ended October 31, 2023, the average monthly number of contracts outstanding for written options and purchased options held by the Funds were as follows:
| | | First Eagle
Global Income
Builder Fund | |
Options: | |
Average Number of Contracts — Written | | | 13,217 | | |
At October 31, 2023, the Funds had the following options grouped into appropriate risk categories illustrated below:
First Eagle Global Income Builder Fund
| | | | | | | Gain or (Loss)
Derivative Recognized
in Income | |
Risk Type | | Asset Derivative
Fair Value(1) | | Liability Derivative
Fair Value(2) | | Net Realized
Gains (Losses)(3) | | Change in
Appreciation
(Depreciation)(4) | |
Equity — Written options | | $ | — | | | $ | 327,757 | | | $ | 5,211,627 | | | $ | 1,930,458 | | |
(1) Statements of Assets and Liabilities location: Investments in securities of unaffiliated issuers.
(2) Statements of Assets and Liabilities location: Option contracts written, at value.
(3) Statements of Operations location: Net realized gains (losses) from expiration or closing of option contracts written.
(4) Statements of Operations location: Changes in unrealized appreciation (depreciation) of option contracts written.
First Eagle Funds | Annual Report | October 31, 2023
207
Notes to Financial Statements
h) Repurchase Agreements — The Funds may enter into repurchase agreement transactions with institutions that meet the Adviser's credit guidelines. Each repurchase agreement is valued at market. The Funds require that the collateral received in a repurchase agreement transaction be transferred to a custodian in a manner sufficient to enable the Funds to obtain collateral in the event of a counterparty default. If the counterparty defaults and the fair value of the collateral declines, realization of the collateral by the Funds may be delayed or limited.
i) Bank Loans — A Fund may invest in bank loans, which usually take the form of loan participations and assignments. Loan participations and assignments are agreements to make money available to U.S. or foreign corporations, partnerships or other business entities (the "Borrower") in a specified amount, at a specified rate and within a specified time. A loan is typically originated, negotiated and structured by a U.S. or foreign bank, insurance company or other financial institution (the "Agent") for a group of loan investors ("Loan Investors"). The Agent typically administers and enforces the loan on behalf of the other Loan Investors in the syndicate and may hold any collateral on behalf of the Loan Investors. Such loan participations and assignments are typically senior, secured and collateralized in nature. A Fund records an investment when the Borrower withdraws money and records interest as earned. A Fund generally has no right to enforce compliance with the terms of the loan agreement with the Borrower. As a result, a Fund assumes the credit risk of the Borrower, the selling participant and any intermediary between a Fund and the Borrower ("Intermediate Participants"). In the event that the Borrower, selling participant or Intermediate Participants becomes insolvent or enters into bankruptcy, each Fund may incur certain costs and delays in realizing payment or may suffer a loss of principal and/or interest.
j) Treasury Inflation-Protected Securities — The Funds may invest in Treasury Inflation-Protected Securities ("TIPS") which are specially structured bonds in which the principal amount is adjusted to keep pace with inflation. The principal value of TIPS will be adjusted upward or downward and any increase or decrease in the principal amount of TIPS will be included as interest income in the Statements of Operations, even though investors do not receive their principal until maturity. TIPS are subject to interest rate risk.
k) Restricted Securities — The Funds may invest in securities that are subject to legal or contractual restrictions on resale. These securities generally may be resold in transactions exempt from registration or to the public if the securities are registered. Disposal of these securities may involve time-consuming negotiations and expenses, and prompt sale at an acceptable price may be difficult. Information regarding restricted securities, if any, is included at the end of each Fund's Schedule of Investments.
l) New Accounting Pronouncements — In March 2020, the FASB issued Accounting Standard Update ("ASU") 2020-04, which provides optional guidance to ease the potential accounting burden associated with transitioning away from
First Eagle Funds | Annual Report | October 31, 2023
208
Notes to Financial Statements
the London Interbank Offered Rate and other reference rates that are expected to be discontinued. The ASU is effective immediately upon release of the update on March 12, 2020 through December 31, 2022. In December 2022, the FASB issued ASU 2022-06, "Reference Rate Reform (Topic 949)" which extends the effective period of ASU 2020-04 through December 31, 2024. There is no material impact to the financial statements and related disclosures.
In March 2022, the FASB issued ASU 2022-02, "Financial Instruments Credit Losses (Topic 326)", which is intended to address issues identified during the post implementation review of ASU 2016-3, "Financial Instruments Credit Losses (Topic 326): Measurement of Credit Losses on Financial Instruments". The amendment, among other things, eliminates the accounting guidance for troubled debt restructurings by creditors in Subtopic 310-40, "Receivables Troubled Debt Restructurings by Creditors", while enhancing disclosure requirements for certain loan refinancings and restructurings by creditors when a borrower is experiencing financial difficulty. The new guidance is effective for interim and annual periods beginning after December 15, 2022. There is no material impact to the financial statements and related disclosure.
In June 2022, FASB issued Accounting Standards Update ("ASU") 2022-03, Fair Value Measurement (Topic 820) — Fair Value Measurement of Equity Securities Subject to Contractual Sale Restrictions. The amendments in the ASU clarify that a contractual restriction on the sale of an equity security is not considered part of the unit of account of the equity security and, therefore, should not be considered in measuring fair value. The ASU is effective for interim and annual reporting periods beginning after December 15, 2023, with the option of early adoption. Management is currently evaluating the impact, if any, of applying this new standard.
m) United States Income Taxes — No provision has been made for U.S. federal income taxes since it is the intention of each Fund to distribute to shareholders all taxable net investment income and net realized gains on investments, if any, within the allowable time limit, and to comply with the provisions of Subchapter M of the Internal Revenue Code applicable to the regulated investment company. The Funds declare and pay such income and capital gains on an annual basis except for the First Eagle High Income Fund and the First Eagle Global Income Builder Fund which declare income daily and pay monthly, and First Eagle Rising Dividend Fund which distributes income on a quarterly basis.
The Funds adopted provisions surrounding income taxes, which require the tax effects of certain tax positions to be recognized. These tax positions must meet a "more likely than not" standard that, based on their technical merits, have a more than 50% likelihood of being sustained upon examination. Management of the Trust has analyzed the Funds' tax positions taken on federal and state income tax returns for all open tax years (the current and the prior three tax years) and has concluded that no provision for income tax is required in the Funds' financial statements.
First Eagle Funds | Annual Report | October 31, 2023
209
Notes to Financial Statements
At October 31, 2023, the components of accumulated earnings on a tax basis were as follows:
| | Undistributed
Net Investment | | Undistributed
Net Realized | | Net
Unrealized
Appreciation | | Capital Loss
Carryforward | |
| | Income | | Gains | | (Depreciation) | | Short-Term | | Long-Term | |
First Eagle Global Fund | | $ | 555,949,324 | | | $ | 1,080,912,973 | | | | $11,402,833,902 | | | $ | — | | | $ | — | | |
First Eagle Overseas
Fund | | | 209,717,335 | | | | 53,470,450 | | | | 1,983,054,439 | | | | — | | | | — | | |
First Eagle U.S. Value
Fund | | | 12,842,864 | | | | 61,271,968 | | | | 394,344,826 | | | | — | | | | — | | |
First Eagle Gold Fund | | | 18,732,396 | | | | — | | | | 414,729,577 | | | | 7,071,360 | | | | 601,143,629 | | |
First Eagle Global
Income Builder Fund | | | — | | | | — | | | | 42,161,342 | | | | — | | | | — | | |
First Eagle High
Income Fund | | | 570,621 | | | | — | | | | (13,518,072 | ) | | | 7,963,816 | | | | 117,013,261 | | |
First Eagle Rising
Dividend Fund | | | 1,585,492 | | | | 25,773,332 | | | | 35,963,532 | | | | — | | | | — | | |
First Eagle Small Cap
Opportunity Fund | | | 6,951,149 | | | | — | | | | (113,555,132 | ) | | | 43,948,683 | | | | 9,089,069 | | |
First Eagle U.S. Smid
Cap Opportunity Fund | | | 75,046 | | | | — | | | | (835,091 | ) | | | 76,810 | | | | — | | |
First Eagle Global Real
Assets Fund | | | 195,417 | | | | — | | | | (477,052 | ) | | | 37,066 | | | | — | | |
The components of distributable earnings' differences between book basis and tax basis are primarily due to the treatment of passive foreign investment companies, distributions from real estate investment trusts, the treatment of forward foreign currencies contracts, straddle loss deferral, foreign repatriated earnings for First Eagle Overseas Fund, investment in partnerships, global intangible low-taxed income from investment in certain foreign corporations for First Eagle Overseas Fund, wash sales and amortization on certain callable bond investments for First Eagle Global Income Builder and First Eagle High Income Fund.
Under the Regulated Investment Company Modernization Act of 2010 (the "Act"), net capital losses recognized by the Funds after December 31, 2010, may get carried forward indefinitely, and retain their character as short-term and/or long-term losses. For the current year, the First Eagle Gold Fund and First Eagle Global Real Assets Fund utilized $22,155,903 and $29,642 in net capital loss carryforward, respectively.
First Eagle Funds | Annual Report | October 31, 2023
210
Notes to Financial Statements
Late year ordinary losses incurred after December 31st and within the taxable year are deemed to arise on the first business day of the Funds' next taxable year. For the year ended October 31, 2023, none of the Funds had late year loss deferrals.
n) Reclassification of Capital Accounts — As a result of certain differences in the computation of net investment income and net realized capital gains under federal income tax rules and regulations versus GAAP, a reclassification has been made on the Statements of Assets and Liabilities to increase (decrease) distributable earnings and capital surplus for the Funds as follows:
| | Undistributed Net
Investment Income
(Loss) | | Undistributed Net
Realized Gains
(Losses) | | Capital Surplus | |
First Eagle Global Fund | | $ | (34,164,903 | ) | | $ | (36,967,798 | ) | | $ | 71,132,701 | | |
First Eagle Overseas Fund | | | 6,318,357 | | | | (14,792,214 | ) | | | 8,473,857 | | |
First Eagle U.S. Value Fund | | | (710,736 | ) | | | (2,867,611 | ) | | | 3,578,347 | | |
First Eagle Gold Fund | | | 548,627 | | | | 5,444,438 | | | | (5,993,065 | ) | |
First Eagle Global Income Builder Fund | | | 1,416,613 | | | | (2,573,886 | ) | | | 1,157,273 | | |
First Eagle High Income Fund | | | (36,384 | ) | | | 46,732 | | | | (10,348 | ) | |
First Eagle Rising Dividend Fund | | | (252,130 | ) | | | 109,553 | | | | 142,577 | | |
First Eagle Small Cap Opportunity Fund | | | (282,923 | ) | | | 282,923 | | | | — | | |
First Eagle U.S. Smid Cap Opportunity Fund | | | 14 | | | | — | | | | (14 | ) | |
First Eagle Global Real Assets Fund | | | 14,948 | | | | 6,931 | | | | (21,879 | ) | |
The primary permanent differences causing such reclassification include the tax treatment of currency gains and losses, distributions paid in connection with the redemption of Fund shares, adjustments on certain callable bonds, investments in passive foreign investment companies and differing book and tax treatment of transactions with the Subsidiary.
At the year ended October 31, 2023, the First Eagle Global Cayman Fund, Ltd., First Eagle Overseas Cayman Fund, Ltd., First Eagle Gold Cayman Fund Ltd., and First Eagle U.S. Value Cayman Fund, Ltd. had unrealized gains for tax purposes. Any unrealized losses to be recognized for tax purposes in the future can only be utilized by the Funds to the extent of tax basis realized gains in the Subsidiaries in the same year. Given the uncertainty of their future use, tax losses have been reclassified to Capital surplus.
o) Distribution to Shareholders — Distributions to shareholders during the fiscal year ended October 31, 2023, which are determined in accordance with income tax regulations, are recorded on ex-dividend date.
First Eagle Funds | Annual Report | October 31, 2023
211
Notes to Financial Statements
| | Ordinary Income | | Long Term Capital Gains | |
| | 2023 | | 2022 | | 2023 | | 2022 | |
First Eagle Global Fund | | $ | 119,665,749 | | | $ | 996,491,550 | | | $ | 1,765,986,612 | | | $ | 1,999,867,824 | | |
First Eagle Overseas Fund | | | 38,362,057 | | | | 521,499,594 | | | | 399,260,258 | | | | 291,931,553 | | |
First Eagle U.S. Value Fund | | | 7,439,013 | | | | 11,950,931 | | | | 82,244,789 | | | | 97,095,054 | | |
First Eagle Gold Fund | | | — | | | | 23,300,651 | | | | — | | | | — | | |
First Eagle Global Income
Builder Fund | | | 39,839,758 | | | | 35,149,999 | | | | 24,615,575 | | | | 50,851,122 | | |
First Eagle High Income Fund | | | 9,170,820 | | | | 8,954,667 | | | | — | | | | — | | |
First Eagle Rising Dividend
Fund | | | 4,688,085 | | | | 22,690,363 | | | | 8,670,694 | | | | 46,461,070 | | |
First Eagle Small Cap
Opportunity Fund | | | 608,113 | | | | — | | | | — | | | | — | | |
First Eagle U.S. Smid Cap
Opportunity Fund | | | 3,618 | | | | — | | | | — | | | | — | | |
First Eagle Global Real Assets
Fund | | | 179,759 | | | | — | | | | — | | | | — | | |
p) Class Accounting — Investment income, common expenses and realized/unrealized gain or loss on investments are allocated to the various classes of the Fund on the basis of daily net assets of each class. Fees relating to a specific class are charged directly to that class.
q) Use of Estimates — The preparation of financial statements in conformity with GAAP requires management to make estimates and assumptions that affect the reported amounts of assets and liabilities at the date of the financial statements and the reported amounts of revenues and expenses during the reporting period. Actual results could differ from those estimates.
r) Foreign Taxes — The Funds may be subject to foreign taxes on income, and gains on investments or currency purchases/repatriation, a portion of which may be recoverable. The Funds will accrue such taxes and recoveries as applicable, based upon their current interpretation of tax rules and regulations that exist in the markets in which they invest.
First Eagle Funds | Annual Report | October 31, 2023
212
Notes to Financial Statements
Note 2 — Investment Advisory, Custody and Administration Agreements; Transactions with Related Persons
For its services, the Adviser receives, pursuant to an Investment Advisory Agreement between the Funds and the Adviser (the "Advisory Agreement"), an annual advisory fee as follows:
Fund | | Management Fee
(% of Average Daily Net Assets) | |
First Eagle Global Fund | | | 0.75 | % | |
First Eagle Overseas Fund | | | 0.75 | | |
First Eagle U.S. Value Fund | | | 0.75 | (1) | |
First Eagle Gold Fund | | | 0.75 | | |
First Eagle Global Income Builder Fund | | | 0.75 | | |
First Eagle High Income Fund | | | 0.45 | (2) | |
First Eagle Rising Dividend Fund | | | 0.50 | (3) | |
First Eagle Small Cap Opportunity Fund | | | 0.85 | (4) | |
First Eagle U.S. Smid Cap Opportunity Fund | | | 0.75 | (5) | |
First Eagle Global Real Assets Fund | | | 0.65 | (6) | |
(1) The Adviser has agreed to waive First Eagle U.S. Value Fund's management fee at an annual rate in the amount of 0.05% of the average daily value of the Fund's net assets for the period through February 29, 2024. This waiver has the effect of reducing the management fee shown in the table for the term of the waiver from 0.75% to 0.70%.
(2) Effective January 1, 2023 the Adviser has contractually agreed to waive and/or reimburse certain fees and expenses of Classes A, C, I, R3, R4, R5 and R6 for First Eagle High Income Fund so that the total annual operating expenses (excluding interest, taxes, brokerage commissions, acquired fund fees and expenses, dividend and interest expenses relating to short sales, and extraordinary expenses, if any) ("annual operating expenses") of each class are limited to 0.94%, 1.69%, 0.69%, 1.04%, 0.79%, 0.69% and 0.69% of average net assets, respectively. Each of these undertakings lasts until February 29, 2024 and may not be terminated during its term without the consent of the Board. First Eagle High Income Fund has agreed that each of Classes A, C, I, R3, R4, R5 and R6 will repay the Adviser for fees and expenses waived or reimbursed for the class provided that repayment does not cause annual operating expenses (after the repayment is taken into account) to exceed the lesser of: (1) 0.94%, 1.69%, 0.69%, 1.04%, 0.79%, 0.69% and 0.69% of the class' average net assets, respectively; or (2) if applicable, the then-current expense limitations. Any such repayment must be made within three years after the year in which the Adviser incurred the expense. For the year ended October 31, 2023, the Adviser reimbursed $257,606 in expenses which are included under Expense waiver in the Statement of Operations. As of October 31, 2023, the Fund has $25,128 receivable from the Adviser for reimbursement of expenses, which are included under due from adviser on its Statement of Assets and Liabilities.
First Eagle Funds | Annual Report | October 31, 2023
213
Notes to Financial Statements
For the year ended October 31, 2023, the amounts available for potential future repayment by the Adviser and the expiration schedule are as follows:
| | | | Potential Recoupment
Amounts Expiring
October 31, | |
| | Total Eligible
for Recoupment | | 2026 | |
Class A | | $ | 102,116 | | | $ | 102,116 | | |
Class C | | | 8,380 | | | | 8,380 | | |
Class I | | | 142,781 | | | | 142,781 | | |
Class R3 | | | 848 | | | | 848 | | |
Class R4 | | | 74 | | | | 74 | | |
Class R5 | | | 21 | | | | 21 | | |
Class R6 | | | 3,386 | | | | 3,386 | | |
Total | | $ | 257,606 | | | $ | 257,606 | | |
(3) The Adviser has contractually agreed to waive and/or reimburse certain fees and expenses of Classes A, C, I, R3, R4, R5 and R6 for First Eagle Rising Dividend Fund so that the total annual operating expenses (excluding interest, taxes, brokerage commissions, acquired fund fees and expenses, dividend and interest expenses relating to short sales, and extraordinary expenses, if any) ("annual operating expenses") of each class are limited to 0.90%, 1.65%, 0.65%, 1.00%, 0.75%, 0.65% and 0.65% of average net assets, respectively. Each of these undertakings lasts until February 29, 2024 and may not be terminated during its term without the consent of the Board. First Eagle Rising Dividend Fund has agreed that each of Classes A, C, I, R3, R4, R5 and R6 will repay the Adviser for fees and expenses waived or reimbursed for the class provided that repayment does not cause annual operating expenses (after the repayment is taken into account) to exceed the lesser of: (1) 0.90%, 1.65%, 0.65%, 1.00%, 0.75%, 0.65% and 0.65% of the class' average net assets, respectively; or (2) if applicable, the then-current expense limitations. Any such repayment must be made within three years after the year in which the Adviser incurred the expense. For the year ended October 31, 2023, the Adviser reimbursed $559,347 in expenses which are included under Expense waiver in the Statement of Operations. As of October 31, 2023, the Fund has $73,401 receivable from the Adviser for reimbursement of expenses, which are included under due from adviser on its Statement of Assets and Liabilities.
For the year ended October 31, 2023, the amounts available for potential future repayment by the Adviser and the expiration schedule are as follows:
| | | | Potential Recoupment
Amounts Expiring
October 31, | |
| | Total Eligible
for Recoupment | | 2024 | | 2025 | | 2026 | |
Class A | | $ | 1,051,419 | | | $ | 300,262 | | | $ | 305,896 | | | $ | 445,261 | | |
Class C | | | 135,391 | | | | 77,110 | | | | 41,567 | | | | 16,714 | | |
Class I | | | 252,407 | | | | 83,807 | | | | 75,472 | | | | 93,128 | | |
Class R3 | | | 268 | | | | 74 | | | | 71 | | | | 123 | | |
First Eagle Funds | Annual Report | October 31, 2023
214
Notes to Financial Statements
| | | | Potential Recoupment
Amounts Expiring
October 31, | |
| | Total Eligible
for Recoupment | | 2024 | | 2025 | | 2026 | |
Class R4 | | $ | 188 | | | $ | 39 | | | $ | 50 | | | $ | 99 | | |
Class R5 | | | 189 | | | | 83 | | | | 74 | | | | 32 | | |
Class R6 | | | 5,758 | | | | 1,244 | | | | 524 | | | | 3,990 | | |
Total | | $ | 1,445,620 | | | $ | 462,619 | | | $ | 423,654 | | | $ | 559,347 | | |
(4) The Adviser has contractually agreed to waive and/or reimburse certain fees and expenses of Classes A, I and R6 for First Eagle Small Cap Opportunity Fund so that the total annual operating expenses (excluding interest, taxes, brokerage commissions, acquired fund fees and expenses, dividend and interest expenses relating to short sales, and extraordinary expenses, if any) ("annual operating expenses") of each class are limited to 1.25%, 1.00% and 1.00% of average net assets, respectively. Each of these undertakings lasts until February 29, 2024 and may not be terminated during its term without the consent of the Board. The Fund has agreed that each of Classes A, I and R6 will repay the Adviser for fees and expenses waived or reimbursed for the class provided that repayment does not cause annual operating expenses (after the repayment is taken into account) to exceed the lesser of: (1) 1.25%, 1.00% and 1.00% of the class' average net assets, respectively; or (2) if applicable, the then current expense limitations. Any such repayment must be made within three years after the year in which the Adviser incurred the expense. For the year ended October 31, 2023, the Adviser reimbursed $869,382 in expenses which are included under Expense waiver in the Statement of Operations. As of October 31, 2023, the Fund has $257,449 receivable from the Adviser for reimbursement of expenses, which are included under due from adviser on its Statement of Assets and Liabilities.
For the year ended October 31, 2023, the amounts available for potential future repayment by the Adviser and the expiration schedule are as follows:
| | | | Potential Recoupment
Amounts Expiring
October 31, | |
| | Total Eligible
for Recoupment | | 2024 | | 2025 | | 2026 | |
Class A | | $ | 82,289 | | | $ | 11,812 | | | $ | 35,559 | | | $ | 34,918 | | |
Class I | | | 1,471,208 | | | | 177,007 | | | | 467,141 | | | | 827,060 | | |
Class R6 | | | 25,531 | | | | 3,249 | | | | 14,878 | | | | 7,404 | | |
Total | | $ | 1,579,028 | | | $ | 192,068 | | | $ | 517,578 | | | $ | 869,382 | | |
(5) The Adviser has contractually agreed to waive and/or reimburse certain fees and expenses of Classes A, I, and R6 for First Eagle U.S. Smid Cap Opportunity Fund so that the total annual operating expenses (excluding interest, taxes, brokerage commissions, acquired fund fees and expenses, dividend and interest expenses relating to short sales, and extraordinary expenses, if any) ("annual operating expenses") of each class are limited to 1.20%, 0.95% and 0.95% of average net assets, respectively. Each of these undertakings lasts until February 29, 2024 and may not be terminated during its term without the consent of the Board. The Fund has agreed that each of Classes A, I and R6 will repay the Adviser for fees and expenses waived or reimbursed for the class provided that repayment does not cause annual operating expenses (after the repayment is taken into account) to exceed the lesser of: (1) 1.20%, 0.90% and 0.95% of the class' average net assets, respectively; or (2) if
First Eagle Funds | Annual Report | October 31, 2023
215
Notes to Financial Statements
applicable, the then current expense limitations. Any such repayment must be made within three years after the year in which the Adviser incurred the expense. For the year ended October 31, 2023, the Adviser reimbursed $355,159 in expenses which are included under Expense waiver in the Statement of Operations. As of October 31, 2023, the Fund has $-receivable from the Adviser for reimbursement of expenses, which are included under due from adviser on its Statement of Assets and Liabilities.
For the year ended October 31, 2023, the amounts available for potential future repayment by the Adviser and the expiration schedule are as follows:
| | | | Potential Recoupment
Amounts Expiring
October 31, | |
| | Total Eligible
for Recoupment | | 2025 | | 2026 | |
Class A | | $ | 8,895 | | | $ | 5,340 | | | $ | 3,555 | | |
Class I | | | 446,832 | | | | 98,971 | | | | 347,861 | | |
Class R6 | | | 8,075 | | | | 4,332 | | | | 3,743 | | |
Total | | $ | 463,802 | | | $ | 108,643 | | | $ | 355,159 | | |
(6) Classes A, I, and R6 for First Eagle Global Real Assets Fund so that the total annual operating expenses (excluding interest, taxes, brokerage commissions, acquired fund fees and expenses, dividend and interest expenses relating to short sales, and extraordinary expenses, if any) ("annual operating expenses") of each class are limited to 1.10%, 0.85% and 0.85% of average net assets, respectively. Each of these undertakings lasts until February 29, 2024 and may not be terminated during its term without the consent of the Board. The Fund has agreed that each of Classes A, I and R6 will repay the Adviser for fees and expenses waived or reimbursed for the class provided that repayment does not cause annual operating expenses (after the repayment is taken into account) to exceed the lesser of: (1) 1.10%, 0.85% and 0.85% of the class' average net assets, respectively; or (2) if applicable, the then current expense limitations. Any such repayment must be made within three years after the year in which the Adviser incurred the expense. For the year ended October 31, 2023, the Adviser reimbursed $446,269 in expenses which are included under Expense waiver in the Consolidated Statement of Operations. As of October 31, 2023, the Fund has $42,440 receivable from the Adviser for reimbursement of expenses, which are included under due from adviser on its Consolidated Statement of Assets and Liabilities.
For the year ended October 31, 2023, the amounts available for potential future repayment by the Adviser and the expiration schedule are as follows:
| | | | Potential Recoupment
Amounts Expiring
October 31, | |
| | Total Eligible
for Recoupment | | 2025 | | 2026 | |
Class A | | $ | 104,304 | | | $ | 40,189 | | | $ | 64,115 | | |
Class I | | | 601,944 | | | | 262,027 | | | | 339,917 | | |
Class R6 | | | 80,319 | | | | 38,082 | | | | 42,237 | | |
Total | | $ | 786,567 | | | $ | 340,298 | | | $ | 446,269 | | |
First Eagle Funds | Annual Report | October 31, 2023
216
Notes to Financial Statements
The Adviser also performs certain administrative, accounting, operations, compliance and other services on behalf of the Funds, and in accordance with its agreement with the Adviser, the Funds (except for First Eagle Global Income Builder Fund and First Eagle High Income Fund, which pay the fee described in the next paragraphs) reimburse the Adviser for costs (including personnel and other costs) related to those services. These reimbursements may not exceed an annual rate of 0.05% of a Fund's average daily net assets.
Pursuant to Administrative Services Agreements between each of First Eagle Global Income Builder Fund and First Eagle High Income Fund, and the Adviser, each pay the Adviser a monthly administration fee that is accrued daily at an annual rate of 0.05% of the Fund's average daily net assets.
For the year ended October 31, 2023, The Adviser waived and the Funds had due from Adviser amounts shown below:
| | | Adviser Waived Amount | | Due From Adviser | |
First Eagle Global Fund | | $ | — | | | $ | — | | |
First Eagle Overseas Fund | | | — | | | | — | | |
First Eagle U.S. Value Fund | | | — | | | | — | | |
First Eagle Gold Fund | | | — | | | | — | | |
First Eagle Global
Income Builder Fund | | | — | | | | — | | |
First Eagle High Income Fund | | | — | | | | — | | |
First Eagle Rising Dividend Fund | | | 53,122 | | | | — | | |
First Eagle Small Cap Opportunity Fund | | | — | | | | — | | |
First Eagle U.S. Smid Cap Opportunity Fund | | | 10,482 | | | | 5,268 | | |
First Eagle Global Real Assets Fund | | | 83,633 | | | | 29,378 | | |
The Funds have entered into a custody agreement with J.P. Morgan Chase Bank, N.A. ("JPM"). The custody agreement provides for an annual fee based on the amount of assets under custody plus transaction charges. JPM serves as custodian of the Funds' portfolio securities and other assets. JPM has directly entered into sub-custodial agreements to maintain the custody of gold and silver bullion in the Funds. Under the terms of the custody agreement between the Funds and JPM, JPM maintains and deposits in separate accounts, cash, securities and other assets of the Funds. JPM is also required, upon the order of the Funds, to deliver securities held by JPM and the sub-custodian, and to make payments for securities purchased by the Funds. JPM has also entered into sub-custodian agreements with a number of foreign banks and clearing agencies, pursuant to which portfolio securities purchased outside the United States are maintained in the custody of these entities.
First Eagle Funds | Annual Report | October 31, 2023
217
Notes to Financial Statements
The Funds have also entered into an agreement for administrative services with JPM, pursuant to which JPM provides certain financial reporting and other administrative services. JPM, as the Funds' administrator, receives annual fees separate from and in addition to the fees it receives for its services as the Funds' custodian.
FEF Distributors, LLC, a wholly owned subsidiary of the Adviser, serves as the Funds' principal underwriter. For the year ended October 31, 2023 FEF Distributors, LLC realized $332,699, $16,865, $14,236, $59,180, $19,695, $3,305, $3,872, $29,291, $91 and $189 pertaining to the sales of shares of First Eagle Global Fund, First Eagle Overseas Fund, First Eagle U.S. Value Fund, First Eagle Gold Fund, First Eagle Global Income Builder Fund, First Eagle High Income Fund, First Eagle Rising Dividend Fund, First Eagle Small Cap Opportunity Fund, First Eagle U.S. Smid Cap Opportunity Fund and First Eagle Global Real Assets Fund, respectively. For the year ended October 31, 2023, FEF Distributors, LLC realized $72,736, $1,954, $454, $12,433, $2,982, $656 and $119 CDSC pertaining to the redemption of shares of First Eagle Global Fund, First Eagle Overseas Fund, First Eagle U.S. Value Fund, First Eagle Gold Fund, First Eagle Global Income Builder Fund, First Eagle High Income Fund and, First Eagle Rising Dividend Fund, respectively; and the adviser realized $58,465, $196,034, $9,234, $17,914, $58,704, $8,159, $1,737 and $2,778 CDSC pertaining to the redemption of shares of First Eagle Global Fund, First Eagle Overseas Fund, First Eagle U.S. Value Fund, First Eagle Gold Fund, First Eagle Global Income Builder Fund, First Eagle High Income Fund, First Eagle Rising Dividend Fund and First Eagle Small Cap Opportunity Fund, respectively.
The Trust adopted a Trustee Deferred Compensation Plan (the "Plan"), which allows the Independent Trustees to defer the receipt of all or a portion of compensation related to performance of their duties as a Trustee. The deferred fees are invested in various First Eagle Funds until distribution in accordance with the Trustee Deferred Compensation Plan. As of October 31, 2023, balances to the Plan are included in the fees payable to the Trustees on the Statements of Assets and Liabilities.
Note 3 — Plans of Distribution
Under the terms of the Distribution Plans and Agreements ("the Plans") with FEF Distributors, LLC (the "Distributor"), pursuant to the provisions of Rule 12b-1 under the 1940 Act, the First Eagle Global Fund, First Eagle Overseas Fund, First Eagle U.S. Value Fund, First Eagle Gold Fund, First Eagle Global Income Builder Fund, First Eagle High Income Fund, First Eagle Rising Dividend Fund, First Eagle Small Cap Opportunity Fund, First Eagle U.S. Smid Cap Opportunity Fund and First Eagle Global Real Assets Fund pay the Distributor monthly a distribution and/or service fee with respect to Class A, Class C, Class R3 and Class R4 shares based on each Fund's average daily net assets as shown in the table below. Under the Plans, the Distributor is obligated to use the amounts received under the Plans for, among other things, payments to qualifying dealers for their assistance in the distribution
First Eagle Funds | Annual Report | October 31, 2023
218
Notes to Financial Statements
of a Fund's shares and the provision of shareholder services and for other expenses such as advertising costs and the payment for the printing and distribution of prospectuses to prospective investors.
Fund | | Class A | | Class C | | Class R3 | | Class R4 | |
First Eagle Global Fund | | | 0.25 | % | | | 1.00 | % | | | 0.35 | % | | | 0.10 | % | |
First Eagle Overseas Fund | | | 0.25 | % | | | 1.00 | % | | | 0.35 | % | | | 0.10 | % | |
First Eagle U.S. Value Fund | | | 0.25 | % | | | 1.00 | % | | | 0.35 | % | | | 0.10 | % | |
First Eagle Gold Fund | | | 0.25 | % | | | 1.00 | % | | | 0.35 | % | | | 0.10 | % | |
First Eagle Global Income Builder Fund | | | 0.25 | % | | | 1.00 | % | | | 0.35 | % | | | 0.10 | % | |
First Eagle High Income Fund | | | 0.25 | % | | | 1.00 | % | | | 0.35 | % | | | 0.10 | % | |
First Eagle Rising Dividend Fund | | | 0.25 | % | | | 1.00 | % | | | 0.35 | % | | | 0.10 | % | |
First Eagle Small Cap Opportunity Fund | | | 0.25 | % | | | n/a | | | | n/a | | | | n/a | | |
First Eagle U.S. Smid Cap Opportunity Fund | | | 0.25 | % | | | n/a | | | | n/a | | | | n/a | | |
First Eagle Global Real Assets Fund | | | 0.25 | % | | | n/a | | | | n/a | | | | n/a | | |
The Distributor bears distribution costs of a Fund to the extent they exceed payments received under the Plan. For the year ended October 31, 2023, the distribution fees incurred by the Funds are disclosed in the Statements of Operations.
The Service fee covers expenses incurred by the Distributor for providing shareholder liaison services, including assistance with subscriptions, redemptions and other shareholder questions. For the year ended October 31, 2023, the services fees incurred by the Funds are disclosed in the Statements of Operations.
Note 4 — Purchases and Sales of Securities
For the year ended October 31, 2023, purchases and proceeds from sales of investments, excluding short-term securities, were as follows:
| Fund | | Purchases
excluding
U.S. Government
Securities | | Sales and
Maturities
excluding
U.S. Government
Securities | | Purchases of
U.S. Government
Securities | | Sales and
Maturities of
U.S. Government
Securities | |
First Eagle Global Fund | | $ | 2,559,025,640 | | | $ | 4,134,668,144 | | | $ | — | | | $ | — | | |
First Eagle Overseas Fund | | | 464,312,718 | | | | 1,020,185,611 | | | | — | | | | — | | |
First Eagle U.S. Value Fund | | | 69,630,287 | | | | 162,692,683 | | | | — | | | | — | | |
First Eagle Gold Fund | | | 338,272,613 | | | | 353,590,381 | | | | — | | | | — | | |
First Eagle Global Income
Builder Fund | | | 326,948,487 | | | | 291,343,384 | | | | 144,634,365 | | | | 31,422,754 | | |
First Eagle High Income Fund | | | 38,714,415 | | | | 75,966,370 | | | | — | | | | — | | |
First Eagle Rising
Dividend Fund | | | 114,366,387 | | | | 159,661,442 | | | | — | | | | — | | |
First Eagle Funds | Annual Report | October 31, 2023
219
Notes to Financial Statements
| Fund | | Purchases
excluding
U.S. Government
Securities | | Sales and
Maturities
excluding
U.S. Government
Securities | | Purchases of
U.S. Government
Securities | | Sales and
Maturities of
U.S. Government
Securities | |
First Eagle Small Cap
Opportunity Fund | | $ | 1,184,746,211 | | | $ | 380,941,299 | | | $ | — | | | $ | — | | |
First Eagle U.S. Smid Cap
Opportunity Fund | | | 31,523,826 | | | | 5,260,407 | | | | — | | | | — | | |
First Eagle Global Real
Assets Fund | | | 6,135,401 | | | | 4,211,497 | | | | 27,699 | | | | 119,327 | | |
Note 5 — Line of Credit
On June 26, 2023, the Funds renewed a $200 million committed, unsecured line of credit ("Credit Facility") with JPM for the First Eagle Funds and First Eagle Variable Funds to be utilized for temporarily financing the purchase or sale of securities for prompt delivery in the ordinary course of business or for temporarily financing the redemption of shares of each Fund at the request of shareholders and other temporary or emergency purposes with a termination date of June 25, 2024. Under the Credit Facility arrangement, each Fund has agreed to pay a per annum rate of interest for borrowings generally based on 1.00% plus the higher of Daily Simple Secured Overnight Financing Rate plus a ten basis point credit spread adjustment, Overnight Bank Funding Rate or Effective Federal Funds Rate and a commitment fee of 0.20% per annum on the unused portion of the Credit Facility. A portion of the commitment fees related to the Credit Facility are paid by the Funds and are included in other expenses in the Statements of Operations. During the period, the Funds had no borrowings under the agreement.
Note 6 — Indemnification and Investment Risk
In the normal course of business, the Funds enter into contracts that contain a variety of representations which provide general indemnifications. Each Fund's maximum exposure under these arrangements is unknown, as this would involve future claims that may be made against each Fund that have not yet occurred. However, based on experience, the Funds expect the risk of loss to be remote. The Funds may have elements of risk not typically associated with investments in the United States due to their investments in foreign countries or regions. Such foreign investments may subject the Funds to additional risks resulting from political or economic conditions in such countries or regions and the possible imposition of adverse governmental laws or currency exchange restrictions could cause the securities and their markets to be less liquid and their prices to be more volatile than those of comparable U.S. securities. The securities markets in many emerging-market countries are substantially smaller, less developed, less liquid and more volatile than the securities markets of developed countries.
First Eagle Funds | Annual Report | October 31, 2023
220
Notes to Financial Statements
The First Eagle High Income Fund and First Eagle Global Income Builder Fund invest in high yield securities which may be subject to greater levels of interest rate, credit and liquidity risk than investment grade securities. These high yield securities may be considered speculative with respect to the issuer's continuing ability to make principal and interest payments and may be subject to significant price fluctuations.
The Funds are subject to interest rate and credit risk. The value of debt securities may decline as interest rates increase. The Funds could lose money if the issuer of a fixed income security is unable to pay interest or repay principal when it is due. The ability of the issuers of debt to meet their obligations may be affected by the economic and political developments in a specific industry or region.
The Funds enter into derivatives which may represent off-balance sheet risk. Off-balance sheet risk exists when the maximum potential loss on a particular investment is greater than the value of such investment as reflected in the Statements of Assets and Liabilities.
Note 7 — Redemption In-Kind Transactions
The redemption in-kind policy for all of the Funds reserves the right of the Funds to pay redemptions in-kind (i.e., payments in the form of marketable securities or, as needed, other traded assets, rather than cash) if the redemption request is large enough to affect a Fund's operations (for example, if it represents more than $250,000 or 1% of the Fund's assets). When receiving assets distributed in-kind, the recipient will bear applicable commissions or other costs on their sale. There were no redemptions in-kind during the year ended October 31, 2023.
Note 8 — Subsequent Events
For First Eagle High Income Fund, the Adviser will implement an additional expense limitation arrangement through at least February 28, 2025. The Adviser also has waived the Fund's management fees in full from November 1, 2023 through April 30, 2024, with the result that no management fees will be paid by the Fund during that period. Pursuant to the new expense limitation terms, which were effective November 1, 2023, the Adviser has contractually agreed to waive and/or reimburse certain fees and expenses of Classes A, C, I, R3, R4, R5 and R6 so that the total annual operating expenses (excluding interest and related expense and fees paid on Fund borrowings and/or interest and related expenses from inverse floaters, taxes, brokerage commissions, acquired fund fees and expenses, dividend and interest expenses relating to short sales, and extraordinary expenses, if any) ("annual operating expenses") of each class are limited to 0.85%, 1.60%, 0.60%, 0.95%, 0.70%, 0.60% and 0.60% of average net assets, respectively. Each of these undertakings lasts until February 28, 2025 and may not be terminated during its term without the consent of the Board. The Fund has agreed that each of Classes A, C, I, R3, R4, R5 and R6 will repay the Adviser for fees and expenses waived or
First Eagle Funds | Annual Report | October 31, 2023
221
Notes to Financial Statements
reimbursed for the class provided that repayment does not cause annual operating expenses (after the repayment is taken into account) to exceed the lesser of: (1) 0.85%, 1.60%, 0.60%, 0.95%, 0.70%, 0.60% and 0.60% of the class' average net assets, respectively; or (2) if applicable, the then-current expense limitations. Any such repayment must be made within three years after the year in which the Adviser incurred the expense. Any waiver that is directly attributable to the management fee for the period from November 1, 2023 through April 30, 2024 will not be repaid to the Adviser.
Effective on or about December 27, 2023, the First Eagle High Income Fund is expected to change its name to the First Eagle High Yield Municipal Fund, and to make corresponding changes to the Fund's 80% investment policy, and principal investment strategy, and include an additional fundamental investment restriction.
Effective on or about February 28, 2024, all of the issued and outstanding Class R3, R4 and R5 shares of the applicable Funds will be converted into Class R6 shares of the same Fund. No sales charge (load), fee or other charge will be imposed on the conversion. The conversions are not expected to be a taxable event for federal income tax purposes and should not result in recognition of gain or loss by converting shareholders. The conversions of Class R3, R4 and R5 shares to Class R6 shares will be effected at the respective net asset values per share of the applicable Fund. At the time of the conversions, the net asset values per Class R3, R4 or R5 shares may be higher or lower than the net asset value per share of the Class R6 shares; as a result, depending on the relative net asset value per share, a shareholder may receive fewer or more Class R6 shares than the number of Class R3, R4 of R5 shares converted. However, a shareholder's total invested amount in a Fund will be unchanged by the conversions.
Class R6 shares of each Fund currently have the same or lower Total Annual Operating Expenses as the Total Annual Operating Expenses of the corresponding Class R3, R4 and R5 shares. However, and while voluntary share class support arrangements can be discontinued at any time and should not be considered a feature of the class, certain of the Class R3, R4 and R5 shares have benefited from voluntary expense subsidies by First Eagle Investment Management, LLC, the Funds' investment adviser. Actual (subsidized) expenses for these shares at times can be lower than the stated Total Annual Operating Expenses and in some cases can be lower than the Total Annual Operating Expense for the corresponding R6 shares.
First Eagle Funds | Annual Report | October 31, 2023
222
Report of Independent Registered Public Accounting Firm
To the Board of Trustees of First Eagle Funds and Shareholders of each of the ten funds listed in the table below
Opinions on the Financial Statements
We have audited the accompanying statements of assets and liabilities, including the schedules of investments, of each of the funds listed in the table below (constituting the First Eagle Funds, hereafter collectively referred to as the "Funds") as of October 31, 2023, the related statements of operations and of changes in net assets for each of the periods indicated in the table below, including the related notes, and the financial highlights for each of the periods indicated therein (collectively referred to as the "financial statements"). In our opinion, the financial statements present fairly, in all material respects, the financial position of each of the Funds as of October 31, 2023, the results of each of their operations and the changes in each of their net assets for the periods indicated in the table below, and each of the financial highlights for each of the periods indicated therein, in conformity with accounting principles generally accepted in the United States of America.
First Eagle Global Fund(1) | | First Eagle High Income Fund(2) | |
First Eagle Overseas Fund(1) | | First Eagle Rising Dividend Fund(2) | |
First Eagle U.S. Value Fund(1) | | First Eagle Small Cap Opportunity Fund(2) | |
First Eagle Gold Fund(1) | | First Eagle U.S. Smid Cap Opportunity Fund(3) | |
First Eagle Global Income Builder Fund(2) | | First Eagle Global Real Assets Fund(4) | |
(1) Consolidated statement of assets and liabilities, including the consolidated schedule of investments, as of October 31, 2023, and the related consolidated statement of operations for the year ended October 31, 2023, consolidated statement of changes in net assets for each of the two years in the period ended October 31, 2023 and the consolidated financial highlights for each of the periods indicated therein
(2) Statement of assets and liabilities, including the schedule of investments, as of October 31, 2023, and the related statement of operations for the year ended October 31, 2023, statement of changes in net assets for each of the two years in the period ended October 31, 2023, and the financial highlights for each of the periods indicated therein
(3) Statement of assets and liabilities, including the schedule of investments, as of October 31, 2023, and the related statement of operations for the year ended October 31, 2023, statement of changes in net assets and financial highlights for the year ended October 31, 2023 and for the period August 15, 2022 (inception date) through October 31, 2022
(4) Consolidated statement of assets and liabilities, including the consolidated schedule of investments, as of October 31, 2023, and the related consolidated statement of operations for the year ended October 31, 2023, consolidated statement of changes in net assets and the consolidated financial highlights for the year ended October 31, 2023 and for the period November 30, 2021 (inception date) through October 31, 2022
Basis for Opinions
These financial statements are the responsibility of the Funds' management. Our responsibility is to express an opinion on the Funds' financial statements based on our audits. We are a public accounting firm registered with the Public Company Accounting Oversight Board (United States) (PCAOB) and are required to be
First Eagle Funds | Annual Report | October 31, 2023
223
Report of Independent Registered Public Accounting Firm
independent with respect to the Funds in accordance with the U.S. federal securities laws and the applicable rules and regulations of the Securities and Exchange Commission and the PCAOB.
We conducted our audits of these financial statements in accordance with the standards of the PCAOB. Those standards require that we plan and perform the audit to obtain reasonable assurance about whether the financial statements are free of material misstatement, whether due to error or fraud.
Our audits included performing procedures to assess the risks of material misstatement of the financial statements, whether due to error or fraud, and performing procedures that respond to those risks. Such procedures included examining, on a test basis, evidence regarding the amounts and disclosures in the financial statements. Our audits also included evaluating the accounting principles used and significant estimates made by management, as well as evaluating the overall presentation of the financial statements. Our procedures included confirmation of securities owned as of October 31, 2023, by correspondence with the custodian, agent banks and brokers; when replies were not received from brokers, we performed other auditing procedures. We believe that our audits provide a reasonable basis for our opinions.
/s/PricewaterhouseCoopers LLP
New York, New York
December 22, 2023
We have served as the auditor of one or more investment companies advised by First Eagle Investment Management, LLC since 2006.
First Eagle Funds | Annual Report | October 31, 2023
224
Fund Expenses (unaudited)
Example
As a shareholder of the First Eagle Funds, you may incur two types of costs: (1) transaction costs and (2) ongoing costs, including advisory fees; distribution fees (12b-1) and/or service fees; and other Fund expenses. This example is intended to help you understand your ongoing costs (in dollars) of investing in the Fund and to compare these costs with the ongoing costs of investing in other mutual funds.
This example is based on an investment of $1,000 invested on May 1, 2023 and held for the six-months ended October 31, 2023.
Actual Expenses
The table below titled "Based on Actual Total Return" provides information about actual account values and actual expenses. You may use the information provided in this table, together with the amount you invested, to estimate the expenses that you paid over the period. To estimate the expenses you paid on your account, divide your ending account value by $1,000 (for example, an $8,600 ending account value divided by $1,000 = 8.6), then multiply the result by the number under the heading entitled "Expenses Paid During the Period".
First Eagle Funds | Annual Report | October 31, 2023
225
Fund Expenses (unaudited)
Based on Actual Total Return(1)
| | | Actual Total
Return Without
Sales Charges(2) | | Beginning
Account
Date Value | | Ending
Account
Value
10/31/23 | | Annualized
Expense | | Expenses
Paid for
the Period(3) | |
First Eagle Global Fund* | |
Class A | | | -4.14 | % | | $ | 1,000 | | | $ | 958.60 | | | | 1.09 | % | | $ | 5.38 | | |
Class C | | | -4.52 | | | | 1,000 | | | | 954.80 | | | | 1.85 | | | | 9.12 | | |
Class I | | | -4.03 | | | | 1,000 | | | | 959.70 | | | | 0.86 | | | | 4.25 | | |
Class R3 | | | -4.26 | | | | 1,000 | | | | 957.40 | | | | 1.29 | | | | 6.36 | | |
Class R4 | | | -4.15 | | | | 1,000 | | | | 958.50 | | | | 1.10 | | | | 5.43 | | |
Class R5 | | | -4.11 | | | | 1,000 | | | | 958.90 | | | | 1.02 | | | | 5.04 | | |
Class R6 | | | -4.00 | | | | 1,000 | | | | 960.00 | | | | 0.79 | | | | 3.90 | | |
First Eagle Overseas Fund* | |
Class A | | | -6.36 | | | | 1,000 | | | | 936.40 | | | | 1.15 | | | | 5.61 | | |
Class C | | | -6.71 | | | | 1,000 | | | | 932.90 | | | | 1.85 | | | | 9.01 | | |
Class I | | | -6.28 | | | | 1,000 | | | | 937.20 | | | | 0.88 | | | | 4.30 | | |
Class R3 | | | -6.48 | | | | 1,000 | | | | 935.20 | | | | 1.39 | | | | 6.78 | | |
Class R4 | | | -6.27 | | | | 1,000 | | | | 937.30 | | | | 0.94 | | | | 4.59 | | |
Class R5 | | | -6.26 | | | | 1,000 | | | | 937.40 | | | | 0.86 | | | | 4.20 | | |
Class R6 | | | -6.24 | | | | 1,000 | | | | 937.60 | | | | 0.79 | | | | 3.86 | | |
First Eagle U.S. Value Fund* | |
Class A | | | -2.27 | | | | 1,000 | | | | 977.30 | | | | 1.08 | | | | 5.38 | | |
Class C | | | -2.63 | | | | 1,000 | | | | 973.70 | | | | 1.81 | | | | 9.00 | | |
Class I | | | -2.16 | | | | 1,000 | | | | 978.40 | | | | 0.86 | | | | 4.29 | | |
Class R3 | | | -2.48 | | | | 1,000 | | | | 975.20 | | | | 1.44 | | | | 7.17 | | |
Class R4 | | | -2.33 | | | | 1,000 | | | | 976.70 | | | | 1.18 | | | | 5.88 | | |
Class R5 | | | -2.17 | | | | 1,000 | | | | 978.30 | | | | 0.91 | | | | 4.54 | | |
Class R6 | | | -2.16 | | | | 1,000 | | | | 978.40 | | | | 0.78 | | | | 3.89 | | |
First Eagle Gold Fund* | |
Class A | | | -12.92 | | | | 1,000 | | | | 870.80 | | | | 1.19 | | | | 5.61 | | |
Class C | | | -13.25 | | | | 1,000 | | | | 867.50 | | | | 1.92 | | | | 9.04 | | |
Class I | | | -12.84 | | | | 1,000 | | | | 871.60 | | | | 0.95 | | | | 4.48 | | |
Class R3 | | | -13.14 | | | | 1,000 | | | | 868.60 | | | | 1.54 | | | | 7.25 | | |
Class R4 | | | -12.95 | | | | 1,000 | | | | 870.50 | | | | 1.17 | | | | 5.52 | | |
Class R5 | | | -12.88 | | | | 1,000 | | | | 871.20 | | | | 1.05 | | | | 4.95 | | |
Class R6 | | | -12.77 | | | | 1,000 | | | | 872.30 | | | | 0.85 | | | | 4.01 | | |
First Eagle Funds | Annual Report | October 31, 2023
226
Fund Expenses (unaudited)
| | | Actual Total
Return Without
Sales Charges(2) | | Beginning
Account
Date Value | | Ending
Account
Value
10/31/23 | | Annualized
Expense | | Expenses
Paid for
the Period(3) | |
First Eagle Global Income Builder Fund | |
Class A | | | -5.48 | % | | $ | 1,000 | | | $ | 945.20 | | | | 1.20 | % | | $ | 5.88 | | |
Class C | | | -5.76 | | | | 1,000 | | | | 942.40 | | | | 1.95 | | | | 9.55 | | |
Class I | | | -5.34 | | | | 1,000 | | | | 946.60 | | | | 1.00 | | | | 4.91 | | |
Class R3 | | | -5.65 | | | | 1,000 | | | | 943.50 | | | | 1.54 | | | | 7.54 | | |
Class R4 | | | -5.56 | | | | 1,000 | | | | 944.40 | | | | 1.40 | | | | 6.86 | | |
Class R5 | | | -5.39 | | | | 1,000 | | | | 946.10 | | | | 1.14 | | | | 5.59 | | |
Class R6 | | | -5.31 | | | | 1,000 | | | | 946.90 | | | | 0.91 | | | | 4.47 | | |
First Eagle High Income Fund | |
Class A | | | -0.04 | | | | 1,000 | | | | 999.60 | | | | 0.94 | | | | 4.74 | | |
Class C | | | -0.54 | | | | 1,000 | | | | 994.60 | | | | 1.69 | | | | 8.50 | | |
Class I | | | -0.04 | | | | 1,000 | | | | 999.60 | | | | 0.69 | | | | 3.48 | | |
Class R3 | | | -0.09 | | | | 1,000 | | | | 999.10 | | | | 1.04 | | | | 5.24 | | |
Class R4 | | | -0.09 | | | | 1,000 | | | | 999.10 | | | | 0.75 | | | | 3.78 | | |
Class R5 | | | -0.04 | | | | 1,000 | | | | 999.60 | | | | 0.63 | | | | 3.18 | | |
Class R6 | | | -0.06 | | | | 1,000 | | | | 999.40 | | | | 0.69 | | | | 3.48 | | |
First Eagle Rising Dividend Fund (formerly named First Eagle Fund of America) | |
Class A | | | -1.23 | | | | 1,000 | | | | 987.70 | | | | 0.90 | | | | 4.51 | | |
Class C | | | -1.58 | | | | 1,000 | | | | 984.20 | | | | 1.66 | | | | 8.30 | | |
Class I | | | -1.13 | | | | 1,000 | | | | 988.70 | | | | 0.65 | | | | 3.26 | | |
Class R3 | | | -1.31 | | | | 1,000 | | | | 986.90 | | | | 1.00 | | | | 5.01 | | |
Class R4 | | | -1.18 | | | | 1,000 | | | | 988.20 | | | | 0.75 | | | | 3.76 | | |
Class R5 | | | -1.13 | | | | 1,000 | | | | 988.70 | | | | 0.64 | | | | 3.21 | | |
Class R6 | | | -1.13 | | | | 1,000 | | | | 988.70 | | | | 0.65 | | | | 3.26 | | |
First Eagle Small Cap Opportunity Fund | |
Class A | | | -6.40 | | | | 1,000 | | | | 936.00 | | | | 1.25 | | | | 6.10 | | |
Class I | | | -6.26 | | | | 1,000 | | | | 937.40 | | | | 1.00 | | | | 4.88 | | |
Class R6 | | | -6.26 | | | | 1,000 | | | | 937.40 | | | | 1.00 | | | | 4.88 | | |
First Eagle U.S. Smid Cap Opportunity Fund | |
Class A | | | -4.50 | | | | 1,000 | | | | 955.00 | | | | 1.21 | | | | 5.96 | | |
Class I | | | -4.28 | | | | 1,000 | | | | 957.20 | | | | 0.95 | | | | 4.69 | | |
Class R6 | | | -4.29 | | | | 1,000 | | | | 957.10 | | | | 0.96 | | | | 4.74 | | |
First Eagle Funds | Annual Report | October 31, 2023
227
Fund Expenses (unaudited)
| | | Actual Total
Return Without
Sales Charges(2) | | Beginning
Account
Date Value | | Ending
Account
Value
10/31/23 | | Annualized
Expense | | Expenses
Paid for
the Period(3) | |
First Eagle Global Real Assets Fund* | |
Class A | | | -5.87 | % | | $ | 1,000 | | | $ | 941.30 | | | | 1.01 | % | | $ | 4.94 | | |
Class I | | | -5.71 | | | | 1,000 | | | | 942.90 | | | | 0.77 | | | | 3.77 | | |
Class R6 | | | -5.62 | | | | 1,000 | | | | 943.80 | | | | 0.77 | | | | 3.77 | | |
* Consolidated Financial Statements
(1) For the six-months ended October 31, 2023.
(2) Past performance does not guarantee future results. Assumes reinvestment of all dividends and capital gain distributions, if any, at net asset value. Total return is not annualized, as it may not be representative of the total return for the year
(3) Expenses are equal to the annualized expense ratio multiplied by the average account value over the period, multiplied by 184/365 (to reflect the one-half year period).
First Eagle Funds | Annual Report | October 31, 2023
228
Fund Expenses (unaudited)
Hypothetical Example for Comparison Purposes
The table below titled "Based on Hypothetical Total Return" provides information about hypothetical account values and hypothetical expenses based on the actual expense ratios and an assumed rate of return of 5% per year before expenses, which is not the First Eagle Funds' actual return. The hypothetical account values and expenses may not be used to estimate the actual ending account balance or expenses you paid for the period. You may use the information provided in this table to compare the ongoing costs of investing in the Funds and other funds. To do so, compare the 5% hypothetical example relating to the Fund with the 5% hypothetical examples that appear in the shareholder reports of other funds.
This example is based on an investment of $1,000 invested on May 1, 2023 and held for the six-months ended October 31, 2023.
Please note that the expenses shown in the table below are meant to highlight your ongoing costs only and do not reflect any transactional costs, such as front-end or back-end sales charges (loads). Therefore, the table is useful in comparing ongoing costs only, and will not help you determine the relative total costs of owning different funds. In addition, if these transaction costs were included, your costs would have been higher.
First Eagle Funds | Annual Report | October 31, 2023
229
Fund Expenses (unaudited)
Based on Hypothetical Total Return(1)
| | | Hypothetical
Annualized
Total
Return | | Beginning
Account
Date Value | | Ending
Account
Value | | Annualized
Expense | | Expenses
Paid for
the Period(2) | |
First Eagle Global Fund* | |
Class A | | | 5.00 | % | | $ | 1,000 | | | $ | 1,019.71 | | | | 1.09 | % | | $ | 5.55 | | |
Class C | | | 5.00 | | | | 1,000 | | | | 1,015.88 | | | | 1.85 | | | | 9.40 | | |
Class I | | | 5.00 | | | | 1,000 | | | | 1,020.87 | | | | 0.86 | | | | 4.38 | | |
Class R3 | | | 5.00 | | | | 1,000 | | | | 1,018.70 | | | | 1.29 | | | | 6.56 | | |
Class R4 | | | 5.00 | | | | 1,000 | | | | 1,019.66 | | | | 1.10 | | | | 5.60 | | |
Class R5 | | | 5.00 | | | | 1,000 | | | | 1,020.06 | | | | 1.02 | | | | 5.19 | | |
Class R6 | | | 5.00 | | | | 1,000 | | | | 1,021.22 | | | | 0.79 | | | | 4.02 | | |
First Eagle Overseas Fund* | |
Class A | | | 5.00 | | | | 1,000 | | | | 1,019.41 | | | | 1.15 | | | | 5.85 | | |
Class C | | | 5.00 | | | | 1,000 | | | | 1,015.88 | | | | 1.85 | | | | 9.40 | | |
Class I | | | 5.00 | | | | 1,000 | | | | 1,020.77 | | | | 0.88 | | | | 4.48 | | |
Class R3 | | | 5.00 | | | | 1,000 | | | | 1,018.20 | | | | 1.39 | | | | 7.07 | | |
Class R4 | | | 5.00 | | | | 1,000 | | | | 1,020.47 | | | | 0.94 | | | | 4.79 | | |
Class R5 | | | 5.00 | | | | 1,000 | | | | 1,020.87 | | | | 0.86 | | | | 4.38 | | |
Class R6 | | | 5.00 | | | | 1,000 | | | | 1,021.22 | | | | 0.79 | | | | 4.02 | | |
First Eagle U.S. Value Fund* | |
Class A | | | 5.00 | | | | 1,000 | | | | 1,019.76 | | | | 1.08 | | | | 5.50 | | |
Class C | | | 5.00 | | | | 1,000 | | | | 1,016.08 | | | | 1.81 | | | | 9.20 | | |
Class I | | | 5.00 | | | | 1,000 | | | | 1,020.87 | | | | 0.86 | | | | 4.38 | | |
Class R3 | | | 5.00 | | | | 1,000 | | | | 1,017.95 | | | | 1.44 | | | | 7.32 | | |
Class R4 | | | 5.00 | | | | 1,000 | | | | 1,019.26 | | | | 1.18 | | | | 6.01 | | |
Class R5 | | | 5.00 | | | | 1,000 | | | | 1,020.62 | | | | 0.91 | | | | 4.63 | | |
Class R6 | | | 5.00 | | | | 1,000 | | | | 1,021.27 | | | | 0.78 | | | | 3.97 | | |
First Eagle Gold Fund* | |
Class A | | | 5.00 | | | | 1,000 | | | | 1,019.21 | | | | 1.19 | | | | 6.06 | | |
Class C | | | 5.00 | | | | 1,000 | | | | 1,015.53 | | | | 1.92 | | | | 9.75 | | |
Class I | | | 5.00 | | | | 1,000 | | | | 1,020.42 | | | | 0.95 | | | | 4.84 | | |
Class R3 | | | 5.00 | | | | 1,000 | | | | 1,017.44 | | | | 1.54 | | | | 7.83 | | |
Class R4 | | | 5.00 | | | | 1,000 | | | | 1,019.31 | | | | 1.17 | | | | 5.96 | | |
Class R5 | | | 5.00 | | | | 1,000 | | | | 1,019.91 | | | | 1.05 | | | | 5.35 | | |
Class R6 | | | 5.00 | | | | 1,000 | | | | 1,020.92 | | | | 0.85 | | | | 4.33 | | |
First Eagle Funds | Annual Report | October 31, 2023
230
Fund Expenses (unaudited)
| | | Hypothetical
Annualized
Total
Return | | Beginning
Account
Date Value | | Ending
Account
Value | | Annualized
Expense | | Expenses
Paid for
the Period(2) | |
First Eagle Global Income Builder Fund | |
Class A | | | 5.00 | % | | $ | 1,000 | | | $ | 1,019.16 | | | | 1.20 | % | | $ | 6.11 | | |
Class C | | | 5.00 | | | | 1,000 | | | | 1,015.38 | | | | 1.95 | | | | 9.91 | | |
Class I | | | 5.00 | | | | 1,000 | | | | 1,020.16 | | | | 1.00 | | | | 5.09 | | |
Class R3 | | | 5.00 | | | | 1,000 | | | | 1,017.44 | | | | 1.54 | | | | 7.83 | | |
Class R4 | | | 5.00 | | | | 1,000 | | | | 1,018.15 | | | | 1.40 | | | | 7.12 | | |
Class R5 | | | 5.00 | | | | 1,000 | | | | 1,019.46 | | | | 1.14 | | | | 5.80 | | |
Class R6 | | | 5.00 | | | | 1,000 | | | | 1,020.62 | | | | 0.91 | | | | 4.63 | | |
First Eagle High Income Fund | |
Class A | | | 5.00 | | | | 1,000 | | | | 1,020.47 | | | | 0.94 | | | | 4.79 | | |
Class C | | | 5.00 | | | | 1,000 | | | | 1,016.69 | | | | 1.69 | | | | 8.59 | | |
Class I | | | 5.00 | | | | 1,000 | | | | 1,021.73 | | | | 0.69 | | | | 3.52 | | |
Class R3 | | | 5.00 | | | | 1,000 | | | | 1,019.96 | | | | 1.04 | | | | 5.30 | | |
Class R4 | | | 5.00 | | | | 1,000 | | | | 1,021.42 | | | | 0.75 | | | | 3.82 | | |
Class R5 | | | 5.00 | | | | 1,000 | | | | 1,022.03 | | | | 0.63 | | | | 3.21 | | |
Class R6 | | | 5.00 | | | | 1,000 | | | | 1,021.73 | | | | 0.69 | | | | 3.52 | | |
First Eagle Rising Dividend Fund (formerly named First Eagle Fund of America) | |
Class A | | | 5.00 | | | | 1,000 | | | | 1,020.67 | | | | 0.90 | | | | 4.58 | | |
Class C | | | 5.00 | | | | 1,000 | | | | 1,016.84 | | | | 1.66 | | | | 8.44 | | |
Class I | | | 5.00 | | | | 1,000 | | | | 1,021.93 | | | | 0.65 | | | | 3.31 | | |
Class R3 | | | 5.00 | | | | 1,000 | | | | 1,020.16 | | | | 1.00 | | | | 5.09 | | |
Class R4 | | | 5.00 | | | | 1,000 | | | | 1,021.42 | | | | 0.75 | | | | 3.82 | | |
Class R5 | | | 5.00 | | | | 1,000 | | | | 1,021.98 | | | | 0.64 | | | | 3.26 | | |
Class R6 | | | 5.00 | | | | 1,000 | | | | 1,021.93 | | | | 0.65 | | | | 3.31 | | |
First Eagle Small Cap Opportunity Fund | |
Class A | | | 5.00 | | | | 1,000 | | | | 1,018.90 | | | | 1.25 | | | | 6.36 | | |
Class I | | | 5.00 | | | | 1,000 | | | | 1,020.16 | | | | 1.00 | | | | 5.09 | | |
Class R6 | | | 5.00 | | | | 1,000 | | | | 1,020.16 | | | | 1.00 | | | | 5.09 | | |
First Eagle U.S. Smid Cap Opportunity Fund | |
Class A | | | 5.00 | | | | 1,000 | | | | 1,019.11 | | | | 1.21 | | | | 6.16 | | |
Class I | | | 5.00 | | | | 1,000 | | | | 1,020.42 | | | | 0.95 | | | | 4.84 | | |
Class R6 | | | 5.00 | | | | 1,000 | | | | 1,020.37 | | | | 0.96 | | | | 4.89 | | |
First Eagle Global Real Assets Fund* | |
Class A | | | 5.00 | | | | 1,000 | | | | 1,020.11 | | | | 1.01 | | | | 5.14 | | |
Class I | | | 5.00 | | | | 1,000 | | | | 1,021.32 | | | | 0.77 | | | | 3.92 | | |
Class R6 | | | 5.00 | | | | 1,000 | | | | 1,021.32 | | | | 0.77 | | | | 3.92 | | |
* Consolidated Financial Statements
(1) For the six-months ended October 31, 2023.
(2) Expenses are equal to the annualized expense ratio multiplied by the average account value over the period, multiplied by 184/365 (to reflect the one-half year period).
First Eagle Funds | Annual Report | October 31, 2023
231
Form N-PORT portfolio schedule
The Funds file their complete schedule of portfolio holdings with the Securities and Exchange Commission ("SEC") for the first and third quarters of each fiscal year as an exhibit to its reports on Form N-PORT. The Funds' Form N-PORT is available on the SEC's Web site at www.sec.gov. Additionally, you may obtain copies of Form N-PORT from the Fund upon request by calling 1.800.334.2143.
Proxy voting policies, procedures and record
You may obtain (1) a description of the Funds' proxy voting policies, (2) a description of the Funds' proxy voting procedures and (3) information regarding how the Funds voted any proxies related to portfolio securities during the most recent twelve-month period ended June 30 for which an SEC filing has been made, without charge, upon request by contacting the Funds directly at 1.800.334.2143 or on the EDGAR Database on the SEC's Web site at www.sec.gov.
First Eagle Funds | Annual Report | October 31, 2023
232
Board Considerations for Continuation of Advisory Agreements
At a meeting held on June 20-21, 2023, the Board of Trustees of the Funds, including a majority of the independent trustees (the "Independent Trustees"), approved the continuation of the Funds' advisory agreements (the "Advisory Agreements"). The Advisory Agreement for First Eagle U.S. Smid Cap Opportunity Fund was reviewed but no action was required as the agreement was still within its initial two-year term.
In response to a letter sent to the Adviser on behalf of the Independent Trustees requesting information about the Advisory Agreements and other arrangements and plans, the Trustees received extensive materials from the Adviser, including reviews of performance and expense information compared against the Funds' respective composites, benchmarks and peer groups compiled by an independent data provider. The Trustees also had the benefit of receiving presentations from and holding discussions with management throughout the year.
Prior to approving the continuation of the Advisory Agreements, the Independent Trustees met in executive sessions with their independent counsel to discuss management's responses to their information request and reviewed their legal and fiduciary obligations and the factors relating to their evaluation and approval. In their deliberations, Trustees attributed different weights to the various factors, and no factor alone was considered dispositive. At the conclusion of their review, the Trustees determined that the advisory fees were fair and reasonable under the circumstances and within the range of what could be negotiated at arm's length, and that the continuance of the Advisory Agreements should serve the best interests of each Fund and its shareholders. The Trustees considered the following topics in reaching their conclusion to continue the Advisory Agreements:
Nature, Quality, and Extent of Services Provided by Adviser
• The Trustees reviewed the services provided and to be provided by the Adviser to the Funds. The Adviser provides the Funds with investment research, advice and supervision, and continuously furnishes an investment portfolio for the Funds consistent with the Funds' investment objectives, policies and restrictions as set forth in the Funds' Prospectuses. The Trustees were assured that service levels for Funds subject to fee waivers or breakpoints are not affected by the waivers or breakpoints. The Trustees considered the commitment of the Adviser to provide high quality services to the Funds.
• The Trustees reviewed each Fund's historical relationship with the Adviser and the institutional resources available to the Funds under that relationship. The Trustees, in their deliberations, recognized that, for many of the Funds' shareholders, the decision to purchase Fund shares included a decision to select the Adviser as the investment adviser and that there is a strong association in the minds of Fund shareholders between the Adviser and each of the Funds.
First Eagle Funds | Annual Report | October 31, 2023
233
Board Considerations for Continuation of Advisory Agreements
• The Trustees commented on the background and experience of the Funds' Portfolio Managers and the quality of the Trustees' frequent meetings with them both individually and as a group throughout the year and in prior meetings. The Trustees also appreciated new product development as a further indication of investment in capabilities. The Trustees noted, based on reports by senior management, that the Adviser's ownership group continues to be strongly supportive of the business and is engaged in appropriate and thoughtful strategic planning for the future.
• The Trustees considered that they received regular reports from the Adviser on the effects of market volatility and operational and investment risk.
Investment Performance of Fund and Adviser
• The Trustees reviewed the performance of each Fund on both an absolute and a relative basis over 1-year, 3-year, 5-year and 10-year periods (where applicable, and with only recent performance presented for the First Eagle Small Cap Opportunity Fund and First Eagle Global Real Assets Fund given they are recently formed). It was noted that the First Eagle U.S. Smid Cap Opportunity Fund did not have an advisory agreement subject to review at this time. Performance over these various periods was noted relative to the Funds' benchmarks, to the performance of peer mutual funds and to Morningstar and Lipper Category Averages (the category averages being referred to as "composites").
The comparative review reflected research and benchmarking by an independent data provider with periods of outperformance and lagging performance generally as follows (all periods ended as of March 31, 2023):
| | Composite #1 | | Composite #2 | | Peer Group | | Benchmark | |
Global Fund | | Outperformed over all periods shown | | Outperformed over all periods shown | | Outperformed over all periods shown | | Outperformed over trailing 1-year period
Lagged all other periods shown | |
Overseas Fund | | Outperformed over trailing 1- and 5-year periods
Lagged all other periods shown | | Outperformed over trailing 5-year period
Lagged all other periods shown | | Outperformed over trailing 1- and 5-year periods
Lagged all other periods shown | | Outperformed over trailing 1-year period
Lagged all other periods shown | |
U.S. Value Fund | | Outperformed over all periods shown | | Outperformed over trailing 1-year period
Lagged all other periods shown | | Outperformed over trailing 1-year period
Lagged all other periods shown | | Outperformed over trailing 1-year period
Lagged all other periods shown | |
Gold Fund | | Outperformed over trailing 1-, 5- and 10-year periods
Lagged over trailing 3-year period | | Outperformed over trailing 1-, 5- and 10-year periods
Lagged over trailing 3-year period | | Outperformed over trailing 1-, 5- and 10-year periods
Lagged over trailing 3-year period | | Outperformed over all periods shown | |
First Eagle Funds | Annual Report | October 31, 2023
234
Board Considerations for Continuation of Advisory Agreements
| | Composite #1 | | Composite #2 | | Peer Group | | Benchmark | |
Global Income Builder Fund | | Outperformed over all periods shown | | Outperformed over all periods shown | | Outperformed over all periods shown | | Outperformed over trailing 1-year period
Lagged all other periods shown | |
High Income Fund | | Outperformed over trailing 1- and 3-year periods
Lagged over trailing 5- and 10-year periods | | Outperformed over trailing 1- and 3-year periods
Lagged over trailing 5- and 10-year periods | | Outperformed over trailing 1-year period
Matched performance over trailing 3-year period
Lagged over trailing 5- and 10-year periods | | Outperformed over trailing 1- and 3-year periods
Lagged over trailing 5- and 10-year periods | |
Rising Dividend Fund | | Outperformed over trailing 1-year period
Lagged all other periods shown | | Outperformed over trailing 1-year period
Lagged all other periods shown | | Outperformed over trailing 1-year period
Lagged all other periods shown | | Outperformed over trailing 1-year period
Lagged all other periods shown | |
Small Cap Opportunity Fund | | Lagged over trailing 1-year period | | Lagged over trailing 1-year period | | Lagged over trailing 1-year period | | Outperformed over trailing 1-year period | |
Global Real Assets Fund | | Outperformed over trailing 1-year period (longer periods not applicable because not yet available) | | Outperformed over trailing 1-year period (longer periods not applicable because not yet available) | | Outperformed over trailing 1-year period (longer periods not applicable because not yet available) | | Outperformed over trailing 1-year period (longer periods not applicable because not yet available) | |
• Performance for each Fund was determined to be adequate given benchmarks, peer comparisons and on an absolute basis, and reflective of each Fund's investment objective and philosophy.
• A memorandum provided to the Trustees with management commentary on performance was discussed. This included supplemental information showing downside risk analysis intended to support management's view that an emphasis on downside risk is an important consideration in assessing the Funds' performance.
• The Trustees commented on the Funds' holdings of short-term investments and, in some cases, gold positions, and noted that short-term investments and gold can be important elements of the First Eagle Global Value team's investment philosophy and typically represent differentiating factors from peers for those Funds.
Costs of Services To Be Provided and Profits To Be Realized by Adviser and its Affiliates From Relationship with Funds; Economies of Scale; Fall-Out Benefits
• The Trustees reviewed the total compensation received by the Adviser and the Funds' total costs for using the Adviser's services, taking into account expenses incurred by the Adviser that are passed through to the Funds (notably under the administrative cost reimbursement program applicable to certain Funds). They concluded that this compensation was commensurate with the nature, extent, and quality of the services provided and therefore fair and reasonable
First Eagle Funds | Annual Report | October 31, 2023
235
Board Considerations for Continuation of Advisory Agreements
under the circumstances, and referred to their prior discussion on performance of each Fund, including a review of performance against each Fund's respective composites, benchmark and peer group. As part of their analysis, the Trustees considered fees charged by investment advisers to peer mutual funds for services comparable to those provided by the Adviser and referred to an independent data provider fee report, together with a management summary of the same. They determined that the Adviser's fees were competitive, with the net management fees for some Funds being higher and for some Funds being lower than their peer averages/medians, but all being within the range of peers. The Trustees also considered, where applicable and available, the advisory fees charged to other clients of the Adviser with similar investment objective(s) to a Fund and received information that for some Funds, the fees charged to these other clients were higher or lower relative to the respective Fund. The Trustees were apprised that for some of these other accounts there are different styles and categories of services provided (e.g., regulatory and operational structures may differ, frequency and scale of cash flows may differ, etc.), which may be reflected in lower fees charged relative to the respective Fund.
• A memorandum provided to the Trustees with management commentary on fees and expenses was discussed.
• While analyzing the effects of direct and indirect compensation to the Adviser and its affiliates (sometimes referred to as "fall-out benefits"), the Trustees considered the absence of affiliated broker-dealer relationships and the effects of the administrative service fees and reimbursements paid to the Adviser. The Trustees noted that the Adviser is absorbing soft dollar costs and paying them itself. With regard to other possible benefits associated with the Adviser's management of the Funds, the Trustees noted, among other things, that the Distributor is generally able to retain revenue associated with Rule 12b-1 fees on shareholders it services directly and that the Adviser may be able to extend investment and operational efficiencies associated with the Funds to its management of other types of accounts.
• The Trustees reviewed the Funds' expense ratios, which were deemed reasonable both on an absolute basis and in comparison to peer funds. The Trustees noted changes in expense ratios over time, with some Funds showing decreases and some showing increases. In general, a contributing factor to the change in expense ratio was an increase or decrease in average net assets over the relevant period. In the case of each of the Rising Dividend Fund and the High Income Fund, there was a decrease in the advisory fee as of August 1, 2020 and July 1, 2021, respectively. The Trustees also considered the effect of Fund asset size on particular categories of expenses, both currently and relative to prior periods. The Trustees noted the impact on expense ratios of the administrative fees or reimbursements paid to or charged by the Adviser, as the case may be. While economies of scale can be complex to assess and typically are not directly
First Eagle Funds | Annual Report | October 31, 2023
236
Board Considerations for Continuation of Advisory Agreements
measurable, the Trustees noted that the Adviser may be able to employ economies of scale in certain areas relating to the management of the Fund, potentially including investment management, trading, compliance and back-office operations. In the case of the administrative expense reimbursements, because they represent the provision of services at cost, any economies of scale realized are, by definition, for the benefit of the Funds.
• The Trustees reviewed the Adviser's financial condition and profitability. Profits to the Adviser vary meaningfully depending on the particular Fund, with some Funds showing losses to the Adviser and others showing healthy profits. Overall, profits were viewed as not excessive and providing appropriate incentives to the Adviser. The Trustees noted the cyclical and competitive nature of the global asset management industry and the related importance of profitability in maintaining the Adviser's culture and management continuity. The Trustees also noted that the Adviser has always shown the willingness to commit resources to support investment in the business and to maintain the generally high quality of the overall shareholder experience in the Funds, such as attracting and retaining qualified personnel and investing in technology. Levels of support are not solely dependent on the profits realized on a per-Fund basis. The Trustees reviewed personal investments maintained in the Funds by certain portfolio managers (with those investments being both direct and "notional" under the Adviser's compensation plans), which was viewed as evidence of commitment to the Funds by key personnel.
First Eagle Funds | Annual Report | October 31, 2023
237
Fund Liquidity Risk Management Program (unaudited)
Consistent with Rule 22e-4 under the 1940 Act (the "Liquidity Rule"), the Funds have adopted and implemented a liquidity risk management program (the "LRMP") reasonably designed to assess and manage each Fund's liquidity risk, which is defined under the Liquidity Rule as the risk that the Fund is unable to meet investor redemption requests without significantly diluting the remaining investors' interests in the Fund. The Funds' Board has approved First Eagle Investment Management, LLC's Liquidity Management Committee ("First Eagle") to serve as the administrator of the Funds' LRMP. As part of its responsibilities as administrator, First Eagle has retained a third party to perform certain functions, including providing market data and liquidity classification model information.
The Funds' LRMP includes a number of processes designed to support the assessment and management of its liquidity risk. In particular, the Funds' LRMP includes: (1) no less than annual assessments of factors that influence each Fund's liquidity risk taking into account certain factors, as applicable, including each Fund's (i) investment strategy and liquidity of portfolio investments (during both normal and reasonably foreseeable stressed conditions), (ii) short-term and long-term cash flow projections (during both normal and reasonably foreseeable stressed conditions), and (iii) holdings of cash and cash equivalents and borrowing arrangements and other funding sources; (2) no less than monthly classifications of each Fund's investments into one of four liquidity classifications provided for in the Liquidity Rule; (3) a 15% of net assets limit on the acquisition of "illiquid investments" (as defined under the Liquidity Rule); (4) potential establishment of a minimum percentage of a Fund's assets to be invested in investments classified as "highly liquid" (as defined under the Liquidity Rule) (at present, however, each Fund invests primarily in "highly liquid" investments in the ordinary course, which means no such minimum threshold need be specified); and (5) reporting to the Funds' Board and/or to the SEC, as required.
At a meeting of the Board on June 20, 2023, the Board reviewed a written report prepared by First Eagle (the "LRMP Report") addressing the operation, adequacy, and effectiveness of the Funds' LRMP, including any material changes to the LRMP for the period from January 1, 2022 through December 31, 2022 (the "Reporting Period"). The LRMP Report stated that First Eagle concluded that the Funds' LRMP was reasonably designed to assess and manage each Fund's liquidity risk and was adequately and effectively implemented during the Reporting Period. The LRMP Report also stated that First Eagle concluded that each Fund's investment strategy is appropriate for an open-end fund and that its cash management program is appropriately monitored by the investment management team. The LRMP Report noted those changes to the LRMP approved by the Board earlier in the Reporting Period.
There can be no assurance that the LRMP will achieve its objectives in the future. Additional information regarding risks of investing in each Fund, including liquidity risks presented by a Fund's investment portfolio, is found in each Fund's Prospectus and Statement of Additional Information.
First Eagle Funds | Annual Report | October 31, 2023
238
Fiscal Year Ended October 31, 2023 (unaudited)
Each Fund designates at the following amounts (or the maximum amount allowable) distributed during the fiscal year ended October 31, 2023, if any, as capital gain dividends, dividends eligible for the corporate dividends received deduction and/or qualified dividend income:
| | % of Qualifying
Dividend
Income | | % of Dividends
Eligible for
the Dividends
Received
Deduction | | Long-Term
Capital Gains | |
First Eagle Global Fund | | | 100.00 | % | | | 46.43 | % | | $ | 1,818,075,418 | | |
First Eagle Overseas Fund* | | | 92.66 | % | | | 1.94 | % | | | 400,980,039 | | |
First Eagle U.S. Value Fund | | | 100.00 | % | | | 97.77 | % | | | 85,514,878 | | |
First Eagle Gold Fund* | | | 0.00 | % | | | 0.00 | % | | | — | | |
First Eagle Global Income Builder Fund | | | 73.34 | % | | | 21.86 | % | | | 24,615,575 | | |
First Eagle High Income Fund | | | 0.00 | % | | | 0.00 | % | | | — | | |
First Eagle Rising Dividend Fund | | | 100.00 | % | | | 100.00 | % | | | 8,805,339 | | |
First Eagle Small Cap Opportunity Fund | | | 100.00 | % | | | 95.09 | % | | | — | | |
First Eagle U.S. Smid Cap Opportunity Fund | | | 100.00 | % | | | 100.00 | % | | | — | | |
First Eagle Global Real Assets Fund | | | 96.62 | % | | | 43.43 | % | | | — | | |
* First Eagle Overseas Fund paid foreign taxes of $21,440,579 and recognized Section 853 foreign source income of $232,828,541. First Eagle Gold Fund paid foreign taxes of $2,900,920 and recognized Section 853 foreign source income of $14,882,899. Pursuant to Section 853 of the Internal Revenue Code, the First Eagle Overseas Fund and First Eagle Gold Fund designate such amounts (or the maximum amount allowable) as having been paid in connection with dividends distributed from investment company taxable income during the fiscal year ended October 31, 2023.
First Eagle Funds | Annual Report | October 31, 2023
239
The Trust is committed to protecting your privacy. We are providing you with this privacy notice to inform you of how we handle your personal information that we collect and may disclose to our affiliates. If the Trust changes its information practices, we will provide you with notice of any material changes. This privacy policy supersedes any of our previous policies relating to the information you disclose to us.
FACTS | |
WHAT DOES THE TRUST DO WITH YOUR PERSONAL INFORMATION? | |
Why? | | Financial companies choose how they share your personal information. Federal law gives consumers the right to limit some but not all sharing. Federal law also requires us to tell you how we collect, share, and protect your personal information. Please read this notice carefully to understand what we do. | |
What? | | The types of personal information we collect and share depend on the product or service you have with us. This information can include:
◼ Social Security number, income, and assets
◼ account balances, payment history, and account activity
◼ credit history and credit scores
◼ name, address, telephone number, occupation
◼ online information, such as your IP address and data gathered from your browsing activity and location
◼ information we encounter in public records in the ordinary course of business | |
How? | | All financial companies need to share customers' personal information to run their everyday business. In the section below, we list the reasons financial companies can share their customers' personal information; the reasons the Trust chooses to share; and whether you can limit this sharing. | |
First Eagle Funds | Annual Report | October 31, 2023
240
Reasons we can share your personal information | | Does the Trust share? | | Can you limit this sharing? | |
For our everyday business purposes—
such as to process your transactions, maintain your account(s), respond to court orders and legal investigations, or report to credit bureaus | | Yes | | No | |
For our marketing purposes—
to offer our products and services to you | | Yes | | Yes | |
For joint marketing with other financial companies | | No | | N/A | |
For our affiliates' everyday business
purposes—
information about your transactions and experiences | | Yes | | No | |
For our affiliates' everyday business
purposes—
information about your creditworthiness | | Yes | | Yes; see below | |
For our affiliates to market to you | | Yes | | Yes | |
For nonaffiliates to market to you | | No | | N/A | |
To limit our sharing | | ◼ Call 800.334.2143 and indicate your desire to limit our sharing
◼ Visit us online: www.firsteagle.com/individuals-home or
◼ Mail the form below
Please note:
If you are a new customer, we can begin sharing your information 30 days from the date we sent this notice. When you are no longer our customer, we continue to share your information as described in this notice.
However, you can contact us at any time to limit our sharing. | |
Questions? | | Call 800.334.2143 or go to www.firsteagle.com/individuals-home | |
First Eagle Funds | Annual Report | October 31, 2023
241
#
Mail-in Form
If you have a joint account, your choice(s) will apply to everyone on your account unless you mark below.
❑ Apply my choices only to me | | Mark any/all you want to limit:
❑ Do not share information about my creditworthiness with your affiliates for their everyday business purposes.
❑ Do not allow your affiliates to use my personal information to market to me.
❑ Do not share my personal information with nonaffiliates to market their products and services to me.
Name
Address
City, State, Zip
Account #
Mail to:
First Eagle Funds
P.O. Box 219324
Kansas City, MO
64121-9324
| |
#
What we do
How does the Trust protect my personal information? | | We protect personal information provided to us by our individual shareholders according to strict standards of security and confidentiality. These standards apply to both our physical facilities and any online services we may provide. We maintain physical, electronic and procedural safeguards that comply with federal standards to guard consumer information. We permit only authorized individuals, who are trained in the proper handling of individual shareholder information and need to access this information to do their job, to have access to this information. | |
How does the Trust collect my personal information? | | We collect your personal information, for example, when you
◼ open an account, make transactions using your account, or deposit money
◼ subscribe to receive information, submit an application, or otherwise submit a form containing personal information
◼ use our services online
We also collect your personal information from others, such as credit bureaus, affiliates, or other companies. | |
First Eagle Funds | Annual Report | October 31, 2023
242
Why can't I limit all sharing? | | Federal law gives you the right to limit only
◼ sharing for affiliates' everyday business purposes—information about your creditworthiness
◼ affiliates from using your information to market to you
◼ sharing for nonaffiliates to market to you
State laws and individual companies may give you additional rights to limit sharing. | |
What happens when I limit sharing for an account I hold jointly with someone else? | | Your choices will apply to everyone on your account. | |
Definitions
Affiliates | | Companies related by common ownership or control. They can be financial and nonfinancial companies.
◼ Affiliated companies include First Eagle Investments; First Eagle Holdings, Inc.; First Eagle Investment Management, LLC; FEF Distributors, LLC; First Eagle Separate Account Management, LLC; First Eagle Alternative Credit, LLC; Napier Park Global Capital LLC; Napier Park Global Capital Ltd; First Eagle Investment Management Ltd; First Eagle Investment Management GmbH; First Eagle Funds (Ireland) ICAV; First Eagle Amundi Sub-Funds (Luxembourg) SICAV; First Eagle Credit Opportunities Fund, First Eagle Private Credit Fund, First Eagle Variable Funds and any other First Eagle Funds and any sub-funds, as applicable. | |
Nonaffiliates | | Companies not related by common ownership or control. They can be financial and nonfinancial companies.
◼ Nonaffiliated third parties may include service providers such as the Trust's distributors, registrar and transfer agent for shareholder transactions, other parties providing individual shareholder servicing, accounting and recordkeeping services, attorneys, accountants, and auditors. | |
First Eagle Funds | Annual Report | October 31, 2023
243
Other important information
Sharing of Personal Information with Nonaffiliated Third Parties
We will only share your personal information collected, as described above, with nonaffiliated third parties:
• At your request;
• When you authorize us to process or service a transaction or product (nonaffiliated third parties in this instance may include service providers such as the Trust's distributors, registrar and transfer agent for shareholder transactions, and other parties providing individual shareholder servicing, accounting and recordkeeping services);
• With companies that perform sales and marketing services on our behalf with whom we have agreements to protect the confidentiality of your information and to use the information only for the purposes for which we disclose the information to them; or
• When required by law to disclose such information to appropriate authorities.
We do not otherwise provide information about you to outside firms, organizations or individuals except as permitted by law.
What We do with Personal Information about Our Former Customers
If you decide to discontinue doing business with us, the Trust will continue to adhere to this privacy policy with respect to the information we have in our possession about you and your account following the termination of our shareholder relationship.
First Eagle Funds | Annual Report | October 31, 2023
244
Additional Information (unaudited)
Management of the Trust
The business of the Trust is managed by its Board of Trustees, which elects officers responsible for the day to day operations of the Funds and for the execution of the policies formulated by the Board of Trustees.
Pertinent information regarding the members of the Board of Trustees and principal officers of the Trust is set forth below. Some of the Trustees and officers are employees of the Adviser and its affiliates. At least a majority of the Trust's Board of Trustees are not "interested persons" as that term is defined in the Investment Company Act.
Independent Trustees(1)
Lisa Anderson | Trustee | December 2005 to present
1345 Avenue of the Americas | New York, New York | 10105
(born October 1950)
Principal Occupation(s) During Past 5 Years: Special Lecturer and James T. Shotwell Professor of International Relations Emerita at the Columbia University School of International and Public Affairs; prior to 2016, President of the American University in Cairo
Number of Portfolios in the Fund Complex Overseen by Trustee: 12
Other Directorships/Trusteeships Held by Trustee: Trustee, First Eagle Variable Funds (1 portfolio) and First Eagle Credit Opportunities Fund (1 portfolio); Member Emerita, Human Rights Watch; Member, Advisory Board, School of Global Affairs and Public Policy, American University in Cairo; Member, Advisory Board, Kluge Center, Library of Congress, Washington, DC; Trustee, Hertie School of Governance (Berlin); Trustee, Tufts University; Trustee, Aga Khan University
Candace K. Beinecke(2) | Trustee (Chair) | December 1999 to present
1345 Avenue of the Americas | New York, New York | 10105
(born November 1946)
Principal Occupation(s) During Past 5 Years: Senior Partner, Hughes Hubbard & Reed LLP; prior to April 2017, Chair, Hughes Hubbard & Reed LLP
Number of Portfolios in the Fund Complex Overseen by Trustee: 12
Other Directorships/Trusteeships Held by Trustee: Trustee, First Eagle Variable Funds (Chair) (1 portfolio) and First Eagle Credit Opportunities Fund (Chair) (1 portfolio); Lead Trustee, Vornado Realty Trust; Trustee and Co-Chair, Metropolitan Museum of Art; Director, Partnership for New York City
(1) Trustees who are not "interested persons" of the Trust as defined in the 1940 Act. The term of office of the Independent Trustees is indefinite.
(2) Ms. Beinecke also served as trustee of a predecessor fund to Rising Dividend Fund since 1996.
First Eagle Funds | Annual Report | October 31, 2023
245
Additional Information (unaudited)
Independent Trustees(1)—(continued)
Peter W. Davidson | Trustee | December 2019 to present
1345 Avenue of the Americas | New York, New York | 10105
(born May 1959)
Principal Occupation(s) During Past 5 Years: CEO, Aligned Climate Capital LLC; prior to 2019, CEO, Aligned Intermediary, Inc.; prior to 2015, Executive Director, Loan Programs Office, U.S. Department of Energy
Number of Portfolios in the Fund Complex Overseen by Trustee: 12
Other Directorships/Trusteeships Held by Trustee: Trustee, First Eagle Variable Funds (1 portfolio) and First Eagle Credit Opportunities Fund (1 portfolio); Chairman, Summit Ridge Energy; Director, Beam Global (BEEM); Chair, JM Kaplan Fund; Chairman, Greenwood Cemetery; Board Member, Nyle Water Systems; Board Member, SWTCH
Jean D. Hamilton | Trustee | March 2003 to present
1345 Avenue of the Americas | New York, New York | 10105
(born January 1947)
Principal Occupation(s) During Past 5 Years: Private Investor/Independent Consultant/Member, Brock Capital Group LLC
Number of Portfolios in the Fund Complex Overseen by Trustee: 12
Other Directorships/Trusteeships Held by Trustee: Trustee, First Eagle Variable Funds (1 portfolio) and First Eagle Credit Opportunities Fund (1 portfolio); Director, RenaissanceRe Holdings Ltd (retired May 2022); Chairman, Investment Committee, Thomas Cole National Historic Site; Member, Investment Advisory Committee, Liz Claiborne and Art Ortenberg Foundation; prior to June 2012, Director, Four Nations
James E. Jordan | Trustee | December 1999 to present
1345 Avenue of the Americas | New York, New York | 10105
(born April 1944)
Principal Occupation(s) During Past 5 Years: Private Investor and Independent Consultant
Number of Portfolios in the Fund Complex Overseen by Trustee: 12
Other Directorships/Trusteeships Held by Trustee: Trustee, First Eagle Variable Funds (1 portfolio) and First Eagle Credit Opportunities Fund (1 portfolio); Director, JZ Capital Partners, Plc. (Guernsey investment trust company)
(1) Trustees who are not "interested persons" of the Trust as defined in the 1940 Act. The term of office of the Independent Trustees is indefinite.
First Eagle Funds | Annual Report | October 31, 2023
246
Additional Information (unaudited)
Independent Trustees(1)—(continued)
William M. Kelly(3) | Trustee | December 1999 to present
1345 Avenue of the Americas | New York, New York | 10105
(born February 1944)
Principal Occupation(s) During Past 5 Years: Private Investor
Number of Portfolios in the Fund Complex Overseen by Trustee: 12
Other Directorships/Trusteeships Held by Trustee: Trustee, First Eagle Variable Funds (1 portfolio) and First Eagle Credit Opportunities Fund (1 portfolio); Trustee Emeritus, St. Anselm College
Paul J. Lawler | Trustee | March 2002 to present
1345 Avenue of the Americas | New York, New York | 10105
(born May 1948)
Principal Occupation(s) During Past 5 Years: Private Investor
Number of Portfolios in the Fund Complex Overseen by Trustee: 12
Other Directorships/Trusteeships Held by Trustee: Trustee, First Eagle Variable Funds (1 portfolio) and First Eagle Credit Opportunities Fund (1 portfolio); Trustee and Audit Chair, The American University in Cairo; Trustee, registered investment company advised by affiliates of The Blackstone Group, L.P. (1 portfolio); Director, Historic Eastfield Foundation
Mandakini Puri | Trustee | April 2023 to present
1345 Avenue of the Americas | New York, New York | 10105
born February 14,1960)
Principal Occupation(s) During Past 5 Years: Independent Consultant and Private Investor; prior to May 2013, a Manging Director and Co-Head of Black Rock Private Equity
Number of Portfolios in the Fund Complex Overseen by Trustee: 12
Other Directorships/Trusteeships Held by Trustee: Trustee, First Eagle Variable Funds (1 portfolio) and First Eagle Credit Opportunities Fund; Trustee, Vornado Realty Trust; Director, Alexander's Inc.; prior to June, 2018, Director, Validus Holdings; Trustee, V&A Americas Foundation; prior to June 2021, Member, Wharton School Graduate Executive Board
(1) Trustees who are not "interested persons" of the Trust as defined in the 1940 Act. The term of office of the Independent Trustees is indefinite.
(3) Mr. Kelly also served as trustee of a predecessor fund to Rising Dividend Fund since 1998.
First Eagle Funds | Annual Report | October 31, 2023
247
Additional Information (unaudited)
Interested Trustees(4)(5)
John P. Arnhold | Trustee | December 1999 to present
1345 Avenue of the Americas | New York, New York | 10105
(born December 1953)
Principal Occupation(s) During Past 5 Years: Director, First Eagle Holdings, Inc.; Managing Member, Arnhold LLC; prior to July 2017, Director, First Eagle Investment Management LLC; President, First Eagle Funds; President, First Eagle Variable Funds; Director, FEF Distributors, LLC; prior to March 2016, Co-President and Co-CEO First Eagle Holdings, Inc.; CIO and Chairman, First Eagle Investment Management, LLC; CEO and Chairman, FEF Distributors, LLC
Number of Portfolios in the Fund Complex Overseen by Trustee: 12
Other Directorships/Trusteeships Held by Trustee: Trustee, First Eagle Variable Funds (1 portfolio) and First Eagle Credit Opportunities Fund (1 portfolio); Chairman and Director, Arnhold Ceramics; Director, The Arnhold Foundation; Chairman, The Mulago Foundation; Director, WNET.org; Trustee Emeritus, Trinity Episcopal Schools Corp.; Trustee, Jazz at Lincoln Center; Life Trustee, International Tennis Hall of Fame; Advisor, Investment Committee of the USTA; Managing Member, New Eagle Holdings Management Company, LLC; Trustee, Conservation International; Trustee, UC Santa Barbara Foundation; prior to January 2018, Director, First Eagle Amundi; prior to June 2016, Trustee, Vassar College
Mehdi Mahmud | Trustee | September 2019 to present
1345 Avenue of the Americas | New York, New York | 10105
(born September 1972)
Principal Occupation(s) During Past 5 Years: President and Chief Executive Officer, First Eagle Investment Management, LLC; President, First Eagle Funds, First Eagle Variable Funds and First Eagle Credit Opportunities Fund; prior to March 2016, Chairman and Chief Executive Officer, Jennison Associates LLC
Number of Portfolios in the Fund Complex Overseen by Trustee: 12
Other Directorships/Trusteeships Held by Trustee: Trustee, First Eagle Variable Funds (1 portfolio) and First Eagle Credit Opportunities Fund (1 portfolio); Director, First Eagle Amundi; Director, Third Point Reinsurance Ltd.
(4) Each of Messrs. Arnhold and Mahmud is treated as an Interested Trustee because of the professional roles each holds or has held with the Adviser.
(5) The term of office of each Interested Trustee is indefinite.
First Eagle Funds | Annual Report | October 31, 2023
248
Additional Information (unaudited)
Trustee Emeritus(6)
Jean-Marie Eveillard | Trustee Emeritus | June 2008 to present
1345 Avenue of the Americas | New York, New York | 10105
(born January 1940)
Principal Occupation(s) During Past 5 Years: Senior Adviser to First Eagle Investment Management, LLC since March 2009 through June 2021; formerly, Senior Vice President, First Eagle Investment Management, LLC since January 2000; previously, Portfolio Manager of First Eagle Global Fund, First Eagle Overseas Fund, First Eagle U.S. Value Fund, First Eagle Gold Fund, and First Eagle Variable Funds (portfolio management tenure: 1979-2004, March 2007-March 2009)
Number of Portfolios in the Fund Complex Overseen by Trustee: 11
Other Directorships/Trusteeships Held by Trustee: Trustee Emeritus, First Eagle Variable Funds (1 portfolio); Director, Varenne Capital Partners (French money management firm); Board member, Perspective (South African money management firm); Trustee, FIAF (Alliance Francaise); prior to March 2015, Trustee, The Frick Collection
Officers(7)
Mehdi Mahmud | President | June 2017 to present
1345 Avenue of the Americas | New York, New York | 10105
(born September 1972)
Principal Occupation(s) During Past Five (5) Years: President and Chief Executive Officer, First Eagle Investment Management, LLC; President, First Eagle Variable Funds and First Eagle Credit Opportunities Fund; Director, First Eagle Amundi; Chief Executive Officer, First Eagle Alternative Credit, LLC
Robert Bruno | Senior Vice President | December 1999 to present
1345 Avenue of the Americas | New York, New York | 10105
(born June 1964)
Principal Occupation(s) During Past Five (5) Years: Executive Managing Director, First Eagle Investment Management, LLC; President, FEF Distributors, LLC; Senior Vice President, First Eagle Variable Funds and First Eagle Credit Opportunities Fund
Joseph T. Malone | Chief Financial Officer | September 2008 to present
1345 Avenue of the Americas | New York, New York | 10105
(born September 1967)
Principal Occupation(s) During Past Five (5) Years: Managing Director, First Eagle Investment Management, LLC; Chief Financial Officer, First Eagle Variable Funds and First Eagle Credit Opportunities Fund
(6) Mr. Eveillard, as Trustee Emeritus, is a former member of the Board of Trustees and is invited to attend all Board meetings. He is not a Trustee for purposes of the Trust's Declaration of Trust, Delaware law or the Investment Company Act.
(7) The term of office of each officer is indefinite. Length of time served represents time served as an officer of the Trust (or its predecessor entities), although various positions may have been held during the period.
First Eagle Funds | Annual Report | October 31, 2023
249
Additional Information (unaudited)
Officers(7)—(continued)
Seth Gelman | Chief Compliance Officer | April 2023 to present
1345 Avenue of the Americas | New York, New York | 10105
(born August 1975)
Principal Occupation(s) During Past Five (5) Years: Chief compliance Officer and Managing Director, First Eagle Investment Management, LLC; Chief Compliance Officer, First Eagle Variable Funds and First Eagle Credit Opportunities Fund; prior to February 2023, Chief Compliance Officer of Insight Investment North America
David O'Connor | General Counsel | December 2017 to present
1345 Avenue of the Americas | New York, New York | 10105
(born February 1966)
Principal Occupation(s) During Past Five (5) Years: General Counsel and Executive Managing Director, First Eagle Investment Management, LLC; General Councel and Officer of First Eagle Variable Funds and First Eagle Credit Opportunities Fund; General Counsel, First Eagle Holdings, Inc.; Secretary and General Counsel, FEF Distributors, LLC; Director, First Eagle Amundi; Head of Legal & Compliance, First Eagle Private Fund
Sheelyn Michael | Secretary and Deputy General Counsel | December 2017 to present (Deputy General Counsel); December 2018 to present (Secretary)
1345 Avenue of the Americas | New York, New York | 10105
(born September 1971)
Principal Occupation(s) During Past Five (5) Years: Deputy General Counsel and Managing Director, First Eagle Investment Management, LLC; Secretary and Deputy General Counsel, First Eagle Variable Funds and First Eagle Credit Opportunities Fund; Director, First Eagle Investment Management, Ltd; Deputy General Counsel, First Eagle Private Credit Fund
Michael Luzzatto | Vice President | December 2004 to present
1345 Avenue of the Americas | New York, New York | 10105
(born April 1977)
Principal Occupation(s) During Past Five (5) Years: Managing Director, First Eagle Investment Management, LLC; Vice President, FEF Distributors, LLC; Vice President, First Eagle Variable Funds and First Eagle Credit Opportunities Fund; Vice President, First Eagle Private Credit Fund
(7) The term of office of each officer is indefinite. Length of time served represents time served as an officer of the Trust (or its predecessor entities), although various positions may have been held during the period.
First Eagle Funds | Annual Report | October 31, 2023
250
Trustees
Lisa Anderson
John P. Arnhold
Candace K. Beinecke (Chair)
Peter Davidson
Jean D. Hamilton
James E. Jordan
William M. Kelly
Paul J. Lawler
Mehdi Mahmud
Mandakini Puri
Trustee Emeritus
Jean-Marie Eveillard*
Officers
Mehdi Mahmud
President
Robert Bruno
Senior Vice President
Joseph T. Malone
Chief Financial Officer
Seth Gelman
Chief Compliance Officer
David O'Connor
General Counsel
Sheelyn Michael
Secretary & Deputy General Counsel
Michael Luzzatto
Vice President
Investment Adviser
First Eagle Investment Management, LLC
1345 Avenue of the Americas
New York, NY 10105
Legal Counsel
Sidley Austin LLP
787 Seventh Avenue
New York, NY 10019
Custodian
JPMorgan Chase Bank, N.A.
4 Chase Metrotech Center, Floor 16,
Brooklyn, NY 11245
Shareholder Servicing Agent
SS&C GIDS, Inc.
330 West 9th Street
Kansas City, MO 64105
800.334.2143
Underwriter
FEF Distributors, LLC
1345 Avenue of the Americas
New York, NY 10105
Independent Registered Public
Accounting Firm
PricewaterhouseCoopers LLP
300 Madison Avenue
New York, NY 10017
Additional information about the Trustees and Officers is included in the Funds' Statement of Additional Information.
* Mr. Eveillard is a former member of the Board of Trustees and is invited to attend all Board meetings. He is not a Trustee for purposes of the Trust's Declaration of Trust, Delaware law or the Investment Company Act.
This report is not authorized for distribution to prospective investors unless preceded or accompanied by a currently effective prospectus of First Eagle Funds.
First Eagle Funds | Annual Report | October 31, 2023
251

First Eagle Funds are offered by FEF Distributors, LLC,
1345 Avenue of the Americas, New York, NY 10105.
First Eagle Investment Management, LLC
1345 Avenue of the Americas, New York, NY 10105-0048
800.334.2143 www.firsteagle.com
The Registrant has adopted a code of ethics that applies to its principal executive officer and principal financial officer. Copies of the code of ethics may be requested free of charge by calling 1-800-334-2143 (toll free).
| Item 3. | Audit Committee Financial Expert. |
The Board of Trustees of the registrant has designated Paul J. Lawler, William M. Kelly and Jean Hamilton as Audit Committee Financial Experts. Mr. Lawler, Mr. Kelly and Ms. Hamilton are considered by the Board to be independent trustees.
| Item 4. | Principal Accountant Fees and Services |
For the Fiscal years ended October 31, 2023 and October 31, 2022, the aggregate PricewaterhouseCoopers LLP (PwC) audit fees for professional services rendered to the registrant were approximately $631,499 and $610,145, respectively. Fees included in the audit fees category are those associated with the annual audits of the financial statements and services that are normally provided in connection with statutory and regulatory filings.
For the fiscal years ended October 31, 2023 and October 31, 2022, the aggregate PwC fees for assurance and related services rendered to the registrant were approximately $0 and $0, respectively.
In each fiscal year ended October 31, 2023 and October 31, 2022, the aggregate tax fees billed by PwC for professional services rendered to the registrant were approximately $627,600 and $609,040, respectively.
Fees included in the tax fees category comprise all services performed by professional staff in the independent accountant’s tax division except those services related to audits. This category comprises fees for tax compliance and preparation of tax returns.
In each of the fiscal years ended October 31, 2023 and October 31, 2022, there were no fees billed by PwC for products and services, other than 4(a)-(c) above, rendered to the registrant.
(e)(1) The registrant’s audit committee has adopted a policy whereby audit and non-audit services performed by the registrant’s principal accountant for the registrant, its investment adviser, and any entity controlling, controlled by, or under common control with the investment adviser that provides ongoing services to the registrant require pre-approval by the committee or a designated member thereof. If such a service is required between regularly scheduled audit committee meetings, pre-approval may be authorized by one audit committee member with ratification at the next scheduled audit committee meeting. Waiver of pre-approval for audit and non-audit services requiring fees of a de minimis amount is not permitted.
(e)(2) No services included in (b) – (d) above were approved pursuant to paragraph (c)(7)(i)(C) of Rule 2-01 of Regulation S-X.
(f) According to PwC, for the fiscal year ended October 31, 2023, the percentage of hours spent on the audit of the registrant’s financial statements for the most recent fiscal year that were attributable to work performed by persons who are not full-time, permanent employees of PwC was 0%.
(g) Other than as described in the table above, the aggregate fees billed for the most recent fiscal year and the preceding fiscal year by the registrant’s principal accountant for non-audit services rendered to the registrant (“covered”), its investment adviser, and any entity controlling, controlled by, or under common control with the investment adviser (“non-covered”) that provides ongoing services to the registrant was $0 in 2023 and 2022.
(h) Not applicable.
(i) Not applicable.
(j) Not applicable.
| Item 5. | Audit Committee of Listed Registrants |
Not applicable at this time.
| Item 6. | Schedule of Investments |
Please see schedule of investments contained in the Report to Stockholders included under Item 1 of this Form N-CSR.
| Item 7. | Disclosure of Proxy Voting Policies and Procedures for Closed-End Management Investment Companies. |
Not applicable.
| Item 8. | Portfolio Managers of Closed-End Investment companies. |
Not applicable.
| Item 9. | Purchases of Equity Securities by Closed-End Management Investment Company and Affiliated Purchasers. |
Not applicable.
| Item 10. | Submission of Matters to a Vote of Security Holders. |
No material change to report at this time.
| Item 11. | Controls and Procedures. |
(a) In the opinion of the principal executive officer and principal financial officer, based on their evaluation, the registrant's disclosure controls and procedures are adequately designed and are operating effectively to ensure (i) that material information relating to the registrant, including its consolidated subsidiaries, is made known to them by others within those entities, particularly during the period in which this report is being prepared; and (ii) that information required to be disclosed by the registrant on Form N-CSR is recorded, processed, summarized and reported within the time periods specified in the Securities and Exchange Commission's rules and forms.
(b) There were no changes in the registrant's internal control over financial reporting that occurred during the registrant's most recent fiscal half-year (the registrant's second fiscal half-year in the case of an annual report) that have materially affected or are reasonably likely to materially affect, the registrant's internal control over financial reporting.
| Item 12. | Disclosure of Securities Lending Activities for Closed-End Management Investment Companies. |
Not applicable to this annual report.
(a)(1) Code of ethics required to be disclosed under Item 2 of Form N-CSR.
(a)(2) Certifications pursuant to Rule 30a-2(a) under the Investment Company Act of 1940 (17 CFR 270.30a-2(a)): Attached hereto.
(b) Certification pursuant to Rule 30a-2(b) under the Investment Company Act of 1940 (17 CFR 270.30a-2(b)): Attached hereto.
SIGNATURES
Pursuant to the requirements of the Securities Exchange Act of 1934 and the Investment Company Act of 1940, the registrant has duly caused this report to be signed on its behalf by the undersigned, thereunto duly authorized.
| (Registrant) | First Eagle Funds |
| | |
| By (Signature and Title)* | /s/ Mehdi Mahmud |
| | Mehdi Mahmud, President |
Date: December 26, 2023
Pursuant to the requirements of the Securities Exchange Act of 1934 and the Investment Company Act of 1940, this report has been signed below by the following persons on behalf of the registrant and in the capacities and on the dates indicated.
| By (Signature and Title)* | /s/ Mehdi Mahmud |
| | Mehdi Mahmud, Principal Executive Officer |
Date: December 26, 2023
| By (Signature and Title)* | /s/ Joseph T. Malone |
| | Joseph T. Malone, Principal Financial Officer |
Date: December 262023
* Print the name and title of each signing officer under his or her signature.