United States
Securities and Exchange Commission
Washington, D.C. 20549
Form 10-K
(Mark One) | | | | | |
| ☒ | ANNUAL REPORT PURSUANT TO SECTION 13 OR 15(d) OF THE SECURITIES EXCHANGE ACT OF 1934 |
For the fiscal year ended December 31, 2024
or
| | | | | |
| ☐ | TRANSITION REPORT PURSUANT TO SECTION 13 OR 15(d) OF THE SECURITIES EXCHANGE ACT OF 1934 |
For the transition period from to
Commission file number 000-24498
DIAMOND HILL INVESTMENT GROUP, INC.
(Exact name of registrant as specified in its charter)
| | | | | | | | |
| Ohio | | 65-0190407 |
(State of
incorporation) | | (I.R.S. Employer
Identification No.) |
325 John H. McConnell Blvd, Suite 200, Columbus, Ohio 43215
(Address of principal executive offices) (Zip Code)
Registrant’s telephone number, including area code: (614) 255-3333
Securities registered pursuant to Section 12(b) of the Act: | | | | | | | | | | | | | | |
| Title of each class | | Trading Symbol | | Name of each exchange on which registered |
| Common shares, no par value | | DHIL | | The Nasdaq Stock Market |
Securities registered pursuant to Section 12(g) of the Act: None
Indicate by check mark if the registrant is a well-known seasoned issuer, as defined in Rule 405 of the Securities Act. Yes ☐ No ☒
Indicate by check mark if the registrant is not required to file reports pursuant to Section 13 or Section 15(d) of the Act. Yes ☐ No ☒
Indicate by check mark whether the registrant (1) has filed all reports required to be filed by Section 13 or 15(d) of the Securities Exchange Act of 1934 during the preceding 12 months (or for such shorter period that the registrant was required to file such reports), and (2) has been subject to such filing requirements for the past 90 days. Yes ☒ No ☐
Indicate by check mark whether the registrant has submitted electronically every Interactive Data File required to be submitted pursuant to Rule 405 of Regulation S-T (§ 232.405 of this chapter) during the preceding 12 months (or for such shorter period that the registrant was required to submit such files). Yes ☒ No ☐
Indicate by check mark whether the registrant is a large accelerated filer, an accelerated filer, a non-accelerated filer, a smaller reporting company, or an emerging growth company. See the definitions of “large accelerated filer,” “accelerated filer,” “smaller reporting company,” and “emerging growth company” in Rule 12b-2 of the Exchange Act.
| | | | | | | | | | | | | | | | | | | | |
| Large accelerated filer | | ☐ | | Accelerated filer | | ☒ |
| | | | | | |
| Non-accelerated filer | | ☐ | | Smaller reporting company | | ☐ |
| | | | | | |
| | | | Emerging growth company | | ☐ |
If an emerging growth company, indicate by check mark if the registrant has elected not to use the extended transition period for complying with any new or revised financial accounting standards provided pursuant to Section 13(a) of the Exchange Act. ☐
Indicate by check mark whether the registrant has filed a report on and attestation to its management’s assessment of
the effectiveness of its internal control over financial reporting under Section 404(b) of the Sarbanes-Oxley Act (15 U.S.C.
7262(b)) by the registered public accounting firm that prepared or issued its audit report. ☒
If securities are registered pursuant to Section 12(b) of the Act, indicate by check mark whether the financial statements of the registrant included in the filing reflect the correction of an error to previously issued financial statements. ☐
Indicate by check mark whether any of those error corrections are restatements that required a recovery analysis of incentive-based compensation received by any of the registrant’s executive officers during the relevant recovery period pursuant to §240.10D-1(b). ☐
Indicate by check mark whether the registrant is a shell company (as defined in Rule 12b-2 of the Exchange Act). Yes ☐ No ☒
The aggregate market value of the registrant’s common shares (the only common equity of the registrant) held by non-affiliates on The Nasdaq Global Select Market was $368,996,675, based on the closing price of $140.75 on June 30, 2024. For these purposes only, calculation of holdings by non-affiliates is based upon the assumption that the registrant’s executive officers and directors are affiliates.
As of February 26, 2025, the registrant had 2,787,492 outstanding common shares.
Documents Incorporated by Reference
Portions of the registrant’s definitive Proxy Statement for its 2025 Annual Meeting of Shareholders to be filed pursuant to Regulation 14A under the Securities Exchange Act of 1934, as amended, are incorporated by reference into Part III of this Annual Report on Form 10-K.
Diamond Hill Investment Group, Inc.
Form 10-K
For the Fiscal Year Ended December 31, 2024
Index
PART I
Cautionary Note Regarding Forward-Looking Statements
This Annual Report on Form 10-K (this “Form 10-K”), the documents incorporated herein by reference and statements, whether oral or written, made from time to time by representatives of Diamond Hill Investment Group, Inc., an Ohio corporation organized in 1990 (“DHIL”, and collectively with its subsidiaries, the “Company”), may contain or incorporate “forward-looking statements” within the meaning of the Private Securities Litigation Reform Act of 1995, as amended (the “PSLR Act”), Section 27A of the Securities Act of 1933, as amended (the “Securities Act”), and Section 21E of the Securities Exchange Act of 1934, as amended (the “Exchange Act”). Such statements are provided under the “safe harbor” protection of the PSLR Act. Forward-looking statements include, but are not limited to, statements regarding anticipated operating results, prospects and levels of assets under management, technological developments, economic trends (including interest rates and market volatility), expected transactions and similar matters. The words “may,” “believe,” “expect,” “anticipate,” “target,” “goal,” “project,” “estimate,” “guidance,” “forecast,” “outlook,” “would,” “will,” “continue,” “likely,” “should,” “hope,” “seek,” “plan,” “intend,” and variations of such words and similar expressions identify such forward-looking statements. Similarly, descriptions of the Company’s objectives, strategies, plans, goals, or targets are also forward-looking statements. Forward-looking statements are based on the Company’s expectations at the time such statements are made, speak only as of the dates they are made and are susceptible to a number of risks, uncertainties and other factors. While the Company believes that the assumptions underlying its forward-looking statements are reasonable, investors are cautioned that any of the assumptions could prove to be inaccurate and, accordingly, the Company's actual results and experiences may differ materially from the anticipated results or other expectations expressed in its forward-looking statements.
Factors that may cause such actual results or experiences to differ materially from results discussed in the forward-looking statements include, but are not limited to: (i) any reduction in the Company’s assets under management (“AUM”) or assets under advisement (“AUA”); (ii) withdrawal, renegotiation, or termination of investment advisory agreements; (iii) damage to the Company’s reputation; (iv) failure to comply with investment guidelines or other contractual requirements; (v) challenges from the competition the Company faces in its business; (vi) challenges from industry trends towards lower fee strategies and model portfolio arrangements; (vii) adverse regulatory and legal developments; (viii) unfavorable changes in tax laws or limitations; (ix) interruptions in or failure to provide critical technological service by the Company or third parties; (x) adverse civil litigation and government investigations or proceedings; (xi) failure to adapt to or successfully incorporate technological changes, such as artificial intelligence (“AI”), into the Company’s business; (xii) risk of loss on the Company’s investments; (xiii) lack of sufficient capital on satisfactory terms; (xiv) losses or costs not covered by insurance; (xv) a decline in the performance of the Company’s products; (xvi) changes in interest rates and inflation; (xvii) changes in national and local economic and political conditions; (xix) the continuing economic uncertainty in various parts of the world; (xviii) the effects of pandemics and the actions taken in connection therewith; (xx) political uncertainty caused by, among other things, political parties, economic nationalist sentiments, tensions surrounding the current socioeconomic landscape; and (xix), other risks identified from time-to-time in the Company’s public documents on file with the U.S. Securities and Exchange Commission (“SEC”), including those discussed in Item 1A of this Form 10-K.
Forward-looking statements attributable to the Company or any person acting on its behalf are expressly qualified in their entirety by the cautionary statements above, in Item 1A of this Form 10-K, and in the Company’s other public documents on file with the SEC. New risks and uncertainties arise from time to time, and factors that the Company currently deems immaterial may become material, and it is impossible for the Company to predict these events or how they may affect it. The Company undertakes no obligation to update any forward-looking statements after the date they are made, whether as a result of new information, future events or developments, except as required by federal securities laws, although it may do so from time to time. Readers are advised to consult any further disclosures the Company makes on related subjects in its public announcements and SEC filings. The Company does not endorse any projections regarding future performance that may be made by third parties.
Overview
DHIL derives its consolidated revenue and net income from investment advisory and fund administration services provided by its wholly owned subsidiary, Diamond Hill Capital Management, Inc., an Ohio corporation (“DHCM”). DHCM is a registered investment adviser under the Investment Advisers Act of 1940, as amended (the “Advisers Act”), and is the investment adviser and administrator for the Diamond Hill Funds, a series of open-end mutual funds (each, a “Diamond Hill Fund”, and collectively, the “Diamond Hill Funds”) and the Diamond Hill Securitized Credit Fund, a closed-end registered investment company (“DHSC”, and collectively with the Diamond Hill Funds, the “Proprietary Funds”). DHCM also provides investment advisory and related services to the Diamond Hill Micro Cap Fund, LP (“DHMF”), a private fund, as well as separately managed accounts (“SMAs”), collective investment trusts (“CITs”), other pooled vehicles including sub-advised funds, and model delivery programs.
The Company believes focusing on generating excellent, long-term investment outcomes and building enduring client partnerships will enable it to grow its intrinsic value to achieve a compelling, long-term return for its shareholders.
The Company accomplishes this through its shared investment principles, including: (i) valuation-disciplined active portfolio management, (ii) fundamental bottom-up research, (iii) a long-term, business-owner mindset, and (iv) a client alignment philosophy that ensures clients’ interests come first. Client alignment is emphasized through: (i) a strategic capacity discipline that protects portfolio managers’ abilities to generate excess returns, (ii) personal investment by portfolio managers in the strategies they manage, (iii) portfolio manager compensation being driven by long-term investment results in client portfolios, and (iv) a fee philosophy focused on a fair sharing of the economics among clients, employees, and shareholders. The Company’s core cultural values of curiosity, ownership, trust, and respect create an environment where investment professionals focus on investment results and all teammates focus on the overall client experience.
The Company offers a variety of investment strategies designed for long-term strategic allocations from institutionally oriented investors in key asset classes, aligning its investment team’s competitive advantages with its clients’ needs.
Assets Under Management
DHCM’s principal source of revenue is investment advisory fee income earned from managing client accounts under investment advisory and sub-advisory agreements. The fees earned depend on the type of investment strategy, account size, and servicing requirements. DHCM’s revenues depend largely on the total value and composition of its AUM. Accordingly, net cash flows from clients, market fluctuations, and the composition of AUM impact the Company’s revenues and results of operations.
Model Delivery Programs - Assets Under Advisement
DHCM provides strategy-specific model portfolios to sponsors of model delivery programs. DHCM is paid for its services by the program sponsors at a pre-determined rate based on AUA in the model delivery programs. DHCM does not have discretionary investment authority over individual client accounts in the model delivery programs, and therefore, the AUA is not included in the Company’s AUM.
The Company’s revenues are highly dependent on both the value and composition of AUM and AUA. The following is a summary of the Company’s AUM by product and investment strategy, a roll-forward of the change in AUM, and a summary of AUA for each of the past three years ended December 31, 2024:
| | | | | | | | | | | | | | | | | | | | | |
| Assets Under Management and Assets Under Advisement
As of December 31, |
| (in millions) | 2024 | | 2023 | | 2022 | | | | |
| Proprietary Funds | $ | 18,097 | | | $ | 15,879 | | | $ | 14,745 | | | | | |
| Separately managed accounts | 6,108 | | | 6,617 | | | 6,220 | | | | | |
| Collective investment trusts | 1,947 | | | 1,359 | | | 1,040 | | | | | |
| Other pooled vehicles | 3,860 | | | 3,563 | | | 2,758 | | | | | |
| Total AUM | 30,012 | | | 27,418 | | | 24,763 | | | | | |
| Total AUA | 1,913 | | | 1,746 | | | 1,802 | | | | | |
| Total AUM and AUA | $ | 31,925 | | | $ | 29,164 | | | $ | 26,565 | | | | | |
| | | | | | | | | | | | | | | | | | | | | |
| Assets Under Management
by Investment Strategy
As of December 31, |
| (in millions) | 2024 | | 2023 | | 2022 | | | | |
| U.S. Equity | | | | | | | | | |
| Large Cap | $ | 17,702 | | | $ | 17,307 | | | $ | 16,478 | | | | | |
| Small-Mid Cap | 2,009 | | | 2,588 | | | 2,646 | | | | | |
| Mid Cap | 1,082 | | | 1,023 | | | 899 | | | | | |
| Select | 755 | | | 593 | | | 392 | | | | | |
| Small Cap | 253 | | | 255 | | | 306 | | | | | |
| Large Cap Concentrated | 129 | | | 98 | | | 99 | | | | | |
| Micro Cap | 33 | | | 21 | | | 15 | | | | | |
| Total U.S. Equity | 21,963 | | | 21,885 | | | 20,835 | | | | | |
| | | | | | | | | |
| Alternatives | | | | | | | | | |
| Long-Short | 1,684 | | | 1,725 | | | 1,752 | | | | | |
| Total Alternatives | 1,684 | | | 1,725 | | | 1,752 | | | | | |
| | | | | | | | | |
| International Equity | | | | | | | | | |
| International | 141 | | | 109 | | | 52 | | | | | |
| | | | | | | | | |
| Total International Equity | 141 | | | 109 | | | 52 | | | | | |
| | | | | | | | | |
| Fixed Income | | | | | | | | | |
| Short Duration Securitized Bond | 3,732 | | | 1,948 | | | 1,308 | | | | | |
| Core Fixed Income | 2,416 | | | 1,735 | | | 792 | | | | | |
| Securitized Credit | 52 | | | — | | | — | | | | | |
| Long Duration Treasury | 24 | | | 26 | | | 33 | | | | | |
| | | | | | | | | |
| | | | | | | | | |
| Total Fixed Income | 6,224 | | | 3,709 | | | 2,133 | | | | | |
| | | | | | | | | |
| Total-All Strategies | 30,012 | | | 27,428 | | | 24,772 | | | | | |
(Less: Investments in affiliated funds)(a) | — | | | (10) | | | (9) | | | | | |
| Total AUM | 30,012 | | | 27,418 | | | 24,763 | | | | | |
Total AUA(b) | 1,913 | | | 1,746 | | | 1,802 | | | | | |
| Total AUM and AUA | $ | 31,925 | | | $ | 29,164 | | | $ | 26,565 | | | | | |
(a) Certain of the Proprietary Funds own shares of the Diamond Hill Short Duration Securitized Bond Fund. The Company reduces the total AUM of each Proprietary Fund that holds such shares by the AUM of the investments held in this affiliated fund.
(b) AUA is primarily comprised of model portfolio assets related to the Large Cap and Select strategies.
| | | | | | | | | | | | | | | | | | | | | |
| Change in Assets Under Management
For the Year Ended December 31, |
| (in millions) | 2024 | | 2023 | | 2022 | | | | |
| AUM at beginning of the year | $ | 27,418 | | | $ | 24,763 | | | $ | 31,028 | | | | | |
| Net cash inflows (outflows) | | | | | | | | | |
| Proprietary Funds | 726 | | | (599) | | | (2,433) | | | | | |
| Separately managed accounts | (1,269) | | | (416) | | | (73) | | | | | |
| Collective investment trusts | 403 | | | 153 | | | 486 | | | | | |
| Other pooled vehicles | (149) | | | 368 | | | (221) | | | | | |
| (289) | | | (494) | | | (2,241) | | | | | |
| Net market appreciation/(depreciation) and income | 2,883 | | | 3,149 | | | (4,024) | | | | | |
| Increase (decrease) during the year | 2,594 | | | 2,655 | | | (6,265) | | | | | |
| AUM at end of the year | 30,012 | | | 27,418 | | | 24,763 | | | | | |
| AUA at end of year | 1,913 | | | 1,746 | | | 1,802 | | | | | |
| Total AUM and AUA at end of year | $ | 31,925 | | | $ | 29,164 | | | $ | 26,565 | | | | | |
Capacity
The Company’s ability to retain and grow its AUM has been, and will continue to be, primarily driven by delivering attractive long-term investment results. If the Company determines the size of a strategy could impede its ability to meet its investment objectives, the Company, where possible, may close that strategy to new clients. The Company’s commitment to capacity discipline inherently impacts its ability to grow its AUM as investment results are prioritized over asset accumulation.
The Company’s capacity as of December 31, 2024 was estimated to be $45 billion to $55 billion in domestic equities, $20 billion to $30 billion in international equities, and $50 billion to $70 billion in fixed income. The Company’s capacity increases with the development of new products or strategies.
Growth and Distribution Strategy
The Company’s growth centers first and foremost on delivering an investment and client experience that enables investors to experience better outcomes over the long-term. The Company’s client alignment philosophy guides it to develop strategies and offer vehicles that meet clients’ objectives, capitalize on its investment team’s research capabilities, and align with its investment principles.
The Company looks to attract like-minded, long-term focused clients across all of its offerings. To ensure efficient business development and relationship management, the Company has dedicated resources toward content-led marketing and sales enablement efforts. The Company believes that the combination of these efforts will lead to a deeper understanding of its investment strategies, and ultimately, longer holding periods for investors.
As an active investment boutique, the Company brings long-term oriented investment strategies to clients. Each strategy is designed to deliver excellent, long-term investment outcomes. It is imperative that the Company attracts and retains a diversified client base that philosophically aligns with the Company’s investment principles, long-term orientation, and understands the outcomes the Company can provide.
The Company’s distribution team focuses primarily on asset allocators with centralized research teams, allowing it to efficiently deliver services to a large and diversified client base. These asset allocators tend to be highly sophisticated buyers, who conduct deep research and pair the Company’s strategies with complementary strategies to meet holistic client objectives. These asset allocators include centralized research teams at institutional consulting firms, wirehouses, banks, independent broker dealers (“IBD”), and independent registered investment advisory firms (“RIAs”). The Company also believes having a focus on plan sponsors with their own investment research teams is important.
The Company’s distribution team members possess a deep understanding of the Company’s clients’ business models and needs. The team takes a consultative, customized approach to developing and maintaining relationships.
Creating a customized approach requires integrating marketing throughout the sales process and client lifecycle. A proactive, investment content-led marketing effort with a compelling digital ecosystem allows the Company to deliver the right content to the right clients/prospects in the right format at all stages of the client lifecycle.
Distribution technology and business intelligence, including the use of third-party data sets and advanced analytics, provide a solid and scalable foundation for all client interactions. Compiling, centralizing, and analyzing data regarding trends, prospects, purchasing patterns, and engagement informs resource allocation and segmentation of clients, enhancing the effectiveness of the Company’s distribution efforts. The Company’s intention is to deliver investment strategies to clients in the investment vehicle that best meets their unique needs.
Fund Administration Activities
DHCM provides fund administration services to the Proprietary Funds. Fund administration services are broadly defined to include the following services: portfolio and regulatory compliance; treasury and financial oversight; oversight of back-office service providers, such as the custodian, fund accountant, and transfer agent; and general business management and governance of the Proprietary Funds.
Competition
Competition in the investment management industry is intense, and DHCM’s competitors include investment management firms, broker-dealers, banks, and insurance companies, some of whom offer various investment alternatives, including passive index strategies, and strategies that invest in private equity and credit. Many of DHCM’s competitors are better known, offer a broader range of investment products, and have more dedicated resources for business development and marketing.
Regulation
The Company is subject to various federal, state, and non-U.S. laws and regulations. As a matter of public policy, regulatory bodies are charged with safeguarding the integrity of the securities and other financial markets, and with protecting the interests of participants in those markets, including investment advisory clients and shareholders of investment funds. If an adviser fails to comply with these laws and regulations, these regulatory bodies have broad administrative powers, including the power to limit, restrict, or prohibit an investment adviser from carrying on its business. Possible sanctions that regulatory bodies may impose include civil and criminal liability, the suspension of individual employees, limitations on engaging in certain lines of business for specified periods of time, revocation of investment adviser, broker-dealer, and other registrations, censures, and fines.
DHCM is registered with the SEC under the Advisers Act and operates in a highly regulated environment. The Advisers Act imposes numerous obligations on registered investment advisers, including fiduciary duties, recordkeeping requirements, operational requirements, and disclosure obligations. All of the Proprietary Funds are registered with the SEC under the Investment Company Act of 1940, as amended (“Company Act”), and are required to make notice filings with all states where the Proprietary Funds are offered for sale. Virtually all aspects of DHCM’s investment advisory and fund administration business are subject to various federal and state laws and regulations.
DHCM is a “fiduciary” under the Employee Retirement Income Security Act of 1974, as amended (“ERISA”), with respect to benefit plan clients, and therefore, is subject to ERISA regulations. ERISA and applicable provisions of the Internal Revenue Code of 1986, as amended, impose certain duties on persons who are fiduciaries, prohibit certain transactions involving ERISA plan clients, and provide monetary penalties for violations of these prohibitions. In recent years, the Department of Labor, which administers ERISA, has been active in proposing and adopting regulations affecting the asset management industry.
DHCM’s trading activities for client accounts are regulated by the SEC under the Exchange Act, which includes regulations governing trading on inside information, market manipulation, and a broad number of trading and market regulation requirements in the United States.
The preceding descriptions of the regulatory and statutory provisions applicable to DHCM are not exhaustive or complete and are qualified in their entirety by reference to the respective statutory or regulatory provisions. Failure to comply with these requirements could have a material adverse effect on DHCM’s business.
Contractual Relationships with the Diamond Hill Funds
DHCM is highly dependent on its contractual relationships with the Diamond Hill Funds. If any of DHCM’s advisory or administration agreements with the Diamond Hill Funds were terminated or not renewed, or were amended or modified to reduce fees, DHCM would be materially and adversely affected. DHCM generated approximately 66%, 68%, and 71% of its 2024, 2023, and 2022 revenues, respectively, from its advisory and administration agreements with the Diamond Hill Funds. DHCM believes that it has strong relationships with the Diamond Hill Funds and their board of trustees, and DHCM has no reason to believe that these advisory or administration contracts will not be renewed in the future. However, there is no assurance that the Diamond Hill Funds will choose to continue their relationships with DHCM. Please see Item 1A for risk factors regarding this relationship.
Human Capital
The Company believes its people are its greatest asset, and each role within the firm contributes to its goals of generating excellent, long-term investment outcomes and building enduring client partnerships.
Workforce Data
Attracting, developing, and retaining talented employees is integral to the Company’s human capital strategy and critical to its success. The Company depends on highly skilled personnel, with specialized expertise and extensive experience in the investment management industry. The Company’s overall headcount has remained relatively consistent over the last five years, and was 127 as of December 31, 2024, two employees fewer than as of December 31, 2023.
The average employee tenure is 8.3 years, and more than one-third of its employees have been with the Company more than 10 years. The Company’s five-year average employee turnover rate is 7.4%. The Company’s employees are based in 12 states, and approximately 80% of its employees reside in Ohio.
As of December 31, 2024, females represented 43% of DHIL’s board of directors (“Board”), 67% of the Company’s management team, and approximately 33% of its employees. As of December 31, 2024, racial or ethnic minorities represented approximately 14% of the Company’s workforce and 14% of the Board. Please see additional demographic details on the Company’s website.
Competitive Pay and Benefits
The Company’s competitive compensation and benefits are designed to help attract, retain, and motivate employees who embody its values. The Company aligns its employees’ compensation with client outcomes, individual and team results, and company performance.
Culture
The Company’s culture emphasizes four key values: curiosity, ownership, trust and respect. The way its employees embody these core values creates the Company’s culture. The culture allows the Company to attract and retain employees who share its commitment to client alignment, are motivated by investment excellence, and are committed to delivering excellent outcomes. Diversity, equity, and inclusion is embedded in the policies, practices, and strategic initiatives of the Company, ensuring we have teams that encourage varied points of view. The Company believes clients are best served by decision making that engages diverse perspectives.
Our culture manifests itself in a variety of ways. Employees who are curious focus on continuous self-improvement and have a passion for learning. They are open-minded, seek differing perspectives, and go beyond surface-level assumptions. Employees who think and act like business owners naturally embrace a long-term mindset. They lead by example and accept accountability for ensuring strong client outcomes. Employees who embrace trust act with integrity, are authentic and honest in interactions with others, and put client interests ahead of all others. Employees who are motivated by giving and receiving respect communicate and provide feedback candidly, transparently, and with positive intent. They are humble in their assumptions and listen to better understand others. They embrace, value, and celebrate diversity, inclusion, and differences in all forms, and recognize that transparency and accountability are critical to driving real change within the firm, in the industry, and within their community.
The Company’s culture revolves around the fact that DHCM is a fiduciary first and foremost. The primary focus is serving its clients. The Company’s long-term, valuation-disciplined investment principles are foundational to its culture and have been consistently implemented since the firm’s inception. All members of the investment team believe in, and adhere to, the same investment principles. The Company’s employees invest alongside its clients, and portfolio managers have significant personal investments in the strategy or strategies they manage.
SEC Filings
The Company maintains a website at www.diamond-hill.com. The Company’s Annual Reports on Form 10-K, Quarterly Reports on Form 10-Q, Current Reports on Form 8-K, and amendments to those reports that it files or furnishes from time-to-time pursuant to Section 13(a) or 15(d) of the Exchange Act, are made available free of charge, on or through the Investor Relations section of the Company’s website, as soon as reasonably practicable after such material is electronically filed with, or furnished to, the SEC. Information contained on the Company’s website is not part of this Form 10-K or any other report or document that it files with, or furnishes to, the SEC. These reports are also available free of charge on the SEC’s website at http://www.sec.gov.
The Company’s future results of operations, financial condition, liquidity, and capital resources as well as the market price of its common shares, are subject to various risks, including those risks mentioned below and elsewhere in this Form 10-K as well as those risks that are discussed from time-to-time in the Company’s other filings with the SEC. Investors should carefully consider these risks before making an investment decision regarding the Company’s securities. There may be additional risks of which the Company is currently unaware, or of which the Company currently considers to be immaterial. The occurrence of any of these risks could have a material adverse effect on the Company’s financial condition, results of operations, liquidity, capital resources and the value of its securities. Please see “Forward Looking Statements” within Part I, Item 1, of this Form 10-K.
Business Risks
Poor investment results or adverse ratings of the Company’s products could affect its ability to attract new clients or could reduce its AUM, potentially negatively impacting revenue and net income.
If the Company fails to deliver acceptable investment results for its clients, both in the short and long-term, the Company could experience diminished investor interest and a decrease in its AUM.
Investment strategies are assessed and rated by independent third parties, including rating agencies, industry analysts, and publications. Investors can be influenced by such ratings. If a Company strategy receives an adverse report, it could negatively impact the Company’s AUM and revenues.
The Company’s success depends on its key personnel, and its financial performance could be negatively affected by the loss of their services.
The Company’s success depends on highly skilled personnel, including portfolio managers, research analysts, and management, many of whom have specialized expertise and extensive experience in the investment management industry. Financial services professionals are in high demand, and the Company faces significant competition for qualified employees. Other than the Company’s Chief Executive Officer, its employees do not have employment contracts and generally can terminate their employment at any time. The Company may not be able to retain or replace key personnel. To retain or replace its key personnel, the Company may be required to increase compensation, which would decrease its net income. The loss of key personnel could damage the Company’s reputation and make it more difficult to retain and attract new employees and clients. A loss of client assets resulting from the departure of key personnel may materially decrease the Company’s revenues and net income.
The Company’s investment results and/or growth in its AUM may be constrained if appropriate investment opportunities are not available or if the Company closes certain of its investment strategies to new investors.
The Company’s ability to deliver excellent investment results depends in large part on its ability to identify appropriate investment opportunities in which to invest client assets. If the Company is unable to identify sufficient investment opportunities for existing and new client assets on a timely basis, its investment results could be adversely affected. The risk that appropriate investment opportunities may be unavailable is influenced by a number of factors, including general market conditions, and is likely to increase if the Company’s AUM increases rapidly. The Company’s efforts to establish and develop new strategies may face challenges or ultimately be unsuccessful, which could impact its results of operations, reputation, and/or culture. In addition, if the Company determines that sufficient investment opportunities are not available for an investment strategy, or it believes that it is necessary to continue to produce attractive returns from an investment strategy, the Company will consider closing the investment strategy to new investors. If the Company misjudged the point at which it would be
optimal to close an investment strategy, the investment results of the strategy could be negatively impacted. The Company has closed investment strategies in the past and may do so again in the future. As of December 31, 2024, the Company does not have any closed investment strategies.
The Company is subject to substantial competition in all aspects of its business.
The Company’s investment products compete against investment products and services from:
•Asset management firms;
•Mutual fund companies;
•Commercial banks and thrift institutions;
•Insurance companies;
•Interval and other closed-end funds;
•Exchange-traded funds;
•Private funds, including hedge funds and private equity and credit funds; and
•Brokerage and investment banking firms.
Many of the Company’s competitors have substantially greater resources and may operate in more markets or offer a broader range of products, including passively managed or “index” products. Some of these institutions operate in a different regulatory environment, which may give them certain competitive advantages in the investment products and portfolio structures that they offer. The Company competes with other providers of investment services primarily based upon its philosophy, performance, and quality of client service. Some institutions have a broader array of products and distribution channels, which makes it more difficult for the Company to compete. If current or potential clients decide to use one of the Company’s competitors, it could face a significant decline in AUM, AUA, revenues, and net income. If the Company is required to lower its fees to remain competitive, its net income could be significantly reduced because some of the Company’s expenses are fixed, especially over shorter periods of time, and its expenses may not decrease in proportion to the decrease in revenues. Additionally, over the past several years, investors have generally shown a preference for passive investment products over actively managed strategies. If this trend continues, the Company’s AUM, revenues, and net income may be negatively impacted.
Industry trends towards lower fee strategies and model portfolio arrangements could adversely impact the Company’s revenues.
Market and competitive pressures in recent years have created a trend towards lower management fees in the asset management industry and there can be no assurance that the Company will be able to maintain its current fee structure. As a result, a shift in the Company’s AUM from higher to lower fee generating clients and strategies could result in a decrease in revenues even if its AUM increases or remains unchanged. Similarly, in recent years, there has been a trend in clients shifting their assets from higher fee mutual funds and SMAs to lower fee model portfolio arrangements. As a result, a shift in the Company’s client assets from AUM to AUA could result in a decrease in Company revenues.
The loss of access to, or increased fees required by, third-party distribution sources to market the Company’s portfolios and access its client base could adversely affect the Company’s results of operations.
The Company’s ability to attract additional AUM is dependent on its relationship with third-party financial intermediaries. The Company compensates some of these intermediaries for access to investors and for various marketing services provided. These distribution sources and client bases may not continue to be accessible to the Company under reasonable terms, or at all. If such investor access is restricted or eliminated, it could have an adverse effect on the Company’s results of operations. Fees paid to financial intermediaries for investor access and marketing services have generally increased in recent years. If such fee increases continue, refusal to pay them could restrict the Company’s access to those client bases while paying them could adversely affect its profitability.
A significant portion of DHCM's revenues are based on advisory and administration agreements with the Diamond Hill Funds that are subject to termination without cause and on short notice.
DHCM is highly dependent on its contractual relationships with the Diamond Hill Funds. If DHCM’s advisory or administration agreements with the Diamond Hill Funds were terminated or not renewed, or were amended or modified to reduce fees, DHCM would be materially and adversely affected. Generally, these agreements are terminable by either party upon 60 days’ prior written notice without penalty. The Diamond Hill Funds’ agreements are subject to annual approval by either: (i) their board of trustees, or (ii) a vote of the majority of the outstanding voting securities of each Diamond Hill Fund.
These agreements automatically terminate in the event of their assignment by either DHCM or the Diamond Hill Funds. DHCM generated approximately 66%, 68%, and 71% of its 2024, 2023, and 2022 revenues, respectively, from its advisory and administration agreements with the Diamond Hill Funds, including 29% and 11% from the advisory contracts with the Diamond Hill Large Cap Fund and the Diamond Hill Long-Short Fund during 2024. The loss of either the Diamond Hill Large Cap Fund or Diamond Hill Long-Short Fund contracts would have a material adverse effect on DHCM. DHCM believes that it has strong relationships with the Diamond Hill Funds and their board of trustees, and it has no reason to believe that these advisory or administration contracts will not be renewed in the future. However, there can be no assurance that the Diamond Hill Funds will choose to continue their relationships with DHCM.
Negative public opinion of the Company could cause it to lose clients and adversely affect its share price.
Negative public opinion can result from the Company’s actual or alleged conduct in any number of activities, including trading practices, corporate governance and acquisitions, DEI issues, social media and other marketing activities, and actions taken by governmental regulators and community organizations in response to any of the foregoing. Negative public opinion could adversely affect the Company’s ability to attract and maintain clients, could expose the Company to potential litigation or regulatory action, and could have a material adverse effect on its share price or result in heightened volatility.
Operational Risks
Cybersecurity attacks could prevent the Company from managing client portfolios, cause the unauthorized disclosure of sensitive or confidential client or employee information or result in misappropriation of information or funds, each of which could severely harm its business.
As part of its business, the Company collects, processes, and transmits sensitive and confidential information about its clients and employees, as well as proprietary information about its business. The Company has policies and procedures pursuant to which it takes numerous security measures to prevent cyberattacks of various kinds as well as fraudulent and inadvertent activity by persons who have been granted access to such sensitive or confidential information. Nevertheless, the Company’s systems, like all technology systems, remain vulnerable to unauthorized access, which can result in theft or corruption of information. In addition, the Company shares information with third-party vendors upon whom it relies for various functions. The systems of such third parties also are vulnerable to cyber threats. Unauthorized access can come from unrelated third parties through the internet, from access to hardware removed from the Company’s or those third parties’ premises, or from employees acting intentionally or inadvertently.
Cybersecurity incidents can involve, among other things: (i) deliberate attacks designed to corrupt the Company’s information systems and make them unusable by the Company to operate its business; (ii) theft of information used by the perpetrators for financial and other gain; or (iii) inadvertent releases of information by employees or third parties with whom the Company does business.
Cyberattacks that corrupt the Company’s information systems and make them unusable could impair its ability to trade securities in its clients’ accounts. Corruption of the systems of the Company’s third-party vendors could impact the Company to the same extent as corruption of its own systems. If information about the Company’s employees or clients is intentionally stolen or inadvertently made public, that information could be used to commit identity theft, obtain credit in an employee’s or client’s name, or steal from an employee or client. If information about the Company’s business is obtained by unauthorized persons, whether through intentional attacks or inadvertent releases of information, it could be used to harm its competitive position.
Whether information is corrupted, stolen, or inadvertently disclosed, and regardless of the type and nature of the information (e.g., proprietary information about the Company’s business or personal information about clients or employees), it could have various adverse impacts on, and be materially harmful to, the Company, including the following:
•The Company’s reputation could be harmed, resulting in the loss of clients, vendors, and employees or making payments or concessions to such persons to maintain its relationships with them;
•The Company’s inability to operate its business fully, even if temporarily, and thus, fulfill contracts with clients or vendors, could result in termination of contracts and loss of revenue;
•Harm suffered by clients or vendors whose contracts have been breached, or by clients, vendors, or employees whose information is compromised, could result in costly litigation against the Company;
•The Company’s need to focus attention on remediation of a cybersecurity issue could take its attention away from the operation of its business, resulting in lost revenue;
•The Company could incur costs to repair systems made inoperable by a cyberattack and to make changes to its systems to reduce future cyber threats. Those changes could include, among other things, obtaining additional technologies as well as employing additional personnel and training employees;
•The interruption of the Company’s business or theft of proprietary information could harm its ability to compete; and
•Any losses that the Company may be responsible to bear may not be covered by insurance.
Any of the above potential impacts of a cybersecurity incident, individually or collectively, could have a material adverse effect on the Company’s business, financial condition, and results of operations.
The Company may not be able to adapt to technological change.
The financial services industry is continually undergoing rapid technological change with frequent introductions of new technology-driven products and services. The effective use of technology increases efficiency and enables financial institutions to better serve clients while reducing costs. The Company’s future success depends, in part, upon its ability to address client needs by using technology to provide products and services that will satisfy client demands, as well as to create additional efficiencies in its operations. The Company may not be able to implement effectively new technology-driven products and services or be successful in marketing these products and services to its clients. Failure to successfully keep pace with technological changes affecting the financial services industry could negatively affect the Company’s growth, revenue, and profit.
The Company operates in an intensely competitive business environment. It may not be as successful as its competitors incorporating AI into its business or adapting to a rapidly changing marketplace.
The Company’s competitors may be larger, more diversified, better funded, and have access to more advanced technology, including generative AI. These competitive advantages may enable its competition to innovate better and more quickly, or to compete more effectively on quality and price, which could cause the Company to lose business and profitability. Burgeoning interest in AI may increase competition and disrupt the Company’s business model. AI may lower barriers to entry in the industry and the Company may be unable to effectively compete with the products or services offered by new competitors. AI-related changes to the products and services on offer may affect customer expectations, requirements, or tastes in ways that the Company cannot adequately anticipate or adapt to, causing its business to lose revenues, market share, or the ability to operate profitably and sustainably.
Operational risks may disrupt the Company’s business, result in losses, or limit its growth.
The Company is dependent on the capacity and reliability of the communications, information, and technology systems supporting its operations, whether developed, owned, or operated internally by the Company or by third parties. Operational risks, such as trading or operational errors, interruption of the Company’s financial, accounting, trading, compliance, and other data processing systems, the loss of data contained in such systems, or compromised systems due to cyberattack, could result in a disruption of the Company’s business, liability to clients, regulatory intervention, or reputational damage, and thus, adversely affect its business.
Employee misconduct could harm the Company by impairing its ability to attract and retain clients and subjecting the Company to significant legal liability, regulatory scrutiny and reputational harm.
The Company’s controls and procedures may fail or be circumvented, its risk management policies and procedures may be inadequate,and operational risks could adversely affect its reputation and financial condition.
The Company has developed and continues to update strategies and procedures specific to its business for managing risks, which include market risk, liquidity risk, operational risk and reputational risk. Management of these risks can be very complex. These strategies and procedures may fail under some circumstances, particularly if the Company is confronted with risks that it has underestimated or not identified. Some of the Company’s risk evaluation methods depend upon information provided by others and public information regarding markets, clients, or other matters that are otherwise accessible by the Company. If the Company’s policies and procedures are not fully effective or it is not successful in capturing all risks to which it is or may be exposed,the Company may suffer harm to its reputation or be subject to litigation or regulatory actions that could have a material adverse effect on its business, results of operations,or financial condition.
Industry, Market, and Economic Risks
The Company’s AUM, which impacts revenue, is subject to significant fluctuations.
The majority of the Company’s revenue is calculated as a percentage of AUM or is related to the general performance of the equity securities markets. A decline in securities prices or in the sale of investment products, or an increase in client redemptions, generally will reduce revenue and net income. Financial market declines will generally negatively impact the level of the Company’s AUM, and consequently, its revenue and net income. A recession or other economic or political events, whether in the United States or globally could also adversely impact the Company’s revenue, if such events led to a decreased demand for products, a higher redemption rate, or a decline in securities prices. Investor interest in the Company’s fixed income strategies is affected by changes in interest rates and the overall credit environment. In addition, the majority of the Company’s existing AUM is managed in primarily long-only, equity investment strategies, which exposes it to greater risk than certain of its competitors who may manage assets in more diverse strategies.
The Company’s investment approach may underperform other investment approaches during certain market conditions.
The Company’s investment strategies are best suited for investors with long-term investment time horizons. The Company’s investment strategies may not perform well during certain periods of time. Additionally, the Company has, and is expected to continue to have, common positions and industry concentrations across its strategies at the same time. As such, factors leading to underperformance may impact multiple strategies simultaneously.
The Company’s investment income and asset levels may be negatively impacted by fluctuations in its investment portfolio.
The Company currently has a substantial portion of its assets invested in investment strategies that it manages. All of these investments are subject to market risk and the Company’s non-operating investment income could be adversely affected by market performance. Fluctuations in investment income are expected to occur in the future.
Trading in DHIL common shares is limited, which may adversely affect the time and the price at which shareholders can sell their shares.
Although DHIL common shares are listed on The Nasdaq Global Select Market, the shares are held by a relatively small number of shareholders, and trading in its common shares is relatively inactive. Certain shareholders, including certain of the Company’s directors and officers, own a significant number of shares. The spread between the bid and the ask prices is often wide. As a result, shareholders may not be able to sell their shares on short notice, and the sale of a large number of shares at one time could temporarily depress the market price.
Regulatory Risks
Changes in tax laws and unanticipated tax obligations could have an adverse impact on the Company’s financial condition, results of operations, and cash flow.
The Company is subject to federal, state, and local income taxes in the United States. We cannot predict future changes in the tax regulations to which we are subject, and any such changes could have a material impact on our tax liability or result in increased costs of our tax compliance efforts. Tax authorities may disagree with certain positions that the Company has taken or may implement changes in tax policy, which may result in the assessment of additional taxes on the Company. The Company regularly assesses the appropriateness of its tax positions and reporting. The Company cannot provide assurances, however, that tax authorities will agree with the positions it has taken, or that the Company will accurately predict the outcomes of audits, and the actual outcomes of these audits could be unfavorable.
The Company’s business is subject to substantial governmental regulation, which can change frequently and may increase costs of compliance, reduce revenue, result in fines, penalties, and lawsuits for noncompliance, and adversely affect its results of operations and financial condition.
The Company’s business is subject to a variety of federal securities laws, including the Advisers Act, the Company Act, the Securities Act, the Exchange Act, the Sarbanes-Oxley Act of 2002, the U.S. PATRIOT Act of 2001, and the Dodd-Frank Wall Street Reform and Consumer Protection Act of 2010, each as amended. In addition, the Company is subject to significant regulation and oversight by the SEC. Changes in legal, regulatory, accounting, tax, and compliance requirements could have a significant effect on the Company’s operations and results, including, but not limited to, increased expenses and reduced investor interest in certain funds and other investment products that the Company offers. The Company continually monitors legislative, tax, regulatory, accounting, and compliance developments that could impact its business. The Company and its directors, officers, and employees could be subject to lawsuits or regulatory proceedings for violations of such laws and
regulations, which could result in the payment of fines or penalties and cause reputational harm to the Company, which could negatively affect its financial condition and results of operations, as well as divert management’s attention from its operations.
General Risk Factors
The Company’s insurance policies may not cover all losses and costs to which it may be exposed.
The Company carries insurance in amounts and under terms that it believes are appropriate. The Company’s insurance may not cover all liabilities and losses to which it may be exposed. Certain insurance coverage may not be available or may be prohibitively expensive in future periods. As the Company’s insurance policies come up for renewal, it may need to assume higher deductibles or pay higher premiums, which could have an adverse impact on its results of operations and financial condition.
Natural disasters, global pandemics, and other unpredictable events could adversely affect the Company’s operations.
Natural disasters, outbreaks of epidemics or pandemics, terrorist attacks, extreme weather events or other unpredictable events could adversely affect the Company’s revenues, expenses, and net income by:
•Decreasing investment valuations in, and returns on, the investment portfolios that the Company manages and its corporate investments, thus, causing reductions in AUM, AUA, and revenue;
•Causing disruptions in national or global economies that decrease investor confidence and make investment products generally less attractive;
•Reducing the availability of key personnel necessary to conduct the Company’s business activities;
•Interrupting the Company’s business operations or those of critical service providers;
•Triggering technology delays or failures; and/or
•Requiring substantial capital expenditures and operating expenses to restore the Company’s operations.
The Company has developed various backup systems and contingency plans but cannot be assured that those preparations will be adequate in all circumstances that could arise, or that material interruptions and disruptions will not occur. The Company also relies to varying degrees on outside vendors for service delivery in addition to technology and disaster contingency support. There is a risk that these vendors will not be able to perform in an adequate and timely manner. If the Company’s operations or its employees’ ability to perform their duties is temporarily disrupted, or if the Company is unable to respond adequately to such an event in a timely manner, revenues, expenses, and net income could be negatively impacted.
| | | | | |
| ITEM 1B. | Unresolved Staff Comments |
None.
The Company is subject to several material risks related to cybersecurity threats. A cybersecurity attack could prevent the Company from managing client portfolios, cause the unauthorized disclosure of sensitive or confidential client or employee information, and/or result in misappropriation of information or funds, which individually or collectively could severely harm its business. In 2024, the Company did not identify any cybersecurity risks that have materially affected or are reasonably likely to materially affect its business strategy, results of operations, or financial condition. However, despite its efforts, the Company cannot eliminate all risks from cybersecurity threats or incidents, or provide assurances that it has not experienced an undetected cybersecurity incident. For more information about these risks, please see Item 1A.
The Company has an Information Security Committee (the “Committee”) to identify, assess, and manage cybersecurity risks and to implement necessary policies and procedures to mitigate those risks. The Committee also coordinates employee education efforts throughout the year. The Technology Risk & Information Security Officer serves as the Committee chair and the day-to-day manager of the Company’s information security management systems. The Committee is comprised of members having expertise in information technology infrastructure, data security, risk management, compliance, legal, and business continuity and recovery efforts. The Committee identifies and assesses risks by understanding and evaluating the Company’s systems, processes, data, and controls. This information is then augmented through participation by certain
Committee members in industry threat intelligence groups designed to share best practices and emerging threats related to cybersecurity. The Committee also completes a full cybersecurity risk assessment annually, which drives the implementation of policies and procedures as well as the scope of third-party testing. The Committee has implemented an information security program that includes a comprehensive set of cybersecurity policies and procedures that follows standards established by the International Organization for Standardization (“ISO 27001”). The policies and procedures within the program, among other things, are to oversee, identify, and mitigate the Company’s cybersecurity risks as well as cybersecurity risks to the Company associated with its significant service providers and vendors. The Company’s cybersecurity policies and procedures have been independently certified by a third party as compliant with the ISO 27001 standard. The Committee engages third-party experts to perform penetration tests on a periodic basis and to assess whether these policies and procedures are designed appropriately and operating effectively.
Cybersecurity oversight forms part of the Board’s risk oversight of the Company. The Board oversees efforts by management to manage the cybersecurity risks to which the Company may be exposed. The Board receives quarterly reports and meets periodically with the Committee chair. From its review of these reports and discussions with management and the Committee chair, the Board ensures it has sufficient awareness of the material cybersecurity risks to which the Company is exposed, enabling a dialogue about how management manages and mitigates those risks. The Board currently has four members who have obtained certifications in cybersecurity oversight.
The Company leases office space and conducts its general operations at one location, the address of which is 325 John H. McConnell Boulevard, Suite 200, Columbus, Ohio 43215. The Company does not own any real estate or interests in real estate.
The Company is not aware of any pending legal proceedings that the Company believes will have, individually or in the , a material adverse effect on its consolidated financial statements.
| | | | | |
| ITEM 4. | Mine Safety Disclosures |
Not applicable.
PART II
| | | | | |
| ITEM 5. | Market for Registrant’s Common Equity, Related Shareholder Matters and Issuer Purchases of Equity Securities |
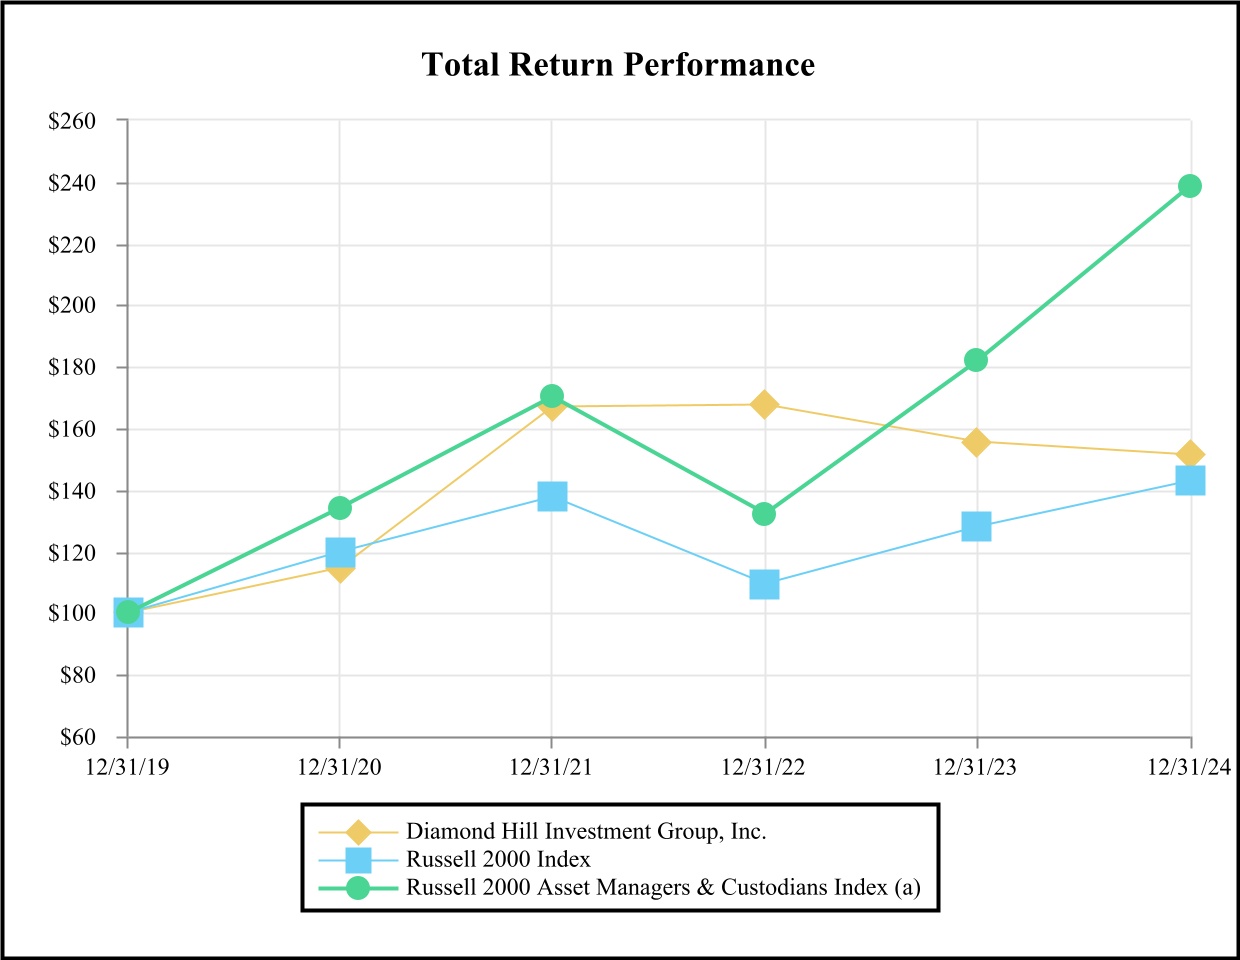
The following performance graph compares the cumulative total shareholder return of an investment in DHIL common shares to that of the Russell 2000 Index and the Russell 2000 Asset Managers & Custodians Index (the “R2000 A&C Index”) for the five-year period ended December 31, 2024. The graph assumes that the value of the investment in DHIL common shares and each index was $100 on December 31, 2019. Total return includes reinvestment of all dividends. The Russell 2000 Index measures the performance of approximately 2,000 small-cap U.S. equities, and was selected as a broad equity market index comprised of companies with comparable market capitalization to DHIL. The R2000 A&C Index is comprised of the Asset Managers & Custodians subsector of the Russell 2000 Index, and provides a comparison to companies with comparable market capitalization to DHIL that operate in the same industry as the Company. The historical information set forth below is not necessarily indicative of future performance. The Company does not make or endorse any predictions as to future share performance.
| | | | | | | | | | | | | | | | | | | | | | | | | | | | | | | | | | | | | | |
| 12/31/2019 | | 12/31/2020 | | 12/31/2021 | | 12/31/2022 | | 12/31/2023 | | 12/31/2024 | Cumulative 5 Year Total Return |
| Diamond Hill Investment Group, Inc. | $100 | | $115 | | $167 | | $168 | | $156 | | $151 | 51 | % |
| Russell 2000 Index | $100 | | $120 | | $138 | | $110 | | $128 | | $143 | 43 | % |
Russell 2000 Asset Managers & Custodians Index(a) | $100 | | $134 | | $170 | | $132 | | $182 | | $239 | 139 | % |
(a) The R2000 A&C Index used to calculate the returns includes the following companies by year:
| | | | | | | | | | | | | | |
| 2020 | 2021 | 2022 | 2023 | 2024 |
| Arlington Asset Investment Corp. | Arlington Asset Investment Corp. | Associated Capital Group, Inc. | Associated Capital Group, Inc. | AlTi Global, Inc. |
| Associated Capital Group, Inc. | Associated Capital Group, Inc. | AssetMark Financial Holdings, Inc. | AlTi Global, Inc. | AssetMark Financial Holdings, Inc. |
| AssetMark Financial Holdings, Inc. | AssetMark Financial Holdings, Inc. | Artisan Partners Asset Management, Inc. | AssetMark Financial Holdings, Inc. | Artisan Partners Asset Management, Inc. |
| Artisan Partners Asset Management, Inc. | Artisan Partners Asset Management, Inc. | Blucora, Inc. | Artisan Partners Asset Management, Inc. | BrightSphere Investment Group Inc |
| Ares Management Corporation | Blucora, Inc. | Brookfield Business Corp. | Avantax, Inc. | Brookfield Business Corp. |
| BrightSphere Investment Group, Inc. | BrightSphere Investment Group, Inc. | BrightSphere Investment Group, Inc. | Brookfield Business Corp. | Burford Capital Limited |
| Cohen & Steers, Inc. | Cohen & Steers, Inc. | Cohen & Steers, Inc. | BrightSphere Investment Group, Inc. | Cohen & Steers, Inc. |
| Cowen Inc | Cowen Inc | Diamond Hill Investment Group, Inc. | Cohen & Steers, Inc. | Diamond Hill Investment Group, Inc. |
| Diamond Hill Investment Group, Inc. | Diamond Hill Investment Group, Inc. | Federated Hermes, Inc. | Diamond Hill Investment Group, Inc. | GCM Grosvenor, Inc. |
| Federated Hermes, Inc. | Federated Hermes, Inc. | Focus Financial Partners, Inc. | Federated Hermes, Inc. | Hamilton Lane Incorporated |
| Focus Financial Partners, Inc. | Focus Financial Partners, Inc. | GAMCO Investors, Inc. | Focus Financial Partners, Inc. | Patria Investments Ltd. |
| GAMCO Investors, Inc. | GAMCO Investors, Inc. | GCM Grosvenor, Inc. | GCM Grosvenor, Inc. | PJT Partners, Inc. |
| Greenhill & Co., Inc. | GCM Grosvenor, Inc. | Greenhill & Co., Inc. | Hamilton Lane Incorporated | Perella Weinberg Partners |
| Hamilton Lane Incorporated | Greenhill & Co., Inc. | Hamilton Lane Incorporated | Oppenheimer Holdings Inc. | P10, Inc. |
| Morgan Group Holding Co. | Hamilton Lane Incorporated | Manning & Napier, Inc. | Patria Investments Ltd. | Silvercrest Asset Management Group Inc. |
| Oppenheimer Holdings Inc. | MMA Capital Holdings, Inc. | Oppenheimer Holdings Inc. | PJT Partners, Inc. | StepStone Group, Inc. |
| PJT Partners, Inc. | Oppenheimer Holdings Inc. | PJT Partners, Inc. | Perella Weinberg Partners | Victory Capital Holdings, Inc. |
| Pzena Investment Management, Inc. | PJT Partners, Inc. | Perella Weinberg Partners | P10, Inc. | Virtus Investment Partners, Inc. |
| Silvercrest Asset Management Group Inc. | Pzena Investment Management, Inc. | Pzena Investment Management, Inc. | Silvercrest Asset Management Group Inc. | WisdomTree, Inc. |
| Sculptor Capital Management, Inc. | Silvercrest Asset Management Group Inc. | Silvercrest Asset Management Group Inc. | Sculptor Capital Management, Inc. | |
| StepStone Group, Inc. | Sculptor Capital Management, Inc. | Sculptor Capital Management, Inc. | StepStone Group, Inc. | |
| Virtus Investment Partners, Inc. | StepStone Group, Inc. | StepStone Group, Inc. | Victory Capital Holdings, Inc. | |
| Waddell & Reed Financial, Inc. | Virtus Investment Partners, Inc. | Victory Capital Holdings, Inc. | Virtus Investment Partners, Inc. | |
| Westwood Holdings Group, Inc. | Waddell & Reed Financial, Inc. | Virtus Investment Partners, Inc. | WisdomTree, Inc. | |
| WisdomTree Investments, Inc. | Westwood Holdings Group, Inc. | WisdomTree, Inc. | | |
| WisdomTree Investments, Inc. | | | |
DHIL’s common shares trade on The Nasdaq Global Select Market under the ticker symbol DHIL. The following table sets forth the high and low daily close prices during each quarter of 2024 and 2023:
| | | | | | | | | | | | | | | | | | | | | | | | | | | | | | | | | | | | | |
| | 2024 | | | 2023 | |
| High
Price | | Low
Price | | Quarterly Dividend
Per Share | | | High
Price | | Low
Price | | Quarterly Dividend
Per Share | |
| Quarter ended: | | | | | | | | | | | | | |
| March 31 | $ | 166.53 | | | $ | 144.68 | | | $ | 1.50 | | | | $ | 191.47 | | | $ | 158.38 | | | $ | 1.50 | | |
| June 30 | $ | 159.18 | | | $ | 138.79 | | | $ | 1.50 | | | | $ | 178.18 | | | $ | 156.32 | | | $ | 1.50 | | |
| September 30 | $ | 163.24 | | | $ | 139.35 | | | $ | 1.50 | | | | $ | 187.24 | | | $ | 161.40 | | | $ | 1.50 | | |
| December 31 | $ | 171.89 | | | $ | 150.15 | | | $ | 1.50 | | | | $ | 171.99 | | | $ | 147.81 | | | $ | 1.50 | | |
Due to the relatively low trading volume of DHIL’s common shares, bid/ask spreads can be wide at times, and therefore, quoted prices may not be indicative of the price a shareholder may receive in an actual transaction. During 2024 and 2023, approximately 4,335,746 and 3,143,990, of DHIL’s common shares were traded, respectively.
Each fiscal quarter, the Board determines whether to approve and pay a regular quarterly dividend. In addition to the regular quarterly dividends, in the fourth quarter of each fiscal year, the Board decides whether to approve and pay a special dividend. Although DHIL currently expects to pay regular quarterly dividends, depending on the circumstances and the Board’s judgment, DHIL may not pay quarterly or special dividends. DHIL has not paid a special dividend since 2022.
The approximate number of record holders of DHIL common shares as of February 26, 2025 was 70. The approximate number of beneficial holders of DHIL common shares held by brokers, banks, and other intermediaries was greater than 8,000 as of February 26, 2025.
Purchases of Equity Securities by the Issuer and Affiliated Purchasers
The following table sets forth information regarding repurchases of DHIL common shares during the quarter ended December 31, 2024:
| | | | | | | | | | | | | | | | | | | | | | | |
| Period | Total Number of Shares Purchased(a) | | Average Price
Paid Per Share | | Total Number of Shares Purchased as part of Publicly Announced Programs(b) | | Approximate Dollar Value of Shares that May Yet Be Purchased Under the Programs(b) |
October 1, 2024 through
October 31, 2024 | 10,475 | | | 161.61 | | | — | | | $ | 4,739,260 | |
November 1, 2024 through
November 30, 2024 | 22,556 | | | $ | 168.33 | | | 22,556 | | | 46,203,126 | |
December 1, 2024 through
December 31, 2024 | 30,243 | | | $ | 156.95 | | | 30,243 | | | 41,456,564 | |
| Total | 63,274 | | | | | 52,799 | | | $ | 41,456,564 | |
(a)The Company regularly withholds common shares for tax payments due upon the vesting of employee restricted shares. During the quarter ended December 31, 2024, the Company withheld 10,475 DHIL common shares for employee tax withholding obligations at an average price paid per share of $161.61.
(b)On May 10, 2023, the Board approved a repurchase plan, authorizing management to repurchase up to $50.0 million DHIL common shares (“2023 Repurchase Program”). On November 4, 2024, the Board terminated the 2023 Repurchase Program and authorized management to repurchase up to $50.0 million DHIL common shares in the open market and in private transactions in accordance with applicable securities laws (“2024 Repurchase Program”). The 2024 Repurchase Program will expire on November 4, 2026, or upon the earlier completion of all authorized purchases under the program.
In connection with the 2024 Repurchase Program, DHIL entered into a Rule 10b5-1 trading arrangement. The Rule 10b5-1 trading arrangement is intended to qualify for the safe harbor under Rule 10b5-1 of the Exchange Act. A Rule 10b5-1 trading arrangement allows a company to purchase its stock at times when it would not ordinarily be in the market because of its trading policies or the possession of material nonpublic information. Because repurchases under DHIL’s Rule 10b5-1 trading
arrangement are subject to specified parameters and certain price, timing, and volume restraints specified in the plan, there is no guarantee as to the exact number of common shares that will be repurchased or that there will be any repurchases at all pursuant to the plan. Purchases under the 2024 Repurchase Program may be made in the open market or through privately negotiated transactions. Purchases in the open market are intended to comply with Rule 10b-18 under the Exchange Act.
Sale of Unregistered Securities
During the quarter ended December 31, 2024, DHIL did not sell any common shares that were not registered under the Securities Act.
In this Item 7, Management’s Discussion and Analysis of Financial Condition and Results of Operations (“MD&A”), the Company discusses and analyzes its consolidated results of operations for the past three fiscal years and other factors that may affect its future financial performance. This discussion should be read in conjunction with the Company’s consolidated financial statements and notes to consolidated financial statements contained in this Form 10-K.
Certain statements the Company makes under this MD&A constitute “forward-looking statements” under the PSLR Act. See “Cautionary Note Regarding Forward-Looking Statements” in Part I, Item 1. You should also consider the Company’s forward-looking statements in light of the risks discussed Part I, Item 1A, as well as the Company’s consolidated financial statements, related notes and other financial information appearing elsewhere in this Form 10-K and its other filings with the SEC.
Business Environment1
The investment management industry experienced notable shifts in 2024, influenced by investor preferences, market conditions, and macroeconomic developments. The performances of the U.S. and international equity markets, as well as the U.S. fixed income market, has a direct impact on the Company’s operations and financial position. Returns of several major equity and fixed income market indexes for 2024 were as follows:
| | | | | | | | |
| | 2024 |
| Russell 1000 Index | | 24.51% |
| Russell 2000 Index | | 11.54% |
| Russell 3000 Index | | 23.81% |
| MSCI ACWI ex USA Index | | 5.53% |
| Bloomberg Barclays U.S. Aggregate Index | | 1.25% |
| Bloomberg Barclays U.S. 1-3 Yr. Gov./Credit Index | | 4.36% |
Equity Market Conditions
The U.S. equity markets experienced gains in 2024. The Russell 3000 Index rose +23.8%, with large-cap stocks leading at +24.5%, while mid-cap stocks gained +15.3% and small-cap stocks increased +11.5%.
Growth stocks outperformed value stocks for the second consecutive year, continuing the trend observed for most of the last decade. The Russell 1000 Growth Index (R1000G) returned 33.4%, exceeding the Russell 1000 Value Index (R1000V) by 19 percentage points (14.4%). This differential was 31-percentage-points in 2023, marking the widest two-year growth-stock advantage since the beginning of Russell's large cap style data, which goes back to 1979. The performance gap was narrower in
1 All net asset and flow data stated in this MD&A are sourced from Morningstar, Inc. © 2024/2025 Morningstar, Inc. All rights reserved. The information contained herein: (1) is proprietary to Morningstar and/or its content providers; (2) may not be copied or distributed; and (3) is not warranted to be accurate, complete, or timely. Neither Morningstar nor its content providers are responsible for any damages or losses arising from any use of this information. Past performance is not a guarantee of future results.
smaller capitalization stocks, with the Russell 2000 Growth Index outperforming the Russell 2000 Value Index by approximately 7 percentage points.
The MSCI ACWI ex-U.S. Index increased 5.5% in 2024, marking a second consecutive year of gains. Despite positive returns, asset allocators continue to evaluate the appropriate allocation to international stocks in portfolios. Historically, market leadership has rotated between U.S. and international equities, but U.S. stocks have maintained a prolonged period of relative outperformance.
Fixed Income Market Conditions
The U.S. fixed income market posted a +1.25% return in 2024, as measured by the Bloomberg U.S. Aggregate Bond Index. Though relatively modest, this reflects a market adjusting to shifting interest rate expectations.
The Federal Reserve cut interest rates three times in 2024, reducing the federal funds rate by 50 basis points in September and 25 basis points in both November and December. Inflation remained relatively unchanged from the end of 2023 to the end of 2024.
Treasury yields fluctuated throughout 2024 but ended the year slightly up. The 2-year Treasury yield rose by 0.02 percentage points, and the 10-year Treasury yield increased by 0.70 percentage points.
Investment Flows and Market Trends
Total mutual fund and exchange-traded fund (ETF) inflows reached $720 billion in 2024, the second-highest annual inflow recorded in the past 25 years. Passively managed strategies accounted for $885 billion in inflows, while actively managed funds experienced $166 billion in outflows. Investors allocated $1.2 trillion to ETFs, while mutual funds saw $388 billion in outflows, continuing a multi-year trend of preference for ETFs.
Within U.S. equities, large-cap ETFs received $514 billion in inflows, while large-cap mutual funds saw $318 billion in outflows.
In fixed income, taxable bond funds had $483 billion in inflows, led by $135 billion into the intermediate core bond category. ETF market share within this category increased from 16% in 2020 to 22% in 2024.
The market for actively managed ETFs expanded, with 500 new products introduced and $285 billion in inflows, representing 26% of total ETF flows.
Shifts in Investment Vehicles and Distribution
Investment vehicle preferences continued to change, with increased use of separately managed accounts (SMAs) and model delivery programs. These options offer tax efficiency and customization, leading to broader adoption among institutional and high-net-worth investors.
Other investment structures, such as closed-end registered investment companies, collective investment trusts (CITs), private funds, and other pooled vehicles, remain relevant. Private market allocations within institutional investor’s portfolios have continued to grow.
Investment Results
It is imperative that the Company generate strong long-term investment results. Strong investment performance is the key driver of long-term success and meaningfully influences the Company’s ability to attract and retain clients.
The strategies offered by the Company have generally tended to fare well compared to their peers in the relevant Morningstar categories. Relative returns versus core benchmarks have been more challenging, as many valuation-sensitive investors have struggled to keep pace with core benchmarks.
Below is a summary of the performance of the Diamond Hill Funds compared to their respective Morningstar categories and the Company’s investment strategy composite returns compared to their respective benchmarks. Note that a number of the Company’s strategies do not yet have a 10-year track record. To see more detail, a table is included below these illustrations which provides information on inception date, performance since inception, and the U.S. equity strategies' performance relative to the Core and Value benchmarks.
| | | | | | | | | | | | | | | | | | | | |
| | 1 Year | 3 Year | 5 Year | 10 Year | Inception |
| % Funds Outperform | Morningstar Category Average | 50.00 | % | 60.00 | % | 66.67 | % | 50.00 | % | 80.00 | % |
| % Assets Outperform | Morningstar Category Average | 34.92 | % | 44.86 | % | 44.95 | % | 87.90 | % | 99.00 | % |
| % Composites Outperform | Performance Benchmark | 46.15 | % | 53.85 | % | 40.00 | % | — | % | 69.23 | % |
| % Assets Outperform | Performance Benchmark | 23.74 | % | 24.27 | % | 23.34 | % | — | % | 81.86 | % |
| % Composites Outperform | Supplemental Benchmark | 14.29 | % | 28.57 | % | 57.14 | % | 57.14 | % | 85.71 | % |
| % Assets Outperform | Supplemental Benchmark | 1.19 | % | 4.23 | % | 76.67 | % | 76.67 | % | 94.67 | % |
Source: © 2024 Morningstar, Inc. All rights reserved. The information contained herein: (1) is proprietary to Morningstar and/or its content providers; (2) may not be copied or distributed; and (3) is not warranted to be accurate, complete, or timely. Neither Morningstar nor its content providers are responsible for any damages or losses arising from any use of this information. Past performance is not a guarantee of future results.
The total number of funds included in the 1-, 3-, 5-, and 10-year periods are 10, 10, 9, and 6, respectively. The percentage of Diamond Hill Fund assets that outperform is based on the Diamond Hill Fund assets as of December 31, 2024. Total fund assets for the 1-, 3-, 5-, and 10-year periods are $18.0B, $18.0B, $18.0B, and $12.4B, respectively, which represents between 41% and 60% of total Company assets for each period.
The percentage of the Company’s composites that outperform their benchmark includes all its composites (excluding Long-Duration Treasury) versus the performance benchmark for each composite, except for the Long-Short Composite which uses a blended index that is a 60%/40% weighted blend of the Russell 1000 Index and the Bloomberg U.S. Treasury Bills 1-3 Month Index as of December 31,2024. The percentage of composite assets that outperform is based on total Company composite assets as of December 31, 2024, excluding wrap fee accounts and restricted accounts. Composite net returns are calculated using the highest applicable standard separate account fee schedule. Total composite assets for the 1-, 3-, 5-, and 10-year periods are $26.4B, $26.4B, $26.1B, and $20.3B, respectively, which represents between 67% and 88% of total Company assets for each period.
While the Company’s equity-focused strategies use core benchmarks to evaluate investment performance over full market cycles, many clients also compare results to value benchmarks. The following is a summary of the investment returns for each of the Company’s strategies as of December 31, 2024, relative to their respective core and value indices, as applicable.
| | | | | | | | | | | | | | | | | | | | | | | | | | | | | | | | | | | |
| | | As of December 31, 2024 |
| U.S. Equity Composites | Inception | | 1 Year | | 3 Year | | 5 Year | | 10 Year | | Since Inception |
| Diamond Hill Large Cap | 6/30/2001 | | 12.06 | % | | 3.35 | % | | 8.70 | % | | 9.54 | % | | 9.13 | % |
| Russell 1000 Index | | | 24.51 | % | | 8.41 | % | | 14.28 | % | | 12.87 | % | | 9.08 | % |
| Russell 1000 Value Index | | | 14.37 | % | | 5.63 | % | | 8.68 | % | | 8.49 | % | | 7.60 | % |
| Diamond Hill Large Cap Concentrated | 12/31/2011 | | 14.28 | % | | 5.01 | % | | 10.00 | % | | 10.40 | % | | 12.17 | % |
| Russell 1000 Index | | | 24.51 | % | | 8.41 | % | | 14.28 | % | | 12.87 | % | | 14.61 | % |
| Russell 1000 Value Index | | | 14.37 | % | | 5.63 | % | | 8.68 | % | | 8.49 | % | | 11.23 | % |
| Diamond Hill Mid Cap | 12/31/2013 | | 10.61 | % | | 1.83 | % | | 6.42 | % | | 7.38 | % | | 7.43 | % |
| Russell Midcap Index | | | 15.34 | % | | 3.79 | % | | 9.92 | % | | 9.63 | % | | 9.95 | % |
| Russell Midcap Value Index | | | 13.07 | % | | 3.88 | % | | 8.59 | % | | 8.10 | % | | 8.69 | % |
| Diamond Hill Small-Mid Cap | 12/31/2005 | | 8.31 | % | | 1.45 | % | | 6.80 | % | | 7.30 | % | | 8.32 | % |
| Russell 2500 Index | | | 12.00 | % | | 2.39 | % | | 8.77 | % | | 8.85 | % | | 8.82 | % |
| Russell 2500 Value Index | | | 10.98 | % | | 3.81 | % | | 8.44 | % | | 7.81 | % | | 7.86 | % |
| Diamond Hill Small Cap | 12/31/2000 | | 13.29 | % | | 6.04 | % | | 9.63 | % | | 7.25 | % | | 10.04 | % |
| Russell 2000 Index | | | 11.54 | % | | 1.24 | % | | 7.40 | % | | 7.82 | % | | 8.02 | % |
| Russell 2000 Value Index | | | 8.05 | % | | 1.94 | % | | 7.29 | % | | 7.14 | % | | 8.44 | % |
| Diamond Hill Select | 6/30/2000 | | 13.14 | % | | 6.98 | % | | 13.38 | % | | 10.91 | % | | 10.62 | % |
| Russell 3000 Index | | | 23.81 | % | | 8.01 | % | | 13.86 | % | | 12.55 | % | | 7.97 | % |
| Russell 3000 Value Index | | | 13.98 | % | | 5.41 | % | | 8.60 | % | | 8.40 | % | | 7.80 | % |
| Diamond Hill Micro Cap | 9/30/2021 | | 23.63 | % | | 12.14 | % | | N/A | | N/A | | 14.75 | % |
| Russell Micro Cap Index | | | 13.70 | % | | (1.00) | % | | N/A | | N/A | | (1.74) | % |
| | | | | | | | | | | |
| Alternative Composites | | | | | | | | | | | |
| Diamond Hill Long-Short | 6/30/2000 | | 10.97 | % | | 4.98 | % | | 6.90 | % | | 6.66 | % | | 7.36 | % |
| 60% Russell 1000 Index / 40% BofA ML U.S. T-Bill 0-3 Month Index | | | 16.63 | % | | 7.00 | % | | 9.87 | % | | 8.61 | % | | 5.77 | % |
| | | | | | | | | | | |
| International Composites | | | | | | | | | | | |
| Diamond Hill International | 12/31/2016 | | 4.03 | % | | 2.14 | % | | 5.14 | % | | N/A | | 8.18 | % |
| MSCI ACWI ex USA Index | | | 5.53 | % | | 0.82 | % | | 4.10 | % | | N/A | | 6.23 | % |
| | | | | | | | | | | |
| Fixed Income Composites | | | | | | | | | | | |
| Diamond Hill Short Duration Securitized Bond | 7/31/2016 | | 9.40 | % | | 4.85 | % | | 4.11 | % | | N/A | | 4.01 | % |
| Bloomberg Barclays U.S. 1-3 Yr. Gov./Credit Index | | | 4.36 | % | | 1.69 | % | | 1.58 | % | | N/A | | 1.65 | % |
| Diamond Hill Core Bond | 7/31/2016 | | 3.58 | % | | (0.81) | % | | 0.89 | % | | N/A | | 1.89 | % |
| Bloomberg Barclays U.S. Aggregate Index | | | 1.25 | % | | (2.41) | % | | (0.33) | % | | N/A | | 0.84 | % |
| Diamond Hill Securitized Credit Composite | 10/31/2024 | | N/A | | N/A | | N/A | | N/A | | 2.33 | % |
_______________________ | | | | | |
| - | Composite returns are net of fees. |
| - | Index returns do not reflect any fees. |
Key Financial Performance Indicators
There are a variety of key performance indicators that the Company monitors to evaluate its business results. The following table presents the results of certain key performance indicators over the past three fiscal years:
| | | | | | | | | | | | | | | | | |
| | For the Years Ended December 31, |
| | 2024 | | 2023 | | 2022 |
| Ending AUM and AUA (in millions) | $ | 31,925 | | | $ | 29,164 | | | $ | 26,565 | |
| Average AUM and AUA (in millions) | 31,610 | | | 27,321 | | | 29,551 | |
| Net cash outflows (in millions) | (289) | | | (494) | | | (2,241) | |
| | | | | |
| Total revenue (in thousands) | 151,095 | | | 136,716 | | | 154,496 | |
| Net operating income | 43,892 | | | 35,504 | | | 64,331 | |
Adjusted net operating income(a) | $ | 48,696 | | | $ | 41,434 | | | $ | 60,352 | |
| Average advisory fee rate | 0.45 | % | | 0.47 | % | | 0.49 | % |
| Net operating profit margin | 29 | % | | 26 | % | | 42 | % |
Adjusted net operating profit margin(a) | 32 | % | | 30 | % | | 39 | % |
(a) Adjusted net operating income and adjusted net operating profit margin are non-GAAP financial measures. See the “Non-GAAP Financial Measures and Reconciliation” section in this MD&A for the definitions of “GAAP” and “non-GAAP” as well as a reconciliation of non-GAAP financial measures to the most directly comparable financial measures calculated and presented in accordance with GAAP.
Assets Under Management
The Company derives revenue primarily from DHCM’s investment advisory and administration fees. Investment advisory and administration fees paid to DHCM are generally based on the value of the investment portfolios it manages and fluctuate with changes in the total value of its AUM. The Company, through DHCM, recognizes revenue when DHCM satisfies its performance obligations under the terms of a contract with a client.
Model Delivery Programs - Assets Under Advisement
DHCM provides strategy-specific model portfolios to sponsors of model delivery programs. DHCM is paid for its services by the program sponsor at a pre-determined rate based on AUA in the model delivery programs. DHCM does not have discretionary investment authority over individual client accounts in model delivery programs, and therefore, the AUA is not included in the Company’s AUM.
The Company’s revenues are highly dependent on both the value and composition of AUM and AUA. The following is a summary of the Company’s AUM by product and investment objective, a roll-forward of the change in AUM, and a summary of AUA for 2024, 2023, and 2022:
| | | | | | | | | | | | | | | | | |
| Assets Under Management and Assets Under Advisement
As of December 31, |
| (in millions) | 2024 | | 2023 | | 2022 |
| Proprietary Funds | $ | 18,097 | | | $ | 15,879 | | | $ | 14,745 | |
| Separately managed accounts | 6,108 | | | 6,617 | | | 6,220 | |
| Collective investment trusts | 1,947 | | | 1,359 | | | 1,040 | |
| Other pooled vehicles | 3,860 | | | 3,563 | | | 2,758 | |
| Total AUM | 30,012 | | | 27,418 | | | 24,763 | |
| Total AUA | 1,913 | | | 1,746 | | | 1,802 | |
| Total AUM and AUA | $ | 31,925 | | | $ | 29,164 | | | $ | 26,565 | |
| | | | | | | | | | | | | | | | | |
| Assets Under Management
by Investment Strategy
As of December 31, |
| (in millions) | 2024 | | 2023 | | 2022 |
| U.S. Equity | | | | | |
| Large Cap | $ | 17,702 | | | $ | 17,307 | | | $ | 16,478 | |
| Small-Mid Cap | 2,009 | | | 2,588 | | | 2,646 | |
| Mid Cap | 1,082 | | | 1,023 | | | 899 | |
| Select | 755 | | | 593 | | | 392 | |
| Small Cap | 253 | | | 255 | | | 306 | |
| Large Cap Concentrated | 129 | | | 98 | | | 99 | |
| Micro Cap | 33 | | | 21 | | | 15 | |
| Total U.S. Equity | 21,963 | | | 21,885 | | | 20,835 | |
| | | | | |
| Alternatives | | | | | |
| Long-Short | 1,684 | | | 1,725 | | | 1,752 | |
| Total Alternatives | 1,684 | | | 1,725 | | | 1,752 | |
| | | | | |
| International Equity | | | | | |
| International | 141 | | | 109 | | | 52 | |
| Total International Equity | 141 | | | 109 | | | 52 | |
| | | | | |
| Fixed Income | | | | | |
| Short Duration Securitized Bond | 3,732 | | | 1,948 | | | 1,308 | |
| Core Fixed Income | 2,416 | | | 1,735 | | | 792 | |
| Securitized Credit | 52 | | | — | | | — | |
| Long Duration Treasury | 24 | | | 26 | | | 33 | |
| Total Fixed Income | 6,224 | | | 3,709 | | | 2,133 | |
| | | | | |
| Total-All Strategies | 30,012 | | | 27,428 | | | 24,772 | |
(Less: Investments in affiliated funds)(a) | — | | | (10) | | | (9) | |
| Total AUM | 30,012 | | | 27,418 | | | 24,763 | |
Total AUA(b) | 1,913 | | | 1,746 | | | 1,802 | |
| Total AUM and AUA | $ | 31,925 | | | $ | 29,164 | | | $ | 26,565 | |
(a) Certain of the Diamond Hill Funds own shares of the Diamond Hill Short Duration Securitized Bond Fund. The Company reduces the total AUM of each Diamond Hill Fund that holds such shares by the AUM of the investments held in this affiliated fund.
(b) AUA is primarily comprised of Large Cap and Select strategies.
| | | | | | | | | | | | | | | | | |
| Change in Assets Under Management
For the Year Ended December 31, |
| (in millions) | 2024 | | 2023 | | 2022 |
| AUM at beginning of the year | $ | 27,418 | | | $ | 24,763 | | | $ | 31,028 | |
| Net cash inflows (outflows) | | | | | |
| Proprietary Funds | 726 | | | (599) | | | (2,433) | |
| Separately managed accounts | (1,269) | | | (416) | | | (73) | |
| Collective investment trusts | 403 | | | 153 | | | 486 | |
| Other pooled vehicles | (149) | | | 368 | | | (221) | |
| (289) | | | (494) | | | (2,241) | |
| Net market appreciation (depreciation) and income | 2,883 | | | 3,149 | | | (4,024) | |
| Increase (decrease) during the year | 2,594 | | | 2,655 | | | (6,265) | |
| AUM at end of the year | 30,012 | | | 27,418 | | | 24,763 | |
| AUA at end of the year | 1,913 | | | 1,746 | | | 1,802 | |
| Total AUM and AUA at end of year | $ | 31,925 | | | $ | 29,164 | | | $ | 26,565 | |
| | | | | |
| Average AUM during the year | $ | 29,718 | | | $ | 25,552 | | | $ | 27,599 | |
| Average AUA during the year | 1,892 | | | 1,769 | | | 1,952 | |
| Total Average AUM and AUA during the year | $ | 31,610 | | | $ | 27,321 | | | $ | 29,551 | |
| | | | | | | | | | | | | | | | | |
| Net Cash Outflows Further Breakdown
For the Year Ended December 31, |
| (in millions) | 2024 | | 2023 | | 2022 |
| Net cash inflows (outflows) | | | | | |
| Equity | $ | (2,544) | | | $ | (1,865) | | | $ | (2,247) | |
| Fixed Income | 2,255 | | | 1,371 | | | 6 | |
| $ | (289) | | | $ | (494) | | | $ | (2,241) | |
2024 Discussion of Net Cash Outflows
Flows out of the Company’s equity strategies were largely driven by flows out of its Large Cap and Small-Mid Cap strategies, which experienced net outflows of $1.6 billion and $0.8 billion, respectively. Outflows from the equity strategies were partially offset by fixed income net inflows of $2.3 billion, largely driven by flows into the Short Duration and Core Bond strategies, which experienced net inflows of $1.6 billion and $0.6 billion, respectively.
2023 Discussion of Net Cash Outflows
Flows out of the Company’s equity strategies were largely driven by flows out of its Large Cap strategy, which experienced net
outflows of $1.4 billion. Net outflows from the Company’s other equity strategies totaled approximately $0.5 billion. Outflows from the equity strategies were partially offset by fixed income net inflows of $1.4 billion into the Company’s fixed income strategies.
2022 Discussion of Net Cash Outflows
Flows out of the Company’s equity strategies were largely driven by flows out of its Large Cap strategy, which experienced net
outflows of $1.9 billion. The Large Cap strategy was soft closed during 2022. The strategy was fully reopened on February 28, 2023. Net outflows from the Company’s other equity strategies totaled approximately $0.3 billion. The Company’s fixed income strategies saw mixed results with net flows of $0.3 billion into its Core Bond strategy offsetting outflows from its Short Duration Securitized Bond Fund of $0.2 billion. The Company also saw growth in its CIT offerings. In addition to new clients, some larger plans moved from the Funds into the CITs.
Consolidated Results of Operations
The following is a table and discussion of the Company’s consolidated results of operations.
| | | | | | | | | | | | | | | | | | | | | | | | | | | | | | | | | | | |
| (in thousands, except per share amounts and percentages) | 2024 | | 2023 | | % Change | | 2023 | | 2022 | | % Change |
| Total revenue | $ | 151,095 | | | $ | 136,716 | | | 11% | | $ | 136,716 | | | $ | 154,496 | | | (12)% |
| Net operating income | 43,892 | | | 35,504 | | | 24% | | 35,504 | | | 64,331 | | | (45)% |
Adjusted net operating income (a) | 48,696 | | | 41,434 | | | 18% | | 41,434 | | | 60,352 | | | (31)% |
| Investment income (loss), net | 15,119 | | | 23,071 | | | (34)% | | 23,071 | | | (20,187) | | | NM |
Gain on sale of High Yield-Focused Advisory Contracts(b) | — | | | — | | | NM | | — | | | 6,814 | | | (100)% |
| Income tax expense | 15,833 | | | 15,490 | | | 2% | | 15,490 | | | 14,088 | | | 10% |
| Net income attributable to common shareholders | 43,178 | | | 42,226 | | | 2% | | 42,226 | | | 40,434 | | | 4% |
| Earnings per share attributable to common shareholders (diluted) | $ | 15.66 | | | $ | 14.32 | | | 9% | | $ | 14.32 | | | $ | 13.01 | | | 10% |
Adjusted earnings per share attributable to common shareholders (diluted)(a) | $ | 12.92 | | | $ | 10.28 | | | 26% | | $ | 10.28 | | | $ | 14.40 | | | (29)% |
| Net operating profit margin | 29 | % | | 26 | % | | NM | | 26 | % | | 42 | % | | NM |
Adjusted net operating profit margin (a) | 32 | % | | 30 | % | | NM | | 30 | % | | 39 | % | | NM |
(a) Adjusted net operating income, adjusted earnings per share attributable to common shareholders (diluted), and adjusted net operating profit margin are non-GAAP financial measures. See the “Non-GAAP Financial Measures and Reconciliation” section within this Form 10-K for the definition of “non-GAAP” and a reconciliation of the non-GAAP financial measures to the most directly comparable financial measures calculated and presented in accordance with GAAP.
(b) The Diamond Hill Corporate Credit and the Diamond Hill High Yield investment advisory contracts (the “High Yield-Focused Advisory Contracts”) were sold to Brandywine Global Investment Management, LLC (“Brandywine Global”) effective July 30, 2021, and the final payment related to the transaction occurred on July 30, 2022.
Summary Discussion of Consolidated Results of Operations - 2024 Compared to 2023
Revenue for 2024 increased $14.4 million compared to 2023, primarily due to a 16% increase in total average AUM and AUA, partially offset by a decrease in the average advisory fee rate from 0.47% in 2023 to 0.45% in 2024. Refer to the “Revenue” section below in this MD&A for further details on the decrease in the average advisory fee rate.
Operating profit margin was 29% for 2024 and 26% for 2023. The increase in operating profit margin was primarily driven by compensation, and related costs, excluding deferred compensation expense (2% of the 3% margin increase) and deferred compensation expense (1% of the 3% margin increase).
Adjusted net operating profit margin was 32% for 2024 and 30% for 2023. Adjusted net operating profit margin excludes the impact of market movements on the deferred compensation liability and related economic hedges, and the impact of the consolidated Diamond Hill Core Plus Bond Fund in 2024, and the Diamond Hill International Fund in 2023. Any Proprietary Fund(s) consolidated during the applicable period are referred to as the “Consolidated Fund(s)”. Refer to Note 2 to the consolidated financial statements for a detailed description of the funds that are consolidated in each year. Refer to the “Non-GAAP Financial Measures and Reconciliation” section below in this MD&A for further details on adjusted net operating profit margin.
The Company expects that its operating margin will fluctuate from period to period based on various factors, including revenues, investment results in the strategies the Company manages, employee performance, staffing levels, and gains and losses on investments held in the Diamond Hill Fixed Term Deferred Compensation Plan and the Diamond Hill Variable Term Deferred Compensation Plan (together, the “Deferred Compensation Plans”).
The Company had $15.1 million in investment income due to market appreciation in 2024, compared to $23.1 million in investment income due to market appreciation in 2023.
Income tax expense increased $0.3 million in 2024, compared to 2023. The increase in income tax expense was due to an increase in the Company’s income before taxes, and an increase in its effective tax rate from 26.4% to 26.8% year-over-year.
The increase in the Company’s effective tax rate in 2024 was due to the impact attributable to redeemable noncontrolling interests.
The Company generated net income attributable to common shareholders of $43.2 million ($15.66 per diluted share) for 2024, compared to $42.2 million ($14.32 per diluted share) for 2023. The year-over-year increase in net income attributable to common shareholders was primarily due to an increase in revenues and was partially offset by lower investment income in 2024 compared to higher investment income in 2023.
Summary Discussion of Consolidated Results of Operations - 2023 Compared to 2022
Revenue for 2023 decreased $17.8 million compared to 2022, primarily due to a 7.5% decrease in total average AUM and AUA, as well as a decrease in the average advisory fee rate from 0.49% in 2022 to 0.47% in 2023. Refer to the “Revenue” section below in this MD&A for further details on the decrease in the average advisory fee rate.
Operating profit margin was 26% for 2023 and 42% for 2022. The decrease in operating profit margin was primarily driven by deferred compensation expense (benefit) (7% of the 16% margin decrease), compensation, and related costs, excluding deferred compensation (6% of the 16% margin decrease), and a combination of general and administrative, sales and marketing, and fund administration expenses (3% of the 16% margin decrease).
Adjusted net operating profit margin was 30% for 2023 and 39% for 2022. Adjusted net operating profit margin excludes the impact of market movements on the deferred compensation liability and related economic hedges, and the impact of the Consolidated Funds. Refer to Note 2 to the consolidated financial statements for a detailed description of the funds that are consolidated in each year. Refer to the “Non-GAAP Financial Measures and Reconciliation” section below in this MD&A for further details on adjusted net operating profit margin.
The Company expects that its operating margin will fluctuate from period to period based on various factors, including revenues, investment results in the strategies the Company manages, employee performance, staffing levels, and gains and losses on investments held in the Deferred Compensation Plans.
The Company had $23.1 million in investment income due to market appreciation in 2023, compared to $20.2 million in investment loss due to market declines in 2022.
The Company recorded a gain of $6.8 million from the final payment on the sale of its High Yield-Focused Advisory Contracts during 2022.
Income tax expense increased $1.4 million for 2023, compared to 2022. The increase in income tax expense was primarily due to an increase in the Company’s income before taxes, which was partially offset by a decrease in its effective tax rate from 27.6% to 26.4% year-over-year. The decrease in the Company’s effective tax rate in 2023 was primarily due to the benefit attributable to redeemable noncontrolling interests.
The Company generated net income attributable to common shareholders of $42.2 million ($14.32 per diluted share) for 2023, compared to $40.4 million ($13.01 per diluted share) for 2022. The year-over-year increase in net income attributable to common shareholders was primarily due to investment income in 2023 compared to investment loss in 2022 due to the market environment. The increase in investment income in 2023 was partially offset by a decline of revenues as a result of decreased average AUM and AUA, while the investment losses in 2022 were partially offset by the recognition during 2022 of a $6.8 million gain from the final payment on the sale of the High Yield-Focused Advisory Contracts.
Revenue | | | | | | | | | | | | | | | | | | | | | | | | | | | | | | | | | | | |
| (in thousands, except percentages) | 2024 | | 2023 | | % Change | | 2023 | | 2022 | | % Change |
| Investment advisory | $ | 143,342 | | | $ | 129,180 | | | 11% | | $ | 129,180 | | | $ | 144,326 | | | (10)% |
| Fund administration, net | 7,753 | | | 7,536 | | | 3% | | 7,536 | | | 10,170 | | | (26)% |
| Total | $ | 151,095 | | | $ | 136,716 | | | 11% | | $ | 136,716 | | | $ | 154,496 | | | (12)% |
Revenue - 2024 Compared to 2023
Investment Advisory Fees. Investment advisory fees increased by $14.2 million, or 11%, from 2023 to 2024. Investment advisory fees are calculated as a percentage of the market value of client accounts at contractual fee rates, which vary by investment product. The increase in investment advisory fees was primarily due to an increase in total average AUM and AUA of 16%, partially offset by a decrease in the average advisory fee rate from 0.47% to 0.45% period over period.
The average advisory fee rate for equity assets decreased from 0.49% in 2023 to 0.48% in 2024, and the average advisory fee rate for fixed income assets remained unchanged at 0.30% in 2023 and 2024. The decrease in the total average advisory fee rate was due to the growth in fixed income assets, which increased from 11% of total average AUM and AUA in 2023, to 15% in 2024. The average advisory fee rate is calculated by dividing investment advisory revenues by total average AUM and AUA during the period. If the trend in the growth in fixed income assets as a percentage of total assets continues, the total average advisory fee rate could continue to decline.
Fund Administration Fees. Fund administration fees increased $0.2 million, or 3%, from 2023 compared to 2024. Fund administration fees include administration fees received from the Proprietary Funds, which are calculated as a percentage of the funds’ average AUM. This increase was primarily due to the impact of a 15% increase in the Proprietary Funds’ average AUM from 2023 compared to 2024, partially offset by an increase in administration fees paid on behalf of the funds as a percentage of average fund AUM.
Revenue - 2023 Compared to 2022
Investment Advisory Fees. Investment advisory fees decreased by $15.1 million, or 10%, from 2022 to 2023. Investment advisory fees are calculated as a percentage of the market value of client accounts at contractual fee rates, which vary by investment product. The decrease in investment advisory fees was primarily due to a decrease in total average AUM and AUA of 7.5% and a decrease in the average advisory fee rate from 0.49% to 0.47% period over period.
The average advisory fee rate for equity assets decreased from 0.50% in 2022 to 0.49% in 2023, and the average advisory fee rate for fixed income assets decreased from 0.31% in 2022 to 0.30% in 2023. The decrease in the total average advisory fee rate was due to the growth in fixed income assets, which increased from 8% of total average AUM and AUA in 2022, to 11% in 2023. The average advisory fee rate is calculated by dividing investment advisory revenues by total average AUM and AUA during the period.
Fund Administration Fees. Fund administration fees decreased $2.6 million, or 26%, from 2022 compared to 2023. Fund administration fees include administration fees received from the Proprietary Funds, which are calculated as a percentage of the Proprietary Funds’ average AUM. This decrease was primarily due to the impact of a 13% decrease in the Proprietary Funds’ average AUM from 2022 compared to 2023, and an increase in administration fees paid on behalf of the Proprietary Funds as a percentage of average fund AUM.
Expenses | | | | | | | | | | | | | | | | | | | | | | | | | | | | | | | | | | | |
| (in thousands, except percentages) | 2024 | | 2023 | | % Change | | 2023 | | 2022 | | % Change |
| Compensation and related costs, excluding deferred compensation expense (benefit) | $ | 74,589 | | | $ | 70,731 | | | 5% | | $ | 70,731 | | | $ | 70,505 | | | —% |
| Deferred compensation expense (benefit) | 4,776 | | | 5,600 | | | (15)% | | 5,600 | | | (4,402) | | | NM |
| General and administrative | 16,785 | | | 14,935 | | | 12% | | 14,935 | | | 13,607 | | | 10% |
| Sales and marketing | 7,510 | | | 6,684 | | | 12% | | 6,684 | | | 7,160 | | | (7)% |
| Fund administration | 3,543 | | | 3,262 | | | 9% | | 3,262 | | | 3,295 | | | (1)% |
| Total | $ | 107,203 | | | $ | 101,212 | | | 6% | | $ | 101,212 | | | $ | 90,165 | | | 12% |
Expenses - 2024 Compared to 2023
Compensation and Related Costs, Excluding Deferred Compensation Expense. Employee compensation and related costs (excluding deferred compensation expense) increased by $3.9 million in 2024. This increase is due to an increase in incentive compensation of $1.8 million, an increase in salary and related benefits of $1.0 million, an increase in severance expense of $0.9 million, and an increase in restricted stock expense of $0.2 million. On average, the Company had 128 employees in 2024
and 129 employees in 2023. Incentive compensation expense can fluctuate significantly period over period as the Company evaluates investment performance, individual performance, its own performance, and other factors.
Deferred Compensation Expense. Deferred compensation expense was $4.8 million for 2024 compared to an expense of $5.6 million for 2023, primarily due to a decrease in market appreciation on the Deferred Compensation Plans’ investments in 2024 compared to 2023.
The gain (loss) on the Deferred Compensation Plans’ investments increases (decreases) deferred compensation expense (benefit) and is included in operating income. Deferred compensation expense (benefit) is offset by an equal amount in investment income (loss) below net operating income on the consolidated statements of income, and thus, has no impact on net income attributable to the Company.
General and Administrative. General and administrative expenses increased by $1.8 million, or 12%, from 2023 compared to 2024. This increase was primarily due to a $1.5 million increase in expenses to support improvements to the Company’s research management system, cloud data platform and overall technology support, and an increase in investment research-related expenses of $0.3 million.
Sales and Marketing. Sales and marketing expenses increased by $0.8 million, or 12%, from 2023 compared to 2024. The increase was primarily due to an increase in payments made to third-party intermediaries as a result of the increase in the Proprietary Funds’ average AUM period over period.
Fund Administration. Fund administration expenses increased by less than $0.1 million, or 9%, from 2023 compared to 2024. Fund administration expenses consist of both variable and fixed expenses. The variable expenses are based on Proprietary Fund AUM levels and the number of shareholder accounts. The increase was due to an increase in variable expenses as a result of the increase in the Proprietary Funds’ average AUM period over period.
Expenses - 2023 Compared to 2022
Compensation and Related Costs, Excluding Deferred Compensation Expense (Benefit). Employee compensation and related costs (excluding deferred compensation benefit) increased by $0.2 million in 2023. This increase is primarily due to an increase in salary and related benefits of $1.3 million, and an increase in restricted stock expense of $1.0 million, partially offset by a decrease in incentive compensation of $2.4 million. On average, the Company had 129 employees in 2023 and 2022. Incentive compensation expense can fluctuate significantly period over period as the Company evaluates investment performance, individual performance, its own performance, and other factors.
Deferred Compensation Expense (Benefit). Deferred compensation expense was $5.6 million for 2023 compared to a benefit of $4.4 million for 2022, primarily due to market appreciation on the Deferred Compensation Plans’ investments in 2023 compared to market declines in 2022.
The gain (loss) on the Deferred Compensation Plans’ investments increases (decreases) deferred compensation expense (benefit) and is included in operating income. Deferred compensation expense (benefit) is offset by an equal amount in investment income (loss) below net operating income on the consolidated statements of income, and thus, has no impact on net income attributable to the Company.
General and Administrative. General and administrative expenses increased by $1.3 million, or 10%, from 2022 compared to 2023. This increase was primarily due to an increase in investment research-related expenses of $0.6 million, an increase in consulting expenses of $0.4 million, and an increase in recruiting expenses of $0.3 million.
Sales and Marketing. Sales and marketing expenses decreased by $0.5 million, or 7%, from 2022 compared to 2023. The decrease was primarily due to a reduction in payments made to third-party intermediaries as a result of the decrease in the Proprietary Funds’ average AUM period over period.
Fund Administration. Fund administration expenses decreased by less than $0.1 million, or 1%, from 2022 compared to 2023. Fund administration expenses consist of both variable and fixed expenses. The variable expenses are based on Proprietary Fund AUM levels and the number of shareholder accounts. The decrease was due to a reduction in variable expenses as a result of the decrease in the Proprietary Funds’ average AUM period over period.
Liquidity and Capital Resources
Sources of Liquidity
The Company’s current financial condition is liquid, with a significant amount of its assets comprised of cash and cash equivalents, investments, accounts receivable, and other current assets. The Company’s main source of liquidity is cash flows from operating activities, which are generated from investment advisory and fund administration fees. Cash and cash equivalents, investments held directly by DHCM, accounts receivable, and other current assets represented $187.4 million and $181.8 million of total assets as of December 31, 2024, and 2023, respectively. The Company believes that these sources of liquidity, as well as its continuing cash flows from operating activities, will be sufficient to meet its current and future operating needs for the next 12 months and beyond.
Uses of Liquidity
The Company anticipates that its main uses of cash will be for operating expenses and seed capital to fund new and existing investment strategies. The Board and management regularly review various factors to determine whether the Company has capital in excess of that required for its business and what the appropriate uses of any such excess capital are, including share repurchases and/or the payment of dividends.
Share Repurchases
On November 4, 2024, the Board approved the 2024 Repurchase Program. The 2024 Repurchase Program authorizes management to repurchase up to $50.0 million of DHIL’s common shares in the open market and in private transactions in accordance with applicable securities laws. The 2024 Repurchase Program will expire on May 4, 2026, or upon the earlier completion of all authorized purchases under the program. As of December 31, 2024, $41.5 million remained available for repurchases under the 2024 Repurchase Program. Prior to the approval of the 2024 Repurchase Program, the Company repurchased shares under similar prior repurchase programs.
The authority to repurchase shares may be exercised from time to time as market conditions warrant and is subject to regulatory constraints. The timing, amount, and other terms and conditions of any repurchases will be determined by management in its discretion based on a variety of factors, including the market price of such shares, corporate considerations, general market and economic conditions, and applicable legal requirements.
The following table summarizes the Company’s annual share repurchase transactions:
| | | | | | | | | | | | | | | | | |
| Year | Total Number
of Shares
Purchased | | Average Price
Paid Per Share Purchased | | Purchase Price of Shares
Purchased |
| 2024 | 195,224 | | | $ | 154.92 | | | $ | 30,244,638 | |
| 2023 | 212,638 | | | 162.81 | | | 34,619,944 | |
| 2022 | 217,009 | | | 178.45 | | | 38,726,007 | |
| Total | 624,871 | | | $ | 165.78 | | | $ | 103,590,589 | |
Dividends
Fiscal 2024 was the 17th consecutive year that the Company paid a dividend.
A summary of cash dividends paid during the years ended December 31, 2024, 2023, and 2022 is presented below:
| | | | | | | | | | | | | | | | | | | | | | | | | | | | | | | | | | | | | | |
| Year | | Regular Dividend Per Share | | Regular Dividend Total | | Special Dividend Per Share | | Special Dividend Total | | Total Dividend Per Share | | Total Dividends |
| 2024 | | $ | 6.00 | | | $ | 16,530,676 | | | $ | — | | | $ | — | | | $ | 6.00 | | | $ | 16,530,676 | |
| 2023 | | $ | 6.00 | | | 17,676,364 | | | $ | — | | | — | | | $ | 6.00 | | | 17,676,364 | |
| 2022 | | $ | 6.00 | | | 18,637,238 | | | $ | 4.00 | | | 12,059,669 | | | $ | 10.00 | | | 30,696,907 | |
| Total | | | | $ | 52,844,278 | | | | | $ | 12,059,669 | | | | | $ | 64,903,947 | |
On February 26, 2025, the Board approved a regular quarterly dividend for the first quarter of 2025 of $1.50 per share to be paid on March 21, 2025, to shareholders of record at the close of business on March 10, 2025. This dividend is expected to reduce shareholders’ equity by approximately $4.2 million. Subject to Board approval and compliance with applicable law, the Company expects to pay a regular quarterly dividend of $1.50 per share in 2025.
In addition to the regular quarterly dividends, the Board will decide whether to approve and pay an additional special dividend in the fourth quarter of each fiscal year. After assessing the market environment, the level of share repurchases during the year, as well as the regular quarterly dividend paid during 2024, the Board decided not to issue a special dividend in 2024. Although the Company currently expects to continue to pay regular quarterly dividends, depending on the circumstances and the Board’s judgment, the Company may not pay quarterly or special dividends as described.
Working Capital
As of December 31, 2024, the Company had working capital of approximately $150.4 million, compared to $146.1 million as of December 31, 2023. Working capital includes cash and cash equivalents, accounts receivable, investments (excluding those held in the Company’s Deferred Compensation Plans), and other current assets of DHCM, net of accounts payable and accrued expenses, accrued incentive compensation, and other current DHCM liabilities.
The Company had no debt and the Company believes its available working capital is sufficient to cover current expenses and presently anticipated capital expenditures.
Below is a summary of investments as of December 31, 2024 and 2023:
| | | | | | | | | | | | | | |
| As of December 31, | | | |
| 2024 | | 2023 | | | |
| Corporate Investments: | | | | | | |
| Diamond Hill International Fund | $ | 54,887,433 | | | $ | 52,763,714 | | | | |
| Diamond Hill Core Plus Bond Fund | 35,294,858 | | | — | | | | |
| Diamond Hill Micro Cap Fund, LP | 15,978,910 | | | 12,482,396 | | | | |
| Diamond Hill Large Cap Concentrated Fund | 14,180,828 | | | 12,402,576 | | | | |
| Diamond Hill Securitized Credit Fund | 117,266 | | | — | | | | |
| Diamond Hill Core Bond Fund | — | | | 34,003,006 | | | | |
| Total Corporate Investments | 120,459,295 | | | 111,651,692 | | | | |
| Deferred Compensation Plan Investments in the Funds | 39,129,093 | | | 36,087,170 | | | | |
| Total investments held by DHCM | 159,588,388 | | | 147,738,862 | | | | |
| Redeemable noncontrolling interest in the Consolidated Fund | 164,593 | | | — | | | | |
| Total investments | $ | 159,752,981 | | | $ | 147,738,862 | | | | |
Cash Flow Analysis
Cash Flows from Operating Activities
The Company’s cash flows from operating activities are calculated by adjusting net income to reflect other significant operating sources and uses of cash, certain significant non-cash items (such as share-based compensation), and timing differences in the cash settlement of operating assets and liabilities. The Company expects that cash flows provided by operating activities will continue to serve as its primary source of working capital.
In 2024, net cash provided by operating activities totaled $16.6 million. Cash provided by operating activities was primarily driven by net income of $43.2 million as well as non-cash adjustments added back to net income consisting of share-based compensation of $11.8 million and depreciation of $1.2 million. These cash inflows were partially offset by the net change in securities held by the Consolidated Funds of $35.8 million and the cash impact of timing differences in the settlement of other assets and liabilities of $3.8 million. Net cash provided by operating activities of $16.6 million was inclusive of $35.9 million of cash used in operations by the Consolidated Funds.
In 2023, net cash provided by operating activities totaled $34.7 million. Cash provided by operating activities was primarily driven by net income of $43.1 million as well as non-cash adjustments added back to net income consisting of share-based compensation of $11.7 million and depreciation of $1.3 million. These cash inflows were partially offset by the net change in securities held by the Consolidated Funds of $10.9 million and the cash impact of timing differences in the settlement of other
assets and liabilities of $10.5 million. Net cash provided by operating activities of $34.7 million was inclusive of $9.8 million of cash used in operations by the Consolidated Funds.
In 2022, net cash provided by operating activities totaled $39.5 million. Cash provided by operating activities was primarily driven by net income of $36.9 million, and the add backs of net losses on investments of $24.5 million, share-based compensation of $10.7 million, and market declines of $1.4 million. These cash inflows were partially offset by the net change in securities held by the Consolidated Funds of $14.0 million, the cash impact of timing differences in the settlement of other assets and liabilities of $13.2 million, and the adjustment to net income of $6.8 million for the gain on sale of the High Yield- Focused Advisory Contracts. Net cash provided by operating activities of $39.5 million was inclusive of $9.5 million of cash used in operations by the Consolidated Funds.
Cash Flows from Investing Activities
The Company’s cash flows from investing activities consist primarily of capital expenditures and purchases and redemptions in
its investment portfolio.
Cash flows provided by investing activities totaled $30.5 million in 2024. Cash flows provided by investing activities were driven by proceeds from the sale of Company-sponsored investments totaling $47.0 million, partially offset by purchases of Company-sponsored investments of $15.1 million and purchases of property and equipment of $1.4 million.
Cash flows used in investing activities totaled $4.2 million in 2023. Cash flows used in investing activities were driven by purchases of Company-sponsored investments of $19.5 million, partially offset by proceeds from the sale of Company- sponsored investments totaling $15.3 million.
Cash flows provided by investing activities totaled $6.0 million in 2022. The cash provided was due to proceeds from the sale of Company-sponsored investments totaling $6.9 million and $6.8 million of proceeds received from the final payment for the sale of the High Yield-Focused Advisory Contracts. These proceeds were partially offset by purchases of Company-sponsored investments of $7.6 million and property and equipment purchases of $0.1 million.
Cash Flows from Financing Activities
The Company’s cash flows from financing activities consist primarily of the repurchase of DHIL common shares, dividends paid on DHIL common shares, DHIL common shares withheld related to employee tax withholding proceeds received under the Diamond Hill Investment Group, Inc. Employee Stock Purchase Plan (“ESPP”), and distributions to, or contributions from, redeemable noncontrolling interest holders.
In 2024, net cash used in financing activities totaled $52.5 million, consisting of repurchases of DHIL’s common shares of $30.2 million, the payment of dividends of $16.5 million, and the value of shares withheld to cover employee tax withholding obligations of $6.3 million. These cash outflows were partially offset by proceeds received under the ESPP of $0.3 million and net subscriptions received in the Consolidated Funds from redeemable non-controlling interest holders of $0.2 million.
In 2023, net cash used in financing activities totaled $46.7 million, consisting of repurchases of DHIL’s common shares of $34.6 million, the payment of dividends of $17.7 million, and the value of shares withheld to cover employee tax withholding obligations of $5.2 million. These cash outflows were partially offset by net subscriptions received in the Consolidated Funds from redeemable non-controlling interest holders of $10.4 million and proceeds received under the ESPP of $0.4 million.
In 2022, net cash used in financing activities totaled $62.9 million, consisting of repurchases of DHIL’s common shares of $38.7 million, the payment of dividends of $30.7 million, and the value of shares withheld to cover employee tax withholding obligations of $3.4 million. These cash outflows were partially offset by net subscriptions received in the Consolidated Funds from redeemable non-controlling interest holders of $9.5 million and proceeds received under the ESPP of $0.5 million.
Supplemental Consolidated Cash Flow Statement
The following table summarizes the condensed cash flows for 2024, 2023, and 2022 that are attributable to the Company and to the Consolidated Funds, and the related eliminations required in preparing the consolidated financial statements.
| | | | | | | | | | | | | | | | | | | | | | | |
| Year Ended December 31, 2024 |
| Cash flow attributable to Diamond Hill Investment Group, Inc. | | Cash flow attributable to Consolidated Funds | | Eliminations | | As reported on the Consolidated Statement of Cash Flows |
| Cash flows from operating activities: | | | | | | | |
| Net income | $ | 43,177,729 | | | $ | (226,242) | | | $ | 226,431 | | | $ | 43,177,918 | |
| Adjustments to reconcile net income to net cash provided by operating activities: | | | | | | | |
| Depreciation | 1,224,475 | | | — | | | — | | | 1,224,475 | |
| Share-based compensation | 11,821,490 | | | — | | | — | | | 11,821,490 | |
| Net gains on investments | (7,799,438) | | | 226,242 | | | (506,951) | | | (8,080,147) | |
| Net change in securities held by Consolidated Funds | — | | | (35,809,404) | | | — | | | (35,809,404) | |
| Other changes in assets and liabilities | 4,345,935 | | | (81,415) | | | — | | | 4,264,520 | |
| Net cash provided by operating activities | 52,770,191 | | | (35,890,819) | | | (280,520) | | | 16,598,852 | |
| Net cash (used in) provided by investing activities | (5,413,528) | | | — | | | 35,925,520 | | | 30,511,992 | |
| Net cash used in financing activities | (52,723,938) | | | $ | 35,890,819 | | | $ | (35,645,000) | | | (52,478,119) | |
| Net change during the year | (5,367,275) | | | — | | | — | | | (5,367,275) | |
| Cash and cash equivalents at beginning of year | 46,991,879 | | | — | | | — | | | 46,991,879 | |
| Cash and cash equivalents at end of year | $ | 41,624,604 | | | — | | | — | | | $ | 41,624,604 | |
| | | | | | | | | | | | | | | | | | | | | | | |
| Year Ended December 31, 2023 |
| Cash flow attributable to Diamond Hill Investment Group, Inc. | | Cash flow attributable to Consolidated Funds | | Eliminations | | As reported on the Consolidated Statement of Cash Flows |
| Cash flows from operating activities: | | | | | | | |
| Net income | $ | 42,226,422 | | | $ | 3,818,572 | | | $ | (2,959,446) | | | $ | 43,085,548 | |
| Adjustments to reconcile net income to net cash provided by operating activities: | | | | | | | |
| Depreciation | 1,289,315 | | | — | | | — | | | 1,289,315 | |
| Share-based compensation | 11,691,890 | | | — | | | — | | | 11,691,890 | |
| Net gains on investments | (15,677,551) | | | (3,818,572) | | | 2,959,446 | | | (16,536,677) | |
| Net change in securities held by Consolidated Funds | — | | | (10,930,911) | | | — | | | (10,930,911) | |
| Other changes in assets and liabilities | 4,959,742 | | | 1,110,217 | | | — | | | 6,069,959 | |
| Net cash provided by operating activities | 44,489,818 | | | (9,820,694) | | | — | | | 34,669,124 | |
| Net cash used in investing activities | (3,675,461) | | | — | | | (530,163) | | | (4,205,624) | |
| Net cash used in financing activities | (57,017,780) | | | $ | 9,820,694 | | | $ | 530,163 | | | (46,666,923) | |
| Net change during the year | (16,203,423) | | | — | | | — | | | (16,203,423) | |
| Cash and cash equivalents at beginning of year | 63,195,302 | | | — | | | — | | | 63,195,302 | |
| Cash and cash equivalents at end of year | $ | 46,991,879 | | | — | | | — | | | $ | 46,991,879 | |
| | | | | | | | | | | | | | | | | | | | | | | |
| Year Ended December 31, 2022 |
| Cash flow attributable to Diamond Hill Investment Group, Inc. | | Cash flow attributable to Consolidated Funds | | Eliminations | | As reported on the Consolidated Statement of Cash Flows |
| Cash flows from operating activities: | | | | | | | |
| Net income | $ | 40,434,107 | | | $ | (11,739,448) | | | $ | 8,176,103 | | | $ | 36,870,762 | |
| Adjustments to reconcile net income to net cash provided by operating activities: | | | | | | | |
| Depreciation | 1,377,610 | | | — | | | — | | | 1,377,610 | |
| Share-based compensation | 10,660,673 | | | — | | | — | | | 10,660,673 | |
| Gain on sale of High Yield-Focused Advisory Contracts | (6,813,579) | | | — | | | — | | | (6,813,579) | |
| Net losses on investments | 21,552,322 | | | 11,739,448 | | | (8,819,876) | | | 24,471,894 | |
| Net change in securities held by Consolidated Funds | — | | | (14,039,687) | | | — | | | (14,039,687) | |
| Other changes in assets and liabilities | (17,563,539) | | | 4,518,501 | | | — | | | (13,045,038) | |
| Net cash provided by operating activities | 49,647,594 | | | (9,521,186) | | | (643,773) | | | 39,482,635 | |
| Net cash provided by investing activities | 5,330,622 | | | — | | | 703,249 | | | 6,033,871 | |
| Net cash used in financing activities | (72,333,307) | | | $ | 9,521,186 | | | $ | (59,476) | | | (62,871,597) | |
| Net change during the year | (17,355,091) | | | — | | | — | | | (17,355,091) | |
| Cash and cash equivalents at beginning of year | 80,550,393 | | | — | | | — | | | 80,550,393 | |
| Cash and cash equivalents at end of year | $ | 63,195,302 | | | — | | | — | | | $ | 63,195,302 | |
Material Cash Commitments
The Company’s material cash commitments consist of its obligations under its Deferred Compensation Plans, lease obligations, and other contractual amounts that will be due for the purchase of goods and services to be used in its operations. Some of these contractual amounts may be cancelable under certain conditions and may involve termination fees. The Company expects to fund these cash commitments with future cash flow from operations and its Deferred Compensation Plans’ investments in the Proprietary Funds.
Its obligations under the Deferred Compensation Plans are disclosed on the consolidated balance sheets with more information included in Note 7 to the consolidated financial statements. Its lease obligations are disclosed in Note 8 to the consolidated financial statements. The Company’s other material cash commitments for goods and services used in operations primarily consist of obligations related to long-term software licensing and maintenance contracts.
Non-GAAP Financial Measures and Reconciliation
As a supplement to information calculated and presented in accordance with U.S. generally accepted accounting principles (“GAAP”), the Company is providing certain financial measures that are based on methodologies other than GAAP (“non-GAAP”). Management believes the non-GAAP financial measures below are useful measures of the Company’s core business activities, are important metrics in estimating the value of an asset management business, and help facilitate comparisons to Company operating performance across periods. These non-GAAP financial measures are presented for supplemental informational purposes only, should not be used as a substitute for financial measures calculated in accordance with GAAP and may be calculated differently from similarly titled non-GAAP measures used by other companies. The following schedules reconcile the differences between financial measures calculated in accordance with GAAP and non-GAAP financial measures for 2024 and 2023. Investors are encouraged to review the related GAAP financial measures and the reconciliation of these non-GAAP financial measures to their most directly comparable GAAP financial measures, as well as the Company’s condensed consolidated financial statements and related notes included elsewhere in this report.
| | | | | | | | | | | | | | | | | | | | | | | | | | | | | | | | | | | | | | | | | |
| | Year Ended December 31, 2024 |
| (in thousands, except percentages and per share data) | Total operating expenses | | Net operating income | | Total non-operating income | | Income tax expense(5) | | Net income attributable to common shareholders | | Earnings per share attributable to common shareholders - diluted | | Net operating profit margin |
| GAAP Basis | $ | 107,203 | | | $ | 43,892 | | | $ | 15,119 | | | $ | 15,833 | | | $ | 43,178 | | | $ | 15.66 | | | 29 | % |
| Non-GAAP Adjustments: | | | | | | | | | | | | | |
Deferred compensation liability(1) | (4,776) | | | 4,776 | | | (4,776) | | | — | | | — | | | — | | | 3 | % |
Consolidated Funds(2) | — | | | 28 | | | 199 | | | 61 | | | 165 | | | 0.06 | | | — | |
Other investment income(4) | — | | | — | | | $ | (10,542) | | | (2,825) | | | (7,717) | | | (2.80) | | | — | |
| | | | | | | | | | | | | |
| Adjusted Non-GAAP Basis | $ | 102,427 | | | $ | 48,696 | | | — | | | $ | 13,069 | | | $ | 35,626 | | | $ | 12.92 | | | 32 | % |
| | | | | | | | | | | | | | | | | | | | | | | | | | | | | | | | | | | | | | | | | |
| | Year Ended December 31, 2023 |
| (in thousands, except percentages and per share data) | Total operating expenses | | Net operating income | | Total non-operating loss | | Income tax expense(5) | | Net income attributable to common shareholders | | Earnings per share attributable to common shareholders - diluted | | Net operating profit margin |
| GAAP Basis | $ | 101,212 | | | $ | 35,504 | | | $ | 23,071 | | | $ | 15,490 | | | $ | 42,226 | | | $ | 14.32 | | | 26 | % |
| Non-GAAP Adjustments: | | | | | | | | | | | | | |
Deferred compensation liability(1) | (5,600) | | | 5,600 | | | (5,600) | | | — | | | — | | | — | | | 4 | % |
Consolidated Funds(2) | — | | | 330 | | | (4,148) | | | (793) | | | (2,166) | | | (0.73) | | | — | |
Other investment income(4) | — | | | — | | | $ | (13,323) | | | (3,571) | | | (9,752) | | | (3.31) | | | — | |
| | | | | | | | | | | | | |
| Adjusted Non-GAAP Basis | $ | 95,612 | | | $ | 41,434 | | | — | | | $ | 11,126 | | | $ | 30,308 | | | $ | 10.28 | | | 30 | % |
| | | | | | | | | | | | | | | | | | | | | | | | | | | | | | | | | | | | | | | | | |
| | Year Ended December 31, 2022 |
| (in thousands, except percentages and per share data) | Total operating expenses | | Net operating income | | Total non-operating income | | Income tax expense(5) | | Net income attributable to common shareholders | | Earnings per share attributable to common shareholders - diluted | | Net operating profit margin |
| GAAP Basis | $ | 90,165 | | | $ | 64,331 | | | $ | (13,373) | | | $ | 14,088 | | | $ | 40,434 | | | $ | 13.01 | | | 42 | % |
| Non-GAAP Adjustments: | | | | | | | | | | | | | |
Deferred compensation liability(1) | 4,402 | | | (4,402) | | | 4,402 | | | — | | | — | | | — | | | (3) | % |
Consolidated Funds(2) | — | | | 423 | | | 11,317 | | | 2,113 | | | 6,063 | | | 1.95 | | | — | |
Gain on sale of High Yield-Focused Advisory Contracts(3) | — | | | — | | | (6,814) | | | (1,761) | | | (5,053) | | | (1.63) | | | — | |
Other investment income(4) | — | | | — | | | $ | 4,468 | | | 1,155 | | | 3,313 | | | 1.07 | | | — | |
| | | | | | | | | | | | | |
| Adjusted Non-GAAP Basis | $ | 94,567 | | | $ | 60,352 | | | — | | | $ | 15,595 | | | $ | 44,757 | | | $ | 14.40 | | | 39 | % |
(1) This non-GAAP adjustment removes the compensation expense resulting from market valuation changes in the Deferred Compensation Plans’ liability and the related net gains/losses on investments designated as an economic hedge against the related liability. Amounts deferred under the Deferred Compensation Plans are adjusted for appreciation/depreciation of investments chosen by participants. The Company believes it is useful to offset the non-operating investment income or loss realized on the hedges against the related compensation expense and remove the net impact to help readers understand the Company’s core operating results and to improve comparability from period to period.
(2) This non-GAAP adjustment removes the impact that the Consolidated Fund(s) have on the Company’s GAAP consolidated statements of income. Specifically, the Company adds back the operating expenses and subtracts the investment income of the Consolidated Fund(s). The adjustment to net operating income represents the operating expenses of the Consolidated Fund(s), net of the elimination of related management and administrative fees. The adjustment to net income attributable to common shareholders represents the net income of the Consolidated Fund(s), net of redeemable non-controlling interests. The Company believes removing the impact of the Consolidated Fund(s) helps readers understand its core operating results and improves comparability from period to period.
(3) This non-GAAP adjustment removes the impact of the gain on the sale of the High Yield-Focused Advisory Contracts. The sale of the High Yield-Focused Advisory Contracts was a discrete transaction, thus, the Company believes that removing the impact of the gain helps readers understand the Company’s core operating results and improves comparability period to period.
(4) This non-GAAP adjustment represents the net gains or losses earned on the Company’s non-consolidated investment portfolio that are not designated as economic hedges of the Deferred Compensation Plans’ liability, non-consolidated seed investments, and other investments. The Company believes adjusting for these non-operating income or loss items helps readers understand the Company’s core operating results and improves comparability from period to period.
(5) The income tax expense impacts were calculated and resulted in an overall non-GAAP effective tax rate of 26.8% for 2024, 26.8% for 2023 and 25.8% for 2022.
Critical Accounting Policies and Estimates
The preparation of financial statements requires management to make estimates, judgments, and assumptions that affect the reported amounts of assets, liabilities, revenues, expenses, and related disclosures of contingent assets and liabilities. The Company evaluates such estimates, judgments, and assumptions on an ongoing basis, and bases its estimates, judgments, and assumptions on historical experiences, current trends, and various other factors that it believes to be reasonable under the circumstances. By their nature, these estimates, judgments, and assumptions are subject to uncertainty, and actual results may differ materially from these estimates.
Consolidation. The Company consolidates all subsidiaries and certain investments in which the Company has a controlling interest. The Company is generally deemed to have a controlling interest when it owns the majority of the voting interest of a voting rights entity (“VRE”) or are deemed to be the primary beneficiary of a variable interest entity (“VIE”). A VIE is an entity that lacks sufficient equity to finance its activities, or any entity whose equity holders do not have defined power to direct the activities of the entity normally associated with an equity investment. The Company’s analysis to determine whether an entity is a VIE or a VRE involves judgment and considers several factors, including an entity’s legal organization, equity structure, the rights of the investment holders, the Company’s ownership interest in the entity, and its contractual involvement with the entity. The Company continually reviews and reconsiders its VIE or VRE conclusions upon the occurrence of certain events, such as changes to its ownership interest, or amendments to contract documents.
Provisions for Income Taxes. The objectives of accounting for income taxes are to recognize the amount of taxes payable or refundable for the current year and deferred tax liabilities and assets for the future tax consequences of events that have been recognized in an entity’s financial statements or tax returns. Judgment is required in assessing the future tax consequences of events that have been recognized in the Company’s financial statements or tax returns.
Revenue Recognition when Acting as an Agent vs. Principal. The Proprietary Funds have selected and contractually engaged certain vendors to fulfill various services to benefit the Proprietary Funds’ shareholders or to satisfy regulatory requirements of the Proprietary Funds. These services include, among others, required fund shareholder mailings, registration services, and legal and audit services. DHCM, in fulfilling a portion of its role under the administration agreements with the Proprietary Funds, acts as agent to pay these obligations of the Proprietary Funds. Each vendor is independently responsible for fulfillment of the services it has been engaged to provide and negotiates fees and terms with the management and board of trustees of each Proprietary Fund. The fee that the Proprietary Funds pay to DHCM is reviewed annually by the Proprietary Funds’ respective boards of trustees and specifically considers the contractual expenses that DHCM pays on behalf of the Proprietary Funds. As a result, DHCM is not involved in the delivery or pricing of these services and bears no risk related to these services. Revenue has been recorded net of these Proprietary Fund expenses, as appropriate for this agency relationship.
| | | | | |
| ITEM 7A. | Quantitative and Qualitative Disclosures About Market Risk |
The Company’s revenues and net income are based primarily on the value of its AUM. Accordingly, declines in financial market values directly and negatively impact its investment advisory revenues and net income.
The Company invests in its investment strategies, which are market risk sensitive financial instruments. These investments have inherent market risk in the form of price risk due to the potential future loss of value that would result from a decline in their fair value. Market prices fluctuate, and the amount realized upon subsequent sale may differ significantly from the reported market value.
The table below summarizes the Company’s market risks as of December 31, 2024, and shows the effects of a hypothetical 10% increase and decrease in investments.
| | | | | | | | | | | | | | | | | |
| Fair Value as of December 31, 2024 | | Fair Value
Assuming a
Hypothetical
10% Increase | | Fair Value
Assuming a
Hypothetical
10% Decrease |
| Equity investments | $ | 79,207,519 | | | $ | 87,128,271 | | | $ | 71,286,767 | |
| Fixed Income investments | 80,545,462 | | | 88,600,008 | | | 72,490,916 | |
| Total | $ | 159,752,981 | | | $ | 175,728,279 | | | $ | 143,777,683 | |
| | | | | |
| ITEM 8. | Financial Statements and Supplementary Data |
Index to Consolidated Financial Statements
Report of Independent Registered Public Accounting Firm
To the Shareholders and Board of Directors
Diamond Hill Investment Group, Inc.:
Opinion on the Consolidated Financial Statements
We have audited the accompanying consolidated balance sheets of Diamond Hill Investment Group, Inc. and subsidiaries (the Company) as of December 31, 2024 and 2023, the related consolidated statements of income, shareholders’ equity and redeemable noncontrolling interest, and cash flows for each of the years in the three-year period ended December 31, 2024, and the related notes (collectively, the consolidated financial statements). In our opinion, the consolidated financial statements present fairly, in all material respects, the financial position of the Company as of December 31, 2024 and 2023, and the results of its operations and its cash flows for each of the years in the three-year period ended December 31, 2024, in conformity with U.S. generally accepted accounting principles.
We also have audited, in accordance with the standards of the Public Company Accounting Oversight Board (United States) (PCAOB), the Company’s internal control over financial reporting as of December 31, 2024, based on criteria established in Internal Control – Integrated Framework (2013) issued by the Committee of Sponsoring Organizations of the Treadway Commission, and our report dated February 26, 2025 expressed an unqualified opinion on the effectiveness of the Company’s internal control over financial reporting.
Basis for Opinion
These consolidated financial statements are the responsibility of the Company’s management. Our responsibility is to express an opinion on these consolidated financial statements based on our audits. We are a public accounting firm registered with the PCAOB and are required to be independent with respect to the Company in accordance with the U.S. federal securities laws and the applicable rules and regulations of the Securities and Exchange Commission and the PCAOB.
We conducted our audits in accordance with the standards of the PCAOB. Those standards require that we plan and perform the audit to obtain reasonable assurance about whether the consolidated financial statements are free of material misstatement, whether due to error or fraud. Our audits included performing procedures to assess the risks of material misstatement of the consolidated financial statements, whether due to error or fraud, and performing procedures that respond to those risks. Such procedures included examining, on a test basis, evidence regarding the amounts and disclosures in the consolidated financial statements. Our audits also included evaluating the accounting principles used and significant estimates made by management, as well as evaluating the overall presentation of the consolidated financial statements. We believe that our audits provide a reasonable basis for our opinion.
Critical Audit Matter
The critical audit matter communicated below is a matter arising from the current period audit of the consolidated financial statements that was communicated or required to be communicated to the audit committee and that: (1) relates to accounts or disclosures that are material to the consolidated financial statements and (2) involved our especially challenging, subjective, or complex judgments. The communication of a critical audit matter does not alter in any way our opinion on the consolidated financial statements, taken as a whole, and we are not, by communicating the critical audit matter below, providing a separate opinion on the critical audit matter or on the accounts or disclosures to which it relates.
Evaluation of the assets under management data used in the calculation of investment advisory fee revenue for separately managed accounts (excluding performance-based fees), collective investment trusts and other pooled vehicles
As discussed in Note 2 to the consolidated financial statements, the Company recognizes investment advisory fee revenue for its separately managed accounts (excluding performance-based fees), collective investment trusts and other pooled vehicles based on a percentage of its assets under management (AUM). The Company recognized $44.6 million in investment advisory fees related to separately managed accounts (excluding performance-based fees), collective investment trusts and other pooled vehicles during the year ended December 31, 2024. AUM is an input to the calculation of the investment advisory fee revenue. Specifically, as it pertains to these accounts, the inputs to the AUM calculation and the calculated AUM value are transmitted through multiple information technology (IT) systems used in the calculation of investment advisory fee revenue.
We identified the evaluation of the AUM data used in the calculation of separately managed accounts (excluding performance-based fees), collective investment trusts and other pooled vehicles investment advisory fee revenue as a critical audit matter. There is a high degree of auditor judgment required to perform procedures to address the Company’s use of multiple IT systems to maintain the AUM data, including the use of professionals with specialized skills and knowledge to test the AUM data processed through multiple IT systems.
The following are the primary procedures we performed to address this critical audit matter. We evaluated the design and tested the operating effectiveness of certain internal controls related to the critical audit matter. This included controls related to the inputs to the AUM calculation, as well as controls that reconcile AUM between IT systems. We involved IT professionals with specialized skills and knowledge, who assisted in the testing of application and related general IT controls relevant to the IT systems used to maintain AUM data. We compared AUM used in the calculation of investment advisory fees to the source IT systems for a selection of accounts.
/s/ KPMG LLP
We have served as the Company’s auditor since 2012.
Columbus, Ohio
February 26, 2025
Diamond Hill Investment Group, Inc.
Consolidated Balance Sheets
| | | | | | | | | | | |
| | December 31, |
| | 2024 | | 2023 |
| ASSETS | | | |
| Cash and cash equivalents | $ | 41,624,604 | | | $ | 46,991,879 | |
| Investments | 159,752,981 | | | 147,738,862 | |
| Accounts receivable | 20,205,678 | | | 18,051,241 | |
| Prepaid expenses | 3,694,019 | | | 3,509,460 | |
| Income taxes receivable | 1,550,718 | | | 1,620,864 | |
| Property and equipment, net of depreciation | 8,380,594 | | | 2,591,604 | |
| Deferred taxes | 9,918,056 | | | 11,590,438 | |
| Total assets | $ | 245,126,650 | | | $ | 232,094,348 | |
| LIABILITIES AND SHAREHOLDERS’ EQUITY | | | |
| Liabilities | | | |
| Accounts payable and accrued expenses | $ | 5,599,931 | | | $ | 5,421,454 | |
| Accrued incentive compensation | 31,500,000 | | | 29,500,000 | |
| Lease liability | 6,335,490 | | | 768,916 | |
| Deferred compensation | 39,129,093 | | | 36,087,170 | |
| | | |
| Total liabilities | 82,564,514 | | | 71,777,540 | |
| Redeemable noncontrolling interest | 246,008 | | | — | |
| Permanent Shareholders’ Equity | | | |
| Common shares, no par value: 7,000,000 shares authorized; 2,670,469 issued and outstanding at December 31, 2024 (inclusive of 173,120 unvested shares); 2,823,076 issued and outstanding at December 31, 2023 (inclusive of 190,172 unvested shares) | 28,478,515 | | | 22,164,410 | |
| Preferred shares, undesignated, 1,000,000 shares authorized and unissued | — | | | — | |
| Deferred equity compensation | (15,833,657) | | | (15,392,418) | |
| Retained earnings | 149,671,270 | | | 153,544,816 | |
| Total permanent shareholders’ equity | 162,316,128 | | | 160,316,808 | |
| Total liabilities and shareholders’ equity | $ | 245,126,650 | | | $ | 232,094,348 | |
The accompanying notes are an integral part of these consolidated financial statements.
Diamond Hill Investment Group, Inc.
Consolidated Statements of Income
| | | | | | | | | | | | | | | | | |
| | Year Ended December 31, |
| | 2024 | | 2023 | | 2022 |
| REVENUES: | | | | | |
| Investment advisory | $ | 143,341,943 | | | $ | 129,179,500 | | | $ | 144,325,517 | |
| Fund administration, net | 7,753,188 | | | 7,536,871 | | | 10,170,502 | |
| Total revenue | 151,095,131 | | | 136,716,371 | | | 154,496,019 | |
| OPERATING EXPENSES: | | | | | |
| Compensation and related costs, excluding deferred compensation expense (benefit) | 74,588,900 | | | 70,730,640 | | | 70,505,216 | |
| Deferred compensation expense (benefit) | 4,775,627 | | | 5,599,880 | | | (4,402,265) | |
| General and administrative | 16,784,783 | | | 14,935,033 | | | 13,606,922 | |
| Sales and marketing | 7,510,182 | | | 6,684,410 | | | 7,159,686 | |
| Fund administration | 3,543,848 | | | 3,262,421 | | | 3,294,983 | |
| Total operating expenses | 107,203,340 | | | 101,212,384 | | | 90,164,542 | |
| NET OPERATING INCOME | 43,891,791 | | | 35,503,987 | | | 64,331,477 | |
| NON-OPERATING INCOME (LOSS) | | | | | |
| Investment income (loss), net | 15,119,200 | | | 23,071,441 | | | (20,186,511) | |
| Gain on sale of High Yield-Focused Advisory Contracts | — | | | — | | | 6,813,579 | |
| Total non-operating income (loss) | 15,119,200 | | | 23,071,441 | | | (13,372,932) | |
| NET INCOME BEFORE TAXES | 59,010,991 | | | 58,575,428 | | | 50,958,545 | |
| Income tax expense | (15,833,073) | | | (15,489,880) | | | (14,087,783) | |
| NET INCOME | 43,177,918 | | | 43,085,548 | | | 36,870,762 | |
| Net (income) loss attributable to redeemable noncontrolling interest | (189) | | | (859,126) | | | 3,563,345 | |
| NET INCOME ATTRIBUTABLE TO COMMON SHAREHOLDERS | $ | 43,177,729 | | | $ | 42,226,422 | | | $ | 40,434,107 | |
| Earnings per share attributable to common shareholders | | | | | |
| Basic | $ | 15.66 | | | $ | 14.32 | | | $ | 13.01 | |
| Diluted | $ | 15.66 | | | $ | 14.32 | | | $ | 13.01 | |
| Weighted average shares outstanding | | | | | |
| Basic | 2,757,860 | | | 2,948,625 | | | 3,107,604 | |
| Diluted | 2,757,860 | | | 2,948,625 | | | 3,107,604 | |
The accompanying notes are an integral part of these consolidated financial statements.
Diamond Hill Investment Group, Inc.
Consolidated Statements of Shareholders’ Equity and Redeemable Noncontrolling Interest | | | | | | | | | | | | | | | | | | | | | | | | | | | | | | | | | | | |
| Shares
Outstanding | | Common Shares | | Deferred Equity
Compensation | | Retained
Earnings | | Total | | Redeemable Noncontrolling Interest |
| Balance at December 31, 2021 | 3,171,536 | | | $ | 80,434,049 | | | $ | (15,268,705) | | | $ | 119,257,558 | | | $ | 184,422,902 | | | $ | 17,756,336 | |
| Issuance of restricted share grants | 76,143 | | | 13,436,439 | | | (13,436,439) | | | — | | | — | | | — | |
| Amortization of restricted share grants | — | | | — | | | 10,530,486 | | | — | | | 10,530,486 | | | — | |
| Common shares issued as incentive compensation | 2,743 | | | 487,870 | | | — | | | — | | | 487,870 | | | — | |
| Issuance of common shares related to 401(k) plan match | 211 | | | 37,313 | | | — | | | — | | | 37,313 | | | — | |
| Issuance of common shares related to employee stock purchase plan | 3,392 | | | 619,159 | | | — | | | — | | | 619,159 | | | — | |
| Shares withheld related to employee tax withholding obligations | (19,302) | | | (3,436,678) | | | — | | | — | | | (3,436,678) | | | — | |
| Forfeiture of restricted share grants | (7,257) | | | (1,163,514) | | | 1,163,514 | | | — | | | — | | | — | |
| Repurchases of common shares | (217,009) | | | (38,726,007) | | | — | | | — | | | (38,726,007) | | | — | |
| Cash dividends paid of $10.00 per share | — | | | — | | | — | | | (30,696,907) | | | (30,696,907) | | | — | |
| Net income (loss) | — | | | — | | | — | | | 40,434,107 | | | 40,434,107 | | | (3,563,345) | |
| Net subscriptions of consolidated funds | — | | | — | | | — | | | — | | | — | | | 9,461,710 | |
| Net deconsolidations of Company sponsored investments | — | | | — | | | — | | | — | | | — | | | (9,528,503) | |
| Balance at December 31, 2022 | 3,010,457 | | | $ | 51,688,631 | | | $ | (17,011,144) | | | $ | 128,994,758 | | | $ | 163,672,245 | | | $ | 14,126,198 | |
| Issuance of restricted share grants | 59,578 | | | 11,131,853 | | | (11,131,853) | | | — | | | — | | | — | |
| Amortization of restricted share grants | — | | | — | | | 11,603,239 | | | — | | | 11,603,239 | | | — | |
| | | | | | | | | | | |
| Issuance of common shares related to 401(k) plan match | 99 | | | 16,344 | | | — | | | — | | | 16,344 | | | — | |
| Issuance of common shares related to employee stock purchase plan | 2,904 | | | 482,097 | | | — | | | — | | | 482,097 | | | — | |
| Shares withheld related to employee tax withholding obligations | (30,204) | | | (5,131,262) | | | — | | | — | | | (5,131,262) | | | — | |
| Forfeiture of restricted share grants | (7,120) | | | (1,147,340) | | | 1,147,340 | | | — | | | — | | | — | |
| Repurchases of common shares (inclusive of accrued excise tax of $255,969) | (212,638) | | | (34,875,913) | | | — | | | — | | | (34,875,913) | | | — | |
| Cash dividends paid of $6.00 per share | — | | | — | | | — | | | (17,676,364) | | | (17,676,364) | | | — | |
| Net income | — | | | — | | | — | | | 42,226,422 | | | 42,226,422 | | | 859,126 | |
| Net deconsolidations of Company sponsored investments | — | | | — | | | — | | | — | | | — | | | (25,336,181) | |
| Net subscriptions of consolidated funds | — | | | — | | | — | | | — | | | — | | | 10,350,857 | |
| Balance at December 31, 2023 | 2,823,076 | | | $ | 22,164,410 | | | $ | (15,392,418) | | | $ | 153,544,816 | | | $ | 160,316,808 | | | $ | — | |
| Issuance of restricted share grants | 87,344 | | | 13,474,536 | | | (13,474,536) | | | — | | | — | | | — | |
| Amortization of restricted share grants | — | | | — | | | 11,763,736 | | | — | | | 11,763,736 | | | — | |
| | | | | | | | | | | |
| Issuance of common shares related to employee stock purchase plan | 2,501 | | | 385,037 | | | — | | | — | | | 385,037 | | | — | |
| Shares withheld related to employee tax withholding obligations | (39,757) | | | (6,275,907) | | | — | | | — | | | (6,275,907) | | | — | |
| Forfeiture of restricted share grants | (7,471) | | | (1,269,561) | | | 1,269,561 | | | — | | | — | | | — | |
| Repurchases of common shares (inclusive of accrued excise tax of $275,961) | (195,224) | | | | | — | | | (30,520,599) | | | (30,520,599) | | | — | |
| Cash dividends paid of $6.00 per share | — | | | — | | | — | | | (16,530,676) | | | (16,530,676) | | | — | |
| Net income | — | | | — | | | — | | | 43,177,729 | | | 43,177,729 | | | 189 | |
| | | | | | | | | | | |
| Net subscriptions of consolidated funds | — | | | — | | | — | | | — | | | — | | | $ | 245,819 | |
| Balance at December 31, 2024 | 2,670,469 | | | $ | 28,478,515 | | | $ | (15,833,657) | | | $ | 149,671,270 | | | $ | 162,316,128 | | | 246,008 | |
The accompanying notes are an integral part of these consolidated financial statements.
Diamond Hill Investment Group, Inc.
Consolidated Statements of Cash Flows | | | | | | | | | | | | | | | | | |
| | Year Ended December 31, |
| | 2024 | | 2023 | | 2022 |
| CASH FLOWS FROM OPERATING ACTIVITIES: | | | | | |
| Net income | $ | 43,177,918 | | | $ | 43,085,548 | | | $ | 36,870,762 | |
| Adjustments to reconcile net income to net cash provided by operating activities: | | | | | |
| Depreciation | 1,224,475 | | | 1,289,315 | | | 1,377,610 | |
| Share-based compensation | 11,821,490 | | | 11,691,890 | | | 10,660,673 | |
| (Increase) decrease in accounts receivable | (2,154,437) | | | (3,393,686) | | | 3,107,409 | |
| Change in current income taxes | 70,146 | | | (157,317) | | | (2,265,287) | |
| Change in deferred income taxes | 1,672,382 | | | 2,783,768 | | | (4,526,654) | |
| Gain on sale of High Yield-Focused Advisory Contracts | — | | | — | | | (6,813,579) | |
| Net (gain) loss on investments | (8,080,147) | | | (16,536,677) | | | 24,471,894 | |
| Net change in securities held by Consolidated Funds | (35,809,404) | | | (10,930,911) | | | (14,039,687) | |
| Increase (decrease) in accrued incentive compensation | 2,000,000 | | | (2,600,000) | | | (4,647,548) | |
| Increase (decrease) in deferred compensation | 3,041,923 | | | 5,342,180 | | | (6,603,304) | |
| Other changes in assets and liabilities | (365,494) | | | 4,095,014 | | | 1,890,346 | |
| Net cash provided by operating activities | 16,598,852 | | | 34,669,124 | | | 39,482,635 | |
| CASH FLOWS FROM INVESTING ACTIVITIES: | | | | | |
| Purchase of property and equipment | (1,363,440) | | | (21,705) | | | (101,454) | |
| Purchase of Company sponsored investments | (15,125,376) | | | (19,469,955) | | | (7,606,958) | |
| Proceeds from sale of Company sponsored investments | 47,000,808 | | | 15,286,036 | | | 6,928,704 | |
| | | | | |
| Proceeds from sale of High Yield-Focused Advisory Contracts | — | | | — | | | 6,813,579 | |
| Net cash provided by (used in) investing activities | 30,511,992 | | | (4,205,624) | | | 6,033,871 | |
| CASH FLOWS FROM FINANCING ACTIVITIES: | | | | | |
| Value of shares withheld related to employee tax withholding obligations | (6,275,907) | | | (5,131,262) | | | (3,436,678) | |
| Payment of dividends | (16,530,676) | | | (17,676,364) | | | (30,696,907) | |
| Net subscriptions received from redeemable noncontrolling interest holders | 245,819 | | | 10,350,857 | | | 9,461,710 | |
| Repurchase of common shares | (30,244,638) | | | (34,619,944) | | | (38,726,007) | |
| Proceeds received under employee stock purchase plan | 327,283 | | | 409,790 | | | 526,285 | |
| Net cash used in financing activities | (52,478,119) | | | (46,666,923) | | | (62,871,597) | |
| CASH AND CASH EQUIVALENTS | | | | | |
| Net change during the year | (5,367,275) | | | (16,203,423) | | | (17,355,091) | |
| At beginning of year | 46,991,879 | | | 63,195,302 | | | 80,550,393 | |
| At end of year | $ | 41,624,604 | | | $ | 46,991,879 | | | $ | 63,195,302 | |
| Supplemental information related to cash activities | | | | | |
| Income taxes paid | $ | 14,090,545 | | | $ | 12,863,429 | | | $ | 20,879,724 | |
| | | | | |
| Supplemental information related to non-cash activities | | | | | |
| Operating lease right-of-use asset addition, net of lease incentives | 3,173,981 | | | $ | — | | | $ | — | |
| Lease incentives included in property and equipment | 2,837,175 | | | $ | — | | | $ | — | |
| Common shares issued as incentive compensation | — | | | $ | — | | | $ | 487,870 | |
| | | | | |
| | | | | |
The accompanying notes are an integral part of these consolidated financial statements.
Diamond Hill Investment Group, Inc.
Notes to Consolidated Financial Statements
Note 1 Business and Organization
DHIL derives its consolidated revenues and net income from investment advisory and fund administration services provided by DHCM. DHCM is a registered investment adviser. DHCM is the investment adviser and administrator for the Proprietary Funds. DHCM also provides investment advisory services to DHMF, SMAs, CITs, other pooled vehicles including sub-advised funds, and model delivery programs.
Note 2 Significant Accounting Policies
Basis of Presentation
The accompanying consolidated financial statements of the Company have been prepared pursuant to the rules and regulations of the SEC and in accordance with the instructions to Form 10-K. The Company believes that the disclosures contained herein are adequate to make the information presented not misleading.
These consolidated financial statements reflect, in the opinion of the Company, all material adjustments (which include only normal recurring adjustments) necessary to fairly present the Company’s financial position as of December 31, 2024 and 2023, and results of operations for the years ended December 31, 2024, 2023 and 2022.
Use of Estimates
The preparation of the consolidated financial statements requires management to make estimates and judgments that affect the reported amounts of assets and liabilities and disclosure of contingent assets and liabilities as of the date of the financial statements as well as the reported amounts of revenue and expense during the reporting period. Estimates have been prepared based on the most current and best available information, but actual results could differ materially from those estimates.
Reclassification
Certain prior period amounts and disclosures may have been reclassified to conform to the current period’s financial presentation.
Prior to January 1, 2024, the Company recorded share repurchases as a reduction to common shares in permanent shareholders’ equity. Effective January 1, 2024, share repurchases have been recorded as a reduction to retained earnings in permanent shareholders’ equity. The Company has not reclassified any share repurchases included in common shares prior to January 1, 2024.
Principles of Consolidation
The accompanying consolidated financial statements include the operations of DHIL and its consolidated subsidiaries. All inter-company transactions and balances have been eliminated in consolidation.
DHCM holds certain investments in the Proprietary Funds and DHMF for general corporate investment purposes, to provide seed capital for newly formed strategies, or to add capital to existing strategies. The Diamond Hill Funds are organized in a series fund structure in which there are multiple mutual funds within one trust (the “Trust”). The Trust is an open-end investment company registered under the Company Act. Each individual Diamond Hill Fund represents a separate share class of a legal entity organized under the Trust. DHSC is organized as a Delaware statutory trust and is a closed-end investment company registered under the Company Act. DHMF is organized as a Delaware limited partnership and is exempt from registration under the Company Act.
DHIL consolidates those subsidiaries and investments over which it has a controlling interest. The Company is generally deemed to have a controlling interest when it owns the majority of the voting interest of a VRE or is deemed to be the primary beneficiary of a VIE. A VIE is an entity that lacks sufficient equity to finance its activities, or any entity whose equity holders do not have defined power to direct the activities of the entity normally associated with an equity investment. The Company’s analysis to determine whether an entity is a VIE or a VRE involves judgment and consideration of several factors, including an entity’s legal organization, equity structure, the rights of the investment holders, the Company’s ownership interest in the entity, and the Company’s contractual involvement with the entity. The Company continually reviews and reconsiders its controlling
interest, VIE or VRE conclusions upon the occurrence of certain events, such as changes to its ownership interest, or amendments to contract documents.
The Company performs its consolidation analysis at the individual fund level and has concluded that the Proprietary Funds are VREs because the structure of the Proprietary Funds is such that the shareholders are deemed to have the power through voting rights to direct the activities that most significantly impact each Proprietary Fund’s economic performance. The Proprietary Funds are consolidated if DHIL ownership, directly or indirectly, represents a majority interest (greater than 50%). The Company records redeemable noncontrolling interests in consolidated investments for which the Company’s ownership is less than 100%. As of December 31, 2024, the Company has consolidated the Diamond Hill Core Plus Bond Fund. As of December 31, 2023, the Company did not consolidate any of the Proprietary Funds. As of December 31, 2022, the Company consolidated the Diamond Hill International Fund. The Company deconsolidated the Diamond Hill International Fund during the year ended December 31, 2023, and deconsolidated the Diamond Hill Large Cap Concentrated during the year ended December 31, 2022 as the Company’s ownership declined to less than 50% during each of these years. The Proprietary Fund(s) consolidated during the applicable period are referred to as the “Consolidated Fund(s).”
DHCM is the investment advisor of DHMF and is the managing member of Diamond Hill Fund GP, LLC (the “General Partner”), which is the general partner of DHMF. DHCM is wholly-owned by, and consolidated with, DHIL. Further, through its control of the General Partner, DHCM has the power to direct DHMF’s economic activities and the right to receive investment advisory fees from DHMF that may be significant. DHMF commenced operations on June 1, 2021, and its underlying assets consist primarily of marketable securities.
The Company concluded DHMF was a VIE given that: (i) DHCM has disproportionately less voting interest than economic interest, and (ii) DHMF’s limited partners have full power to remove the General Partner (which is controlled by DHCM, which is controlled by DHIL) due to the existence of substantive kick-out rights. In addition, substantially all of DHMF’s activities are conducted on behalf of the General Partner, which has disproportionately few voting rights. The Company concluded it is not the primary beneficiary of DHMF as it lacks the power to control DHMF, since DHMF’s limited partners have single-party kick-out rights and can unilaterally remove the General Partner without cause. DHCM’s investments in DHMF are reported as a component of the Company’s investment portfolio and valued at DHCM’s respective share of DHMF's net income or loss.
Gains and losses attributable to changes in the value of DHCM’s interests in DHMF are included in the Company’s reported investment income. The Company’s exposure to loss as a result of its involvement with DHMF is limited to the amount of its investment. DHCM is not obligated to provide, and has not provided, financial or other support to DHMF, except for its investments to date and its contractually provided investment advisory responsibilities. The Company has not provided liquidity arrangements, guarantees, or other commitments to support DHMF’s operations, and DHMF’s creditors and interest holders have no recourse to the general credit of the Company.
Redeemable Noncontrolling Interest
Redeemable noncontrolling interest represents third-party interests in the Consolidated Funds. This interest is redeemable at the option of the investors, and therefore, is not treated as permanent equity. Redeemable noncontrolling interest is recorded at redemption value, which approximates the fair value each reporting period.
Segment Information
Management has determined that the Company operates in a single business segment, which is providing investment advisory and fund administration services. The Chief Operating Decision Maker (“CODM”) is the Company’s Chief Executive Officer who evaluates the performance of the business and allocates resources using a single, consolidated internal reporting structure.
The accounting policies of the segment are the same as those described in this Note 2. The CODM assesses performance for the segment and decides how to allocate resources based on net operating income.
The CODM does not review Company assets in evaluating the results of the single business segment, therefore, no additional asset information is presented.
For information regarding how the Company generates revenue, and its revenues by source, see Note 2, Revenue Recognition - General. Substantially all of the Company’s revenue is generated from clients in the United States, and all long-lived assets are located in the United States. No single customer accounted for more than 10% of the Company’s total revenue during the periods presented.
Cash and Cash Equivalents
Cash and cash equivalents include demand deposits and money market mutual funds held by DHCM. The Company considers all highly liquid temporary cash instruments with an original maturity of three months or less to be cash equivalents. The Company places its cash on deposit with U.S. financial institutions that are insured by the Federal Deposit Insurance Corporation (“FDIC”) up to $250,000. The Company’s credit risk in the event of failure of these financial institutions is represented by the difference between the FDIC limit and the total amount on deposit. Management monitors the financial institutions’ creditworthiness in conjunction with balances on deposit to minimize risk. The Company from time to time may have amounts on deposit in excess of the insured limits. As of December 31, 2024, the Company had $1.3 million and $40.3 million in demand deposits and money market mutual funds, respectively. As of December 31, 2023, the Company had $2.8 million and $44.2 million in demand deposits and money market mutual funds, respectively.
Accounts Receivable
The Company records accounts receivable when they are due and presents them on the balance sheet net of any allowance for doubtful accounts. Accounts receivable are written off when they are determined to be uncollectible. Any allowance for doubtful accounts is estimated based on the Company’s historical losses, existing conditions in the industry, and the financial stability of the individual or entity that owes the receivable. No allowance for doubtful accounts was deemed necessary at either December 31, 2024 or 2023. Accounts receivable from the Proprietary Funds were $10.3 million and $9.1 million as of December 31, 2024 and 2023, respectively.
Investments
Management determines the appropriate classification of the Company’s investments at the time of purchase and re-evaluates its determination for each reporting period.
Company sponsored investments, where the Company has neither the control nor the ability to exercise significant influence, as well as securities held in the Consolidated Funds, are measured at fair value based on quoted market prices. Unrealized gains and losses are recorded as investment income (loss) in the Company's consolidated statements of income.
Investments classified as equity method investments represent investments in which the Company owns 20% to 50% of the outstanding voting interests in the entity or where it is determined that the Company is able to exercise significant influence but not control over the investments. When using the equity method, the Company recognizes its respective share of the investee’s net income or loss for the period, which is recorded as investment income (loss) in the Company’s consolidated statements of income.
Property and Equipment
Property and equipment, consisting of leasehold improvements, right-of-use lease assets, computer equipment, capitalized software, furniture, and fixtures are carried at cost less accumulated depreciation.
Property, plant and equipment consist of the following as of December 31, 2024 and December 31, 2023:
| | | | | | | | | | | |
| As of December 31, |
| 2024 | | 2023 |
| Furniture and Fixtures | $ | 7,033,635 | | | $ | 7,033,635 | |
| Software and Hardware | 5,228,929 | | | 5,095,529 | |
| Construction in Progress | 4,067,215 | | | — | |
| Right of Use Lease Asset | 3,443,019 | | | 630,169 | |
| Total | 19,772,798 | | | 12,759,333 | |
| Less: Accumulated Depreciation | (11,392,204) | | | (10,167,729) | |
| Net Property, Plant and Equipment | $ | 8,380,594 | | | $ | 2,591,604 | |
Depreciation expense for the years ended December 31, 2024 and 2023 was $1,224,475 and $1,289,315, respectively.
The Company depreciates its property, plant, and equipment on a straight-line basis over the following estimated useful lives:
•Leasehold Improvements: Life of the lease
•Software & Hardware: 3- 5 years
•Furniture and Fixtures: 7 years
•Right of Use Lease Asset: Life of the lease
Construction in Progress includes costs incurred for leasehold improvements to the Company’s leased office space and internally developed software. These projects are expected to be completed within the next 12 months.
Implementation costs incurred to develop or obtain internal-use software, including hosting arrangements, are capitalized and expensed on a straight-line basis over either the estimated useful life of the respective software or the term of the hosting arrangement.
Property and equipment is tested for impairment when there is an indication that the carrying amount of an asset may not be recoverable. When an asset is determined to not be recoverable, the impairment loss is measured based on the excess, if any, of the carrying value of the asset over its fair value.
Revenue Recognition – General
The Company recognizes revenue when DHCM satisfies performance obligations under the terms of a contract with a client. The Company earns substantially all of its revenue from DHCM investment advisory and fund administration contracts. Investment advisory and fund administration fees, generally calculated as a percentage of AUM, are recorded as revenue as services are performed.
Revenue from contracts with clients that was earned during the years ended December 31, 2024, 2023 and 2022 include:
| | | | | | | | | | | | | | | | | |
| Year Ended December 31, 2024 |
| Investment advisory | | Fund administration, net | | Total revenue |
| Proprietary Funds | $ | 92,531,710 | | | $ | 7,753,188 | | | $ | 100,284,898 | |
| SMAs | 27,382,582 | | | — | | | 27,382,582 | |
| Other pooled vehicles | 11,465,794 | | | — | | | 11,465,794 | |
| CITs | 6,671,696 | | | — | | | 6,671,696 | |
| Model delivery | 5,290,161 | | | — | | | 5,290,161 | |
| $ | 143,341,943 | | | $ | 7,753,188 | | | $ | 151,095,131 | |
| | | | | | | | | | | | | | | | | |
| Year Ended December 31, 2023 |
| Investment advisory | | Fund administration, net | | Total revenue |
| Proprietary Funds | $ | 84,810,452 | | | $ | 7,536,871 | | | $ | 92,347,323 | |
| SMAs | 26,075,046 | | | — | | | 26,075,046 | |
| Other pooled vehicles | 9,261,533 | | | — | | | 9,261,533 | |
| Model delivery | 5,211,113 | | | — | | | 5,211,113 | |
| CITs | 3,821,356 | | | — | | | 3,821,356 | |
| $ | 129,179,500 | | | $ | 7,536,871 | | | $ | 136,716,371 | |
| | | | | | | | | | | | | | | | | |
| Year Ended December 31, 2022 |
| Investment advisory | | Fund administration, net | | Total revenue |
| Proprietary Funds | $ | 98,873,571 | | | $ | 10,170,502 | | | $ | 109,044,073 | |
| SMAs | 27,700,949 | | | — | | | 27,700,949 | |
| Other pooled vehicles | 9,410,541 | | | — | | | 9,410,541 | |
| Model delivery | 5,910,061 | | | — | | | 5,910,061 | |
| CITs | 2,430,395 | | | — | | | 2,430,395 | |
| $ | 144,325,517 | | | $ | 10,170,502 | | | $ | 154,496,019 | |
Revenue Recognition – Investment Advisory Fees
DHCM’s investment advisory contracts with clients have a single performance obligation because the contracted services are not separately identifiable from other obligations in the contracts, and therefore, are not distinct. All obligations to provide investment advisory services are satisfied over time by DHCM.
The fees DHCM receives for its services under its investment advisory contracts are based on AUM, which changes based on the value of securities held under each investment advisory contract. These fees are thereby constrained and represent variable consideration, and they are excluded from revenue until the AUM on which DHCM’s client is billed is no longer subject to market fluctuations.
DHCM also provides its strategy model portfolios and related services to sponsors of model delivery programs. For its services, DHCM is paid a model delivery fee by the program sponsor at a pre-determined rate based on the amount of AUA in the program.
Revenue Recognition – Fund Administration
DHCM has administrative and transfer agency services agreements with the Proprietary Funds under which DHCM performs certain services for each Proprietary Fund. These services include performance obligations such as fund administration, fund accounting, transfer agency, and other related functions. These services are performed concurrently under DHCM’s agreements with the Proprietary Funds, all performance obligations to provide these administrative services are satisfied over time, and the Company recognizes the related revenue as time progresses. Each fund pays DHCM a fee for performing these services, which is calculated using an annual rate multiplied by the average daily net assets of each respective fund share class. These fees are thereby constrained and represent variable consideration, and they are excluded from revenue until the AUM on which DHCM bills the Proprietary Funds is no longer subject to market fluctuations.
The Proprietary Funds have selected and contractually engaged certain vendors to fulfill various services to benefit the Proprietary Funds’ shareholders or to satisfy regulatory requirements of the Proprietary Funds. These services include, among others, required shareholder mailings, federal and state registrations, and legal and audit services. In fulfilling a portion of its role under the administration and transfer agency services agreements with the Proprietary Funds, DHCM acts as agent and pays for these services on behalf of the Proprietary Funds. Each vendor is independently responsible for fulfillment of the services it has been engaged to provide and negotiates its fees and terms directly with the Proprietary Funds’ management and respective boards of trustees. Each year, the Proprietary Funds’ respective boards of trustees review the fee that each fund pays to DHCM, and specifically considers the contractual expenses that DHCM pays on behalf of the Proprietary Funds. As a result, DHCM is not involved in the delivery or pricing of these services, and bears no risk related to these services. Revenue has been recorded net of these Fund-related expenses.
Fund administration gross and net revenue are summarized below:
| | | | | | | | | | | | | | | | | |
| | Year Ended December 31, |
| | 2024 | | 2023 | | 2022 |
| Fund administration: | | | | | |
| Administration revenue, gross | $ | 24,719,844 | | | $ | 21,597,721 | | | $ | 25,188,386 | |
| Fund related expense | (16,966,656) | | | (14,060,850) | | | (15,017,884) | |
| Fund administration revenue, net | $ | 7,753,188 | | | $ | 7,536,871 | | | $ | 10,170,502 | |
Income Taxes
The Company accounts for current and deferred income taxes through an asset and liability approach. Deferred tax assets are recognized for deductible temporary differences, and deferred tax liabilities are recognized for taxable temporary differences. Deferred tax assets are reduced by a valuation allowance when it is more likely than not that some portion or all of the deferred tax assets will not be realized. Deferred tax assets and liabilities are adjusted for the effects of changes in tax laws and rates on the date of enactment.
The Company is subject to examination by federal and applicable state and local jurisdictions for various tax periods. The Company’s income tax positions are based on research and interpretations of the income tax laws and rulings in each of the jurisdictions in which it does business. Due to the subjectivity of interpretations of laws and rulings in each jurisdiction, the differences and interplay in tax laws among those jurisdictions, and the inherent uncertainty in estimating the final resolution of complex tax audit matters, the Company’s estimates of income tax liabilities may differ materially from actual payments or
assessments. The Company regularly assesses its positions with regard to tax exposures and records liabilities for these uncertain tax positions and related interest and penalties, if any, according to the principles of Financial Accounting Standards Board (“FASB”) Accounting Standards Codification (“ASC”) 740, Income Taxes. The Company records interest and penalties within income tax expense on the income statement. See Note 9.
Earnings Per Share
Basic and diluted earnings per share (“EPS”) are computed by dividing net income attributable to common shareholders by the
weighted average number of DHIL common shares outstanding for the period, which includes unvested restricted shares. See Note 10.
Recently Adopted Accounting Guidance
In November 2023, the FASB issued Accounting Standards Update ("ASU") No. 2023-07 - “Segment Reporting (Topic 280) - Improvements to Reportable Segment Disclosures.” which expands annual and interim disclosure requirements for reportable segments, primarily through enhanced disclosures about significant segment expenses and clarifies that single reportable segment entities are required to apply all existing segment disclosures in the guidance. The Company adopted this standard in its 2024 annual reporting by applying the required retrospective approach. The adoption of this standard did not have a material effect on the Company’s consolidated financial statements but resulted in enhanced segment disclosures in this Note 2.
Newly Issued But Not Yet Adopted Accounting Guidance
In November 2024, the FASB issued ASU No. 2024-03, “Income Statement - Reporting Comprehensive Income - Expense Disaggregation Disclosures.” The ASU requires entities to disaggregate any relevant expense caption presented on the face of the income statement within continuing operations into the following required natural expense categories, as applicable: (1) purchases of inventory, (2) employee compensation, (3) depreciation, (4) intangible asset amortization, and (5) depreciation, depletion, and amortization recognized as part of oil- and gas-producing activities or other depletion expenses. ASU 2024-03 is effective for financial statements issued for annual periods beginning after December 15, 2026, and interim reporting periods beginning after December 15, 2027. The Company is currently evaluating the impact of ASU 2024-03 on its consolidated financial statements and related disclosures. While the Company has not yet completed its assessment, the adoption of this guidance is not expected to have a material impact on the Company’s consolidated financial statements.
In December 2023, the FASB issued ASU No. 2023-09, “Improvements to Income Tax Disclosures.” This update requires certain revisions to income tax disclosures, primarily disclosures related to rate reconciliation and income taxes paid. ASU 2023-09 is effective for financial statements issued for annual periods beginning after December 15, 2024. The Company does not believe that adoption of ASU 2023-09 will have a material impact on the Company’s consolidated financial statements.
Note 3 Investments
The following table summarizes the carrying value of the Company’s investments as of December 31, 2024 and 2023:
| | | | | | | | | | | |
| As of December 31, |
| 2024 | | 2023 |
| Fair value investments: | | | |
Securities held in Consolidated Funds(a) | $ | 35,583,162 | | | — | |
| Company-sponsored investments | 30,146,571 | | | $ | 63,208,573 | |
| Company-sponsored equity method investments | 94,023,248 | | | 84,530,289 | |
| Total Investments | $ | 159,752,981 | | | $ | 147,738,862 | |
(a) Of the securities held in the Consolidated Funds as of December 31, 2024, DHCM directly held $35.4 million and non-controlling shareholders held $0.2 million.
As of December 31, 2024, the Company has consolidated the Diamond Hill Core Plus Bond Fund. As of December 31, 2023, the Company did not consolidate any of the Proprietary Funds. The Company deconsolidated the Diamond Hill International Fund during the year ended December 31, 2023, as the Company’s ownership declined to less than 50%.
The components of net investment income (loss) are as follows: | | | | | | | | | | | | | | | | | |
| For the Year Ended December 31, |
| 2024 | | 2023 | | 2022 |
| Realized gains (losses) | $ | 141,604 | | | $ | 39,096 | | | $ | (118,408) | |
| Change in unrealized | 9,809,930 | | | 15,690,012 | | | (24,082,672) | |
| Dividends | 4,922,446 | | | 7,517,393 | | | 4,193,792 | |
| Interest income | 298,186 | | | — | | | — | |
| Other loss | (52,966) | | | (175,060) | | | (179,223) | |
| Investment income (loss), net | $ | 15,119,200 | | | $ | 23,071,441 | | | $ | (20,186,511) | |
Company-Sponsored Equity Method Investments
As of December 31, 2024, the Company’s equity method investments consisted of DHMF, the Diamond Hill International Fund, and the Diamond Hill Large Cap Concentrated Fund. The Company’s ownership percentage in each of these investments was 84%, 40%, and 43%, respectively. The Company’s ownership in DHMF, the Diamond Hill International Fund, and the Diamond Hill Large Cap Concentrated Fund includes $9.0 million of investments held in the Deferred Compensation Plans (as defined in Note 7).
As of December 31, 2023, the Company’s equity method investments consisted of DHMF, the Diamond Hill International Fund, and the Diamond Hill Large Cap Concentrated Fund. The Company’s ownership percentage in each of these investments was 85%, 49%, and 47%, respectively. The Company’s ownership in DHMF, the Diamond Hill International Fund, and the Diamond Hill Large Cap Concentrated Fund includes $6.9 million of investments held in the Deferred Compensation Plans.
As of December 31, 2022, the Company’s equity method investments consisted of DHMF and the Diamond Hill Large Cap Concentrated Fund, and the Company’s ownership percentage in each of these investments was 85% and 48%, respectively. The Company’s ownership in DHMF and the Diamond Hill Large Cap Concentrated Fund includes $3.8 million of investments from the Deferred Compensation Plans.
The following table includes the condensed summary financial information from the Company’s equity method investments as of December 31, 2024 and 2023, and for the years ended December 31, 2024, 2023, and 2022:
| | | | | | | | | | | | | | | | | |
| | | As of December 31, |
| | | 2024 | | 2023 |
| Total assets | | | $ | 211,179,739 | | | $ | 162,145,182 | |
| Total liabilities | | | 8,334,844 | | | 4,551,099 | |
| Net assets | | | 202,844,895 | | | 157,594,083 | |
| DHCM’s portion of net assets | | | $ | 94,023,248 | | | $ | 84,530,289 | |
| | | | | |
| For the Year Ended December 31, |
| 2024 | | 2023 | | 2022 |
| Investment income | $ | 4,406,158 | | | $ | 1,349,183 | | | $ | 413,528 | |
| Expenses | 1,686,238 | | | 460,670 | | | 134,478 | |
| Net realized gains | 6,957,654 | | | 311,950 | | | 378,476 | |
| Change in unrealized | 4,988,298 | | | 15,879,847 | | | (402,230) | |
| Net income | 14,665,872 | | | 17,080,310 | | | 255,296 | |
| DHCM’s portion of net income (loss) | $ | 9,039,837 | | | $ | 9,728,056 | | | $ | (405,393) | |
The Company’s investments at December 31, 2024 and 2023 include its interest in DHMF, an unconsolidated VIE, as the Company is not deemed the primary beneficiary. The Company’s maximum risk of loss related to its involvement with DHMF is limited to the carrying value of its investment which was $22.9 million and $17.7 million as of December 31, 2024 and 2023, respectively.
Note 4 Fair Value Measurements
The Company determines the fair value of its cash equivalents and certain investments using the following broad levels listed below:
Level 1 - Unadjusted quoted prices for identical instruments in active markets.
Level 2 - Quoted prices for similar instruments in active markets, quoted prices for identical or similar instruments in markets that are not active, and model-driven valuations in which all significant inputs are observable.
Level 3 - Valuations derived from techniques in which significant inputs are unobservable. The Company does not value any investments using Level 3 inputs.
These levels are not necessarily an indication of the risk or liquidity associated with investments.
The following table summarizes investments that are recognized in the Company’s consolidated balance sheet using fair value measurements (excludes investments classified as equity method investments) determined based upon the differing levels as of December 31, 2024 and 2023:
| | | | | | | | | | | | | | |
| December 31, 2024 | Level 1 | Level 2 | Level 3 | Total |
| Cash equivalents | $ | 40,339,754 | | — | | — | | $ | 40,339,754 | |
| Fair value investments | | | | |
Securities held in Consolidated Funds(a) | 1,840,412 | | 33,742,750 | | | 35,583,162 | |
| Company-sponsored investments | 30,146,571 | | — | | — | | 30,146,571 | |
| | | | |
| December 31, 2023 | | | | |
| Cash equivalents | 44,171,397 | | — | | — | | 44,171,397 | |
| Fair value investments | | | | |
| Company-sponsored investments | $ | 63,208,573 | | — | | — | | $ | 63,208,573 | |
(a) Of the securities held in the Consolidated Funds as of December 31, 2024, DHCM directly held $35.4 million and non-controlling shareholders held $0.2 million.
Changes to fair values of the investments are recorded in the Company’s consolidated statements of income as investment income (loss), net.
Note 5 Line of Credit
The Company has a committed Line of Credit Agreement (“Credit Agreement”) with a commercial bank that matures on December 11, 2025, which permits the Company to borrow up to $25.0 million. Borrowings under the Credit Agreement bear interest at a rate equal to the Secured Overnight Financing Rate plus 1.10%. The Company pays a commitment fee on the unused portion of the facility, accruing at a rate per annum of 0.10%.
The proceeds of the Credit Agreement may be used by the Company and its subsidiaries for ongoing working capital needs, to seed new and existing investment strategies, and for other general corporate purposes. The Credit Agreement contains customary representations, warranties, and covenants.
The Company did not borrow under the Credit Agreement during 2024, and no borrowings were outstanding as of December 31, 2024.
Note 6 Capital Stock
Common Shares
DHIL has only one class of securities outstanding, common shares, no par value per share.
Authorization of Preferred Shares
DHIL’s Amended and Restated Articles of Incorporation authorize the issuance of 1,000,000 “blank check” preferred shares with such designations, rights, and preferences as may be determined from time to time by the Board. The Board is authorized, without shareholder approval, to issue preferred shares with dividend, liquidation, conversion, voting, or other rights, which could adversely affect the voting or other rights of the holders of the common shares. There were no preferred shares issued or outstanding as of either December 31, 2024, or 2023.
Note 7 Compensation Plans
Share-Based Payment Transactions
The Company maintains the shareholder-approved Diamond Hill Investment Group, Inc. 2022 Equity and Cash Incentive Plan (“2022 Plan”), which authorizes the issuance of 300,000 common shares of DHIL in various forms of equity awards. As of December 31, 2024, there were 152,759 common shares available for grants under the 2022 Plan. Previously, the Company issued equity awards under the Diamond Hill Investment Group, Inc. 2014 Equity and Cash Incentive Plan (“2014 Plan”). There are no longer any DHIL common shares available for issuance under the 2014 Plan, although certain grants previously made under the 2014 Plan remain issued and outstanding.
Restricted share grants represent DHIL common shares issued and outstanding upon grant that remain subject to restrictions until specified vesting conditions are satisfied. The Company issues to all new Company employees upon hire restricted shares that cliff vest after five years. After the end of each year, the Company also issues to certain key employees restricted shares that vest ratably on an annual basis over three years.
Restricted shares are valued based upon the fair market value of the common shares on the applicable grant date. The restricted shares are recorded as deferred compensation in the equity section of the balance sheet on the grant date and then recognized as compensation expense on a straight-line basis over the vesting period of the respective grant. The Company’s policy is to adjust compensation expense for forfeitures as they occur.
Compensation and related costs, excluding deferred compensation expense (benefit) includes expenses related to restricted shares of $11.8 million, $11.6 million, and $10.5 million, for the years ended December 31, 2024, 2023, and 2022, respectively.
The following table represents a roll-forward of outstanding restricted shares and related activity for 2024:
| | | | | | | | | | | |
| Shares | | Weighted-Average
Grant Date Price
per Share |
| Outstanding Restricted Shares as of December 31, 2023 | 190,172 | | | $ | 164.69 | |
| Grants issued | 87,344 | | | 154.27 | |
| Grants vested | (96,925) | | | 161.90 | |
| Grants forfeited | (7,471) | | | 169.93 | |
| Outstanding Restricted Shares as of December 31, 2024 | 173,120 | | | $ | 160.77 | |
The weighted-average grant date price per share of restricted shares issued during the years ended December 31, 2023 and 2022 was $186.85 and $176.46, respectively. The total fair value of restricted shares vested, as of their respective vesting dates, during the years ended December 31, 2024, 2023, and 2022 was $15.3 million, $13.8 million, and $9.1 million, respectively.
Total deferred equity compensation related to unvested restricted shares was $15.8 million as of December 31, 2024. The recognition of compensation expense related to deferred compensation over the remaining vesting periods is as follows:
| | | | | | | | | | | | | | | | | | | | | | | | | | | | | | | | | | | | | | |
| 2025 | | 2026 | | 2027 | | 2028 | | 2029 | | Thereafter | | Total |
| $ | 8,223,033 | | | $ | 4,979,504 | | | $ | 1,661,651 | | | $ | 657,845 | | | $ | 311,624 | | | $ | — | | | $ | 15,833,657 | |
Employee Stock Purchase Plan
Under the ESPP, eligible employees may purchase DHIL common shares at 85% of the fair market value on the last day of each offering period. Each offering period is approximately three months, which coincides with the Company’s fiscal quarters. During the year ended December 31, 2024, ESPP participants purchased 2,501 DHIL common shares for $0.3 million and the Company recorded $0.1 million of share-based payment expense related to these purchases. During the year ended December 31, 2023, ESPP participants purchased 2,904 DHIL common shares for $0.4 million and the Company recorded $0.1 million of share-based payment expense related to these purchases.
As of December 31, 2024, 86,925 DHIL common shares were reserved for future issuance through the ESPP.
Share Grant Transactions
The following table represents DHIL common shares issued as part of the Company’s incentive compensation program during the years ended December 31, 2024, 2023, and 2022:
| | | | | | | | | | | |
| Shares Issued | | Grant Date Value |
| December 31, 2024 | — | | | — | |
| December 31, 2023 | — | | | — | |
| December 31, 2022 | 2,743 | | | $ | 487,870 | |
401(k) Plan
The Company sponsors a 401(k) plan in which all Company employees are eligible to participate. Company employees may contribute a portion of their compensation subject to certain limits based on federal tax laws. The Company matches employee contributions equal to 250.0% of the first 6.0% of an employee’s compensation contributed to the plan. The Company may settle the 401(k) plan matching contributions in cash or common shares of the Company. After June 1, 2023, the Company made all matching contributions in cash. Employees vest ratably in the matching contributions over a five year period. The following table summarizes the Company’s expenses attributable to the 401(k) plan during the years ended December 31, 2024, 2023 and 2022:
| | | | | | | | | | | | | | | | | | | | | | | |
| Shares Issued | | Share Contributions | | Cash Contributions | | Total Company Contributions |
| December 31, 2024 | — | | | — | | | $ | 3,074,509 | | | $ | 3,074,509 | |
| December 31, 2023 | 99 | | | $ | 16,344 | | | 3,067,630 | | | 3,083,974 | |
| December 31, 2022 | 211 | | | $ | 37,313 | | | $ | 2,910,156 | | | $ | 2,947,469 | |
Deferred Compensation Plans
Under the Deferred Compensation Plans, participants may elect to voluntarily defer, for a minimum of five years (subject to an earlier distribution in the case of the participant’s death or disability or a change in control of DHIL), certain incentive compensation that the Company may contribute into the Deferred Compensation Plans. Participants are responsible for designating investment options for the assets they contribute, and the distribution paid to each participant reflects any gains or losses on the assets realized in connection with the Deferred Compensation Plans. Assets held in the Deferred Compensation Plans are included in the Company’s investment portfolio, and the associated obligation to participants is included in deferred compensation liability. Deferred compensation liability was $39.1 million and $36.1 million as of December 31, 2024 and 2023, respectively.
Note 8 Operating Leases
On July 31, 2024, the Company entered into a 10-year extension of its lease through March 31, 2035, for office space of approximately 37,829 square feet at a single location.
As of December 31, 2024 and December 31, 2023, the carrying value of the right-of-use asset, which is included in property and equipment on the consolidated balance sheets, was approximately $3.4 million and $0.6 million, respectively. As of December 31, 2024 and December 31, 2023, the carrying value of the lease liability was approximately $6.3 million and $0.8 million, respectively.
The carrying value of the lease liability includes both principal and accrued interest on lease payments that are due in the current and future periods. Lease liability is measured at the present value of the remaining lease payments, discounted using the discount rate determined at the lease commencement date. Interest expense on lease liability is recognized in the consolidated income statements over the lease term.
As of December 31, 2024, the weighted average discount rate applied to the Company’s lease liability was 6.5%, reflective of the Company’s incremental borrowing rate. The determination of the incremental borrowing rate involves judgment, including assumptions about the Company’s credit risk, economic conditions, and the lease-specific circumstances such as lease term and asset class. Changes in these assumptions could have a material impact on the measurement of the Company’s lease liability.
The following table summarizes the total lease and operating expenses for the years ended December 31, 2024, 2023 and 2022:
| | | | | | | | | | | | | | |
| For the year ended December 31, |
| 2024 | | 2023 | | 2022 |
| $ | 934,353 | | | $ | 908,516 | | | $ | 918,496 | |
The following table provides a maturity analysis of the Company’s operating lease liability, based on undiscounted cash flows,
as of December 31, 2024:
| | | | | | | | |
| |
| | December 31, 2024 |
| 2025 | | $ | 723,480 | |
| 2026 | | 773,603 | |
| 2027 | | 796,868 | |
| 2028 | | 820,889 | |
| 2029 | | 845,384 | |
| 2030 and Thereafter | | 4,870,010 | |
| Total undiscounted operating lease payments | | 8,830,234 | |
| Less: Imputed interest | | (2,494,744) | |
| Present value of operating lease liability | | $ | 6,335,490 | |
Note 9 Income Taxes
The provision for income taxes consists of:
| | | | | | | | | | | | | | | | | |
| | For the year ended December 31, |
| | 2024 | | 2023 | | 2022 |
| Current federal income tax provision | $ | 11,122,669 | | | $ | 9,974,451 | | | $ | 14,494,857 | |
| Current state and local income tax provision | 3,038,022 | | | 2,731,661 | | | 4,119,580 | |
| Deferred income tax expense (benefit) | 1,672,382 | | | 2,783,768 | | | (4,526,654) | |
| Provision for income taxes | $ | 15,833,073 | | | $ | 15,489,880 | | | $ | 14,087,783 | |
The following table reconciles the statutory federal income tax rate to the Company’s effective income tax rate: | | | | | | | | | | | | | | | | | |
| 2024 | | 2023 | | 2022 |
| Statutory U.S. federal income tax rate | 21.0 | % | | 21.0 | % | | 21.0 | % |
| State and local income taxes, net of federal benefit | 4.6 | | | 4.7 | | | 4.7 | |
| Internal revenue code section 162 limitations | 1.4 | | | 1.3 | | | 1.5 | |
| Excess tax deficit on vesting of restricted shares | 0.3 | | | 0.3 | | | 0.1 | |
| Income tax benefit from dividends paid on restricted shares | (0.4) | | | (0.5) | | | (0.9) | |
| Other | (0.1) | | | — | | | (0.6) | |
| Unconsolidated effective income tax rate | 26.8 | % | | 26.8 | % | | 25.8 | % |
| Impact attributable to redeemable noncontrolling interest (a) | — | | | (0.4) | | | 1.8 | |
| Effective income tax rate | 26.8 | % | | 26.4 | % | | 27.6 | % |
(a) The provision for income taxes includes expense (benefit) attributable to the fact that the Company’s operations include the Consolidated Funds, which are not subject to federal income taxes. Accordingly, a portion of the Company’s earnings are not subject to corporate tax levels.
Deferred income taxes and benefits arise from temporary differences between taxable income for financial statement and income tax return purposes. Net deferred tax assets consisted of the following as of December 31, 2024 and 2023:
| | | | | | | | | | | |
| 2024 | | 2023 |
| Stock-based compensation | $ | 2,649,082 | | | $ | 2,778,585 | |
| Accrued compensation | 10,696,310 | | | 10,715,239 | |
| Unrealized gains | (3,257,452) | | | (1,487,350) | |
| Property and equipment | (194,110) | | | (422,062) | |
| Other assets and liabilities | 24,226 | | | 6,026 | |
| Net deferred tax assets | $ | 9,918,056 | | | $ | 11,590,438 | |
The net temporary differences incurred to date will reverse in future periods as the Company generates taxable earnings. The Company believes it is more likely than not that the results of future operations will generate sufficient taxable income to realize the net deferred tax assets recorded. The Company records a valuation allowance when it is more likely than not that some portion or all of the deferred tax assets will not be realized. As of December 31, 2024, no valuation allowance was deemed necessary.
FASB ASC 740, Income Taxes, prescribes a recognition threshold and measurement attribute for the financial statement recognition and measurement of a tax position taken or expected to be taken in a tax return and also provides guidance on derecognition, classification, interest and penalties, accounting in interim periods, disclosure and transition. The Company recognizes tax benefits related to positions taken, or expected to be taken, on its tax returns, only if the positions are “more-likely-than-not” sustainable. Once this threshold has been met, the Company’s measurement of its expected tax benefits is recognized in its financial statements. The Company did not record an accrual for tax-related uncertainties or unrecognized tax positions as of December 31, 2024 and 2023, respectively. The Company does not expect a change to the reserve for uncertain tax positions within the next twelve months that would have a material impact on the consolidated financial statements.
The Company and its subsidiaries file income tax returns with the Internal Revenue Service and the taxing authorities of various states. Generally, the Company is subject to federal, state, and local examinations by tax authorities for the tax years ended December 31, 2021 through 2024.
Note 10 Earnings Per Share
DHIL common shares outstanding consist of all shares issued and outstanding, including unvested restricted shares. Basic and diluted EPS are calculated under the two-class method. The following table sets forth the computation for basic and diluted EPS and reconciliation between basic and diluted shares outstanding:
| | | | | | | | | | | | | | | | | |
| | Year Ended December 31, |
| | 2024 | | 2023 | | 2022 |
| Net income | $ | 43,177,918 | | | $ | 43,085,548 | | | $ | 36,870,762 | |
| Less: Net (income) loss attributable to redeemable noncontrolling interest | (189) | | | (859,126) | | | 3,563,345 | |
| Net income attributable to common shareholders | $ | 43,177,729 | | | $ | 42,226,422 | | | $ | 40,434,107 | |
| | | | | |
| Weighted average number of outstanding shares - Basic | 2,757,860 | | | 2,948,625 | | | 3,107,604 | |
| Weighted average number of outstanding shares - Diluted | 2,757,860 | | | 2,948,625 | | | 3,107,604 | |
| | | | | |
| Earnings per share attributable to common shareholders | | | | | |
| Basic | $ | 15.66 | | | $ | 14.32 | | | $ | 13.01 | |
| Diluted | $ | 15.66 | | | $ | 14.32 | | | $ | 13.01 | |
Note 11 Commitments and Contingencies
The Company indemnifies its directors, officers, and certain employees for certain liabilities that may arise from the performance of their duties to the Company. From time to time, the Company and its subsidiaries may be involved in legal matters incidental to its business. There are currently no such legal matters pending that the Company believes will have a material adverse effect on its consolidated financial statements. However, litigation involves an element of uncertainty, and future developments could cause legal actions or claims to have a material adverse effect on the Company’s financial condition, results of operations, and liquidity.
Additionally, in the normal course of business, the Company enters into agreements that contain a variety of representations and
warranties and that provide indemnification obligations. Certain agreements do not contain any limits on the Company’s liability and could involve future claims that may be made against the Company that have not yet occurred. Therefore, it is not possible to estimate the Company’s potential liability under these indemnities. Further, the Company maintains insurance policies that may provide full or partial coverage against certain of these liabilities.
Note 12 Sale of the High Yield-Focused Investment Advisory Contracts
DHCM entered into an asset purchase agreement dated February 2, 2021 (the “Purchase Agreement”) with Brandywine Global, a specialist investment manager of Franklin Resources, Inc. The transaction closed on July 30, 2021, at which time Brandywine Global acquired the High Yield-Focused Advisory Contracts. After the closing, the Corporate Credit Fund and the High Yield Fund were renamed as the BrandywineGLOBAL Corporate Credit Fund and the BrandywineGLOBAL High Yield Fund (the “High Yield-Focused Funds”).
DHCM determined the gain on this transaction in accordance with FASB ASC 610-20, Gains and Losses from the Derecognition of Nonfinancial Assets. DHCM received an initial cash payment at closing of $9.0 million, which was included in gain on sale of High Yield-Focused Advisory Contracts in the consolidated statements of income during the third quarter of 2021.
Under the terms of the Purchase Agreement, DHCM received an additional payment of $6.8 million based on the net revenue of the High Yield-Focused Funds on July 30, 2022, effectively closing the transaction. The additional payment was included in gain on sale of High Yield-Focused Advisory Contracts in the consolidated statements of income during the third quarter of 2022.
Note 13 Subsequent Events
On February 26, 2025, the Board approved a quarterly cash dividend of $1.50 per share, payable on March 21, 2025, to shareholders of record as of the close of business on March 10, 2025.
From January 1, 2025 through February 26, 2025, the Company granted approximately 127,000 restricted shares which increased deferred equity compensation by $19.1 million. The recognition of compensation expense related to these awards over the remaining vesting periods is as follows:
| | | | | | | | | | | | | | | | | | | | | | | | | | | | | | | | | | | | | | |
| 2025 | | 2026 | | 2027 | | 2028 | | 2029 | | Thereafter | | Total |
| $ | 4,320,272 | | | $ | 5,168,523 | | | $ | 5,168,523 | | | $ | 2,623,772 | | | $ | 1,775,522 | | | $ | — | | | $ | 19,056,612 | |
| | | | | |
| ITEM 9. | Changes in and Disagreements With Accountants on Accounting and Financial Disclosures |
None.
| | | | | |
| ITEM 9A. | Controls and Procedures |
Evaluation of Disclosure Controls and Procedures
Management, including the Chief Executive Officer and the Chief Financial Officer, has conducted an evaluation of the effectiveness of the Company’s disclosure controls and procedures (as defined in Rules 13a-15(e) or 15d-15(e) of the Exchange Act) as of the end of the period covered by this Form 10-K (the “Evaluation Date”). Based on such evaluation, the Chief Executive Officer and the Chief Financial Officer have concluded that, as of the Evaluation Date, the Company’s disclosure controls and procedures were effective to provide reasonable assurance that the information required to be disclosed by the Company in the reports that it files or submits under the Exchange Act, is recorded, processed, summarized and reported within the time periods specified in the SEC’s rules and forms, and to ensure that the information required to be disclosed by the Company in the reports it files or submits under the Exchange Act is accumulated and communicated to the Company’s management, including the Chief Executive Officer and Chief Financial Officer, or persons performing similar functions, as appropriate to allow timely decisions regarding required disclosure.
Changes in Internal Control Over Financial Reporting
There were no changes in the Company’s internal control over financial reporting during the quarter ended December 31, 2024 that have materially affected, or are reasonably likely to materially affect, the Company’s internal control over financial reporting.
Management’s Annual Report on Internal Control Over Financial Reporting
The Company’s management is responsible for establishing and maintaining adequate internal control over financial reporting, as defined in Rule 13a-15(f) and 15d-15(f) of the Exchange Act. The Company’s internal control over financial reporting is a process designed to provide reasonable assurance regarding the reliability of financial reporting and the preparation of its consolidated financial statements for external purposes in accordance with accounting principles generally accepted in the United States of America.
Under the supervision and with the participation of the Chief Executive Officer and the Chief Financial Officer, management assessed the effectiveness of the Company’s internal control over financial reporting as of December 31, 2024 based on criteria established in Internal Control - Integrated Framework (2013) issued by the Committee of Sponsoring Organizations of the Treadway Commission. Based on this assessment, management concluded that the Company’s internal control over financial reporting was effective as of December 31, 2024 to provide reasonable assurance regarding the reliability of financial reporting and the preparation of consolidated financial statements for external reporting purposes in accordance with GAAP. [The audit committee of the Board reviewed the results of management’s assessment.]
The Company’s independent registered public accounting firm, KPMG LLP, has audited the Company’s 2024 and 2023 consolidated financial statements included in this Form 10-K and the Company’s internal control over financial reporting as of December 31, 2024, and has issued its Report of Independent Registered Public Accounting Firm on Consolidated Financial Statements and the Company’s internal control over financial reporting, which is included in this Form 10-K.
Inherent Limitations on Effectiveness of Controls
There are inherent limitations in the effectiveness of any control system, including the potential for human error and the possible circumvention or overriding of controls and procedures. Additionally, judgments in decision-making may be faulty and breakdowns may occur because of a simple error or mistake. An effective control system can provide only reasonable, not absolute, assurance that the control objectives of the system are adequately met. Accordingly, management, including the Chief Executive Officer and Chief Financial Officer, does not expect that the control system can prevent or detect all errors or fraud. Also, projections of any evaluation of effectiveness to future periods are subject to the risk that controls may become inadequate because of changes in conditions, or that the degree of compliance with the policies or procedures may deteriorate.
Report of Independent Registered Public Accounting Firm
To the Shareholders and Board of Directors
Diamond Hill Investment Group, Inc.:
Opinion on Internal Control Over Financial Reporting
We have audited Diamond Hill Investment Group, Inc. and subsidiaries' (the Company) internal control over financial reporting as of December 31, 2024, based on criteria established in Internal Control – Integrated Framework (2013) issued by the Committee of Sponsoring Organizations of the Treadway Commission. In our opinion, the Company maintained, in all material respects, effective internal control over financial reporting as of December 31, 2024, based on criteria established in Internal Control – Integrated Framework (2013) issued by the Committee of Sponsoring Organizations of the Treadway Commission.
We also have audited, in accordance with the standards of the Public Company Accounting Oversight Board (United States) (PCAOB), the consolidated balance sheets of the Company as of December 31, 2024 and 2023, the related consolidated statements of income, shareholders’ equity and redeemable noncontrolling interest, and cash flows for each of the years in the three-year period ended December 31, 2024, and the related notes (collectively, the consolidated financial statements), and our report dated February 26, 2025 expressed an unqualified opinion on those consolidated financial statements.
Basis for Opinion
The Company’s management is responsible for maintaining effective internal control over financial reporting and for its assessment of the effectiveness of internal control over financial reporting, included in the accompanying Management's Annual Report on Internal Control Over Financial Reporting. Our responsibility is to express an opinion on the Company’s internal control over financial reporting based on our audit. We are a public accounting firm registered with the PCAOB and are required to be independent with respect to the Company in accordance with the U.S. federal securities laws and the applicable rules and regulations of the Securities and Exchange Commission and the PCAOB.
We conducted our audit in accordance with the standards of the PCAOB. Those standards require that we plan and perform the audit to obtain reasonable assurance about whether effective internal control over financial reporting was maintained in all material respects. Our audit of internal control over financial reporting included obtaining an understanding of internal control over financial reporting, assessing the risk that a material weakness exists, and testing and evaluating the design and operating effectiveness of internal control based on the assessed risk. Our audit also included performing such other procedures as we considered necessary in the circumstances. We believe that our audit provides a reasonable basis for our opinion.
Definition and Limitations of Internal Control Over Financial Reporting
A company’s internal control over financial reporting is a process designed to provide reasonable assurance regarding the reliability of financial reporting and the preparation of financial statements for external purposes in accordance with generally accepted accounting principles. A company’s internal control over financial reporting includes those policies and procedures that (1) pertain to the maintenance of records that, in reasonable detail, accurately and fairly reflect the transactions and dispositions of the assets of the company; (2) provide reasonable assurance that transactions are recorded as necessary to permit preparation of financial statements in accordance with generally accepted accounting principles, and that receipts and expenditures of the company are being made only in accordance with authorizations of management and directors of the company; and (3) provide reasonable assurance regarding prevention or timely detection of unauthorized acquisition, use, or disposition of the company’s assets that could have a material effect on the financial statements.
Because of its inherent limitations, internal control over financial reporting may not prevent or detect misstatements. Also, projections of any evaluation of effectiveness to future periods are subject to the risk that controls may become inadequate because of changes in conditions, or that the degree of compliance with the policies or procedures may deteriorate.
/s/ KPMG LLP
Columbus, Ohio
February 26, 2025
| | | | | |
| ITEM 9B. | Other Information |
During the quarter ended December 31, 2024, no director or officer (as defined under Rule 16a-1 of the Exchange Act) adopted or terminated any Rule 10b5-1 trading arrangements or any non-Rule 10b5-1 trading arrangements (in each case, as defined in Item 408(a) of Regulation S-K).
| | | | | |
| ITEM 9C. | Disclosure Regarding Foreign Jurisdictions that Prevent Inspections |
Not applicable.
PART III
| | | | | |
| ITEM 10. | Directors, Executive Officers and Corporate Governance |
Information required by this Item 10 is incorporated herein by reference from the Company’s definitive proxy statement for its 2025 annual meeting of shareholders, which will be filed with the SEC no later than 120 days after December 31, 2024, pursuant to Regulation 14A of the Exchange Act (the “2025 Proxy Statement”), under the captions: “Delinquent Section 16(a) Reports”, “Proposal 1 - Election of Directors”, “The Board of Directors and Committees”, “Corporate Governance”, and “Executive Compensation”.
| | | | | |
| ITEM 11. | Executive Compensation |
Information required by this Item 11 is incorporated herein by reference from the 2025 Proxy Statement under the captions: “The Board of Directors and Committees”, “Corporate Governance”, and “Executive Compensation” (excluding the information under the subheadings “Pay Versus Performance Table,” “Tabular List of Important Financial Performance Measures” and “Analysis of Information Presented in the Pay Versus Performance Table”).
| | | | | |
| ITEM 12. | Security Ownership of Certain Beneficial Owners and Management and Related Shareholder Matters |
The following table sets forth certain information concerning the Company's equity compensation plans at December 31, 2024:
Equity Compensation Plan Information
| | | | | | | | | | | | | | | | | |
| (a) | | (b) | | (c) |
| Plan category | Number of securities to
be issued upon the
exercise of outstanding
options, warrants and
rights | | Weighted-average
exercise price of
outstanding options,
warrants and rights | | Number of securities
remaining available for
future issuance under
equity compensation
plans (excluding
securities reflected in
column (a) |
| Equity compensation plans approved by security holders | — | | | — | | | 152,759 | |
The other information required by this Item 12 is incorporated herein by reference from the 2025 Proxy Statement under the captions: “Security Ownership of Certain Beneficial Owners and Management” and “ Executive Compensation.”
| | | | | |
| ITEM 13. | Certain Relationships and Related Transactions, and Director Independence |
Information required by this Item 13 is incorporated herein by reference from the 2025 Proxy Statement under the caption: “Proposal 1 – Election of Directors – Director Independence” and “Corporate Governance”.
| | | | | |
| ITEM 14. | Principal Accountant Fees and Services |
Information required by this Item 14 is incorporated herein by reference from the 2025 Proxy Statement under the caption: “Proposal 2 – Ratification of the Appointment of Independent Registered Public Accounting Firm”.
PART IV
| | | | | |
| ITEM 15. | Exhibit and Financial Statement Schedules |
| | | | | |
| (a) (1) | Financial Statements: See “Index to the Consolidated Financial Statements” within Part II. Item 8, Financial Statements and Supplementary Data. |
| (2) | Financial Statement Schedules: All financial statement schedules for which provision is made in the applicable accounting regulations of the SEC are omitted because they are not required or the required information is included in the accompanying financial statements or notes thereto. |
| (3) | Exhibits: |
| | | | | |
| 3.1 | |
| |
| 3.2 | |
| |
| 4.1 | |
| |
| 10.1 | |
| |
| 10.2 | |
| |
| 10.3* | |
| |
| 10.4* | |
| |
| 10.5* | |
| |
| 10.6* | |
| |
| 10.7* | |
| |
| 10.8* | |
| |
| 10.9* | |
| |
| 10.10* | |
| |
| 10.11* | |
| |
| 10.12* | |
| |
| 10.13* | |
| |
| | | | | |
| 10.14* | |
| |
| 10.15* | |
| |
| 10.16* | |
| |
| 10.17* | |
| |
| 10.18* | |
| |
| 10.19* | |
| |
| 10.20* | |
| |
| 10.21* | |
| |
| 10.22* | |
| |
| 10.23 | |
| |
| 10.24 | |
| |
| 14.1 | |
| |
| 19.1 | |
| |
| 21.1 | |
| |
| 23.1 | |
| |
| 31.1 | |
| |
| 31.2 | |
| |
| 32.1 | |
| |
| 97.1 | |
| |
| 101.INS | XBRL Instance Document. |
| |
| 101.SCH | XBRL Taxonomy Extension Schema Document. |
| |
| 101.CAL | XBRL Taxonomy Extension Calculation Linkbase Document. |
| |
| 101.DEF | XBRL Taxonomy Extension Definition Linkbase Document. |
| |
| 101.LAB | XBRL Taxonomy Extension Label Linkbase Document. |
| |
| 101.PRE | XBRL Taxonomy Extension Presentation Linkbase Document. |
| | | | | |
| |
| 104 | Cover Page Interactive Data File (Embedded within the Inline XBRL document and included in Exhibit 101). |
| | | | | |
| * | Denotes management contract or compensatory plan or arrangement. |
| (b) | Exhibits: Reference is made to Item 15(a)(3) above. |
| (c) | Financial Statement Schedules: None required. |
| | | | | |
| ITEM 16. | Form 10-K Summary |
None.
SIGNATURES
Pursuant to the requirements of Section 13 or 15(d) of the Securities Exchange Act of 1934, as amended, the registrant has duly caused this report to be signed on its behalf by the undersigned, thereunto duly authorized:
| | | | | | | | | | | |
| DIAMOND HILL INVESTMENT GROUP, INC. | |
| | |
| By: | | /s/ Heather E. Brilliant | |
| | Heather E. Brilliant, Chief Executive Officer and President | February 26, 2025 |
Pursuant to the requirements of the Securities Exchange Act of 1934, as amended, this report has been signed below by the following persons on behalf of the registrant and in the capacities and on the dates indicated.
| | | | | | | | | | | | | | |
| Signature | | Title | | Date |
| | | | |
| /s/ Heather E. Brilliant | | Chief Executive Officer and | | February 26, 2025 |
| Heather E. Brilliant | | President (Principal Executive Officer) | | |
| | | | |
| /s/ Thomas E. Line | | Chief Financial Officer and | | February 26, 2025 |
| Thomas E. Line | | Treasurer (Principal Financial Officer and Principal Accounting Officer) | | |
| | | | |
| Richard S. Cooley* | | Director | | February 26, 2025 |
| Richard S. Cooley | | | | |
| | | | |
| Gordon B. Fowler* | | Director | | February 26, 2025 |
| Gordon Fowler | | | | |
| | | | |
| James F. Laird* | | Director | | February 26, 2025 |
| James F. Laird | | | | |
| | | | |
| Paula R. Meyer* | | Director | | February 26, 2025 |
| Paula R. Meyer | | | | |
| | | | |
| Nicole R. St. Pierre* | | Director | | February 26, 2025 |
| Nicole R. St. Pierre | | | | |
| | | | |
| L’Quentus Thomas* | | Director | | February 26, 2025 |
| L’Quentus Thomas | | | | |
| | | | |
| | | | | |
| * By | /s/ Thomas E. Line |
| Thomas E. Line |
| Executed by Thomas E. Line |
| on behalf of those indicated pursuant to Powers of Attorney |
| |
| |
| |
| |
| |
| |
