UNITED STATES
SECURITIES AND EXCHANGE COMMISSION
Washington, D.C. 20549
FORM N-CSR
CERTIFIED SHAREHOLDER REPORT OF REGISTERED MANAGEMENT INVESTMENT COMPANIES
Investment Company Act file number 811-07986
The Alger Institutional Funds
(Exact name of registrant as specified in charter)
100 Pearl Street, New York, New York 10004
(Address of principal executive offices) (Zip code)
Mr. Hal Liebes
Fred Alger Management, LLC
100 Pearl Street
New York, New York 10004
(Name and address of agent for service)
Registrant’s telephone number, including area code: 212-806-8800
Date of fiscal year end: October 31
Date of reporting period: April 30, 2022
Form N-CSR is to be used by management investment companies to file reports with the Commission, not later than 10 days after the transmission to Stockholders of any report to be transmitted to Stockholders under Rule 30e-1 under the Investment Company Act of 1940 (17 CFR 270.30e1). The Commission may use the information provided on Form N-CSR in its regulatory, disclosure review, inspection, and policymaking roles.
A registrant is required to disclose the information specified by Form N-CSR, and the Commission will make this information public. A registrant is not required to respond to the collection of information contained in Form N-CSR unless the Form displays a currently valid Office of Management and Budget (“OMB”) control number. Please direct comments concerning the accuracy of the information collection burden estimate and any suggestions for reducing the burden to the Secretary, Securities and Exchange Commission, 450 Fifth Street, NW, Washington, DC 20549-0609. The OMB has reviewed this collection of information under the clearance requirements of 44 U.S.C. § 3507.
ITEM 1. |
(a) | The following is a copy of the report transmitted to shareholders pursuant to Rule 30e-1 under the Investment Company Act of 1940 (17 CFR 270.30e-1). |
The Alger Institutional Funds | |
1 | |
12 | |
20 | |
21 | |
37 | |
41 | |
43 | |
Financial Highlights | 47 |
Notes to Financial Statements | 62 |
Additional Information | 89 |
Many Investors Shun Powerful Wealth Creator
In 1924, economist John Maynard Keynes wrote that companies that reinvest profits can create “an element of compound interest operating in favour of a sound industrial investment." At Alger, we believe reinvesting profits and producing compounding earnings growth is a powerful wealth creator. To that end, we seek companies that we believe have strong potential for compounding earnings growth, and we seek to avoid cyclical companies, including “short-duration” companies, or businesses with high current earnings that return most of their profits to shareholders. In most instances, these cyclical companies, in our view, have little or no potential for future long-term earnings growth.
As Warren Buffett has observed, investors “occasionally do crazy things,” which creates opportunities for investors who can “disregard mob fears or enthusiasms….and focus on a few simple fundamentals." We believe recent concerns about interest rates, inflation and valuations have caused many investors to act irrationally by focusing on cyclical short- duration companies while shunning the "sound industrial investment" identified by Keynes.
Setting the Stage for a Difficult Six-Month Period
The strong trend of investors rejecting the appeal of long-term earnings growth, in our view, played a major role in our disappointing fund performance during the fiscal six-month period ended April 30, 2022. The fiscal period included the continuation of a dramatic rotation by many investors seeking instant gratification by favoring companies with high current earnings. This rotation was initially fueled prior to the reporting period by optimism that scaling back or eliminating measures to curtail the COVID-19 pandemic combined with unprecedented levels of fiscal stimulus would drive strong economic growth. More recently, however, optimism gave way to concerns that equities may be overvalued at a time when the economy could overheat and require the U.S. Federal Reserve (the “Fed”) to continue to raise interest rates to fight inflation.
These concerns were supported by the following developments:
• | U.S. gross domestic product (“GDP”), which declined 3.4% in 2020 due to the economy shutting down to contain the pandemic, jumped 5.7% in 2021. |
• | After climbing to 6.3% at the end of 2020, the seasonally adjusted unemployment rate declined to 4.2% as of the November 2021 start of the fiscal six-month reporting period. It eventually reached 3.6% as of the end of the six-month period, during which concerns about inflation grew, a result of a tight labor market, among other things. |
• | Data appeared to validate inflation concerns. After hitting a 6.8% year-over- year increase (or increase during the past 12-month period) in November 2021 and increasing each subsequent month, the Consumer Price Index hit 8.5% as of March 2022. |
In response, the Fed shifted its outlook-it no longer maintained that inflation was a transitory result of supply chain issues and the economy reopening, and in March, the Fed raised the federal funds rate by 25 basis points ("BPS"), its first hike since cutting the rate to zero in 2020. Furthermore, Fed statements in March led many investors to anticipate a 50BPS rate hike in May and 200BPS in aggregate hikes by the end of 2022. Fears that rate hikes could eventually spark a recession also weighed upon investor sentiment.
Interest Rates Support Rotation Away from Quality
The rotation to short-duration companies was also partially supported by investors reacting to higher interest rates in a fairly typical fashion-they adjusted their cash flow modeling by increasing the rate at which they discount future cash flows back to the present, thereby lowering the value of long-duration companies. This process is similar to how long-term bonds are impacted more by rising rates than short-term bonds.
Not Just Growth, But High-Quality Small Cap Growth, Underperforms
Many small cap growth companies tend to have little or no current earnings, but strong potential for significant sales and earnings growth. Within the Russell 2000 Growth Index, for example, we believe many Healthcare companies are high-quality businesses even though they may not generate profits due to their investments in new initiatives, their products or potential products can have high gross margins and potential for capturing market share.
As a result of investors dismissing the appeal of potential earnings growth, the Healthcare sector was one of the worst performing sectors within the small cap growth category. From a broader perspective, sectors that generally consist of companies that provide dividends and appear to be less susceptible to inflation, such as Energy and Consumer Staples, led.
Also during the fiscal six-month period, growth underperformed value across the market cap spectrum, with the -26.77% return of the Russell 2000 Growth Index being a noteworthy laggard when compared to the -9.5% return of the Russell 2000 Value Index. The broad market, as measured by the S&P 500 Index, dropped 8.17%.
International Markets Also Struggle
Concerns about interest rates, inflation and the Russian invasion of Ukraine also extended beyond the U.S. Investors also assessed the spread of COVID-19 in China. Among non-U.S. equities, emerging markets significantly underperformed with the MSCI Emerging Markets Index declining 14.04% during the fiscal six-month reporting period. Within the index, the Utilities sector was the only sector to generate positive performance, as investors focused on companies that they perceived as having recession resistant fundamentals that provide a relatively high return of cash to shareholders. Consumer Discretionary, Healthcare and Energy were among the worst performing sectors. The selloff also included developed markets with the MSCI EAFE Index declining 11.58%. From a broader perspective, the MSCI ACWI Index declined 11.45%.
Irrational Behavior Creates Opportunity
As a result of investors’ rotation out of quality companies, growth equities, we believe, are trading at attractive valuations. Notably, the Russell 2000 Growth Index price-to-earnings (P/E) ratio based on the next 12-months' earnings, declined from 50.2x to approximately 33.5x during the six-month fiscal reporting period while the Russell 1000 Growth Index declined from 30.7x to 23.8x.
Navigating Fed Rate Hikes
Investors who are concerned about monetary policy may want to consider two points:
First, Fed rate increases don’t always lead to recessions. In fact, since 1965 there have been three instances in which the Fed increased the federal funds rate 300 BPS or more that resulted in continued real economic growth and slowing inflation rather than recessions. Additionally, during the 12-months following the end of Fed tightening in 1985 and 1995, as well as after the Fed relented in 2018, equities generated double-digit returns.
Second, the later phases of monetary tightening have been accompanied by growth stocks outperforming value equities. The six-month periods starting approximately three months after the beginning of Fed tightening cycles initiated in 1994, 1999, 2004, and 2015 illustrate this point. Based on the returns of the Russell 3000 Growth and Russell 3000 Value indices, the median outperformance of growth during those periods was 400BPS. During later phases of rate hikes, economic growth slows, so investors may be more willing to pay a premium for companies that can increase their earnings.
Going Forward
We continue to believe that unprecedented levels of innovation, such as healthcare advancements in genetic science, and digital technologies including artificial intelligence, e-commerce, the metaverse, streaming entertainment, and cloud computing are providing opportunities for leading companies to reward investors by generating long-term earnings growth. We will continue to focus on conducting in-depth fundamental research as we seek leaders of innovation rather than take short-term bets on the fickle nature of investor sentiment. We believe doing so is the best strategy for helping our valued shareholders reach their investment goals.
Portfolio Matters
Alger Capital Appreciation Institutional Fund
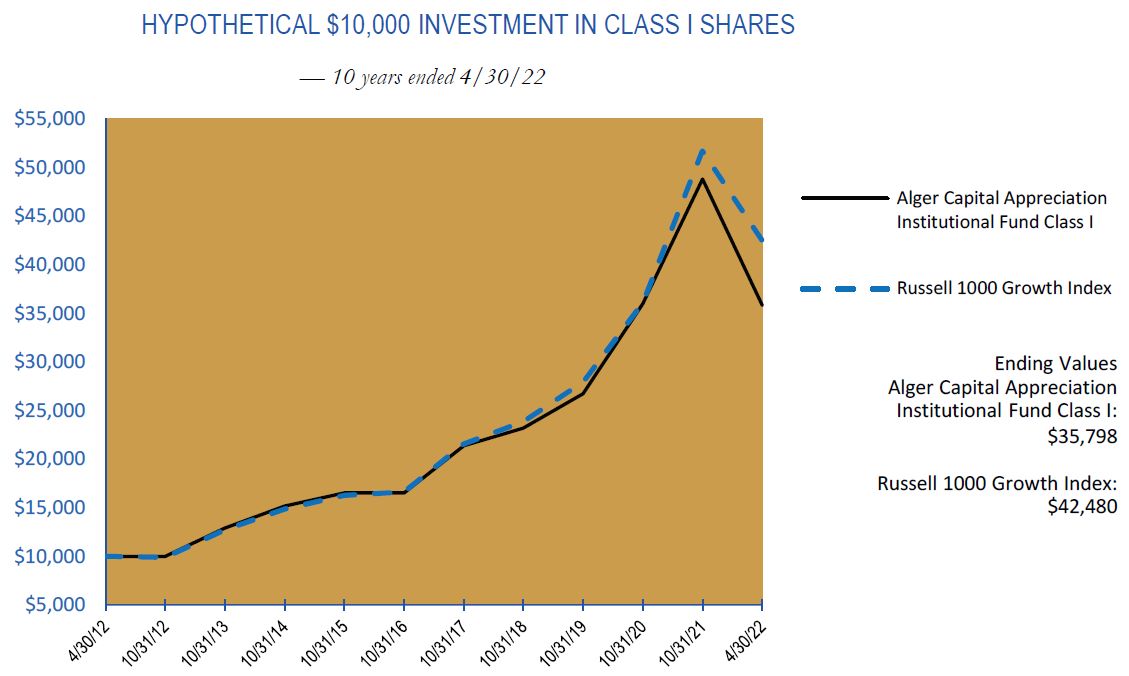
The Alger Capital Appreciation Institutional Fund returned -26.65% for the fiscal six- month period ended April 30, 2022, compared to the -17.84% return of its benchmark, the Russell 1000 Growth Index.
During the reporting period, the largest portfolio sector weightings were Information Technology and Consumer Discretionary. The largest sector overweight was Information Technology and the largest sector underweight was Consumer Staples.
Contributors to Performance
The Communication Services and Real Estate sectors provided the largest contributions to relative performance during the reporting period. Regarding individual positions, Alibaba Group Holding Ltd. Sponsored ADR; AbbVie, Inc.; UnitedHealth Group Inc.; Vertex Pharmaceuticals Inc.; and Qualcomm, Inc. were among the top contributors to absolute performance. Alibaba is a leading e-commerce and cloud computing company in China. It also serves the big data analytics, digital media and entertainment markets. Alibaba’s shares have previously suffered from concerns about heightened regulatory oversight of the Chinese internet sector by the Chinese Communist Party. Additionally, many investors became concerned about the potential for U.S. exchange listed Chinese ADRs to be delisted if they failed to meet U.S. financial reporting standards by 2024. These issues caused investors to sell shares of Alibaba, which we believe created attractive valuations. In the later portion of the fiscal six-month reporting period, the shares outperformed in response to statements by the Chinese government supporting stable markets and overseas listings. The Chinese government also stated that its intensified regulatory efforts aimed at tech companies may end soon.
Detractors from Performance
The Information Technology and Financial sectors were among the sectors that detracted from relative performance during the reporting period. Regarding individual positions, Amazon.com, Inc.; Microsoft Corp.; Shopify, Inc., Cl. A; Alphabet, Inc., Cl. C; and PayPal Holdings, Inc. were the top detractors from absolute performance. Microsoft is a positive dynamic change beneficiary of corporate America's transformative digitization. In a previous earnings call, Microsoft's CEO expects that technology spending as a percent of GDP is likely to jump from about 5% today to 10% in a few years, and that Microsoft will continue to take market share within the technology industry. Microsoft’s enterprise cloud product, Azure, is rapidly growing and accruing market share. Microsoft reported that Azure grew 46% in the quarter ended December 31, 2021, and the company’s total revenue growth exceeded 20%. Microsoft's share price declined despite its high unit volume growth as the broad equity market and technology stocks declined due to higher interest rates and the Russia/Ukraine conflict.
Alger Focus Equity Fund
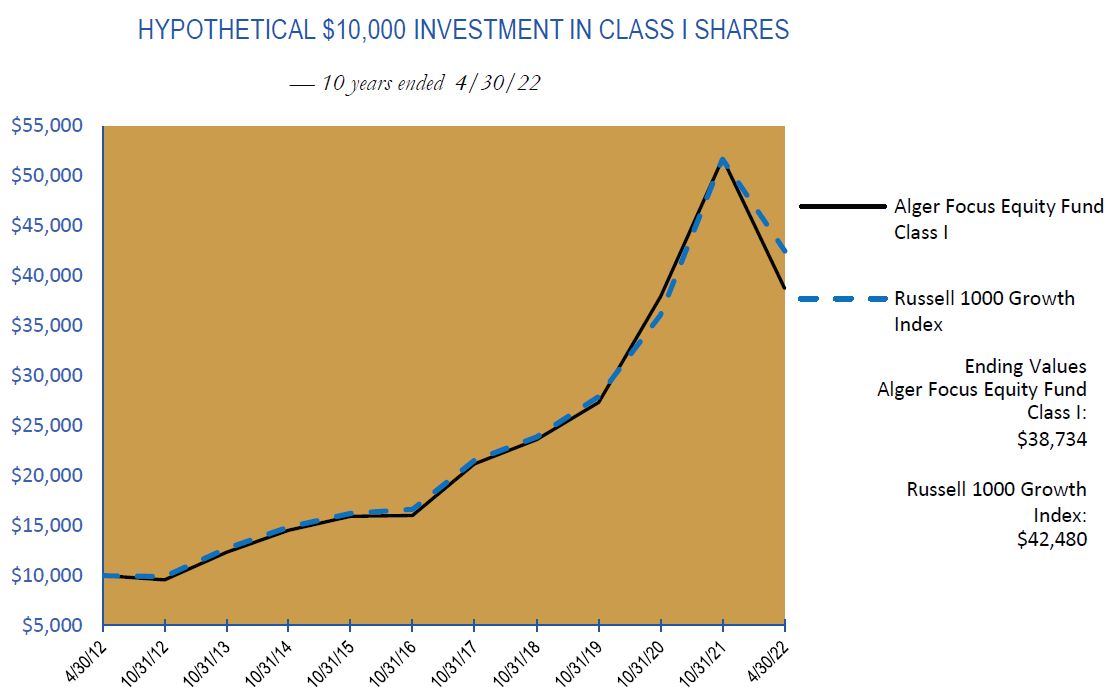
The Alger Focus Equity Fund returned -25.17% for the fiscal six-month period ended April 30, 2022, compared to the -17.84% return of its benchmark, the Russell 1000 Growth Index.
During the reporting period, the largest sector weightings were Information Technology and Consumer Discretionary. The largest sector overweight was Communication Services and the largest sector underweight was Consumer Staples.
Contributors to Performance
The Communication Services and Real Estate sectors provided the greatest contributions to relative performance during the reporting period. Regarding individual positions, Alibaba Group Holding Ltd. Sponsored ADR; UnitedHealth Group, Inc.; Qualcomm, Inc.; Starbucks Corp.; and Xilinx, Inc. were the top contributors to absolute performance. Shares of Alibaba outperformed in response to developments identified in the Alger Capital Appreciation Institutional Fund discussion.
Detractors from Performance
The Information Technology and Financials sectors were among the sectors that detracted from relative performance during the reporting period. Regarding individual positions, Amazon.com, Inc.; Microsoft Corp.; Shopify, Inc., Cl. A; Intuit, Inc.; and Alphabet, Inc., Cl. C were the most significant detractors from absolute performance. Shares of Microsoft underperformed in response to developments identified in the Alger Capital Appreciation Institutional Fund discussion.
Alger Mid Cap Growth Institutional Fund
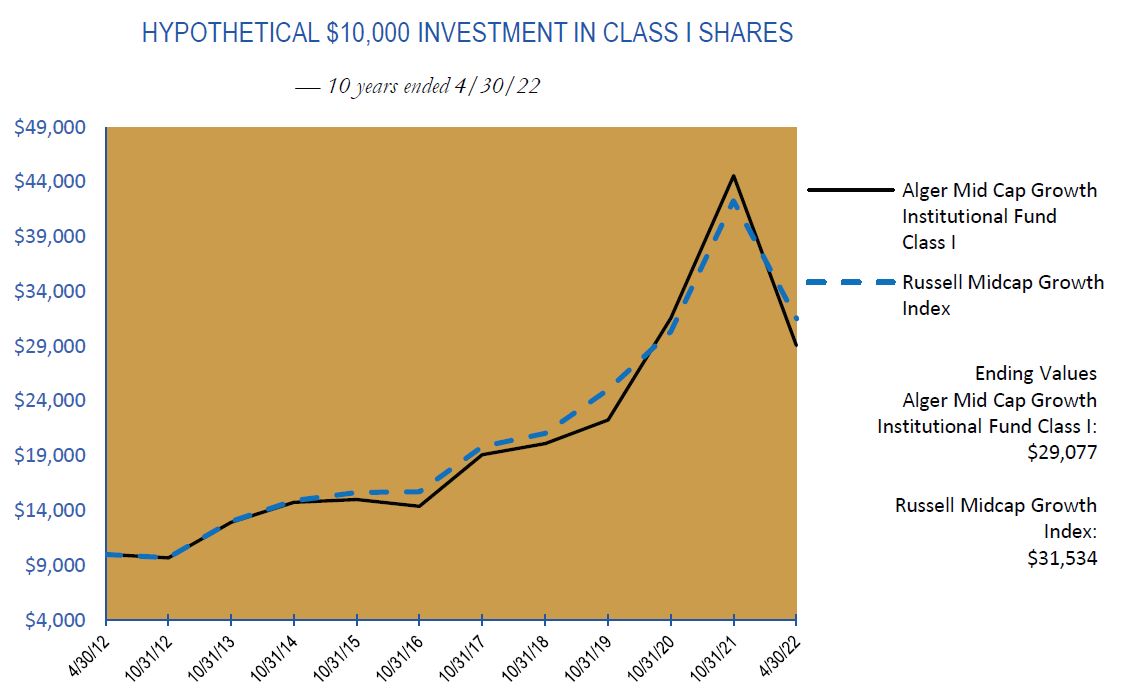
The Alger Mid Cap Growth Institutional Fund returned -34.74% for the fiscal six-month period ended April 30, 2022, compared to the -25.44% return of its benchmark, the Russell Midcap Growth Index.
During the reporting period, the largest sector weightings were Information Technology and Healthcare. The largest sector overweight was Energy and the largest underweight was Industrial.
Contributors to Performance
The Consumer Discretionary and Real Estate sectors provided the largest contributions to relative performance during the reporting period.
Regarding individual positions, Diamondback Energy, Inc.; Palo Alto Networks, Inc.; Vail Resorts, Inc.; Lucid Group, Inc.; and Xilinx, Inc. were among the top contributors to absolute performance. Vail Resorts is a premier luxury mountain resort operator whose properties include locations in Vail, Breckenridge, Beaver Creek, Park City, and Whistler. Given its strong industry position, shares of Vail Resorts positively contributed to portfolio performance as it capitalized on consumers’ embrace of travel and social activity as the economy reopened from pandemic restrictions.
Detractors from Performance
The Information Technology and Healthcare sectors were among the sectors that detracted from relative performance during the reporting period. Among individual positions, Upstart Holdings, Inc.; Natera, Inc.; Marqeta, Inc., Cl. A; Affirm Holdings, Inc., Cl. A; and Paycom Software, Inc. were among the most significant detractors from absolute performance. Natera is a specialty lab providing genetic testing services in reproductive health, oncology and transplant. Non-invasive prenatal testing (NIPT), part of the company’s reproductive health franchise, has generated the majority of revenue historically; however, we believe Natera's oncology business has potential to contribute toward a larger share of revenue as customers increasingly adopt these tests following positive insurance reimbursement decisions and favorable clinical trial results. Natera’s share underperformed after the publication of short report by Hindenburg Research. The company also lost a false advertisement lawsuit by CareDx, and high-growth, high-valuation companies were out of favor with many investors during the fiscal reporting period. We believe many of the allegations in the short report regarding sales and the company’s relationship with a third-party billing vendor are irrelevant to Natera’s outlook and its oncology franchise, which we view as the company’s key growth engine.
Alger Small Cap Growth Institutional Fund
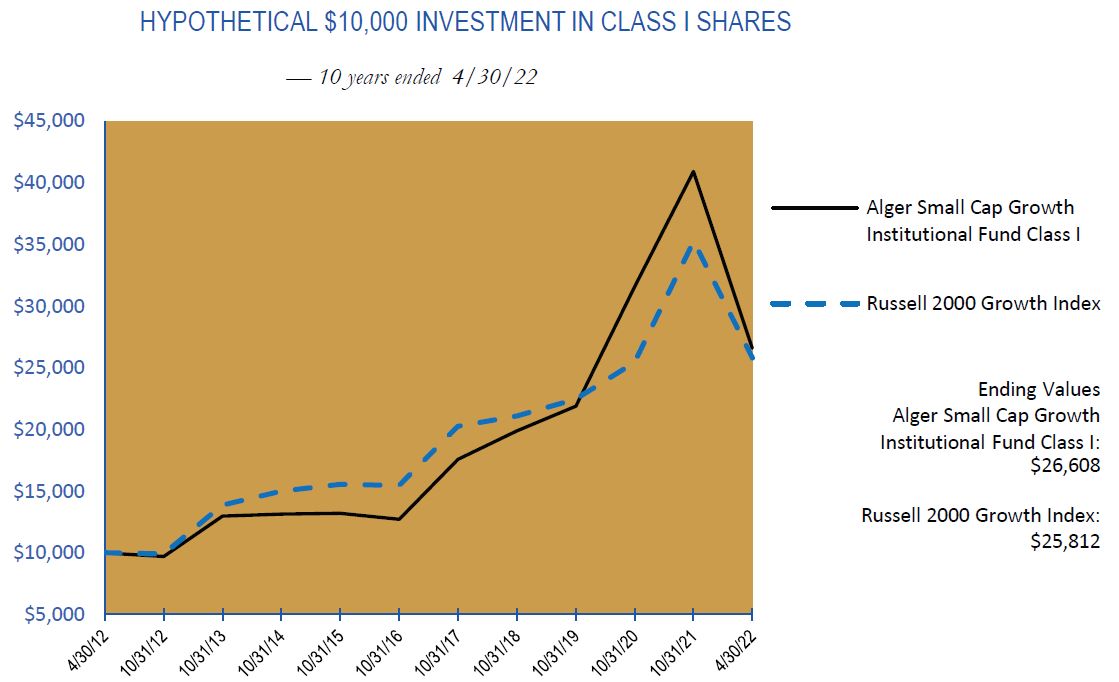
The Alger Small Cap Growth Institutional Fund returned -34.99% for the fiscal six-month period ended April 30, 2022, compared to the -26.77% return of its benchmark, the Russell 2000 Growth Index.
During the reporting period, the largest portfolio sector weightings were Healthcare and Information Technology. The largest sector overweight was Healthcare and the largest underweight was Industrials.
Contributors to Performance
The Financials and Industrials sectors provided the largest contributions to relative performance during the reporting period. Regarding individual positions, Vocera Communications, Inc.; Magnolia Oil & Gas Corp., Cl. A; US Foods Holding Corp.; Chefs' Warehouse, Inc.; and HealthEquity, Inc. were among the top contributors to absolute performance. Vocera Communications is a leading provider of cloud-based communication and workflow solutions, primarily for the healthcare industry. Vocera's core solution is an enterprise-class server software platform that allows users to communicate and collaborate using voice or Health Insurance Portability and Accountability Act (HIPAA) compliant secure texting through a variety of Vocera-designed and third-party devices. On January 6, 2022, Stryker Corp. announced an agreement to acquire Vocera for $79.25 per share, or an approximate $3.1 billion enterprise value, which was a 26.8% premium to the prior day's closing price. The deal was completed on February 23, 2022.
Detractors from Performance
The Information Technology and Healthcare sectors were among the sectors that detracted from relative performance during the reporting period. Regarding individual positions, InMode Ltd.; Joint Corp.; HubSpot, Inc.; Everbridge, Inc.; and Avalara, Inc. were among the top detractors from absolute performance. InMode designs, develops, manufactures and commercializes innovative minimally invasive and non-invasive aesthetic medical products. InMode’s platforms harness novel radio frequency (RF) technology for emerging minimally invasive procedures that bridge the gap between temporary treatments like facials and more invasive surgical procedures like facelifts across several specialty categories such as plastic surgery, gynecology, dermatology, ophthalmology and otolaryngology (ear, nose and throat care). The aesthetics market experienced strong tailwinds coming out of the COVID-19 pandemic. These tailwinds include the “Zoom effect,” or dissatisfaction with one’s personal appearance after viewing one’s own face on Zoom, which resulted in more people deciding to undergo aesthetic procedures. De-stigmatization of aesthetic procedures, aided by social media platforms, has also supported InMode's results. However, the stock price declined during the first quarter, in part due to a rotation out of high-valuation names. Some investors also feared a wallet share shift away from aesthetics and have concerns about InMode’s exposure to international markets due to the Ukraine/Russia conflict; however, our research suggests the company's revenue exposure to Europe is minimal.
I thank you for putting your trust in Alger.
Sincerely,
Daniel C. Chung, CFA
Chief Executive Officer
Fred Alger Management, LLC
Investors cannot invest directly in an index. Index performance does not reflect the deduction for fees, expenses or taxes.
This report and the financial statements contained herein are submitted for the general information of shareholders of the funds. This report is not authorized for distribution to prospective investors in a fund unless preceded or accompanied by an effective prospectus for the fund. Performance of funds discussed represents the return of Class I shares.
The performance data quoted represents past performance, which is not an indication or guarantee of future results.
Standardized performance results can be found on the following pages. The investment return and principal value of an investment in a fund will fluctuate so that an investor's shares, when redeemed, may be worth more or less than their original cost. Current performance may be lower or higher than the performance quoted. For performance data current to the most recent month-end, visit us at www.alger.com, or call us at (800) 992-3863.
The views and opinions of the funds’ management in this report are as of the date of the Shareholders' Letter and are subject to change at any time subsequent to this date. There is no guarantee that any of the assumptions that formed the basis for the opinions stated herein are accurate or that they will materialize. Moreover, the information forming the basis for such assumptions is from sources believed to be reliable; however, there is no guarantee that such information is accurate. Any securities mentioned, whether owned in a fund or otherwise, are considered in the context of the construction of an overall portfolio of securities and therefore reference to them should not be construed as a recommendation or offer to purchase or sell any such security. Inclusion of such securities in a fund and transactions in such securities, if any, may be for a variety of reasons, including, without limitation, in response to cash flows, inclusion in a benchmark, and risk control. The reference to a specific security should also be understood in such context and not viewed as a statement that the security is a significant holding in a fund. Please refer to the Schedule of Investments for each fund that is included in this report for a complete list of fund holdings as of April 30, 2022. Securities mentioned in the Shareholders' Letter, if not found in the Schedules of Investments, may have been held by the funds during the fiscal six-month period ended April 30, 2022.
Risk Disclosures
Alger Capital Appreciation Institutional Fund
Investing in the stock market involves risks, including the potential loss of principal. Growth stocks may be more volatile than other stocks as their prices tend to be higher in relation to their companies’ earnings and may be more sensitive to market, political, and economic developments. Local, regional, or global events such as environmental or natural disasters, war, terrorism, pandemics, outbreaks of infectious diseases and similar public health threats, recessions, or other events could have a significant impact on investments. A significant portion of assets may be invested in securities of companies in related sectors, and may be similarly affected by economic, political, or market events and conditions and may be more vulnerable to unfavorable sector developments. Foreign securities involve special risks including currency fluctuations, inefficient trading, political and economic instability, and increased volatility.
Alger Focus Equity Fund
Investing in the stock market involves risks, including the potential loss of principal. Growth stocks may be more volatile than other stocks as their prices tend to be higher in relation to their companies’ earnings and may be more sensitive to market, political, and economic developments. Local, regional, or global events such as environmental or natural disasters, war, terrorism, pandemics, outbreaks of infectious diseases and similar public health threats, recessions, or other events could have a significant impact on investments. A significant portion of assets may be invested in securities of companies in related sectors, and may be similarly affected by economic, political, or market events and conditions and may be more vulnerable to unfavorable sector developments. Foreign securities involve special risks including currency fluctuations, inefficient trading, political, and economic instability, and increased volatility. Assets may be focused in a small number of holdings, making them susceptible to risks associated with a single economic, political or regulatory event than a more diversified portfolio. Active trading may increase transaction costs, brokerage commissions, and taxes, which can lower the return on investment.
Alger Mid Cap Growth Institutional Fund
Investing in the stock market involves risks, including the potential loss of principal. Growth stocks may be more volatile than other stocks as their prices tend to be higher in relation to their companies’ earnings and may be more sensitive to market, political, and economic developments. Local, regional or global events such as environmental or natural disasters, war, terrorism, pandemics, outbreaks of infectious diseases and similar public health threats, recessions, or other events could have a significant impact on investments. A significant portion of assets may be invested in securities of companies in related sectors, and may be similarly affected by economic, political, or market events and conditions and may be more vulnerable to unfavorable sector developments. Investing in companies of medium capitalizations involve the risk that such issuers may have limited product lines or financial resources, lack management depth, or have limited liquidity. Foreign securities involve special risks including currency fluctuations, inefficient trading, political and economic instability, and increased volatility. Active trading may increase transaction costs, brokerage commissions, and taxes, which can lower the return on investment.
Alger Small Cap Growth Institutional Fund
Investing in the stock market involves risks, including the potential loss of principal. Growth stocks may be more volatile than other stocks as their prices tend to be higher in relation to their companies’ earnings and may be more sensitive to market, political, and economic developments. Local, regional or global events such as environmental or natural disasters, war, terrorism, pandemics, outbreaks of infectious diseases and similar public health threats, recessions, or other events could have a significant impact on investments. A significant portion of assets may be invested in securities of companies in related sectors, and may be similarly affected by economic, political, or market events and conditions and may be more vulnerable to unfavorable sector developments. Investing in companies of small and medium capitalizations involve the risk that such issuers may have limited product lines or financial resources, lack management depth, or have limited liquidity. Foreign securities involve special risks including currency fluctuations, inefficient trading, political and economic instability, and increased volatility. At times, the Fund may hold a large cash position, which may underperform relative to equity securities.
For a more detailed discussion of the risks associated with a fund, please see the Prospectus.
Before investing, carefully consider a fund's investment objective, risks, charges, and expenses.
For a prospectus and summary prospectus containing this and other information or for the Alger Institutional Funds' most recent month-end performance data, visit www.alger.com, call (800) 992-3863 or consult your financial advisor. Read the prospectus and summary prospectus carefully before investing.
Distributor: Fred Alger & Company, LLC.
NOT FDIC INSURED. NOT BANK GUARANTEED. MAY LOSE VALUE.
Definitions:
• | The Consumer Price Index is a measure of the average change over time in the prices paid by urban consumers for a market basket of consumer goods and services. |
• | Price-to-earnings is the ratio for valuing a company that measures its current share price relative to its earnings per share (EPS). |
• | The Russell 3000 Growth Index combines the large-cap Russell 1000 Growth, the small-cap Russell 2000 Growth and the Russell Microcap Growth Index. It includes companies that are considered more growth oriented relative to the overall market as defined by Russell's leading style methodology. The Russell 3000 Growth Index is constructed to provide a comprehensive, un- biased, and stable barometer of the growth opportunities within the broad market. |
• | The Russell 3000 Value Index measures the performance of the broad value segment of the US equity value universe. It includes those Russell 3000 companies with lower price-to-book ratios and lower forecasted growth values. The Russell 3000 Value Index is constructed to provide a comprehensive, unbiased and stable barometer of the broad value market. |
• | The MSCI ACWI Index (gross) is a free float-adjusted market capitalization weighted index that is designed to measure the equity market performance of developed and emerging markets. The MSCI ACWI captures large and mid cap representation across developed markets and emerging markets countries. |
• | The MSCI Emerging Markets Index (gross) is a free float-adjusted market capitalization index that is designed to measure equity market performance in the global emerging markets. The MSCI EAFE Index is designed to repre- sent the performance of large and mid-cap securities across developed mar- kets, including countries in Europe, Australasia and the Far East, excluding the U.S. and Canada. |
• | The MSCI EAFE Index is designed to represent the performance of large and mid-cap securities across developed markets, including countries in Eu- rope, Australasia and the Far East, excluding the U.S. and Canada. |
• | The Russell 1000 Growth Index measures the performance of the large-cap growth segment of the U.S. equity universe. It includes those Russell 1000 companies with higher growth earning potential as defined by Russell's lead- ing style methodology. The Russell 1000 Growth Index is constructed to provide a comprehensive and unbiased barometer for the large-cap growth segment. |
• | The Russell Midcap Growth Index measures the performance of the mid- cap growth segment of the U.S. equity universe. It includes those Russell Midcap Index companies with higher growth earning potential as defined by Russell's leading style methodology. The Russell Midcap Growth Index is constructed to provide a comprehensive and unbiased barometer of the mid-cap growth market. |
• | The S&P 500 Index is an index of large company stocks considered to be representative of the U.S. stock market. |
• | The Russell 2000 Growth Index measures the performance of the small- cap growth segment of the U.S. equity universe. It includes those Russell 2000 companies with higher growth earning potential as defined by Russell's leading style methodology. The Russell 2000 Growth Index is constructed to provide a comprehensive and unbiased barometer for the small-cap growth segment. |
• | The Russell 2000 Value Index measures the performance of the small cap value segment of the U.S. equity universe. It includes those Russell 2000 companies with lower price-to-book ratios and lower forecasted growth values. The Russell 2000 Value Index is constructed to provide a comprehensive and unbiased barometer for the large-cap growth segment. |
FUND PERFORMANCE AS OF 3/31/22 (Unaudited)
AVERAGE ANNUAL TOTAL RETURNS
1 YEAR | 5 YEARS | 10 YEARS | SINCE INCEPTION | |||||||||||||
Alger Capital Appreciation Institutional Class I (Inception 11/8/93) | 2.01 | % | 17.82 | % | 15.31 | % | 12.82 | % | ||||||||
Alger Capital Appreciation Institutional Class R (Inception 1/27/03)* | 1.56 | % | 17.29 | % | 14.78 | % | 12.27 | % | ||||||||
Alger Capital Appreciation Institutional Class Y (Inception 2/28/17) | 2.38 | % | 18.28 | % | n/a | 18.33 | % | |||||||||
Alger Capital Appreciation Institutional Class Z-2 (Inception 10/14/16) | 2.36 | % | 18.20 | % | n/a | 18.79 | % | |||||||||
Alger Focus Equity Class A (Inception 12/31/12) | (2.73 | )% | 18.74 | % | n/a | 17.32 | % | |||||||||
Alger Focus Equity Class C (Inception 12/31/12) | 0.98 | % | 19.12 | % | n/a | 17.11 | % | |||||||||
Alger Focus Equity Class I (Inception 11/8/93) | 2.69 | % | 20.09 | % | 16.05 | % | 10.46 | % | ||||||||
Alger Focus Equity Class Y (Inception 2/28/17) | 3.02 | % | 20.47 | % | n/a | 20.55 | % | |||||||||
Alger Focus Equity Class Z (Inception 12/31/12) | 2.99 | % | 20.42 | % | n/a | 18.40 | % | |||||||||
Alger Mid Cap Growth Institutional Class I (Inception 11/8/93) | (13.25 | )% | 15.39 | % | 13.17 | % | 12.21 | % | ||||||||
Alger Mid Cap Growth Institutional Class R (Inception 1/27/03)* | (13.61 | )% | 14.85 | % | 12.60 | % | 11.65 | % | ||||||||
Alger Mid Cap Growth Institutional Class Z-2 (Inception 10/14/16) | (12.92 | )% | 15.75 | % | n/a | 17.16 | % | |||||||||
Alger Small Cap Growth Institutional Class I (Inception 11/8/93) | (20.97 | )% | 15.31 | % | 11.81 | % | 10.03 | % | ||||||||
Alger Small Cap Growth Institutional Class R (Inception 1/27/03)* | (21.30 | )% | 14.78 | % | 11.28 | % | 9.50 | % | ||||||||
Alger Small Cap Growth Institutional Class Z-2 (Inception 8/1/16) | (20.68 | )% | 15.70 | % | n/a | 16.52 | % |
The performance data quoted represents past performance, which is not an indication or a guarantee of future results. The Fund’s average annual total returns include changes in share price and reinvestment of dividends and capital gains.
Previously, the Alger Focus Equity Fund followed different investment strategies under the name "Alger Large Cap Growth Institutional Fund" and was managed by different portfolio managers. Performance prior to December 31, 2012 reflects those management styles and does not reflect the current investment personnel and strategies of the Fund. On October 15, 2018, Alger Capital Appreciation Focus Fund changed its name to Alger Focus Equity Fund.
* | Since inception performance is calculated from 11/8/93. Performance ftgures prior to 1/27/03, inception of Class R shares, are those of the Fund's Class I shares. The performance ftgures prior to 1/27/03 have been reduced to reflect the higher operating expenses of Class R shares. |
The chart above illustrates the change in value of a hypothetical $10,000 investment made in the Alger Capital Appreciation Institutional Fund Class I shares and the Russell 1000 Growth Index (an unmanaged index of common stocks) for the ten years ended April 30, 2022. Figures for the Alger Capital Appreciation Institutional Fund Class I shares and the Russell 1000 Growth Index include reinvestment of dividends. Figures for the Alger Capital Appreciation Institutional Fund Class I shares also include reinvestment of capital gains. Performance for the Alger Capital Appreciation Institutional Fund Class R, Class Y and Class Z-2 shares may vary from the results shown above due to differences in expenses each class bears. Investors cannot invest directly in any index. Index performance does not reflect deduction for fees, expenses, or taxes.
ALGER CAPITAL APPRECIATION INSTITUTIONAL FUND
Fund Highlights Through April 30, 2022 (Unaudited) (Continued)
PERFORMANCE COMPARISON AS OF 4/30/22
AVERAGE ANNUAL TOTAL RETURNS
1 YEAR | 5 YEARS | 10 YEARS | Since 11/8/1993 | |||||||||||||
Class I (Inception 11/8/93) | (18.11 | )% | 13.56 | % | 13.60 | % | 12.16 | % | ||||||||
Class R (Inception 1/27/03)* | (18.45 | )% | 13.06 | % | 13.07 | % | 11.61 | % | ||||||||
Russell 1000 Growth Index | (5.35 | )% | 17.28 | % | 15.56 | % | 10.37 | % |
1 YEAR | 5 YEARS | 10 YEARS | Since Inception | |||||||||||||
Class Y (Inception 2/28/17) | (17.80 | )% | 14.02 | % | n/a | 14.48 | % | |||||||||
Russell 1000 Growth Index | (5.35 | )% | 17.28 | % | n/a | 17.45 | % |
1 YEAR | 5 YEARS | 10 YEARS | Since Inception | |||||||||||||
Class Z-2 (Inception 10/14/16) | (17.85 | )% | 13.93 | % | n/a | 15.17 | % | |||||||||
Russell 1000 Growth Index | (5.35 | )% | 17.28 | % | n/a | 18.35 | % |
The performance data quoted represents past performance, which is not an indication or a guarantee of future results. The Fund's average annual total returns include changes in share price and reinvestment of dividends and capital gains. The chart and table above do not reflect the deduction of taxes that a shareholder would have paid on Fund distributions or on the redemption of Fund shares. Investment return and principal will fluctuate and the Fund's shares, when redeemed, may be worth more or less than their original cost. Current performance may be higher or lower than the performance quoted. For updated performance, visit us at www.alger.com or call us at (800) 992-3863.
* | Performance ftgures prior to 1/27/03, inception of Class R shares, are those of the Fund's Class I shares. The performance ftgures prior to 1/27/03 have been reduced to reflect the higher operating expenses of Class R shares. |
ALGER FOCUS EQUITY FUND
Fund Highlights Through April 30, 2022 (Unaudited)
The chart above illustrates the change in value of a hypothetical $10,000 investment made in the Alger Focus Equity Fund Class I shares and the Russell 1000 Growth Index (an unmanaged index of common stocks) for the ten years ended April 30, 2022. Previously, the Fund followed different investment strategies under the name "Alger Large Cap Growth Institutional Fund" and was managed by different portfolio managers. Performance prior to December 31, 2012 reflects those management styles and does not reflect the current investment personnel and strategies of the Fund. On October 15, 2018, Alger Capital Appreciation Focus Fund changed its name to Alger Focus Equity Fund. Figures for Alger Focus Equity Fund Class I shares and the Russell 1000 Growth Index include reinvestment of dividends. Figures for the Alger Focus Equity Fund Class I shares also include reinvestment of capital gains. Performance for Alger Focus Equity Fund Class A, Class C, Class Y and Class Z shares may vary from the results shown above due to differences in expenses and sales charges that those classes bear. Investors cannot invest directly in any index. Index performance does not reflect deduction for fees, expenses, or taxes.
ALGER FOCUS EQUITY FUND
Fund Highlights Through April 30, 2022 (Unaudited) (Continued)
PERFORMANCE COMPARISON AS OF 4/30/22
AVERAGE ANNUAL TOTAL RETURNS
1 YEAR | 5 YEARS | 10 YEARS | Since Inception | |||||||||||||
Class I (Inception 11/8/93) | (17.34 | )% | 15.90 | % | 14.50 | % | 9.85 | % | ||||||||
Russell 1000 Growth Index | (5.35 | )% | 17.28 | % | 15.56 | % | 10.37 | % |
1 YEAR | 5 YEARS | 10 YEARS | Since Inception | |||||||||||||
Class A (Inception 12/31/12) | (21.71 | )% | 14.60 | % | n/a | 15.29 | % | |||||||||
Class C (Inception 12/31/12) | (18.71 | )% | 14.97 | % | n/a | 15.09 | % | |||||||||
Class Z (Inception 12/31/12) | (17.10 | )% | 16.23 | % | n/a | 16.36 | % | |||||||||
Russell 1000 Growth Index | (5.35 | )% | 17.28 | % | n/a | 16.69 | % |
1 YEAR | 5 YEARS | 10 YEARS | Since Inception | |||||||||||||
Class Y (Inception 2/28/17) | (17.08 | )% | 16.27 | % | n/a | 16.78 | % | |||||||||
Russell 1000 Growth Index | (5.35 | )% | 17.28 | % | n/a | 17.45 | % |
The performance data quoted represents past performance, which is not an indication or a guarantee of future results. The Fund's average annual total returns include changes in share price and reinvestment of dividends and capital gains. Class A returns reflect the maximum initial sales charge and Class C returns reflect the applicable contingent deferred sales charge. The chart and table above do not reflect the deduction of taxes that a shareholder would have paid on Fund distributions or on the redemption of Fund shares. Previously, the Fund followed different investment strategies under the name "Alger Large Cap Growth Institutional Fund" and was managed by different portfolio managers. Performance prior to December 31, 2012 reflects those management styles and does not reflect the current investment personnel and strategies of the Fund. On October 15, 2018, the Fund changed its name from Alger Capital Appreciation Focus Fund to Alger Focus Equity Fund. Investment return and principal will fluctuate and the Fund's shares, when redeemed, may be worth more or less than their original cost. Current performance may be higher or lower than the performance quoted. For updated performance, visit us at www.alger.com or call us at (800) 992-3863.
ALGER MID CAP GROWTH INSTITUTIONAL FUND
Fund Highlights Through April 30, 2022 (Unaudited)
The chart above illustrates the change in value of a hypothetical $10,000 investment made in the Alger Mid Cap Growth Institutional Fund Class I shares and the Russell Midcap Growth Index (an unmanaged index of common stocks) for the ten years ended April 30, 2022. Figures for Alger Mid Cap Growth Institutional Fund Class I shares and the Russell Midcap Growth Index include reinvestment of dividends. Figures for the Alger Mid Cap Growth Institutional Fund Class I shares also include reinvestment of capital gains. Performance for the Alger Mid Cap Growth Institutional Fund Class R and Class Z-2 shares may vary from the results shown above due to differences in expenses the class bears. Investors cannot invest directly in any index. Index performance does not reflect deduction for fees, expenses, or taxes.
ALGER MID CAP GROWTH INSTITUTIONAL FUND
Fund Highlights Through April 30, 2022 (Unaudited) (Continued)
PERFORMANCE COMPARISON AS OF 4/30/22
AVERAGE ANNUAL TOTAL RETURNS
1 YEAR | 5 YEARS | 10 YEARS | Since 11/8/1993 | |||||||||||||
Class I (Inception 11/8/93) | (29.09 | )% | 11.42 | % | 11.26 | % | 11.55 | % | ||||||||
Class R (Inception 1/27/03)* | (29.42 | )% | 10.89 | % | 10.70 | % | 10.99 | % | ||||||||
Russell Midcap Growth Index | (16.73 | )% | 12.06 | % | 12.17 | % | 9.86 | % |
1 YEAR | 5 YEARS | 10 YEARS | Since Inception | |||||||||||||
Class Z-2 (Inception 10/14/16) | (28.82 | )% | 11.77 | % | n/a | 13.57 | % | |||||||||
Russell Midcap Growth Index | (16.73 | )% | 12.06 | % | n/a | 13.18 | % |
The performance data quoted represents past performance, which is not an indication or a guarantee of future results. The Fund's average annual total returns include changes in share price and reinvestment of dividends and capital gains. The chart and table above do not reflect the deduction of taxes that a shareholder would have paid on Fund distributions or on the redemption of Fund shares. Investment return and principal will fluctuate and the Fund's shares, when redeemed, may be worth more or less than their original cost. Current performance may be higher or lower than the performance quoted. For updated performance, visit us at www.alger.com or call us at (800) 992-3863.
* | Performance ftgures prior to 1/27/03, inception of Class R shares, are those of the Fund's Class I shares. The performance ftgures prior to 1/27/03 have been reduced to reflect the higher operating expenses of Class R shares. |
ALGER SMALL CAP GROWTH INSTITUTIONAL FUND
Fund Highlights Through April 30, 2022 (Unaudited)
The chart above illustrates the change in value of a hypothetical $10,000 investment made in the Alger Small Cap Growth Institutional Fund Class I shares and the Russell 2000 Growth Index (an unmanaged index of common stocks) for the ten years ended April 30, 2022. Figures for the Alger Small Cap Growth Institutional Fund Class I shares and the Russell 2000 Growth Index include reinvestment of dividends. Figures for the Alger Small Cap Growth Institutional Fund Class I shares also include reinvestment of capital gains. Performance for the Alger Small Cap Growth Institutional Fund Class R and Class Z-2 shares may vary from the results shown above due to differences in expenses the class bears. Investors cannot invest directly in any index. Index performance does not reflect deduction for fees, expenses, or taxes.
ALGER SMALL CAP GROWTH INSTITUTIONAL FUND
Fund Highlights Through April 30, 2022 (Unaudited) (Continued)
PERFORMANCE COMPARISON AS OF 4/30/22
AVERAGE ANNUAL TOTAL RETURNS
1 YEAR | 5 YEARS | 10 YEARS | Since 11/8/1993 | |||||||||||||
Class I (Inception 11/8/93) | (34.53 | )% | 11.75 | % | 10.28 | % | 9.45 | % | ||||||||
Class R (Inception 1/27/03)* | (34.81 | )% | 11.24 | % | 9.75 | % | 8.92 | % | ||||||||
Russell 2000 Growth Index | (26.44 | )% | 7.08 | % | 9.95 | % | 7.27 | % |
1 YEAR | 5 YEARS | 10 YEARS | Since Inception | |||||||||||||
Class Z-2 (Inception 8/1/16) | (34.34 | )% | 12.12 | % | n/a | 13.40 | % | |||||||||
Russell 2000 Growth Index | (26.44 | )% | 7.08 | % | n/a | 8.53 | % |
The performance data quoted represents past performance, which is not an indication or a guarantee of future results. The Fund's average annual total returns include changes in share price and reinvestment of dividends and capital gains. The chart and table above do not reflect the deduction of taxes that a shareholder would have paid on Fund distributions or on the redemption of Fund shares. Investment return and principal will fluctuate and the Fund's shares, when redeemed, may be worth more or less than their original cost. Current performance may be higher or lower than the performance quoted. For updated performance, visit us at www.alger.com or call us at (800) 992-3863.
* Performance ftgures prior to 1/27/03, inception of Class R shares, are those of the Fund's Class I shares. The performance ftgures prior to 1/27/03 have been reduced to reflect the higher operating expenses of Class R shares.
SECTORS | Alger Capital Appreciation Institutional Fund | Alger Focus Equity Fund | Alger Mid Cap Growth Institutional Fund | Alger Small Cap Growth Institutional Fund | ||||||||||||
Communication Services | 7.3 | % | 7.7 | % | 4.9 | % | 5.7 | % | ||||||||
Consumer Discretionary | 19.7 | 19.9 | 13.9 | 11.8 | ||||||||||||
Consumer Staples | 0.4 | 0.0 | 0.5 | 5.3 | ||||||||||||
Energy | 2.4 | 2.2 | 8.1 | 5.9 | ||||||||||||
Financials | 3.1 | 4.7 | 4.3 | 1.1 | ||||||||||||
Healthcare | 14.8 | 11.6 | 16.7 | 29.7 | ||||||||||||
Industrials | 8.2 | 7.1 | 11.5 | 6.0 | ||||||||||||
Information Technology | 42.3 | 41.2 | 30.1 | 30.4 | ||||||||||||
Materials | 1.0 | 0.3 | 1.6 | 2.5 | ||||||||||||
Real Estate | 0.4 | 0.0 | 0.5 | 1.0 | ||||||||||||
Utilities | 0.3 | 0.0 | 2.6 | 0.0 | ||||||||||||
Short-Term Investments and Net Other Assets | 0.1 | 5.3 | 5.3 | 0.6 | ||||||||||||
100.0 | % | 100.0 | % | 100.0 | % | 100.0 | % |
† Based on net assets for each Fund.
THE ALGER INSTITUTIONAL FUNDS
ALGER CAPITAL APPRECIATION INSTITUTIONAL FUND
COMMON STOCKS—99.3% | SHARES | VALUE | ||||||
AEROSPACE & DEFENSE—3.3% | ||||||||
HEICO Corp. | 111,366 | $ | 15,728,220 | |||||
Lockheed Martin Corp. | 44,249 | 19,120,878 | ||||||
Raytheon Technologies Corp. | 79,528 | 7,548,003 | ||||||
TransDigm Group, Inc.* | 82,036 | 48,795,833 | ||||||
91,192,934 | ||||||||
AGRICULTURAL & FARM MACHINERY—0.5% | ||||||||
Deere & Co. | 35,620 | 13,448,331 | ||||||
AIR FREIGHT & LOGISTICS—0.2% | ||||||||
GXO Logistics, Inc.* | 77,772 | 4,603,325 | ||||||
ALUMINUM—0.1% | ||||||||
Alcoa Corp. | 42,618 | 2,889,500 | ||||||
APPAREL ACCESSORIES & LUXURY GOODS—1.7% | ||||||||
Capri Holdings Ltd.* | 324,684 | 15,487,427 | ||||||
Lululemon Athletica, Inc.* | 20,354 | 7,218,139 | ||||||
LVMH Moet Hennessy Louis Vuitton SE | 36,892 | 23,870,720 | ||||||
46,576,286 | ||||||||
APPLICATION SOFTWARE—8.5% | ||||||||
Adobe, Inc.* | 85,585 | 33,887,381 | ||||||
Atlassian Corp., PLC, Cl. A* | 66,889 | 15,038,654 | ||||||
Avalara, Inc.* | 100,109 | 7,615,292 | ||||||
Bill.com Holdings, Inc.* | 58,797 | 10,037,236 | ||||||
Cadence Design Systems, Inc.* | 152,306 | 22,975,360 | ||||||
Confuent, Inc , C A* | 125,337 | 3,915,528 | ||||||
Datadog, Inc., Cl. A* | 175,390 | 21,183,604 | ||||||
Intuit, Inc. | 196,343 | 82,218,631 | ||||||
Salesforce, Inc.* | 113,022 | 19,885,091 | ||||||
Unity Software, Inc.* | 162,585 | 10,797,270 | ||||||
Zendesk, Inc.* | 58,263 | 7,110,416 | ||||||
234,664,463 | ||||||||
AUTOMOBILE MANUFACTURERS—3.4% | ||||||||
General Motors Co.* | 231,073 | 8,759,978 | ||||||
Tesla, Inc.* | 96,611 | 84,124,994 | ||||||
92,884,972 | ||||||||
BIOTECHNOLOGY—3.3% | ||||||||
AbbVie, Inc. | 269,467 | 39,579,313 | ||||||
Horizon Therapeutics PLC* | 133,973 | 13,204,379 | ||||||
Natera, Inc.* | 324,110 | 11,382,743 | ||||||
Vertex Pharmaceuticals, Inc.* | 96,331 | 26,319,556 | ||||||
90,485,991 | ||||||||
CASINOS & GAMING—2.5% | ||||||||
MGM Resorts International | 1,714,315 | 70,355,488 | ||||||
CONSUMER FINANCE—0.4% | ||||||||
Upstart Holdings, Inc.* | 155,886 | 11,694,568 | ||||||
COPPER—0.4% | ||||||||
Freeport-McMoRan, Inc. | 265,839 | 10,779,772 |
THE ALGER INSTITUTIONAL FUNDS
ALGER CAPITAL APPRECIATION INSTITUTIONAL FUND
Schedule of Investments April 30, 2022 (Unaudited) (Continued)
COMMON STOCKS—99.3% (CONT.) | SHARES | VALUE | ||||||
DATA PROCESSING & OUTSOURCED SERVICES—4.6% | ||||||||
Block, Inc., Cl. A* | 137,735 | $ | 13,710,142 | |||||
Marqeta, Inc., Cl. A* | 1,548,074 | 14,397,088 | ||||||
PayPal Holdings, Inc.* | 220,857 | 19,419,956 | ||||||
Visa, Inc., Cl. A | 376,187 | 80,176,735 | ||||||
127,703,921 | ||||||||
ELECTRIC UTILITIES—0.3% | ||||||||
NextEra Energy, Inc. | 129,027 | 9,163,498 | ||||||
ELECTRICAL COMPONENTS & EQUIPMENT—2.8% | ||||||||
AMETEK, Inc. | 154,529 | 19,510,832 | ||||||
Eaton Corp. PLC | 309,569 | 44,893,696 | ||||||
Generac Holdings, Inc.* | 60,748 | 13,326,896 | ||||||
77,731,424 | ||||||||
FINANCIAL EXCHANGES & DATA—1.5% | ||||||||
S&P Global, Inc. | 112,051 | 42,187,202 | ||||||
FOOTWEAR—0.7% | ||||||||
NIKE, Inc., Cl. B | 154,029 | 19,207,416 | ||||||
HEALTHCARE DISTRIBUTORS—0.9% | ||||||||
McKesson Corp. | 83,422 | 25,828,285 | ||||||
HEALTHCARE EQUIPMENT—2.7% | ||||||||
Dexcom, Inc.* | 10,441 | 4,265,984 | ||||||
Edwards Lifesciences Corp.* | 242,623 | 25,664,661 | ||||||
Intuitive Surgical, Inc.* | 187,135 | 44,781,405 | ||||||
74,712,050 | ||||||||
HEALTHCARE FACILITIES—0.7% | ||||||||
Acadia Healthcare Co., Inc.* | 241,935 | 16,422,548 | ||||||
Tenet Healthcare Corp.* | 41,235 | 2,989,950 | ||||||
19,412,498 | ||||||||
HOTELS RESORTS & CRUISE LINES—1.4% | ||||||||
Airbnb, Inc., Cl. A* | 103,819 | 15,906,109 | ||||||
Expedia Group, Inc.* | 49,885 | 8,717,404 | ||||||
Hilton Worldwide Holdings, Inc.* | 96,715 | 15,018,872 | ||||||
39,642,385 | ||||||||
HYPERMARKETS & SUPER CENTERS—0.4% | ||||||||
Costco Wholesale Corp. | 20,924 | 11,125,709 | ||||||
INTERACTIVE MEDIA & SERVICES—5.8% | ||||||||
Alphabet, Inc., Cl. C* | 57,637 | 132,526,483 | ||||||
Meta Platforms, Inc., Cl. A* | 39,501 | 7,918,766 | ||||||
Snap, Inc., Cl. A* | 678,807 | 19,318,847 | ||||||
159,764,096 | ||||||||
INTERNET & DIRECT MARKETING RETAIL—7.9% | ||||||||
Alibaba Group Holding Ltd.#,* | 288,628 | 28,022,893 | ||||||
Altaba, Inc.*,(a) | 342,659 | 1,202,733 | ||||||
Amazon.com, Inc.* | 71,980 | 178,915,647 | ||||||
MercadoLibre, Inc.* | 11,927 | 11,612,485 | ||||||
219,753,758 |
THE ALGER INSTITUTIONAL FUNDS
ALGER CAPITAL APPRECIATION INSTITUTIONAL FUND
Schedule of Investments April 30, 2022 (Unaudited) (Continued)
COMMON STOCKS—99.3% (CONT.) | SHARES | VALUE | ||||||
INTERNET SERVICES & INFRASTRUCTURE—2.4% | ||||||||
MongoDB, Inc., Cl. A* | 70,131 | $ | 24,891,596 | |||||
Shopify, Inc., Cl. A* | 47,675 | 20,348,643 | ||||||
Snowflake, Inc., Cl. A* | 128,390 | 22,011,182 | ||||||
67,251,421 | ||||||||
INVESTMENT BANKING & BROKERAGE—0.0% | ||||||||
Morgan Stanley | 17,239 | 1,389,291 | ||||||
LEISURE FACILITIES—1.2% | ||||||||
Vail Resorts, Inc. | 132,484 | 33,672,133 | ||||||
LIFE SCIENCES TOOLS & SERVICES—1.9% | ||||||||
Danaher Corp. | 206,770 | 51,926,150 | ||||||
MANAGED HEALTHCARE—3.0% | ||||||||
UnitedHealth Group, Inc. | 161,479 | 82,120,145 | ||||||
MOVIES & ENTERTAINMENT—1.5% | ||||||||
Live Nation Entertainment, Inc.* | 389,747 | 40,876,665 | ||||||
OIL & GAS EXPLORATION & PRODUCTION—1.7% | ||||||||
Pioneer Natural Resources Co. | 206,051 | 47,900,676 | ||||||
OIL & GAS STORAGE & TRANSPORTATION—0.7% | ||||||||
Cheniere Energy, Inc. | 147,421 | 20,021,246 | ||||||
PHARMACEUTICALS—2.3% | ||||||||
AstraZeneca PLC# | 307,048 | 20,387,987 | ||||||
Bayer AG* | 636,798 | 41,940,584 | ||||||
62,328,571 | ||||||||
REGIONAL BANKS—1.2% | ||||||||
Signature Bank | 131,384 | 31,827,774 | ||||||
RESTAURANTS—0.9% | ||||||||
Chipotle Mexican Grill, Inc., Cl. A* | 3,967 | 5,774,405 | ||||||
Shake Shack, Inc., Cl. A* | 256,688 | 14,844,267 | ||||||
Yum China Holdings, Inc. | 102,685 | 4,292,233 | ||||||
24,910,905 | ||||||||
SEMICONDUCTOR EQUIPMENT—2.1% | ||||||||
Applied Materials, Inc. | 196,391 | 21,671,747 | ||||||
ASML Holding NV# | 12,160 | 6,855,443 | ||||||
Enphase Energy, Inc.* | 32,695 | 5,276,973 | ||||||
Lam Research Corp. | 30,840 | 14,364,038 | ||||||
SolarEdge Technologies, Inc.* | 34,243 | 8,574,790 | ||||||
56,742,991 | ||||||||
SEMICONDUCTORS—4.8% | ||||||||
Advanced Micro Devices, Inc.* | 725,778 | 62,068,535 | ||||||
NVIDIA Corp. | 262,324 | 48,653,232 | ||||||
QUALCOMM, Inc. | 153,044 | 21,378,716 | ||||||
132,100,483 | ||||||||
SPECIALTY CHEMICALS—0.5% | ||||||||
Albemarle Corp. | 75,109 | 14,483,269 | ||||||
SYSTEMS SOFTWARE—13.5% | ||||||||
Crowdstrike Holdings, Inc., Cl. A* | 133,596 | 26,553,541 | ||||||
Microsoft Corp. | 1,228,508 | 340,935,540 | ||||||
Palo Alto Networks, Inc.* | 12,300 | 6,903,744 | ||||||
374,392,825 |
THE ALGER INSTITUTIONAL FUNDS
ALGER CAPITAL APPRECIATION INSTITUTIONAL FUND
Schedule of Investments April 30, 2022 (Unaudited) (Continued)
COMMON STOCKS—99.3% (CONT.) | SHARES | VALUE | ||||||
TECHNOLOGY HARDWARE STORAGE & PERIPHERALS—6.2% | ||||||||
Apple, Inc. | 1,088,599 | $ | 171,617,632 | |||||
TRUCKING—1.4% | ||||||||
Uber Technologies, Inc.* | 781,032 | 24,586,887 | ||||||
XPO Logistics, Inc.* | 268,812 | 14,459,398 | ||||||
39,046,285 | ||||||||
TOTAL COMMON STOCKS | ||||||||
(Cost $2,041,874,296) | 2,748,416,334 | |||||||
PREFERRED STOCKS—0.1% | SHARES | VALUE | ||||||
DATA PROCESSING & OUTSOURCED SERVICES—0.1% | ||||||||
Chime Financial, Inc., Series G*,@,(a) | 38,919 | 2,315,291 | ||||||
(Cost $2,688,128) | 2,315,291 | |||||||
REAL ESTATE INVESTMENT TRUST—0.4% | SHARES | VALUE | ||||||
SPECIALIZED—0.4% | ||||||||
Crown Castle International Corp. | 53,065 | 9,828,169 | ||||||
(Cost $9,624,851) | 9,828,169 | |||||||
SPECIAL PURPOSE VEHICLE—0.1% | SHARES | VALUE | ||||||
DATA PROCESSING & OUTSOURCED SERVICES—0.1% | ||||||||
Crosslink Ventures Capital LLC, Cl. A*,@,(a),(b) | 123 | 4,293,561 | ||||||
(Cost $3,075,000) | 4,293,561 | |||||||
Total Investments | ||||||||
(Cost $2,057,262,275) | 99.9 | % | $ | 2,764,853,355 | ||||
Affiliated Securities (Cost $3,075,000) | 4,293,561 | |||||||
Unaffiliated Securities (Cost $2,054,187,275) | 2,760,559,794 | |||||||
Other Assets in Excess of Liabilities | 0.1 | % | 1,864,059 | |||||
NET ASSETS | 100.0 | % | $ | 2,766,717,414 |
# | American Depositary Receipts. |
(a) | Security is valued in good faith at fair value determined using signiftcant unobservable inputs pursuant to procedures established by the Board. |
(b) | Deemed an afftliate of the Fund in accordance with Section 2(a)(3) of the Investment Company Act of 1940. See Note 11 - Afftliated Securities. |
* | Non-income producing security. |
@ | Restricted security - Investment in security not registered under the Securities Act of 1933. Sales or transfers of the investment may be restricted only to qualifted buyers. |
Security | Acquisition Date(s) | Acquisition Cost | % of net assets (Acquisition Date) | Market Value | % of net assets as of 4/30/2022 | |||||||||||||
Chime Financial, Inc., Series G | 8/24/21 | 2,688,128 | 0.06 | % | 2,315,291 | 0.08 | % | |||||||||||
Crosslink Ventures Capital LLC, Cl. A | 10/2/20 | 3,075,000 | 0.08 | % | 4,293,561 | 0.15 | % | |||||||||||
Total | 6,608,852 | 0.23 | % |
See Notes to Financial Statements.
THE ALGER INSTITUTIONAL FUNDS | ALGER FOCUS EQUITY FUND |
Schedule of Investments April 30, 2022 (Unaudited)
COMMON STOCKS—94.7% | SHARES | VALUE | ||||||
AEROSPACE & DEFENSE—2.0% | ||||||||
Textron, Inc. | 37,825 | $ | 2,619,381 | |||||
TransDigm Group, Inc.* | 35,468 | 21,096,721 | ||||||
23,716,102 | ||||||||
APPAREL ACCESSORIES & LUXURY GOODS—0.6% | ||||||||
Capri Holdings Ltd.* | 152,397 | 7,269,337 | ||||||
APPLICATION SOFTWARE—6.8% | ||||||||
Adobe, Inc.* | 34,081 | 13,494,372 | ||||||
Bill.com Holdings, Inc.* | 30,445 | 5,197,266 | ||||||
Intuit, Inc. | 117,949 | 49,391,144 | ||||||
Salesforce, Inc.* | 49,162 | 8,649,562 | ||||||
Unity Software, Inc.* | 70,169 | 4,659,923 | ||||||
81,392,267 | ||||||||
AUTOMOBILE MANUFACTURERS—4.0% | ||||||||
General Motors Co.* | 319,443 | 12,110,084 | ||||||
Tesla, Inc.* | 41,439 | 36,083,424 | ||||||
48,193,508 | ||||||||
CASINOS & GAMING—3.8% | ||||||||
MGM Resorts International | 1,101,947 | 45,223,905 | ||||||
CONSUMER FINANCE—0.5% | ||||||||
Upstart Holdings, Inc.* | 75,957 | 5,698,294 | ||||||
COPPER—0.3% | ||||||||
Freeport-McMoRan, Inc. | 92,050 | 3,732,627 | ||||||
DATA PROCESSING & OUTSOURCED SERVICES—5.1% | ||||||||
Marqeta, Inc., Cl. A* | 656,572 | 6,106,120 | ||||||
PayPal Holdings, Inc.* | 65,897 | 5,794,323 | ||||||
Visa, Inc., Cl. A | 227,983 | 48,590,017 | ||||||
60,490,460 | ||||||||
ELECTRICAL COMPONENTS & EQUIPMENT—3.5% | ||||||||
AMETEK, Inc. | 97,954 | 12,367,672 | ||||||
Eaton Corp. PLC | 207,664 | 30,115,433 | ||||||
42,483,105 | ||||||||
FINANCIAL EXCHANGES & DATA—2.2% | ||||||||
S&P Global, Inc. | 70,097 | 26,391,521 | ||||||
FOOTWEAR—0.8% | ||||||||
NIKE, Inc., Cl. B | 78,026 | 9,729,842 | ||||||
HEALTHCARE DISTRIBUTORS—1.5% | ||||||||
McKesson Corp. | 58,649 | 18,158,317 | ||||||
HEALTHCARE EQUIPMENT—1.1% | ||||||||
Edwards Lifesciences Corp.* | 120,711 | 12,768,810 | ||||||
HOTELS RESORTS & CRUISE LINES—1.7% | ||||||||
Airbnb, Inc., Cl. A* | 79,109 | 12,120,290 | ||||||
Booking Holdings, Inc.* | 3,650 | 8,067,631 | ||||||
20,187,921 | ||||||||
INTERACTIVE MEDIA & SERVICES—5.7% | ||||||||
Alphabet, Inc., Cl. C* | 24,746 | 56,899,220 | ||||||
Snap, Inc., Cl. A* | 391,191 | 11,133,296 | ||||||
68,032,516 |
THE ALGER INSTITUTIONAL FUNDS | ALGER FOCUS EQUITY FUND |
Schedule of Investments April 30, 2022 (Unaudited) (Continued)
COMMON STOCKS—94.7% (CONT.) | SHARES | VALUE | ||||||
INTERNET & DIRECT MARKETING RETAIL—8.5% | ||||||||
Alibaba Group Holding Ltd.#,* | 169,757 | $ | 16,481,707 | |||||
Amazon.com, Inc.* | 31,796 | 79,033,091 | ||||||
MercadoLibre, Inc.* | 6,323 | 6,156,263 | ||||||
101,671,061 | ||||||||
INTERNET SERVICES & INFRASTRUCTURE—2.2% | ||||||||
Shopify, Inc., Cl. A* | 21,157 | 9,030,231 | ||||||
Snowflake, Inc., Cl. A* | 80,491 | 13,799,377 | ||||||
Twilio, Inc., Cl. A* | 26,684 | 2,983,805 | ||||||
25,813,413 | ||||||||
LEISURE FACILITIES—0.5% | ||||||||
Vail Resorts, Inc. | 25,343 | 6,441,177 | ||||||
LIFE SCIENCES TOOLS & SERVICES—2.1% | ||||||||
Danaher Corp. | 98,041 | 24,621,036 | ||||||
MANAGED HEALTHCARE—4.7% | ||||||||
UnitedHealth Group, Inc. | 111,557 | 56,732,312 | ||||||
MOVIES & ENTERTAINMENT—2.0% | ||||||||
Live Nation Entertainment, Inc.* | 228,095 | 23,922,604 | ||||||
OIL & GAS EXPLORATION & PRODUCTION—2.2% | ||||||||
Pioneer Natural Resources Co. | 115,177 | 26,775,197 | ||||||
PHARMACEUTICALS—2.2% | ||||||||
Bayer AG* | 351,368 | 23,141,685 | ||||||
Catalent, Inc.* | 35,156 | 3,183,728 | ||||||
26,325,413 | ||||||||
REGIONAL BANKS—2.0% | ||||||||
Signature Bank | 99,712 | 24,155,232 | ||||||
SEMICONDUCTOR EQUIPMENT—1.9% | ||||||||
Applied Materials, Inc. | 136,243 | 15,034,415 | ||||||
SolarEdge Technologies, Inc.* | 33,192 | 8,311,609 | ||||||
23,346,024 | ||||||||
SEMICONDUCTORS—5.7% | ||||||||
Advanced Micro Devices, Inc.* | 395,137 | 33,792,116 | ||||||
NVIDIA Corp. | 115,601 | 21,440,518 | ||||||
QUALCOMM, Inc. | 96,190 | 13,436,781 | ||||||
68,669,415 | ||||||||
SYSTEMS SOFTWARE—13.4% | ||||||||
Crowdstrike Holdings, Inc., Cl. A* | 70,482 | 14,009,002 | ||||||
Microsoft Corp. | 526,984 | 146,248,600 | ||||||
160,257,602 | ||||||||
TECHNOLOGY HARDWARE STORAGE & PERIPHERALS—6.1% | ||||||||
Apple, Inc. | 466,851 | 73,599,060 | ||||||
TRUCKING—1.6% | ||||||||
Uber Technologies, Inc.* | 393,627 | 12,391,378 | ||||||
XPO Logistics, Inc.* | 117,532 | 6,322,046 | ||||||
18,713,424 | ||||||||
TOTAL COMMON STOCKS | ||||||||
(Cost $1,034,465,809) | 1,134,511,502 |
THE ALGER INSTITUTIONAL FUNDS | ALGER FOCUS EQUITY FUND |
Schedule of Investments April 30, 2022 (Unaudited) (Continued)
PREFERRED STOCKS—0.0% | SHARES | VALUE | ||||||
BIOTECHNOLOGY—0.0% Prosetta Biosciences, Inc., Series D*,@,(a),(b) | 76,825 | $ | – | |||||
(Cost $345,713) | – | |||||||
Total Investments | ||||||||
(Cost $1,034,811,522) | 94.7 | % | $ | 1,134,511,502 | ||||
Affiliated Securities (Cost $345,713) | – | |||||||
Unaffiliated Securities (Cost $1,034,465,809) | 1,134,511,502 | |||||||
Other Assets in Excess of Liabilities | 5.3 | % | 63,364,333 | |||||
NET ASSETS | 100.0 | % | $ | 1,197,875,835 |
# | American Depositary Receipts. |
(a) | Deemed an afftliate of the Fund in accordance with Section 2(a)(3) of the Investment Company Act of 1940. See Note 11 - Afftliated Securities. |
(b) | Security is valued in good faith at fair value determined using signiftcant unobservable inputs pursuant to procedures established by the Board. |
* | Non-income producing security. |
@ | Restricted security - Investment in security not registered under the Securities Act of 1933. Sales or transfers of the investment may be restricted only to qualifted buyers. |
Security | Acquisition Date(s) | Acquisition Cost | % of net assets (Acquisition Date) | Market Value | % of net assets as of 4/30/2022 | |||||||||||||
Prosetta Biosciences, Inc., Series D | 2/6/15 | $ | 345,713 | 0.80 | % | $ | 0 | 0.00 | % | |||||||||
Total | 0 | 0.00 | % |
See Notes to Financial Statements.
THE ALGER INSTITUTIONAL FUNDS | ALGER MID CAP GROWTH INSTITUTIONAL FUND |
COMMON STOCKS—92.2% | SHARES | VALUE | ||||||
AEROSPACE & DEFENSE—5.2% | ||||||||
Axon Enterprise, Inc.* | 3,095 | $ | 347,259 | |||||
HEICO Corp. | 12,896 | 1,821,302 | ||||||
TransDigm Group, Inc.* | 2,462 | 1,464,422 | ||||||
3,632,983 | ||||||||
AIR FREIGHT & LOGISTICS—0.4% | ||||||||
GXO Logistics, Inc.* | 4,573 | 270,676 | ||||||
APPAREL ACCESSORIES & LUXURY GOODS—2.8% | ||||||||
Lululemon Athletica, Inc.* | 4,009 | 1,421,712 | ||||||
Moncler SpA | 10,927 | 569,147 | ||||||
1,990,859 | ||||||||
APPAREL RETAIL—2.2% | ||||||||
Aritzia, Inc.* | 29,284 | 1,042,926 | ||||||
Burlington Stores, Inc.* | 2,589 | 527,017 | ||||||
1,569,943 | ||||||||
APPLICATION SOFTWARE—10.9% | ||||||||
Avalara, Inc.* | 4,159 | 316,375 | ||||||
Bill.com Holdings, Inc.* | 4,747 | 810,360 | ||||||
Cadence Design Systems, Inc.* | 7,360 | 1,110,256 | ||||||
Datadog, Inc., Cl. A* | 6,053 | 731,081 | ||||||
Manhattan Associates, Inc.* | 8,652 | 1,129,519 | ||||||
Paycom Software, Inc.* | 4,373 | 1,230,868 | ||||||
Sprout Social, Inc., Cl. A* | 13,529 | 829,057 | ||||||
Synopsys, Inc.* | 3,281 | 940,958 | ||||||
The Trade Desk, Inc., Cl. A* | 10,080 | 593,914 | ||||||
7,692,388 | ||||||||
AUTOMOTIVE RETAIL—1.3% | ||||||||
O'Reilly Automotive, Inc.* | 1,507 | 914,071 | ||||||
BIOTECHNOLOGY—3.6% | �� | |||||||
Alkermes PLC* | 9,438 | 272,286 | ||||||
Apellis Pharmaceuticals, Inc.* | 6,996 | 304,536 | ||||||
BioMarin Pharmaceutical, Inc.* | 5,065 | 412,038 | ||||||
BioNTech SE#,* | 1,705 | 236,620 | ||||||
Celldex Therapeutics, Inc.* | 11,173 | 341,335 | ||||||
Natera, Inc.* | 19,531 | 685,929 | ||||||
Prometheus Biosciences, Inc.* | 10,778 | 283,461 | ||||||
2,536,205 | ||||||||
BUILDING PRODUCTS—0.7% | ||||||||
Trex Co., Inc.* | 9,089 | 528,889 | ||||||
CASINOS & GAMING—2.0% | ||||||||
MGM Resorts International | 33,472 | 1,373,691 | ||||||
CONSUMER FINANCE—1.4% | ||||||||
Upstart Holdings, Inc.* | 12,812 | 961,156 | ||||||
DATA PROCESSING & OUTSOURCED SERVICES—1.4% | ||||||||
Marqeta, Inc., Cl. A* | 108,492 | 1,008,976 | ||||||
DIVERSIFIED METALS & MINING—1.6% | ||||||||
MP Materials Corp.* | 29,209 | 1,111,110 | ||||||
ELECTRIC UTILITIES—1.9% | ||||||||
NextEra Energy, Inc. | 19,239 | 1,366,354 |
THE ALGER INSTITUTIONAL FUNDS | ALGER MID CAP GROWTH INSTITUTIONAL FUND |
Schedule of Investments April 30, 2022 (Unaudited) (Continued)
COMMON STOCKS—92.2% (CONT.) | SHARES | VALUE | ||||||
ELECTRICAL COMPONENTS & EQUIPMENT—2.3% | ||||||||
AMETEK, Inc. | 6,370 | $ | 804,276 | |||||
Generac Holdings, Inc.* | 3,709 | 813,681 | ||||||
1,617,957 | ||||||||
ELECTRONIC EQUIPMENT & INSTRUMENTS—1.6% | ||||||||
908 Devices, Inc.* | 41,877 | 743,317 | ||||||
Trimble, Inc.* | 6,077 | 405,336 | ||||||
1,148,653 | ||||||||
FINANCIAL EXCHANGES & DATA—0.7% | ||||||||
MSCI, Inc., Cl. A | 1,204 | 507,185 | ||||||
HEALTHCARE DISTRIBUTORS—2.2% | ||||||||
AmerisourceBergen Corp., Cl. A | 4,953 | 749,339 | ||||||
McKesson Corp. | 2,520 | 780,217 | ||||||
1,529,556 | ||||||||
HEALTHCARE EQUIPMENT—2.2% | ||||||||
Dexcom, Inc.* | 1,735 | 708,886 | ||||||
Insulet Corp.* | 3,493 | 834,792 | ||||||
1,543,678 | ||||||||
HEALTHCARE SERVICES—0.3% | ||||||||
Guardant Health, Inc.* | 3,358 | 207,189 | ||||||
HEALTHCARE TECHNOLOGY—0.7% | ||||||||
Veeva Systems, Inc., Cl. A* | 2,859 | 520,195 | ||||||
HOTELS RESORTS & CRUISE LINES—1.0% | ||||||||
Airbnb, Inc., Cl. A* | 2,294 | 351,464 | ||||||
Expedia Group, Inc.* | 2,056 | 359,286 | ||||||
710,750 | ||||||||
HYPERMARKETS & SUPER CENTERS—0.5% | ||||||||
BJ's Wholesale Club Holdings, Inc.* | 5,342 | 343,758 | ||||||
INTERACTIVE HOME ENTERTAINMENT—1.9% | ||||||||
Take-Two Interactive Software, Inc.* | 10,922 | 1,305,288 | ||||||
INTERACTIVE MEDIA & SERVICES—0.3% | ||||||||
Snap, Inc., Cl. A* | 6,359 | 180,977 | ||||||
INTERNET SERVICES & INFRASTRUCTURE—1.2% | ||||||||
MongoDB, Inc., Cl. A* | 2,293 | 813,854 | ||||||
LEISURE FACILITIES—1.1% | ||||||||
Vail Resorts, Inc. | 2,930 | 744,689 | ||||||
LIFE SCIENCES TOOLS & SERVICES—4.2% | ||||||||
10X Genomics, Inc., Cl. A* | 3,854 | 184,067 | ||||||
Azenta, Inc. | 7,567 | 567,222 | ||||||
Bio-Techne Corp. | 4,142 | 1,572,676 | ||||||
Repligen Corp.* | 2,275 | 357,721 | ||||||
West Pharmaceutical Services, Inc. | 956 | 301,198 | ||||||
2,982,884 | ||||||||
MOVIES & ENTERTAINMENT—2.7% | ||||||||
Liberty Media Corp.-Liberty Formula One, Cl. C* | 11,629 | 724,836 | ||||||
Live Nation Entertainment, Inc.* | 11,065 | 1,160,497 | ||||||
1,885,333 |
THE ALGER INSTITUTIONAL FUNDS | ALGER MID CAP GROWTH INSTITUTIONAL FUND |
Schedule of Investments April 30, 2022 (Unaudited) (Continued)
COMMON STOCKS—92.2% (CONT.) | SHARES | VALUE | ||||||
OIL & GAS EQUIPMENT & SERVICES—4.0% | ||||||||
Baker Hughes Co., Cl. A | 42,494 | $ | 1,318,164 | |||||
ChampionX Corp. | 52,472 | 1,107,159 | ||||||
ProPetro Holding Corp.* | 29,573 | 418,162 | ||||||
2,843,485 | ||||||||
OIL & GAS EXPLORATION & PRODUCTION—4.1% | ||||||||
Diamondback Energy, Inc. | 12,280 | 1,550,105 | ||||||
Pioneer Natural Resources Co. | 5,805 | 1,349,488 | ||||||
2,899,593 | ||||||||
PHARMACEUTICALS—3.1% | ||||||||
Catalent, Inc.* | 14,318 | 1,296,638 | ||||||
Green Thumb Industries, Inc.* | 24,239 | 339,829 | ||||||
Jazz Pharmaceuticals PLC* | 1,693 | 271,252 | ||||||
Pacira BioSciences, Inc.* | 3,445 | 256,894 | ||||||
2,164,613 | ||||||||
REGIONAL BANKS—2.2% | ||||||||
Signature Bank | 6,462 | 1,565,419 | ||||||
RENEWABLE ELECTRICITY—0.7% | ||||||||
NextEra Energy Partners LP | 7,142 | 476,086 | ||||||
RESEARCH & CONSULTING SERVICES—0.6% | ||||||||
CoStar Group, Inc.* | 6,180 | 393,172 | ||||||
RESTAURANTS—3.5% | ||||||||
Chipotle Mexican Grill, Inc., Cl. A* | 539 | 784,574 | ||||||
Shake Shack, Inc., Cl. A* | 21,886 | 1,265,667 | ||||||
The Cheesecake Factory, Inc.* | 11,225 | 414,315 | ||||||
2,464,556 | ||||||||
SEMICONDUCTOR EQUIPMENT—5.0% | ||||||||
Applied Materials, Inc. | 5,086 | 561,240 | ||||||
Enphase Energy, Inc.* | 2,332 | 376,385 | ||||||
KLA Corp. | 2,356 | 752,176 | ||||||
Lam Research Corp. | 798 | 371,676 | ||||||
Onto Innovation, Inc.* | 2,769 | 196,987 | ||||||
SolarEdge Technologies, Inc.* | 5,100 | 1,277,091 | ||||||
3,535,555 | ||||||||
SEMICONDUCTORS—3.4% | ||||||||
Advanced Micro Devices, Inc.* | 11,908 | 1,018,372 | ||||||
Microchip Technology, Inc. | 11,854 | 772,881 | ||||||
SiTime Corp.* | 3,686 | 621,349 | ||||||
2,412,602 | ||||||||
SYSTEMS SOFTWARE—5.0% | ||||||||
Crowdstrike Holdings, Inc., Cl. A* | 5,969 | 1,186,398 | ||||||
Fortinet, Inc.* | 2,947 | 851,713 | ||||||
Palo Alto Networks, Inc.* | 2,615 | 1,467,747 | ||||||
3,505,858 | ||||||||
TRUCKING—2.3% | ||||||||
Old Dominion Freight Line, Inc. | 4,468 | 1,251,576 |
THE ALGER INSTITUTIONAL FUNDS | ALGER MID CAP GROWTH INSTITUTIONAL FUND |
Schedule of Investments April 30, 2022 (Unaudited) (Continued)
COMMON STOCKS—92.2% (CONT.) | SHARES | VALUE | ||||||
TRUCKING—2.3% (CONT.) | ||||||||
Uber Technologies, Inc.* | 11,977 | $ | 377,036 | |||||
1,628,612 | ||||||||
TOTAL COMMON STOCKS | ||||||||
(Cost $71,464,617) | 64,888,798 | |||||||
PREFERRED STOCKS—0.0% | SHARES | VALUE | ||||||
BIOTECHNOLOGY—0.0% | ||||||||
Prosetta Biosciences, Inc., Series D*,@,(a),(b) | 166,009 | – | ||||||
(Cost $747,040) | – | |||||||
RIGHTS—0.4% | SHARES | VALUE | ||||||
BIOTECHNOLOGY—0.4% | ||||||||
Tolero CDR*,@,(b),(c) | 422,928 | 304,508 | ||||||
(Cost $226,186) | 304,508 | |||||||
REAL ESTATE INVESTMENT TRUST—0.5% | SHARES | VALUE | ||||||
SPECIALIZED—0.5% | ||||||||
Crown Castle International Corp. | 2,003 | 370,976 | ||||||
(Cost $396,604) | 370,976 | |||||||
SPECIAL PURPOSE VEHICLE—1.6% | SHARES | VALUE | ||||||
DATA PROCESSING & OUTSOURCED SERVICES—1.6% | ||||||||
Crosslink Ventures Capital LLC, Cl. A*,@,(a),(b) | 22 | 767,954 | ||||||
Crosslink Ventures Capital LLC, Cl. B*,@,(a),(b) | 9 | 326,925 | ||||||
1,094,879 | ||||||||
TOTAL SPECIAL PURPOSE VEHICLE | ||||||||
(Cost $775,000) | 1,094,879 | |||||||
Total Investments | ||||||||
(Cost $73,609,447) | 94.7 | % | $ | 66,659,161 | ||||
Affiliated Securities (Cost $1,522,040) | 1,094,879 | |||||||
Unaffiliated Securities (Cost $72,087,407) | 65,564,282 | |||||||
Other Assets in Excess of Liabilities | 5.3 | % | 3,740,845 | |||||
NET ASSETS | 100.0 | % | $ | 70,400,006 |
# | American Depositary Receipts. |
(a) | Deemed an affiliate of the Fund in accordance with Section 2(a)(3) of the Investment Company Act of 1940. See Note 11 - Affiliated Securities. |
(b) | Security is valued in good faith at fair value determined using significant unobservable inputs pursuant to procedures established by the Board. |
(c) | Contingent Deferred Rights. |
* | Non-income producing security. |
@ | Restricted security - Investment in security not registered under the Securities Act of 1933. Sales or transfers of the investment may be restricted only to qualified buyers. |
Security | Acquisition Date(s) | Acquisition Cost | % of net assets (Acquisition Date) | Market Value | % of net assets as of 4/30/2022 | ||||||||||||
Crosslink Ventures Capital LLC, Cl. A | 10/2/20 | $ | 550,000 | 0.50 | % | $ | 767,954 | 1.09 | % | ||||||||
Crosslink Ventures Capital LLC, Cl. B | 12/16/20 | 225,000 | 0.19 | % | 326,925 | 0.47 | % | ||||||||||
Prosetta Biosciences, Inc., Series D | 2/6/15 | 747,040 | 0.50 | % | 0 | 0.00 | % | ||||||||||
Tolero CDR | 2/6/17 | 226,186 | 0.23 | % | 304,508 | 0.43 | % | ||||||||||
Total | 1,399,387 | 1.99 | % |
See Notes to Financial Statements.
THE ALGER INSTITUTIONAL FUNDS | ALGER SMALL CAP GROWTH INSTITUTIONAL FUND |
Schedule of Investments April 30, 2022 (Unaudited) (Continued)
COMMON STOCKS—93.7% | SHARES | VALUE | ||||||
ADVERTISING—0.4% | ||||||||
Magnite, Inc.* | 81,700 | $ | 788,405 | |||||
AEROSPACE & DEFENSE—3.3% | ||||||||
HEICO Corp. | 25,263 | 3,567,893 | ||||||
Hexcel Corp. | 12,486 | 678,739 | ||||||
Mercury Systems, Inc.* | 43,625 | 2,433,839 | ||||||
6,680,471 | ||||||||
AGRICULTURAL & FARM MACHINERY—0.2% | ||||||||
Hydrofarm Holdings Group, Inc.* | 45,962 | 438,937 | ||||||
APPAREL ACCESSORIES & LUXURY GOODS—1.2% | ||||||||
Capri Holdings Ltd.* | 50,413 | 2,404,700 | ||||||
APPAREL RETAIL—2.1% | ||||||||
Aritzia, Inc.* | 50,073 | 1,783,310 | ||||||
Victoria's Secret & Co.* | 54,535 | 2,569,689 | ||||||
4,352,999 | ||||||||
APPLICATION SOFTWARE—20.9% | ||||||||
ACI Worldwide, Inc.* | 104,482 | 2,885,793 | ||||||
Avalara, Inc.* | 36,322 | 2,763,015 | ||||||
Bill.com Holdings, Inc.* | 22,027 | 3,760,229 | ||||||
Blackbaud, Inc.* | 34,609 | 2,007,668 | ||||||
Blackline, Inc.* | 34,208 | 2,293,646 | ||||||
Digital Turbine, Inc.* | 25,706 | 813,595 | ||||||
Everbridge, Inc.* | 42,785 | 1,844,033 | ||||||
ForgeRock, Inc., Cl. A* | 14,085 | 287,757 | ||||||
Guidewire Software, Inc.* | 19,478 | 1,693,417 | ||||||
HubSpot, Inc.* | 7,818 | 2,966,384 | ||||||
Manhattan Associates, Inc.* | 31,095 | 4,059,452 | ||||||
Paycom Software, Inc.* | 11,823 | 3,327,820 | ||||||
Paycor HCM, Inc.* | 4,766 | 117,387 | ||||||
Q2 Holdings, Inc.* | 55,535 | 2,872,826 | ||||||
SEMrush Holdings, Inc., Cl. A* | 47,723 | 465,776 | ||||||
Smartsheet, Inc., Cl. A* | 36,524 | 1,765,205 | ||||||
Sprout Social, Inc., Cl. A* | 44,365 | 2,718,687 | ||||||
SPS Commerce, Inc.* | 35,187 | 4,209,421 | ||||||
Vertex, Inc., Cl. A* | 94,237 | 1,340,992 | ||||||
42,193,103 | ||||||||
ASSET MANAGEMENT & CUSTODY BANKS—0.3% | ||||||||
Affiliated Managers Group, Inc | 5,109 | 641,537 | ||||||
BIOTECHNOLOGY—2.9% | ||||||||
Alkermes PLC* | 18,970 | 547,284 | ||||||
CareDx, Inc.* | 126,904 | 3,862,958 | ||||||
Celldex Therapeutics, Inc.* | 15,204 | 464,482 | ||||||
Karuna Therapeutics, Inc.* | 6,802 | 758,151 | ||||||
Turning Point Therapeutics, Inc.* | 8,458 | 249,004 | ||||||
5,881,879 | ||||||||
DATA PROCESSING & OUTSOURCED SERVICES—1.2% | ||||||||
DLocal Ltd., Cl. A* | 80,976 | 1,835,726 | ||||||
Marqeta, Inc., Cl. A* | 74,534 | 693,166 | ||||||
2,528,892 |
THE ALGER INSTITUTIONAL FUNDS | ALGER SMALL CAP GROWTH INSTITUTIONAL FUND |
Schedule of Investments April 30, 2022 (Unaudited) (Continued)
COMMON STOCKS—93.7% (CONT.) | SHARES | VALUE | ||||||
DIVERSIFIED SUPPORT SERVICES—0.4% | ||||||||
IAA, Inc.* | 21,263 | $ | 779,289 | |||||
ELECTRICAL COMPONENTS & EQUIPMENT—0.4% | ||||||||
Sunrun, Inc.* | 36,651 | 732,287 | ||||||
ELECTRONIC EQUIPMENT & INSTRUMENTS—1.8% | ||||||||
908 Devices, Inc.* | 24,351 | 432,230 | ||||||
Cognex Corp. | 47,829 | 3,234,676 | ||||||
3,666,906 | ||||||||
FOOD DISTRIBUTORS—2.4% | ||||||||
The Chefs' Warehouse, Inc.* | 45,752 | 1,674,523 | ||||||
US Foods Holding Corp.* | 87,254 | 3,282,496 | ||||||
4,957,019 | ||||||||
HEALTHCARE DISTRIBUTORS—0.3% | ||||||||
PetIQ, Inc., Cl. A* | 29,488 | 586,811 | ||||||
HEALTHCARE EQUIPMENT—8.3% | ||||||||
CryoPort, Inc.* | 58,749 | 1,325,377 | ||||||
Impulse Dynamics NV, Series E*,@,(a) | 532,406 | 1,756,940 | ||||||
Inmode Ltd.* | 85,260 | 2,140,879 | ||||||
Inogen, Inc.* | 7,985 | 201,861 | ||||||
Insulet Corp.* | 20,977 | 5,013,293 | ||||||
Mesa Laboratories, Inc. | 10,892 | 2,326,858 | ||||||
Paragon 28, Inc.* | 34,433 | 618,761 | ||||||
Tandem Diabetes Care, Inc.* | 34,574 | 3,335,699 | ||||||
16,719,668 | ||||||||
HEALTHCARE FACILITIES—1.2% | ||||||||
The Joint Corp.* | 76,739 | 2,342,074 | ||||||
HEALTHCARE SERVICES—1.1% | ||||||||
Biodesix, Inc.* | 34,078 | 54,866 | ||||||
Guardant Health, Inc.* | 28,081 | 1,732,598 | ||||||
Privia Health Group, Inc.* | 22,951 | 504,692 | ||||||
2,292,156 | ||||||||
HEALTHCARE SUPPLIES—4.2% | ||||||||
Neogen Corp.* | 179,100 | 4,728,240 | ||||||
Quidel Corp.* | 36,948 | 3,717,708 | ||||||
8,445,948 | ||||||||
HEALTHCARE TECHNOLOGY—2.0% | ||||||||
Convey Health Solutions Holdings, Inc.* | 65,548 | 333,639 | ||||||
Definitive Healthcare Corp , Cl. A* | 15,589 | 368,680 | ||||||
Doximity, Inc., Cl. A* | 8,832 | 352,132 | ||||||
Renalytix PLC#,* | 74,636 | 378,404 | ||||||
Sophia Genetics SA* | 38,769 | 249,285 | ||||||
Veeva Systems, Inc., Cl. A* | 13,137 | 2,390,277 | ||||||
4,072,417 | ||||||||
HOMEBUILDING—0.3% | ||||||||
Skyline Champion Corp.* | 11,072 | 565,115 | ||||||
HOMEFURNISHING RETAIL—0.8% | ||||||||
Arhaus, Inc., Cl. A* | 23,071 | 165,419 | ||||||
Bed Bath & Beyond, Inc.* | 100,265 | 1,364,607 | ||||||
1,530,026 |
THE ALGER INSTITUTIONAL FUNDS | ALGER SMALL CAP GROWTH INSTITUTIONAL FUND |
Schedule of Investments April 30, 2022 (Unaudited) (Continued)
COMMON STOCKS—93.7% (CONT.) | SHARES | VALUE | ||||||
HUMAN RESOURCE & EMPLOYMENT SERVICES—1.2% | ||||||||
LegalZoom.com, Inc.* | 69,733 | $ | 1,000,669 | |||||
Upwork, Inc.* | 64,856 | 1,360,030 | ||||||
2,360,699 | ||||||||
HYPERMARKETS & SUPER CENTERS—2.5% | ||||||||
BJ's Wholesale Club Holdings, Inc.* | 79,417 | 5,110,484 | ||||||
INDUSTRIAL MACHINERY—0.5% | ||||||||
Gates Industrial Corp., PLC* | 77,926 | 993,557 | ||||||
INTERACTIVE HOME ENTERTAINMENT—1.0% | ||||||||
Take-Two Interactive Software, Inc.* | 16,608 | 1,984,822 | ||||||
INTERACTIVE MEDIA & SERVICES—1.9% | ||||||||
Bumble, Inc., Cl. A* | 21,939 | 526,316 | ||||||
Eventbrite, Inc., Cl. A* | 65,017 | 687,880 | ||||||
Genius Sports Ltd.* | 285,006 | 1,088,723 | ||||||
Tripadvisor, Inc.* | 60,697 | 1,558,092 | ||||||
3,861,011 | ||||||||
INTERNET & DIRECT MARKETING RETAIL—0.7% | ||||||||
Farfetch Ltd., Cl. A* | 65,054 | 728,605 | ||||||
The RealReal, Inc.* | 129,405 | 701,375 | ||||||
1,429,980 | ||||||||
INTERNET SERVICES & INFRASTRUCTURE—0.6% | ||||||||
BigCommerce Holdings, Inc.* | 68,228 | 1,219,234 | ||||||
LEISURE FACILITIES—1.0% | ||||||||
Planet Fitness, Inc., Cl. A* | 24,261 | 1,941,608 | ||||||
LIFE SCIENCES TOOLS & SERVICES—7.9% | ||||||||
Akoya Biosciences, Inc.* | 66,342 | 624,278 | ||||||
Alpha Teknova, Inc.* | 15,421 | 173,178 | ||||||
Bio-Techne Corp. | 16,685 | 6,335,128 | ||||||
Codex DNA, Inc.* | 38,575 | 142,727 | ||||||
Cytek Biosciences, Inc.* | 27,150 | 256,567 | ||||||
ICON PLC* | 8,908 | 2,015,079 | ||||||
Maravai LifeSciences Holdings, Inc., Cl. A* | 21,044 | 646,682 | ||||||
MaxCyte, Inc.* | 23,465 | 129,996 | ||||||
NanoString Technologies, Inc.* | 102,524 | 1,925,401 | ||||||
NeoGenomics, Inc.* | 71,563 | 676,270 | ||||||
Personalis, Inc.* | 52,152 | 292,051 | ||||||
Rapid Micro Biosystems, Inc., Cl. A* | 31,307 | 182,520 | ||||||
Repligen Corp.* | 16,361 | 2,572,604 | ||||||
15,972,481 | ||||||||
MANAGED HEALTHCARE—1.6% | ||||||||
HealthEquity, Inc.* | 50,812 | 3,166,604 | ||||||
MOVIES & ENTERTAINMENT—2.4% | ||||||||
Live Nation Entertainment, Inc.* | 45,775 | 4,800,882 | ||||||
OIL & GAS EQUIPMENT & SERVICES—0.9% | ||||||||
ChampionX Corp. | 37,585 | 793,043 | ||||||
ProPetro Holding Corp.* | 77,048 | 1,089,459 | ||||||
1,882,502 |
THE ALGER INSTITUTIONAL FUNDS | ALGER SMALL CAP GROWTH INSTITUTIONAL FUND |
Schedule of Investments April 30, 2022 (Unaudited) (Continued)
COMMON STOCKS—93.7% (CONT.) | SHARES | VALUE | ||||||
OIL & GAS EXPLORATION & PRODUCTION—5.0% | ||||||||
Coterra Energy, Inc. | 39,757 | $ | 1,144,604 | |||||
Magnolia Oil & Gas Corp., Cl. A | 389,969 | 9,062,880 | ||||||
10,207,484 | ||||||||
PERSONAL PRODUCTS—0.4% | ||||||||
The Beauty Health Co.* | 55,593 | 728,268 | ||||||
PRECIOUS METALS & MINERALS—0.5% | ||||||||
Xometry, Inc., Cl. A* | 30,049 | 986,208 | ||||||
REGIONAL BANKS—0.8% | ||||||||
Webster Financial Corp. | 31,770 | 1,588,182 | ||||||
RESTAURANTS—4.8% | ||||||||
Shake Shack, Inc., Cl. A* | 67,142 | 3,882,822 | ||||||
Sweetgreen, Inc., Cl. A* | 18,023 | 486,621 | ||||||
The Cheesecake Factory, Inc.* | 84,459 | 3,117,382 | ||||||
Wingstop, Inc. | 23,609 | 2,166,362 | ||||||
9,653,187 | ||||||||
SEMICONDUCTOR EQUIPMENT—0.6% | ||||||||
SolarEdge Technologies, Inc.* | 5,080 | 1,272,083 | ||||||
SEMICONDUCTORS—0.8% | ||||||||
Universal Display Corp. | 13,240 | 1,691,145 | ||||||
SPECIALTY CHEMICALS—2.0% | ||||||||
Balchem Corp. | 32,965 | 4,061,288 | ||||||
SPECIALTY STORES—0.9% | ||||||||
Brilliant Earth Group, Inc., Cl. A* | 10,779 | 82,998 | ||||||
Five Below, Inc.* | 11,556 | 1,815,448 | ||||||
1,898,446 | ||||||||
TOTAL COMMON STOCKS | ||||||||
(Cost $178,332,231) | 189,410,794 | |||||||
PREFERRED STOCKS—3.4% | SHARES | VALUE | ||||||
BIOTECHNOLOGY—0.0% | ||||||||
Prosetta Biosciences, Inc., Series D*,@,(a),(b) | 133,263 | – | ||||||
DATA PROCESSING & OUTSOURCED SERVICES—3.4% | ||||||||
Chime Financial, Inc., Series G*,@,(a) | 114,399 | 6,805,597 | ||||||
TOTAL PREFERRED STOCKS | ||||||||
(Cost $8,501,200) | 6,805,597 | |||||||
RIGHTS—0.2% | SHARES | VALUE | ||||||
BIOTECHNOLOGY—0.2% | ||||||||
Tolero CDR*,@,(a),(c) | 528,559 | 380,562 | ||||||
(Cost $285,725) | 380,562 | |||||||
REAL ESTATE INVESTMENT TRUST—1.0% | SHARES | VALUE | ||||||
RETAIL—1.0% | ||||||||
Tanger Factory Outlet Centers, Inc. | 125,834 | 2,029,702 | ||||||
(Cost $2,071,500) | 2,029,702 |
THE ALGER INSTITUTIONAL FUNDS | ALGER SMALL CAP GROWTH INSTITUTIONAL FUND |
Schedule of Investments April 30, 2022 (Unaudited) (Continued)
SPECIAL PURPOSE VEHICLE—1.1% | SHARES | VALUE | ||||||
DATA PROCESSING & OUTSOURCED SERVICES—1.1% | ||||||||
Crosslink Ventures Capital LLC, Cl. A*,@,(a),(b) | 51 | $ | 1,780,257 | |||||
Crosslink Ventures Capital LLC, Cl. B*,@,(a),(b) | 13 | 472,225 | ||||||
2,252,482 | ||||||||
TOTAL SPECIAL PURPOSE VEHICLE | ||||||||
(Cost $1,600,000) | 2,252,482 | |||||||
Total Investments | ||||||||
(Cost $190,790,656) | 99.4 | % | $ | 200,879,137 | ||||
Affiliated Securities (Cost $2,199,684) | 2,252,482 | |||||||
Unaffiliated Securities (Cost $188,590,972) | 198,626,655 | |||||||
Other Assets in Excess of Liabilities | 0.6 | % | 1,171,735 | |||||
NET ASSETS | 100.0 | % | $ | 202,050,872 |
# | American Depositary Receipts. |
(a) | Security is valued in good faith at fair value determined using significant unobservable inputs pursuant to procedures established by the Board. |
(b) | Deemed an affiliate of the Fund in accordance with Section 2(a)(3) of the Investment Company Act of 1940. See Note 11 - Affiliated Securities. |
(c) | Contingent Deferred Rights. |
* | Non-income producing security. |
@ | Restricted security - Investment in security not registered under the Securities Act of 1933. Sales or transfers of the investment may be restricted only to qualified buyers. |
Security | Acquisition Date(s) | Acquisition Cost | % of net assets (Acquisition Date) | Market Value | % of net assets as of 4/30/2022 | ||||||||||||
Chime Financial, Inc., Series G | 8/24/21 | $ | 7,901,516 | 2.12 | % | $ | 6,805,597 | 3.37 | % | ||||||||
Crosslink Ventures Capital LLC, Cl. A | 10/2/20 | 1,275,000 | 0.49 | % | 1,780,257 | 0.88 | % | ||||||||||
Crosslink Ventures Capital LLC, Cl. B | 12/16/20 | 325,000 | 0.11 | % | 472,225 | 0.23 | % | ||||||||||
Impulse Dynamics NV, Series E | 2/11/22 | 1,756,940 | 0.71 | % | 1,756,940 | 0.87 | % | ||||||||||
Prosetta Biosciences, Inc., Series D | 2/6/15 | 599,684 | 0.10 | % | 0 | 0.00 | % | ||||||||||
Tolero CDR | 2/6/17 | 285,725 | 0.16 | % | 380,562 | 0.19 | % | ||||||||||
Total | 11,195,581 | 5.54 | % |
See Notes to Financial Statements.
Alger Capital Appreciation Institutional Fund | Alger Focus Equity Fund | |||||||
ASSETS: | ||||||||
Investments in unaffiliated securities, at value (Identified cost below)* see accompanying schedules of investments | 2,760,559,794 | 1,134,511,502 | ||||||
Investments in affiliated securities, at value (Identified cost below)** see accompanying schedules of investments | $ | 4,293,561 | $ | — | ||||
Cash and cash equivalents | 34,654,700 | 76,515,826 | ||||||
Foreign cash † | 319,381 | — | ||||||
Receivable for investment securities sold | 10,334,742 | 5,756,155 | ||||||
Receivable for shares of beneficial interest sold | 10,074,147 | 1,156,481 | ||||||
Dividends and interest receivable | 821,323 | 78,132 | ||||||
Receivable from Investment Manager | 30,242 | 5,900 | ||||||
Prepaid expenses | 197,433 | 164,420 | ||||||
Total Assets | 2,821,285,323 | 1,218,188,416 | ||||||
LIABILITIES: | ||||||||
Payable for investment securities purchased | 43,091,765 | 17,729,839 | ||||||
Payable for shares of beneficial interest redeemed | 6,706,112 | 1,624,208 | ||||||
Accrued investment advisory fees | 1,894,224 | 562,215 | ||||||
Accrued distribution fees | 169,243 | 65,194 | ||||||
Accrued shareholder servicing fees | 442,359 | 11,287 | ||||||
Accrued shareholder administrative fees | 25,159 | 11,602 | ||||||
Accrued administrative fees | 69,187 | 29,733 | ||||||
Accrued custodian fees | 29,906 | 15,259 | ||||||
Accrued transfer agent fees | 1,935,545 | 137,467 | ||||||
Accrued printing fees | 33,744 | 34,363 | ||||||
Accrued professional fees | 35,724 | 26,307 | ||||||
Accrued trustee fees | 7,924 | 3,126 | ||||||
Accrued fund accounting fees | 120,964 | 58,365 | ||||||
Accrued tax payable | 863 | 1,249 | ||||||
Accrued other expenses | 5,190 | 2,367 | ||||||
Total Liabilities | 54,567,909 | 20,312,581 | ||||||
NET ASSETS | $ | 2,766,717,414 | $ | 1,197,875,835 | ||||
NET ASSETS CONSIST OF: | ||||||||
Paid in capital (par value of $.001 per share) | 1,820,251,461 | 1,115,774,220 | ||||||
Distributable earnings | 946,465,953 | 82,101,615 | ||||||
NET ASSETS | $ | 2,766,717,414 | $ | 1,197,875,835 | ||||
* Identified cost | $ | 2,054,187,275(a | ) | $ | 1,034,465,809(b | ) | ||
** Identified cost | $ | 3,075,000(a | ) | $ | 345,713(b | ) | ||
† Cost of foreign cash | $ | 318,064 | $ | — |
See Notes to Financial Statements.
THE ALGER INSTITUTIONAL FUNDS
Statements of Assets and Liabilities April 30, 2022 (Unaudited) (Continued)
Alger Capital Appreciation Institutional Fund | Alger Focus Equity Fund | |||||||
NET ASSETS BY CLASS: | ||||||||
Class A | $ | — | $ | 83,219,101 | ||||
Class C | $ | — | $ | 51,623,896 | ||||
Class I | $ | 1,568,925,242 | $ | 50,391,658 | ||||
Class R | $ | 373,031,308 | $ | — | ||||
Class Y | $ | 415,714,368 | $ | 150,907,642 | ||||
Class Z | $ | — | $ | 861,733,538 | ||||
Class Z-2 | $ | 409,046,496 | $ | — | ||||
SHARES OF BENEFICIAL INTEREST OUTSTANDING — NOTE 6: | ||||||||
Class A | — | 1,949,877 | ||||||
Class C | — | 1,324,732 | ||||||
Class I | 50,962,407 | 1,171,643 | ||||||
Class R | 15,189,302 | — | ||||||
Class Y | 13,098,631 | 3,406,882 | ||||||
Class Z | — | 19,509,195 | ||||||
Class Z-2 | 12,932,976 | — | ||||||
NET ASSET VALUE PER SHARE: | ||||||||
Class A — Net Asset Value Per Share Class A | $ | — | $ | 42.68 | ||||
Class A — Offering Price Per Share (includes a 5.25% sales charge) | $ | — | $ | 45.04 | ||||
Class C — Net Asset Value Per Share Class C | $ | — | $ | 38.97 | ||||
Class I — Net Asset Value Per Share Class I | $ | 30.79 | $ | 43.01 | ||||
Class R — Net Asset Value Per Share Class R | $ | 24.56 | $ | — | ||||
Class Y — Net Asset Value Per Share Class Y | $ | 31.74 | $ | 44.29 | ||||
Class Z — Net Asset Value Per Share Class Z | $ | — | $ | 44.17 | ||||
Class Z-2 — Net Asset Value Per Share Class Z-2 | $ | 31.63 | $ | — |
See Notes to Financial Statements.
(a) | At April 30, 2022, the net unrealized appreciation on investments, based on cost for federal income tax purposes of 2,078,819,136, amounted to 686,034,219 which consisted of aggregate gross unrealized appreciation of 921,015,137 and aggregate gross unrealized depreciation of 234,980,918. |
(b) | At April 30, 2022, the net unrealized appreciation on investments, based on cost for federal income tax purposes of 1,045,744,960, amounted to 88,766,542 which consisted of aggregate gross unrealized appreciation of 187,143,905 and aggregate gross unrealized depreciation of 98,377,363. |
THE ALGER INSTITUTIONAL FUNDS
Statements of Assets and Liabilities April 30, 2022 (Unaudited) (Continued)
Alger Mid Cap Growth Institutional Fund | Alger Small Cap Growth Institutional Fund | |||||||
ASSETS: | ||||||||
Investments in unaffiliated securities, at value (Identified cost below)* see accompanying schedules of investments | $ | 65,564,282 | $ | 198,626,655 | ||||
Investments in affiliated securities, at value (Identified cost below)** see accompanying schedules of investments | 1,094,879 | 2,252,482 | ||||||
Cash and cash equivalents | 1,517,870 | 2,510,277 | ||||||
Receivable for investment securities sold | 2,864,219 | 315,336 | ||||||
Receivable for shares of beneficial interest sold | 22,103 | 134,898 | ||||||
Dividends and interest receivable | 5,013 | 25,167 | ||||||
Receivable from Investment Manager | 2,258 | — | ||||||
Prepaid expenses | 11,491 | 65,166 | ||||||
Total Assets | 71,082,115 | 203,929,981 | ||||||
LIABILITIES: | ||||||||
Payable for shares of beneficial interest redeemed | 485,742 | 1,500,698 | ||||||
Accrued investment advisory fees | 48,648 | 149,802 | ||||||
Accrued distribution fees | 2,131 | 2,724 | ||||||
Accrued shareholder servicing fees | 12,507 | 23,259 | ||||||
Accrued shareholder administrative fees | 640 | 1,849 | ||||||
Accrued administrative fees | 1,760 | 5,086 | ||||||
Accrued custodian fees | 4,550 | 3,323 | ||||||
Accrued transfer agent fees | 70,777 | 125,989 | ||||||
Accrued printing fees | 5,827 | 21,234 | ||||||
Accrued professional fees | 30,350 | 29,130 | ||||||
Accrued trustee fees | 220 | 661 | ||||||
Accrued fund accounting fees | 15,557 | 12,958 | ||||||
Accrued tax payable | 1,178 | 1,295 | ||||||
Accrued other expenses | 2,222 | 1,101 | ||||||
Total Liabilities | 682,109 | 1,879,109 | ||||||
NET ASSETS | $ | 70,400,006 | $ | 202,050,872 | ||||
NET ASSETS CONSIST OF: | ||||||||
Paid in capital (par value of $.001 per share) | 86,892,987 | 183,712,151 | ||||||
Distributable earnings (Distributions in excess of earnings) | (16,492,981 | ) | 18,338,721 | |||||
NET ASSETS | $ | 70,400,006 | $ | 202,050,872 | ||||
* Identified cost | $ | 72,087,407(a | ) | $ | 188,590,972(b | ) | ||
** Identified cost | $ | 1,522,040(a | ) | $ | 2,199,684(b | ) |
See Notes to Financial Statements.
THE ALGER INSTITUTIONAL FUNDS
Statements of Assets and Liabilities April 30, 2022 (Unaudited) (Continued)
Alger Mid Cap Growth Institutional Fund | Alger Small Cap Growth Institutional Fund | |||||||
NET ASSETS BY CLASS: | ||||||||
Class I | $ | 50,081,434 | $ | 94,510,378 | ||||
Class R | $ | 4,728,958 | $ | 6,008,171 | ||||
Class Z-2 | $ | 15,589,614 | $ | 101,532,323 | ||||
SHARES OF BENEFICIAL INTEREST OUTSTANDING — NOTE 6: | ||||||||
Class I | 2,707,293 | 5,694,890 | ||||||
Class R | 331,450 | 519,475 | ||||||
Class Z-2 | 815,009 | 5,982,706 | ||||||
NET ASSET VALUE PER SHARE: | ||||||||
Class I — Net Asset Value Per Share Class I | $ | 18.50 | $ | 16.60 | ||||
Class R — Net Asset Value Per Share Class R | $ | 14.27 | $ | 11.57 | ||||
Class Z-2 — Net Asset Value Per Share Class Z-2 | $ | 19.13 | $ | 16.97 |
See Notes to Financial Statements.
(a) | At April 30, 2022, the net unrealized depreciation on investments, based on cost for federal income tax purposes of 74,518,252, amounted to 7,859,091 which consisted of aggregate gross unrealized appreciation of 2,603,909 and aggregate gross unrealized depreciation of 10,463,000. |
(b) | At April 30, 2022, the net unrealized appreciation on investments, based on cost for federal income tax purposes of 191,248,095, amounted to 9,631,042 which consisted of aggregate gross unrealized appreciation of 53,300,534 and aggregate gross unrealized depreciation of 43,669,492. |
THE ALGER INSTITUTIONAL FUNDS
Alger Capital Appreciation Institutional Fund | Alger Focus Equity Fund | |||||||
INCOME: | ||||||||
Dividends (net of foreign withholding taxes*) | $ | 8,202,313 | $ | 3,020,395 | ||||
Interest | 2,909 | 10,353 | ||||||
Total Income | 8,205,222 | 3,030,748 | ||||||
EXPENSES: | ||||||||
Investment advisory fees — Note 3(a) | 12,920,759 | 3,814,327 | ||||||
Distribution fees — Note 3(c) | ||||||||
Class A | — | 130,076 | ||||||
Class C | — | 313,906 | ||||||
Class R | 1,180,585 | — | ||||||
Shareholder servicing fees — Note 3(f) | 3,070,630 | 88,229 | ||||||
Shareholder administrative fees — Note 3(f) | 176,744 | 78,775 | ||||||
Administration fees — Note 3(b) | 486,047 | 201,719 | ||||||
Custodian fees | 63,220 | 32,155 | ||||||
Interest expenses | 36,920 | 110 | ||||||
Transfer agent fees — Note 3(f) | 1,019,194 | 133,370 | ||||||
Printing fees | 36,365 | 41,475 | ||||||
Professional fees | 76,405 | 34,780 | ||||||
Registration fees | 98,321 | 64,070 | ||||||
Trustee fees — Note 3(g) | 52,026 | 21,881 | ||||||
Fund accounting fees | 254,017 | 125,325 | ||||||
Accrued taxes | 297 | 297 | ||||||
Other expenses | 43,906 | 18,488 | ||||||
Total Expenses | 19,515,436 | 5,098,983 | ||||||
Less, expense reimbursements/waivers — Note 3(a) | (161,648 | ) | (27,327 | ) | ||||
Net Expenses | 19,353,788 | 5,071,656 | ||||||
NET INVESTMENT LOSS | (11,148,566 | ) | (2,040,908 | ) | ||||
REALIZED AND UNREALIZED GAIN (LOSS) ON INVESTMENTS AND FOREIGN CURRENCY: | ||||||||
Net realized gain ( loss on unaffi ated nvestments | 271,653,042 | (81,693,609 | ) | |||||
Net realized gain on redemption-in-kind | — | 77,070,975 | ||||||
Net realized gain on foreign currency transactions | 9,489 | 2,472 | ||||||
Net change n unrea zed (deprec at on) on unaffi ated | ||||||||
investments | (1,297,950,419 | ) | (399,094,141 | ) | ||||
Net change unrealized (deprec at on) on affi ated | ||||||||
investments | (629,883 | ) | — | |||||
Net change in unrealized (depreciation) on foreign currency | (6,611 | ) | (2,927 | ) | ||||
Net realized and unrealized (loss) on investments and foreign currency | (1,026,924,382 | ) | (403,717,230 | ) | ||||
NET DECREASE IN NET ASSETS RESULTING FROM | ||||||||
OPERATIONS | $ | (1,038,072,948 | ) | $ | (405,758,138 | ) | ||
* Foreign withholding taxes | $ | 115,273 | $ | — |
See Notes to Financial Statements.
THE ALGER INSTITUTIONAL FUNDS
Statements of Operations for the six months ended April 30, 2022 (Unaudited) (Continued)
Alger Mid Cap Growth Institutional Fund | Alger Small Cap Growth Institutional Fund | |||||||
INCOME: | ||||||||
Dividends | $ | 130,306 | $ | 317,738 | ||||
Interest | 280 | 995 | ||||||
Total Income | 130,586 | 318,733 | ||||||
EXPENSES: | ||||||||
Investment advisory fees — Note 3(a) | 350,308 | 1,080,912 | ||||||
Distribution fees — Note 3(c) | ||||||||
Class R | 14,836 | 19,146 | ||||||
Shareholder servicing fees — Note 3(f) | 90,135 | 173,566 | ||||||
Shareholder administrative fees — Note 3(f) | 4,609 | 13,345 | ||||||
Administration fees — Note 3(b) | 12,676 | 36,698 | ||||||
Custodian fees | 9,109 | 11,239 | ||||||
Interest expenses | 952 | 656 | ||||||
Transfer agent fees — Note 3(f) | 39,756 | 78,994 | ||||||
Printing fees | 3,726 | 15,480 | ||||||
Professional fees | 16,816 | 21,135 | ||||||
Registration fees | 55,747 | 26,830 | ||||||
Trustee fees — Note 3(g) | 1,314 | 3,978 | ||||||
Fund accounting fees | 33,706 | 42,101 | ||||||
Accrued taxes | 297 | 297 | ||||||
Other expenses | 8,832 | 8,184 | ||||||
Total Expenses | 642,819 | 1,532,561 | ||||||
Less, expense reimbursements/waivers — Note 3(a) | (9,637 | ) | — | |||||
Net Expenses | 633,182 | 1,532,561 | ||||||
NET INVESTMENT LOSS | (502,596 | ) | (1,213,828 | ) | ||||
REALIZED AND UNREALIZED GAIN (LOSS) ON INVESTMENTS AND FOREIGN CURRENCY: | ||||||||
Net rea zed ga n ( loss) on unaffi ated nvestments | (8,128,705 | ) | 13,278,565 | |||||
Net realized gain (loss) on foreign currency transactions | (197 | ) | 7,124 | |||||
Net change n unrealized (deprec at on) on unaffi ated investments | (30,702,431 | ) | (128,855,100 | ) | ||||
Net change n unrea zed (deprec at on) on affi ated investments | (165,330 | ) | (337,247 | ) | ||||
Net change in unrealized (depreciation) on foreign currency | (113 | ) | — | |||||
Net realized and unrealized (loss) on investments and foreign currency | (38,996,776 | ) | (115,906,658 | ) | ||||
NET DECREASE IN NET ASSETS RESULTING FROM OPERATIONS | $ | (39,499,372 | ) | $ | (117,120,486 | ) |
See Notes to Financial Statements.
THE ALGER INSTITUTIONAL FUNDS
Alger Capital Appreciation Institutional Fund | ||||||||
For the Six Months Ended | For the Year Ended | |||||||
April 30, 2022 | October 31, 2021 | |||||||
Net investment loss | $ | (11,148,566 | ) | $ | (23,737,965 | ) | ||
Net realized gain on investments and foreign currency | 271,662,531 | 791,432,568 | ||||||
Net change in unrealized appreciation (depreciation) on investments and foreign currency | (1,298,586,913 | ) | 440,334,204 | |||||
Net increase (decrease) in net assets resulting from operations | (1,038,072,948 | ) | 1,208,028,807 | |||||
Dividends and distributions to shareholders: | ||||||||
Class I | (363,087,549 | ) | (334,101,515 | ) | ||||
Class R | (104,193,164 | ) | (93,628,884 | ) | ||||
Class Y | (107,008,462 | ) | (77,891,544 | ) | ||||
Class Z-2 | (98,406,277 | ) | (83,783,950 | ) | ||||
Total dividends and distributions to shareholders | (672,695,452 | ) | (589,405,893 | ) | ||||
Increase (decrease) from shares of benefic a nterest transact ons: | ||||||||
Class I | 205,807,159 | (139,462,617 | ) | |||||
Class R | 64,797,103 | (38,173,960 | ) | |||||
Class Y | (4,335,899 | ) | 92,435,215 | |||||
Class Z-2 | 25,175,798 | 3,399,124 | ||||||
Net ncrease (decrease) from shares of benefic a nterest transactions — Note 6 | 291,444,161 | (81,802,238 | ) | |||||
Total increase (decrease) | (1,419,324,239 | ) | 536,820,676 | |||||
Net Assets: | ||||||||
Beginning of period | 4,186,041,653 | 3,649,220,977 | ||||||
END OF PERIOD | $ | 2,766,717,414 | $ | 4,186,041,653 |
See Notes to Financial Statements.
THE ALGER INSTITUTIONAL FUNDS
Statements of Changes in Net Assets (Unaudited) (Continued)
Alger Focus Equity Fund | ||||||||
For the Six Months Ended April 30, 2022 | For the Year Ended October 31, 2021 | |||||||
Net investment loss | $ | (2,040,908 | ) | $ | (2,905,833 | ) | ||
Net realized gain (loss) on investments, redemption-in-kind and | ||||||||
foreign currency | (4,620,162 | ) | 203,135,590 | |||||
Net change in unrealized appreciation (depreciation) on | ||||||||
investments and foreign currency | (399,097,068 | ) | 212,034,428 | |||||
Net increase (decrease) in net assets resulting from operations | (405,758,138 | ) | 412,264,185 | |||||
Dividends and distributions to shareholders: | ||||||||
Class A | (14,410,192 | ) | (5,562,411 | ) | ||||
Class C | (9,232,177 | ) | (4,078,168 | ) | ||||
Class I | (9,193,544 | ) | (4,326,616 | ) | ||||
Class Y | (23,615,638 | ) | (8,557,155 | ) | ||||
Class Z | (141,604,729 | ) | (50,310,167 | ) | ||||
Total dividends and distributions to shareholders | (198,056,280 | ) | (72,834,517 | ) | ||||
Increase (decrease) from shares of benefic a interest transact ons: | ||||||||
Class A | 7,702,060 | 4,333,928 | ||||||
Class C | 7,983,691 | (1,734,591 | ) | |||||
Class I | (1,055,714 | ) | (2,647,367 | ) | ||||
Class Y | 29,337,347 | 31,724,594 | ||||||
Class Z | 128,358,363 | 180,694,073 | ||||||
Net increase from shares of benefic a interest transact ons - Note 6 | 172,325,747 | 212,370,637 | ||||||
Total increase (decrease) | (431,488,671 | ) | 551,800,305 | |||||
Net Assets: | ||||||||
Beginning of period | 1,629,364,506 | 1,077,564,201 | ||||||
END OF PERIOD | $ | 1,197,875,835 | $ | 1,629,364,506 |
See Notes to Financial Statements.
THE ALGER INSTITUTIONAL FUNDS
Statements of Changes in Net Assets (Unaudited) (Continued)
Alger Mid Cap Growth Institutional Fund | ||||||||
For the Six Months Ended | For the Year Ended | |||||||
April 30, 2022 | October 31, 2021 | |||||||
Net investment loss | $ | (502,596 | ) | $ | (1,265,616 | ) | ||
Net realized gain (loss) on investments and foreign currency | (8,128,902 | ) | 48,753,268 | |||||
Net change in unrealized depreciation on investments and foreign currency | (30,867,874 | ) | (5,046,399 | ) | ||||
Net increase (decrease) in net assets resulting from operations | (39,499,372 | ) | 42,441,253 | |||||
Dividends and distributions to shareholders: | ||||||||
Class I | (33,226,128 | ) | (11,492,230 | ) | ||||
Class R | (3,288,321 | ) | (841,887 | ) | ||||
Class Z-2 | (10,135,108 | ) | (2,277,430 | ) | ||||
Total dividends and distributions to shareholders | (46,649,557 | ) | (14,611,547 | ) | ||||
Increase (decrease) from shares of benefic a interest transact ons: | ||||||||
Class I | 26,305,443 | (22,600,674 | ) | |||||
Class R | 3,144,826 | (94,668 | ) | |||||
Class Z-2 | 8,906,742 | 3,284,423 | ||||||
Net increase (decrease) from shares of benefic a interest transactions — Note 6 | 38,357,011 | (19,410,919 | ) | |||||
Total increase (decrease) | (47,791,918 | ) | 8,418,787 | |||||
Net Assets: | ||||||||
Beginning of period | 118,191,924 | 109,773,137 | ||||||
END OF PERIOD | $ | 70,400,006 | $ | 118,191,924 |
See Notes to Financial Statements.
THE ALGER INSTITUTIONAL FUNDS
Statements of Changes in Net Assets (Unaudited) (Continued)
Alger Small Cap Growth Institutional Fund | ||||||||
For the Six Months Ended | For the Year Ended | |||||||
April 30, 2022 | October 31, 2021 | |||||||
Net investment loss | $ | (1,213,828 | ) | $ | (3,289,096 | ) | ||
Net realized gain on investments and foreign currency | 13,285,689 | 59,633,392 | ||||||
Net change in unrealized appreciation (depreciation) on investments | (129,192,347 | ) | 22,048,878 | |||||
Net increase (decrease) in net assets resulting from operations | (117,120,486 | ) | 78,393,174 | |||||
Dividends and distributions to shareholders: | ||||||||
Class I | (28,859,482 | ) | (9,442,561 | ) | ||||
Class R | (2,153,880 | ) | (741,154 | ) | ||||
Class Z-2 | (26,627,936 | ) | (6,376,030 | ) | ||||
Total dividends and distributions to shareholders | (57,641,298 | ) | (16,559,745 | ) | ||||
Increase (decrease) from shares of benefic a interest transact ons: | ||||||||
Class I | (82,888 | ) | (6,833,467 | ) | ||||
Class R | 1,757,338 | (2,219,896 | ) | |||||
Class Z-2 | 14,674,156 | 46,607,240 | ||||||
Net increase from shares of benefic a interest transact ons - Note 6 | 16,348,606 | 37,553,877 | ||||||
Total increase (decrease) | (158,413,178 | ) | 99,387,306 | |||||
Net Assets: | ||||||||
Beginning of period | 360,464,050 | 261,076,744 | ||||||
END OF PERIOD | $ | 202,050,872 | $ | 360,464,050 |
See Notes to Financial Statements.
THE ALGER INSTITUTIONAL FUNDS
Alger Capital Appreciation Institutional Fund | Class I | |||||||||||||||||||||||
Six months ended 4/30/2022(i) | Year ended 10/31/2021 | Year ended 10/31/2020 | Year ended 10/31/2019 | Year ended 10/31/2018 | Year ended 10/31/2017 | |||||||||||||||||||
Net asset value, beginning of period | $ | 50.16 | $ | 43.16 | $ | 35.43 | $ | 34.51 | $ | 33.96 | $ | 26.44 | ||||||||||||
INCOME FROM INVESTMENT OPERATIONS: | ||||||||||||||||||||||||
Net investment loss(ii) | (0.13 | ) | (0.29 | ) | (0.14 | ) | (0.07 | ) | (0.05 | ) | – | |||||||||||||
Net realized and unrealized gain (loss) on investments | (11.24 | ) | 14.23 | 11.44 | 4.54 | 2.79 | 7.71 | |||||||||||||||||
Total from investment operations | (11.37 | ) | 13.94 | 11.30 | 4.47 | 2.74 | 7.71 | |||||||||||||||||
Distributions from net realized gains | (8.00 | ) | (6.94 | ) | (3.57 | ) | (3.55 | ) | (2.19 | ) | (0.19 | ) | ||||||||||||
Net asset value, end of period | $ | 30.79 | $ | 50.16 | $ | 43.16 | $ | 35.43 | $ | 34.51 | $ | 33.96 | ||||||||||||
Total return | (26.65 | )% | 35.72 | % | 34.58 | % | 15.20 | % | 8.46 | % | 29.38 | % | ||||||||||||
RATIOS/SUPPLEMENTAL DATA: | ||||||||||||||||||||||||
Net assets, end of period (000's omitted) | $ | 1,568,925 | $ | 2,313,493 | $ | 2,105,435 | $ | 2,028,574 | $ | 2,259,000 | $ | 2,451,822 | ||||||||||||
Ratio of gross expenses to average net assets | 1.15 | % | 1.12 | % | 1.13 | % | 1.16 | % | 1.15 | % | 1.14 | % | ||||||||||||
Ratio of expense reimbursements to average net assets | – | – | – | – | –(iii) | – | ||||||||||||||||||
Ratio of net expenses to average net assets | 1.15 | % | 1.12 | % | 1.13 | % | 1.16 | % | 1.15 | % | 1.14 | % | ||||||||||||
Ratio of net investment income (loss) to average net assets | (0.69 | )% | (0.63 | )% | (0.36 | )% | (0.21 | )% | (0.16 | )% | 0.01 | % | ||||||||||||
Portfolio turnover rate | 59.42 | % | 78.70 | % | 83.95 | % | 80.36 | % | 64.77 | % | 66.72 | % |
See Notes to Financial Statements.
(i) | Ratios have been annualized; total return and portfolio turnover rate have not been annualized. |
(ii) | Amount was computed based on average shares outstanding during the period. |
(iii) | Amount was less than 0.005% per share. |
THE ALGER INSTITUTIONAL FUNDS
Financial Highlights for a share outstanding throughout the period (Unaudited)
Alger Capital Appreciation Institutional Fund | Class R | |||||||||||||||||||||||
Six months ended 4/30/2022(i) | Year ended 10/31/2021 | Year ended 10/31/2020 | Year ended 10/31/2019 | Year ended 10/31/2018 | Year ended 10/31/2017 | |||||||||||||||||||
Net asset value, beginning of period | $ | 41.74 | $ | 37.10 | $ | 31.05 | $ | 30.83 | $ | 30.70 | $ | 24.03 | ||||||||||||
INCOME FROM INVESTMENT OPERATIONS: | ||||||||||||||||||||||||
Net investment loss(ii) | (0.17 | ) | (0.41 | ) | (0.26 | ) | (0.20 | ) | (0.19 | ) | (0.13 | ) | ||||||||||||
Net realized and unrealized gain (loss) on investments | (9.01 | ) | 11.99 | 9.88 | 3.97 | 2.51 | 6.99 | |||||||||||||||||
Total from investment operations | (9.18 | ) | 11.58 | 9.62 | 3.77 | 2.32 | 6.86 | |||||||||||||||||
Distributions from net realized gains | (8.00 | ) | (6.94 | ) | (3.57 | ) | (3.55 | ) | (2.19 | ) | (0.19 | ) | ||||||||||||
Net asset value, end of period | $ | 24.56 | $ | 41.74 | $ | 37.10 | $ | 31.05 | $ | 30.83 | $ | 30.70 | ||||||||||||
Total return | (26.80 | )% | 35.10 | % | 33.99 | % | 14.69 | % | 7.96 | % | 28.78 | % |
RATIOS/SUPPLEMENTAL DATA: |
Net assets, end of period (000's omitted) | $ | 373,031 | $ | 553,283 | $ | 520,172 | $ | 525,018 | $ | 595,010 | $ | 654,966 | ||||||||||||
Ratio of gross expenses to average net assets | 1.57 | % | 1.56 | % | 1.58 | % | 1.61 | % | 1.59 | % | 1.62 | % | ||||||||||||
Ratio of expense reimbursements to average net assets | – | – | – | – | –(iii) | – | ||||||||||||||||||
Ratio of net expenses to average net assets | 1.57 | % | 1.56 | % | 1.58 | % | 1.61 | % | 1.59 | % | 1.62 | % | ||||||||||||
Ratio of net investment loss to average net assets | (1.11 | )% | (1.07 | )% | (0.80 | )% | (0.67 | )% | (0.60 | )% | (0.48 | )% | ||||||||||||
Portfolio turnover rate | 59.42 | % | 78.70 | % | 83.95 | % | 80.36 | % | 64.77 | % | 66.72 | % |
See Notes to Financial Statements
(i) | Ratios have been annualized; total return and portfolio turnover rate have not been annualized. |
(ii) | Amount was computed based on average shares outstanding during the period. |
(iii) | Amount was less than 0.005% per share. |
THE ALGER INSTITUTIONAL FUNDS
Financial Highlights for a share outstanding throughout the period (Unaudited)
Alger Capital Appreciation Institutional Fund | Class Y | |||||||||||||||||||||||
Six months ended 4/30/2022(i) | Year ended 10/31/2021 | Year ended 10/31/2020 | Year ended 10/31/2019 | Year ended 10/31/2018 | From 2/28/2017 (commencement of operations) to 10/31/2017(ii) | |||||||||||||||||||
Net asset value, beginning of period | $ | 51.36 | $ | 43.91 | $ | 35.86 | $ | 34.75 | $ | 34.05 | $ | 28.85 | ||||||||||||
INCOME FROM INVESTMENT OPERATIONS: | ||||||||||||||||||||||||
Net investment income (loss)(iii) | (0.06 | ) | (0.13 | ) | –(iv) | 0.05 | 0.08 | 0.02 | ||||||||||||||||
Net realized and unrealized gain (loss) on investments | (11.56 | ) | 14.52 | 11.62 | 4.61 | 2.81 | 5.18 | |||||||||||||||||
Total from investment operations | (11.62 | ) | 14.39 | 11.62 | 4.66 | 2.89 | 5.20 | |||||||||||||||||
Distributions from net realized gains | (8.00 | ) | (6.94 | ) | (3.57 | ) | (3.55 | ) | (2.19 | ) | – | |||||||||||||
Net asset value, end of period | $ | 31.74 | $ | 51.36 | $ | 43.91 | $ | 35.86 | $ | 34.75 | $ | 34.05 | ||||||||||||
Total return | (26.49 | )% | 36.19 | % | 35.10 | % | 15.69 | % | 8.90 | % | 18.02 | % | ||||||||||||
RATIOS/SUPPLEMENTAL DATA: | ||||||||||||||||||||||||
Net assets, end of period (000's omitted) | $ | 415,714 | $ | 678,853 | $ | 484,362 | $ | 337,299 | $ | 166,778 | $ | 97,889 | ||||||||||||
Ratio of gross expenses to average net assets | 0.81 | % | 0.79 | % | 0.82 | % | 0.84 | % | 0.83 | % | 0.85 | % | ||||||||||||
Ratio of expense reimbursements to average net assets | (0.06 | )% | (0.04 | )% | (0.07 | )% | (0.09 | )% | (0.10 | )% | (0.10 | )% | ||||||||||||
Ratio of net expenses to average net assets | 0.75 | % | 0.75 | % | 0.75 | % | 0.75 | % | 0.73 | % | 0.75 | % | ||||||||||||
Ratio of net investment income (loss) to average net assets | (0.29 | )% | (0.27 | )% | (0.01 | )% | 0.14 | % | 0.22 | % | 0.10 | % | ||||||||||||
Portfolio turnover rate | 59.42 | % | 78.70 | % | 83.95 | % | 80.36 | % | 64.77 | % | 66.72 | % |
See Notes to Financial Statements.
(i) | Ratios have been annualized; total return and portfolio turnover rate have not been annualized. |
(ii) | Ratios have been annualized; total return has not been annualized; portfolio turnover is for the twelve months then ended. |
(iii) | Amount was computed based on average shares outstanding during the period. |
(iv) | Amount was less than 0.005 per share. |
THE ALGER INSTITUTIONAL FUNDS
Financial Highlights for a share outstanding throughout the period (Unaudited)
Alger Capital Appreciation Institutional Fund | Class Z-2 | |||||||||||||||||||||||
Six months ended 4/30/2022(i) | Year ended 10/31/2021 | Year ended 10/31/2020 | Year ended 10/31/2019 | Year ended 10/31/2018 | Year ended 10/31/2017 | |||||||||||||||||||
Net asset value, beginning of period | $ | 51.23 | $ | 43.83 | $ | 35.82 | $ | 34.74 | $ | 34.08 | $ | 26.44 | ||||||||||||
INCOME FROM INVESTMENT OPERATIONS: | ||||||||||||||||||||||||
Net investment income (loss)(ii) | (0.07 | ) | (0.14 | ) | (0.02 | ) | 0.03 | 0.06 | 0.07 | |||||||||||||||
Net realized and unrealized gain (loss) on investments | (11.53 | ) | 14.48 | 11.60 | 4.60 | 2.79 | 7.76 | |||||||||||||||||
Total from investment operations | (11.60 | ) | 14.34 | 11.58 | 4.63 | 2.85 | 7.83 | |||||||||||||||||
Distributions from net realized gains | (8.00 | ) | (6.94 | ) | (3.57 | ) | (3.55 | ) | (2.19 | ) | (0.19 | ) | ||||||||||||
Net asset value, end of period | $ | 31.63 | $ | 51.23 | $ | 43.83 | $ | 35.82 | $ | 34.74 | $ | 34.08 | ||||||||||||
Total return | (26.53 | ) | 36.13 | % | 35.02 | % | 15.56 | % | 8.80 | % | 29.83 | % | ||||||||||||
RATIOS/SUPPLEMENTAL DATA: | ||||||||||||||||||||||||
Net assets, end of period (000's omitted) | $ | 409,046 | $ | 640,412 | $ | 539,253 | $ | 464,636 | $ | 463,046 | $ | 436,145 | ||||||||||||
Ratio of gross expenses to average net assets | 0.81 | % | 0.79 | % | 0.82 | % | 0.83 | % | 0.82 | % | 0.84 | % | ||||||||||||
Ratio of expense reimbursements to average net assets | – | – | – | – | –(iii) | – | ||||||||||||||||||
Ratio of net expenses to average net assets | 0.81 | % | 0.79 | % | 0.82 | % | 0.83 | % | 0.82 | % | 0.84 | % | ||||||||||||
Ratio of net investment income (loss) to average net assets | (0.35 | )% | (0.31 | )% | (0.05 | )% | 0.10 | % | 0.16 | % | 0.22 | % | ||||||||||||
Portfolio turnover rate | 59.42 | % | 78.70 | % | 83.95 | % | 80.36 | % | 64.77 | % | 66.72 | % |
See Notes to Financial Statements.
(i) | Ratios have been annualized; total return and portfolio turnover rate have not been annualized. |
(ii) | Amount was computed based on average shares outstanding during the period. |
(iii) | Amount was less than 0.005% per share. |
THE ALGER INSTITUTIONAL FUNDS
Financial Highlights for a share outstanding throughout the period (Unaudited)
Alger Focus Equity Fund | Class A | |||||||||||||||||||||||
Six months ended 4/30/2022(i) | Year ended 10/31/2021 | | Year ended 10/31/2020 | | Year ended 10/31/2019 | | Year ended 10/31/2018 | | Year ended 10/31/2017 | | ||||||||||||||
Net asset value, beginning of period | $ | 65.10 | $ | 50.77 | $ | 37.33 | $ | 34.00 | $ | 31.74 | $ | 23.95 | ||||||||||||
INCOME FROM INVESTMENT OPERATIONS: | ||||||||||||||||||||||||
Net investment income (loss)(ii) | (0.14 | ) | (0.25 | ) | (0.07 | ) | –(iii) | (0.06 | ) | 0.01 | ||||||||||||||
Net realized and unrealized gain (loss) on investments | (14.32 | ) | 17.97 | 14.29 | 4.95 | 3.55 | 7.78 | |||||||||||||||||
Total from investment operations | (14.46 | ) | 17.72 | 14.22 | 4.95 | 3.49 | 7.79 | |||||||||||||||||
Dividends from net investment income | – | – | (0.02 | ) | – | – | – | |||||||||||||||||
Distributions from net realized gains | (7.96 | ) | (3.39 | ) | (0.76 | ) | (1.62 | ) | (1.23 | ) | – | |||||||||||||
Net asset value, end of period | $ | 42.68 | $ | 65.10 | $ | 50.77 | $ | 37.33 | $ | 34.00 | $ | 31.74 | ||||||||||||
Total return(iv) | (25.17 | )% | 36.37 | % | 38.75 | % | 15.56 | % | 11.33 | % | 32.53 | % | ||||||||||||
RATIOS/SUPPLEMENTAL DATA: | ||||||||||||||||||||||||
Net assets, end of period (000's omitted) | $ | 83,219 $ | $ | 118,641 | $ | 89,028 | 53,533 | $ | 43,621 | $ | 23,693 | |||||||||||||
Ratio of gross expenses to average net assets | 0.94 | % | 0.92 | % | 0.95 | % | 1.00 | % | 1.03 | % | 1.11 | % | ||||||||||||
Ratio of net expenses to average net assets | 0.94 | % | 0.92 | % | 0.95 | % | 1.00 | % | 1.03 | % | 1.11 | % |
Ratio of net investment income (loss) to average net assets | (0.53 | )% | (0.43 | )% | (0.16 | )% | (0.01 | )% | (0.17 | )% | 0.03 | % | ||||||||||||
Portfolio turnover rate(v) | 65.40 | % | 107.82 | % | 99.52 | % | 134.50 | % | 135.54 | % | 98.57 | % |
See Notes to Financial Statements.
(i) | Ratios have been annualized; total return and portfolio turnover rate have not been annualized. |
(ii) | Amount was computed based on average shares outstanding during the period. |
(iii) | Amount was less than 0.005 per share. |
(iv) | Does not reflect the effect of sales charges, if applicable. |
(v) | Portfolio turnover excludes the value of portfolio securities received or delivered as a result of in-kind fund share transactions. |
THE ALGER INSTITUTIONAL FUNDS
Financial Highlights for a share outstanding throughout the period (Unaudited)
Alger Focus Equity Fund | Class C | |||||||||||||||||||||||
Six months ended 4/30/2022(i) | Year ended 10/31/2021 | Year ended 10/31/2020 | Year ended 10/31/2019 | Year ended 10/31/2018 | Year ended 10/31/2017 | |||||||||||||||||||
Net asset value, beginning of period | $ | 60.35 | $ | 47.63 | $ | 35.30 | $ | 32.47 | $ | 30.59 | $ | 23.27 | ||||||||||||
INCOME FROM INVESTMENT OPERATIONS: | ||||||||||||||||||||||||
Net investment loss(ii) | (0.31 | ) | (0.65 | ) | (0.38 | ) | (0.26 | ) | (0.31 | ) | (0.21 | ) | ||||||||||||
Net realized and unrealized gain (loss) on investments | (13.11 | ) | 16.76 | 13.47 | 4.71 | 3.42 | 7.53 | |||||||||||||||||
Total from investment operations | (13.42 | ) | 16.11 | 13.09 | 4.45 | 3.11 | 7.32 | |||||||||||||||||
Distributions from net realized gains | (7.96 | ) | (3.39 | ) | (0.76 | ) | (1.62 | ) | (1.23 | ) | – | |||||||||||||
Net asset value, end of period | $ | 38.97 | $ | 60.35 | $ | 47.63 | $ | 35.30 | $ | 32.47 | $ | 30.59 |
Total return(iii) | (25.46 | )% | 35.33 | % | 37.73 | % | 14.68 | % | 10.51 | % | 31.46 | % | ||||||||||||
RATIOS/SUPPLEMENTAL DATA: | ||||||||||||||||||||||||
Net assets, end of period (000's omitted) | $ | 51,624 | $ | 70,664 | $ | 57,067 | $ | 37,169 | $ | 26,366 | $ | 18,660 | ||||||||||||
Ratio of gross expenses to average net assets | 1.70 | % | 1.68 | % | 1.71 | % | 1.75 | % | 1.80 | % | 1.90 | % | ||||||||||||
Ratio of net expenses to average net assets | 1.70 | % | 1.68 | % | 1.71 | % | 1.75 | % | 1.80 | % | 1.90 | % | ||||||||||||
Ratio of net investment loss to average net assets | (1.29 | )% | (1.19 | )% | (0.91 | )% | (0.77 | )% | (0.93 | )% | (0.79 | )% | ||||||||||||
Portfolio turnover rate(iv) | 65.40 | % | 107.82 | % | 99.52 | % | 134.50 | % | 135.54 | % | 98.57 | % |
See Notes to Financial Statements.
(i) | Ratios have been annualized; total return and portfolio turnover rate have not been annualized. |
(ii) | Amount was computed based on average shares outstanding during the period. |
(iii) | Does not reflect the effect of sales charges, if applicable. |
(iv) | Portfolio turnover excludes the value of portfolio securities received or delivered as a result of in-kind fund share transactions |
THE ALGER INSTITUTIONAL FUNDS
Financial Highlights for a share outstanding throughout the period (Unaudited)
Alger Focus Equity Fund | Class I | |||||||||||||||||||||||
Six months ended 4/30/2022(i) | Year ended 10/31/2021 | Year ended 10/31/2020 | Year ended 10/31/2019 | Year ended 10/31/2018 | Year ended 10/31/2017 | |||||||||||||||||||
Net asset value, beginning of period | $ | 65.54 | $ | 51.07 | $ | 37.56 | $ | 34.17 | $ | 31.88 | $ | 24.06 | ||||||||||||
INCOME FROM INVESTMENT OPERATIONS: | ||||||||||||||||||||||||
Net investment income (loss)(ii) | (0.12 | ) | (0.23 | ) | (0.03 | ) | 0.01 | (0.05 | ) | 0.01 | ||||||||||||||
Net realized and unrealized gain (loss) on investments | (14.45 | ) | 18.09 | 14.37 | 5.00 | 3.57 | 7.81 | |||||||||||||||||
Total from investment operations | (14.57 | ) | 17.86 | 14.34 | 5.01 | 3.52 | 7.82 | |||||||||||||||||
Dividends from net investment income | – | –(iii) | (0.07 | ) | – | – | – | |||||||||||||||||
Distributions from net realized gains | (7.96 | ) | (3.39 | ) | (0.76 | ) | (1.62 | ) | (1.23 | ) | – | |||||||||||||
Net asset value, end of period | $ | 43.01 | $ | 65.54 | $ | 51.07 | $ | 37.56 | $ | 34.17 | $ | 31.88 | ||||||||||||
Total return(iv) | (25.17 | )% | 36.44 | % | 38.81 | % | 15.66 | % | 11.40 | % | 32.50 | % | ||||||||||||
RATIOS/SUPPLEMENTAL DATA: | ||||||||||||||||||||||||
Net assets, end of period (000's omitted) | $ | 50,392 | $ | 77,895 | $ | 63,658 | $ | 68,705 | $ | 37,070 | $ | 23,952 | ||||||||||||
Ratio of gross expenses to average net assets | 0.91 | % | 0.89 | % | 0.93 | % | 0.96 | % | 1.02 | % | 1.12 | % | ||||||||||||
Ratio of expense reimbursements to average net assets | – | (0.01 | )% | (0.04 | )% | (0.04 | )% | (0.02 | )% | – | ||||||||||||||
Ratio of net expenses to average net assets | 0.91 | % | 0.88 | % | 0.89 | % | 0.92 | % | 1.00 | % | 1.12 | % | ||||||||||||
Ratio of net investment income (loss) to average net assets | (0.43 | )% | (0.39 | )% | (0.06 | )% | 0.04 | % | (0.13 | )% | 0.02 | % | ||||||||||||
Portfolio turnover rate(v) | 65.40 | % | 99.52 | % | 134.50 | % | 135.54 | % | 98.57 | % |
See Notes to Financial Statements.
(i) | Ratios have been annualized; total return and portfolio turnover rate have not been annualized. |
(ii) | Amount was computed based on average shares outstanding during the period. |
(iii) | Amount was less than 0.005 per share. |
(iv) | Does not reflect the effect of sales charges, if applicable. |
(v) | Portfolio turnover excludes the value of portfolio securities received or delivered as a result of in-kind fund share transactions. |
THE ALGER INSTITUTIONAL FUNDS
Financial Highlights for a share outstanding throughout the period (Unaudited)
Alger Focus Equity Fund | Class Y | |||||||||||||||||||||||
Six months ended 4/30/2022(i) | Year ended 10/31/2021 | Year ended 10/31/2020 | Year ended 10/31/2019 | Year ended 10/31/2018 | From 2/28/2017 (commencement of operations) to 10/31/2017(ii) | |||||||||||||||||||
Net asset value, beginning of period | $ | 67.15 | $ | 52.12 | $ | 38.29 | $ | 34.79 | $ | 32.33 | $ | 26.86 | ||||||||||||
INCOME FROM INVESTMENT OPERATIONS: | ||||||||||||||||||||||||
Net investment income (loss)(iii) | (0.05 | ) | (0.06 | ) | 0.07 | 0.12 | 0.04 | (0.01 | ) | |||||||||||||||
Net realized and unrealized gain (loss) on investments | (14.85 | ) | 18.50 | 14.65 | 5.08 | 3.65 | 5.48 | |||||||||||||||||
Total from investment operations | (14.90 | ) | 18.44 | 14.72 | 5.20 | 3.69 | 5.47 | |||||||||||||||||
Dividends from net investment income | – | (0.02 | ) | (0.13 | ) | (0.08 | ) | – | – | |||||||||||||||
Distributions from net realized gains | (7.96 | ) | (3.39 | ) | (0.76 | ) | (1.62 | ) | (1.23 | ) | – | |||||||||||||
Net asset value, end of period | $ | 44.29 | $ | 67.15 | $ | 52.12 | $ | 38.29 | $ | 34.79 | $ | 32.33 | ||||||||||||
Total return(iv) | (25.04 | )% | 36.84 | % | 39.17 | % | 15.97 | % | 11.78 | % | 20.36 | % | ||||||||||||
RATIOS/SUPPLEMENTAL DATA: | ||||||||||||||||||||||||
Net assets, end of period (000's omitted) | $ | 150,908 | $ | 194,908 | $ | 121,688 | $ | 69,175 | $ | 57,880 | $ | 4,319 | ||||||||||||
Ratio of gross expenses to average net assets | 0.61 | % | 0.61 | % | 0.63 | % | 0.66 | % | 0.70 | % | 1.51 | % | ||||||||||||
Ratio of expense reimbursements to average net assets | (0.03 | )% | (0.03 | )% | – | (0.01 | )% | (0.05 | )% | (0.86 | )% | |||||||||||||
Ratio of net expenses to average net assets | 0.58 | % | 0.58 | % | 0.63 | % | 0.65 | % | 0.65 | % | 0.65 | % | ||||||||||||
Ratio of net investment income (loss) to average net assets | (0.17 | )% | (0.10 | )% | 0.16 | % | 0.34 | % | 0.11 | % | (0.05 | )% | ||||||||||||
Portfolio turnover rate(v) | 65.40 | % | 107.82 | % | 99.52 | % | 134.50 | % | 135.54 | % | 98.57 | % |
See Notes to Financial Statements.
(i) | Ratios have been annualized; total return and portfolio turnover rate have not been annualized. |
(ii) | Ratios have been annualized; total return has not been annualized; portfolio turnover is for the twelve months then ended. |
(iii) | Amount was computed based on average shares outstanding during the period. |
(iv) | Does not reflect the effect of sales charges, if applicable. |
(v) | Portfolio turnover excludes the value of portfolio securities received or delivered as a result of in-kind fund share transactions. |
THE ALGER INSTITUTIONAL FUNDS
Financial Highlights for a share outstanding throughout the period (Unaudited)
Alger Focus Equity Fund | Class Z | |||||||||||||||||||||||
Six months ended 4/30/2022(i) | Year ended 10/31/2021 | Year ended 10/31/2020 | Year ended 10/31/2019 | Year ended 10/31/2018 | Year ended 10/31/2017 | |||||||||||||||||||
Net asset value, beginning of period | $ | 67.00 | $ | 52.02 | $ | 38.21 | $ | 34.73 | $ | 32.28 | $ | 24.30 | ||||||||||||
INCOME FROM INVESTMENT OPERATIONS: | ||||||||||||||||||||||||
Net investment income (loss)(ii) | (0.06 | ) | (0.08 | ) | 0.06 | 0.11 | 0.05 | 0.07 | ||||||||||||||||
Net realized and unrealized gain (loss) on investments | (14.81 | ) | 18.47 | 14.64 | 5.07 | 3.63 | 7.91 | |||||||||||||||||
Total from investment operations | (14.87 | ) | 18.39 | 14.70 | 5.18 | 3.68 | 7.98 | |||||||||||||||||
Dividends from net investment income | – | (0.02 | ) | (0.13 | ) | (0.08 | ) | – | – | |||||||||||||||
Distributions from net realized gains | (7.96 | ) | (3.39 | ) | (0.76 | ) | (1.62 | ) | (1.23 | ) | – | |||||||||||||
Net asset value, end of period | $ | 44.17 | $ | 67.00 | $ | 52.02 | 38.21 | $ | 34.73 | $ | 32.28 | |||||||||||||
Total return(iii) | (25.06 | )% | 36.81 | % | 39.20 | % | 15.93 | % | 11.74 | % | 32.84 | % | ||||||||||||
RATIOS/SUPPLEMENTAL DATA: | ||||||||||||||||||||||||
Net assets, end of period (000's omitted) | $ | 861,734 $ | 1,167,256 | $ | 746,122 | $ | 351,530 | $ | 172,900 | $ | 61,721 | |||||||||||||
Ratio of gross expenses to average net assets | 0.61 | % | 0.61 | % | 0.63 | % | 0.66 | % | 0.71 | % | 0.84 | % | ||||||||||||
Ratio of expense reimbursements to average net assets | – | – | – | – | (0.02 | )% | – | |||||||||||||||||
Ratio of net expenses to average net assets | 0.61 | % | 0.61 | % | 0.63 | % | 0.66 | % | 0.69 | % | 0.84 | % | ||||||||||||
Ratio of net investment income (loss) to average net assets | (0.20 | )% | (0.13 | )% | 0.13 | % | 0.29 | % | 0.15 | % | 0.25 | % | ||||||||||||
Portfolio turnover rate(iv) | 65.40 | % | 107.82 | % | 99.52 | % | 134.50 | % | 135.54 | % | 98.57 | % |
See Notes to Financial Statements.
(i) | Ratios have been annualized; total return and portfolio turnover rate have not been annualized. |
(ii) | Amount was computed based on average shares outstanding during the period. |
(iii) | Does not reflect the effect of sales charges, if applicable. |
(iv) | Portfolio turnover excludes the value of portfolio securities received or delivered as a result of in-kind fund share transactions. |
THE ALGER INSTITUTIONAL FUNDS
Financial Highlights for a share outstanding throughout the period (Unaudited)
Alger Mid Cap Growth Institutional Fund | Class I | |||||||||||||||||||||||
Six months ended 4/30/2022(i) | Year ended 10/31/2021 | | Year ended 10/31/2020 | Year ended 10/31/2019 | Year ended 10/31/2018 | | Year ended 10/31/2017 | |||||||||||||||||
Net asset value, beginning of period | $ | 50.80 | $ | 40.47 | $ | 31.04 | $ | 30.20 | $ | 28.65 | $ | 21.59 | ||||||||||||
INCOME FROM INVESTMENT OPERATIONS: | ||||||||||||||||||||||||
Net investment loss(ii) | (0.15 | ) | (0.45 | ) | (0.27 | ) | (0.21 | ) | (0.25 | ) | (0.13 | ) | ||||||||||||
Net realized and unrealized gain (loss) on investments | (12.30 | ) | 16.11 | 12.27 | 3.03 | 1.80 | 7.19 | |||||||||||||||||
Total from investment operations | (12.45 | ) | 15.66 | 12.00 | 2.82 | �� | 1.55 | 7.06 | ||||||||||||||||
Distributions from net realized gains | (19.85 | ) | (5.33 | ) | (2.57 | ) | (1.98 | ) | – | – | ||||||||||||||
Net asset value, end of period | $ | 18.50 | $ | 50.80 | $ | 40.47 | $ | 31.04 | $ | 30.20 | $ | 28.65 | ||||||||||||
Total return | (34.74 | )% | 41.08 | % | 41.71 | % | 10.76 | % | 5.44 | % | 32.70 | % |
RATIOS/SUPPLEMENTAL DATA: | ||||||||||||||||||||||||
Net assets, end of period (000's omitted) | $ | 50,081 | $ | 85,297 | $ | 86,228 | $ | 73,274 | $ | 79,954 | $ | 85,890 | ||||||||||||
Ratio of gross expenses to average net assets | 1.44 | % | 1.27 | % | 1.35 | % | 1.35 | % | 1.34 | % | 1.28 | % | ||||||||||||
Ratio of net expenses to average net assets | 1.44 | % | 1.27 | % | 1.35 | % | 1.35 | % | 1.34 | % | 1.28 | % | ||||||||||||
Ratio of net investment loss to average net assets | (1.16 | )% | (0.97 | )% | (0.80 | )% | (0.70 | )% | (0.80 | )% | (0.50 | )% | ||||||||||||
Portfolio turnover rate | 126.78 | % | 171.43 | % | 180.30 | % | 182.64 | % | 127.57 | % | 157.49 | % |
See Notes to Financial Statements.
(i) | Ratios have been annualized; total return and portfolio turnover rate have not been annualized. |
(ii) | Amount was computed based on average shares outstanding during the period. |
THE ALGER INSTITUTIONAL FUNDS
Financial Highlights for a share outstanding throughout the period (Unaudited)
Alger Mid Cap Growth Institutional Fund | Class R | |||||||||||||||||||||||
Six months ended 4/30/2022(i) | Year ended 10/31/2021 | Year ended 10/31/2020 | Year ended 10/31/2019 | Year ended 10/31/2018 | Year ended 10/31/2017 | |||||||||||||||||||
Net asset value, beginning of period | $ | 44.37 | $ | 36.07 | $ | 28.06 | $ | 27.64 | $ | 26.35 | $ | 19.96 | ||||||||||||
INCOME FROM INVESTMENT OPERATIONS: | ||||||||||||||||||||||||
Net investment loss(ii) | (0.16 | ) | (0.59 | ) | (0.36 | ) | (0.32 | ) | (0.36 | ) | (0.24 | ) | ||||||||||||
Net realized and unrealized gain (loss) on investments | (10.09 | ) | 14.22 | 10.94 | 2.72 | 1.65 | 6.63 | |||||||||||||||||
Total from investment operations | (10.25 | ) | 13.63 | 10.58 | 2.40 | 1.29 | 6.39 | |||||||||||||||||
Distributions from net realized gains | (19.85 | ) | (5.33 | ) | (2.57 | ) | (1.98 | ) | – | – | ||||||||||||||
Net asset value, end of period | $ | 14.27 | $ | 44.37 | $ | 36.07 | $ | 28.06 | $ | 27.64 | $ | 26.35 |
Total return | (34.89 | )% | 40.42 | % | 41.03 | % | 10.24 | % | 4.90 | % | 32.01 | % | ||||||||||||
RATIOS/SUPPLEMENTAL DATA: | ||||||||||||||||||||||||
Net assets, end of period (000's omitted) | $ | 4,729 | $ | 7,426 | $ | 6,093 | $ | 7,952 | $ | 10,672 | $ | 12,943 | ||||||||||||
Ratio of gross expenses to average net assets | 1.87 | % | 1.75 | % | 1.83 | % | 1.85 | % | 1.82 | % | 1.81 | % | ||||||||||||
Ratio of net expenses to average net assets | 1.87 | % | 1.75 | % | 1.83 | % | 1.85 | % | 1.82 | % | 1.81 | % | ||||||||||||
Ratio of net investment loss to average net assets | (1.59 | )% | (1.46 | )% | (1.22 | )% | (1.18 | )% | (1.28 | )% | (1.04 | )% | ||||||||||||
Portfolio turnover rate | 126.78 | % | 171.43 | % | 180.30 | % | 182.64 | % | 127.57 | % | 157.49 | % |
See Notes to Financial Statements.
(i) | Ratios have been annualized; total return and portfolio turnover rate have not been annualized. |
(ii) | Amount was computed based on average shares outstanding during the period. |
THE ALGER INSTITUTIONAL FUNDS
Financial Highlights for a share outstanding throughout the period (Unaudited)
Alger Mid Cap Growth Institutional Fund | Class Z-2 | |||||||||||||||||||||||
Six months ended 4/30/2022(i) | Year ended 10/31/2021 | Year ended 10/31/2020 | Year ended 10/31/2019 | Year ended 10/31/2018 | Year ended 10/31/2017 | |||||||||||||||||||
Net asset value, beginning of period | $ | 51.68 | $ | 40.99 | $ | 31.31 | $ | 30.36 | $ | 28.72 | $ | 21.59 | ||||||||||||
INCOME FROM INVESTMENT OPERATIONS: | ||||||||||||||||||||||||
Net investment loss(ii) | (0.10 | ) | (0.32 | ) | (0.16 | ) | (0.12 | ) | (0.17 | ) | (0.08 | ) | ||||||||||||
Net realized and unrealized gain (loss) on investments | (12.60 | ) | 16.34 | 12.41 | 3.05 | 1.81 | 7.21 | |||||||||||||||||
Total from investment operations | (12.70 | ) | 16.02 | 12.25 | 2.93 | 1.64 | 7.13 | |||||||||||||||||
Distributions from net realized gains | (19.85 | ) | (5.33 | ) | (2.57 | ) | (1.98 | ) | – | – | ||||||||||||||
Net asset value, end of period | $ | 19.13 | $ | 51.68 | $ | 40.99 | $ | 31.31 | $ | 30.36 | $ | 28.72 | ||||||||||||
Total return | (34.59 | )% | 41.50 | % | 42.18 | % | 11.08 | % | 5.74 | % | 33.02 | % |
RATIOS/SUPPLEMENTAL DATA: | ||||||||||||||||||||||||
Net assets, end of period (000's omitted) | $ | 15,590 $ | 25,469 | $ | 17,452 | $ | 12,409 | $ | 11,316 | $ | 8,810 | |||||||||||||
Ratio of gross expenses to average net assets | 1.09 | % | 0.97 | % | 1.05 | % | 1.09 | % | 1.08 | % | 1.14 | % | ||||||||||||
Ratio of expense reimbursements to average net assets | (0.10 | )% | – | (0.01 | )% | (0.04 | )% | (0.03 | )% | (0.09 | )% | |||||||||||||
Ratio of net expenses to average net assets | 0.99 | % | 0.97 | % | 1.04 | % | 1.05 | % | 1.05 | % | 1.05 | % | ||||||||||||
Ratio of net investment loss to average net assets | (0.71 | )% | (0.68 | )% | (0.48 | )% | (0.40 | )% | (0.53 | )% | (0.31 | )% | ||||||||||||
Portfolio turnover rate | 126.78 | % | 171.43 | % | 180.30 | % | 182.64 | % | 127.57 | % | 157.49 | % |
See Notes to Financial Statements.
(i) | Ratios have been annualized; total return and portfolio turnover rate have not been annualized. |
(ii) | Amount was computed based on average shares outstanding during the period. |
THE ALGER INSTITUTIONAL FUNDS
Financial Highlights for a share outstanding throughout the period (Unaudited)
Alger Mid Cap Growth Institutional Fund | Class I | |||||||||||||||||||||||
Six months ended 4/30/2022(i) | Year ended 10/31/2021 | Year ended 10/31/2020 | Year ended 10/31/2019 | Year ended 10/31/2018 | Year ended 10/31/2017 | |||||||||||||||||||
Net asset value, beginning of period | $ | 31.70 | $ | 25.77 | $ | 21.49 | $ | 22.53 | $ | 20.52 | $ | 14.83 | ||||||||||||
INCOME FROM INVESTMENT OPERATIONS: | ||||||||||||||||||||||||
Net investment loss(ii) | (0.12 | ) | (0.32 | ) | (0.24 | ) | (0.25 | ) | (0.22 | ) | (0.14 | ) | ||||||||||||
Net realized and unrealized gain (loss) on investments | (9.62 | ) | 7.80 | 8.32 | 1.95 | 2.81 | 5.83 | |||||||||||||||||
Total from investment operations | (9.74 | ) | 7.48 | 8.08 | 1.70 | 2.59 | 5.69 | |||||||||||||||||
Dividends from net investment income | – | – | (0.03 | ) | – | – | – | |||||||||||||||||
Distributions from net realized gains | (5.36 | ) | (1.55 | ) | (3.77 | ) | (2.74 | ) | (0.58 | ) | – | |||||||||||||
Net asset value, end of period | $ | 16.60 | $ | 31.70 | $ | 25.77 | $ | 21.49 | $ | 22.53 | $ | 20.52 | ||||||||||||
Total return | (34.99 | )% | 29.64 | % | 44.12 | % | 10.20 | % | 12.96 | % | 38.37 | % |
RATIOS/SUPPLEMENTAL DATA: | ||||||||||||||||||||||||
Net assets, end of period (000's omitted) | $ | 94,510 | $ | 180,795 | $ | 152,183 | $ | 95,853 | $ | 132,526 | $ | 130,527 | ||||||||||||
Ratio of gross expenses to average net assets | 1.30 | % | 1.24 | % | 1.30 | % | 1.35 | % | 1.32 | % | 1.32 | % | ||||||||||||
Ratio of net expenses to average net assets | 1.30 | % | 1.24 | % | 1.30 | % | 1.35 | % | 1.32 | % | 1.32 | % | ||||||||||||
Ratio of net investment loss to average net assets | (1.07 | )% | (1.04 | )% | (1.10 | )% | (1.16 | )% | (1.00 | )% | (0.77 | )% | ||||||||||||
Portfolio turnover rate | 11.38 | % | 41.10 | % | 23.78 | % | 14.93 | % | 28.20 | % | 29.70 | % |
See Notes to Financial Statements.
(i) | Ratios have been annualized; total return and portfolio turnover rate have not been annualized |
(ii) | Amount was computed based on average shares outstanding during the period. |
THE ALGER INSTITUTIONAL FUNDS
Financial Highlights for a share outstanding throughout the period (Unaudited)
Alger Mid Cap Growth Institutional Fund | Class R | |||||||||||||||||||||||
Six months ended 4/30/2022(i) | Year ended 10/31/2021 | Year ended 10/31/2020 | Year ended 10/31/2019 | Year ended 10/31/2018 | Year ended 10/31/2017 | |||||||||||||||||||
Net asset value, beginning of period | $ | 24.00 | $ | 19.92 | $ | 17.48 | $ | 18.97 | $ | 17.44 | $ | 12.67 | ||||||||||||
INCOME FROM INVESTMENT OPERATIONS: | ||||||||||||||||||||||||
Net investment loss(ii) | (0.11 | ) | (0.35 | ) | (0.27 | ) | (0.28 | ) | (0.27 | ) | (0.19 | ) | ||||||||||||
Net realized and unrealized gain (loss) on investments | (6.96 | ) | �� | 5.98 | 6.48 | 1.53 | 2.38 | 4.96 | ||||||||||||||||
Total from investment operations | (7.07 | ) | 5.63 | 6.21 | 1.25 | 2.11 | 4.77 | |||||||||||||||||
Distributions from net realized gains | (5.36 | ) | (1.55 | ) | (3.77 | ) | (2.74 | ) | (0.58 | ) | – | |||||||||||||
Net asset value, end of period | $ | 11.57 | $ | 24.00 | $ | 19.92 | $ | 17.48 | $ | 18.97 | $ | 17.44 |
Total return | (35.11 | )% | 29.02 | % | 43.38 | % | 9.67 | % | 12.48 | % | 37.65 | % | ||||||||||||
RATIOS/SUPPLEMENTAL DATA: | ||||||||||||||||||||||||
Net assets, end of period (000's omitted) | $ | 6,008 $ | 9,751 | $ | 9,940 | $ | 8,690 | $ | 9,238 | $ | 11,253 | |||||||||||||
Ratio of gross expenses to average net assets | 1.71 | % | 1.73 | % | 1.80 | % | 1.81 | % | 1.77 | % | 1.82 | % | ||||||||||||
Ratio of net expenses to average net assets | 1.71 | % | 1.73 | % | 1.80 | % | 1.81 | % | 1.77 | % | 1.82 | % | ||||||||||||
Ratio of net investment loss to average net assets | (1.47)% | (1.51 | )% | (1.58 | )% | (1.63 | )% | (1.44 | )% | (1.27 | )% | |||||||||||||
Portfolio turnover rate | 11.38 | % | 41.10 | % | 23.78 | % | 14.93 | % | 28.20 | % | 29.70 | % |
See Notes to Financial Statements.
(i) | Ratios have been annualized; total return and portfolio turnover rate have not been annualized. |
(ii) | Amount was computed based on average shares outstanding during the period. |
Alger Mid Cap Growth Institutional Fund | Class Z-2 | |||||||||||||||||||||||
Six months ended 4/30/2022(i) | Year ended 10/31/2021 | Year ended 10/31/2020 | Year ended 10/31/2019 | Year ended 10/31/2018 | Year ended 10/31/2017 | |||||||||||||||||||
$ | 32.23 | $ | 26.10 | $ | 21.76 | $ | 22.70 | $ | 20.60 | $ | 14.84 | |||||||||||||
INCOME FROM INVESTMENT OPERATIONS: | ||||||||||||||||||||||||
Net investment loss(ii) | (0.08 | ) | (0.24 | ) | (0.18 | ) | (0.17 | ) | (0.15 | ) | (0.09 | ) | ||||||||||||
Net realized and unrealized gain (loss) on investments | (9.82 | ) | 7.92 | 8.42 | 1.97 | 2.83 | 5.85 | |||||||||||||||||
Total from investment operations | (9.90 | ) | 7.68 | 8.24 | 1.80 | 2.68 | 5.76 | |||||||||||||||||
Dividends from net investment income | – | – | (0.13 | ) | – | – | – | |||||||||||||||||
Distributions from net realized gains | (5.36 | ) | (1.55 | ) | (3.77 | ) | (2.74 | ) | (0.58 | ) | – | |||||||||||||
Net asset value, end of period | $ | 16.97 | $ | 32.23 | $ | 26.10 | $ | 21.76 | $ | 22.70 | $ | 20.60 |
Total return | (34.89 | )% | 30.05 | % | 44.55 | % | 10.61 | % | 13.35 | % | 38.81 | % | ||||||||||||
RATIOS/SUPPLEMENTAL DATA: | ||||||||||||||||||||||||
Net assets, end of period (000's omitted) | $ | 101,532 | $ | 169,918 | $ | 98,954 | $ | 47,863 | $ | 49,552 | $ | 67,268 | ||||||||||||
Ratio of gross expenses to average net assets | 0.95 | % | 0.94 | % | 0.99 | % | 1.02 | % | 1.00 | % | 1.03 | % | ||||||||||||
Ratio of expense reimbursements to average net assets | – | – | (0.01 | )% | (0.03 | )% | (0.01 | )% | (0.04 | )% | ||||||||||||||
Ratio of net expenses to average net assets | 0.95 | % | 0.94 | % | 0.98 | % | 0.99 | % | 0.99 | % | 0.99 | % |
Ratio of net investment loss to average net assets | (0.71 | )% | (0.76 | )% | (0.79)%` | (0.81 | )% | (0.66 | )% | (0.51 | )% | |||||||||||||
Portfolio turnover rate | 11.38 | % | 41.10 | % | 23.78 | % | 14.93 | % | 28.20 | % | 29.70 | % |
See Notes to Financial Statements.
(i) | Ratios have been annualized; total return and portfolio turnover rate have not been annualized. |
(ii) | Amount was computed based on average shares outstanding during the period. |
The Alger Institutional Funds (the “Trust”) is an open-end registered investment company organized as a business trust under the laws of the Commonwealth of Massachusetts. The Trust qualifies as an investment company as defined in Financial Accounting Standards Board ("FASB") Accounting Standards Codification 946 - Financial Services - Investment Companies. The Trust operates as a series company currently offering an unlimited number of shares of beneficial interest in four series - Alger Capital Appreciation Institutional Fund, Alger Focus Equity Fund, Alger Mid Cap Growth Institutional Fund and Alger Small Cap Growth Institutional Fund (collectively, the “Funds” or individually, each a “Fund”). The Funds normally invest primarily in equity securities and each has an investment objective of long-term capital appreciation.
Each Fund offers one or more of the following share classes: Class A, C, I, R, Y, Z and Z-2. Class A shares are generally subject to an initial sales charge while Class C shares are generally subject to a deferred sales charge. Class I, R, Y, Z and Z-2 shares are sold to institutional investors without an initial or deferred sales charge and Class Y, Z and Z-2 shares are generally subject to a minimum initial investment of $500,000. Class C shares will automatically convert to Class A shares on the fifth business day of the month following the eighth anniversary of the purchase date of a shareholder’s Class C shares, without the imposition of any sales load, fee or other charge. Class C shares held at certain dealers may not convert to Class A shares or may be converted on a different schedule. At conversion, a proportionate amount of shares representing reinvested dividends and distributions will also be converted into Class A shares. Each class has identical rights to assets and earnings, except that each share class bears the pro rata allocation of the Fund's expenses other than a class expense (not including advisory or custodial fees or other expenses related to the management of the Fund’s assets).
NOTE 2 - Significant Accounting Policies: |
(a) Investment Valuation: The Funds value their financial instruments at fair value using independent dealers or pricing services under policies approved by the Trust’s Board of Trustees (the “Board”). Investments held by the Funds are valued on each day the New York Stock Exchange (the "NYSE") is open, as of the close of the NYSE (normally 4:00
p.m. Eastern Time).
Investments in money market funds and short-term securities held by the Funds having a remaining maturity of sixty days or less are valued at amortized cost which approximates market value.
Equity securities, including traded rights, warrants and option contracts for which valuation information is readily available, are valued at the last quoted sales price or official closing price on the primary market or exchange on which they are traded as reported by an independent pricing service. In the absence of quoted sales, such securities are valued at the bid price or, in the absence of a recent bid price, the equivalent as obtained from one or more of the major market makers for the securities to be valued.
THE ALGER INSTITUTIONAL FUNDS
NOTES TO FINANCIAL STATEMENTS (Unaudited) (Continued)
Debt securities generally trade in the over-the-counter market. Debt securities with remaining maturities of more than sixty days at the time of acquisition are valued on the basis of the last available bid prices or current market quotations provided by dealers or pricing services. In determining the value of a particular investment, pricing services may use certain information with respect to transactions in such investments, quotations from dealers, pricing matrixes, market transactions in comparable investments, various relationships observed in the market between investments and calculated yield measures based on valuation technology commonly employed in the market for such investments. Debt securities with a remaining maturity of sixty days or less are valued at amortized cost which approximates market value.
Securities for which market quotations are not readily available are valued at fair value, as determined in good faith pursuant to procedures established by the Board and described further herein.
Securities in which the Funds invest may be traded in foreign markets that close before the close of the NYSE. Developments that occur between the close of the foreign markets and the close of the NYSE may result in adjustments to the closing foreign prices to reflect what the Trust’s investment adviser, pursuant to policies established by the Board, believes to be the fair value of these securities as of the close of the NYSE. The Funds may also fair value securities in other situations, for example, when a particular foreign market is closed but the Funds are open.
FASB Accounting Standards Codification 820 - Fair Value Measurements and Disclosures ("ASC 820") defines fair value as the price that the Funds would receive upon selling an investment in a timely transaction to an independent buyer in the principal or most advantageous market of the investment. ASC 820 established a three-tier hierarchy to maximize the use of observable market data and minimize the use of unobservable inputs and to establish classification of fair value measurements for disclosure purposes. Inputs refer broadly to the assumptions that market participants would use in pricing the asset or liability and may be observable or unobservable. Observable inputs are based on market data obtained from sources independent of the Funds. Unobservable inputs are inputs that reflect the Funds' own assumptions based on the best information available in the circumstances. The three-tier hierarchy of inputs is summarized in the three broad Levels listed below.
• | Level 1 - quoted prices in active markets for identical investments |
• | Level 2 - significant other observable inputs (including quoted prices for similar investments, interest rates, prepayment speeds, credit risk, etc.) |
• | Level 3 - significant unobservable inputs (including the Funds' own assumptions in determining the fair value of investments) |
THE ALGER INSTITUTIONAL FUNDS
NOTES TO FINANCIAL STATEMENTS (Unaudited) (Continued)
The Funds’ valuation techniques are generally consistent with either the market or the income approach to fair value. The market approach considers prices and other relevant information generated by market transactions involving identical or comparable assets to measure fair value. The income approach converts future amounts to a current, or discounted, single amount. These fair value measurements are determined on the basis of the value indicated by current market expectations about such future events. Inputs for Level 1 include exchange-listed prices and broker quotes in an active market. Inputs for Level 2 include the last trade price in the case of a halted security, an exchange-listed price which has been adjusted for fair value factors, and prices of closely related securities. Additional Level 2 inputs include an evaluated price which is based upon a compilation of observable market information such as spreads for fixed income and preferred securities. Inputs for Level 3 include, but are not limited to, revenue multiples, earnings before interest, taxes, depreciation and amortization ("EBITDA") multiples, discount rates, time to exit and the probabilities of success of certain outcomes. Such unobservable market information may be obtained from a company's financial statements and from industry studies, market data, and market indicators such as benchmarks and indexes. Because of the inherent uncertainty and often limited markets for restricted securities, the valuations assigned to such securities by the Funds may significantly differ from the valuations that would have been assigned by the Funds had there been an active market for such securities.
Valuation processes are determined by a Valuation Committee (“Committee”) authorized by the Board and comprised of representatives of the Trust's investment adviser and officers of the Trust. The Committee reports its fair value determinations and related valuation information to the Board. The Board is responsible for approving the valuation policy and procedures.
While Committee meetings are held on an as-needed basis, the Committee generally meets quarterly to review and evaluate the effectiveness of the procedures for making fair value determinations. The Committee considers, among other things, the results of quarterly back testing of the fair value model for foreign securities, pricing comparisons between primary and secondary price sources, the outcome of price challenges put to the Funds’ pricing vendor, and variances between transactional prices and the previous day’s prices.
In December 2020, the Securities and Exchange Commission adopted Rule 2a-5 under the Investment Company Act of 1940, as amended (the “1940 Act”), which is intended to address valuation practices and the role of the board of directors with respect to the fair value of the investments of a registered investment company. Among other things, Rule 2a-5 will permit the Board to designate the Funds’ investment adviser, Fred Alger Management, LLC ("Alger Management" or the "Investment Manager"), to perform the Funds' fair value determinations, which will be subject to the Board’s oversight and certain reporting and other requirements intended to ensure that the Board receives the information it needs to oversee the Investment Manager’s fair value determinations. Compliance with Rule 2a-5 will not be required until September 2022. The Funds, the Board, and the Investment Manager are currently in the process of implementing the requirements of Rule 2a-5 for compliance with these requirements by the September 2022 compliance deadline.
(b) Cash and Cash Equivalents: Cash and cash equivalents include U.S. dollars, foreign cash and overnight time deposits.
(c) Securities Transactions and Investment Income: Securities transactions are recorded on a trade date basis. Realized gains and losses from securities transactions are recorded on the identified cost basis. Dividend income is recognized on the ex-dividend date and interest income is recognized on the accrual basis.
THE ALGER INSTITUTIONAL FUNDS
NOTES TO FINANCIAL STATEMENTS (Unaudited) (Continued)
FASB Accounting Standards Codification 740 - Income Taxes ("ASC 740") requires the Funds to measure and recognize in their financial statements the benefit of a tax position taken (or expected to be taken) on an income tax return if such position will more likely than not be sustained upon examination based on the technical merits of the position. No tax years are currently under investigation. The Funds file income tax returns in the U.S. Federal jurisdiction, as well as the New York State and New York City jurisdictions. The statute of limitations on the Funds' tax returns remains open for the tax years 2018-2021. Management does not believe there are any uncertain tax positions that require recognition of a tax liability.
(g) Allocation Methods: The Trust accounts separately for the assets, liabilities and operations of each Fund. Expenses directly attributable to each Fund are charged to that Fund's operations; expenses which are applicable to all Funds are allocated among them based on net assets. Income, realized and unrealized gains and losses, and expenses of each Fund are allocated among the Fund's classes based on relative net assets, with the exception of distribution fees, transfer agency fees, and shareholder servicing and related fees.
(h) Estimates: These financial statements have been prepared in accordance with accounting principles generally accepted in the United States of America, which require using estimates and assumptions that affect the reported amounts therein. These unaudited interim financial statements reflect all adjustments that are, in the opinion of management, necessary to present a fair statement of results for the interim period. Actual results may differ from those estimates. All such estimates are of a normal recurring nature.
NOTE 3 - Investment Advisory Fees and Other Transactions with Afffiliates: |
(a) Investment Advisory Fees: Fees incurred by each Fund, pursuant to the provisions of the Trust’s Investment Advisory Agreement with the Investment Manager, are payable monthly and computed based on the following rates. The actual rate paid as a percentage of average daily net assets, for the six months ended April 30, 2022, is set forth below under the heading “Actual Rate”:
Tier 1 | Tier 2 | Tier 3 | Tier 4 | Tier 5 | Actual Rate | |
Alger Capital Appreciation Institutional Fund(a) | 0.81% | 0.65% | 0.60% | 0.55% | 0.45% | 0.73% |
Alger Focus Equity Fund(b) | 0.52% | — | — | — | — | 0.52% |
Alger Mid Cap Growth Institutional Fund(c) | 0.76% | 0.70% | — | — | — | 0.76% |
Alger Small Cap Growth Institutional Fund(c) | 0.81% | 0.75% | — | — | — | 0.81% |
(a) Tier 1 rate is paid on assets up to 2 billion, Tier 2 rate is paid on assets between 2 billion and 3 billion, Tier 3 rate is paid on assets between 3 billion and 4 billion, Tier 4 rate is paid on assets between 4 billion and 5 billion, and Tier 5 rate is paid on assets in excess of 5 billion.
(b) Tier 1 rate is paid on all assets.
(c) Tier 1 rate is paid on assets up to 1 billion and Tier 2 rate is paid on assets in excess of 1 billion.
THE ALGER INSTITUTIONAL FUNDS
NOTES TO FINANCIAL STATEMENTS (Unaudited) (Continued)
Alger Management has contractually agreed to waive fees or to reimburse Fund expenses (excluding acquired fund fees and expenses, dividend expense on short sales, borrowing costs, interest, taxes, brokerage and extraordinary expenses) through February 29, 2024 to the extent necessary to limit the amount by which the total annual fund operating expenses exceed the rates, based on average daily net assets, as listed in the table below:
CLASS | FEES WAIVED / REIMBURSED FOR THE SIX MONTHS ENDED | |||||||||||||||||||||||||||||||
A | C | I | R | Y | Z | Z-2 | APRIL 30, 2022 | |||||||||||||||||||||||||
Alger Capital Appreciation Institutional Fund | – | – | – | – | 0.75% | – | 0.85% | $ | 161,648 | |||||||||||||||||||||||
Alger Focus Equity Fund | – | – | – | – | 0.58% | 0.63% | – | 27,327 | ||||||||||||||||||||||||
Alger Mid Cap Growth Institutional Fund | – | – | – | – | – | – | 0.99% | 9,637 | ||||||||||||||||||||||||
Alger Small Cap Growth Institutional Fund | – | – | – | – | – | – | 0.99% | – |
Alger Management may, during the term of the contract, recoup any fees waived or expenses reimbursed pursuant to the contract; however, a Fund will only make repayments to the Investment Manager if such repayment does not cause a Fund's expense ratio after the repayment is taken into account, to exceed both (i) the expense cap in place at the time such amounts were waived or reimbursed, and (ii) a Fund's current expense cap. Such recoupment is limited to two years from the date the amount is initially waived or reimbursed. For the six months ended April 30, 2022, there were no recoupments made to the Investment Manager.
(b) Administration Fees: Fees incurred by each Fund, pursuant to the provisions of the Trust's Fund Administration Agreement with Alger Management, are payable monthly and computed based on the average daily net assets of each Fund at the annual rate of 0.0275%.
(c) Distribution Fees: Class A Shares: The Trust has adopted a Distribution Plan pursuant to which Class A shares of Alger Focus Equity Fund pay Fred Alger & Company, LLC, the Trust's distributor and an affiliate of the Investment Manager (the "Distributor" or "Alger LLC") a fee at the annual rate of 0.25% of the respective average daily net assets of the Class A shares of the Fund to compensate Alger LLC for its activities and expenses incurred in distributing and/or administering the share class and/or shareholder servicing. The fees paid may be more or less than the expenses incurred by Alger LLC.
Class C Shares: The Trust has adopted a Distribution Plan pursuant to which Class C shares of Alger Focus Equity Fund pays Alger LLC a fee at the annual rate of 1% of the average daily net assets of the Class C shares of the Fund to compensate Alger LLC for its activities and expenses incurred in distributing and/or servicing the Class C shares. The fees paid may be more or less than the expenses incurred by Alger LLC.
Class R Shares: The Trust has adopted a Distribution Plan pursuant to which Class R shares of each Fund issuing such shares pays Alger LLC a fee at the annual rate of 0.50% of the respective average daily net assets of the Class R shares of the designated Fund to compensate Alger LLC for its activities and expenses incurred in distributing and/or servicing the Class R shares. The fees paid may be more or less than the expenses incurred by the Distributor.
THE ALGER INSTITUTIONAL FUNDS
NOTES TO FINANCIAL STATEMENTS (Unaudited) (Continued)
(d) Sales Charges: Sales of shares of the Funds may be subject to contingent deferred sales charges. The contingent deferred sales charges are used by Alger LLC to offset distribution expenses previously incurred. Sales charges do not represent expenses of the Trust. For the six months ended April 30, 2022, contingent deferred sales charges imposed, all of which were retained by Alger LLC, were as follows:
CONTINGENT DEFERRED SALES CHARGES | ||||
Alger Focus Equity Fund | $ | 2,355 |
(e) Brokerage Commissions: During the six months ended April 30, 2022, Alger Capital Appreciation Institutional Fund, Alger Focus Equity Fund, Alger Mid Cap Growth Institutional Fund and Alger Small Cap Growth Institutional Fund paid Alger LLC commissions of $173,131, $51,007, $21,889 and $13,912, respectively, in connection with securities transactions.
(f) Shareholder Administrative Fees: The Trust has entered into a Shareholder Administrative Services Agreement with Alger Management to compensate Alger Management for its liaising with, providing administrative oversight of, the Trust’s transfer agent, and for other related services. The Funds compensate Alger Management at the annual rate of 0.0165% of their respective average daily net assets for the Class A and Class C shares and 0.01% of their respective average daily net assets for the Class I, Class R, Class Y, Class Z and Class Z-2 shares for these services.
Alger Management makes payments to intermediaries that provide sub-accounting services to omnibus accounts invested in the Funds. A portion of the fees paid by Alger Management to intermediaries that provide sub-accounting services are charged back to the appropriate Fund, subject to certain limitations, as approved by the Board. For the six months ended April 30, 2022, Alger Management charged back to Alger Capital Appreciation Institutional Fund, Alger Focus Equity Fund, Alger Mid Cap Growth Institutional Fund, and Alger Small Cap Growth Institutional Fund, $884,123, $53,443, $31,618 and $56,426, respectively, for these services, which are included in the transfer agent fees in the accompanying Statements of Operations.
(g) Trustee Fees: Each trustee who is not an "interested person" of the Trust, as defined in the 1940 Act (“Independent Trustee”), receives a fee of $156,000 per annum, paid pro rata based on net assets by each fund in the Alger Fund Complex, plus travel expenses incurred for attending board meetings. The term "Alger Fund Complex" refers to the Trust, The Alger Funds, The Alger Funds II, The Alger Portfolios, Alger Global Focus Fund and The Alger ETF Trust, each of which is a registered investment company managed by Alger Management. The Independent Trustee appointed as Chairman of the Board receives additional compensation of $22,000 per annum paid pro rata based on net assets by each fund in the Alger Fund Complex. Additionally, each member of the Audit Committee receives a fee of $13,000 per annum, paid pro rata based on net assets by each fund in the Alger Fund Complex.
THE ALGER INSTITUTIONAL FUNDS
NOTES TO FINANCIAL STATEMENTS (Unaudited) (Continued)
Effective January 1, 2022, the Board adopted a policy requiring Trustees to receive a minimum of 10% of their annual compensation in shares of one or more of the funds in the Alger Fund Complex.
Prior to January 1, 2022, each Independent Trustee received a fee of $142,000 per annum, paid pro rata based on net assets by each fund in the Alger Fund Complex, plus travel expenses incurred for attending board meetings. The Independent Trustee appointed as Chairman of the Board received additional compensation of $20,000 per annum paid pro rata based on net assets by each fund in the Alger Fund Complex. Additionally, each member of the Audit Committee received a fee of $13,000 per annum, paid pro rata based on net assets by each fund in the Alger Fund Complex.
(h) Interfund Trades: The Funds may engage in purchase and sale transactions with other funds advised by Alger Management or Weatherbie Capital, LLC, an affiliate of Alger Management. For the six months ended April 30, 2022, these purchases and sales were as follows:
PURCHASES | SALES | REALIZED GAIN/LOSS | ||||||||||
Alger Small Cap Growth Institutional Fund | $ | 1,695,466 | $ | — | $ | — |
(i) Interfund Loans: The Funds, along with other funds in the Alger Fund Complex, may borrow money from and lend money to each other for temporary or emergency purposes. To the extent permitted under its investment restrictions, each Fund may lend uninvested cash in an amount up to 15% of its net assets to other funds in the Alger Fund Complex. If a Fund has borrowed from other funds in the Alger Fund Complex and has aggregate borrowings from all sources that exceed 10% of the Fund's total assets, such Fund will secure all of its loans from other funds in the Alger Fund Complex. The interest rate charged on interfund loans is equal to the average of the overnight time deposit rate and bank loan rate available to the Funds. There were no interfund loans outstanding as of April 30, 2022.
During the six months ended April 30, 2022, the Alger Capital Appreciation Institutional Fund, Alger Focus Equity Fund, Alger Mid Cap Growth Institutional Fund and Alger Small Cap Growth Institutional Fund incurred interfund loan interest expenses of $23,325, $85, $219, $639 respectively, which are included as interest expenses in the accompanying Statement of Operations.
(j) Other Transactions with Afftliates: Certain officers and one Trustee of the Trust are directors and/or officers of Alger Management, the Distributor, or their affiliates. At April 30, 2022, Alger Management and its affiliated entities owned the following shares:
THE ALGER INSTITUTIONAL FUNDS
NOTES TO FINANCIAL STATEMENTS (Unaudited) (Continued)
SHARE CLASS | ||||||||||||||||
A | Y | Z | Z-2 | |||||||||||||
Alger Capital Appreciation Institutional Fund | – | 414 | – | 4,518 | ||||||||||||
Alger Focus Equity Fund | 14,581 | 408 | 38,745 | – | ||||||||||||
Alger Mid Cap Growth Institutional Fund | – | – | – | 4,909 | ||||||||||||
Alger Small Cap Growth Institutional Fund | – | – | – | 7,733 |
(k) Shareholder Servicing Fees: The Trust has entered into a shareholder servicing agreement with Alger LLC whereby Alger LLC provides Class I and Class R shares of the applicable Funds with ongoing servicing of shareholder accounts. As compensation for such services, the Class I and Class R shares of each applicable Fund pay Alger LLC a monthly fee at an annual rate of 0.25% of the value of the average daily net assets of those classes. The fees paid may be more or less than the expenses incurred by the Distributor.
NOTE 4 — Securities Transactions: |
The following summarizes the securities transactions by each Fund, other than U.S. Government securities, in-kind transactions and short-term securities, for the six months ended April 30, 2022:
PURCHASES | SALES | |||||||
Alger Capital Appreciation Institutional Fund | $ | 2,117,298,448 | $ | 2,486,856,847 | ||||
Alger Focus Equity Fund | 932,749,374 | 979,898,387 | ||||||
Alger Mid Cap Growth Institutional Fund | 117,347,022 | 128,298,666 | ||||||
Alger Small Cap Growth Institutional Fund | 30,410,991 | 58,832,619 |
NOTE 5 — Borrowing: |
The Funds may borrow from Brown Brothers Harriman & Co., the Funds' custodian (the "Custodian" or "BBH"), on an uncommitted basis. Each Fund pays the Custodian a market rate of interest, generally based upon a rate of return with respect to each respective currency borrowed, taking into consideration relevant overnight and short-term reference rates and the range of distribution between and among the interest rates paid on deposits to other institutions, less applicable commissions, if any. Borrowings from the Custodian are included in Bank overdrafts in the Statements of Assets and Liabilities. The Funds may also borrow from other funds in the Alger Fund Complex, as discussed in Note 3(i). For the six months ended April 30, 2022, the Funds had the following borrowings from the Custodian and other funds in the Alger Fund Complex:
AVERAGE DAILY BORROWING | WEIGHTED AVERAGE INTEREST RATE | |||||||
Alger Capital Appreciation Institutional Fund | $ | 5,452,561 | 1.30 | % | ||||
Alger Focus Equity Fund | 18,809 | 1.17 | ||||||
Alger Mid Cap Growth Institutional Fund | 111,593 | 1.72 | ||||||
Alger Small Cap Growth Institutional Fund | 125,559 | 1.05 |
THE ALGER INSTITUTIONAL FUNDS
NOTES TO FINANCIAL STATEMENTS (Unaudited) (Continued)
The highest amount borrowed from the Custodian and other funds in the Alger Fund Complex during the six months ended April 30, 2022 by each Fund was as follows:
HIGHEST BORROWING | ||||
Alger Capital Appreciation Institutional Fund | $ | 124,304,000 | ||
Alger Focus Equity Fund | 2,974,000 | |||
Alger Mid Cap Growth Institutional Fund | 3,294,539 | |||
Alger Small Cap Growth Institutional Fund | 2,759,858 |
On September 7, 2021, BBH, the Fund's custodian, announced that it had entered into an agreement with State Street Bank and Trust Company ("State Street") to sell BBH's Investor Services business to State Street (the “Transaction”). The completion of the Transaction is subject to customary closing conditions and regulatory approvals. As a result of the Transaction, it is expected that State Street will replace BBH as the Fund's custodian effective as of the completion of the Transaction, the timing of which is not currently finalized.
NOTE 6 — Share Capital: |
The Trust has an unlimited number of authorized shares of beneficial interest of $.001 par value which are presently divided into four series. Each series is divided into separate classes. During the six months ended April 30, 2022, and the year ended October 30, 2021, transactions of shares of beneficial interest were as follows:
THE ALGER INSTITUTIONAL FUNDS
NOTES TO FINANCIAL STATEMENTS (Unaudited) (Continued)
FOR THE SIX MONTHS ENDED APRIL 30, 2022 | FOR THE YEAR ENDED OCTOBER 31, 2021 | |||||||||||||||
SHARES | AMOUNT | SHARES | AMOUNT | |||||||||||||
Alger Capital Appreciation Institutional Fund | ||||||||||||||||
Class I: | ||||||||||||||||
Shares sold | 3,324,189 | $ | 125,842,317 | 6,932,849 | $ | 308,319,220 | ||||||||||
Dividends reinvested | 8,729,064 | 357,978,918 | 7,958,967 | 329,262,481 | ||||||||||||
Shares redeemed | (7,216,445 | ) | (278,014,076 | ) | (17,543,284 | ) | (777,044,318 | ) | ||||||||
Net increase (decrease) | 4,836,808 | $ | 205,807,159 | (2,651,468 | ) | $ | (139,462,617 | ) | ||||||||
Class R: | ||||||||||||||||
Shares sold | 755,718 | $ | 22,604,378 | 1,177,042 | $ | 44,215,802 | ||||||||||
Dividends reinvested | 3,173,301 | 103,957,327 | 2,698,455 | 93,258,631 | ||||||||||||
Shares redeemed | (1,994,895 | ) | (61,764,602 | ) | (4,640,710 | ) | (175,648,393 | ) | ||||||||
Net increase (decrease) | 1,934,124 | $ | 64,797,103 | (765,213 | ) | $ | (38,173,960 | ) | ||||||||
Class Y: | ||||||||||||||||
Shares sold | 2,224,452 | $ | 92,072,069 | 3,730,299 | $ | 170,087,788 | ||||||||||
Dividends reinvested | 2,290,601 | 96,686,254 | 1,699,103 | 71,753,136 | ||||||||||||
Shares redeemed | (4,633,243 | ) | (193,094,222 | ) | (3,243,335 | ) | (149,405,709 | ) | ||||||||
Net increase (decrease) | (118,190 | ) | $ | (4,335,899 | ) | 2,186,067 | $ | 92,435,215 | ||||||||
Class Z-2: | ||||||||||||||||
Shares sold | 1,076,963 | $ | 41,898,762 | 1,841,479 | $ | 84,954,469 | ||||||||||
Dividends reinvested | 2,335,207 | 98,265,521 | 1,986,371 | 83,705,657 | ||||||||||||
Shares redeemed | (2,980,284 | ) | (114,988,485 | ) | (3,630,137 | ) | (165,261,002 | ) | ||||||||
Net increase | 431,886 | $ | 25,175,798 | 197,713 | $ | 3,399,124 |
THE ALGER INSTITUTIONAL FUNDS
NOTES TO FINANCIAL STATEMENTS (Unaudited) (Continued)
FOR THE SIX MONTHS ENDED APRIL 30, 2022 | FOR THE YEAR ENDED OCTOBER 31, 2021 | |||||||||||||||
SHARES | AMOUNT | SHARES | AMOUNT | |||||||||||||
Alger Capital Appreciation Institutional Fund | ||||||||||||||||
Class A: | ||||||||||||||||
Shares sold | 189,464 | $ | 10,154,612 | 525,001 | $ | 30,364,913 | ||||||||||
Shares converted from Class C | 28,053 | 1,470,808 | 43,235 | 2,591,544 | ||||||||||||
Dividends reinvested | 250,005 | 14,062,788 | 101,841 | 5,447,453 | ||||||||||||
Shares redeemed | (339,969 | ) | (17,986,148 | ) | (601,268 | ) | (34,069,982 | ) | ||||||||
Net increase | 127,553 | $ | 7,702,060 | 68,809 | $ | 4,333,928 | ||||||||||
Class C: | ||||||||||||||||
Shares sold | 156,042 | $ | 7,491,383 | 190,103 | $ | 10,358,874 | ||||||||||
Shares converted to Class A | (30,581 | ) | (1,470,808 | ) | (46,498 | ) | (2,591,544 | ) | ||||||||
Dividends reinvested | 174,899 | 9,009,061 | 79,104 | 3,948,864 | ||||||||||||
Shares redeemed | (146,488 | ) | (7,045,945 | ) | (250,063 | ) | (13,450,785 | ) | ||||||||
Net increase (decrease) | 153,872 | $ | 7,983,691 | (27,354 | ) | $ | (1,734,591 | ) | ||||||||
Class I: | ||||||||||||||||
Shares sold | 139,131 | $ | 7,536,383 | 389,234 | $ | 22,473,460 | ||||||||||
Subscriptions in-kind* | 2,177,233 | 147,434,796 | — | — | ||||||||||||
Dividends reinvested | 152,486 | 8,642,907 | 75,865 | 4,083,795 | ||||||||||||
Redemptions in-kind** | (2,223,483 | ) | (150,943,812 | ) | — | — | ||||||||||
Shares redeemed | (262,249 | ) | (13,725,988 | ) | (522,965 | ) | (29,204,622 | ) | ||||||||
Net decrease | (16,882 | ) | $ | (1,055,714 | ) | (57,866 | ) | $ | (2,647,367 | ) | ||||||
Class Y: | ||||||||||||||||
Shares sold | 392,300 | $ | 21,949,839 | 824,636 | $ | 47,977,736 | ||||||||||
Dividends reinvested | 379,807 | 22,142,762 | 145,885 | 8,025,161 | ||||||||||||
Shares redeemed | (267,637 | ) | (14,755,254 | ) | (402,682 | ) | (24,278,303 | ) | ||||||||
Net increase | 504,470 | $ | 29,337,347 | 567,839 | $ | 31,724,594 | ||||||||||
Class Z: | ||||||||||||||||
Shares sold | 3,083,321 | $ | 168,992,289 | 5,731,504 | $ | 340,685,196 | ||||||||||
Dividends reinvested | 2,426,793 | 141,093,762 | 914,460 | 50,203,839 | ||||||||||||
Shares redeemed | (3,423,014 | ) | (181,727,688 | ) | (3,566,328 | ) | (210,194,962 | ) | ||||||||
Net increase | 2,087,100 | $ | 128,358,363 | 3,079,636 | $ | 180,694,073 |
THE ALGER INSTITUTIONAL FUNDS
NOTES TO FINANCIAL STATEMENTS (Unaudited) (Continued)
FOR THE SIX MONTHS ENDED APRIL 30, 2022 | FOR THE YEAR ENDED OCTOBER 31, 2021 | |||||||||||||||
SHARES | AMOUNT | SHARES | AMOUNT | |||||||||||||
Alger Mid Cap Growth Institutional Fund | ||||||||||||||||
Class I: | ||||||||||||||||
Shares sold | 185,412 | $ | 5,008,415 | 482,262 | $ | 22,388,935 | ||||||||||
Dividends reinvested | 1,306,957 | 32,739,262 | 265,104 | 11,365,021 | ||||||||||||
Shares redeemed | (464,297 | ) | (11,442,234 | ) | (1,198,853 | ) | (56,354,630 | ) | ||||||||
Net increase (decrease) | 1,028,072 | $ | 26,305,443 | (451,487 | ) | $ | (22,600,674 | ) | ||||||||
Class R: | ||||||||||||||||
Shares sold | 30,929 | $ | 555,920 | 45,297 | $ | 1,843,906 | ||||||||||
Dividends reinvested | 166,142 | 3,214,840 | 21,723 | 816,986 | ||||||||||||
Shares redeemed | (32,973 | ) | (625,934 | ) | (68,568 | ) | (2,755,560 | ) | ||||||||
Net increase (decrease) | 164,098 | $ | 3,144,826 | (1,548 | ) | $ | (94,668 | ) | ||||||||
Class Z-2: | ||||||||||||||||
Shares sold | 259,648 | $ | 6,751,583 | 129,431 | $ | 6,238,420 | ||||||||||
Dividends reinvested | 353,527 | 9,138,654 | 45,688 | 1,987,879 | ||||||||||||
Shares redeemed | (290,957 | ) | (6,983,495 | ) | (108,129 | ) | (4,941,876 | ) | ||||||||
Net increase | 322,218 | $ | 8,906,742 | 66,990 | $ | 3,284,423 |
Alger Small Cap Growth Institutional Fund | ||||||||||||||||
Class I: | ||||||||||||||||
Shares sold | 568,479 | $ | 12,467,446 | 2,648,139 | $ | 81,047,723 | ||||||||||
Dividends reinvested | 1,270,807 | 28,224,632 | 314,052 | 9,029,003 | ||||||||||||
Shares redeemed | (1,847,780 | ) | (40,774,966 | ) | (3,165,178 | ) | (96,910,193 | ) | ||||||||
Net decrease | (8,494 | ) | $ | (82,888 | ) | (202,987 | ) | $ | (6,833,467 | ) | ||||||
Class R: | ||||||||||||||||
Shares sold | 46,270 | $ | 693,792 | 110,776 | $ | 2,554,915 | ||||||||||
Dividends reinvested | 136,909 | 2,122,088 | 33,491 | 732,104 | ||||||||||||
Shares redeemed | (70,023 | ) | (1,058,542 | ) | (236,982 | ) | (5,506,915 | ) | ||||||||
Net increase (decrease) | 113,156 | $ | 1,757,338 | (92,715 | ) | $ | (2,219,896 | ) | ||||||||
Class Z-2: | ||||||||||||||||
Shares sold | 2,061,901 | $ | 44,729,050 | 3,681,090 | $ | 115,278,838 | ||||||||||
Dividends reinvested | 1,144,418 | 25,955,396 | 213,917 | 6,235,667 | ||||||||||||
Shares redeemed | (2,496,003 | ) | (56,010,290 | ) | (2,414,400 | ) | (74,907,265 | ) | ||||||||
Net increase | 710,316 | $ | 14,674,156 | 1,480,607 | $ | 46,607,240 |
* Certain shareholders of the Fund subscribed shares in-kind.
** Certain shareholders of the Fund redeemed shares in-kind.
Subscriptions In-Kind: The Fund may receive payment for Fund shares purchased wholly or in part by receiving portfolio securities from shareholders. For the six months ended April 30, 2022, the Fund had subscriptions in-kind in the amount of $147,434,796.
Redemptions In-Kind: The Fund may make payment for Fund shares redeemed wholly or in part by receiving portfolio securities from shareholders. For the six months ended April 30, 2022, the Fund had redemptions in-kind with total proceeds in the amount of $150,943,812. The net realized gains on these redemptions in-kind amounted to $77,070,975, which are not considered taxable for federal income tax purposes.
THE ALGER INSTITUTIONAL FUNDS
NOTES TO FINANCIAL STATEMENTS (Unaudited) (Continued)
NOTE 7 — Income Tax Information |
At October 31, 2021, the Funds had no capital loss carryforwards utilized for federal income tax purposes.
The difference between book-basis and tax-basis unrealized appreciation (depreciation) is determined annually and is attributable primarily to the tax deferral of losses on wash sales, U.S. Internal Revenue Code Section 988 currency transactions, nondeductible expenses on dividends sold short, tax treatment of partnership investments, realization of unrealized appreciation of passive foreign investment companies, and return of capital from real estate investment trust investments.
The Funds accrue tax on unrealized gains in foreign jurisdictions that impose a foreign capital tax.
NOTE 8 — Fair Value Measurements: |
The following is a summary of the inputs used as of April 30, 2022, in valuing the Funds’ investments carried at fair value on a recurring basis. Based upon the nature, characteristics, and risks associated with their investments, the Funds have determined that presenting them by security type and sector is appropriate.
Alger Capital Appreciation Institutional Fund | TOTAL | LEVEL 1 | LEVEL 2 | LEVEL 3 | ||||||||||||
COMMON STOCKS | ||||||||||||||||
Communication Services | $ | 200,640,761 | $ | 200,640,761 | $ | — | $ | — | ||||||||
Consumer Discretionary | 547,003,343 | 521,929,890 | 23,870,720 | 1,202,733 | ||||||||||||
Consumer Staples | 11,125,709 | 11,125,709 | — | — | ||||||||||||
Energy | 67,921,922 | 67,921,922 | — | — | ||||||||||||
Financials | 87,098,835 | 87,098,835 | — | — | ||||||||||||
Healthcare | 406,813,690 | 364,873,106 | 41,940,584 | — | ||||||||||||
Industrials | 226,022,299 | 226,022,299 | — | — | ||||||||||||
Information Technology | 1,164,473,736 | 1,164,473,736 | — | — | ||||||||||||
Materials | 28,152,541 | 28,152,541 | — | — | ||||||||||||
Utilities | 9,163,498 | 9,163,498 | — | — | ||||||||||||
TOTAL COMMON STOCKS | $ | 2,748,416,334 | $ | 2,681,402,297 | $ | 65,811,304 | $ | 1,202,733 | ||||||||
PREFERRED STOCKS | ||||||||||||||||
Information Technology | 2,315,291 | — | — | 2,315,291 | ||||||||||||
REAL ESTATE INVESTMENT TRUST | ||||||||||||||||
Real Estate | 9,828,169 | 9,828,169 | — | — | ||||||||||||
SPECIAL PURPOSE VEHICLE | ||||||||||||||||
Information Technology | 4,293,561 | — | — | 4,293,561 | ||||||||||||
TOTAL INVESTMENTS IN SECURITIES | $ | 2,764,853,355 | $ | 2,691,230,466 | $ | 65,811,304 | $ | 7,811,585 |
THE ALGER INSTITUTIONAL FUNDS
NOTES TO FINANCIAL STATEMENTS (Unaudited) (Continued)
Alger Focus Equity Fund | TOTAL | LEVEL 1 | LEVEL 2 | LEVEL 3 | ||||||||||||
COMMON STOCKS | ||||||||||||||||
Communication Services | $ | 91,955,120 | $ | 91,955,120 | $ | — | $ | — | ||||||||
Consumer Discretionary | 238,716,751 | 238,716,751 | — | — | ||||||||||||
Energy | 26,775,197 | 26,775,197 | — | — | ||||||||||||
Financials | 56,245,047 | 56,245,047 | — | — | ||||||||||||
Healthcare | 138,605,888 | 115,464,203 | 23,141,685 | — | ||||||||||||
Industrials | 84,912,631 | 84,912,631 | — | — | ||||||||||||
Information Technology | 493,568,241 | 493,568,241 | — | — | ||||||||||||
Materials | 3,732,627 | 3,732,627 | — | — | ||||||||||||
TOTAL COMMON STOCKS | $ | 1,134,511,502 | $ | 1,111,369,817 | $ | 23,141,685 | $ | — | ||||||||
PREFERRED STOCKS | ||||||||||||||||
Healthcare | — | * | — | — | — | * | ||||||||||
TOTAL INVESTMENTS IN SECURITIES | $ | 1,134,511,502 | $ | 1,111,369,817 | $ | 23,141,685 | $ | — |
Alger Mid Cap Growth Institutional Fund | TOTAL | LEVEL 1 | LEVEL 2 | LEVEL 3 | ||||||||||||
COMMON STOCKS | ||||||||||||||||
Communication Services | 3,371,598 | 3,371,598 | — | — | ||||||||||||
Consumer Discretionary | 9,768,559 | 9,199,412 | 569,147 | — | ||||||||||||
Consumer Staples | 343,758 | 343,758 | — | — | ||||||||||||
Energy | 5,743,078 | 5,743,078 | — | — | ||||||||||||
Financials | 3,033,760 | 3,033,760 | — | — | ||||||||||||
Healthcare | 11,484,320 | 11,484,320 | — | — | ||||||||||||
Industrials | 8,072,289 | 8,072,289 | — | — | ||||||||||||
Information Technology | 20,117,886 | 20,117,886 | — | — | ||||||||||||
Materials | 1,111,110 | 1,111,110 | — | — | ||||||||||||
Utilities | 1,842,440 | 1,842,440 | — | — | ||||||||||||
TOTAL COMMON STOCKS | $ | 64,888,798 | $ | 64,319,651 | $ | 569,147 | $ | — | ||||||||
PREFERRED STOCKS | ||||||||||||||||
Healthcare RIGHTS | — | * | — | — | — | * | ||||||||||
Healthcare | 304,508 | — | — | 304,508 | ||||||||||||
REAL ESTATE INVESTMENT TRUST | ||||||||||||||||
Real Estate | 370,976 | 370,976 | — | — | ||||||||||||
SPECIAL PURPOSE VEHICLE | ||||||||||||||||
Information Technology | 1,094,879 | — | — | 1,094,879 | ||||||||||||
TOTAL INVESTMENTS IN SECURITIES | $ | 66,659,161 | $ | 64,690,627 | $ | 569,147 | $ | 1,399,387 |
THE ALGER INSTITUTIONAL FUNDS
NOTES TO FINANCIAL STATEMENTS (Unaudited) (Continued)
Alger Small Cap Growth Institutional Fund | TOTAL | LEVEL 1 | LEVEL 2 | LEVEL 3 | ||||||||||||
COMMON STOCKS | ||||||||||||||||
Communication Services | $ | 11,435,120 | $ | 11,435,120 | $ | — | $ | — | ||||||||
Consumer Discretionary | 23,776,061 | 23,776,061 | — | — | ||||||||||||
Consumer Staples | 10,795,771 | 10,795,771 | — | — | ||||||||||||
Energy | 12,089,986 | 12,089,986 | — | — | ||||||||||||
Financials | 2,229,719 | 2,229,719 | — | — | ||||||||||||
Healthcare | 59,480,038 | 57,723,098 | — | 1,756,940 | ||||||||||||
Industrials | 11,985,240 | 11,985,240 | — | — | ||||||||||||
Information Technology | 52,571,363 | 52,571,363 | — | — | ||||||||||||
Materials | 5,047,496 | 5,047,496 | — | — | ||||||||||||
TOTAL COMMON STOCKS | $ | 189,410,794 | $ | 187,653,854 | $ | — | $ | 1,756,940 | ||||||||
PREFERRED STOCKS | ||||||||||||||||
Healthcare | — | * | — | — | — | * | ||||||||||
Information Technology | 6,805,597 | — | — | 6,805,597 | ||||||||||||
TOTAL PREFERRED STOCKS | $ | 6,805,597 | $ | — | $ | — | $ | 6,805,597 | ||||||||
RIGHTS | ||||||||||||||||
Healthcare | 380,562 | — | — | 380,562 | ||||||||||||
REAL ESTATE INVESTMENT TRUST | ||||||||||||||||
Real Estate | 2,029,702 | 2,029,702 | — | — | ||||||||||||
SPECIAL PURPOSE VEHICLE | ||||||||||||||||
Information Technology | 2,252,482 | — | — | 2,252,482 | ||||||||||||
TOTAL INVESTMENTS IN SECURITIES | $ | 200,879,137 | $ | 189,683,556 | $ | — | $ | 11,195,581 |
* Prosetta Biosciences, Inc., Series D shares are classified as a Level 3 investment and are fair valued at zero as of April 30, 2022.
FAIR VALUE MEASUREMENTS USING SIGNIFICANT UNOBSERVABLE INPUTS (LEVEL 3) | ||||
Alger Capital Appreciation Institutional Fund | Common Stocks | |||
Opening balance at November 1, 2021 | $ | 1,339,796 | ||
Transfers into Level 3 | — | |||
Transfers out of Level 3 | — | |||
Total gains or losses | ||||
Included in net realized gain (loss) on investments | — | |||
Included in net change in unrealized appreciation (depreciation) on investments | (137,063 | ) | ||
Purchases and sales | ||||
Purchases | — | |||
Sales | — | |||
Closing balance at April 30, 2022 | 1,202,733 | |||
Net change in unrealized appreciation (depreciation) attributable to investments still held at April 30, 2022* | $ | (137,063 | ) |
THE ALGER INSTITUTIONAL FUNDS
NOTES TO FINANCIAL STATEMENTS (Unaudited) (Continued)
FAIR VALUE MEASUREMENTS USING SIGNIFICANT UNOBSERVABLE INPUTS (LEVEL 3) | ||||
Alger Capital Appreciation Institutional Fund | Preferred Stocks | |||
Opening balance at November 1, 2021 | $ | 2,688,128 | ||
Transfers into Level 3 | — | |||
Transfers out of Level 3 | — | |||
Total gains or losses | ||||
Included in net realized gain (loss) on investments | — | |||
Included in net change in unrealized appreciation (depreciation) on investments | (372,837 | ) | ||
Purchases and sales | ||||
Purchases | — | |||
Sales | — | |||
Closing balance at April 30, 2022 | 2,315,291 | |||
Net change in unrealized appreciation (depreciation) attributable to investments still held at April 30, 2022* | $ | (372,837 | ) |
FAIR VALUE MEASUREMENTS USING SIGNIFICANT UNOBSERVABLE INPUTS (LEVEL 3) | ||||
Alger Capital Appreciation Institutional Fund | Special Purpose Vehicle | |||
Opening balance at November 1, 2021 | $ | 4,923,444 | ||
Transfers into Level 3 | — | |||
Transfers out of Level 3 | — | |||
Total gains or losses | ||||
Included in net realized gain (loss) on investments | — | |||
Included in net change in unrealized appreciation (depreciation) on investments | (629,883 | ) | ||
Purchases and sales | ||||
Purchases | — | |||
Sales | — | |||
Closing balance at April 30, 2022 | 4,293,561 | |||
Net change in unrealized appreciation (depreciation) attributable to investments still held at April 30, 2022* | $ | (629,883 | ) |
THE ALGER INSTITUTIONAL FUNDS
NOTES TO FINANCIAL STATEMENTS (Unaudited) (Continued)
FAIR VALUE MEASUREMENTS USING SIGNIFICANT UNOBSERVABLE INPUTS (LEVEL 3) | ||||
Alger Focus Equity Fund | Preferred Stocks | |||
Opening balance at November 1, 2021 | $ | 0 | ** | |
Transfers into Level 3 | — | |||
Transfers out of Level 3 | — | |||
Total gains or losses | ||||
Included in net realized gain (loss) on investments | — | |||
Included in net change in unrealized appreciation (depreciation) on investments | — | |||
Purchases and sales | ||||
Purchases | — | |||
Sales | — | |||
Closing balance at April 30, 2022 | 0 | ** | ||
Net change in unrealized appreciation (depreciation) attributable to investments still held at April 30, 2022* | $ | — |
FAIR VALUE MEASUREMENTS USING SIGNIFICANT UNOBSERVABLE INPUTS (LEVEL 3) | ||||
Alger Mid Cap Growth Institutional Fund | Preferred Stocks | |||
Opening balance at November 1, 2021 | $ | 0 | ** | |
Transfers into Level 3 | — | |||
Transfers out of Level 3 | — | |||
Total gains or losses | ||||
Included in net realized gain (loss) on investments | — | |||
Included in net change in unrealized appreciation (depreciation) on investments | — | |||
Purchases and sales | ||||
Purchases | — | |||
Sales | — | |||
Closing balance at April 30, 2022 | 0 | ** | ||
Net change in unrealized appreciation (depreciation) attributable to investments still held at April 30, 2022* | $ | — |
THE ALGER INSTITUTIONAL FUNDS
NOTES TO FINANCIAL STATEMENTS (Unaudited) (Continued)
FAIR VALUE MEASUREMENTS USING SIGNIFICANT UNOBSERVABLE INPUTS (LEVEL 3) | ||||
Alger Mid Cap Growth Institutional Fund | Rights | |||
Opening balance at November 1, 2021 | $ | 317,196 | ||
Transfers into Level 3 | — | |||
Transfers out of Level 3 | — | |||
Total gains or losses | ||||
Included in net realized gain (loss) on investments | — | |||
Included in net change in unrealized appreciation (depreciation) on investments | (12,688 | ) | ||
Purchases and sales | ||||
Purchases | — | |||
Sales | — | |||
Closing balance at April 30, 2022 | 304,508 | |||
Net change in unrealized appreciation (depreciation) attributable to investments still held at April 30, 2022* | $ | (12,688 | ) |
FAIR VALUE MEASUREMENTS USING SIGNIFICANT UNOBSERVABLE INPUTS (LEVEL 3) | ||||
Alger Mid Cap Growth Institutional Fund | Special Purpose Vehicle | |||
Opening balance at November 1, 2021 | $ | |||
Transfers into Level 3 | 1,260,209 | |||
Transfers out of Level 3 | — | |||
Total gains or losses | — | |||
Included in net realized gain (loss) on investments | — | |||
Included in net change in unrealized appreciation (depreciation) on investments | (165,330 | ) | ||
Purchases and sales | ||||
Purchases | — | |||
Sales | — | |||
Closing balance at April 30, 2022 | 1,094,879 | |||
Net change in unrealized appreciation (depreciation) attributable to investments still held at April 30, 2022* | $ | (165,330 | ) |
THE ALGER INSTITUTIONAL FUNDS
NOTES TO FINANCIAL STATEMENTS (Unaudited) (Continued)
FAIR VALUE MEASUREMENTS USING SIGNIFICANT UNOBSERVABLE INPUTS (LEVEL 3) | ||||
Alger Small Cap Growth Institutional Fund | Common Stocks | |||
Opening balance at November 1, 2021 | $ | — | ||
Transfers into Level 3 | — | |||
Transfers out of Level 3 | — | |||
Total gains or losses | ||||
Included in net realized gain (loss) on investments | — | |||
Included in net change in unrealized appreciation (depreciation) on investments | — | |||
Purchases and sales | ||||
Purchases | 1,756,940 | |||
Sales | — | |||
Closing balance at April 30, 2022 | 1,756,940 | |||
Net change in unrealized appreciation (depreciation) attributable to investments still held at April 30, 2022* | $ | — |
FAIR VALUE MEASUREMENTS USING SIGNIFICANT UNOBSERVABLE INPUTS (LEVEL 3) | ||||
Alger Small Cap Growth Institutional Fund | Preferred Stocks | |||
Opening balance at November 1, 2021 | $ | 7,901,516 | ** | |
Transfers into Level 3 | — | |||
Transfers out of Level 3 | — | |||
Total gains or losses | ||||
Included in net realized gain (loss) on investments | — | |||
Included in net change in unrealized appreciation (depreciation) on investments | (1,095,919 | ) | ||
Purchases and sales | ||||
Purchases | — | |||
Sales | — | |||
Closing balance at April 30, 2022 | 6,805,597 | ** | ||
Net change in unrealized appreciation (depreciation) attributable to investments still held at April 30, 2022* | $ | (1,095,919 | ) |
THE ALGER INSTITUTIONAL FUNDS
NOTES TO FINANCIAL STATEMENTS (Unaudited) (Continued)
FAIR VALUE MEASUREMENTS USING SIGNIFICANT UNOBSERVABLE INPUTS (LEVEL 3) | ||||
Alger Small Cap Growth Institutional Fund | Rights | |||
Opening balance at November 1, 2021 | $ | 396,419 | ||
Transfers into Level 3 | — | |||
Transfers out of Level 3 | — | |||
Total gains or losses | ||||
Included in net realized gain (loss) on investments | — | |||
Included in net change in unrealized appreciation (depreciation) on investments | (15,857 | ) | ||
Purchases and sales | ||||
Purchases | — | |||
Sales | — | |||
Closing balance at April 30, 2022 | 380,562 | |||
Net change in unrealized appreciation (depreciation) attributable to investments still held at April 30, 2022* | $ | (15,857 | ) |
FAIR VALUE MEASUREMENTS USING SIGNIFICANT UNOBSERVABLE INPUTS (LEVEL 3) | ||||
Alger Small Cap Growth Institutional Fund | Special Purpose Vehicle | |||
Opening balance at November 1, 2021 | $ | 2,589,729 | ||
Transfers into Level 3 | — | |||
Transfers out of Level 3 | — | |||
Total gains or losses | ||||
Included in net realized gain (loss) on investments | — | |||
Included in net change in unrealized appreciation (depreciation) on investments | (337,247 | ) | ||
Purchases and sales | ||||
Purchases | — | |||
Sales | — | |||
Closing balance at April 30, 2022 | 2,252,482 | |||
Net change in unrealized appreciation (depreciation) attributable to investments still held at April 30, 2022* | $ | (337,247 | ) |
* Net change in unrealized appreciation (depreciation) is included in net change in unrealized appreciation (depreciation) on investments in the accompanying statements of operations.
** Prosetta Biosciences, Inc., Series D shares are classifted as a Level 3 investment and are fair valued at zero as of April 30, 2022.
The following table provides quantitative information about each Fund's Level 3 fair value measurements of its investments as of April 30, 2022. The table below is not intended to be all-inclusive, but rather provides information on the Level 3 inputs as they relate to each Fund’s fair value measurements.
THE ALGER INSTITUTIONAL FUNDS
NOTES TO FINANCIAL STATEMENTS (Unaudited) (Continued)
Fair Value April 30, 2022 | Valuation Methodology | Unobservable Input | Input/Range | Weighted Average Inputs | ||||||||||
Alger Small Cap Growth Institutional Fund | ||||||||||||||
Common Stocks | $ | 1,202,733 | Income Approach | Discount Rate Probability of Success | 0.00%-4.70 15.00%-50.00 | % % | N/A | |||||||
Preferred Stocks | 2,315,291 | Market Approach | Transaction Price Revenue Multiple | N/A 26.0x-30.57 | x | N/A | ||||||||
Special Purpose Vehicle | 4,293,561 | Market Approach | Transaction Price Revenue Multiple | N/A 26.0x-30.57 | x | N/A | ||||||||
Alger Focus Equity Fund | ||||||||||||||
Preferred Stocks | $ | — | * | Income Approach | Discount Rate | 100.00 | % | N/A | ||||||
Alger Mid Cap Growth Institutional Fund | ||||||||||||||
Preferred Stocks | $ | — | * | Income Approach | Discount Rate | 100.00 | % | N/A | ||||||
Rights | 304,508 | Income Approach | Discount Rate Probability of Success | 5.67%-6.01 0.00%-60.00 | % % | N/A | ||||||||
Special Purpose Vehicle | 1,094,879 | Market Approach | Transaction Price Revenue Multiple | N/A 26.0x-30.57 | x | N/A | ||||||||
Alger Small Cap Growth Institutional Fund | ||||||||||||||
Common Stocks | $ | 1,756,940 | Market Approach | Priced at Cost | N/A | |||||||||
Preferred Stocks | — | * | Income Approach | Discount Rate | 100.00 | % | N/A | |||||||
Preferred Stocks | 6,805,597 | Market Approach | Transaction Price Revenue Multiple | N/A 26.0x-30.57 | x | |||||||||
Rights | 380,562 | Income Approach | Discount Rate Probability of Success | 5.67%-6.01 0.00%-60.00 | % % | N/A | ||||||||
Special Purpose Vehicle | 2,252,482 | Market Approach | Transaction Price Revenue Multiple | N/A 26.0x-30.57 | x | N/A |
* | Prosetta Biosciences, Inc., Series D shares are classifted as a Level 3 investment and are fair valued at zero as of April 30, 2022. |
The significant unobservable inputs used in the fair value measurement of the Fund's securities are revenue and EBITDA multiples, discount rates, and the probability of success of certain outcomes. Significant increases and decreases in these inputs in isolation and interrelationships between these inputs would have resulted in significantly higher or lower fair value measurements than those noted in the table above. Generally, all other things being equal, increases in revenue and EBITDA multiples, decreases in discount rates, and increases in the probability of success result in higher fair value measurements, whereas decreases in revenues and EBITDA multiples, increases in discount rates, and decreases in the probability of success result in lower fair value measurements.
THE ALGER INSTITUTIONAL FUNDS
NOTES TO FINANCIAL STATEMENTS (Unaudited) (Continued)
Certain of the Funds’ assets and liabilities are held at carrying amount or face value, which approximates fair value for financial statements purposes. As of April 30, 2022, such assets were categorized within the ASC 820 disclosure hierarchy as follows:
TOTAL | LEVEL 1 | LEVEL 2 | LEVEL 3 | |||||||||||||
Cash, Foreign Cash and Cash Equivalents: | ||||||||||||||||
Alger Capital Appreciation Institutional Fund | $ | 34,974,081 | $ | 319,381 | $ | 34,654,700 | $ | – | ||||||||
Alger Focus Equity Fund | 76,515,826 | – | 76,515,826 | – | ||||||||||||
Alger Mid Cap Growth Institutional Fund | 1,517,870 | – | 1,517,870 | – | ||||||||||||
Alger Small Cap Growth Institutional Fund | 2,510,277 | – | 2,510,277 | – |
NOTE 9 — Derivatives:
FASB Accounting Standards Codification 815 - Derivatives and Hedging ("ASC 815") requires qualitative disclosures about objectives and strategies for using derivatives, quantitative disclosures about fair value amounts of and gains and losses on derivative instruments, and disclosures about credit-risk-related contingent features in derivative agreements.
Options — The Funds seek to capture the majority of the returns associated with equity market investments. To meet this investment goal, the Funds invest in a broadly diversified portfolio of common stocks, the Funds may also buy and sell call and put options on equities and equity indexes. The Funds may also purchase call options to increase their exposure to the stock market and also provide diversification of risk. The Funds may also purchase put options in order to protect from significant market declines that may occur over a short period of time. The Funds may also write covered call and cash secured put options to generate cash flows while reducing the volatility of the Funds' portfolios. The cash flows may be an important source of the Funds’ returns, although written call options may reduce the Funds' ability to profit from increases in the value of the underlying security or equity portfolio. The value of a call option generally increases as the price of the underlying stock increases and decreases as the stock decreases in price. Conversely, the value of a put option generally increases as the price of the underlying stock decreases and decreases as the stock increases in price. The combination of the diversified stock portfolio and the purchase and sale of options is intended to provide the Funds with the majority of the returns associated with equity market investments but with reduced volatility and returns that are augmented with the cash flows from the sale of options.
The Funds’ option contracts were not subject to any rights of offset with any counterparty. All of the Funds' options were exchange traded which utilize a clearinghouse that acts as an intermediary between buyer and seller, receiving initial and maintenance margin from both, and guaranteeing performance of the option contract.
There were no derivative instruments held by the Funds throughout the six months ended or as of April 30, 2022.
THE ALGER INSTITUTIONAL FUNDS
NOTES TO FINANCIAL STATEMENTS (Unaudited) (Continued)
NOTE 10 — Principal Risks:
Alger Capital Appreciation Institutional Fund — Investing in the stock market involves risks, including the potential loss of principal. The value of these securities, like other investments, may move up or down, sometimes rapidly and unpredictably. Your Fund shares at any point in time may be worth less than what you invested, even after taking into account the reinvestment of Fund dividends and distributions. Local, regional or global events such as environmental or natural disasters, war, terrorism, pandemics, outbreaks of infectious diseases and similar public health threats, recessions, or other events could have a significant impact on investments. Growth stocks may be more volatile than other stocks as their prices tend to be higher in relation to their companies’ earnings and may be more sensitive to market, political, and economic developments. A significant portion of assets may be invested in securities of companies in related sectors, and may be similarly affected by economic, political, or market events and conditions and may be more vulnerable to unfavorable sector developments. Foreign securities involve special risks including currency fluctuations, inefficient trading, political and economic instability, and increased volatility.
Alger Focus Equity Fund - Investing in the stock market involves risks, including the potential loss of principal. The value of these securities, like other investments, may move up or down, sometimes rapidly and unpredictably. Your Fund shares at any point in time may be worth less than what you invested, even after taking into account the reinvestment of Fund dividends and distributions. Local, regional or global events such as environmental or natural disasters, war, terrorism, pandemics, outbreaks of infectious diseases and similar public health threats, recessions, or other events could have a significant impact on investments. Growth stocks may be more volatile than other stocks as their prices tend to be higher in relation to their companies’ earnings and may be more sensitive to market, political, and economic developments. A significant portion of assets may be invested in securities of companies in related sectors, and may be similarly affected by economic, political, or market events and conditions and may be more vulnerable to unfavorable sector developments. Foreign securities involve special risks including currency fluctuations, inefficient trading, political and economic instability, and increased volatility. Assets may be focused in a small number of holdings, making them susceptible to risks associated with a single economic, political or regulatory event than a more diversified portfolio. Active trading may increase transaction costs, brokerage commissions, and taxes, which can lower the return on investment.
Alger Mid Cap Growth Institutional Fund — Investing in the stock market involves risks, including the potential loss of principal. The value of these securities, like other investments, may move up or down, sometimes rapidly and unpredictably. Your Fund shares at any point in time may be worth less than what you invested, even after taking into account the reinvestment of Fund dividends and distributions. Local, regional or global events such as environmental or natural disasters, war, terrorism, pandemics, outbreaks of infectious diseases and similar public health threats, recessions, or other events could have a significant impact on investments. Growth stocks may be more volatile than other stocks as their prices tend to be higher in relation to their companies’ earnings and may be more sensitive to market, political, and economic developments. A significant portion of assets may be invested in securities of companies in related sectors, and may be similarly affected by economic, political, or market events and conditions and may be more vulnerable to unfavorable sector developments. Investing in companies of medium capitalizations involves the risk that such issuers may have limited product lines or financial resources, lack management depth, or have limited liquidity. Foreign securities involve special risks including currency fluctuations, inefficient trading, political and economic instability, and increased volatility. Active trading may increase transaction costs, brokerage commissions, and taxes, which can lower the return on investment.
THE ALGER INSTITUTIONAL FUNDS
NOTES TO FINANCIAL STATEMENTS (Unaudited) (Continued)
Alger Small Cap Growth Institutional Fund — Investing in the stock market involves risks, including the potential loss of principal. The value of these securities, like other investments, may move up or down, sometimes rapidly and unpredictably. Your Fund shares at any point in time may be worth less than what you invested, even after taking into account the reinvestment of Fund dividends and distributions. Local, regional or global events such as environmental or natural disasters, war, terrorism, pandemics, outbreaks of infectious diseases and similar public health threats, recessions, or other events could have a significant impact on investments. Growth stocks may be more volatile than other stocks as their prices tend to be higher in relation to their companies’ earnings and may be more sensitive to market, political, and economic developments. A significant portion of assets may be invested in securities of companies in related sectors, and may be similarly affected by economic, political, or market events and conditions and may be more vulnerable to unfavorable sector developments. Investing in companies of small and medium capitalizations involves the risk that such issuers may have limited product lines or financial resources, lack management depth, or have limited liquidity. Foreign securities involve special risks including currency fluctuations, inefficient trading, political and economic instability, and increased volatility. At times, the Portfolio may hold a large cash position, which may underperform relative to equity securities.
Transactions in foreign securities may involve certain considerations and risks not typically associated with those of U.S. companies because of, among other factors, the level of governmental supervision and regulation of foreign security markets, and the possibility of political or economic instability. Additional risks associated with investing in emerging markets include increased volatility, limited liquidity, and less stringent regulatory and legal systems.
NOTE 11 - Affiliated Securities:
The issuers of the securities listed below are deemed to be affiliates of the Funds because the Funds and their affiliates, collectively, owned 5% or more of the issuer's voting securities during all or part of the six months ended April 30, 2022. Information regarding the Funds' holdings of such securities is set forth in the following table:
THE ALGER INSTITUTIONAL FUNDS
NOTES TO FINANCIAL STATEMENTS (Unaudited) (Continued)
Security | Value at October 31, 2021 | Purchases/ Conversion | Sales/ Conversion | Dividend/ Interest Income | Realized Gain (Loss) | Net Increase (Decrease) in Unrealized App(Dep) | Value at April 30, 2022 | |||||||||||||||||||||
Alger Capital Appreciation Institutional Fund Special Purpose Vehicle | ||||||||||||||||||||||||||||
Crosslink Ventures Capital LLC, | ||||||||||||||||||||||||||||
Cl. A | $ | 4,923,444 | $ | - | $ | - | $ | - | $ | - | $ | (629,883 | ) | $ | 4,293,561 | |||||||||||||
Total | $ | 4,923,444 | $ | - | $ | - | $ | - | $ | - | $ | (629,883 | ) | $ | 4,293,561 |
Security | Value at October 31, 2021 | Purchases/ Conversion | Sales/ Conversion | Dividend/ Interest Income | Realized Gain (Loss) | Net Increase (Decrease) in Unrealized App(Dep) | Value at April 30, 2022 | |||||||||||||||||||||
Alger Focus Equity Fund | ||||||||||||||||||||||||||||
Preferred Stocks | ||||||||||||||||||||||||||||
Prosetta Biosciences, Inc., Series D | $ | - | * | $ | – | $ | – | $ | – | $ | – | $ | – | $ | - | * | ||||||||||||
Total | $ | - | * | $ | – | $ | – | $ | – | $ | – | $ | – | $ | - | * |
Security | Value at October 31, 2021 | Purchases/ Conversion | Sales/ Conversion | Dividend/ Interest Income | Realized Gain (Loss) | Net Increase (Decrease) in Unrealized App(Dep) | Value at April 30, 2022 | |||||||||||||||||||||
Alger Mid Cap Growth Institutional Fund | ||||||||||||||||||||||||||||
Preferred Stocks | ||||||||||||||||||||||||||||
Prosetta Biosciences, Inc., Series D | $ | - | * | $ | – | $ | – | $ | – | $ | – | $ | – | $ | - | * | ||||||||||||
Special Purpose Vehicle | ||||||||||||||||||||||||||||
Crosslink Ventures Capital LLC, Cl. A | 880,616 | – | – | – | – | (112,662 | ) | 767,954 | ||||||||||||||||||||
Crosslink Ventures Capital LLC, Cl. B | 379,593 | – | – | – | – | (52,668 | ) | 326,925 | ||||||||||||||||||||
Total | $ | 1,260,209 | $ | – | $ | – | $ | – | $ | – | $ | (165,330 | ) | $ | 1,094,879 |
Security | Value at October 31, 2021 | Purchases/ Conversion | Sales/ Conversion | Dividend/ Interest Income | Realized Gain (Loss) | Net Increase (Decrease) in Unrealized App(Dep) | Value at April 30, 2022 | |||||||||||||||||||||
Alger Small Cap Growth Institutional Fund | ||||||||||||||||||||||||||||
Preferred Stocks | ||||||||||||||||||||||||||||
Prosetta Biosciences, Inc., Series D | $ | – | * | $ | – | $ | – | $ | – | $ | – | $ | – | $ | - | * | ||||||||||||
Special Purpose Vehicle | ||||||||||||||||||||||||||||
Crosslink Ventures Capital LLC, Cl. A | 2,041,428 | – | – | – | – | (261,171 | ) | 1,780,257 | ||||||||||||||||||||
Crosslink Ventures Capital LLC, Cl. B | 548,301 | – | – | – | – | (76,076 | ) | 472,225 | ||||||||||||||||||||
Total | $ | 2,589,729 | $ | – | $ | – | $ | – | $ | – | $ | (337,247 | ) | $ | 2,252,482 |
* | Prosetta Biosciences, Inc., Series D shares are classifted as a Level 3 investment and are fair valued at zero as of April 30, 2022. |
THE ALGER INSTITUTIONAL FUNDS
NOTES TO FINANCIAL STATEMENTS (Unaudited) (Continued)
NOTE 12 — Subsequent Events:
Management of each Fund has evaluated events that have occurred subsequent to April 30, 2022, through the issuance date of the Financial Statements. No such events have been identified which require recognition and/or disclosure.
Shareholder Expense Example
As a shareholder of a Fund, you incur two types of costs: transaction costs, if applicable, including sales charges (loads) and redemption fees; and ongoing costs, including management fees, distribution (12b-1) fees, if applicable, and other Fund expenses. This example is intended to help you understand your ongoing costs (in dollars) of investing in a Fund and to compare these costs with the ongoing costs of investing in other mutual funds.
The example below is based on an investment of $1,000 invested at the beginning of the six-month period starting November 1, 2021 and ending April 30, 2022 and held for the entire period.
Actual Expenses
The first line for each class of shares in the table below provides information about actual account values and actual expenses. You may use the information in this line, together with the amount you invested, to estimate the expenses that you paid over the period. Simply divide your account value by $1,000 (for example, an $8,600 account value divided by $1,000 = 8.6), then multiply the result by the number in the first line under the heading entitled "Expenses Paid During the Six Months Ended April 30, 2022" to estimate the expenses you paid on your account during this period.
Hypothetical Example for Comparison Purposes
The second line for each class of shares in the table below provides information about hypothetical account values and hypothetical expenses based on the actual expense ratio for each class of the Fund’s shares and an assumed rate of return of 5% per year before expenses, which is not the Fund's actual return. The hypothetical account values and expenses may not be used to estimate the actual ending account balance or expenses you paid for the period. You may use this information to compare the ongoing costs of investing in the Fund and other funds. To do so, compare this 5% hypothetical example with the 5% hypothetical examples that appear in the shareholder reports of other funds.
Please note that the expenses shown in the table are meant to highlight your ongoing costs only and do not reflect any transaction costs, such as sales charges (loads) and redemption fees. Therefore, the second line under each class of shares in the table is useful in comparing ongoing costs only, and will not help you determine the relative total costs of owning different funds. In addition, if these transactional costs were included, your costs would have been higher.
THE ALGER INSTITUTIONAL FUNDS
ADDITIONAL INFORMATION (Unaudited) (Continued)
Beginning Account Value November 1, 2021 | Ending Account Value April 30, 2022 | Expenses Paid During the Six Months Ended April 30, 2022(a) | Annualized Expense Ratio For the Six Months Ended April 30, 2022(b) | ||
Alger Capital Appreciation Institutional Fund | |||||
Class I | Actual | $ 1,000.00 | $ 733.50 | $ 4.94 | 1.15% |
Hypothetical(c) | 1,000.00 | 1,019.09 | 5.76 | 1.15 | |
Class R | Actual | 1,000.00 | 732.00 | 6.74 | 1.57 |
Hypothetical(c) | 1,000.00 | 1,017.01 | 7.85 | 1.57 | |
Class Y | Actual | 1,000.00 | 735.10 | 3.23 | 0.75 |
Hypothetical(c) | 1,000.00 | 1,021.08 | 3.76 | 0.75 | |
Class Z-2 | Actual | 1,000.00 | 734.70 | 3.48 | 0.81 |
Hypothetical(c) | 1,000.00 | 1,020.78 | 4.06 | 0.81 | |
Alger Focus Equity Fund | |||||
Class A | Actual | $ 1,000.00 | $ 709.00 | $ 3.98 | 0.94% |
Hypothetical(c) | 1,000.00 | 1,020.13 | 4.71 | 0.94 | |
Class C | Actual | 1,000.00 | 739.00 | 7.33 | 1.70 |
Hypothetical(c) | 1,000.00 | 1,016.36 | 8.50 | 1.70 | |
Class I | Actual | 1,000.00 | 748.30 | 3.94 | 0.91 |
Hypothetical(c) | 1,000.00 | 1,020.28 | 4.56 | 0.91 | |
Class Y | Actual | 1,000.00 | 749.60 | 2.52 | 0.58 |
Hypothetical(c) | 1,000.00 | 1,021.92 | 2.91 | 0.58 | |
Class Z | Actual | 1,000.00 | 749.40 | 2.65 | 0.61 |
Hypothetical(c) | 1,000.00 | 1,021.77 | 3.06 | 0.61 | |
Alger Mid Cap Growth Institutional Fund | |||||
Class I | Actual | $ 1,000.00 | $ 652.60 | $ 5.90 | 1.44% |
Hypothetical(c) | 1,000.00 | 1,017.65 | 7.20 | 1.44 | |
Class R | Actual | 1,000.00 | 651.10 | 7.66 | 1.87 |
Hypothetical(c) | 1,000.00 | 1,015.52 | 9.35 | 1.87 | |
Class Z-2 | Actual | 1,000.00 | 654.10 | 4.06 | 0.99 |
Hypothetical(c) | 1,000.00 | 1,019.89 | 4.96 | 0.99 | |
Alger Small Cap Growth Institutional Fund | |||||
Class I | Actual | $ 1,000.00 | $ 650.10 | $ 5.32 | 1.30% |
Hypothetical(c) | 1,000.00 | 1,018.35 | 6.51 | 1.30 | |
Class R | Actual | 1,000.00 | 648.90 | 6.99 | 1.71 |
Hypothetical(c) | 1,000.00 | 1,016.31 | 8.55 | 1.71 | |
Class Z-2 | Actual | 1,000.00 | 651.10 | 3.89 | 0.95 |
Hypothetical(c) | 1,000.00 | 1,020.08 | 4.76 | 0.95 |
(a) | Expenses are equal to the annualized expense ratio of the respective share class, multiplied by the average account value over the period, multiplied by 181/365 (to reflect the one-half year period). |
(b) | Annualized. |
(c) | 5% annual return before expenses. |
THE ALGER INSTITUTIONAL FUNDS
ADDITIONAL INFORMATION (Unaudited) (Continued)
Privacy Policy |
U.S. Consumer Privacy Notice | Rev. 6/22/21 | ||
FACTS | WHAT DOES ALGER DO WITH YOUR PERSONAL INFORMATION? | ||
Why? | Financial companies choose how they share your personal information. Federal law gives consumers the right to limit some but not all sharing. Federal law also requires us to tell you how we collect, share, and protect your personal information. Please read this notice carefully to understand what we do. | ||
What? | The types of personal information we collect and share depend on the product or service you have with us. This information can include: • Social Security number and • Account balances and • Transaction history and • Purchase history and • Assets When you are no longer our customer, we continue to share your information as described in this notice. | ||
How? | All financial companies need to share personal information to run their everyday business. In the section below, we list the reasons financial companies can share personal information; the reasons Alger chooses to share; and whether you can limit this sharing. |
Reasons we can share your personal information | Does Alger share? | Can you limit this sharing? | |||
For our everyday business purposes — such as to process your transactions, maintain your account(s), respond to court orders and legal investigations, or report to credit bureaus | Yes | No | |||
For our marketing purposes — to offer our products and services to you | Yes | No | |||
For joint marketing with other financial companies | No | We don’t share | |||
For our affiliates' everyday business purposes — information about your transactions and experiences | Yes | No | |||
For our affiliates' everyday business purposes — information about your creditworthiness | No | We don’t share | |||
For nonafffiliates to market to you | No | We don’t share | |||
Questions? Call 1-800-223-3810 |
THE ALGER INSTITUTIONAL FUNDS
ADDITIONAL INFORMATION (Unaudited) (Continued)
Who we are | |||
Who is providing this notice? | Alger includes Fred Alger Management, LLC and Fred Alger & Company, LLC as well as the following funds: The Alger Funds, The Alger Funds II, The Alger Institutional Funds, The Alger Portfolios, Alger Global Focus Fund, and The Alger ETF Trust. |
What we do | |||
How does Alger protect my personal information? | To protect your personal information from unauthorized access and use, we use security measures that comply with federal law. These measures include computer safeguards and secured files and buildings | ||
How does Alger collect my personal information? | We collect your personal information, for example, when you: • Open an account or • Make deposits or withdrawals from your account or • Give us your contact information or • Provide account information or • Pay us by check. | ||
Why can’t I limit all sharing? | Federal law gives you the right to limit some but not all sharing related to: • sharing for affiliates' everyday business purposes - information about your credit worthiness • affiliates from using your information to market to you • sharing for nonaffiliates to market to you State laws and individual companies may give you additional rights to limit sharing. |
Definitions | |||
Affiliates | Companies related by common ownership or control. They can be financial and nonfinancial companies • Our affiliates include Fred Alger Management, LLC, Weatherbie Capital, LLC and Fred Alger & Company, LLC as well as the following funds: The Alger Funds, The Alger Funds II, The Alger Institutional Funds, The Alger Portfolios, Alger Global Focus Fund, and The Alger ETF Trust. | ||
Nonaffiliates | Companies not related by common ownership or control They can be financial and nonfinancial companies. | ||
Joint marketing | A formal agreement between nonaffiliated financial companies that together market financial products or services to you. |
THE ALGER INSTITUTIONAL FUNDS
ADDITIONAL INFORMATION (Unaudited) (Continued)
Proxy Voting Policies
A description of the policies and procedures the Funds use to determine how to vote proxies relating to portfolio securities and the proxy voting record is available, without charge, by calling (800) 992-3863 or online on the Funds' website at http://www.alger.com or on the SEC's website at http://www.sec.gov.
Fund Holdings
The Board has adopted policies and procedures relating to disclosure of the Funds’ portfolio securities. These policies and procedures recognize that there may be legitimate business reasons for holdings to be disclosed and seek to balance those interests to protect the proprietary nature of the trading strategies and implementation thereof by the Funds.
Generally, the policies prohibit the release of information concerning portfolio holdings, which have not previously been made public, to individual investors, institutional investors, intermediaries that distribute the Funds’ shares and other parties which are not employed by the Investment Manager or its affiliates except when the legitimate business purposes for selective disclosure and other conditions (designed to protect the Funds) are acceptable.
The Funds file their complete schedules of portfolio holdings with the SEC semi-annually in shareholder reports on Form N-CSR and after the first and third fiscal quarters as an exhibit to their reports on Form N-PORT. The Funds' Forms N-CSR and N-PORT are available online on the SEC's website at www.sec.gov.
In addition, the Funds make publicly available their month-end top 10 holdings with a 10 day lag and their month-end full portfolios with a 60 day lag on their website www.alger. com and through other marketing communications (including printed advertising/sales literature and/or shareholder telephone customer service centers). No compensation or other consideration is directly received for the non-public disclosure of portfolio holdings information.
In accordance with the foregoing, the Funds provide portfolio holdings information to third parties including financial intermediaries and service providers who need access to this information in the performance of their services and are subject to duties of confidentiality
(1) imposed by law, including a duty not to trade on non-public information, and/or (2) pursuant to an agreement that confidential information is not to be disclosed or used (including trading on such information) other than as required by law. From time to time, the Funds will communicate with these third parties to confirm that they understand the Funds’ policies and procedures regarding such disclosure. These agreements must be approved by the Trust's Chief Compliance Officer.
The Board periodically reviews a report disclosing the third parties to whom each Fund’s holdings information has been disclosed and the purpose for such disclosure, and it considers whether or not the release of information to such third parties is in the best interest of the Fund and its shareholders.
THE ALGER INSTITUTIONAL FUNDS
ADDITIONAL INFORMATION (Unaudited) (Continued)
In addition to material the Funds routinely provide to shareholders, the Investment Manager may make additional statistical information available regarding the Alger Family of Funds. Such information may include, but not be limited to, relative weightings and characteristics of a Fund versus an index (such as P/E ratio, alpha, beta, capture ratio, maximum drawdown, standard deviation, EPS forecasts, Sharpe ratio, information ratio, R-squared, and market cap analysis), security specific impact on overall portfolio performance, month-end top ten contributors to and detractors from performance, portfolio turnover, and other similar information. Shareholders should visit www.alger.com or may also contact the Funds at (800) 992-3863 to obtain such information.
Liquidity Risk Management Program
In accordance with Rule 22e-4 under the 1940 Act (the "Liquidity Rule"), the Trust has adopted and implemented a liquidity risk management program (the "LRMP"), which is reasonably designed to assess and manage the Funds’ liquidity risk.
The Board met on December 15, 2021 (the "Meeting") to review the LRMP. The Board previously appointed Alger Management as the program administrator for the LRMP and approved an agreement with ICE Data Services ("ICE"), a third party vendor that assists the Funds with liquidity classifications required by the Liquidity Rule. Alger Management also previously delegated oversight of the LRMP to the Liquidity Risk Committee. At the Meeting, the Liquidity Risk Committee, on behalf of Alger Management, provided the Board with a report that addressed the operation of the LRMP and assessed its adequacy and effectiveness of implementation, and any material changes to the LRMP (the "Report"). The Report covered the period from December 1, 2020 through November 30, 2021 (the “Review Period”).
The Report stated that the Committee assessed the Funds’ liquidity risk by considering qualitative factors such as the Funds' investment strategy, holdings, diversification of investments, redemption policies, cash flows, cash levels, shareholder concentration, and access to borrowings, among others, in conjunction with the quantitative classifications generated by ICE. In addition, in connection with the review of the Funds' liquidity risks and the operation of the LRMP and the adequacy and effectiveness of its implementation, the Liquidity Risk Committee also evaluated the levels at which to set the reasonably anticipated trade size and market price impact. The Report described the process for determining that the Funds primarily holds investments that are highly liquid. The Report noted that the Liquidity Risk Committee also performed stress tests on certain Funds in light of the market volatility caused by the COVID-19 pandemic, and it was concluded that the Funds remained primarily highly liquid.
There were no material changes to the LRMP during the Review Period, except that certain changes were made to the LRMP to add liquidity considerations for certain exchange-traded funds managed by Alger Management. The Report provided to the Board stated that the Committee concluded that, based on the operation of the functions, as described in the Report, during the Review Period, the Trust's LRMP was operating effectively and adequately with respect to the Funds and has been effectively implemented during the Review Period.
THE ALGER INSTITUTIONAL FUNDS
100 Pearl Street, 27th Floor
New York, NY 10004
(800) 992-3863
www.alger.com
Investment Manager
Fred Alger Management, LLC
100 Pearl Street, 27th Floor
New York, NY 10004
Distributor
Fred Alger & Company, LLC
100 Pearl Street, 27th Floor
New York, NY 10004
Transfer Agent and Dividend Disbursing Agent
UMB Fund Services, Inc.
235 W. Galena Street
Milwaukee, WI 53212
Custodian
Brown Brothers Harriman & Company
50 Post Office Square
Boston, MA 02110
Independent Registered Public Accounting Firm
Deloitte & Touche LLP
30 Rockefeller Plaza
New York, NY 10112
This report is submitted for the general information of the shareholders of The Alger Institutional Funds. It is not authorized for distribution to prospective investors unless accompanied by an effective Prospectus for the Trust, which contains information concerning the Trust's investment policies, fees and expenses as well as other pertinent information.
(This page has been intentionally left blank)
(b) | Include a copy of each notice transmitted to stockholders in reliance on Rule 30e-3 under the Act (17 CFR 270.30e-3) that contains disclosures specified by paragraph (c)(3) of that rule. |
Not applicable.
ITEM 2. | CODE OF ETHICS. |
Not applicable.
ITEM 3. | AUDIT COMMITTEE FINANCIAL EXPERT. |
Not applicable.
ITEM 4. | PRINCIPAL ACCOUNTANT FEES AND SERVICES. |
Not applicable.
ITEM 5. | AUDIT COMMITTEE OF LISTED REGISTRANTS. |
Not applicable.
ITEM 6. | INVESTMENTS. |
Not applicable.
ITEM 7. | DISCLOSURE OF PROXY VOTING POLICIES AND PROCEDURES FOR CLOSED-END MANAGEMENT INVESTMENT COMPANIES. |
Not applicable.
ITEM 8. | PORTFOLIO MANAGERS OF CLOSED-END MANAGEMENT INVESTMENT COMPANIES. |
Not applicable.
ITEM 9. | PURCHASES OF EQUITY SECURITIES BY CLOSED-END MANAGEMENT INVESTMENT COMPANY AND AFFILIATED PURCHASERS. |
Not applicable.
ITEM 10. | SUBMISSION OF MATTERS TO A VOTE OF SECURITY HOLDERS. |
Not applicable.
ITEM 11. | CONTROLS AND PROCEDURES. |
(a) The Registrant’s principal executive officer and principal financial officer have concluded that the Registrant’s disclosure controls and procedures (as defined in Rule 30a-3(c) under the Investment Company Act of 1940, as amended) are effective based on their evaluation of the disclosure controls and procedures as of a date within 90 days of the filing date of this document.
(b) No changes in the Registrant’s internal control over financial reporting occurred during the Registrant’s second fiscal quarter of the period covered by this report that materially affected, or are reasonably likely to materially affect, the Registrant’s internal control over financial reporting.
ITEM 12. | Disclosure of Securities Lending Activities for Closed-End Management Investment Companies. |
Not applicable.
ITEM 13. | EXHIBITS. |
(a) (1) Not applicable
(a) (3) Not applicable
(a) (4) Not applicable
SIGNATURES
Pursuant to the requirements of the Securities Exchange Act of 1934 and the Investment Company Act of 1940, the registrant has duly caused this report to be signed on its behalf by the undersigned, thereunto duly authorized.
The Alger Institutional Funds
By: | /s/ Hal Liebes |
Hal Liebes | |
President |
Date: June 22, 2022
Pursuant to the requirements of the Securities Exchange Act of 1934 and the Investment Company Act of 1940, this report has been signed below by the following persons on behalf of the registrant and in the capacities and on the dates indicated.
By: | /s/ Hal Liebes |
Hal Liebes | |
President |
Date: June 22, 2022
By: | /s/ Michael D. Martins |
Michael D. Martins | |
Treasurer |
Date: June 22, 2022