UNITED STATES
SECURITIES AND EXCHANGE COMMISSION
Washington, D.C. 20549
FORM 10-K
| | | | | |
| ☒ | ANNUAL REPORT PURSUANT TO SECTION 13 OR 15(d) OF THE SECURITIES EXCHANGE ACT OF 1934 |
For the fiscal year ended December 31, 2024
OR
| | | | | |
| ☐ | TRANSITION REPORT PURSUANT TO SECTION 13 OR 15(d) OF THE SECURITIES EXCHANGE ACT OF 1934 |
For the transition period from to
Commission File Number 1-475
A. O. Smith Corporation
(Exact name of registrant as specified in its charter)
Delaware
(State of Incorporation)
11270 West Park Place, Milwaukee, Wisconsin
(Address of Principal Executive Office)
39-0619790
(I.R.S. Employer Identification No.)
53224
(Zip Code)
(414) 359-4000
Registrant’s telephone number, including area code
Securities registered pursuant to Section 12(b) of the Act:
| | | | | | | | | | | | | | | | | | | | |
| Title of Each Class | | Trading Symbol(s) | | Shares of Stock Outstanding January 31, 2025 | | Name of Each Exchange on
Which Registered |
Class A Common Stock
(par value $5.00 per share) | | None | | 25,870,069 | | Not listed |
Common Stock
(par value $1.00 per share) | | AOS | | 118,089,097 | | New York Stock Exchange |
Securities registered pursuant to Section 12(g) of the Act: None.
Indicate by check mark if the registrant is a well-known seasoned issuer, as defined in Rule 405 of the Securities Act. ☒ Yes ¨ No
Indicate by check mark if the registrant is not required to file reports pursuant to Section 13 or Section 15(d) of the Act. ¨ Yes ☒ No
Indicate by check mark whether the registrant (1) has filed all reports required to be filed by Section 13 or 15(d) of the Securities Exchange Act of 1934 during the preceding 12 months (or for such shorter period that the registrant was required to file such reports), and (2) has been subject to such filing requirements for the past 90 days. ☒ Yes ¨ No.
Indicate by check mark whether the registrant has submitted electronically every Interactive Data File required to be submitted pursuant to Rule 405 of Regulation S-T (§232.405 of this chapter) during the preceding 12 months (or for such shorter period that the registrant was required to submit such files). ☒ Yes ¨ No
Indicate by check mark whether the registrant is a large accelerated filer, an accelerated filer, a non-accelerated filer, a smaller reporting company, or an emerging growth company. See the definitions of “large accelerated filer,” “accelerated filer,” “smaller reporting company” and “emerging growth company” in Rule 12b-2 of the Exchange Act.
| | | | | | | | | | | | | | | | | |
| Large accelerated filer | ☒ | Accelerated filer | ☐ | Emerging growth company | ☐ |
| | | | | |
| Non-accelerated filer | ☐ | Smaller reporting company | ☐ | | |
If an emerging growth company, indicate by check mark if the registrant has elected not to use the extended transition period for complying with any new or revised financial accounting standards provided pursuant to Section 13(a) of the Exchange Act. ¨
Indicate by check mark whether the registrant has filed a report on and attestation to its management's assessment of the effectiveness of its internal control over financial reporting under Section 404(b) of the Sarbanes-Oxley Act (15 U.S.C. 7262(b)) by the registered public accounting firm that prepared or issued its audit report. ☒
If securities are registered pursuant to Section 12(b) of the Act, indicate by check mark whether the financial statements of the registrant included in the filing reflect the correction of an error to previously issued financial statements. ¨
Indicate by a check mark whether any of those error corrections are restatements that required a recovery analysis of incentive-based compensation received by any of the registrant’s executive officers during the relevant recovery period pursuant to §240.10D-1(b). ¨
Indicate by check mark whether the registrant is a shell company (as defined in Rule 12b-2 of the Act.) ☐ Yes ☒ No
The aggregate market value of voting stock held by non-affiliates of the registrant was $66,240,083 for Class A Common Stock and $9,664,355,425 for Common Stock as of June 30, 2024.
DOCUMENTS INCORPORATED BY REFERENCE
| | | | | |
| 1. | Portions of the company’s definitive Proxy Statement for the 2025 Annual Meeting of Stockholders (to be filed with the Securities and Exchange Commission under Regulation 14A within 120 days after the end of the registrant’s fiscal year and, upon such filing, to be incorporated by reference in Part III). |
A. O. Smith Corporation
Index to Form 10-K
Year Ended December 31, 2024
PART 1
ITEM 1 – BUSINESS
As used in this annual report on Form 10-K, references to the “Company,” “A. O. Smith,” “AOS,” “we,” “us,” and “our” refer to A. O. Smith and its consolidated subsidiaries. The following discussion should be read in conjunction with our consolidated financial statements and notes thereto under “Item 8 Financial Statements and Supplementary Data” in this annual report on Form 10-K. Our company is comprised of two reporting segments: North America and Rest of World. Both segments manufacture and market comprehensive lines of residential and commercial gas and electric water heaters, boilers, heat pumps, tanks and water treatment products. Both segments primarily manufacture and market in their respective regions of the world. Our Rest of World segment is primarily comprised of China, Europe and India.
NORTH AMERICA
Sales in our North America segment accounted for approximately 77 percent of our total sales in 2024. This segment serves residential and commercial end markets with a broad range of products including:
Water heaters. Our residential and commercial water heaters primarily come in sizes ranging from 40 to 80 gallon models, however, we also offer sizes as low as 2.5 gallon (point-of-use) and as high as 2,500 gallon products with varying efficiency ranges. We offer electric, natural gas and liquid propane tank-type models as well as tankless (gas and electric), heat pump and solar tank units. Typical applications for our water heaters include residences, restaurants, hotels, office buildings, laundries, car washes, schools and small businesses.
Boilers. Our residential and commercial boilers range in size from 45,000 British Thermal Units (BTUs) to 6.0 million BTUs. Boilers are closed loop water heating systems used primarily for space heating or hydronic heating. Our boilers are primarily used in applications in commercial settings for hospitals, schools, hotels and other large commercial buildings while residential boilers are used in homes, apartments and condominiums.
Water treatment products. With the acquisition of Aquasana, Inc. (Aquasana) in 2016 we entered the water treatment market. We expanded our product offerings and geographic footprint with the acquisitions of Hague Quality Water International (Hague) in 2017, Water-Right, Inc. (Water-Right) in 2019, Master Water Conditioning Corporation (Master Water) in 2021, Atlantic Filter Corporation (Atlantic Filter) in 2022, Water Tec of Tucson, Inc (Water Tec) in 2023 and Impact Water Products (Impact) in 2024. Our water treatment products range from point-of-entry water softeners, solutions for problem well water, whole-home water filtration products and point-of-use carbon and reverse osmosis products. We also offer a comprehensive line of commercial water treatment and filtration products. Typical applications for our water treatment products include residences, restaurants, schools and offices.
Other. In our North America segment, we also manufacture expansion tanks, commercial solar water heating systems, swimming pool and spa heaters, related products and parts.
A significant portion of our North America sales is derived from the replacement of existing products.
We believe we are the largest manufacturer and marketer of water heaters in North America with a leading share in both the residential and commercial portions of the market. We expanded our presence in North America with our acquisition of Giant Factories, Inc. (Giant), a Canada-based manufacturer of residential and commercial water heaters, which we acquired in late 2021. In the commercial segments of the market for both water heating and space heating, we believe our comprehensive product lines and our high-efficiency products give us a competitive advantage. Our wholesale distribution channel, where we sell our products primarily under the A. O. Smith and State brands, includes approximately 900 independent wholesale plumbing distributors serving residential and commercial end markets. We also sell our residential water heaters through the retail and maintenance, repair and operations (MRO) channels. In the retail channel, our customers include four of the six largest national hardware and home center chains, including a long-standing exclusive relationship with Lowe’s where we sell A. O. Smith branded products.
Our Lochinvar brand is one of the leading residential and commercial boiler brands in North America. Approximately 45 percent of Lochinvar branded sales consist of residential and commercial water heaters while the remaining 55 percent of Lochinvar branded sales consist primarily of boilers and related parts. Our commercial boiler distribution channel is primarily comprised of manufacturer representative firms with the remainder of our Lochinvar branded products being distributed through wholesale channels.
In our water treatment business we sell through a variety of channels. We sell our A. O. Smith branded water treatment products primarily through our water quality, dealer network and Amazon. Our Aquasana branded products are primarily sold directly to consumers through e-commerce channels. Our water softener products and problem well water solutions, which
include the Hague, Water-Right, Master Water, Atlantic Filter, Impact, and Water Tec brands, are sold through water quality dealers and contractors. Our water softener products are also sold through home center retail chains.
Our energy-efficient product offerings continue to be a sales driver for our business. Our condensing commercial water heaters and boilers continue to be an option for commercial customers looking for high-efficiency water and space heating with a short payback period through energy savings. We offer residential heat pumps, condensing tank-type and tankless water heaters in North America, as well as other higher efficiency water heating solutions to round out our energy-efficient product offerings. We recently launched our newly designed ADAPT condensing gas tankless water heater and VERITUS air source commercial heat pump water heater to align with greenhouse gas emission reduction trends across the U.S.
We sell our products in highly competitive markets. We compete in each of our targeted market segments based on product design, reliability, quality of products and services, advanced technologies, energy efficiency, maintenance costs and price. Our principal water heating and boiler competitors in North America include Rheem, Bradford White, Rinnai, Aerco and Navien. Numerous other manufacturing companies also compete. Our principal water treatment competitors in the U.S. are Culligan, Kinetico, Pentair, Franklin Electric and Ecowater as well as numerous regional assemblers.
REST OF WORLD
Sales in our Rest of World segment accounted for approximately 23 percent of our total sales in 2024, a majority of which were in China. We have operated in China for nearly 30 years. In that time, we have established A. O. Smith brand recognition in the residential and commercial markets. We manufacture and market residential water heater and water treatment products, primarily incorporating reverse osmosis technology, and commercial dispensing water treatment products. The Chinese water heater market is predominantly comprised of electric wall-hung, gas tankless, combi-boiler, heat pump and solar water heaters. We believe we are one of the market leaders of water heaters and reverse osmosis water treatment products to the residential market in China in dollar terms. We also design and market kitchen products (range hoods, cooktops, steam ovens, and dishwashers) and connected product technology in China.
We sell our products in approximately 9,400 points of sale in China, of which approximately 4,400 are retail outlets in tier one through tier three cities and approximately 1,600 exclusively sell our products. We also sell our products through e-commerce channels. Our primary competitors in China in the water heater market segment are Haier/Casarte, Midea/COLMO, and Rinnai. Our principal competitors in the water treatment market are Angel, Haier/Casarte, Midea/COLMO, Truliva, and Xiaomi.
In 2008, we established a sales office in India and began importing products specifically designed for India. We began manufacturing water heaters in India in 2010 and water treatment products in 2015. In 2024, we expanded our product offerings and geographic footprint with the acquisition of Pureit, a Unilever PLC business. Pureit offers a broad range of residential water purification solutions in India and other South Asian markets. We continue to increase our product offerings and sales in this country, primarily through wholesale, e-commerce and retail channels. Our primary competitors in India are Racold, Bajaj and Havells in the water heater market and Eureka Forbes and Kent in the water treatment market.
We also sell water heaters in the European, Middle East, and Far East markets and water treatment products in Vietnam, all of which combined comprised less than 14 percent of total Rest of World sales in 2024.
RAW MATERIALS
Raw materials for our manufacturing operations, primarily consisting of steel, are generally available in adequate quantities. A portion of our customers are contractually obligated to accept price changes based on fluctuations in steel prices. There has been volatility in steel costs over the last several years. In addition tariffs could potentially increase volatility in steel and other input materials.
RESEARCH AND DEVELOPMENT
To improve our competitiveness by generating new products and processes, we conduct research and development at our Corporate Technology Center in Milwaukee, Wisconsin, our Global Engineering Center in Nanjing, China, and our operating locations. Our total expenditures for research and development in 2024, 2023 and 2022 were $101.7 million, $97.5 million and $89.0 million, respectively.
PATENTS AND TRADEMARKS
We invest, own and use in our businesses various trademarks, trade names, patents, trade secrets and licenses. We monitor our intellectual property for infringements. Although we believe our trademarks, trade names, patents, trade secrets, and licenses to constitute a valuable asset in the aggregate, we do not regard our business as being materially dependent on any
single trademark, trade name, patent, trade secret, license or any group of related such rights. Our trade name is important with respect to our products, particularly in China, India, and North America.
HUMAN CAPITAL
We employed approximately 12,700 employees as of December 31, 2024 with approximately 7,200 in North America and 5,500 in Rest of World. A small portion of our workforce in the U.S. is represented by a labor union, while outside the U.S., we have employees in certain countries that are represented by employee representative organizations, such as an employee association, union, or works council.
Our Guiding Principles and Values. The foundation of how we conduct business and interact with our employees is outlined in A. O. Smith Corporation’s Guiding Principles and our Statement of Values. These principles and values help to shape how we hire, train and treat our employees, emphasizing teamwork and promoting diversity in seeking our objectives. We believe that our Guiding Principles and Values shape the critical elements of our effort to attract, retain and develop talent. In 2024, we were named by Ethisphere on the list of the World’s Most Ethical Companies. The annual list recognizes global companies dedicated to integrity, sustainability, governance, and community with a commitment to ethical behavior, accountability, and driving positive change.
Culture and Employee Engagement. We conduct a Global Employee Engagement Survey on a biannual basis. This third party managed survey measures employees’ level of engagement against external norms and provides us with actionable feedback that drives improvement priorities. Participation in our most recent survey in 2024 was 93 percent, which we believe reflects our employees’ desire to share their perspectives and a commitment to continuous improvement. Survey results help shape action plans to further improve our culture and we will conduct the survey again in 2026.
Diversity and Inclusion. As reflected in our Guiding Principles, we strive to create a workplace where people from all backgrounds can thrive and achieve their fullest potential. Our commitment to this objective starts at the top with our Board of Directors, which is 40 percent diverse from either a gender or ethnic/racial perspective.
Compensation and Benefits. We provide what we believe is a robust total compensation program designed to be market-competitive and internally equitable to attract, retain, motivate and reward a high-performance workforce. Regular internal and external analysis is performed to ensure this market alignment. In addition to salaries, these programs, which vary by country, can include annual performance-based bonuses, stock-based compensation awards, retirement plans with employee matching opportunities, health benefits, health savings and flexible spending accounts, paid time off, family leave, and tuition assistance, among others.
Training and Development. We provide all employees with a wide range of professional development experiences, both formal and informal, to help them achieve their full potential. All of our salaried employees are given formal development plans. Some of the formal development programs that employees have access to include early-career leadership development programs, front-line leadership development programs, continuous improvement skill-building programs, core process technology councils and tuition reimbursement for degree programs or trade schools. To maintain our focus on career development all our salaried employees worldwide are required to have career conversations with their manager. Globally, all office and professional employees also have formal performance reviews and development plans with a focus on learning by doing. We expect our managers to work closely with their employees to ensure performance feedback and to conduct development discussions on a regular basis.
Safety. The safety of our people is always at the forefront of what we do. We provide safety training in our production facilities, designed to empower our employees with the knowledge and tools they need to make safe choices and mitigate risks. In addition to traditional training, we use standardized signage and visual management throughout our facilities. Since 1954, we have annually awarded the Lloyd B. Smith President's Safety Award, which acknowledges an A. O. Smith facility that demonstrates the most improvement over one year in the area of workplace safety.
BACKLOG
Due to the short-cycle nature of our businesses, our operations do not normally sustain significant backlogs.
GOVERNMENT REGULATIONS AND ENVIRONMENTAL MATTERS
Our operations, including the manufacture, packaging, labeling, storage, distribution, advertising and sale of our products, are subject to various federal, state, local and foreign laws and regulations. In the U.S., many of our products are regulated by the Department of Energy, the Consumer Product Safety Commission, and the Federal Trade Commission. State and local governments, through laws, regulations, and building codes, also regulate our water heating and water treatment products. Whether at the federal, state, or local level, these laws are intended to improve energy efficiency and product safety, and protect public health and the environment. In recent years, a number of states and local authorities have proposed or implemented bans on gas-fired products in new construction in an effort to address greenhouse gas emissions. Similar laws and regulations have been adopted by government authorities in other countries in which we manufacture, distribute, and sell our products. We offer a complete line of water and hydronic heating products, including electric-powered water heaters and boilers, and we believe that any reduction in fossil fuel-powered products would be counterbalanced by a corresponding increase in demand for our non-fossil fuel powered products. We are confident that our continued emphasis on product design and innovation, including energy efficiency, will keep us well positioned to deliver products demanded by customers, regardless of fuel source.
In addition, our operations are subject to federal, state and local environmental laws. We are subject to regulations of the U.S. Environmental Protection Agency and the Occupational Health and Safety Administration and their counterpart state agencies. Compliance with government regulations and environmental laws has not had and is not expected to have a material effect upon the capital expenditures, earnings, or competitive position of our company. See Item 3.
AVAILABLE INFORMATION
We maintain a website with the address www.aosmith.com. The information contained on our website is not included as a part of, or incorporated by reference into, this Annual Report on Form 10-K. We make available free of charge through our website our Annual Report on Form 10-K, quarterly reports on Form 10-Q, current reports on Form 8-K and amendments to these reports as soon as reasonably practical after we have electronically filed such material with, or furnished such material to, the Securities and Exchange Commission (SEC). All reports we file with the SEC are also available free of charge via EDGAR through the SEC’s website at www.sec.gov.
We are committed to sound corporate governance and have documented our corporate governance practices by adopting the A. O. Smith Corporate Governance Guidelines. The Corporate Governance Guidelines, Criteria for Selection of Directors, Financial Code of Ethics, the A. O. Smith Guiding Principles, as well as the charters for the Audit, Personnel and Compensation, Nominating and Governance and the Investment Policy Committees of the Board of Directors and other corporate governance materials, may be viewed on the Company’s website. Any waiver of or amendments to the Financial Code of Conduct or the A. O. Smith Guiding Principles would be posted on this website; to date there have been none. Copies of these documents will be sent to stockholders free of charge upon written request of the corporate secretary at the address shown on the cover page of this Annual Report on Form 10-K.
We are also committed to growing our business in a sustainable and socially responsible manner consistent with our Guiding Principles. This commitment has driven us to design, engineer and manufacture highly innovative and efficient products in an environmentally responsible manner that helps reduce energy consumption, conserve water and improve drinking water quality and public health. Consistent with this commitment, we issued our sustainability report biennially detailing our company’s historical and current efforts. We issued our fourth report, the 2024 sustainability report, in November 2024, documenting our environmental, social, and governance (ESG) activities over the past two years. This report details the positive impact of our highly efficient products, highlights our company’s commitment to employees and the communities in which we operate, reports on our progress toward our greenhouse gas emissions intensity reduction goal of 10 percent by 2025 (2019 baseline) and announced a new water goal to achieve an annual water savings of 40 million gallons by 2030 (2023 baseline). We have made significant progress toward our emission reduction goal and prevented over 560,000 metric tons of carbon emissions in 2023 through the sale of our high efficiency water heaters and boilers. Our ESG Scorecard (scorecard) reflecting our progress is available on our website. Our scorecard also provides information on our employee diversity, product stewardship, and recordable incident rate, among other items. Our Sustainability Report and scorecard are available on our website and not included as part of, or incorporated by reference into, this Annual Report on Form 10-K.
ITEM 1A – RISK FACTORS
In the ordinary course of our business, we face various strategic, operating, compliance and financial risks. These risks could have an impact on our business, financial condition, operating results and cash flows. The risks set forth below are not an exhaustive list of potential risks but reflect those that we believe to be material. You should carefully consider the risk factors set forth below and all other information contained in this Annual Report on Form 10-K, including the documents incorporated by reference, before making an investment decision regarding our common stock. If any of the events contemplated by the following risks were to actually occur, then our business, financial condition, or results of operations could be materially adversely affected. As a result, the trading price of our common stock could decline, and you may lose all or part of your investment.
Economic and Industry Risks
■The effects of global and regional economic conditions could have a material adverse effect on our business
A decline in economic activity, such as a recession or economic downturn, in the U.S., China, and other regions in the world in which we do business, could further adversely affect consumer confidence and spending patterns which could result in decreased demand for the products we sell, a delay in purchases, increased price competition, or slower adoption of energy-efficient water heaters and boilers, or high-quality water treatment products, which could negatively impact our profitability and cash flows. Such deterioration in economic conditions could arise from many factors or fears including public health crises, further deterioration in the property market, political instability or risk of government default. In addition, an increase in price levels generally or in particular industries, could result in a consumer shift away from the products we offer, including trading down to lower priced models, which could adversely affect our revenues and, at the same time, increase our costs. A deterioration in economic conditions also could negatively impact our vendors and customers, which could result in an increase in bad debt expense, customer and vendor bankruptcies, interruption or delay in supply of materials, or increased material prices, which could negatively impact our ability to distribute, market and sell our products and our financial condition, results of operations and cash flows.
■Import tariffs, taxes, customs duties and other trading regulations imposed by the U.S. government and retaliatory responses from other countries, could significantly increase the prices we pay for raw materials that are critical to our ability to manufacture our products
Import tariffs, taxes, customs duties and other trading regulations imposed by the U.S. government on foreign countries, or by foreign countries on the U.S., could significantly increase the prices we pay for raw materials that are critical to our ability to manufacture our products. And, we may be unable to find a domestic supplier to provide the necessary raw materials on an economical basis in the amounts we require. Also, the current U.S. administration has expressed a desire to impose substantial new or increased tariffs. Any widespread imposition of new or increased tariffs could increase the cost of and reduce the demand for our products and any cost increases will either require us to increase prices, foreclose our sales into impacted markets or negatively impact our profit margins. Any new or increased tariffs could also trigger retaliatory responses from other countries which may decrease the competitiveness of our products in foreign markets. New or increased tariffs could also negatively affect U.S. national or regional economies, which could negatively affect the demand for our products.
Unfavorable changes to import tariffs, taxes, customs duties and other trading regulations could have a material adverse effect on our financial condition, results of operations and cash flows.
■The occurrence or threat of extraordinary events, including natural disasters, political disruptions, terrorist attacks, public health issues, and acts of war, could significantly disrupt production, or impact consumer spending
As a global company with a large international footprint, we are subject to increased risk of damage or disruption to us and our employees, facilities, suppliers, distributors, or customers. Extraordinary events, including natural disasters, resulting from but not limited to climate change, political disruptions, terrorist attacks, public health issues and acts of war may disrupt our business and operations and impact our supply chain and access to necessary raw materials or could adversely affect the economy generally, resulting in a loss of sales and customers. Any of these disruptions or other extraordinary events outside of our control that impact our operations or the operations of our suppliers and key distributors could affect our business negatively, harming operating results.
Natural disasters and extreme weather conditions may disrupt the productivity of our facilities. For example, two of our manufacturing plants are located within a floodplain that has experienced past flooding events. We also have other manufacturing facilities located in hurricane and earthquake zones. We maintain insurance coverage and have taken steps to mitigate these physical risks related to natural disasters and extreme weather conditions. Although we have taken steps to
mitigate the risk of flooding, there is still the potential for natural disasters and extreme weather conditions to disrupt the productivity of our facilities.
Apart from the potential impact on our operations, these types of events also could negatively impact consumer spending in the impacted regions or depending on the severity, globally, which could materially and adversely affect our financial condition, results of operations and cash flows.
■Our business could be adversely impacted by changes in consumer purchasing behavior, consumer preferences, technological changes, and market trends
Consumer preferences for products and the methods in which they purchase products are constantly changing based on, among other factors, cost, performance, convenience, availability of government incentives, environmental and social concerns and perceptions. As consumer confidence changes, purchasing behavior may shift the product mix to lower priced models in the markets in which we participate or result in a shift to other distribution channels, for example e-commerce. Consumer preferences and broader trends, such as decarbonization and electrification efforts in response to climate change, may result in reduced demand for gas or fossil fuel-powered products and increased demand for higher efficiency products and/or more electric powered products. In addition, technologies are ever changing. Our ability to respond to these trends, timely transition our product portfolio, develop new and innovative products, and acquire and protect the necessary intellectual property rights is essential to our continued success, but cannot reasonably be assured. It is possible that we will not be able to develop new technologies, products or distribution channels, or do so on a timely basis, to align with consumer purchasing behavior and consumer preferences, which could materially and adversely affect our financial condition, results of operations and cash flows.
■Our operations could be adversely impacted by material and component price volatility, as well as supplier concentration
The market prices for certain materials and components we purchase, primarily steel, can be volatile. In recent years, we have also experienced inflation-related increases in our transportation and other costs. In addition tariffs could potentially increase volatility in steel and other input materials. Significant increases in the cost of any of the key materials and components we purchase would increase our cost of doing business and ultimately could lead to lower operating earnings if we are not able to recover these cost increases through price increases to our customers. Historically, there has been a lag in our ability to recover increased material costs from customers, and that lag, could negatively impact our profitability. In some cases, we are dependent on a limited number of suppliers for some of the raw materials and components we require in the manufacturing of our products. A significant disruption or termination of the supply from one of these suppliers could delay sales or increase costs which could result in a material adverse effect on our financial condition, results of operations and cash flows.
■Because we participate in markets that are highly competitive, our revenues and earnings could decline as we respond to competition
We sell all of our products in highly competitive and evolving markets. We compete in each of our targeted markets based on product design, reliability, quality of products and services, advanced technologies, product performance, maintenance costs and price. Some of our competitors may have greater financial, marketing, manufacturing, research and development and distribution resources than we have; others may invest little in technology or product development but compete on price and the rapid replication of features, benefits, and technologies, and some are increasingly expanding beyond their existing manufacturing or geographic footprints. New technologies and new competitors have developed and continue to develop in certain markets in which we participate, such as gas tankless and heat pump technologies in North America. While we design and manufacture these and other products, we cannot assure that our products will continue to compete successfully with those of our current competitors and new market participants and it is possible that we will not be able to retain our customer base or improve or maintain our profit margins on sales to our customers. There is also increasing use of data analytics, machine learning, and artificial intelligence software, which our competitors may be able to use more effectively or implement more successfully than we are able to do. Failure to adapt to the evolving competitive environment could materially and adversely affect our financial condition, results of operations and cash flows.
■Because approximately 21 percent of our sales in 2024 were attributable to China, adverse economic conditions or changes in consumer behavior in China could impact our business
Our third-party sales in China decreased six percent in local currency in 2024 compared to 2023. We derive a substantial portion of our sales in China from premium-tier products. Changes in consumer preferences and purchasing behaviors including preferences for e-commerce and manufacturer emphasis on brand ecosystems and connectivity, weakening consumer confidence and sentiment, as well as economic uncertainty, sociopolitical and demographic risks, availability of
government incentives, and increased competition from Chinese-based companies may prompt Chinese consumers to postpone purchases, choose lower-priced products or different alternatives, or lengthen the cycle of replacement purchases. Further deterioration in the Chinese economy may adversely affect our financial condition, results of operations and cash flows.
Business, Operational, and Strategic Risks
■We sell our products and operate outside the U.S., and to a lesser extent, rely on imports and exports, which may present additional risks to our business
Approximately 32 percent of our sales in 2024 were attributable to products sold outside of the U.S., primarily in China and Canada, and to a lesser extent in Europe and India. We also have operations and business relationships outside the U.S. that comprise a portion of our manufacturing, supply, and distribution. Approximately 5,000 of our 12,700 employees as of December 31, 2024 were located in China. At December 31, 2024, approximately $206 million of cash and marketable securities were held by our foreign subsidiaries, substantially all of which were located in China. International operations generally are subject to various risks, including: political, religious, and economic instability; local labor market conditions; new or increased tariffs or other trade restrictions, or changes to trade agreements; the impact of foreign government regulations, actions or policies; the effects of income taxes; governmental expropriation; the changes or imposition of statutory restrictions which prohibit repatriation of cash; the imposition or increases in withholding and other taxes on remittances and other payments by foreign subsidiaries; labor relations problems; the imposition of environmental or employment laws, or other restrictions or actions by foreign governments; and differences in business practices.
Unfavorable changes in the political, regulatory, or trade climate, diplomatic relations, or government policies, particularly in relation to countries where we have a presence, including Canada, China, India and Mexico, could have a material adverse effect on our financial condition, results of operations and cash flows or our ability to repatriate funds to the U.S.
■A material loss, cancellation, reduction, or delay in purchases by one or more of our largest customers could harm our business
Sales to our five largest customers represented approximately 42 percent of our sales in 2024. We expect that our customer concentration will continue for the foreseeable future. Our concentration of sales to a relatively small number of customers makes our relationships with each of these customers important to our business. We cannot assure that we will be able to retain our largest customers. Some of our customers may shift their purchases to our competitors in the future. Our customers may experience financial instability, affecting their ability to make or pay for future purchases. Further, a customer may be acquired by a customer of a competitor which could result in our loss of that customer. The loss of one or more of our largest customers, any material reduction or delay in sales to these customers, or our inability to successfully develop relationships with additional customers could have a material adverse effect on our financial position, results of operations and cash flows.
■A portion of our business could be adversely affected by a decline in North American new residential or commercial construction or a decline in replacement-related volume of water heaters and boilers, including a decline in demand for commercial spaces
Residential new construction activity in North America and industry-wide replacement-related volume of water heaters were flat in 2024 after growth in 2023. New residential housing starts in the U.S. are projected to be approximately flat in 2025. Commercial construction activity in North America grew in 2024, although at a slower rate than 2023. We believe that the significant majority of the markets we serve are for the replacement of existing products, and residential water heater replacement volume has been strong. In recent years, businesses and commercial spaces have experienced and may experience in the future, fluctuation in demand and in occupancy that may reduce demand for our products, and commercial sectors, such as the restaurant and hospitality industries in which we have customers, may experience long-term shifts in consumer behavior which could negatively impact demand or capacity and may not return to pre-pandemic levels. In addition, the acceptance of remote work arrangements could negatively impact demand for commercial construction. Changes in the replacement volume and in the construction market in North America could negatively affect us.
■An inability to adequately maintain our information systems and their security, as well as to protect data and other confidential information, could adversely affect our business and reputation
In the ordinary course of business, we utilize information systems for day-to-day operations, to collect and store sensitive data and information, including our proprietary and regulated business information and personally identifiable information of our customers, suppliers and business partners, as well as personally identifiable information about our employees. Our information systems are susceptible to outages due to system failures, cybersecurity threats, failures on the part of third-party information system providers, natural disasters, power loss, telecommunications failures, viruses, fraud, theft, malicious
actors or breaches of security. Like many companies, we, and some third parties upon which we rely, have experienced cybersecurity incidents and attacks on information technology networks and systems, products and services in the past but, to date, none have resulted in a material breach or had a material adverse impact on our financial condition, results of operations, or cash flows. We may experience such incidents and attacks in the future, potentially with increasing frequency from increasingly sophisticated cyber threats. In addition, remote work and remote access to our systems have increased in recent years, which may heighten these risks. Use of artificial intelligence software may also create risks from unintentional disclosure of proprietary, confidential, personal or otherwise sensitive information. Although we have a response plan in place in the event of a data breach and we have an active program to maintain and improve data security and address these risks and uncertainties by implementing and improving internal controls, security technologies, insurance programs, network and data center resiliency and recovery processes, a successful attack in the future could result in operations failure or breach of security that could lead to disruptions of our business activities and the loss or disclosure of both our and our customers’ financial, product and other confidential information and could result in regulatory actions, significant expense and litigation and have a material adverse effect on our financial condition, results of operations and cash flows and our reputation.
■Our international operations are subject to risks related to foreign currencies
We have a significant presence outside of the U.S., primarily in China and Canada and to a lesser extent Europe, Mexico, and India, and therefore, hold assets, including $119 million of cash and marketable securities denominated in Chinese renminbi, incur liabilities, earn revenues and pay expenses in a variety of currencies other than the U.S. dollar. The financial statements of our foreign subsidiaries are translated into U.S. dollars in our consolidated financial statements. Furthermore, typically our products are priced in foreign countries in local currencies. As a result, we are subject to risks associated with operating in foreign countries, including fluctuations in currency exchange rates and interest rates, or global exchange rate instability or volatility that strengthens the U.S. dollar against foreign currencies. An increase in the value of the U.S. dollar relative to the local currencies of our foreign markets, particularly in China, has negatively affected our sales, profitability, and cash and cash equivalents balances and could have such effects in the future. In 2024, the change in foreign currencies negatively impacted our sales and cash and cash equivalents by approximately $18 million and $7 million, respectively. In addition to currency translation risks, we incur a currency transaction risk whenever one of our subsidiaries enters into a purchase or sale transaction using a currency different from the operating subsidiaries’ functional currency. The majority of our foreign currency transaction risk results from sales of our products in Canada, a portion of which we manufacture in the U.S., and to a lesser extent from component purchases in Europe and India and payroll in Mexico. These risks may adversely impact our reported sales and profits in the future or negatively impact revenues and earnings translated from foreign currencies into U.S. dollars.
■Our business may be adversely impacted by product defects
Product defects can occur through our own product development, design and manufacturing processes or through our reliance on third parties for component design and manufacturing activities. We may incur various expenses related to product defects, including product warranty costs, product liability and recall or retrofit costs. While we maintain a reserve for product warranty costs based on certain estimates and our knowledge of current events and actions, our actual warranty costs may exceed our reserve, resulting in current period expenses and a need to increase our reserves for warranty charges. In addition, product defects and recalls may diminish the reputation of our brand. Further, our inability to cure a product defect could result in the failure of a product line or the temporary or permanent withdrawal from a product or market. Any of these events may have a material adverse impact on our financial condition, results of operations and cash flows.
■Potential acquisitions could use a significant portion of our capital and we may not successfully integrate future acquisitions or operate them profitably or achieve strategic objectives
We will continue to evaluate potential acquisitions, and we could use a significant portion of our available capital to fund future acquisitions. We may not be able to successfully integrate future acquired businesses or operate them profitably or accomplish our strategic objectives for those acquisitions. If we complete any future acquisitions in new geographies, our unfamiliarity with relevant regulations and market conditions may impact our ability to operate them profitably or achieve our strategic objectives for those acquisitions. Our level of indebtedness may increase in the future if we finance acquisitions with debt, which would cause us to incur additional interest expense and could increase our vulnerability to general adverse economic and industry conditions and limit our ability to service our debt or obtain additional financing. The impact of future acquisitions may have a material adverse effect on our financial condition, results of operations and cash flows.
Legal, Regulatory, and Governance Risks
■Changes in regulations or standards, such as those associated with climate change, could adversely affect our business
Our products are subject to a wide variety of statutory, regulatory, codes and industry standards and requirements related to, among other items, energy and water efficiency, environmental emissions, labeling and safety. For example, the Department of Energy (DOE) has adopted a new efficiency rule for commercial water heaters that will take effect in 2026 and for our residential water heaters that will take effect in 2029. In addition, new national drinking water standards regulating per- and poly-fluoroalkyl substances (PFAS), as well as lead, could affect the demand for our water filtration products. There are also a number of federal, foreign, state and local governments adopting laws, regulations and codes in response to climate change that require a transition to non-fossil fuel based sources of energy production as well as significantly reducing or eliminating the on-site combustion of fossil fuels in the building sector. We believe our products are currently efficient, safe and environment-friendly. However, a significant change to regulatory or code requirements that promotes a transition to alternative energy sources as a replacement for gas, or a significant shift in industry standards, could substantially increase manufacturing costs, capital expenditures, transportation costs and raw material costs, alter distribution channels, attract new competitors, impact the size and timing of demand for our products, affect the types of products we are able to offer or put us at a competitive disadvantage, any of which could harm our business and have a material adverse effect on our financial condition, results of operations and cash flow.
■We are subject to U.S. and global laws and regulations covering our domestic and international operations that could adversely affect our business and results of operations
Due to our global operations, we are subject to many laws governing international relations, including those that prohibit improper payments to government officials and restrict where we can do business, what information or products we can supply to certain countries and what information we can provide to a non-U.S. government, including but not limited to the Foreign Corrupt Practices Act and the U.S. Export Administration Act. Violations of these laws may result in criminal penalties or sanctions that could have a material adverse effect on our financial condition, results of operations and cash flows.
■Our sustainability commitments could result in additional costs, and our inability to achieve them could have an adverse impact on our reputation and performance
We periodically communicate our strategies, commitments and targets related to sustainability matters, including carbon emissions, water usage, and human rights, through the issuance of our sustainability report. Although we intend to meet these strategies, commitments and targets and are committed to advancing sustainable innovations in our industry, we may be unable to achieve them due to availability of resources, significant increases in operational costs, and technological changes. Failure to meet these sustainability requirements or targets could adversely impact our reputation as well as the demand for our products and adversely affect our business, financial condition and results of operations. In addition, standards and processes for measuring and reporting carbon emissions, water usage, and other sustainability metrics may change over time, result in inconsistent data, or result in significant revisions to our strategies, commitments and targets, or our ability to achieve them. Any scrutiny of our carbon emissions or other sustainability disclosures or our failure to achieve related strategies, commitments and targets could negatively impact our reputation or performance.
■Our results of operations may be negatively impacted by product liability lawsuits and claims
Our products expose us to potential product liability risks that are inherent in the design, manufacture, sale and use of our products. While we currently maintain what we believe to be suitable product liability insurance, we cannot be certain that we will be able to maintain this insurance on acceptable terms, that this insurance will provide adequate protection against potential liabilities or that our insurance providers will be able to ultimately pay all insured losses. In addition, we self-insure a portion of product liability claims. A series of successful claims against us could materially and adversely affect our reputation and our financial condition, results of operations and cash flows.
■We have significant goodwill and indefinite-lived intangible assets and an impairment of our goodwill or indefinite-lived intangible assets could cause a decline in our net worth
Our total assets include significant goodwill and indefinite-lived intangible assets. Our goodwill results from our acquisitions, representing the excess of the purchase prices we paid over the fair value of the net tangible and intangible assets we acquired. We assess whether there have been impairments in the value of our goodwill or indefinite-lived intangible assets during the fourth quarter of each calendar year or sooner if triggering events warrant. If future operating performance at our businesses does not meet expectations, we may be required to reflect non-cash charges to operating results for goodwill or indefinite-lived intangible asset impairments. The recognition of an impairment of a significant portion of goodwill or indefinite-lived intangible assets would negatively affect our results of operations and total capitalization, the effect of which could be material. A significant reduction in our stockholders’ equity due to an impairment of goodwill or indefinite-lived intangible assets may affect our ability to maintain the debt-to-capital ratio required under our existing debt arrangements. We have identified the valuation of goodwill and indefinite-lived intangible assets as a critical accounting policy. See “Management’s Discussion and Analysis of Financial Condition and Results of Operations - Critical Accounting Policies - Goodwill and Indefinite-lived Intangible Assets” included in Item 7 of this Annual Report on Form 10-K.
■Certain members of the founding family of our company and trusts for their benefit have the ability to influence all matters requiring stockholder approval
We have two classes of common equity: our Common Stock and our Class A Common Stock. The holders of Common Stock currently are entitled, as a class, to elect only one-third of our Board of Directors. The holders of Class A Common Stock are entitled, as a class, to elect the remaining directors. Certain members of the founding family of our company and trusts for their benefit (Smith Family) have entered into a voting trust agreement with respect to shares of our Class A Common Stock and shares of our Common Stock they own. As of December 31, 2024, through the voting trust, these members of the Smith Family own approximately 66.8 percent of the total voting power of our outstanding shares of Class A Common Stock and Common Stock, taken together as a single class, and approximately 96.9 percent of the voting power of the outstanding shares of our Class A Common Stock, as a separate class. Due to the differences in the voting rights between shares of our Common Stock (one-tenth of one vote per share) and shares of our Class A Common Stock (one vote per share), the Smith Family voting trust is in a position to control to a large extent the outcome of matters requiring a stockholder vote, including the adoption of amendments to our certificate of incorporation or bylaws or approval of transactions involving a change of control. This ownership position may increase if other members of the Smith Family enter into the voting trust agreement, and the voting power relating to this ownership position may increase if shares of our Class A Common Stock held by stockholders who are not parties to the voting trust agreement are converted into shares of our Common Stock. The voting trust agreement provides that, in the event one of the parties to the voting trust agreement wants to withdraw from the trust or transfer any of its shares of our Class A Common Stock, such shares of our Class A Common Stock are automatically exchanged for shares of our Common Stock held by the trust to the extent available in the trust. In addition, the trust will have the right to purchase the shares of our Class A Common Stock and our Common Stock proposed to be withdrawn or transferred from the trust. As a result, the Smith Family members that are parties to the voting trust agreement have the ability to maintain their collective voting rights in our company even if certain members of the Smith Family decide to transfer their shares.
ITEM 1B – UNRESOLVED STAFF COMMENTS
None.
ITEM 1C – CYBERSECURITY
Cybersecurity Governance
We recognize the importance of maintaining the safety and security of our systems and data and have a holistic process for overseeing and managing cybersecurity and related risks. This process is supported by both our management and our Board of Directors.
Our Chief Information Officer (CIO) oversees our information systems and cybersecurity function and reports to our Chief Operating Officer (COO). She has over 30 years of experience in leading information systems management, strategy, and operational execution, including incident management, prevention, and response. Our Senior Director of Global Information Security (ISD) reports to our CIO and is responsible for the protection and defense of our networks and systems and managing cybersecurity risk. He has over 20 years of experience in managing cybersecurity and related risks, including threat identification, incident response, and defense strategies. Our CIO and ISD are supported by a direct and cross-functional team of professionals with broad experience and expertise in threat assessment and detection, mitigation technologies, training, incident response, and regulatory compliance.
Our Board of Directors is responsible for overseeing our enterprise risk management activities in general, which includes our management of information and cybersecurity risk. The full Board receives an update on our cyber risk management process and trends related to cybersecurity at least annually, or real-time if a material event occurs. The Audit Committee of the Board assists the full Board in its oversight of cybersecurity risks. As part of its oversight, the Audit Committee receives regular reports from management on information systems and security, including metrics and controls at each meeting, and other items at least annually including risk assessments, security software, incident response plans, and key updates to the cybersecurity program and its effectiveness.
We have also established a committee of our executive leadership team to consider cybersecurity risks and to consider mitigation strategies in managing the risk. Our CIO and ISD participate on this committee, which meets regularly. We have an established incident response plan led by our CIO and ISD to assess, respond, and report in the event of a cybersecurity incident. Depending on the nature and severity of the incident, the plan requires escalating notifications up to our CEO, Audit Committee and our Board.
Cybersecurity Risk Management
Our cybersecurity risk management program is integrated into our overall enterprise risk management program, and shares common methodologies, reporting channels and governance processes that apply across the enterprise risk management program consistent with other legal, compliance, strategic, operational, and financial risk areas. Our program is guided by cybersecurity frameworks, such as the National Institute of Standards and Technology Cybersecurity Framework (NIST CSF), although we also look to other standards to help us identify, assess, and manage cybersecurity risks relevant to our business.
The Company has a robust cybersecurity program to assess, identify and manage material risk from cybersecurity threats and to prevent, detect and respond to cybersecurity threats, including those associated with the use of third-party service providers. Our approach to cybersecurity risk management includes:
•Cybersecurity awareness training, including interactive simulations and tabletop exercises for our employees, incident response personnel, senior management, and our Board;
•Periodic risk assessments designed to help identify significant or potentially material cybersecurity risks to our critical systems, information, and our broader enterprise information technology (IT) environment;
•The use of external service providers, where appropriate, to assess, test or otherwise assist with aspects of our security controls;
•A multi-layered defense and continuous monitoring strategy employing various tools and testing, and incorporating lessons learned from our defense and monitoring efforts to help prevent future attacks;
•Regular testing by our Internal Audit function of controls related to our financial information systems; and
•Information security assessments conducted on third parties with whom we share sensitive electronic data against established cybersecurity frameworks;
While we have experienced cybersecurity incidents in the past, to-date none have materially affected the Company or our financial position, results of operations and/or cash flows. We continue to invest in cybersecurity and the resiliency of our networks, including our controls and processes, all of which are designed in an effort to protect our IT systems and infrastructure, and the information they contain. For more information regarding the risks we face from cybersecurity threats, please see Item 1A - Risk Factors.
ITEM 2 – PROPERTIES
Properties utilized by us at December 31, 2024 were as follows:
North America
In this segment, we have 23 manufacturing and assembly plants located in 13 states and two non-U.S. countries, of which 18 are owned directly by us or our subsidiaries and five are leased from outside parties. The terms of leases in effect at December 31, 2024, expire between 2025 and 2028.
Rest of World
In this segment, we have five manufacturing plants located in three non-U.S. countries, of which four are owned directly by us or our subsidiaries and one is leased from an outside party. The terms of the lease in effect at December 31, 2024, expire in 2035.
Corporate and General
We consider our plants and other physical properties to be suitable, adequate, and of sufficient productive capacity to meet the requirements of our business. Our manufacturing plants operate at varying levels of utilization depending on the type of operation and market conditions. The executive offices of the Company, which are leased, are located in Milwaukee, Wisconsin.
ITEM 3 – LEGAL PROCEEDINGS
We are involved in various unresolved legal actions, administrative proceedings and claims in the ordinary course of our business involving product liability, property damage, insurance coverage, exposure to asbestos and other substances, patents and environmental matters, including the disposal of hazardous waste. Although it is not possible to predict with certainty the outcome of these unresolved legal actions or the range of possible loss or recovery, we believe, based on past experience, adequate reserves and insurance availability, that these unresolved legal actions will not have a material effect on our financial position or results of operations. A more detailed discussion of certain of these matters appears in Note 16, “Commitments and Contingencies” of Notes to the Consolidated Financial Statements.
ITEM 4 – MINE SAFETY DISCLOSURES
Not applicable.
EXECUTIVE OFFICERS OF THE COMPANY
Pursuant to General Instruction of G(3) of Form 10-K, the following is a list of our executive officers which is included as an unnumbered Item in Part I of this report in lieu of being included in our Proxy Statement for our 2025 Annual Meeting of Stockholders.
| | | | | | | | | | | | | | |
| Name (Age) | | Positions Held | | Period Position Was Held |
| Samuel M. Carver (55) | | Senior Vice President – Global Operations | | 2021 to Present |
| | | | |
| | Vice President – North America Manufacturing | | 2011 to 2021 |
| | | | |
| | Various A. O. Smith Management Positions | | 2006 to 2011 |
| | | | |
| Robert J. Heideman (58) | | Senior Vice President – Chief Technology Officer | | 2013 to Present |
| | | | |
| | Senior Vice President – Engineering & Technology | | 2011 to 2012 |
| | | | |
| | Various A. O. Smith Management Positions | | 2002 to 2011 |
| | | | |
| D. Samuel Karge (50) | | Senior Vice President | | 2018 to Present |
| | | | |
| | President – North America Water Treatment | | 2018 to Present |
| | | | |
| | Vice President, Sales and Marketing – Zurn Industries (water solutions manufacturer) | | 2016 to 2018 |
| | | | |
| Parag Kulkarni (57) | | Senior Vice President, International | | 2022 to Present |
| | | | |
| | President - A. O. Smith India Water Products Private Limited | | 2022 to Present |
| | | | |
| | Managing Director - A. O. Smith India Water Products Private Limited | | 2015 to 2022 |
| | | | |
| Charles T. Lauber (62) | | Executive Vice President and Chief Financial Officer | | 2019 to Present |
| | | | |
| | Senior Vice President, Strategy and Corporate Development | | 2013 to 2019 |
| | | | |
| | Senior Vice President – Chief Financial Officer – A. O. Smith Water Products Company | | 2006 to 2012 |
| | | | |
| | Various A. O. Smith Management Positions | | 1999 to 2006 |
| | | | |
| Stephen D. O'Brien (56) | | Senior Vice President | | 2024 to Present |
| | | | |
| | President and General Manager - North America Water Heating | | 2024 to Present |
| | | | |
| | Senior Vice President; President - Lochinvar, LLC | | 2022 to 2024 |
| | | | |
| | Chief Operating Officer – Lochinvar, LLC | | 2021 to 2022 |
| | | | |
| | Senior Vice President - Mitsubishi Electric Trane US (manufacturer of heating and air-conditioning systems) | | 2017 to 2021 |
| | | | |
| Jack Qiu (52) | | Senior Vice President | | 2020 to Present |
| | | | |
| | President - A. O. Smith China | | 2020 to Present |
| | | | |
| | Vice President - A. O. Smith China | | 2012 to 2020 |
| | | | |
| | Various A. O. Smith Management Positions | | 2003 to 2012 |
| | | | |
| S. Melissa Scheppele (62) | | Senior Vice President - Chief Information Officer | | 2020 to Present |
| | | | |
| | Vice President and Chief Information Officer - Triumph Group (aerospace and defense business) | | 2016 to 2020 |
| | | | |
| | | | |
| | | | |
| | | | |
| | | | | | | | | | | | | | |
| Name (Age) | | Positions Held | | Period Position Was Held |
| Darrell W. Schuh (56) | | Senior Vice President | | 2024 to Present |
| | | | |
| | President - Lochinvar, LLC | | 2024 to Present |
| | | | |
| | Vice President and General Manager - APCOM and Water Systems | | 2017 to 2024 |
| | | | |
| | Vice President - Product Engineering | | 2012 to 2017 |
| | | | |
| Curtis E. Selby (57) | | Senior Vice President - Human Resources and Public Affairs | | 2024 to Present |
| | | | |
| | Chief Operating Officer - Board & Brush Creative Studio (painting workshops) | | 2015 to 2024 |
| | | | |
| | CHRO - Gardner Denver (manufacturer of compressors, blowers and vacuum pumps) | | 2014 to 2015 |
| | | | |
| | Vice President of International Human Resources - Regal Beloit (manufacturer of electric motors) | | 2011 to 2014 |
| | | | |
| | Vice President of Global Human Resources - A. O. Smith Electrical Products Company | | 2005 to 2011 |
| | | | |
| | Director of Human Resources - A. O. Smith Electrical Products Company | | 2001 to 2005 |
| | | | |
| Stephen M. Shafer (49) | | President and Chief Operating Officer | | 2024 to Present |
| | | | |
| | President - Automotive and Aerospace Solutions Division of 3M Company (manufacturer of specialized materials and products used in the manufacturing, maintenance and repair of vehicles and aircraft) | | 2020 to 2024 |
| | | | |
| | Senior Vice President and Chief Strategy Officer - 3M Company (manufacturer of building materials, adhesives, medical and home cleaning supplies) | | 2019 to 2020 |
| | | | |
| James F. Stern (62) | | Executive Vice President, General Counsel and Secretary | | 2007 to Present |
| | | | |
| | Partner – Foley & Lardner LLP (law firm) | | 1997 to 2007 |
| | | | |
| Kevin J. Wheeler (65) | | Chairman | | 2020 to Present |
| | | | |
| | Chief Executive Officer | | 2018 to Present |
| | | | |
| | President | | 2017 to 2024 |
| | | | |
| | President and Chief Operating Officer | | 2017 to 2018 |
| | | | |
| | Senior Vice President | | 2013 to 2017 |
| | | | |
| | President and General Manager – North America, India and Europe Water Heating | | 2013 to 2017 |
| | | | |
| | Various A. O. Smith Management Positions | | 1999 to 2013 |
| | | | |
PART II
ITEM 5 – MARKET FOR REGISTRANT’S COMMON EQUITY, RELATED STOCKHOLDER MATTERS AND ISSUER PURCHASES OF EQUITY SECURITIES
(a)Market Information. Our Common Stock is listed on the New York Stock Exchange under the symbol AOS. Our Class A Common Stock is not listed. EQ Shareowner Services, P.O. Box 64874, St. Paul, Minnesota, 55164-0874 serves as the registrar, stock transfer agent and dividend reinvestment agent for our Common Stock and Class A Common Stock.
(b)Holders. As of January 31, 2025, the approximate number of stockholders of record of Common Stock and Class A Common Stock were 471 and 131, respectively. The actual number of stockholders is greater than this number of holders of record, and includes stockholders who are beneficial owners, but whose shares are held in street name by brokers and other nominees. This number of stockholders of record also does not include stockholders whose shares may be held in trust by other entities.
(c)Dividends. Dividends declared on the common stock are shown in Note 11, “Stockholders' Equity” of Notes to the Consolidated Financial Statements appearing elsewhere herein.
(d)Stock Repurchases. In 2024, the Board of Directors approved adding 2,000,000 shares of Common Stock to an existing discretionary share repurchase authority. Under the share repurchase program, the Common Stock may be purchased through a combination of Rule 10b5-1 automatic trading plan and discretionary purchases in accordance with applicable securities laws. The number of shares purchased and the timing of the purchases will depend on a number of factors, including share price, trading volume and general market conditions, as well as working capital requirements, general business conditions and other factors, including alternative investment opportunities. The stock repurchase authorization remains effective until terminated by our Board of Directors which may occur at any time, subject to the parameters of any Rule 10b5-1 automatic trading plan that we may then have in effect. In 2024, we repurchased 3,755,337 shares at an average price of $81.43 per share and at a total cost of $305.8 million. As of December 31, 2024, there were 1,746,125 shares remaining on the existing repurchase authorization. On January 26 2025, the Board of Directors approved adding 5,000,000 shares of common stock to the existing discretionary share repurchase authority. Including the additional shares, we have 6,476,677 shares available for repurchase as of the date of the Board of Directors' approval. We intend to spend approximately $400 million to repurchase Common Stock in 2025 through a combination of 10b5-1 plans and open-market purchases.
(e)Performance Graph. The following information in this Item 5 of this Annual Report on Form 10-K is not deemed to be “soliciting material” or to be “filed” with the SEC or subject to Regulation 14A or 14C under the Securities Exchange Act of 1934 or to the liabilities of Section 18 of the Securities Exchange Act of 1934, and will not be deemed to be incorporated by reference into any filing under the Securities Act of 1933 or the Securities Exchange Act of 1934, except to the extent we specifically incorporate it by reference into such a filing.
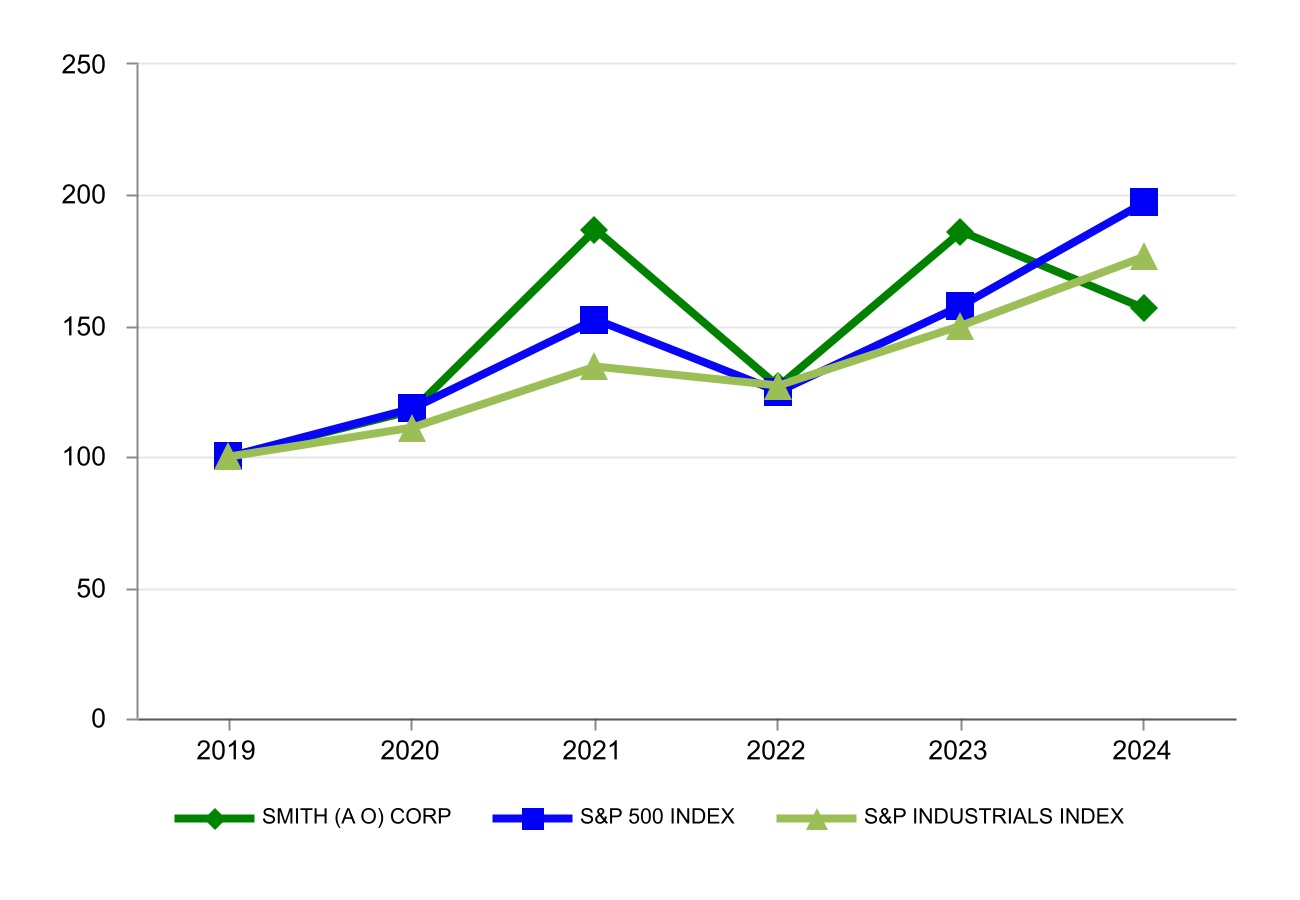
The graph below shows a five-year comparison of the cumulative shareholder return on our Common Stock with the cumulative total return of the Standard & Poor’s (S&P) 500 Index, S&P 500 Select Industrials Index, which are published indices.
Comparison of Five-Year Cumulative Total Return
From December 31, 2019 to December 31, 2024
Assumes $100 Invested with Reinvestment of Dividends
| | | | | | | | | | | | | | | | | | | | | | | | | | | | | | | | | | | |
| Base
Period | | Indexed Returns |
| Company/Index | 12/31/19 | | 12/31/20 | | 12/31/21 | | 12/31/22 | | 12/31/23 | | 12/31/24 |
| A. O. Smith Corporation | 100.0 | | | 117.4 | | | 186.9 | | | 126.8 | | | 186.1 | | | 156.5 | |
| S&P 500 Index | 100.0 | | | 118.4 | | | 152.4 | | | 124.8 | | | 157.6 | | | 197.0 | |
| S&P 500 Select Industrial Index | 100.0 | | | 111.0 | | | 134.5 | | | 127.1 | | | 150.2 | | | 176.4 | |
ITEM 6 – SELECTED FINANCIAL DATA
Not applicable.
ITEM 7 – MANAGEMENT’S DISCUSSION AND ANALYSIS OF FINANCIAL CONDITION AND RESULTS OF OPERATIONS
OVERVIEW
Our company is comprised of two reporting segments: North America and Rest of World. Our Rest of World segment is primarily comprised of China, Europe and India. Both segments manufacture and market comprehensive lines of residential and commercial gas, heat pump and electric water heaters, boilers, tanks, and water treatment products. Both segments primarily manufacture and market in their respective region of the world.
We continue to seek acquisitions that enable geographic growth, expand our core business, and establish adjacencies. On November 1, 2024, we acquired Pureit from Unilever for approximately $125 million, subject to customary adjustments. Pureit, a leading water purification business in South Asia, offers a broad range of residential water purification solutions and has annual sales of approximately USD $60 million. The acquisition fits squarely in our core capabilities and doubles our market penetration in the South Asia region. In the first quarter of 2024, we acquired Impact Water Products, a privately-held water treatment company. The acquisition supports our geographic expansion and growth strategy by expanding the West Coast presence of our water treatment business.
Also, we continue to look for opportunities to add to our existing product portfolio in high growth regions demonstrated by our previous introductions of kitchen products and connected product technologies in China. We also recently introduced our internally designed and manufactured gas tankless water heaters in North America. In addition, we are expanding our commercial water heater capacity in North America in preparation for the new efficiency rule for commercial water heaters that the Department of Energy (DOE) has adopted that will take effect in 2026.
In 2024, we recognized restructuring and impairment expenses of $17.6 million. In China, severance expenses of $11.3 million related to the right sizing of that business for current market conditions. The remaining $6.3 million related to the restructuring of our water treatment business in North America as a part of a profitability improvement strategy that prioritizes improving our cost structure and emphasizes our more profitable channels.
In our North America segment, we saw soft residential and commercial water heater order demand in the second half of 2024 after a strong first half of the year. We believe that a pre-buy ahead of our March 1st price increase pulled forward some demand into the first half of the year. We also believe our second half order demand was negatively impacted by our improved lead times. Those factors along with caution around softening of end market demand may have driven some customers to reduce their inventory levels. 2024 residential industry unit volumes were flat compared to the prior year and we project 2025 industry residential unit volumes will be flat as well. Proactive replacement has been above historical levels for the last several years and we project that will continue in 2025. We believe that new home construction remains in a deficit and will be flat compared to 2024. We anticipate that commercial water heater industry volumes will be approximately flat in 2025 after minimal growth in 2024 driven by growth in commercial electric water heaters greater than 55 gallons which was offset by lower shipments of commercial gas water heaters. We expect our boilers sales to grow between three and five percent in 2025 compared to 2024 as we continue to benefit from the transition to higher efficiency boilers. We anticipate sales of our North America water treatment products will be between $235 million and $245 million, a year-over-year decrease of approximately five percent as we de-emphasize certain channels and focus on our more profitable channels.
In our Rest of World segment, after sales growth of three percent in the first half of the year, our full-year 2024 third-party sales in China declined six percent due to a further weakening of consumer demand in the second half of the year. In 2025, we project our third-party sales in China to decrease between five to eight percent in local currency compared to 2024 as we expect consumer demand softness will persist in 2025.
Combining all of these factors, we expect our 2025 consolidated sales to be approximately flat to up two percent compared to 2024. Our guidance excludes the impacts from potential future acquisitions.
RESULTS OF OPERATIONS
In this section, we discuss the results of our operations for 2024 compared with 2023. We discuss our cash flows and current financial condition under “Liquidity and Capital Resources.” For a discussion related to 2023 compared with 2022, please refer to Item 7 of Part II, “Management’s Discussion and Analysis of Financial Condition and Results of Operations” in our Annual Report on Form 10-K for the Year Ended December 31, 2023, which was filed with the United States Securities and Exchange Commission (SEC) on February 13, 2024, and is available on the SEC's website at www.sec.gov.
| | | | | | | | | | | | | | | | | |
| Years Ended December 31, |
| (dollars in millions) | 2024 | | 2023 | | 2022 |
| Net sales | $ | 3,818.1 | | | $ | 3,852.8 | | | $ | 3,753.9 | |
| Cost of products sold | 2,362.0 | | | 2,368.0 | | | 2,424.3 | |
| Gross profit | 1,456.1 | | | 1,484.8 | | | 1,329.6 | |
| Gross profit margin % | 38.1 | % | | 38.5 | % | | 35.4 | % |
| Selling, general and administrative expenses | 739.3 | | | 727.4 | | | 670.9 | |
| Restructuring and impairment expenses | 17.6 | | | 18.8 | | | — | |
| Interest expense | 6.7 | | | 12.0 | | | 9.4 | |
| Other (income) expense-net | (8.5) | | | (6.9) | | | 425.6 | |
| Earnings before provision for income taxes | 701.0 | | | 733.5 | | | 223.7 | |
| Provision for (benefit from) income taxes | 167.4 | | | 176.9 | | | (12.0) | |
| Net Earnings | $ | 533.6 | | | $ | 556.6 | | | $ | 235.7 | |
Our sales in 2024 were $3,818.1 million, a decrease of $34.7 million compared to 2023 sales of $3,852.8 million. Our decrease in net sales was primarily driven by lower water heater volumes in North America, lower sales in China, and unfavorable currency translation of approximately $18 million due to the depreciation of foreign currencies compared to the U.S. dollar, which more than offset our higher boiler sales and pricing actions. Our 2024 and 2023 acquisitions of water treatment companies in North America added approximately $18 million of incremental net sales in 2024.
Our 2024 gross profit margin of 38.1 percent decreased compared to 38.5 percent in 2023. The lower gross profit margin in 2024 compared to 2023 was primarily due to higher production costs and operational inefficiencies associated with volume volatility, which outpaced our pricing actions.
Selling, general, and administrative (SG&A) expenses were $739.3 million in 2024, or $11.9 million higher than in 2023. The increase in SG&A expenses in 2024 compared to the prior year was primarily due to higher employee costs from increased wages and higher selling and advertising expenses to support our strategic initiatives.
We recognized $17.6 million of restructuring and impairment expenses during the year ended December 31, 2024. Of these expenses, $6.3 million was related to our water treatment business in the North America segment and was a result of a profitability improvement strategy that prioritizes improving our cost structure and emphasizes our more profitable channels. In the Rest of World segment, restructuring included severance costs in China of $11.3 million and was related to the right sizing of that business for current market conditions. Restructuring and impairment expenses in 2023 were $18.8 million, of which $15.7 million was recorded in the Rest of World segment and $3.1 million was recorded in Corporate Expense and related primarily to the sale of our business in Turkey.
Interest expense was $6.7 million in 2024, compared to $12.0 million in 2023. The decrease in interest expense in 2024 compared to last year was primarily due to lower average debt levels.
Other (income) expense, net was $8.5 million of income in 2024 compared to income of $6.9 million in 2023. The increase in other income was driven by lower foreign currency translation losses compared to last year, partially offset by lower interest income from lower average cash balances.
Our effective income tax rate in 2024 was lower compared to 2023. The change in the effective income tax rate in 2024 compared to the prior year was primarily due to the restructuring and impairment expense recorded in 2023 with no associated tax benefit. We estimate that our annual effective income tax rate for the full year of 2025 will be approximately 24 to 24.5 percent.
We are providing non-U.S. Generally Accepted Accounting Principles (GAAP) measures (adjusted earnings, adjusted earnings per share (EPS), total segment earnings, adjusted segment earnings, and adjusted corporate expense) that exclude the impact of restructuring and impairment expenses and pension settlement income. Reconciliations from GAAP measures to non-GAAP measures are provided in the Non-GAAP Measures section below. We believe that the measures of adjusted earnings, adjusted EPS, total segment earnings, adjusted segment earnings, and adjusted corporate expense provide useful information to investors about our performance and allow management and our investors to better understand our performance between periods without regard to items that we do not consider to be a component of our core operating performance or recurring in nature.
North America Segment
| | | | | | | | | | | |
| Years ended December 31 (dollars in millions) | 2024 | | 2023 |
| Net Sales | $ | 2,950.1 | | | $ | 2,922.9 | |
| Segment Earnings | 707.5 | | | 726.7 | |
| Segment Margin | 24.0 | % | | 24.9 | % |
Sales in our North America segment were $2,950.1 million in 2024, or $27.2 million higher than sales of $2,922.9 million in 2023. Compared to the prior year, pricing actions, higher boiler sales, and approximately $18 million of incremental net sales from our 2024 and 2023 acquisitions of water treatment companies primarily drove our net sales increase and more than offset lower water heater volumes.
North America segment earnings were $707.5 million in 2024, or $19.2 million lower than segment earnings of $726.7 million in 2023. Segment margins were 24.0 percent and 24.9 percent in 2024 and 2023, respectively. Lower segment earnings and margins in 2024 were primarily due to lower water heater volumes, higher production costs and higher SG&A expenses associated with strategic investments that outpaced our pricing actions and higher boiler volumes. Segment earnings and margin in 2024 also included restructuring and impairment expenses of $6.3 million related to our water treatment business and a result of a profitability improvement strategy that prioritizes improving our cost structure and emphasizes our more profitable channels.
Adjusted segment earnings and adjusted segment margin in 2024 were $713.8 million and 24.2 percent, respectively, which excludes $6.3 million of pre-tax restructuring and impairment expenses. Adjusted segment earnings and adjusted segment margin in 2023 were $726.0 million and 24.8 percent, respectively, and exclude pension settlement income. We estimate our 2025 North America segment margin will be approximately 24.0 to 24.5 percent.
Rest of World Segment
| | | | | | | | | | | |
| Years ended December 31 (dollars in millions) | 2024 | | 2023 |
| Net Sales | $ | 918.6 | | | $ | 956.9 | |
| Segment Earnings | 64.5 | | | 83.4 | |
| Segment Margin | 7.0 | % | | 8.7 | % |
Sales in our Rest of World segment were $918.6 million in 2024, or $38.3 million lower than sales of $956.9 million in 2023. Compared to the prior year, lower net sales in 2024 were primarily driven by decreased sales of our core water heating and water treatment products in China and included approximately $13 million of unfavorable currency translation. The decline in sales in 2024 was partially offset by higher volumes of kitchen products in China and included increased inter-segment sales of approximately $16 million related to our tankless water heaters manufactured in China and shipped to the U.S. market.
Rest of World segment earnings were $64.5 million in 2024 and lower compared to $83.4 million in 2023. Segment margins were 7.0 percent and 8.7 percent in 2024 and 2023, respectively. Lower volumes of our core water heating and water treatment products and an unfavorable product mix and sales promotions in China primarily drove lower segment earnings and segment margin in 2024, partially offset by lower SG&A costs. Segment earnings and margin in 2024 and 2023 included restructuring and impairment expenses of $11.3 million and $15.7 million, respectively. Restructuring and impairment expenses in 2024 were severance costs in China related to the right sizing of that business for current market conditions, and 2023 expenses were primarily associated with the sale of our business in Turkey.
Adjusted segment earnings and adjusted segment margin in 2024 were $75.8 million and 8.3 percent, respectively. Adjusted segment earnings and adjusted segment margin in 2023 were $99.1 million and 10.4 percent, respectively. Adjusted segment earnings and adjusted segment margin in 2024 and 2023 exclude $11.3 million and $15.7 million of restructuring and impairment expenses, respectively. We estimate our 2025 Rest of World segment margin will be approximately eight to nine percent.
LIQUIDITY AND CAPITAL RESOURCES
Our working capital was $495.7 million at December 31, 2024, compared with $555.0 million at December 31, 2023. The decrease in working capital was primarily related to lower cash and receivable balances, partially offset by higher inventory balances, lower accounts payable and lower payroll-related accruals. As of December 31, 2024, cash balances were negatively impacted by $6.6 million due to changes in foreign currency during the year. Cash and cash equivalents used to fund our operations are primarily generated through operating activities and our existing credit facilities. We believe our available cash and existing credit facilities are sufficient to cover our cash needs for the foreseeable future. We use a global cash pooling arrangement, intercompany borrowing, and some local credit lines to meet funding needs and allocate capital resources among various entities. We have historically made and anticipate future cash repatriations from certain foreign subsidiaries. In 2024, we repatriated approximately $90 million of cash from our foreign subsidiaries and used the proceeds to pay down outstanding debt balances and fund acquisitions.
| | | | | | | | | | | |
| Years ended December 31 (dollars in millions) | 2024 | | 2023 |
| Cash provided by operating activities | $ | 581.8 | | | $ | 670.3 | |
| Cash used in investing activities | (267.1) | | | (24.1) | |
| Cash used in financing activities | (408.4) | | | (684.7) | |
Cash provided by operations in 2024 was $581.8 million and lower than $670.3 million in 2023, primarily as a result of higher incentive payments associated with record sales and profits earned in 2023, higher inventory balances and lower earnings, which more than offset lower trade receivable balances. Our free cash flow in 2024 and 2023 was $473.8 million and $597.7 million, respectively. We expect cash provided by operating activities to be between $600 million and $650 million in 2025. We expect free cash flow to be between $500 million and $550 million in 2025. Free cash flow is a non-GAAP measure described in more detail in the Non-GAAP Measures section below.
Capital expenditures totaled $108.0 million in 2024 compared with $72.6 million in 2023. Higher capital expenditures compared to the prior year were primarily due to our capacity expansion projects in Juarez, Mexico and McBee, South Carolina and our new engineering facility in Lebanon, Tennessee. We project that 2025 capital expenditures will be between $90 million and $100 million and full-year depreciation and amortization expense will be approximately $80 million.
In 2024, we renewed and amended our $500 million revolving credit facility ("renewed facility") which now expires on August 23, 2029. The renewed facility is with a group of nine banks and has an accordion provision that allows it to be increased up to $1 billion if certain conditions (including lender approval) are satisfied. Borrowing rates under the renewed facility are determined by our leverage ratio. The renewed facility requires us to maintain two financial covenants, a leverage ratio test and an interest coverage test, and we were in compliance with the covenants as of December 31, 2024, and expect to be in compliance for the foreseeable future. The renewed facility backs up commercial paper and credit line borrowings. At December 31, 2024, we had $30.0 million of borrowings outstanding under the renewed facility and an available borrowing capacity of $470.0 million. We believe the combination of available borrowing capacity and operating cash flows will provide sufficient funds to finance our existing operations for the foreseeable future.
Our total debt increased by $65.9 million in 2024 primarily due to borrowings associated with our share repurchase program and Pureit acquisition. Our leverage, as measured by the ratio of total debt to total capitalization, was 9.3 percent at December 31, 2024, compared with 6.5 percent at December 31, 2023.
In 2024, our Board of Directors approved adding 2,000,000 shares of common stock to our existing discretionary share repurchase authority. Under our share repurchase program, we may purchase our common stock through a combination of a Rule 10b5-1 automatic trading plan and discretionary purchases in accordance with applicable securities laws. The stock repurchase authorization remains effective until terminated by our Board of Directors, which may occur at any time, subject to the parameters of any Rule 10b5-1 automatic trading plan that we may then have in effect. During 2024, we repurchased 3,755,337 shares of our stock at a total cost of $305.8 million. As of December 31, 2024, we had 1,746,125 shares remaining on the share repurchase authority. On January 26, 2025, the Board of Directors approved adding 5,000,000 shares of common stock to the existing discretionary share repurchase authority. Including the additional shares, we had 6,476,677 shares
available for repurchase as of the date of the Board of Directors' approval. We intend to repurchase approximately $400 million of our common stock in 2025 through a combination of 10b5-1 plans and open-market purchases.
We paid dividends of $1.30 per share in 2024 compared with $1.22 per share in 2023. We increased our dividend by six percent in the fourth quarter of 2024, and the five-year compound annual growth rate of our dividend payment is approximately eight percent. We have paid dividends for 85 consecutive years with annual amounts increasing each of the last 33 years.
Recent Accounting Pronouncements
Refer to Recent Accounting Pronouncements in Note 1, “Organization and Significant Accounting Policies” of Notes to the Consolidated Financial Statements.
Critical Accounting Policies
Our accounting policies are described in Note 1, “Organization and Significant Accounting Policies” of Notes to the Consolidated Financial Statements. Also as disclosed in Note 1, the preparation of financial statements in conformity with accounting principles generally accepted in the U.S. requires the use of estimates and assumptions about future events that affect the amounts reported in the financial statements and accompanying notes. Future events and their effects cannot be determined with absolute certainty. Therefore, the determination of estimates requires the exercise of judgment. Actual results inevitably will differ from those estimates, and such differences may be material to the financial statements.
The most significant accounting estimates inherent in the preparation of our financial statements include estimates associated with the evaluation of the impairment of goodwill and indefinite-lived intangible assets and significant estimates used in the determination of the liability related to product warranties. Various assumptions and other factors underlie the determination of these significant estimates. The process of determining significant estimates is fact-specific and takes into account factors such as historical experience and trends, and in some cases, actuarial techniques. We monitor these significant factors and adjustments are made as facts and circumstances dictate. Historically, actual results have not significantly deviated from those determined using the estimates described above.
Goodwill and Indefinite-lived Intangible Assets
In conformity with GAAP, goodwill and indefinite-lived intangible assets are tested for impairment annually or more frequently if events or changes in circumstances indicate that the assets might be impaired. We perform impairment reviews for our reporting units using a fair-value method based on management’s judgments and assumptions. The fair value represents the estimated amount at which a reporting unit could be bought or sold in a current transaction between willing parties on an arms-length basis. The estimated fair value is then compared with the carrying amount of the reporting unit, including recorded goodwill. We are subject to financial statement risk to the extent that goodwill and indefinite-lived intangible assets become impaired. Any impairment review is, by its nature, highly judgmental as estimates of future sales, earnings and cash flows are utilized to determine fair values. However, we believe that we conduct a thorough and competent annual quantitative analysis of goodwill and indefinite-lived intangible assets. Based on the annual goodwill impairment test, we determined there was no impairment of our goodwill as of December 31, 2024. The fair value of each of our reporting units significantly exceeded its carrying value and a 20 percent decrease in the estimated fair value of our reporting units would not have resulted in a different conclusion. Based on the annual indefinite-lived assets impairment test, we determined there was no impairment of our indefinite-lived assets as of December 31, 2024.
Product Warranty
Our products carry warranties that generally range from one to 12 years and are based on terms that are generally accepted in the market. We provide for the estimated cost of product warranty at the time of sale. The product warranty provision is estimated based on warranty loss experience using actual historical failure rates and estimated costs of product replacement. The variables used in the calculation of the provision are reviewed at least annually. At times, warranty issues may arise which are beyond the scope of our historical experience. We provide for any such warranty issues as they become known and estimable. While our warranty costs have historically been within calculated estimates, it is possible that future warranty costs could differ significantly from those estimates. The allocation of the warranty liability between current and long-term is based on the expected warranty liability to be paid in the next year as determined by historical product failure rates. At December 31, 2024 and 2023, our reserve for product warranties was $190.4 million and $188.1 million, respectively.
Non-GAAP Measures
We are providing non-U.S. Generally Accepted Accounting Principles (GAAP) measures (adjusted earnings, adjusted EPS, total segment earnings, adjusted segment earnings, and adjusted corporate expense) that exclude the impact of restructuring and impairment expenses and pension settlement income. Reconciliations from GAAP measures to non-GAAP measures are provided below.
We believe that the measures of adjusted earnings, adjusted EPS, adjusted segment earnings and adjusted corporate expense provide useful information to investors about our performance and allow management and our investors to better understand our performance between periods without regard to items that we do not consider to be a component of our core operating performance or recurring in nature.
A. O. SMITH CORPORATION
Adjusted Earnings and Adjusted Earnings Per Share
(dollars in millions, except per share data)
(unaudited)
The following is a reconciliation of net earnings and diluted earnings per share to adjusted earnings (non-GAAP) and adjusted earnings per share (non-GAAP):
| | | | | | | | | | | | | | | | | | | | | | | |
| | | Twelve Months Ended
December 31, |
| | | | | | 2024 | | 2023 |
| Net Earnings (GAAP) | | | | | | | $ | 533.6 | | | $ | 556.6 | |
| Restructuring and impairment expenses, before tax | | | | | | | | 17.6 | | | | 18.8 | |
| Pension settlement income, before tax | | | | | | | | — | | | | (0.9) | |
| Tax effect on above items | | | | | | | | (3.2) | | | | 0.3 | |
| Adjusted Earnings (non-GAAP) | | | | | | | $ | 548.0 | | | $ | 574.8 | |
| | | | | | | | | | | |
Diluted Earnings Per Share (GAAP)(1) | | | | | | | $ | 3.63 | | | $ | 3.69 | |
| Restructuring and impairment expenses, per diluted share, before tax | | | | | | | | 0.12 | | | | 0.12 | |
| Pension settlement income per diluted share, before tax | | | | | | | | — | | | | — | |
| Tax effect on above items per diluted share | | | | | | | | (0.02) | | | | — | |
Adjusted Earnings Per Share (non-GAAP)(1) | | | | | | | $ | 3.73 | | | $ | 3.81 | |
(1) Earnings per share amounts are calculated discretely and, therefore, may not add up to the total due to rounding.
A. O. SMITH CORPORATION
Adjusted Segment Earnings
(dollars in millions)
(unaudited)
The following is a reconciliation of reported earnings before provision for income taxes to total segment earnings (non-GAAP) and adjusted segment earnings (non-GAAP):
| | | | | | | | | | | | | | | | | | | | | | | |
| | | Twelve Months Ended
December 31, |
| | | | | | 2024 | | 2023 |
| Earnings Before Provision for Income Taxes (GAAP) | | | | | | | $ | 701.0 | | | $ | 733.5 | |
Add: Corporate expense(1) | | | | | | | | 63.9 | | | | 64.1 | |
| Add: Interest expense | | | | | | | | 6.7 | | | | 12.0 | |
| Total Segment Earnings (non-GAAP) | | | | | | | $ | 771.6 | | | $ | 809.6 | |
| | | | | | | | | | | |
North America(2) | | | | | | | $ | 707.5 | | | $ | 726.7 | |
Rest of World(3) | | | | | | | | 64.5 | | | | 83.4 | |
| Inter-segment earnings elimination | | | | | | | | (0.4) | | | | (0.5) | |
| Total Segment Earnings (non-GAAP) | | | | | | | $ | 771.6 | | | $ | 809.6 | |
| | | | | | | | | | | |
| Additional Information | | | | | | | | | | | |
(1)Corporate expense | | | | | | | $ | (63.9) | | | $ | (64.1) | |
| Pension settlement income, before tax | | | | | | | | — | | | | (0.2) | |
| Impairment expense, before tax | | | | | | | | — | | | | 3.1 | |
| Adjusted Corporate expense (non-GAAP) | | | | | | | $ | (63.9) | | | $ | (61.2) | |
| | | | | | | | | | | |
(2)North America | | | | | | | $ | 707.5 | | | $ | 726.7 | |
| Restructuring and impairment expenses, before tax | | | | | | | | 6.3 | | | | — | |
| Pension settlement income, before tax | | | | | | | | — | | | | (0.7) | |
| Adjusted North America (non-GAAP) | | | | | | | $ | 713.8 | | | $ | 726.0 | |
| | | | | | | | | | | |
(3)Rest of World | | | | | | | $ | 64.5 | | | $ | 83.4 | |
| Restructuring and impairment expenses, before tax | | | | | | | | 11.3 | | | | 15.7 | |
| Adjusted Rest of World (non-GAAP) | | | | | | | $ | 75.8 | | | $ | 99.1 | |
A. O. SMITH CORPORATION
Free Cash Flow
(dollars in millions)
(unaudited)
The following is a reconciliation of reported cash flow from operating activities to free cash flow (non-GAAP):
| | | | | | | | | | | | | | | | | |
| Twelve Months Ended
December 31, |
| 2024 | | 2023 |
| Cash provided by operating activities (GAAP) | $ | 581.8 | | | $ | 670.3 | |
| Less: Capital expenditures | | (108.0) | | | | (72.6) | |
| Free cash flow (non-GAAP) | $ | 473.8 | | | $ | 597.7 | |
A. O. SMITH CORPORATION
2025 EPS Guidance and 2024 Adjusted EPS
(unaudited)
The following is a reconciliation of diluted EPS to adjusted EPS (non-GAAP) (all items are net of tax):
| | | | | | | | | | | | | | | | | | | | |
| 2025
Guidance | | 2024 | |
| Diluted EPS (GAAP) | $ | 3.60 - 3.90 | | $ | 3.63 | | |
| Restructuring and impairment expenses | | — | | | | 0.10 | | (1) |
| Adjusted EPS (non-GAAP) | $ | 3.60 - 3.90 | | $ | 3.73 | | |
(1) Includes pre-tax restructuring and impairment expenses of $11.3 million and $6.3 million, within the Rest of World segment and North America segment, respectively.
Outlook
As we begin 2025, we expect our consolidated sales to be approximately flat to up two percent compared to 2024. Our projection is driven by expected flat industry residential and commercial volumes. In our Rest of the World segment, after a challenging 2024, we expect consumer demand softness will persist in 2025 in China and a decline in third-party sales. We expect full-year earnings of between $3.60 and $3.90 per share. Our guidance excludes the impacts of potential future acquisitions.
OTHER MATTERS
Environmental
Our operations are governed by a number of federal, foreign, state, local and environmental laws concerning the generation and management of hazardous materials, the discharge of pollutants into the environment and remediation of sites owned by the Company or third parties. We have expended financial and managerial resources complying with such laws. Expenditures related to environmental matters were not material in 2024 and we do not expect them to be material in any single year. We have reserves associated with environmental obligations at various facilities and we believe these reserves together with available insurance coverage are sufficient to cover reasonably anticipated remediation costs. Although we believe that our operations are substantially in compliance with such laws and maintain procedures designed to maintain compliance, there are no assurances that substantial additional costs for compliance will not be incurred in the future. However, since the same laws govern our competitors, we should not be placed at a competitive disadvantage.
Risk Management
We evaluate risk to our business in a number of ways, primarily through our Enterprise Risk Management (ERM) process, which we conduct enterprise-wise on a periodic basis, and seeks to identify and address significant and material risks. Our ERM process assesses, manages, and monitors risks consistent with the integrated risk framework in the Enterprise Risk Management-Integrated Framework (2017) issued by the Committee of Sponsoring Organizations of the Treadway
Commission (COSO). We believe that risk-taking is an inherent aspect of the pursuit of our strategy. Our goal is to manage risks prudently rather than avoid risks. We can mitigate risks and their impact on our company only to a limited extent.
A team of senior executives prioritizes identified risks, including decarbonization, new technologies and cyber threats among others, and assigns an executive to address each major identified risk area and lead action plans to manage risks. Our Board of Directors provides oversight of the ERM process and reviews significant identified risks. The Audit Committee of the Board of Directors also reviews significant financial risk exposures and the steps management has taken to monitor and manage them. Our other Board committees also play a role in risk management, as set forth in their respective charters.
Our goal is to proactively manage risks using a structured approach in conjunction with strategic planning, with the intent to preserve and enhance shareholder value. However, the risks set forth in Item 1A - Risk Factors and elsewhere in this Annual Report on Form 10-K and other risks and uncertainties could adversely affect us and cause our results to vary materially from recent results or from our anticipated future results.
Market Risk
We are exposed to various types of market risks, primarily currency. We monitor our risks in such areas on a continuous basis and generally enter into forward contracts to minimize such exposures. We do not engage in speculation in our derivatives strategies. Further discussion regarding derivative instruments is contained in Note 1, “Organization and Significant Accounting Policies” of Notes to Consolidated Financial Statements.
We enter into foreign currency forward contracts to minimize the effect of fluctuating foreign currencies. At December 31, 2024, we had net foreign currency contracts outstanding with notional values of $70.1 million. Assuming a hypothetical ten percent movement in the respective currencies, the potential foreign exchange gain or loss associated with the change in exchange rates would amount to $7.0 million. However, gains and losses from our forward contracts will be offset by gains and losses in the underlying transactions being hedged.
Forward-Looking Statements
This filing contains statements that the Company believes are “forward-looking statements” within the meaning of the Private Securities Litigation Reform Act of 1995. Forward-looking statements generally can be identified by the use of words such as “may,” “will,” “expect,” “intend,” “estimate,” “anticipate,” “believe,” “forecast,” “continue,” “guidance,” “outlook” or words of similar meaning. All forward-looking statements are subject to risks and uncertainties that could cause actual results to differ materially from those anticipated as of the date of this filing. Important factors that could cause actual results to differ materially from these expectations include, among other things, the following: further softening in U.S. residential and commercial water heater demand; negative impacts to the Company, particularly the demand for its products, resulting from global inflationary pressures or a potential recession in one or more of the markets in which the Company participates; the Company’s ability to continue to obtain commodities, components, parts and accessories on a timely basis through its supply chain and at expected costs; negative impacts to demand for the Company’s products, particularly commercial products, as a result of changes in commercial property usage that followed the COVID-19 pandemic; further weakening in North American residential or commercial construction or instability in the Company's replacement markets; inability of the Company to implement or maintain pricing actions; inconsistent recovery of the Chinese economy or a further decline in the growth rate of consumer spending or housing sales in China; the availability, timing or effects of China stimulus programs; negative impact to the Company’s businesses from international tariffs, trade disputes and geopolitical differences, including the conflicts in Ukraine and the Middle East; potential weakening in the high-efficiency gas boiler segment in the U.S.; substantial defaults in payment by, material reduction in purchases by or the loss, bankruptcy or insolvency of a major customer; foreign currency fluctuations; the Company’s inability to successfully integrate or achieve its strategic objectives resulting from acquisitions; failure to realize the expected benefits of acquisitions or expected synergies; failure to realize the expected benefits, timing and extent, of regulatory changes; competitive pressures on the Company’s businesses; including new technologies and new competitors; the impact of potential information technology or data security breaches; negative impact of changes in government regulations or regulatory requirements; the inability to respond to secular trends toward decarbonization and energy efficiency and adverse developments in general economic, political and business conditions in key regions of the world. A more detailed description of these risks is contained under the heading "Risk Factors" in Item 1A above. Forward-looking statements included in this filing are made only as of the date of this filing, and the Company is under no obligation to update these statements to reflect subsequent events or circumstances. All subsequent written and oral forward-looking statements attributed to the Company, or persons acting on its behalf, are qualified entirely by these cautionary statements.
Forward-looking and other statements in this Form 10-K regarding our environmental and other sustainability plans and goals are not an indication that these statements are necessarily material to investors or are required to be disclosed in our filings with the SEC. In addition, historical, current, and forward-looking social, environmental and sustainability-related statements
may be based on standards for measuring progress that are still developing, internal controls and processes that continue to evolve, and assumptions that are subject to change in the future. Any such forward-looking statements made herein are based on information currently available to us as of the date of this Report. We undertake no obligation to publicly update or revise any forward-looking statements, whether as a result of new information, future events or otherwise, except as required by law.
ITEM 7A – QUANTITATIVE AND QUALITATIVE DISCLOSURES ABOUT MARKET RISK
See “Market Risk” above.
ITEM 8 – FINANCIAL STATEMENTS AND SUPPLEMENTARY DATA
REPORT OF INDEPENDENT REGISTERED PUBLIC ACCOUNTING FIRM
To the Stockholders and the Board of Directors of A. O. Smith Corporation
Opinion on the Financial Statements
We have audited the accompanying consolidated balance sheets of A. O. Smith Corporation (the Company) as of December 31, 2024 and 2023, the related consolidated statements of earnings, comprehensive earnings, stockholders’ equity and cash flows for each of the three years in the period ended December 31, 2024, and the related notes and financial statement schedule listed in the Index at Item 15(a) (collectively referred to as the “consolidated financial statements”). In our opinion, the consolidated financial statements present fairly, in all material respects, the financial position of the Company at December 31, 2024 and 2023, and the results of its operations and its cash flows for each of the three years in the period ended December 31, 2024, in conformity with U.S. generally accepted accounting principles.
We also have audited, in accordance with the standards of the Public Company Accounting Oversight Board (United States) (PCAOB), the Company’s internal control over financial reporting as of December 31, 2024, based on criteria established in Internal Control-Integrated Framework issued by the Committee of Sponsoring Organizations of the Treadway Commission (2013 framework), and our report dated February 11, 2025 expressed an unqualified opinion thereon.
Basis for Opinion
These financial statements are the responsibility of the Company’s management. Our responsibility is to express an opinion on the Company’s financial statements based on our audits. We are a public accounting firm registered with the PCAOB and are required to be independent with respect to the Company in accordance with the U.S. federal securities laws and the applicable rules and regulations of the Securities and Exchange Commission and the PCAOB.
We conducted our audits in accordance with the standards of the PCAOB. Those standards require that we plan and perform the audit to obtain reasonable assurance about whether the financial statements are free of material misstatement, whether due to error or fraud. Our audits included performing procedures to assess the risks of material misstatement of the financial statements, whether due to error or fraud, and performing procedures that respond to those risks. Such procedures included examining, on a test basis, evidence regarding the amounts and disclosures in the financial statements. Our audits also included evaluating the accounting principles used and significant estimates made by management, as well as evaluating the overall presentation of the financial statements. We believe that our audits provide a reasonable basis for our opinion.
Critical Audit Matter
The critical audit matter communicated below is a matter arising from the current period audit of the financial statements that was communicated or required to be communicated to the audit committee and that: (1) relates to accounts or disclosures that are material to the financial statements and (2) involved our especially challenging, subjective or complex judgments. The communication of the critical audit matter does not alter in any way our opinion on the consolidated financial statements, taken as a whole, and we are not, by communicating the critical audit matter below, providing a separate opinion on the critical audit matter or on the accounts or disclosures to which it relates.
| | | | | | | | |
| | Product Warranty Liability Valuation |
| | |
Description of the Matter
| | At December 31, 2024, the Company’s product warranty liability was $190.4 million. As discussed in Note 1 of the consolidated financial statements, the Company records a liability for the expected cost of warranty-related claims at the time of sale. The product warranty liability is estimated based upon warranty loss experience using actual historical failure rates and estimated cost of product replacement. Products generally carry warranties from one to twelve years. The Company performs separate warranty calculations based on the product type and the warranty term and aggregates them.
|
| | Auditing the product warranty liability was complex due to the judgmental nature of the warranty loss experience assumptions, including the estimated product failure rate and the estimated cost of product replacement. In particular, it is possible that future product failure rates may not be reflective of historical product failure rates, or that a product quality issue has not yet been identified as of the financial statement date. Additionally, the cost of product replacement could differ from estimates due to fluctuations in the replacement cost of the product. |
| | |
How We Addressed the Matter in our Audit
| | We obtained an understanding, evaluated the design, and tested the operating effectiveness of controls over the Company’s product warranty liability calculation. For example, we tested controls over management’s review of the product warranty liability calculation, including the significant assumptions and the data inputs to the calculation. To test the Company’s calculation of the product warranty liability, our audit procedures included, among others, evaluating the methodology used, and testing the significant assumptions discussed above and the underlying data used by the Company in its analysis. We tested the validity of claims within the calculation and tested the completeness and accuracy of the claims settled data. We recalculated the historical failure rates using actual claims data. We compared the estimated cost of replacement included in the product warranty liability with the current costs to manufacture a comparable product and assessed the impact of projected changes in significant product costs. We also analyzed current year claims data to identify changes in failure trends and assessed the historical accuracy of the prior year liability. Further, we inquired of operational and quality control personnel regarding quality issues and trends. |
| | |
/s/ Ernst & Young LLP
We have served as the Company’s auditor since 1917.
Milwaukee, Wisconsin
February 11, 2025
CONSOLIDATED BALANCE SHEETS
| | | | | | | | | | | |
| December 31 (dollars in millions) | | | |
| 2024 | | 2023 |
| Assets | | | |
| Current Assets | | | |
| Cash and cash equivalents | $ | 239.6 | | | $ | 339.9 | |
| Marketable securities | 36.5 | | | 23.5 | |
| Receivables | 541.4 | | | 596.0 | |
| Inventories | 532.1 | | | 497.4 | |
| Other current assets | 43.3 | | | 43.5 | |
| Total Current Assets | 1,392.9 | | | 1,500.3 | |
| Net property, plant and equipment | 628.7 | | | 597.5 | |
| Goodwill | 761.7 | | | 633.4 | |
| Other intangibles | 321.1 | | | 336.7 | |
| Operating lease assets | 32.8 | | | 37.3 | |
| Other assets | 102.8 | | | 108.7 | |
| Total Assets | $ | 3,240.0 | | | $ | 3,213.9 | |
| Liabilities | | | |
| Current Liabilities | | | |
| Trade payables | $ | 588.7 | | | $ | 600.4 | |
| Accrued payroll and benefits | 78.5 | | | 92.2 | |
| Accrued liabilities | 153.0 | | | 177.4 | |
| Product warranties | 67.0 | | | 65.3 | |
| Long-term debt due within one year | 10.0 | | | 10.0 | |
| Total Current Liabilities | 897.2 | | | 945.3 | |
| Long-term debt | 183.2 | | | 117.3 | |
| Product warranties | 123.4 | | | 122.8 | |
| Pension liabilities | 11.0 | | | 10.5 | |
| Long-term operating lease liabilities | 23.5 | | | 27.9 | |
| Other liabilities | 118.2 | | | 145.7 | |
| Total Liabilities | 1,356.5 | | | 1,369.5 | |
| Commitments and contingencies | — | | | — | |
| Stockholders’ Equity | | | |
| Preferred Stock | — | | | — | |
| Class A Common Stock (shares issued 26,014,825 and 26,023,132 as of December 31, 2024 and 2023, respectively) | 130.1 | | | 130.1 | |
| Common Stock (shares issued 164,692,769 and 164,684,460 as of December 31, 2024 and 2023, respectively) | 164.7 | | | 164.7 | |
| Capital in excess of par value | 601.3 | | | 578.2 | |
| Retained earnings | 3,601.3 | | | 3,258.1 | |
| Accumulated other comprehensive loss | (111.9) | | | (84.2) | |
| Treasury stock at cost | (2,502.0) | | | (2,202.5) | |
| Total Stockholders’ Equity | 1,883.5 | | | 1,844.4 | |
| Total Liabilities and Stockholders’ Equity | $ | 3,240.0 | | | $ | 3,213.9 | |
See accompanying notes which are an integral part of these statements.
CONSOLIDATED STATEMENT OF EARNINGS
| | | | | | | | | | | | | | | | | |
| Years ended December 31 (dollars in millions, except per share amounts) | | | | | |
| 2024 | | 2023 | | 2022 |
| Net sales | $ | 3,818.1 | | | $ | 3,852.8 | | | $ | 3,753.9 | |
| Cost of products sold | 2,362.0 | | | 2,368.0 | | | 2,424.3 | |
| Gross profit | 1,456.1 | | | 1,484.8 | | | 1,329.6 | |
| Selling, general and administrative expenses | 739.3 | | | 727.4 | | | 670.9 | |
| Restructuring and impairment expenses | 17.6 | | | 18.8 | | | — | |
| Interest expense | 6.7 | | | 12.0 | | | 9.4 | |
| Other (income) expense, net | (8.5) | | | (6.9) | | | 425.6 | |
| Earnings before provision for income taxes | 701.0 | | | 733.5 | | | 223.7 | |
| Provision for (benefit from) income taxes | 167.4 | | | 176.9 | | | (12.0) | |
| Net Earnings | $ | 533.6 | | | $ | 556.6 | | | $ | 235.7 | |
Net Earnings Per Share of Common Stock (1) | $ | 3.65 | | | $ | 3.71 | | | $ | 1.52 | |
Diluted Net Earnings Per Share of Common Stock (1) | $ | 3.63 | | | $ | 3.69 | | | $ | 1.51 | |
(1)Earnings per share amounts are calculated discretely and, therefore, may not add up to the total due to rounding.
CONSOLIDATED STATEMENT OF COMPREHENSIVE EARNINGS
| | | | | | | | | | | | | | | | | |
| Years ended December 31 (dollars in millions) | | | | | |
| 2024 | | 2023 | | 2022 |
| Net Earnings | $ | 533.6 | | | $ | 556.6 | | | $ | 235.7 | |
| Other comprehensive earnings (loss) | | | | | |
| Foreign currency translation adjustments | (24.0) | | | 3.8 | | | (39.4) | |
| Unrealized net (loss) gain on cash flow derivative instruments, less related income tax benefit (provision) of $0.7 in 2024, $1.4 in 2023 and $(1.4) in 2022 | (2.2) | | | (4.2) | | | 4.3 | |
| Change in pension liability less related income tax benefit (provision) of $0.5 in 2024, $0.5 in 2023 and $(179.0) in 2022 | (1.5) | | | (1.4) | | | 284.1 | |
| Comprehensive Earnings | $ | 505.9 | | | $ | 554.8 | | | $ | 484.7 | |
See accompanying notes which are an integral part of these statements.
CONSOLIDATED STATEMENT OF CASH FLOWS
| | | | | | | | | | | | | | | | | |
| Years ended December 31 (dollars in millions) | | | | | |
| 2024 | | 2023 | | 2022 |
| Operating Activities | | | | | |
| Net earnings | $ | 533.6 | | | $ | 556.6 | | | $ | 235.7 | |
| Adjustments to reconcile earnings to cash provided by (used in) operating activities: | | | | | |
| Depreciation and amortization | 78.8 | | | 78.3 | | | 76.9 | |
| Stock based compensation expense | 14.9 | | | 11.5 | | | 11.1 | |
| Deferred income taxes | (4.6) | | | (3.8) | | | — | |
| Non-cash impairments | 4.7 | | | 15.6 | | | — | |
| Pension settlement (income) expense | — | | | (0.9) | | | 417.3 | |
| Pension settlement non-cash taxes | — | | | 0.2 | | | (167.7) | |
| Net changes in operating assets and liabilities, net of acquisitions: | | | | | |
| Current assets and liabilities | (22.6) | | | 20.0 | | | (194.1) | |
| Noncurrent assets and liabilities | (23.0) | | | (7.2) | | | 12.2 | |
| Cash Provided by Operating Activities | 581.8 | | | 670.3 | | | 391.4 | |
| Investing Activities | | | | | |
| Capital expenditures | (108.0) | | | (72.6) | | | (70.3) | |
| Acquisitions | (145.9) | | | (16.8) | | | (8.0) | |
| Investments in marketable securities | (73.7) | | | (63.1) | | | (91.6) | |
| Net proceeds from sales of marketable securities | 60.5 | | | 128.4 | | | 178.0 | |
| Cash (Used in) Provided by Investing Activities | (267.1) | | | (24.1) | | | 8.1 | |
| Financing Activities | | | | | |
| Long-term debt incurred (repaid) | 69.7 | | | (218.1) | | | 150.6 | |
| Common stock repurchases | (305.8) | | | (306.5) | | | (403.5) | |
| Net proceeds (payments) from stock option activity | 18.1 | | | 23.4 | | | (0.7) | |
| Dividends paid | (190.4) | | | (183.5) | | | (177.2) | |
| Cash Used in Financing Activities | (408.4) | | | (684.7) | | | (430.8) | |
| Effect of exchange rate changes on cash and cash equivalents | (6.6) | | | (12.8) | | | (20.8) | |
| Net decrease in cash and cash equivalents | (100.3) | | | (51.3) | | | (52.1) | |
| Cash and cash equivalents-beginning of year | 339.9 | | | 391.2 | | | 443.3 | |
| Cash and Cash Equivalents-End of Year | $ | 239.6 | | | $ | 339.9 | | | $ | 391.2 | |
See accompanying notes, which are an integral part of these statements.
CONSOLIDATED STATEMENT OF STOCKHOLDERS’ EQUITY
| | | | | | | | | | | | | | | | | |
| Years ended December 31 (dollars in millions) | | | | | |
| 2024 | | 2023 | | 2022 |
| Class A Common Stock | | | | | |
| Balance at the beginning of the year | $ | 130.1 | | | $ | 130.2 | | | $ | 130.5 | |
| Conversion of Class A Common Stock | — | | | (0.1) | | | (0.3) | |
| Balance at the end of the year | $ | 130.1 | | | $ | 130.1 | | | $ | 130.2 | |
| Common Stock | | | | | |
| Balance at the beginning of the year | $ | 164.7 | | | $ | 164.7 | | | $ | 164.7 | |
| Conversion of Class A Common Stock | — | | | — | | | — | |
| Balance at the end of the year | $ | 164.7 | | | $ | 164.7 | | | $ | 164.7 | |
| Capital in Excess of Par Value | | | | | |
| Balance at the beginning of the year | $ | 578.2 | | | $ | 555.9 | | | $ | 545.2 | |
| Conversion of Class A Common Stock | — | | | 0.1 | | | 0.3 | |
| Issuance of share units | (15.0) | | | (10.3) | | | (6.0) | |
| Vesting of share units | (2.5) | | | (3.7) | | | (3.0) | |
| Stock based compensation expense | 13.1 | | | 10.4 | | | 11.1 | |
| Exercises of stock options | 11.4 | | | 14.5 | | | 1.3 | |
| Issuance of share based compensation | 16.1 | | | 11.3 | | | 7.0 | |
| Balance at the end of the year | $ | 601.3 | | | $ | 578.2 | | | $ | 555.9 | |
| Retained Earnings | | | | | |
| Balance at the beginning of the year | $ | 3,258.1 | | | $ | 2,885.0 | | | $ | 2,826.6 | |
| Net earnings | 533.6 | | | 556.6 | | | 235.7 | |
| Dividends on stock | (190.4) | | | (183.5) | | | (177.3) | |
| Balance at the end of the year | $ | 3,601.3 | | | $ | 3,258.1 | | | $ | 2,885.0 | |
| Accumulated Other Comprehensive Loss | | | | | |
| Balance at the beginning of the year | $ | (84.2) | | | $ | (82.4) | | | $ | (331.4) | |
| Foreign currency translation adjustments | (24.0) | | | 3.8 | | | (39.4) | |
| Unrealized net (loss) gain on cash flow derivative instruments, less related income tax benefit (provision) of $0.7 in 2024, $1.4 in 2023 and $(1.4) in 2022 | (2.2) | | | (4.2) | | | 4.3 | |
| Change in pension liability less related income tax benefit (provision) of $0.5 in 2024, $0.5 in 2023 and $(179.0) in 2022 | (1.5) | | | (1.4) | | | 284.1 | |
| Balance at the end of the year | $ | (111.9) | | | $ | (84.2) | | | $ | (82.4) | |
| Treasury Stock | | | | | |
| Balance at the beginning of the year | $ | (2,202.5) | | | $ | (1,905.7) | | | $ | (1,503.4) | |
| Exercise of stock options, net of 36,300, 61,605 and 47,309 shares surrendered as proceeds and to pay taxes in 2024, 2023 and 2022, respectively | 6.6 | | | 8.8 | | | (2.1) | |
| Stock incentives and directors’ compensation | 0.2 | | | 0.3 | | | 0.3 | |
| Shares repurchased | (305.8) | | | (306.5) | | | (403.5) | |
| Excise tax on repurchases of common stock | (3.0) | | | (3.1) | | | — | |
| Vesting of share units | 2.5 | | | 3.7 | | | 3.0 | |
| Balance at the end of the year | $ | (2,502.0) | | | $ | (2,202.5) | | | $ | (1,905.7) | |
| Total Stockholders’ Equity | $ | 1,883.5 | | | $ | 1,844.4 | | | $ | 1,747.7 | |
See accompanying notes which are an integral part of these statements.
NOTES TO CONSOLIDATED FINANCIAL STATEMENTS
1. Organization and Significant Accounting Policies
Organization. A. O. Smith Corporation (A. O. Smith or the Company) is comprised of two reporting segments: North America and Rest of World. The Rest of World segment is primarily comprised of China, Europe and India. Both segments manufacture and market comprehensive lines of residential and commercial gas and electric water heaters, boilers, tanks and water treatment products. Both segments primarily manufacture and market in their respective regions of the world.
Consolidation. The consolidated financial statements include the accounts of the Company and its wholly owned subsidiaries after elimination of intercompany transactions.
Use of estimates. The preparation of financial statements in conformity with accounting principles generally accepted in the United States (U.S.) requires management to make estimates and assumptions that affect the amounts reported in the accompanying financial statements and notes. Actual results could differ from those estimates.
Fair value of financial instruments. The carrying amounts of cash, cash equivalents, marketable securities, receivables, floating rate debt and trade payables approximated fair value as of December 31, 2024 and 2023, due to the short maturities or frequent rate resets of these instruments. The fair value of term notes with financial institutions included in Long-term debt within the consolidated balance sheets was approximately $143.6 million as of December 31, 2024 compared with the carrying amount of $163.2 million for the same date. The fair value of term notes with financial institutions was approximately $116.5 million as of December 31, 2023 compared with the carrying amount of $127.3 million.
Foreign currency translation. For all subsidiaries outside the U.S., with the exception of its Barbados, Hong Kong and Mexican companies and its non-operating companies in the Netherlands, the Company uses the local currency as the functional currency. For those operations using a functional currency other than the U.S. dollar, assets and liabilities were translated into U.S. dollars at year-end exchange rates, and revenues and expenses were translated at weighted-average exchange rates. The resulting translation adjustments were recorded as a separate component of stockholders’ equity. The Barbados, Hong Kong, Mexican and non-operating Netherlands companies use the U.S. dollar as the functional currency. Gains and losses from foreign currency transactions were included in net earnings and were not significant in 2024, 2023, or 2022.
Cash and cash equivalents. The Company considers all highly liquid investments with a maturity of three months or less when purchased to be cash equivalents.
Marketable securities. The Company considers all highly liquid investments with maturities greater than 90 days when purchased to be marketable securities. At December 31, 2024, the Company’s marketable securities consisted of bank time deposits with original maturities ranging from 180 days to 12 months and were primarily located at investment grade rated banks in China and Hong Kong.
Inventory valuation. Inventories are carried at lower of cost or net realizable value. Cost is determined on the last-in, first-out (LIFO) method for a certain portion of the Company’s domestic inventories, which comprised 43 percent and 39 percent of the Company’s total inventory at December 31, 2024 and 2023, respectively. The inventories of foreign subsidiaries and the remaining domestic inventories and supplies were determined using the first-in, first-out (FIFO) method.
Property, plant and equipment. Property, plant and equipment are stated at cost. Depreciation is computed primarily by the straight-line method. The estimated service lives used to compute depreciation are generally 25 to 50 years for buildings, three to 20 years for equipment and three to 15 years for software. Maintenance and repair costs are expensed as incurred.
Goodwill and other intangibles. Goodwill and indefinite-lived intangible assets are not amortized but are reviewed for impairment on an annual basis. Separable intangible assets, primarily comprised of customer relationships, that are not deemed to have an indefinite life are amortized on a straight-line basis over their estimated useful lives which range from four to 25 years.
Impairment of long-lived and amortizable intangible assets. Property, plant and equipment and intangible assets subject to amortization are reviewed for impairment whenever events or changes in circumstances indicate that the carrying amount may not be recoverable. If the sum of the expected undiscounted cash flows is less than the carrying value of the related asset or group of assets, a loss is recognized for the difference between the fair value and carrying value of the asset or group of assets. Such analyses involves significant judgment.
Product warranties. The Company’s products carry warranties that generally range from one to twelve years and are based on terms that are consistent with the market. The Company records a liability for the expected cost of warranty-related claims
1. Organization and Significant Accounting Policies (continued)
at the time of sale and is estimated based on the warranty period, product type and loss experience using actual historical failure rates and estimated costs of product replacement. The variables used in the calculation of the provision are reviewed by the Company at least annually. At times, warranty issues may arise which are beyond the scope of the Company’s historical experience. The Company provides for any such warranty issues as they become known and estimable. The allocation of the warranty liability between current and long-term is based on expected warranty claims to be settled in the next year as determined by historical product failure rates.
The following table presents the Company’s product warranty liability activity in 2024 and 2023:
| | | | | | | | | | | |
| Years ended December 31 (dollars in millions) | 2024 | | 2023 |
| Balance at beginning of year | $ | 188.1 | | | $ | 182.5 | |
| Expense | 81.1 | | | 79.9 | |
| Claims settled | (78.8) | | | (74.3) | |
| Balance at end of year | $ | 190.4 | | | $ | 188.1 | |
Derivative instruments. The Company utilizes certain derivative instruments to enhance its ability to manage currency as well as raw materials price risk. The Company does not enter into contracts for speculative purposes. The fair values of all derivatives are recorded in the consolidated balance sheets. The change in a derivative’s fair value is recorded each period in current earnings or accumulated other comprehensive loss (AOCL), depending on whether the derivative is designated as part of a hedge transaction and if so, the type of hedge transaction. See Note 14, “Derivative Instruments” for disclosure of the Company’s derivative instruments and hedging activities.
Fair Value Measurements. Accounting Standards Codification (ASC) 820 Fair Value Measurements, defines fair value, establishes a consistent framework for measuring fair value and expands disclosure for each major asset and liability category measured at fair value on either a recurring basis or nonrecurring basis. ASC 820 clarifies that fair value is an exit price, representing the amount that would be received to sell an asset or paid to transfer a liability in an orderly transaction between market participants. As such, fair value is a market-based measurement that should be determined based on assumptions that market participants would use in pricing an asset or liability. As a basis for considering such assumptions, ASC 820 establishes a three-tier fair value hierarchy, which prioritizes the inputs used in measuring fair value as follows: (Level 1) observable inputs such as quoted prices in active markets; (Level 2) inputs, other than the quoted prices in active markets, that are observable either directly or indirectly; and (Level 3) unobservable inputs in which there is little or no market data, which require the reporting entity to develop its own assumptions.
Assets and liabilities measured at fair value are based on the market approach which are prices and other relevant information generated by market transactions involving identical or comparable assets or liabilities.
Assets (liabilities) measured at fair value on a recurring basis are as follows (dollars in millions):
| | | | | | | | | | | | | | |
| Fair Value Measurement Using | Balance Sheet Location | December 31, 2024 | | December 31, 2023 |
| Quoted prices in active markets for identical assets (Level 1) | Marketable Securities | $ | 36.5 | | | $ | 23.5 | |
| Significant other observable inputs (Level 2) | (Accrued liabilities) / Other current assets | (1.9) | | | (4.1) | |
There were no changes in the valuation techniques used to measure fair values on a recurring basis.
Revenue recognition. Substantially all of the Company’s sales are from contracts with customers for the purchase of its products. Contracts and customer purchase orders are used to determine the existence of a sales contract. Shipping documents are used to verify shipment. For substantially all of its products, the Company transfers control of products to the customer at the point in time when title and risk are passed to the customer, which generally occurs upon shipment of the product. See Note 2, “Revenue Recognition” for disclosure of the Company’s revenue recognition activities.
Advertising. The majority of advertising costs are charged to operations as incurred and totaled $100.3 million, $93.9 million and $100.4 million during 2024, 2023 and 2022, respectively. Included in total advertising costs are expenses associated with store displays for water heater, water treatment products, and kitchen products in China that are amortized over 12 to 48 months which totaled $21.1 million, $15.2 million and $17.2 million during 2024, 2023 and 2022, respectively.
1. Organization and Significant Accounting Policies (continued)
Research and development. Research and development costs are charged to operations as incurred and amounted to $101.7 million, $97.5 million and $89.0 million during 2024, 2023 and 2022, respectively.
Environmental costs. The Company accrues for costs associated with environmental obligations when such costs are probable and reasonably estimable. Costs of estimated future expenditures are not discounted to their present value. Recoveries of environmental costs from other parties are recorded as assets when their receipt is considered probable. The accruals are adjusted as facts and circumstances change.
Stock-based compensation. Compensation cost is recognized using the straight-line method over the vesting period of the award and forfeitures are recognized as they occur. In accordance with amended ASC 718 Compensation-Stock Compensation, the Company recognized $4.1 million, $3.2 million, and $1.1 million of discrete income tax benefits on settled stock based compensation awards during 2024, 2023, and 2022 respectively.
Income taxes. The provision for income taxes is computed using the asset and liability method, in accordance with ASC 740 Income Taxes, under which deferred tax assets and liabilities are recognized for the expected future tax consequences of temporary differences between the financial reporting and tax bases of assets and liabilities and for operating losses and tax credit carryforwards. Deferred tax assets and liabilities are measured using the currently enacted tax rates that apply to taxable income in effect for the years in which those tax assets are expected to be realized or settled and are classified as noncurrent in the consolidated balance sheet. The Company records a valuation allowance to reduce deferred tax assets to the amount that is believed more likely than not to be realized.
The Company recognizes the tax benefit from an uncertain tax position only if it is more likely than not the tax position will be sustained on examination by the taxing authorities, based on the technical merits of the position. The tax benefits recognized in the financial statements from such positions are then measured based on the largest benefit that has a greater than 50 percent likelihood of being realized upon settlement.
Earnings per share of common stock. The Company is not required to use the two-class method of calculating earnings per share since its Class A Common Stock and Common Stock have equal dividend rights. The numerator for the calculation of basic and diluted earnings per share is net earnings. The following table sets forth the computation of basic and diluted weighted-average shares used in the earnings per share calculations:
| | | | | | | | | | | | | | | | | |
| 2024 | | 2023 | | 2022 |
| Denominator for basic earnings per share - weighted-average shares outstanding | 145,997,584 | | | 149,952,679 | | | 154,786,327 | |
| Effect of dilutive stock options, restricted stock and share units | 1,086,496 | | | 1,062,895 | | | 993,037 | |
| Denominator for diluted earnings per share | 147,084,080 | | | 151,015,574 | | | 155,779,364 | |
Recent Accounting Pronouncements
In November 2024, the Financial Accounting Standards Board (FASB) issued Accounting Standards Update (ASU) 2024-03 “Income Statement - Reporting Comprehensive Income (Topic 220): Disaggregation of Income Statement Expenses.” The ASU requires additional disclosures by disaggregating the costs and expense line items that are presented on the face of the income statement. The ASU is effective for the Company beginning with its 2027 annual disclosures and subsequent interim periods. Early adoption is permitted. This ASU requires a public company to apply the amendments either prospectively to financial statements issued for reporting periods after the effective date of this ASU or retrospectively to any or all prior periods presented in the financial statements. The Company is currently evaluating the impact of adopting this ASU on its disclosures.
In December 2023, the FASB amended ASC 740 (issued under ASU 2023-09, “Improvements to Income Tax Disclosures”). This ASU requires added disclosures related to the tax rate reconciliation and income taxes paid and includes other amendments intended to improve effectiveness and comparability. The amendment is effective for the Company beginning with its 2025 annual disclosures with early adoption permitted and should be applied on a prospective basis. The Company is currently evaluating the impact the adoption of ASU 2023-09 will have on its annual disclosures.
In November 2023, the FASB issued ASU 2023-07, “Segment Reporting (Topic 280) - Improvements to Reportable Segment Disclosures.” The update is intended to improve reportable segment disclosure requirements, primarily through enhanced disclosures about significant expenses. The ASU requires disclosures to include significant segment expenses that are regularly provided to the chief operating decision maker (CODM), a description of other segment items by reportable segment, and any additional measures of a segment's profit or loss used by the CODM when deciding how to allocate resources. The ASU also requires all annual disclosures currently required by Topic 280 to be included in interim periods. The update is effective for the Company beginning with its 2024 annual disclosures and interim periods beginning in 2025,
1. Organization and Significant Accounting Policies (continued)
with early adoption permitted and requires retrospective application to all prior periods presented in the financial statements. The adoption of ASU 2023-07 did not affect the Company’s financial position or its results of operations. Refer to Note 17, Operations by Segment, for additional disclosures.
2. Revenue Recognition
Substantially all of the Company’s sales are from contracts with customers for the purchase of its products. Contracts and customer purchase orders are used to determine the existence of a sales contract. Shipping documents are used to verify shipment. For substantially all of its products, the Company transfers control of products to the customer at the point in time when title and risk are passed to the customer, which generally occurs upon shipment of the product. Each unit sold is considered an independent, unbundled performance obligation. The Company’s sales arrangements do not include other performance obligations that are material in the context of the contract.
The nature, timing and amount of revenue for a respective performance obligation are consistent for each customer. The Company measures the sales transaction price based upon the payment terms associated with the transaction and whether the sales price is subject to refund or adjustment. Sales and value added taxes are excluded from the measurement of the transaction price. The Company’s payment terms for the majority of its customers are 30 to 90 days from shipment.
Additionally, certain customers in China pay the Company prior to the shipment of products resulting in a customer deposits liability of $54.4 million and $59.7 million at December 31, 2024 and December 31, 2023, respectively. Customer deposit liabilities are short term in nature, recognized into revenue within one year of receipt. The Company assesses the collectability of customer receivables based on the creditworthiness of a customer as determined by credit checks and analysis, as well as the customer’s payment history. In determining the allowance for credit losses, the Company also considers various factors including the aging of customer accounts and historical write-offs. In addition, the Company monitors other risk factors including forward-looking information when establishing adequate allowances for credit losses, which reflects the current estimate of credit losses expected to be incurred over the life of the receivables. The Company’s allowance for credit losses was $12.9 million and $10.1 million at December 31, 2024 and December 31, 2023, respectively.
Rebates and incentives are based on pricing agreements and are tied to sales volume. The amount of revenue is reduced for variable consideration related to customer rebates which are calculated using expected values and are based on program specific factors such as expected rebate percentages based on expected volumes. In situations where the customer has the right to return eligible products, the Company reduces revenue for its estimates of expected product returns, which are primarily based on an analysis of historical experience. Changes in such accruals may be required if actual sales volume differs from estimated sales volume or if future returns differ from historical experience. Shipping and handling costs billed to customers are included in net sales and the related costs are included in cost of products sold and are activities performed to fulfill the promise to transfer products.
Disaggregation of Net Sales
The Company is comprised of two reporting segments: North America and Rest of World. The Rest of World segment is primarily comprised of China, Europe and India. Both segments manufacture and market comprehensive lines of residential and commercial gas, heat pump and electric water heaters, boilers, tanks and water treatment products. Both segments primarily manufacture and market in their respective regions of the world.
As each segment manufactures and markets products in its respective region of the world, the Company has determined that geography is the primary factor in reporting its sales. The Company further disaggregates its North America segment sales by major product line as each of North America’s major product lines is sold through distinct distribution channels and these product lines may be impacted differently by certain economic factors. Within the Rest of World segment, particularly in China and India, the Company’s major customers purchase across the Company’s product lines, utilizing the same distribution channels regardless of product type. In addition, the impact of economic factors is unlikely to be differentiated by product line in the Rest of World segment.
The North America segment's major product lines are defined as the following:
Water heaters The Company’s water heaters are open water heating systems that heat potable water. Typical applications for water heaters include residences, restaurants, hotels, office buildings, laundries, car washes and small businesses. The Company sells residential and commercial water heater products and related parts through its wholesale distribution channel, which includes approximately 900 independent wholesale plumbing distributors. The Company also sells residential water heaters and related parts through retail and maintenance, repair and operations (MRO) channels. A significant portion of the Company’s water heater sales in the North America segment is derived from the replacement of existing products.
2. Revenue Recognition (continued)
Boilers The Company’s boilers are closed loop water heating systems used primarily for space heating or hydronic heating. The Company’s boilers are primarily used in applications in commercial settings for hospitals, schools, hotels and other large commercial buildings while residential boilers are used in homes, apartments and condominiums. The Company’s boiler distribution channel is comprised primarily of manufacturer representative firms, with the remainder of its boilers distributed through wholesale channels. The Company’s boiler sales in the North America segment are derived from a combination of replacement of existing products and new construction.
Water treatment products The Company’s water treatment products range from point-of-entry water softeners, solutions for problem well water, and whole-home water filtration products to on-the-go filtration bottles, point-of-use carbon, and reverse osmosis products. Typical applications for the Company’s water treatment products include residences, restaurants, hotels and offices. The Company sells water treatment products through its retail and wholesale distribution channels, similar to water heaters. The Company’s water treatment products are also sold through independent water quality dealers as well as directly to consumers including through e-commerce sales channels. A portion of the Company’s sales of water treatment products in the North America segment is comprised of replacement filters.
The following table disaggregates the Company’s net sales by segment. As described above, the Company’s North America segment sales are further disaggregated by major product line. In addition, the Company’s Rest of World segment sales are disaggregated by China and all other Rest of World.
| | | | | | | | | | | | | | | | | |
| Years ended December 31 (dollars in millions) | 2024 | | 2023 | | 2022 |
| North America | | | | | |
| Water heaters and related parts | $ | 2,441.7 | | | $ | 2,456.9 | | | $ | 2,325.1 | |
| Boilers and related parts | 260.0 | | | 240.1 | | | 272.0 | |
| Water treatment products | 248.4 | | | 225.9 | | | 222.0 | |
| Total North America | 2,950.1 | | | 2,922.9 | | | 2,819.1 | |
| Rest of World | | | | | |
| China | $ | 791.9 | | | $ | 835.1 | | | $ | 839.1 | |
| All other Rest of World | 126.7 | | | 121.8 | | | 126.7 | |
| Total Rest of World | 918.6 | | | 956.9 | | | 965.8 | |
| Inter-segment sales | (50.6) | | | (27.0) | | | (31.0) | |
| Total Net Sales | $ | 3,818.1 | | | $ | 3,852.8 | | | $ | 3,753.9 | |
3. Acquisitions
2024 Acquisitions
During the fourth quarter of 2024, the Company acquired Pureit, a residential water purification business in South Asia, from Unilever for an aggregate purchase price of $124.6 million. The purchase price consists of an initial cash payment of $117.9 million upon the closing of the transaction and a separate payment of $6.7 million made under a transitional supply agreement with Unilever. Due to the close proximity of the acquisition date and the Company's filing of its annual report on Form 10-K for the year ended December 31, 2024, the initial accounting for the business combination is incomplete and is pending identification and measurement of the assets acquired and liabilities assumed. Therefore, the Company is unable to disclose the information required by ASC 805, Business Combinations. Such information will be included in the Company's subsequent Form 10-Q. At December 31, 2024, the purchase price allocated to Goodwill was $117.9 million and the payment of $6.7 million was included in Other current assets within the Company’s consolidated financial statements. The acquired company is included in the Rest of World segment.
During the first quarter of 2024, the Company acquired a privately-held water treatment company. The Company paid an aggregate cash purchase price of $21.3 million, net of cash acquired. The Company also agreed to make contingent payments based on the amount by which sales of products increase over the next three years. The addition of the acquired company expanded the Company's water treatment footprint in North America. The acquired company is included in the North America segment.
3. Acquisitions (continued)
2023 Acquisitions
During the third quarter of 2023, the Company acquired a privately-held water treatment company. The Company paid an aggregate cash purchase price of $16.8 million, net of cash acquired. The addition of the acquired company expands the Company's water treatment platform. The acquired company is included in the North America segment.
2022 Acquisitions
During the second quarter of 2022, the Company acquired a privately-held water treatment company. The Company paid an aggregate cash purchase price of $5.5 million, net of cash acquired. The addition of the company acquired expands the Company's water treatment platform and is included in the North America segment for reporting purposes. In addition, in the third quarter of 2022, the Company incurred $4.3 million of expenses and related income tax benefit of $1.1 million associated with a terminated acquisition. These expenses were related to the due diligence of a prospective acquisition target and recorded within selling, general and administrative expenses in the consolidated statement of earnings.
As required under ASC 805, results of operations have been included in the Company’s consolidated financial statements from the date of acquisition.
4. Leases
The Company’s lease portfolio consists of operating leases for buildings and equipment, such as forklifts and copiers, primarily in the United States and China. The Company defines a lease as a contract that gives the Company the right to control the use of a physical asset for a stated term. The Company pays the lessor for that right, with a series of payments defined in the contract and a corresponding right of use operating lease asset and liability are recorded. The Company has elected not to record leases with an initial term of 12 months or less on its consolidated balance sheet. To determine balance sheet amounts, required legal payments are discounted using the Company’s incremental borrowing rate as of the inception of the lease. The incremental borrowing rate is the rate of interest that the Company would incur if it were to borrow, on a collateralized basis, an amount equal to the value of the leased item over a similar term, in a similar economic environment. Variable lease components not based on an index or rate are excluded from the measurement of the lease asset and liability and expensed as incurred for all asset classes.
Certain leases include one or more options to renew or terminate. Renewal terms can extend the lease term from one to five years and options to terminate can be effective within one year. The exercise of lease renewal or termination is at the Company’s discretion and when it is determined to be reasonably certain to renew or terminate, the option is reflected in the measurement of lease asset and liability. The Company’s lease agreements do not contain any arrangements related to material residual value guarantees, restrictive covenants or material subleases. Cash flows associated with leases are materially consistent with the expense recorded in the consolidated statement of earnings.
Supplemental balance sheet information related to leases is as follows:
| | | | | | | | | | | |
| (dollars in millions) | December 31, 2024 | | December 31, 2023 |
| Liabilities | | | |
| Short term: Accrued liabilities | $ | 11.3 | | | $ | 11.6 | |
| Long term: Operating lease liabilities | 23.5 | | | 27.9 | |
| Total operating lease liabilities | $ | 34.8 | | | $ | 39.5 | |
| Less: Rent incentives and deferrals | (2.0) | | | (2.2) | |
| Assets | | | |
| Operating lease assets | $ | 32.8 | | | $ | 37.3 | |
| | | | | |
| Lease Term and Discount Rate | December 31, 2024 |
| Weighted-average remaining lease term | 7.0 years |
| Weighted-average discount rate | 4.63% |
The components of lease expense were as follows:
| | | | | | | | | | | | | | | | | |
| (dollars in millions) | | | | | |
Lease Expense(1) | Classification | | Year ended December 31, 2024 | | Year ended December 31, 2023 |
| Operating lease expense | Cost of products sold | | $ | 7.0 | | | $ | 5.3 | |
| Selling, general and administrative expenses | | 15.9 | | | 16.2 | |
(1)Includes short-term lease expense of $1.7 million and variable lease expenses of $6.0 million for the year ended December 31, 2024 and short-term lease expense of $1.8 million and variable lease expenses of $4.6 million for the year ended December 31, 2023, respectively.
Maturities of lease liabilities were as follows:
| | | | | |
| (dollars in millions) | December 31, 2024 |
| 2025 | $ | 12.4 | |
| 2026 | 7.6 | |
| 2027 | 4.8 | |
| 2028 | 3.1 | |
| 2029 | 2.1 | |
| After 2029 | 10.7 | |
| Total lease payments | 40.7 | |
| Less: Imputed interest | (5.9) | |
| Present value of operating lease liabilities | $ | 34.8 | |
5. Restructuring and Impairment Expenses
2024 Restructuring and Impairment Expenses
The Company recognized $17.6 million of restructuring and impairment expenses during the year ended December 31, 2024. These expenses were comprised of $12.1 million in severance costs, $0.8 million of other restructuring expenses, and asset impairments of $4.7 million, as well as a corresponding $3.2 million tax benefit.
Of the $17.6 million expense recognized during the year ended December 31, 2024, $6.3 million was related to the Company’s water treatment business in the North America segment and was a result of a profitability improvement strategy that prioritizes improving its cost structure. In the Rest of World segment, severance costs in China of $11.3 million was related to the right sizing of that business for current market conditions.
2023 Restructuring and Impairment Expenses
In 2023, the Company determined that its business in Turkey (disposal group) included in the Rest of World segment met the criteria to be classified as held for sale. The Company determined the fair value of the disposal group, less cost to sell, was lower than its carrying amount. As a result the Company recorded an impairment expense of $15.6 million, of which $12.5 million was recorded in the Rest of World segment, and $3.1 million was recorded in Corporate Expense. The impairment was recorded as a net reduction of $4.5 million to the assets and liabilities and $11.1 million for the anticipated liquidation of the cumulative foreign currency translation adjustment associated with the disposal group. The remaining carrying value of the disposal group was $0.6 million and classified as held for sale. During 2023, the Company sold the disposal group for an amount that approximated the carrying value of the net assets. Upon closing of the sale in the second quarter of 2023, the Company released $11.0 million of foreign currency translation losses from accumulated other comprehensive loss.
In 2023, the Company recorded $3.2 million of restructuring expense related to the exit of a business within the Far East region.
5. Restructuring and Impairment Expenses (continued)
The following table presents an analysis of the Company’s restructuring reserve for the years ended December 31, 2024, 2023, and 2022:
| | | | | | | | | | | | | | | | | | | | | | | |
| (dollars in millions) | Severance
Costs | | Other Restructuring Expenses | | Non-cash
Impairments | | Total |
| Balance at December 31, 2022 | — | | | — | | | — | | | — | |
| Charges | 0.3 | | | 2.9 | | | 15.6 | | | 18.8 | |
| Non-cash and other adjustments | — | | | — | | | (15.6) | | | (15.6) | |
| Balance at December 31, 2023 | 0.3 | | | 2.9 | | | — | | | 3.2 | |
| Charges | 12.1 | | | 0.8 | | | 4.7 | | | 17.6 | |
| Cash payments | (3.5) | | | (2.2) | | | — | | | (5.7) | |
| Non-cash and other adjustments | — | | | — | | | (4.7) | | | (4.7) | |
| Balance at December 31, 2024 | 8.9 | | | 1.5 | | | — | | | 10.4 | |
6. Statement of Cash Flows
Supplemental cash flow information is as follows:
| | | | | | | | | | | | | | | | | |
| Years ended December 31 (dollars in millions) | 2024 | | 2023 | | 2022 |
| Net change in current assets and liabilities, net of acquisitions: | | | | | |
| Receivables | $ | 49.0 | | | $ | (16.4) | | | $ | 42.5 | |
| Inventories | (40.5) | | | 18.1 | | | (82.8) | |
| Other current assets | 7.1 | | | 7.2 | | | (9.1) | |
| Trade payables | (5.9) | | | (21.4) | | | (89.4) | |
| Accrued liabilities, including payroll and benefits | (32.9) | | | 28.4 | | | (46.5) | |
| Income taxes | 0.6 | | | 4.1 | | | (8.8) | |
| $ | (22.6) | | | $ | 20.0 | | | $ | (194.1) | |
In addition, cash interest paid during the years ended December 31, 2024, 2023 and 2022 was $6.7 million, $12.3 million, and $9.3 million, respectively. Total cash and cash equivalents and marketable securities at December 31, 2024 and 2023 was $276.1 million and $363.4 million, respectively, of which $205.7 million and $291.8 million were held by the Company’s foreign subsidiaries, at December 31, 2024 and 2023, respectively.
7. Inventories
The following table presents the components of the Company’s inventory balances:
| | | | | | | | | | | |
| December 31 (dollars in millions) | 2024 | | 2023 |
| Finished products | $ | 196.1 | | | $ | 177.7 | |
| Work in process | 42.4 | | | 44.2 | |
| Raw materials | 343.0 | | | 322.6 | |
| Inventories, at FIFO cost | 581.5 | | | 544.5 | |
| LIFO reserve | (49.4) | | | (47.1) | |
| Inventories, at LIFO cost | $ | 532.1 | | | $ | 497.4 | |
8. Property, Plant and Equipment
| | | | | | | | | | | |
| December 31 (dollars in millions) | 2024 | | 2023 |
| Land | $ | 30.0 | | | $ | 31.0 | |
| Buildings | 408.5 | | | 378.6 | |
| Equipment | 911.8 | | | 865.9 | |
| Software | 145.6 | | | 143.1 | |
| 1,495.9 | | | 1,418.6 | |
| Accumulated depreciation and amortization | (867.2) | | | (821.1) | |
| Net property, plant, and equipment | $ | 628.7 | | | $ | 597.5 | |
9. Goodwill and Other Intangible Assets
Changes in the carrying amount of goodwill during the years ended December 31, 2024 and 2023 consisted of the following:
| | | | | | | | | | | | | | | | | |
| (dollars in millions) | North America | | Rest of World | | Total |
| Balance at December 31, 2022 | $ | 561.1 | | | $ | 58.6 | | | $ | 619.7 | |
| Currency translation adjustment | 2.6 | | | (0.1) | | | 2.5 | |
| Acquisitions | 11.2 | | | — | | | 11.2 | |
| Balance at December 31, 2023 | 574.9 | | | 58.5 | | | 633.4 | |
| Currency translation adjustment | (8.7) | | | (1.4) | | | (10.1) | |
| Acquisitions | 20.5 | | | 117.9 | | | 138.4 | |
| Balance at December 31, 2024 | $ | 586.7 | | | $ | 175.0 | | | $ | 761.7 | |
The carrying amount of other intangible assets consisted of the following:
| | | | | | | | | | | | | | | | | | | | | | | | | | | | | | | | | | | |
| 2024 | | 2023 |
| December 31 (dollars in millions) | Gross
Carrying
Amount | | Accumulated
Amortization | | Net | | Gross
Carrying
Amount | | Accumulated
Amortization | | Net |
| Amortizable intangible assets: | | | | | | | | | | | |
| Patents | $ | 3.7 | | | $ | (3.7) | | | $ | — | | | $ | 3.7 | | | $ | (3.7) | | | $ | — | |
| Customer lists | 287.5 | | | (187.3) | | | 100.2 | | | 286.4 | | | (174.0) | | | 112.4 | |
| Total amortizable intangible assets | 291.2 | | | (191.0) | | | 100.2 | | | 290.1 | | | (177.7) | | | 112.4 | |
| Indefinite-lived intangible assets: | | | | | | | | | | | |
| Trade names | 220.9 | | | — | | | 220.9 | | | 224.3 | | | — | | | 224.3 | |
| Total intangible assets | $ | 512.1 | | | $ | (191.0) | | | $ | 321.1 | | | $ | 514.4 | | | $ | (177.7) | | | $ | 336.7 | |
Amortization expenses of other intangible assets of $12.7 million, $12.6 million, and $12.8 million were recorded in 2024, 2023 and 2022, respectively. In the future, excluding the impact of any future acquisitions, the Company expects amortization expense of approximately $12.7 million annually and the intangible assets will be amortized over a weighted-average period of 10 years.
The Company concluded that no goodwill impairment existed at the time of the annual impairment tests which were performed in the fourth quarters of 2024, 2023 and 2022. No impairments of other intangible assets were recorded in 2024, 2023 and 2022.
10. Debt
| | | | | | | | | | | |
| December 31 (dollars in millions) | 2024 | | 2023 |
| | | |
| Revolving credit agreement borrowings, average year-end interest rates of 5.3% for 2024 | 30.0 | | | — | |
| | | |
| Fixed rate agreements, expiring 2027-2034, average year-end interest rates of 4.6% for 2024 and 3.1% for 2023 | 163.2 | | | 127.3 | |
| 193.2 | | | 127.3 | |
| Long-term debt due within one year | (10.0) | | | (10.0) | |
| Long-term debt | $ | 183.2 | | | $ | 117.3 | |
In 2024, the Company renewed and amended its $500 million multi-year multi-currency revolving credit agreement with a new expiration date of August 23, 2029. The facility has an accordion provision which allows it to be increased up to $1 billion if certain conditions (including lender approval) are satisfied. Borrowings under the Company’s bank credit lines and commercial paper borrowings are supported by the $500 million revolving credit agreement. As a result of the long-term nature of this facility, the Company’s credit line borrowings are classified as long-term debt at December 31, 2024. At its option, the Company either maintains cash balances or pays fees for bank credit and services. The Company has fixed-rate interest expense obligations of $23.9 million on outstanding debt as of December 31, 2024. Scheduled maturities of long-term debt within each of the five years subsequent to December 31, 2024 are as follows:
| | | | | |
| Years ending December 31 (dollars in millions) | Amount |
| 2025 | $ | 10.0 | |
| 2026 | 39.7 | |
| 2027 | 39.7 | |
| 2028 | 25.5 | |
| 2029 | 55.5 | |
11. Stockholders’ Equity
The Company’s authorized capital consists of three million shares of Preferred Stock $1 par value, 27 million shares of Class A Common Stock $5 par value, and 240 million shares of Common Stock $1 par value. The Common Stock has equal dividend rights with Class A Common Stock and is entitled, as a class, to elect one-third of the Board of Directors and has 1/10th vote per share on all other matters. Class A Common Stock is convertible to Common Stock on a one for one basis.
There were 8,307 shares during 2024, 12,524 shares during 2023 and 68,785 shares during 2022, of Class A Common Stock converted into Common Stock. Regular dividends paid on the A. O. Smith Corporation Class A Common Stock and Common Stock amounted to $1.30, $1.22 and $1.14 per share in 2024, 2023 and 2022, respectively.
In 2024, the Board of Directors approved adding 2,000,000 shares of Common Stock to an existing discretionary share repurchase authority. Under the share repurchase program, the Common Stock may be purchased through a combination of Rule 10b5-1 automatic trading plan and discretionary purchases in accordance with applicable securities laws. The number of shares purchased and the timing of the purchases will depend on a number of factors, including share price, trading volume and general market conditions, as well as working capital requirements, general business conditions and other factors, including alternative investment opportunities. The stock repurchase authorization remains effective until terminated by the Company's Board of Directors which may occur at any time, subject to the parameters of any Rule 10b5-1 automatic trading plan that we may then have in effect. In 2024, the Company repurchased 3,755,337 shares at an average price of $81.43 per share and at a total cost of $305.8 million. As of December 31, 2024, there were 1,746,125 shares remaining on the existing repurchase authorization. In 2023, the Company repurchased 4,377,000 shares at a cost of $306.5 million. In 2022, the Company repurchased 6,647,895 shares at a cost of $403.5 million.
At December 31, 2024, a total of 130,380 and 46,257,599 shares of Class A Common Stock and Common Stock, respectively, were held as treasury stock. At December 31, 2023, a total of 130,380 and 43,049,885 shares of Class A Common Stock and Common Stock, respectively, were held as treasury stock.
11. Stockholders’ Equity (continued)
Changes to accumulated other comprehensive loss by component are as follows:
| | | | | | | | | | | | | | |
| (dollars in millions) | Years ended December 31, |
| 2024 | | | 2023 |
| Cumulative foreign currency translation | | | | |
| Balance at beginning of period | $ | (80.3) | | | | $ | (84.1) | |
| Other comprehensive (loss) gain before reclassifications | (24.0) | | | | 3.8 | |
| Balance at end of period | (104.3) | | | | (80.3) | |
| Unrealized net gain (loss) on cash flow derivatives | | | | |
| Balance at beginning of period | 0.7 | | | | 4.9 | |
| Other comprehensive (loss) gain before reclassifications | (0.5) | | | | 2.8 | |
Realized gains on derivatives reclassified to cost of products sold (net of tax provision of $0.5 and $2.2 in 2023, respectively)(1) | (1.7) | | | | (7.0) | |
| Balance at end of period | (1.5) | | | | 0.7 | |
| Pension liability | | | | |
| Balance at beginning of period | (4.6) | | | | (3.2) | |
| Other comprehensive loss before reclassifications | (1.8) | | | | (1.6) | |
Amounts reclassified from accumulated other comprehensive loss(1) | 0.3 | | | | 0.2 | |
| Balance at end of period | (6.1) | | | | (4.6) | |
| Total accumulated other comprehensive loss, end of period | $ | (111.9) | | | | $ | (84.2) | |
(1)Amounts reclassified from accumulated other comprehensive loss:
| | | | | | | | | | | | | | | | | |
| Realized gains on derivatives reclassified to cost of products sold | $ | (2.2) | | | | $ | (9.2) | | |
| Tax provision | 0.5 | | | | 2.2 | | |
| Reclassification net of tax | $ | (1.7) | | | | $ | (7.0) | | |
| Amortization of pension items: | | | | | |
| Actuarial losses | $ | 0.3 | | (2) | | $ | 0.1 | | (2) |
| Prior year service cost | 0.1 | | (2) | | 0.1 | | (2) |
| 0.4 | | | | 0.2 | | |
| Tax benefit | (0.1) | | | | — | | |
| Reclassification net of tax | $ | 0.3 | | | | $ | 0.2 | | |
(2)These accumulated other comprehensive loss components are included in the computation of net periodic benefit cost. See Note 13, “Pensions and Other Post-retirement Benefits” for additional details.
Included in the results for 2023 is $11.0 million of foreign currency translation losses reclassified from accumulated other comprehensive loss to Net earnings related to the Company's sale of its business in Turkey. See Note 5 - Restructuring and Impairment Expenses for additional details.
12. Stock Based Compensation
The Company adopted the A. O. Smith Combined Incentive Compensation Plan (the Incentive Plan) effective January 1, 2007, and the Incentive Plan was most recently reapproved by stockholders on April 15, 2020. The Incentive Plan is a continuation of the A. O. Smith Combined Executive Incentive Compensation Plan which was originally approved by stockholders in 2002. The number of shares available for granting of options or share units at December 31, 2024, was 2,291,099 which includes 2,400,000 additional shares that were authorized on April 15, 2020 at the Company's annual meeting of stockholders. Upon stock option exercise or share unit vesting, shares are issued from treasury stock. Total stock based compensation expense recognized in 2024, 2023 and 2022 was $14.9 million, $11.5 million and $11.1 million, respectively.
12. Stock Based Compensation (continued)
Stock Options
Beginning in 2023, the Company no longer grants stock options. The stock options previously granted in 2022 have three year pro rata vesting from the date of grant. Stock options were issued at exercise prices equal to the fair value of the Company’s Common Stock on the date of grant. For active employees, all options granted in 2022 expire ten years after the date of grant. The Company’s stock options are expensed ratably over the three year vesting period; however, included in the stock option expense recognized in 2022 is expense associated with the accelerated vesting of stock option awards for certain employees who either are retirement eligible or become retirement eligible during the vesting period. Stock based compensation expense attributable to stock options for 2024, 2023 and 2022 was $0.6 million, $1.2 million and $5.5 million, respectively.
Changes in options, all of which relate to the Company’s Common Stock, were as follows:
| | | | | | | | | | | | | | | | | | | | | | | | | | | | | | | | | | | |
| Years Ended December 31 | 2024 | | 2023 | | 2022 |
| Number of
Options | | Weighted
Avg. Per
Share
Exercise
Price | | Number of
Options | | Weighted
Avg. Per
Share
Exercise
Price | | Number of
Options | | Weighted
Avg. Per
Share
Exercise
Price |
| Number of shares under options: | | | | | | | | | | | |
| Outstanding at beginning of year | 1,872,553 | | | $ | 52.93 | | | 2,481,606 | | | $ | 51.22 | | | 2,252,498 | | | $ | 47.73 | |
| Granted | — | | | — | | | — | | | — | | | 322,460 | | | 74.11 | |
Exercised(1) | (473,452) | | | 46.46 | | | (600,344) | | | 45.68 | | | (66,697) | | | 39.77 | |
| Forfeited | (3,260) | | | 74.27 | | | (8,709) | | | 66.96 | | | (26,655) | | | 61.46 | |
Outstanding at end of year(2) | 1,395,841 | | | 55.07 | | | 1,872,553 | | | 52.93 | | | 2,481,606 | | | 51.22 | |
Exercisable at end of year(3) | 1,295,061 | | | 53.59 | | | 1,549,749 | | | 49.51 | | | 1,675,552 | | | 46.88 | |
(1)The total intrinsic value of options exercised in 2024, 2023 and 2022 was $18.0 million, $15.0 million and $1.6 million, respectively.
(2)The weighted average remaining contractual life of options outstanding was 6 years at December 31, 2024, and 7 years at December 31, 2023 and December 31, 2022, respectively. The aggregate intrinsic value of options outstanding at December 31, 2024 was $20.0 million.
(3)The weighted average remaining contractual life of options exercisable was 6 years at December 31, 2024, December 31, 2023, and December 31, 2022, respectively. The aggregate intrinsic value of options exercisable at December 31, 2024 was $20.0 million.
| | | | | | | | | | | |
| Number of Options | | Weighted Avg. Per
Share Exercise Price |
| Nonvested options at beginning of year | 322,804 | | | $ | 69.33 | |
| Vested | (219,931) | | | 67.09 | |
| Forfeited | (2,093) | | | 74.27 | |
| Nonvested options at end of year | 100,780 | | | 74.10 | |
12. Stock Based Compensation (continued)
The weighted-average fair value per option at the date of grant during 2022, using the Black-Scholes option-pricing model, was $17.57. Assumptions were as follows:
| | | | | | | | | |
| | | | | 2022 |
| Expected life (years) | | | | | 5.7 |
| Risk-free interest rate | | | | | 1.9 | % |
| Dividend yield | | | | | 1.5 | % |
| Expected volatility | | | | | 26.8 | % |
The expected lives of options for purposes of these models are based on historical exercise behavior. The risk-free interest rates for purposes of these models are based on the U.S. Treasury yield in effect on the date of grant for the respective expected lives of the option. The expected dividend yields for purposes of these models are based on the dividends paid in the preceding four quarters divided by the grant date market value of the Common Stock. The expected volatility for purposes of these models is based on the historical volatility of the Common Stock.
Share Units
Participants in the Incentive Plan may also be awarded share units. Share units vest three years after the date of grant. The Company granted 195,497, 168,807 and 94,731 share units under the Incentive Plan in 2024, 2023 and 2022, respectively.
The share units were valued at $16.1 million, $11.3 million and $7.0 million at the date of issuance in 2024, 2023 and 2022, respectively, based on the price of the Company’s Common Stock at the date of grant. The share units are recognized as compensation expense ratably over the three-year vesting period; however, included in share unit expense was expense associated with accelerated vesting of share unit awards for certain employees who are retirement eligible or will become retirement eligible during the vesting period. Stock based compensation expense attributable to share units of $12.5 million, $9.6 million and $5.6 million was recognized in 2024, 2023 and 2022, respectively. Certain non-U.S.-based employees receive the cash value of the share price at the vesting date in lieu of shares. Unvested cash-settled awards are remeasured at each reporting period.
A summary of share unit activity under the Incentive Plan is as follows:
| | | | | | | | | | | |
| Number of Units | | Weighted-Average
Grant Date Value |
| Issued and unvested at January 1, 2024 | 381,189 | | | $ | 63.33 | |
| Granted | 195,497 | | | 82.31 | |
| Vested | (98,216) | | | 60.32 | |
| Forfeited | (9,201) | | | 73.49 | |
| Issued and unvested at December 31, 2024 | 469,269 | | | 71.50 | |
Performance Stock Units
Beginning in 2023, certain executives may be awarded performance stock units under the Incentive Plan. Performance stock units vest over three years following the date of the grant. Performance stock units vest under a set of measurement criteria which are based upon achievement of certain sustainability targets. Potential payouts range from zero to 150 percent of the target awards and changes from target amounts are reflected as performance adjustments. The Company granted 29,475 and 24,580 performance stock units under the Incentive Plan in 2024 and 2023, respectively.
The performance stock units were valued at $2.4 million and $1.7 million at the date of issuance in 2024 and 2023, respectively, based on the price of the Company’s Common Stock at the date of grant. The performance stock units are recognized as compensation expense ratably over the three-year vesting period. Stock based compensation expense attributable to performance stock units of $1.8 million and $0.7 million was recognized in 2024 and 2023, respectively. Certain non-U.S.-based executives receive the cash value of the share price at the vesting date in lieu of shares. Unvested cash-settled awards are remeasured at each reporting period.
12. Stock Based Compensation (continued)
A summary of stock unit activity under the Incentive Plan is as follows:
| | | | | | | | | | | |
| Number of Units | | Weighted-Average
Grant Date Value |
| Issued and unvested at January 1, 2024 | 34,758 | | | $ | 67.14 | |
| Granted | 29,475 | | | 82.19 | |
| Forfeited | (6,124) | | | 75.48 | |
| Performance adjustments | 16,289 | | | 80.76 | |
| Issued and unvested at December 31, 2024 | 74,398 | | | 75.40 | |
13. Pension and Other Post-retirement Benefits
The Company provides retirement benefits for all U.S. employees including benefits for employees of previously owned businesses which were earned up to the date of sale. The Company also has two foreign pension plans, neither of which is material to the Company’s financial position.
The Company has a defined contribution plan which matches 100 percent of the first one percent of contributions made by participating employees and matches 50 percent of the next five percent of employee contributions. In addition, the Company has defined contribution plans for certain hourly employees which provide for matching Company contributions.
The Company had a defined benefit plan for salaried employees and its non-union hourly workforce. In 2009, the Company announced U.S. employees hired after January 1, 2010, would not participate in the defined benefit plan, and benefit accruals for the majority of current salaried and hourly employees sunset on December 31, 2014. An additional Company contribution is made to the defined contribution plan in lieu of benefits earned in a defined benefit plan. The Company also has defined benefit and contribution plans for certain union hourly employees.
In 2021, the Company's Board of Directors approved the termination of the defined benefit pension plan (the Plan) with a termination date of December 31, 2021. The Plan represented over 95 percent of the Company's pension plan liability. In 2022, the Company received a determination letter from the Internal Revenue Service (IRS) that allowed the Company to proceed with the termination process. The Company settled approximately $169 million of Plan liabilities through lump-sum payments from existing plan assets to eligible participants who elected to receive them and settled approximately $463 million of Plan liabilities by entering into an agreement to purchase annuities from Mass Mutual Life Insurance Company (MML). The irrevocable agreement with MML covers approximately 7,000 active and former employees and their beneficiaries, with MML assuming the future annuity payments for these individuals commencing March 1, 2023. These settlements resulted in $417.3 million of pretax expense in 2022, partially offset by approximately $167.7 million in related tax benefits. In 2023, the Company realized pre-tax pension settlement income of $0.9 million, of which $0.7 million was recorded in the North America segment and $0.2 million in Corporate Expense, and included $0.2 million in related tax benefits. The pension settlement income related to refunds from MML to the Plan for the reconciliation of participant data and was partially offset by settlement accounting adjustments. The remaining pension assets associated with the Plan at December 31, 2024 were $15.6 million. The Company intends to use the remaining assets to fund future non-elective contributions to the Company’s defined contribution plan.
The Company has unfunded defined-benefit post-retirement plans covering certain hourly and salaried employees that provide medical and life insurance benefits from retirement to age 65. Certain hourly employees retiring after January 1, 1996, are subject to a maximum annual benefit and salaried employees hired after December 31, 1993, are not eligible for post-retirement medical benefits.
Obligations and Funded Status
Pension and Post-retirement Disclosure Information
The following tables present the changes in benefit obligations, plan assets and funded status for domestic pension and post-retirement plans and the components of net periodic benefit costs.
13. Pension and Other Post-retirement Benefits (continued)
| | | | | | | | | | | | | | | | | | | | | | | |
| Pension Benefits | | Post-retirement Benefits |
| Years ended December 31 (dollars in millions) | 2024 | | 2023 | | 2024 | | 2023 |
| Accumulated benefit obligation (ABO) at December 31 | $ | (27.3) | | | $ | (26.3) | | | N/A | | N/A |
| Change in projected benefit obligations (PBO) | | | | | | | |
| PBO at beginning of year | $ | (26.7) | | | $ | (28.3) | | | $ | (1.7) | | | $ | (1.7) | |
| Service cost | (1.1) | | | (0.9) | | | — | | | — | |
| Interest cost | (1.4) | | | (1.2) | | | (0.1) | | | (0.1) | |
| Participant contributions | — | | | — | | | (0.1) | | | (0.1) | |
| | | | | | | |
| Actuarial gain (loss) including assumption changes | 0.7 | | | (1.1) | | | 0.1 | | | — | |
| Benefits paid | 0.8 | | | 4.8 | | | 0.2 | | | 0.2 | |
| PBO at end of year | $ | (27.7) | | | $ | (26.7) | | | $ | (1.6) | | | $ | (1.7) | |
| Change in fair value of plan assets | | | | | | | |
| Plan assets at beginning of year | $ | 20.3 | | | $ | 45.2 | | | $ | — | | | $ | — | |
| Actual return on plan assets | (1.4) | | | 0.6 | | | — | | | — | |
| Contribution by the Company | 0.5 | | | 0.5 | | | 0.1 | | | 0.1 | |
| Participant contributions | — | | | — | | | 0.1 | | | 0.1 | |
| Benefits paid | (0.8) | | | (4.8) | | | (0.2) | | | (0.2) | |
| Transfer related to plan termination | — | | | (21.2) | | | — | | | — | |
| Plan assets at end of year | $ | 18.6 | | | $ | 20.3 | | | $ | — | | | $ | — | |
| Funded status | $ | (9.1) | | | $ | (6.4) | | | $ | (1.6) | | | $ | (1.7) | |
| Amount recognized in the balance sheet | | | | | | | |
| Noncurrent assets | $ | 2.2 | | | $ | 4.4 | | | $ | — | | | $ | — | |
| Current liabilities | (0.5) | | | (0.5) | | | (0.2) | | | (0.2) | |
| Non-current liabilities | (10.8) | | | (10.3) | | | (1.4) | | | (1.5) | |
| Net pension liability at end of year | $ | (9.1) | | * | $ | (6.4) | | * | $ | (1.6) | | | $ | (1.7) | |
| Amounts recognized in accumulated other comprehensive loss before tax | | | | | | | |
| Net actuarial loss | $ | 8.3 | | | $ | 6.7 | | | $ | 0.2 | | | $ | 0.3 | |
| Prior service cost | 1.8 | | | 1.9 | | | (1.3) | | | (1.8) | |
| Total recognized in accumulated other comprehensive loss | $ | 10.1 | | | $ | 8.6 | | | $ | (1.1) | | | $ | (1.5) | |
*In addition, the Company has a liability for a foreign pension plan of $0.3 million at December 31, 2024 and 2023, respectively.
The actuarial loss in the current year for the pension plan was primarily due to the change in the discount rate.
13. Pension and Other Post-retirement Benefits (continued)
| | | | | | | | | | | | | | | | | | | | | | | | | | | | | | | | | | | |
| Pension Benefits | | Post-retirement Benefits |
| Years ended December 31 (dollars in millions) | 2024 | | 2023 | | 2022 | | 2024 | | 2023 | | 2022 |
| Net periodic cost (benefit) | | | | | | | | | | | |
| Service cost | $ | 1.1 | | | $ | 0.9 | | | $ | 1.4 | | | $ | — | | | $ | — | | | $ | — | |
| Interest cost | 1.4 | | | 1.2 | | | 14.5 | | | 0.1 | | | 0.1 | | | 0.1 | |
| Expected return on plan assets | (1.2) | | | (1.0) | | | (21.5) | | | — | | | — | | | — | |
| Amortization of unrecognized: | | | | | | | | | | | |
| Net actuarial loss | 0.3 | | | 0.1 | | | 19.9 | | | — | | | — | | | — | |
| Prior service cost | 0.1 | | | 0.1 | | | (0.4) | | | (0.5) | | | (0.5) | | | (0.5) | |
| Defined-benefit plan expense (income) | 1.7 | | | 1.3 | | | 13.9 | | | (0.4) | | | (0.4) | | | $ | (0.4) | |
| Pension settlement (income) expense | — | | | (0.9) | | | 417.3 | | | — | | | — | | | — | |
| Various U.S. defined contribution plans cost | 17.9 | | | 16.5 | | | 15.3 | | | — | | | — | | | — | |
| $ | 19.6 | | | $ | 16.9 | | | $ | 446.5 | | | $ | (0.4) | | | $ | (0.4) | | | $ | (0.4) | |
| | | | | | | | | | | |
Other changes in plan assets and projected benefit
obligation recognized in other comprehensive loss | | | | | | | | | | | |
| Net actuarial loss (gain) | $ | 1.9 | | | $ | 1.5 | | | $ | (27.0) | | | $ | (0.1) | | | $ | — | | | $ | 0.2 | |
| Amortization of net actuarial loss | (0.3) | | | (0.1) | | | (19.9) | | | — | | | — | | | — | |
| Settlement loss | — | | | — | | | (417.3) | | | — | | | — | | | — | |
| | | | | | | | | | | |
| Amortization of prior service cost | (0.1) | | | (0.1) | | | 0.4 | | | 0.5 | | | 0.5 | | | 0.5 | |
| Total recognized in other comprehensive loss | 1.5 | | | 1.3 | | | (463.8) | | | 0.4 | | | 0.5 | | | 0.7 | |
| Total recognized in net periodic cost (benefit) and other comprehensive loss | $ | 3.2 | | | $ | 1.7 | | | $ | (32.6) | | | $ | — | | | $ | 0.1 | | | $ | 0.3 | |
The 2024 and 2023 after tax adjustments for additional minimum pension liability resulted in other comprehensive (loss) of $(1.5) million and $(1.4) million, respectively.
Actuarial assumptions used to determine benefit obligations at December 31 are as follows:
| | | | | | | | | | | | | | | | | | | | | | | |
| Pension Benefits | | Post-retirement Benefits |
| 2024 | | 2023 | | 2024 | | 2023 |
| Discount rate | 5.57 | % | | 4.96 | % | | 5.49 | % | | 4.89 | % |
Actuarial assumptions used to determine net periodic benefit cost for the year ended December 31 are as follows:
| | | | | | | | | | | | | | | | | | | | | | | | | | | | | | | | | | | |
| Pension Benefits | | Post-retirement Benefits |
| Years ended December 31 | 2024 | | 2023 | | 2022 | | 2024 | | 2023 | | 2022 |
| Discount rate | 4.96 | % | | 5.15 | % | | 2.80 | % | | 4.89 | % | | 5.09 | % | | 2.44 | % |
| Expected long-term return on plan assets | 5.25 | % | | 5.25 | % | | 3.12 | % | | N/A | | N/A | | N/A |
| Rate of compensation increase | 4.00 | % | | 4.00 | % | | 4.00 | % | | N/A | | N/A | | N/A |
Assumed health care cost trend rates
Health care inflation assumptions are no longer needed as all remaining retiree medical benefits are fixed subsidies or reimbursements.
13. Pension and Other Post-retirement Benefits (continued)
Plan Assets
The Company’s pension plan weighted asset allocations as of December 31 by asset category are as follows:
| | | | | | | | | | | |
| Asset Category | 2024 | | 2023 |
| Equity securities | 19 | % | | 17 | % |
| Debt securities | 76 | | | 70 | |
| | | |
| Private equity | 5 | | | 12 | |
| Cash | — | | | 1 | |
| 100 | % | | 100 | % |
The following tables present the fair value measurement of the Company’s plan assets as of December 31, 2024 and 2023 (dollars in millions):
| | | | | | | | | | | | | | | | | | | | | | | |
| | | December 31, 2024 |
| Asset Category | Total | | Quoted Prices in
Active Markets for
Identical Contracts
(Level 1) | | Significant Other
Observable Inputs
(Level 2) | | Significant Non-
observable Inputs
(Level 3) |
| Short-term investments | $ | 0.2 | | | $ | 0.2 | | | $ | — | | | $ | — | |
| Equity securities | | | | | | | |
| Common stocks | 2.3 | | | 2.3 | | | — | | | — | |
| | | | | | | |
| Fixed income securities | | | | | | | |
| U.S. Treasury securities | 6.5 | | | 0.8 | | | 5.7 | | | — | |
| Other fixed income securities | 7.4 | | | — | | | 7.4 | | | — | |
| | | | | | | |
| | | | | | | |
| Other types of investments | | | | | | | |
| Mutual funds | 1.2 | | | — | | | 1.2 | | | — | |
| | | | | | | |
| Private equity | 0.9 | | | — | | | — | | | 0.9 | |
| Total fair value of plan asset investments | $ | 18.5 | | | $ | 3.3 | | | $ | 14.3 | | | $ | 0.9 | |
| Non-investment plan assets | 0.1 | | | | | | | |
| Total plan assets | $ | 18.6 | | | | | | | |
| | | | | | | | | | | | | | | | | | | | | | | |
| | | December 31, 2023 |
| Asset Category | Total | | Quoted Prices in
Active Markets for
Identical Contracts
(Level 1) | | Significant Other
Observable Inputs
(Level 2) | | Significant Non-
observable Inputs
(Level 3) |
| Short-term investments | $ | 0.2 | | | $ | 0.2 | | | $ | — | | | $ | — | |
| Equity securities | | | | | | | |
| Common stocks | 2.5 | | | 2.5 | | | — | | | — | |
| | | | | | | |
| Fixed income securities | | | | | | | |
| U.S. Treasury securities | 6.7 | | | 0.6 | | | 6.1 | | | — | |
| Other fixed income securities | 7.4 | | | — | | | 7.4 | | | — | |
| | | | | | | |
| | | | | | | |
| Other types of investments | | | | | | | |
| Mutual funds | 1.0 | | | — | | | 1.0 | | | — | |
| | | | | | | |
| Private equity | 2.4 | | | — | | | — | | | 2.4 | |
| Total fair value of plan asset investments | $ | 20.2 | | | $ | 3.3 | | | $ | 14.5 | | | $ | 2.4 | |
| Non-investment plan assets | 0.1 | | | | | | | |
| Total plan assets | $ | 20.3 | | | | | | | |
The short-term investments included in the Company’s plan assets consist of cash and cash equivalents. The fair value of the remaining categories of the Company’s plan assets are valued as follows: equity securities are valued using the closing stock price on a national securities exchange, which reflects the last reported sales price on the last business day of the year; fixed income securities are valued using institutional bond quotes, which are based on various market and industry inputs; mutual funds and real estate funds are valued using the net asset value of the fund, which is based on the fair value of the underlying securities; Options are valued using the closings market value on the last day of the year; and private equity investments are
13. Pension and Other Post-retirement Benefits (continued)
valued at the estimated fair value at the previous quarter end, which is based on the proportionate share of the underlying portfolio investments.
The following table presents a reconciliation of the fair value measurements using significant unobservable inputs (Level 3) as of December 31, 2024 and 2023 (dollars in millions):
| | | | | | | | | |
| | | Private
equity | | |
| Balance at December 31, 2022 | | | $ | 2.2 | | | |
| Actual return (loss) on plan assets: | | | | | |
| Relating to assets still held at the reporting date | | | 3.9 | | | |
| Relating to assets sold during the period | | | (3.6) | | | |
| Purchases, sales and settlements | | | (0.3) | | | |
| Transfers in and/or out | | | 0.2 | | | |
| Balance at December 31, 2023 | | | 2.4 | | | |
| Actual return (loss) on plan assets: | | | | | |
| Relating to assets still held at the reporting date | | | (0.6) | | | |
| Relating to assets sold during the period | | | (1.0) | | | |
| Purchases, sales and settlements | | | 0.1 | | | |
| | | | | |
| Balance at December 31, 2024 | | | $ | 0.9 | | | |
The Company’s investment policies employ an approach whereby a diversified blend of equity and bond investments is used to maximize the long-term return of plan assets for a prudent level of risk. Equity investments are diversified across domestic and non-domestic stocks, as well as growth, value, and small to large capitalizations. Bond investments include corporate and government issues, with short, mid, and long-term maturities, with a focus on investment-grade when purchased. The Company’s target allocation to equity managers is between 30 to 60 percent with the remainder allocated primarily to bonds, private equity managers, and cash. Investment and market risks are measured and monitored on an ongoing basis through regular investment portfolio reviews, annual liability measurements and periodic asset/liability studies.
The Company’s actual asset allocations are in line with target allocations. The Company regularly reviews its actual asset allocation and periodically rebalances its investments to the targeted allocation when considered appropriate.
There was no Company stock included in plan assets at December 31, 2024.
Cash Flows
The Company was not required to make any contributions in 2024 to the Plan and is not required to make a contribution in 2025.
Estimated Future Payments
As of December 31, 2024, the following benefit payments, which reflect expected future service, as appropriate, are expected to be paid:
| | | | | | | | | | | |
| Years ended December 31 (dollars in millions) | Pension Benefits | | Post-retirement
Benefits |
| 2025 | $ | 0.9 | | | $ | 0.2 | |
| 2026 | 1.0 | | | 0.2 | |
| 2027 | 5.4 | | | 0.2 | |
| 2028 | 6.0 | | | 0.2 | |
| 2029 | 1.2 | | | 0.2 | |
| 2030 – 2034 | 7.0 | | | 0.6 | |
14. Derivative Instruments
The Company utilizes certain derivative instruments to enhance its ability to manage currency exposure as well as raw materials price risk. Derivative instruments are entered into for periods consistent with the related underlying exposures and do not constitute positions independent of those exposures. The Company does not enter into contracts for speculative purposes. The contracts are executed with major financial institutions with no credit loss anticipated for failure of the counterparties to perform.
Cash Flow Hedges
With the exception of its net investment hedges, the Company designates all of its hedging instruments as cash flow hedges. For derivative instruments that are designated and qualify as a cash flow hedge (i.e., hedging the exposure to variability in expected future cash flows that is attributable to a particular risk), gains or losses on the derivative instrument are reported as a component of other comprehensive loss, net of tax, and are reclassified into earnings in the same line item associated with the forecasted transaction and in the same period or periods during which the hedged transaction affects earnings.
Foreign Currency Forward Contracts
The Company is exposed to foreign currency exchange risk as a result of transactions in currencies other than the functional currency of certain subsidiaries. The Company utilizes foreign currency forward purchase and sale contracts to manage the volatility associated with foreign currency purchases, sales and certain intercompany transactions in the normal course of business. Principal currencies for which the Company utilizes foreign currency forward contracts include the British pound, Canadian dollar, Euro and Mexican peso.
Gains and losses on these instruments are recorded in accumulated other comprehensive loss, net of tax, until the underlying transaction is recorded in earnings. When the hedged item is realized, gains or losses are reclassified from accumulated other comprehensive loss to the consolidated statement of earnings. The assessment of effectiveness for forward contracts is based on changes in the forward rates. These hedges have been determined to be effective.
The majority of the amounts in accumulated other comprehensive loss for cash flow hedges are expected to be reclassified into earnings within one year. The combined fair value of the foreign currency forward contracts was a liability balance of $1.4 million as of December 31, 2024 which was recorded in Accrued liabilities within the consolidated balance sheet. The combined fair value of the foreign currency forward contracts was an asset balance of $0.9 million as of December 31, 2023 and recorded in Other current assets within the consolidated balance sheet.
The following table summarizes, by currency, the contractual amounts of the Company’s foreign currency forward contracts that are designated as cash flow hedges:
| | | | | | | | | | | | | | | | | | | | | | | |
| December 31 (dollars in millions) | 2024 | | 2023 |
| Buy | | Sell | | Buy | | Sell |
| | | | | | | |
| Canadian dollar | — | | | 28.9 | | | — | | | 80.5 | |
| Euro | 14.0 | | | — | | | 24.1 | | | — | |
| Mexican peso | 27.2 | | | — | | | 14.2 | | | — | |
| Total | $ | 41.2 | | | $ | 28.9 | | | $ | 38.3 | | | $ | 80.5 | |
Interest Rate Swaps
The Company is exposed to interest rate risk as a result of the Company’s floating rate borrowings. The Company enters into forward interest rate swap agreements with an independent counterparty to hedge the variability in cash flows due to changes in Secured Overnight Financing Rate (SOFR) benchmark interest rate associated with variable rate borrowings. The interest rate swap has a maturity date of September 30, 2029 and effectively converts the Company’s variable interest rate obligations to fixed interest rate obligations. Interest rate swaps with an aggregate notional amount of 4.2 billion rupees and zero were
14. Derivative Instruments (continued)
outstanding as of December 31, 2024 and December 31, 2023, respectively. The aggregate effective interest rate of the swap as of December 31, 2024 was 8.25%.
The fair value of the interest rate swap contract was a liability balance of $0.5 million as of December 31, 2024 which was recorded in Accrued liabilities within the consolidated balance sheet. The fair value of the interest rate swap contract was zero as of December 31, 2023.
The effect of cash flow hedges on the consolidated statement of earnings:
Years ended December 31 (dollars in millions):
| | | | | | | | | | | | | | | | | | | | | | | | | | | | | |
Derivatives in ASC 815 cash flow
hedging relationships | Amount of (loss) gain recognized in other
comprehensive loss on
derivatives | | Location of gain (loss)
reclassified from
accumulated other
comprehensive loss into
earnings | | Amount of gain (loss) reclassified
from accumulated
other comprehensive
loss into earnings |
| 2024 | | 2023 | | | | 2024 | | 2023 |
| Foreign currency contracts | $ | (0.7) | | | $ | 3.7 | | | Cost of products sold | | $ | 2.2 | | | $ | 9.2 | |
| Interest rate swaps | $ | (0.5) | | | $ | — | | | Interest Expense | | $ | (0.1) | | | $ | — | |
| | | | | | | | | |
| | | | | | | | | |
Net Investment Hedges
The Company uses foreign currency denominated intercompany debt and third-party foreign currency forward contracts to hedge the exposure to a portion of the Company’s net investments in certain non-U.S. subsidiaries against the effect of exchange rate fluctuations on the translation of foreign currency balances to the U.S. dollar. For the derivative instruments that are designated and qualify as net investment hedges, gains and losses are reported in other comprehensive loss where they offset gains and losses recorded on the Company’s net investments in its non-U.S. subsidiaries. These hedges are determined to be effective. The Company recognized $2.3 million of after tax gains and $(1.8) million of after-tax losses associated with hedges of a net investment in non-U.S. subsidiaries in currency translation adjustment in other comprehensive income in 2024 and 2023, respectively.
The contractual amount of the Company’s foreign currency denominated intercompany debt that are designated as net investment hedge was 1.5 billion RMB as of December 31, 2024. The fair value of the net investment hedges was zero as of December 31, 2024. The contractual amount of the Company’s foreign currency denominated intercompany debt that are designated as net investment hedge was $204.0 million as of December 31, 2023. The fair value of the third-party foreign currency forward contracts was a liability balance $(4.2) million as of December 31, 2023 which was recorded in Accrued liabilities within the consolidated balance sheet.
Balance Sheet Hedges
Foreign Exchange Contracts
The Company periodically enters into foreign exchange contracts to mitigate the foreign currency volatility relative to certain intercompany loans. These foreign exchange contracts did not qualify for hedge accounting in accordance with ASC 815 and as such were marked to market through earnings. The combined fair value of the foreign exchange contracts was zero as of December 31, 2024. The combined fair value of the foreign exchange contracts was an liability balance of $(0.8) million as of December 31, 2023 and recorded in Accrued liabilities within the consolidated balance sheet.
The following table summarizes the contractual amounts of the Company's foreign exchange contracts that are designated as balance sheet hedges:
| | | | | | | | | | | | | | | | | | | | | | | |
| December 31 (dollars in millions) | 2024 | | 2023 |
| Buy | | Sell | | Buy | | Sell |
| Canadian dollar | $ | — | | | $ | 6.4 | | | $ | 44.1 | | | $ | — | |
| Chinese yuan | — | | | — | | | 206.8 | | | — | |
| Total | $ | — | | | $ | 6.4 | | | $ | 250.9 | | | $ | — | |
The amounts recognized within the consolidated statements of earnings related to the Company's foreign exchange contracts are set forth below.
14. Derivative Instruments (continued)
Years ended December 31 (dollars in millions)
| | | | | | | | | | | | | | | | | | | | | | | |
| Derivatives not designated as hedging instruments: | Location of within the consolidated statements of earnings | | 2024 | | 2023 | | 2022 |
| Foreign exchange contracts | Other expense (income) - net | | $ | 0.9 | | | $ | (3.7) | | | $ | 1.2 | |
15. Income Taxes
The components of the provision for (benefit from) income taxes consisted of the following:
| | | | | | | | | | | | | | | | | |
| Years ended December 31 (dollars in millions) | 2024 | | 2023 | | 2022 |
| Current: | | | | | |
| Federal | $ | 124.3 | | | $ | 124.9 | | | $ | 101.8 | |
| State | 25.2 | | | 28.3 | | | 26.6 | |
| International | 22.5 | | | 27.5 | | | 30.5 | |
| Deferred: | | | | | |
| Federal | (4.4) | | | (4.8) | | | (136.9) | |
| State | (0.5) | | | (1.8) | | | (34.1) | |
| International | 0.3 | | | 2.8 | | | 0.1 | |
| $ | 167.4 | | | $ | 176.9 | | | $ | (12.0) | |
The provision for (benefit from) income taxes differs from the U.S. federal statutory rate due to the following items:
| | | | | | | | | | | | | | | | | |
| Years ended December 31 | 2024 | | 2023 | | 2022 |
Provision at U.S. federal statutory rate(1) | 21.0 | % | | 21.0 | % | | 21.0 | % |
State taxes, net of federal benefit(1) | 2.8 | | | 2.8 | | | 2.7 | |
U.S pension plan settlement expense(1) | — | | | — | | | (29.5) | |
| International income tax rate differential—China | (1.1) | | | (1.2) | | | (4.6) | |
| International income tax rate differential—other | 0.7 | | | 1.3 | | | 3.5 | |
| Research tax credits | (0.4) | | | (0.4) | | | (1.0) | |
| Excess tax benefit on stock compensation | (0.5) | | | (0.4) | | | (0.5) | |
| Other | 1.4 | | | 1.0 | | | 3.0 | |
| 23.9 | % | | 24.1 | % | | (5.4) | % |
(1) Included in 2022 is tax effects of the pension plan settlement expense associated with the termination of the Plan. Refer to Note 13, “Pension and Other Postretirement Benefits” for more information. A tax benefit of $101.9 million on the pretax expense were reflected in computed tax provision at U.S. federal statutory rate and state taxes, net of federal tax benefit for 2022. In 2022, the tax benefit of $65.8 million or a 29.5 percent benefit related to the release of stranded tax effects in AOCL through the income statement was reflected in U.S. pension plan settlement expense.
Components of earnings before income taxes were as follows:
| | | | | | | | | | | | | | | | | |
| Years ended December 31 (dollars in millions) | 2024 | | 2023 | | 2022 |
| U.S. | $ | 577.2 | | | $ | 596.4 | | | $ | 63.9 | |
| International | 123.8 | | | 137.1 | | | 159.8 | |
| $ | 701.0 | | | $ | 733.5 | | | $ | 223.7 | |
Our 2022 provision for income taxes included $167.7 million of tax benefit related to the effective settlement of the Plan, $101.9 million of which was the related tax effect on the pretax expense of $417.3 million and $65.8 million of which was related to the release of stranded tax effects in AOCL through the Tax Cuts and Jobs Act. Refer to Note 13, “Pension and Other Postretirement Benefits,” for more information.
The Company paid income taxes of $187.7 million, $189.5 million, and $175.4 million in 2024, 2023 and 2022, respectively.
15. Income Taxes (continued)
Undistributed earnings of the Company’s foreign subsidiaries amounted to $695.0 million at December 31, 2024. The Company had $3.5 million accrued for its estimate of withholding taxes due upon repatriation of approximately $93.5 million of foreign earnings it considers not permanently reinvested as of December 31, 2024. The Company considers $601.5 million of the total undistributed earnings to be permanently reinvested as a result of various factors including imposition of statutory restrictions at certain jurisdictions that prohibit the repatriation of a portion of the earnings. Accordingly, no provision for state, local and foreign withholding income taxes has been provided thereon. Upon repatriation of those earnings, in the form of dividends or otherwise, the Company would be subject to state and local taxes, and withholding taxes payable to the various foreign countries. The Company expects to be able to take a 100 percent dividend received deduction to offset any US federal income tax liability. Determination of the amount of unrecognized state and local deferred income tax liability and associated foreign withholding taxes is not practicable due to the complexities associated with its hypothetical calculation.
The tax effects of temporary differences of assets and liabilities between income tax and financial reporting are as follows:
| | | | | | | | | | | | | | | | | | | | | | | |
| December 31 (dollars in millions) | 2024 | | 2023 |
| Assets | | Liabilities | | Assets | | Liabilities |
| Employee benefits | $ | 16.7 | | | $ | — | | | $ | 12.9 | | | $ | — | |
| Product liability and warranties | 51.6 | | | — | | | 52.1 | | | — | |
| Inventories | 2.0 | | | — | | | 3.0 | | | — | |
| Accounts receivable | 12.0 | | | — | | | 13.3 | | | — | |
| Property, plant and equipment | — | | | 49.8 | | | — | | | 52.4 | |
| Intangibles | — | | | 58.6 | | | — | | | 62.4 | |
| Environmental liabilities | 1.4 | | | — | | | 1.5 | | | — | |
| Undistributed foreign earnings | — | | | 3.5 | | | — | | | 5.1 | |
| Tax loss and credit carryovers | 9.7 | | | — | | | 12.3 | | | — | |
| All other | 11.0 | | | — | | | 17.6 | | | — | |
| Valuation allowance | (6.1) | | | — | | | (11.7) | | | — | |
| $ | 98.3 | | | $ | 111.9 | | | $ | 101.0 | | | $ | 119.9 | |
| Net liability | | | $ | 13.6 | | | | | $ | 18.9 | |
The Company believes it is more likely than not that it will realize its net deferred tax assets through the reduction of future taxable income. The Company considered historical operating results in determining the probability of the realization of the deferred tax assets.
A reconciliation of the beginning and ending amounts of tax loss carryovers, credit carryovers and valuation allowances is as follows:
| | | | | | | | | | | | | | | | | | | | | | | |
| Net Operating Losses and Tax Credits | | Valuation Allowances |
| December 31 (dollars in millions) | 2024 | | 2023 | | 2024 | | 2023 |
| Beginning balance | $ | 12.3 | | | $ | 10.1 | | | $ | 11.7 | | | $ | 8.3 | |
| Change in balance | (2.6) | | | 2.2 | | | (5.6) | | | 3.4 | |
| Ending balance | $ | 9.7 | | | $ | 12.3 | | | $ | 6.1 | | | $ | 11.7 | |
The Company has foreign net operating loss carryovers that expire in 2025 through 2030, with some net operating losses being carried forward indefinitely and state and local net operating loss carryovers that are carried forward indefinitely.
A reconciliation of the beginning and ending amount of unrecognized benefits is as follows:
| | | | | | | | | | | |
| (dollars in millions) | 2024 | | 2023 |
| Balance at January 1 | $ | 17.2 | | | $ | 15.0 | |
| Change to tax positions from prior years | (1.0) | | | 2.2 | |
| Balance at December 31 | $ | 16.2 | | | $ | 17.2 | |
15. Income Taxes (continued)
The amount of unrecognized tax benefits that, if recognized, would affect the effective income tax rate is $4.3 million. The Company recognizes potential interest and penalties related to unrecognized tax benefits as a component of income tax expense. At December 31, 2024, there was an immaterial amount of interest and penalties accrued. The Company anticipates that there will not be a material decrease in the total amount of unrecognized tax benefits in 2025. The Company’s U.S. federal income tax returns and its U.S. state and local income tax returns are subject to audit for the years 2018-2024 and 2006-2024, respectively. The Company is subject to examinations in foreign tax jurisdictions for the years 2018-2024. If the examinations at certain foreign tax jurisdictions are resolved unfavorably, there could be additional assessments imposed by the relevant authorities.
16. Commitments and Contingencies
Environmental Contingencies
The Company is a potentially responsible party in judicial and administrative proceedings seeking to clean up sites which have been environmentally impacted. In each case, the Company has established reserves, insurance proceeds and/or a potential recovery from third parties. The Company believes any environmental claims will not have a material effect on its financial position or results of operations.
Product Liability
The Company is subject to various claims and pending lawsuits for product liability and other matters arising out of the conduct of the Company’s business. For product liability claims, the Company self insures a portion of its product liability loss exposure. The Company has established reserves and insurance coverage that it believes are adequate to cover incurred claims. For the years ended December 31, 2024 and 2023, the Company had $125 million of product liability insurance for individual losses in excess of $7.5 million. At December 31, 2024 and 2023, the reserve for product liability was $26.3 million and $30.5 million, respectively. The Company periodically reevaluates its exposure on claims and lawsuits and makes adjustments to its reserves as appropriate. The Company believes, based on current knowledge, consultation with counsel, adequate reserves and insurance coverage that the outcome of such claims and lawsuits will not have a material adverse effect on the Company’s financial position, results of operations or cash flows.
Purchase Obligations
The Company utilizes blanket purchase orders to communicate expected annual requirements to certain suppliers. Requirements under blanket purchase orders generally do not become committed until several weeks prior to the scheduled unit production. The purchase obligations the Company considers firm as of December 31, 2024, is $188.8 million, most of which will be ordered in 2025.
Inventory Repurchase Arrangements
The Company maintains a commercial relationship with a supply-chain service provider (the Provider) in connection with the Company’s business in China. In this capacity, the Provider offers order-entry, warehousing and logistics support. The Provider also offers asset-backed financing to certain of the Company’s distributors in China to facilitate their working capital needs. To facilitate its financing support business, the Provider has collateralized lending facilities in place with multiple Chinese banks under which the Company has agreed to repurchase inventory if both requested by the banks and certain defined conditions are met, primarily related to the aging of the distributors’ notes.
The Provider is required to indemnify the Company for any losses the Company would incur in the event of an inventory repurchase under these arrangements. Potential losses under the repurchase arrangements represent the difference between the repurchase price and net proceeds from the resale of product plus costs incurred in the process, less related distributor rebates.
Before considering any reduction of distributor rebate accruals of $2.0 million and $0.6 million as of December 31, 2024 and December 31, 2023, respectively, and from the resale of the related inventory, the gross amount the Company would be obligated to repurchase, which would be contingent on the default of all of the outstanding loans, was approximately $2.9 million and $0.8 million as of December 31, 2024 and December 31, 2023, respectively. The Company’s reserves for estimated losses under repurchase arrangements were immaterial as of December 31, 2024 and December 31, 2023.
Legal Judgment Income
On September 28, 2022, the Company received a cash judgment of $11.5 million from a competitor of our North America segment related to its infringement of one of the Company’s patents. The terms of the judgment resulted in pre-tax income of $11.5 million which is recorded as an offset to selling, general and administrative expenses and a related tax expense of $2.9 million.
17. Operations by Segment
The Company is comprised of two reporting segments: North America and Rest of World. The Rest of World segment is primarily comprised of China, Europe and India. Both segments manufacture and market comprehensive lines of residential and commercial gas and electric water heaters, boilers, tanks and water treatment products. Both segments primarily manufacture and market in their respective regions of the world.
The Company’s Chief Executive Officer (CEO) is the Chief Operating Decision Maker (CODM). The CODM allocates resources and makes operating decisions based on the financial information presented by the two reporting segments. The measures regularly reviewed by our CODM include segment sales, earnings, and segment margin. Segment earnings, defined by the Company as earnings before interest expense, taxes, corporate expense, and corporate research and development expenses, were used to measure the performance of the segments. Our CODM uses these financial measures to evaluate and allocate capital and company resources as critical determinants of segment performance.
The accounting policies of the reportable segments are the same as those described in the “Summary of Significant Accounting Policies” outlined in Note 1 - Organization and Significant Accounting Policies.
| | | | | | | | | | | | | | | | | | | | | | | | | | | | | | | | | | | |
| December 31, 2024 |
| (dollars in millions) | North America | | Rest of World | | Inter-segment Elimination | | Total Segments | | Less: Corporate Expenses | | Total |
| Sales from external customers | $ | 2,928.1 | | | $ | 890.0 | | | $ | — | | | $ | 3,818.1 | | | $ | — | | | $ | 3,818.1 | |
| Inter-segment sales | 22.0 | | | 28.6 | | | — | | | 50.6 | | | — | | | 50.6 | |
| 2,950.1 | | | 918.6 | | | — | | | 3,868.7 | | | — | | | 3,868.7 | |
| Elimination of Inter-segment sales | (22.0) | | | (28.6) | | | — | | | (50.6) | | | — | | | (50.6) | |
| Net Sales | 2,928.1 | | | 890.0 | | | — | | | 3,818.1 | | | — | | | 3,818.1 | |
| Cost of products sold | 1,780.1 | | | 581.9 | | | — | | | 2,362.0 | | | — | | | 2,362.0 | |
| Gross Profit | 1,148.0 | | | 308.1 | | | — | | | 1,456.1 | | | — | | | 1,456.1 | |
| Inter-segment Profit | — | | | 0.4 | | | (0.4) | | | — | | | — | | | — | |
| Selling, general and administrative expenses | 433.2 | | | 235.0 | | | — | | | 668.2 | | | 71.1 | | | 739.3 | |
| Restructuring and impairment expense | 6.3 | | | 11.3 | | | — | | | 17.6 | | | — | | | 17.6 | |
Other expense (income), net(1) | 1.0 | | | (2.3) | | | — | | | (1.3) | | | (7.2) | | | (8.5) | |
| Earnings | $ | 707.5 | | | $ | 64.5 | | | $ | (0.4) | | | $ | 771.6 | | | $ | (63.9) | | | $ | 707.7 | |
| Interest expense | | | | | | | | | | | (6.7) | |
| Earning before provision for income taxes | | | | | | | | | | | $ | 701.0 | |
(1)Other expense (income), net consist primarily of interest income that is located within Corporate Expenses.
| | | | | | | | | | | | | | | | | | | | | | | | | | | | | | | | | | | |
| December 31, 2023 |
| (dollars in millions) | North America | | Rest of World | | Inter-segment Elimination | | Total Segments | | Less: Corporate Expenses | | Total |
| Sales from external customers | $ | 2,904.3 | | | $ | 948.5 | | | $ | — | | | $ | 3,852.8 | | | $ | — | | | $ | 3,852.8 | |
| Inter-segment sales | 18.6 | | | 8.4 | | | — | | | 27.0 | | | — | | | 27.0 | |
| 2,922.9 | | | 956.9 | | | — | | | 3,879.8 | | | — | | | 3,879.8 | |
| Elimination of Inter-segment sales | (18.6) | | | (8.4) | | | — | | | (27.0) | | | — | | | (27.0) | |
| Net Sales | 2,904.3 | | | 948.5 | | | — | | | 3,852.8 | | | — | | | 3,852.8 | |
| Cost of products sold | 1,761.1 | | | 607.0 | | | — | | | 2,368.1 | | | (0.1) | | | 2,368.0 | |
| Gross Profit | 1,143.2 | | | 341.5 | | | — | | | 1,484.7 | | | 0.1 | | | 1,484.8 | |
| Inter-segment Profit | — | | | 0.5 | | | (0.5) | | | — | | | — | | | — | |
| Selling, general and administrative expenses | 411.6 | | | 243.0 | | | — | | | 654.6 | | | 72.8 | | | 727.4 | |
| Restructuring and impairment expense | — | | | 15.7 | | | — | | | 15.7 | | | 3.1 | | | 18.8 | |
Other expense (income), net(2) | 4.9 | | | (0.1) | | | — | | | 4.8 | | | (11.7) | | | (6.9) | |
| Earnings | $ | 726.7 | | | $ | 83.4 | | | $ | (0.5) | | | $ | 809.6 | | | $ | (64.1) | | | $ | 745.5 | |
| Interest expense | | | | | | | | | | | (12.0) | |
| Earnings before provision for income taxes | | | | | | | | | | | $ | 733.5 | |
(2)Other expense (income), net consist primarily of interest income that is located within Corporate Expenses.
17. Operations by Segment (continued)
| | | | | | | | | | | | | | | | | | | | | | | | | | | | | | | | | | | |
| December 31, 2022 |
| (dollars in millions) | North America | | Rest of World | | Inter-segment Elimination | | Total Segments | | Less: Corporate Expenses | | Total |
| Sales from external customers | $ | 2,792.4 | | | $ | 961.5 | | | $ | — | | | $ | 3,753.9 | | | $ | — | | | $ | 3,753.9 | |
| Inter-segment sales | 26.7 | | | 4.3 | | | — | | | 31.0 | | | — | | | 31.0 | |
| 2,819.1 | | | 965.8 | | | — | | | 3,784.9 | | | — | | | 3,784.9 | |
| Elimination of Inter-segment sales | (26.7) | | | (4.3) | | | — | | | (31.0) | | | — | | | (31.0) | |
| Net Sales | 2,792.4 | | | 961.5 | | | — | | | 3,753.9 | | | — | | | 3,753.9 | |
| Cost of products sold | 1,813.9 | | | 610.6 | | | — | | | 2,424.5 | | | (0.2) | | | 2,424.3 | |
| Gross Profit | 978.5 | | | 350.9 | | | — | | | 1,329.4 | | | 0.2 | | | 1,329.6 | |
| Inter-segment Profit | 0.3 | | | — | | | (0.3) | | | — | | | — | | | — | |
| Selling, general and administrative expenses | 356.2 | | | 252.0 | | | — | | | 608.2 | | | 62.7 | | | 670.9 | |
Other expense (income), net(3) | 356.6 | | | 2.6 | | | — | | | 359.2 | | | 66.4 | | | 425.6 | |
| Earnings | $ | 266.0 | | | $ | 96.3 | | | $ | (0.3) | | | $ | 362.0 | | | $ | (128.9) | | | $ | 233.1 | |
| Interest expense | | | | | | | | | | | (9.4) | |
| Earnings before provision for income taxes | | | | | | | | | | | $ | 223.7 | |
(3)Other expense (income), net consist primarily of a pre-tax pension settlement expense of $346.8 million in the North America segment and $70.5 million within Corporate expenses.
In 2024, sales to the Company's North America segment’s two largest customers were $586.6 million and $495.8 million which represented 15 percent and 13 percent of the Company’s net sales, respectively. In 2023, sales to the Company's North America segment’s two largest customers were $604.5 million and $509.0 million which represented 16 percent and 13 percent of the Company’s net sales, respectively. In 2022, sales to the Company's North America segment’s two largest customers were $596.4 million and $414.2 million which represented 16 percent and 11 percent of the Company’s net sales, respectively.
Assets, depreciation and capital expenditures by segment
| | | | | | | | | | | | | | | | | | | | | | | | | | | | | | | | | | | | | | | | | | | | | | | | | | | | | |
| Total Assets (December 31) | | Depreciation and Amortization (Years Ended December 31) | | Capital Expenditures (Years Ended December 31) |
| (dollars in millions) | 2024 | | 2023 | | 2022 | | 2024 | | 2023 | | 2022 | | 2024 | | 2023 | | 2022 |
| North America | $ | 2,315.2 | | | $ | 2,297.4 | | | $ | 2,230.3 | | | $ | 60.4 | | | $ | 58.6 | | | $ | 55.7 | | | $ | 100.3 | | | $ | 58.4 | | | $ | 48.6 | |
| Rest of World | 592.1 | | | 475.0 | | | 597.7 | | | 17.0 | | | 18.3 | | | 20.5 | | | 7.6 | | | 11.0 | | | 10.9 | |
| Total Segments | 2,907.3 | | | 2,772.4 | | | 2,828.0 | | | 77.4 | | | 76.9 | | | 76.2 | | | 107.9 | | | 69.4 | | | 59.5 | |
| Corporate | 332.7 | | | 441.5 | | | 504.3 | | | 1.4 | | | 1.4 | | | 0.7 | | | 0.1 | | | 3.2 | | | 10.8 | |
| Total | $ | 3,240.0 | | | $ | 3,213.9 | | | $ | 3,332.3 | | | $ | 78.8 | | | $ | 78.3 | | | $ | 76.9 | | | $ | 108.0 | | | $ | 72.6 | | | $ | 70.3 | |
(1)The majority of corporate assets consist of cash, cash equivalents, marketable securities, and deferred income taxes.
17. Operations by Segment (continued)
Net sales and long-lived assets by geographic location
The following data by geographic area includes net sales based on product shipment destination and long-lived assets based on physical location. Long-lived assets include net property, plant and equipment, operating lease assets and other long-term assets.
| | | | | | | | | | | | | | | | | | | | | | | | | | | | | | | | | | | | | | |
| Long-lived Assets (December 31) | | | Net Sales (Years Ended December 31) |
| (dollars in millions) | 2024 | | 2023 | | 2022 | | | 2024 | | 2023 | | 2022 |
| United States | $ | 441.4 | | | $ | 422.6 | | | $ | 409.8 | | | United States | $ | 2,573.7 | | | $ | 2,547.1 | | | $ | 2,430.0 | |
| China | 193.8 | | | 210.6 | | | 225.2 | | | China | 760.0 | | | 827.4 | | | 826.6 | |
| Canada | 54.0 | | | 58.1 | | | 54.7 | | | Canada | 331.2 | | | 335.3 | | | 341.6 | |
| Other Foreign | 75.1 | | | 52.1 | | | 41.3 | | | Other Foreign | 153.2 | | | 143.0 | | | 155.7 | |
| Total | $ | 764.3 | | | $ | 743.4 | | | $ | 731.0 | | | Total | $ | 3,818.1 | | | $ | 3,852.8 | | | $ | 3,753.9 | |
ITEM 9 – CHANGES IN AND DISAGREEMENTS WITH ACCOUNTANTS ON ACCOUNTING AND FINANCIAL DISCLOSURE
None.
ITEM 9A – CONTROLS AND PROCEDURES
Evaluation of Disclosure Controls and Procedures
Our management, with the participation of our Chief Executive Officer and Chief Financial Officer, has evaluated the effectiveness of our disclosure controls and procedures (as defined in Rule 13a-15(e) under the Securities Exchange Act of 1934, as amended (“the Exchange Act”)) as of the end of the period covered by this report. Based on the evaluation, our Chief Executive Officer and Chief Financial Officer have concluded that, as of the end of such period our disclosure controls and procedures are effective in recording, processing, summarizing, and reporting, on a timely basis, information required to be disclosed by us in the reports that we file or submit under the Exchange Act, and that information is accumulated and communicated to the Chief Executive Officer and Chief Financial Officer, as appropriate, to allow timely discussions regarding required disclosure.
Management Report on Internal Control Over Financial Reporting
Our management is responsible for establishing and maintaining adequate internal control over financial reporting (as defined in Exchange Act Rule 13a-15(f)). The Company’s internal control over financial reporting is designed to provide reasonable assurance regarding the reliability of financial reporting and the preparation of financial statements for external purposes in accordance with generally accepted accounting principles. Our management, with the participation of our Chief Executive Officer and Chief Financial Officer, has evaluated the effectiveness of our internal control over financial reporting based on the Internal Control-Integrated Framework (2013) issued by the Committee of Sponsoring Organizations of the Treadway Commission. Consistent with guidance issued by the Securities and Exchange Commission that an assessment of a recently acquired business may be omitted from management’s report on internal control over financial reporting in the year of acquisition, management excluded an assessment of the effectiveness of the Company’s internal control over financial reporting related to Pureit. The acquisition constituted 3.8 percent and 6.5 percent of total assets and net assets, respectively, as of December 31, 2024 and less than 0.5 percent of net sales and net earnings for the year then ended. Based on this evaluation, our management has concluded that, as of December 31, 2024, our internal control over financial reporting was effective.
Because of its inherent limitations, internal control over financial reporting may not prevent or detect misstatements. Also, projections of any evaluation of effectiveness to future periods are subject to risk that controls may become inadequate because of changes in conditions, or that the degree of compliance with the policies or procedures may deteriorate. Ernst & Young LLP, an independent registered public accounting firm, has audited our consolidated financial statements and the effectiveness of internal controls over financial reporting as of December 31, 2024 as stated in their report which is included herein.
Changes in Internal Control Over Financial Reporting
There have been no changes in the Company’s internal control over financial reporting (as defined in Exchange Act Rule 13a-15(f)) during the year ended December 31, 2024 that have materially affected, or are reasonably likely to materially affect, our internal control over financial reporting.
ITEM 9B – OTHER INFORMATION
During the three months ended December 31, 2024, none of our directors or Section 16 officers adopted or terminated a “Rule 10b5-1trading arrangement” or “non-Rule 10b5-1 trading arrangement,” as each term is defined in Item 408(a) of Regulation S-K.
ITEM 9C – DISCLOSURE REGARDING FOREIGN JURISDICTIONS THAT PREVENT INSPECTIONS
None.
REPORT OF INDEPENDENT REGISTERED PUBLIC ACCOUNTING FIRM
To the Stockholders and the Board of Directors of A. O. Smith Corporation
Opinion on Internal Control Over Financial Reporting
We have audited A. O. Smith Corporation’s internal control over financial reporting as of December 31, 2024, based on criteria established in Internal Control—Integrated Framework issued by the Committee of Sponsoring Organizations of the Treadway Commission (2013 framework) (the COSO criteria). In our opinion, A. O. Smith Corporation (the Company) maintained, in all material respects, effective internal control over financial reporting as of December 31, 2024, based on the COSO criteria.
As indicated in the accompanying Management Report on Internal Control Over Financial Reporting, management’s assessment of and conclusion on the effectiveness of internal control over financial reporting did not include the internal controls of Pureit, which is included in the 2024 consolidated financial statements of the Company and constituted 3.8 percent and 6.5 percent of total assets and net assets, respectively, as of December 31, 2024 and less than 0.5 percent of net sales and net earnings for the year then ended. Our audit of internal control over financial reporting of the Company also did not include an evaluation of the internal control over financial reporting of Pureit.
We also have audited, in accordance with the standards of the Public Company Accounting Oversight Board (United States) (PCAOB), the consolidated balance sheets of the Company as of December 31, 2024 and 2023, the related consolidated statements of earnings, comprehensive earnings, stockholders’ equity and cash flows for each of the three years in the period ended December 31, 2024, and the related notes and financial statement schedule listed in the Index at Item 15(a) and our report dated February 11, 2025 expressed an unqualified opinion thereon.
Basis for Opinion
The Company’s management is responsible for maintaining effective internal control over financial reporting and for its assessment of the effectiveness of internal control over financial reporting included in the accompanying Management Report on Internal Control Over Financial Reporting. Our responsibility is to express an opinion on the Company’s internal control over financial reporting based on our audit. We are a public accounting firm registered with the PCAOB and are required to be independent with respect to the Company in accordance with the U.S. federal securities laws and the applicable rules and regulations of the Securities and Exchange Commission and the PCAOB.
We conducted our audit in accordance with the standards of the PCAOB. Those standards require that we plan and perform the audit to obtain reasonable assurance about whether effective internal control over financial reporting was maintained in all material respects.
Our audit included obtaining an understanding of internal control over financial reporting, assessing the risk that a material weakness exists, testing and evaluating the design and operating effectiveness of internal control based on the assessed risk, and performing such other procedures as we considered necessary in the circumstances. We believe that our audit provides a reasonable basis for our opinion.
Definition and Limitations of Internal Control Over Financial Reporting
A company’s internal control over financial reporting is a process designed to provide reasonable assurance regarding the reliability of financial reporting and the preparation of financial statements for external purposes in accordance with generally accepted accounting principles. A company’s internal control over financial reporting includes those policies and procedures that (1) pertain to the maintenance of records that, in reasonable detail, accurately and fairly reflect the transactions and dispositions of the assets of the company; (2) provide reasonable assurance that transactions are recorded as necessary to permit preparation of financial statements in accordance with generally accepted accounting principles, and that receipts and expenditures of the company are being made only in accordance with authorizations of management and directors of the company; and (3) provide reasonable assurance regarding prevention or timely detection of unauthorized acquisition, use, or disposition of the company’s assets that could have a material effect on the financial statements.
Because of its inherent limitations, internal control over financial reporting may not prevent or detect misstatements. Also, projections of any evaluation of effectiveness to future periods are subject to the risk that controls may become inadequate because of changes in conditions, or that the degree of compliance with the policies or procedures may deteriorate.
/s/ Ernst & Young LLP
Milwaukee, Wisconsin
February 11, 2025
PART III
ITEM 10 – DIRECTORS, EXECUTIVE OFFICERS AND CORPORATE GOVERNANCE
The information included under the headings “Election of Directors” and “Board Committees” in our definitive Proxy Statement for the 2025 Annual Meeting of Stockholders (to be filed with the Securities and Exchange Commission (SEC) under Regulation 14A within 120 days after the end of the registrant’s fiscal year) is incorporated herein by reference. The information required regarding Executive Officers of the Company is included in Part I of this Annual Report on Form 10-K under the caption “Executive Officers of the Company.”
We have a separately designated Audit Committee on which Michael M. Larsen, Todd W. Fister, Christopher L. Mapes, and Lois M. Martin serve, with Mr. Larsen, as Chairperson. All members are independent under applicable SEC and New York Stock Exchange rules; the Board of Directors of the Company has concluded that Mr. Larsen, Mr. Fister and Ms. Martin are “audit committee financial experts” in accordance with SEC rules.
We have adopted a Financial Code of Ethics applicable to our principal executive officer, principal financial officer and principal accounting officer. As a best practice, this code has been executed by key financial and accounting personnel as well. In addition, we have adopted a general code of business conduct for our directors, officers and all employees, which is known as the A. O. Smith Guiding Principles. The Financial Code of Ethics, the A. O. Smith Guiding Principles and other company corporate governance matters are available on our website at www.aosmith.com. We are not including the information contained on our website as a part of or incorporating it by reference into, this Form 10-K. We intend to disclose on this website any amendments to, or waivers from, the Financial Code of Ethics or the A. O. Smith Guiding Principles that are required to be disclosed pursuant to SEC rules. There have been no waivers of the Financial Code of Ethics or the A. O. Smith Guiding Principles. Stockholders may obtain copies of any of these corporate governance documents free of charge by writing to the Corporate Secretary at the address on the cover page of this Form 10-K.
The information included under the heading “Compliance with Section 16(a) of the Securities Exchange Act” in our definitive Proxy Statement for the 2025 Annual Meeting of Stockholders (to be filed with the SEC under Regulation 14A within 120 days after the end of the registrant’s fiscal year) is incorporated herein by reference.
ITEM 11 – EXECUTIVE COMPENSATION
The information included under the headings "Executive Compensation," "Director Compensation," and "Report of the Personnel and Compensation Committee" in the Company's Definitive Proxy Statement for the 2025 Annual Meeting of Stockholders (to be filed with the SEC under Regulation 14A within 120 days after the end of the registrant’s fiscal year) is incorporated herein by reference.
ITEM 12 – SECURITY OWNERSHIP OF CERTAIN BENEFICIAL OWNERS AND MANAGEMENT AND RELATED STOCKHOLDER MATTERS
The information included under the headings “Principal Stockholders” and “Security Ownership of Directors and Management” in our definitive Proxy Statement for the 2025 Annual Meeting of Stockholders (to be filed with the SEC under Regulation 14A within 120 days after the end of the registrant’s fiscal year) is incorporated herein by reference.
Equity Compensation Plan Information
The following table provides information about our equity compensation plans as of December 31, 2024.
| | | | | | | | | | | | | | | | | | | | | | | | | | |
| Plan Category | Number of securities to
be issued upon the
exercise of outstanding
options, warrants and
rights | | | Weighted-average exercise
price of outstanding options,
warrants and rights | | | Number of securities
remaining available for
future issuance under
equity compensation
plans (excluding
securities reflected in
the first column) | |
| Equity compensation plans approved by security holders | 2,114,214 | | (1) | | $ | 55.07 | | (2) | | 2,291,099 | | (3) |
| Equity compensation plans not approved by security holders | — | | | | — | | | | — | | |
| Total | 2,114,214 | | | | 55.07 | | | | 2,291,099 | | |
(1)Consists of 1,395,841 shares subject to stock options, 428,234 shares subject to employee share units, 215,741 shares subject to director share units and 74,398 shares subject to performance stock units.
(2)Represents the weighted average exercise price of outstanding options and does not take into account outstanding share units.
(3)Represents securities remaining available for issuance under the A. O. Smith Combined Incentive Compensation Plan. If any awards lapse, expire, terminate or are canceled without issuance of shares, or shares are forfeited under any award, then such shares will become available for issuance under the A. O. Smith Combined Incentive Compensation Plan, hereby increasing the number of securities remaining available.
ITEM 13 – CERTAIN RELATIONSHIPS, RELATED TRANSACTIONS AND DIRECTOR INDEPENDENCE
The information included under the headings “Director Independence and Financial Literacy”, “Compensation Committee Interlocks and Insider Participation” and “Procedure for Review of Related Party Transactions” in our definitive Proxy Statement for the 2025 Annual Meeting of Stockholders (to be filed with the SEC under Regulation 14A within 120 days after the end of the registrant’s fiscal year) is incorporated herein by reference.
ITEM 14 – PRINCIPAL ACCOUNTANT FEES AND SERVICES
Our principal accountant is Ernst & Young, LLP (PCAOB ID: 42). The information included under the heading “Report of the Audit Committee” in our definitive Proxy Statement for the 2025 Annual Meeting of Stockholders (to be filed with the SEC under Regulation 14A within 120 days after the end of the registrant’s fiscal year) required by this Item 14 is incorporated herein by reference.
PART IV
ITEM 15 – EXHIBITS, FINANCIAL STATEMENT SCHEDULES
(a)The following documents are filed as part of this Annual Report on Form 10-K:
1.Financial Statements of the Company
| | | | | |
| Form 10-K
Page Number |
| The following consolidated financial statements of A. O. Smith Corporation are included in Item 8: | |
| |
| |
| |
| For each of the three years in the period ended December 31, 2024: | |
| |
| |
| |
| |
| |
| |
2.Financial Statement Schedules
Schedules not included have been omitted because they are not applicable.
3.Exhibits - see the Index to Exhibits on pages 65-66 of this report. Each management contract or compensatory plan or arrangement required to be filed as an exhibit to this report on Form 10-K are listed as Exhibits 10(a) through 10(p) in the Index to Exhibits.
Pursuant to the requirements of Rule 14a-3(b)(10) of the Securities Exchange Act of 1934, as amended, we will, upon request and upon payment of a reasonable fee not to exceed the rate at which such copies are available from the SEC, furnish copies to our security holders of any exhibits listed in the Index to Exhibits.
INDEX TO EXHIBITS
| | | | | | | | |
Exhibit
Number | Description |
| | |
| (3)(i) | | |
| | |
| (3)(ii) | | |
| | |
| (4) | (a) | |
| | |
| (b) | |
| | |
| (c) | Amendment No. 1 dated as of December 15, 2016, to the Amended and Restated Credit Agreement, dated as of December 12, 2012, among A. O. Smith Corporation, A. O Smith Enterprises Ltd., A. O. Smith International Holdings B.V., and the financial institutions and agents party thereto, incorporated by reference to Exhibit 4(c) in the annual report on Form 10-K for the fiscal year ended December 31, 2016. |
| | |
| (d) | Amendment No. 2 dated as of April 1, 2021, to the Amended and Restated Credit Agreement, dated as of December 12, 2012, among A. O. Smith Corporation, A. O Smith Enterprises Ltd., A. O. Smith International Holdings B.V., and the financial institutions and agents party thereto, incorporated by reference to Exhibit 10.1 in the quarterly report on Form 10-Q for the quarter ended March 31, 2021. |
| | |
| (e) | Amendment No. 3 dated as of May 1, 2023, to the Amended and Restated Credit Agreement, dated as of December 12, 2012, among A. O. Smith Corporation, A. O Smith Enterprises Ltd., A. O. Smith International Holdings B.V., and the financial institutions and agents party thereto, incorporated by reference to Exhibit 10.1 in the quarterly report on Form 10-Q for the quarter ended September 30, 2023. |
| | |
| (f) | |
| | |
| (g) | The corporation has instruments that define the rights of holders of long-term debt that are not being filed with this Registration Statement in reliance upon Item 601(b)(4)(iii) of Regulation S-K. The Registrant agrees to furnish to the SEC, upon request, copies of these instruments. |
| | |
| (10) | Material Contracts |
| | |
| (a) | |
| | |
| (b) | |
| | |
| (c) | |
| | |
| (d) | |
| | |
| (e) | |
| | |
| (f) | |
| | |
| | | | | | | | |
Exhibit
Number | Description |
| (g) | |
| | |
| (h) | |
| | |
| (i) | |
| | |
| (j) | |
| | |
| (k) | |
| | |
| (l) | |
| | |
| (m) | |
| | |
| (n) | |
| | |
| (o) | |
| | |
| (p) | |
| | |
| (19) | | |
| | |
| (21) | | |
| | |
| (23) | | |
| | |
| (31.1) | | |
| | |
| (31.2) | | |
| | |
| (32.1) | | |
| | |
| (32.2) | | |
| | |
| (101) | | The following materials from A. O. Smith Corporation’s Annual Report on Form 10-K for the fiscal year ended December 31, 2024 are filed herewith, formatted in XBRL (Extensive Business Reporting Language): (i) the Consolidated Balance Sheets as of December 31, 2024 and 2023, (ii) the Consolidated Statement of Earnings for the three years ended December 31, 2024, (iii) the Consolidated Statement of Comprehensive Earnings for the three years ended December 31, 2024, (iv) the Consolidated Statement of Cash Flows for the three years ended December 31, 2024, (v) the Consolidated Statement of Stockholders’ Equity for the three years ended December 31, 2024 and (vi) the Notes to Consolidated Financial Statements. |
SIGNATURES
Pursuant to the requirements of Section 13 or 15(d) of the Securities Exchange Act of 1934, the registrant has duly caused this report to be signed on behalf of the undersigned, thereunto duly authorized.
| | | | | | | | | | | |
| A. O. SMITH CORPORATION |
| | | |
| Date: February 11, 2025 | By: | | /s/ Kevin J. Wheeler |
| | | Kevin J. Wheeler
Chairman and Chief Executive Officer |
Pursuant to the requirements of the Securities Exchange Act of 1934, this report has been signed below as of February 11, 2025 by the following persons on behalf of the registrant and in the capacities and on the dates indicated.
| | | | | | | | |
| Name and Title | | Signature |
| | |
| | |
| KEVIN J. WHEELER | | /s/ Kevin J. Wheeler |
| Director | | Kevin J. Wheeler |
| Chairman and Chief Executive Officer | | |
| | |
| CHARLES T. LAUBER | | /s/ Charles T. Lauber |
| Executive Vice President and Chief Financial Officer | | Charles T. Lauber |
| | |
| BENJAMIN A. OTCHERE | | /s/ Benjamin A. Otchere |
| Vice President and Controller | | Benjamin A. Otchere |
| | |
| RONALD D. BROWN | | /s/ Ronald D. Brown |
| Director | | Ronald D. Brown |
| | |
| TODD W. FISTER | | /s/ Todd W. Fister |
| Director | | Todd W. Fister |
| | |
| VICTORIA M. HOLT | | /s/ Victoria M. Holt |
| Director | | Victoria M. Holt |
| | |
| DR. ILHAM KADRI | | /s/ Dr. Ilham Kadri |
| Director | | Dr. Ilham Kadri |
| | |
| MICHAEL M. LARSEN | | /s/ Michael M. Larsen |
| Director | | Michael M. Larsen |
| | |
| CHRISTOPHER L. MAPES | | /s/ Christopher L. Mapes |
| Director | | Christopher L. Mapes |
| | |
| LOIS M. MARTIN | | /s/ Lois M. Martin |
| Director | | Lois M. Martin |
| | |
| AJITA G. RAJENDRA | | /s/ Ajita G. Rajendra |
| Director | | Ajita G. Rajendra |
| | |
| MARK D. SMITH | | /s/ Mark D. Smith |
| Director | | Mark D. Smith |
A. O. SMITH CORPORATION
SCHEDULE II - VALUATION AND QUALIFYING ACCOUNTS
(Dollars in millions)
Years ended December 31, 2024, 2023 and 2022
| | | | | | | | | | | | | | | | | | | | | | | | | | | | | |
| Description | Balance at
Beginning
of Year | | Charged to
Costs and
Expenses | | Acquisition
of
Businesses | | Deductions | | Balance at
End of
Year |
| 2024: | | | | | | | | | |
| Valuation allowance for trade and notes receivable | $ | 10.1 | | | $ | 3.1 | | | $ | — | | | $ | (0.3) | | | $ | 12.9 | |
| Valuation allowance for deferred tax assets | 11.7 | | | — | | | — | | | (5.6) | | | 6.1 | |
| 2023: | | | | | | | | | |
| Valuation allowance for trade and notes receivable | $ | 9.5 | | | $ | 1.1 | | | $ | — | | | $ | (0.5) | | | $ | 10.1 | |
| Valuation allowance for deferred tax assets | 8.3 | | | 3.4 | | | — | | | — | | | 11.7 | |
| 2022: | | | | | | | | | |
| Valuation allowance for trade and notes receivable | $ | 9.5 | | | $ | 0.6 | | | $ | — | | | $ | (0.6) | | | $ | 9.5 | |
| Valuation allowance for deferred tax assets | 7.1 | | | 1.2 | | | — | | | — | | | 8.3 | |