UNITED STATES
SECURITIES AND EXCHANGE COMMISSION
WASHINGTON, D.C. 20549
_________________________
FORM 6-K
_________________________
Report of Foreign Private Issuer
Pursuant to Rule 13a-16 or 15d-16 under
the Securities Exchange Act of 1934
For the quarterly period ended June 30, 2021
Commission file number 1-12874
_________________________
TEEKAY CORPORATION
(Exact name of Registrant as specified in its charter)
_________________________
4th Floor, Belvedere Building,
69 Pitts Bay Road,
Hamilton, HM 08, Bermuda
(Address of principal executive office)
_________________________
| Indicate by check mark whether the registrant files or will file annual reports under cover Form 20-F or Form 40-F. | ||
Form 20-F ý Form 40-F ¨ | ||
| Indicate by check mark if the registrant is submitting the Form 6-K in paper as permitted by Regulation S-T Rule 101(b)(1). | ||
Yes ¨ No ý | ||
| Indicate by check mark if the registrant is submitting the Form 6-K in paper as permitted by Regulation S-T Rule 101(b)(7). | ||
Yes ¨ No ý | ||
Page 1
TEEKAY CORPORATION AND SUBSIDIARIES
REPORT ON FORM 6-K FOR THE QUARTERLY PERIOD ENDED JUNE 30, 2021
INDEX
| PAGE | |||||
Page 2
ITEM 1 – FINANCIAL STATEMENTS
TEEKAY CORPORATION AND SUBSIDIARIES
UNAUDITED CONSOLIDATED STATEMENTS OF (LOSS) INCOME
(in thousands of U.S. Dollars, except share and per share amounts)
| Three Months Ended June 30, | Six Months Ended June 30, | ||||||||||||||||||||||
| 2021 | 2020 | 2021 | 2020 | ||||||||||||||||||||
| $ | $ | $ | $ | ||||||||||||||||||||
Revenues (note 3) | 325,480 | 482,805 | 684,561 | 1,056,859 | |||||||||||||||||||
| Voyage expenses | (78,128) | (66,896) | (154,353) | (188,460) | |||||||||||||||||||
| Vessel operating expenses | (130,567) | (147,796) | (259,004) | (301,089) | |||||||||||||||||||
Time-charter hire expenses (note 5) | (8,005) | (17,714) | (19,126) | (44,770) | |||||||||||||||||||
| Depreciation and amortization | (59,244) | (62,936) | (117,830) | (135,853) | |||||||||||||||||||
| General and administrative expenses | (22,920) | (23,668) | (45,287) | (41,945) | |||||||||||||||||||
(Write-down) and gain (loss) on sale (note 13) | (86,686) | (10,669) | (87,401) | (105,275) | |||||||||||||||||||
Asset retirement obligation extinguishment gain (note 7) | 32,950 | 0 | 32,950 | 0 | |||||||||||||||||||
Gain on commencement of sales-type lease (note 3) | 0 | 0 | 0 | 44,943 | |||||||||||||||||||
Restructuring charges (note 15) | 0 | (4,622) | (303) | (7,010) | |||||||||||||||||||
| (Loss) income from vessel operations | (27,120) | 148,504 | 34,207 | 277,400 | |||||||||||||||||||
| Interest expense | (48,694) | (59,245) | (97,633) | (121,765) | |||||||||||||||||||
| Interest income | 1,336 | 2,314 | 3,381 | 5,117 | |||||||||||||||||||
Realized and unrealized (losses) gains on non-designated derivative instruments (note 10) | (3,389) | (9,270) | 3,932 | (30,933) | |||||||||||||||||||
Equity income (note 14 and 6b) | 28,111 | 35,343 | 65,268 | 37,656 | |||||||||||||||||||
Foreign exchange (loss) gain (notes 9 and 10) | (3,413) | (8,922) | 2,310 | (2,276) | |||||||||||||||||||
Other loss (note 7) | (4,639) | (399) | (9,154) | (1,080) | |||||||||||||||||||
| (Loss) income before income taxes | (57,808) | 108,325 | 2,311 | 164,119 | |||||||||||||||||||
Income tax recovery (note 12) | 204 | 17,175 | 1,589 | 13,383 | |||||||||||||||||||
| Net (loss) income | (57,604) | 125,500 | 3,900 | 177,502 | |||||||||||||||||||
| Net loss (income) attributable to non-controlling interests | 55,760 | (103,777) | 24,207 | (205,584) | |||||||||||||||||||
Net (loss) income attributable to the shareholders of Teekay Corporation | (1,844) | 21,723 | 28,107 | (28,082) | |||||||||||||||||||
Per common share of Teekay Corporation (note 18) | |||||||||||||||||||||||
| • Basic (loss) income attributable to shareholders of Teekay Corporation | (0.02) | 0.21 | 0.28 | (0.28) | |||||||||||||||||||
| • Diluted (loss) income attributable to shareholders of Teekay Corporation | (0.02) | 0.21 | 0.28 | (0.28) | |||||||||||||||||||
Weighted average number of common shares outstanding (note 18) | |||||||||||||||||||||||
| • Basic | 101,330,151 | 101,107,362 | 101,248,493 | 100,997,456 | |||||||||||||||||||
| • Diluted | 101,330,151 | 101,196,383 | 111,561,672 | 100,997,456 | |||||||||||||||||||
The accompanying notes are an integral part of the unaudited consolidated financial statements.
Page 3
TEEKAY CORPORATION AND SUBSIDIARIES
UNAUDITED CONSOLIDATED STATEMENTS OF COMPREHENSIVE (LOSS) INCOME
(in thousands of U.S. Dollars)
| Three Months Ended June 30, | Six Months Ended June 30, | ||||||||||||||||||||||
| 2021 | 2020 | 2021 | 2020 | ||||||||||||||||||||
| $ | $ | $ | $ | ||||||||||||||||||||
| Net (loss) income | (57,604) | 125,500 | 3,900 | 177,502 | |||||||||||||||||||
| Other comprehensive (loss) income: | |||||||||||||||||||||||
| Other comprehensive income (loss) before reclassifications | |||||||||||||||||||||||
| Unrealized (loss) gain on qualifying cash flow hedging instruments | (16,948) | (11,082) | 21,058 | (68,634) | |||||||||||||||||||
| Pension adjustments, net of taxes | (133) | (19) | (270) | (34) | |||||||||||||||||||
| Amounts reclassified from accumulated other comprehensive (loss) income relating to: | |||||||||||||||||||||||
| Realized loss on qualifying cash flow hedging instruments | |||||||||||||||||||||||
To interest expense (note 10) | 825 | 482 | 1,640 | 634 | |||||||||||||||||||
| To equity income | 5,096 | 2,427 | 10,078 | 5,931 | |||||||||||||||||||
| Other comprehensive (loss) income | (11,160) | (8,192) | 32,506 | (62,103) | |||||||||||||||||||
| Comprehensive (loss) income | (68,764) | 117,308 | 36,406 | 115,399 | |||||||||||||||||||
| Comprehensive loss (income) attributable to non-controlling interests | 62,169 | (98,543) | 4,810 | (164,063) | |||||||||||||||||||
| Comprehensive (loss) income attributable to shareholders of Teekay Corporation | (6,595) | 18,765 | 41,216 | (48,664) | |||||||||||||||||||
The accompanying notes are an integral part of the unaudited consolidated financial statements.
Page 4
TEEKAY CORPORATION AND SUBSIDIARIES
UNAUDITED CONSOLIDATED BALANCE SHEETS
(in thousands of U.S. Dollars, except share amounts)
| As at June 30, 2021 | As at December 31, 2020 | ||||||||||
| $ | $ | ||||||||||
| ASSETS | |||||||||||
| Current | |||||||||||
Cash and cash equivalents (notes 9 and 19) | 258,351 | 348,785 | |||||||||
Restricted cash – current (note 19) | 11,380 | 11,144 | |||||||||
| Accounts receivable, including non-trade of $7,964 (2020 – $7,931) | 121,014 | 150,997 | |||||||||
| Accrued revenue | 23,740 | 50,952 | |||||||||
| Prepaid expenses | 81,317 | 63,521 | |||||||||
Current portion of net investments in direct financing and sales-type leases, net (notes 3 and 6b) | 14,650 | 14,826 | |||||||||
Assets held for sale (note 13) | 11,925 | 32,974 | |||||||||
| Other current assets | 27,160 | 16,772 | |||||||||
| Total current assets | 549,537 | 689,971 | |||||||||
Restricted cash – non-current (note 19) | 40,521 | 45,961 | |||||||||
Vessels and equipment (note 9) | |||||||||||
At cost, less accumulated depreciation of $1,062,951 (2020 – $1,161,658) (note 13) | 2,254,208 | 2,325,097 | |||||||||
Vessels related to finance leases, at cost, less accumulated amortization of $270,665 (2020 – $281,786) (note 5) | 2,012,772 | 2,105,372 | |||||||||
Operating lease right-of-use assets (note 5) | 14,435 | 52,961 | |||||||||
| Total vessels and equipment | 4,281,415 | 4,483,430 | |||||||||
Net investment in direct financing and sales-type leases, net – non-current (notes 3 and 6b) | 501,485 | 513,815 | |||||||||
Investment in and loans, net to equity-accounted investments (notes 6b, 11a and 14) | 1,133,444 | 1,075,653 | |||||||||
| Goodwill, intangibles and other non-current assets | 130,199 | 137,082 | |||||||||
| Total assets | 6,636,601 | 6,945,912 | |||||||||
| LIABILITIES AND EQUITY | |||||||||||
| Current | |||||||||||
| Accounts payable | 103,987 | 124,066 | |||||||||
Accrued liabilities and other (note 7) | 210,003 | 332,086 | |||||||||
Short-term debt (note 8) | 10,000 | 10,000 | |||||||||
Current portion of long-term debt (note 9) | 374,960 | 261,366 | |||||||||
Current obligations related to finance leases (note 5) | 212,890 | 150,408 | |||||||||
Current portion of operating lease liabilities (note 5) | 14,724 | 25,108 | |||||||||
| Total current liabilities | 926,564 | 903,034 | |||||||||
Long-term debt (note 9) | 1,693,759 | 1,793,741 | |||||||||
Long-term obligations related to finance leases (note 5) | 1,384,922 | 1,550,557 | |||||||||
Long-term operating lease liabilities (note 5) | 105 | 29,182 | |||||||||
Other long-term liabilities (note 7) | 168,877 | 198,107 | |||||||||
| Total liabilities | 4,174,227 | 4,474,621 | |||||||||
Commitments and contingencies (notes 5, 8, 9, 10 and 11) | |||||||||||
| Equity | |||||||||||
Common stock and additional paid-in capital ($0.001 par value; 725,000,000 shares authorized; 101,429,683 shares outstanding and issued (2020 – 101,108,886) (note 17) | 1,052,900 | 1,057,319 | |||||||||
| Accumulated deficit | (498,797) | (527,028) | |||||||||
| Non-controlling interest | 1,944,035 | 1,989,883 | |||||||||
Accumulated other comprehensive loss (note 16) | (35,764) | (48,883) | |||||||||
| Total equity | 2,462,374 | 2,471,291 | |||||||||
| Total liabilities and equity | 6,636,601 | 6,945,912 | |||||||||
The accompanying notes are an integral part of the unaudited consolidated financial statements.
Page 5
TEEKAY CORPORATION AND SUBSIDIARIES
UNAUDITED CONSOLIDATED STATEMENTS OF CASH FLOWS
(in thousands of U.S. Dollars)
| Six Months Ended June 30, | |||||||||||
| 2021 | 2020 | ||||||||||
| $ | $ | ||||||||||
| Cash, cash equivalents and restricted cash provided by (used for) | |||||||||||
| OPERATING ACTIVITIES | |||||||||||
| Net income | 3,900 | 177,502 | |||||||||
| Non-cash and non-operating items: | |||||||||||
| Depreciation and amortization | 117,830 | 135,853 | |||||||||
Unrealized (gain) loss on derivative instruments (note 10) | (34,145) | 27,544 | |||||||||
Write-down and (gain) loss on sale (note 13) | 87,401 | 105,275 | |||||||||
Asset retirement obligation extinguishment gain (note 7) | (32,950) | 0 | |||||||||
Gain on commencement of sales-type lease (note 3) | 0 | (44,943) | |||||||||
| Equity income, net of dividends received $28,589 (2020 - $14,852) | (36,679) | (22,804) | |||||||||
| Foreign currency exchange loss (gain) and other | 13,967 | (7,250) | |||||||||
| Change in operating assets and liabilities: | |||||||||||
| Receipts from direct financing and sales-type leases | 7,285 | 334,146 | |||||||||
| Change in other operating assets and liabilities | (85,312) | 75,978 | |||||||||
| Asset retirement obligation expenditures | (1,419) | 0 | |||||||||
| Expenditures for dry docking | (21,014) | (5,608) | |||||||||
| Net operating cash flow | 18,864 | 775,693 | |||||||||
| FINANCING ACTIVITIES | |||||||||||
| Proceeds from issuance of long-term debt, net of issuance costs | 315,230 | 931,871 | |||||||||
| Prepayments of long-term debt | (151,543) | (1,302,389) | |||||||||
| Scheduled repayments of long-term debt | (156,142) | (240,355) | |||||||||
| Proceeds from short-term debt | 25,000 | 205,000 | |||||||||
| Prepayment of short-term debt | (25,000) | (245,000) | |||||||||
| Prepayment of obligations related to finance leases | (56,724) | 0 | |||||||||
| Repayments of obligations related to finance leases | (46,429) | (47,162) | |||||||||
| Repurchase of Teekay LNG common units | 0 | (15,635) | |||||||||
| Distributions paid from subsidiaries to non-controlling interests | (42,933) | (35,519) | |||||||||
| Other financing activities | (388) | (794) | |||||||||
| Net financing cash flow | (138,929) | (749,983) | |||||||||
| INVESTING ACTIVITIES | |||||||||||
| Expenditures for vessels and equipment | (20,090) | (12,824) | |||||||||
Proceeds from sale of vessels and equipment (note 13) | 32,687 | 60,915 | |||||||||
Proceeds from the sale of assets, net of cash sold (note 13) | 0 | 12,221 | |||||||||
| Proceeds from repayments of advances to equity-accounted joint ventures | 11,830 | 3,500 | |||||||||
| Other investing activities | 0 | (6,430) | |||||||||
| Net investing cash flow | 24,427 | 57,382 | |||||||||
| (Decrease) increase in cash, cash equivalents, restricted cash and cash held for sale | (95,638) | 83,092 | |||||||||
| Cash, cash equivalents, restricted cash and cash held for sale, beginning of the period | 405,890 | 456,325 | |||||||||
| Cash, cash equivalents and restricted cash, end of the period | 310,252 | 539,417 | |||||||||
Supplemental cash flow information (note 19) | |||||||||||
The accompanying notes are an integral part of the unaudited consolidated financial statements.
Page 6
TEEKAY CORPORATION AND SUBSIDIARIES
UNAUDITED CONSOLIDATED STATEMENTS OF CHANGES IN TOTAL EQUITY
(in thousands of U.S. Dollars, except share amounts)
| TOTAL EQUITY | |||||||||||||||||||||||||||||||||||
Thousands of Shares of Common Stock Outstanding # | Common Stock and Additional Paid-in Capital $ | Accumulated Deficit $ | Accumulated Other Compre- hensive Loss $ | Non- controlling Interests $ | Total $ | ||||||||||||||||||||||||||||||
| Balance as at December 31, 2020 | 101,109 | 1,057,319 | (527,028) | (48,883) | 1,989,883 | 2,471,291 | |||||||||||||||||||||||||||||
| Net income | — | — | 29,951 | — | 31,553 | 61,504 | |||||||||||||||||||||||||||||
| Other comprehensive income | — | — | — | 17,860 | 25,806 | 43,666 | |||||||||||||||||||||||||||||
| Dividends declared: | |||||||||||||||||||||||||||||||||||
| Other dividends | — | — | — | — | (19,174) | (19,174) | |||||||||||||||||||||||||||||
| Employee stock compensation and other | 177 | 939 | — | — | — | 939 | |||||||||||||||||||||||||||||
Change in accounting policy (note 2) | — | (6,334) | — | — | — | (6,334) | |||||||||||||||||||||||||||||
| Changes to non-controlling interest from equity contributions and other | — | — | (20) | 4 | 693 | 677 | |||||||||||||||||||||||||||||
| Balance as at March 31, 2021 | 101,286 | 1,051,924 | (497,097) | (31,019) | 2,028,761 | 2,552,569 | |||||||||||||||||||||||||||||
| Net loss | — | — | (1,844) | — | (55,760) | (57,604) | |||||||||||||||||||||||||||||
| Other comprehensive loss | — | — | — | (4,751) | (6,409) | (11,160) | |||||||||||||||||||||||||||||
| Dividends declared: | — | ||||||||||||||||||||||||||||||||||
| Other dividends | — | — | — | — | (23,759) | (23,759) | |||||||||||||||||||||||||||||
| Employee stock compensation and other | 144 | 976 | — | — | — | 976 | |||||||||||||||||||||||||||||
| Changes to non-controlling interest from equity contributions and other | — | — | 144 | 6 | 1,202 | 1,352 | |||||||||||||||||||||||||||||
| Balance as at June 30, 2021 | 101,430 | 1,052,900 | (498,797) | (35,764) | 1,944,035 | 2,462,374 | |||||||||||||||||||||||||||||
Page 7
TEEKAY CORPORATION AND SUBSIDIARIES
UNAUDITED CONSOLIDATED STATEMENTS OF CHANGES IN TOTAL EQUITY
(in thousands of U.S. Dollars, except share amounts)
| TOTAL EQUITY | |||||||||||||||||||||||||||||||||||||||||
| Thousands of Shares of Common Stock Outstanding # | Common Stock and Additional Paid-in Capital $ | Accumulated Deficit $ | Accumulated Other Compre- hensive Loss $ | Non- controlling Interests $ | Total $ | ||||||||||||||||||||||||||||||||||||
| Balance as at December 31, 2019 | 100,784 | 1,052,284 | (546,684) | (23,737) | 2,089,730 | 2,571,593 | |||||||||||||||||||||||||||||||||||
| Net (loss) income | — | — | (49,805) | — | 101,807 | 52,002 | |||||||||||||||||||||||||||||||||||
| Other comprehensive loss | — | — | — | (17,624) | (36,287) | (53,911) | |||||||||||||||||||||||||||||||||||
| Dividends declared: | |||||||||||||||||||||||||||||||||||||||||
| Other dividends | — | — | — | — | (16,353) | (16,353) | |||||||||||||||||||||||||||||||||||
| Employee stock compensation and other | 324 | 1,238 | — | — | — | 1,238 | |||||||||||||||||||||||||||||||||||
Change in accounting policy (note 2) | — | — | (17,216) | — | (36,084) | (53,300) | |||||||||||||||||||||||||||||||||||
| Changes to non-controlling interest from equity contributions and other | — | — | 2,912 | (321) | (17,196) | (14,605) | |||||||||||||||||||||||||||||||||||
| Balance as at March 31, 2020 | 101,108 | 1,053,522 | (610,793) | (41,682) | 2,085,617 | 2,486,664 | |||||||||||||||||||||||||||||||||||
| Net income | — | — | 21,723 | — | 103,777 | 125,500 | |||||||||||||||||||||||||||||||||||
| Other comprehensive loss | — | — | — | (2,958) | (5,234) | (8,192) | |||||||||||||||||||||||||||||||||||
| Dividends declared: | |||||||||||||||||||||||||||||||||||||||||
| Other dividends | — | — | — | — | (19,166) | (19,166) | |||||||||||||||||||||||||||||||||||
| Employee stock compensation and other | (1) | 1,368 | — | — | — | 1,368 | |||||||||||||||||||||||||||||||||||
| Changes to non-controlling interest from equity contributions and other | — | — | 116,818 | (9,030) | (106,721) | 1,067 | |||||||||||||||||||||||||||||||||||
| Balance as at June 30, 2020 | 101,107 | 1,054,890 | (472,252) | (53,670) | 2,058,273 | 2,587,241 | |||||||||||||||||||||||||||||||||||
The accompanying notes are an integral part of the unaudited consolidated financial statements.
Page 8
TEEKAY CORPORATION AND SUBSIDIARIES
NOTES TO THE UNAUDITED CONSOLIDATED FINANCIAL STATEMENTS
(all tabular amounts stated in thousands of U.S. Dollars, other than share and per share data)
1.Basis of Presentation
The unaudited interim consolidated financial statements have been prepared in accordance with United States generally accepted accounting principles (or GAAP). They include the accounts of Teekay Corporation (or Teekay), which is incorporated under the laws of the Republic of the Marshall Islands, its wholly-owned or controlled subsidiaries and any variable interest entities (or VIEs) of which Teekay is the primary beneficiary (collectively, the Company).
Certain information and footnote disclosures required by GAAP for complete annual financial statements have been omitted from these unaudited interim consolidated financial statements and, therefore, these financial statements should be read in conjunction with the Company’s audited consolidated financial statements for the year ended December 31, 2020, included in the Company’s Annual Report on Form 20-F, filed with the U.S. Securities and Exchange Commission (or SEC) on April 1, 2020. In the opinion of management, these unaudited interim consolidated financial statements reflect all adjustments, consisting of a normal recurring nature, necessary to present fairly, in all material respects, the Company’s consolidated financial position, results of operations, cash flows and changes in total equity for the interim periods presented. The results of operations for the three and six months ended June 30, 2021, are not necessarily indicative of those for a full fiscal year. Significant intercompany balances and transactions have been eliminated upon consolidation.
The preparation of financial statements in conformity with GAAP requires management to make estimates and assumptions that affect the amounts reported in the unaudited financial statements and accompanying notes. Actual results could differ from those estimates. It is possible that the amounts recorded as derivative assets and liabilities could vary by material amounts prior to their settlement.
In March 2020, the World Health Organization declared the outbreak of a novel coronavirus (or COVID-19) as a pandemic. Given the dynamic nature of these circumstances, the full extent to which the COVID-19 global pandemic may have direct or indirect impact on the Company's business and the related financial reporting implications cannot be reasonably estimated at this time, although it could materially affect the Company's business, results of operations and financial condition in the future. COVID-19 has resulted and may continue to result in a significant decline in global demand for oil. As the Company's business includes the transportation of crude oil and refined petroleum products on behalf of customers, any significant decrease in demand for the cargo the Company transports could adversely affect demand for the Company's vessels and services. Spot tanker rates have come under pressure since mid-May 2020 as a result of record OPEC+ oil production cuts and lower production from other oil producing countries, which reduced crude exports, and the unwinding of floating storage and the delivery of newbuilding vessels to the world tanker fleet. COVID-19 has also been a contributing factor to the decline in short-term tanker charter rates and the increase in certain crewing-related costs, which has had an impact on the Company's cash flows. COVID-19 was a contributing factor to the write-down of certain tankers of Teekay Tankers during the three and six months ended June 30, 2021, and was also a contributing factor to the write-down of 6 of Teekay LNG's multi-gas vessels and 1 floating production storage and offloading (or FPSO) unit of Teekay Parent during the six months ended June 30, 2020 (see Note 13) .
2. Recent Accounting Pronouncements
In December 2019, the FASB issued Accounting Standards Update (or ASU) 2019-12 - Income Taxes (Topic 740) Simplifying the Accounting for Income Taxes (or ASU 2019-12), as part of its initiative to reduce complexity in the accounting standards. The amendments in ASU 2019-12 eliminate certain exceptions related to the approach for intraperiod tax allocation, the methodology for calculating income taxes in an interim period and the recognition of deferred tax liabilities for outside basis differences, among other changes. The guidance becomes effective for annual reporting periods beginning after December 15, 2020 and interim periods within those fiscal years with early adoption permitted, including adoption in any interim period. The adoption did not have an impact on the Company's consolidated financial statements and related disclosures.
In March 2020, the FASB issued ASU 2020-04 - Reference Rate Reform (Topic 848) Facilitation of the Effects of Reference Rate Reform on Financial Reporting. This update provides optional guidance for a limited period of time to ease potential accounting impacts associated with transitioning away from reference rates that are expected to be discontinued, such as the London Interbank Offered Rate (or LIBOR). This update applies only to contracts, hedging relationships and other transactions that reference LIBOR or another reference rate expected to be discontinued. This update is effective through December 31, 2022. The Company is currently evaluating the effect of adopting this new guidance.
In August 2020, the FASB issued ASU 2020-06 - Debt - Debt with Conversion and Other Options (Subtopic 470-20) and Derivatives and Hedging - Contracts in Entity’s Own Equity (Subtopic 815-40). This update simplified the accounting for convertible debt instruments and convertible preferred stock by reducing the number of accounting models and the number of embedded conversion features that could be recognized separately from the primary contract. This update also enhanced transparency and improved disclosures for convertible instruments and earnings per share guidance. This update is mandatory beginning January 1, 2022; however, the Company early adopted this update effective January 1, 2021 using the modified retrospective method of transition. The adoption of ASU 2020-06 has impacted the accounting for the Company’s Convertible Senior Notes due January 15, 2023 (or the Convertible Notes) whereby the existing debt and equity components have been recombined into a single component accounted for as a single liability, at its amortized cost. On adoption, the Company increased the carrying value of long-term debt by $6.3 million and decreased common stock and additional paid-in capital by $6.3 million. Adoption of ASU 2020-06 also decreased the Company's interest expense by $0.7 million and $1.5 million for the three and six months ended June 30, 2021. In addition, the adoption of ASU 2020-06 resulted in the Company having to change from the use of the
Page 9
TEEKAY CORPORATION AND SUBSIDIARIES
NOTES TO THE UNAUDITED CONSOLIDATED FINANCIAL STATEMENTS
(all tabular amounts stated in thousands of U.S. Dollars, other than share and per share data)
treasury stock method to the if-converted method to determine the dilutive impact of the Convertible Notes when calculating diluted earnings per share attributable to shareholders of Teekay Corporation. For the three and six months ended June 30, 2021, the change to the if-converted method increased the Company's diluted income attributable to shareholders of Teekay Corporation by $1.6 million and $3.2 million, respectively, increased the denominator of the diluted earnings per share calculation by 9,588,378 shares for both periods, and increased the diluted earnings per share attributable to shareholders of Teekay Corporation by $0.01 and $0.02, respectively (see Note 18).
3. Revenues
The Company’s primary source of revenue is chartering its vessels and offshore units to its customers. The Company utilizes four primary forms of contracts, consisting of time-charter contracts, voyage charter contracts, bareboat charter contracts and contracts for FPSO units. The Company also generates revenue from the management and operation of vessels owned by third parties and by equity-accounted investments as well as by providing corporate management services to such third-party entities. For a description of these contracts, see "Item 18 – Financial Statements: Note 2" in the Company’s Annual Report on Form 20-F for the year ended December 31, 2020.
Revenue Table
The following tables contain the Company’s revenue for the three and six months ended June 30, 2021 and 2020, by contract type, by segment and by business lines within segments.
| Three Months Ended June 30, 2021 | |||||||||||||||||||||||
Teekay LNG Liquefied Gas Carriers | Teekay Tankers Conventional Tankers | Teekay Parent Offshore Production | Teekay Parent Other | Total | |||||||||||||||||||
| $ | $ | $ | $ | $ | |||||||||||||||||||
| Time charters | 135,595 | 7,065 | 0 | 0 | 142,660 | ||||||||||||||||||
| Voyage charters | 10,318 | 113,998 | 0 | 0 | 124,316 | ||||||||||||||||||
| FPSO contracts | 0 | 0 | 12,290 | 0 | 12,290 | ||||||||||||||||||
| Management fees and other | 2,856 | 2,357 | 0 | 41,001 | 46,214 | ||||||||||||||||||
| 148,769 | 123,420 | 12,290 | 41,001 | 325,480 | |||||||||||||||||||
| Three Months Ended June 30, 2020 | |||||||||||||||||||||||
Teekay LNG Liquefied Gas Carriers | Teekay Tankers Conventional Tankers | Teekay Parent Offshore Production | Teekay Parent Other | Total | |||||||||||||||||||
| $ | $ | $ | $ | $ | |||||||||||||||||||
| Time charters | 135,761 | 34,986 | 0 | 4,096 | 174,843 | ||||||||||||||||||
| Voyage charters | 10,383 | 207,926 | 0 | 0 | 218,309 | ||||||||||||||||||
| FPSO contracts | 0 | 0 | 28,787 | 0 | 28,787 | ||||||||||||||||||
| Management fees and other | 2,061 | 3,580 | 0 | 55,225 | 60,866 | ||||||||||||||||||
| 148,205 | 246,492 | 28,787 | 59,321 | 482,805 | |||||||||||||||||||
| Six Months Ended June 30, 2021 | |||||||||||||||||||||||
Teekay LNG Liquefied Gas Carriers | Teekay Tankers Conventional Tankers | Teekay Parent Offshore Production | Teekay Parent Other | Total | |||||||||||||||||||
| $ | $ | $ | $ | $ | |||||||||||||||||||
| Time charters | 277,232 | 35,350 | 0 | 2,255 | 314,837 | ||||||||||||||||||
| Voyage charters | 19,585 | 226,199 | 0 | 0 | 245,784 | ||||||||||||||||||
| FPSO contracts | 0 | 0 | 23,107 | 0 | 23,107 | ||||||||||||||||||
| Management fees and other | 4,754 | 4,620 | 0 | 91,459 | 100,833 | ||||||||||||||||||
| 301,571 | 266,169 | 23,107 | 93,714 | 684,561 | |||||||||||||||||||
Page 10
TEEKAY CORPORATION AND SUBSIDIARIES
NOTES TO THE UNAUDITED CONSOLIDATED FINANCIAL STATEMENTS
(all tabular amounts stated in thousands of U.S. Dollars, other than share and per share data)
| Six Months Ended June 30, 2020 | |||||||||||||||||||||||
Teekay LNG Liquefied Gas Carriers | Teekay Tankers Conventional Tankers | Teekay Parent Offshore Production | Teekay Parent Other | Total | |||||||||||||||||||
| $ | $ | $ | $ | $ | |||||||||||||||||||
| Time charters | 266,306 | 50,553 | 0 | 9,053 | 325,912 | ||||||||||||||||||
| Voyage charters | 17,700 | 525,404 | 0 | 0 | 543,104 | ||||||||||||||||||
| FPSO contracts | 0 | 0 | 74,720 | 0 | 74,720 | ||||||||||||||||||
| Management fees and other | 4,086 | 12,435 | 0 | 96,602 | 113,123 | ||||||||||||||||||
| 288,092 | 588,392 | 74,720 | 105,655 | 1,056,859 | |||||||||||||||||||
The following table contains the Company's total revenue for the three and six months ended June 30, 2021 and 2020, by those contracts or components of contracts accounted for as leases and by those contracts or components not accounted for as leases.
| Three Months Ended June 30, | Six Months Ended June 30, | |||||||||||||||||||||||||
| 2021 | 2020 | 2021 | 2020 | |||||||||||||||||||||||
| $ | $ | $ | $ | |||||||||||||||||||||||
| Lease revenue | ||||||||||||||||||||||||||
| Lease revenue from lease payments of operating leases | 251,842 | 390,407 | 530,744 | 876,590 | ||||||||||||||||||||||
| Interest income on lease receivables | 12,294 | 12,877 | 24,822 | 25,543 | ||||||||||||||||||||||
Variable lease payments – cost reimbursements (1) | 9,670 | 13,658 | 17,322 | 26,848 | ||||||||||||||||||||||
Variable lease payments – other (2) | 0 | 0 | 0 | 5,218 | ||||||||||||||||||||||
| 273,806 | 416,942 | 572,888 | 934,199 | |||||||||||||||||||||||
| Non-lease revenue | ||||||||||||||||||||||||||
| Non-lease revenue – related to sales-type or direct financing leases | 5,460 | 4,997 | 10,840 | 9,537 | ||||||||||||||||||||||
| Management fees and other income | 46,214 | 60,866 | 100,833 | 113,123 | ||||||||||||||||||||||
| 51,674 | 65,863 | 111,673 | 122,660 | |||||||||||||||||||||||
| Total | 325,480 | 482,805 | 684,561 | 1,056,859 | ||||||||||||||||||||||
(1)Reimbursement for vessel operating expenditures and dry-docking expenditures received from the Company's customers relating to such costs incurred by the Company to operate the vessel for the customer.
(2)Compensation from time-charter contracts based on spot market rates in excess of a base daily hire amount, production tariffs based on the volume of oil produced, the price of oil and other monthly or annual operational performance measures.
Operating Leases
As at June 30, 2021, the minimum scheduled future rentals to be received by the Company in each of the next five years for time charters, bareboat charters and FPSO contracts that were accounted for as operating leases were approximately $265.4 million (remainder of 2021), $429.8 million (2022), $322.8 million (2023), $252.9 million (2024) and $197.4 million (2025).
Minimum scheduled future revenues should not be construed to reflect total charter hire revenues for any of the years. Minimum scheduled future revenues do not include revenue generated from new contracts entered into after June 30, 2021, revenue from unexercised option periods of contracts that existed on June 30, 2021, revenue from vessels in the Company’s equity-accounted investments, or variable or contingent revenues accounted for under Accounting Standards Codification (or ASC) 842 Leases. In addition, minimum scheduled future operating lease revenues presented in this paragraph have been reduced by estimated off-hire time for any periodic maintenance and do not reflect the impact of revenue sharing arrangements whereby time-charter revenues are shared with other revenue sharing arrangement participants. The amounts may vary given unscheduled future events such as vessel maintenance.
Page 11
TEEKAY CORPORATION AND SUBSIDIARIES
NOTES TO THE UNAUDITED CONSOLIDATED FINANCIAL STATEMENTS
(all tabular amounts stated in thousands of U.S. Dollars, other than share and per share data)
Net Investment in Direct Financing Leases and Sales-Type Leases
On March 27, 2020, the Company entered into a bareboat charter with Britoil Limited (or BP), a subsidiary of BP p.l.c., for the Petrojarl Foinaven FPSO for a period up to December 2030. BP may cancel the charter on six-months' notice. Under the terms of this charter, Teekay received a cash payment of approximately $67 million in April 2020 and will receive a nominal per day rate over the life of the contract and a fixed lump sum payment at the end of the contract period. The charter was classified and accounted for as a sales-type lease. Consequently, as at March 31, 2020, the Company recognized a net investment in sales-type lease of $81.9 million and an asset retirement obligation of $6.1 million, derecognized the carrying value of the Petrojarl Foinaven FPSO and related customer contract, and recognized a gain of $44.9 million in the three months ended March 31, 2020. As at June 30, 2021, the net investment in sales-type lease was $14.6 million, with the majority of the reduction from inception relating to the cash payment of $67 million received in April 2020. In April 2021, BP announced its decision to suspend production from the Foinaven oil fields and permanently remove the Petrojarl Foinaven FPSO unit from the site. The Company expects the FPSO unit to be redelivered to Teekay Parent in the third quarter of 2022, at which point the Company intends to green-recycle the FPSO unit. At the end of the contract, the Company will receive a fixed lump sum payment from BP which the Company expects will cover the cost of green-recycling the FPSO unit.
As at June 30, 2021, Teekay LNG had 3 liquefied natural gas (or LNG) carriers, excluding vessels in its equity-accounted joint ventures, which are accounted for as direct financing leases. For a description of Teekay LNG's LNG carriers accounted for as direct financing leases, see "Item 18 – Financial Statements: Note 2" to the Company's Annual Report on Form 20-F for the year ended December 31, 2020.
As at December 31, 2019, Teekay LNG had 2 additional LNG carriers, the WilForce and the WilPride, that were chartered to Awilco LNG ASA (or Awilco) and were accounted for as sales-type leases. In January 2020, Awilco purchased both carriers from Teekay LNG and paid Teekay LNG the associated purchase obligation amounts, deferred hire amounts and interest on deferred hire amounts, totaling $260.4 million relating to these 2 vessels.
As at June 30, 2021, estimated minimum lease payments to be received related to direct financing and sales-type leases in each of the next five years were approximately $32.3 million (remainder of 2021), $64.2 million (2022), $64.0 million (2023), $64.3 million (2024), $64.2 million (2025) and an aggregate of $446.5 million thereafter. The leases are expected to end between 2028 and 2039.
Contract Liabilities
The Company enters into certain customer contracts that result in situations where the customer will pay consideration upfront for performance to be provided in the following month or months. These receipts are contract liabilities and are presented as deferred revenue until performance is provided. As at June 30, 2021 and December 31, 2020, there were contract liabilities of $14.0 million and $30.7 million, respectively. During the three and six months ended June 30, 2021, the Company recognized revenues of $21.7 million and $30.7 million, respectively, (three and six months ended June 30, 2020 - $28.1 million and $32.4 million, respectively) included in contract liability at the beginning of such periods.
4. Segment Reporting
The Company’s segments are described in "Item 18 – Financial Statements: Note 3" to the Company’s Annual Report on Form 20-F for the year ended December 31, 2020. The Company allocates capital and assesses performance from the separate perspectives of its 2 publicly-traded subsidiaries Teekay LNG and Teekay Tankers (together, the Daughter Entities), Teekay and its remaining subsidiaries (or Teekay Parent), as well as from the perspective of the Company's lines of business. The primary focus of the Company’s organizational structure, internal reporting and allocation of resources by the chief operating decision maker is on the Daughter Entities and Teekay Parent (the Legal Entity approach) and its segments are presented accordingly on this basis. The Company has 3 primary lines of business: (1) offshore production (FPSO units), (2) LNG and liquefied petroleum gas (or LPG) carriers, and (3) conventional tankers. The Company manages these businesses for the benefit of all stakeholders. The Company incorporates the primary lines of business within its segments, as in certain cases there is more than one line of business in each Daughter Entity and the Company believes this information allows a better understanding of the Company’s performance and prospects for future net cash flows.
The following table includes the Company’s revenues by segment for the three and six months ended June 30, 2021 and 2020:
Page 12
TEEKAY CORPORATION AND SUBSIDIARIES
NOTES TO THE UNAUDITED CONSOLIDATED FINANCIAL STATEMENTS
(all tabular amounts stated in thousands of U.S. Dollars, other than share and per share data)
| Three Months Ended June 30, | Six Months Ended June 30, | |||||||||||||
| 2021 | 2020 | 2021 | 2020 | |||||||||||
| $ | $ | $ | $ | |||||||||||
| Teekay LNG | ||||||||||||||
| Liquefied Gas Carriers | 148,769 | 148,205 | 301,571 | 288,092 | ||||||||||
| Teekay Tankers | ||||||||||||||
| Conventional Tankers | 123,420 | 246,492 | 266,169 | 588,392 | ||||||||||
| Teekay Parent | ||||||||||||||
| Offshore Production | 12,290 | 28,787 | 23,107 | 74,720 | ||||||||||
| Other | 41,001 | 59,321 | 93,714 | 105,655 | ||||||||||
| 53,291 | 88,108 | 116,821 | 180,375 | |||||||||||
| 325,480 | 482,805 | 684,561 | 1,056,859 | |||||||||||
The following table includes the Company’s (loss) income from vessel operations by segment for the three and six months ended June 30, 2021 and 2020:
(Loss) income from Vessel Operations(1) | ||||||||||||||
| Three Months Ended June 30, | Six Months Ended June 30, | |||||||||||||
| 2021 | 2020 | 2021 | 2020 | |||||||||||
| $ | $ | $ | $ | |||||||||||
| Teekay LNG | ||||||||||||||
| Liquefied Gas Carriers | 64,736 | 69,589 | 135,347 | 91,327 | ||||||||||
| Teekay Tankers | ||||||||||||||
| Conventional Tankers | (119,434) | 92,986 | (131,277) | 213,112 | ||||||||||
| Teekay Parent | ||||||||||||||
| Offshore Production | 30,543 | (11,540) | 32,515 | (23,808) | ||||||||||
| Other | (2,965) | (2,531) | (2,378) | (3,231) | ||||||||||
| 27,578 | (14,071) | 30,137 | (27,039) | |||||||||||
| (27,120) | 148,504 | 34,207 | 277,400 | |||||||||||
(1)Includes direct general and administrative expenses and indirect general and administrative expenses (allocated to each segment based on estimated use of corporate resources).
A reconciliation of total segment assets to consolidated total assets presented in the accompanying unaudited consolidated balance sheets is as follows:
Page 13
TEEKAY CORPORATION AND SUBSIDIARIES
NOTES TO THE UNAUDITED CONSOLIDATED FINANCIAL STATEMENTS
(all tabular amounts stated in thousands of U.S. Dollars, other than share and per share data)
| June 30, 2021 | December 31, 2020 | |||||||
| $ | $ | |||||||
| Teekay LNG – Liquefied Gas Carriers | 4,661,759 | 4,647,242 | ||||||
| Teekay Tankers – Conventional Tankers | 1,593,712 | 1,743,013 | ||||||
| Teekay Parent – Offshore Production | 18,372 | 30,845 | ||||||
| Teekay Parent – Other | 19,148 | 60,002 | ||||||
| Cash and cash equivalents | 258,351 | 348,785 | ||||||
| Other assets not allocated | 98,435 | 132,425 | ||||||
| Eliminations | (13,176) | (16,400) | ||||||
| Consolidated total assets | 6,636,601 | 6,945,912 | ||||||
5. Leases
Obligations Related to Finance Leases
| June 30, 2021 | December 31, 2020 | ||||||||||
| $ | $ | ||||||||||
| Teekay LNG | |||||||||||
| LNG Carriers | 1,305,055 | 1,340,922 | |||||||||
| Teekay Tankers | |||||||||||
| Conventional Tankers | 292,757 | 360,043 | |||||||||
| Total obligations related to finance leases | 1,597,812 | 1,700,965 | |||||||||
| Less current portion | (212,890) | (150,408) | |||||||||
| Long-term obligations related to finance leases | 1,384,922 | 1,550,557 | |||||||||
Teekay LNG
As at June 30, 2021 and December 31, 2020, Teekay LNG was a party to finance leases on 9 LNG carriers. These 9 LNG carriers were sold by Teekay LNG to third parties (or Lessors) and leased back under 7.5- to 15-year bareboat charter contracts ending in 2026 through 2034. At inception of these leases, the weighted-average interest rate implicit in these leases was 5.1%. The bareboat charter contracts are presented as obligations related to finance leases on the Company's unaudited consolidated balance sheets and have purchase obligations at the end of the lease terms.
The obligations of Teekay LNG under the bareboat charter contracts for the 9 LNG carriers are guaranteed by Teekay LNG. The guarantee agreements require Teekay LNG to maintain minimum levels of tangible net worth and aggregate liquidity, and not to exceed a maximum amount of leverage. As at June 30, 2021, Teekay LNG was in compliance with all covenants in respect of the obligations related to its finance leases.
As at June 30, 2021, the remaining commitments related to the financial liabilities of these 9 LNG carriers, including the amounts to be paid for the related purchase obligations, approximated $1.7 billion, including imputed interest of $366.8 million, repayable for the remainder of 2021 through 2034, as indicated below:
| Commitments | ||||||||
| At June 30, 2021 | ||||||||
| Year | $ | |||||||
| Remainder of 2021 | 69,063 | |||||||
| 2022 | 136,959 | |||||||
| 2023 | 135,459 | |||||||
| 2024 | 132,011 | |||||||
| 2025 | 129,725 | |||||||
| Thereafter | 1,068,641 | |||||||
Page 14
TEEKAY CORPORATION AND SUBSIDIARIES
NOTES TO THE UNAUDITED CONSOLIDATED FINANCIAL STATEMENTS
(all tabular amounts stated in thousands of U.S. Dollars, other than share and per share data)
Teekay Tankers
From 2017 to 2019, Teekay Tankers completed sale-leaseback financing transactions with financial institutions relating to 16 of Teekay Tankers' vessels. Under these arrangements, Teekay Tankers transferred the vessels to subsidiaries of the financial institutions (collectively, the Lessors) and leased the vessels back from the Lessors on bareboat charters ranging from 9 to 12-year terms. In October 2020, Teekay Tankers completed the purchases of 2 of these vessels for a total cost of $29.6 million and in May 2021, Teekay Tankers completed the purchases of 2 more of these vessels for a total cost of $56.7 million. In March 2021, Teekay Tankers also declared purchase options to acquire 6 additional vessels for a total cost of $128.8 million with an expected completion date of September 2021. Teekay Tankers has the option to purchase each of the remaining 6 vessels, four of which can be purchased between now and the end of their respective lease terms, while the remaining two can be purchased starting in November 2021 until the end of their respective lease terms.
The bareboat charters related to these vessels require that Teekay Tankers maintain a minimum liquidity (cash, cash equivalents and undrawn committed revolving credit lines with at least six months to maturity) of the greater of $35.0 million and at least 5.0% of Teekay Tankers' consolidated debt and obligations related to finance leases.
NaN of the bareboat charters were entered into with subsidiaries of a financial institution in July 2017 and November 2018. NaN of these bareboat charters, entered into in July 2017, require Teekay Tankers to maintain, for each vessel, a minimum hull coverage ratio of 90% of the total outstanding principal balance during the first three years of the lease period and 100% of the total outstanding principal balance thereafter. As at June 30, 2021, these ratios were 102% (December 31, 2020 – ranged from 121% to 143%). The remaining 2 of these bareboat charters, entered into in November 2018, require Teekay Tankers to maintain, for each vessel, a minimum hull coverage ratio of 100% of the total outstanding principal balance. As at June 30, 2021, these ratios ranged from 122% to 127% (December 31, 2020 – ranged from 145% to 156%). Should any of these ratios drop below the required amount, the lessor may request that the Company prepay additional charter hire.
NaN bareboat charters, entered into with subsidiaries of a financial institution in September 2018, require Teekay Tankers to maintain, for each vessel, a minimum hull coverage ratio of 75% of the total outstanding principal balance during the first year of the lease period, 78% for the second year, 80% for the following two years and 90% of the total outstanding principal balance thereafter. As at June 30, 2021, these ratios ranged from 98% to 104% (December 31, 2020 – ranged from 80% to 88%). Should any of these ratios drop below the required amount, and Teekay Tankers is unable to cure any such breach within the prescribed cure period, Teekay Tankers' obligations may become immediately due and payable at the election of the relevant lessor. In certain circumstances, this could lead to cross-defaults under Teekay Tankers' other financing agreements, which in turn could result in obligations becoming due and commitments being terminated under such agreements.
The requirements of the bareboat charters are assessed annually or quarterly with reference to vessel valuations compiled by one or more agreed upon third parties. As at June 30, 2021, Teekay Tankers was in compliance with all covenants in respect of its obligations related to finance leases.
The weighted average interest rate on Teekay Tankers’ obligations related to finance leases as at June 30, 2021 was 7.5% (December 31, 2020 – 7.8%).
As at June 30, 2021, the total remaining commitments (including vessel purchase options declared) related to the financial liabilities of these vessels were approximately $352.1 million (December 31, 2020, $480.9 million), including imputed interest of $59.3 million (December 31, 2020 $120.9 million), repayable from 2021 through 2030, as indicated below:
| Commitments | ||||||||
| At June 30, 2021 | ||||||||
| Year | $ | |||||||
| Remainder of 2021 | 142,913 | |||||||
| 2022 | 21,848 | |||||||
| 2023 | 21,846 | |||||||
| 2024 | 21,903 | |||||||
| 2025 | 21,841 | |||||||
| Thereafter | 121,782 | |||||||
Operating Lease Liabilities
The Company charters-in vessels from other vessel owners on time-charter-in and bareboat charter contracts, whereby the vessel owner provides use of the vessel to the Company, and, in the case of time-charter-in contracts, also operates the vessel for the Company. A time-charter-in contract is typically for a fixed period of time, although in certain cases the Company may have the option to extend the charter. The Company typically pays the owner a daily hire rate that is fixed over the duration of the charter. The Company is generally not required to pay the daily hire rate for time charters during periods the vessel is not able to operate.
Page 15
TEEKAY CORPORATION AND SUBSIDIARIES
NOTES TO THE UNAUDITED CONSOLIDATED FINANCIAL STATEMENTS
(all tabular amounts stated in thousands of U.S. Dollars, other than share and per share data)
In March 2021, the charter contracts relating to the Suksan Salamander FSO unit were novated to Altera Infrastructure L.P. (or Altera), and the in-charter contract relating to the unit was terminated at the same time. This contract termination resulted in the Company derecognizing the associated right-of use asset and liability of $29.7 million and $29.5 million, respectively.
As at June 30, 2021, total minimum commitments to be incurred by the Company under time-charter-in and bareboat charter contracts were approximately $17.1 million (remainder of 2021), $22.8 million (2022), $9.6 million (2023), $6.8 million (2024), $6.8 million (2025) and $25.0 million (thereafter), including 1 LR2 tanker delivered to the Company in September 2021 to commence an 18-month time charter-in contract, 1 ship-to-ship (or STS) support vessel expected to be delivered to the Company in September 2021 to commence a 2-year time charter-in contract, and 1 Aframax tanker newbuilding expected to be delivered to the Company in the fourth quarter of 2022 to commence a 7-year time charter-in contract. The minimum commitments exclude 2 time charter-in contracts for 2 Aframax tankers that were entered into by Teekay Tankers subsequent to June 30, 2021.
6. Financial Instruments
a)Fair Value Measurements
For a description of how the Company estimates fair value and for a description of the fair value hierarchy levels, see "Item 18 – Financial Statements: Note 11" in the Company’s Annual Report on Form 20-F for the year ended December 31, 2020.
The following table includes the estimated fair value and carrying value of those assets and liabilities that are measured at fair value on a recurring and non-recurring basis, as well as the estimated fair value of the Company’s financial instruments that are not accounted for at fair value on a recurring basis.
| June 30, 2021 | December 31, 2020 | ||||||||||||||||||||||||||||
| Fair Value Hierarchy Level | Carrying Amount Asset (Liability) $ | Fair Value Asset (Liability) $ | Carrying Amount Asset (Liability) $ | Fair Value Asset (Liability) $ | |||||||||||||||||||||||||
| Recurring | |||||||||||||||||||||||||||||
Cash, cash equivalents and restricted cash (note 19) | Level 1 | 310,252 | 310,252 | 405,890 | 405,890 | ||||||||||||||||||||||||
Derivative instruments (note 10) | |||||||||||||||||||||||||||||
Interest rate swap agreements – assets (1) | Level 2 | 1,465 | 1,465 | 0 | 0 | ||||||||||||||||||||||||
Interest rate swap agreements – liabilities (1) | Level 2 | (41,072) | (41,072) | (77,873) | (77,873) | ||||||||||||||||||||||||
Cross currency interest swap agreements – assets (1) | Level 2 | 5,806 | 5,806 | 4,505 | 4,505 | ||||||||||||||||||||||||
Cross currency interest swap agreements – liabilities (1) | Level 2 | (18,510) | (18,510) | (20,022) | (20,022) | ||||||||||||||||||||||||
| Forward freight agreements | Level 2 | (336) | (336) | 0 | 0 | ||||||||||||||||||||||||
| Non-recurring | |||||||||||||||||||||||||||||
Vessels and equipment (2) | Level 2 | 125,125 | 125,125 | 99,967 | 99,967 | ||||||||||||||||||||||||
Vessels related to finance leases (2) | Level 2 | 26,250 | 26,250 | 0 | 0 | ||||||||||||||||||||||||
Vessels held for sale (3) | Level 2 | 11,270 | 11,270 | 31,680 | 31,680 | ||||||||||||||||||||||||
Operating lease right-of-use assets (note 13) | Level 2 | 0 | 0 | 1,799 | 1,799 | ||||||||||||||||||||||||
| Other | |||||||||||||||||||||||||||||
| Loans to equity-accounted investees – current | (4) | 26,899 | (4) | 16,772 | (4) | ||||||||||||||||||||||||
| Advances to equity-accounted investees and joint venture partners – long-term | (4) | 105,436 | (4) | 111,338 | (4) | ||||||||||||||||||||||||
Short-term debt (note 8) | Level 2 | (10,000) | (10,000) | (10,000) | (10,000) | ||||||||||||||||||||||||
Long-term debt – public (note 9) | Level 1 | (589,513) | (612,233) | (587,913) | (597,281) | ||||||||||||||||||||||||
Long-term debt – non-public (note 9) | Level 2 | (1,479,206) | (1,504,140) | (1,467,194) | (1,481,093) | ||||||||||||||||||||||||
Obligations related to finance leases, including current portion (note 5) | Level 2 | (1,597,812) | (1,695,527) | (1,700,965) | (1,868,667) | ||||||||||||||||||||||||
(1)The fair value of the Company's interest rate swap and cross currency swap agreements at June 30, 2021 includes $3.6 million (December 31, 2020 – $6.1 million) of accrued interest expense which is recorded in accrued liabilities on the unaudited consolidated balance sheet.
(2)In June 2021, the carrying values of three Suezmax tankers, three LR2 tankers and one Aframax tankers were written down to their estimated fair values, using appraised values. See Note 13.
(3)In June 2021, the carrying value of one Aframax tanker was written down to its estimated sales price, less selling costs. See Note 13.
(4)In these unaudited interim consolidated financial statements, the Company’s loans to and investments in equity-accounted investments form the aggregate carrying value of the Company’s interests in entities accounted for by the equity method. The fair value of the individual components of such aggregate interests is not determinable.
Page 16
TEEKAY CORPORATION AND SUBSIDIARIES
NOTES TO THE UNAUDITED CONSOLIDATED FINANCIAL STATEMENTS
(all tabular amounts stated in thousands of U.S. Dollars, other than share and per share data)
b) Credit Losses
For a description of the Company's exposure to potential credit losses under ASC 326, see "Item 18 – Financial Statements: Note 11b" in the Company’s Annual Report on Form 20-F for the year ended December 31, 2020.
The following table includes the amortized cost basis of the Company's direct interests in financing receivables and net investment in direct financing leases by class of financing receivables and by period of origination and their associated credit quality.
| Amortized Cost Basis by Origination Year | ||||||||||||||||||||||||||||||||||||||
Credit Quality Grade (1) | 2020 | 2018 | 2016 and prior | Total | ||||||||||||||||||||||||||||||||||
| As at June 30, 2021 | $ | $ | $ | $ | ||||||||||||||||||||||||||||||||||
| Sales-type lease – Teekay Parent | ||||||||||||||||||||||||||||||||||||||
Petrojarl Foinaven FPSO | Performing | 14,574 | 0 | 0 | 14,574 | |||||||||||||||||||||||||||||||||
| Direct financing leases – Teekay LNG | ||||||||||||||||||||||||||||||||||||||
Tangguh Hiri and Tangguh Sago | Performing | 0 | 0 | 326,166 | 326,166 | |||||||||||||||||||||||||||||||||
| Bahrain Spirit | Performing | 0 | 210,795 | 0 | 210,795 | |||||||||||||||||||||||||||||||||
| 0 | 210,795 | 326,166 | 536,961 | |||||||||||||||||||||||||||||||||||
| Loans to equity-accounted joint ventures | ||||||||||||||||||||||||||||||||||||||
| Exmar LPG Joint Venture | Performing | 0 | 0 | 32,266 | 32,266 | |||||||||||||||||||||||||||||||||
| Bahrain LNG Joint Venture | Performing | 0 | 0 | 73,375 | 73,375 | |||||||||||||||||||||||||||||||||
| Other | Performing | 660 | 0 | 0 | 660 | |||||||||||||||||||||||||||||||||
| 660 | 0 | 105,641 | 106,301 | |||||||||||||||||||||||||||||||||||
| 15,234 | 210,795 | 431,807 | 657,836 | |||||||||||||||||||||||||||||||||||
| As at December 31, 2020 | ||||||||||||||||||||||||||||||||||||||
| Sales-type lease – Teekay Parent | ||||||||||||||||||||||||||||||||||||||
Petrojarl Foinaven FPSO | Performing | 15,472 | 0 | 0 | 15,472 | |||||||||||||||||||||||||||||||||
| Direct financing leases – Teekay LNG | ||||||||||||||||||||||||||||||||||||||
Tangguh Hiri and Tangguh Sago | Performing | 0 | 0 | 332,308 | 332,308 | |||||||||||||||||||||||||||||||||
| Bahrain Spirit | Performing | 0 | 211,939 | 0 | 211,939 | |||||||||||||||||||||||||||||||||
| 0 | 211,939 | 332,308 | 544,247 | |||||||||||||||||||||||||||||||||||
| Loans to equity-accounted joint ventures | ||||||||||||||||||||||||||||||||||||||
| Exmar LPG Joint Venture | Performing | 0 | 0 | 42,266 | 42,266 | |||||||||||||||||||||||||||||||||
| Bahrain LNG Joint Venture | Performing | 0 | 0 | 73,375 | 73,375 | |||||||||||||||||||||||||||||||||
| Other | Performing | 991 | 0 | 0 | 991 | |||||||||||||||||||||||||||||||||
| 991 | 0 | 115,641 | 116,632 | |||||||||||||||||||||||||||||||||||
| 16,463 | 211,939 | 447,949 | 676,351 | |||||||||||||||||||||||||||||||||||
(1)For a description of how the Company's credit quality grades are determined see "Item 18 – Financial Statements: Note 11b" in the Company’s Annual Report on Form 20-F for the year ended December 31, 2020. As at June 30, 2021, all direct financing and sales-type leases held by the Company and Teekay LNG's equity-accounted joint ventures had a credit quality grade of performing.
Page 17
TEEKAY CORPORATION AND SUBSIDIARIES
NOTES TO THE UNAUDITED CONSOLIDATED FINANCIAL STATEMENTS
(all tabular amounts stated in thousands of U.S. Dollars, other than share and per share data)
Changes in the allowance for credit losses for the three and six months ended June 30, 2021 are as follows:
Direct Financing and Sales-Type Leases (1)(2) $ | Direct Financing and Sales-Type Leases and Other within Equity-Accounted Joint Ventures (1)(2) $ | Loans to Equity-Accounted Joint Ventures (1)(2) $ | Guarantees of Debt (1)(2) $ | Total $ | |||||||||||||||||||||||||
Three and Six Months Ended June 30, 2021 | |||||||||||||||||||||||||||||
| As at December 31, 2020 | 31,078 | 54,937 | 4,726 | 2,080 | 92,821 | ||||||||||||||||||||||||
Provision for (reversal of) potential credit losses | 4,726 | 6,677 | (981) | 218 | 10,640 | ||||||||||||||||||||||||
| As at March 31, 2021 | 35,804 | 61,614 | 3,745 | 2,298 | 103,461 | ||||||||||||||||||||||||
Reversal of (provision for) potential credit losses | (404) | 722 | 255 | (298) | 275 | ||||||||||||||||||||||||
| As at June 30, 2021 | 35,400 | 62,336 | 4,000 | 2,000 | 103,736 | ||||||||||||||||||||||||
Three and Six Months Ended June 30, 2020 | |||||||||||||||||||||||||||||
| As at January 1, 2020 | 11,155 | 36,292 | 3,714 | 2,139 | 53,300 | ||||||||||||||||||||||||
(Reversal of) provision for potential credit losses | (100) | 8,980 | 0 | 0 | 8,880 | ||||||||||||||||||||||||
| As at March 31, 2020 | 11,055 | 45,272 | 3,714 | 2,139 | 62,180 | ||||||||||||||||||||||||
Provision for (reversal of) potential credit losses | 465 | (423) | 83 | (288) | (163) | ||||||||||||||||||||||||
| As at June 30, 2020 | 11,520 | 44,849 | 3,797 | 1,851 | 62,017 | ||||||||||||||||||||||||
(1)For a description of how the credit loss provision for direct financing leases, direct financing and sales-type leases and other within equity-accounted joint ventures, loans to equity-accounted joint ventures and guarantees of debt was determined for the three months ended March 31, 2021 and 2020, see "Item 18 – Financial Statements: Note 11b" in the Company’s Annual Report on Form 20-F for the year ended December 31, 2020.
(2)The changes in credit loss provision of ($0.4) million and $4.3 million for the three and six months ended June 30, 2021, respectively ($0.5 million and $0.4 million for the three and six months ended June 30, 2020, respectively), relating to the Company's consolidated vessels, are included in other expense on the unaudited consolidated statements of income. The change in the credit loss provision for the six months ended June 30, 2021 primarily reflects a decline in the estimated charter-free valuations for certain types of Teekay LNG's LNG carriers at the end of their time-charter contract, which are accounted for as direct financing leases. These estimated future charter-free values are subject to change based on the underlying LNG shipping market fundamentals.
The changes in credit loss provision of $0.7 million and $7.4 million for the three and six months ended June 30, 2021, respectively (($0.4) million and $8.6 million for the three and six months ended June 30, 2020, respectively), relating to the direct financing and sales-type leases and other within Teekay LNG's equity-accounted joint ventures are included in equity income. The change in credit loss provision for the six months ended June 30, 2021 primarily reflects a decline in the estimated charter-free valuations for certain types of LNG carriers at the end of their time-charter contract, which are accounted for as direct financing and sales-type leases.
The changes in the credit loss provision for the Company's consolidated vessels and the vessels within Teekay LNG's equity-accounted joint ventures for the six months ended June 30, 2021 do not reflect any material change in expectations of the charterers' ability to make their time-charter hire payments as they come due compared to the beginning of the year.
Page 18
TEEKAY CORPORATION AND SUBSIDIARIES
NOTES TO THE UNAUDITED CONSOLIDATED FINANCIAL STATEMENTS
(all tabular amounts stated in thousands of U.S. Dollars, other than share and per share data)
7. Accrued Liabilities and Other and Other Long-Term Liabilities
Accrued Liabilities and Other
| June 30, 2021 | December 31, 2020 | ||||||||||
| $ | $ | ||||||||||
| Accrued liabilities | |||||||||||
| Voyage and vessel expenses | 91,854 | 140,029 | |||||||||
| Interest and distributions | 27,987 | 31,765 | |||||||||
| Payroll and related liabilities | 38,455 | 37,349 | |||||||||
| Deferred revenues – current | 17,800 | 34,461 | |||||||||
Current portion of derivative liabilities (note 10) | 27,248 | 58,186 | |||||||||
| Office lease liability – current | 2,416 | 1,607 | |||||||||
| Loans from equity-accounted investments | 4,243 | 16,689 | |||||||||
| Asset retirement obligation – current | 0 | 12,000 | |||||||||
| 210,003 | 332,086 | ||||||||||
Other Long-Term Liabilities
| June 30, 2021 | December 31, 2020 | ||||||||||
| $ | $ | ||||||||||
| Deferred revenues and gains | 21,567 | 23,732 | |||||||||
| Guarantee liabilities | 10,741 | 11,818 | |||||||||
| Asset retirement obligation | 10,839 | 37,996 | |||||||||
| Pension liabilities | 10,267 | 9,172 | |||||||||
Derivative liabilities (note 10) | 29,130 | 33,566 | |||||||||
Unrecognized tax benefits (note 12) | 71,008 | 70,738 | |||||||||
| Office lease liability – long-term | 11,465 | 9,396 | |||||||||
| Other | 3,860 | 1,689 | |||||||||
| 168,877 | 198,107 | ||||||||||
Asset Retirement Obligations
In the first quarter of 2020, CNR International (U.K.) Limited (or CNRI) provided formal notice to Teekay of its intention to cease production in June 2020 and to decommission the Banff field shortly thereafter. As such, in the third quarter of 2020, the Company removed the Petrojarl Banff FPSO from the Banff field and redelivered the Apollo Spirit FSO to its owners. The Company is currently in the process of recycling the FPSO unit at an EU-approved shipyard and is also required to recycle the subsea equipment following removal from the field (or Phase 2). During the first half of 2020, the asset retirement obligation (or ARO) relating to the Petrojarl Banff FPSO unit and Phase 2 was increased based on changes to cost estimates and the carrying value of the unit was fully written down.
In April 2021, Teekay and CNRI, on behalf of the Banff joint venture, entered into a Decommissioning Services Agreement (or DSA), whereby Teekay engaged CNRI to assume full responsibility for Teekay’s remaining Phase 2 obligations. The DSA was subject to certain conditions precedent that needed to be satisfied by June 1, 2021 (or any agreed extension thereto), failing which the DSA could have been terminated by either party. On May 27, 2021, all conditions precedent of the DSA that needed to be satisfied by June 1, 2021 were met. As such, Teekay was deemed to have fulfilled all of its prior decommissioning obligations associated with the Banff field and the Company derecognized the ARO and its associated receivable, resulting in a $33.0 million gain that has been included in asset retirement obligation extinguishment gain in the consolidated statements of (loss) income for the three and six months ended June 30, 2021.
In March 2020, Teekay Parent entered into a new bareboat charter contract with the existing charterer of the Petrojarl Foinaven FPSO unit, which can be extended up to December 2030. Under the terms of the new contract, Teekay received a cash payment of $67 million in April 2020, and will receive a nominal per day rate over the life of the contract and a fixed lump sum payment at the end of the contract period, which is expected to cover the costs of recycling the FPSO unit in accordance with the EU Ship Recycling Regulation. However, the extent to which this lump sum payment covers the costs of recycling the FPSO unit will depend on a number of factors when the recycling is completed, including the nature and extent of prevailing EU Ship Recycling Regulation, the condition of the FPSO unit, and the availability of recycling facilities, among other factors.
In April 2021, the charterer of the Petrojarl Foinaven FPSO unit announced its decision to suspend production from the Foinaven oil fields and permanently remove the Petrojarl Foinaven FPSO unit from the site. The Company currently expects the FPSO unit will be redelivered to Teekay Parent in the third quarter of 2022, at which point the Company expects to receive the fixed lump sum payment from the charterer and intends to green-recycle the FPSO unit. Although the Company has not changed its cost estimate to recycle the Petrojarl
Page 19
TEEKAY CORPORATION AND SUBSIDIARIES
NOTES TO THE UNAUDITED CONSOLIDATED FINANCIAL STATEMENTS
(all tabular amounts stated in thousands of U.S. Dollars, other than share and per share data)
Foinaven FPSO unit, during the three months ended June 30, 2021, the Company increased the present value of its estimated ARO liability relating to the FPSO unit by $2.7 million as a result of the earlier than expected redelivery of the FPSO unit, which has been included in other loss in the consolidated statements of (loss) income. As of June 30, 2021, the carrying value of the related lease asset was $14.6 million, which is comprised of the expected fixed lump sum payment, the expected residual value of the asset and the day rate to be received over the remaining life of the contract. As of June 30, 2021, the present value of the Petrojarl Foinaven FPSO unit's estimated ARO relating to recycling costs was $10.7 million.
8. Short-Term Debt
In November 2018, Teekay Tankers Chartering Pte. Ltd. (or TTCL), a wholly-owned subsidiary of Teekay Tankers, entered into a working capital revolving loan facility (or the Working Capital Loan), which initially provided available aggregate borrowings of up to $40.0 million for TTCL, and had an initial maturity date in May 2019, subject to extension as described below. The maximum available aggregate borrowings were subsequently increased to $80.0 million, effective December 2019. The amount available for drawdown is limited to a percentage of certain receivables and accrued revenue, which is assessed weekly. The next maturity date of the Working Capital Loan is in November 2021. The Working Capital Loan maturity date is continually extended for further periods of six months thereafter unless and until the lender gives notice in writing that no further extensions shall occur. Proceeds of the Working Capital Loan are used to provide working capital in relation to certain vessels subject to the revenue sharing agreements (or RSAs). Interest payments are based on LIBOR plus a margin of 3.5%.
The Working Capital Loan is collateralized by the assets of TTCL. The Working Capital Loan requires Teekay Tankers to maintain its paid-in capital contribution under the RSAs and the retained distributions of the RSA counterparties in an amount equal to the greater of (a) an amount equal to the minimum average capital contributed by the RSA counterparties per vessel in respect of the RSA (including cash, bunkers or other working capital contributions and amounts accrued to the RSA counterparties but unpaid) and (b) a minimum capital contribution ranging from $20.0 million to $30.0 million based on the amount borrowed. As at June 30, 2021, $10.0 million (December 31, 2020 – $10.0 million) was owing under this facility, the aggregate available borrowings were $29.8 million (December 31, 2020 - $32.0 million) and the interest rate on the facility was 3.6% (December 31, 2020 – 3.6%). As at June 30, 2021, Teekay Tankers was in compliance with all covenants in respect of this facility.
9. Long-Term Debt
| June 30, 2021 | December 31, 2020 | ||||||||||
| $ | $ | ||||||||||
| Revolving Credit Facilities due through 2024 | 355,000 | 285,000 | |||||||||
| Senior Notes (9.25%) due November 15, 2022 | 243,395 | 243,395 | |||||||||
| Convertible Senior Notes (5%) due January 17, 2023 | 112,184 | 112,184 | |||||||||
| Norwegian Krone-denominated Bonds due through September 2025 | 354,486 | 355,514 | |||||||||
| U.S. Dollar-denominated Term Loans due through 2030 | 892,249 | 938,280 | |||||||||
| Euro-denominated Term Loans due through 2024 | 134,447 | 152,710 | |||||||||
| Total principal | 2,091,761 | 2,087,083 | |||||||||
| Less unamortized discount and debt issuance costs | (23,042) | (31,976) | |||||||||
| Total debt | 2,068,719 | 2,055,107 | |||||||||
| Less current portion | (374,960) | (261,366) | |||||||||
| Long-term portion | 1,693,759 | 1,793,741 | |||||||||
As at June 30, 2021, the Company had 4 revolving credit facilities (collectively, the Revolvers) available. The Revolvers, as at such date, provided for aggregate borrowings of up to $883.9 million, of which $528.9 million was undrawn. Interest payments are based on LIBOR plus a margin. At June 30, 2021 and December 31, 2020, the margins ranged between 1.40% and 4.25%. As at June 30, 2021, the aggregate amount available under the Revolvers was scheduled to decrease by $56.5 million (remainder of 2021), $560.8 million (2022), $65.3 million (2023) and $201.3 million (2024). The Revolvers are collateralized by first-priority mortgages granted on 33 of the Company’s vessels, together with other related security, and include a guarantee from Teekay or its subsidiaries for all but 1 of the Revolvers' outstanding amounts. Included in other related security are 36.0 million common units in Teekay LNG and 5.0 million Class A common shares in Teekay Tankers to secure a $150 million credit facility.
In May 2019, the Company issued $250.0 million in aggregate principal amount of 9.25% senior secured notes at par due November 2022 (or the 2022 Notes). The 2022 Notes are guaranteed on a senior secured basis by certain of Teekay's subsidiaries and are secured by a first-priority lien on 1 of Teekay Parent's FPSO units, a pledge of the equity interests in Teekay's subsidiary that owns all of Teekay's common units of Teekay LNG and all of Teekay’s Class A common shares of Teekay Tankers, and a pledge of the equity interests in Teekay's subsidiaries that own or previously owned Teekay Parent’s FPSO units.
Page 20
TEEKAY CORPORATION AND SUBSIDIARIES
NOTES TO THE UNAUDITED CONSOLIDATED FINANCIAL STATEMENTS
(all tabular amounts stated in thousands of U.S. Dollars, other than share and per share data)
The Company may redeem the 2022 Notes in whole or in part at a redemption price equal to a percentage of the principal amount of the 2022 Notes to be redeemed plus accrued and unpaid interest to, but excluding, the redemption date as follows: 104.625% at any time on or after November 15, 2020, but prior to November 15, 2021; 102.313% at any time on or after November 15, 2021, but prior to August 15, 2022; and 100% at any time on or after August 15, 2022. During 2020, Teekay Parent repurchased 2022 Notes in the open market. Teekay Parent acquired $6.6 million of the principal of the 2022 Notes for total consideration of $6.2 million.
On January 26, 2018, Teekay Parent completed a private offering of $125.0 million in aggregate principal amount of 5% Convertible Senior Notes due January 15, 2023 (or the Convertible Notes). At the election of the holder, the Convertible Notes are convertible into Teekay’s common stock, initially at a rate of 85.4701 shares of common stock per $1,000 principal amount of Convertible Notes. This represents an initial effective conversion price of $11.70 per share of common stock. The initial conversion price represents a premium of 20% to the concurrent common stock offering price of $9.75 per share. On issuance of the Convertible Notes, $104.6 million of the net proceeds was reflected in long-term debt, including unamortized discount, and was being accreted to its par value over its five-year term through interest expense until the adoption of ASU 2020-06 on January 1, 2021 (see Note 2). The remaining amount of the net proceeds of $16.1 million was allocated to the conversion feature and reflected in additional paid-in capital. During 2020, Teekay Parent repurchased $12.8 million of the principal of the Convertible Notes for total consideration of $10.5 million and as such the outstanding principal value of the Convertible Notes on June 30, 2021 and January 1, 2021, was $112.2 million. As of June 30, 2021 and January 1, 2021, the net carrying amount of the Convertible Notes was $111.0 million and $110.6 million, respectively, which reflected unamortized debt issuance costs of $1.2 million and $1.6 million, respectively. The estimated fair value (Level 2) of the Convertible Notes was $110.0 million and $101.6 million, as of June 30, 2021 and January 1, 2021. For the three and six months ended June 30, 2021, total interest expense for the Convertible Notes was $1.6 million and $3.2 million, respectively, with coupon interest expense of $1.4 million and $2.8 million, respectively, and amortization of debt issuance costs of $0.2 million and $0.4 million, respectively.
As at June 30, 2021, Teekay LNG had a total of Norwegian Krone (or NOK) 3.1 billion in senior unsecured bonds issued in the Norwegian bond market that mature through 2025 (December 31, 2020 – NOK 3.1 billion). As at June 30, 2021, the total carrying amount of the senior unsecured bonds was $354.5 million (December 31, 2020 – $355.5 million). The bonds are listed on the Oslo Stock Exchange. The interest payments on the bonds are based on Norwegian Interbank Offered Rate (or NIBOR) plus a margin, which ranges from 4.60% to 6.00% as at June 30, 2021 (December 31, 2020 - 4.60% to 6.00%). The Company entered into cross currency rate swaps to swap all interest and principal payments of the bonds into U.S. Dollars, with the interest payments fixed at rates ranging from 5.74% to 7.89% (December 31, 2020 - 5.74% to 7.89%), and the transfer of the principal amount fixed at $360.5 million upon maturity in exchange for NOK 3.1 billion (see Note 10).
As at June 30, 2021, the Company had 7 U.S. Dollar-denominated term loans outstanding, which totaled $892.2 million in aggregate principal amount (December 31, 2020 – $938.3 million). Interest payments on the term loans are based on LIBOR plus a margin, of which 1 of the term loans has an additional tranche with a weighted average fixed rate of 4.26%. At June 30, 2021 and at December 31, 2020, the margins ranged between 1.85% and 3.25%. The term loans require payments in quarterly installments commencing three months after drawdown, and 6 of the term loans have balloon or bullet repayments due at maturity. The term loans are collateralized by first-priority mortgages on 19 (December 31, 2020 – 20) of the Company’s vessels, together with certain other security.
Teekay LNG has 2 Euro-denominated term loans outstanding, which, as at June 30, 2021, totaled 113.4 million Euros ($134.4 million) (December 31, 2020 – 125.0 million Euros ($152.7 million)). Teekay LNG is servicing the loans with funds generated by 2 Euro-denominated, long-term time-charter contracts. Interest payments for one of the term loans are based on Euro Interbank Offered Rate (or EURIBOR) plus a margin. Interest payments on the remaining term loan are based on EURIBOR where EURIBOR is limited to zero or above zero values, plus a margin. At June 30, 2021 and December 31, 2020, the margins ranged between 0.60% and 1.95%. The Euro-denominated term loans reduce in monthly and semi-annual payments with varying maturities through 2024, are collateralized by first-priority mortgages on 2 of Teekay LNG's vessels, together with certain other security, and are guaranteed by Teekay LNG and 1 of its subsidiaries.
Both Euro-denominated term loans and NOK-denominated bonds are revalued at the end of each period using the then-prevailing U.S. Dollar exchange rate. Due primarily to the revaluation of the Company’s NOK-denominated bonds, the Company’s Euro-denominated term loans and restricted cash and the change in the valuation of the Company’s cross currency swaps, the Company recognized a foreign exchange loss of $3.4 million (2020 – loss of $8.9 million) and a gain of $2.3 million (2020 - loss of $2.3 million) during the three and six months ended June 30, 2021 and 2020, respectively.
The weighted-average interest rate on the Company’s aggregate long-term debt as at June 30, 2021 was 3.9% (December 31, 2020 – 3.8%). This rate does not include the effect of the Company’s interest rate swap agreements (see Note 10).
The aggregate annual long-term debt principal repayments required to be made by the Company subsequent to June 30, 2021, are $201.2 million (remainder of 2021), $477.6 million (2022), $429.5 million (2023), $326.3 million (2024), $187.4 million (2025) and $469.8 million (thereafter).
The Company’s long-term debt agreements generally provide for maintenance of minimum consolidated financial covenants and 7 loan agreements require the maintenance of vessel market value to loan ratios. As at June 30, 2021, these ratios were 195%, 289%, 170%, 145%, 148%, 400% and 137% compared to their minimum required ratios of 135%, 125%, 125%, 120%, 120%, 115% and 110%, respectively. The vessel values used in these ratios are the appraised values provided by third parties where available or prepared by the Company based on second-hand sale and purchase market data. Changes in the LNG/LPG carrier and conventional tanker markets could affect the Company's compliance with these ratios.
Page 21
TEEKAY CORPORATION AND SUBSIDIARIES
NOTES TO THE UNAUDITED CONSOLIDATED FINANCIAL STATEMENTS
(all tabular amounts stated in thousands of U.S. Dollars, other than share and per share data)
Certain loan agreements require Teekay LNG to maintain a minimum level of tangible net worth, and minimum liquidity (cash, cash equivalents and undrawn committed revolving credit lines with at least six months to maturity) of $35.0 million, and not to exceed a maximum level of financial leverage. Certain loan agreements require Teekay Tankers to maintain minimum liquidity (cash, cash equivalents and undrawn committed revolving credit lines with at least six months to maturity) of the greater of $35.0 million and at least 5.0% of Teekay Tankers' total consolidated debt and obligations related to finance leases.
As at June 30, 2021, the Company was in compliance with all covenants under its credit facilities and other long-term debt.
10. Derivative Instruments and Hedging Activities
The Company uses derivative instruments to manage certain risks in accordance with its overall risk management policies.
Foreign Exchange Risk
From time to time, the Company economically hedges portions of its forecasted expenditures denominated in foreign currencies with foreign currency forward contracts. As at June 30, 2021, the Company was not committed to any foreign currency forward contracts.
The Company enters into cross currency swaps, and pursuant to these swaps the Company receives the principal amount in NOK on the maturity dates of the swaps, in exchange for payment of a fixed U.S. Dollar amount. In addition, the cross currency swaps exchange a receipt of floating interest in NOK based on NIBOR plus a margin for a payment of U.S. Dollar fixed interest. The purpose of the cross currency swaps is to economically hedge the foreign currency exposure on the payment of interest and principal amounts of the Company’s NOK-denominated bonds due in 2021, 2023 and 2025. In addition, the cross currency swaps economically hedge the interest rate exposure on the NOK bonds due in 2021, 2023 and 2025. The Company has not designated, for accounting purposes, these cross currency swaps as cash flow hedges of its NOK-denominated bonds due in 2021, 2023 and 2025. As at June 30, 2021, the Company was committed to the following cross currency swaps:
Fair Value / Carrying Amount of Asset / (Liability) $ | ||||||||||||||||||||||||||||||||||||||
| Notional Amount NOK | Notional Amount USD | Floating Rate Receivable | ||||||||||||||||||||||||||||||||||||
Reference Rate | Margin | Fixed Rate Payable | Remaining Term (years) | |||||||||||||||||||||||||||||||||||
| 1,200,000 | 146,500 | NIBOR | 6.00% | 7.72% | (8,667) | 0.3 | ||||||||||||||||||||||||||||||||
| 850,000 | 102,000 | NIBOR | 4.60% | 7.89% | (9,843) | 2.2 | ||||||||||||||||||||||||||||||||
| 1,000,000 | 112,000 | NIBOR | 5.15% | 5.74% | 5,806 | 4.2 | ||||||||||||||||||||||||||||||||
| (12,704) | ||||||||||||||||||||||||||||||||||||||
Interest Rate Risk
The Company enters into interest rate swap agreements, which exchange a receipt of floating interest for a payment of fixed interest, to reduce the Company’s exposure to interest rate variability on its outstanding floating-rate debt. The Company designates certain of its interest rate swap agreements as cash flow hedges for accounting purposes.
As at June 30, 2021, the Company was committed to the following interest rate swap agreements related to its LIBOR-based debt and EURIBOR-based debt, whereby certain of the Company’s floating-rate debts were swapped with fixed-rate obligations:
Interest Rate Index | Principal Amount | Fair Value / Carrying Amount of Asset / (Liability) $ | Weighted- Average Remaining Term (years) | Fixed Swap Rate (%)(1) | |||||||||||||||||||||||||
| LIBOR-Based Debt: | |||||||||||||||||||||||||||||
U.S. Dollar-denominated interest rate swaps (2) | LIBOR | 860,941 | (34,968) | 3.6 | 2.2 | ||||||||||||||||||||||||
| EURIBOR-Based Debt: | |||||||||||||||||||||||||||||
| Euro-denominated interest rate swaps | EURIBOR | 62,945 | (4,639) | 2.2 | 3.9 | ||||||||||||||||||||||||
| (39,607) | |||||||||||||||||||||||||||||
(1)Excludes the margins the Company pays on its variable-rate debt which, as of June 30, 2021, ranged from 0.6% to 4.25%.
(2)Includes interest rate swaps with the notional amount reducing quarterly or semi-annually. NaN interest rate swaps are subject to mandatory early termination in 2024, at which time the swaps will be settled based on their fair value.
Page 22
TEEKAY CORPORATION AND SUBSIDIARIES
NOTES TO THE UNAUDITED CONSOLIDATED FINANCIAL STATEMENTS
(all tabular amounts stated in thousands of U.S. Dollars, other than share and per share data)
Tabular Disclosure
The following tables present the location and fair value amounts of derivative instruments, segregated by type of contract, on the Company’s unaudited consolidated balance sheets.
| Prepaid Expenses and Other | Goodwill, Intangibles and Other Non-Current Assets | Accrued Liabilities and Other (1) | Accrued Liabilities and Other (2) | Other Long-Term Liabilities | |||||||||||||||||||||||||
| $ | $ | $ | $ | $ | |||||||||||||||||||||||||
| As at June 30, 2021 | |||||||||||||||||||||||||||||
| Derivatives designated as a cash flow hedge: | |||||||||||||||||||||||||||||
| Interest rate swap agreements | 0 | 0 | (63) | (3,077) | (5,673) | ||||||||||||||||||||||||
| Derivatives not designated as a cash flow hedge: | |||||||||||||||||||||||||||||
| Interest rate swap agreements | 0 | 1,465 | (2,735) | (12,979) | (16,545) | ||||||||||||||||||||||||
| Cross currency swap agreements | 258 | 5,562 | (756) | (10,856) | (6,912) | ||||||||||||||||||||||||
| Forward freight agreements | 0 | 0 | 0 | (336) | 0 | ||||||||||||||||||||||||
| 258 | 7,027 | (3,554) | (27,248) | (29,130) | |||||||||||||||||||||||||
| Prepaid Expenses and Other | Goodwill, Intangibles and Other Non-Current Assets | Accrued Liabilities and Other (1) | Accrued Liabilities and Other (2) | Other Long-Term Liabilities | |||||||||||||||||||||||||
| $ | $ | $ | $ | $ | |||||||||||||||||||||||||
| As at December 31, 2020 | |||||||||||||||||||||||||||||
| Derivatives designated as a cash flow hedge: | |||||||||||||||||||||||||||||
| Interest rate swap agreements | 0 | 0 | (70) | (3,162) | (9,631) | ||||||||||||||||||||||||
| Derivatives not designated as a cash flow hedge: | |||||||||||||||||||||||||||||
| Interest rate swap agreements | 0 | 0 | (5,372) | (43,590) | (16,048) | ||||||||||||||||||||||||
| Cross currency swap agreements | 0 | 4,505 | (701) | (11,434) | (7,887) | ||||||||||||||||||||||||
| 0 | 4,505 | (6,143) | (58,186) | (33,566) | |||||||||||||||||||||||||
(1)Represents accrued interest related to derivative instruments presented in accrued liabilities and other on the consolidated balance sheets (see Note 7).
(2)Represents the current portion of derivative liabilities presented in accrued liabilities and other on the consolidated balance sheets (see Note 7).
As at June 30, 2021, the Company had multiple interest rate swaps and cross currency swaps with the same counterparty that are subject to the same master agreements. Each of these master agreements provides for the net settlement of all derivatives subject to that master agreement through a single payment in the event of default or termination of any one derivative. The fair value of these derivatives is presented on a gross basis in the Company’s unaudited consolidated balance sheets. As at June 30, 2021, these derivatives had an aggregate fair value asset amount of $6.2 million and an aggregate fair value liability amount of $57.6 million.
Page 23
TEEKAY CORPORATION AND SUBSIDIARIES
NOTES TO THE UNAUDITED CONSOLIDATED FINANCIAL STATEMENTS
(all tabular amounts stated in thousands of U.S. Dollars, other than share and per share data)
For the periods indicated, the following tables present the (losses) gains on interest rate swap agreements designated and qualifying as cash flow hedges and their impact on other comprehensive (loss) income (or OCI) (excluding such agreements in equity-accounted investments):
| Three Months Ended June 30, | Six Months Ended June 30, | ||||||||||||||||||||||
| 2021 | 2020 | 2021 | 2020 | ||||||||||||||||||||
| $ | $ | $ | $ | ||||||||||||||||||||
| Amount of (loss) gain recognized in OCI | (435) | (1,055) | 4,040 | (10,226) | |||||||||||||||||||
| Amount of loss reclassified from accumulated OCI to interest expense | (825) | (482) | (1,640) | (634) | |||||||||||||||||||
Realized and unrealized (losses) gains from derivative instruments that are not designated for accounting purposes as cash flow hedges are recognized in earnings and reported in realized and unrealized gains (losses) on non-designated derivatives in the unaudited consolidated statements of (loss) income as follows:
| Three Months Ended June 30, | Six Months Ended June 30, | ||||||||||||||||||||||
| 2021 | 2020 | 2021 | 2020 | ||||||||||||||||||||
| $ | $ | $ | $ | ||||||||||||||||||||
| Realized (losses) relating to: | |||||||||||||||||||||||
| Interest rate swap agreements | (4,353) | (3,879) | (9,271) | (6,556) | |||||||||||||||||||
| Interest rate swap agreement termination | 0 | 0 | (18,012) | 0 | |||||||||||||||||||
| Foreign currency forward contracts | 0 | 0 | 0 | (241) | |||||||||||||||||||
| Forward freight agreements | (89) | (201) | (61) | (250) | |||||||||||||||||||
| (4,442) | (4,080) | (27,344) | (7,047) | ||||||||||||||||||||
| Unrealized gains (losses) relating to: | |||||||||||||||||||||||
| Interest rate swap agreements | 1,323 | (5,251) | 31,579 | (24,063) | |||||||||||||||||||
| Foreign currency forward contracts | 0 | 53 | 0 | 255 | |||||||||||||||||||
| Forward freight agreements | (270) | 8 | (303) | (78) | |||||||||||||||||||
| 1,053 | (5,190) | 31,276 | (23,886) | ||||||||||||||||||||
| Total realized and unrealized (losses) gains on derivative instruments | (3,389) | (9,270) | 3,932 | (30,933) | |||||||||||||||||||
Realized and unrealized (losses) gains from cross currency swaps are recognized in earnings and reported in foreign exchange (loss) gain in the unaudited consolidated statements of (loss) income as follows:
| Three Months Ended June 30, | Six Months Ended June 30, | ||||||||||||||||||||||
| 2021 | 2020 | 2021 | 2020 | ||||||||||||||||||||
| $ | $ | $ | $ | ||||||||||||||||||||
| Realized losses on maturity and termination of cross currency swaps | 0 | (33,844) | 0 | (33,844) | |||||||||||||||||||
| Realized losses | (1,293) | (1,430) | (2,638) | (3,247) | |||||||||||||||||||
| Unrealized (losses) gains | (2,261) | 45,882 | 2,869 | (3,658) | |||||||||||||||||||
| Total realized and unrealized (losses) gains on cross currency swaps | (3,554) | 10,608 | 231 | (40,749) | |||||||||||||||||||
The Company is exposed to credit loss to the extent the fair value represents an asset in the event of non-performance by the counterparties to the cross currency and interest rate swap agreements; however, the Company does not anticipate non-performance by any of the counterparties. In order to minimize counterparty risk, the Company only enters into derivative transactions with counterparties that are rated A- or better by Standard & Poor’s or A3 or better by Moody’s at the time of the transaction. In addition, to the extent possible and practical, interest rate swaps are entered into with different counterparties to reduce concentration risk.
Page 24
TEEKAY CORPORATION AND SUBSIDIARIES
NOTES TO THE UNAUDITED CONSOLIDATED FINANCIAL STATEMENTS
(all tabular amounts stated in thousands of U.S. Dollars, other than share and per share data)
11. Commitments and Contingencies
a)Vessels Under Construction and Upgrades
Teekay LNG's share of commitments to fund equipment installation and other construction contract costs as at June 30, 2021 are as follows:
| Total $ | Remainder of 2021 $ | 2022 $ | |||||||||
Certain consolidated LNG carriers (i) | 27,866 | 13,012 | 14,854 | ||||||||
Bahrain LNG Joint Venture (ii) | 11,339 | 11,339 | 0 | ||||||||
| 39,205 | 24,351 | 14,854 | |||||||||
(i)In June 2019, Teekay LNG entered into an agreement with a contractor to supply reliquefication equipment on certain of Teekay LNG's LNG carriers in 2021 and 2022, for an estimated installed cost of $54.8 million. As at June 30, 2021, the estimated remaining cost of this installation is $27.9 million.
(ii)Teekay LNG has a 30% ownership interest in the Bahrain LNG Joint Venture which has an LNG receiving and regasification terminal in Bahrain. As at June 30, 2021, Teekay LNG's proportionate share of the estimated remaining cost of $11.3 million relates to the final construction installment on the LNG terminal. The Bahrain LNG Joint Venture has remaining undrawn debt financing of $24.0 million, which is undrawn, of which $7.2 million relates to Teekay LNG's proportionate share of the construction commitments included in the table above.
b)Liquidity
Management is required to assess whether the Company will have sufficient liquidity to continue as a going concern for the one-year period following the issuance of its financial statements. The Company had consolidated net income of $3.9 million and consolidated cash flows from operating activities of ($18.9) million during the six months ended June 30, 2021 and had a working capital deficit of $377.0 million as at June 30, 2021. This working capital deficit included approximately $375.0 million related to scheduled maturities and repayments of debt in the next 12 months.
Teekay Tankers declared purchase options to acquire 6 tankers with an expected completion date of September 2021, for a total cost of $128.8 million, as part of the repurchase options under the sale-leaseback arrangements described in Note 5. As a result of this, over the one-year period following the issuance of these unaudited consolidated financial statements, the Company expects that Teekay Tankers will need to obtain additional sources of financing, in addition to amounts generated from operations, to meet its minimum liquidity requirements under its financial covenants. In June 2021, Teekay Tankers signed term sheets for $141.7 million in new sale-leaseback transactions relating to 8 vessels, including 2 vessels that were repurchased in May 2021 and 6 vessels to be repurchased in September 2021. Teekay Tankers considers it probable that these sale-leaseback transactions will be completed during the third quarter of 2021 and as such, expects that it will have sufficient liquidity to continue as a going concern for at least a one-year period following the issuance of these unaudited consolidated financial statements.
Teekay LNG had a working capital deficit of $352.3 million as at June 30, 2021, which includes $355.1 million related to scheduled maturities and repayments of long-term debt during the one-year period following the issuance of these unaudited consolidated financial statements. Teekay LNG expects that it will have sufficient liquidity to continue as a going concern for at least the one-year period following the issuance of these unaudited consolidated financial statements, based on its liquidity at the date these unaudited consolidated financial statements were issued, the liquidity it expects to generate from operations over the following year, the cash distributions it expects to receive from its equity-accounted joint ventures, and an expected debt refinancing which Teekay LNG considers probable based on its history of refinancing similar debt.
Based on the Company’s liquidity at the date these unaudited consolidated financial statements were issued, the liquidity the Company expects to generate from operations over the following year and from the completion of Teekay Tankers' sale-leaseback of eight vessels, the cash distributions it expects to receive from its equity-accounted joint ventures and expected debt refinancings, the Company expects that it will have sufficient liquidity to continue as a going concern for at least the one-year period following the issuance of these unaudited consolidated financial statements.
c)Legal Proceedings and Claims
The Company may, from time to time, be involved in legal proceedings and claims that arise in the ordinary course of business. The Company believes that any adverse outcome of existing claims, individually or in the aggregate, would not have a material effect on its financial position, results of operations or cash flows, when taking into account its insurance coverage and indemnifications from charterers. For information about recent legal proceedings, please read “Item 18 – Financial Statements: Note 16c – Legal Proceedings and Claims” in the Company's Annual Report on Form 20-F for the year ended December 31, 2020.
Page 25
TEEKAY CORPORATION AND SUBSIDIARIES
NOTES TO THE UNAUDITED CONSOLIDATED FINANCIAL STATEMENTS
(all tabular amounts stated in thousands of U.S. Dollars, other than share and per share data)
d)Other
The Company enters into indemnification agreements with certain officers and directors. In addition, the Company enters into other indemnification agreements in the ordinary course of business. The maximum potential amount of future payments required under these indemnification agreements is unlimited. However, the Company maintains what it believes is appropriate liability insurance that reduces its exposure and enables the Company to recover future amounts paid up to the maximum amount of the insurance coverage, less any deductible amounts pursuant to the terms of the respective policies, the amounts of which are not considered material.
Teekay LNG guarantees its proportionate share of certain loan facilities and obligations on interest rate swaps for its equity-accounted joint ventures for which the aggregate principal amount of the loan facilities and fair value of the interest rate swaps as at June 30, 2021 was $1.3 billion. As at June 30, 2021, with the exception of debt service coverage ratio breaches for three of the vessels in the Teekay LNG's 33%-owned joint venture with NYK and Mitsui & Co. Ltd. (or the Angola Joint Venture), all of Teekay LNG's equity-accounted joint ventures were in compliance with all covenants relating to these loan facilities that Teekay LNG guarantees. The Angola Joint Venture expects to obtain a waiver for the covenant requirements that were not met at June 30, 2021 until the next compliance test at December 31, 2021, similar to the waiver obtained in March 2021.
12. Income Tax Recovery
The components of the provision for income tax recovery are as follows:
| Three Months Ended June 30, | Six Months Ended June 30, | ||||||||||||||||||||||
| 2021 | 2020 | 2021 | 2020 | ||||||||||||||||||||
| $ | $ | $ | $ | ||||||||||||||||||||
| Current | 765 | 16,408 | (580) | 12,622 | |||||||||||||||||||
| Deferred | (561) | 767 | 2,169 | 761 | |||||||||||||||||||
| Income tax recovery | 204 | 17,175 | 1,589 | 13,383 | |||||||||||||||||||
The following table reflects changes in uncertain tax positions relating to freight tax liabilities, which are recorded in other long-term liabilities and accrued liabilities on the Company's unaudited consolidated balance sheets:
| Six Months Ended June 30, | |||||||||||
| 2021 | 2020 | ||||||||||
| $ | $ | ||||||||||
| Balance of unrecognized tax benefits as at January 1 | 70,738 | 62,958 | |||||||||
| Increases for positions related to the current year | 3,281 | 3,007 | |||||||||
| Increases for positions related to prior years | 5,247 | 3,971 | |||||||||
| Decreases for positions related to prior years | 0 | (16,441) | |||||||||
| Decrease related to statute limitations | (8,379) | (1,003) | |||||||||
| Foreign exchange gain (loss) | 121 | (1,491) | |||||||||
| Balance of unrecognized tax benefits as at June 30 | 71,008 | 51,001 | |||||||||
Included in the Company's current income tax expense are provisions for uncertain tax positions relating to freight taxes. Positions relating to freight taxes can vary each period depending on the trading patterns of the Company's vessels.
During the six months ended June 30, 2020, the Company secured an agreement with a tax authority, which was based in part on an initiative of the tax authority in response to the COVID-19 global pandemic and included the waiver of interest and penalties on unpaid taxes. As a result, the Company reduced its freight tax liabilities for this jurisdiction by $16.4 million to $9.8 million, of which $8.5 million was paid in August 2020 and $1.1 million was paid in June 2021 with respect to open tax years up to and including 2020.
The Company does not presently anticipate that its provisions for uncertain tax positions relating to freight taxes will significantly increase in the next 12 months; however, this is dependent on the jurisdictions in which vessel trading activity occurs. The Company reviews its freight tax obligations on a regular basis and may update its assessment of its tax positions based on available information at the time. Such information may include legal advice as to the applicability of freight taxes in relevant jurisdictions. Freight tax regulations are subject to change and interpretation; therefore, the amounts recorded by the Company may change accordingly.
13. (Write-down) and Gain (Loss) on Sale
The Company's write-downs and vessel sales generally relate to vessels approaching the end of their useful lives as well as other vessels it strategically sells, or is attempting to sell, to reduce exposure to a certain vessel class.
Page 26
TEEKAY CORPORATION AND SUBSIDIARIES
NOTES TO THE UNAUDITED CONSOLIDATED FINANCIAL STATEMENTS
(all tabular amounts stated in thousands of U.S. Dollars, other than share and per share data)
The following table contains the (write-downs) and gains (losses) on sales of assets for the three and six months ended June 30, 2021 and 2020:
| Three Months Ended June 30, | ||||||||||||||||||||||||||
| Segment | Asset Type | Completion of Sale Date | 2021 | 2020 | ||||||||||||||||||||||
| $ | $ | |||||||||||||||||||||||||
Teekay Parent Segment – Offshore Production (1) | 1 FPSO unit | N/A | 0 | (13,566) | ||||||||||||||||||||||
Teekay Tankers Segment – Conventional Tankers (2) | 3 Suezmaxes | N/A | (62,937) | 0 | ||||||||||||||||||||||
Teekay Tankers Segment – Conventional Tankers (2) | 3 LR2 Tankers | N/A | (18,381) | 0 | ||||||||||||||||||||||
Teekay Tankers Segment – Conventional Tankers (2)(3) | 2 Aframaxes | N/A | (5,368) | 0 | ||||||||||||||||||||||
Teekay Tankers Segment – Conventional Tankers (4) | (4) | Apr-2020 | 0 | 3,081 | ||||||||||||||||||||||
| Teekay Tankers Segment – Conventional Tankers | 1 Suezmax | N/A | 0 | 460 | ||||||||||||||||||||||
| Teekay Tankers Segment - Conventional Tankers | Operating lease right-of-use asset | N/A | 0 | (644) | ||||||||||||||||||||||
| Total | (86,686) | (10,669) | ||||||||||||||||||||||||
| Six Months Ended June 30, | ||||||||||||||||||||||||||
| Segment | Asset Type | Completion of Sale Date | 2021 | 2020 | ||||||||||||||||||||||
| $ | $ | |||||||||||||||||||||||||
Teekay Parent Segment – Offshore Production (1) | 2 FPSO unit | N/A | 0 | (60,085) | ||||||||||||||||||||||
Teekay LNG Segment – Liquefied Gas Carriers (5) | 6 Multi-gas Carriers | N/A | 0 | (45,000) | ||||||||||||||||||||||
Teekay Tankers Segment – Conventional Tankers (2) | 3 Suezmaxes | N/A | (62,937) | 0 | ||||||||||||||||||||||
Teekay Tankers Segment – Conventional Tankers (2) | 3 LR2 Tankers | N/A | (18,381) | 0 | ||||||||||||||||||||||
Teekay Tankers Segment – Conventional Tankers (2)(3) | 2 Aframaxes | N/A | (5,368) | 0 | ||||||||||||||||||||||
Teekay Tankers Segment – Conventional Tankers (4) | (4) | Apr-2020 | 0 | 3,081 | ||||||||||||||||||||||
| Teekay Tankers Segment – Conventional Tankers | 3 Suezmaxes | Feb/Mar-2020 | 0 | (2,627) | ||||||||||||||||||||||
| Teekay Tankers Segment – Conventional Tankers | Operating lease right-of-use asset | N/A | (715) | (644) | ||||||||||||||||||||||
| Total | (87,401) | (105,275) | ||||||||||||||||||||||||
(1)During the first half of 2020, Teekay Parent recognized an impairment charge of $60.1 million, in respect of 2 of its FPSO units. In the first quarter of 2020, CNRI provided formal notice to Teekay of its intention to cease production in June 2020 and decommission the Banff field shortly thereafter. As such, in the third quarter of 2020, the Company removed the Petrojarl Banff FPSO from the Banff field and redelivered the Apollo Spirit FSO to its owner. During 2020, the ARO relating to the Petrojarl Banff FPSO unit and Phase 2 was increased based on changes to cost estimates and the carrying value of the unit was fully written down. During 2020, the Company also made changes to its expected cash flows from the Sevan Hummingbird FPSO unit based on the market environment and oil prices, and contract discussions with the customer, which resulted in a full write-down of its carrying value.
(2)During the three months ended June 30, 2021, Teekay Tankers wrote down the carrying values of 3 Suezmax tankers, 3 LR2 tankers and 1 Aframax tanker to their estimated fair values, using appraised values provided by third parties, primarily due to a weaker near-term tanker market outlook and a reduction in charter rates as a result of the current economic environment, which has been impacted by the COVID-19 global pandemic.
(3)As at June 30, 2021, Teekay Tankers classified 1 Aframax tanker, including its related bunkers and lube oil inventory, as held for sale. The vessel cost was written down to its estimated sales price, less estimated selling costs.
(4)On April 30, 2020, Teekay Tankers completed the sale of the non-US portion of its ship-to-ship support services business as well as its LNG terminal management business for proceeds of $27.1 million, including an adjustment of $1.1 million for the final amounts of cash and other working capital present on the closing date. $14.3 million of the total proceeds were received on closing and the remaining $12.7 million was received in July 2020.
(5)During the first quarter of 2020, the carrying values for 6 of Teekay LNG's 7 wholly-owned multi-gas carriers were written down to their estimated fair values, using appraised values, primarily due to the lower near-term outlook for these type of vessels as a result of the economic environment at that time (including the economic impact of the COVID-19 global pandemic), as well as Teekay LNG receiving notification that its then-existing commercial management agreement with a third-party commercial manager would dissolve and be replaced by a new commercial management agreement in September 2020.
14. Related Party Transactions
The Company provides ship management and corporate services to certain of its equity-accounted joint ventures that own and operate LNG carriers on long-term charters. In addition, the Company is reimbursed for costs incurred by the Company for its seafarers operating these LNG carriers. During the three and six months ended June 30, 2021, the Company earned $20.9 million and $40.7 million (three and six months ended June 30, 2020 – $19.9 million and $37.4 million) of fees pursuant to these management agreements and reimbursement of costs.
Page 27
TEEKAY CORPORATION AND SUBSIDIARIES
NOTES TO THE UNAUDITED CONSOLIDATED FINANCIAL STATEMENTS
(all tabular amounts stated in thousands of U.S. Dollars, other than share and per share data)
In September 2018, Teekay LNG entered into an agreement with its 52%-owned joint venture with Marubeni Corporation (or the MALT Joint Venture) to charter in one of the MALT Joint Venture's LNG carriers, the Magellan Spirit, which charter had an original term of two years and was further extended by 21 months to June 2022. Time-charter hire expenses for the three and six months ended June 30, 2021 were $5.9 million and $11.7 million (three and six months ended June 30, 2020 – $5.4 million and $11.3 million).
On May 11, 2020, Teekay and Teekay LNG agreed to eliminate all of Teekay LNG's incentive distribution rights, which were held by Teekay GP LLC, in exchange for the issuance to a subsidiary of Teekay Corporation of 10.75 million newly-issued common units of Teekay LNG. The common units were valued at $122.6 million, based on the prevailing unit price at the time of issuance. As a result of the share issuance of Teekay LNG, the Company recorded a decrease to accumulated deficit of $116.6 million and an increase to accumulated other comprehensive loss of $9.0 million with a corresponding decrease in non-controlling interests of $107.6 million. The $116.6 million represents Teekay’s dilution gain from the issuance of new common units by Teekay LNG and is credited directly to equity, and the $9.0 million represents the change in Teekay's interest in Teekay LNG's accumulated other comprehensive loss.
15. Restructuring Charges
During the six months ended June 30, 2021, the Company recorded restructuring charges of $0.3 million. The restructuring charges primarily related to severance costs resulting from the reorganization and realignment of resources of the Company's shared service function.
During the three and six months ended June 30, 2020, the Company recorded restructuring charges of $4.6 million and $7.0 million, respectively. The restructuring charges primarily related to severance costs resulting from the expected termination of the management contract for an FSO unit based in Australia; the severance costs were partially recovered from the customer and the recovery is included in revenues. Restructuring costs also included severance costs resulting from the reorganization and realignment of resources of the Company's shared service function of which a portion of the costs were recovered from the customer, Altera, and the recovery is presented in revenue. The 2020 restructuring charges also related to the termination of the contract for the Banff FPSO.
At June 30, 2021 and December 31, 2020, $0.9 million and $2.4 million, respectively, of restructuring liabilities were recorded in accrued liabilities and other on the unaudited consolidated balance sheets.
16. Accumulated Other Comprehensive Loss
As at June 30, 2021 and December 31, 2020, the Company’s accumulated other comprehensive loss consisted of the following components:
| June 30, | December 31, | ||||||||||
| 2021 | 2020 | ||||||||||
| $ | $ | ||||||||||
| Unrealized loss on qualifying cash flow hedging instruments | (30,617) | (44,006) | |||||||||
| Pension adjustments, net of tax recoveries | (5,147) | (4,877) | |||||||||
| (35,764) | (48,883) | ||||||||||
17. Capital Stock
The authorized capital stock of Teekay at June 30, 2021 and December 31, 2020 was 25 million shares of preferred stock, with a par value of $1 per share, and 725 million shares of common stock, with a par value of $0.001 per share. As at June 30, 2021, Teekay had 0 shares of preferred stock issued.
In December 2020, Teekay filed a continuous offering program (or COP) under which Teekay may issue shares of its common stock at market prices up to a maximum aggregate amount of $65.0 million. As of June 30, 2021, 0 shares of common stock have been issued under this COP.
Page 28
TEEKAY CORPORATION AND SUBSIDIARIES
NOTES TO THE UNAUDITED CONSOLIDATED FINANCIAL STATEMENTS
(all tabular amounts stated in thousands of U.S. Dollars, other than share and per share data)
18. Net (Loss) Income Per Share
| Three Months Ended June 30, | Six Months Ended June 30, | ||||||||||||||||||||||
| 2021 | 2020 | 2021 | 2020 | ||||||||||||||||||||
| $ | $ | $ | $ | ||||||||||||||||||||
Net (loss) income attributable to the shareholders of Teekay Corporation - basic | (1,844) | 21,723 | 28,107 | (28,082) | |||||||||||||||||||
Increase in net earnings for interest expense recognized during the period relating to Convertible Notes | 0 | 0 | 3,188 | 0 | |||||||||||||||||||
Reduction in net earnings due to dilutive impact of stock- based awards in Teekay LNG and Teekay Tankers | 0 | 0 | (87) | 0 | |||||||||||||||||||
Net (loss) income attributable to the shareholders of Teekay Corporation - diluted | (1,844) | 21,723 | 31,208 | (28,082) | |||||||||||||||||||
| Weighted average number of common shares | 101,330,151 | 101,107,362 | 101,248,493 | 100,997,456 | |||||||||||||||||||
| Dilutive effect of Convertible Notes | 0 | 0 | 9,588,378 | 0 | |||||||||||||||||||
| Dilutive effect of stock-based awards | 0 | 89,021 | 724,801 | 0 | |||||||||||||||||||
| Common stock and common stock equivalents | 101,330,151 | 101,196,383 | 111,561,672 | 100,997,456 | |||||||||||||||||||
| Income (loss) per common share | |||||||||||||||||||||||
| - Basic | (0.02) | 0.21 | 0.28 | (0.28) | |||||||||||||||||||
| - Diluted | (0.02) | 0.21 | 0.28 | (0.28) | |||||||||||||||||||
Prior to January 1, 2021, the Company used the treasury stock method to determine the dilutive impact of the Convertible Notes (see Note 9) when calculating diluted earnings per share. Upon adoption of ASU 2020-06 on January 1, 2021, the Company changed to the if-converted method to determine any potential dilutive impact of the Convertible Notes on diluted earnings per share (see Note 2). The dilutive impact of the conversion feature on the Convertible Notes is determined using an assumed conversion date equal to the beginning of the reporting period.
Stock-based awards and the conversion feature on the Convertible Notes that have an anti-dilutive effect on the calculation of diluted loss per common share are excluded from this calculation. For both the three and six months ended June 30, 2021, 5.5 million shares of Common Stock from stock-based awards and the conversion feature on the Convertible Notes (three and six months ended June 30, 2020 - 6.0 million) were excluded from the computation of diluted earnings per common share for these periods, as including them would have had an anti-dilutive impact.
19. Supplemental Cash Flow Information
Total cash, cash equivalents, restricted cash, and cash and restricted cash held for sale are as follows:
| June 30, 2021 | December 31, 2020 | June 30, 2020 | December 31, 2019 | ||||||||||||||||||||
| $ | $ | $ | $ | ||||||||||||||||||||
| Cash and cash equivalents | 258,351 | 348,785 | 461,152 | 353,241 | |||||||||||||||||||
| Restricted cash – current | 11,380 | 11,144 | 16,317 | 56,777 | |||||||||||||||||||
| Restricted cash – non-current | 40,521 | 45,961 | 61,948 | 44,849 | |||||||||||||||||||
| Assets held for sale – cash | 0 | 0 | 0 | 1,121 | |||||||||||||||||||
| Assets held for sale – restricted cash | 0 | 0 | 0 | 337 | |||||||||||||||||||
| 310,252 | 405,890 | 539,417 | 456,325 | ||||||||||||||||||||
The Company maintains restricted cash deposits relating to certain term loans, collateral for cross currency swaps (see Note 10), performance bond collateral, leasing arrangements, project tenders and amounts received from charterers to be used only for dry-docking expenditures and emergency repairs.
Page 29
ITEM 2 – MANAGEMENT’S DISCUSSION AND ANALYSIS OF FINANCIAL CONDITION AND RESULTS OF OPERATIONS
The following Management’s Discussion and Analysis of Financial Condition and Results of Operations should be read in conjunction with the unaudited consolidated financial statements and accompanying notes contained in “Item 1 – Financial Statements” of this Report on Form 6-K and with our audited consolidated financial statements contained in “Item 18 – Financial Statements” and with Management’s Discussion and Analysis of Financial Condition and Results of Operations in “Item 5 – Operating and Financial Review and Prospects” in our Annual Report on Form 20-F for the year ended December 31, 2020. Included in our Annual Report on Form 20-F is important information about items that you should consider when evaluating our results, including an explanation of our organizational structure, information about the types of contracts we enter into and certain non-GAAP measures we utilize to measure our performance. Unless otherwise indicated, references in this Report to “Teekay,” the “Company,” “we,” “us” and “our” and similar terms refer to Teekay Corporation and its subsidiaries.
Overview
Teekay Corporation (or Teekay) is an operational leader and project developer in the marine midstream space. Teekay provides a comprehensive set of marine services to the world's leading oil and gas companies. We have a 100% general partnership interest in one publicly-listed master limited partnership, Teekay LNG Partners L.P. (or Teekay LNG), a controlling interest in publicly-listed Teekay Tankers Ltd. (or Teekay Tankers, and together with Teekay LNG, the Daughter Entities), and we directly own two floating production storage and offloading (or FPSO) units. Teekay and its subsidiaries, other than Teekay LNG and Teekay Tankers, are referred to herein as Teekay Parent. As of June 30, 2021, we had economic interests in Teekay LNG and Teekay Tankers of 42.4% and 28.6%, respectively. In addition to Teekay Parent’s investments in Teekay LNG and Teekay Tankers, Teekay Parent conducts business in Australia through the provision of operational and maintenance marine services, and provides marine and corporate services to Teekay LNG (and certain of its joint ventures) and to Teekay Tankers.
ITEMS YOU SHOULD CONSIDER WHEN EVALUATING OUR RESULTS
There are a number of factors that should be considered when evaluating our historical financial performance and assessing our future prospects and we use a variety of financial and operational terms and concepts when analyzing our results of operations. These items can be found in "Item 5 – Operating and Financial Review and Prospects” in our Annual Report on Form 20-F for the year ended December 31, 2020.
Novel Coronavirus (COVID-19) Pandemic
Although global demand for LNG and LPG has remained relatively stable, the COVID-19 global pandemic has resulted and may continue to result in a significant decline in global demand for crude oil, and may result in reduced demand for LNG and LPG in the future. As our business includes the transportation of LNG, LPG and oil on behalf of our customers, any significant decrease in demand for the cargo we transport could adversely affect demand for our vessels and services.
To date, we have not experienced any material business interruptions as a result of the COVID-19 global pandemic. However, COVID-19 has been a contributing factor to the decline in spot and short-term time charter rates in our oil tanker business since mid-May 2020 and has also increased certain crewing-related costs, which has had an impact on our cash flows. During the three and six months ended June 30, 2021, COVID-19 was a contributing factor to the non-cash write-down of certain tankers of Teekay Tankers and was a contributing factor to the non-cash write-down of six of Teekay LNG's multi-gas vessels and one of our FPSO units during the six months ended June 30, 2020, as described in "Item 1 - Financial Statements: Note 13 - (Write-down) and Gain (Loss) on Sale ". We continue to monitor the potential impact of the COVID-19 global pandemic on us and our industry, including counterparty risk associated with our vessels under contract and monitoring the impact on potential vessel impairments. We have also introduced a number of measures to protect the health and safety of the crews on our vessels and our onshore staff.
Effects of the COVID-19 global pandemic may include, among others: deterioration of worldwide, regional or national economic conditions and activity and of demand for LNG, LPG and oil; operational disruptions to us or our customers due to worker health risks and the effects of new regulations, directives or practices implemented in response to the pandemic (such as travel restrictions for individuals and vessels and quarantining and physical distancing); potential delays in (a) the loading and discharging of cargo on or from our vessels, (b) vessel inspections and related certifications by class societies, customers or government agencies, (c) maintenance, modifications or repairs to, or drydocking of, our existing vessels due to worker health or other business disruptions, and (d) the timing of crew changes; reduced cash flow and financial condition, including potential liquidity constraints; potential reduced access to capital as a result of any credit tightening generally or due to continued declines in global financial markets; potential reduced ability to opportunistically sell any of our vessels on the second-hand market, either as a result of a lack of buyers or a general decline in the value of second-hand vessels; potential decreases in the market values of our vessels and any related impairment charges or breaches relating to vessel-to-loan financial covenants; potential disruptions, delays or cancellations in the construction of new LNG projects (including production, liquefaction, regasification, storage and distribution facilities), which could reduce our future growth opportunities; and potential deterioration in the financial condition and prospects of our customers or business partners.
Given the dynamic nature of the pandemic, including the development of variants of the virus, the duration of any potential business disruption and the related financial impact, and the effects on us and our suppliers, customers and industry, cannot be reasonably estimated at this time and could materially affect our business, results of operations and financial condition. Please read “Item 3. Key Information - Risk Factors” in
Page 30
our Annual Report on Form 20-F for the year ended December 31, 2020 for additional information about the potential risks of COVID-19 on our business.
RECENT DEVELOPMENTS AND RESULTS OF OPERATIONS
The following table (a) presents revenues and (loss) income from vessel operations for Teekay LNG, Teekay Tankers and Teekay Parent, and (b) reconciles these amounts to our unaudited consolidated financial statements. Please read "Item 1 – Financial Statements: Note 4 – Segment Reporting" for information about our lines of business and segments.
| Revenues | (Loss) Income from Vessel Operations | ||||||||||||||||||||||||||||||||||||||||||||||
| Three Months Ended | Six Months Ended | Three Months Ended | Six Months Ended | ||||||||||||||||||||||||||||||||||||||||||||
| June 30, | June 30, | June 30, | June 30, | ||||||||||||||||||||||||||||||||||||||||||||
| (in thousands of U.S. dollars) | 2021 | 2020 | 2021 | 2020 | 2021 | 2020 | 2021 | 2020 | |||||||||||||||||||||||||||||||||||||||
| Teekay LNG | 148,769 | 148,205 | 301,571 | 288,092 | 64,736 | 69,589 | 135,347 | 91,327 | |||||||||||||||||||||||||||||||||||||||
| Teekay Tankers | 123,420 | 246,492 | 266,169 | 588,392 | (119,434) | 92,986 | (131,277) | 213,112 | |||||||||||||||||||||||||||||||||||||||
| Teekay Parent | 53,291 | 88,108 | 116,821 | 180,375 | 27,578 | (14,071) | 30,137 | (27,039) | |||||||||||||||||||||||||||||||||||||||
| Teekay Corporation Consolidated | 325,480 | 482,805 | 684,561 | 1,056,859 | (27,120) | 148,504 | 34,207 | 277,400 | |||||||||||||||||||||||||||||||||||||||
SUMMARY
Teekay's consolidated income from vessel operations decreased to $34.2 million for the six months ended June 30, 2021 compared to $277.4 million for the same period last year. The primary reasons for this decrease in our consolidated results are as follows:
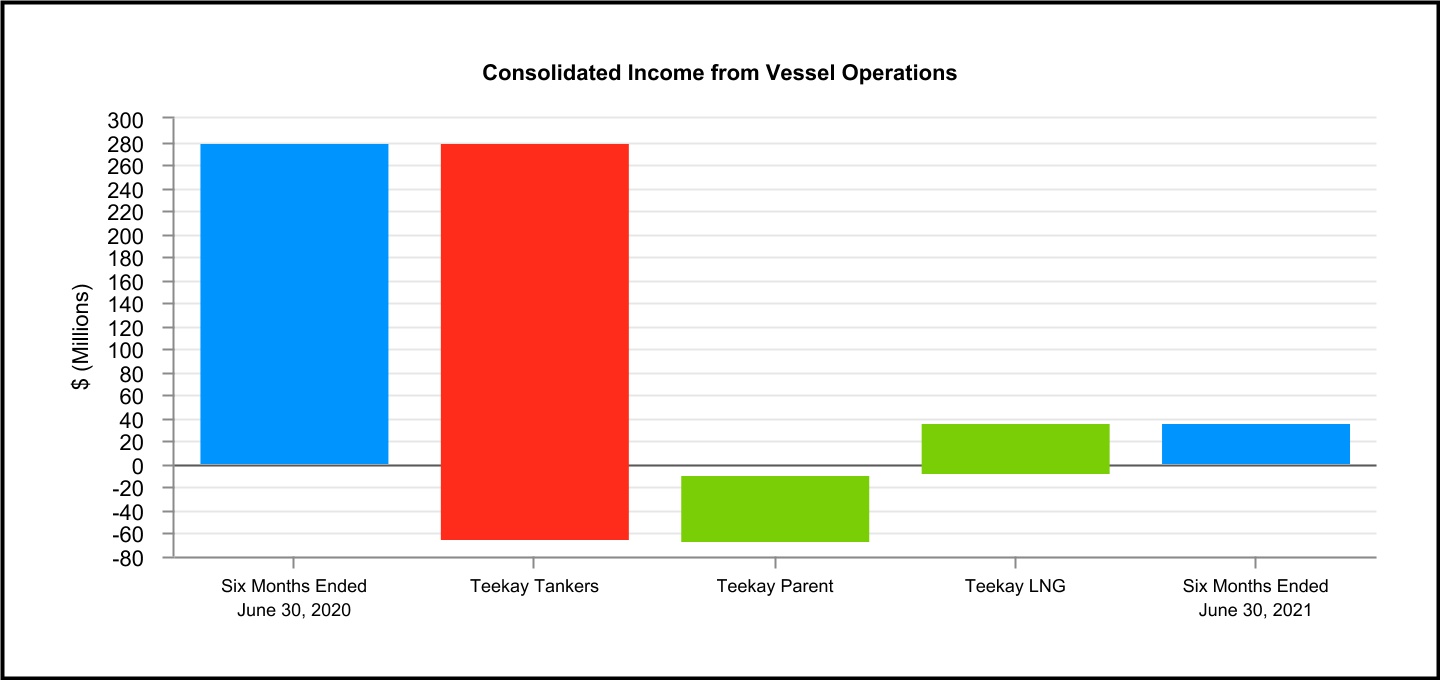
•a decrease in income from vessel operations in Teekay Tankers of $344.4 million, primarily due to a decrease of $190.5 million as a result of lower overall average realized spot TCE rates earned by its Suezmax, Aframax and LR2 product tankers and lower earnings from Teekay Tankers' full service lightering (or FSL) dedicated vessels compared to the same period in the prior year, a decrease of $86.7 million due to an increase in vessel write-downs compared to the same period in the prior year, and a decrease of $41.1 million due to various vessels on time-charter out contracts earning lower fixed rates compared to the spot rates realized during the first half of 2020, and various vessels returning from time-charter out contracts earning lower spot rates during the first half of 2021 compared to previous fixed rates;
partially offset by:
Page 31
•an increase in income from vessel operations in Teekay Parent of $57.2 million primarily due to a gain of $33.0 million on the extinguishment of the asset retirement obligation (or ARO) relating to the Petrojarl Banff FPSO unit in the second quarter of 2021, and impairment charges of $60.1 million recognized in the first half of 2020, partially offset by a gain of $44.9 million on commencement of a sales-type lease related to the Petrojarl Foinaven FPSO unit in the first quarter of 2020; and
•an increase in income from vessel operations in Teekay LNG of $44.0 million primarily due to a $45.0 million write-down of six multi-gas carriers during the first quarter of 2020.
Teekay LNG
As at June 30, 2021, Teekay LNG’s liquefied gas fleet consisted of a controlling interest in 22 LNG carriers and seven multi-gas carriers. In addition, Teekay LNG has interests ranging from 20% to 52% in 25 LNG carriers, 23 LPG carriers and one LNG regasification terminal in Bahrain that are accounted for using the equity method.
Recent Developments in Teekay LNG
In April 2021, Teekay LNG secured a one-year, fixed-rate charter contract for the Oak Spirit LNG carrier, which commenced in August 2021.
In March 2021, Teekay LNG secured a one-year, spot market-linked charter contract, with a one-year extension option at a fixed rate for the Creole Spirit LNG carrier, which commenced in March 2021.
In March 2021, the charterer of the Arwa Spirit exercised its one-year option to extend the charter contract to May 2022 at a fixed-rate. In addition, in April 2021 the Methane Spirit commenced a two-year, fixed-rate charter contract, with a one-year extension option. Teekay LNG has a 52% interest in both of these vessels.
Operating Results – Teekay LNG
The following table compares Teekay LNG’s operating results, equity income and number of calendar-ship-days for its vessels for the three and six months ended June 30, 2021 and 2020. Please read "Item 1 – Financial Statements: Note 4 – Segment Reporting" for information about our lines of business and segments.
| (in thousands of U.S. Dollars, except calendar-ship-days) | Three Months Ended June 30, | Six Months Ended June 30, | |||||||||||||||||||||
| 2021 | 2020 | 2021 | 2020 | ||||||||||||||||||||
| Revenues | 148,769 | 148,205 | 301,571 | 288,092 | |||||||||||||||||||
| Voyage expenses | (6,360) | (5,329) | (13,543) | (7,646) | |||||||||||||||||||
| Vessel operating expenses | (32,536) | (28,407) | (62,625) | (54,511) | |||||||||||||||||||
| Time-charter hire expenses | (5,867) | (5,368) | (11,717) | (11,290) | |||||||||||||||||||
| Depreciation and amortization | (32,349) | (31,629) | (64,251) | (64,268) | |||||||||||||||||||
General and administrative expenses (1) | (6,921) | (7,883) | (14,088) | (14,050) | |||||||||||||||||||
| Write-down of vessels | — | — | — | (45,000) | |||||||||||||||||||
| Income from vessel operations | 64,736 | 69,589 | 135,347 | 91,327 | |||||||||||||||||||
| Equity Income – Liquefied Gas Carriers | 28,940 | 32,155 | 66,456 | 32,528 | |||||||||||||||||||
Calendar-Ship-Days (2) | |||||||||||||||||||||||
| Liquefied Gas Carriers | 2,730 | 2,730 | 5,430 | 5,470 | |||||||||||||||||||
(1)Includes direct general and administrative expenses and indirect general and administrative expenses (allocated to each of Teekay LNG's segments based on estimated use of resources).
(2)Calendar-ship-days presented relate to consolidated vessels.
Income from vessel operations for Teekay LNG decreased to $64.7 million for the three months ended June 30, 2021, compared to $69.6 million for the same period in the prior year, and increased to $135.3 million for the six months ended June 30, 2021, compared to $91.3 million for the same period in the prior year, primarily as a result of:
•decreases of $3.0 million and $7.0 million for the three and six months ended June 30, 2021, respectively, primarily due to timing of repairs and maintenance expenditures incurred;
•decreases of $3.3 million and $5.2 million for the three and six months ended June 30, 2021, respectively, due to off-hire days for the scheduled dry docking of two LNG carriers during 2021; and
Page 32
•decreases of $2.5 million and $3.7 million for the three and six months ended June 30, 2021, respectively, due to the redelivery of the Creole Spirit LNG carrier and this vessel earning a lower rate upon redeployment in March 2021;
offset by:
•increases of $0.6 million and $0.9 million for the three and six months ended June 30, 2021, respectively, primarily due to higher charter rates earned on Teekay LNG's LPG carriers, partially offset by unscheduled off-hire days for certain multi-gas carriers due to repairs;
•increases of $2.2 million and $11.5 million for the three and six months ended June 30, 2021, respectively, due to lower operational claims on certain LNG and LPG carriers; and
•an increase of $45.0 million for the six months ended June 30, 2021, due to the write-down of six multi-gas carriers during the first quarter of 2020, partly as a result of the economic environment at that time (including the economic impact of the COVID-19 global pandemic).
Equity income related to Teekay LNG’s liquefied gas carriers decreased to $28.9 million for the three months ended June 30, 2021, compared to $32.2 million for the same period in the prior year, and increased to $66.5 million for the six months ended June 30, 2021, compared to equity income of $32.5 million for the same period in the prior year. The changes were primarily as a result of:
•decreases of $1.9 million and $5.4 million for the three and six months ended June 30, 2021, respectively, primarily due to lower charter rates earned upon redeployment of the Marib Spirit, Arwa Spirit and Methane Spirit between May 2020 and April 2021 in Teekay LNG's 52%-owned joint venture with Marubeni Corporation (or the MALT Joint Venture); and
•decreases of $1.4 million and $4.5 million for the three and six months ended June 30, 2021, respectively, due to off-hire for scheduled dry docking and unscheduled off-hire for repairs of certain of its equity-accounted LPG carriers in Teekay LNG's 50%-owned joint venture with Exmar NV (or the Exmar LPG Joint Venture) for the three months ended June 30, 2021, and unscheduled off-hire for repairs on certain of Teekay LNG's equity-accounted LNG carriers in its 50%-owned joint venture with China LNG Shipping (Holdings) Limited (or the Yamal LNG Joint Venture) for the six months ended June 30, 2021;
offset by:
•increases of $1.5 million and $39.1 million for the three and six months ended June 30, 2021, respectively, due to unrealized gains on non-designated interest rate swaps due to an increase in long-term forward LIBOR benchmark interest rates, compared to unrealized losses in the same period of the prior year; and
•an increase of $3.1 million for the six months ended June 30, 2021 due to higher rates earned on certain LPG carriers in the Exmar LPG Joint Venture.
Teekay Tankers
As at June 30, 2021, Teekay Tankers owned 50 double-hulled conventional oil and product tankers, time-chartered-in one Aframax tanker and owned a 50% interest in one Very Large Crude Carrier (or VLCC).
Recent Developments in Teekay Tankers
In June 2021 and July 2021, Teekay Tankers entered into time charter-in contracts for a LR2 product tanker and an Aframax tanker, and entered into a new time charter-in contract for an existing time chartered-in Aframax tanker, for terms of 18 to 24 months at an average rate of $17,800 per day. Each of the charters provides Teekay Tankers with the option to extend for an additional 12 months at an average rate of $19,800 per day. The new time charter-in contract for the existing time chartered-in Aframax tanker will commence in August 2021. The LR2 product tanker is expected to be delivered to Teekay Tankers in September 2021 and the Aframax tanker is expected to be delivered to Teekay Tankers in the fourth quarter of 2021 or the first quarter of 2022.
In February 2021, Teekay Tankers agreed to sell two Aframax tankers for a combined sales price of $32.0 million. Both tankers were delivered to their new owners in March 2021.
Page 33
Operating Results – Teekay Tankers
The following table compares Teekay Tankers’ operating results, equity income and number of calendar-ship-days for its vessels for the three and six months ended June 30, 2021 and 2020.
| (in thousands of U.S. Dollars, except calendar-ship-days) | Three Months Ended | Six Months Ended | |||||||||||||||||||||
| June 30, | June 30, | ||||||||||||||||||||||
| 2021 | 2020 | 2021 | 2020 | ||||||||||||||||||||
| Revenues | 123,420 | 246,492 | 266,169 | 588,392 | |||||||||||||||||||
| Voyage expenses | (71,773) | (61,558) | (140,818) | (180,799) | |||||||||||||||||||
| Vessel operating expenses | (43,129) | (46,218) | (86,177) | (96,867) | |||||||||||||||||||
| Time-charter hire expense | (2,138) | (9,296) | (5,768) | (19,175) | |||||||||||||||||||
| Depreciation and amortization | (26,895) | (29,546) | (53,579) | (59,178) | |||||||||||||||||||
| General and administrative | (12,233) | (9,784) | (23,703) | (19,070) | |||||||||||||||||||
| (Write-down) and gain (loss) on sale of assets | (86,686) | 2,896 | (87,401) | (191) | |||||||||||||||||||
| (Loss) income from vessel operations | (119,434) | 92,986 | (131,277) | 213,112 | |||||||||||||||||||
| Equity (loss) income | (829) | 3,188 | (1,188) | 5,128 | |||||||||||||||||||
Calendar-Ship-Days (1) | |||||||||||||||||||||||
| Conventional Tankers | 4,644 | 5,096 | 9,425 | 10,398 | |||||||||||||||||||
(1)Calendar-ship-days presented relate to owned and in-chartered consolidated vessels.
Tanker Market
Crude tanker spot rates remained very weak during the second quarter of 2021 as the COVID-19 global pandemic continued to weigh on the crude tanker market. Some of the main factors which negatively impacted spot tanker rates included:
a.Uneven oil demand recovery – According to the International Energy Agency (IEA), global oil demand increased by 1.1 million barrels per day (mb/d) during the second quarter of 2021. However, total oil demand of 94.6 mb/d was still significantly below pre-COVID-19 levels of approximately 100 mb/d. Furthermore, the recovery in oil demand has been very uneven across different geographies with a much stronger rebound in North America and Europe and a slower recovery in Asia, Latin America, and Africa. The slower pace of recovery in Asia is particularly problematic for the tanker market, as it is a large driver of tonne-mile demand. Crude oil imports into China were down 3% year-over-year through the first half of 2021, the first such decline since 2013.
b.Continued OPEC+ supply discipline – Global oil supply continues to be constrained by OPEC+ production cuts, with global oil production of 94.5 mb/d in the second quarter of 2021 versus approximately 100 mb/d prior to the pandemic. The OPEC+ group did start to increase supply from May 2021 onwards, in line with their earlier pledge to raise production by 2.1 mb/d between May and August 2021. However, this did not translate fully into an increase in crude oil exports due to higher domestic oil consumption for power generation, particularly in Saudi Arabia.
c.Decline in long-haul crude oil movements – A widening spread between the price of Brent and Dubai crude oil meant that Atlantic basin crude oil became less attractive to Asian buyers. This led to a decrease in long-haul movement from the Atlantic-to-Pacific during the second quarter of 2021 with Asian buyers targeting Middle Eastern crude instead. This led to a drop in average voyage distances which was negative for crude tanker tonne-mile demand.
d.Front heavy newbuild delivery schedule – The global newbuilding delivery schedule for 2021 is heavily weighted to the first half of the year, which has led to a relatively large number of new tanker deliveries in the past six months. In the Suezmax sector, 20 of the 22 newbuildings set to deliver in 2021 have already been delivered. This has led to an increase in available fleet supply and therefore lower fleet utilization.
e.Higher bunker prices – An increase in crude oil prices has led to higher bunker costs, which weighed on tanker spot earnings during the second quarter of 2021.
Looking ahead, Teekay Tankers is encouraged by tanker supply and demand indicators which they believe point towards a market recovery in the coming quarters. According to the IEA, global oil demand is expected to increase from 94.7 mb/d in the second quarter of 2021 to 99.4 mb/d by the fourth quarter of 2021, taking oil demand close to pre-COVID-19 levels by the end of 2021. This steep increase in demand should spur an oil supply response from both OPEC and non-OPEC producers, particularly with global oil inventories now sitting below five-year average
Page 34
levels. The OPEC+ group has recognized that more oil is needed, and has pledged to increase production by 2 mb/d between August and December 2021 at an even rate of 0.4 mb/d per month. Global oil demand is projected to grow by a further 3.1 mb/d next year and OPEC+ has announced that it will gradually phase out its remaining supply cuts by September 2022 in order to meet this additional demand. The return of OPEC+ production, coupled with a projected increase in non-OPEC supply of 2.2 mb/d in the second half of 2021 and a further 1.8 mb/d in 2022, should lead to a significant increase in crude tanker demand in the coming quarters which is expected to help drive an increase in fleet utilization and therefore rates.
Fleet supply fundamentals continue to look very positive. The tanker orderbook remains relatively low at approximately 8 percent of the existing fleet size, which is largely unchanged from last quarter. Tanker newbuild ordering slowed considerably during the second quarter of 2021, mainly due to a rapid increase in newbuilding prices. Rising newbuild prices were the result of higher steel costs and a record amount of containership ordering that has soaked up shipyard capacity through 2023 and into 2024. With newbuilding prices continuing to rise, Teekay Tankers expects that the level of newbuild ordering will remain relatively low in the near-term. Higher steel prices have also led to an increase in tanker scrap values, which are currently at a 10-year high. This has led to an increase in tanker scrapping, with 6.6 million deadweight tons (mdwt) removed in 2021 year-to-date versus 3.5 mdwt and 3.4 mdwt in all of 2020 and 2019, respectively, and on an annualized basis, is also running ahead of the 20-year historical average of 9 mdwt per year. The combination of a relatively small tanker orderbook, low levels of new tanker orders, and increased scrapping are expected to keep tanker fleet growth at relatively low levels over the next two to three years.
In summary, the tanker market continues to be severely impacted by the effects of COVID-19 on tanker demand. However, the projected increase in both oil demand and supply, coupled with positive fleet supply fundamentals, point towards an improvement in crude spot tanker rates over the coming quarters.
(Loss) income from vessel operations for Teekay Tankers was a loss of ($119.4) million and ($131.3) million, for the three and six months ended June 30, 2021, respectively, compared to income of $93.0 million and $213.1 million for the same periods in the prior year, primarily as a result of:
•decreases of $86.8 million and $190.5 million for the three and six months ended June 30, 2021, respectively, due to lower overall average realized spot TCE rates earned during the first half of 2021 by Suezmax tankers, Aframax tankers and LR2 product tankers, as well as lower earnings from FSL dedicated vessels;
•a decrease of $86.7 million for the three and six months ended June 30, 2021 due to an increase in write-downs related to the write-down of one tanker that is held for sale at June 30, 2021 and the impairment of seven tankers and one right-of-use asset in the first half of 2021 due to the lower near-term tanker market outlook and a reduction of charter rates as a result of the current economic environment, compared to the impairment of four right-of-use assets during the first half of the prior year;
•net decreases of $24.3 million and $41.1 million for the three and six months ended June 30, 2021, respectively, due to various vessels on time-charter out contracts earning lower fixed rates compared to the spot rates realized during the first half of 2020 and various vessels returning from time-charter out contracts earning lower spot rates during the first half of 2021 compared to previous fixed rates;
•decreases of $9.8 million and $12.1 million for the three and six months ended June 30, 2021, respectively, due to more off-hire days and off-hire bunker expenses during the first half of 2021 primarily related to increased scheduled dry dockings compared to the same periods in the prior year;
•decreases of $2.5 million and $7.2 million for the three and six months ended June 30, 2021, respectively, due to the sale of three Suezmax tankers in the first quarter of 2020 and two Aframax tankers in the first quarter of 2021; and
•decreases of $2.1 million and $5.8 million for the three and six months ended June 30, 2021, respectively, due to the redeliveries of three Aframax in-chartered tankers and two LR2 product tankers to their owners at various times during 2020 and the first quarter of 2021.
Teekay Parent
As at June 30, 2021, Teekay Parent had direct interests in two 100%-owned FPSO units, which are included in Teekay Parent’s Offshore Production business. Teekay Parent delivered one FPSO unit to a yard for recycling in May 2021. Included in Teekay Parent’s Other and Corporate G&A segment was one FSO unit in-chartered from Altera until March 1, 2021, when it was redelivered. Teekay Parent also redelivered one FSO unit to Altera in August 2020, one bunker barge to a third party in May 2020, and two shuttle tankers to Altera in March 2020. The remaining portion of the Other and Corporate G&A segment primarily relates to Teekay Parent's marine services business in Australia as well as marine and corporate services provided to Teekay LNG's equity-accounted joint ventures and Altera.
Recent Developments in Teekay Parent
In April 2021, Teekay Parent and CNR International (U.K.) Limited (or CNRI), on behalf of the Banff joint venture, entered into a Decommissioning Services Agreement (or DSA) whereby Teekay Parent engaged CNRI to assume full responsibility for Teekay’s remaining Phase 2 asset retirement obligation (or ARO), to decommission our remaining subsea infrastructure located within the CNRI-operated Banff field. The DSA was subject to certain conditions precedent that needed to be satisfied by June 1, 2021 (or any agreed extension thereto) failing which the DSA could have been terminated by either party. On May 27, 2021, all conditions precedent of the DSA that needed to be satisfied by June 1, 2021, were met. As such, Teekay was deemed to have fulfilled all of its prior decommissioning obligations associated with the Banff field and we derecognized the ARO and its associated receivable, resulting in a $33.0 million gain.
Page 35
CNRI has extensive historical experience in decommissioning subsea assets and has other equipment at the Banff field that also require decommissioning over a longer decommissioning period. As such, we expect CNRI may be able to achieve significant cost synergies in decommissioning all equipment concurrently and potentially at better pricing from sub-suppliers compared to Teekay Parent.
In April 2021, BP plc announced its decision to suspend production from the Foinaven oil fields and permanently remove the Petrojarl Foinaven FPSO unit from the site. We currently expect the FPSO unit will be redelivered to Teekay Parent earlier than expected in the third quarter of 2022, at which point we intend to green-recycle the FPSO unit. Although we have not changed our cost estimate to recycle the Petrojarl Foinaven FPSO unit, during the three months ended June 30, 2021, we increased the present value of the estimated ARO liability relating to the FPSO unit by $2.7 million as a result of the earlier than expected redelivery of the FPSO unit.
Operating Results – Teekay Parent
The following tables compare Teekay Parent’s operating results, and the number of calendar-ship-days for its vessels for the three and six months ended June 30, 2021 and 2020.
| (in thousands of U.S. Dollars, except calendar-ship-days) | Offshore | Other and | Teekay Parent | ||||||||||||||||||||||||||||||||
| Production | Corporate G&A | Total | |||||||||||||||||||||||||||||||||
| Three Months Ended June 30, | |||||||||||||||||||||||||||||||||||
| 2021 | 2020 | 2021 | 2020 | 2021 | 2020 | ||||||||||||||||||||||||||||||
| Revenues | 12,290 | 28,787 | 41,001 | 59,321 | 53,291 | 88,108 | |||||||||||||||||||||||||||||
| Voyage expenses | — | (9) | 5 | — | 5 | (9) | |||||||||||||||||||||||||||||
| Vessel operating expenses | (14,263) | (24,404) | (40,639) | (48,767) | (54,902) | (73,171) | |||||||||||||||||||||||||||||
| Time-charter hire expenses | — | (20) | — | (3,030) | — | (3,050) | |||||||||||||||||||||||||||||
| Depreciation and amortization | — | (1,761) | — | — | — | (1,761) | |||||||||||||||||||||||||||||
General and administrative expenses (1) | (434) | (578) | (3,332) | (5,423) | (3,766) | (6,001) | |||||||||||||||||||||||||||||
| (Write-down) and gain (loss) on sale | — | (13,565) | — | — | — | (13,565) | |||||||||||||||||||||||||||||
| Asset retirement obligation extinguishment gain | 32,950 | — | — | — | 32,950 | — | |||||||||||||||||||||||||||||
| Restructuring charges | — | 10 | — | (4,632) | — | (4,622) | |||||||||||||||||||||||||||||
| Income (loss) from vessel operations | 30,543 | (11,540) | (2,965) | (2,531) | 27,578 | (14,071) | |||||||||||||||||||||||||||||
Calendar-Ship-Days (2) | |||||||||||||||||||||||||||||||||||
| FPSO Units | 239 | 273 | — | — | 239 | 273 | |||||||||||||||||||||||||||||
| FSO Units | — | 91 | — | 91 | — | 182 | |||||||||||||||||||||||||||||
Page 36
| (in thousands of U.S. Dollars, except calendar-ship-days) | Offshore | Other and | Teekay Parent | ||||||||||||||||||||||||||||||||
| Production | Corporate G&A | Total | |||||||||||||||||||||||||||||||||
| Six Months Ended June 30, | |||||||||||||||||||||||||||||||||||
| 2021 | 2020 | 2021 | 2020 | 2021 | 2020 | ||||||||||||||||||||||||||||||
| Revenues | 23,107 | 74,720 | 93,714 | 105,655 | 116,821 | 180,375 | |||||||||||||||||||||||||||||
| Voyage expenses | — | (15) | 8 | — | 8 | (15) | |||||||||||||||||||||||||||||
| Vessel operating expenses | (22,814) | (60,674) | (87,388) | (89,037) | (110,202) | (149,711) | |||||||||||||||||||||||||||||
| Time-charter hire expenses | — | (7,970) | (1,641) | (6,335) | (1,641) | (14,305) | |||||||||||||||||||||||||||||
| Depreciation and amortization | — | (12,407) | — | — | — | (12,407) | |||||||||||||||||||||||||||||
General and administrative expenses (1) | (728) | (1,277) | (6,768) | (7,548) | (7,496) | (8,825) | |||||||||||||||||||||||||||||
| (Write-down) and gain (loss) on sale | — | (60,084) | — | — | — | (60,084) | |||||||||||||||||||||||||||||
| Asset retirement obligation extinguishment gain | 32,950 | — | — | — | 32,950 | — | |||||||||||||||||||||||||||||
| Gain on commencement of sales-type lease | — | 44,943 | — | — | — | 44,943 | |||||||||||||||||||||||||||||
| Restructuring charges | — | (1,044) | (303) | (5,966) | (303) | (7,010) | |||||||||||||||||||||||||||||
| Loss from vessel operations | 32,515 | (23,808) | (2,378) | (3,231) | 30,137 | (27,039) | |||||||||||||||||||||||||||||
Calendar-Ship-Days (2) | |||||||||||||||||||||||||||||||||||
| FPSO Units | 509 | 546 | — | — | 509 | 546 | |||||||||||||||||||||||||||||
| FSO Units | — | 182 | 59 | 182 | 59 | 364 | |||||||||||||||||||||||||||||
(1)Includes direct general and administrative expenses and indirect general and administrative expenses allocated to offshore production, and other and corporate G&A based on estimated use of corporate resources.
(2)Apart from three FPSO units (one of which was delivered for recycling in May 2021), all remaining calendar-ship-days presented relate to in-chartered vessels.
Teekay Parent – Offshore Production
Income from vessel operations for Teekay Parent’s Offshore Production business was $30.5 million and $32.5 million for the three and six months ended June 30, 2021, respectively, compared to loss from vessel operations of $11.5 million and $23.8 million for the same periods in the prior year. The changes are primarily a result of:
•increases of $46.5 million and $93.0 million for the three and six months ended June 30, 2021, respectively, due to a gain of $33.0 million from the derecognition of the ARO obligation relating to the Petrojarl Banff FPSO unit in the second quarter of 2021, compared to write-downs of $13.5 million and $60.1 million relating to Teekay Parent's FPSO units in the three and six months ended June 30, 2020, respectively.
partially offset by
•decreases of $5.4 million and $2.0 million for the three and six months ended June 30, 2021, respectively, related to the Petrojarl Banff FPSO unit, primarily due to higher decommissioning costs incurred in the second quarter of 2021, partially offset by a decrease in depreciation and restructuring charges compared to the first half of 2020;
•decreases of $0.1 million and $35.5 million for the three and six months ended June 30, 3021, respectively, related to the Petrojarl Foinaven FPSO unit, primarily due to a $44.9 million gain on commencement of a sales-type lease in the first quarter of 2020, partially offset by operational losses in the first quarter of 2020 associated with the previous charter agreement.
Teekay Parent – Other and Corporate G&A
Losses from vessel operations for Teekay Parent’s Other and Corporate G&A segment were $3.0 million and $2.4 million for the three and six months ended June 30, 2021, respectively, compared to losses from vessel operations of $2.5 million and $3.2 million in the same periods in the prior year. The decrease in loss for the six months ended June 30, 2021 was primarily related to a decrease in corporate expenses.
Page 37
Other Consolidated Operating Results
The following table compares our other consolidated operating results for the three and six months ended June 30, 2021 and 2020:
| Three Months Ended | Six Months Ended | ||||||||||||||||||||||
| June 30, | June 30, | ||||||||||||||||||||||
| (in thousands of U.S. dollars) | 2021 | 2020 | 2021 | 2020 | |||||||||||||||||||
| $ | $ | $ | $ | ||||||||||||||||||||
| Interest expense | (48,694) | (59,245) | (97,633) | (121,765) | |||||||||||||||||||
| Interest income | 1,336 | 2,314 | 3,381 | 5,117 | |||||||||||||||||||
| Realized and unrealized (losses) gains on non-designated derivative instruments | (3,389) | (9,270) | 3,932 | (30,933) | |||||||||||||||||||
| Foreign exchange (loss) gain | (3,413) | (8,922) | 2,310 | (2,276) | |||||||||||||||||||
| Other loss | (4,639) | (399) | (9,154) | (1,080) | |||||||||||||||||||
| Income tax recovery | 204 | 17,175 | 1,589 | 13,383 | |||||||||||||||||||
Interest Expense. Interest expense decreased to $48.7 million and $97.6 million for the three and six months ended June 30, 2021, respectively, from $59.2 million and $121.8 million for the same periods in the prior year, primarily due to:
•decreases of $5.0 million and $12.1 million for the three and six months ended June 30, 2021, respectively, relating to Teekay LNG, primarily due to lower debt balances as a result of debt repayments and a decrease in LIBOR for the three and six months ended June 30, 2021 compared to the same periods of the prior year;
•decreases of $4.2 million and $9.2 million for the three and six months ended June 30, 2021, respectively, relating to Teekay Tankers, primarily due to significant prepayments of loan principal during 2020, lower interest costs associated with the debt refinancings completed during 2020, overall lower average LIBOR rates, as well as lower interest associated with finance lease obligations resulting from the repurchase of two Aframax tankers and two Suezmax tankers, previously under sale-leaseback arrangements, during the fourth quarter of 2020 and second quarter of 2021, respectively; and
•decreases of $1.3 million and $2.8 million for the three and six months ended June 30, 2021, respectively, relating to Teekay Parent, primarily due to lower accretion expense incurred on Teekay's 5% Convertible Senior Notes (or Convertible Notes) as a result of the adoption of ASU 2020-06 on January 1, 2021 (see "Item 1 - Financial Statements Note 2: Recent Accounting Pronouncements" for further details), and lower debt balances primarily due to the repurchase of some of Teekay's 9.25% senior secured notes due November 2022 (or the 2022 Notes) and Convertible Notes during 2020.
Realized and unrealized (losses) gains on non-designated derivative instruments. For the six months ended June 30, 2021 and 2020, we had interest rate swap agreements with aggregate average net outstanding notional amounts of approximately $0.9 billion and $1.0 billion, respectively, with average fixed rates of approximately 2.5% and 3.1%, respectively. We incurred realized losses of $4.4 million and $27.3 million during the three and six months ended June 30, 2021, respectively, compared to realized losses of $3.9 million and $6.6 million for the same periods in the prior year under the interest rate swap agreements. The increase in realized losses for the six months ended June 30, 2021, is primarily due to the termination of the interest rate swap agreement associated with the debt refinancing in Teekay LNG's 70%-owned consolidated joint venture, TK BLT Corporation (or the Tangguh Joint Venture).
Primarily as a result of significant changes in the long-term benchmark interest rates during the three and six months ended June 30, 2021 compared with the same period in 2020, we recognized unrealized gains of $1.3 million and $31.6 million, respectively, under the interest rate swap agreements during the three and six months ended June 30, 2021, compared to unrealized losses of $5.3 million and $24.1 million for the same periods in the prior year.
Foreign Exchange (Loss) Gain. Foreign currency exchange (losses) gains were ($3.4) million and $2.3 million for the three and six months ended June 30, 2021, respectively, compared to losses of ($8.9) million and ($2.3) million for the same periods in the prior year. Our foreign currency exchange gains and losses, substantially all of which are unrealized, are primarily due to the relevant period-end revaluation of our Norwegian-Krone (or NOK)-denominated debt and our Euro-denominated term loans, finance lease and restricted cash for financial reporting purposes and the realized and unrealized (losses) gains on our cross currency swaps. Gains on NOK-denominated and Euro-denominated monetary liabilities reflect a stronger U.S. Dollar against the NOK and Euro on the date of revaluation or settlement compared to the rate in effect at the beginning of the period. Losses on NOK-denominated and Euro-denominated monetary liabilities reflect a weaker U.S. Dollar against the NOK and Euro on the date of revaluation or settlement compared to the rate in effect at the beginning of the period.
For the three and six months ended June 30, 2021, foreign currency exchange (losses) gains included realized losses of ($1.3) million and ($2.6) million, respectively, (2020 – losses of ($1.4) million and ($3.2) million) and unrealized (losses) gains of ($2.3) million and $2.9 million (2020 – gain of $12.1 million and loss of ($37.4) million) on our cross currency swaps, and unrealized gains of $2.2 million and $1.0 million, respectively, (2020 – unrealized loss of ($20.0) million and unrealized gain of $34.0 million, respectively) on the revaluation of our NOK-denominated debt.
Page 38
Other loss. Other loss increased to $4.6 million and $9.2 million for the three and six months ended June 30, 2021, compared to $0.4 million and $1.1 million for the same periods in the prior year. The changes for the periods were primarily due to an increase in the present value of the ARO liability related to the Petrojarl Foinaven FPSO unit as a result of the earlier than expected redelivery of the FPSO unit (see “Item 1 – Financial Statements: Note 7 – Accrued Liabilities and Other and Other Long-Term Liabilities”), changes in foreign exchange rates relating to accrued tax balances and the amortization of a previously deferred gain in prior periods, as well as an increase for the six months ended June 30, 2021 due to an increase in unrealized credit loss provision recorded in the first quarter of 2021 as a result of declines of estimated charter-free valuations of certain of our LNG vessels under time-charter contracts accounted for as direct financing leases, and the impact of such declines on our expectation of the value of the vessels upon completion of their existing charter contracts.
Income Tax Recovery. Income tax recoveries were $0.2 million and $1.6 million for the three and six months ended June 30, 2021, respectively, compared to tax recoveries of $17.2 million and $13.4 million for the same periods in the prior year. The changes were primarily due to decreases in freight tax accruals in the first half of 2020 as a result of an agreement with a tax authority, which was based in part on an initiative of the tax authority in response to the COVID-19 global pandemic and included the waiver of interest and penalties on unpaid taxes, as well as changes in vessel trading activities.
LIQUIDITY AND CAPITAL RESOURCES
Liquidity and Cash Needs
Teekay Corporation – Consolidated
Overall, our consolidated operations are capital intensive. We finance the purchase of vessels primarily through a combination of borrowings from commercial banks, the issuance of equity and debt securities (primarily by our Daughter Entities), through partnering with joint venture partners and cash generated from operations. In addition, we may use sale and leaseback arrangements as a source of long-term liquidity. We use certain of our revolving credit facilities to finance changes in working capital or other expenditures which may arise. As at June 30, 2021, Teekay Corporation’s total consolidated cash and cash equivalents was $258.4 million, compared to $348.8 million at December 31, 2020. Teekay Corporation’s total consolidated liquidity, including cash, cash equivalents, undrawn credit facilities and the undrawn portion of a loan, which is determined based on certain borrowing criteria to finance Teekay Tankers' pool management operations, was $0.8 billion as at June 30, 2021 compared to $1.0 billion as at December 31, 2020.
Our revolving credit facilities and term loans are described in “Item 1 – Financial Statements: Note 9 – Long-Term Debt.” They contain covenants and other restrictions typical of debt financing secured by vessels that restrict our ship-owning subsidiaries from, among other things: incurring or guaranteeing indebtedness; changing ownership or structure, including mergers, consolidations, liquidations and dissolutions; making dividends or distributions if we are in default; making capital expenditures in excess of specified levels; making certain negative pledges and granting certain liens; selling, transferring, assigning or conveying assets; making certain loans and investments; or entering into new lines of business.
Our long-term debt agreements generally provide for maintenance of minimum consolidated financial covenants and seven of our loan agreements require the maintenance of vessel market value to loan ratios. As at June 30, 2021, these ratios were 195%, 289%, 170%, 145%, 148% 400% and 137% compared to their minimum required ratios of 135%, 125%, 125%, 120%, 120% 115% and 110%, respectively. The vessel values used in these ratios are the appraised values provided by third parties where available or prepared by us based on second-hand sale and purchase market data. Changes in the LNG/LPG carrier or conventional tanker markets could negatively affect our compliance with these ratios.
The indenture that governs our 2022 Notes (further described in the Teekay Parent section below) contains covenants that, among other things, restrict our and the guarantors’ ability to: incur additional indebtedness and guarantee indebtedness; pay dividends or make other distributions or repurchase or redeem our equity interests; prepay, redeem or repurchase certain debt; issue certain preferred stock or similar equity securities; make investments; sell assets; incur liens, including the granting of any lien on any of the 2022 Note collateral, or further pledging any of the 2022 Note collateral as security, subject to permitted liens; enter into transactions with affiliates; and consolidate, merge or sell all or substantially all of our assets. The indenture also provides that under specific circumstances we may be required to offer to use all or a portion of the net proceeds of sales of our FPSO units or sales of Class B common stock of Teekay Tankers consummated prior to a specified date to repurchase 2022 Notes at a premium. The indenture further provides that we may be required, under certain circumstances, to offer to use all or a portion of the net proceeds of certain asset sales (other than a sale of an FPSO unit or shares of Class B common stock of Teekay Tankers prior to the specified date) to repurchase 2022 Notes.
As at June 30, 2021, we were in compliance with all covenants under our credit facilities and other long-term debt.
We are exposed to market risk from foreign currency fluctuations and changes in interest rates, spot tanker market rates for vessels and bunker fuel prices. We use foreign currency forward contracts, cross currency and interest rate swaps and forward freight agreements to manage currency, interest rate and spot tanker rates.
Page 39
Teekay Parent
Teekay Parent primarily owns equity ownership interests in the Daughter Entities and 100% ownership interests in the general partner of Teekay LNG and two FPSO units, and also provides management services to the Daughter Entities and third-parties. Teekay Parent’s primary short-term liquidity needs are the payment of operating expenses, asset retirement obligations and recycling costs associated with its FPSO units, debt servicing costs and scheduled repayments of long-term debt, as well as funding its other working capital requirements. Teekay Parent’s primary sources of liquidity are cash and cash equivalents, cash flows provided by operations, dividends/distributions and management fees received from the Daughter Entities and third-parties, and its availability under its undrawn credit facilities. As at June 30, 2021, Teekay Parent’s total cash and cash equivalents was $53.6 million, compared to $44.8 million at December 31, 2020. Teekay Parent’s total liquidity, including cash, cash equivalents and undrawn credit facilities, was $193.6 million as at June 30, 2021, compared to $173.4 million as at December 31, 2020.
In December 2020, Teekay Parent filed a continuous offering program (or COP) under which Teekay Parent may issue shares of its common stock, at market prices up to a maximum aggregate amount of $65.0 million. As of the date of filing this report, no shares of common stock have been issued under the COP.
In October 2020, Teekay Parent secured a new equity margin revolving credit facility maturing in June 2022 to refinance its previous facility which was scheduled to mature in December 2020. The equity margin revolving credit facility provides for aggregate potential borrowings of up to $150 million and is secured by common units of Teekay LNG and shares of Class A common stock of Teekay Tankers that are owned by Teekay Parent. Availability under the credit facility relates to the value of the common units and common stock pledged as collateral for the facility. As part of the refinancing, 10.75 million Teekay LNG common units were included as additional security. Should the value of the collateral decrease beyond a certain threshold, any outstanding amounts are to be repaid in full. Teekay Parent had $150.0 million available to be drawn based on the value of the collateral as at June 30, 2021, of which $140.0 million was undrawn as of that date.
During 2020, Teekay Parent repurchased some of its Convertible Notes and 2022 Notes in the open market. As of June 30, 2021, Teekay Parent had acquired a total of $12.8 million principal amount of the Convertible Notes for total consideration of $10.5 million and $6.6 million principal amount of its 2022 Notes for total consideration of $6.2 million.
Based on Teekay Parent's liquidity at the date of this filing and the liquidity Teekay Parent expects to generate from operations over the following year, Teekay Parent expects to have sufficient liquidity to meet its existing liquidity needs for at least the next 12 months.
Teekay LNG
Teekay LNG's primary liquidity needs for the remainder of 2021 through 2022 include payment of operating expenditures, dry-docking expenditures, the funding of general working capital requirements, scheduled repayments and maturities of long-term debt and obligations related to finance leases, debt servicing costs, committed capital expenditures, its quarterly distributions, including payments of distributions on its Series A and Series B Preferred Units and common units, and funding any common and preferred unit repurchases it may undertake. Teekay LNG anticipates that its primary sources of funds for its liquidity needs will be cash flows from operations, proceeds from financings and refinancings, and cash distributions that it expects to receive from its equity-accounted joint ventures.
Teekay LNG's ability to continue to expand the size of its fleet over the long-term is dependent upon its ability to generate operating cash flow, obtain long-term bank borrowings, sale-leaseback financing and other debt, as well as its ability to raise debt or equity financing through public or private offerings.
As at June 30, 2021, Teekay LNG's consolidated cash and cash equivalents were $144.2 million, compared to $206.8 million at December 31, 2020. Teekay LNG's total liquidity, which consists of cash, cash equivalents and undrawn credit facilities, was $381.9 million as at June 30, 2021, compared to $461.6 million as at December 31, 2020.
As at June 30, 2021, Teekay LNG had a working capital deficit of $352.3 million. This working capital deficit primarily arose from $355.1 million of long-term debt being classified as current at June 30, 2021 relating to scheduled maturities and repayments in the 12 months following June 30, 2021. Scheduled debt maturities include $139.5 million of NOK bonds maturing in October 2021 and $105.0 million drawn under revolving credit facilities due in March 2022, which Teekay LNG expects to refinance to meet its minimum liquidity requirements under its financial covenants.
As at June 30, 2021, Teekay LNG had available liquidity from undrawn revolving credit facilities of $237.7 million.
Teekay LNG also guarantees its proportionate share of certain loan facilities and obligations on interest rate swaps for its equity-accounted joint ventures for which the aggregate principal amount of the loan facilities and fair value of the interest rate swaps as at June 30, 2021 was $1.3 billion. As at June 30, 2021, with the exception of debt service coverage ratio breaches for three of the vessels in the Teekay LNG's 33%-owned joint venture with NYK and Mitsui & Co. Ltd. (or the Angola Joint Venture), all of Teekay LNG's equity-accounted joint ventures were in compliance with all covenants relating to these loan facilities that Teekay LNG guarantees. The Angola Joint Venture expects to obtain a waiver for the covenant requirements that were not met at June 30, 2021 until the next compliance test at December 31, 2021, similar to the waiver obtained in March 2021.
In December 2018, Teekay LNG announced that its general partner's board of directors authorized a repurchase program for the repurchase of up to $100 million of Teekay LNG's common units. Since the announcement of the common unit repurchase program, Teekay LNG has
Page 40
repurchased a total of 3.6 million common units for $44.2 million and associated general partnership interest of $0.3 million. As at August 13, 2021, the remaining dollar value of units that may be purchased under the program is approximately $55.8 million.
As part of its balanced capital allocation strategy, Teekay LNG increased its quarterly cash distributions on its common units by 15% from $0.25 per common unit to $0.2875 per common unit commencing with the quarterly distribution paid in May 2021.
For at least the one-year period following the date of this filing, Teekay LNG expects that its existing liquidity, combined with the cash flows it expects to generate from its operations, receive as dividends from its equity-accounted joint ventures and obtain from an expected debt refinancing, which it considers probable based on its history of refinancing similar debt, will be sufficient to finance its liquidity needs.
Teekay Tankers
Teekay Tankers' primary sources of liquidity are cash and cash equivalents, cash flows provided by its operations, its undrawn credit facilities, and capital raised through financing transactions.
As at June 30, 2021, Teekay Tankers' total consolidated cash and cash equivalents were $60.5 million, compared to $97.2 million at December 31, 2020. Teekay Tankers' total liquidity, including cash, cash equivalents and undrawn credit facilities, was $231.4 million as at June 30, 2021, compared to $372.6 million as at December 31, 2020.
As at June 30, 2021, Teekay Tankers had a working capital deficit of $47.6 million, compared to a working capital surplus of $48.3 million as at December 31, 2020. The change in working capital balance was due to an increase in current liabilities resulting from the repurchase options declared in March 2021 for six vessels under existing finance leases, which are expected to be completed in September 2021 as discussed below, as well as net operating cash outflow. Teekay Tankers expects the working capital deficit will be addressed through cash generated from operations and proceeds from the expected refinancings of eight vessels, including the two vessels that were purchased in May 2021 and the six vessels to be repurchased in September 2021. In June 2021, Teekay Tankers signed term sheets for $141.7 million of new sale-leaseback transactions related to these eight vessels. The expected financing related to these vessels is considered probable of completion during the third quarter of 2021.
In May 2021, Teekay Tankers completed the purchases of two Suezmax tankers previously under the sale-leaseback arrangements described in "Item 1 - Financial Statements: Note 5 – Leases" of this report, for a total cost of $56.7 million, using available cash and an undrawn credit facility.
In March 2021, Teekay Tankers declared purchase options to acquire six Aframax tankers for a total cost of $128.8 million, as part of the repurchase options under sale-leaseback arrangements described in "Item 1 - Financial Statements: Note 5 – Leases" of this report. Teekay Tankers expects to complete the purchase and delivery of these vessels in September 2021.
Teekay Tankers anticipates that its primary sources of funds for its short-term liquidity needs will be cash flows from operations, existing cash and cash equivalents and undrawn short-term and long-term borrowings, and expected proceeds from refinancing eight vessel repurchases, which it believes will be sufficient to meet its existing liquidity needs for at least the next 12 months.
Teekay Tankers' short-term charters and spot market tanker operations contribute to the volatility of its net operating cash flow, and thus may impact its ability to generate sufficient cash flows to meet its short-term liquidity needs. Historically, the tanker industry has been cyclical, experiencing volatility in profitability and asset values resulting from changes in the supply of, and demand for, vessel capacity. In addition, tanker spot markets historically have exhibited seasonal variations in charter rates. Tanker spot markets are typically stronger in the winter months as a result of increased oil consumption in the northern hemisphere and unpredictable weather patterns that tend to disrupt vessel scheduling. However, there may be years where other factors override typical seasonality. This was the case in the first half of 2021 when lower oil demand as a result of the COVID-19 global pandemic, a constrained oil supply resulting from production cuts, the return of ships from floating storage and the delivery of newbuilding vessels to the world tanker fleet contributed to weak tanker rates.
Page 41
Cash Flows
The following table summarizes our consolidated cash and cash equivalents provided by (used for) operating, financing and investing activities for the periods presented:
| (in thousands of U.S. Dollars) | Six Months Ended June 30, | ||||||||||
| 2021 | 2020 | ||||||||||
| $ | $ | ||||||||||
| Net operating cash flows | 18,864 | 775,693 | |||||||||
| Net financing cash flows | (138,929) | (749,983) | |||||||||
| Net investing cash flows | 24,427 | 57,382 | |||||||||
Operating Cash Flows
Our consolidated net cash flow from operating activities fluctuates primarily as a result of changes in vessel utilization and TCE rates, changes in interest rates, fluctuations in working capital balances, the timing and amount of dry-docking expenditures, repairs and maintenance activities, vessel additions and dispositions, and foreign currency rates. Our exposure to the spot tanker market has contributed significantly to fluctuations in operating cash flows historically as a result of highly cyclical spot tanker rates. In addition, until June 2020, the production performance of certain of our FPSO units that operated under contracts with a production-based compensation component contributed to fluctuations in operating cash flows. Further, as the charter contracts of some of our FPSO units included incentives based on oil prices, changes in global oil prices during recent years also impacted our operating cash flows until June 2020.
Teekay LNG and Teekay Tankers do not have full control over the operations of, nor do they have any legal claim to the revenue and expenses of their investments in their equity-accounted joint ventures. Consequently, the cash flow generated by their investments in equity-accounted joint ventures may not be available for use by Teekay LNG and Teekay Tankers in the period that such cash flows are generated.
Consolidated net cash flow from operating activities decreased to $18.9 million for the six months ended June 30, 2021, from $775.7 million for the six months ended June 30, 2020. This decrease was primarily due to a $326.9 million decrease in direct financing lease payments received, which mainly related to payments received by Teekay LNG upon the sale of the WilForce and WilPride LNG carriers in January 2020. There was also a $267.8 million decrease in income from operations (before depreciation, amortization, write-downs and gain on commencement of sales-type lease) largely related to our tanker business. For a further discussion of changes in income from operations from our businesses, please read “Item 2 - Recent Developments and Results of Operations.” Other decreases in cash flow from operating activities include a $161.3 million decrease related to changes to non-cash working capital, and a $15.4 million decrease related to increased expenditures for dry docking compared to the corresponding period of 2020. These decreases to operating cash flows were partially offset by a $36.1 million decrease related to decreased net interest expense, including realized losses on interest rate swaps and cross currency swaps, and an increase of $13.7 million in distributions from equity-accounted joint ventures compared to the corresponding period of 2020.
Financing Cash Flows
We use our credit facilities to partially finance capital expenditures. Occasionally, we will use revolving credit facilities to finance these expenditures until longer-term financing is obtained, at which time we typically use all or a portion of the proceeds from the longer-term financings to prepay outstanding amounts under the revolving credit facilities. We actively manage the maturity profile of our outstanding financing arrangements. Our net payments on long-term debt, which are the proceeds from the issuance of long-term debt, net of debt issuance costs and prepayments of long-term debt, were $163.7 million in the six months ended June 30, 2021 compared to ($370.5) million in the same period last year. Scheduled debt repayments decreased by $84.2 million in the six months ended June 30, 2021, compared to the same period last year.
During the six months ended June 30, 2021, net repayments on Teekay Tankers' working capital facility decreased to nil from $40.0 million compared to the same period last year.
During the six months ended June 30, 2021, Teekay Tankers used $56.7 million of cash to purchase two Suezmax tankers previously under sale-leaseback financing arrangements.
During the six months ended June 30, 2020, Teekay LNG used $15.6 million of cash to repurchase common units.
Investing Cash Flows
During the six months ended June 30, 2021, we incurred capital expenditures for vessels and equipment of $20.1 million and Teekay Tankers received proceeds of $32.7 million from the sale of the two Aframax tankers.
During the six months ended June 30, 2020, we incurred capital expenditures for vessels and equipment of $12.8 million and Teekay Tankers received proceeds of $12.2 million from the sale of the non-US portion of its ship-to-ship support services business as well as its LNG terminal management business, and also received proceeds on the sale of three Suezmax tankers of $60.9 million.
Page 42
CONTRACTUAL OBLIGATIONS AND CONTINGENCIES
The following table summarizes our long-term contractual obligations as at June 30, 2021, excluding expected interest payments where applicable:
| Remainder of | Beyond | ||||||||||||||||||||||||||||||||||||||||
| Total | 2021 | 2022 | 2023 | 2024 | 2025 | 2025 | |||||||||||||||||||||||||||||||||||
| In millions of U.S. Dollars | |||||||||||||||||||||||||||||||||||||||||
| Teekay LNG | |||||||||||||||||||||||||||||||||||||||||
Bond repayments (1)(2) | 354.5 | 139.5 | — | 98.8 | — | 116.2 | — | ||||||||||||||||||||||||||||||||||
Scheduled repayments of long-term debt (1)(2) | 546.4 | 56.1 | 108.0 | 101.9 | 91.0 | 71.2 | 118.2 | ||||||||||||||||||||||||||||||||||
Repayments on maturity of long-term debt (1)(2) | 526.3 | — | 105.0 | 35.7 | 34.0 | — | 351.6 | ||||||||||||||||||||||||||||||||||
Scheduled repayments of obligations related to finance leases (3) | 1,671.9 | 69.1 | 137.0 | 135.5 | 132.0 | 129.7 | 1,068.6 | ||||||||||||||||||||||||||||||||||
Commitments under operating leases (4) | 208.6 | 23.9 | 35.0 | 24.0 | 23.9 | 23.9 | 77.9 | ||||||||||||||||||||||||||||||||||
Equipment and other construction contract costs (5) | 39.2 | 24.4 | 14.8 | — | — | — | — | ||||||||||||||||||||||||||||||||||
| 3,346.9 | 313.0 | 399.8 | 395.9 | 280.9 | 341.0 | 1,616.3 | |||||||||||||||||||||||||||||||||||
| Teekay Tankers | |||||||||||||||||||||||||||||||||||||||||
Scheduled repayments of long-term and other debt (2) | 117.1 | 5.6 | 11.2 | 47.2 | 53.1 | — | — | ||||||||||||||||||||||||||||||||||
Repayments on maturity of long-term and other debt (2) | 181.9 | — | — | 33.7 | 148.2 | — | — | ||||||||||||||||||||||||||||||||||
Scheduled repayments of obligations related to finance leases (2) | 292.8 | 134.0 | 12.3 | 13.1 | 13.9 | 14.8 | 104.7 | ||||||||||||||||||||||||||||||||||
Chartered-in vessels (operating leases) (6)(7)(8)(9) | 65.0 | 5.1 | 11.7 | 9.6 | 6.8 | 6.8 | 25.0 | ||||||||||||||||||||||||||||||||||
| 656.8 | 144.7 | 35.2 | 103.6 | 222.0 | 21.6 | 129.7 | |||||||||||||||||||||||||||||||||||
| Teekay Parent | |||||||||||||||||||||||||||||||||||||||||
Bond repayments (2) | 355.6 | — | 243.4 | 112.2 | — | — | — | ||||||||||||||||||||||||||||||||||
Repayments on maturity of long-term debt (2) | 10.0 | — | 10.0 | — | — | — | — | ||||||||||||||||||||||||||||||||||
Asset retirement obligations (10) | 11.6 | — | 11.6 | — | — | — | — | ||||||||||||||||||||||||||||||||||
| 377.2 | — | 265.0 | 112.2 | — | — | — | |||||||||||||||||||||||||||||||||||
| Total | 4,380.9 | 457.7 | 700.0 | 611.7 | 502.9 | 362.6 | 1,746.0 | ||||||||||||||||||||||||||||||||||
(1)Euro-denominated and NOK-denominated obligations are presented in U.S. Dollars and have been converted using the prevailing exchange rate as of June 30, 2021.
(2)Our interest-bearing obligations include bonds, commercial bank debt and obligations related to finance leases. Please read “Item 1 – Financial Statements: Note 5 – Leases" and “Item 1 – Financial Statements: Note 9 – Long-Term Debt” for the terms upon which future interest payments are determined, as well as “Item 1 – Financial Statements: Note 10 – Derivative Instruments and Hedging Activities" for a summary of the terms of our derivative instruments which hedge certain of our floating rate interest-bearing obligations.
(3)In addition to lease payments, includes amounts Teekay LNG is required to pay to purchase the leased assets at the end of their respective lease terms.
(4)Teekay LNG has corresponding leases whereby it is the lessor and expects to receive approximately $192.8 million under those leases from the remainder of 2020 to 2028.
(5)The Bahrain LNG Joint Venture, in which Teekay LNG has a 30% ownership interest, has a receiving and regasification terminal in Bahrain. The Bahrain LNG Joint Venture completed the mechanical construction and commissioning of the Bahrain terminal in late-2019 and began receiving terminal use payments in early-2020 under its 20-year agreement with National Oil & Gas Authority (or NOGA). As at June 30, 2021, Teekay LNG's 30% share of the estimated remaining costs included in the table above is $11.3 million, of which the Bahrain LNG Joint Venture has secured undrawn debt financing of $7.2 million related to Teekay LNG's proportionate share.
In June 2019, Teekay LNG entered into an agreement with a contractor to supply equipment on certain of Teekay LNG's LNG carriers in 2021 and 2022 for an estimated installed cost of $54.8 million. As at June 30, 2021, Teekay LNG's estimated remaining cost of this installation is $27.9 million.
(6)Includes one LR2 tanker and one STS support vessel, both of which are expected to be delivered to Teekay Tankers during the third quarter of 2021 to commence an 18-month time charter-in contract and a two-year time charter-in contract, respectively.
(7)Includes one Aframax tanker expected to be delivered to Teekay Tankers in late-2022 to commence a seven-year time charter-in contract.
Page 43
(8)Excludes payments required if Teekay Tankers exercises options to extend the terms of in-chartered leases signed as of June 30, 2021. If Teekay Tankers exercise all options to extend the terms of signed in-chartered leases, Teekay Tankers would expect total payments of $8.2 million (remainder of 2021), $17.0 million (2022), $16.9 million (2023), $13.1 million (2024), $6.8 million (2025) and $47.9 million (thereafter).
(9)Excludes two time charter-in contracts for two Aframax tankers that were entered into by Teekay Tankers subsequent to June 30, 2021.
(10)Teekay Parent recognized an ARO relating to the recycling of the Petrojarl Foinaven FPSO unit. Teekay Parent is entitled to receive $11.6 million from the charterer at the end of the bareboat charter, which is currently expected to cover the costs of the ARO. However, the extent to which this payment covers the costs of recycling the FPSO unit will depend on a number of factors when the recycling is completed, including among others, the nature and extent of prevailing EU Ship Recycling Regulation, the condition of the FPSO unit, and the availability of recycling facilities. The receivable is included in net investments in direct financing leases and sales-type leases, net - non-current on our consolidated balance sheet. The present value of the estimated Petrojarl Foinaven ARO was $10.6 million as at June 30, 2021. In April 2021, the charterer of the Petrojarl Foinaven FPSO unit announced its decision to suspend production from the Foinaven oil fields and permanently remove the Petrojarl Foinaven FPSO unit from the site. We expect the FPSO unit to be redelivered to us in the third quarter of 2022, at which point we will receive the fixed lump sum payment from the charterer that is expected to cover the cost of green-recycling the FPSO unit.
CRITICAL ACCOUNTING ESTIMATES
Accounting estimates and assumptions that we consider to be the most critical to an understanding of our consolidated financial statements because they inherently involve significant judgments and uncertainties, are discussed in “Item 5 – Operating and Financial Review and Prospects” in our Annual Report on Form 20-F for the year ended December 31, 2020. The following contains those sections of our critical accounting estimates that have been updated for significant developments up to June 30, 2021:
Vessel Lives and Impairment
The following contains an update from our Annual Report on Form 20-F for the year ended December 31, 2020 for significant developments up to June 30, 2021 to our critical accounting estimates with respect to Vessel Lives and Impairment for vessels in our Teekay Tankers - Conventional Tankers segment where undiscounted cash flows are marginally greater than the carrying values. The table below presents the aggregate market values and carrying values of our vessels in the Teekay Tankers - Conventional Tankers segment that we have determined have a market value that is less than their carrying value and which have estimated future undiscounted cash flows that are only marginally greater than their respective carrying values as of June 30, 2021. While the market values of these vessels are below their carrying values, no impairment has been recognized on any of these vessels in the six months ended June 30, 2021 as the estimated future undiscounted cash flows relating to such vessels are greater than their carrying values and GAAP does not allow an impairment to be recognized under this circumstance. We consider the vessels reflected in the following table to be at a higher risk of future impairment as compared to other vessels in our fleet:
Aframax, Suezmax and Product Tankers (in thousands of U.S. dollars, except number of vessels) | # Vessels | Market Values (1) | Carrying Values | ||||||||||||||
| Tankers | 12 | 248,100 | 372,574 | ||||||||||||||
(1)Market values are determined using reference to second-hand market comparables. Since vessel values can be volatile, our estimates of market value shown above may not be indicative of either the current or future prices we could obtain if we sold any of the vessels.
Our estimates of future undiscounted cash flows used to determine whether a vessel's carrying value is recoverable involve assumptions about future charter rates, vessel utilization, operating expenses, dry-docking expenditures, vessel residual values, the probability of the vessel being sold and the remaining estimated life of our vessels. Our estimated charter rates are based on rates under existing vessel contracts and market rates at which we expect we can re-charter our vessels. Such market rates for the first three years are based on prevailing market 3-year time-charter rates and thereafter, a 10-year historical average of actual spot charter rates earned by our vessels, adjusted to exclude years which management has determined as outliers. We consider as outliers those years that have been impacted by rare events or circumstances that have distorted the historical 10-year trailing average to such a degree that this average is not representative of what a reasonable outlook would be if we do not exclude such years. We have identified such events in the current 10-year historical period as at June 30, 2021, which has resulted in the exclusion of the three years from 2011 to 2013 from our averages. Our estimated charter rates are discounted for the years when the vessel age is 15 years and older, as compared to the estimated charter rates for years when the vessel is younger than 15 years. Such discounts reflect expectations of lower utilization and higher fuel consumption for older vessels.
In our experience, certain assumptions relating to our estimates of future cash flows are more predictable by their nature, including estimated revenue under existing contract terms, ongoing operating costs and remaining vessel life. Certain assumptions relating to our estimates of future cash flows require more judgment and are inherently less predictable, such as future charter rates beyond the firm period of existing contracts, the probability and timing of vessels being sold and vessel residual values, due to their volatility. We believe that the assumptions used to estimate future cash flows of our vessels are reasonable at the time they are made. We can make no assurances, however, as to whether our estimates of future cash flows, particularly future vessel charter rates or vessel values, will be accurate.
Our estimates of future cash flows are more sensitive to changes in certain assumptions, such as future charter rates. For example, for those 12 vessels in the table above where the undiscounted cash flows are marginally greater than the carrying values, if at June 30, 2021, the 3-year time-charter rates were reduced by either 5% or 10%, two or four, respectively, of the 12 vessels would have been impaired, resulting in an additional impairment of $8.4 million or $39.2 million, respectively. If at June 30, 2021, the 10-year historical average of actual spot charter rates earned by our vessels, adjusted to exclude years which management has determined as outliers, was reduced by either 5% or 10%, six or 11, respectively, of the 12 vessels would have been impaired, resulting in an additional impairment of $71.1 million or $122.6 million, respectively.
Page 44
For additional information about our impairment policies, please read "Item 5 – Operating and Financial Review and Prospects - Critical Accounting Estimates - Vessel Lives and Impairment" in our Annual Report on Form 20-F for the year ended December 31, 2020.
FORWARD-LOOKING STATEMENTS
This Report on Form 6-K for the three and six months ended June 30, 2021, contains certain forward-looking statements (as such term is defined in Section 21A of the Securities Act of 1933, as amended, and Section 21E of the Securities Exchange Act of 1934, as amended) concerning future events and our operations, performance and financial condition, including, among others, statements regarding:
•the expected scope, duration and effects of the COVID-19 global pandemic, including the effects on our industry and business, including our liquidity and the potential effect on typical seasonal variations in tanker rates;
•conditions and fundamentals of the markets in which we operate, including the balance of supply and demand in these markets and spot tanker charter rates and volatility, levels of oil production by OPEC+ and others, and competition for providing services;
•the impact of future changes in the demand for and price of oil, and the related effects on the demand for and price of natural gas;
•forecasts of worldwide tanker fleet growth;
•meeting our going concern requirements and our liquidity needs, and the liquidity needs of Teekay LNG and Teekay Tankers, anticipated funds and sources of financing for liquidity needs and the sufficiency of cash flows, and our estimation that we will have sufficient liquidity for at least the next 12 months;
•our business strategy and other plans and objectives for future operations;
•expected uses of proceeds from vessel or securities transactions, including proceeds from refinancing vessel repurchases;
•compliance with financing agreements, including the potential effects and the expected effect of restrictive covenants in such agreements;
•the ability of the Angola Joint Venture to obtain waivers of covenant breaches relating to three of its vessels;
•the amounts and settlements of recycling, decommissioning and/or other asset retirement obligations related to the Petrojarl Banff FPSO, the Petrojarl Foinaven FPSO and related subsea equipment in the North Sea;
•the ability of CNRI to fulfill the obligations under the DSA related to the Petrojarl Banff FPSO;
•the expected timing and cost relating to the additional equipment to be installed for certain of Teekay LNG's LNG carriers;
•the impact and expected cost of, and our ability to comply with, new and existing governmental regulations and maritime self-regulatory organization standards applicable to our business;
•expected costs, capabilities, newbuilding deliveries, acquisitions and conversions, and the commencement of any related charters or other contracts;
•operating expenses, availability of crew and crewing costs, number of off-hire days, dry-docking requirements and durations and the adequacy and cost of insurance;
•our hedging activities relating to foreign exchange, interest rate and spot market risks, and the effects of fluctuations in foreign exchange, interest rate and spot market rates on our business and results of operations;
•our expectations regarding tax positions, liabilities and classifications;
•our expectations regarding, and our accounting estimates and the level of expected changes in our provisions for uncertain tax positions relating to freight taxes in the next 12 months;
•the future valuation or impairment of our assets, including our goodwill;
•our expectations regarding pattern of expense recognition of chartered-in vessels; and
•the potential impact of proposed accounting treatment or new accounting guidance.
Forward-looking statements include, without limitation, any statement that may predict, forecast, indicate or imply future results, performance or achievements, and may contain the words “believe”, “anticipate”, “expect”, “estimate”, “project”, “will be”, “will continue”, “will likely result”, or words or phrases of similar meanings. These statements involve known and unknown risks and are based upon a number of assumptions and estimates that are inherently subject to significant uncertainties and contingencies, many of which are beyond our control. Actual results may differ materially from those expressed or implied by such forward-looking statements. The following factors are among those that could cause actual results to differ materially from the forward-looking statements, which involve risks and uncertainties, and that should be considered in evaluating any such statement: failure to achieve or the delay in achieving expected benefits of our financing initiatives; changes in oil prices; changes in vessel values; changes in production of or demand for oil, petroleum products, LNG and LPG, either generally or in particular regions; changes in anticipated levels of vessel newbuilding orders or deliveries or rates of vessel scrapping; OPEC+ production and supply levels; the duration and extent of the COVID-19 global pandemic and any resulting effects on the markets in which we operate; the impact of the COVID-19 global pandemic on our ability to maintain safe and efficient operations; higher than expected costs and/or delays associated with the remediation or the decommissioning/recycling of the Petrojarl Foinaven FPSO; our ability to fund the recycling costs of the Petrojarl Foinaven FPSO under the agreed contractual terms with the customer; competitive factors in the markets in which we operate; loss of any customer, time charter or vessel; potential delays or cancellations of anticipated vessel deliveries or purchase; changes in the financial stability of our charterers; changes in trading patterns significantly affecting overall vessel tonnage requirements; the timing of implementation of new laws and regulations; political, governmental and economic instability in the regions and markets in which we operate; the application of sanctions to us or any of our counterparties or joint venture parties; spot tanker market rate fluctuations; changes in the typical seasonal variations in tanker charter rates; changes in the offshore production of oil or demand for FPSOs, LNG or LPG carriers; changes in cash
Page 45
distributions by Teekay LNG; the outcome of discussions or legal action with third parties relating to existing or potential disputes or claims; potential inability to obtain charters; lender willingness to provide covenant waivers to the Angola Joint Venture; the potential for early termination of long-term contracts and our ability to renew or replace long-term contracts or complete existing contract negotiations; cost overruns; our exposure to interest rate and currency exchange rate fluctuations; changes in our expenses; changes in tax regulations or the outcome of tax positions; our future capital expenditure requirements and the inability to secure financing for such requirements; our potential inability to raise financing to refinance debt maturities; conditions in the capital markets and lending markets; potential inability to implement our growth strategy; and other factors discussed in our filings from time to time with the SEC, including in our Annual Report on Form 20-F for the fiscal year ended December 31, 2020. We expressly disclaim any obligation or undertaking to release publicly any updates or revisions to any forward-looking statements contained herein to reflect any change in our expectations with respect thereto or any change in events, conditions or circumstances on which any such statement is based.
Page 46
TEEKAY CORPORATION AND SUBSIDIARIES
JUNE 30, 2021
PART II – OTHER INFORMATION
Item 1 – Legal Proceedings
See “Part I – Item 1 – Financial Statements: Note 11c – Commitments and Contingencies – Legal Proceedings and Claims” in this Report.
Item 1A – Risk Factors
In addition to the other information set forth in this Report on Form 6-K, you should carefully consider the risk factors discussed in Part I, “Item 3. Key Information – Risk Factors” in our Annual Report on Form 20-F for the year ended December 31, 2020, which could materially affect our business, financial condition or results of operations and the price and value of our securities.
Item 2 – Unregistered Sales of Equity Securities and Use of Proceeds
None
Item 3 – Defaults Upon Senior Securities
None
Item 4 – Mine Safety Disclosures
Not applicable
Item 5 – Other Information
Our 2021 Annual General Meeting was held on June 21, 2021. The following persons were elected directors for a term of three years by the votes set forth opposite their names:
| Terms expiring 2022 | Votes For | Votes Withheld | Votes Against | Broker Non-Votes | ||||||||||||||||||||||
| Kenneth Hvid | 50,225,177 | 6,183,979 | N/A | N/A | ||||||||||||||||||||||
| Alan Semple | 55,407,358 | 1,001,798 | N/A | N/A | ||||||||||||||||||||||
Item 6 – Exhibits
None
THIS REPORT ON FORM 6-K IS HEREBY INCORPORATED BY REFERENCE INTO THE FOLLOWING REGISTRATION STATEMENTS OF THE COMPANY:
•REGISTRATION STATEMENT ON FORM F-3 (FILE NO. 033-97746) FILED WITH THE SEC ON OCTOBER 4, 1995;
•REGISTRATION STATEMENT ON FORM S-8 (FILE NO. 333-42434) FILED WITH THE SEC ON JULY 28, 2000;
•REGISTRATION STATEMENT ON FORM S-8 (FILE NO. 333-119564) FILED WITH THE SEC ON OCTOBER 6, 2004;
•REGISTRATION STATEMENT ON FORM S-8 (FILE NO. 333-147683) FILED WITH THE SEC ON NOVEMBER 28, 2007;
•REGISTRATION STATEMENT ON FORM S-8 (FILE NO. 333-166523) FILED WITH THE SEC ON MAY 5, 2010;
•REGISTRATION STATEMENT ON FORM S-8 (FILE NO. 333-187142) FILED WITH THE SEC ON MARCH 8, 2013;
•REGISTRATION STATEMENT ON FORM F-3 (FILE NO. 333-212787) FILED WITH THE SEC ON JULY 29, 2016;
•REGISTRATION STATEMENT ON FORM F-3 (FILE NO. 333-231003) FILED WITH THE SEC ON APRIL 24, 2019; AND
•REGISTRATION STATEMENT ON FORM F-3 (FILE NO. 333-251793) FILED WITH THE SEC ON DECEMBER 29, 2020.
Page 47
SIGNATURES
Pursuant to the requirements of the Securities Exchange Act of 1934, the registrant has duly caused this report to be signed on its behalf by the undersigned, thereunto duly authorized.
| TEEKAY CORPORATION | |||||||||||
| Date: August 13, 2021 | By: | /s/ Vincent Lok | |||||||||
Vincent Lok Executive Vice President and Chief Financial Officer (Principal Financial and Accounting Officer) | |||||||||||
Page 48