UNITED STATES
SECURITIES AND EXCHANGE COMMISSION
WASHINGTON, D.C. 20549
FORM 20-F
☐ | REGISTRATION STATEMENT PURSUANT TO SECTION 12(b) OR 12(g) OF THE SECURITIES EXCHANGE ACT OF 1934 |
OR
☒ | ANNUAL REPORT PURSUANT TO SECTION 13 OR 15(d) OF THE SECURITIES EXCHANGE ACT OF 1934 |
For the fiscal year ended December 31, 2020
OR
☐ | TRANSITION REPORT PURSUANT TO SECTION 13 OR 15(d) OF THE SECURITIES EXCHANGE ACT OF 1934 |
For the transition period from to
OR
☐ | SHELL COMPANY REPORT PURSUANT TO SECTION 13 OR 15(d) OF THE SECURITIES EXCHANGE ACT OF 1934 |
Date of event requiring this shell company report,
Commission file number: 001-12440
ENEL AMÉRICAS S.A.
(Exact name of Registrant as specified in its charter)
ENEL AMÉRICAS S.A.
(Translation of Registrant’s name into English)
CHILE
(Jurisdiction of incorporation or organization)
Santa Rosa 76, Santiago, Chile
(Address of principal executive offices)
Nicolás Billikopf, phone: (56-9) 9343-5500, nicolas.billikopf@enel.com, Av. Santa Rosa 76, Piso 15, Comuna de Santiago, Santiago, Chile
(Name, Telephone, E-mail, and Address of Company Contact Person)
Securities registered or to be registered pursuant to Section 12(b) of the Act:
| | |
|---|---|---|
Title of Each Class
| Trading Symbol(s) | Name of Each Exchange on Which Registered
|
American Depositary Shares Representing Common Stock | ENIA | New York Stock Exchange |
Common Stock, no par value * | * | New York Stock Exchange |
US$ 600,000,000 4.00% Notes due October 25, 2026 | ENIA26A | New York Stock Exchange |
US$ 858,000 6.60% Notes due December 1, 2026 | ENIA26 | New York Stock Exchange |
* | Listed, not for trading, but only in connection with the registration of American Depositary Shares, pursuant to the requirements of the Securities and Exchange Commission. |
Securities registered or to be registered pursuant to Section 12(g) of the Act: None
Securities for which there is a reporting obligation pursuant to Section 15(d) of the Act: None
Indicate the number of outstanding shares of each of the issuer’s classes of capital or common stock as of the close of the period covered by the annual report.
Shares of Common Stock: 76,086,311,036
Indicate by check mark if the registrant is a well-known seasoned issuer, as defined in Rule 405 of the Securities Act. ☒ Yes ☐ No
If this report is an annual or transition report, indicate by check mark if the registrant is not required to file reports pursuant to Section 13 or 15(d) of the Securities Exchange Act of 1934. ☐ Yes ☒ No
Indicate by check mark whether the registrant (1) has filed all reports required to be filed by Section 13 or 15(d) of the Securities Exchange Act of 1934 during the preceding 12 months (or for such shorter period that the registrant was required to file such reports), and (2) has been subject to such filing requirements for the past 90 days. ☒ Yes ¨ No
Indicate by check mark whether the registrant has submitted electronically every Interactive Data File required to be submitted pursuant to Rule 405 of Regulation S-T during the preceding 12 months (or for such shorter period that the registrant was required to submit such files). ☒ Yes ☐ No
Indicate by check mark whether the registrant is a large accelerated filer, an accelerated filer, a non-accelerated filer, or an emerging growth company. See the definitions of “large accelerated filer,” “accelerated filer,” and “emerging growth company” in Rule 12b-2 of the Exchange Act.
Large accelerated filer ☒ | Accelerated filer ☐ | Non-accelerated filer ☐ | Emerging growth company |
If an emerging growth company that prepares its financial statements in accordance with U.S. GAAP, indicate by check mark if the registrant has elected not to use the extended transition period for complying with any new or revised financial accounting standards † provided pursuant to Section 13(a) of the Exchange Act. ☐
† The term “new or revised financial accounting standard” refers to any update issued by the Financial Accounting Standards Board to its Accounting Standards Codification after April 5, 2012.
Indicate by check mark whether the registrant has filed a report on and attestation to its management’s assessment of the effectiveness of its internal control over financial reporting under Section 404(b) of the Sarbanes-Oxley Act (15 U.S.C. 7262(b)) by the registered public accounting firm that prepared or issued its audit report. ⌧
| | |
Indicate by check mark which basis of accounting the registrant has used to prepare the financial statements included in this filing: | ||
| | |
U.S. GAAP ☐ | International Financial Reporting Standards as issued by the International Accounting Standards Board ☒ | Other ☐ |
If “Other” has been checked in response to the previous question, indicate by check mark which financial statement item the registrant has elected to follow. ☐ Item 17 ☐ Item 18
If this is an annual report, indicate by check mark whether the registrant is a shell company (as defined in Rule 12b-2 of the Exchange Act). ☐ Yes ☒ No
Enel Américas Simplified Organizational Structure (1)
As of the date of this Report
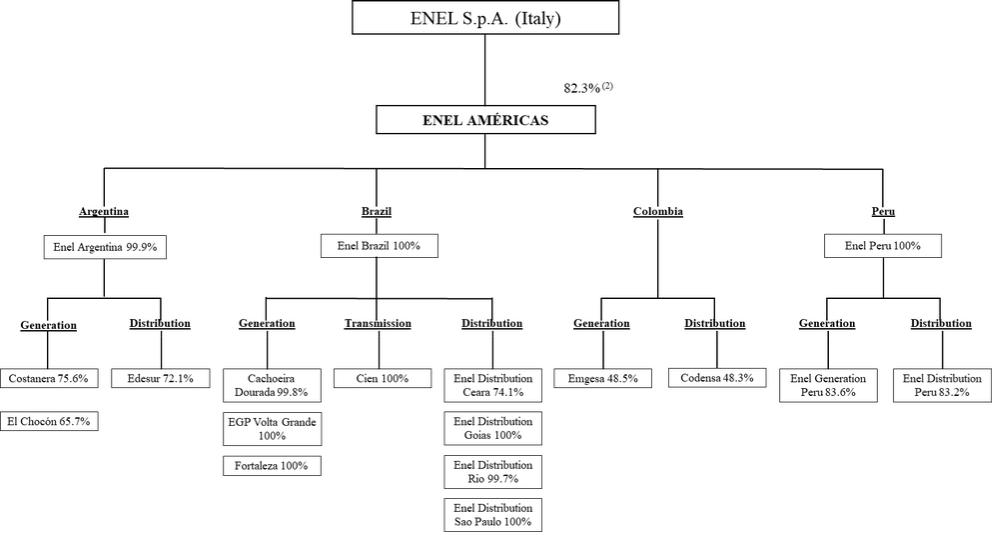
| (2) | As of December 31, 2020, Enel S.p.A. beneficially owned 65% of Enel Américas. Upon the effectiveness of the merger by incorporation of EGP Américas SpA into Enel Américas on April 1, 2021, Enel S.p.A.’s beneficial ownership interest in Enel Américas increased to 75.2%, and as a result of Enel S.p.A.’s tender offer launched on March 15, 2021 for up to 10% of Enel Américas’ then-outstanding shares of common stock (including shares represented by ADS), which expired on April 13, 2021, Enel S.p.A.’s beneficial ownership interest in Enel Américas increased to the current level of 82.3%. |
2
| |||
|---|---|---|---|
| Page | ||
| 4 | ||
| | ||
| 10 | ||
| | ||
| 11 | ||
| | ||
| 13 | ||
| | | |
| 14 | ||
| | | |
| | | |
| | ||
| 15 | ||
| | ||
| 15 | ||
| | ||
| 15 | ||
| | ||
| 29 | ||
| | ||
| 111 | ||
0 | | | |
| 111 | ||
| | ||
| 170 | ||
| | ||
| 178 | ||
| | ||
| 181 | ||
| | ||
| 182 | ||
| | ||
| 184 | ||
| | ||
| 200 | ||
| | ||
| 204 | ||
| | ||
| | ||
| | ||
| 205 | ||
| | ||
Material Modifications to the Rights of Security Holders and Use of Proceeds | | 205 | |
| | ||
| 205 | ||
| | ||
| 206 | ||
| | ||
| 206 | ||
| | ||
| 206 | ||
| | ||
| 207 | ||
| | ||
| 208 | ||
| | ||
Purchases of Equity Securities by the Issuer and Affiliated Purchasers | | 208 | |
| | ||
| 210 | ||
| | ||
| 210 | ||
| | ||
| 210 | ||
| | ||
| | | |
| | | |
| 211 | ||
| | | |
| 211 | ||
| | | |
| 211 | ||
3
ADR | | American Depositary Receipt | | A certificate issued by our depositary that represents ADS, or American Depositary Shares. |
| | | | |
ADS | | American Depositary Share(s) | | An equity interest in our company that is issued by Citibank, N.A., as the depositary, in respect of shares of our company held by the depositary. Each ADS represents 50 shares and ADS are traded on the New York Stock Exchange. In this Report, ADS is used in the singular and plural forms. |
| | | | |
AFP | | Administradora de Fondos de Pensiones | | A legal entity that manages a Chilean pension fund. |
| | | | |
ANEEL | | Agência Nacional de Energia Elétrica | | Brazilian governmental agency for electric energy. |
| | | | |
BNDES | | Banco Nacional de Desenvolvimento Econȏmico e Social | | The National Bank for Economic and Social Development (“BNDES”) is the principal agent of development in Brazil, focusing on sustainable social and environmental development. |
| | | | |
Brazilian MME | | Ministério de Minas y Energia | | Brazilian Ministry of Mines and Energy. |
| | | | |
Cachoeira Dourada | | Enel Green Power Cachoeira Dourada S.A. | | Brazilian generation subsidiary owned by Enel Brasil. Formerly Centrais Elétricas Cachoeira Dourada S.A. |
| | | | |
CAMMESA | | Compañía Administradora del Mercado Mayorista Eléctrico S.A. | | Argentine autonomous entity in charge of the Mercado Eléctrico Mayorista (Wholesale Electricity Market), or MEM. CAMMESA’s stockholders are generation, transmission, distribution companies, large users, and the Secretariat of Energy. |
| | | | |
CCEE | | Câmara de Comercialização de Energia Elétrica | | Electricity Trading Chamber or Wholesale Clearing House |
| | | | |
Chilean Stock Exchanges | | Chilean Stock Exchanges | | The two stock exchanges located in Chile: the Santiago Stock Exchange and the Electronic Stock Exchange. |
| | | | |
Cien | | Enel CIEN S.A. | | Brazilian transmission subsidiary, wholly-owned by Enel Brasil. Formerly Companhia de Interconexão Energética S.A. |
| | | | |
CND | | Centro Nacional de Despacho | | Colombian National Dispatch Center in charge of coordinating the efficient operation |
4
and dispatch of generation units to satisfy demand. | ||||
| | | | |
CNPE | | Conselho Nacional de Politica Energética | | Brazilian national energy policy council in charge of advising the Brazilian President on energy policy. |
| | | | |
CMF | | Comisión para el Mercado Financiero | | Chilean Financial Market Commission, the governmental authority that supervises the financial markets. Formerly the Chilean Superintendence of Securities and Insurance or SVS in its Spanish acronym. |
| | | | |
CMSE | | Comitê de Monitoramento do Setor Elétrico | | The Brazilian energy sector monitoring committee that evaluates the continuity and security of the energy supply across the country. |
| | | | |
Codensa | | Codensa S.A. E.S.P. | | Colombian distribution subsidiary that operates mainly in Bogotá and whose voting power is controlled by us. |
| | | | |
COES | | Comité de Operación Económica del Sistema | | Peruvian entity in charge of coordinating the efficient operation and dispatch of generation units to satisfy demand. |
| | | | |
Colombian MME | | Ministerio de Minas y Energía | | Colombian Ministry of Mines and Energy. |
| | | | |
Costanera | | Enel Generación Costanera S.A. | | A publicly held Argentine generation company controlled by us. Formerly Central Costanera S.A. |
| | | | |
CREG | | Comisión de Regulación de Energía y Gas | | Colombian Commission for the Regulation of Energy and Gas. |
| | | | |
CTM | | Compañía de Transmisión del Mercosur S.A. | | Argentine transmission company and a subsidiary of Enel Brasil. |
| | | | |
Dock Sud | | Central Dock Sud S.A. | | Argentine generation subsidiary. |
| | | | |
Edesur | | Empresa Distribuidora del Sur S.A. | | Argentine distribution subsidiary, with a concession area in the southern part of the Buenos Aires greater metropolitan area. |
| | | | |
EGP Volta Grande | | Enel Green Power Volta Grande S.A. | | Brazilian generation subsidiary located in the State of Minas Gerais, in Brazil, owned by Enel Brasil. |
| | | | |
El Chocón | | Enel Generación El Chocón S.A. | | Argentine generation company with two hydroelectric plants, El Chocón and Arroyito, both located in the Limay River, Argentina and our subsidiary. Formerly Hidroeléctrica El Chocón S.A. |
| | | | |
5
Emgesa | | Emgesa S.A. E.S.P. | | Colombian generation subsidiary whose voting power is controlled by us. |
| | | | |
Enel | | Enel S.p.A. | | Our Italian parent company with multinational operations in the power and gas markets, with a 65% and 82.3% beneficial ownership of Enel Américas as of December 31, 2020, and the date of this Report, respectively. |
| | | | |
Enel Américas | | Enel Américas S.A. | | Our company, a publicly held limited liability stock corporation incorporated under the laws of the Republic of Chile, headquartered in Chile, with subsidiaries engaged primarily in the generation and distribution of electricity in Argentina, Brazil, Colombia, and Peru, and controlled by Enel. The registrant of this Report. Formerly known as Enersis S.A. |
| | | | |
Enel Argentina | | Enel Argentina S.A. | | Argentine holding company subsidiary. |
| | | | |
Enel Brasil | | Enel Brasil S.A. | | Brazilian holding company subsidiary. Formerly known as Endesa Brasil S.A. |
| | | | |
Enel Distribution Ceara | | Companhia Energética Do Ceará S.A. | | A publicly held Brazilian distribution subsidiary operating in the state of Ceará controlled by Enel Brasil. Also commercially known as Enel Distribuição Ceará. |
| | | | |
Enel Distribution Goias | | CELG Distribuição S.A. | | Brazilian distribution subsidiary that operates a concession in the state of Goias, owned by Enel Brasil. Also commercially known as Enel Distribuição Goiás. |
| | | | |
Enel Distribution Peru | | Enel Distribución Perú S.A.A. | | A publicly held Peruvian distribution subsidiary, with a concession area in the northern part of Lima. Formerly Empresa de Distribución Eléctrica de Lima Norte S.A. or Edelnor. |
| | | | |
Enel Distribution Rio | | Ampla Energia e Serviços S.A. | | A publicly held Brazilian distribution subsidiary operating in Rio de Janeiro, owned by Enel Brasil. Also commercially known as Enel Distribuição Rio. |
| | | | |
Enel Distribution Sao Paulo | | Eletropaulo Metropolitana Eletricidade de São Paulo S.A. | | A publicly held Brazilian distribution subsidiary operating in Sao Paulo, owned by Enel Investimentos Sudeste S.A., a wholly-owned investment vehicle of Enel Brasil. Also commercially known as Enel Distribuição São Paulo. |
| | | | |
6
Enel Generation Peru | | Enel Generación Perú S.A.A. | | A publicly held Peruvian generation subsidiary. Formerly Edegel S.A.A. |
| | | | |
Enel Generation Piura | | Enel Generación Piura S.A. | | A publicly held Peruvian generation subsidiary. Formerly Empresa Eléctrica de Piura S.A. or EEPSA. |
| | | | |
Enel Peru | | Enel Perú S.A.C. | | Peruvian holding company subsidiary. |
| | | | |
| | | | |
Enel Sudeste | | Enel Investimentos Sudeste S.A. | | A former Brazilian investment holding company, owned by Enel Brasil, and parent company of Enel Distribution Sao Paulo. In 2019 Enel Sudeste was merged into Enel Distribution Sao Paulo. |
| | | | |
Enel Trading Argentina | | Enel Trading Argentina S.R.L. | | Energy trading subsidiary with operations in Argentina. Formerly Central Comercializadora de Energía S.A. or CEMSA. |
| | | | |
Enel X Brasil | | Enel X Brasil S.A. | | A Brazilian subsidiary engaged in developing, implementing, and selling products and services different from the sale of energy or energy distribution under concessions, and associated services in Brazil, owned by Enel Brasil. |
| | | | |
Enel X Colombia | | Enel X Colombia S.A.S. | | A Colombian subsidiary engaged in developing, implementing, and selling products and services different from the sale of energy or energy distribution under concessions, and associated services in Colombia, owned by Codensa. |
| | | | |
ENRE | | Ente Nacional Regulador de la Electricidad | | Argentine national regulatory authority for the energy sector. |
| | | | |
FONINVEMEM | | Fondo para Inversiones Necesarias que permitan Incrementar la Oferta de Energía Eléctrica en el Mercado Eléctrico Mayorista | | Argentine fund created to increase electricity supply in the MEM. |
| | | | |
Fortaleza | | Central Geradora Termeletrica Fortaleza S.A. | | Brazilian generation subsidiary that operates in the state of Ceará and is wholly-owned by Enel Brasil. Also commercially known as Enel Geração Fortaleza. |
| | | | |
GEB | | Grupo Energía Bogotá S.A. | | Colombian state-owned financial and energy holding company, with investments in electricity generation, transmission, trading and distribution and natural gas transmission, distribution, and trading sectors. Formerly Empresa Energía de Bogotá S.A. or EEB. |
7
| | | | |
IFRS | | International Financial Reporting Standards | | International Financial Reporting Standards as issued by the International Accounting Standards Board (IASB). |
| | | | |
LNG | | Liquefied Natural Gas. | | Liquefied natural gas. |
| | | | |
MADS | | Ministerio de Ambiente y Desarrollo Sostenible | | Colombian Ministry of Environment and Sustainable Development. |
| | | | |
MEM | | Mercado Eléctrico Mayorista | | Wholesale Electricity Market. There are such markets in each of Argentina, Colombia, and Peru. |
| | | | |
MINEM | | Ministerio de Energia y Minas | | Peruvian Ministry of Energy and Mines. |
| | | | |
NIS | | Sistema Interconectado Nacional | | National interconnected electric system. There are such systems in each of Argentina, Brazil, and Colombia. |
| | | | |
OEF | | Obligación de Energía Firme | | Colombian firm energy commitment of generators to guarantee energy in the long term. |
| | | | |
ONS | | Operador Nacional do Sistema Elétrico | | National Electric System Operator. Brazilian non-profit private entity responsible for the planning and coordination of operations in interconnected systems. |
| | | | |
Osinergmin | | Organismo Supervisor de la Inversión en Energía y Minería | | Energy and Mining Investment Supervisory Authority, the Peruvian regulatory electricity authority. |
| | | | |
OSM | | Ordinary Shareholders’ Meeting | | Ordinary Shareholders’ Meeting |
| | | | |
PPA | | Power Purchase Agreement | | Power Purchase Agreement |
| | | | |
PLD | | Preço de Liquidação das Diferenças | | Settlement price for differences. It is the price assigned to sales and purchases of energy on the Brazilian spot market. |
| | | | |
SAIDI | | System Average Interruption Duration Index | | Index of average duration of interruptions in the power supply. |
| | | | |
SAIFI | | System Average Interruption Frequency Index | | Index of average frequency of interruptions in the power supply. |
| | | | |
SEE | | Secretaria de Energía Argentina | | The Argentine Ministry of Energy and Mining manages the electricity industry through the Argentine Secretary of Energy. |
| | | | |
SEIN | | Sistema Eléctrico Interconectado Nacional | | Peruvian national interconnected electricity system. |
| | | | |
8
SENACE | | Servicio Nacional de Certificación Ambiental para las Inversiones Sostenibles | | Peruvian autonomous national environmental certification service for sustainable investments that reports to the Peruvian Ministry of the Environment. |
| | | | |
TESA | | Transportadora de Energía S.A. | | Transmission company with operations in Argentina and a subsidiary of Enel Brasil, our subsidiary. |
| | | | |
UF | | Unidad de Fomento | | Chilean inflation-indexed, Chilean peso-denominated monetary unit equivalent to Ch$ 29,070.33 as of December 31, 2020. |
| | | | |
UPME | | Unidad de Planificación Minero Energética | | Colombian energy and mining planning unit responsible for planning the expansion of the generation and transmission systems. |
| | | | |
UTA | | Unidad Tributaria Anual | | Chilean annual tax unit. One UTA equals 12 Unidades Tributarias Mensuales (“UTM”), a Chilean inflation-indexed monthly tax unit used to define fines, among other purposes. As of December 31, 2020, one UTM was equivalent to Ch$ 51,029, and one UTA was equal to Ch$ 612,348. |
| | | | |
VAD | | Valor Agregado de Distribución | | Value-added from distribution of electricity. |
| | | | |
XM | | Expertos de Mercado S.A. E.S.P. | | A subsidiary of Interconexión Eléctrica S.A. (“ISA”), a Colombian company that provides system management in real-time services in electrical, financial, and transportation sectors. |
| | | | |
| | | | |
9
As used in this Report on Form 20-F (“Report”), first-person personal pronouns such as “we,” “us” or “our” as well as “Enel Américas” and “the Company” refer to Enel Américas S.A. and our consolidated subsidiaries unless the context indicates otherwise. Unless otherwise noted, our interest in our principal subsidiaries and jointly controlled companies and associates is expressed in terms of our economic interest as of December 31, 2020.
We are a Chilean company engaged through our subsidiaries and jointly controlled companies in the electricity generation, transmission, and distribution businesses in Argentina, Brazil, Colombia, and Peru. We participate in the generation and transmission businesses mainly through our subsidiaries Costanera, Dock Sud, and El Chocón in Argentina; Cachoeira Dourada, Fortaleza, EGP Volta Grande, and Cien in Brazil; Emgesa in Colombia; and Enel Generation Peru and Enel Generation Piura in Peru. In the distribution business, our principal subsidiaries are Edesur in Argentina; Enel Distribution Ceara, Enel Distribution Rio, Enel Distribution Sao Paulo, and Enel Distribution Goias in Brazil; Codensa in Colombia; and Enel Distribution Peru in Peru. For additional information relating to our principal subsidiaries and associates, please see “Item 4. Information on the Company — C. Organizational Structure — Principal Subsidiaries and Affiliates.”
We are a publicly held limited liability stock corporation headquartered in Chile and organized on June 19, 1981, under the laws of the Republic of Chile. During 2016, we completed a corporate reorganization to separate our Chilean businesses from our non-Chilean businesses. As part of this process, the former Enersis S.A. changed its name to Enel Américas S.A. on December 1, 2016. For additional information relating to the company and the corporate reorganization completed in 2016, please see “Item 4. Information on the Company — A. History and Development of the Company — History” and “— The 2016 Reorganization.”
As of the date of this Report, Enel S.p.A. (“Enel”), an Italian energy company with multinational operations in the power and gas markets, owns a beneficial interest of 82.3% of us and is our ultimate controlling shareholder. For additional information relating to the Merger with EGP Americas, please see “Item 4. Information on the Company — A. History and Development of the Company — Merger with EGP Américas and Related Tender Offer.”
10
Financial Information
In this Report, unless otherwise specified, references to “U.S. dollars” or “US$” are to dollars of the United States of America (“United States”); references to “Ar$” or “Argentine pesos” are to the currency of Argentina; references to “R$,” or “reais” are to Brazilian reais, the currency of Brazil; references to “pesos” or “Ch$” are to Chilean pesos, the currency of Chile; references to “COP$” or “Colombian pesos” are to the currency of Colombia; references to “soles” are to Peruvian Soles, the currency of Peru; references to “EUR” are to Euro, the currency of the European Union and references to “UF” are to Unidades de Fomento. The UF is a Chilean inflation-indexed, peso-denominated monetary unit that is adjusted daily to reflect changes in the official Consumer Price Index (“CPI”) of the Chilean National Institute of Statistics (Instituto Nacional de Estadísticas or “INE”). The UF is adjusted in monthly cycles. Each day in the period beginning on the tenth day of the current month through the ninth day of the succeeding month, the nominal peso value of the UF is indexed to reflect a proportionate amount of the change in the Chilean CPI during the prior calendar month. As of December 31, 2020, one UF was equivalent to Ch$ 29,070.33. The U.S. dollar equivalent of one UF was US$ 40.89 as of December 31, 2020, using the Observed Exchange Rate reported by the Central Bank of Chile (Banco Central de Chile) as of December 31, 2020, of Ch$ 710.95 per US$ 1.00. The U.S. dollar observed exchange rate (dólar observado) (the “Observed Exchange Rate”), which is reported by the Central Bank of Chile and published daily on its webpage, is the weighted average exchange rate of the previous business day’s transactions in the Formal Exchange Market. Unless the context specifies otherwise, all amounts translated from Chilean pesos to U.S. dollars or vice versa, or from UF to Chilean pesos, have been carried out at the rates applicable as of December 31, 2020.
Since 2017, our functional currency has been the U.S. dollar, and therefore our consolidated financial statements and other financial information concerning us included in this Report are presented in U.S. dollars. The change of our functional currency was recorded as of January 1, 2017, by translating all items of our consolidated financial statements to the new functional currency, using the exchange rate of Ch$ 669.47 as of January 1, 2017. We also changed the presentation currency of our consolidated financial statements from the Chilean peso to the U.S. dollar. The change in the presentation currency was applied retrospectively as if the U.S. dollar had always been the presentation currency of the consolidated financial statements. The consolidated financial statements for the year ended December 31, 2016, were restated in U.S. dollars using the average exchange rate for each period. For further information about our functional currency, please refer to Note 2.8 of the Notes to our consolidated financial statements.
We have prepared our consolidated financial statements in accordance with International Financial Reporting Standards (“IFRS”), as issued by the International Accounting Standards Board (“IASB”). All our subsidiaries are integrated, and all their assets, liabilities, income, expenses, and cash flows are included in the consolidated financial statements after making the adjustments and eliminations related to intra-group transactions. Our interest in associated companies over which we exercise significant influence is included in our consolidated financial statements using the equity method. For detailed information regarding consolidated entities, jointly controlled entities, and associated companies, see Notes 2.4 and 2.5 of the Notes to our consolidated financial statements.
This Report may contain translations of Chilean peso amounts into U.S. dollars at specified rates. Unless otherwise indicated, the Chilean peso equivalent for information in U.S. dollars is based on the Observed Exchange Rate for December 31, 2020, as defined in “Item 3. Key Information — A. Selected Financial Data — Exchange Rates”. The Federal Reserve Bank of New York does not report a noon buying rate for Chilean pesos. No representation is made that the Chilean peso or U.S. dollar amounts disclosed in this Report could have been or could be converted into U.S. dollars or Chilean pesos at such rate or any other rate. See “Item 3. Key Information — A. Selected Financial Data — Exchange Rates.”
Technical Terms
References to “TW” are to terawatts (1012 watts or a trillion watts); references to “GW” and “GWh” are to gigawatts (109 watts or a billion watts) and gigawatt-hours, respectively; references to “MW” and “MWh” are to megawatts (106 watts or a million watts) and megawatt-hours, respectively; references to “kW” and “kWh” are to kilowatts (103 watts or a thousand watts) and kilowatt-hours, respectively; references to “kV” are to kilovolts, and references to “MVA” are to megavolt amperes. References to “BTU” and “MBTU” are to a British thermal unit and million British thermal units, respectively. A “BTU” is an energy unit equal to approximately 1,055 joules. References to “Hz” are to hertz, and references to “mtpa” are to metric tons per annum. Unless otherwise indicated, statistics provided in this
11
Report concerning the installed capacity of electricity generation facilities are expressed in MW. One TW equals 1,000 GW, one GW equals 1,000 MW, and one MW equals 1,000 kW. Starting in 2018, the installed capacity we present in this Report corresponds to the net installed capacity, which considers the MW that each power plant consumes for its operation. Prior to 2018, the installed capacity we present in this Report corresponds to the gross installed capacity, without considering the MW that each power plant consumes for its operation. Starting in 2020, the electricity sales we present in this Report correspond to gross energy sales. 2019 amounts have been updated to correspond to this new presentation, but 2018 amounts have not been updated to correspond to this new presentation. Beginning in 2020, in calculating the number of customers we consider all customers with a current contract in a given period (rather than only those customers with a current contract who were supplied with energy and billed for it in a given period). 2019 amounts have been updated to correspond to this new presentation, but 2018 amounts have not been updated to correspond to this new presentation.
Statistics relating to aggregate annual electricity production are expressed in GWh and based on a year of 8,760 hours, except for a leap year like 2020, which is based instead on 8,784 hours. Statistics relating to installed capacity and production of the electricity industry do not include electricity of self-generators.
Energy losses experienced by generation companies during transmission are calculated by subtracting the number of GWh of energy sold from the number of GWh of energy generated (excluding their energy consumption and losses on the part of the power plant) within a given period. Losses are expressed as a percentage of total energy generated.
Energy losses during distribution are calculated as the difference between total energy purchased (GWh of electricity demand, including own generation) and the energy sold excluding tolls and energy consumption not billed (also measured in GWh) within a given period. Distribution losses are expressed as a percentage of the total energy purchased. Losses in distribution arise from illegally tapped energy as well as technical losses.
Calculation of Economic Interest
In this report, references are made to the “economic interest” of Enel Américas in its related companies. We could have a direct and indirect interest in such companies. In circumstances in which we do not directly own an interest in a related company, our economic interest in such ultimate affiliated company is calculated by multiplying the percentage of economic interest in a directly held related company by the percentage of economic interest of any entity in the ownership chain of such affiliated company. For example, if we directly own a 6% equity stake in an affiliated company and 40% is directly held by our 60%-owned subsidiary, our economic interest in such associate would be 60% times 40% plus 6%, equal to 30%.
Rounding
Figures included in this Report have been rounded for ease of presentation. Due to rounding, the sums in tables do not always exactly equal the sums of the entries.
12
This Report contains statements that are or may constitute forward-looking statements within the meaning of Section 27A of the Securities Act of 1933, as amended, and Section 21E of the Securities Exchange Act of 1934, as amended (the “Exchange Act”). These statements appear throughout this Report and include statements regarding our intent, belief, or current expectations, including but not limited to any statements concerning:
● | our capital investment program; |
● | trends affecting our financial condition or results of operations; |
● | our dividend policy; |
● | the future impact of competition and regulation; |
● | political and economic conditions in the countries in which our related companies or we operate or may operate in the future; |
● | any statements preceded by, followed by, or that include the words “believes,” “expects,” “predicts,” “anticipates,” “intends,” “estimates,” “should,” “may,” or similar expressions; and |
● | other statements contained or incorporated by reference in this Report regarding matters that are not historical facts. |
Because such statements are subject to risks and uncertainties, actual results may differ materially from those expressed or implied by such forward-looking statements. Factors that could cause actual results to differ materially include but are not limited to:
● | demographic developments, political events, economic fluctuations, social unrest, public health crises and pandemics, and interventionist measures by authorities in the markets in South America in which we operate; |
● | hydrology, droughts, flooding, and other weather conditions; |
● | changes in the environmental regulations and the regulatory framework of the electricity industry in one or more of the countries in which we operate; |
● | our ability to implement proposed capital expenditures, including our ability to arrange financing where required; |
● | the nature and extent of future competition in our principal markets; and |
● | the factors discussed below under “Risk Factors.” |
You should not place undue reliance on such statements, which speak only as of the date that they were made. Our independent registered public accounting firm has not examined or compiled the forward-looking statements and, accordingly, does not provide any assurance concerning such statements. You should consider these cautionary statements together with any written or oral forward-looking statements that we may issue in the future. We do not undertake any obligation to release publicly any revisions to forward-looking statements contained in this Report to reflect later events or circumstances or the occurrence of unanticipated events, except as required by law.
For all these forward-looking statements, we claim the protection of the safe harbor for forward-looking statements contained in the Private Securities Litigation Reform Act of 1995.
13
On April 1, 2021, we completed the acquisition of EGP Américas SpA, a wholly-owned subsidiary of Enel S.p.A., our controlling shareholder, through a merger of EGP Américas SpA with and into Enel Américas. Prior to the merger, EGP Américas SpA, a newly-formed company, held the renewable energy generation businesses in Central and South America (outside of Chile) previously held by Enel Green Power S.p.A. As a result of the merger, we have now strengthened our renewable energy generation business and diversified geographically through exposure to Costa Rica, Guatemala, and Panama, in addition to acquiring new assets in South American countries where we were already present. Enel S.p.A.’s ownership interest in us increased to 75.2% as of April 1, 2021.
On March 15, 2021, Enel S.p.A. launched dual Chilean and U.S. partial public tender offers to acquire shares and ADS of Enel Américas, representing 10% of our then-current share capital, for a cash purchase price of Ch$ 140 per share and the U.S. dollar equivalent of Ch$ 7,000 per ADS. The tender offers expired on April 13, 2021, and the shares and ADSs were accepted for purchase by Enel S.p.A. on April 16, 2021. As a result of the merger and the tender offers, Enel S.p.A. owns 82.3% of our share capital as of the date of this Report.
After giving effect to the issuance of new shares in connection with the merger, and as of the date of this Report, there are 107,281,698,561 shares of common stock outstanding. For additional information on the merger and the tender offers, please see “Item 4. Information on the Company — A. History and Development of the Company — History” and “— Merger with EGP Américas and Related Tender Offer.”
14
Item 1. Identity of Directors, Senior Management and Advisers
Not applicable.
Item 2. Offer Statistics and Expected Timetable
Not applicable.
A. Selected Financial Data.
The following selected consolidated financial data should be read in conjunction with our consolidated financial statements included in this Report. The selected consolidated financial data as of December 31, 2020 and 2019, and for the three years ended December 31, 2020, are derived from our audited consolidated financial statements included in this Report. The selected consolidated financial data as of December 31, 2018, 2017, and 2016, and for the years ended December 31, 2017, and 2016 are derived from our consolidated financial statements not included in this Report. Our consolidated financial statements were prepared in accordance with IFRS, as issued by the IASB.
Our consolidated financial statements are presented in U.S. dollars because of our functional currency’s change from Chilean pesos to U.S. dollars in 2017. The change of our functional currency was recorded as of January 1, 2017, by translating all items of our consolidated financial statements to the new functional currency, using the closing exchange rate at the date of exchange. We also changed the presentation currency of our consolidated financial statements from Chilean pesos to U.S. dollars. The change in the presentation currency was applied retrospectively as if the U.S. dollar had always been the consolidated financial statements’ presentation currency. The consolidated statement of financial position data as of December 31, 2016, was translated into U.S. dollars using the closing U.S. dollar Observed Exchange Rate (dólar observado) of Ch$ 669.47 per US$ 1.00. The consolidated statement of comprehensive income data for the year ended December 31, 2016, was translated into U.S. dollars using the average exchange rate of Ch$ 676.19 per US$ 1.00. For further information about our functional currency, please refer to Note 2.8 of the Notes to our consolidated financial statements The Observed Exchange Rate, which is reported and published daily on the Central Bank of Chile’s web page, corresponds to the weighted-average exchange rate of the previous business day’s transactions in the Formal Exchange Market. For more information concerning historical exchange rates, see “— Exchange Rates” below. The tables are expressed in millions of U.S. dollars, except for ratios, operating data, and data for shares and American Depositary Shares (“ADS”).
15
The following tables set forth our selected consolidated financial data for the years indicated and the operating data of our principal subsidiaries:
| | | | | | | | | | |
| | As of and for the year ended December 31, | ||||||||
|
| 2020 |
| 2019 |
| 2018 |
| 2017 |
| 2016 |
| | (US$ millions) | ||||||||
Consolidated Statement of Comprehensive Income Data | | | | | | | | | | |
Revenues and other operating income | | 12,193 | | 14,314 | | 12,990 | | 10,438 | | 7,643 |
Operating costs(1) | | (10,140) | | (11,545) | | (10,555) | | (8,219) | | (5,843) |
Operating income from continuing operations | | 2,053 | | 2,769 | | 2,435 | | 2,219 | | 1,800 |
Financial results(2) | | (313) | | (378) | | (333) | | (582) | | (439) |
Other gains | | 5 | | 14 | | 1 | | 5 | | 12 |
Share of profit (loss) of associates and joint venture accounted for using the equity method | | 3 | | 1 | | 2 | | 3 | | 3 |
Income from continuing operations before income tax | | 1,748 | | 2,406 | | 2,105 | | 1,646 | | 1,376 |
Income tax expenses, continuing operations | | (567) | | (236) | | (438) | | (519) | | (531) |
Net Income from continuing operations | | 1,181 | | 2,170 | | 1,667 | | 1,127 | | 845 |
Profit after tax from discontinued operations | | — | | — | | — | | — | | 170 |
Net income | | 1,181 | | 2,170 | | 1,667 | | 1,127 | | 1,015 |
Net income attributable to the parent Company | | 825 | | 1,614 | | 1,201 | | 709 | | 566 |
Net income attributable to non-controlling interests | | 356 | | 556 | | 466 | | 417 | | 448 |
Basic and diluted earnings from continuing operations per average number of shares (US$ per share) | | 0.011 | | 0.025 | | 0.021 | | 0.012 | | 0.009 |
Basic and diluted earnings from continuing operations per average number of ADS (US$ per ADS) | | 0.542 | | 1.233 | | 1.045 | | 0.617 | | 0.453 |
Basic and diluted earnings from discontinued operations per average number of shares (US$ per share) | | ― | | ― | | ― | | ― | | 0.002 |
Basic and diluted earnings from discontinued operations per average number of ADS (US$ per ADS) | | ― | | ― | | ― | | ― | | 0.116 |
Total basic and diluted earnings per average number of shares (US$ per share) | | 0.011 | | 0.025 | | 0.021 | | 0.012 | | 0.009 |
Total basic and diluted earnings per average number of ADS (US$ per ADS) | | 0.542 | | 1.233 | | 1.045 | | 0.617 | | 0.453 |
Cash dividends per share (US$ per share) | | 0.011 | | 0.008 | | 0.006 | | 0.005 | | 0.007 |
Cash dividends per ADS (US$ per ADS) | | 0.530 | | 0.419 | | 0.309 | | 0.249 | | 0.332 |
Weighted average number of shares of common stock (millions) | | 76,086 | | 65,481 | | 57,453 | | 57,453 | | 49,769 |
| | | | | | | | | | |
Consolidated Statement of Financial Position Data | | | | | | | | | | |
Total assets | | 26,934 | | 29,776 | | 27,396 | | 20,169 | | 16,851 |
Non-current liabilities | | 9,323 | | 10,794 | | 8,914 | | 6,956 | | 5,150 |
Equity attributable to the parent company | | 8,106 | | 9,966 | | 6,724 | | 6,481 | | 6,200 |
Equity attributable to non-controlling interests | | 2,228 | | 2,280 | | 2,108 | | 1,798 | | 1,680 |
Total equity | | 10,334 | | 12,246 | | 8,832 | | 8,279 | | 7,880 |
Capital stock(3) | | 9,763 | | 9,784 | | 6,763 | | 6,763 | | 6,904 |
| | | | | | | | | | |
Other Consolidated Financial Data | | | | | | | | | | |
Capital expenditures (CAPEX)(4) | | 1,553 | | 1,659 | | 1,541 | | 1,371 | | 1,230 |
Depreciation, amortization and impairment losses(5) | | 1,100 | | 1,225 | | 923 | | 728 | | 630 |
| (1) | Operating expenses represent raw materials and consumables used, other work performed by the entity and capitalized, employee benefit expenses, depreciation and amortization expenses, impairment loss recognized in the period’s profit or loss, and other expenses. |
| (2) | Financial results represent (+) financial income, (-) financial expenses, (+/-) foreign currency exchange differences, and net gains/losses from indexed assets and liabilities. |
| (3) | Capital stock represents issued capital. |
| (4) | CAPEX figures represent cash flows used to purchase property, plant, and equipment, and intangible assets for each year. |
| (5) | Please refer to Note 31 of the Notes to our consolidated financial statements for further detail. |
16
| | | | | | | | | | |
| | As of and for the year ended December 31, | ||||||||
|
| 2020 |
| 2019 |
| 2018 |
| 2017 |
| 2016 |
OPERATING DATA OF PRINCIPAL SUBSIDIARIES(1) | | | | | | | | | | |
| | | | | | | | | | |
Edesur (Argentina) | | | | | | | | | | |
Electricity sold (GWh) | | 15,888 | | 16,798 | | 17,548 | | 17,736 | | 18,493 |
Number of customers (thousands) | | 2,508 | | 2,490 | | 2,530 | | 2,529 | | 2,505 |
Total energy losses (%)(2) | | 18.9 | | 15.5 | | 14.2 | | 12.0 | | 12.0 |
| | | | | | | | | | |
Enel Distribution Rio (Brazil) | | | | | | | | | | |
Electricity sold (GWh) | | 11,228 | | 11,568 | | 11,019 | | 11,091 | | 11,181 |
Number of customers (thousands) | | 2,948 | | 2,940 | | 2,959 | | 3,030 | | 3,054 |
Total energy losses (%)(2) | | 22.1 | | 22.5 | | 21.0 | | 20.4 | | 19.4 |
| | | | | | | | | | |
Enel Distribution Ceara (Brazil) | | | | | | | | | | |
Electricity sold (GWh) | | 11,866 | | 12,197 | | 11,843 | | 11,522 | | 11,628 |
Number of customers (thousands) | | 4,011 | | 3,956 | | 3,933 | | 4,017 | | 3,890 |
Total energy losses (%)(2) | | 15.9 | | 14.0 | | 13.9 | | 13.6 | | 12.5 |
| | | | | | | | | | |
Enel Distribution Goias (Brazil) | | | | | | | | | | |
Electricity sold (GWh) | | 14,469 | | 14,365 | | 13,755 | | 12,264 | | ― |
Number of customers (thousands) | | 3,207 | | 3,114 | | 3,027 | | 2,928 | | ― |
Total energy losses (%)(2) | | 11.4 | | 12.3 | | 11.6 | | 11.7 | | ― |
| | | | | | | | | | |
Enel Distribution Sao Paulo (Brazil) | | | | | | | | | | |
Electricity sold (GWh) | | 40,350 | | 43,148 | | 24,693 | | ― | | ― |
Number of customers (thousands) | | 7,896 | | 7,777 | | 7,224 | | ― | | ― |
Total energy losses (%)(2) | | 10.6 | | 9.6 | | 9.5 | | ― | | ― |
| | | | | | | | | | |
Codensa (Colombia) | | | | | | | | | | |
Electricity sold (GWh) | | 13,834 | | 14,307 | | 14,024 | | 13,790 | | 13,632 |
Number of customers (thousands) | | 3,615 | | 3,527 | | 3,439 | | 3,340 | | 3,248 |
Total energy losses (%)(2) | | 7.6 | | 7.7 | | 7.7 | | 7.8 | | 7.1 |
| | | | | | | | | | |
Enel Distribution Peru (Peru) | | | | | | | | | | |
Electricity sold (GWh) | | 7,578 | | 8,211 | | 8,045 | | 7,934 | | 7,782 |
Number of customers (thousands) | | 1,456 | | 1,434 | | 1,423 | | 1,397 | | 1,367 |
Total energy losses (%)(2) | | 8.8 | | 8.2 | | 8.1 | | 8.2 | | 7.8 |
| | | | | | | | | | |
Enel Américas | | | | | | | | | | |
Installed capacity in Argentina (MW)(3) | | 4,419 | | 4,419 | | 4,419 | | 4,419 | | 4,537 |
Installed capacity in Brazil (MW)(3)(4) | | 1,354 | | 1,354 | | 1,354 | | 1,354 | | 1,372 |
Installed capacity in Colombia (MW)(3) | | 3,506 | | 3,506 | | 3,499 | | 3,467 | | 3,509 |
Installed capacity in Peru (MW)(3) | | 1,990 | | 1,987 | | 1,985 | | 1,979 | | 2,026 |
Generation in Argentina (GWh) | | 13,901 | | 12,974 | | 13,949 | | 14,825 | | 13,124 |
Generation in Brazil (GWh)(4) | | 4,823 | | 5,292 | | 3,755 | | 4,034 | | 4,034 |
Generation in Colombia (GWh) | | 14,009 | | 15,250 | | 14,052 | | 14,765 | | 14,952 |
Generation in Peru (GWh) | | 7,722 | | 8,244 | | 8,106 | | 7,430 | | 8,698 |
| (1) | Some information may be different than reported in previous periods. For further details, please refer to “Item 4. Information on the Company — B. Business Overview. — Electricity Distribution Business.” |
| (2) | Energy losses in distribution arise from illegally tapped energy and technical losses. They are calculated as the difference between total energy generated and purchased (GWh) and energy sold, excluding tolls and energy consumption not billed (GWh) within a given period. Losses are expressed as a percentage of the total energy purchased. |
| (3) | Installed capacity figures may differ from previous years due to the fact that, starting in 2018, we began reporting the net installed capacity instead of the gross installed capacity. |
| (4) | Since 2017, data includes Volta Grande hydroelectric plant’s capacity and generation due to its acquisition and consolidation since November 2017. |
17
Exchange Rates
Fluctuations in the exchange rate between the Chilean peso and the U.S. dollar will affect the U.S. dollar equivalent of the price in Chilean pesos of our shares of common stock on the Santiago Stock Exchange (Bolsa de Comercio de Santiago) and the Chilean Electronic Stock Exchange (Bolsa Electrónica de Chile). These fluctuations in the exchange rate affect the price of our ADS and the dividends we pay (see “Item 8. Financial Information — A. Consolidated Statements and Other Financial Information — Dividends”). Also, to the extent that significant financial liabilities are denominated in foreign currencies, fluctuations in the exchange rate may significantly impact our earnings.
For further details regarding fluctuation in the exchange rates between the U.S. dollar and the local currency in each of the countries in which we operate, please refer to “Item 5. Operating and Financial Review and Prospects — a. Operating Results. — 1. Discussion of Main Factors Affecting Operating Results and Financial Condition of the Company — d. Economic Conditions — Local Currency Exchange Rate.”
B. Capitalization and Indebtedness.
Not applicable.
C. Reasons for the Offer and Use of Proceeds.
Not applicable.
D. Risk Factors.
Risk Related to Our Business
Our businesses depend heavily on hydrology and are affected by droughts, flooding, storms, ocean currents, and other inclement weather conditions.
Approximately 55% of our consolidated installed generation capacity in 2020 was hydroelectric. Accordingly, arid hydrological conditions could negatively affect our business, results of operations, and financial condition. Regional hydrological conditions have often been subject to two weather phenomena dealing with ocean currents - El Niño and La Niña - that influence rainfall and may result in drought or flooding, depending on the region affected. Droughts may affect our ability to dispatch energy from our hydroelectric facilities.
In the past, El Niño has affected Colombian hydrologic conditions, where 88% of our installed capacity is hydroelectric, leading to rainfall deficits, high temperatures, and higher energy prices. In March 2017, “El Niño Costero” in Peru led to unusually intensive rains that flooded the Santa Eulalia River, caused innumerable landslides and avalanches in the coastal basins, and resulted in the stoppage of several of our hydroelectric power plants, mainly Callahuanca (84 MW) and Moyopampa (69 MW). Each ocean current event is unique and, depending on its intensity and duration, the magnitude of the social and economic effects could be material.
Our distribution business is also affected by inclement weather, mainly in Argentina. With extreme temperatures, demand can increase significantly within a short period, affecting service and resulting in service outages that may result in fines. Depending on weather conditions, results obtained by our distribution business can vary from year to year.
Our operating expenses increase during drought periods when thermal power plants, which have higher operating costs relative to hydroelectric power plants, are dispatched more frequently. Depending on our commercial obligations, we may need to buy electricity at higher spot prices to comply with our contractual supply obligations. Beyond increasing operating costs, the cost of these electricity purchases may exceed our contracted electricity sale prices, thus potentially producing losses from those contracts. For further information concerning the effect of hydrology on our business and financial results, please refer to “Item 5. Operating and Financial Review and Prospects— A. Operating Results — 1. Discussion of Main Factors Affecting Operating Results and Financial Condition of the Company—a. Generation and Transmission Business.”
18
Droughts also indirectly affect the operation of our thermal power plants, including our facilities that use natural gas, fuel oil, or coal, in the following manner:
● | Our thermal power plants require water for cooling, and droughts may reduce water availability and increase transportation costs. As a result, we may have to purchase water from agricultural areas that are also experiencing water shortages. These water purchases may increase our operating costs and require us to negotiate further with the local communities. |
● | Thermal power plants generate emissions such as nitrogen oxide (NO), carbon dioxide (CO2), carbon monoxide (CO), sulfur dioxide (SO2), and particulate matter into the atmosphere. Therefore, greater use of thermal power plants during droughts generally increases the risk of producing higher greenhouse gas (GHG) emissions. |
A full recovery from the drought affecting the regions where most of our hydroelectric power plants are located may last for an extended period, and new drought periods may recur in the future. Prolonged droughts may exacerbate the risks described above and have a further negative effect on our business, results of operations, and financial condition.
We depend on payments from our subsidiaries and associates to meet our payment obligations.
We rely on cash from dividends, loans, interest payments, capital reductions, and other distributions from our subsidiaries and equity affiliates to pay our obligations. Such payments and distributions are subject to legal constraints, such as dividend restrictions, fiduciary obligations, contractual limitations, and foreign exchange controls imposed by local authorities.
Historically, we have not always accessed some of our operating subsidiaries’ cash flows due to government regulations, strategic considerations, economic conditions, and credit restrictions. In the future, we may not always be able to immediately rely on cash flows from operating subsidiaries to repay our debt.
Dividend Limits and Other Legal Restrictions: Some of our subsidiaries are subject to legal reserve requirements and other restrictions on dividend payments. Other legal restrictions, such as foreign currency controls, may limit our subsidiaries and equity affiliates’ ability to pay dividends and make loan payments or other distributions to us. Their directors’ fiduciary duties to their minority shareholders may restrict the ability of any of our subsidiaries that are not wholly-owned to distribute cash to us. Furthermore, local authorities may force some of our subsidiaries, under applicable regulation, to reduce or eliminate dividend payments. These restrictions could impede our subsidiaries from distributing cash to us under certain circumstances.
Contractual Constraints: Distribution restrictions included in the credit agreements of our subsidiaries, including most of our subsidiaries in Brazil, may prevent dividends and other distributions to shareholders if they do not comply with specified financial ratios. Our credit agreements typically prohibit any distributions in the event of ongoing default.
Operating Results of Our Subsidiaries: Our subsidiaries and equity affiliates’ ability to pay dividends or make loan payments or other distributions to us is limited by their operating results. To the extent that any of our subsidiaries’ cash requirements exceed their available cash, they will not be able to make funds available to us.
The currency of any dividend paid by our subsidiaries is subject to depreciation in relation to our functional currency, which may adversely affect our ability to pay dividends to shareholders.
The situations described above could adversely affect our business, results of operations, and financial condition.
We are involved in litigation proceedings.
We are involved in various litigation proceedings that could result in unfavorable decisions or financial penalties against us. In Colombia, we exercise control over Emgesa and Codensa through shareholder agreements with Grupo Energía Bogotá S.A. (“GEB”). In October 2018, GEB initiated arbitration proceedings for alleged breach of the shareholder agreements concerning the failure to distribute 100% of the profits in 2016, 2017, and 2018 in Emgesa and Codensa and the breach of other provisions of the shareholders’ agreement, and also requested compensation for damages. The financial claim amounts to COP$ 1,876,417,133 thousand (US$ 548.3 million) plus interest. An adverse
19
ruling could set a precedent that would oblige us always to vote in favor of a 100% distribution of distributable profits, which in turn might not always be financially prudent.
Our financial condition or results of operations could be unfavorably affected if we are unsuccessful in defending litigations or other lawsuits and proceedings against us. Please see Note 35.3 of the Notes to our consolidated financial statements for further information on litigation proceedings.
Construction and operation of power plants may encounter significant delays, stoppages, cost overruns, and stakeholder opposition that may damage our reputation and potentially impair our goodwill with stakeholders.
Our power plant projects may be delayed in obtaining regulatory approvals or may face shortages and increases in the price of equipment, materials, or labor. They may be subject to construction delays, strikes, accidents, and human error. Any such event could negatively affect our business, results of operations, and financial condition.
Market conditions may change significantly between the approval and completion of a project, which, in some cases, may decrease a project’s profitability or render it impracticable. Deviations in market conditions, such as estimates of timing and expenditures, may lead to cost overruns and delays in project completion that widely exceed our initial forecasts. In turn, this may have a material adverse effect on our business, results of operations, and financial condition.
We may develop new projects in locations that are sometimes challenging in geographical topography, such as mountain slopes, jungles, or other areas with limited access. Additionally, given some projects’ locations, there may be additional inherent risks to archeological heritage sites. These factors may also lead to significant delays and cost overruns.
Our thermal power plants’ operation, especially those that are coal-fired, may affect our goodwill with stakeholders due to GHG emissions that could unfavorably affect the environment and nearby residents. Furthermore, outside stakeholders may influence the interests and perceptions of the local communities about the Company. If we fail to address appropriately all relevant stakeholders’ concerns, including environmental, social and governance criteria (“ESG”), we may face opposition, which could negatively affect our reputation, stall operations, or lead to litigation threats or actions. Our reputation is the foundation of our relationship with key stakeholders and other constituencies. If we do not effectively manage these sensitive issues, they could adversely affect our business, results of operations, and financial condition.
Damage to our reputation may exert considerable pressure on regulators, creditors, and other stakeholders, possibly leading to the abandonment of projects and operations. This damage could cause our share prices to drop and hinder our ability to attract and retain valuable employees. Any of these outcomes could result in an impairment of our goodwill with stakeholders.
Our long-term energy sales contracts are subject to fluctuations in the market prices of certain commodities, energy, and other factors.
We have exposure to fluctuations in certain commodity market prices that affect our long-term energy sales contracts. These contracts commit our subsidiaries to material obligations as selling parties and contain prices indexed to different commodities, exchange rates, inflation, and the market price of electricity. Unfavorable changes to these indices would reduce the rates we charge under these contracts, which could adversely affect our business, results of operations, and financial condition. In our distribution business, we also have economic exposure to fluctuations in energy prices.
We are subject to incremental risks in distribution markets that are becoming more liberalized.
In some countries, our distribution customers who meet the minimum and maximum demand requirements may freely choose unregulated tariffs. This flexibility may adversely affect our operating income. In some cases, customers may choose an alternative energy provider, which could adversely affect our business, results of operations, and financial condition.
20
Our electricity business is subject to risks arising from natural disasters, catastrophic accidents, and acts of vandalism or terrorism, which could unfavorably affect our operations, earnings, and cash flow.
Our primary facilities include power plants and transmission and distribution assets that are exposed to damage from catastrophic natural disasters, such as earthquakes and fires, human causes, as well as acts of vandalism, protests, riots, and terrorism. A catastrophic event could cause prolonged unavailability of our assets, disruptions in our business, significant decreases in revenues due to lower demand, or significant additional costs not covered by our business interruption insurance. There may be lags between a significant accident or catastrophic event and the final reimbursement from our insurance policies, which typically carry a deductible and are subject to per event policy maximum amounts.
In mid-October 2019, widespread street demonstrations and protests erupted in Santiago and quickly spread throughout Chile. These actions became commonplace and, at times, were accompanied by looting, arson, and vandalism. Violent confrontations between protesters and the police and armed forces resulted in a significant loss of human lives and serious injuries. Accumulated damage to public and private property amounted to billions of dollars. Damage to the country’s economy, prospects for growth, perception of risk, and immediate repercussions in unemployment and productivity loss were also significant. Our corporate headquarters in Santiago suffered a severe arson attack on October 18, 2019, resulting in the dislocation of our management and headquarters employees for an extended period. In a globalized and interconnected world, all the countries in which we operate are subject to this risk.
Any natural or human catastrophic disruption to our electricity assets in the countries in which we operate could significantly affect our results of operations and financial condition.
We are subject to financing risks, such as those associated with funding our new projects and capital expenditures or refinancing existing obligations.
As of December 31, 2020, our consolidated debt totaled US$ 6.1 billion, and our holding company debt in Chile totaled US$ 1.1 billion. As of December 31, 2020, we held US$ 601 million in SEC-registered bonds issued in the U.S. and had drawn bank debt under Senior Unsecured Revolving Credit Agreements in the aggregate amount of US$ 325 million, all governed under the laws of the State of New York.
Our debt agreements are subject to several of the following provisions, including (1) financial covenants, (2) affirmative and negative covenants, (3) events of default, (4) mandatory prepayments for contractual breaches, (5) change of control clauses for material mergers and divestments, and (6) bankruptcy and insolvency proceeding covenants, among others.
A significant portion of our financial indebtedness is subject to cross default provisions, which have varying definitions, criteria, materiality thresholds, and applicability concerning subsidiaries that could result in cross default. Our debt may also become immediately due and payable in cases involving bankruptcy or insolvency proceedings of a significant or material subsidiary. Likewise, some of our debtholders may decide to accelerate our debt in cross default events dealing with significant or material subsidiaries, among other potential covenant defaults.
We may be unable to refinance our debt or obtain such refinancing in terms acceptable to us. In the absence of such refinancing, we could be forced to liquidate assets at unfavorable prices to make payments due on our debt. Furthermore, we may be unable to sell our assets at opportune moments or sufficiently high prices to obtain proceeds that would enable us to make such payments.
We may also be unable to raise the necessary funds required to finish our projects under development or construction. Market conditions or unforeseen project costs prevailing when we need funds could compromise our ability to finance these projects and expenditures.
As of the date of this Report, Brazil is the country with our highest refinancing risk. As of December 31, 2020, the debt of our Brazilian subsidiaries amounted to US$ 2.5 billion while the debt of our Colombian subsidiaries amounted to US$ 1.7 billion.
Our inability to finance new projects or capital expenditures, refinance our existing debt, or comply with our covenants could negatively affect our results of operations and financial condition.
21
If third-party electricity transmission facilities, gas pipeline infrastructure, or fuel supply contracts fail to provide us with adequate service, we may be unable to deliver the electricity we sell to our final customers.
We depend on transmission facilities owned and operated by other companies to deliver the electricity we sell. This dependence exposes us to several risks. If the transmission is disrupted, or its capacity is inadequate, we may be unable to sell and deliver our electricity. If a region’s power transmission infrastructure is inadequate, our recovery of sales costs and profits may be insufficient. If restrictive transmission price regulations are imposed, transmission companies may not have sufficient incentives to invest in expanding their infrastructure, which could unfavorably affect our results of operations and financial condition or affect our ability to deploy our portfolio of projects under development. The construction of new transmission lines may take longer than in the past, mainly because of sustainability, social, and environmental requirements that create uncertainties regarding project completion timing. As a result, in some of the countries in which we operate, renewable energy projects are being completed faster than new transmission projects, creating a backlog of electricity that can be transmitted through current transmission systems. In Argentina, for example, the lack of investment in transmission lines will reduce incentives for the development of renewable energy projects.
We also rely on pipelines to obtain natural gas, mainly in Peru, where more than 50% of our generation capacity is thermal. In recent years, the Peruvian system has occasionally faced gas and electricity shortages due to a lack of sufficient capacity in the pipeline and transmission lines, which led to higher spot prices. Depending on the facility type, our thermal generation power plants purchase gas, coal, diesel, and other fuels to produce electricity. Any contract breach or supply shortage may prevent our facilities from producing electricity on time.
We may be unable to reach satisfactory collective bargaining agreements with our unionized employees or retain key employees in labor conflict cases.
A large percentage of our employees are members of unions with which we have collective bargaining agreements that must be renewed regularly. Our business, results of operations, and financial condition could be unfavorably affected by a failure to reach a collective bargaining agreement with any labor union or by a deal with a labor union that contains terms we view as unfavorable. Laws in many of the countries in which we operate provide legal mechanisms for judicial authorities to impose a collective bargaining agreement if the parties cannot come to an agreement, which may materially increase our costs.
We employ many highly specialized employees. Specific actions such as strikes, walkouts, or work stoppages by these employees could negatively impact our business, results of operations, financial conditions, and reputation.
We may be unable to enter into suitable acquisitions or successfully integrate businesses that we acquire.
We review acquisition prospects that may increase our market coverage or provide synergies with our existing businesses on an ongoing basis. However, there can be no assurance that we will be able to identify and acquire suitable companies in the future. The acquisition and integration of independent companies that we do not control is generally a complicated, costly, and time-consuming process that requires significant efforts and expenditures. For example, as a result of the acquisition of Enel Distribution Sao Paulo in 2018, our leverage at the onset increased considerably due to the new debt for the purchase itself and the consolidation of Enel Distribution Sao Paulo’s existing debt.
Integrating acquired businesses may be difficult, expensive, time-consuming, and a strain on our resources and relationships with our employees and customers. Ultimately, these acquisitions may not be successful or achieve the expected benefits. Any delays or difficulties encountered in connection with acquisitions and the integration of their operations could have a material adverse effect on our business, results of operations, or financial condition.
For example, our integration with EGP Américas may be difficult and expensive. The merger with EGP Américas involves integrating a mature business, as is the case of our conventional energy business, with EGP Américas’ non-conventional renewable energy business. Our goal in integrating the operations is to increase the revenues and earnings of the combined businesses and, as a combined company, to improve our ability to satisfy our customers’ demands. In so doing, we may encounter substantial difficulties in integrating our operations and could incur high costs as a result of, among other things:
| ● | inconsistencies in standards, controls, procedures and policies, business cultures and compensation structures between EGP Américas and us and the need to implement, integrate and harmonize various business-specific |
22
| operating procedures and systems, as well as our financial, accounting, information, and other systems and those of EGP Américas; |
| ● | diversion of management’s attention from their other responsibilities as a result of the need to deal with integration issues; |
| ● | failure to retain our customers and suppliers and those of EGP Américas; |
| ● | difficulties in achieving full utilization of our assets and resources and those of EGP Américas; and |
| ● | complications in retaining key employees (who may depart because of issues relating to the uncertainty and difficulty of integration or general discontent) or efficiently managing the broader organization. |
Under any of these circumstances, the business growth opportunities, revenue benefits, and other benefits anticipated by us to result from the completion of the merger with EGP Américas may not be achieved as expected. To the extent that we incur higher integration costs or achieve lower revenue benefits than expected, our results of operations and financial condition may suffer. The diversion of management attention and any difficulties encountered from this merger could increase costs or reduce our revenues, earnings, and operating results. Any delays encountered in the integration process could have an adverse effect on our revenues, expenses, operating results, and financial condition, which may adversely affect our securities’ value.
Interruption in or failure of our information technology, control, and communications systems or cyberattacks to or cybersecurity breaches of these systems could have a material adverse effect on our business, results of operations, and financial condition.
We operate in an industry that requires the continued operation of sophisticated information technology, control, and communications systems (“IT Systems”) and network infrastructure. We use our IT Systems and infrastructure to create, collect, use, disclose, store, dispose of, and otherwise process sensitive information, including company and customer data and personal information regarding customers, employees and their dependents, contractors, shareholders, and other individuals. IT Systems are critical to controlling and monitoring our power plants’ operations, maintaining generation and network performance, generating invoices to bill customers, achieving operating efficiencies, and meeting our service targets and standards in our generation business. The operation of our generation system is dependent not only on the physical interconnection of our facilities with the electricity network infrastructure but also on communications among the various parties connected to the network. The reliance on IT Systems to manage information and communication among those parties has increased significantly since the implementation of smart meters and intelligent grids in Brazil and Colombia.
Our generation facilities, IT Systems, and other infrastructure and the information processed in our IT Systems, could be affected by cybersecurity incidents, including those caused by human error. Our industry has begun to see an increased volume and sophistication of cybersecurity incidents from international activist organizations, nation-states, and individuals and are among the emerging risks identified in our planning process. Cybersecurity incidents could harm our business by limiting our generation capabilities, delaying our development and construction of new facilities or capital improvement projects to existing facilities, disrupting our customer operations, or exposing us to various events that could compromise our liability. Our business systems are part of an interconnected system. Therefore, a disruption caused by the impact of a cybersecurity incident in the electric transmission grid, network infrastructure, fuel sources, or our third-party service providers’ operations could also unfavorably affect our business.
Our business requires the collection and storage of personally identifiable information of our customers, employees, and shareholders, who expect that we will adequately protect the privacy of such information. Cybersecurity breaches may expose us to a risk of loss or misuse of confidential and proprietary information. Significant theft, loss, or fraudulent use of personally identifiable information may lead to high costs to notify and protect the impacted persons. It could cause us to become subject to significant litigation, losses, liability, fines, or penalties, any of which could materially and adversely affect our results of operations and reputation. We would eventually have to incur significant costs associated with governmental actions in response to such intrusions or strengthen our information and electronic control systems.
23
The cybersecurity threat is dynamic, evolving, and increasing in sophistication, magnitude, and frequency. We may be unable to implement adequate preventive measures or accurately assess the likelihood of a cybersecurity incident. We are unable to quantify the potential impact of cybersecurity incidents on our business and reputation. These potential cybersecurity incidents and corresponding regulatory action could result in a material decrease in revenues and high additional costs, including penalties, third-party claims, repair costs, increased insurance expense, litigation costs, notification and remediation costs, security costs, and compliance costs.
Risk Related to Regulatory Matters
Governmental regulations may unfavorably affect our businesses, cause delays, impede the development of new projects, or increase the costs of operations and capital expenditures.
Our businesses and the tariffs we charge to our customers are subject to extensive regulation that may negatively affect our profitability. For example, governmental authorities in any of the countries where we operate may impose material rationing policies during droughts or prolonged failures of power facilities, which may adversely affect our business, results of operations, and financial condition.
Electricity regulations issued by governmental authorities in the countries where we operate may affect our generation companies’ ability to collect revenues sufficient to offset their operating costs, which could adversely affect our business, results of operations, and financial condition. Governmental authorities may also delay the distribution tariff review process, or tariff adjustments determined by regulatory authorities may be insufficient to pass on our costs to customers.
Our operating subsidiaries are also subject to environmental regulations that, among other things, require us to perform environmental impact studies on future projects and obtain construction and operating permits from local and national regulators. Governmental authorities may withhold or delay the approval of these permits until the completion of environmental impact studies. Therefore, their processing time may be longer than expected. Environmental regulations for existing and future generation capacity have become stricter and require increased capital investments. Any delay in meeting the required emission standards may constitute a violation of the environmental regulations. Failure to certify monitoring systems’ original implementation and ongoing emission standard requirements may result in significant penalties, sanctions, or legal claims for damages. We expect that more restrictive emission limits will be established in the future.
Changes to laws and regulations or governmental authorities’ interpretation of laws and regulations could result in delays or modifications to proposed projects, which could adversely affect our business, results of operations, and financial condition.
We are subject to potential business and financial risks resulting from climate change legislation and regulation to limit GHG emissions.
Future climate change legislation and regulation restricting or regulating GHG emissions could increase our operating costs and have a material adverse effect on our business, results of operations, and financial condition. The adoption and implementation of any international treaty, legislation, or regulation imposing new or additional reporting obligations or limiting emissions of GHGs from our operations could require us to incur additional costs to comply with such requirements and possibly require the reduction or limitation of GHG emissions associated with our operations. These higher compliance standards may involve additional costs to operate and maintain our equipment and facilities, install emission controls, or pay taxes and fees relating to GHG emissions, which could have a material adverse effect on our business, results of operations, and financial condition.
Our business and profitability could be unfavorably affected if water rights are denied, if water concessions are granted with limited duration, or if the cost of water rights is increased.
Each country’s respective authority grants us water rights for water supply from rivers, lakes, and reservoirs near our production facilities. In Colombia, water rights and water concessions are awarded for different periods for each of our power plants, in some cases for up to 50 years. However, these concessions may be revoked for specific reasons, including a progressive water decrease or depletion, and water for human consumption has priority over any other use. In Peru, the concessions are granted for indefinite periods but could be revoked due to scarcity or a decline in service
24
quality. In Argentina, hydroelectric generators with a generation capacity exceeding 500 kW must obtain a concession to use public water sources for a determined or indefinite term.
Any limitations on our current water rights, additional water rights, or the current unlimited duration of water concessions could have a material adverse effect on our hydroelectric development projects and profitability.
Regulatory authorities may impose fines on our subsidiaries due to operational failures or breaches of regulations.
Our electricity businesses may be subject to regulatory fines for any breach of current regulations, including failures to supply energy, in the four countries where we operate. Local regulatory entities supervise our generation subsidiaries. We may be subject to fines when the regulator determines that the company is responsible for the operational failures that affect the regular energy supply to the system. Our subsidiaries may be required to pay fines or compensate customers if they cannot deliver electricity, even if such failures are not within their control, or when they do not meet environmental or other standards. Fines may also be associated with a breach of regulations.
In 2018, the Peruvian National Superintendence of Customs and Tax Administration (“SUNAT” in its Spanish acronym) fined Enel Generation Peru US$ 2.9 million after an audit of the Ad Valorem General Sales Tax and Municipal Promotion Tax on imports for 2008 and 2009. In 2020, the Brazilian governmental agency for electric energy (“ANEEL” in its Portuguese acronym) fined Enel Distribution Goias R$ 43.2 million due to flaws in technical procedures and commercial issues related to the quality of electricity supply and Enel Distribution Ceara and Enel Distribution Sao Paulo R$ 21 million and R$ 186 million respectively, in each case due to flaws in the registration of the respective company’s asset base. In 2020, the Argentine national regulatory authority for the energy sector (“ENRE” in its Spanish acronym) fined Edesur Ar$ 1.5 million for breaches of the public highway safety regime.
Risk Related to Countries in South America and Other Global Risks
Certain South American countries have been historically characterized by frequent and occasionally drastic economic interventionist measures by governmental authorities, including expropriations that may adversely affect our business and financial results.
Governmental authorities have altered monetary, credit, tariff, tax, and other policies to influence South American countries, including Argentina, Brazil, Colombia, and Peru. Even though we do not have electricity operations in Chile, our company is established under the laws of the Republic of Chile. It is also subject to changes in Chilean tax, labor, and monetary laws, among others. Other governmental actions in the South American countries in which we operate have also involved wage, price, and tariff rate controls and other interventionist measures, such as expropriation or nationalization.
If we do not meet minimum service and technical standards in the distribution business, we may lose our concessions. In some concession areas, such as those in Buenos Aires, Goiás, and Rio de Janeiro, it may be challenging to satisfy specific minimum standards that, if not met, empower regulators to revoke our concessions and reassign them to our competitors. For example, a loss of a concession by one of our significant subsidiaries could lead to a default of a debt obligation by such subsidiary, which could trigger a cross default, bankruptcy, or insolvency proceedings. Such events could have a material adverse effect on our contractual obligations under debt covenants.
For 2021, we expect tax reforms and amendments to the current tax laws in Colombia that will charge VAT tax on products that currently are tax-free, increase the income tax base on natural persons, and reduce or eliminate tax benefits. Changes in governmental and monetary policies regarding tariffs, exchange controls, regulations, and taxation could reduce our profitability. Inflation, devaluation, social instability, and other political, economic, diplomatic developments or crises, including governments’ response in the region to these circumstances, could also reduce our profitability.
South American economic fluctuations, political instability, and corruption scandals may affect our results of operations, financial condition, and the value of our securities.
All our operations are in South America. Accordingly, our consolidated revenues may be affected by the performance of South American economies. If local, regional, or worldwide economic trends adversely affect the economy of any of the countries in which we operate, our financial condition and results of operations could also be
25
adversely affected. We operate in Argentina, Brazil, Colombia, and Peru, more volatile countries that at times have experienced political instability due to, among other things, corruption scandals involving several high-ranking government officials. South American financial and securities markets are influenced by economic and market conditions in other countries, which could unfavorably affect our securities’ value.
Also, the challenges arising from changes in economic conditions, regulatory policies, laws governing foreign trade, manufacturing, development and investment, and various crises in the countries in which we operate and other South American countries, either individually or in the aggregate, could severely affect the economies in these countries and our business, result of operations, and financial condition. For example, in December 2019, after a steep devaluation of the Argentine peso against the U.S. dollar, the Argentine government declared a public emergency. It enacted several emergency economic measures to stabilize the economy and resolve the resulting social crisis. In Peru, in November 2020, Congress removed President Vizcarra from office based on alleged corruption charges. Manuel Merino, the head of Congress, assumed the office as acting president, only to resign one week later, along with his entire cabinet, due to mass protests. Congress subsequently appointed Francisco Sagasti as the third president in one week. In Colombia, large demonstrations against the government took place in November and December 2019. Initially, the protests were organized by students, unions, and indigenous groups opposed to proposed changes to the Colombian pension and labor laws. The protests expanded rapidly to encompass economic inequality, corruption, possible austerity measures, and rising violence in the countryside. After several months of lockdown, protests resumed in October 2020 due to the Covid-19 pandemic, including a national strike demanding governmental reforms.
In Chile, widespread protests began in October 2019, resulting in a declaration of a state of emergency for a brief period, the introduction of several social and economic reforms. In October 2020, the government held a referendum to decide whether to create a new Chilean constitution and whether a popularly elected assembly or a combination of current legislators and a popularly elected assembly would draft the new constitution. Nearly 80% of voters approved the referendum for a new constitution and opted to have a popularly elected assembly draft the new constitution. Although we do not have operations in Chile, our management and headquarters are in Chile, and our common stock is traded on the Chilean Stock Exchanges. Demonstrations and civil unrest in the countries in which we operate and Chile may continue or worsen, which could negatively impact these countries’ economies and adversely affect our business, results of operations, financial condition, and value of our securities.
Insufficient cash flows from our subsidiaries located in these countries have resulted in their inability to meet debt obligations and the need to seek waivers to comply with some debt covenants. To a limited extent, these subsidiaries may require guarantees or other emergency measures from us as shareholders, especially those located in Brazil and Argentina. For further details regarding financial support provided to our Brazilian subsidiaries, please refer to “Item 7. Major Shareholders and Related Party Transactions — B. Related Party Transactions.”
Future adverse developments in these countries may impair our ability to execute our strategic plan, which could adversely affect our growth, results of operations, and financial condition.
A further deterioration of Argentina’s economic situation or further devaluation of the Argentine peso could have an adverse effect on our operations and profitability.
Since July 2018, Argentina has been considered a hyperinflationary economy according to IFRS accounting standards. A general price index was used to present the amounts related to our Argentine subsidiaries in our consolidated financial statements retrospectively to reflect the changes in the purchasing power of the Argentine peso under the provisions outlined in IAS 29, “Financial Reporting in Hyper-Inflationary Economies.” Non-monetary assets and liabilities were restated as of February 2003, the latest date in which an inflation adjustment for accounting purposes was applied in our Argentine subsidiaries. Our consolidated financial statements have not been restated to reflect the gain from the indexation of our Argentine subsidiaries’ non-monetary assets and liabilities before January 1, 2018. Such monetary gain up to that date was recognized as an adjustment to our retained earnings as of January 1, 2018 (please see Note 2.9 of the Notes to our consolidated financial statements).
The Argentine peso experienced one of the steepest devaluations against the U.S. dollar in 2019 and 2020, amounting to an annual depreciation of 37.1% and 28.8%, respectively. Further deterioration of Argentina’s economy, a continued devaluation of the Argentine peso against the U.S. dollar driven by hyperinflation, or the initial freezing and subsequent lowering of electricity distribution tariffs could adversely affect our results of operations and financial condition.
26
We are subject to the adverse effects of worldwide pandemics.
An international public health crisis, such as the one attributable to the Covid-19 pandemic that began in December 2019, has led to high unemployment levels in all the countries in which we operate and has impacted the electricity demand, the financial markets, and the ability of our businesses to generate income. For the year ended December 31, 2020, our sales from energy distribution were 4.5% lower than in the same period of 2019, net production fell 3.1% as compared to the same period of 2019, and sales from energy generation decreased 7.7% as compared to the same period of 2019. Our collection rates fell 4.7% in Peru, 2.0% in Colombia, 1.9% in Argentina, , and 1.5% in Brazil as compared to the same period of 2019. We estimate that the impact on our net income caused by the Covid-19 pandemic stems from lower energy demand and increased uncollectible debts. For further information with respect to the pandemic effect on our business and financial results, please refer to “Item 5. Operating and Financial Review and Prospects — A. Operating Results”.
In March 2020, in response to the Covid-19 pandemic, governments in all the countries where we operate declared some form of a state of emergency recognized by their respective constitutions. These declarations granted each government various special powers, such as control over public spending, military use, license to close businesses and schools, and the ability to restrict border crossings and domestic travel through quarantines and other measures. Governments of the countries in which we operate took the following measures, among others, to preserve access to essential services and preserve business continuity:
| ● | In March 2020, Argentina enacted a rule to forbid companies providing essential services from cutting service due to non-payment for 180 days for low-income residential customers, small businesses, and companies providing other essential services, such as health facilities. In May 2020, the Argentine regulator issued a resolution to allow users who have reduced their demand 50% or more to suspend their payments or make them in 30 installments. |
| ● | Brazil enacted a similar prohibition on the suspension of electricity supply due to non-payment for all residential customers and companies and facilities providing essential services. This measure was in effect from March to July 2020. In March 2020, ANEEL issued a regulation to grant loans to the distribution companies, commonly known as the “COVID Account,” aiming to ease financial distress and avoid tariff adjustments. |
| ● | Colombia allowed low-income level 1 and 2 residential customers representing approximately 44% of the customer base to defer payment of monthly electricity bills for 36 months and level 3 and 4 residential customers representing approximately 40% of the customer base to defer payment of monthly electricity bills for 24 months, without penalty or risk of a cut in service. |
| ● | Peru allowed 4.8 million vulnerable residential customers to prorate bills issued during March 2020 or bills that included any consumption during the emergency period for up to 24 installments, without interest, charges, or fees due to late payment. The government also established a subsidy to cover customers’ unpaid bills with monthly energy consumption of up to 125 kW from March to December 2020. |
The private sector in these countries has voluntarily taken further measures, such as adopting telecommuting wherever possible and closing commercial offices. Many businesses, such as restaurants, retail stores, malls, and spaces for large gatherings, have temporarily closed, many by executive decree, and companies associated with travel, transportation, and tourism have been severely affected, and many went bankrupt.
Recent increases in infection rates may indicate a second wave of coronavirus infections in 2021. The South American countries in which we operate have not yet implemented a widespread vaccination program. Accordingly, if there is a resurgence of the Covid-19 pandemic and any vaccines that may be made available are insufficient to restrain the pandemic and similar outbreaks in the future, our business, results of operations and financial condition may be materially adversely affected.
27
Political events or financial or other crises in any region worldwide can significantly impact the countries in which we operate and, consequently, may unfavorably affect our operations and liquidity.
The countries in which we operate are vulnerable to external shocks that could cause significant economic difficulties and affect growth. If any of these countries experience lower than expected economic growth or a recession, it is likely that consumer demand for electricity will decrease and that some of our customers may have difficulties paying their electric bills, possibly increasing our uncollectible accounts. Any of these situations could adversely affect our results of operations and financial condition.
Financial and political events in these countries and other parts of the world could also negatively affect our business. For example, since 2018, the U.S. and China have been involved in a trade war involving protectionist measures that increase volatility in financial markets worldwide due to the uncertainty of political decisions. Also, instability in the Middle East or any other major oil-producing region could result in higher fuel prices worldwide, which would increase the operating costs for our thermal generation power plants and unfavorably affect our results of operations and financial condition. An international financial crisis and its disruptive effects on the financial industry could negatively affect our ability to obtain new bank financings under the same historical terms and conditions that we have benefited from to date.
Political events or financial or other crises could also diminish our ability to access capital markets in the countries in which we operate and international capital markets as sources of liquidity or increase interest rates available to us. Reduced liquidity could negatively affect our capital expenditures, long-term investments and acquisitions, growth prospects, and dividend payout policy.
Foreign exchange risk may unfavorably affect our results and the U.S. dollar value of dividends payable to ADS holders.
Even though our functional currency is the U.S. dollar, our subsidiaries generate revenues in Argentine pesos, Peruvian nuevos soles, Brazilian reais, and Colombian pesos. We generally have been and will continue to be materially exposed to currency fluctuations in our local currencies against the U.S. dollar because of time lags and other limitations to pegging our tariff rates to the U.S. dollar. This exposure can substantially decrease the value of cash generated by our subsidiaries and the value of our dividends when translated into U.S. dollars if our local currencies experience a devaluation against the U.S. dollar. For example, the Argentine peso and Brazilian real devalued 28.8% and 22.4% against the U.S. dollar in 2020, respectively. Future volatility in the exchange rate of the currencies in which we receive revenues or incur expenditures may adversely affect our business, results of operations, and financial condition, especially when measured in U.S. dollars, the currency that affects our ADS holders.
Risk Related to Ownership of Our Shares and ADS
Our controlling shareholder may influence us and may have a strategic view for our development that differs from that of our minority shareholders.
Enel, our controlling shareholder, owns a beneficial interest of 82.3% of our share capital as of the date of this Report. Under Chilean corporate law, Enel has the power to determine the outcome of all material matters that require a simple majority of shareholders’ votes, such as the election of most of the seats on our board, and, subject to contractual and legal restrictions, the adoption of our dividend policy. In addition, since Enel has the power to determine the outcome of all material matters that require the affirmative vote of at least two-thirds of the outstanding common stock of the Company, our controlling shareholder exercises significant influence over our business strategy and operations. However, in some cases, its interests may differ from those of our minority shareholders. Certain conflicts of interest affecting Enel in these matters may be resolved in a manner that is different from the interests of our company or our minority shareholders.
The relative illiquidity and volatility of the Chilean securities market could unfavorably affect the price of our common stock and ADS.
Even though we do not have assets in Chile, our shares are traded on the Chilean Stock Exchanges because we are organized under the laws of the Republic of Chile and have our headquarters in Chile. Chilean securities markets are substantially smaller and have less liquidity than the major securities markets in the United States and other developed
28
countries. The low liquidity of the Chilean market may impair shareholders’ ability to sell shares, or holders of ADS to sell shares of our common stock withdrawn from the ADS program, on the Chilean Stock Exchanges in the amount and at the desired price and time.
Lawsuits against us brought outside of the South American countries in which we operate, or complaints against us based on foreign legal concepts may be unsuccessful.
All our operations are located outside of the United States. All our directors and officers reside outside of the United States, and substantially all their assets are located outside the United States. If investors were to bring a lawsuit against our directors and officers in the United States, it may be difficult for them to effect service of legal process within the United States upon these persons. It may also be difficult to enforce judgments obtained in U.S. courts based on civil liability provisions of U.S. federal securities laws against them in U.S. or Chilean courts. There is also doubt about whether an action could be brought successfully in Chile for liability based solely on the civil liability provisions of U.S. federal securities laws.
We identified a material weakness in our internal controls over financial reporting, which, if not remediated, could result in material misstatements of our consolidated financial statements or cause us to fail to meet our periodic reporting obligations.
Our management assessed the effectiveness of its internal control over financial reporting as of December 31, 2020 based on criteria established in the framework “Internal Controls — Integrated Framework (2013)” issued by the Committee of Sponsoring Organizations of the Treadway Commission (COSO). Based on the assessment, we have identified a material weakness in our internal control over financial reporting related to our general information technology controls, including the design and implementation of access and change management controls. A material weakness is a deficiency, or a combination of deficiencies, in internal control over financial reporting such that there is a reasonable possibility that a material misstatement of our annual or interim financial statements will not be prevented or detected on a timely basis. As a result, our management has concluded that as of December 31, 2020, our internal control over financial reporting was not effective, although our consolidated financial statements included in this Annual Report on Form 20-F present fairly, in all material respects, our consolidated financial position, results of operations and cash flows as of the dates and for the periods presented. See “Item 15. Controls and Procedures.”
The material weakness will not be considered remediated until any applicable new or enhanced controls operate for a sufficient period and management has concluded through testing that these controls are operating effectively. As of the date of this Report, the material weakness with respect to our internal control over financial reporting has not been remediated.
Any failure, difficulties or delay in implementing and maintaining such remedial measures could (i) result in a material misstatement in our financial reporting or financial statements that would not be prevented or detected, (ii) cause us to fail to meet our reporting obligations under applicable securities laws or (iii) cause investors to lose confidence in our financial reporting or financial statements, the occurrence of any of which could materially and adversely affect our business, financial condition, cash flows, results of operations and the prices of our securities.
Item 4. Information on the Company
A. History and Development of the Company.
History
We are a publicly held limited liability stock corporation headquartered in Chile and organized on June 19, 1981, under the laws of the Republic of Chile. Since January 1983, we have been registered in Santiago with the Chilean Financial Market Commission (“CMF” in its Spanish acronym) under Registration No. 0175. We have also been registered with the SEC under the commission file number 001-12440 since October 19, 1993. Our full legal name is Enel Américas S.A., and we are also known commercially as “Enel Américas.” Our shares are listed and traded on the Chilean Stock Exchanges under the trading symbol “ENELAM.” Our ADS are listed and traded on the NYSE under the trading symbol “ENIA.”
29
Our contact information in Chile is:
| |
Contact Person: | Nicolás Billikopf |
Street Address: | Av. Santa Rosa 76, Piso 15 Comuna de Santiago Santiago, Chile |
Email: | nicolas.billikopf@enel.com |
Telephone: | (56-9) 9343-5500 |
Web site: | www.enelamericas.com |
The information contained on or linked from our website is not included as part of, or incorporated by reference into, this Report. The SEC maintains a website that contains reports, proxy and information statements, and other information regarding issuers that file electronically with the SEC, such as our company, at www.sec.gov.
We are an electric utility company engaged in the generation, transmission, and distribution of electricity businesses in Argentina, Brazil, Colombia, and Peru through our subsidiaries and affiliates. As of December 31, 2020, we had 11,269 MW of net installed generation capacity and 25.6 million distribution customers. Our net installed generation capacity is comprised of 112 generation units in the four countries in which we operate, of which 55% are hydroelectric power plants. As of December 31, 2020, we had consolidated assets of US$ 26,934 million and operating revenues of US$ 12,193 million.
Since June 2009, our controlling shareholder has been the Italian company Enel SpA, which as of December 31, 2020 beneficially owned 65% of our shares and as of the date of this Report, beneficially owns 82.3% of our shares. Enel is a multinational power company and a leading integrated player in the global power, gas, and renewable energy markets. It is present in over 30 countries worldwide, producing energy with over 87 GW of installed capacity. Enel distributes electricity through a network of over 2.2 million kilometers. With more than 74 million business and household end users globally, Enel has the most extensive global customer base among its European peers. Enel’s renewables arm Enel Green Power is the world’s largest publicly owned renewable energy player, with over 47 GW of wind, solar, geothermal, and hydropower plants installed in Europe, the Americas, Africa, Asia, and Oceania.
We are one of the largest publicly listed companies in the electricity sector in South America. We have been known as Enel Américas since the 2016 Reorganization described further below. However, we trace our origins to Compañía Chilena de Electricidad Ltda. (“CCE” in its Spanish acronym), which was formed in 1921 as a result of the merger of Chilean Electric Tramway and Light Co., founded in 1889, and Compañía Nacional de Fuerza Eléctrica (“CONAFE” in its Spanish acronym), with operations dating back to 1919. Following the nationalization of the CCE in the 1970s, the Chilean electric utility sector was reorganized in the 1980s under the Chilean Electricity Law, known as the Decree with Force of Law No. 1 of 1982 (“DFL 1”). The CCE’s operations were divided into a generation company, AES Gener S.A. (“Gener”), an unrelated company, and two distribution companies, one with a concession in the Valparaíso Region, Chilquinta S.A., an unrelated company, and the other with a concession in the Santiago Metropolitan Region, Compañía Chilena Metropolitana de Distribución Eléctrica S.A. From 1982 to 1987, the Chilean electric utility sector went through a process of re-privatization. In August 1988, Compañía Chilena Metropolitana de Distribución Eléctrica S.A. changed its name to Enersis S.A. (“Enersis”), our predecessor. In the 1990s, Enersis diversified into electricity generation, transmission, and distribution sectors in five South American countries, including Chile. After the 2016 Reorganization (described below), we no longer hold electricity assets in Chile but instead have electricity generation, transmission, and distribution assets in Argentina, Brazil, Colombia, and Peru.
Enersis began international operations in 1992 with our participation in Edesur, a distribution company, and Costanera, a generation company, both in Argentina. In 1994, we expanded into Peru through our distribution company Edelnor (now Enel Distribution Peru), and in 1995, we acquired the electricity generation company Edegel (now Enel Generation Peru). Our presence in Brazil and Colombia began in 1996 through our Brazilian distributor, Ampla (now Enel Distribution Rio), and the Colombian generator, Codensa. In 1997, we acquired an interest in the Colombian generator Emgesa. We acquired the Brazilian distributor Coelce (now Enel Distribution Ceara) in 1998 and the Brazilian generator Fortaleza in the state of Ceará in 2002. In 2005, Enel Brasil was formed to control our electricity assets held in Brazil, including our distribution companies in Rio and Ceara, our generation companies, Fortaleza and Cachoeira Dourada, and a transmission business owned through Cien.
30
During the 2000s, we increased our participation in some of our existing subsidiaries. In 2006, Empresa de Generación Termoeléctrica Ventanilla S.A., a Peruvian generation company that was owned by the Spanish electric utility, Endesa, S.A. (“Endesa Spain”) at the time, merged with and into Edegel, becoming a 457 MW thermoelectric generation company. In September 2007, we merged our generation subsidiaries in Colombia into our generation company Emgesa. As of December 31, 2020, we held a 48.5% economic and 56.4% voting interest in Emgesa and, under a shareholders’ agreement, we control and consolidate the company. For more information regarding the control and consolidation of Emgesa, see “Item 5. Operating and Financial Review and Prospects — A. Operating Results. — 1. Discussion of Main Factors Affecting Operating Results and Financial Condition of the Company.” In October 2009, Enel Generation Chile purchased an additional 29.4% of Enel Generation Peru, increasing our economic interest in that company from 19.8% to 37.5%, and we acquired an additional 24% of Enel Distribution Peru, increasing our economic interest in the company from 33.5% to 57.5%.
In March 2013, we completed a capital increase proposed by Endesa Spain, our parent company at the time, through in-kind contributions from all its equity interests in 25 companies in the five South American countries in which we operated. Minority shareholders had the right to contribute their proportional participation in cash. The capital increase was first offered to existing shareholders through a preemptive rights offering registered with the CMF and the U.S. SEC and subsequently through a follow-on offering. The total Ch$ 2,846 billion capital increase consisted of Ch$ 1,714 billion of in-kind contributions from Endesa Spain and Ch$ 1,132 billion in cash from minority shareholders (the “2013 capital increase”). Following the 2013 capital increase, we acquired additional interests in certain companies, directly or indirectly through our subsidiaries and undertook other reorganizations, including the following transactions:
| ● | In May 2014, we finalized a voluntary public offer to purchase our subsidiary Enel Distribution Ceara shares that we did not own. The investment amounted to Ch$ 133 billion (at that time), and we reached a 64.9% economic interest in Enel Distribution Ceara. Following the 2016 Reorganization, and as of December 31, 2019, we held a 74.1% economic interest in Enel Distribution Ceara. |
| ● | In September 2014, we acquired the indirectly held shares that Inkia Americas Holdings Limited had in Generandes Peru S.A. (39.0% of the company), the controlling company of Enel Generation Peru. The total investment amounted to Ch$ 243 billion (US$ 413 million at that time), and we increased our economic interest in Enel Generation Peru by 21%, to 58.6%. |
| ● | In February 2017, we acquired 94.8% of Celg Distribuição S.A. (now Enel Distribution Goias) in a tender process organized by the Brazilian Government through the national bank for economic and social development (“BNDES” in its Portuguese acronym). The offer amounted to R$ 2,187 million (US$ 640 million at that time). In May 2017, Enel Brasil acquired the remaining 5% of Enel Distribution Goias for R$ 82 million. As of December 31, 2019, we held a 99.9% economic interest in Enel Distribution Goias. |
| ● | In September 2017, we were awarded the 30-year concession auctioned by the Brazilian regulator to operate Volta Grande, the 380 MW hydroelectric power plant located in the State of Minas Gerais. The power plant started commercial operations in 1974. It is comprised of four generation units with an installed capacity of 95 MW each. The tender amounted to R$ 1,419 million (US$ 445 million at that time), and the payment took place on November 30, 2017. To carry out this transaction, we fully subscribed and paid a cash capital increase in Enel Brasil, amounting to R$ 568 million (US$ 178 million). This capital increase was partially financed with the remaining proceeds of the 2013 capital increase. |
| ● | On October 4, 2017, our wholly-owned subsidiary Enel Peru acquired a 7.5% stake of Enel Distribution Peru on the Lima Stock Exchange. This transaction amounted to 262 million soles. As a result, we increased our economic interest in Enel Distribution Peru to 83.2%. |
| ● | On June 4, 2018, we completed a tender offer to acquire Enel Distribution Sao Paulo, Brazil’s biggest distribution company and among the largest distribution companies in South America. Enel Distribution Sao Paulo, with more than 7.2 million customers, operates in a concession area of 4,526 square kilometers. In the tender offer, we acquired 73.4% of the shares at R$ 45.22 per share. Until July 4, 2018, all remaining Enel Distribution Sao Paulo shareholders could sell their shares at the same tender offer price. In September 2018, we participated in a capital increase of Enel Distribution Sao Paulo. In November 2019, we carried out a tender offer of R$ 49.39 per share for the remaining 4% of Enel Distribution Sao Paulo’s common stock. Our |
31
| ownership of the company, as of the date of this Report, is 100%. The total investment to acquire the remaining 4.056% of Enel Distribution Sao Paulo was approximately US$ 2,270 million using the exchange rate at that time. |
| ● | At an Extraordinary Shareholders’ Meeting (“ESM”) held on April 30, 2019, our shareholders approved a capital increase for an amount of US$ 3 billion. The capital increase was made through two preemptive rights periods in Chile for local shares and in the United States for ADRs. As a result, 18,633,669,520 new shares of our common stock, including in the form of ADRs, were subscribed and paid for by our existing shareholders and ADR holders representing 99.5% of the total new shares approved at the ESM, totaling US$ 3 billion, the largest cash-only capital increase in Chilean corporate history. The use of proceeds for the capital increase was to refinance the debt incurred in our acquisition of Enel Distribution Sao Paulo. |
The 2016 Reorganization
During 2016, we completed a corporate reorganization to separate our Chilean businesses from our non-Chilean businesses (the “2016 Reorganization”).
The 2016 Reorganization involved the separation of the respective Chilean and non-Chilean electricity generation, transmission, and distribution businesses of Empresa Nacional de Electricidad S.A. (“Endesa Chile”), Chilectra and Enersis through a “demerger” under Chilean law and the subsequent distribution of the shares of the newly created entities to each company’s respective shareholders (collectively, the “Spin-Offs”). The “demerger,” or separation of the businesses, occurred on March 1, 2016. The Spin-Offs were effective in April 2016, with the creation and public listing of the shares of the newly incorporated entities: (i) Enersis Chile S.A. (“Enersis Chile”), which held the Chilean businesses of Enersis, (ii) Endesa Américas S.A. (“Endesa Américas”), which held the non-Chilean businesses of Endesa Chile, and (iii) Chilectra Américas S.A. (“Chilectra Américas”), which held the non-Chilean businesses of Chilectra.
The 2016 Reorganization also involved the merger of the companies holding the non-Chilean assets. The merger became effective on December 1, 2016, and merged Endesa Américas and Chilectra Américas with and into Enersis Américas, with the latter continuing as the surviving company. The merger combined the non-Chilean generation, transmission, and distribution businesses under a single holding company, contributed to the simplification of the group’s corporate structure, and provided benefits such as subsidiary cash leakage reduction, strategic interest alignment, and increased decision-making and operational efficiencies. As a consequence of the merger, we issued 9,232,202,625 new shares, of which 872,333,871 shares were deemed reacquired and held as treasury stock and were canceled as a result of the approval of the cancellation by the shareholders at the ESM held on April 27, 2017. As a result, our ultimate controlling shareholder, Enel, then owned 51.8% of our outstanding shares.
As part of the 2016 Reorganization process, Enersis changed its name to Enersis Américas S.A. on March 1, 2016, and subsequently to Enel Américas S.A. on December 1, 2016. On October 18, 2016, (i) Endesa Chile changed its name to Enel Generación Chile S.A.; (ii) Chilectra changed its name to Enel Distribución Chile S.A.; and (iii) Enersis Chile S.A. changed its name to Enel Chile S.A.
Enel X
In 2018, we formed Enel X Colombia S.A.S. (“Enel X Colombia”), a wholly-owned subsidiary of Codensa. The primary purpose of Enel X Colombia is to focus on public lighting tenders, supplementing the activities of Codensa. We also changed the name of Enel Soluçoes S.A., a wholly-owned subsidiary of Enel Brasil, to Enel X Brasil S.A. (“Enel X Brasil”). These companies will develop, implement, and sell products and services that incorporate innovation and cutting-edge technology and are different from selling energy or energy distribution and associated services. These Enel X companies expect to offer turnkey projects for municipalities and other public and governmental entities, industrial or residential customer appliances such as photovoltaic systems, heating ventilation air conditioning, led lighting, projects related to energy efficiency, and the development of public and private electric mobility, and charging infrastructure, in all cases including customers outside of our concession areas.
Merger with EGP Américas and Related Tender Offer
On September 21, 2020, the board of directors of Enel Américas unanimously resolved to initiate a merger process aimed at the acquisition by Enel Américas of EGP Américas SpA (“EGP Américas”) through a merger with and into
32
Enel Américas (the “2021 Merger”). Immediately prior to the 2021 Merger, EGP Américas, a newly-formed company, would hold Enel Green Power S.p.A.’s renewable energy generation businesses in Central and South America other than Chile.
The 2021 Merger, which was effective as of April 1, 2021, fits our strategy considering the high priority of renewable energy in the region and our development plans. It allows the acceleration of Enel Américas’ positioning within the energy transition scenario. It also enables us to become the leading power utility in Central and South America in the generation and distribution of energy. As a result of the 2021 Merger, we have now strengthened our renewable energy generation business and diversified geographically through exposure to Costa Rica, Guatemala, and Panama, in addition to acquiring new assets in South American countries where we were already present.
In connection with the 2021 Merger, on December 17, 2020, Enel delivered to Enel Américas a letter stating that it would launch a voluntary partial public tender offer for the acquisition of shares and ADS of Enel Américas representing up to a maximum of 10% of the then-current share capital of Enel Américas. The offering price for the shares in the tender offer would be Ch$ 140 per share and Ch$ 7,000 per ADS (paid in U.S. dollars), which was above the then-current market prices of the shares and ADS and the withdrawal rights price of Ch$ 109.79 per share (the “2021 Tender Offer”). The 2021 Tender Offer was introduced as an alternative to the statutory merger dissenters’ withdrawal rights in response to concerns raised by certain minority shareholders that the statutory merger dissenters’ withdrawal rights may not be adequate. The 2021 Tender Offer was designed to allow shareholders to participate in the 2021 Merger but receive cash for a portion of their ownership interest in Enel Américas, at a fixed cash value significantly higher than the price of Ch$ 109.79 per share offered under Chilean law to dissenting shareholders who exercised their withdrawal rights in connection with the 2021 Merger.
On December 18, 2020, an ESM was held to vote on the 2021 Merger. The transaction was approved by 80% of the total shares. As a result, on April 1, 2021, after the fulfillment of all conditions precedent, we (i) acquired all the assets and liabilities of EGP Américas; (ii) continued with its rights and obligations; (iii) amended our bylaws, including by eliminating the 65% limitation on maximum shareholder concentration that was in place prior to the 2021 Merger; and (iv) carried out a capital increase valued at US$ 6 billion through the issuance of new common shares that would be fully subscribed and paid for by the incorporation of the assets of EGP Américas into Enel Américas.
In connection with the 2021 Merger, 31,195,387,525 shares were issued in Enel Américas on April 1, 2021, and Enel’s beneficial ownership interest in Enel Américas increased to 75.2%. After giving effect to the issuance of new shares in connection with the 2021 Merger, and as of the date of this Report, there are 107,281,698,561 shares of common stock outstanding.
The 2021 Tender Offer was launched on March 15, 2021, and the tender offer period ended on April 13, 2021. In total, 20,194,895,308 shares (including 1,872,063,500 shares represented by 37,441,270 ADSs) were validly tendered and not properly withdrawn pursuant to the 2021 Tender Offer, resulting in a proration factor of approximately 37.7%. As a result of applying the proration factor, Enel accepted for purchase 6,903,312,254 shares and 14,104,937 ADSs, representing an additional 705,246,850 shares in the 2021 Tender Offer.
Enel, our controlling shareholder, owned a beneficial interest of 65% of our share capital as of December 31, 2020, and now owns a beneficial interest of 82.3% of our share capital as of the date of this Report. Enel’s control increased in 2021 as a result of the 2021 Merger and the 2021 Tender Offer.
Capital Investments, Capital Expenditures, and Divestitures
We coordinate our overall financial strategy, including the terms and conditions of loans and intercompany advances entered into by our subsidiaries, to optimize debt and liquidity management. Generally, our operating subsidiaries independently plan capital expenditures financed by internally generated funds or direct financings. One of our goals is to focus on investments that will provide long-term benefits, such as energy loss reduction projects. Although we have considered how these investments will be financed as part of our budget process, we have not committed to any particular financing structure, and investments will depend on the prevailing market conditions when the cash flows are needed.
Our investment plan is flexible enough to adapt to changing circumstances by giving different priorities to each project following expected profitability and strategic fit, including sustainability considerations. We are currently
33
focused on making investments (i) on behalf of the distribution business related to network reliability, capacity improvement, and new technology developments such as smart meters, (ii) for maintenance of our distribution network and generation plants, (iii) in studies required to develop other potential generation and distribution projects, and (iv) in the development of new businesses. For further detail regarding these projects, please see “Item 4. Information on the Company — D. Property, Plant and Equipment — Projects Under Development.”
The table below sets forth the capital expenditures incurred in 2020, 2019, and 2018:
| | | | | | |
|
| 2020 |
| 2019 |
| 2018 |
| | | | | | |
Capital expenditures(1) | | 1,553 | | 1,659 | | 1,541 |
| (1) | Capital expenditures figures listed in this table represent cash flow used to purchase property, plant, and equipment, and intangible assets for each year. |
In the past, this table estimated such capital expenditures for the following three years. As a result of the material corporate change resulting from the 2021 Merger, the Company’s management needs to reevaluate forward-looking capital expenditures.
Please refer to “Item 4. Information on the Company — D. Property, Plant and Equipment. — Project Investments” and “Item 5. Operating and Financial Review and Prospects — F. Tabular Disclosure of Contractual Obligations” for further information.
Capital Expenditures in 2020, 2019, and 2018
A critical part of our capital expenditures is related to non-discretionary investments that include maintenance of existing installed capacity to increase the quality and operation standards of our facilities. During 2020, our investments in our generation units amounted to: US$ 86 million in Colombia, for the Termozipa Battery Energy Storage System project and maintenance and life extension projects executed in the rest of the Colombian power plants; US$ 52 million in Peru for the Ventanilla Battery Energy Storage System projects and maintenance works in the Matucana, Huinco, and Malacas power plants; US$ 36 million in Argentina for the wastewater treatment system in the Costanera power plant and maintenance works in Dock Sud; and US$ 20 million in Brazil. Our investments in our distribution segment amounted to US$ 740 million in Brazil, US$ 385 million in Colombia, US$ 127 million in Peru, and US$ 103 million in Argentina and were focused on reducing energy losses, increasing new connections, and maintaining our distribution networks. We plan to continue expanding our services, increasing the connections available to end customers, and reducing energy losses to improve efficiency and profitability.
During 2019, we invested US$ 226 million in the maintenance of our generation units, of which US$ 108 million was invested in Colombia, US$ 49 million was invested in Peru, US$41 million was invested in Argentina, and US$ 28 million was invested in Brazil. In our distribution segment we invested US$ 1,418 million, which was mainly used to maintain our existing networks and reduce energy losses, and was allocated as follows: US$ 761 million in Brazil, US$ 306 million in Colombia, US$ 187 million in Argentina, and US$ 164 million in Peru.
During 2018, the focus of our capital expenditures in the generation business was on Emgesa and in Peru. With regard to Emgesa, we started improving our thermal power plant, Termozipa, to reduce its environmental impact and extend its useful life. The environmental upgrade aims to achieve the best environmental standards for gas emissions among coal-fired power plants in Latin America. In Peru, we focused on reconstructing our hydroelectric power plants affected by the heavy rains at the beginning of 2017, which damaged the Callahuanca and Moyopampa power plants. We also invested in maintenance activities and modernization of civil works and hydraulic units in Peru.
Projects in progress will be financed with resources provided by external financing and internally generated funds.
34
B. Business Overview.
We are a publicly held limited liability stock corporation headquartered in Chile, with consolidated operations in Argentina, Brazil, Colombia, and Peru. Our core businesses are electricity generation, transmission, and distribution.
The table below presents our revenues by reportable segments and by operating segments within such reportable segments.
| | | | | | | | |
| | Year ended December 31, | ||||||
|
| 2020 |
| 2019 |
| 2018 |
| Change 2020 vs. 2019 |
| | (in millions of US$) | | (in %) | ||||
Generation and Transmission Business in Argentina | | 231 | | 436 | | 328 | | (47.1) |
Costanera | | 113 | | 214 | | 163 | | (47.2) |
El Chocón | | 49 | | 72 | | 67 | | (32.6) |
Dock Sud | | 66 | | 147 | | 95 | | (54.9) |
Other | | 3 | | 3 | | 3 | | — |
| | | | | | | | |
Generation and Transmission Business in Brazil | | 1,106 | | 778 | | 854 | | 42.2 |
Cachoeira Dourada | | 812 | | 494 | | 540 | | 64.4 |
Fortaleza | | 187 | | 310 | | 212 | | (39.6) |
Cien | | 53 | | 70 | | 83 | | (24.7) |
EGP Volta Grande | | 62 | | 107 | | 82 | | (41.7) |
Other | | (8) | | (203) | | (63) | | 96.1 |
| | | | | | | | |
Generation and Transmission Business in Colombia | | 1,159 | | 1,247 | | 1,259 | | (7.0) |
Emgesa | | 1,159 | | 1,247 | | 1,259 | | (7.0) |
| | | | | | | | |
Generation and Transmission Business in Peru | | 505 | | 596 | | 596 | | (15.3) |
Enel Generation Peru | | 446 | | 519 | | 522 | | (14.1) |
Enel Generation Piura | | 64 | | 82 | | 78 | | (22.1) |
Other | | (5) | | (5) | | (4) | | — |
| | | | | | | | |
Total Generation and Transmission Business reportable segment | | 3,001 | | 3,057 | | 3,037 | | (1.8) |
| | | | | | | | |
Distribution Business in Argentina | | 801 | | 1,347 | | 1,190 | | (40.5) |
Edesur | | 801 | | 1,347 | | 1,190 | | (40.5) |
| | | | | | | | |
Distribution Business in Brazil | | 6,735 | | 8,154 | | 6,922 | | (17.4) |
Enel Distribution Rio | | 1,221 | | 1,515 | | 1,511 | | (19.4) |
Enel Distribution Ceara | | 1,142 | | 1,373 | | 1,411 | | (16.8) |
Enel Distribution Goias | | 1,392 | | 1,545 | | 1,542 | | (9.9) |
Enel Distribution Sao Paulo | | 2,980 | | 3,721 | | 2,459 | | (19.9) |
| | | | | | | | |
Distribution Business in Colombia | | 1,547 | | 1,665 | | 1,714 | | (7.1) |
Codensa | | 1,547 | | 1,665 | | 1,714 | | (7.1) |
| | | | | | | | |
Distribution Business in Peru | | 887 | | 950 | | 913 | | (6.7) |
Enel Distribution Peru | | 887 | | 950 | | 913 | | (6.7) |
| | | | | | | | |
Total Distribution Business reportable segment | | 9,970 | | 12,116 | | 10,739 | | (17.7) |
Less: Consolidation adjustments and non-core activities | | (778) | | (859) | | (786) | | 9.4 |
Total Revenues | | 12,193 | | 14,314 | | 12,990 | | (14.8) |
For further information related to our revenues and total income, see “Item 5. Operating and Financial Review and Prospects — A. Operating Results” and Note 27 of the Notes to our consolidated financial statements.
35
Electricity Generation Business
In 2020, our consolidated electricity sales were 66,996 GWh, and our electricity production was 40,455 GWh, an 8% decrease and a 3% decrease, respectively, compared to 2019. Our total installed capacity in 2020 was 11,269 MW, a 0.02% increase compared to 2019.
In 2019, our consolidated electricity sales were 72,553 GWh, and our electricity production was 41,760 GWh, an 11% increase and a 5% increase, respectively, compared to 2018. Our total installed capacity in 2019 was 11,267 MW, a 0.1% increase compared to 2018.
The following tables summarize the operating data relating to our electricity generation:
| | | | | | |
| | Year ended December 31, | ||||
|
| 2020 |
| 2019 |
| 2018 |
Argentina | | | | | | |
Number of generating units(1) | | 29 | | 29 | | 29 |
Installed capacity (MW)(2) | | 4,419 | | 4,419 | | 4,419 |
Electricity generation (GWh) | | 13,901 | | 12,974 | | 13,949 |
Energy sales (GWh) | | 13,903 | | 12,976 | | 13,952 |
Brazil | | | | | | |
Number of generating units(1) | | 17 | | 17 | | 17 |
Installed capacity (MW)(2) | | 1,354 | | 1,354 | | 1,354 |
Electricity generation (GWh) | | 4,823 | | 5,292 | | 3,755 |
Energy sales (GWh) | | 25,296 | | 30,002 | | 22,236 |
Colombia | | | | | | |
Number of generating units(1) | | 36 | | 36 | | 36 |
Installed capacity (MW)(2) | | 3,506 | | 3,506 | | 3,499 |
Electricity generation (GWh) | | 14,009 | | 15,250 | | 14,052 |
Energy sales (GWh) | | 17,539 | | 18,376 | | 18,544 |
Peru | | | | | | |
Number of generating units(1) | | 30 | | 30 | | 30 |
Installed capacity (MW)(2) | | 1,990 | | 1,987 | | 1,985 |
Electricity generation (GWh) | | 7,722 | | 8,244 | | 8,106 |
Energy sales (GWh) | | 10,258 | | 11,199 | | 10,597 |
Total | | | | | | |
Number of generating units(1) | | 112 | | 112 | | 112 |
Installed capacity (MW)(2) | | 11,269 | | 11,267 | | 11,257 |
Electricity generation (GWh) | | 40,455 | | 41,760 | | 39,863 |
Energy sales (GWh) | | 66,996 | | 72,553 | | 65,329 |
| (1) | For details on generation facilities, see “Item 4. Information on the Company — D. Property, Plant, and Equipment — Property, Plant, and Equipment of Generating Companies.” |
| (2) | Total installed capacity is the maximum capacity (MW) under specific technical conditions and characteristics. In most cases, installed capacity is confirmed by satisfaction guarantee tests performed by equipment suppliers. Figures may differ from installed capacity declared to governmental authorities and customers in each country, according to criteria defined by such authorities and relevant contracts. |
In the electricity industry, it is common to divide the business into hydroelectric and thermoelectric generation because each type of generation has significantly different variable costs. Thermoelectric generation requires fuel purchase, which generally leads to higher variable costs than hydroelectric generation from reservoirs or rivers, which typically has immaterial variable costs. Of our total consolidated generation in 2020, 62.1% was from hydroelectric sources, and 37.9% was from thermal sources.
36
The following table summarizes our consolidated generation by type of energy:
CONSOLIDATED GENERATION BY TYPE OF ENERGY (GWh)
| | | | | | | | | | | | |
| | Year ended December 31, | ||||||||||
| | 2020 | | 2019 | | 2018 | ||||||
|
| Generation |
| % |
| Generation |
| % |
| Generation |
| % |
Hydroelectric | | 25,143 | | 62.1 | | 25,604 | | 61.3 | | 23,690 | | 59.4 |
Thermal | | 15,313 | | 37.9 | | 16,155 | | 38.7 | | 16,173 | | 40.6 |
Total generation | | 40,456 | | 100.0 | | 41,760 | | 100.0 | | 39,863 | | 100.0 |
In the countries where we operate, the potential for contracting electricity is related to electricity demand. Customers identified as small volume regulated customers, including residential customers, are subject to government-regulated electricity tariffs and must purchase electricity directly from a distribution company. These distribution companies, which purchase large amounts of electricity for small volume residential customers, generally enter into contractual agreements with generators at a regulated tariff price. Those identified as large volume industrial customers also enter into contractual agreements with energy suppliers. However, such large volume industrial customers are not subject to the regulated tariff price. Instead, these customers are allowed to negotiate the energy price with generators based on the required service characteristics. Finally, the pool market, where energy is typically sold at the spot price, is not carried out through contracted pricing.
We break down our sales to customers by using the two following criteria:
● | The first criterion corresponds to regulated and unregulated customers. Regulated customers are distribution companies that mainly serve residential customers. Unregulated customers may freely negotiate the electricity price with generators or may purchase electricity in the pool market at the spot price. The classification of regulated customers differs from one country to another. |
● | The second criterion corresponds to contracted and non-contracted sales. This method is useful because it provides us a uniform way to compare the customers for each country. Contracted sales are defined uniformly throughout. |
Specific energy consumption limits (measured in GWh) for regulated and unregulated customers are country-specific. Moreover, regulatory frameworks often require that regulated distribution companies have contracts to support their commitments to small volume customers and determine which customers can purchase energy in electricity pool markets.
Energy purchases and transportation costs are the principal variable costs involved in the electricity generation business, in addition to the direct variable cost of generating hydroelectric or thermal electricity, such as fuel costs. Our thermal generation increases during relatively low rainfall periods, typically resulting in higher fuel costs. Under drought conditions, the electricity we have contractually agreed to provide may exceed the amount of electricity we can generate, requiring us to purchase electricity in the pool market at spot prices to satisfy our contractual commitments. The cost of these purchases at spot prices may, under certain circumstances, exceed the price at which we sell electricity under contracts and, therefore, may result in a loss. We attempt to minimize the effects of poor hydrological conditions on our operations in any year by limiting our contractual sales requirements to a quantity that does not exceed the estimated production in a dry year. To determine the estimated production in a dry year, we consider the available statistical information concerning rainfall, hydrological levels, and critical reservoirs’ capacity. In addition to limiting contracted sales, we may adopt other strategies, including installing temporary thermal capacity, negotiating lower consumption levels with unregulated customers, negotiating with other water users, and including pass-through cost clauses in contracts with customers. (For further details about hydrological conditions and their effects on our business, please refer to “Item 5. Operating and Financial Review and Prospects — A. Operating Results. — 1. Discussion of Main Factors Affecting Operating Results and Financial Condition of the Company — a. Generation and Transmission Business.”
37
Seasonality
While our core businesses are subject to weather patterns, only extreme events such as prolonged droughts, rather than seasonal weather variations, may adversely affect our generation capacity and materially affect our operating results and financial condition.
The generation business in the countries where we operate is affected by seasonal changes throughout the year. The months with the most precipitation in Argentina are typically May through August, with snowmelts generally occurring between October and December. In Brazil, due to tropical weather, rainfall is mostly concentrated in summer from November through May, and it is the lightest during the winter. The months with the most precipitation in our operating area in Colombia are typically April, May, October, and November. The months with the most precipitation in Peru are generally November through March.
When there is more precipitation, hydroelectric generating facilities can accumulate additional water for generation. Our reservoirs’ increased level allows us to generate more electricity with hydroelectric power plants during the months when marginal electricity costs are lower.
In general, hydrological conditions such as droughts and insufficient rainfall may adversely affect our generation capacity. For example, severe prolonged drought conditions or reduced rainfall levels in the countries in which we operate caused by the El Niño phenomenon minimizes the amount of water accumulated in reservoirs, thereby curtailing our hydroelectric generation capacity. Hydroelectric generation may be substituted with thermal generation (natural gas, liquefied natural gas, coal, or diesel) and energy purchases on the spot market to mitigate hydrological risk. Both could result in higher costs to meet our obligations under contracts with regulated and unregulated customers.
Operations in Argentina
We participate in electricity generation in Argentina through our subsidiaries Costanera, El Chocón, and Dock Sud. As of December 31, 2020, we had 29 power units with a total net installed capacity of 4,419 MW in Argentina, representing 10.5% of the Argentine National Interconnected System’s (“Argentine NIS”) installed capacity in 2020.
Costanera owns 11 thermal units, with a total net installed capacity of 2,210 MW, El Chocón owns nine hydroelectric units and four diesel engines, with a total net installed capacity of 1,362 MW, and Dock Sud owns five thermal units with an aggregate net installed capacity of 847 MW.
Our Argentine subsidiaries have stakes in three additional companies: Termoeléctrica Manuel Belgrano S.A., Termoeléctrica San Martín S.A., and Central Vuelta de Obligado S.A. (Vuelta de Obligado). These companies were formed to construct three generation facilities for a fund called “FONINVEMEM,” whose purpose is to increase electricity capacity and generation within the Argentine wholesale electricity market. By December 2020, these units’ total aggregate capacity was 2,456 MW (823 MW from Manuel Belgrano, 823 MW from San Martín, and 810 MW from Vuelta de Obligado).
Our total generation in Argentina amounted to 13,901 GWh in 2020. According to the entity in charge of the wholesale electricity market (“CAMMESA” in its Spanish acronym), our generation market share was approximately 11% of Argentina’s total electricity production during 2020.
Our hydroelectric generation in Argentina accounted for over 20.6% of our total generation in Argentina in 2020, reaching 2,860 GWh, an increase of 14% compared to 2019, while our thermal generation in Argentina accounted for 79.4% of our total generation in 2020, reaching 11,041 GWh, an increase of 5.5% compared to 2019, in each case mainly due to exports to the Brazilian energy market during 2020.
38
Our generation by type and subsidiary in Argentina is shown in the following table:
ELECTRICITY GENERATION IN ARGENTINA (GWh)
| | | | | | | | | | | | |
| | Year ended December 31, | ||||||||||
| | 2020 | | 2019 | | 2018 | ||||||
|
| Generation |
| % |
| Generation |
| % |
| Generation |
| % |
Hydroelectric generation (El Chocón) | | 2,860 | | 20.6 | | 2,509 | | 19.3 | | 2,859 | | 20.5 |
Thermal generation (Costanera and Dock Sud)(1) | | 11,041 | | 79.4 | | 10,464 | | 80.7 | | 11,090 | | 79.5 |
Total generation | | 13,901 | | 100.0 | | 12,974 | | 100.0 | | 13,949 | | 100.0 |
| (1) | Includes diesel engines from El Chocón |
The following table sets forth our electricity generation and purchases in Argentina:
ELECTRICITY GENERATION AND PURCHASES IN ARGENTINA (GWh)
| | | | | | | | | | | | |
| | Year ended December 31, | ||||||||||
| | 2020 | | 2019 | | 2018 | ||||||
|
| (GWh) |
| % |
| (GWh) |
| % |
| (GWh) |
| % |
Electricity generation | | 13,901 | | 99.98 | | 12,974 | | 99.98 | | 13,949 | | 100.0 |
Electricity purchases | | 2 | | 0.02 | | 2 | | 0.02 | | 3 | | 0.0 |
Total(1) | | 13,903 | | 100.0 | | 12,976 | | 100.0 | | 13,952 | | 100.0 |
| (1) | Electricity generation and electricity purchases may differ from total electricity sales because of transmission losses, the power plants’ own consumption, and technical losses. |
The distribution of our electricity sales in Argentina by subsidiary is shown in the following table:
ELECTRICITY SALES BY SUBSIDIARY IN ARGENTINA (GWh)
| | | | | | |
| | Year ended December 31, | ||||
|
| 2020 |
| 2019 |
| 2018 |
Costanera | | 6,518 | | 6,210 | | 7,101 |
El Chocón | | 2,924 | | 2,528 | | 2,901 |
Dock Sud | | 4,461 | | 4,238 | | 3,951 |
Total | | 13,903 | | 12,976 | | 13,952 |
For the year ended December 31, 2020, Costanera did not have contracts with unregulated customers or distribution companies and sold all of its electricity to the pool market during the year. For the year ended December 31, 2020, El Chocón had six contracts with unregulated customers and no contracts with distribution companies. For the year ended December 31, 2020, Dock Sud did not have any contracts with regulated customers or distribution companies and sold all of its electricity to the pool market during the year.
The electricity demand throughout the Argentine NIS decreased by 1.2% during 2020. The total electricity demand was 127,314 GWh in 2020, 128,867 GWh in 2019, and 132,925 GWh in 2018. Our Argentine subsidiaries compete with all the major power plants connected to the Argentine NIS.
According to the installed capacity reported by CAMMESA, in its monthly report as of December 2020, our primary competitors in Argentina are: (1) the state-controlled company Enarsa (with an installed capacity of 1,362 MW), (2) the nuclear unit “NASA” (with an installed capacity of 1,755 MW), and (3) the hydroelectric units Yacyretá and Salto Grande (with an aggregate installed capacity of 4,045 MW).
The leading private competitors are AES Group, Sociedad Argentina de Energía S.A. (“Sadesa”), and Pampa Energía. The AES Group has ten power plants connected to the Argentine NIS with a total net installed capacity of 4,224 MW. Sadesa owns approximately 3,899 MW of installed capacity, the most significant of which are Piedra del Águila (with an installed capacity of 1,400 MW) and Central Puerto (a thermal facility with 1,777 MW of installed
39
capacity). Pampa Energía, with a total installed capacity of 3,871 MW, competes with us with seven power plants, of which 938 MW is hydroelectric, and 2,631 MW is thermal.
Operations in Brazil
We participate in electricity generation in Brazil through our subsidiaries Cachoeira Dourada, Fortaleza, and EGP Volta Grande.
As of December 31, 2020, we had a total net installed capacity of 1,354 MW in Brazil, representing 1% of the Brazilian system’s total net installed capacity.
Cachoeira Dourada is a hydroelectric company consisting of three generation units with a total net installed capacity of 655 MW, located in Midwest Brazil.
Fortaleza owns a combined-cycle plant with ten generation units that use natural gas, with a total net installed capacity of 319 MW. The plant is located 50 kilometers from the capital of the state of Ceará and began commercial operations in 2003. Since January 2010, Fortaleza has received natural gas from the Pecem regasification terminal, an unrelated company. In 2019, our thermal generation increased after a decrease in 2018, caused by a legal dispute in connection with our gas supply contract with Petrobras, a gas supplier. On August 28, 2020, Petrobras and Fortaleza reached an agreement to settle the existing claims. However, a final judicial ruling is pending, as Petrobras and Fortaleza have requested that the judicial claims be settled without a judgment on the merits. From January to August 2020, there was an injunction in place that required Petrobras to provide the gas supply. Now that Petrobras and Fortaleza have reached an agreement to settle the claims, the contract will be enforced and will remain in effect until 2023. See Note 35.3 of the Notes to our consolidated financial statements for further information. In 2020, our thermal generation decreased because the ONS established lower dispatch energy levels for thermal generators in order to ensure adequate supply at reasonable costs.
EGP Volta Grande is a hydroelectric company consisting of four generation units with a total net installed capacity of 380 MW, located in southeast Brazil. EGP Volta Grande was purchased by our subsidiary Enel Brasil on November 30, 2017.
Our hydroelectric generation increased by 11% in 2020 compared to 2019 due to favorable hydrological conditions.
Our generation by type and subsidiary in Brazil is shown in the following table:
ELECTRICITY GENERATION IN BRAZIL (GWh)
| | | | | | | | | | | | |
| | Year ended December 31, | ||||||||||
| | 2020 | | 2019 | | 2018 | ||||||
| �� | Generation |
| % |
| Generation |
| % |
| Generation |
| % |
Hydroelectric generation (Cachoeira Dourada and EGP Volta Grande) | | 4,611 | | 95.6 | | 4,164 | | 78.7 | | 3,219 | | 85.7 |
Thermal generation (Fortaleza)(1) | | 212 | | 4.4 | | 1,128 | | 21.3 | | 537 | | 14.3 |
Total | | 4,823 | | 100.0 | | 5,292 | | 100.0 | | 3,755 | | 100.0 |
| (1) | In 2018, our thermal generation decreased due to a legal dispute about the gas supply contract with Petrobras (gas supplier). Petrobras ceased the supply of gas to Fortaleza. In 2020, our thermal generation decreased because the ONS defined lower dispatch energy levels by thermal generators to ensure adequate supply at reasonable costs. |
40
The following table sets forth our electricity generation and purchases in Brazil:
ELECTRICITY GENERATION AND PURCHASES IN BRAZIL (GWh)
| | | | | | | | | | | | |
| | Year ended December 31, | ||||||||||
| | 2020 | | 2019 | | 2018 | ||||||
|
| (GWh) |
| % |
| (GWh) |
| % |
| (GWh) |
| % |
Electricity generation | | 4,823 | | 19.1 | | 5,292 | | 17.6 | | 3,755 | | 16.9 |
Electricity purchases | | 20,473 | | 80.9 | | 24,710 | | 82.4 | | 18,481 | | 83.1 |
Total(1) | | 25,296 | | 100.0 | | 30,002 | | 100.0 | | 22,236 | | 100.0 |
| (1) | Electricity generation and electricity purchases may differ from total electricity sales because of transmission losses, the power plants’ own consumption, and technical losses. |
The following table sets forth our electricity sales in Brazil by generation subsidiary:
ELECTRICITY SALES BY SUBSIDIARY IN BRAZIL (GWh)
| | | | | | | | | | | | |
| | Year ended December 31, | ||||||||||
| | 2020 | | 2019 | | 2018 | ||||||
|
| Sales |
| % of Sales |
| Sales |
| % of Sales |
| Sales |
| % of Sales |
Cachoeira Dourada(1) | | 19,660 | | 77.7 | | 22,890 | | 76.3 | | 18,098 | | 81.4 |
Fortaleza | | 3,636 | | 14.4 | | 4,742 | | 15.8 | | 2,763 | | 12.4 |
EGP Volta Grande | | 2,000 | | 7.9 | | 2,370 | | 7.9 | | 1,376 | | 6.2 |
Total electricity sales | | 25,296 | | 100.0 | | 30,002 | | 100.0 | | 22,236 | | 100.0 |
| (1) | The increase in 2019 is mainly explained by a higher level of trading with unregulated customers. |
For the year ended December 31, 2020, Cachoeira Dourada’s principal unregulated customers were (ordered by energy contracted): Ferbasa, Rima, Vicunha, and Volkswagen.
Fortaleza has its entire output dedicated to one long-term contract with Enel Distribution Ceara that expires in 2023. Fortaleza hedged electricity sales in 2019 but not in 2020. The 2019 hedging transactions arose from a concern related to a potential stoppage of gas supply, similar to that experienced in 2018, and allowed Fortaleza to sell electricity in the unregulated market.
EGP Volta Grande sold 70% of its total generation through the quota system with a fixed monthly revenue and the remaining 30% in the unregulated market.
Operations in Colombia
We participate in electricity generation in Colombia through our subsidiary Emgesa. As of December 31, 2020, Emgesa operated 36 generation units, with a total net installed capacity of 3,506 MW, of which 3,097 MW was from hydroelectric plants and 409 MW was from thermal plants. According to Expertos de Mercado S.A. E.S.P. (“XM”), a Colombian company that provides system management in real-time services in the electrical, financial, and transportation sectors, our hydroelectric and thermal generation plants represented 20.1% of the country’s total electricity generation net capacity as of December 2020, making Emgesa the company with the largest percentage of generation capacity, followed by Empresa Pública de Medellín and Isagen with 19.9% and 16.3%, respectively. For information on the installed generation capacity for each of our Colombian subsidiaries, see “Item 4. Information on the Company — D. Property, Plant, and Equipment—Property, Plant, and Equipment of Generating Companies.”
Approximately 68.3% of the electricity generation capacity in Colombia is hydroelectric, and therefore, our electricity generation depends on reservoir levels and rainfall. In 2020, our hydroelectric generation represented 95% of our total generation, and thermal generation represented the remaining 5%. For the year ended December 31, 2020, our
41
hydroelectric generation decreased by 9% compared to 2019, mainly due to lower demand as an effect of the Covid-19 pandemic on the energy industry.
The average spot price of electricity during 2020 was COP$ 252 per kWh, a 10.5% increase compared to 2019, mainly due to unfavorable hydrological conditions between January and April.
Our generation by type in Colombia is shown in the following table:
ELECTRICITY GENERATION IN COLOMBIA (GWh)
| | | | | | | | | | | | |
| | Year ended December 31, | ||||||||||
| | 2020 | | 2019 | | 2018 | ||||||
|
| Generation |
| % |
| Generation |
| % |
| Generation |
| % |
Hydroelectric generation(1) | | 13,314 | | 95.0 | | 14,620 | | 95.9 | | 13,763 | | 97.9 |
Thermal generation | | 696 | | 5.0 | | 630 | | 4.1 | | 289 | | 2.1 |
Total generation | | 14,009 | | 100.0 | | 15,250 | | 100.0 | | 14,052 | | 100.0 |
| (1) | Rionegro power plant was sold in 2020. Figures include 44 MWh for 2020, 20.4 GWh for 2019, and 9.2 GWh for 2018. |
The following table sets forth our electricity generation and purchases in Colombia:
ELECTRICITY GENERATION AND PURCHASES IN COLOMBIA (GWh)
| | | | | | | | | | | | |
| | Year ended December 31, | ||||||||||
| | 2020 | | 2019 | | 2018 | ||||||
|
| (GWh) |
| % |
| (GWh) |
| % |
| (GWh) |
| % |
Electricity generation | | 14,009 | | 79.2 | | 15,250 | | 81.9 | | 14,052 | | 75.8 |
Electricity purchases | | 3,689 | | 20.8 | | 3,369 | | 18.1 | | 4,491 | | 24.2 |
Total(1) | | 17,698 | | 100.0 | | 18,619 | | 100.0 | | 18,544 | | 100.0 |
| (1) | Electricity generation and electricity purchases may differ from total electricity sales because transmission losses, the power plants’ own consumption and technical losses have already been deducted. |
Colombia has a single interconnected electricity system, the Colombian NIS. Electricity demand in the Colombian NIS was 70.4 TWh during 2020, an increase of 2.1% compared to 2019.
In 2020, Emgesa sold 3,704 GWh of electricity to unregulated customers, representing 21% of the total electricity sales. Regulated customers represented 61% of the of the total electricity sales. Additionally, sales in the spot market totaled 3,209 GWh, or 18% of the total electricity sales.
For the year ended December 31, 2020, principal distribution customers were: Air-e, Caribemar de la Costa S.A.S. E.S.P., Codensa (our subsidiary), Electrificadora de Santander, Empresas Municipales de Cali, and Empresas Públicas de Medellín.
Operations in Peru
We participate in electricity generation in Peru through Enel Generation Peru (formerly known as Edegel S.A.A.) and Enel Generation Piura (formerly known as Empresa Eléctrica de Piura S.A.). We operate 30 generation units in Peru, with a total net installed capacity of 1,990 MW. As of December 2020, Enel Generation Peru owns 20 hydroelectric units, with a total net installed capacity of 793 MW, and the remaining 861 MW consists of seven thermal units. Enel Generation Piura owns three thermal units with an aggregate installed capacity of 336 MW. On June 15, 2017, four hydroelectric units of Enel Generation Peru, belonging to the Callahuanca hydroelectric plant, experienced damage caused by avalanches that occurred during March 2017 and were temporarily taken out of operation. Since March 30, 2019, all of the Callahuanca hydroelectric units have been in operation.
42
According to the Committee of Economic Operation of the Peruvian System (“COES” in its Spanish acronym), the Peruvian entity in charge of coordinating the efficient operation and centralized dispatch of generation units to satisfy demand, our hydroelectric and thermal generation plants in Peru represented 15.9% of the country’s total electricity generation capacity as of December 31, 2020.
For information on the installed generation capacity for each of our power plants in Peru, see “Item 4. Information on the Company — D. Property, Plant, and Equipment. — Property, Plant, and Equipment of Generating Companies.”
Hydroelectric generation represented 56.4% of the total production of our Peruvian generation subsidiaries in 2020. In the case of Enel Generation Peru, hydrological conditions were favorable and comparable with their historical averages. However, thermal generation decreased compared to 2019 due to reduced energy demand caused by the Covid-19 pandemic.
Our generation by type and subsidiary in Peru is shown in the following table:
ELECTRICITY GENERATION IN PERU (GWh)
| | | | | | | | | | | | |
| | Year ended December 31, | ||||||||||
| | 2020 | | 2019 | | 2018 | ||||||
|
| Generation |
| % |
| Generation |
| % |
| Generation |
| % |
Hydroelectric generation (Enel Generation Peru) | | 4,358 | | 56.4 | | 4,311 | | 52.3 | | 3,849 | | 47.5 |
Thermal generation (Enel Generation Peru and Enel Generation Piura) | | 3,364 | | 43.6 | | 3,933 | | 47.7 | | 4,257 | | 52.5 |
Total generation | | 7,722 | | 100.0 | | 8,244 | | 100.0 | | 8,106 | | 100.0 |
Enel Generation Peru has long-term gas supply, transportation, and distribution contracts for its Ventanilla and Santa Rosa facilities. It has also signed transport capacity transfer agreements with other generators, which allows it to trade transport capacity to operate as instructed by COES and optimize the use of the natural gas transport system.
Enel Generation Piura has five long-term sales and purchase agreements for “wet” gas, which is mixed with other hydrocarbons. Enel Generation Piura purchases “wet” gas and converts it into “dry” gas used for electric generation at its Malacas Power Plant. The gas is also sold to the Talara refinery (owned by Petroperu, the Peruvian National Oil Company) through a supply agreement which will remain in place until commercial operation of the renovated Talara refinery and perhaps longer if Enel Generation Piura reaches an agreement with the local gas distribution concessionaire, Gases del Norte del Peru S.A.C. (GASNORP).
Enel Generation Piura signed an agreement with the Pariñas Processing Plant to satisfy its dry gas needs. The agreement allows Enel Generation Piura to convert wet gas into dry gas and recover natural gas liquids, which are shared with the Pariñas Processing Plant.
The following table sets forth our electricity generation and purchases in Peru:
ELECTRICITY GENERATION AND PURCHASES IN PERU (GWh)(1)
| | | | | | | | | | | | |
| | Year ended December 31, | ||||||||||
| | 2020 | | 2019 | | 2018 | ||||||
|
| (GWh) |
| % |
| (GWh) |
| % |
| (GWh) |
| % |
Electricity generation | | 7,722 | | 75.3 | | 8,244 | | 73.6 | | 8,106 | | 76.5 |
Electricity purchases | | 2,536 | | 24.7 | | 2,955 | | 26.4 | | 2,491 | | 23.5 |
Total | | 10,258 | | 100.0 | | 11,199 | | 100.0 | | 10,597 | | 100.0 |
| (1) | The values include sales to distribution companies without contracts. |
The Peruvian National Interconnected Electric System (“SEIN”) is the only interconnected system in Peru. Electricity sales in the SEIN decreased by 7.4% in 2020 compared to 2019, amounting to 45,402 GWh in 2020.
43
The distribution of our electricity sales in Peru by subsidiary is shown in the following table:
ELECTRICITY SALES BY SUBSIDIARY IN PERU (GWh)
| | | | | | | | | | | | |
| | Year ended December 31, | ||||||||||
| | 2020 | | 2019 | | 2018 | ||||||
|
| Sales |
| % of Sales |
| Sales |
| % of Sales |
| Sales |
| % of Sales |
Enel Generation Peru | | 9,642 | | 94.0 | | 10,541 | | 94.1 | | 9,994 | | 94.3 |
Enel Generation Piura | | 616 | | 6.0 | | 658 | | 5.9 | | 603 | | 5.7 |
Total electricity sales | | 10,258 | | 100.0 | | 11,199 | | 100.0 | | 10,597 | | 100.0 |
In 2020, Enel Generation Peru had energy contracts with eight regulated customers and 101 unregulated customers. Sales to unregulated customers, regulated customers, and spot market sales represented 45%, 39% and 16% of Enel Generation Peru’s total sales in 2020, respectively.
For the year ended December 31, 2020, Enel Generation Peru’s principal distribution customers were (ordered by energy contracted): Enel Distribution Peru (our subsidiary), Luz del Sur, and SEAL.
In 2020, Enel Generation Piura had contracts with eight regulated customers and four unregulated customers. Sales to unregulated customers, regulated customers, and spot market sales represented 18%, 67% and 15% of Enel Generation Piura’s total sales in 2020, respectively.
For the year ended December 31, 2020, Enel Generation Piura’s principal distribution customers were Enel Distribution Peru and Luz del Sur.
Our most significant competitors in Peru are Engie Perú and Inkia Energy.
Electricity Transmission Business
Cien
Our electricity transmission operations are conducted through Cien, a wholly-owned subsidiary of Enel Brasil and us. Cien consolidates CTM and TESA, which operate the Argentine side of the interconnection line between Argentina and Brazil. The local authority recognizes Cien as a “regulatory asset” and as part of the Brazilian grid. Therefore, it is entitled to receive fixed payments called Permitted Annual Compensation (RAP).
Cien enables the energy integration of Mercosur and the import and export of electricity between Argentina and Brazil. It is responsible for the operation of transmission lines covering a distance of approximately one thousand kilometers, with a total transmission capacity of 2,200 MW. Cien operates each transmission line under the Cien I and Cien II concessions granted by the Brazilian government. The Cien I concession’s term expired in June 2020 and the Cien II concession’s term expires in July 2022. However, with regard to the Cien I concession, the Brazilian MME issued an official act in June 2020 designating Cien to continue operating the facilities covered by the Cien I concession until a new operator is appointed through an upcoming bid process. In the meantime, Cien will receive an annual income calculated based on current criteria and methodology. Cien’s subsidiaries, CTM and TESA, have concessions granted by the Argentine government, which expire in 2087.
Electricity Distribution Business
Our electricity distribution business is conducted in Argentina through Edesur; in Brazil through Enel Distribution Rio, Enel Distribution Ceara, Enel Distribution Goias, and Enel Distribution Sao Paulo; in Colombia through Codensa; and in Peru through Enel Distribution Peru. For the year ended December 31, 2020, electricity sales decreased by 4.5% compared to 2019, totaling 115,213 GWh. For more information on energy sales by our distribution subsidiaries for the last five fiscal years, see “Item 3. Key Information — A. Selected Financial Data.”
44
Edesur (Argentina)
Edesur is one of the largest electricity distribution companies in Argentina in terms of energy purchases. Edesur operates in a concession area of 3,309 square kilometers in the south-central part of the Buenos Aires metropolitan area, serving approximately 2.5 million customers under a 95-year concession granted by the Argentine government that will be in force until 2087. As of December 31, 2020, residential, commercial, industrial, and other customers, primarily public and municipal, represented 46%, 22%, 7%, and 25%, respectively, of Edesur’s total energy sales of 15,888 GWh. In 2020, its energy losses were 18.9% compared to 15.5% in 2019.
The following table sets forth Edesur’s primary operating data for each of the periods indicated:
| | | | | | |
| | Year ended December 31, | ||||
|
| 2020 |
| 2019 |
| 2018 |
Electricity sales (GWh) | | 15,888 | | 16,798 | | 17,548 |
Residential | | 7,282 | | 5,842 | | 8,436 |
Commercial | | 3,466 | | 3,106 | | 1,340 |
Industrial | | 1,179 | | 4,331 | | 4,221 |
Other customers(1) | | 3,962 | | 3,520 | | 3,551 |
Number of customers (thousands) | | 2,508 | | 2,490 | | 2,530 |
Residential | | 2,216 | | 2,195 | | 2,227 |
Commercial | | 271 | | 274 | | 280 |
Industrial | | 20 | | 20 | | 21 |
Other customers | | 1 | | 1 | | 1 |
Energy purchased (GWh)(2) | | 13,094 | | 13,747 | | 14,514 |
Total energy losses (%)(3) | | 18.9 | | 15.5 | | 14.2 |
SAIDI (hours) | | 14.0 | | 20.2 | | 25.2 |
SAIFI (times) | | 4.5 | | 6.0 | | 6.7 |
| (1) | The figures for other customers include tolls. |
| (2) | Edesur purchased all of its energy from CAMMESA, the governmental agency that regulates and acts as an intermediary between generation and distribution. |
| (3) | Energy losses are calculated as the percent difference between the energy purchased and energy sold, excluding tolls and energy consumption not billed (GWh) within a given period. Losses in distribution arise mainly from illegally tapped lines and technical losses. |
For the year ended December 31, 2020, Edesur’s principal unregulated customers were (ordered alphabetically): A.F.I.P., Arcos Dorados Argentina S.A, AYSA S.A., Banco Nación Argentina, Banco Santander Río S.A., Cerámica Canuelas S.A., Cerámica Quilmes S.A., COCA COLA FEMSA S.A., Curtiembres Fonseca S.A., DIA ARGENTINA S.A., Hoteles Sheraton de Argentina, JUMBO Retail Argentina S.A., Los Cipreses S.A., Metrovias S.A., Reginal LEE S.A.I.C., Roca Argentina S.A., Telecom Argentina S.A., Telefónica Argentina S.A., Telefónica Mov. Argentina S.A. and Valenciana Argentina.
In 2020, the collection rate from Edesur’s customers was 93.9% compared to 95.8% in 2019.
45
Enel Distribution Rio (Brazil)
Enel Distribution Rio is the second-largest electricity distribution company in the State of Rio de Janeiro, Brazil, in terms of the number of customers and annual energy sales. Enel Distribution Rio is mainly engaged in distributing electricity to 66 municipalities located in the State of Rio de Janeiro. It serves approximately 3 million customers in a concession area of 32,615 square kilometers, with an estimated population of 17.2 million. Enel Distribution Rio operates under a 30-year concession granted by the Brazilian government, which will remain in force until December 2026. As of December 31, 2020, residential, commercial, industrial, and other customers represented 43%, 14%, 2%, and 41%, respectively, of Enel Distribution Rio’s total sales of 11,228 GWh. In 2020, its energy losses were 22.1%, compared to 22.5% in 2019.
The following table sets forth Enel Distribution Rio’s primary operating data for each of the periods indicated:
| | | | | | |
| | Year ended December 31, | ||||
|
| 2020 |
| 2019 |
| 2018 |
Electricity sales (GWh) | | 11,228 | | 11,568 | | 11,019 |
Residential | | 4,825 | | 4,839 | | 4,755 |
Commercial | | 1,562 | | 1,927 | | 1,930 |
Industrial | | 180 | | 227 | | 400 |
Other customers(1) | | 4,662 | | 4,574 | | 3,934 |
Number of customers (thousands) | | 2,948 | | 2,940 | | 2,959 |
Residential | | 2,528 | | 2,691 | | 2,721 |
Commercial | | 132 | | 155 | | 152 |
Industrial | | 4 | | 4 | | 4 |
Other customers | | 284 | | 90 | | 82 |
Energy purchased (GWh) | | 14,414 | | 14,920 | | 14,490 |
Total energy losses (%)(2) | | 22.1 | | 22.5 | | 21.0 |
SAIDI (hours) | | 10.5 | | 13.2 | | 13.9 |
SAIFI (times) | | 6.1 | | 8.0 | | 7.7 |
| (1) | The data for other customers includes tolls. |
| (2) | Energy losses are calculated as the percent difference between the energy purchased and energy sold, excluding tolls and energy consumption not billed (GWh) within a given period. Losses in distribution arise mainly from illegally tapped lines and technical losses. |
In 2020, the collection rate from Enel Distribution Rio’s customers was 93.7% compared to 97.4% in 2019.
46
Enel Distribution Ceara (Brazil)
Enel Distribution Ceara is mainly engaged in distributing electricity to municipalities located in the state of Ceará and serves almost 4 million customers in a concession area of 148,921 square kilometers, with an estimated population of 9.1 million. Enel Distribution Ceara operates under a 30-year concession granted by the Brazilian government, in force until May 2028. As of December 31, 2020, residential, commercial, industrial, and other customers represented 41%, 14%, 5%, and 40%, respectively, of Enel Distribution Ceara’s total sales of 11,866 GWh. In 2020, its energy losses were 15.9 %, compared to 14.0% in 2019.
The following table sets forth Enel Distribution Ceara’s primary operating data for each of the periods indicated:
| | | | | | |
| | Year ended December 31, | ||||
|
| 2020 |
| 2019 |
| 2018 |
Electricity sales (GWh) | | 11,866 | | 12,197 | | 11,843 |
Residential | | 4,910 | | 4,610 | | 4,372 |
Commercial | | 1,676 | | 1,953 | | 1,931 |
Industrial | | 596 | | 666 | | 703 |
Other customers(1) | | 4,684 | | 4,968 | | 4,837 |
Number of customers (thousands) | | 4,011 | | 3,956 | | 3,933 |
Residential | | 3,176 | | 3,114 | | 3,181 |
Commercial | | 183 | | 187 | | 168 |
Industrial | | 6 | | 6 | | 5 |
Other customers | | 646 | | 649 | | 579 |
Energy purchased (GWh) | | 14,103 | | 14,186 | | 13,771 |
Total energy losses (%)(2) | | 15.9 | | 14.0 | | 13.9 |
SAIDI (hours) | | 15.9 | | 13.9 | | 8.7 |
SAIFI (times) | | 6.0 | | 5.4 | | 4.4 |
| (1) | The data for other customers includes tolls. |
| (2) | Energy losses are calculated as the percent difference between the energy purchased and energy sold, excluding tolls and energy consumption not billed (GWh) within a given period. Losses in distribution arise mainly from illegally tapped lines and technical losses. |
In 2020, the collection rate from Enel Distribution Ceara’s customers was 98.6% compared to 97.4% in 2019.
47
Enel Distribution Goias (Brazil)
Enel Distribution Goias is mainly engaged in distributing electricity to municipalities located in the state of Goiás and serves almost three million customers in a concession area of 336,871 square kilometers, with an estimated population of 6.9 million. Enel Distribution Goias operates under a concession granted by the Brazilian government that will remain in force until July 2045. As of December 31, 2020, residential, commercial, industrial, and other customers accounted for 37%, 14%, 4%, and 45%, respectively, of Enel Distribution Goias’ total energy sales of 14,469 GWh. In 2020, energy losses were 11.4%, compared to 12.3% in 2019.
The following table sets forth Enel Distribution Goias’ primary operating data for each of the periods indicated:
| | | | | | |
| | Year ended December 31, | ||||
|
| 2020 |
| 2019 |
| 2018 |
Electricity sales (GWh) | | 14,469 | | 14,365 | | 13,755 |
Residential | | 5,382 | | 5,066 | | 4,741 |
Commercial | | 1,972 | | 2,260 | | 2,416 |
Industrial | | 654 | | 821 | | 3,556 |
Other customers(1) | | 6,461 | | 6,217 | | 3,041 |
Number of customers (thousands) | | 3,207 | | 3,114 | | 3,027 |
Residential | | 2,753 | | 2,730 | | 2,589 |
Commercial | | 219 | | 222 | | 217 |
Industrial | | 9 | | 9 | | 9 |
Other customers | | 227 | | 153 | | 211 |
Energy purchased (GWh) | | 16,330 | | 16,382 | | 15,717 |
Total energy losses (%)(2) | | 11.4 | | 12.3 | | 11.6 |
SAIDI (hours) | | 15.9 | | 22.5 | | 25.6 |
SAIFI (times) | | 8.5 | | 9.7 | | 12.3 |
| (1) | The data for other customers includes tolls. |
| (2) | Energy losses are calculated as the percent difference between the energy purchased and energy sold, excluding tolls and energy consumption not billed (GWh) within a given period. Losses in distribution arise mainly from illegally tapped lines and technical losses. |
In 2020, the collection rate from Enel Distribution Goias’ customers was 98.3% compared to 98.1% in 2019.
48
Enel Distribution Sao Paulo (Brazil)
Enel Distribution Sao Paulo distributes electricity to municipalities located in the Sao Paulo Metropolitan Area and serves almost 7.2 million customers in a concession area of 4,526 square kilometers, with an estimated population of 18 million. Enel Distribution Sao Paulo operates under a concession granted by the Brazilian government that will remain in force until June 2028. As of December 31, 2020, residential, commercial, industrial, and other customers accounted for 40%, 23%, 7%, and 30%, respectively, of Enel Distribution Sao Paulo’s total energy sales of 40,350 GWh. In 2020, energy losses were 10.6%, compared to 9.6% in 2019. Enel Brasil acquired Enel Distribution Sao Paulo in June 2018.
The following table sets forth Enel Distribution Sao Paulo’s primary operating data for each of the periods indicated:
| | | | | | |
| | Year ended December 31, | ||||
|
| 2020 |
| 2019 |
| 2018(1) |
Electricity sales (GWh) | | 40,350 | | 43,148 | | 24,693 |
Residential | | 16,074 | | 16,365 | | 9,455 |
Commercial | | 9,375 | | 10,516 | | 5,880 |
Industrial | | 2,620 | | 2,772 | | 1,814 |
Other customers(2) | | 12,281 | | 13,496 | | 7,542 |
Number of customers (thousands) | | 7,896 | | 7,777 | | 7,224 |
Residential | | 7,392 | | 7,286 | | 6,766 |
Commercial | | 445 | | 438 | | 410 |
Industrial | | 30 | | 28 | | 26 |
Other customers | | 30 | | 25 | | 22 |
Energy purchased (GWh) | | 45,154 | | 47,804 | | 27,370 |
Total energy losses (%)(3) | | 10.6 | | 9.6 | | 9.5 |
SAIDI (hours) | | 7.4 | | 6.3 | | 7.0 |
SAIFI (times) | | 3.6 | | 3.5 | | 4.1 |
| (1) | We acquired Enel Distribution Sao Paulo in June 2018. |
| (2) | The data for other customers includes tolls. |
| (3) | Energy losses are calculated as the percent difference between the energy purchased and energy sold, excluding tolls and energy consumption not billed (GWh) within a given period. Losses in distribution arise mainly from illegally tapped lines and technical losses. |
In 2020, the collection rate from Enel Distribution Sao Paulo’s customers was 98.7% compared to 100.6% in 2019. The 2019 collection rate was more than 100% due to the collection of unpaid bills from previous periods.
49
Codensa (Colombia)
Codensa is a Colombian electricity distribution company that serves a concession area of 26,093 square kilometers in Bogotá and 130 other municipalities of the provinces of Cundinamarca, with approximately 3.5 million customers.
Under Colombian law, since no concessions are granted, administrative authorization is required to provide distribution service. In the case of Codensa, the authorization is of indefinite duration.
Since 2001, Codensa only provides services to regulated customers. The unregulated market is serviced directly by our generation company, Emgesa, except for public lighting in Bogotá. In 2020, Codensa’s energy losses were 7.6%, compared to 7.7% in 2019. As of December 31, 2020, residential, commercial, industrial, and other customers accounted for 39%, 15%, 7%, and 39%, respectively, of Codensa’s total energy sales of 13,834 GWh.
The following table sets forth Codensa’s primary operating data for each of the periods indicated:
| | | | | | |
| | Year ended December 31, | ||||
|
| 2020 |
| 2019 |
| 2018 |
Electricity sales (GWh) | | 13,834 | | 14,307 | | 14,024 |
Residential | | 5,407 | | 5,113 | | 5,055 |
Commercial | | 2,035 | | 2,508 | | 2,489 |
Industrial | | 927 | | 1,044 | | 1,066 |
Other customers(1) | | 5,464 | | 5,642 | | 5,414 |
Number of customers (thousands) | | 3,615 | | 3,527 | | 3,439 |
Residential | | 3,222 | | 3,144 | | 3,062 |
Commercial | | 327 | | 322 | | 317 |
Industrial | | 49 | | 49 | | 49 |
Other customers | | 17 | | 12 | | 11 |
Energy purchased (GWh)(2) | | 14,964 | | 14,368 | | 15,269 |
Total energy losses (%)(3) | | 7.6 | | 7.7 | | 7.7 |
SAIDI (hours) | | 7.8 | | 11.1 | | 11.8 |
SAIFI (times) | | 5.6 | | 6.8 | | 9.0 |
| (1) | The data for other customers includes tolls. |
| (2) | In 2020, 52.8% of the electricity purchased without tolls was acquired from Emgesa, compared to 51.6% in 2019 and 36.8% in 2018. |
| (3) | Energy losses are calculated as the percent difference between the energy purchased and energy sold, excluding tolls and energy consumption not billed (GWh) within a given period. Losses in distribution arise mainly from illegally tapped lines and technical losses. |
In 2020, the collection rate from Codensa’s customers was 98.9% compared to 100.9% in 2019.
50
Enel Distribution Peru (Peru)
Enel Distribution Peru is a Peruvian electricity distribution company that operates in a concession area of 1,602 square kilometers under an indefinite concession granted by the Peruvian government with approximately 1.45 million customers. It has an exclusive concession to distribute electricity in the northern part of the Lima metropolitan area, some provinces in the Lima region, including Huaral, Huaura, Barranca, and Oyón, and the adjacent province of Callao.
As of December 31, 2020, residential, commercial, industrial, and other customers accounted for 42%, 9%, 21%, and 28%, respectively, of Enel Distribution Peru’s total energy sales of 7,578 GWh. In 2020, energy losses were 8.8%, compared to 8.2% in 2019.
The following table sets forth Enel Distribution Peru’s principal operating data for each of the periods indicated:
| | | | | | |
| | Year ended December 31, | ||||
|
| 2020 |
| 2019 |
| 2018 |
Electricity sales (GWh) | | 7,578 | | 8,211 | | 8,045 |
Residential | | 3,188 | | 3,068 | | 2,988 |
Commercial | | 666 | | 814 | | 886 |
Industrial | | 1,557 | | 1,937 | | 1,847 |
Other customers(1) | | 2,167 | | 2,392 | | 2,324 |
Number of customers (thousands) | | 1,456 | | 1,434 | | 1,423 |
Residential | | 1,377 | | 1,359 | | 1,348 |
Commercial | | 47 | | 47 | | 46 |
Industrial | | 2 | | 2 | | 2 |
Other customers | | 30 | | 27 | | 27 |
Energy purchased (GWh)(2) | | 7,040 | | 7,649 | | 7,532 |
Total energy losses (%)(3) | | 8.8 | | 8.2 | | 8.1 |
SAIDI (hours) | | 7.0 | | 7.0 | | 7.3 |
SAIFI (times) | | 2.6 | | 2.8 | | 2.8 |
| (1) | The data for other customers includes tolls. |
| (2) | In 2020, 33.5% of the electricity purchased was acquired from Enel Generation Peru, Chinango, and Enel Generation Piura, compared to 34.5% in 2019 and 34.0% in 2018. |
| (3) | Energy losses are calculated as the percent difference between the energy purchased and energy sold, excluding tolls and energy consumption not billed (GWh) within a given period. Losses in distribution arise mainly from illegally tapped lines and technical losses. |
In 2020, Enel Distribution Peru’s primary unregulated customers were (ordered alphabetically): AGP Peru S.A.C., Ajinomoto Del Peru S.A., APM Terminals Callao Sociedad Anonima, Cía. Minera Agregados Calcareos S.A., Filasur S.A., GYM Ferrovias S.A., Lima Airport Partners S.R.L., Minera Colquisiri S.A., Nestlé Perú S.A., Planta de Tratamiento de Aguas, Productos Paraíso del Perú S.A.C., San Miguel Industrias Pet S.A., and Servicios Industriales de la Marina S.A.
In 2020, the collection rate from Enel Distribution Peru’s customers was 95.1% compared to 99.8% in 2019.
For further details regarding the regulation of the distribution business, see “Item 4. Information on the Company— B. Business Overview — Electricity Industry Regulatory Framework.” For further details regarding the financial impact, see “Item 5. Operating and Financial Review and Prospects — A. Operating Results — 2. Analysis of Results of Operations for the Years Ended December 31, 2020, and 2019.”
Seasonality
Seasonal changes in energy demand directly influence the distribution business. Although the price at which a distribution company purchases electricity can change seasonally and has an impact on the price at which it is sold to end-users, it does not have an effect on our profitability since the cost of electricity purchased is passed on to end-users through tariffs that are set for multi-year periods. However, in the case of regulated customers, an increase in tariffs due to rate adjustments may not happen immediately, which could affect our profitability in the short term.
51
ELECTRICITY INDUSTRY REGULATORY FRAMEWORK
The following chart summarizes the main characteristics of the electricity regulatory framework currently in effect by business segment in the countries in which we operate.
| | | | Argentina | | Brazil | | Colombia | | Peru |
|---|---|---|---|---|---|---|---|---|---|---|
Gx | | Unregulated Market | | Regulated remuneration scheme (Resolution 31/2020) | | Spot markets with prices defined by a model, with limits defined by the regulator. | | Spot market with auctioned cost (Price-offered) | | Spot markets with costs audited. Natural gas prices are declared with limits. |
| Regulated | | Seasonal Price | | Auction PPAs: 25/30 years – hydro; 15/20 years – wind, solar, thermal, and biomass Authorization: 35 years. | | Auction 3/5 years | | Auction up to 20 years and node price | |
| Capacity | | Contribution | | — | | Firm energy contribution (energy auctions for at least 20 years for new projects and 1 year for current projects) | | Income based on contributions during | |
Tx | | Features | | Public - Open Access - Regulated Tariff | ||||||
Dx | | Law | | Concession contract | | Authorization | | Administrative Concession (indefinite) | ||
| Expansion | | 95 years | | 30 years | | — | | Undefined | |
| Tariff review | | 5 years | | 4/5 years | | 5 years | | 4 years | |
Td | | Unregulated customers | | > 0.03 MW | | > 0.5 MW to 2.0*MW/ renewable | | > 0.1 MW | | > 0.2 to 2.5 MW |
| Unregulated market (%) | | ≈ 20% | | ≈ 30% | | ≈ 30% | | ≈ 58% | |
| | | ||||
Gx: Generation | | Tx: Transmission | | Dx: Distribution | | Td: Trading |
*The former 2.5 MW maximum limit to be an unregulated customer in Brazil was reduced to 2.0 MW as of January 1, 2020, and further reduced to 1.5 MW as of January 1, 2021. It is expected to be reduced to 1 MW as of January 1, 2022, and 0.5 MW as of January 1, 2023.
Argentine Electricity Regulatory Framework
Industry Overview and Structure
In the Argentine Wholesale Electricity Market (“Argentine MEM” in its Spanish acronym), there are four categories of local agents (generators, transmitters, distributors, and large customers) and two external agents (traders of generation and traders of demand) who are allowed to buy and sell electricity and related products. CAMMESA (Compañía Administradora del Mercado Mayorista Eléctrico S.A.) is the autonomous entity responsible for operating the Argentine MEM.
52
The following chart shows the relationships among the various participants in the Argentine MEM:

i) | Generators: |
The generation segment is comprised of companies that own electricity generation power plants. Electricity generators sell their energy to the market at a price established by the regulator. In February 2017, new guidelines for the remuneration of existing generation power plants focused on incentives to enable power plants’ availability. In February 2019, the remuneration values determined in Resolution 1/2019 were updated. Moreover, a change in the methodology used to determine the real available power was introduced for hydroelectric generators. In February 2020, Resolution 31/2020 replaced Resolution 1/2019 and defines a minimum remuneration for electricity generation by technology and scale according to their availability.
ii) | Transmitters: |
The transmission sector is a public service that operates under monopoly conditions and comprises several companies that have been granted concessions by the Argentine government. One concessionaire operates and maintains the highest voltage facilities. In contrast, eight concessionaires operate and maintain high- and medium-voltage facilities to which generation plants, distribution systems, and large customers are connected. The international interconnected transmission systems also require concessions granted by the Argentine Secretary of Energy (“SEE”). Transmission companies are authorized to charge different tolls for their services.
iii) | Distributors: |
Distribution is a public service that operates under monopoly conditions and comprises companies that have been granted concessions by the Argentine government. Distribution companies must make electricity available to end customers within a specific concession area, regardless of whether they have a contract with the distributor or directly with a generator. Distributors have regulated tariffs and are subject to quality service specifications. They may obtain electricity on the Argentine MEM’s spot market at the so-called “seasonal price,” defined by the SEE as the maximum electricity cost purchased by distributors that can be passed on to regulated customers. As stipulated in the privatization decrees and laws issued in 1992, there
53
are two electricity distribution areas in the greater Buenos Aires area subject to bipartite concessions between the City of Buenos Aires and the Province of Buenos Aires, Edesur (our subsidiary) and Edenor (an unrelated company). The local distribution areas are subject to concessions granted by the provincial or municipal authorities; however, all distribution companies acting in the Argentine MEM must operate under its rules.
iv) | Customers: |
Distributors supply regulated and unregulated customers at regulated tariffs. Regulated customers are defined as those that demand up to 30 kW of capacity, and unregulated customers demand at least 30 kW. The latter are classified into three categories: major large, minor large, and large private customers. Each class has different requirements concerning purchases of energy. Major large customers are required to purchase 50% of their demand through supply contracts and 50% in the spot market, while minor large and large private customers must buy all their needs through supply contracts. Large customers participate in CAMMESA by appointing two directors and two acting directors to the Argentine Association of Electric Power for Large Customers. Large customers buy electricity directly from CAMMESA following the expiration of their bilateral contracts directly from generators. There is one interconnected system, the Argentine NIS, and smaller systems that provide electricity to remote areas.
Principal Regulatory Authorities
The Argentine Secretary of Energy is responsible for studying and analyzing the behavior of energy markets; preparing the strategic planning for electricity, hydrocarbons, and other fuels; promoting policies that increase competition and improve efficiency in the allocation of resources; applying sector policies; orienting new operators to the general interests of the sector; and respecting the rational exploitation of resources and the preservation of the environment. The Argentine Secretary of Energy, through the Sub-Secretary of Electric Energy, implements necessary actions to manage the energy industry and resolves issues to avoid emergencies.
The primary responsibilities of the Sub-Secretary of Electric Energy include:
● | modification of transmission system regulation in terms of connections, use, and international interconnections; |
● | revision of regulations regarding dispatch and pricing procedures; |
● | definition of the capacity, energy, and other technical parameter requirements for distributors and large consumers to enter the Argentine MEM; |
● | description of rules to operate and enter into contracts in the Argentine MEM; |
● | authorization of electricity imports and exports; |
● | settlement of complaints filed against the National Regulatory Authority for the Energy Sector; |
● | execution of the ministry’s functions within the Consejo Federal de la Energía Eléctrica; and |
● | management of an electricity development fund. |
The Argentine National Regulatory Authority for the Energy Sector (“ENRE” in its Spanish acronym) carries out measures necessary to meet national policy objectives concerning the generation, transmission, and distribution of electricity.
ENRE’s principal activities include:
| ● | protection of customer rights; |
| ● | promotion of competitiveness; |
| ● | encouragement of investments that assure long-term supply; |
54
| ● | promotion of free access, non-discrimination, and the generalized use of the transmission and distribution services; |
| ● | regulation of transmission and distribution services to ensure fair and reasonable tariffs; and |
| ● | encouragement of private investment in production, transmission, and distribution, striving for competitive markets where applicable. |
CAMMESA is the Argentine autonomous entity in charge of operating the Argentine MEM. Its stakeholders are generation, transmission, distribution companies, large users, and the Under Secretary of Electric Energy. CAMMESA’s principal functions are the coordination of dispatch operations, the establishment of wholesale prices, and the management of economic transactions in the Argentine NIS. It is also responsible for executing the dispatch through financial considerations and rationality in managing energy resources, coordinating the Argentine NIS’s centralized operation to guarantee its security and quality, and managing the Argentine MEM. These functions are designed to ensure transparency through the participation and regulation of all stakeholders.
The Federal Environmental Council is an institutional branch of the federal government empowered to address environmental problems and solutions in Argentina. It has the legal authority to coordinate the development of environmental policy among member states. Member states adopt regulations, rules, and resolutions issued by the Argentine Assembly. The principal functions of the Argentine Federal Environmental Council are to:
| (i) | manage specific funds for the electricity sector; |
| (ii) | advise the national executive authority and the provincial governments concerning the electricity industry, priorities in performing studies, works, concessions, authorizations, prices, and tariffs in the electricity sector; and |
(iii) | advise on modifications resulting from legislation referring to the electricity industry. |
The Ministry of Environment and Sustainable Development, a member of the Federal Environment Council, assists the Chief of the Ministers’ Cabinet in implementing environmental measures and assures their insertion in the ministries and other public sector areas. It seeks to foster rational exploitation and sovereignty over Argentina’s natural resources taking into account fairness and social inclusion. The Secretary of Energy is involved in preserving the environment through the national planning, implementation, and management of sustainable development programs, rational use of renewable energy, and environmental issues in coordination with different branches of the Argentine government.
The Electricity Law
���
General
Private companies originally developed the Argentine electricity industry. The Argentine government began to intervene in the sector in the 1950s and initiated a nationalization process. In 1960, it organized the sector and established the federal legal framework to begin major transmission and generation projects. Many government-owned corporations were created within this framework to carry out various hydroelectric and nuclear projects.
As a result of the electricity shortage in 1989, the following laws were passed starting in 1990: Law 23,696 (“State Reform”), Law 23,697 (“Economic Emergency”), and Law 24,065 (“Electricity Framework”). This legislation’s objective was to replace the vertically integrated system based on a centralized state monopoly with a competitive system based on market conditions.
FONINVEMEM
FONINVEMEM is a fund managed by CAMMESA created to encourage electricity capacity within the Argentine MEM. Private sector generators in the Argentine MEM were called upon to participate from 2004 until 2006 in the construction, operation, and maintenance of electricity generation plants financed with FONINVEMEM funds, consisting of two combined-cycle generation plants of approximately 825 MW each. Both power plants receive
55
remuneration under Resolution 31/2020, published in February 2020, which replaced Resolution 1/2019 and extended the operations and maintenance contract for each power plant. See “— Pricing” below for a further discussion about Resolution 31/2020.
Limits and Restrictions
To preserve competition in the electricity market, participants in the electricity sector are subject to vertical and horizontal integration restrictions, depending on the market segment in which they operate.
Vertical Integration Restrictions
Vertical integration restrictions apply to companies that intend to participate simultaneously in different sub-sectors of the electricity market. The Electricity Framework’s vertical integration restrictions are applied differently to each sub-sector as described below.
Generators
● | Neither a generation company nor any of its controlled or controlling companies can be an owner, majority shareholder, or the controlling entity of a transmission company; |
● | Since a distribution company cannot own generation units, a holder of generation units cannot own distribution concessions. However, an electricity generator’s shareholders may own an entity that holds distribution units, either by themselves or through any other entity created to own or control distribution units. |
Transmitters
● | Neither a transmission company nor any of its controlled or controlling companies can be an owner, majority shareholder, or the controlling company of a generation company; |
● | Neither a transmission company nor any of its controlled or controlling companies can be an owner, majority shareholder, or the controlling company of a distribution company; and |
● | Transmission companies cannot buy or sell electricity. |
Distributors
● | Neither a distribution company nor any of its controlled or controlling companies can be an owner, majority shareholder, or the controlling company of a transmission company; and |
● | A distribution company cannot own generation units. However, an electricity distributor’s shareholders may own generation units either directly or through any other entity created to own or control generation units. |
Horizontal Integration Restrictions
In addition to the vertical integration restrictions described above, distribution and transmission companies are subject to the following horizontal integration restrictions.
Transmitters
● | Two or more transmission companies can merge or be part of the same economic group only if they obtain express approval from the ENRE. Such acceptance is also necessary when a transmission company intends to acquire shares of another transmission company. Pursuant to concession agreements that govern services rendered by private companies operating transmission lines between 132 kW and 140 kW, the service is rendered by the concessionaire on an exclusive basis in certain areas indicated in the concession agreement. According to concession agreements that govern services rendered by private companies operating high-voltage |
56
transmission services of at least 220 kW, such companies must render the service on an exclusive basis and are entitled to render the service throughout the entire country without territorial limitations.
Distributors
● | Two or more distribution companies can merge or be part of the same economic group only if they obtain express approval from the ENRE. Such permission is necessary when a distribution company intends to acquire shares of another transmission or distribution company. |
● | Pursuant to concession agreements that govern services rendered by private companies operating distribution networks, the concessionaire renders the service on an exclusive basis in certain areas indicated in the concession agreement. |
Regulation of Generation Companies
Concessions
Hydroelectric generators with a normal generation capacity exceeding 500 kW must obtain a concession to use public water sources. Concessions may be granted for a fixed or indefinite term.
Such concession holders have the right to:
(iii) | request that the authorities use the powers conferred in Article 10 of Law 15,336 in cases where it is necessary to appropriate the property of a third party that was not part of the concession when the concession holder has failed to reach an agreement with the third party. |
Dispatch
All generators that are agents of the Argentine MEM must be connected to the Argentine NIS and are obliged to comply with the dispatch order to generate and deliver energy to the Argentine NIS as determined by CAMMESA.
Pricing
In February 2020, the SEE published Resolution 31/2020, which replaced Resolution 1/2019, and defines remuneration for all existing renewable energy sources. The resolution establishes compensation prices at an exchange rate of Ar$ 60 per US$ 1.00 and updates prices in Argentine pesos. The resolution defines a minimum remuneration for electricity generation by technology and scale according to availability. For thermal generators, it also establishes the possibility of offering availability commitments with an equal differential remuneration for all technologies. CAMMESA allows thermal generators up to 30 days before the start of each quarterly period to declare the firm power value to be committed by each unit. Adjustments may be made in the same period based on seasonal requirements. The remuneration of each unit will be proportional to its compliance with its power declaration. The minimum remuneration is based on the minimum price. The power remuneration will be affected according to the use of thermal generation equipment.
Resolution 31/2020 established, in Annex VI - Update of The Values Established in Argentine Pesos, that the remuneration values expressed in Argentine pesos would be updated monthly based on the evolution of the consumer price index and the wholesale price index, both published by the Argentine Institute of Statistics (“INDEC” in its Spanish acronym). However, in April 2020, CAMMESA was instructed to postpone until further notice application of Resolution 31/2020.
57
Our generation companies in Argentina are keeping a record of economic transactions that occurred from March 2020 until the date of this Report due to the fact that the inflation adjustment was not applied to electricity generation payments during that time. Additionally, we have submitted formal complaints to the Argentine Ministry of Energy and Mining for the El Chocón and Central Costanera units.
Remuneration of Power Availability in Peak Hours
The hydroelectric enabled generators receive monthly remuneration for their average power produced and available during maximum energy demand. This remuneration is equal to the price of power in the hours of maximum demand. In addition, thermal enabled generators receive a monthly payment for the average power delivered in the hours of maximum thermal requirement (“HMRT” in its Spanish acronym), equal to the price of power in the hours of maximum thermal requirement.
Resolution 1/2019 established a remuneration scheme for thermal power and energy delivered to the system. With respect to power, a minimum remuneration is provided based on the generator units’ scale and technology. Furthermore, generators may enter into binding contracts with CAMMESA without regard to scale or technology to guarantee availability in exchange for higher remuneration during two distinct periods (summer/winter and spring/fall).
With regard to energy, Resolution 1/2019 distinguishes between generated and delivered energy by considering the total available power and disregarding the real energy delivered. The remuneration for generated energy depends only on the type of fuel used in its production, while the payment for delivered energy is standardized for thermal and hydroelectric generators.
Also, Resolution 1/2019 established the remuneration scheme for all hydroelectric generation plants, distinguishing between power plants under a privately-operated concession and power plants owned partially by the Argentine government, Salto Grande (in a partnership with the government of Uruguay) and Yacyreyta (in a partnership with the government of Paraguay). The remuneration for privately-operated hydroelectric power plants is similar to the compensation for thermal generation, which depends on scale and technology, with some key differences. Hydroelectric generators cannot guarantee availability, and the payments they received for generated energy are not determined by scale.
As for the Salto Grande and Yacyreyta hydroelectric power plants, Resolution 1/2019 distinguishes between generated and operated energy for remuneration purposes.
In May 2017, the SEE called for a public auction, Resolution 287/2017, offering substantially higher remuneration in exchange for new high-efficiency thermal generation. In the auction, only projects interested in closing open-cycle gas turbines and co-generation were considered. The SEE awarded 1,810 MW that was to be added in 2019 and 2020. Due to the generators’ difficulties in obtaining necessary financing, the deadlines were extended by Resolution 25/2019.
For generation companies other than biomass/biogas, hydroelectricity, nuclear plants, and blocks of energy commercialized through regulated energy contracts, the SEE established guidelines in February 2017 to remunerate existing power plants. The resolution defines a minimum remuneration for power by scale and technology.
In March 2016, the SEE called for additional thermal generation capacity for the 2016 and 2017 summer seasons and the 2017 and 2018 winter seasons. Therefore, 2,871 MW were tendered and awarded in two stages: 1,915 MW in the first stage and 956 MW in the second stage. These tenders were implemented in order the meet demand during the seasonal peaks.
In November 2011, the Argentine MEM’s seasonal reference prices for non-subsidized electricity were published. The seasonal price corresponds to the cost of supply minus the subsidy. It is used to calculate the tariff paid by end consumers and guarantee the pass-through of generation costs to distributors.
This resolution also provided for:
58
As a result of Decree 134, which declared a state of emergency for the Argentine electricity sector, the Argentine MEM must enact a resolution for each change in seasonal price, subsequently transferred to the tariff. The seasonal price is calculated based on the operational programming, dispatch, and price calculations. Each resolution allows prices to reflect the actual energy cost, reducing the subsidies and creating differentiated prices for the residential customers based on their efficient energy usage. This step was the first towards the reestablishment of market conditions.
In December 2017, the SEE published Resolution No. 1,091 for new stabilized prices for energy and transportation, covering the period from December 1, 2017, to April 30, 2018, reducing subsidies and increasing the tariff charged to end consumers. In May 2018, Provision 44 fixed prices applicable to the Argentine MEM from May 1, 2018, to October 31, 2018, maintaining prices set in 2017. In July 2018, Provision 75 fixed prices for August 1, 2018, to October 31, 2018, increasing wholesale prices and reducing subsidies. In October 2018, Provision 97 fixed prices for the period from November 1, 2018, to April 30, 2019, maintaining prices established in July 2018 through Provision 75.
In February 2019, the Government Secretariat of Energy enacted Resolution No. 366/18, which set a new reference price for electricity with increases of 25% and 20% in May and August 2019, respectively, which remained effective until October 2019. Resolutions No. 26/19 and 38/19 of the Secretariat of Renewables Resources and Electricity Market approved the seasonal price updates for August through October 2019, and again from November 2019 to April 2020, maintaining fixed prices until April 2020. As a result of the entrance into force of the Solidarity Law on December 27, 2020, the ENRE suspended the seasonal price updates.
Stabilization Fund
The stabilization fund, managed by CAMMESA, established by the Electricity Framework on December 19, 1991, to absorb the difference between distributors’ purchases at seasonal prices and payments to generators for energy sales at the spot price. When the spot price is lower than the seasonal price, the stabilization fund increases. When the spot price is higher than the seasonal price, the stabilization fund decreases. The outstanding balance of this fund at any given time reflects the accumulation of differences between the seasonal price and the hourly energy price in the spot market. The stabilization fund must maintain a minimum balance to cover payments to generators if prices in the spot market during the quarter exceed the seasonal price.
The stabilization fund has been adversely affected due to modifications to the spot price and the seasonal price made by the emergency regulations, under which seasonal prices were set below spot prices resulting in large deficits in the stabilization fund. The Argentine government has financed these deficits through loans to CAMMESA and with funds from FONINVEMEM. Still, these continue to be insufficient to cover the differences between the spot price and the seasonal price.
Sales to Distribution Companies and Regulated Customers
To stabilize distribution prices, the market uses the seasonal value as the energy price to be paid by distributors for their purchases of electricity traded in the spot market, as determined every six months by the Argentine Sub-Secretary of Electric Energy, based on CAMMESA’s recommended seasonal price level for the next period according to its estimated spot price. CAMMESA calculates this price by evaluating its expected supply, demand, and available capacity and other factors. The seasonal price is revised every 90 days.
The emergency regulations also made significant changes to the seasonal prices charged to distributors in the Argentine MEM, including the implementation of a cap (which varies depending on the customer category) on the cost of electricity charged by CAMMESA to distributors at a price significantly below the spot price charged by generators.
59
Specific Regulatory Charges for Electricity Companies
The authority in charge of determining regulatory charges in Argentina is administratively divided among federal, provincial, and municipal governments. Therefore, the tax charge varies according to where the customer lives.
Incentives and Penalties
The so-called Energy Plus Service Program is provided by generators that have (i) installed new generation capacity or (ii) connected previously unconnected existing generation capacity to the Argentine NIS. All large customers with higher demand than their base demand as of November 1, 2006, were required to enter into a contract with the Energy Plus Service Program to cover their excess demand. The primary purpose of the Energy Plus Service Program is to encourage large customers with a need greater than or equal to 300 kW to sign a contract with a fast installation thermal generation power plant and to penalize those who consume above their historical levels and do not have a contract with a quick installation thermal generations power plant. Large customers who do not enter into such agreements must pay additional amounts for any consumption that exceeds base demand. The authorities must approve the prices under the contracts with the Energy Plus Service Program. Unregulated customers who cannot secure an Energy Plus Service contract can request CAMMESA to conduct an auction to satisfy their demand.
Fuel procurement
In the years following Resolution 95/2013, which placed significant constraints on the normal functioning of the electricity market, CAMMESA took control of fuel supply and procurement. Resolution 70/2018 was designed to normalize the fuel market for thermal generation gradually. The resolution allowed generators to obtain fuel on their own only if the fuel price was lower than the reference price set by CAMMESA. All generators that opt out of the joint fuel purchase by CAMMESA and fail to obtain the required fuel to operate are sanctioned under Resolution 1/2019.
In December 2019, through Resolution 12/2019, the Argentine government repealed Resolution 70/2018 that allowed generators to obtain their own fuel. As a result, generators must now purchase fuel directly from CAMMESA.
Regulation of Distribution Companies
Concessions
Distributors are companies holding a concession to distribute electricity to customers. Electricity concessions are granted to distributors according to their jurisdiction, whether national, provincial, or municipal. Distributors must supply enough electricity to meet demand in their exclusive concession areas at tariffs as per the relevant local regulations. Penalties for supply shortages are included in concession agreements. Concessions are issued for energy distribution and retail sale, with specific terms for the contract’s concessionaire. The concession periods are divided into “management periods” that allow the concessionaire to give up concessions at particular intervals.
Energy Purchases
Distribution companies must satisfy 100% of customer demand in their concession area under specific regulated service quality standards and prices. To do so, distributors must ensure the reliability and quality of their energy supply. Distribution companies purchase energy on the Argentine MEM, which may be commercialized through either the spot market, the seasonal market, or contracts. In the spot market, electricity prices change hourly according to demand and the availability of power plants. The seasonal market works by identifying two six-month seasons within each year related to hydrology: one from May 1 and the other from November 1. A stabilized energy price is determined for each season according to the expected generation costs during those six month periods. Distributors purchase energy at that price, and the price difference, compared to the spot market, is added to the following period. Distributors may also sign contracts with generators at freely negotiated prices that may include clauses regarding duration, delivery, payment, breach, and respective compensation.
60
Distribution Tariff-Setting Process
In January 2018, ENRE approved the new tariffs chart for Edesur, effective as of February 2018. These tariffs consider the following: inflation adjustments, ex-post adjustments from the previous quarter, the 48-installment deferred value-added for distribution (“VAD”), the efficiency factor, and the adjustments related to structural changes.
Additionally, the mechanism to determine the new tariffs included a decrease in the subsidies to the wholesale price, as a result the subsidy was modified to 90% of the seasonal price operated in 2017. These tariffs maintain social tariff subsidies and bonuses for the energy consumption savings of residential customers. Social tariff subsidies only apply to the generation component of the tariff and consider a special rate charged to low-income consumers equivalent to a percentage of the billing compared to the regular residential customer. This generates a distortion in the tariff formula that must be recovered through an ex-post adjustment scheme. Low-income consumers receive a 100% discount on the first 150 kWh of the month and a 50% discount on the subsequent 150 kWh. Additionally, a 10% discount on the value of generation is applied to all residential consumers who consume at least 20% less than their historical levels.
As a result of the Integral Rate Revision (“RTI” in its Spanish acronym) mechanism, ENRE established the new tariffs or VAD for Edesur, which took effect in February 2017. The RTI mechanism determines the remuneration of distributors every five years. Based on a gradual policy adopted by the Ministry of Energy and Mining, it instructed ENRE to increase the VAD by a maximum of 42%. The new tariff was adjusted in two subsequent stages, together with the corresponding updates on November 1, 2017, and February 1, 2018.
In the RTI mechanism effective as of February 2018, the following elements corresponding to the VAD component were included in the new tariff chart:
| |
(i) | the third installment of the distribution cost increase associated with the RTI; |
(ii) | the proportional part of the deferred revenue associated with previously acquired gradual provisions; and |
(iii) | the cost monitoring mechanism corresponding to the period and the application of the efficiency factor. The latter reflects the compliance by Edesur with the investment plan committed in the RTI whenever the expected value is reached. |
The difference between the VAD determined by the RTI and the VAD that currently applies to this gradual process is deferred in 48 installments as of February 2018. In July 2017, ENRE determined the specific procedure to bill deferred revenues. The RTI also determined that the VAD would be adjusted according to a “trigger clause” that would update the costs if the semi-annual consumer price index variation is higher than 5% (otherwise, it is postponed until the subsequent semester) and the adjustment mechanism dispositions, which will use a semi-annual adjustment formula that considers salaries, wholesale inflation, and retail inflation.
In July 2018, the Argentine government signed an agreement with Edesur, committing to pay Edesur the increase to the adjustment mechanism foreseen in the tariff in February and August 2018. In August 2018, 50% of the increase corresponding to the application of the cost monitoring mechanism was applied to the VAD component under the aforementioned agreement.
The cost monitoring mechanism is a polynomial formula that adjusts the remuneration of distributors every six months, mainly for inflation. Additionally, the ex-post adjustments corresponding to (i) the devolution of transportation costs associated with the previous tariffs chart (regulatory amendment) and (ii) the amounts recognized as compensation for the debit/credit tax and the health and safety taxes were applied.
At the same time, the Argentine government modified the maximum range of the social tariff subsidies. Resolution 24/2019 set the tariffs as of February 2019, and it reflects the increases in the stabilized price of energy and the power reference price, established by SGE Resolution 366/2019. It also increased the national energy fund from Ar$ 15.5 per MWh to Ar$ 80 per MWh. Furthermore, Resolution 26/2019, effective as of February 2019, approved the new values of the distribution cost. The new values came into force on March 1, 2019. With the increase in the VAD in February 2019, the variation of the cost monitoring mechanism, from August 2018 to February 2019, brought the indicator to levels above the 1.58% required by the RTI . The recovery corresponding to the deferral of 50% of the increase in the VAD
61
that should have occurred in August 2018 (7.93%) and the one-month deferral of this last increase (from February 2019 to March 2019) was incorporated. With the increments granted, the VAD defined by the RTI returned to normal.
As of January 1, 2019, the Argentine government ceased to guarantee the social rate; however, the municipal and provincial governments of Buenos Aires have committed to maintain it.
In May 2019, new tariffs came into force to update seasonal prices from May through July 2019 and constituted a new way of setting the differential price for residential consumers in order to offset previous price increases.
In May 2019, Edesur signed an obligation for regularization agreement with the Argentine Ministry of Energy and Mining, according to which the pending reciprocal claims arising in the 2006-2017 transition period ended.
As of August 2019, the cost monitoring mechanism entered into force, adjusted the remuneration of Edesur, and increased seasonal price implied by Resolution 14/2019. Later that month, Edesur and the Argentine government signed an agreement for the maintenance of tariffs. The agreement instructed ENRE to apply the tariff schedules for all customers from the previous semiannual period to the semiannual period beginning on August 1, 2019. This implied that Edesur would continue to receive compensation for earlier recoveries and deferrals (ENRE Resolution 26/2019). The difference generated in the VAD and the difference concerning seasonal prices from August 1, 2019, to December 31, 2019, was planned to be recovered in seven monthly installments beginning on January 1, 2020. Still, the ENRE did not comply with its commitment. In this framework, the parties agreed to postpone the payment of all penalties until March 2020. The agreement addressed that the paid amount was the original amount plus corresponding updates at the time of payment and that the amount was recovered in six monthly installments.
On December 27, 2019, ENRE, in accordance with Article 7 of Law No. 27541, instructed Edesur not to modify the current tariff even though the company was no longer under federal jurisdiction.
On January 8, 2020, Edesur sent Note No. 10 to ENRE, which was a motion for reconsideration of its December 27, 2019 letter which had been rejected by ENRE on January 13, 2020, through Note “NO-2020-02753292-APN-DIRECTORY # ENRE”.
On January 29, 2020, Edesur sent Note No. 50 to ENRE, instructing that ENRE apply the new rate schedule based on the cost monitoring update mechanism defined in the current RTI for February 2020, including any recovery amounts owed. As of the date of this Report, no response has been received.
Since March 2020, the ENRE has moved forward with resolutions that have been pending since August 2019 through the issuance of:
| (i) | Resolution No. 56 in June 2020, which determined that Edesur had to make payments to the accounts of 380 customers involved in a claim totaling Ar$ 3.2 million. The sanction on Edesur was a result of deficiencies in the electricity service provided and in response to complaints. |
| (ii) | Resolution No. 60 in June 2020, which applies sanctions in connection with safety on public roads in response to claims from July to September 2018. |
| (iii) | Resolution No. 63 in July 2020, which concerns items of non-compliance detected during inspections carried out at our commercial offices in 2017. |
In July 2020, several mayors of the municipalities within Edesur’s concession area issued press releases highlighting deficiencies in Edesur’s service. As a result, ENRE issued three fines to Edesur in 2020:
| (i) | Resolution No. 85: A fine of 350,000 kWh, equivalent to US$ 0.017 million. |
| (ii) | Resolution No. 86: A fine of 200,000 kWh, equivalent to US$ 0.009 million. |
| (iii) | Resolution No. 87: A fine of 41,603,000 kWh, equivalent to US$ 1.1 million. |
On August 14, 2020, a proposal was approved to expand the 2020 national budget. Articles 18 to 20 established the possibility of granting credits equivalent to three CAMMESA invoices to those distributors that were current in their debt obligations with Edesur or had a payment plan to settle debt obligations before October 31, 2020. These articles were all vetoed by regulatory decree. Additionally, Articles 13 and 14 created the Emergency Municipal Infrastructure Program of the Province of Buenos Aires for project maintenance in urban, suburban, and rural areas.
62
Decree 756 was published on September 21, 2020, extending the benefits of DNU 311/2020 and 543/2020 until December 31, 2020, which allowed vulnerable customers to delay or skip payment on up to seven consecutive or alternate invoices, with due dates as of March 1, 2020.
On October 20, 2020, ENRE issued Resolution No. 43 in response to the request for prior authorization to carry out non-regulated activities (specifically, Enel X’s home assistance service), as established in the Edesur bylaws. Additionally, ENRE fined Edesur 400,000 kWh and requested all relevant information about this service.
The 2021 national budget bill maintains the special regime for the payment of outstanding obligations with CAMMESA and the Argentine Ministry of Energy and Mining, whether for energy consumption, power, interest, or penalties, accumulated as of September 30, 2020, under the conditions established by the enforcement authority.
Penalties
The distributors are subject to three types of penalties:
1) | Quality of service penalties related to normal operation such as temporary interruptions, technical, and commercial services; |
2) | Extraordinary penalties, at the discretion of ENRE, applied in case distributors do not comply with their service obligations (e.g., blackouts); and |
3) | Supply penalties related to the system as a whole, including generation, transmission, and distribution companies, intended to compensate customers. This penalty is temporarily suspended. |
Regulation of Transmission
The transmission sector is regulated by the electricity framework and the terms of the concession granted to Transener S.A., the primary operator of transmission lines in Argentina, under Decree 2,743. Due to technological reasons, the transmission sector is heavily affected by economies of scale that limit competition. As a result, the transmission sector operates under monopoly conditions and is subject to considerable regulation. In accordance with Resolution No. 196 of the Argentine government, ENRE completed the RTI before January 31, 2017.
In November 2017, the SEE published Resolution No. 1,085, which approved the new methodology to distribute the remuneration cost of transmission. The resolution stated that as of December 1, 2017, the cost of the transmission system has to be proportionately paid in terms of demand, and generators have to pay for direct connection costs. It instructed CAMMESA to perform the calculations of the Argentine MEM’s public electricity transportation service prices for its distribution agents based on the approved methodology, including the adjustments required when seasonal prices are revised. This rule determined that charges and bonuses did not depend more on the facilities’ use but on regional allocation.
Electricity Exports and Imports
In 2018, the Argentine authorities enabled the export of natural gas and established a new procedure for authorizing exports, which are based on surplus production of natural gas generated from the policies carried out in recent years in terms of incentives for production. The authorized exports were destined for Chile, with a maximum quantity of 750,000 m3 per day, for a total volume of 479,250,000 m3, under continuous conditions from the authorization until June 1, 2020.
Additionally, the export of 600 MW of electricity to Brazil was completed in September 2018. The export was agreed to by CAMMESA and the Brazilian National Electric System Operator (“ONS” in its Portuguese acronym). The export is possible thanks to the surplus of thermal generation and available fuels (mainly natural gas), which was generated from the availability of gas resulting from higher production of Vaca Muerta, and made it possible due to private investment in new electricity generation and the improvement of the availability from the thermal generation power plants that took advantage of lower energy demand during the spring season. Such integration of operations represented both operating and economic benefits for Argentina and Brazil.
63
Environmental Regulation
Electricity facilities are subject to federal and local environmental laws and regulations, including Law 24,051, the “Hazardous Waste Law,” and ancillary regulations.
Certain reporting and monitoring obligations and emission standards are imposed on the electricity sector. Failure to satisfy these requirements entitles the Argentine government to impose penalties such as suspension of operations that, in the case of public services, could result in the cessation of concessions.
The use of renewable energy has been a high national interest since 2015. Under Law 27,191, hydroelectric plants with a capacity of up to 50 MW qualify as “renewable” in this context. The law establishes that large customers need to meet their demand with contracts associated with renewable technologies according to the following schedule: at least 12% by 2019, 16% by 2021, 18% by 2023, and 20% by 2025. The law sets a maximum price of US$ 113 per MWh for renewable energy contracts in the Argentine MEM, but it does not set a specific commitment for distributors. It established penalties for those who do not comply with the rates established by Article 8, equivalent to the variable cost of electricity production generated with imported diesel fuel for the deficit of contracted renewable energy. Law 27,191 also established incentives for investments, including the anticipation of the VAD tax refund, the application of accelerated depreciation, the creation of a common fund for project financing, and import duty exemptions.
In November 2018, through Resolution No. 100, the Sub-Secretary of Electric Energy, invited all interested parties to participate in an auction to secure long-term energy PPAs with CAMMESA. Given constraints present at that time, the government wanted to connect small-scale renewable energy projects to the 220 kV and 132 kV grids. As a result, 352 MW were awarded.
In September 2019, because nearly 50 of the 88 projects awarded during the second round of the RenovAr auction had been stalled, the Sub-Secretary of Electric Energy issued a note instructing CAMMESA to defer for 180 days all penalties and fines stemming from delays in the date of the approved commercial commencement. On October 8, 2019, the Sub-Secretary issued a note reinstating the penalties and fines previously deferred.
Regulatory Issues Due to the Covid-19 Pandemic
As a result of the Covid-19 pandemic, the government of Argentina ordered: (i) the closure of all commercial offices for an indefinite term starting in March 2020; (ii) restriction of suspension of essential services as of March 2020 for 180 days, including for users with current notices of service cuts outstanding; (iii) allowance for users who suffered a 50% or greater reduction in their power demand to suspend payment of energy bills or make them in installments until demand reached 70% of normal demand; (iv) that charges to residential tier one users during periods without meter readings (from March 2020 to May 2020) should be equal to the lowest consumption of energy recorded in the same month during the last three years; and (v) the creation of a solidarity account to finance tasks, construction, or modifications related to connection and guaranteed access to electrical energy for customers as defined in Article 1 of Law No. 27,351. The account will be funded by fines charged for poor service quality and product and commercial deficiencies.
64
Brazilian Electricity Regulatory Framework
Industry Overview and Structure
There are six types of agents in the Brazilian electricity market: generation, transmission, distribution, trading, regulated customers, and unregulated customers. Under Brazilian law, generation, transmission, distribution, and trading are different activities (unbundled system).
Brazil’s electricity industry is organized into one large interconnected electricity system, the National Interconnected System (“NIS”), which provides coverage to more than 99% of the Brazilian population. There are four sub-market divisions (different from the geographical division) within the Brazilian NIS: South-East/Center-West, South, Northeast, and North. The ONS is responsible for managing and operating the NIS.
The following chart shows the relationships among the various participants in the Brazilian NIS:
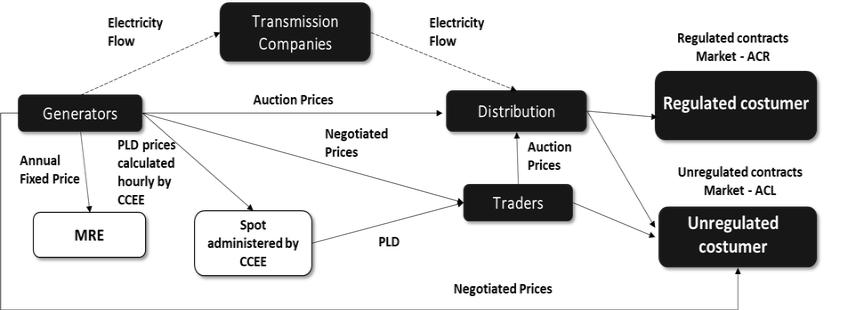
i) | Power Generation: |
The generation sector is organized on a competitive basis, with independent power producers (IPPs) who execute PPAs with regulated distributors, traders, or unregulated customers. In both regulated and unregulated cases, the differences between production and sales (demand) are traded on the short-term market or spot market at the Settlement Price for Differences (“PLD” in its Portuguese acronym). There is also a mechanism used by hydroelectric generators that seek to re-allocate hydrological risk by offsetting differences between the hydrological plant’s firm energy and its actual production, called the Electricity Reallocation Mechanism (“MRE” in its Portuguese acronym).
ii) | Transmission: |
The transmission sector operates under public/private monopoly conditions with auctioned concession contracts. The Brazilian National Electric Energy Agency (“ANEEL” in its Portuguese acronym) fixes the transmission companies’ annual revenues for all electricity companies with transmission operations in Brazil. Transmission revenues consider a fixed fee that does not depend on the amount of electricity flowing through the network. The transmission network comprises any transmission asset operating above 138 kV.
65
iii) | Distribution: |
Distribution is a public service that operates under monopoly conditions. Companies allowed to operate the distribution service have a concession to act in a geographically defined concession area. Distributors in Brazil are not permitted to:
| (i) | perform activities related to electricity generation or transmission; |
| (ii) | hold, directly or indirectly, any equity interest in any other company, corporation, or partnership; or |
| (iii) | develop activities unrelated to their respective concessions, except for those permitted by law, approved by the regulator, or established in the relevant concession agreement. |
iv) | Energy Traders: |
Laws, decrees, and resolutions dating back to 2004 govern the sale and purchase of electricity. Law 10,848, Decrees 5,163 and 5,177 relating to the Electricity Trading Chamber or Wholesale Clearing House (“CCEE” in its Portuguese acronym) and the role of ANEEL and Resolution 109, which introduced the Electricity Trading Convention, define the terms, rules, and procedures for trading at CCEE.
These regulations introduced two alternatives for the execution of the PPAs:
| (i) | regulated contracts between power generators and distribution agents; and |
| (ii) | unregulated market contracts, between power generators, energy trading companies, importing and exporting agents, and unregulated customers. |
PPAs govern commercial relations between the agents participating in the CCEE. It is mandatory for all agents participating in the Brazilian NIS to register contracts before CCEE, including information about the volume of traded energy and the agreement’s terms. There is no obligation to register energy prices of unregulated PPAs.
The CCEE records differences between energy production, consumption, and contracted amount. Positive or negative differences between them are settled in the short-term market and priced at the PLD. As of the date of this Report, the PLD has a weekly definition for each level of required energy or load and each sub-market, based on the system’s marginal operating cost, within a minimum and maximum price range. Since January 2020, marginal operating costs have been calculated on an hourly basis and, as of January 2021, spot prices have also been calculated on an hourly basis (hourly PLD).
v) | Regulated Customers |
The regulated market comprises all consumers who can only have their electricity supply provided by the distribution company operating in the area.
vi) | Unregulated Customers: |
The unregulated market includes the electricity trade between power generation concessionaires, independent producers, self-producers, energy traders, importers of electricity, and unregulated customers.
Unregulated customers in Brazil are those who currently demand:
| (i) | A load greater than 2,000 kW, with supply from conventional sources under contracts with power generators or energy traders, but not with distributors; or |
| (ii) | A load between 500 to 2,000 kW, with supply from renewable sources (special customer). |
66
Pursuant to Ordinance 465/2019 issued by the Brazilian Ministry of Mines and Energy (“Brazilian MME” in its Portuguese acronym), the 2,000 kW limit with respect to energy supply from conventional sources was lowered to 1,500 kW on January 1, 2021 and will be lowered further to 1,000 kW on January 1, 2022, and 500 kW on January 1, 2023.
Ordinance 465/2019 also established that by January 31, 2022, ANEEL and the CCEE should present an analysis setting out the necessary regulatory measures and corresponding action plan to open the market to customers demanding less than 500 kW of energy supplied from conventional sources as of January 1, 2024.
Regulatory Authorities
The Brazilian MME regulates the electricity industry, and its primary role is to establish policies, guidelines, and regulations for the sector.
The Energy Research Company (“EPE” in its Portuguese acronym) is an entity that reports to the Brazilian MME. Its purpose is to conduct research and studies to support energy planning.
The Brazilian National Energy Policy Council (“CNPE” in its Portuguese acronym) oversees developing the national energy policy. Its primary responsibilities include:
| (i) | providing national energy policy, guidelines, and recommendations to the Brazilian president; |
| (ii) | stability and security of supply; |
| (iii) | universal access to electricity; |
| (iv) | directives for specific programs (such as the use of natural gas, biofuel, biomass, coal, and thermonuclear energy); and |
| (v) | directives for the import and export of energy. |
ANEEL is the regulatory body. Its primary responsibilities include:
| (i) | The process of auditing power concessions and authorizations, including commercialization, power generation, transmission, and distribution; |
| (ii) | enactment of the regulatory framework; |
| (iii) | regulation of the use of primary electricity resources, including the use of hydro potential; |
| (iv) | establishment of a (re)bidding process, under the Brazilian MME’s directive, for hydrological concessions, transmission lines, and distribution utilities; |
| (v) | resolution of administrative disputes between electricity sector agents; and |
| (vi) | establishment of criteria and methodology to determine all tariffs that ensure that customers pay a fair price for energy and preservation of the distribution economic and financial balance so the latter can provide quality service and continuity. |
The Energy Sector Monitoring Committee (“CMSE” in its Portuguese acronym), which reports to the Brazilian MME, was created to evaluate the country’s continuity and security. The CMSE primarily:
| (i) | supervises energy generation, transmission, distribution, trading, import and export activities; and |
67
| (ii) | assesses the security of supply and the risk of supply mitigation measures. |
The ONS is a private non-profit entity that operates under ANEEL’s authorization, whose fundamental role is to optimize the NIS and other isolated systems, focusing on ensuring adequate supply at reasonable costs. Concession, permission, and authorization holders from generation, transmission, distribution, and unregulated consumers, energy importers and exporters comprise the ONS. The Brazilian MME and representatives of the Consumer Councils also participate.
The ONS must perform its role on behalf of all interested parties but cannot purchase or sell electricity. Its main goals and responsibilities are:
| ● | planning for the generation and transmission sector; |
| ● | organization of the use of the NIS and international interconnections; |
| ● | guaranteeing agents access to the transmission network in a non-discriminatory manner; |
| ● | assistance in expanding the energy system; |
| ● | proposing to the Brazilian MME the plans and guidelines for extensions to the primary network; and |
| ● | presentation of rules for the operation of the transmission system for approval by ANEEL. |
The ONS is also responsible for ensuring free access to transmission systems and for the administration of both: a) contracts in which transmission concessionaires make their networks available to the operator; and b) contracts in which the users of the transmission are entitled to the right to use it.
The role of the CCEE is to provide an environment for energy trading activities, and operations, improving solutions according to the market needs with integrity, transparency, and accountability.
The CCEE consists of public service generation companies, independent producers, self-producers, distributors, traders, importers, exporters of energy, and free and particular consumers from all over the country. This diverse base of agents encourages the CCEE to base its work on agility and balance, with fair and equitable rules.
Its main objectives and responsibilities include:
| (i) | holding auctions for the purchase and sale of energy in the regulated contracting environment; |
| (ii) | recording the volume of all energy commercialization contracts in the regulated and unregulated contracting environments; |
| (iii) | accounting for and settling the difference between the amounts generated or consumed and those recorded in short-term transactions; |
| (iv) | calculating the PLD used to value transactions in the short-term market; |
| (v) | applying the respective penalties for non-compliance with the limits for contracting electricity; |
| (vi) | carrying out the structuring and management of the reserve energy contract; and |
| (vii) | carrying out the structuring, management, and financial settlement of the account in the regulated contracting environment; and the centralizing account of the “tariff flag” resources, as explained further on |
68
The Brazilian Institute of Environment and Renewable Natural Resources (“IBAMA” in its Portuguese acronym) is an executive body of the National Environmental Policy that acts as an independent federal organization.
IBAMA’s primary roles are to:
| (i) | exercise the power of environmental policy; |
| (ii) | execute actions of national environmental policies, referring to federal attributions related to environmental licensing and quality control, authorization to use natural resources; |
| (iii) | follow the guidelines issued by the Ministry of the Environment; |
| (iv) | execute supplementary actions within the powers of the State, under the current environmental legislation; |
| (v) | propose and edit rules and standards for environmental quality, zoning, and assessment of environmental impacts; |
| (vi) | apply environmental and administrative penalties; |
| (vii) | issue and disclose information related to the environment; |
| (viii) | monitor environmental issues concerning the prevention and control of deforestation and fires; |
| (ix) | support environmental emergencies; |
| (x) | execute environmental education programs; and |
| (xi) | establish criteria for the management of the use of wildlife, fishing, and forest resources. |
Electricity Law and Regulation
General
The Brazilian electricity law encourages competition and private capital, including privatizing assets belonging to federal or state governments. The Electricity Sector Law introduced IPPs to open the electricity sector to private sector investment. IPPs are individual agents, or agents acting in a consortium, who receive a concession, permit, or authorization from the Brazilian government to generate and sell electricity.
The wholesale energy market is composed of generation companies, traders, and distribution companies. The purchase and sale of electricity are freely negotiated. In the short-term market, electricity sales and purchases are carried out at spot market prices set by the CCEE. These prices are calculated on a marginal cost basis, modeling future operating conditions and establishing a merit order curve with variable costs for thermal units and opportunity costs for hydroelectric plants, which results in one price for each subsystem currently set for the week after its determination. However, as of January 2021, the spot prices are settled every hour (hourly PLD).
The Brazilian electricity sector regulatory framework model has the following primary objectives:
| (i) | guarantee the security of the electricity supply and promote reasonable tariffs; and |
| (ii) | improve social integration in Brazil through programs designed to provide universal access to electricity. |
The model considers a series of measures for industry players, such as the obligation of distributors and unregulated customers to satisfy all their electricity supply through contracts. It also defines a methodology to calculate the actual physical back-up of the generation capacity that guarantees electricity generation contracted sales, ensuring that
69
hydroelectric and thermal plants sell their power in a proportion that offers the best balance between the cost of such coverage and the cost of supply. Electricity supply continuity and security are monitored continuously, emphasizing the early detection of occasional imbalances between supply and demand.
The laws and regulations allow for:
| (i) | the transfer of the responsibility of managing global reversal reserve, fuel consumption account, and energy development account funds to the CCEE; |
| (ii) | the transfer of a company’s control as an option to the expiration of the concession; and |
| (iii) | the sale of contractual surplus energy by distributors to unregulated consumers. |
In terms of tariffs, the model requires distributors to purchase electricity in a regulated environment through public auction promoted by the government and managed by ANEEL to obtain the lowest tariffs. This procedure allows for reductions in the cost of electricity that distributors pass on to customer tariffs. The new model also includes a subsidy for low-income customers.
Power Generation
Concession and Authorization
The Concessions Law provides that upon receiving authorization, IPPs and customers will have access to the distribution and transmission systems owned by other concessionaires, providing reimbursement of related costs, as determined by ANEEL.
In Brazil, companies or consortia that intend to build or operate hydro generation plants with a capacity exceeding 50 MW or transmission networks need to participate in a public tender process. Concessions and authorizations give the right to generate, transmit, or distribute electricity in a given concession area for a certain period.
The Brazilian Congress authorizes the extension of the concession period for existing transmission, distribution, and hydro and thermal generation.
New generation concessions or authorizations depend on the source to produce energy and are limited to a maximum of 35 years, while new transmission or distribution concessions are limited to 30 years. Existing concessions may be renewed at the Brazilian government’s sole discretion for a period up to their initial term.
Dispatch and PLD Pricing
The PLD values the differences between purchases and sales of electricity in the short-term market. The mathematical models used to compute the PLD assign a greater weight to hydroelectric generation plants within the Brazilian electricity production mix. The purpose is to find an optimal equilibrium between the current benefit obtained from the water use and the future benefit resulting from its storage, measured in terms of the savings from the use of fuels for thermal plants.
The PLD was published weekly until December 2020 and modified to an hourly basis in January 2021. The PLD for each load level is based on the marginal operational cost, which has a maximum and minimum price for each period and submarket. The ONS determines the duration of each level. The PLD information flows to the CCEE to allow for accounting and liquidation.
The PLD model seeks to optimize both hydro and thermal power production for each submarket. The model first considers electricity demand, and subsequently hydrological conditions, fuel prices, cost of the deficit, auctioned non-operational projects, and availability of equipment used for generation and transmission. This process’ outcome is the marginal operating costs for each load level, submarket, and the PLD.
Annually, ANEEL defines the upper and lower limits for the PLD. Following this rule and in light of the upcoming hourly PLD, in October 2019, ANEEL released the PLD limits for 2020. As of January 1, 2020, the minimum PLD is
70
the highest value between the Itaipu hydroelectric power plant’s production cost and the Optimization Energy Rate. The maximum PLD has two limits: the maximum structural PLD, effective as of January 2020, and the maximum hourly PLD, effective as of January 2021. Hourly PLDs must meet the average target value equal to maximum structural PLD.
| ● | Minimum PLD = R$ 39.68/MWh |
Electricity Reallocation Mechanism
The MRE provides financial protection against hydrological risks to hydroelectric generators by ensuring them optimally supplied hydrological resources by taking advantage of Brazil’s extension and its diversity in different rain regimes.
The MRE guarantees that, notwithstanding the centralized dispatch, all hydroelectric generators will have a share of the total national hydroelectric production proportional to their “firm energy” or maximum firm energy (physical guarantee), which is the electricity that a hydroelectric generation plant can deliver continually during a year, considering poor hydrological conditions.
In each period, a generator has the right to the quantity of energy corresponding to the product between the generating scaling factor (the ratio between total production of the hydroelectric plant to its total physical capacity) and its physical capacity. The final quantity of energy allocated to each hydroelectric producer can be greater or lower than its firm energy, which depends on the total hydro production compared to the total hydroelectric contractual firm energy.
The MRE allows each hydroelectric producer to fulfill its contracts before buying energy in the spot market, to purchase cheaper energy at a price that covers the incremental costs of operation, the maintenance of hydroelectric plants, and the financial compensation for the use of water. The tariff used for trading energy in the MRE (the optimum energy tariff) was set at R$ 12.77 per MWh for 2020.
The system’s total hydroelectric production is more stable and reliable than a single hydroelectric power plant. Therefore, the MRE is an efficient mechanism to reduce individual power plant generation volatility and hydrological risk. Energy contracts in Brazil are only financial instruments, and the electricity production is disassociated from contracted energy.
In recent years, however, insufficient rainfall, an increase in the number and relevance of run-of-the-river plants with consequential loss of regulation capacity, and, above all, a distorted use of the MRE to cope with non-hydrological risks led to hydroelectric generation plants frequently being under their firm energy levels (generating scaling factor < 1). Due to the lack of a regulatory solution, generators filed a lawsuit and obtained an injunction against exposure to the short-term market.
After a lengthy legal and judiciary debate to resolve this problem, in September 2020, Law 14,052/2020 was enacted to modify the electricity sector, including through the renegotiation of hydrological risk. On December 1, 2020, ANEEL approved REN 895/2020 concerning the rules and methodology to compensate hydroelectric generators for the non-hydrological risks assumed since 2013. The CCEE was in charge of determining the compensation values, and, once they were published, they became the subject of discussion by some hydroelectric generators. As a result, an administrative process was initiated to review those values, and ANEEL did not approve them. However, ANEEL committed to review the calculations and asked hydroelectric generators to withdraw all judicial processes still in courts.
Commercialization
The current electricity industry model divides the electricity energy trade into two market environments:
● | the regulated market contractual environment (“ACR” in its Portuguese acronym); and |
● | the unregulated market contractual Environment (“ACL” in its Portuguese acronym). |
71
Electricity trading in the ACR results in regulated PPAs signed between electricity producers and distribution utilities. Distribution utilities can only procure electricity in government-organized reverse auctions. Producers who sell electricity through one of these auctions sign a regulated PPA with each distribution company participating in the auction.
In the ACL, the negotiation among generating agents, trading agents, unregulated customers, importers, and exporters of electricity happens freely through bilateral agreements.
Generation agents, regardless of whether they are public generation concessionaires, IPPs, self-producers, or trading agents, can sell electricity in both environments, maintaining the market’s overall competitiveness. ACR or ACL agreements must be registered with the CCEE and are the basis for the settlement of differences in the short-term market.
Electricity Producers and Unregulated Customers
In the unregulated contract environment, suppliers and customers freely negotiate conditions, volume, and price. The only obligation is to register all transactions with the CCEE.
Electricity Producers, Distribution Companies, and Regulated Customers
Distribution companies must procure energy through regulated auctions organized by the government. There are eight auctions numbered from A-0 through A-7, as explained below.
There are separate auctions for:
| (i) | existing capacity to adjust the conditions of current contracts or to enter into new PPAs to replace expired agreements; and |
| (ii) | new capacity to meet future demand. |
Auctions for existing capacity are energy adjustment tenders that purchase energy from all current generation sources through energy purchase agreements for up to five years.
Auctions for the supply of future energy needs and reserve energy auctions for the contracting of security of supply capacity are for future electricity production plants. Both types of auctions involve purchase agreements ranging from 15 to 35 years.
| | | | | ||||||
|---|---|---|---|---|---|---|---|---|---|---|
| | | | | ||||||
| | Plant Types | ||||||||
Auctions | | New | | Existing | | Renewables | | Indicated by | | Auctioned together with |
A-0 | | | | X | | X | | | | |
A-1 | | | | X | | X | | | | |
A-2 | | | | X | | X | | | | |
A-3 | | X | | X | | X | | | | |
A-4 | | X | | X | | X | | | | |
A-5 | | X | | X | | X | | X | | X |
A-6 | | X | | | | X | | X | | X |
A-7 | | | | | | | | X | | X |
72
In 2018, Auctions A-1 and A-2 were held for existing power plants (operating assets). There were two additional Auctions with the following results:
| ● | Auction A-4: 356.19 MWavg, or 3,120 TWh/year, allocated to hydro (6.6%), biomass (9.7%), wind (16.2%), and solar (67.5%) at an average price of R$ 124.75 MWh. |
| ● | Auction A-6: 1,228.59 MWavg, or 10,762 TWh/year, allocated to gas (26.6%), hydro (18.9%), biomass (0.9%), and wind (53.6%) at an average price of R$ 140.87 MWh. |
In 2019, there were two Auctions with the following results:
| ● | Auction A-4: 81.1 MWavg, or 710 TWh/year, allocated to hydro (20.2%), biomass (5.3%), wind (23.7%), and solar (50.7%) at an average price R$ 151.15 MWh. |
| ● | Auction A-6: 1,155.2 MWavg or 10,119 TWh/year, allocated to thermal (64.28%), hydro (14.89%), wind (15.68%), and solar (5.15%) at an average price R$ 176.09 MWh. |
For the first time, solar and wind generators contracted using the “Seasonalization” model (distribution throughout the year) of the contracts by quantity according to the load profile declared by the buyer, as occurs with hydroelectric projects. Previously, “seasonalization” followed the generation profile of the plant. This change only days ahead of the auction resulted in some solar and wind projects being withdrawn from the auction, given the limited time available to evaluate risks and mitigation costs resulting from the change in seasonality rules of energy sale contacts. Regardless, competition and contracting of thermal sources were favored to meet pre-defined security of supply requirement and the demand declared by the distributors.
Due to the Covid-19 pandemic, the Brazilian MME canceled all generation auctions for 2020.
On March 2, 2021, the Brazilian government published Law 14,120 to implement improvements in electric energy laws and regulations and enable capacity auctions to be carried out within the framework of reserve auctions.
Electricity Producers to Electricity Producers
Electricity producers can directly sell energy to other electricity producers while freely negotiating prices, terms, and conditions. All transactions must be registered with the CCEE.
Incentives and Non-Compliance Penalties
Under the current regulatory framework, a “new electricity production project” benefits from regulated long-term PPAs (20 years for wind and solar and 30 years for hydroelectric). The price levels for each technology are a means to attract investment in capacity expansion and allow reasonable project finance conditions. Existing power plants, including depreciated assets, sell their energy at lower prices and under contracts with shorter terms.
Law 10,438 created an incentive for renewable energies, including a discount of up to 50% on distribution or transmission tariffs. Customers with a demand ranging from 500 Kw to 2,000 kW (the maximum limit will gradually decrease to 500 kW in the next few years) are free to migrate to the unregulated market if they purchase electricity only from renewable sources. However, the government recently challenged this incentive for renewable energy. On March 2, 2021, the Brazilian government published Law 14,120 to mitigate the effects of Covid-19 pandemic and remove the incentive for new renewable energy generation or extension projects. Law 14,120 only ensures the incentive for new renewable energy generation or extensions projects that request concessions until March, 1, 2022. After March 1, 2022, the discount will be eliminated. However, for new hydroelectric generation projects with an installed capacity of up to 30 MW, the discount will remain at 50% for five additional years and at 25% for the following five years. The end of the incentive for renewable projects will be compensated for by a mechanism that will consider the environmental benefits. The Brazilian government, ANEEL, and the MME will define the guidelines for the implementation of this mechanism.
In December 2019, ANEEL passed Normative Resolution No. 846. The resolution brought relevant changes to the penalties regime of the electricity sector. It also established the conditions for imposing fines for non-compliant agents based on the infraction’s nature and materiality (including notices, fines, temporary suspension of the right to participate
73
in tenders for new concessions, licenses or authorizations, and confiscation). For each violation, the fines and calculation percentages vary from 0.125% to 2% of revenues. It may also impose obligations to place restrictions on the terms and conditions of agreements between related parties, temporarily suspend the right to participate in tenders for new concessions, and, in extreme circumstances, terminate the concession contract. This resolution applies to non-compliant agents as of January 1, 2020.
Any selling agent must guarantee 100% of its PPAs in terms of firm energy and physical deliveries. This guarantee comes from its power plants or through the purchase of energy or power contracts from third parties. Differences in actual delivery and commitment lead to substantial penalties for generation companies and traders. Penalties are based on revenues for the previous 12-month period.
Generators may sell electricity through contracts signed within the ACR or the ACL. IPPs must provide physical coverage from their power generation for 100% of their contracts. They generate energy for their exclusive use and may sell excess power to third parties, with ANEEL’s authorization. There are monthly assessments of the physical coverage, based on actual production and the other on sales contracts. Generation agents must pay penalties if they fail to provide physical coverage.
Regulation of Distribution Companies
Energy Purchases
In the regulated market, electricity distribution companies must buy electricity through public auctions carried out regularly, as regulated by ANEEL and organized by the CCEE.
There are two types of regulated bids:
| (i) | existing capacity: to adjust the conditions of the current contracts or enter into new PPAs to replace expired agreements; and |
| (ii) | new capacity, including renewable electricity (biomass, mini-hydro electric, solar, and wind power) to meet future demand. |
Authorities define a capped price, and all participating distributors who call for bids enter into contracts on a prorated basis with each bidding generator.
Power supply for public lighting service
ANEEL recently published a new regulation concerning electricity supply conditions for the public lighting service (REN 888/2020). As a result, electricity distributors will no longer be able to charge municipalities for the municipal tax collection service (COSIP) included in the electricity bills. The charge will be limited to 1% until this regulation takes effect after the next tariff review.
The new rule also determined that an electricity distributor will have an obligation to compensate the municipality for failure to meet quality indicators or to discount energy supply interruption periods on public lighting consumption invoices.
Distribution Tariffs to End Customers
Distribution tariffs to end customers are subject to reviews performed every 3 to 5 years, annual adjustments, and reviews by ANEEL to reflect changes in energy purchase costs and market conditions.
Distribution Tariff-Setting Process
For adjusting distribution tariffs, ANEEL divides the costs of distribution companies into (i) costs beyond the control of the distributor, such as energy purchases and taxes (“Parcel A costs”), and (ii) costs under the control of distributors (“Parcel B costs”), the VAD. Each distribution company’s concession agreement provides for an annual adjustment.
74
The Concessions Law establishes the following reviews for end customer tariffs:
| (i) | ordinary tariff review according to the concession contract of each distributor; |
| (ii) | annual inflation adjustments less an “X” factor (a unique value for each distributor which reflects its recent efficiency gains, the management of its operating costs, and its service quality); and |
| (iii) | extraordinary tariff reviews. |
Distribution companies’ pricing is intended to maintain constant operating margins for the concessionaire. It allows for tariff changes due to Parcel A costs and the concessionaire to retain any efficiency gains achieved for defined periods. Tariffs to end customers are also adjusted according to the variation of costs incurred in purchasing electricity.
The value adjustment account is a mechanism that helps to maintain stability in the energy market. It enables the creation of deferred Parcel A costs, which are compensated through annual tariff adjustments based on fees to offset the previous year’s deficits or surpluses.
In December 2014, distributors in Brazil signed an amendment to the concession contract that allowed deferred costs, including the value adjustment account, to become part of the assets to be compensated at the end of the concession if they were not previously paid through tariffs. IFRS allows the recognition of deferred revenue by ensuring that the amounts are recoverable.
Ordinary tariff reviews consider the entire tariff-setting structure for the company, including the costs of providing services and energy losses and a return for the investor. Distributors define the tariff review period at the time their respective concession agreements are executed. Some distributors have three-year periods, most have four-year periods, and some have five-year periods. The tariff review applies to all distributors but spans different periods. Since 2003, ANEEL has carried out periodic tariff reviews every four to five years, and these define the methodology to be applied during ordinary tariff reviews.
If there is a substantial change in its operating costs, the law guarantees a company’s economic and financial equilibrium. If Parcel A cost components increased significantly within the period between two annual tariff adjustments, the concessionaire would request ANEEL to transfer those costs to end customers.
Tariff Review Methodology
In the third and fourth cycles of periodic tariff revisions, ANEEL applies a benchmarking methodology to define the efficient regulatory operating costs, which observes a relation between the products that a distributor delivers (such as network, energy delivered, consumers, quality, and losses) and its operational costs.
In March 2020, ANEEL approved a new methodology for the regulatory weighted average cost of capital (“WACC”), which is calculated annually based on macroeconomic parameters and applied to the tariff reviews in that year. In methodological terms, ANEEL concentrates on using Brazilian market data (such as the reference to Brazilian sovereign bonds to assess the cost of equity and Brazilian sovereign debentures for the cost of debt). Also, for the distribution segment, the agency determined an additional risk premium for the transmission segment.
The new methodology will not apply to Enel Distribution Sao Paulo, Enel Distribution Goias, Enel Distribution Rio, and Enel Distribution Ceara until their next tariff review in 2023. As a result, these companies will keep their regulatory WACC of 12.3% before taxes. ANEEL also defined a regulatory WACC of 7.40% for transmission companies that should have had a tariff review in 2019, but postponed it until 2020, as was the case for Cien. The WACC approved for distribution and transmission companies that underwent a tariff review in 2021 was 7.02% and 6.76%, respectively.
In March 2020, ANEEL also updated the methodology for calculating factor of productivity gains in the distribution industry, which was 0.66%, compared to the previous average of 1.53%. For the companies that have signed the amendment of Concession Agreements, the new index will be applied yearly as of the tariff adjustments (Enel Distribution Goias in October 2020 and Enel Distribution Rio in March 2021). For those companies that have not signed
75
the amendment, the new index will be applied only in the next tariff review processes (Enel Distribution Ceara in March 2023 and Enel Distribution Sao Paulo in July 2023).
Other tariff review methodology items, such as regulatory operational expenditures and losses, are still under discussion with ANEEL. The change in tariff review methodology is an opportunity to improve company revenues. However, any change in the methodology will not be applied to Enel Distribution companies until 2023.
Revenue from Tariff Flags
ANEEL applies an additional monthly charge to customer tariffs whenever the system’s actual marginal cost has been higher than the defined marginal cost. The regulator’s objective is to provide the consumer with the real cost of generation considering the anticipated additional tariff rate to the distributor, as described in the chart below, that otherwise would have been reflected in the following annual tariff adjustment review. This mechanism is composed of color-coded levels: green, yellow, and red. Since its creation, the cost ranges and additional tariffs have changed according to new expectations of the marginal cost of generation:
| | | ||
| | Description | | Additional Tariff Rate |
Green | | Favorable generation conditions | | No additional rate |
| | | | |
Yellow | | Less favorable generation conditions | | +0.01343 |
| | | | |
Red level 1 | | Expensive generation conditions | | +0.04169 |
| | | | |
Red level 2 | | Most expensive generation conditions | | +0.06243 |
On an exceptional and temporary basis due to the Covid-19 pandemic, in May 2020, ANEEL suspended the application of the additional tariffs and activated the green flag until December 31, 2020.
Energy Development Account
The Energy Development Account (“CDE” in its Portuguese acronym) is a sectoral fund that finances several public policies in the Brazilian electricity sector, such as universalization of the electric energy service throughout Brazil; granting of tariff discounts to several users of the service (low income, rural, irrigating, public water, sewage and sanitation services, incentive energy generation and consumption, etc.); low tariff for isolated electrical systems (Fuel Consumption Account - CCC); and competitiveness of electricity generation from the national coal source; among others.
CDE resources are collected mainly from the annual dues paid by all agents that sell electricity to end consumers through a tariff charge included in the tariffs for the use of energy distribution and transmission systems.
Since the CDE is a sector charge, it is economically neutral to distribution companies once ANEEL collects it via a regulatory tracking account. However, since tracking account validation occurs only once a year, financial mismatching may occur.
Between January 1, 2017, and December 31, 2029, the CDE’s charges will be gradually balanced in Brazilian regions. As of January 1, 2030, the annual cost per MWh will be prorated according to the customer’s connected tension level.
In 2020, within the set of measures to cope with the effects of the Covid-19 pandemic, the Government implemented a financial mechanism called the “Covid Account.” The CCEE began lending funds to distribution companies for short-term cash purposes. Customers will be charged an additional CDE fee from 2021 to 2026 to repay the funds lent to distribution companies.
76
Extension of Distribution Concession Contracts
The Brazilian government may extend distribution concessions once and for a period of up to 30 years. The idea is to ensure continuity, efficient service, feasible rates, and profitability for distributors. It is still under discussion whether the extension will require further payments from utilities.
Concession Termination
In November 2020, ANEEL enacted REN 896/2020, establishing rules for implementing a termination process for certain electric energy distribution concessions. REN 896/2020 was enacted as a result of poor service quality and economic and financial sustainability requirements based on (i) evaluation of the distributor’s economic and financial efficiency (non-compliance for two consecutive years will result in termination of the concession) and (ii) a distributor’s breach of the internal time without power supply (SAIDI) and frequency of interruptions in energy installations (SAIFI) limits (non-compliance for three consecutive years will result in termination of the concession).
The rules established above (REN 896/2020) shall apply (i) to concessionaires with renewed contracts, from the calendar year following the end of the transition period (five years) to meet the efficiency criteria (the sixth year after the addendum signature) and (ii) to concessionaires with non-renewed concession contracts, from 2022 onwards.
Distribution Companies - Tariff Adjustments
The following table identifies the average tariff adjustment for low-, medium- and high-voltage customers, organized by company:
Average adjustment increase for | ||||||
Company | Tariff adjustment date | Low-voltage customers | Medium- and high-voltage customers | |||
Enel Distribution Rio | March 2021 | 4.63% | 10.38% | |||
Enel Distribution Ceara | April 2020 | 4.00% | 3.78% | |||
Enel Distribution Sao Paulo | July 2020 | 3.58% | 6.00% | |||
Enel Distribution Goias | October 2020 | 3.36% | 6.63% | |||
Transfers from Other Transmission Facilities (“DIT”) for Distribution Companies
On February 13, 2017, ANEEL issued Resolution No. 758, establishing the conditions required to transfer installations with voltage less than 230 kV (Basic Network referred to as “DIT”) from electricity transmission companies to distribution concessionaires. Enel Distribution Rio will receive DITs during its next ordinary tariff review in March 2023. Enel Distribution Ceara, Enel Distribution Goias, and Enel Distribution Sao Paulo will not receive any DITs.
Covid-19 pandemic - Financial Measures
On June 23, 2020, ANEEL approved the regulation establishing the “Covid Account”. This regulation sets forth criteria for a syndicated loan to distribution companies to guarantee sufficient cash flow during the pandemic and to avoid subsequent tariff adjustments.
The CCCE receives the loan amount for the “Covid Account”, which ANEEL subsequently approves, and the funds are transferred to the distribution companies. Distribution companies will pass on the loan repayment to consumers within five years by charging an additional fee to the energy development account beginning in 2021.
77
Covid-19 pandemic - Operational Measures
ANEEL implemented provisional rules to adapt to the Covid-19 pandemic. It approved REN 878/2020, which was in force from March 25, 2020, to July 31, 2020. The main measures were:
| ● | temporary suspension of face-to-face service to the public to preserve the health of employees and the population at large; |
| ● | suspension of the term limit for claiming compensation for damages to equipment; |
| ● | suspension of the obligation to deliver printed invoices to consumers’ addresses; |
| ● | permission to bill electronically; |
| ● | permission for distribution companies to use consumption readings at intervals different from customary or to provide means for the consumer to provide meter readings; |
| ● | prohibition of suspension of electricity supply due to default by urban and rural residential consumer and for essential services and activities; and |
| ● | the interruption of any services or service channels by distribution companies being required to be preceded by broad communication to the public through publication on the company’s website. |
Regulation of the continuity of the electricity supply
ANEEL approved REN 925/2021 concerning the quality of energy supply and customer compensation. The new rule will take effect as of January 1, 2022, and will focus on eliminating the effects of non-distributors-caused power outages and quality improvement for customers who today have electrictiy’s low-quality levels.
Regulation of Transmission Utilities
The extent of 158,892 km of the Brazilian transmission network as of August 2020, reflects the country’s geographical expanse and the decision to interconnect the entire country and profit from the geographic diversity of primary energy resources (large hydro, biomass, wind and solar, small hydro, and thermal). Today, Brazil is more than 99% interconnected. In the remaining 1%, electricity supply comes from thermal or hydroelectric power plants close to large consumer centers. The Brazilian government is gradually interconnecting these remaining areas.
The interconnected electricity system allows the exchange of electricity among the different regions. When a region faces any scarcity problem, such as a reduction in hydroelectric generation due to a dry season associated with a decrease in reservoir levels, the security of supply comes from electricity flowing from surpluses produced in other parts of the country.
Any electricity market agent that produces or consumes energy is entitled to access and use the transmission network. For this purpose, the law and ANEEL guarantee such access. Unregulated customers also have access right if they comply with existing technical and legal requirements.
The ONS is responsible for the operation and management of the transmission network and the optimal dispatch of generation plants and energy exchange between sub-markets.
Transmission revenue is a fixed fee that does not depend on the amount of electricity flowing through the network. Similar to distribution companies, transmission companies have three tariff events:
| (i) | an ordinary tariff review every four years; |
| (ii) | an annual tariff adjustment due to inflation and annually allowed revenues (a fixed amount paid by consumers and generators); and |
| (iii) | an extraordinary tariff review if extraordinary events take place. |
In June 2019, Cien underwent its tariff adjustment process. However, the process was provisional because the regulator postponed its effects until the next year’s tariff review. In June 2020, ANEEL approved Cien’s tariff review, taking into consideration its 2019 provisional tariff adjustment process. The new annual allowed income took effect retroactively as of July 1, 2019.
78
Cien holds two concessions: one for Cien I and one for Cien II. The Cien I concession’s term expired in June 2020, and the Cien II concession’s term expires in July 2022. However, with regard to the Cien I concession, the Brazilian MME issued an official act in June 2020 permitting Cien to continue operating the facilities covered by the Cien I concession until a new operator is appointed through an upcoming bid process. In the meantime, Cien will receive an annual income calculated based on current criteria and methodology.
Environmental Legal System
Article 225 of the Federal Constitution establishes the Brazilian environmental legal system. In brief, it operates: (i) preventively, through environmental licensing rules, policies aimed at protection of natural resources, and environmental standards set by the National Environmental Council, at a federal level, and by bodies of the National Environmental System at the state level; and (ii) reactively, through criminal and administrative penalties, and mechanisms for compensation of environmental damages caused.
Therefore, the set-up and development of potentially polluting activities are contingent upon prior environmental licensing. The environmental bodies will verify whether proper measures are being taken to protect the environment and require the implementation of such actions. Federal and state rules can regulate environmental licensing.
The environmental legislative system in Brazil can be regulated by federal, state, or municipal rules. If any of the environmental protection rules are found to have been breached, the inspecting authority shall impose the administrative and criminal penalties prescribed by law.
Hydroelectric facilities are required to obtain concessions for water rights and environmental licensing procedures. Thermal electricity generation, transmission, and distribution companies must obtain environmental approvals from regulatory authorities. Wind and solar energy are usually subject to simplified environmental permits and their corresponding archeological surveys and permits.
Modernization of the Electricity Sector
Since 2017, measures have taken place to allow a comprehensive reform of the energy sector, emphasizing its modernization, sustainability, and legal stability. There are potential changes in the energy sector’s institutional model focused on the modernization trends by the current Brazilian government. Among these initiatives, the Brazilian MME has presented proposals and measures that deal with the following topics in an integrated manner:
In 2019, the Brazilian MME released a diagnosis report with proposals for some improvements:
Expansion of Electricity Generation with Correct Allocation of Costs and Risks:
| (i) | The ACL has increasingly enabled the expansion of the power generation pool. It has influenced the feasibility of specific projects by offering the possibility of a more attractive price mix by combining a low-risk regulated PPA with a higher-risk unregulated PPA. However, the ACL seeks the lowest prices, usually renewable energy, which are not necessarily aligned with the need for supply security. |
79
| (ii) | Security of supply is broadly based on contracting hydroelectric and or thermoelectric plants in the ACR with corresponding cost allocation only to regulated customers. |
| (iii) | The conclusion is that a review of the current arrangement is needed to allocate costs proportionally and to create a market for system requirements, including security of supply criteria and measures to review a plant’s firm energy so that regulated and unregulated costumers share these costs accordingly. |
Rationalization of Charges and Subsidies:
The desirable improvements identified by the government are to:
Tariff Policy and Digitization:
The diagnosis is that the world is undergoing several transformations, including the decentralization of power generation systems, the digitalization of networks, the onset of electric mobility, the valuation of individual choice possibilities, and the predominance of renewable sources in the worldwide electrical energy matrix. Desirable improvements include promoting the connection between energy policy and sector regulation.
Increasing Unregulated Markets
The diagnosis is that while the global trend is to empower consumer decisions, there is a challenge to adapt the current sector model to eliminate technological transformation barriers. As a desirable enhancement, the government introduced an integrated plan to the market, including the definitions of wholesale and retail boundaries, conditions for migration, regulation and monitoring mechanisms of the traders, and energy exchange associated with a clearing mechanism.
Modernization
In December 2019, the Brazilian MME published Ordinance 465 aimed to decrease the limits to access the unregulated market gradually. The current limit remains 200 kW, and from January 2023, the maximum limit will be 500 kW.
In 2019, Public Consultation 83 sought stakeholders’ opinions on a new mechanism to allow for system expansion with the right allocation of costs and risks. Public Consultation 85 dealt with the review of allocated firm energy and structural sustainability of the MRE.
The Brazilian MME also implemented a new operational model and hourly pricing formation based on the short-term hydrothermal dispatch model. First, the ONS applied an hourly marginal cost to the daily dispatch/operation in 2020. In January 2021, the CCEE used an hourly PLD for the short-term market’s accounting and settlement.
On September 1, 2020, the Brazilian government published Provisional Decree No. 998, amending several laws regarding the electricity sector. The intention was to provide additional measures to mitigate the effects of the Covid-19 pandemic on regulated consumers beyond Provisional Measure 950, which established the “Covid Account”. It included some of the modernization working group’s proposals, which are part of bill PLS 232/2016, to accelerate the decree’s implementation. The final text was approved in the Brazilian parliament on February 4, 2021, in the form of bill of law No. 42 and approved by the Brazilian president, becoming Law No. 14.020 on March 2, 2021.
Main topics covered by Law No. 14,020
• | Use of R&D and energy efficiency funds to mitigate the increases of distribution tariffs to customers. |
80
• | Adopt competitive mechanisms to allow distribution companies to minimize energy surpluses and avoid the exposure to market prices and related losses. |
• | Capacity reserve auctions in which all consumers bear the costs. |
• | End of incentives for new renewable projects, compensated by new economic mechanisms to recognize environmental characteristics (pending definition). |
• | Definition of a special kind of trader (retailer) to represent small unregulated consumers in that market, with the possibility of suspending such consumers’ supply in the event of non-payment. |
Renewable Energy Discounts
Renewable projects receive a discount of up to 50% on tariffs for using transmission and distribution grids. The CDE is in charge of subsidizing the discount on renewable sources.
Initially, this incentive was designed to increase the installed renewable capacity, but in 2020 the government passed Law No. 14,020, eliminating the incentive for new renewable projects. However, existing projects will continue to benefit from discounts until the end of their respective authorization periods. New ventures that request exploration permits within one year of the publication of Law No. 14,020 will also be entitled to discounts, provided that their generating units begin operations within 48 months of the concession date.
As an exception, for new hydroelectric generation projects with an installed capacity of up to 30 MW, the discounts will remain at 50% for five years from the publication of the law and at 25% for the following five years.
The benefits ensured by the transition rule will apply until the end of the respective permit, will not be extended in the event of a future permit renewal, and will be valid as long as the respective project remains in operation. However, the project cannot be transferred to third parties.
New Natural Gas Market Law:
On June 24, 2019, the CNPE published Resolution No. 16, concerning liberalization of the gas market, and on April 8, 2021, the Brazilian president approved the resolution as a law.
The new gas law will regulate the transportation, treatment, processing, storage, liquefaction, regasification and commercialization of natural gas in Brazil. This regulation will make the market accessible to new companies that will be authorized agents (instead of concessionaires), in order to generate competition and, consequently, deconcentrate Petrobras’ monopoly in the production, importation and processing of gas. Additionally, the law established that the National Agency of Petroleum, Natural Gas and Biofuels (“ANP”) may promote measures to compel agents to offer natural gas to stimulate competition.
Colombian Electricity Regulatory Framework
Industry Overview and Structure
The Wholesale Electricity Market in Colombia (“Colombian MEM” in its Spanish acronym) is based on a competitive market model and operates under open access principles. For its effective operation, the Colombian MEM relies on a central agency, XM, which oversees the market’s central dispatch through the National Dispatch Center (“CND”) and the management of the commercial exchange system through the Commercial Exchange System Authority.
There are two categories of agents, generators and traders, who are allowed to buy and sell electricity and related products in the Colombian MEM. All the electricity supply offered by generation companies connected to the Colombian National Interconnected System (“NIS”) and all of the electricity requirements of end-customers, whose demand is represented by trading companies, are traded on the Colombian MEM.
There is one interconnected system, the Colombian NIS, and several isolated regional and smaller systems that provide electricity to specific areas. According to the Colombian Mining and Energy Planning Unit (“UPME” in its Spanish acronym), 96.5% of the Colombian population in 2018 received electricity through the public network.
81
The following chart shows the relationships among the various participants in the Colombian MEM:
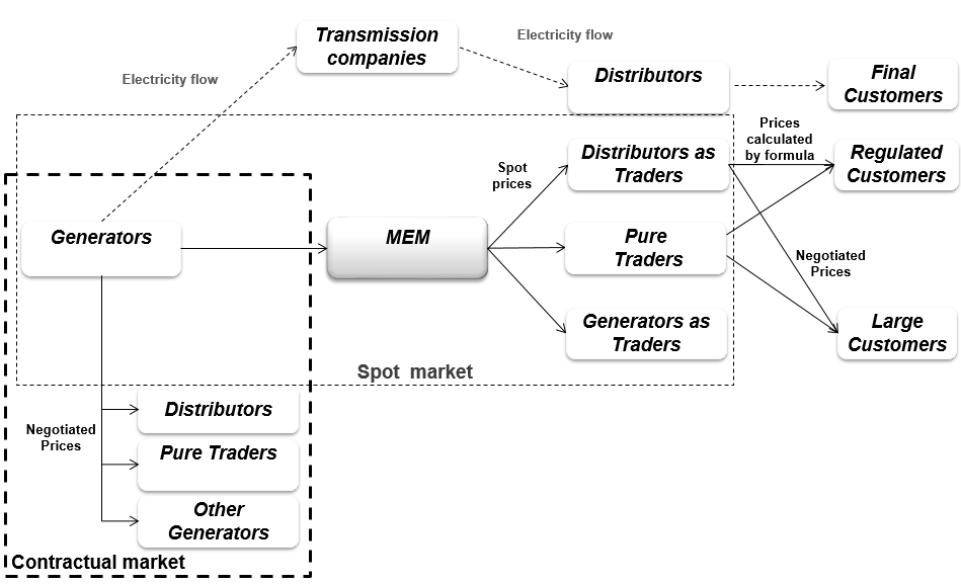
Generation activity consists of electricity production through hydroelectric, thermoelectric, and renewable energy plants connected to the Colombian NIS.
A summary of key generation sector provisions includes the following:
● | generators are organized on a competitive basis, with independent generators selling their output on the spot market or through private contracts with large customers, other generators, and traders; |
| ● | generators with capacities of at least 20 MW are required to participate in the Colombian MEM with all their generation plants or units connected to the Colombian NIS. Plants with an installed capacity less than 20 MW are called “minor plants” or “not centrally dispatched plants,” and they are dispatched as a first priority; |
| ● | generators declare their energy availability and sale price, with the CND centralizing the dispatch of this electricity. |
Trading consists of intermediation between market participants that provide electricity generation, transmission, and distribution services to these services’ customers, whether or not that activity is carried out together with other electricity-sector activities.
Electricity transactions in the Colombian MEM are carried out under the three following modes:
82
“Firm energy” refers to the maximum electric energy that a generation plant can deliver continually during a year with poor hydrological conditions. The generator that acquires a firm energy commitment (“OEF” in its Spanish acronym) will receive a fixed remuneration during the commitment period, which is described under “Penalties” below.
Transmission operates under monopoly conditions with a guaranteed annual fixed income determined by the new replacement value of the networks and equipment and the resulting value of bidding processes awarding new projects to expand the National Transmission System. This value is allocated among the traders of the National Transmission System in proportion to their energy demand.
Distribution is defined as the operation of local networks lower than 220 kV. Any customer may have access to a distribution network for which the customer pays a connection charge.
Principal Regulatory Authorities
The Colombian Ministry of Mines and Energy (“Colombian MME”) is responsible for electricity sector policy, aiming to more efficaciously use the mining and energy resources available in Colombia and contribute to the country’s social and economic development. UPME is responsible for planning the expansion of the generation and transmission networks.
The Colombian Commission for the Regulation of Energy and Gas (“CREG” in its Spanish acronym) implements the principles of the industry set out by the Colombian Electricity Act. This commission comprises eight experts named by the Colombian president, the Colombian MME, the Colombian Ministry of Finance and Public Credit, and the Colombian National Planning Department’s Director or delegates. The Superintendent of Domiciliary Public Services participates in discussion but without a vote on topics that correspond to domiciliary public services. The Superintendent of Industry and Commerce may be invited for issues related to liquid fuels.
CREG is empowered to issue regulations that govern technical and commercial operations and to set charges for regulated activities. CREG’s primary functions are to:
| ● | establish conditions for gradual deregulation of the electricity sector toward an open and competitive market; |
| ● | approve charges for transmission and distribution networks and regulated customers; |
| ● | establish the methodology for calculating maximum tariffs for supplying the regulated market; |
| ● | regulations for planning and coordination of operations of the Colombian NIS; |
| ● | technical requirements for quality, reliability, and security of supply; and |
| ● | protection of customers’ rights. |
The National Operations Council is responsible for establishing technical standards to facilitate the Colombian NIS’s efficient integration and operation. It is a consultative entity composed of the CND’s Director and generation, transmission, and distribution company representatives.
The Commercialization Advisory Committee is an advisory entity that assists CREG with the Colombian MEM’s commercial aspects.
The Colombian Superintendence of Domestic Public Services is responsible for the oversight of all public utility service companies. The Superintendence monitors the efficiency of all utility companies and the quality of services. It can assume control over utility companies when the availability of utility services or such companies’ viability is at risk. Other duties include enforcing regulations, imposing penalties, generally overseeing public utility companies’ financial and administrative performance, providing accounting norms and rules for public service companies, and, in general, organizing information networks and databases of public utilities.
83
The Colombian Ministry of Environment and Sustainable Development (“MADS” in its Spanish acronym) is responsible for managing the environment and renewable natural resources. It is responsible for guiding and regulating environmental planning, as well as developing policies and regulations. Its goal is to recover, preserve, protect, and promote the sustainable use of renewable natural resources and the environment and ensure sustainable development.
Together with the Colombian president, MADS seeks to develop national environmental and renewable natural resource policies to ensure Colombians’ right to a healthy environment in which natural heritage and national sovereignty are protected.
The Electricity Law
General
In 1994, the basic legal framework that currently governs the electricity sector in Colombia was enacted. The most significant reforms included:
| (i) | granting access to private sector participants; |
| (ii) | the functional segregation of the electricity sector into four distinct activities (generation, transmission, distribution, and trading); and |
| (iii) | the creation of an open and competitive wholesale electricity market, the regulation of transmission and distribution activities as regulated monopolies, and the adoption of universal open access principles applicable to transmission and distribution networks. |
The Colombian Electricity Act regulates electricity generation, trading, transmission, and distribution (collectively, the “Activities”). Under the law, any company existing before 1994, domestic or foreign, may undertake any Activities. Companies established after such a date can engage exclusively in only one of such Activities. Trading, however, can be combined with either generation or distribution.
In 2014, the Colombian government’s Renewable Energy Law 1,715 promoted renewable energy and energy efficiency projects. The law proposes tax reductions for projects involved with renewable energies. It also establishes a national fund that fosters research on related topics and defines the methodology for self-generation. Several regulations related to renewable energy have since been published.
Limits and Restrictions on Market Share
Market share for generators and traders is capped at certain maximum levels. The limit for generators is 25% of the Colombian system’s firm energy. The principal market share metric used by CREG to regulate the generation market is the percentage of firm energy that a market participant holds. Additionally, if an electricity generation company’s share of Colombia’s total firm energy ranges from 25% to 30% and the market’s Herfindahl Hirschman Index, a measure of market concentration, is at least 1,800, such company becomes subject to monitoring by the Colombian Superintendence of Domestic Public Services. If an electricity generation company’s share of Colombia’s total firm energy exceeds 30%, such company may be required to sell its share exceeding the 25% threshold.
Similarly, a trader may not account for more than 25% of the Colombian NIS trading activity. Limitations for traders consider international energy sales. Market share is calculated monthly according to the trader’s commercial demand, and traders have up to six months to reduce their market share when the limit is exceeded.
Such limits apply to economic groups, including companies controlled by, or under common control with, other companies. Also, generators may not own more than a 25% interest in a distributor, and vice versa. However, this limitation only applies to individual companies and does not preclude cross-ownership by companies within the same corporate group.
A distribution company can hold more than 25% of an integrated company’s equity if the latter company’s market share accounts for less than 2% of the national generation business.
84
A generator, distributor, trader, or an integrated company (i.e., a firm combining generation, transmission, and distribution activities) cannot own more than 15% of the equity in a transmission company if the latter represents more than 2% of the national transmission business in terms of revenues.
Regulation of Generation Companies
Concessions
Since 1994, economic activities related to the supply of the electricity service have been governed by the:
| (i) | constitutional principles of free-market economic activity; |
| (ii) | free-market private initiative; |
| (iii) | freedom to enter and leave the market; |
| (iv) | corporate freedom; and |
| (v) | free-market competition and private property, with regulation and inspection, surveillance and control by the state. |
These constitutional principles of freedom are the general rule in the electricity industry, while the concession is the exception. Different economic, public, private, or mixed agents may participate in the sector’s activities, which agents shall enjoy the liberty to develop their functions in a context of free-market competition. To operate or start up projects, agents must obtain from the competent authorities the necessary environmental, sanitation, and water rights permits and other municipal permits and licenses. All economic agents may build generation plants and their respective connection lines to the interconnection and transmission networks.
The Colombian government is not legally allowed to participate in the execution and exploitation of generation projects. As a general rule, such projects are to be carried out by the private sector. The Colombian government is only authorized to enter into generation concession agreements when no agents are prepared to assume these activities under comparable conditions.
Dispatch and Pricing
The purchase and sale of electricity can occur between generators, distributors acting in their capacity as traders, traders (who do not generate or distribute electricity), and unregulated customers. There are no restrictions on new entrants into the market as long as they comply with the applicable laws and regulations.
The Colombian MEM facilitates the sale of surplus energy that has not been committed under contracts. An hourly spot price for all dispatched units is established in the wholesale market based on the offer price of the highest-priced energy dispatched unit for that period.
The CND receives price bids each day from all the generators participating in the Colombian MEM. These bids indicate prices and the available capacity per hour for the following day. Based on this information, the CND, guided by an “optimal dispatch” principle, which assumes an infinite transmission capacity through the network, ranks the dispatch optimized during the 24-hour period, taking into consideration initial operating conditions and determining which generators will be dispatched the following day to satisfy expected demand. The price for all generators is set as the most expensive generator dispatched during each hourly period under optimal dispatch. This price-ranking system is intended to ensure that national demand, increased by the total amount of energy exported to other countries, will be satisfied at the lowest cost combination of available generating units in the country.
Additionally, the CND plans the dispatch by considering the network’s limitations and other conditions necessary to satisfy the energy demand expected for the following day in a safe, reliable, and cost-efficient manner. The cost differences between the “planned dispatch” and the “optimal dispatch” are called “restriction costs.” The net value of such restriction costs is allocated proportionally to all traders within the Colombian NIS and are passed on to end customers. Some generators have initiated legal proceedings against the government, arguing that recognized prices do
85
not fully cover the costs associated with these restrictions because current regulations do not consider all the costs of safe and reliable generation.
Sales by Generation Companies to Unregulated Customers
In the unregulated market, generation companies and unregulated customers sign contracts in which terms and prices are freely negotiated. Typically, these agreements establish that the customer pays for the energy they consume each month without a minimum or maximum. The prices are fixed in Colombian pesos, indexed monthly to the Colombian PPI. To be considered “unregulated,” customers are required to have a six-month average monthly power demand of at least 0.1 MW or a minimum of 55 MWh monthly average electricity demand over the prior six months.
Sales by Generation Companies to Traders for the Regulated Market
Traders in the regulated market are required to buy energy through procedures that ensure free-market competition. The buyer considers price factors and other technical conditions and commercial objectives defined before the contracting process for evaluating bids. These agreements can be signed with different terms, such as amounts contracted, demanded with or without a limit, or consumed amounts. Prices are denominated in Colombian pesos and are indexed monthly to the Colombian CPI.
Sales to Other Generation Companies
Generators can sell their energy to other generators at freely negotiated prices and conditions.
Regulatory Charges
Generation companies are obliged to make monthly payments based on their generation to regional autonomous corporations for environmental protection in areas where the plants are located and the municipalities where the generation plants are located. For more information, see “— Environmental Regulation” below.
Generators must contribute one Colombian peso to the Financial Support Fund for Energy for Non-Interconnected Zones for every kilowatt dispatched on the Wholesale Energy Exchange. This requirement was extended to 2021.
Generation Income
Generators connected to the Colombian NIS can also receive “reliability payments,” which are a function of the OEF that they provide to the system. An OEF is a commitment by generation companies, backed by their physical resources, to produce firm energy during scarcity periods. A generator that acquires an OEF will receive fixed compensation during the commitment period, whether or not the fulfillment of its obligation is required. For a generator to receive reliability payments, it must participate in firm energy bids by declaring and certifying such firm energy. OEF allocation auctions are oriented to generation projects with construction periods of less than four years and projects with long construction periods (“GPPS” in its Spanish acronym). CREG can carry out OEF reconfiguration auctions to adjust the differences between the allocated OEF and expected demand. When demand is higher or lower than anticipated, CREG can organize auctions to acquire more firm energy. On the contrary, agents with excess OEFs can sell their commitments.
CREG regulates the reconfiguration auction scheme under the methodology of reliability charge that allows agents to change the beginning of an OEF by renouncing the “reliability payments” and paying a premium. Among the important resolutions carried out during the last three years are the following:
| ● | In 2018, CREG issued Resolution 114, which set the principles and general conditions that the mechanisms for the commercialization of electricity must meet so that their prices are recognized in the cost component of energy sales to regulated customers. |
| ● | In 2018, CREG issued Resolution 064 concerning the opportunity for carrying out an auction for the allocation of firm energy obligations for the period 2022-2023. It recommended allocating an OEF through a reliability charge auction for such period to the extent that a deficit was recorded to cover the demand, derived mainly from the uncertainty before commissioning the Ituango project. Subsequently, a new |
86
| resolution assigned an OEF for the period 2022-2023, with a target demand of 82.8 TWh/year. A deficit is expected to cover approximately 4 TWh/year. This auction will enable new projects and favor the use of new technologies. |
| ● | In July 2019, CREG issued Resolution 060, which adjusts and “temporarily” adds some commercial aspects of the wholesale energy market and technical aspects of the network code concerning the integration of photovoltaic wind and solar plants in the Colombian NIS and factors related to run-of-the-river hydroelectric power plants. |
| ● | In November 2020, CREG issued Resolution 194, which allows power plants under construction to start commercial operations without achieving full capacity. For this, plants must first fulfill their firm energy obligations to the system. |
| ● | In November 2020, CREG issued Resolution 209, which modifies the statute for the context of scarcity in the Colombian MEM that defines the rules of operation under critical supply conditions. |
Gas Market
The Colombian natural gas market operates under near-monopoly conditions and consists of a primary market, secondary market, and short-term market. Supply contracts depend on a balance between supply and demand for the following five years, calculated by the regulatory authority every year. If demand exceeds supply, an auction occurs. If the opposite happens, bilateral negotiations are carried out. Transportation contracts are traded under bilateral negotiation schemes or through auctions.
This regulatory framework results from a former proposal that sought to reform the wholesale market for natural gas and ensure that it operates under transparency and liquidity principles. This framework also outlines entities that are eligible to participate in each market, the types of permitted transactions, and the kind of contracts that may be allowed. It seeks to create standardized force majeure provisions for such agreements to clarify the responsibilities of the parties.
In 2018, CREG issued a resolution to modify the natural gas regulatory framework. This resolution considers the need to adjust the handling of information regarding the volume of surplus and missing quantities derived from the primary market.
In February 2019, CREG Resolution 021 modified Resolution 114 of 2017. Resolution 021 adjusts the duration, start date, and end date of bilateral contracts in the secondary market, making them more flexible. The resolution also incorporates the following: (i) supply contracts subject to conditions; (ii) contracts with the option to purchase gas in the primary market; (iii) transport contracts subject to conditions in the secondary market; (iv) revocable contracts to negotiate bilaterally in the secondary market; and (v) makes the start date of long-term contracts negotiated bilaterally in the primary market more flexible.
In June 2019, CREG Resolution 055 establishes rules for selecting the new natural gas market manager and remuneration conditions and services to be provided in the context of natural gas operations. The selection process began in the second half of 2019 and was completed in the first quarter of 2020.
In November 2020, CREG issued Resolution 185, which modifies the regulatory framework for gas transportation, improving its use of the selling mechanism. It also increases transparency and provides information about transportation transactions to all market participants.
In 2020, UPME published the “Gas Supply Plan,” which defines the infrastructure projects necessary in the gas sector in upcoming years. One of the projects expected to be built is the Pacífico regasification plant, which will provide gas to the country in 2024.
Regulation of Distribution Companies
Distributors (or network operators) are responsible for planning, investing, operating, and maintaining electricity networks under 220 kV. These include regional transmission systems and local distribution systems. Any customer may
87
access the distribution network by paying a connection fee. Under this scheme, the distributor is responsible for operating the distribution network, including the transportation and control of energy losses.
Distribution Tariff-Setting Process
CREG regulates distribution prices that allow distribution companies to recover costs, including operating, maintenance, and capital costs under efficient operations. CREG also sets distribution charges for each company based on the Regulatory Asset Base (RAB) of the distribution assets, the investment plan, the cost of capital, and an incentive scheme for losses quality incentives and operational and maintenance costs that depend on the voltage level.
In June 2015, CREG Resolution 095 defined the methodology for calculating the discount rate (WACC) used in electricity distribution activities. The variables that are considered to determine these rates are:
| ● | risk of an industry in relation to the market where it is developed; |
| ● | inflation; |
| ● | cost of debt; |
| ● | cost of capital; |
| ● | rate of debt; |
| ● | rate associated with a risk-free asset; |
| ● | rate showing market performance; |
| ● | market risk premium; and |
| ● | income tax rate charged to agents. |
Distribution charges are established for five years and updated monthly according to the CPI, and defined for four different voltage levels, which are applied depending on the customer’s connection point as follows:
| ● | level 1: less than 1 kV; |
| ● | level 2: at least 1 kV but less than 30 kV; |
| ● | level 3: at least 30 kV but less than 57.5 kV; and |
| ● | level 4: at least 57.5 kV but less than 220 kV. |
In February 2018, CREG Resolution 015 established the final distribution remuneration methodology, providing current and future stability to Codensa’s revenues. It is a crucial piece of regulation given that it respects the remuneration of the existing asset base, recognizes future investments, sets the compensation of operation and maintenance expenses, and defines profitable paths of loss and quality of service.
Subsequently, some provisions of CREG Resolution 015 of 2018, including the retroactive adjustment factor, the revision of the investment plan, and the application of the quality scheme, were clarified by CREG Resolutions 085 and 151 of 2018 and Resolution 036 of 2019. In respect to the application of CREG Resolution 015 of 2018, in December 2019, CREG issued Resolution 189 of 2019, which approved the variables to calculate the income and fees associated with the distribution of electricity by Codensa. In January 2020, Codensa filed an appeal for reversal of CREG Resolution 189 of 2019. On June 24, 2020, CREG issued Resolution 122 of 2020, which approves the distribution fees for Codensa. With this approval, CREG resolved the appeal presented by Codensa in January 2020, and the new tariffs took effect on July 2020 retroactively from April 2019.
In January 2019, CREG Resolution 015 of 2019 adjusted the WACC due to the modification of the value of the income tax, establishing it at the following maximum pre-tax levels: 11.79% for 2019, 11.64% for 2020, 11.50% for 2021, and 11.36% for 2022 onwards.
88
In May 2019, the Colombian MME issued Resolution 40459, which defines the policy for implementing advanced reading infrastructure for 75% of consumers by 2030.
Sales by Distribution Companies to Regulated Customers
The regulated market is served by traders and distributors acting as traders who bill all service costs according to prices regulated by CREG. The scheme allows distributors to pass on the average purchase price of all market transactions that affect the regulated market to the customers’ tariff, thereby mitigating spot price volatility and providing an efficiency signal to the market. Additionally, CREG established a formula for the total cost of service, which transfers transmission, distribution, marketing costs, and physical losses costs to the regulated market.
Regulation of Transmission Companies
Transmission companies that operate at least 220 kV grids constitute the National Transmission System (“NTS”). They must provide access to third parties on equal conditions and are authorized to collect a tariff for their services. The transmission tariff includes a connection charge covering the cost of operating the facilities, and a usage charge, which applies only to traders.
CREG guarantees an annual fixed income to transmission companies. Income is determined by the new replacement value of the network and equipment and the resulting value of bidding processes of awarding new projects to expand the NTS. This value is allocated among the traders of the NTS in proportion to their energy demand.
According to model expansion plans designed by the Colombian Mining and Energy Planning Agency, the NTS expansion is conducted according to bidding processes opened to existing and new transmission companies, which are handled by the Colombian MME following the guidelines set by CREG. The construction, operation, and maintenance of new projects are awarded to the company that offers the lowest present value of future cash flows needed for carrying out the project.
Trading Regulation
The retail market is divided into regulated and unregulated customers. Customers in the unregulated market may enter freely and directly into electricity supply contracts with a generator or a distributor, acting as traders, or with a pure trader. The unregulated customer, which represented approximately 30% of the market in 2020, consists of customers with peak demand above 0.1 MW or minimum monthly energy consumption of 55 MWh.
Trading involves reselling the electricity purchased in the wholesale market and may be conducted by generators, distributors, or independent agents that comply with specific requirements. Parties freely agree upon trading prices for unregulated customers.
Trading on behalf of regulated customers is subject to the “regulated freedom regime,” under which tariffs are set by each trader using a combination of general cost formulas given by CREG and individual trading costs approved by CREG for each trader. Since CREG approves limits on costs, traders in the regulated market may set lower tariffs for economic reasons. Tariffs include, among other things, energy procurement costs, transmission charges, distribution charges, and a trading margin.
The tariff formula considers a fixed monthly charge covering operating costs plus a variable income for traders covering credit risk, working capital subsidies, and other selling costs.
Tariffs to End Customers
The energy trader is responsible for charging electricity costs to end customers and transferring their payments to the industry’s agents. The tariffs applied to regulated customers are calculated according to a formula established by CREG. This formula reflects the costs of generation, transmission, and distribution, depending on the customer’s connection level, trading losses, constraints, administrative costs, and market operating costs. The pricing formula is currently under review, and CREG Resolution 240B of 2015 establishes the basis of the studies to determine the unit cost formula of providing service to regulated customers. Different factors affect the final costs of the service. Subsidies and contributions are applied according to the socio-economic level of each customer. When subsidies exceed
89
contributions, the Colombian government compensates for the difference. Another factor that affects the final tariff is the distribution area, which establishes a single distribution tariff for the distribution companies in adjacent geographic zones.
To subsidize the value of electricity for the most financially vulnerable residential customers residing in the least developed rural areas, the Colombian MME established the Social Energy Fund (“FOES” in its Spanish acronym). FOES offsets 46 COP$/kWh of the price of electricity for the customers above.
Penalties
CREG established new quality of service regulations for the regional transmission systems in the case of the transmission sector. Specifically, it defined compensations for energy not provided and service interruptions in the regional transmission systems.
Renewable Energy and Energy Efficiency
Renewable Energy
The development and regulation of a framework that encourages the incorporation of renewable energy in the Colombian national energy grid started in 2014 with Law 1715 and its accompanying regulations, including incentives on taxes and import tariffs for investors. Decree 2,143 of 2015 detailed guidelines for implementing these incentives.
In 2018, Decree 570 established public policy guidelines for the long-term contracting of generation projects, with the primary purpose of focusing on the following aspects:
| ● | the need to supply domestic demand; |
| ● | the aim for efficient, safe, and reliable operation in sector activities; |
| ● | the incorporation of advances in science and technology; |
| ● | the diversification of the Colombian electric power generation mix due to the high degree of concentration of hydroelectric generation; |
| ● | the support for the compliance with Colombia’s commitments regarding the reduction of greenhouse gas emissions by 20% concerning the projected emissions for the year 2030 in the business as usual scenario; and |
| ● | the complementary relationship between renewable energy resources and conventional hydroelectric resources, especially during seasonal periods of low hydrology. |
In 2018, CREG Resolution 104 assigned an OEF for the period 2022-2023, with a target demand of 82.8 TWh/year. As a result of this firm energy auction, renewable projects were allocated with firm energy obligations: two solar projects, both owned by Enel Green Power: El Paso (70MW) and La Loma (150MW); and six wind projects, three of them owned by Enel Green Power: Windpeshi (200 MW), Chemesky (100 MW) and Tumawind (200 MW).
In 2018, the Colombian MME also issued Resolution 40,791 to regulate 15-year contracts to ensure they comply with Decree 570 and Resolution 40,795 to announce the first auction launched by UPME to detail the main conditions of the tender. This auction was held in February 2019 and was not successful because competitiveness indicators (concentration and dominance) predicted by CREG were not met.
In 2019, the Colombian MME changed the allocation mechanism and announced a second auction regulated by Resolution 40,678. The resolution defined the auction under the following characteristics: voluntary participation, exclusive to new bilateral renewable energy projects, closed envelope, a ceiling price on bids, and “take or pay” contracts for up to 15 years in COP$/kWh with a start date of January 1, 2022. The auction aimed to optimize the benefit to consumers by offering energy in three different time blocks:
90
| ● | Block 1 - 12:01 AM to 7 AM – 7 hours |
| ● | Block 2 - 7:01 AM to 5 PM – 10 hours |
| ● | Block 3 - 5:01 PM to 12 midnight – 7 hours. |
Although participation in the auction was not mandatory, a complementary mechanism was included to ensure that the auction achieved its goal. After the auction, the allocation of the total target demand was evaluated. In the case of a surplus, the Colombian MME allocated the remaining energy among all commercial agents who attended the regulated auction. The auction was successfully held in October 2019 with the following results:
| ● | the Colombian MME determined a target demand of 12,050 MWh / day, equivalent to 4.39 TWh / year. |
| ● | CREG set the individual maximum cap and the average maximum cap at 200 COP$/kWh and 160 COP$/kWh, respectively. |
| ● | allocated energy totaled 10,186 MWh/day, equivalent to 3.71 TWh/year, and was divided as follows: Block 1 - 2,754 MWh/day; Block 2 - 6,906 MWh/day; Block 3 - 525 MWh/day. |
| ● | total allocated energy obtained a weighted average price of 95.65 COP$/kWh. |
| ● | target demand was not met, and 1,864 MWh/day, equivalent to 0.68 TWh/year, was allocated through the complementary mechanism. The average price of allocation through the complementary mechanism was 107 COP$/kWh. The auction awarded eight projects (five wind and three solar) with a total effective capacity of 1,298 MW. |
| ● | Enel Green Power did not receive energy allocation for any of its projects. |
Energy Efficiency
Since 2001, Law 697 has promoted energy efficiency in Colombia. The law has been the framework for efficiency programs, including the program for rational and efficient energy use. In May 2014, Renewable Energy Law 1,715 established a general legal framework and created a fund intended to promote the development of renewable energy, energy efficiency, and programs designed to reduce electricity demand. One of its main objectives is the progressive replacement of diesel generation in non-interconnected and isolated areas to reduce energy costs and greenhouse gas emissions.
Environmental Regulation
Any entity planning to develop projects or activities related to generation, interconnection, transmission, or distribution of electricity that may result in environmental deterioration must first obtain environmental permits (emissions, dumping, exploitation, and collections, among others) and licenses and establish environmental management plans, as established in Decree 1,076 of 2015. Depending on the projects’ nature, licenses are conferred by the National Authority of Environmental Licenses, Regional Autonomous Corporations, municipalities, districts, and metropolitan areas whose urban population exceeds one million inhabitants. For the licensing processes, environmental alternative diagnosis studies and environmental impact studies must be submitted to the relevant environmental authority according to the authorities’ terms of reference. These studies are subject to the issuance of technical concepts by the competent environmental authorities.
Additionally, any project that requires an environmental license and involves water taken directly from natural sources for any activity must allocate not less than 1% of the total investment for the recovery, conservation, preservation, and monitoring of the watershed that feeds the respective water source.
All hydroelectric generation plants with an installed capacity of more than 10 MW in their operation stage are required to contribute to the environment’s conservation. These resources are called “transfers” and consist of payment from each plant of 6% of its annual production at a rate established by CREG. Half of each payment is allocated to the municipalities where the project is located. The other half to the Regional Autonomous Corporation to fund hydro basin
91
recovery plans and páramo ecosystems from which water comes. In thermal generation, “transfers” represent 4% of their annual production, of which 1.5% is allocated to municipalities where the project is located and 2.5% to the Regional Autonomous Corporation to protect the plant’s environment. Energy produced by renewable sources referred to in Law 1,955 of 2019, whose plants with total installed capacity exceeding 10,000 kilowatts, must transfer the equivalent of 4% of their electricity generation’s gross energy sales, following the rate for block sales indicated by the Energy and Gas Regulatory Commission. The resources collected for this concept are allocated as follows:
| ● | 60% is allocated in equal parts to indigenous communities located in the area of influence of the generation project for the execution of investment projects in infrastructure, public services, basic sanitation and or drinking water, as well as in projects that said communities define, provided that they directly affect their quality of life and well-being. |
In the absence of indigenous communities accredited by the Ministry of the Interior in the respective territory, the percentage established here will be allocated to the municipalities located in the project area for investment in infrastructure, public services, basic sanitation, and or drinking water in the communities in the project’s area of influence.
| ● | 40% is allocated for the municipalities located in the project area. These funds are earmarked for investment projects in infrastructure, public services, basic sanitation, and drinking water in the municipal development plan. |
MADS continues to develop regulations to reduce the contamination and depletion of natural resources caused by contaminant discharges to natural environments. It has updated parameters and limits of specific maximum allowable discharges to surface water and public sewer systems. Since 2017, MADS has been developing a methodology to estimate the environmental flow in Colombian rivers which has been adopted for Bogotá river in 2019 through MADS Resolution 2,130. The procedure is designed to calculate the available water supply in basins that sustain aquatic ecosystems and consider the well-being of the people who depend on such ecosystems for subsistence.
MADS is also concerned with climate change issues. In 2015, it committed to reducing greenhouse gas emissions in Colombia by 20% by 2030 (compared to the 2010 baseline). Subject to receipt of international support, Colombia would be able to increase that goal from 20% to 30% by 2030. In 2020, the mitigation plan was increased to 51%. This goal was submitted to the United Nations Framework Convention on Climate Change for consideration. In 2018, the National Law of Climate Change (Law 1,931) established guidelines for the decisions of public, private, and territorial entities and environmental authorities of the country for climate change management.
Covid-19 Pandemic Regulatory Issues - Energy and Gas Sector
Due to the Covid-19 pandemic, the government of Colombia established a special line of credit for energy companies from April 2020 to December 2020. As of May 2020 the Colombian MME established a mechanism of voluntary contribution, called “Comparto Mi Energía”, aimed at level 4, 5 and 6 users and commercial and industrial customers. The companies collecting the resources use them to cover the unsubsidized consumption of level 1 and 2 residential customers. On April 2020, the Colombian government created a deferred payment plan, declaring that level 1 and 2 residential customers, representing approximately 44% of the customer base, could defer the payment of April and May 2020 energy bills for up to 36 months, and level 3 and 4 residential customers representing approximately 40% of the customer base, could defer payment of energy bills for 24 months, without penalty or risk of a cut in service.
92
Peruvian Electricity Regulatory Framework
Industry Overview and Structure
In the Peruvian Wholesale Electricity Market (“Peruvian MEM” in its Spanish acronym) there are four categories of local agents: generators, transmitters, distributors and large customers. Trading is carried out by generators and distributors.
SEIN is the only interconnected system in Peru, though several smaller isolated systems provide electricity to specific areas.
The following chart shows the relationships among the various participants in SEIN.

i) | Generators: |
The generation segment is comprised of companies that own electricity generation power plants. This segment is a competitive market in which prices tend to reflect the marginal cost of production. Electricity generators, as energy producers, have capacity and electricity sale commitments with their contracted customers. Generators may sell their capacity and electricity to both distributors and unregulated customers.
The amount of electricity a generator sells to customers does not necessarily equal the quantity of electricity that a generator produces because power plant production is allocated by COES, the Peruvian entity responsible for coordinating the efficient operation and centralized dispatch of generation units to satisfy demand. Each power plant’s variable production costs are considered for the spot price calculation, regardless of their contractual commitments. The only exception to this rule applies to natural gas power plants. For dispatch purposes, natural gas prices are established every June and apply from July through June of the following year. Due to court action (Sentencia Acción Popular No. 28315 - 2019 LIMA), new regulations with respect to natural gas prices are expected to be published in May of 2021. The spot market is managed by COES, where an economic balance is reached between the electricity produced by a generator and the demand from the generators’ customers. There are three types of participants authorized to trade in the spot market: 1) generators meeting their supply contracts; 2) distributors serving their unregulated customers for up to 10% of the maximum demand; 3) large customers purchasing up to 10% of their maximum demand.
Electricity production and consumption are valued at marginal cost, which is calculated every half hour. Generators with deficits buy energy from the generators with surpluses. This principle regarding energy sales balances also applies to capacity charges. Osinergmin, the Peruvian regulatory electricity authority, regulates the capacity price.
The spot price is obtained from the dispatch model. The settlements made by COES also include payments and/or collections for ancillary services such as frequency and voltage regulation. They also consider compensation for operating cost overruns, such as operation at minimum load and random operational tests, among others.
93
ii) | Transmitters: |
The transmission system comprises transmission lines, substations, and equipment to transmit electricity from power plants to consumption centers or distribution points. Transmission in Peru is defined as all lines or substations with a voltage higher than 60 kV. Some generation and distribution companies also operate sub-transmission systems at the transmission level.
iii) | Distributors: |
Electricity distribution is carried out in concession areas granted to distribution companies. Distributors buy energy through tender processes or directly from generators under freely negotiated terms (price cap is defined by the “Tarifa en Barra” referred to in Article 47 of the Electricity Concessions Law) and sell it mainly to residential and large customers.
iv) | Large Customers: |
Customers with a capacity demand lower than 200 kW are considered regulated customers, and their energy supply is regarded as a public service. Customers with a capacity demand between 200 - 2,500 kW choose to be regulated or unregulated. Once this type of customers select an option, they remain in that category for at least three years. If customers want to change their type from regulated to unregulated, or vice versa, they must give advance notice of at least one year. Customers with a capacity demand of over 2,500 kW are unregulated customers.
Principal Regulatory Authorities
The Peruvian Ministry of Energy and Mines (“MINEM” in its Spanish acronym) defines national energy policies, regulates environmental matters applicable to the energy sector, and oversees the granting, supervision, maturity, and termination of licenses, authorizations, and concessions for generation, transmission, and distribution activities.
The General Electricity Authority of MINEM is the technical regulatory entity responsible for evaluating the electricity sector. It proposes necessary regulations for the development of electricity generation, transmission, and distribution activities.
The Peruvian Investment Promotion Agency (ProInversion) is a public entity responsible for attracting private investment in public utility and infrastructure works. It also advises investors on their investment decisions.
Osinergmin is an autonomous public regulatory entity that controls and enforces compliance with legal and technical regulations related to electrical, hydrocarbon, and mining activities. It also controls and enforces compliance with the obligations stated in the concession contracts. Osinergmin’s Tariff Regulatory Bureau has the authority to publish regulated tariffs. It also supervises the bidding processes required by distribution companies to purchase energy from generators.
COES coordinates SEIN’s short-, medium-, and long-term operations at minimum cost to maintain the system’s security and optimize energy resources. It also plans SEIN’s transmission development and manages the spot market.
The Peruvian Electricity Law
General
The general legal framework applicable to the Peruvian electricity industry includes:
| ● | the Electricity Concessions Law (Decree Law 25844) and its ancillary regulations; |
| ● | the Law to Secure the Efficient Development of Electricity Generation (Law 28832) and its ancillary regulations; |
94
| ● | the Technical Regulation on Electricity Supply Quality (Supreme Decree 020); |
| ● | the Electricity Import and Export Regulation (Supreme Decree 049); |
| ● | the Antitrust Law for the Electricity Sector (Law 26876); |
| ● | the law establishing prior control of business and concentration of operations (Law 31112); |
| ● | the law regulating Osinergmin (Law 26734, together with Law 27699); |
| ● | the Decree Law 1002 promotes renewable energy; and |
| ● | the Decree Law 1221 improves electricity distribution regulation to encourage access to electricity in Peru. |
The regulatory framework includes:
| ● | the separation of generation, transmission, and distribution activities; |
| ● | freely determined prices for the supply of energy in competitive market conditions; |
| ● | a system of regulated prices based on the principle of efficiency together with a bidding regime for sales from generators to distributors; and |
| ● | private operation of the interconnected electricity systems based on principles of efficiency and quality of service. |
Law 29852 and Regulation 021-2012-EM created the Hydrocarbons Energy Security System and the Social Energy Inclusion Fund. These laws also created a social compensation system and universal service for the most economically vulnerable population sectors. These customers are subsidized by surcharges on unregulated customers’ electricity bills (equivalent to the surcharge that currently exists for regulated customers on the Electrical Social Compensation Fund), transportation surcharges for hydrocarbon-derivative liquids, and natural gas multi-pipelines and surcharges on the use of the natural gas pipeline.
Urgent Decree No. 035-2019 declares that as of February 1, 2020, MINEM and distribution companies are responsible for managing the Social Energy Inclusion Fund, which directs funds to the widespread use of natural gas by vulnerable sectors, develops new energy sources like photovoltaic cells and solar panels, and supplies liquefied petroleum gas to economically vulnerable sectors.
Law 29969 provides guidelines for the universal use of natural gas. State electricity distributors are authorized to carry out natural gas programs, including natural gas distribution in their concession area. They are also able to associate with companies specializing in the development of gas distribution projects. MINEM promotes private investment by granting gas distribution concessions through the pipeline network.
Law 29970 guarantees energy security and promotes the petrochemical complex’s development in the country’s southern region and state-owned companies’ participation in those projects. Within the framework of this law, the following have been declared matters of national interest: (i) the guarantee of energy security; (ii) the transportation of ethane to southern Peru; and (iii) the construction of regional pipelines in Huancavelica, Junín, and Ayacucho and their connection to existing gas pipelines.
Decree Law 1221 establishes the following main modifications:
| ● | In the distribution tariffs, the VAD and the internal rate of return (IRR) calculations are defined for each distribution company with over 50,000 customers. |
| ● | MINEM defines a technical responsibility area (“known ZRT” in its Spanish acronym) for each distributor, given its operational areas, with the possibility to extend their concession areas to nearby rural areas. Investments in these areas can be carried out by either a distributor or a third party and must be approved by the distributor. Investment and audited costs (with a cap) are recognized through the VAD. |
95
| ● | The VAD includes a technology innovation charge (for innovation or energy efficiency projects) equivalent to a maximum percentage of a distributor’s annual revenue. The VAD is adjusted to encourage service quality improvements. In both cases, distributors must present projects for the regulator’s approval. |
| ● | Distributors are obligated to guarantee their regulated demand for 24 months. |
| ● | Distributors must execute urban electrification investments or repay the contribution if the investment is carried out by a third party, when the occupancy rate exceeds 40%. |
| ● | Generation and transmission concessions originating in bidding processes are restricted to a 30-year term. In hydroelectric generation concessions, a favorable report for the watershed, as issued by MINEM, is required. |
| ● | Set conditions on renewable sources and co-generation enable them to inject surplus energy into the distribution system without affecting operational security. |
The government has created the multisectoral commission for the reform of the Electricity Subsector. The aim is to analyze the electricity market and the regulatory framework of the electricity subsector (and hydrocarbons related to electricity) to propose measures that guarantee its sustainability and development. The commission has two years to submit its proposals to MINEM. The commission has defined as short-term issues the review of generation dispatch rules and the discussion of an eventual revision of the regulatory rate.
Limits and Restrictions
Since the enactment of the Electricity Concessions Law, vertical integration has been restricted and different companies must develop activities in generation, transmission, and distribution segments.
The Antitrust Law for the Electricity Sector regulates cases in which vertical and horizontal integration is admissible. An antitrust authorization is compulsory for those electricity companies that hold more than a 5% interest in another business segment, either before or because of a merger or integration. Authorization is also required for the horizontal integration of generation, transmission, and distribution activities that result in a market share of at least 15% on any business segment. Such authorization is granted by the Institute for the Defense of the Consumer and Intellectual Property based on the market share information provided by Osinergmin.
On January 6, 2021, Law No. 31112 was published establishing the prior control of business concentration operations. With the entry into force of this law, after its bylaws and other regulatory adjustments are approved, the contents of Law No. 26876 will be repealed with the exception of Article 13, which modifies the Article 122 of Decree Law No. 25844, Electricity Concessions Law (related to concentration restrictions in the electricity sector) as well as Emergency Decree No. 013-2019 that established the prior control of business concentration operations as of March 01, 2021.
Regulatory Charges
In addition to taxes applicable to all industries (mainly an income tax and a value-added tax), electricity industry operators are subject to a unique regulated contribution that finances costs incurred by the regulator related to the electricity industry’s regulation and supervision. The applicable rate is up to 1% of each company’s annual billing, and collected funds are distributed between MINEM, Osinergmin, and the Environmental Assessment and Inspection Agency.
Regulation of Generation Companies
Concessions
Generation companies that own or operate a power plant with an installed capacity of more than 500 kW require a concession granted by MINEM. A concession for electricity generation activity is a unilateral permit granted to the generator for an unlimited period. It is subject to termination under the procedures outlined in the Electricity Concessions Law and its related regulations.
96
Applicants must first request a temporary two-year concession and subsequently apply for a long-term concession. To be authorized, the applicant must file a petition before MINEM. If the petition is admitted and no opposition is presented, MINEM grants the authorization to develop generation activities for an unlimited time, subject to compliance with applicable regulations.
Dispatch and Pricing
COES controls the coordination of electricity dispatch operations, the setting of spot prices, and the control and management of economic transactions that take place in SEIN. Generators can sell energy to large customers and buy deficits or transfer surpluses between contracted energy and actual production in the pool market at the spot price.
Sales by Generation Companies to Unregulated Customers
Sales to unregulated customers are carried out at mutually agreed prices and conditions that include tolls and compensation to transmission companies for the use of their transmission systems and, if necessary, to distribution companies to use their network.
Sales by Generation Companies to Distribution Companies and Certain Regulated Customers
Sales to distributors can be governed by:
| ● | bilateral contracts at a price no greater than the regulated price in the case of regulated customers (calculated by Osinergmin, cannot differ by more than 10% from prices obtained through tender processes). |
| ● | a tender process allowed under Law 28832. The purpose of this provision is to establish a mechanism that promotes investments in new generation capacity through long-term electricity supply contracts and firm prices with distribution companies. |
Sales of Capacity by Generation Companies to Other Generation Companies
COES determines a firm capacity for each power plant on an annual basis. Firm capacity is the highest capacity that a generator may supply to the system at certain peak hours, considering statistical information and accounting for time out of service for maintenance purposes and arid conditions in the case of hydroelectric plants. This parameter defines the limit for contracts for generators and calculates capacity revenues in the spot market. The procedure to calculate the firm capacity for wind and photovoltaic solar generation plants was modified in 2019 and is now calculated based on the energy production during peak hours.
Depending on the relationship between firm capacity and the company’s contractual requirements, the generation company may be required to purchase or sell capacity in the spot market.
Regulatory Charges
Generators that own hydroelectric plants pay a water royalty based on the energy produced and the regulated energy tariff at peak hours.
Tenders Promoted by the State
MINEM recommended installing new electricity plants that would serve as a backup to guarantee electricity flow to the system to avoid blackouts. As a result, ProInversion carried out a public bid in August 2010 seeking to secure investments for three projects located in Talara, Trujillo, and Ilo that would add another 800 MW to SEIN. The bid resulted in two of the projects being awarded, Reserva Fría de Talara (200 MW for Enel Generation Piura, our subsidiary) and Ilo (400 MW for Enersur, an unrelated company). These plants receive regular payments for being permanently available to operate and provide energy to SEIN at the request of COES. They are also reimbursed for fuel costs incurred for generating electricity. The Trujillo generation facility was later replaced by the Eten generation facility and awarded to Planta de Reserva Fría de Generación de Eten S.A. (200 MW).
97
Electricity Exports and Imports
A 220 kV transmission line has been implemented for the interconnection with Ecuador. However, the line has not operated continuously due to regulatory issues. Internal regulations were also approved for the application of CAN Decision 757, which establishes that when bilateral electricity transactions are carried out with other Andean Nation Community countries, the Economic Operation Committee of SEIN must send weekly reports to MINEM and Osinergmin, demonstrating that priority has been given to supplying the domestic market (Supreme Decree 011-2012-EM).
The governments of Peru and Chile have established a bilateral working group to discuss energy matters. The working group aims to identify and take advantage of potential synergies between the two countries and propose a framework for an agreement related to the electricity integration of both countries and the establishment of general rules for electricity exchanges. A final agreement is pending.
Regulation of Distribution Companies
Bids for Supplying Regulated Customers
The Law to Secure the Efficient Development of Electricity Generation established a bidding regime to acquire energy and capacity by distributors through competitive tenders and firm prices. The regulator approves the general conditions and sets a price cap for the bidding process. Distributors can sign short-term bilateral contracts with generators to buy electricity blocks not covered by tenders and fill any future imbalance.
New contracts to sell energy to distribution companies for resale to regulated customers must be made at fixed prices determined by public bids. Only a small part of the electricity purchased by distribution companies (included in old contracts) is still maintained at node prices. These node prices are set annually by Osinergmin and are the maximum prices for electricity purchased by distribution companies that can be transferred to regulated customers in those contracts.
Distribution Tariffs to End Customers
The tariff applicable to regulated customers includes charges for capacity and electricity for generation, a toll for transmission, and the VAD for distribution, which considers a regulated return on investments, operating and maintenance charges, and a standard percent for energy distribution losses.
Distribution Tariff-Setting Process
The VAD is set every four years for every distribution company with at least 50,000 customers. The latest tariff review for private distribution companies was carried out in November 2018.
The actual return on investment for a distribution company depends on its performance relative to the standards chosen by the Osinergmin for a theoretical model company. The tariff system allows for a greater return for distribution companies that are more efficient than the model company. Distribution companies perform tariff studies, and Osinergmin tests preliminary tariffs to ensure that they provide an average annual IRR between 8%-16% on the replacement cost of electricity-related distribution assets.
Incentives and Penalties
Law 28832 and Supreme Decree 052-2007-EM (“General Regulations of the Supply Auctions”) state that if auctions are called for more than three years in advance, distributors will receive incentive payments that will be added to the generator’s auction price, and then passed on to customers. These payments cannot be more than 3% of the energy price obtained during the tender process.
The distribution concessionaire may lose its concession if it does not provide evidence of a guaranteed supply for at least the following 24 months unless it has called for public auctions according to the current norm and has not received offers sufficient to comply with its total requirements for the established period.
98
Supreme Decree No. 018-2016-EM amends the Regulations of the Electricity Concessions Law to include the use of company-owned intelligent meters and recognition of investment and O&M expenses associated with these meters in the VAD. The decree also allows distribution companies to present technological innovation and quality improvement projects that can be recognized in the VAD through a capacity charge and establishes that the state must define technical responsibility areas (later described by R.M. No. 511-2017-MEM/DM).
Regulation in Transmission
Transmission activities are divided into two categories; “principal,” which are for common use and allow the flow of electricity through the national grid, and “secondary,” which connect a power plant to the national grid or directly to certain end customers. Law 28832 also defined “guaranteed transmission systems” and “supplementary transmission systems” as applicable to projects commissioned after enacting the law. Guaranteed system lines are the result of a public bid. Supplementary system lines are freely constructed and exploited as private projects and must be presented to and approved by Osinergmin. Principal and guaranteed system lines are open to all generators and allow electricity to be delivered to all customers. Transmission concessionaires receive an annual fixed income, payable through a variable tariff revenue and connection tolls per kW. The secondary and supplementary system lines are open to all generators but serve only specific customers who must pay for using the system.
Environmental Regulation
The environmental legal framework applicable to energy-related activities in Peru is established in the Environmental Law 28611, and the Regulation for Environmental Protection regarding Electricity Activities, Supreme Decree 014-2019-EM.
MINEM dictates specific environmental legal dispositions applicable to electricity activities. According to the Environmental Law, the Peruvian Ministry of Environment has as principal duties: (i) design the general environmental policies applicable to every productive activity; and (ii) establish the main guidelines of the different government authorities for their specific environmental sector regulations. Currently, the Environmental Assessment and Inspection Agency is responsible for the supervisory functions regarding the application and implementation of the Environmental Law’s dispositions.
Renewable generation sources are defined as biomass, wind, solar, geothermal, tidal, and hydroelectric power plants with an installed capacity lower than 20 MW. The principal investment incentives for renewable power include:
| ● | an objective percentage of national electricity consumption, set every five years, to be covered by renewable generation, excluding hydroelectric power plants (it has remained unchanged at 5% since 2008); |
| ● | tenders of energy to be covered by renewable energy in which the investor awarded the tender are guaranteed a firm price for the energy injected into the system during the supply contract period of up to 20 years. These tenders have established quotas by type of technology and limited prices; and |
| ● | priority in the dispatch of load and access to transmission and distribution networks. |
Other regulations also established tax incentives, including accelerated asset depreciation for income tax purposes and the advanced recovery of sales tax. In 2015, the Preuvian Congress approved Law 30327 extending the benefits of accelerated asset depreciation for income tax purposes through 2025.
Law 29968 created the National Environmental Certification Service for Sustainable Investments (“SENACE” in its Spanish acronym), a specialized public organization with technical autonomy and incorporated as a separate legal entity that reports to the Peruvian Ministry of the Environment. This organization is responsible for reviewing and approving detailed environmental impact studies of public, private, or mixed capital investment projects, whether national or multi-regional. These projects involve construction and other commercial and service activities whose characteristics, importance, and/or location can result in significant environmental impacts, except those expressly excluded by a Supreme Decree with the consenting vote of the Council of Ministers.
SENACE seeks to implement a single system of environmental administrative procedures to guarantee sustainable investments by implementing a sole process for environmental certification.
99
Covid-19 Pandemic Regulations
Due to the Covid-19 pandemic, the Peruvian government declared a national state of emergency on March 15, 2020 which remained in place until April 30, 2021. During this time, the government guaranteed the provision of public services, including electricity. At the start of the state of emergency, electric utility companies were allowed to suspend readings of meters and bill customers based on their average consumption over the prior six months. Staffing customer service centers and the delivery of paper bills was also suspended, although companies were authorized to distribute bills by digital means.
The Peruvian government also determined that distribution companies could divide bills issued in March 2020 or covering any consumption up to June 30, 2020, into a maximum of 24 installments for customers with a monthly consumption lower than 100 kWh (with interest covered by the government) and declared that distribution companies would not pay compensation or penalties due to violations of the Technical Regulation on Electricity Supply Quality standards so long as they were not related to security issues and occurred as a consequence of restrictions due to the state of emergency related to the Covid-19 pandemic. Later, the range of customers whose bills could be divided into installments was increased to those with a monthly consumption lower than 300 kWh (for bills issued in May 2020 or covering any consumption up to June, 30, 2020).
In addition, the Peruvian government established a subsidy (“Bono Electricidad”) to cover outstanding bills between March and December 2020 of those customers with consumption up to 125 kW who do not live in areas considered medium-high or high income. The maximum amount of subsidy per client is 160 soles, and the funds were transferred directly to distributors.
C. Organizational Structure.
Principal Subsidiaries and Affiliates
We are part of an electricity group controlled by Enel, which beneficially owned 65% of our shares as of December 31, 2020, and beneficially owns 82.3% of our shares as of the date of this Report. Enel, our ultimate controlling shareholder, is an Italian utility company with multinational operations whose principal business is the production, distribution, and sale of electricity, focusing primarily on Europe and Latin America. Enel operates in 32 countries across five continents and produces energy through a managed installed capacity of 87 GW, including more than 47 GW of renewable sources, making Enel one of the world’s largest private renewables operators. Enel is among the largest network operators, distributing electricity to more than 74 million end users. With almost 70 million customers worldwide, Enel has one of the most extensive customer bases among European competitors. Enel’s shares are listed on the Mercato Telematico Azionario organized and managed by Borsa Italiana S.p.A.
100
Enel Américas Simplified Organizational Structure (1)
As of the date of this Report
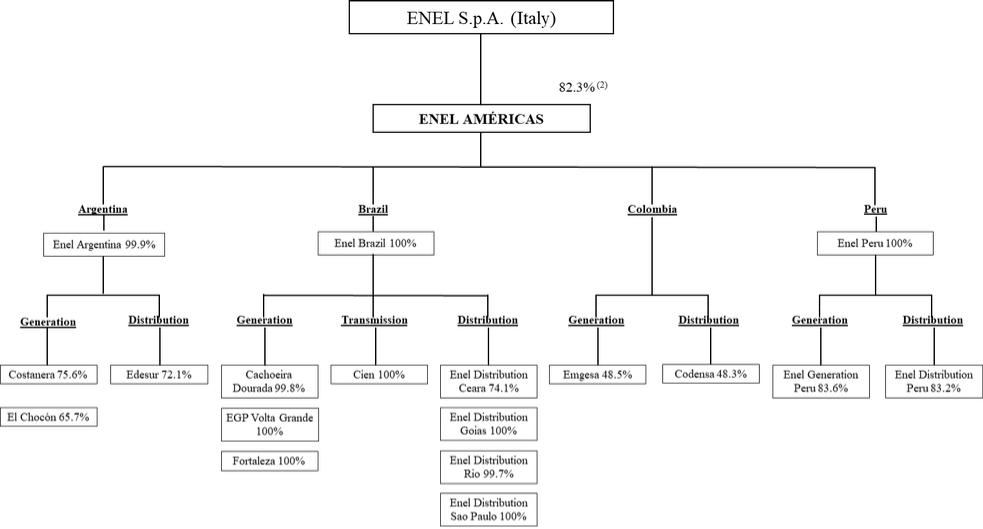
| (1) | Only principal operating subsidiaries are presented here. The percentage listed in the box for each of Enel Américas’ consolidated subsidiaries represents our economic interest in such subsidiary. Please refer to “Presentation of Information” for an explanation of the calculation of economic interest. |
101
We consolidated the companies listed in the following tables as of December 31, 2020. In the case of subsidiaries, our economic interest is calculated by multiplying our percentage economic interest in a directly held subsidiary by the percentage economic interest of any entity in the chain of ownership of such ultimate subsidiary.
| | | | | | |
Principal Subsidiaries and Country of Operations |
| % Economic |
| Consolidated |
| Revenues and Other |
| | (in %) | | (in billions of US$) | | (in billions of US$) |
Electricity Generation, Transmission, and Distribution | | | | | | |
Electricity Generation | | | | | | |
El Chocón (Argentina) | | 65.7 | | 360 | | 49 |
Costanera (Argentina) | | 75.6 | | 350 | | 113 |
Fortaleza (Brazil) | | 100.0 | | 210 | | 187 |
Cachoeira Dourada (Brazil) | | 99.8 | | 714 | | 812 |
EGP Volta Grande (Brazil) | | 100.0 | | 306 | | 62 |
Emgesa (Colombia) | | 48.5 | | 2,780 | | 1,159 |
Enel Generation Peru (Peru)(1) | | 83.6 | | 1,282 | | 446 |
Electricity Transmission | | | | | | |
Cien (Brazil) | | 100.0 | | 173 | | 53 |
Electricity Distribution | | | | | | |
Edesur (Argentina) | | 72.1 | | 1,717 | | 801 |
Enel Distribution Rio (Brazil) | | 99.7 | | 2,294 | | 1,221 |
Enel Distribution Ceara (Brazil) | | 74.1 | | 1,899 | | 1,142 |
Enel Distribution Goias (Brazil) | | 100.0 | | 2,598 | | 1,392 |
Enel Distribution Sao Paulo (Brazil) | | 100.0 | | 6,714 | | 2,980 |
Codensa (Colombia) | | 48.3 | | 2,474 | | 1,547 |
Enel Distribution Peru (Peru) | | 83.2 | | 1,455 | | 887 |
| (1) | The Consolidated Assets and the Revenues and Other Operating Income of Enel Generation Peru include Chinango. |
Generation and Transmission Segment
The following companies include generation and transmission companies consolidated by us as of December 31, 2020.
Costanera (Argentina)
Costanera is a publicly-held Argentine electricity generation company, with 2,210 MW of net installed capacity in Buenos Aires. Costanera consists of six steam turbines with an aggregate capacity of 1,062 MW, which burns oil and gas, and five natural gas combined-cycle facilities with a total capacity of 1,148 MW. Costanera was acquired from the Argentine government after the privatization of Servicios Eléctricos del Gran Buenos Aires S.A. in 1992. We own a 75.6% economic interest in Costanera.
El Chocón (Argentina)
Enel Generation El Chocón is an Argentine electricity generation company. It has nine hydroelectric power stations with an aggregate installed capacity of 1,328 MW located between Neuquén and Río Negro provinces, in the Comahue Basin in southern Argentina. A 30-year concession, which expires in 2023, was granted by the Argentine government to our subsidiary, Hidroinvest S.A., which bought 59% of Enel Generation El Chocón’s shares in July 1993 during the privatization process. Enel Generation El Chocón also has four diesel engines with a total installed capacity of 34 MW, which began operating in 2016. These engines are located in and operated by our Costanera thermal plant (due to an agreement between both companies). We acquired the company in 1993 and currently own a 65.7% economic interest in Enel Generation El Chocón.
102
Enel Argentina (Argentina)
Enel Argentina consolidates operations of two generation companies, Costanera, and El Chocón, and one distribution company, Edesur.
Cachoeira Dourada (Brazil)
Cachoeira Dourada owns and operates a run-of-river hydroelectric plant using the flows from the Paranaiba River, located in the state of Goiás, consisting of three generating units totaling 655 MW of installed capacity. Cachoeira Dourada began its operations in 1997 and has a concession that expires in 2027. We have a 99.8% economic interest in Cachoeira Dourada.
Cien (Brazil)
Cien is a Brazilian transmission and trading company wholly owned by Enel Brasil. It transmits electricity through two owned transmission lines that connect Argentina and Brazil, covering a distance of 740 kilometers, with a total transmission capacity of 2,200 MW. Cien operates each transmission line under the Cien I and Cien II concessions granted by the Brazilian government. The Cien I concession’s term expired in June 2020 and the Cien II concession’s term expires in July 2022. However, with regard to the Cien I concession, the Brazilian MME issued an official act in June 2020 designating Cien to continue operating the facilities covered by the Cien I concession until a new operator is appointed through an upcoming bid process. In the meantime, Cien will receive an annual income calculated based on current criteria and methodology. Cien consolidates CTM and TESA, which operate the Argentine side of the interconnection line with Brazil. We wholly own Cien.
EGP Volta Grande (Brazil)
EGP Volta Grande is a generation company that owns the concession to operate the 380-MW Volta Grande hydroelectric power plant located between the states of Minas Gerais and Sao Paulo. We wholly own EGP Volta Grande through Enel Brasil.
Enel Brasil (Brazil)
Enel Brasil consolidates operations of three generation companies, Cachoeira Dourada, Fortaleza, and EGP Volta Grande, and a transmission company, Cien, and four distribution companies, Enel Distribution Sao Paulo, Enel Distribution Rio, Enel Distribution Ceara, and Enel Distribution Goias.
Fortaleza (Brazil)
Fortaleza owns and operates a natural gas combined-cycle power plant, with a net installed capacity of 319 MW. Fortaleza has a concession that expires in 2031. Enel Brasil wholly owns Fortaleza, and we hold a 100% economic interest in Enel Brasil.
Emgesa (Colombia)
Emgesa has an installed capacity of 3,506 MW, of which 88% is from hydroelectric power plants, and 12% is from thermoelectric power plants. GEB directly holds a 51.5% equity interest in Emgesa. We own 48.5% of Emgesa’s shares, representing 56.4% of the voting rights in Emgesa. As a result of a shareholders’ agreement with GEB, we appoint the majority of the Board members and control Emgesa. For more information, see “Item 5. Operating and Financial Review and Prospects — A. Operating Results. — 1. Discussion of Main Factors Affecting Operating Results and Financial Condition of the Company.”
Enel Generation Peru (Peru)
Enel Generation Peru, an electricity generation company, owns and operates eight hydroelectric plants, two of which are owned and operated by Chinango, Enel Generation Peru’s subsidiary, and two thermal plants. It has a consolidated installed capacity of 1,654 MW, including Chinango’s installed capacity of 199 MW. We hold an 83.6% economic interest in Enel Generation Peru.
103
Enel Peru (Peru)
Enel Peru consolidates operations of two generation companies, Enel Generation Peru (including Chinango), Enel Generación Piura S.A., and one distribution company, Enel Distribution Peru.
Distribution Segment
The following companies include distribution companies consolidated by us as of December 31, 2020.
Edesur (Argentina)
Edesur is one of the largest electricity distribution companies in Argentina in terms of energy purchases. Edesur operates in a concession area of 3,309 square kilometers in the south-central part of the Buenos Aires metropolitan area, serving approximately 2.5 million customers under a concession that expires in 2087. Our economic interest in Edesur is 72.1%.
Enel Distribution Ceara (Brazil)
Enel Distribution Ceara is the sole electricity distributor of the state of Ceará, located in northeastern Brazil, and serves over four million customers within a concession area of 148,921 square kilometers. Enel Distribution Ceara has a concession that expires in 2028. Our economic interest in Enel Distribution Ceara is 74.1%.
Enel Distribution Goias (Brazil)
Enel Distribution Goias distributes electricity in the state of Goiás, located in the center-west of Brazil, and serves 3.2 million customers within a concession area of 336,871 square kilometers. We acquired the company from the Brazilian government as part of its privatization in 2017. Enel Distribution Goias was founded in 1956 and has a concession that expires on December 31, 2044. We have a 100% economic interest in Enel Distribution Goias.
Enel Distribution Rio (Brazil)
Enel Distribution Rio is the second-largest electricity distribution company in the state of Rio de Janeiro, Brazil, in terms of the number of customers and annual energy sales. Enel Distribution Rio is mainly engaged in the distribution of electricity to 66 municipalities located in the state of Rio de Janeiro and serves 2.9 million customers in a concession area of 32,615 square kilometers. The distributor has a concession that expires in 2026. We have a 99.7% economic interest in Enel Distribution Rio.
Enel Distribution Sao Paulo (Brazil)
Enel Distribution Sao Paulo (formerly known as Eletropaulo) is a distribution company located in the state of Saỡ Paulo, with a concession area of 4,526 square kilometers centered around the state capital. It covers the largest metropolitan area of the most developed and industrialized state in Brazil, including 24 municipalities and 7.9 million customers. Enel Brasil wholly owns Enel Distribution Sao Paulo, and we hold a 100% economic interest in Enel Brasil. We acquired control of Enel Distribution Sao Paulo in June 2018.
Codensa (Colombia)
Codensa is a Colombian electricity distribution company that serves a concession area of 26,093 square kilometers in Bogotá and other 130 municipalities of the provinces of Cundinamarca, with approximately 3.6 million customers. Our economic interest in Codensa is 48.3%, which represents 56.7% of the voting rights in Codensa. As a result of our shareholders’ agreement with GEB, we appoint the majority of Codensa’s Board members and control Codensa. For more information regarding the control and consolidation of Codensa, see “Item 5. Operating and Financial Review and Prospects — A. Operating Results. — 1. Discussion of Main Factors Affecting Operating Results and Financial Condition of the Company.”
104
Enel Distribution Peru (Peru)
Enel Distribution Peru, a Peruvian electricity distribution company, operates in a concession area of 1,602 square kilometers. It has an exclusive concession to distribute electricity in the northern Lima metropolitan area and some provinces in the Lima region, including Huaral, Huaura, Barranca, and Oyón, the province adjacent to Callao. Enel Distribution Peru distributed electricity to approximately 1.5 million customers. We hold an 83.2% economic interest in Enel Distribution Peru.
D. | Property, Plant, and Equipment. |
Our property, plant, and equipment is concentrated in electricity generation, distribution, and transmission assets in the four countries in which we operate.
Property, Plant, and Equipment of Generating Companies
We conduct our generation business through our generation subsidiaries Costanera, El Chocón, and Dock Sud in Argentina, Cachoeira Dourada, EGP Volta Grande, and Fortaleza in Brazil, Emgesa in Colombia, and Enel Generation Piura, Enel Generation Peru, and its subsidiary, Chinango, in Peru. As of December 2020, through these subsidiaries, we own 35 power plants in South America, including four mini-hydro plants in Colombia (totaling 112 MW), aggregating 11,269 MW of installed capacity.
The following table identifies the power plants that we own, at the end of each year, organized by country and technology:
| | | | | | | | | | |
|---|---|---|---|---|---|---|---|---|---|---|
| | | | | | Installed Capacity(1) | ||||
Country/Company |
| Power Plant Name |
| Power Plant Type(2) |
| 2020 |
| 2019 |
| 2018 |
| | | | | | (in MW) | ||||
Argentina | | | | | | | | | | |
Costanera | | | | | | | | | | |
| | Costanera Steam Turbine | | Steam Turbine/Natural Gas+Fuel Oil | | 1,062 | | 1,062 | | 1,062 |
| | Costanera Combined Cycle II | | Combined Cycle/Natural Gas+Diesel Oil | | 851 | | 851 | | 851 |
| | Buenos Aires Combined Cycle I | | Combined Cycle/Natural Gas | | 297 | | 297 | | 297 |
| | Total | | | | 2,210 | | 2,210 | | 2,210 |
El Chocón | | | | | | | | | | |
| | Chocón | | Reservoir | | 1,200 | | 1,200 | | 1,200 |
| | Arroyito | | Run-of-the-river | | 128 | | 128 | | 128 |
| | Costanera DE | | Diesel Engines (Diesel Oil + Fuel Oil) | | 34 | | 34 | | 34 |
| | Total | | | | 1,362 | | 1,362 | | 1,362 |
Dock Sud | | | | | | | | | | |
| | Dock Sud CC | | Combined Cycle/Natural Gas+Diesel Oil | | 775 | | 775 | | 775 |
| | Dock Sud TG | | Gas Turbine/Natural Gas+Diesel Oil | | 72 | | 72 | | 72 |
| | Total | | | | 847 | | 847 | | 847 |
Total capacity in Argentina | | | | 4,419 | | 4,419 | | 4,419 | ||
| | | | | | | | | | |
Brazil | | | | | | | | | | |
Cachoeira Dourada | | Cachoeira Dourada | | Run-of-the-river | | 655 | | 655 | | 655 |
EGP Volta Grande | | Volta Grande | | Run-of-the-river | | 380 | | 380 | | 380 |
Fortaleza | | Fortaleza | | Combined Cycle/Gas | | 319 | | 319 | | 319 |
Total capacity in Brazil | | | | 1,354 | | 1,354 | | 1,354 | ||
| | | | | | | | | | |
Colombia | | | | | | | | | | |
Emgesa | | | | | | | | | | |
105
| | | | | | | | | | |
|---|---|---|---|---|---|---|---|---|---|---|
| | | | | | Installed Capacity(1) | ||||
Country/Company |
| Power Plant Name |
| Power Plant Type(2) |
| 2020 |
| 2019 |
| 2018 |
| | | | | | (in MW) | ||||
| | Guavio | | Reservoir | | 1,260 | | 1,260 | | 1,260 |
| | Betania | | Reservoir | | 540 | | 540 | | 540 |
| | Quimbo | | Reservoir | | 400 | | 400 | | 396 |
| | La Guaca | | Run-of-the-river | | 324 | | 324 | | 324 |
| | Paraíso | | Reservoir | | 276 | | 276 | | 276 |
| | Termozipa | | Steam Turbine/Coal | | 225 | | 225 | | 224 |
| | Cartagena | | Steam Turbine/ Natural Gas | | 184 | | 184 | | 184 |
| | Dario Valencia | | Run-of-the-river | | 150 | | 150 | | 150 |
| | Minor plants(3) | | Run-of-the-river | | 112 | | 112 | | 110 |
| | Salto II | | Run-of-the-river | | 35 | | 35 | | 35 |
Total capacity in Colombia | | | | 3,506 | | 3,506 | | 3,499 | ||
| | | | | | | | | | |
Peru | | | | | | | | | | |
Enel Generation Peru | | | | | | | | | | |
| | Ventanilla | | Combined Cycle/Natural Gas | | 460 | | 460 | | 467 |
| | Santa Rosa | | Gas Turbine/Diesel Oil | | 402 | | 400 | | 389 |
| | Huinco | | Reservoir | | 276 | | 276 | | 276 |
| | Matucana | | Run-of-the-river | | 133 | | 133 | | 133 |
| | Callahuanca(4) | | Run-of-the-river | | 84 | | 83 | | 83 |
| | Moyopampa | | Run-of-the-river | | 69 | | 69 | | 69 |
| | Huampani | | Run-of-the-river | | 31 | | 31 | | 31 |
| | Her1 | | Run-of-the-river | | 1 | | 1 | | 1 |
| | Total | | | | 1,455 | | 1,453 | | 1,449 |
Chinango | | | | | | | | | | |
| | Chimay | | Reservoir | | 157 | | 157 | | 157 |
| | Yanango | | Run-of-the-river | | 42 | | 42 | | 42 |
| | Total | | | | 199 | | 199 | | 199 |
Enel Generation Piura | | Malacas(5) | | Gas Turbine/Natural Gas+Diesel Oil | | 336 | | 336 | | 337 |
| | Total | | | | 336 | | 336 | | 337 |
Total capacity in Peru | | | | 1,990 | | 1,987 | | 1,985 | ||
Consolidated capacity | | | | 11,269 | | 11,267 | | 11,257 | ||
| (1) | The installed capacity corresponds to the net installed capacity, which considers the MW that each power plant consumes for its operation. |
| (2) | “Reservoir” and “run-of-the-river” refer to hydroelectric plants that use the force of a dam or a river, respectively, to move the turbines that generate electricity. “Steam” refers to thermal power plants fueled with natural gas, coal, diesel, or fuel oil to produce steam that moves the turbines. “Gas Turbine” (“GT”) or “Open Cycle” refers to thermal power plants that use either diesel or natural gas to produce gas that turns the turbines. “Combined Cycle” refers to a thermal power plant fueled with natural gas, diesel oil, or fuel oil to turn the first turbine and then recovers the heat to generate steam to turn a second turbine. |
| (3) | The small plants have an aggregate capacity of 112 MW. As of December 31, 2020, Emgesa owns and operates four small plants: Charquito (19 MW), El Limonar (18 MW), Laguneta (18 MW), and Tequendama (57 MW). Laguneta was previously reported as a separate power plant. |
| (4) | On June 14, 2017, with the approval of the regulatory entity (COES), the Callahuanca hydroelectric power plant was removed from commercial operation due to a catastrophic event (flooding of the facilities) that occurred on March 16, 2017. The Callahuanca hydroelectric power plant resumed full operations in March 2019. |
| (5) | Malacas includes the installed capacity (189 MW) of the Reserva Fría de Talara power plant. |
106
Property, Plant, and Equipment of Transmission and Distribution Companies
We conduct our distribution business through Edesur in Argentina, Enel Distribution Rio, Enel Distribution Ceara, Enel Distribution Goias, and Enel Distribution Sao Paulo in Brazil, Codensa in Colombia, and Enel Distribution Peru in Peru. We conduct our transmission business through Cien in Brazil.
We have significant property, plant, and equipment assets in electricity distribution. The following tables describe the main property, plant, and equipment of our distribution businesses, such as transmission lines, substations, and transformers, and distribution networks.
TABLE OF DISTRIBUTION FACILITIES
Distribution Network - Transmission Lines(1)
| | | | | | | | | | |
| | | | | | Transmission Lines | ||||
|
| Location |
| Concession Area |
| 2020 |
| 2019 |
| 2018 |
| | | | (in km2) | | (in kilometers) | ||||
Edesur | | Argentina | | 3,309 | | 1,041 | | 1,039 | | 1,039 |
Enel Distribution Goias | | Brazil | | 336,871 | | 6,010 | | 6,004 | | 6,038 |
Enel Distribution Ceara | | Brazil | | 148,921 | | 5,381 | | 5,293 | | 5,259 |
Enel Distribution Rio | | Brazil | | 32,615 | | 3,455 | | 3,429 | | 3,429 |
Enel Distribution Sao Paulo(2) | | Brazil | | 4,526 | | 1,834 | | 1,830 | | 1,824 |
Codensa | | Colombia | | 26,093 | | 1,340 | | 1,319 | | 1,319 |
Enel Distribution Peru | | Peru | | 1,602 | | 727 | | 716 | | 697 |
Total | | | | 553,937 | | 19,788 | | 19,630 | | 19,606 |
| (1) | The transmission lines consist of circuits with voltages in the 35-500 kV range. |
| (2) | We acquired Enel Distribution Sao Paulo in June 2018. |
Power and Interconnection Substations and Transformers(1)(2)
| | | | | | | | | | | | | | | | | | |
| | Year ended December 31, | ||||||||||||||||
| | 2020 | | 2019 | | 2018 | ||||||||||||
|
| Number of |
| Number of |
| Capacity |
| Number of |
| Number of |
| Capacity |
| Number of |
| Number of |
| Capacity |
Edesur | | 67 | | 180 | | 12,876 | | 68 | | 182 | | 12,956 | | 68 | | 185 | | 12,478 |
Enel Distribution Goias | | 346 | | 476 | | 5,784 | | 348 | | 470 | | 5,636 | | 345 | | 466 | | 5,434 |
Enel Distribution Sao Paulo(3) | | 213 | | 460 | | 15,468 | | 231 | | 463 | | 15,420 | | 231 | | 463 | | 15,422 |
Enel Distribution Rio | | 137 | | 281 | | 5,867 | | 137 | | 281 | | 5,786 | | 136 | | 289 | | 5,617 |
Enel Distribution Ceara | | 118 | | 195 | | 3,587 | | 118 | | 195 | | 3,587 | | 118 | | 190 | | 3,331 |
Codensa | | 171 | | 446 | | 11,628 | | 173 | | 435 | | 11,295 | | 173 | | 435 | | 11,295 |
Enel Distribution Peru | | 41 | | 153 | | 5,053 | | 49 | | 150 | | 4,924 | | 46 | | 143 | | 4,510 |
Total | | 1,093 | | 2,191 | | 60,263 | | 1,124 | | 2,176 | | 59,604 | | 1,117 | | 2,171 | | 58,087 |
| (1) | The transformers’ voltage is in the range of 500 kV (in - high voltage, “hv”) and 1 kV (out - medium voltage, “mv”). |
| (2) | The number of substations includes 69 units of hv/hv without capacity for transmission (only capacity for operation). |
| (3) | We acquired Enel Distribution Sao Paulo in June 2018. |
107
Distribution Network - Medium and Low Voltage Lines(1)
| | | | | | | | | | | | |
| | Year ended December 31, | ||||||||||
| | 2020 | | 2019 | | 2018 | ||||||
|
| Medium Voltage |
| Low Voltage |
| Medium Voltage |
| Low Voltage |
| Medium Voltage |
| Low Voltage |
| | | | | | (in Kilometers) | | | | | ||
Edesur | | 8,717 | | 18,167 | | 8,312 | | 18,039 | | 8,182 | | 17,761 |
Enel Distribution Goias | | 184,676 | | 33,415 | | 182,446 | | 33,085 | | 181,274 | | 32,651 |
Enel Distribution Ceara | | 92,481 | | 57,652 | | 90,664 | | 56,619 | | 89,232 | | 55,529 |
Enel Distribution Rio | | 37,667 | | 19,642 | | 37,400 | | 19,817 | | 37,041 | | 19,561 |
Enel Distribution Sao Paulo(2) | | 21,395 | | 20,799 | | 21,339 | | 20,665 | | 21,258 | | 20,554 |
Codensa | | 31,455 | | 43,113 | | 29,681 | | 42,524 | | 29,217 | | 41,973 |
Enel Distribution Peru(3) | | 5,053 | | 13,345 | | 4,945 | | 24,016 | | 4,858 | | 23,743 |
Total | | 381,444 | | 206,133 | | 374,787 | | 214,765 | | 371,062 | | 211,773 |
| (1) | Medium voltage lines: 1 kV – 34.5 kV; low voltage lines: 110 – 380 V |
| (2) | We acquired Enel Distribution Sao Paulo in June 2018. |
| (3) | The low voltage network includes street lighting. |
Transformers for Distribution(1)
| | | | | | | | | | | | |
| | Year ended December 31, | ||||||||||
| | 2020 | | 2019 | | 2018 | ||||||
|
| Number of |
| Capacity |
| Number of |
| Capacity |
| Number of |
| Capacity |
Edesur | | 19,356 | | 7,618 | | 17,308 | | 6,773 | | 19,126 | | 6,466 |
Enel Distribution Goias | | 225,937 | | 6,433 | | 221,702 | | 6,303 | | 220,610 | | 6,202 |
Enel Distribution Ceara | | 153,812 | | 4,249 | | 149,853 | | 3,982 | | 146,381 | | 3,802 |
Enel Distribution Sao Paulo(2) | | 142,608 | | 15,419 | | 141,472 | | 15,245 | | 140,320 | | 14,983 |
Enel Distribution Rio | | 129,047 | | 5,881 | | 127,726 | | 5,737 | | 126,063 | | 5,548 |
Codensa | | 72,762 | | 7,332 | | 68,386 | | 6,832 | | 67,652 | | 6,748 |
Enel Distribution Peru | | 11,369 | | 2,088 | | 11,287 | | 2,042 | | 11,223 | | 1,992 |
Total | | 754,891 | | 49,020 | | 737,734 | | 46,914 | | 731,375 | | 45,741 |
| (1) | The transmission lines consist of circuits with voltages in the 35-500 kV range. |
| (2) | We acquired Enel Distribution Sao Paulo in June 2018. |
Insurance
Our electricity generation and transmission and distribution facilities are insured against damage due to natural disasters such as earthquakes, floods, other acts of god (but not for droughts, which are not considered force majeure risks and are not covered by insurance), or due to fire, or due to mechanical failure, based on the appraised value of the facilities as determined from time to time by an independent appraiser. Our companies are also insured from damages due to third-party claims.
Claims under our subsidiaries’ insurance policies are subject to customary deductibles and other conditions. We also maintain business interruption insurance, providing coverage for up to 24 months, including the deductible period, when following an insured failure of any of our facilities. The insurance coverage taken for our properties is approved by each company’s management, taking into account the quality of the insurance companies and the needs, conditions, and risk evaluations of each facility, and general corporate guidelines. All insurance policies are purchased from reputable international insurers. We continuously monitor and meet with the insurance companies to obtain, yearly, what is the most commercially reasonable insurance coverage.
108
We are also insured against damage to substations, transformers within the substations, and portions of the distribution network up to one kilometer from the substations, towers, or poles. Risks covered include losses caused by fire, explosions, earthquakes, floods, lightning, and damages to machinery and others. Liability insurance policies also protect our companies from claims made by third parties.
Project Investments
We continuously analyze potential growth opportunities in the countries where we operate. The study and profitability assessment of our project portfolio is an ongoing effort. Industry technology is allowing for smaller, less environmentally damaging power plants. These plants can be built more quickly, allow greater flexibility to activate or deactivate according to system needs, and are generally preferred by the community. We favor renewable energy technology for our new power plant investments and seek opportunities by building new greenfield projects or modernizing existing brownfield assets and improving operational or environmental performance. Each project’s expected start-up is assessed and is defined based on the commercial opportunities and our financing capacity to fund these projects. All of our projects are financed with internally generated funds. Our project investments are ordinarily submitted for internal approval in U.S. dollars, but occasionally they may be approved in another currency, including euros. The total amount invested as of the last fiscal year is presented in U.S. dollars, while the total approved investment is in the currency in which the project investment was approved, which may be different.
Below we list our most important projects under development. However, any decision related to construction will depend on commercial opportunities foreseen in the upcoming years, including future tenders for supplying the regulated market and the evolution of the regulatory framework (mainly in Argentina).
Budgeted amounts include connecting lines that could be owned by third parties and paid as tolls unless otherwise indicated.
Projects Completed in 2020
Peru – Ventanilla Battery Energy Storage System (BESS)
Ventanilla is a 460 MW thermal power plant located in Callao province, Peru, comprising three units: two gas turbines and one steam turbine in a combined-cycle plant (2:2:1). The project consisted of installing a 15 MW/8 MWh BESS in the Ventanilla power plant, the first utility-scale BESS installed in Peru.
The BESS is connected to the 16 kV bar of one of the existing turbines to provide primary frequency regulation on behalf of the power plant, thereby reducing the expected penalties associated with primary frequency regulation and, under current regulation, the costs associated with secondary frequency regulation.
Construction on the project began in May 2019. After test compliance, the BESS was considered by the COES as connected to the SEIN on October 21, 2020. As of December 31, 2020, 100% of the project had been completed. The total investment in this project was US$ 10.1 million.
Colombia – Termozipa BESS
Termozipa is a coal-fired power plant located in Tocancipa municipality on the Bogotá River, approximately 40 km from Bogotá, Colombia, with an installed capacity of 225 MW.
This project consisted of installing a 7 MW (4 MWh) BESS in the Termozipa power plant. It is the first utility-scale BESS established in Colombia. It is connected to the 13.8 kV bars of the four existing steam turbines to provide primary frequency regulation services on behalf of the power plant.
Construction on this project began on January 22, 2019, and as of December 31, 2020, the project has been completed except for regulatory tests. The total investment in this project was US$ 6.3 million.
109
Projects under Construction
Argentina – Costanera Thermoelectric Power Plant - Wastewater Treatment System
The new project consists of a new wastewater treatment system for the Costanera power plant, connected to different collection points in the power plant. The new treatment system will allow the discharge of wastewater in compliance with the environmental approvals for the Costanera power plant.
Construction on this project began on May 10, 2019. As of December 31, 2020, approximately 93% of the project had been completed, and we expect it to begin to operate at full capacity in 2021.
The total approved investment is US$ 18 million, of which US$ 17.5 million had been incurred as of December 31, 2020.
Colombia – Termozipa Thermoelectric Power Plant - Best Environmental Practices (BEPP)and Life Extension Project
The BEPP project in Termozipa aims to achieve high standards for gas emissions for coal-fired power plants by reducing the following components: Nitrogen oxide (NOx), sulfur dioxide (SO2), and particulate emissions. The project also includes improvements to the ash extraction system and the refrigeration water discharge system.
The Life Extension Project contemplates improvements to the boilers, mills, turbines, generators, demi plant, water intake, medium- and low-voltage systems, electrostatic precipitators, and ancillary systems, to extend the power plant life an additional 15 years (or 100,000 hours) of operation.
Construction on this project began on December 1, 2016. As of December 31, 2020, 100% of Life Extension activities had been completed, while the part about BEPP is expected to conclude by 2024.
The total approved investment is approximately EUR 134 million, of which US$ 82 million had been incurred as of December 31, 2020.
Projects under Development
We are currently evaluating the development of the following projects, which we classify as “under development.” We will decide whether to proceed or not with each project depending on the commercial and other opportunities foreseen in upcoming years and future tender prices for supplying the regulated market’s energy requirements and negotiations with existing or new unregulated customers.
Peru – Santa Rosa and Malacas Thermoelectric Power Plants – Closure of Open Cycle of Gas Turbines.
We are analyzing the potential closure of the cycle of certain gas turbines in Santa Rosa (gas turbine #8) and Malacas (gas turbines #4 and #6), converting these power plants from open-cycle gas turbines to combined cycle. This conversion may increase the power plants’ installed capacity and improve their efficiency, which may help better position them in priority order for dispatching.
The total estimated investment of these projects is EUR 365 million. We expect construction on the projects to begin in 2024 and operate at full capacity by 2026-2027.
Peru – Ventanilla Thermoelectric Power Plant – Cooling System
We are analyzing improvements in the Ventanilla power plant’s cooling system to reduce raw water utilization from underground water wells.
The total estimated investment is US$ 12.4 million. We expect construction on the project to begin in 2024 and to operate at full capacity by 2026.
110
Peru – Callahuanca Hydroelectric Power Plant – Repowering Project
The Callahuanca repowering project would occur within our existing 84 MW Callahuanca power plant in Peru. Callahuanca is a run-of-the-river hydroelectric power plant with four units. It uses water coming from the Rimac and Santa Eulalia rivers. The project involves improvements in unit No. 4, which would increase the plant’s capacity by 1 MW and the annual generation by at least 23 GWh.
The total estimated investment is US$ 4.4 million. We expect construction on the project to begin in April 2022 and to operate at full capacity by August 2022.
Major Encumbrances
Costanera’s supplier debt with Mitsubishi Corporation (“MC”) is for the remaining payments on equipment purchased from MC in November 1996, which was refinanced in October 2014. The value of the assets pledged to secure this debt was US$ 39.3 million as of December 31, 2020.
Item 4A. Unresolved Staff Comments
None
Item 5. Operating and Financial Review and Prospects
A. | Operating Results. |
General
The following discussion should be read in conjunction with our consolidated financial statements and the notes thereto, included in Item 18 in this Report, and “Selected Financial Data,” included in Item 3 of this Report. Our audited consolidated financial statements as of December 31, 2020 and 2019 and for each of the years in the three-year period ended December 31, 2020, have been prepared under IFRS, as issued by the IASB.
1. | Discussion of Main Factors Affecting Operating Results and Financial Condition of the Company |
We are an electricity company headquartered in Chile that owns and operates generation, transmission, and distribution companies in Argentina, Brazil, Colombia, and Peru. Substantially all our revenues, income, and cash flows come from the operations of our subsidiaries and associates in these countries.
Factors such as (i) hydrological conditions, (ii) fuel prices, (iii) regulatory developments, (iv) exceptional actions adopted by governmental authorities, and (v) changes in economic conditions in countries in which we operate may materially affect our financial results. Our results from operations and financial condition are affected by variations in the exchange rates between the U.S. dollar and the currencies of the countries in which we operate. These exchange variations may materially impact the consolidation of the results of our companies. We also have certain critical accounting policies that affect our consolidated operating results.
Our risk diversification strategy aims to balance the impact of significant changes in one country with opposing changes in other countries and among our different business segments in generation, transmission, and distribution. For the years covered by this Report, the impact of these factors on us is discussed below.
We directly hold 48.5% and 48.3% of the equity interests and 56.4 % and 56.7% of the voting shares of Emgesa and Codensa, respectively. We exercise control over Emgesa and Codensa through shareholder agreements with GEB, which owns both entities’ remaining equity interests. We have the right to appoint the majority of Emgesa’s and Codensa’s board members and consolidate Emgesa and Codensa in our consolidated financial statements.
On June 4, 2018, we completed a tender offer to acquire Enel Distribution Sao Paulo (legally known as Eletropaulo Metropolitana Eletricidade de São Paulo S.A.), one of the main distribution companies in Sao Paulo, Brazil, resulting in our 95.9% ownership. In November 2019, we completed a tender offer and acquired the remaining 4.1% of Enel
111
Distribution Sao Paulo’s common stock, and as of December 31, 2019, we owned 100%. The total investment to acquire Enel Distribution Sao Paulo was US$ 2.3 billion using the exchange rate at that time. For further information, please refer to “Item 4. Information on the Company — A. History and Development of the Company. — History.” The effects of the Enel Distribution Sao Paulo acquisition on our consolidated financial statements for the year ended December 31, 2018, are described in Note 6.1 of the notes to our consolidated financial statements.
a.Generation and Transmission Business
Our electricity generation and transmission businesses are conducted in Argentina through Costanera, El Chocón, and Dock Sud; in Brazil through Cachoeira Dourada, EGP Volta Grande, and Fortaleza; in Colombia through Emgesa; and in Peru through Enel Generation Peru, and Enel Generation Piura. A substantial part of our generation capacity depends on the hydrological conditions prevailing in the countries where we operate. Our net installed capacity as of December 31, 2020, 2019, and 2018 was 11,269 MW, 11,267 MW, and 11,257 MW, respectively. Our hydroelectric installed capacity represented 55.5% of our total net installed capacity in each of those years. See “Item 4. Information on the Company — D. Property, Plants and Equipment.”
Our hydroelectric generation was 25,143 GWh, 25,604 GWh, and 23,690 GWh in 2020, 2019, and 2018, respectively. In 2020, our hydroelectric generation decreased by 1.8% compared to 2019, primarily due to adverse hydrological conditions in Colombia.
In the countries where we operate, hydrological conditions can range from very wet to extremely dry. There is a wide range of possible hydrological conditions between these two extremes, and their final effect on us often depends on accumulated hydrology. For instance, a new year with drought conditions has a smaller impact on us if it follows several abundant rainfall periods instead of exacerbating a prolonged drought. Likewise, an excellent hydrological year has a smaller effect after several wet years than after a prolonged drought.
In Argentina, the months that typically have the most precipitation are May through August. The months when snow and ice in the mountains melt at higher levels is during the warmer months, from October through December, providing water flow to the Collón Curá and Limay Rivers, which feed El Chocón’s reservoir and hydroelectric plant, located in southwestern Argentina, in the Comahue region. Therefore, depending on weather conditions, water availability can peak during two seasons in a year, both winter and summer.
Brazil has several river basins with waterfalls used for hydroelectric generation. Most of Brazil’s rivers are fed primarily from rainfall. Due to its tropical weather, precipitation is concentrated chiefly in the summer months, from November through May, and it is the lightest during the winter months. These hydrological conditions prevail in southern Brazil at the Paranaiba River at the Parana basin, where our Cachoeira Dourada and EGP Volta Grande hydroelectric plants are located.
Hydrological conditions in Colombia vary significantly throughout the different regions and depend on geographical conditions and topography. There are two rainfall patterns. One pattern is characterized by two rainy periods separated by a drier season. The Andean region in the center of the country is one of the most populated areas and the center of economic activity. It is where all our hydroelectric plants, except the Guavio plant, are located. The second pattern is characterized by a rainy season followed by a drier season in the Orinoquia region, in eastern Colombia, where our largest hydroelectric plant, Guavio (1,260 MW), is located.
Hydrological conditions in Peru also vary significantly depending on the location. The coast, which concentrates most of the population and economic activity, typically has less rainfall than the rest of the country. In the Andean mountains, rainfall is most abundant from December through March, providing flow to the Rimac River basin, feeding five of our seven hydroelectric plants. The jungle area also has most of its rainfall in the same period but with greater intensity, providing the Tarma and Tulumayo River basins, where our other two hydroelectric plants are located.
We generally classify our hydrological conditions as either dry or wet, although there are several other intermediate scenarios. Extreme hydrological conditions may materially affect our operating results and financial conditions. However, it is difficult to calculate the effects of hydrology on our operating income without considering other factors. Our operating income can only be explained by looking at a combination of factors.
112
Hydrological conditions affect electricity market prices, generation costs, spot prices, tariffs, and the mix of conventional hydroelectric, thermal, or renewable generation. The market operator is constantly defining the mix to minimize the operating cost of the entire system. Hydroelectric and renewable generation are almost always the least expensive generation technologies and typically have a marginal cost close to zero. However, authorities might assign an opportunity cost for the use of reservoir water, which may lead to hydroelectric generation not necessarily being the lowest marginal cost at a particular time. The thermal generation cost does not depend on hydrological conditions but international commodity prices for LNG, coal, diesel, and fuel oil.
Spot prices primarily depend on hydrological conditions and commodity prices and, to a lesser extent, on renewable generation availability. Under most circumstances, abundant hydrological conditions decrease spot prices, while dry conditions usually increase spot prices. Spot market prices affect our results because we must purchase electricity in the spot market when our contracted energy sales are more than our generation. We sell electricity in the spot market when we have electricity surpluses.
Hydrological conditions do not have an isolated effect but need to be evaluated in conjunction with other factors to understand the impact on our operating results better. Many different factors may affect our operating income, including the level of contracted sales, purchases and sales in the spot market, commodity prices, energy demand, technical and unforeseen problems that can affect the availability of our thermal power plants, location of power plants in relation to urban demand centers, and transmission system conditions, among others.
Argentina operates under a regulated market, with a defined tariff or remuneration scheme and no energy and commodity trading. The system defines the regulated remuneration of generation companies, which provides compensation based on fixed and variable costs and additional operational and maintenance costs. Market prices are unrelated to hydrological conditions or commodity prices. There is a small spot market (around 3.9 TWh, or 3%, of total demand per year during 2020 and 2019) because free bilateral trading has been suspended since 2013. Therefore, El Chocón sells most of its energy to the market operator at the regulated price, which is not affected by hydrological conditions. Our results depend mainly on our electricity generation. Hydrological conditions during 2020 were better than in 2019. In 2019, El Chocón’s generation decreased compared to 2018, primarily due to worse hydrological conditions in the Limay River. Costanera and Dock Sud are thermal power plants, and their operating results depend on their thermal generation rather than hydrology.
In Brazil, there is an electricity reallocation mechanism that provides financial protection against hydrological risks for hydroelectric generators. The market operator defines which hydroelectric plants generate electricity to minimize the system cost. The generators with deficits buy energy from the generators with surpluses at a specified price with a marginal operating cost set annually by ANEEL. All hydroelectric generators that participate in the Electricity Reallocation Mechanism (“MRE” in its Portuguese acronym) participate in the overall hydroelectric generation dispatched in proportion to their assured energy, regardless of their contracted sales. In 2020, the hydroelectric generation of Cachoeira Dourada and EGP Volta Grande increased compared to 2019 due to better hydrological conditions. The same situation occurred in 2019 compared to 2018.
Fortaleza is a thermal plant, and its results depend mainly on its thermal generation, generation costs, energy purchase costs, and commercial policy. Fortaleza’s results decreased in 2020 compared to 2019, mainly due to lower physical sales due to lower demand in the market, primarily due to the Covid-19 pandemic.
Fortaleza’s results in 2019 improved considerably compared to 2018 due to the restitution of gas supply that Petrobras suspended in February 2018. Their results for 2018 were affected by a dispute with Petrobras regarding a Gas Supply Agreement (“GSA”), following Petrobras’ suspension of gas deliveries in February 2018. From December 11, 2018, to August 28, 2020, the GSA was in force as result of Fortaleza’s legal injunction. In August 2020, Petrobras and Fortaleza reached an agreement with respect to the disputes.
In Colombia, the hydrological conditions of the rivers that supply the Emgesa hydroelectric plants in 2020 were less favorable than in 2019, mainly as a result of lower water inputs from the Betania and Bogotá rivers. However, despite the lower physical sales due to lower demand in the regulated market as a result of the Covid-19 pandemic, these were offset by higher operating income and better average sales prices compared to 2019, caused by lower hydrology in 2020 (COP$ 238 per KWh, in 2020 approximately 5.3% higher than in 2019).
113
In Colombia, the hydrological conditions of the rivers that supply Emgesa hydroelectric power plants in 2019 were more favorable than in 2018, mainly due to the more significant water contributions from the Betania and Bogotá Rivers. The average energy spot price during 2019 was COP$ 226 per KWh, approximately 95 % higher than in 2018.
In Peru, hydrology and prices in the Rímac and Tarma River basins in 2020 remained similar compared to 2019.
In Peru, hydrology in the Rímac and Tarma River basins was normal in 2019, with stable flows similar to those in 2018. Spot energy prices rose approximately 2% on average compared to 2018. In 2018, hydrology in the Rímac River basin was normal, with flows close to the historical average. On the other hand, the Tulumayo River, where our Chimay power plant is located, performed better in 2018, ending the year with very humid conditions.
b.Distribution Business
Our electricity distribution business is carried out in Argentina through Edesur; in Brazil through Enel Distribution Rio, Enel Distribution Ceara, Enel Distribution Goias, and Enel Distribution Sao Paulo; in Colombia through Codensa; and in Peru through Enel Distribution Peru. For the year ended December 31, 2020, electricity sales decreased by 4.0% compared to 2019, totaling 115,213 GWh, mainly due to lower physical sales at Enel Distribution Sao Paulo, Enel Distribution Ceara, and Enel Distribution Rio, offset by higher physical sales at Enel Distribution Goias. Our distributors serve the major cities of South America, providing electricity to almost 26 million customers. These companies face an increasing electricity demand, partly due to population growth and higher consumption, which requires continuous investment.
Distribution revenues are mainly derived from the resale of electricity purchased from generators. Revenues associated with distribution include the recovery of the cost of electricity purchased and the resulting revenues from the “Value Added from Distribution,” or VAD, plus the physical energy losses permitted by the regulator. Other revenues derived from our distribution services consist of transmission revenues, charges for new connections, and the maintenance and rental of meters, among others. It also includes revenues from public lighting, infrastructure projects mainly associated with real estate development, and energy efficiency solutions, including air conditioning equipment and LED lights.
Although these other revenue sources have increased, the core business continues to be the distribution of energy at regulated prices. Therefore, the regulatory framework has a substantial impact on our distribution business results, especially when the actions adopted by government authorities define or directly intervene with regulated customer tariffs or affect the price at which distributors can buy their energy. Our ability to purchase electricity relies heavily on generation availability and, to a lesser degree, regulation. Also, we are focusing on reducing physical losses, principally due to illegally tapped energy, especially in Brazil and Argentina, and improving our collection indices and efficiency, primarily through new automation technologies.
c.Selective Regulatory Developments
The regulatory framework governing our businesses in the countries where we operate has a material effect on our operating results. In particular, regulators set (i) energy prices in the generation business, considering factors such as fuel costs, reservoir levels, exchange rates, future investments in installed capacity, and demand growth, and (ii) distribution considering the costs of energy purchases paid by distribution companies (which distribution companies pass on to their customers) and the VAD, all of which are intended to reflect investments and operating costs incurred by distribution and generation companies, and allow our companies to earn a regulated level of return on their investments and guarantee service quality and reliability. Our electricity subsidiaries’ earnings are primarily determined by regulators, mainly through the tariff setting process. In Argentina, SEE Resolution No. 19/2017 set a U.S. dollar remuneration scheme for existing power generators (converted into Argentine pesos at the exchange rate published by the Argentine Central Bank), defining a minimum remuneration for power by technology and scale. On February 28, 2019, SRR and ME Resolution No. 1/2019 replaced SEE Resolution No. 19/2017, establishing the current guidelines for the remuneration of existing generation plants. On February 27, 2020, the Department of Energy published Resolution SE 31/2020, which replaced SRR and ME Resolution No. 1/2019, effective from February 1, 2020. Under this resolution, remuneration prices are subject to be remunerated in Argentine pesos at the exchange rate of Ar$ 60 per U.S. dollar and the resolution established updated values in Argentine pesos. Resolution SE 31/2020 defines a minimum remuneration based on the generator units’ scale and technology and according to actual availability. Additionally, for thermal units, it establishes the possibility of offering commitments of availability with equal differential remuneration for all
114
technologies. CAMMESA will enable the thermal generator to file, up to 30 days before the beginning of each quarterly period, the power value to be committed to by each unit, differentiating among summer, winter, and the remainder of the year (adjustments can be made within the same period). The remuneration that a unit with power commitment will receive will be proportional to its compliance with its commitment, and the minimum value is calculated based on the minimum price. The power remuneration will be affected depending on the usage factor of thermal generation equipment.
In 2020, the Province of Buenos Aires asked the Argentine Ministry of the Economy to initiate a bid process to correct the situation related to the electricity supply in low-income neighborhoods between October 2017 and December 2020. On December 22, 2020, the Argentine Ministry of the Economy and the Secretariat of Energy, the ENRE, Edesur, and other distribution companies in Argentina signed an agreement to create a mechanism to pay off debt corresponding to the framework agreement for the period, while the companies assume the commitment to allocate the funds to electric service works and maintain the network that supplies these neighborhoods with collective meters and other sensitive zones in the concession areas. According to the applicable regulations, this does not imply or extend downstream responsibility for those joint meters. In December 2020, Ar$ 1.5 billion (US$ 17.842 million) were recorded in Other revenues through this agreement. In 2019, new rate adjustments were made in our distribution subsidiaries. In Argentina, as a result of the regulatory agreement signed between Edesur and the Argentine government, the reciprocal claims that originated in the transition period 2006-2016 were settled, which meant recognizing US$ 203 million in results for 2019.
In Brazil, on March 10, 2020, ANEEL approved the tariff adjustment of Enel Distribution Rio, effective as of March 15, 2020. As a result, the average adjustment increased by 2.71% for consumers overall, including an average adjustment of 3.38% for medium- and high-voltage consumers, and 2.48% for low-voltage consumers.
On April 14, 2020, ANEEL approved the tariff adjustment of Enel Distribution Ceara. As a result, the rate increased 3.94% on average for all consumers, including an average adjustment of 4.00% for medium- and high-voltage consumers, and 3.78% for low-voltage consumers. The regulator entity postponed the tariff increases for the next three months due to the economic emergency created by the Covid-19 pandemic and to protect captive customers. The tariffs will be remain unchanged until June 30, 2020, and will be adjusted on July 1, 2020.
The loss of revenue due to the non-application of the new tariffs from April 14, 2020 through June 30, 2020 was compensated with a delay in the payment of the CDE installments for May, June, and July 2020. Those payments were duly adjusted by the Selic rate (Brazil’s federal funds rate) and will be re-adjusted and made to the CDE fund for Enel Ceara in up to 5 equal installments starting from August 2020. Lastly, the difference in revenue between the approved tariff and extended tariff was adjusted by the market up to June 30, 2020 and considered in the subsequent tariff process.
On June 30, 2020, ANEEL approved the tariff adjustment of Enel Distribution Sao Paulo, effective in July 2020, resulting in a rate increase of 4.20% on average for all consumers, including an average adjustment of 6.00% for medium- and high-voltage consumers, and 3.58% for low-voltage consumers.
On October 20, 2020, ANEEL approved the rate adjustment of Enel Distribution Goias, effective as of October 22, 2020. The result led to a rate increase of 4.3% on average for all consumers, including an average adjustment of 6.6% for medium- and high-voltage consumers, and 3.4% for low-voltage consumers.
In Brazil, Enel Distribution Rio underwent a new tariff process that took effect from April 2019 to March 2020. The applied rate increased 7.6% on average for all consumers, 7.5% for low-voltage consumers, and 7.9% for medium- and high-voltage consumers. In October 2019, ANEEL approved an adjustment for Enel Distribution Goias. The effective rate decreased 3.9% on average for all consumers, 2.9% for high-voltage consumers, and 4.3% for low-voltage consumers.
For additional information relating to the regulatory frameworks in the countries where we operate, see “Item 4. Information on the Company — B. Business Overview — Electricity Industry Regulatory Framework.”
d.Economic Conditions
Macroeconomic conditions, such as economic growth or recession, changes in employment levels, and inflation or deflation in the countries where we operate, may significantly affect our operating results. The variation of a local currency against the U.S. dollar may impact our operating results, as well as our assets and liabilities. For example, a
115
devaluation of local currencies against the U.S. dollar increases capital expenditure plans and the cost of servicing U.S. dollar debt. For additional information, see “Item 3. Key Information — D. Risk Factors — South American economic fluctuations, political instability, and corruption scandals may affect our results of operations, financial condition, and the value of our securities.” and “—Foreign exchange risk may unfavorably affect our results and the U.S. dollar value of dividends payable to ADS holders.”
Local Currency Exchange Rate
Variations in the parity of the U.S. dollar and the local currency in each of the countries in which we operate may impact our operating results and overall financial position. The impact will depend on the level at which tariffs are pegged to the U.S. dollar, U.S. dollar-denominated assets and liabilities, and the translation of our foreign subsidiaries’ financial statements for consolidation purposes in the presentation currency, which is the U.S. dollar.
As of December 31, 2020, our consolidated debt totaled US$ 6,090 million (including US$ 2,527 million from Enel Brasil), of which 31.8% was denominated in reais, 29.4% in U.S. dollars, 28.4% in Colombian pesos, 10.3% in soles, 0.2% in Chilean pesos (including UF), and none in Argentine pesos.
The following table sets forth the closing and average local currencies per U.S. dollar exchange rates for the years indicated:
| | | | | | | | | | | | |
| | Local Currency U.S. Dollar Exchange Rates | ||||||||||
| | 2020 | | 2019 | | 2018 | ||||||
|
| Average |
| Year End |
| Average |
| Year End |
| Average |
| Year End |
Argentina (Argentine pesos per U.S. dollar) | | 84.07 | | 84.15 | | 47.91 | | 59.89 | | 36.54 | | 37.70 |
Brazil (Brazilian reais per U.S. dollar) | | 5.16 | | 5.20 | | 3.94 | | 4.03 | | 3.65 | | 3.87 |
Colombia (Colombian pesos per U.S. dollar) | | 3,693.52 | | 3,432.50 | | 3,279.12 | | 3,277.14 | | 2,952.39 | | 3,249.75 |
Peru (Peruvian soles per U.S. dollar) | | 3.50 | | 3.62 | | 3.34 | | 3.32 | | 3.29 | | 3.38 |
Chile (Chilean pesos per U.S. dollar) | | 790.92 | | 710.95 | | 702.63 | | 748.74 | | 640.29 | | 694.77 |
Sources: Central Bank of each country
The following table sets forth the effect recognized as “Foreign currency translation gains (losses)” in our consolidated statements of comprehensive income for translating the financial statements of our foreign subsidiaries for consolidation purposes to the presentation currency, which is the U.S. dollar:
| | | | | | |
| | Foreign currency translation gains (losses) | ||||
|
| 2020 |
| 2019 |
| 2018 |
| | in thousands of US$ | ||||
Argentina | | (356,295) | | (163,865) | | (631,105) |
Brazil | | (1,646,889) | | (295,801) | | (668,638) |
Colombia | | (77,416) | | (235,692) | | (184,701) |
Peru | | (169,315) | | (69,775) | | (90,110) |
Chile | | — | | 128 | | (580) |
Total | | (2,249,915) | | (765,005) | | (1,575,134) |
The financial statements of foreign companies with functional currencies other than the U.S. dollar are translated as follows: (i) for assets and liabilities, the exchange rate on the closing date of the financial statements is used; (ii) for items in the comprehensive income statement, the average exchange rate for the period is used; (iii) equity remains at the historical exchange rate from the date of acquisition or contribution; and (iv) for retained earnings, the average exchange rate at the date of origination is used. However, in Argentina, due to the country’s recognition as a hyperinflationary economy, the treatment is different, as explained in further details below.
Calculation of the appreciation or devaluation of foreign currencies against the U.S. dollar for one period with respect to the previous one is made by determining the percentage change between the reciprocals of the values of the U.S. dollar per any given foreign currency. It is a measure of the percent change between the two periods in the amount of foreign currency needed to exchange for one U.S. dollar. A positive percent change means that the foreign currency
116
appreciated with respect to the U.S. dollar. A negative percent change implies that the foreign currency depreciated with respect to the U.S. dollar.
The following table shows the appreciation or depreciation of 2020 versus 2019 and 2019 versus 2018 for the closing and average local currencies per U.S. dollar.
| | | | | | | | |
| | Appreciation/(Depreciation) per U.S. dollar (in %) | ||||||
| | 2020/2019 | | 2019/2018 | ||||
|
| Average |
| Year End |
| Average |
| Year End |
Argentine pesos | | (43.0) | | (28.8) | | (23.7) | | (37.1) |
Brazilian reais | | (23.6) | | (22.4) | | (7.4) | | (3.9) |
Colombian pesos | | (11.2) | | (4.5) | | (10.0) | | (0.8) |
Peruvian soles | | (4.6) | | (8.5) | | (1.6) | | 1.9 |
Chilean pesos | | (11.2) | | 5.3 | | (8.9) | | (7.2) |
When the impacts of the appreciation or depreciation are significant, they are disclosed and explained in the analysis of results of operations below.
Hyperinflation in Argentina
Since July 2018, the Argentine economy has been considered a hyperinflationary economy according to the criteria set out in the International Accounting Standard (IAS) 29, “Financial Information on Hyperinflationary Economies (“IAS 29”).” This determination was carried out based on qualitative and quantitative criteria that include an accumulated inflation rate of over 100% in three years.
The general price indices as of December 31, 2018, 2019, and 2020 are as follows:
| | | |
| | General Price Index | |
From January to December 2018 | | 47.83 | % |
From January to December 2019 | | 53.64 | % |
From January to December 2020 | | 36.13 | % |
As of December 31, 2018, the first application of IAS 29 resulted in a positive adjustment to Enel Américas’ retained earnings of US$ 961.1 million (net of taxes) as of January 1, 2018, of which US$ 668.7 million was attributable to the shareholders of Enel Américas. On the other hand, for the year ended December 31, 2020, the application of this standard resulted in a pre-tax gain on the indexation of assets and liabilities of US$ 76.7 million (US$ 124.5 million and US$ 270.4 million at year-end 2019 and 2018, respectively). See Note 33 of the notes to our consolidated financial statements.
For consolidation purposes and as a result of the application of IAS 29, the results and the financial situation of our Argentine subsidiaries were converted to Argentine pesos at the closing exchange rate (Ar$/US$) as of December 31, 2020, and 2019, under IAS 21 “Effects of variations in foreign currency exchange rates” when referring to a hyperinflationary economy. Previously, the results of our Argentine subsidiaries were converted at an average exchange rate for the period, as is the case for the translation of the results for our subsidiaries in other countries whose economies are not considered hyperinflationary.
Considering that our presentation and functional currency do not correspond to a hyperinflationary economy according to the IAS 29 guidelines, restating comparative periods is not required in our consolidated financial statements.
Our Argentine operations do not affect our consolidated liquidity. Our Argentine cash and cash equivalents were US$ 139.4 million as of December 31, 2020, which represents 9.3% of our total cash and cash equivalents. Of the Argentine cash and cash equivalents, 47% is denominated in local currency, and 53% is denominated in U.S. dollars.
117
e.Critical Accounting Policies
Critical accounting policies reflect significant judgments and uncertainties, which would potentially result in materially different results under different assumptions and conditions. We believe that our most critical accounting policies regarding the preparation of our combined financial statements under IFRS are described below.
For further detail of the accounting policies and the methods used to prepare the consolidated financial statements, see Notes 2 and 3 of the Notes to our consolidated financial statements.
Impairment of Non-Financial Assets
From time to time, principally at the end of each fiscal year, we evaluate whether there is any indication that an asset has become impaired. Should any such evidence exist, we estimate the recoverable amount of that asset to determine the impairment loss. In the case of identifiable assets that do not generate cash flows independently, we estimate the recoverability of the asset’s cash-generating unit, which is understood to be the smallest identifiable group of assets that produces independent cash inflows.
Notwithstanding the preceding paragraph, in the case of cash-generating units to which goodwill or intangible assets with an indefinite useful life have been allocated, a recoverability analysis is performed routinely at the end of each period.
The criteria used to identify the cash-generating units are in line with our management’s strategic and operational vision, within the specific characteristics of the business, the operating rules and regulations of the market in which we operate, and the corporate organization.
The recoverable amount is the greater of (i) the fair value, less the cost needed to sell the asset, and (ii) the value in use, which is defined as the present value of the estimated future cash flows. To calculate the recoverable value of property, plant, and equipment, goodwill, and intangible assets that form part of a cash-generating unit, we use the value in use criteria in practically all cases.
To estimate the value in use, we prepare future pre-tax cash flow projections based on the most recent budgets available. These budgets incorporate management’s best estimates of cash-generating units’ revenues and costs using sector projections, experience, and future expectations.
In general, these projections cover the next three years, estimating cash flows for future years by applying reasonable growth rates, between 2.5% and 12.8%, and a unique growth rate for the entire forecasted period that is in line with the average long-term growth rates for the electricity sector in the countries where we operate. At the end of December 2020, projects cash flows were extrapolated using an annual growth rate of between 10.1% and 12.8% for Argentina, 3.5% for Brazil, 2.5% for Peru, and 3.0% for Colombia.
Future cash flows are discounted to calculate their present value at a given pre-tax rate that covers the cost of capital for the business and country. The discount rate is calculated considering the current time value of money and the risk premiums generally used by market analysts for the specific business activity and the country involved.
The pre-tax nominal discount rates applied in 2020, 2019, and 2018 are as follows:
| | | | | | | | | | | | | | |
| | | | Year ended December 31, | ||||||||||
| | | | 2020 | | 2019 | | 2018 | ||||||
Country |
| Currency |
| Minimum |
| Maximum |
| Minimum |
| Maximum |
| Minimum |
| Maximum |
| | | | (in %) | ||||||||||
Argentina | | Argentine peso | | 35.8 | | 63.4 | | 24.7 | | 50.6 | | 22.9 | | 36.4 |
Brazil | | Brazilian real | | 9.6 | | 40.2 | | 10.1 | | 23.4 | | 9.1 | | 21.3 |
Colombia | | Colombian peso | | 7.4 | | 11.1 | | 7.6 | | 12.9 | | 7.9 | | 12.9 |
Peru | | Peruvian sol | | 8.7 | | 10.5 | | 8.7 | | 11.8 | | 7.2 | | 12.1 |
118
If the recoverable amount of the cash-generating unit is less than the net carrying amount of the asset, the corresponding impairment loss provision is recognized for the difference and charged to “Reversal of impairment loss (impairment loss) recognized in profit or loss” in the consolidated statement of comprehensive income.
Impairment losses recognized for an asset in prior periods are reversed when their estimated recoverable amount changes, increasing the asset’s value with a credit to earnings, limited to the asset’s carrying amount if no impairment loss had been recognized for the asset. Impairment losses for goodwill are not reversible.
Litigation and Contingencies
We are currently involved in certain legal and tax proceedings. As discussed in Note 25 of the Notes to our consolidated financial statements, we recognized provisions for legal and tax proceedings in an aggregate amount of US$ 941.1 million as of December 31, 2020. This amount was based on consultations with our legal and tax advisors, who are carrying out our defense in these matters and analyzing potential results, assuming a combination of litigation and settlement strategies.
Hedges of Revenues Directly Linked to the U.S. Dollar
We have established a policy to hedge the portion of our revenues directly linked to the U.S. dollar by obtaining financing in U.S. dollars. Some of our subsidiaries generate these revenues with a functional currency other than the U.S. dollar. Exchange differences related to this debt, as they are cash flow hedge transactions, are charged net of taxes to an equity reserve account that forms part of Other Comprehensive Income. They are recorded as income during the period in which the hedged cash flows are realized. This term has been estimated at ten years.
This policy reflects a detailed analysis of our future revenues directly linked to the U.S. dollar to confirm that hedge accounting is applicable. Such analysis may change in the future due to new electricity regulations limiting the cash flows tied to the U.S. dollar.
Pension and Post-Employment Benefit Liabilities
We have various defined benefit plans for our employees. These plans pay benefits to employees at retirement and use formulas based on years of service and employee compensation. We also offer certain additional benefits for some specific retired employees.
The liabilities shown for the pensions and post-employment benefits reflect our best estimate of the future cost of meeting our obligations under these plans. The accounting applied to these defined benefit plans involves actuarial calculations that contain assumptions, including employee turnover, life expectancy, retirement age, discount rates, the future level of employee compensation and benefits, the claims rate under medical plans, and future medical costs. These assumptions change as economic and market conditions vary, and any change in any of these assumptions could have a material effect on the reported results from operations.
The effect of an increase of 100 basis points in the discount rate used to determine the present value of the post-employment defined benefits would decrease the liability by US$ 319.4 million and US$ 436.8 million, as of December 31, 2020, and 2019, respectively. The effect of a decrease of 100 basis points in the rate used to determine the present value of the post-employment defined benefits would increase the liability by US$ 379.7 million and US$ 521.9 million, as of December 31, 2020, and 2019, respectively.
Revenues and expense recognition
Revenues are recognized when the control over a good or service is transferred to the customer. Revenues are measured based on the entitled amount upon the transfer of control, excluding the amounts collected on behalf of third parties.
We analyze and consider all the relevant facts and circumstances for revenue recognition, applying the five-step model established by IFRS 15: 1) identifying the contract with a customer; 2) identifying the performance obligations; 3) determining the transaction price; 4) allocating the transaction price; and 5) recognizing revenue.
119
The following are the criteria for revenue recognition by type of good or service that we provide:
| (i) | Electricity supply (sale and transportation): Corresponds to a single performance obligation that transfers to the customer several different goods/services that are substantially the same and have the same transfer pattern. Since the customer receives and simultaneously consumes the benefits provided by the Company, it is considered a performance obligation met over time. In these cases, we apply an output method to recognize revenue in the amount to which it is entitled to bill for electricity supplied to date. |
| a) | Generation: Revenue is recorded according to the physical deliveries of energy and power, at the prices established in the respective contracts, at the prices stipulated in the electricity market by the current regulations, or at the marginal cost of energy and power, depending on whether unregulated customers, regulated customers, or energy trading in the spot market are involved, respectively. |
| b) | Distribution of electricity: Revenue is recognized based on the amount of energy supplied to customers during the period, at prices established in the respective contracts or at prices stipulated in the electricity market by applicable regulations, as appropriate. |
These revenues include an estimate of the service provided and not invoiced as of the balance sheet’s date. See Notes 2.3 and 28 of the Notes to our consolidated financial statements.
| (ii) | Other Services: Mainly the provision of supplementary services to the electricity business, construction of works, and engineering and consulting services. Customers control committed assets as they are created or improved. Therefore, the Company recognizes this revenue over time, based on the progress, measuring progress through output methods (performance completed to date, milestones reached, etc.), or costs incurred (resources consumed, hours of labor spent, etc.), as appropriate in each case. |
| (iii) | Sale of goods: Revenue from the sale of goods is recognized at a particular time when control of the goods has been transferred to the client, which generally occurs at the time of the physical delivery of the goods. Revenues are measured at the independent sale price of each good and any type of appropriate variable compensation. |
In contracts in which multiple committed goods and services are identified, the recognition criteria will be applied to each of the identifiable performance obligations of the transaction, based on the control transfer pattern of each good or service that is separate and an independent selling price allocated to each of them, or two or more transactions jointly, when these are linked to contracts with customers that are negotiated with a single commercial purpose and the goods and services committed represent a single performance obligation, and their selling prices are not independent.
Enel Américas determines the existence of significant financing components in its contracts, adjusting the value of the consideration if applicable and reflecting the effects of the time value of money. However, we apply the practical solution provided by IFRS 15. It will not adjust the value of the consideration committed for a significant financing component if it expects, at the beginning of the contract, that the period between the payment and the transfer of goods or service to the customer is one year or less.
We exclude the gross revenue of economic benefits received when acting as an agent or broker on behalf of third parties from the revenue figure. We only record as revenue the payment or commission to which we expect to be entitled.
Given that we mainly recognize revenue for the amount to which we have the right to invoice, we have decided to apply the practical disclosure solution provided in IFRS 15, through which it is not required to disclose the aggregate amount of the transaction price allocated to the obligations of performance not met (or partially not met) at the end of the reporting period.
Also, we evaluate the existence of incremental costs of obtaining a contract and costs directly related to the fulfillment of a contract. These costs are recognized as an asset if their recovery is expected with the transfer of the related goods or services and amortized in a manner consistent with the transfer of the related goods or services. The incremental costs of obtaining a contract are recognized as expenses if the depreciation period of the asset that has been recognized is one year or less. Costs that do not qualify for capitalization are recognized as expenses incurred unless they are explicitly attributable to the customer.
120
As of December 31, 2020, and 2019, we had not incurred costs to obtain or fulfill a contract that met the conditions for such capitalization. The expenses incurred to gain a contract are substantially commission payments for sales that, even though they are incremental costs, are related to short-term contracts or performance obligations met at a particular time. Therefore, we would recognize these costs as an expense if they occurred.
Interest revenue (expenses) is recorded considering the effective interest rate applicable to the principal with pending amortization during the corresponding accrual period.
Income taxes
Income tax expense for the period is determined as the sum of current taxes from each of our subsidiaries and results from applying the tax rate to the taxable income for the period after permitted deductions have been made, plus any changes in deferred tax assets and liabilities and tax credits, both for tax losses and deductions. Differences between the carrying amount and tax basis of assets and liabilities generate deferred tax assets and liabilities, which are calculated using the tax rates expected to apply when the assets and liabilities are realized or settled, based on tax rates that have been enacted or substantively enacted by the end of the reporting period.
Deferred tax assets are recognized for all temporary deductible differences, tax losses, and unused tax credits to the extent that it is probable that sufficient future taxable profits exist to recover the temporary deductible differences and make use of the tax credits. Such deferred tax asset is not recognized if the temporary deductible difference arises from the initial recognition of an asset or liability that:
| ● | did not arise from a business combination; and |
| ● | at initial recognition affected neither accounting profit nor taxable profit (loss). |
Concerning temporary deductible differences associated with investments in subsidiaries, associates, and joint arrangements, deferred tax assets are recognized only to the extent that it is probable that the temporary differences will reverse in the foreseeable future, and taxable profits will be available against which the temporary differences can be utilized.
Deferred tax liabilities are recognized for all temporary differences, except those derived from the initial recognition of goodwill and those that arose from investments in subsidiaries, associates, and joint ventures in which we can control their reversal and in which it is probable that they will not be reversed in the foreseeable future.
Current tax and changes in deferred tax assets or liabilities are recorded in profit or loss or equity, depending on where the gains or losses that triggered these tax entries have been recognized.
Any tax deductions that can be applied to current tax liabilities are credited to earnings within the line item “Income tax expenses,” except when there is uncertainty about their tax realization, in which case they are not recognized until effectively realized or in connection with specific tax incentives, in which case they are recorded as government grants.
At the end of each reporting period, we review the deferred tax assets and liabilities recognized and make, if any, necessary corrections based on the results of this analysis.
Deferred tax assets and deferred tax liabilities are offset in the consolidated statement of financial position if we have a legally enforceable right to set off current tax assets against current tax liabilities, and only when the deferred taxes relate to income taxes levied by the same taxation authority.
Impairment of financial assets
Under IFRS 9 Financial Instruments, we apply an impairment model based on expected credit losses based on our history, existing market conditions, and prospective estimates at the end of each reporting period. The new impairment model is applied to financial assets measured at amortized cost or fair value through other comprehensive income, except for investments in equity instruments.
121
The expected credit loss, determined considering Probability of Default (PD), Loss Given Default (LGD), and Exposure at Default (EAD), is the difference between all cash flows that are owed under the contract and all the cash flows that are expected to be received (that is, all cash deficiencies), discounted at the original effective interest rate.
To determine the expected credit losses, we apply two separate approaches:
| ● | General approach: Applied to financial assets other than trade accounts receivable, contractual assets, or lease receivables. This approach is based on evaluating significant increases in the credit risk of financial assets from the date of initial recognition. If the credit risk has not increased significantly on the date of issuance of the financial statements, the impairment losses are measured by reference to the expected credit losses in the next 12 months. If, on the other hand, the credit risk has increased significantly, the impairment is measured considering the expected credit losses for the lifetime of the asset. In general, the measurement of expected credit losses under the general approach is performed individually. |
| ● | Simplified approach: Applied to trade receivables, contract assets, and lease receivables. The impairment provision is consistently recognized by reference to the expected credit losses for the asset’s lifetime. This approach is most commonly applied since trade receivables represent the principal financial asset of Enel Américas and our subsidiaries. |
For trade accounts receivable, contractual assets, and accounts receivable for lease, we apply two types of evaluations of expected credit losses:
| ● | Collective evaluation: Based on grouping accounts receivable into specific groups or “clusters,” considering each business and the local regulatory context. Accounts receivable are grouped according to the characteristics of client portfolios in terms of credit risk, maturity information, and recovery rates. A specific definition of default is considered for each group. |
| ● | Analytical or individual evaluation: If accounts receivable are considered individually significant by management, and there is specific information on any significant increase in credit risk, we apply an individual evaluation of accounts receivable. For the individual evaluation, the PD is generally obtained from an external provider. |
Based on the reference market and the regulatory context of the sector, as well as the recovery expectations after 90 days, for such accounts receivable, we mainly apply a default definition after 180 days after maturity to determine the expected credit losses, since this is considered an effective indicator of a significant increase in credit risk.
To measure the expected credit losses collectively, we consider the following assumptions:
| (i) | PD: average default estimate, calculated for each group of trade accounts receivable, taking into account a minimum of 24-month historical data. |
| (ii) | LGD: calculated based on the recovery rates of a predetermined section, discounted at the effective interest rate; and |
| (iii) | EAD: accounting exposure on the date of the financial report, net of cash deposits, including invoices issued but not due, and invoices to be issued. |
The prospective adjustment can be applied based on specific management evaluations, considering qualitative and quantitative information to reflect possible future events and macroeconomic scenarios affecting the portfolio risk or the financial instrument.
Recent Accounting Pronouncements
Please see Note 2.2 of the Notes to our consolidated financial statements for additional information regarding recent accounting pronouncements.
122
2. | Analysis of Results of Operations for the Years Ended December 31, 2020, and 2019. |
Consolidated Revenues and other operating income
Generation and Transmission Business
The following table sets forth the electricity sales of our subsidiaries and the corresponding changes for the years ended December 31, 2020, and 2019:
| | | | | | | | |
| | Electricity sales during the year ended December 31, | ||||||
|
| 2020 |
| 2019 |
| Change |
| Change |
| | (in GWh) | | (in %) | ||||
Costanera (Argentina) | | 6,518 | | 6,210 | | 308 | | 5.0 |
El Chocón (Argentina) | | 2,924 | | 2,528 | | 396 | | 15.7 |
Dock Sud (Argentina) | | 4,461 | | 4,238 | | 223 | | 5.3 |
Cachoeira Dourada (Brazil) | | 19,660 | | 22,890 | | (3,230) | | (14.1) |
Fortaleza (Brazil) | | 3,636 | | 4,742 | | (1,105) | | (23.3) |
EGP Volta Grande (Brazil) | | 2,000 | | 2,370 | | (370) | | (15.6) |
Emgesa (Colombia) | | 17,539 | | 18,376 | | (837) | | (4.6) |
Enel Generation Peru (Peru) | | 9,642 | | 10,541 | | (899) | | (8.5) |
Enel Generation Piura (Peru) | | 616 | | 658 | | (42) | | (6.3) |
Total | | 66,996 | | 72,553 | | (5,558) | | (7.7) |
Distribution Business
The following table sets forth the electricity sales of our subsidiaries, by country, and their corresponding variations for the years ended December 31, 2020, and 2019:
| | | | | | | | |
| | Electricity sales during the year ended December 31, | ||||||
|
| 2020 |
| 2019 |
| Change |
| Change |
| | (in GWh) | | | | (in %) | ||
Edesur (Argentina) | | 15,888 | | 16,798 | | (910) | | (5.4) |
Enel Distribution Rio (Brazil) | | 11,228 | | 11,568 | | (339) | | (2.9) |
Enel Distribution Ceara (Brazil) | | 11,866 | | 12,197 | | (332) | | (2.7) |
Enel Distribution Goias (Brazil) | | 14,469 | | 14,365 | | 104 | | 0.7 |
Enel Distribution Sao Paulo (Brazil) | | 40,350 | | 43,148 | | (2,798) | | (6.5) |
Codensa (Colombia) | | 13,834 | | 14,307 | | (473) | | (3.3) |
Enel Distribution Peru (Peru) | | 7,578 | | 8,211 | | (633) | | (7.7) |
Total | | 115,213 | | 120,594 | | (5,381) | | (4.5) |
123
The following table sets forth the revenues and other operating income by reportable segments and by operating segments within such reportable segments for the years ended December 31, 2020, and 2019:
| | | | | | | | |
| | Year ended December 31, | ||||||
|
| 2020 |
| 2019 |
| Change |
| Change |
| | (in millions of US$) | | (in %) | ||||
Generation and Transmission Business in Argentina | | 231 | | 436 | | (205) | | (47.1) |
Costanera | | 113 | | 214 | | (101) | | (47.2) |
El Chocón | | 49 | | 72 | | (23) | | (32.6) |
Dock Sud | | 66 | | 147 | | (81) | | (54.9) |
Other | | 3 | | 3 | | — | | — |
Generation and Transmission Business in Brazil | | 1,106 | | 778 | | 328 | | 42.2 |
Cachoeira Dourada | | 812 | | 494 | | 318 | | 64.4 |
Fortaleza | | 187 | | 310 | | (123) | | (39.6) |
Cien | | 53 | | 70 | | (17) | | (24.7) |
EGP Volta Grande | | 62 | | 107 | | (45) | | (41.7) |
Other | | (8) | | (203) | | 195 | | (96.1) |
Generation and Transmission Business in Colombia | | 1,159 | | 1,247 | | (88) | | (7.0) |
Emgesa | | 1,159 | | 1,247 | | (88) | | (7.0) |
Generation and Transmission Business in Peru | | 505 | | 596 | | (91) | | (15.3) |
Enel Generation Peru | | 446 | | 519 | | (73) | | (14.1) |
Enel Generation Piura | | 64 | | 82 | | (18) | | (22.1) |
Other | | (5) | | (5) | | — | | — |
Total Generation and Transmission Business reportable segment | | 3,001 | | 3,057 | | (56) | | (1.8) |
| | | | | | | | |
Distribution Business in Argentina | | 801 | | 1,347 | | (546) | | (40.5) |
Edesur | | 801 | | 1,347 | | (546) | | (40.5) |
Distribution Business in Brazil | | 6,735 | | 8,154 | | (1,419) | | (17.4) |
Enel Distribution Rio | | 1,221 | | 1,515 | | (294) | | (19.4) |
Enel Distribution Ceara | | 1,142 | | 1,373 | | (231) | | (16.8) |
Enel Distribution Goias | | 1,392 | | 1,545 | | (153) | | (9.9) |
Enel Distribution Sao Paulo | | 2,980 | | 3,721 | | (741) | | (19.9) |
Distribution Business in Colombia | | 1,547 | | 1,665 | | (118) | | (7.1) |
Codensa | | 1,547 | | 1,665 | | (118) | | (7.1) |
Distribution Business in Peru | | 887 | | 950 | | (63) | | (6.7) |
Enel Distribution Peru | | 887 | | 950 | | (63) | | (6.7) |
Total Distribution Business reportable segment | | 9,970 | | 12,116 | | (2,146) | | (17.7) |
Less: consolidation adjustments and non-core activities | | (778) | | (859) | | 81 | | (9.4) |
Total Revenues and other operating income | | 12,193 | | 14,314 | | (2,121) | | (14.8) |
Generation and Transmission Business: Revenues
In Argentina, revenues and other operating income decreased by US$ 205 million, or 47.1%, primarily explained by:
| (i) | a decrease of US$ 101 million from Costanera, or 47.2%, in 2020 compared to 2019, mainly explained by lower revenues of: |
| a) | US$ 61 million because of Resolution No. 12/2019, which became applicable in 2020, due to the fact that prior to the resolution taking effect, generation companies could buy fuel in the market and sell it to third parties. As a result of the resolution, generation companies must rely on CAMMESA to supply them with fuel.; |
| b) | US$ 46 million as a result of the devaluation of the Argentine peso against the U.S. dollar; and |
124
| c) | US$ 9 million from lower availability contracts, as a result of a regulatory agreement that ended the previous year. |
This decrease in revenues and other operating income was partially offset by higher revenues of:
| d) | US$ 12 million as a result of increased physical sales of 308 GWh, which includes increased rates of US$ 11 million; and |
| e) | US$ 3 million from the implementation of new Resolution No. 31/2020, applicable as of February 2020, which established that energy and power values should be charged in Argentine pesos, using the exchange rate against the U.S. dollar valid at the billing date. |
| (ii) | a decrease of US$ 81 million from Dock Sud, or 54.9%, in 2020 compared to 2019, which is mainly explained by lower revenues of: |
| a) | US$ 55 million mainly because of Resolution No. 12/2019, which became applicable in 2020, due to the fact that prior to the resolution taking effect, generation companies could buy fuel in the market and sell it to third parties. As a result of the resolution, generation companies must rely on CAMMESA to supply them with fuel ; |
| b) | US$ 27 million as a result of the depreciation of the Argentine peso against the U.S. dollar; and |
| c) | US$ 6 million due to an insurance claim recorded during the first half of 2019. |
This decrease in energy revenues was partially offset by:
| d) | an increase of US$ 7 million in energy sales of 223 GWh. |
| (iii) | a decrease of US$ 23 million from Enel Generation El Chocón in 2020 compared to 2019, primarily because of lower revenues of US$ 25 million as a result of the devaluation of the Argentine peso against the U.S. dollar, offset by US$ 2 million higher energy sales of 396 GWh. |
In Brazil, revenues and other operating income increased by US$ 328 million, or 42.2%, primarily explained by the following:
| (i) | physical energy sales from Cachoeira Dourada increased by US$ 318 million, or 64.3%. The increase is mainly explained by: |
| a) | US$ 568 million increase in energy sales explained by: |
| ● | US$ 649 million higher energy imports from Argentina and Uruguay for commercialization; partially offset by |
| ● | US$ 81 million of lower physical sales to the regulated market for 3,230 GWh, at least partly attributable to the Covid-19 pandemic. |
This increase in physical energy sales was partially offset by:
| b) | US$ 250 million less in revenue as a result of the devaluation of the Brazilian real against the U.S. dollar. |
| (ii) | an increase of US$ 195 million in other operating revenues mainly due to sales transactions and energy purchases between our generation companies in Brazil. |
125
These increases in revenues and other operating income were partially offset by:
| (iii) | a decrease of US$ 123 million from Fortaleza, or 39.6%, mainly as a result of: |
| a) | US$ 65 million less in energy sales explained by a contraction in demand, for 1,106 GWh at least partly attributable to the Covid-19 pandemic, and |
| b) | US$ 57 million less in revenue as a result of the devaluation of the Brazilian real against the U.S. dollar. |
| (iv) | a decrease of US$ 45 million from EGP Volta Grande, or 41.7%, mainly explained by: |
| a) | lower energy sales of US$ 25 million, due to a reduction in demand for 370 GWh, at least partly attributable to the Covid-19 pandemic; and |
| b) | US$ 19 million less in revenue due to the devaluation of the Brazilian real against the U.S. dollar. |
| (v) | a decrease of US$ 17 million from Cien, or 24.7%, mainly explained by the devaluation of the Brazilian real against the U.S. dollar. |
In Colombia, revenues and other operating income from Emgesa decreased by US$ 88 million, or 7.0%, in 2020. This decrease is mainly explained by lower revenues of:
| (i) | US$ 142 million as a result of the devaluation of the Colombian peso against the U.S. dollar; |
| (ii) | US$ 5 million due to an insurance compensation received in June 2019 from a claim at the El Quimbo hydroelectric plant; and |
| (iii) | US$ 2 million in gas sales due to lower consumption partly explained by the Covid-19 pandemic. |
These decreases in revenues and other operating income were partially offset by higher revenues of:
| (iv) | US$ 56 million due to better average sales prices (caused by low hydrology in 2020), which contributed to US$ 111 million in revenues, offset by US$ 55 million for lower physical sales (-837 GWh) due to lower unregulated market demand partly caused by the Covid-19 pandemic; and |
| (v) | US$ 5 million related to the sales of carbon credits. |
In Peru, revenues and other operating income from Enel Generation Peru decreased by US$ 91 million, or 15.3%, primarily explained by:
| (i) | a decrease of US$ 73 million from Enel Generation Peru, or 14.1%. This decrease is mainly explained by lower revenues of: |
| a) | US$ 42 million, or 899 GWh, due at least partly to the Covid-19 pandemic; |
| b) | US$ 22 million as a result of the devaluation of the new Peruvian sol against the U.S. dollar; and |
| c) | US$ 10 million from the modifications to outsourcing agreements. |
| (ii) | a decrease of US$ 18 million from Enel Generation Piura, or 22.1%, mainly explained by: |
| a) | US$ 15 million in lower revenues from lower gas sales; and |
| b) | US$ 3 million from the devaluation of the new Peruvian sol against the U.S. dollar. |
126
Distribution Business: Revenues
In Argentina, revenues and other operating income from Edesur decreased by US$ 546 million, or 40.5%, in 2020, which is mainly explained by:
| (i) | US$ 324 million in lower revenues due to the devaluation of the Argentine peso against the U.S. dollar; |
| (ii) | US$ 203 million in lower revenues as a result of the regulatory agreement signed between Edesur and the Argentine government in 2019, which ended outstanding reciprocal claims arising in the 2006-2016 transition period; and |
| (iii) | US$ 51 million due to inflation adjustments from the application of IAS 29. |
These decreases in revenues and operating income were partially offset by higher revenues of:
| (iv) | US$ 18 million from the new 2020 framework agreement between the ENRE and Edesur, to allocate funds to improve electricity service and distribution networks; and |
| (v) | US$ 14 million as a result of better prices due to inflation adjustments. |
In Brazil, revenues and other operating income decreased by US$ 1,419 million in 2020, or 17.4%, explained by:
| (i) | a decrease of US$ 741 million from Enel Distribution Sao Paulo, or 19.9%, explained by: |
| a) | a decrease of US$ 954 million in revenues due to the devaluation of the Brazilian real against the U.S. dollar. |
This decrease in revenues and other operating income was partially offset by:
| b) | an increase of US$ 90 million in energy sales revenues, as a result of US$ 368 million average sales price increase despite lower physical sales of 2.798 GWh, totaling US$ 278 million, due at least partly to the impacts of the Covid-19 pandemic; |
| c) | US$ 67 million increase in other services due to increased average sale prices for toll services; and |
| d) | US$ 56 million higher operating revenues due to the application of IFRIC 12. |
| (ii) | a decrease of US$ 294 million from Enel Distribution Rio, or 19.4%, mainly explained by: |
| a) | US$ 378 million less in revenues as a result of the devaluation of the Brazilian real against the U.S. dollar. |
This decrease in revenues and other operating income was partially offset by an increase of:
| b) | US$ 55 million in revenues from energy sales, mainly from higher average sale prices, due to US$ 98 million inflation adjustments, partially offset by US$ 43 million lower physical energy sales of 340 GWh partly as a result of the Covid-19 pandemic; and |
| c) | US$ 29 million in other operating income, explained by the application of IFRIC 12. |
| (iii) | a decrease of US$ 231 million from Enel Distribution Ceara, or 16.8 %, primarily due to: |
| a) | a decrease of US$ 355 million in revenues as a result of the devaluation of the Brazilian real against the U.S. dollar. |
127
This decrease in revenues and other operating income was partially offset by an increase of:
| b) | of US$ 61 million due to the application of IFRIC 12; |
| c) | US$ 58 million in energy sales mainly due to (i) higher tariff prices, US$ 92 million, offset by (ii) lower physical sales of 331 GWh, or US$ 34 million, as a result at least in part of the Covid-19 pandemic; and |
| d) | US$ 5 million in other services due to energy tolls for unregulated customers in the local market. |
| (iv) | a decrease of US$ 153 million from Enel Distribution Goias, or 9.9%, which is mainly explained by: |
| a) | US$ 431 million as a result of the devaluation of the Brazilian real against the U.S. dollar. |
This decrease in revenues and other operating income was partially offset by an increase of:
| b) | US$ 134 million in other revenues due to the application of IFRIC 12; |
| c) | US$ 123 million in energy sales explained by higher sectoral commissions payable; and |
| d) | US$ 22 million in toll revenues due to a rate adjustment on unregulated customers. |
In Colombia, revenues and other operating income from Codensa decreased by US$ 118 million in 2020, or 7.1 %, mainly explained by:
| (i) | US$ 194 million due to the devaluation of the Colombian peso against the U.S. dollar. |
This decrease in revenues and other operating income was partially offset by higher revenues of:
| (ii) | US$ 44 million in investment recognition income in 2019, paid at higher rates due to a higher regulatory asset base; |
| (iii) | US$ 11 million mainly due to improved profitability in Codensa’s credit card business; |
| (iv) | US$ 6 million for a better average sale price, despite lower physical sales of 473 GWh due partly to the Covid-19 pandemic; |
| (v) | US$ 6 million related to the CREG Resolution 189 in December 2019, which approved the variables necessary to calculate income and charges associated with Codensa’s energy distribution; |
| (vi) | US$ 6 million in electrical projects and other businesses; and |
| (vii) | US$ 3 million in fee increase from the collection of municipal cleaning charges on customer invoices. |
In Peru, operating income from Enel Distribution Peru decreased by US$ 63 million, or 6.7%, principally explained by:
| (i) | US$ 42 million due to the devaluation of the new Peruvian sol against the U.S. dollar; |
| (ii) | US$ 19 million in lower energy sales explained by (i) a decrease in physical sales of 633 GWh, equivalent to US$ 88 million, for lower energy consumption due partly to the Covid-19 pandemic and (ii) an increase of US$ 69 million in average energy prices due to energy power billing; and |
| (iii) | US$ 3 million less in revenues from traditional businesses such as connections, ancillary services, as well as from retail activities and lower contributions to regulating bodies. |
128
Total Operating Costs
Total operating costs consist primarily of energy purchases from third parties, fuel consumption, depreciation, amortization and impairment losses, maintenance costs, tolls paid to transmission companies, employee salaries, and administrative and selling expenses.
The following table sets forth consolidated operating costs for the years ended December 31, 2020, and 2019:
| | | | | | | | |
| | Year ended December 31, | ||||||
|
| 2020 |
| 2019 |
| Change |
| Change |
| | (in millions of US$) | | (in %) | ||||
Energy purchases | | 5,338 | | 6,097 | | (759) | | (12.4) |
Fuel consumption | | 138 | | 277 | | (139) | | (50.3) |
Transportation costs | | 1,016 | | 1,111 | | (94) | | (8.5) |
Other raw materials and combustibles | | 1,064 | | 1,056 | | 8 | | 0.7 |
Other expenses(1) | | 1,065 | | 1,151 | | (85) | | (7.4) |
Employee benefit expense and other(1) | | 418 | | 628 | | (210) | | (33.5) |
Depreciation, amortization and impairment losses(1) | | 1,100 | | 1,225 | | (125) | | (10.2) |
Total Operating Cost | | 10,140 | | 11,545 | | (1,406) | | (12.2) |
| (1) | Corresponds to selling and administration expenses |
129
The following table sets forth our total operating costs (excluding selling and administrative expenses) by reportable segments and by operating segments within such reportable segments for the years ended December 31, 2020, and 2019:
| | | | | | | | |
| | Year ended December 31, | ||||||
|
| 2020 |
| 2019 |
| Change |
| Change |
| | (in millions of US$) | | (in %) | ||||
| | | | | | | | |
Generation and Transmission Business in Argentina | | 19 | | 130 | | (111) | | (85.7) |
Costanera | | 5 | | 69 | | (64) | | (92.8) |
El Chocón | | 5 | | 6 | | (1) | | (24.3) |
Dock Sud | | 10 | | 54 | | (44) | | (81.4) |
Other | | (1) | | 1 | | (2) | | (200.0) |
Generation and Transmission Business in Brazil | | 781 | | 419 | | 362 | | 86.3 |
Cachoeira Dourada | | 666 | | 395 | | 272 | | 68.7 |
Fortaleza | | 119 | | 183 | | (65) | | (35.2) |
Cien | | — | | 1 | | (1) | | (100.0) |
EGP Volta Grande | | 11 | | 43 | | (32) | | (75.5) |
Other | | (15) | | (203) | | 188 | | 92.6 |
Generation and Transmission Business in Colombia | | 413 | | 466 | | (53) | | (11.4) |
Emgesa | | 413 | | 466 | | (53) | | (11.4) |
Generation and Transmission Business in Peru | | 163 | | 204 | | (41) | | (20.2) |
Enel Generation Peru | | 140 | | 178 | | (38) | | (21.2) |
Enel Generation Piura | | 23 | | 28 | | (5) | | (16.3) |
Other | | (1) | | (1) | | — | | — |
Total Generation and Transmission Business reportable segment | | 1,375 | | 1,219 | | 156 | | 12.8 |
| | | | | | | | |
Distribution Business in Argentina | | 530 | | 774 | | (244) | | (31.5) |
Edesur | | 530 | | 774 | | (244) | | (31.5) |
Distribution Business in Brazil | | 4,938 | | 5,820 | | (882) | | (15.2) |
Enel Distribution Rio | | 869 | | 1,029 | | (160) | | (15.5) |
Enel Distribution Ceara | | 835 | | 992 | | (157) | | (15.8) |
Enel Distribution Goias | | 1,027 | | 1,100 | | (73) | | (6.6) |
Enel Distribution Sao Paulo | | 2,206 | | 2,699 | | (493) | | (18.3) |
Distribution Business in Colombia | | 886 | | 962 | | (76) | | (7.9) |
Codensa | | 886 | | 962 | | (76) | | (7.9) |
Distribution Business in Peru | | 599 | | 619 | | (20) | | (3.2) |
Enel Distribution Peru | | 599 | | 619 | | (20) | | (3.2) |
Total Distribution Business reportable segment | | 6,953 | | 8,175 | | (1,222) | | (14.9) |
Less: consolidation adjustments and non-core activities | | (772) | | (853) | | 81 | | (9.5) |
Total operating costs (excluding selling and administrative expenses) | | 7,556 | | 8,541 | | (985) | | (11.5) |
Generation and Transmission Business: Operating Costs
In Argentina, operating costs decreased US$ 111 million, or 85.7%, mainly due to a decreases of:
| (i) | US$ 64 million, or 92.8%, from Costanera, explained mainly by: |
| a) | US$ 59 million in lower gas consumption as a result of the application of Resolution No. 12/2019; |
| b) | US$ 3 million due to lower variable costs in CAMMESA as a result of lower market activity; and |
| c) | US$ 2 million because of the devaluation of the Argentine peso against the U.S. dollar. |
130
| (ii) | US$ 44 million, or 81.4%, from Dock Sud, mainly explained by: |
| a) | lower gas consumption costs of US$ 41 million, as a result of the implementation of Resolution No. 12/2019; and |
| b) | US$ 3 million lower costs as a result of the devaluation of the Argentine peso against the U.S. dollar. |
| (iii) | US$ 1 million, or 24.3%, from El Chocón as a result of the devaluation of the Argentine peso against the U.S. dollar. |
In Brazil, operating costs increased by US$ 362 million, or 86.3%, which is mainly explained by:
| (i) | an increase of US$ 272 million, or 68.8%, from Cachoeira Dourada, mainly explained by: |
| a) | US$ 618 million in energy purchases to cover its obligations in the market. |
This increase in operating costs was primarily offset by:
| b) | US$ 222 million as a result of the devaluation of the Brazilian real against the U.S. dollar; |
| c) | US$ 63 million of lower energy purchases of 3,520 GWh, due to lower customer demand on the regulated market at least partly attributable to the Covid-19 pandemic; partly offset by |
| d) | US$ 61 million favorable impact due to the registration of the Generation Scaling Factor agreement, which allowed renegotiation and the distribution of hydrological risk costs among system operators. |
| (ii) | US$ 188 million, or 92.6%, in other operating costs mainly due to energy purchases and sales transactions between our generation companies in Brazil. |
These increases in operating costs were partially offset by a decrease of:
| (iii) | US$ 65 million, or 35.2%, from Fortaleza mainly due to: |
| a) | US$ 37 million lower costs as a result of the devaluation of the Brazilian real against the U.S. dollar; |
| b) | US$ 24 million reduction in energy purchases of 190 GWh, explained by lower average purchase prices; and |
| c) | US$ 4 million in lower gas consumption due to lower generation in 2020. |
| (iv) | US$ 32 million, or 75.5%, from EGP Volta Grande due to lower energy purchases of 527 GWh explained by lower energy sales at least partly attributable to the Covid-19 pandemic; and |
In Colombia, operating costs from Emgesa decreased by US$ 53 million, or 11.4%, in 2020, mainly due to:
| (i) | US$ 51 million as a result of the devaluation of the Colombian peso against the U.S. dollar; |
| (ii) | US$ 7 million decrease in energy purchases; and |
| (iii) | US$ 4 million in lower gas purchases mainly due to the decrease in customer demand due partly to the Covid-19 pandemic. |
131
These decreases in operating costs were partially offset by:
| (iv) | US$ 5 million in other variable provisions and services mainly due to the new contribution of the National Development Plan to regulatory bodies; and |
| (v) | US$ 4 million increase in transportation expenses. |
In Peru, operating costs decreased by US$ 41 million, or 20.2%, which is primarily explained by a decrease of:
| (i) | US$ 38 million, or 21.2%, from Enel Generation Peru as a result of: |
| a) | US$ 12 million in lower gas transportation and distribution costs; |
| b) | US$ 11 million in lower energy purchases of 419 GWh, explained by a lower marginal cost and the Covid-19 pandemic; |
| c) | US$ 8 million in lower gas consumption due to lower production in thermal power plants; and |
| d) | US$ 7 million lower costs due to the devaluation of the new Peruvian sol against the U.S. dollar. |
| (ii) | US$ 5 million from Enel Generation Piura, or 16.3%, mainly as a result of: |
| a) | lower gas consumption of US$ 3 million, due to lower demand, which resulted in lower production of thermal power plants; and |
| b) | US$ 1 million due to the devaluation of the new Peruvian sol against the U.S. dollar. |
Distribution Business: Operating Costs
In Argentina, operating costs of Edesur decreased by US$ 244 million, or 31.5%, mainly explained by a decrease of:
| (i) | US$ 214 million as a result of the devaluation of the Argentine peso against the U.S. dollar; |
| (ii) | US$ 27 million in energy purchases due to lower market purchase prices of US$ 26 million and US$ 1 million due to increased energy losses from 15.5% as of December 2019 to 18.9% as of December 2020; and |
| (iii) | US$ 10 million in other supply costs, explained by lower rental expenses of equipment. |
These decreases in operating costs were partially offset by:
| (iv) | US$ 8 million in higher transportation costs due to increased service prices in line with the inflation adjustment associated with the application of IAS 29. |
In Brazil, operating costs decreased by US$ 882 million, or 15.2%, in 2020, explained by:
| a) | US$ 682 million as a result of the devaluation of the Brazilian real against the U.S. dollar. |
This decrease in operating costs was partially offset by:
| b) | US$ 86 million in energy purchases from thermal power plants due to higher prices in the last quarter of 2020 as a result of lower hydrology; |
132
| c) | a US$ 56 million increase in variable supply and services due to the application of IFRIC 12; and |
| d) | US$ 47 million in transportation costs. |
| a) | US$ 269 million in lower costs as a result of the devaluation of the Brazilian real against the U.S. dollar; |
This decrease in operating costs was mainly offset by:
| b) | US$ 38 million in higher energy transportation costs due to higher fees for network use; |
| c) | a US$ 37 million increase in other variable supplies and services due to US$ 29 million related to the application of IFRIC 12 and a US$ 8 million contingency effect related to taxes registered in 2019; and |
| d) | US$ 34 million in higher energy consumption explained by US$ 98 million in higher prices related to inflation adjustment associated with the application of IAS 29, which was offset by 506 GWh in higher energy purchases for a US$ 64 million increase. |
| a) | US$ 259 million, as a result of the devaluation of the Brazilian real against the U.S. dollar. |
This decrease in operating costs was partially offset by:
| b) | US$ 61 million increase from the application of IFRS 12; |
| c) | US$ 23 million increase in energy purchases as a result of higher average purchase prices of US$ 58 million, due to inflation adjustment associated with the application of IAS 29, offset by a US$ 35 million decrease in physical energy purchases of 83 GWh, at least partly attributable to the Covid-19 pandemic; and |
| d) | US$ 18 million increase in transportation costs. |
| a) | US$ 318 million as a result of the devaluation of the Brazilian real against the U.S. dollar. |
This decrease in operating costs was partially offset by higher costs of:
| b) | US$ 141 million in other variable supplies and services that correspond mainly to the application of IFRIC 12; |
| c) | US$ 66 million in energy purchases due to higher average prices; and |
| d) | US$ 38 million in transportation costs. |
In Colombia, operating costs of Codensa decreased by US$ 76 million, or 7.9 %, in 2020, mainly explained by:
133
This decrease in operating costs was partially offset by an increase in costs of:
In Peru, operating costs of Enel Distribution Peru decreased by US$ 20 million, or 3.2%, in 2020, mainly explained by:
This decrease in operating costs was partially offset by:
Selling and Administrative Expenses
Our selling and administrative expenses are salaries and other compensation expenses, depreciation, amortization and impairment losses, and office materials and supplies.
134
The following table sets forth the selling and administrative expenses by reportable segments and by operating segments within such reportable segments for the years ended December 31, 2020, and 2019:
| | | | | | | | |
| | Year ended December 31, | ||||||
|
| 2020 |
| 2019 |
| Change |
| Change |
| | (in millions of US$) | | (in %) | ||||
Generation and Transmission Business in Argentina | | 158 | | 151 | | 7 | | 4.8 |
Costanera | | 89 | | 85 | | 4 | | 4.9 |
El Chocón | | 22 | | 23 | | (1) | | (3.6) |
Dock Sud | | 42 | | 42 | | (0) | | (0.3) |
Other | | 5 | | 1 | | 4.0 | | n.a. |
Generation and Transmission Business in Brazil | | 52 | | 71 | | (19) | | (26.5) |
Cachoeira Dourada | | 16 | | 20 | | (4) | | (18) |
Fortaleza | | 17 | | 26 | | (9) | | (33.2) |
Cien | | 14 | | 20 | | (6) | | (29.7) |
EGP Volta Grande | | 3 | | 4 | | (1) | | (15.8) |
Other | | 1 | | 1 | | — | | — |
Generation and Transmission Business in Colombia | | 140 | | 144 | | (4) | | (2.5) |
Emgesa | | 140 | | 144 | | (4) | | (2.5) |
Generation and Transmission Business in Peru | | 137 | | 137 | | — | | — |
Enel Generation Peru | | 106 | | 108 | | (2) | | (1.7) |
Enel Generation Piura | | 22 | | 21 | | 1 | | 4.4 |
Other | | 9 | | 8 | | 1 | | 13 |
Total Generation and Transmission Business reportable segment | | 488 | | 503 | | (15) | | (3.0) |
| | | | | | | | |
Distribution Business in Argentina | | 339 | | 362 | | (23) | | (6.3) |
Edesur | | 339 | | 362 | | (23) | | (6.3) |
Distribution Business in Brazil | | 1,244 | | 1,628 | | (384) | | (23.6) |
Enel Distribution Rio | | 289 | | 322 | | (33) | | (10.2) |
Enel Distribution Ceara | | 232 | | 241 | | (9) | | (3.7) |
Enel Distribution Goias | | 282 | | 422 | | (140) | | (33.2) |
Enel Distribution Sao Paulo | | 441 | | 643 | | (202) | | (31.5) |
Distribution Business in Colombia | | 286 | | 272 | | 14 | | 5.0 |
Codensa | | 286 | | 272 | | 14 | | 5.0 |
Distribution Business in Peru | | 146 | | 135 | | 11 | | 8.2 |
Enel Distribution Peru | | 146 | | 135 | | 11 | | 8.2 |
Total Distribution Business reportable segment | | 2,015 | | 2,397 | | (382) | | (15.9) |
Less: consolidation adjustments and non-core activities | | 81 | | 104 | | (23) | | (22.0) |
Total selling and administrative expenses | | 2,584 | | 3,004 | | (420) | | (14.0) |
Consolidated depreciation, amortization, and impairment reached US$ 1,100 million for the period ended December 31, 2020, a decrease of US$ 127 million compared to 2019.
Generation and Transmission Business
Consolidated selling and administrative expenses decreased US$ 15 million, or 3.0%, in 2020 compared to 2019, mainly due to a US$ 19 million decrease from the businesses in Brazil, as a result of the devaluation of the Brazilian real against the US dollar.
Distribution Business
Selling and administrative expenses decreased US$ 382 million, or 15.9%, in 2020 compared to 2019, mainly due to the following:
135
In Argentina, selling and administrative expenses decreased by US$ 23 million, or 6.3%, in 2020, primarily due to the following:
| (i) | US$ 26 in lower personnel expenses from Edesur mainly explained by (i) US$ 38 million less in expenses due to the devaluation of the Argentine peso against the U.S. dollar and (ii) US$ 15 million in lower spending on retirement and pension plans, partially offset by US$ 27 million in salary increases, mainly explained by the recognition of inflation in salary and social security expenses; and |
| (ii) | US$ 19 million in lower other expenses from Edesur mainly explained by US$ 51 million as a result of the devaluation of the Argentina pesos against the U.S. dollar, offset by (i) US$ 30 million in higher costs for maintenance and network renovations, among others, and (ii) US$ 2 million for the purchase of safety and hygiene elements linked to the Covid-19 pandemic. |
These decreases in selling and administrative expenses were partially offset by:
| (iii) | US$ 20 million in higher depreciation, mainly due to the application of IAS 29 (inflation) to the company’s fixed assets; and |
| (iv) | US$ 2 million in higher provisions for bad debt due to the application of IFRS 9. |
In Brazil, selling and administrative expenses decreased by US$ 384 million, or 23.6%, in 2020, primarily due to the following:
| (i) | a decrease of US$ 33 million, 10.2%, from Enel Distribution Rio, mainly explained by: |
| a) | US$ 28 million in lower other expenses mainly due to US$ 39 million as a result of the devaluation of the Brazilian real against the U.S. dollar, partially offset by US$ 11 million from higher operation and commercial costs; |
| b) | US$ 21 million in lower amortization and depreciations mainly due to US$ 25 million from the devaluation of the Brazilian real against the U.S. dollar, partially offset by higher amortization of US$ 4 million; |
| c) | US$ 6 million lower in staffing costs, due to US$ 7 million from the devaluation of the Brazilian real against the U.S. dollar, partially offset by lower staffing costs of US$ 1 million; |
These decreases in selling and administrative expenses were partially offset by:
| d) | US$ 22 million in higher provisions for bad debts due to US$ 39 million as a result of the application of IFRS 9 as a consequence of Covid-19 pandemic, partially offset by US$ 17 million as a result of the devaluation of the Brazilian real against the US dollar; and |
| (ii) | a decrease of US$ 140 million, or 33.2%, from Enel Distribution Goias, mainly explained by: |
| a) | US$ 98 million less in impairment losses, mainly explained by an impairment of US$ 92 million recognized in 2019 associated with accounts receivable linked to the Goiás Distribution Contribution Fund (FUNAC), created by the state of Goiás; |
| b) | US$ 16 million less in personnel expenses explained by (i) a US$ 9 million decrease due to fewer staff members and lower overtime expenses resulting from the Covid-19 pandemic; and (ii) US$ 7 million as a result of the devaluation of the Brazilian real against the U.S. dollar; |
136
| c) | US$ 14 million in lower amortization and depreciation expenses mainly due to US$ 20 million from the devaluation of the Brazilian real against the U.S. dollar, offset by higher amortization of US$ 6 million, due to greater investments during the period; |
| d) | US$ 11 million less in other expenses due to US$ 54 million as a result of the devaluation of the Brazilian real, partially offset by an increase of: |
| ● | US$ 32 million in maintenance and conservation costs for electrical installations, meter reading services, customer service, and other services; |
| ● | US$ 8 million in costs for fines and quality-of-service contingencies; and |
| ● | US$ 3 million in expenses explained by other marketing activities and customer-related virtual channels. |
| (iii) | a decrease of US$ 202 million, or 31.5%, from Enel Distribution Sao Paulo mainly due to: |
| a) | US$ 89 million attributable to the effects of voluntary migration by employees to a defined contribution plan; |
| b) | US$ 43 million as a result of the devaluation of the Brazilian real against the U.S. dollar; |
| c) | US$ 42 million in lower amortization expenses explained by US$ 49 million as a result of the devaluation of the Brazilian real against the U.S. dollar, offset by higher amortization of US$ 7 million due to greater investments during the period; |
| d) | US$ 13 million less in expenses due to increased efficiency and digitization of processes; |
| e) | US$ 13 million less in other expenses, explained by US$ 52 million due to the devaluation of the Brazilian real against the U.S. dollar, partially offset by a US$ 40 million increase mainly in third-party service costs for lines, network maintenance, and other technical services; and |
| f) | US$ 4 million in higher personnel expenses due to investments in projects to improve service quality. |
In Colombia, selling and administrative expenses from Codensa increased US$ 14 million, or 5.0%, in 2020, mainly due to an increase of US$ 11 million in provisions for bad debts as a result of the application of IFRS 9 in response to the Covid-19 pandemic.
In Peru, selling and administrative expenses from Enel Distribution Peru increased US$ 11 million, or 8.2%, in 2020, mainly due to an increase of US$ 10 million in provisions for bad debts as a result of the application of IFRS 9 in response to the Covid-19 pandemic.
137
Operating Income
The following table sets forth our operating income by reportable segments and by operating segments within such reportable segments for the years ended December 31, 2020, and 2019:
| | | | | | | | |
| | Year ended December 31, | ||||||
|
| 2020 |
| 2019 |
| Change |
| Change |
| | (in millions of US$) | | (in %) | ||||
Generation and Transmission Business in Argentina | | 53 | | 155 | | (102) | | (65.8) |
Costanera | | 19 | | 60 | | (41) | | (68.6) |
El Chocón | | 22 | | 43 | | (21) | | (49.3) |
Dock Sud | | 14 | | 51 | | (37) | | (71.7) |
Other | | (2) | | 1 | | (3) | | (300) |
Generation and Transmission Business in Brazil | | 273 | | 288 | | (15) | | (5.1) |
Cachoeira Dourada | | 130 | | 79 | | 51 | | 64.1 |
Fortaleza | | 51 | | 100 | | (49) | | (48.8) |
Cien | | 39 | | 50 | | (11) | | (22.0) |
EGP Volta Grande | | 48 | | 60 | | (12) | | (19.2) |
Other | | 5 | | (1) | | 6 | | (600) |
Generation and Transmission Business in Colombia | | 607 | | 637 | | (30) | | (4.8) |
Emgesa | | 607 | | 637 | | (30) | | (4.8) |
Generation and Transmission Business in Peru | | 208 | | 255 | | (47) | | (18.6) |
Enel Generation Peru | | 189 | | 222 | | (33) | | (14.8) |
Enel Generation Piura | | 19 | | 33 | | (14) | | (43.9) |
Other | | — | | — | | — | | n.a. |
Total Generation and Transmission Business reportable segment | | 1,141 | | 1,335 | | (194) | | (14.6) |
| | | | | | | | |
Distribution Business in Argentina | | (68) | | 211 | | (279) | | (132.4) |
Edesur | | (68) | | 211 | | (279) | | (132.4) |
Distribution Business in Brazil | | 554 | | 707 | | (153) | | (21.7) |
Enel Distribution Rio | | 62 | | 164 | | (102) | | (62.1) |
Enel Distribution Ceara | | 75 | | 141 | | (66) | | (47.1) |
Enel Distribution Goias | | 83 | | 23 | | 60 | | 262.9 |
Enel Distribution Sao Paulo | | 333 | | 379 | | (46) | | (12.0) |
Distribution Business in Colombia | | 375 | | 431 | | (56) | | (13.0) |
Codensa | | 375 | | 431 | | (56) | | (13.0) |
Distribution Business in Peru | | 141 | | 196 | | (55) | | (27.8) |
Enel Distribution Peru | | 141 | | 196 | | (55) | | (27.8) |
Total Distribution Business reportable segment | | 1,002 | | 1,545 | | (543) | | (35.2) |
Less: consolidation adjustments and non-core activities | | (89) | | (111) | | 22 | | (19.5) |
Total operating income | | 2,053 | | 2,769 | | (716) | | (25.9) |
Generation and Transmission Business
Operating income from the generation and transmission business decreased US$ 194 million, or 14.6%, in 2020 compared to 2019, mainly explained by the following events:
In Argentina, the operating income decreased by US$ 102 million, or 65.8%, mainly attributable to Costanera’s higher maintenance costs and lower revenues from El Chocón and Dock Sud, explained by the devaluation of the Argentine peso against the U.S. dollar associated with the IAS 29 inflation adjustment.
In Brazil, the operating income decreased by US$ 15 million, or 5.1%, mainly due to (i) higher energy purchases from Cachoeira Dourada, increasing operating costs, and (ii) a decrease in operating income from Fortaleza and EGP Volta Grande due to lower energy sales and the devaluation of the Brazilian real against the U.S. dollar.
138
In Colombia, the operating income decreased by US$ 30 million, or 4.8%, mainly due to lower physical sales and the devaluation of the Colombian peso against the U.S. dollar, partially offset by better sales prices due to a tariff increase.
In Peru, the operating income decreased by US$ 47 million, or 18.6%, due to the devaluation of the new Peruvian Sol against the U.S. dollar, lower physical sales in Enel Generation Peru, and lower gas sales in Enel Generation Piura.
Distribution Business
Operating income decreased US$ 543 million, or 35.2%, in 2020 compared to 2019, mainly explained by the following events:
In Argentina, the operating income from Edesur decreased US$ 279 million, or 132.4%, as a result of the regulatory agreement signed between Edesur and the Argentine government, which settled the outstanding reciprocal claims arising in the transition period 2006-2016 for US$ 203 million, and the effects of the devaluation of the Argentine peso against the U.S. dollar.
In Brazil, operating income decreased US$ 153 million, or 21.7%, mainly by:
| (i) | a decrease of US$ 102 million, or 62.1%, from Enel Distribution Rio, mostly attributable to the effects of the devaluation of the Brazilian real against the U.S. dollar and lower physical sales; |
| (ii) | a decrease of US$ 66 million, or 47.1%, from Enel Distribution Ceara, mainly due to the effects of the devaluation of the Brazilian real against the U.S. dollar; |
| (iii) | a decrease of US$ 46 million, or 12%, from Enel Distribution Sao Paulo, primarily as a result of the devaluation of the Brazilian real against the U.S. dollar, and the positive effect of voluntary migration by employees to a defined contribution pension plan; and |
These decreases in operating income were partially offset by;
| (iv) | an increase of US$ 60 million, or 262.9%, in Enel Distribution Goias mainly due to the reduction of selling and administrative expenses primarily explained by lower impairment losses. |
In Colombia, operating income from Codensa decreased US$ 56 million, or 13.0%, mainly due to lower physical sales and the devaluation of the Colombian peso against the US dollar.
In Peru, operating income from Enel Distribution Peru decreased US$ 55 million, or 27.8%, mainly explained by lower physical sales and devaluation of the new Peruvian sol against the U.S. dollar.
139
Other Results
The following table sets forth our financial and other results for the years ended December 31, 2020, and 2019:
| | | | | | | | |
| | Year ended December 31, | ||||||
|
| 2020 |
| 2019 |
| Change |
| Change |
| | (in millions of US$) | | (in %) | ||||
Financial results | | | | | | | | |
Financial income | | 321 | | 450 | | (129) | | (28.6) |
Financial costs | | (768) | | (1,088) | | 320 | | (29.4) |
Results for Hyperinflation | | 77 | | 124 | | (47) | | (38.1) |
Net foreign currency exchange gains (losses) | | 57 | | 137 | | (80) | | (58.3) |
Total | | (313) | | (377) | | 64 | | 16.9 |
| | | | | | | | |
Other | | | | | | | | |
Other gains (losses) | | 5 | | 14 | | (9) | | (67) |
Share of the profit of associates and joint ventures accounted for using the equity method | | 3 | | — | | 3 | | n.a. |
Total | | 8 | | 14 | | (6) | | (44.3) |
Total other results | | (305) | | (363) | | 58 | | 15.9 |
Financial Results
Our net total financial results in 2020 decreased by US$ 64 million, or 16.9%, compared to 2019. The variation is mainly explained by:
| (i) | a decrease of US$ 129 million in financial income, primarily explained by lower revenues of: |
| a) | US$ 32 million attributable to (i) US$ 27 million from Enel Distribution Sao Paulo, mainly due to the devaluation of the Brazilian real against the U.S. dollar and (ii) US$ 5 million in revenues for lower returns on financial investments; |
| b) | US$ 26 million from our generation subsidies in Argentina, primarily as a result of (i) US$ 30 million in lower interest revenue related to the accounts receivable and (ii) US$ 21 million due to the devaluation of the Argentine peso against the U.S. dollar, partially offset by US$ 25 million in financial income for investment revaluation due to a change in ownership of Central Térmica Manuel Belgrano and Central Térmica San Martín; |
| c) | US$ 17 million from Enel Generation Fortaleza, mainly explained by US$ 13 million in financial updates to PIS/COFINS taxes recorded in 2019; |
| d) | US$ 16 million from Enel Distribution Rio, due to the devaluation of the Brazilian real against the U.S. dollar; |
| e) | US$ 12 million from Edesur, mainly due to US$ 4 million as a result of the devaluation of the Argentine peso against the U.S. dollar and US$ 7 million in lower interest charged on customer defaults; |
| f) | US$ 12 million from Enel Américas, mainly from lower financial issuances; and |
| g) | US$ 6 million from Enel Cien, mainly due to lower revenues as a result of financial updates to PIS/COFINS taxes. |
| (ii) | a decrease of US$ 80 million due to (i) US$ 74 million negative exchange rate differences from our generation subsidiaries in Argentina, (ii) US$ 42 million from Enel Brasil related to updates to service provider agreements. This was partially offset by US$ 34 million less in negative exchange rate |
140
| differences in Enel Américas, mainly due to lower domestic currency placements made in 2019 during the capital increase process. |
| (iii) | a decrease of US$ 47 million in results for hyperinflation, explained by an inflation adjustment attributed to non-monetary assets and liabilities and income statements due to the implementation of IAS 29 in Argentina. |
These decreases were partially offset by;
| (iv) | a decrease of US$ 320 million in financial costs, mainly attributable to: |
| a) | US$ 160 million from Enel Brasil, mainly related to US$ 151 million in debt with Enel Finance International N.V., which was paid off on July 7, 2019, and US$ 9 million as a result of the devaluation of the Brazilian real against the U.S. dollar. |
| b) | US$ 49 million from Enel Distribution Sao Paulo, explained by US$ 53 million due to the devaluation of the Brazilian real against the U.S. dollar, offset by US$ 4 million in higher expenses for updates to civil and labor contingencies; |
| c) | US$ 27 million from Enel Distribution Rio, mainly due to the devaluation of the Brazilian real against the U.S. dollar; |
| d) | US$ 27 million from Enel Distribution Goias, mainly due to US$ 20 million as a result of the devaluation of the Brazilian real against the U.S. dollar and US$ 7 million less in bank debt; |
| e) | US$ 20 million from Edesur, explained by US$ 60 million due to the devaluation of the Argentine peso against the U.S. dollar, primarily offset by (i) US$ 40 million in higher expenses for updates to fines and debt to CAMMESA; |
| f) | US$ 16 million less in expenses from Enel Generation Costanera, mainly US$ 11 million less in expenses on its debt to CAMMESA and US$ 5 million due to the devaluation of the Argentine peso against the U.S. dollar; |
| g) | US$ 16 million from Enel Generation El Chocón, mainly due to lower expenses on its debt with CAMMESA; |
| h) | US$ 14 million from Enel Distribution Ceara, mainly US$ 12 million as a result of the devaluation of the Brazilian real against the U.S. dollar; |
| i) | US$ 12 million from Emgesa, explained by US$ 10 million due to the devaluation of the Colombian peso against the U.S. dollar and US$ 2 million less in bank debt expenses; and |
| j) | US$ 8 million from Codensa, mainly US$ 7 million due to the devaluation of the Colombian peso against the U.S. dollar and US$ 2 million less in financial debt. |
| k) | These decreases in financial costs were partially offset by increased financial costs of: |
| l) | US$ 14 million from EGP Cachoeira Dourada; and |
| m) | US$ 12 million from Enel Américas, mainly explained by withholding tax on dividends from subsidiaries in Argentina and Peru. |
141
Other Non-Operating Results
Other non-operating results decreased in 2020, explained by Enel Distribution Peru’s sale of assets in 2019.
Income Taxes
Total income tax expense increased US$ 330 million in 2020 compared to 2019, explained by increased expenses of:
| (i) | US$ 538 million from Enel Distribution Sao Paulo, of which US$ 553 million originated from deferred tax profit recorded in 2019, arising from the merger with Enel Sudeste, and offset by US$ 15 million from the devaluation of the Brazilian real against the U.S. dollar; |
| (ii) | US$ 13 million from Central Dock Sud, explained by a US$ 25 million tax benefit from the revaluation of its non-monetary tax assets and liabilities recorded in 2019, offset by US$ 12 million due to the devaluation of the Argentine peso against the U.S. dollar; |
These increases in income tax expenses were partially offset by:
| (iii) | US$ 54 million from Edesur, mainly US$ 44 million in lower financial results in regulatory assets and liabilities recorded as a profit in 2019 and US$ 10 million due to the devaluation of the Argentine peso against the U.S. dollar; |
| (iv) | US$ 47 million from Enel Cien, mainly explained by US$ 30 million lower financial results and US$ 17 million higher expenses in 2019 due to impairment losses on receivables; |
| (v) | US$ 33 million from Enel Generation Costanera, primarily as a result of US$ 36 million less in financial results, offset by US$ 3 million due to the devaluation of the Argentine peso against the U.S. dollar; |
| (vi) | US$ 31 million from Enel Distribution Rio, mainly explained by lower financial results; |
| (vii) | US$ 24 million from Codensa, primarily due to US$ 12 million in financial results and US$ 12 million as a result of the devaluation of the Colombian peso against the U.S. dollar; |
| (viii) | US$ 17 million from Enel Distribution Peru, due to lower financial results; and |
| (ix) | US$ 14 million from Enel Generation Peru, mainly explained by the provision of legal contingencies with Empresa de Electricidad del Perú S.A.; |
The effective tax rate was 32.4% in 2020 and 9.8% in 2019. The recognition of deferred tax assets from the merger of Enel Sudeste with Enel Distribution Sao Paulo, registered in 2019, mainly explains this increase.
The following table sets forth the tax effect of rates applied in other countries that result in a difference between domestic or nominal tax rates in Chile (4.7% for 2020 and 5.2% for 2019) and tax rates enacted in each foreign jurisdiction:
| | | | | | | | |
| | Nominal Tax Rates (%) | | Tax effect of rates applied in | ||||
|
| 2020 |
| 2019 |
| 2020 |
| 2019 |
Argentina | | 30.0 | | 30.0 | | (2.8) | | (18.1) |
Brazil | | 34.0 | | 34.0 | | (27.9) | | (41.8) |
Colombia | | 32.0 | | 33.0 | | (43.1) | | (55.7) |
Peru | | 29.5 | | 29.5 | | (7.9) | | (10.3) |
Total | | — | | — | | (81.7) | | (125.9) |
142
Net Income
The following table sets forth our consolidated income before income taxes, income taxes, and net income for the years ended December 31, 2020, and 2019:
| | | | | | | | |
| | Year ended December 31, | ||||||
|
| 2020 |
| 2019 |
| Change |
| Change |
| | (in millions of US$) | | (in %) | ||||
Operating income | | 2,053 | | 2,769 | | (716) | | (25.8) |
Other results | | (305) | | (363) | | 57 | | (15.8) |
Income before income taxes | | 1,748 | | 2,406 | | (658) | | (27.4) |
Income taxes | | (567) | | (236) | | (330) | | 139.7 |
Net Income | | 1,181 | | 2,170 | | (989) | | (45.6) |
Net income attributable to: | | | | | | | | |
Net income attributable to the parent company | | 825 | | 1,614 | | (789) | | (48.9) |
Net income attributable to non-controlling interests | | 356 | | 556 | | (200) | | (35.9) |
Net income attributable to the parent company on a consolidated basis reached US$ 825 million, a decrease of 48.9% compared to 2019, explained by (i) lower demand primarily as a result of the Covid-19 pandemic, which affected our revenues mainly in the distribution segment; (ii) the regulatory agreement signed between Edesur and the Argentine government, which settled the outstanding reciprocal claims arising in the transition period 2006-2016; and (iii) the negative effect from the devaluation of the countries’ currencies where we operate.
3. | Analysis of Results of Operations for the Years Ended December 31, 2019 and 2018. |
Consolidated Revenues and other operating income
Generation and Transmission Business
The following table sets forth the electricity sales of our subsidiaries and the corresponding changes for the years ended December 31, 2019 and 2018:
| | | | | | | | |
| | Electricity sales during the year ended December 31, | ||||||
|
| 2019 |
| 2018 |
| Change |
| Change |
| | (in GWh) | | (in %) | ||||
Costanera (Argentina) | | 6,210 | | 7,101 | | (891) | | (12.5) |
El Chocón (Argentina) | | 2,528 | | 2,901 | | (373) | | (12.9) |
Dock Sud (Argentina) | | 4,238 | | 3,951 | | 288 | | 7.3 |
Cachoeira Dourada (Brazil) | | 22,890 | | 18,098 | | 4,792 | | 26.5 |
Fortaleza (Brazil) | | 4,742 | | 2,763 | | 1,979 | | 71.7 |
EGP Volta Grande (Brazil) | | 2,370 | | 1,376 | | 994 | | 72.2 |
Emgesa (Colombia) | | 18,376 | | 18,544 | | (168) | | (0.9) |
Enel Generation Peru (Peru) | | 10,541 | | 9,994 | | 547 | | 5.5 |
Enel Generation Piura (Peru) | | 658 | | 603 | | 55 | | 9.2 |
Total | | 72,553 | | 65,329 | | 7,225 | | 11.1 |
143
Distribution Business
The following table sets forth the electricity sales of our subsidiaries, by country, and their corresponding variations for the years ended December 31, 2019 and 2018:
| | | | | | | | |
| | Electricity sales during the year ended December 31, | ||||||
|
| 2019 |
| 2018 |
| Change |
| Change |
| | (in GWh) | | (in %) | ||||
Edesur (Argentina) | | 16,798 | | 17,548 | | (750) | | (4.3) |
Enel Distribution Rio (Brazil) | | 11,568 | | 11,019 | | 549 | | 5.0 |
Enel Distribution Ceara (Brazil) | | 12,197 | | 11,843 | | 354 | | 3.0 |
Enel Distribution Goias (Brazil) | | 14,365 | | 13,755 | | 610 | | 4.4 |
Enel Distribution Sao Paulo (Brazil) | | 43,148 | | 24,693 | | 18,456 | | 74.7 |
Codensa (Colombia) | | 14,307 | | 14,024 | | 283 | | 2.0 |
Enel Distribution Peru (Peru) | | 8,211 | | 8,045 | | 166 | | 2.1 |
Total | | 120,594 | | 100,927 | | 19,667 | | 19.5 |
144
The following table sets forth the revenues and other operating income by reportable segments and by operating segments within such reportable segments for the years ended December 31, 2019 and 2018:
| | | | | | | | |
| | Year ended December 31, | ||||||
|
| 2019 |
| 2018 |
| Change |
| Change |
| | (in millions of US$) | | (in %) | ||||
Generation and Transmission Business in Argentina | | 436 | | 328 | | 108 | | 33.0 |
Costanera | | 214 | | 163 | | 51 | | 31.4 |
El Chocón | | 72 | | 67 | | 5 | | 7.3 |
Dock Sud | | 147 | | 95 | | 52 | | 55.1 |
Other | | 3 | | 3 | | — | | — |
Generation and Transmission Business in Brazil | | 778 | | 854 | | (76) | | (9.0) |
Cachoeira Dourada | | 494 | | 540 | | (46) | | (8.5) |
Fortaleza | | 310 | | 212 | | 98 | | 46.3 |
Cien | | 70 | | 83 | | (13) | | (15.3) |
EGP Volta Grande | | 107 | | 82 | | 25 | | 30.6 |
Other | | (203) | | (63) | | (140) | | 222.2 |
Generation and Transmission Business in Colombia | | 1,247 | | 1,259 | | (13) | | (1.0) |
Emgesa | | 1,247 | | 1,259 | | (13) | | (1.0) |
Generation and Transmission Business in Peru | | 596 | | 596 | | — | | — |
Enel Generation Peru | | 519 | | 522 | | (3) | | (0.6) |
Enel Generation Piura | | 82 | | 78 | | 4 | | 5.1 |
Other | | (5) | | (4) | | (1) | | 25.0 |
Total Generation and Transmission Business reportable segment | | 3,057 | | 3,037 | | 20 | | 0.6 |
| | | | | | | | |
Distribution Business in Argentina | | 1,347 | | 1,190 | | 157 | | 13.2 |
Edesur | | 1,347 | | 1,190 | | 157 | | 13.2 |
Distribution Business in Brazil | | 8,154 | | 6,922 | | 1,232 | | 17.8 |
Enel Distribution Rio | | 1,515 | | 1,511 | | 4 | | 0.3 |
Enel Distribution Ceara | | 1,373 | | 1,411 | | (38) | | (2.7) |
Enel Distribution Goias | | 1,545 | | 1,542 | | 3 | | 0.2 |
Enel Distribution Sao Paulo | | 3,721 | | 2,459 | | 1,262 | | 51.3 |
Distribution Business in Colombia | | 1,665 | | 1,714 | | (49) | | (2.8) |
Codensa | | 1,665 | | 1,714 | | (49) | | (2.8) |
Distribution Business in Peru | | 950 | | 913 | | 37 | | 4.1 |
Enel Distribution Peru | | 950 | | 913 | | 37 | | 4.1 |
Total Distribution Business reportable segment | | 12,116 | | 10,739 | | 1,377 | | 12.8 |
Less: consolidation adjustments and non-core activities | | (859) | | (786) | | (73) | | 9.3 |
Total Revenues and other operating income | | 14,314 | | 12,990 | | 1,324 | | 10.2 |
Generation and Transmission Business: Revenues
In Argentina, revenues and other operating income increased by US$ 108 million, or 33.0%, primarily explained by:
| ● | Revenues and other operating income from Costanera increased by US$ 51 million, or 31.4 %, in 2019 compared to 2018. This increase is principally explained by an increase of US$ 94 million in revenues attributable to the translation of sales to the U.S. dollar of US$ 84 million, despite fuel management costs of US$ 10 million and lower physical sales of US$ 7 million (891 GWh). In addition, there was a US$ 27 million increase in revenues related to the IAS 29 inflation adjustment. These increases were partially offset by US$ 70 million in lower revenues as a result of the devaluation of the Argentine peso in relation to the U.S. dollar. |
| ● | Revenues and other operating income from El Chocón increased by US$ 5 million in 2019 compared to 2018, mostly due to a US$ 28 million increase in revenues attributable to the translation of sales to the U.S. dollar, US$ 5 million in higher revenues associated with the IAS 29 inflation adjustment and |
145
| lower physical sales of US$ 1 million (373 GWh). The increases were partially offset by a US$ 29 million decrease in revenues as a result of the devaluation of the Argentine peso in relation to the U.S. dollar. |
| ● | Revenues and other operating income from Dock Sud increased by US$ 52 million, or 55.1 %, in 2019 compared to 2018, which is explained by (i) a US$ 73 million increase in revenues attributable to the translation of sales to the U.S. dollar for US$ 20 million, higher physical sales of US$ 7 million (287 GWh), mainly due to the maintenance that took place in 2018 to the gas turbine TG-10, and to fuel management costs of US$ 48 million; (ii) US$ 7 million in higher revenues associated with the IAS 29 inflation adjustment; and (iii) an US$ 11 million increase in other operating income due to the recognition of insurance compensation for damage to a turbine due to mechanical failure that occurred in the first half of 2019. These increases were partially offset by US$ 39 million in lower revenues as a result of the devaluation of the Argentine peso in relation to the U.S. dollar. |
In Brazil, revenues and other operating income increased by US$ 76 million, or 9.0%, primarily explained by the following:
| ● | Physical energy sales from Cachoeira Dourada decreased by US$ 46 million, or 8.5 %, in 2019. This is mostly explained by a US$ 40 million decrease in revenues as a result of the 8% devaluation of the Brazilian real against the U.S. dollar. In addition, revenues decreased by US$ 6 million as a result of the net effect of lower regulated prices of US$ 24 million, despite higher physical sales of energy for US$ 18 million (4,792 GWh) due to higher demand from regulated customers. |
| ● | Operating revenues from Fortaleza increased by US$ 98 million, or 46.3%, mostly due to US$ 109 million in higher energy sales (1,979 GWh), mainly as a result of a higher demand in 2019 compared to 2018. The increase was partially offset by lower translation effects of US$ 15 million, due to the devaluation of the Brazilian real against the U.S. dollar. |
| ● | Operating revenues from EGP Volta Grande increased by US$ 25 million, or 30.6%, mainly explained by US$ 31 million in higher energy sales (994 GWh). The increase was partially offset by lower translation effects of US$ 6 million, due to the devaluation of the Brazilian real against the U.S. dollar. |
In Colombia, revenues and other operating income from Emgesa decreased by US$ 13 million, or 1%, in 2019. This decrease is mostly explained by (i) a US$ 126 million decrease due to the translation effects from an 11.1% devaluation of the Colombian peso against the U.S. dollar, (ii) a US$ 22 million decrease in physical sales (168 GWh), and (iii) a US$ 9 million decrease in compensations and loss of profit recognized in 2018, corresponding to insurance compensation for the Chivor tunnel accident that affected the Guavio Plant. The decrease was partially offset by higher revenues of US $ 137 million due to the increase in the tariff and US $ 7 million due to higher gas sales.
In Peru, revenues and other operating income from Enel Generation Peru decreased by US$ 3 million, or 0.6%, in 2019. This decrease is mostly explained by (i) US$ 33 million in lower revenues for provisions recognized in 2018 related to the Central Térmica Ventanilla, Callahuanca, and Central Santa Rosa accidents, (ii) a US$ 16 million decrease in toll revenues as a result of non-recurring billing to unregulated clients mainly in Cajamarquilla in 2018 to resolve some legal issues, and (iii) lower translation effects of US$ 7 million due to the 1.7% devaluation of the new Peruvian sol against the U.S. dollar. This decrease is partially offset by higher energy sales of US$ 48 million, which include higher physical sales for US$ 29 million (547 GWh) and higher average selling prices totaling US$ 19 million.
Distribution Business: Revenues
In Argentina, revenues and other operating income from Edesur increased by US$ 157 million, or 13.2 %, in 2019, of which (i) US$ 330 million is due to US$ 427 million higher revenues from energy sales, offset by US$ 97 million of lower physical sales (750 GWh); (ii) US$ 203 million is from higher operating revenues as a result of the regulatory agreement signed between Edesur and the Argentine National State, which settled the outstanding reciprocal claims arising in the transition period 2006-2016; (iii) US$ 58 million is from the IAS 29 inflation adjustment; (iv) US$ 16 million is from toll price increases, mainly due to inflation; and (v) US$ 8 million is from other revenues, mainly from insurance compensation of US$ 6 million, corresponding to claims of several substations made in previous years. The
146
increase was partially offset by US$ 461 million in lower revenues as a result of the devaluation of the Argentine peso in relation to the U.S. dollar.
In Brazil, revenues and other operating income increased by US$ 1,232 million in 2019, or 17.8%, explained by:
| ● | Operating revenues from Enel Distribution Rio increased by US$ 4 million, or 0.3%, in 2019, explained by US$ 106 million in higher revenues from (i) a tariff adjustment applied since April 2019 of US$ 90 million and (ii) higher physical sales of US$ 16 million (70 GWh in higher energy invoiced). Revenues from other services increased by US$ 37 million, mainly explained by an increase of US$ 48 million of revenues from tolls and higher ancillary service revenues of US$ 2 million. The latter increase was partially offset by lower translation effects of US$ 13 million, due to the 8% devaluation of the Brazilian real against the U.S. dollar. |
This increase in operating revenues was partially offset by lower energy sales of US$ 141 million, mainly attributable to (i) lower currency translation effects of US$ 84 million, due to the devaluation of the Brazilian real against the U.S. dollar, (ii) US$ 40 million in lower revenues received from research and development and energy efficiency; and (iii) higher PIS/COFINS tax expenses of US$ 17 million.
Finally, other operating income increased by US$ 2 million, explained by higher construction revenues of US$ 12 million, stemming from the application of IFRIC 12 “Services Grant Agreements” (“IFRIC 12”) and US$ 5 million in other revenues from fines and penalties to clients. This increase was offset by US$ 15 million of lower revenues due to the devaluation of the Brazilian real against the U.S. dollar.
| ● | Operating revenues from Enel Distribution Ceara decreased by US$ 38 million, or 2.7 %, in 2019, mostly due to: |
| o | A decrease of US$ 17 million in revenues from other services as a result of (i) US$ 10 million in lower revenues from tolls from unregulated clients and (ii) US$ 7 million due to lower currency translation effects as a result of the devaluation of the Brazilian real against the U.S. dollar. |
| o | A decrease of US$ 58 million in other operating income, mainly due to US$ 39 million from lower construction revenue from the application of IFRIC 12 and US$ 19 million due to lower currency translation effects as the result of the devaluation of the Brazilian real against the U.S. dollar. |
| o | An increase of US$ 35 million in energy sales, mainly due to (1) US$ 104 million in higher revenues from the tariff adjustment applied since April 2019, (2) US$ 32 million from an increase in physical sales of energy (343 GWh), and (3) US$ 20 million in higher revenues from research and development, partially offset by (1) US$ 79 million from lower currency translation effects, due to the devaluation of the Brazilian real against the U.S. dollar and (2) US$ 41 million in lower revenues derived from the net effect of our regulatory assets and liabilities. |
| ● | Operating revenues from Enel Distribution Goias increased by US$ 3 million, or 0.2%, which is mainly explained by (i) US$ 58 million in higher energy sales as a result of higher physical sales (504 GWh) of US$ 43 million and tariff increases of US$ 15 million and (ii) a US$ 42 million increase in other services mainly explained by an increase in toll revenues due to tariff readjustments for unregulated clients, which increased compared to 2018. Other operating income increased by US$ 46 million from higher construction revenues from the application of IFRIC 12. This increase was partially offset by US$ 115 million in lower translation effects due to the 8% devaluation of the Brazilian real against the U.S. dollar and US$ 28 million in lower revenues from fines to customers for late payment of invoices and work services to third parties. |
147
| ● | Operating revenues from Enel Distribution Sao Paulo was US$ 3,721 million and increased US$ 1,262 million, or 51.3%, compared to 2018. Only six months of results during 2018 were consolidated at the level of Enel Américas. The main variations are explained by (i) an increase in energy sales of US$ 1,226 million, due to higher physical sales of US$ 1,194 (18,455 GWh) and from the tariff adjustment applied since July 2019 for US$ 32 million; (ii) US$ 194 million in revenues from other services that correspond to toll service revenues; and (iii) other operating income of US$ 25 million, mainly from the update of special obligations totaling US$ 32 million and US$ 14 million from fines to customers for late payment of invoices, offset by a lower construction revenues from the application of IFRIC 12 of US$ 22 million. |
These increases were partly offset by lower revenues of US$ 183 million as a result of the translation effects originating in the devaluation of the Brazilian real against the U.S. dollar.
In Colombia, operating income from Codensa decreased by US$ 49 million in 2019, or 2.8 %, mainly explained by US$ 172 million from lower conversion effects, due to the 11.1% devaluation of the Colombian peso against the U.S. dollar. This was partially offset by (i) a US$ 86 million increase mainly due to a higher average price from energy sales for US$ 79 million and a US$ 7 million increase from physical sales (283 GWh); (ii) a US$ 28 million increase attributable to revenue from the rental of posts and ducts, lines, and networks; and (iii) a US$ 8 million increase in fines and penalties to customers.
In Peru, operating income from Enel Distribution Peru increased by US$ 37 million, principally explained by higher energy sales of US$ 61 million, of which US$ 43 million are due to tariff increases and US$ 18 million due to higher physical sales (166 GWh). The increases were partially offset by US$ 14 million related to lower translation effects due to the 1.7% devaluation of the new Peruvian sol against the U.S. dollar and a decrease in revenues of US$ 7 million, mainly due to lower public investments and lower requirements from private customers for investments in distribution networks.
Total Operating Costs
Total operating costs consist primarily of energy purchases from third parties, fuel consumption, depreciation, amortization and impairment losses, maintenance costs, tolls paid to transmission companies, employee salaries, and administrative and selling expenses.
The following table sets forth consolidated operating costs for the years ended December 31, 2019 and 2018:
| | | | | | | | |
| | Year ended December 31, | | | ||||
| | 2019 | | 2018 | | Change | | Change |
|
| (in millions of US$) |
| |
| (in %) | ||
Energy purchases | | 6,097 | | 5,655 | | 442 | | 7.8 |
Fuel consumption | | 277 | | 227 | | 50 | | 22.1 |
Transportation costs | | 1,111 | | 944 | | 167 | | 17.6 |
Other raw materials and combustibles | | 1,056 | | 1,123 | | (67) | | (5.9) |
Other expenses (1) | | 1,151 | | 1,021 | | 130 | | 12.7 |
Employee benefit expense and other (1) | | 628 | | 662 | | (34) | | (5.2) |
Depreciation, amortization and impairment losses (1) | | 1,225 | | 923 | | 302 | | 32.7 |
Total Operating Cost | | 11,545 | | 10,555 | | 990 | | 9.4 |
| (1) | Corresponds to selling and administration expenses. |
148
The following table sets forth our total operating costs (excluding selling and administrative expenses) by reportable segments and by operating segments within such reportable segments for the years ended December 31, 2019 and 2018:
| | | | | | | | |
| | Year ended December 31, | ||||||
|
| 2019 |
| 2018 |
| Change |
| Change |
| | (in millions of US$) | | (in %) | ||||
Generation and Transmission Business in Argentina | | 130 | | 40 | | 90 | | 225.0 |
Costanera | | 69 | | 15 | | 54 | | 351.8 |
El Chocón | | 6 | | 5 | | 1 | | 28.4 |
Dock Sud | | 54 | | 21 | | 33 | | 156.7 |
Other | | 1 | | (1) | | 2 | | (200.0) |
Generation and Transmission Business in Brazil | | 419 | | 574 | | (156) | | (27.3) |
Cachoeira Dourada | | 395 | | 418 | | (23) | | (5.5) |
Fortaleza | | 183 | | 207 | | (24) | | (11.6) |
Cien | | 1 | | 2 | | (1) | | (50.0) |
EGP Volta Grande | | 43 | | 11 | | 32 | | 304.0 |
Other | | (203) | | (64) | | (139) | | (219.1) |
Generation and Transmission Business in Colombia | | 466 | | 478 | | (12) | | (2.6) |
Emgesa | | 466 | | 478 | | (12) | | (2.6) |
Generation and Transmission Business in Peru | | 204 | | 188 | | 16 | | 8.6 |
Enel Generation Peru | | 178 | | 164 | | 14 | | 8.6 |
Enel Generation Piura | | 28 | | 26 | | 2 | | 7.7 |
Other | | (1) | | (2) | | 1 | | 70.2 |
Total Generation and Transmission Business reportable segment | | 1,219 | | 1,281 | | (62) | | (4.8) |
| | | | | | | | |
Distribution Business in Argentina | | 774 | | 729 | | 45 | | 6.1 |
Edesur | | 774 | | 729 | | 45 | | 6.1 |
Distribution Business in Brazil | | 5,820 | | 5,084 | | 736 | | 14.5 |
Enel Distribution Rio | | 1,029 | | 1,027 | | 2 | | 0.2 |
Enel Distribution Ceara | | 992 | | 1,037 | | (45) | | (4.3) |
Enel Distribution Goias | | 1,100 | | 1,106 | | (6) | | (0.5) |
Enel Distribution Sao Paulo | | 2,699 | | 1,914 | | 785 | | 41.0 |
Distribution Business in Colombia | | 962 | | 1,033 | | (71) | | (6.9) |
Codensa | | 962 | | 1,033 | | (71) | | (6.9) |
Distribution Business in Peru | | 619 | | 611 | | 8 | | 1.4 |
Enel Distribution Peru | | 619 | | 611 | | 8 | | 1.4 |
Total Distribution Business reportable segment | | 8,175 | | 7,457 | | 718 | | 9.6 |
Less: consolidation adjustments and non-core activities | | (853) | | (789) | | (64) | | 8.1 |
Total operating costs (excluding selling and administrative expenses) | | 8,541 | | 7,949 | | 592 | | 7.4 |
Generation and Transmission Business: Operating Costs
In Argentina, operating costs increased US$ 90 million, or 225%, mainly due to:
| ● | Operating costs of Costanera increased by US$ 54 million in 2019, mainly due to (i) higher gas consumption totaling US$ 36 million as a result of Resolution No. 70/2018, which established that commercial fuel management ceased to be the exclusive domain of the dispatch agency (CAMMESA) and resulted in commercial fuel management being undertaken by Costanera itself since December 2018, (ii) US$ 17 million in higher costs associated with the IAS 29 inflation adjustment, (iii) a US$ 6 million increase in variable provisions and services related to an increase in production; and (iv) higher third-party costs associated with the purchase of US$ 1 million of fuel. The cost increase was offset by US$ 6 million in lower costs attributable to the devaluation of the Argentine peso against the U.S. dollar. |
149
| ● | Operating costs of Dock Sud increased by US$ 33 million in 2019, mainly due to (i) higher gas consumption costs of US$ 30 million as a result of Resolution No. 70/2018, which established that commercial fuel management ceased to be the exclusive domain of the dispatch agency (CAMMESA), and resulted in commercial fuel management being undertaken by Dock Sud itself since December 2018; (ii) US$ 9 million in higher costs associated with the IAS 29 inflation adjustment; and (iii) US$ 3 million in higher gas transport costs. The cost increase was offset by US$ 9 million in lower costs attributed to the devaluation of the Argentine peso against the U.S. dollar. |
In Brazil, operating costs decreased by US$ 156 million, or 27.3%, which is explained by:
| ● | Operating costs from Cachoeira Dourada decreased by US$ 23 million in 2019, mostly due to a US$ 30 million decrease in the translation effect as a result of the devaluation of the Brazilian real against the U.S. dollar, offset by higher energy purchases of US$ 28 million, an increase of 4,287 GWh, and lower average energy prices of US$ 21 million. |
| ● | Operating costs from Fortaleza decreased by US$ 24 million, mainly due to (i) lower energy purchases of US$ 51 million as a result of lower average energy prices of US$ 55 million and higher physical purchases for US$ 4 million (1,388 GWh) and (ii) US$ 14 million in lower costs related to the devaluation of the Brazilian real against the U.S. dollar. The cost decrease was partially offset by US$ 42 million in higher gas consumption due to the restitution of the Petrobras service. |
| ● | Operating costs from EGP Volta Grande increased by US$ 32 million, which corresponds to higher physical purchases of US$ 17 million (554 GWh) to cover demand and higher average energy prices of US$ 15 million. |
| ● | Other operating costs decreased US$ 139 million due to energy purchases and sales transactions between our generation companies in Brazil. |
In Colombia, operating costs from Emgesa decreased by US$ 12 million in 2019, mainly explained by (i) US$ 48 million due to lower effect of the translation effects from the devaluation of the Colombian peso against the U.S. dollar. The cost decrease was offset by higher energy purchases of US$ 37 million as a result of higher energy prices of US$ 80 million, offset by US$ 41 million for lower physical purchases (1,122 GWh) in the spot market.
In Peru, operating costs from Enel Generation Peru increased by US$ 14 million in 2019 as a result of a US$ 11 million increase in tolls costs, due to non-compensable items determined by COES and a US$ 3 million increase related to natural gas purchases.
Distribution Business: Operating Costs
In Argentina, operating costs of Edesur increased by US$ 44 million, or 6.1%, in 2019, explained mainly by US$ 320 million due to an increase in energy purchases, mainly due to price increases related to the country's internal inflation and US$ 61 million in higher costs due to the inflation adjustment associated with the application of IAS 29. The cost increase was partially offset by lower translation effects totaling US$ 321 million as a result of the devaluation of the Argentine peso against the U.S. dollar and lower physical purchases of US$ 16 million (767 GWh).
In Brazil, operating costs increased by US$ 736 million, or 14.5%, in 2019, explained by:
| (i) | Operating costs from Enel Distribution Ceara decreased by US$ 45 million in 2019, which is mainly explained by US$ 77 million due to lower translation effects because of the devaluation of the Brazilian real against the U.S. dollar, a US$ 39 million decrease in construction costs from the application of IFRIC 12, and US$ 3 million in lower transport costs. This decrease was offset by US$ 74 million from higher energy purchases due to higher demand totaling US$ 60 million and higher prices from regulated industrial tariffs totaling US$ 14 million. |
150
In Colombia, operating costs of Codensa decreased by US$ 71 million, or 6.9 %, in 2019, mainly explained by US$ 104 million in lower translation effects due to the devaluation of the Colombian peso against the U.S. dollar. The cost increase was partially offset by (i) a US$ 12 million increase in energy purchases, mainly due to a higher average price of energy, (ii) a US$ 11 million increase in transport costs, and (iii) a US$ 11 million increase in variable services and supplies for line connections and maintenance charges.
In Peru, operating costs of Enel Distribution Peru increased by US$ 8 million, or 1.4%, in 2019, mainly explained by US$ 13 million from higher energy purchases to cover demand and US$ 5 million of higher variable costs for line connections and maintenance charges, offset by a decrease of US$ 10 million from the devaluation of the new Peruvian sol against the U.S. dollar.
Selling and Administrative Expenses
Selling and administrative expenses relate to salaries, and other compensation, depreciation, amortization and impairment losses, and office materials and supplies. The following table sets forth the selling and administrative expenses by reportable segments and by operating segments within such reportable segments for the years ended December 31, 2019, and 2018:
151
| | | | | | | | |
| | Year ended December 31, | ||||||
|
| 2019 |
| 2018 |
| Change |
| Change |
| | (in millions of US$) | | (in %) | ||||
Generation and Transmission Business in Argentina | | 151 | | 132 | | 19 | | 14.5 |
Costanera | | 85 | | 58 | | 27 | | 45.6 |
El Chocón | | 23 | | 29 | | (6) | | (21.9) |
Dock Sud | | 42 | | 40 | | 2 | | 5.5 |
Other | | 1 | | 4 | | (3.2) | | (76.2) |
Generation and Transmission Business in Brazil | | 71 | | 68 | | 3 | | 3.7 |
Cachoeira Dourada | | 20 | | 20 | | — | | — |
Fortaleza | | 26 | | 21 | | 5 | | 26.6 |
Cien | | 20 | | 25 | | (5) | | (19.2) |
EGP Volta Grande | | 4 | | 3 | | 1 | | 51.4 |
Other | | 1 | | — | | 1 | | n.a. |
Generation and Transmission Business in Colombia | | 144 | | 148 | | (4) | | (2.8) |
Emgesa | | 144 | | 148 | | (4) | | (2.8) |
Generation and Transmission Business in Peru | | 137 | | 139 | | (2) | | (1.1) |
Enel Generation Peru | | 108 | | 116 | | (8) | | (6.9) |
Enel Generation Piura | | 21 | | 22 | | (1) | | (4.5) |
Other | | 8 | | — | | 8 | | n.a. |
Total Generation and Transmission Business reportable segment | | 503 | | 487 | | 16 | | 3.3 |
| | | | | | | | |
Distribution Business in Argentina | | 362 | | 383 | | (21) | | (5.4) |
Edesur | | 362 | | 383 | | (21) | | (5.4) |
Distribution Business in Brazil | | 1,628 | | 1,230 | | 398 | | 32.4 |
Enel Distribution Rio | | 322 | | 311 | | 11 | | 3.5 |
Enel Distribution Ceara | | 241 | | 234 | | 7 | | 3.2 |
Enel Distribution Goias | | 422 | | 278 | | 144 | | 51.9 |
Enel Distribution Sao Paulo | | 643 | | 407 | | 236 | | 57.9 |
Distribution Business in Colombia | | 272 | | 292 | | (20) | | (7.0) |
Codensa | | 272 | | 292 | | (20) | | (7.0) |
Distribution Business in Peru | | 135 | | 126 | | 9 | | 6.8 |
Enel Distribution Peru | | 135 | | 126 | | 9 | | 6.8 |
Total Distribution Business reportable segment | | 2,397 | | 2,031 | | 366 | | 18.0 |
Less: consolidation adjustments and non-core activities | | 104 | | 87 | | 17 | | 19.0 |
Total selling and administrative expenses | | 3,004 | | 2,606 | | 398 | | 15.3 |
Selling and administrative expenses increased in 2019 as compared to 2018, mainly due to the acquisition of Enel Distribution Sao Paulo in mid-2018; otherwise, our selling and administrative expenses would have decreased. The main changes are explained below.
Generation and Transmission Business
In Argentina, selling and administrative expenses increased US$ 19 million, or 14.5%, in 2019, mainly due to:
| (i) | An impairment loss reversal of US$ 72 million from Costanera recorded in 2018, which includes a conversion difference of the Argentine peso against the U.S. dollar totaling US$ 28 million offset by (i) lower provisions for bad debts due to the application of IFRS 9 in 2018 for US$ 8 million, which includes a translation difference of the Argentine peso against the U.S. dollar totaling US$ 3 million, and (ii) lower depreciations of US$ 39 million, mainly due to the translation effects of the Argentine peso against the U.S. dollar. |
152
Distribution Business
In Argentina, staff expenses from Edesur decreased by US$ 52 million in 2019, which corresponds to (i) US$ 63 million in lower translation effects as a result of the devaluation of the Argentine peso against the U.S. dollar and (ii) US$ 12 million from the increase in labor costs. The decrease in expenses was partially offset by (i) US$ 19 million in salary increases mainly due to inflation and (ii) a US$ 4 million increase from the update of staff cost increases from the application of IAS 29.
Other expenses increased by US$ 36 million in 2019, mainly due to higher costs for services of network maintenance and network renewal and others totaling US$ 74 million, and US$ 11 million in higher expense by nature due to the IAS 29 inflation adjustment, offset by lower translation effects of US $ 50 million due to the devaluation of the Argentine peso against the U.S. dollar.
Additionally, provisions for bad debts decreased US$ 6 million due to the application of IFRS 9 in 2018.
In Brazil, selling and administrative expenses increased by US$ 398 million, or 32.4%, in 2019, primarily due to the following:
| (i) | Impairments from Enel Distribution Goias increased US$ 107 million, primarily due to US$ 111 million associated with accounts receivable in the state of Goiás. These receivables are linked to the Goiás Distribution Contribution Fund (FUNAC), created by the state of Goiás in order to gather and allocate financial resources for reimbursement to Enel Distribution Goias of contingency payments of any nature originating until the transfer to Eletrobrás of shareholding control, which occurred in January 2015. |
In Colombia, selling and administrative expenses from Codensa decreased US$ 20 million, or 7%, in 2019, mainly due to a decrease of US$ 11 million in other expenses due to the lower translation effects from the devaluation of the Colombian peso against the U.S. dollar and an US$ 8 million impairment loss reversal associated with the Rio Negro power plant.
In Peru, selling and administrative expenses from Enel Distribution Peru increased US$ 9 million, or 6.8%, in 2019, mainly due to (i) higher depreciation expenses of US $ 5 million due to higher activations; (ii) an increase of US$ 3 million in other expenses, mainly due to higher costs related to third-party service costs for line and network maintenance and other services; and (iii) an increase of US$ 1 million in staff expenses as a result of the end of contract payments.
153
Operating Income
The following table sets forth our operating income by reportable segments and by operating segments within such reportable segments for the years ended December 31, 2019 and 2018:
| | | | | | | | |
| | Year ended December 31, | ||||||
|
| 2019 |
| 2018 |
| Change |
| Change |
| | (in millions of US$) | | (in %) | ||||
Generation and Transmission Business in Argentina | | 155 | | 156 | | (1) | | (0.4) |
Costanera | | 60 | | 89 | | (29) | | (32.8) |
El Chocón | | 43 | | 33 | | 10 | | 30.3 |
Dock Sud | | 51 | | 34 | | 17 | | 50.3 |
Other | | 1 | | — | | 1 | | n.a. |
Generation and Transmission Business in Brazil | | 288 | | 211 | | 77 | | 36.7 |
Cachoeira Dourada | | 79 | | 102 | | (23) | | (22.8) |
Fortaleza | | 100 | | (16) | | 116 | | 706.7 |
Cien | | 50 | | 56 | | (6) | | (11.1) |
EGP Volta Grande | | 60 | | 69 | | (9) | | (12.6) |
Other | | (1) | | — | | (1) | | n.a. |
Generation and Transmission Business in Colombia | | 637 | | 633 | | 4 | | 0.6 |
Emgesa | | 637 | | 633 | | 4 | | 0.6 |
Generation and Transmission Business in Peru | | 255 | | 269 | | (15) | | (5.5) |
Enel Generation Peru | | 222 | | 239 | | (17) | | (7.1) |
Enel Generation Piura | | 33 | | 30 | | 3 | | 9.9 |
Other | | — | | — | | — | | n.a. |
Total Generation and Transmission Business reportable segment | | 1,335 | | 1,269 | | 65 | | 5.1 |
| | | | | | | | |
Distribution Business in Argentina | | 211 | | 78 | | 133 | | 170.5 |
Edesur | | 211 | | 78 | | 133 | | 170.5 |
Distribution Business in Brazil | | 707 | | 608 | | 99 | | 16.2 |
Enel Distribution Rio | | 164 | | 173 | | (9) | | (5.0) |
Enel Distribution Ceara | | 141 | | 140 | | 1 | | 0.7 |
Enel Distribution Goias | | 23 | | 158 | | (135) | | (85.4) |
Enel Distribution Sao Paulo | | 379 | | 138 | | 241 | | 175.2 |
Distribution Business in Colombia | | 431 | | 389 | | 42 | | 10.8 |
Codensa | | 431 | | 389 | | 42 | | 10.8 |
Distribution Business in Peru | | 196 | | 176 | | 20 | | 11.5 |
Enel Distribution Peru | | 196 | | 176 | | 20 | | 11.5 |
Total Distribution Business reportable segment | | 1,545 | | 1,251 | | 294 | | 23.5 |
Less: consolidation adjustments and non-core activities | | (111) | | (85) | | (26) | | 30.2 |
Total operating income | | 2,769 | | 2,435 | | 334 | | 13.7 |
Generation and Transmission Business
In Argentina, operating income in 2019 was stable compared to 2018, mainly due to the effects of the devaluation of the Argentine peso against the U.S dollar on Costanera, which was offset by the increase in income in El Chocón and Dock Sud, explained by the translation of sales to the U.S. dollar and income associated with the IAS 29 inflation adjustment.
In Brazil, operating income increased US$ 78 million, or 37.3%, in 2019 compared to 2018, mainly due to higher energy sales of Fortaleza as a result of higher demand, which was partially offset by the decrease in operating income in Cachoeira Dourada, EGP Volta Grande and Cien due to the devaluation of the Brazilian real against the U.S. dollar.
In Peru, operating income decreased US$ 15 million, or 5.5%, in 2019 compared to 2018, mainly due to a decrease in income for provisions that were recognized in 2018 related to the accidents in Central Térmica Ventanilla, Callahuanca, and Central Santa Rosa.
154
In Colombia, operating income increased US$ 4 million, or 0.6%, in 2019, mainly due to tariff increases, offset by lower physical sales and the effects of currency translation due to the devaluation of the Colombian peso against the U.S. dollar.
Distribution Business
Operating income increased US$ 293 million, or 23.4%, in 2019 compared to 2018, mainly due to the following:
In Argentina, operating income from Edesur increased US$ 133 million as a result of the regulatory agreement signed between Edesur and the Argentine National State, which settled the outstanding reciprocal claims arising in the transition period 2006-2016.
In Brazil, operating income from Enel Distribution Sao Paulo increased US$ 241 million as a result of higher energy sales and the effect of the tariff adjustment applied since July 2019. This was partially offset by the decrease in operating income of US$ 135 million in Enel Distribution Goias due to the effect of the 8% devaluation of the Brazilian real and the impairment loss of accounts receivable from the state of Goiás.
In Colombia, operating income from Codensa increased US$ 142 million due to higher energy sales and higher average sales prices, despite the lower translation effects due to the 11.1% devaluation of the Colombian peso against the U.S. dollar.
In Peru, operating income from Enel Distribution Peru increased US$ 20 million, explained by higher energy sales and higher average sales prices
Other Results
The following table sets forth the other results for the years ended December 31, 2019 and 2018:
| | | | | | | | |
| | Year ended December 31, | ||||||
|
| 2019 |
| 2018 |
| Change |
| Change |
| | (in millions of US$) | | (in %) | ||||
Financial results | | | | | | | | |
Financial income | | 450 | | 358 | | 92 | | 25.6 |
Financial costs | | (1,088) | | (1,072) | | 16 | | 1.5 |
Results for Hyperinflation | | 124 | | 270 | | (146) | | (54.0) |
Net foreign currency exchange gains (losses) | | 137 | | 111 | | 26 | | 23.4 |
Total | | (377) | | (333) | | (44) | | (13.2) |
| | | | | | | | |
Other | | | | | | | | |
Other gains (losses) | | 14 | | 1 | | 13 | | 1,300 |
Share of the profit of associates and joint ventures accounted for | | — | | 2 | | (2) | | (100) |
Total | | 14 | | 3 | | 11 | | 366.7 |
Total other results | | (363) | | (330) | | (33) | | (10.0) |
Financial Results
Our net total financial results in 2019 decreased by US$ 44 million compared to the loss registered in 2018. The variation is mainly explained by:
| ● | the application of IAS 29 in Argentina, which resulted in adjustments to the profit; and |
| ● | the application of inflation to non-monetary assets, liabilities, and results that are not determined on a current basis and translated to U.S. dollars at the year-end exchange rate. |
155
| ● | an increase of US$ 52 million in income from Enel Distribution Sao Paulo due to a full year of income compared to only seven months in 2018, mainly from the application of IFRIC 12 of US$ 51 million; |
| ● | an increase of US$ 42 million in income in Argentina, mainly from accounts receivable from VOSA; |
| ● | an increase of US$ 14 million in the income from Fortaleza from financial updates of PIS/COFINS taxes receivable; and |
| ● | a decrease in income as a result of the translation effects of the functional currencies of our foreign subsidiaries to the U.S. dollar, mainly the Argentine peso amounting to US$ 16 million. |
| ● | an increase in financial costs in Enel Brasil of US$ 84 million related to the debt with Enel Finance International for the purchase of Enel Distribution Sao Paulo; |
| ● | an increase of US $ 25 million related to the subsidiaries due to the update of the post-employment benefit obligations; |
| ● | a decrease of US $ 55 million in financial costs related to the financial debt of banks, bonds, and financial leasing; |
| ● | a decrease of US $ 27 million in financial costs from updating provisions for legal claims; and |
| ● | a decrease of US $ 20 million in financial debts of Argentine subsidiaries for its debt to CAMMESA. |
| ● | an increase of US$ 48 million in positive change related to receivables in foreign currencies for VOSA credits in Argentina, of which El Chocón is responsible for US$ 20 million, Costanera for US$ 19 million, and Dock Sud for US$ 9 million; |
| ● | an increase of US$ 47 million in positive exchange rates for transactions between related companies and denominated in U.S. dollars for financing provided by Enel Américas to Enel Brasil; and |
| ● | a decrease of US$ 69 million as a result of the devaluation of the Argentine peso against the U.S. dollar. |
Other Non-Operating Results
Other non-operating results increased in 2019 for the sales of assets by Enel Distribution Peru.
156
Income Taxes
Total income tax expense decreased US$ 202 million in 2019 compared to 2018, explained by:
| (i) | a decrease of US$ 478 million in tax expense from Enel Distribution Sao Paulo, resulting from the nonrecurring tax benefit from its downstream merger with Enel Sudeste in 2018; |
| (ii) | a decrease of US$ 30 million from El Chocón, explained by the effects of the devaluation of the Argentine peso against the U.S. dollar by US$ 19 million and lower taxes by US$ 11 million due to lower results compared to 2018; |
| (iii) | a decrease of US$ 25 million in tax expense from Dock Sud, mainly explained by a tax benefit originated by the revaluation of its fiscal non-monetary assets and liabilities; |
| (iv) | a decrease of US$ 25 million in tax expense from Edesur, mainly the result of US$ 39 million from the effects of the devaluation of the Argentine peso against the U.S. dollar, offset by an increase of US$ 14 million in expenses due to better financial results in 2019 compared to 2018; and |
| (v) | a decrease of US$ 17 million in tax expense from Enel Américas, mainly due to tax refunds from taxes paid in previous periods and a higher tax credit in 2019. |
The foregoing was partially offset by higher tax expenses from:
| (i) | Enel Distribution Goias for US$ 307 million, due to the recognition of deferred tax assets on the tax loss of US$ 347 million registered in 2018, offset by lower taxes registered as a result of the impairment of the account receivable from the state of Goiás (FUNAC) for US$ 37 million; |
The effective or statutory tax rate was 9.8% in 2019 and 20.8% in 2018. This decrease is mainly due to the recognition of deferred tax assets in Enel Distribution Goias and in Enel Distribution Sao Paulo due to the recognition of deferred tax assets that arose from the merger with Enel Sudeste.
The following table sets forth the tax effect of rates applied in other countries that result in a difference between domestic or nominal tax rates in Chile (5.2% for 2019 and 6.6% for 2018) and tax rates enacted in each foreign jurisdiction.
| | | | | | | | |
| | Nominal Tax Rates (%) | | Tax effect of rates applied in | ||||
|
| 2019 |
| 2018 |
| 2019 |
| 2018 |
Argentina | | 30.0 | | 30.0 | | (18.1) | | (15.9) |
Brazil | | 34.0 | | 34.0 | | (41.8) | | (26.3) |
Colombia | | 33.0 | | 37.0 | | (55.7) | | (86.3) |
Peru | | 29.5 | | 29.5 | | (10.3) | | (11.3) |
Total | | — | | — | | (125.9) | | (139.8) |
157
Net Income
The following table sets forth our consolidated income before income taxes, income taxes and net income for the years ended December 31, 2019 and 2018.
| | | | | | | | |
| | Year ended December 31, | ||||||
|
| 2019 |
| 2018 |
| Change |
| Change |
| | (in millions of US$) | | (in %) | ||||
Operating income | | 2,769 | | 2,435 | | 335 | | 13.8 |
Other results | | (363) | | (330) | | (33) | | 10.1 |
Income before income taxes | | 2,406 | | 2,105 | | 301 | | 14.3 |
Income taxes | | (236) | | (438) | | 202 | | 46.0 |
Net Income | | 2,170 | | 1,667 | | 503 | | 30.3 |
Net income attributable to: | | | | | | | | |
Net income attributable to the parent company | | 1,614 | | 1,201 | | 413 | | 34.4 |
Net income attributable to non-controlling interests | | 556 | | 466 | | 91 | | 19.3 |
B.Liquidity and Capital Resources.
Our primary assets are the stocks of our subsidiaries. The following discussion of cash sources and uses reflects the key drivers of our cash flow.
As a holding company, we receive cash from our subsidiaries and related companies. Our subsidiaries and associates’ cash flows may not always be available to satisfy our liquidity needs, mainly because they are not wholly-owned, but also because there is typically a time lag before we have access to those funds through dividends or capital reductions. However, we believe that cash flow generated from our business operations, cash balances, borrowings from commercial banks, short- and long-term intercompany loans, and ample access to the capital markets will continue to satisfy all our needs for working capital, debt service, dividends, and routine capital expenditures.
Set forth below is a summary of our consolidated cash flow information for the years ended December 31, 2020, 2019, and 2018.
| | | | | | |
| | Year ended December 31, | ||||
|
| 2020 |
| 2019 |
| 2018 |
| | (in millions of US$) | ||||
Net cash flows provided by operating activities | | 2,426 | | 2,528 | | 1,845 |
Net cash flows used in investing activities | | (1,536) | | (1,600) | | (3,069) |
Net cash flows from (used in) financing activities | | (1,187) | | (823) | | 1,867 |
Net increase (decrease) in cash and cash equivalents before effect of exchange rates changes | | (297) | | 105 | | 642 |
Effects of exchange rate changes on cash and cash equivalents | | (135) | | (70) | | (211) |
Cash and cash equivalents at the beginning of the period | | 1,939 | | 1,904 | | 1,473 |
Cash and cash equivalents at the end of the period | | 1,507 | | 1,939 | | 1,904 |
For the year ended December 31, 2020, net cash flows provided by operating activities totaled US$ 2,426 million, a decrease of US$ 102 million, or 4%, compared to 2019. This decrease is mainly explained by:
| (i) | a reduction of US$ 3,639 million in cash collections from the sale of goods and services mainly related to the impact of the Covid-19 pandemic on the devaluation of the local currency, lockdown periods that led to lower energy consumption and lower collection rates, all of which is mainly explained by decreases of: |
| a) | US$ 3,211 million from Enel Brasil mainly explained by lower collections of: |
| ◾ | US$ 1,614 million by Enel Distribution Sao Paulo, |
| ◾ | US$ 703 million by Enel Distribution Goias, |
| ◾ | US$ 551 million by Enel Distribution Rio, and |
| ◾ | US$ 410 million by Enel Distribution Ceara; |
| b) | US$ 228 million from Edesur in Argentina, |
| c) | US$ 142 million from Codensa in Colombia, |
| d) | US$ 106 million from Enel Distribution Peru. |
These reductions in operating activities were partially offset by:
| (i) | an increase in cash flow due to a decrease of US$ 1,710 million in other payments for operating activities, mainly explained by (i) a decline of US$ 1,476 million in payments by Enel Brasil, caused by the effects of the devaluation of the Brazilian real against the U.S. dollar in our energy distribution subsidiaries and (ii) a decrease of US$ 228 million in payments by Codensa, attributed to the devaluation of the Colombian peso against the U.S. dollar and lower payments in “Codensa Hogar,” a program oriented to our residential customers to purchase products and services marketed by various business partners; |
| (ii) | an increase in cash flows due to a decrease of US$ 1,158 million in payments to suppliers for goods and services, mainly explained by the devaluation of the local currencies against the U.S. dollar of: |
| a) | US$ 789 million from Enel Brasil, driven by decreases of |
| ◾ | US$ 518 million from Enel Distribution Sao Paulo, |
| ◾ | US$ 186 million in payments from Enel Distribution Rio, |
| ◾ | US$ 123 million from Enel Distribution Goias, |
partially offset by US$ 30 million in higher Enel Brasil payments of technical services;
| b) | US$ 253 million from Edesur; |
| c) | US$ 126 million from Codensa; |
| (iii) | an increase of US$ 441 million in other cash collections from operating activities, mainly explained by an increase of US$ 617 million from Enel Brasil, on a consolidated basis, explained by collections related to the “Covid Account” (see Note 10 of the Notes to our consolidated financial statements): |
| a) | US$ 255 million from Enel Distribution Sao Paulo, |
| b) | US$ 115 million from Enel Distribution Ceara, |
| c) | US$ 133 million from Enel Distribution Rio, and |
| d) | US$ 114 million from Enel Distribution Goias; |
| (iv) | an increase in cash flows due to a US$ 136 million decrease in payments to employees, mainly from decreases associated with the devaluation of the local currencies: |
| a) | US$ 115 million from Enel Brasil, |
| b) | US$ 20 million from our Argentine subsidiaries. |
| (v) | an increase in cash flow due to a decrease of US$ 57 million in other outflows, mainly from Enel Brasil, explained by the devaluation of the Brazilian real against the U.S. dollar. |
| (vi) | an increase in cash flow due to a decrease of US$ 34 million in income tax payments, related to a reduction of US$ 66 million from Enel Brasil, on a consolidated basis, mainly due to the devaluation of the Brazilian real against the U.S. dollar and lower payments by Enel Distribution Rio and Enel |
159
| Distribution Goias, partially offset by higher payments from Emgesa and Codensa of US$ 22 million and US$ 11 million, respectively. |
For the year ended December 31, 2019, net cash flows stemming from operating activities totaled US$ 2,528 million, an increase of US$ 683 million, or 37%, compared to 2018. This increase is mainly explained by a rise in the type of collections from operating activities:
| (i) | an increase of US$ 1,963 million in cash collections from the sale of goods and services mainly related to: |
| a) | an increase of US$ 2,368 million from Enel Brasil, on a consolidated basis, primarily explained by an increase of US$ 2,585 million from Enel Distribution Sao Paulo as a result of its acquisition in June 2018, partially offset by |
| b) | decreases of US$ 367 million and US$ 41 million in collections from Emgesa and Codensa, respectively. |
| (ii) | an increase of US$ 76 million in other cash collections from operating activities mainly explained by: |
| a) | an increase of US$ 101 million from Enel Brasil associated primarily with the acquisition of Enel Distribution Sao Paulo and a litigation settlement in favor of Enel Distribution Rio, partially offset by |
| b) | a decrease of US$ 22 million in collections mainly from Codensa Hogar, a program for the sale of products and services marketed by various business partners to our residential customers. |
These effects were partially offset by the type of cash payments from operating activities mainly from:
| (i) | an increase of US$ 746 million in payments to suppliers for goods and services primarily explained by: |
| a) | an increase of US$ 1,086 million from Enel Brasil, explained by an increase of US$ 1,460 million from Enel Distribution Sao Paulo, offset by a decrease of US$ 137 million in payments from Enel Distribution Ceara, US$ 66 million from Enel Distribution Rio, and US$ 171 million from other subsidiaries, mainly due to exchange rate differences arising from the devaluation of the Brazilian real against the U.S. dollar; |
| b) | a decrease of US$ 243 million from Emgesa; |
| c) | a decrease of US$ 67 million from Enel Distribution Peru, due to lower energy purchase payments and impact from other suppliers; and |
| d) | a decrease of US$ 34 million from Codensa due to an increase in purchases of energy and tolls. |
| (ii) | an increase of US$ 496 million in other payments for operating activities related to an increase of US$ 504 million from Enel Brasil, mainly explained by US$ 601 million from Enel Distribution Sao Paulo, as a result of our acquisition in June 2018, and US$ 32 million from Enel Distribution Rio associated with VAT payments and the payments to the Energy Development Account, offset by a decrease of US$ 65 million and US$ 61 million from Enel Distribution Goias and Enel Distribution Ceara, respectively, associated with VAT payments and the payments to the Energy Development Account, respectively (In Brazil, Law No. 10,438/2002 created the “Conta de Desenvolvimento Energético” (“CDE”). The CDE is a government fund that aims to promote alternative energy sources and the globalization of energy services and subsidizes low-income residential customers. The fund is financed through charges included in consumer and generator tariffs and government contributions.); |
160
| (iii) | an increase of US$ 81 million in payments to and on behalf of employees, mainly from: |
| a) | an increase of US$ 151 million from Enel Brasil Group, mostly from Enel Distribution Sao Paulo for US$ 133 million, offset by: |
| b) | a decrease of US$ 53 million from our Argentine subsidiaries, mainly due to the devaluation of the Argentine peso against the U.S. dollar; and |
| c) | a decrease of US$ 11 million from Codensa; and |
| (iv) | an increase of US$ 25 million in other outflows of cash, mainly from Enel Brasil, due to taxes on financial operations. |
For further information regarding our operating results in 2020, 2019, and 2018, please see “Item 5. Operating and Financial Review and Prospects — A. Operating Results — 2. Analysis of Results of Operations for the Years Ended December 31, 2020, and 2019” and “— 3. Analysis of Results of Operations for the Years Ended December 31, 2019, and 2018.”
For the year ended on December 31, 2020, net cash flows used in investment activities were outflows amounting to US$ 1,536 million, representing a decrease of US$ 64 million, or 4.0%, compared to 2019, mainly from:
| (i) | US$ 814 million in investments on fixed assets realized by our subsidiaries including: |
| a) | US$ 385 million from Codensa, |
| b) | US$ 127 million from Enel Distribution Peru, |
| c) | US$ 103 million from Edesur, |
| d) | US$ 86 million from Emgesa, |
| e) | US$ 44 million from Enel Generation Peru, and |
| f) | US$ 29 million from Enel Generation Costanera; |
| (ii) | US$ 740 million for the incorporation of intangible assets (under IFRIC 12) of our Brazilian distribution subsidiaries; and |
| (iii) | US$ 39 million in investments in time deposits with a maturity greater than 90 days. |
These effects were offset by US$ 43 million of interest income received.
For the year ended on December 31, 2019, net cash flows used in investment activities were outflows amounting to US$ 1,600 million, representing a decrease of US$ 1,469 million, or 47.9%, compared to 2018, mainly from:
| (i) | US$ 892 million in investments on fixed assets realized by our subsidiaries, mainly explained by US$ 306 million from Codensa, US$ 186 million from Edesur, US$ 165 million from Enel Distribution Peru, US$ 108 million from Emgesa, US$ 43 million from Enel Generation Peru, and US$ 34 million from Dock Sud; |
| (ii) | US$ 767 million for the incorporation of intangible assets (under IFRIC 12) of our Brazilian distribution subsidiaries; and |
| (iii) | US$ 98 million in cash flows used in the purchase of non-controlling interests, as a result of Enel Brasil increasing its ownership interest in Enel Distribution Sao Paulo by 4.1% in November and December 2019, by acquiring 8,133,352 additional shares and reaching 100% ownership. |
161
These cash flows in investment activities were offset by US$ 112 million of interest income received.
For further information regarding the acquisition of fixed assets in 2020 and 2019, please see “Item 4. Information on the Company — A. History and Development of the Company — Capital Investments, Capital Expenditures, and Divestitures.”
For the year ended December 31, 2020, net cash flows used in financing activities amounted to US$ 1,187 million, reflecting an increase of US$ 364 million, or 44.2% compared to 2019, mainly due to:
| (i) | US$ 1,646 million of bank loans and bonds, including: |
| a) | US$ 480 million in loans granted to Enel Américas; |
| b) | US$ 301 million in loans and bonds for Codensa; |
| c) | US$ 275 million in loans for Enel Peru; |
| d) | US$ 167 million in loans for Enel Distribution Sao Paulo; |
| e) | US$ 132 million in loans for Enel Distribution Peru; |
| f) | US$ 103 million in loans for Enel Distribution Ceara; |
| g) | US$ 78 million in loans for Enel Distribution Rio; |
| h) | US$ 45 million in loans for Enel Distribution Goias; |
| i) | US$ 24 million in loans for Enel Generation Piura; |
| (ii) | US$ 295 million in loans from EFI, a related company, of which US$ 150 million were granted to Enel Américas and US$ 145 million to Enel Distribution Rio; |
| (iii) | US$ 110 million in other cash inflows, mainly due to collections of derivatives contracts; |
| (iv) | US$ 1,776 million in payments of loans and bonds (including US$ 511 million paid by us, US$ 454 million by Enel Distribution Goias, US$ 222 million by Enel Distribution Rio, US$ 122 million by Enel Peru, US$ 104 million by Emgesa, US$ 82 million by Enel Distribution Ceara, US$ 80 million by Enel Distribution Peru, US$ 62 million by Fortaleza, US$ 58 million by Codensa, and US$ 45 million by Enel Distribution Sao Paulo); |
| (v) | US$ 1,058 million in dividend payments to third parties, excluding dividends paid to us. These payments mainly comprise US$ 798 million paid by us, on a stand-alone basis, US$ 117 million by Emgesa, US$ 77 million by Codensa, US$ 29 million by Enel Generation Peru, and US$ 12 million by Enel Generation Chocón; |
| (vi) | US$ 327 million in interest expense (including US$ 61 million paid by Emgesa, US$ 42 million by Codensa, US$ 37 million by us, US$ 33 million by Enel Distribution Sao Paulo, US$ 32 million by Enel Distribution Rio, US$ 29 million by Enel Distribution Peru, US$ 25 million by Edesur, US$ 23 million by Enel Distribution Goias, US$ 18 million by Enel Distribution Ceara, and US$ 15 million by Fortaleza); and |
| (vii) | US$ 77 million lease liability payments. |
For the year ended December 31, 2019, net cash flows used in financing activities amounted to US$ 823 million, reflecting a decrease of US$ 2,690 in payments compared to net cash provided by financing activities in 2018. The main drivers of this outgoing cash flow were:
162
| (i) | US$ 3,000 million in proceeds from the share issuance for Enel Américas’ capital increase, net of insurance costs; |
| (ii) | US$ 4,899 million of bank loans and bond financing, mainly explained by: |
| a) | US$ 2,461 million in loans granted to Enel Brasil to pay its debt with EFI, a related company, which refinanced our acquisition of Enel Distribution Sao Paulo; |
| b) | US$ 620 million in loans and bonds granted to/issued by Enel Distribution Goias; |
| c) | US$ 557 million in bonds issued by Enel Distribution Sao Paulo; |
| d) | US$ 440 million in loans and bonds granted to/issued by Enel Distribution Rio; |
| e) | US$ 314 million in loans and bonds granted to/issued by Enel Distribution Ceara; |
| f) | US$ 238 million in loans and bonds granted to/issued by Codensa; |
| g) | US$ 192 million in bonds issued by EGP Volta Grande; |
| (iii) | US$ 120 million in other cash inflows, mainly due to collections of derivatives contracts; |
| (iv) | US$ 4,782 million in payments of loans and bonds (including US$ 2,470 million paid by Enel Brasil, US$ 486 million by Enel Distribution Sao Paulo, US$ 469 million by Enel Distribution Goias, US$ 344 million by Enel Distribution Rio, US$ 263 million by EGP Volta Grande, US$ 249 million by Emgesa, US$ 212 million by Codensa, and US$ 170 million by Enel Distribution Ceara); |
| (v) | US$ 2,662 million of debt payment to EFI for the purchase of Enel Distribution Sao Paulo, which payment was made with the cash proceeds of the Enel Américas capital increase. |
| (vi) | US$ 724 million in dividend payments to third parties, excluding dividends paid to us (including US$ 479 million paid by us, on a stand-alone basis, US$ 110 million by Emgesa, US$ 68 million by Codensa, US$ 22 million by El Chocón, US$ 16 million by Enel Generation Peru, and US$ 7 million by Enel Distribution Peru, among others); |
| (vii) | US$ 615 million in interest expense (including US$ 176 million paid by Enel Brasil, US$ 84 million by Emgesa, US$ 77 million by Enel Distribution Sao Paulo, US$ 52 million by Codensa, US$ 52 million by Enel Distribution Rio, US$ 50 million by Enel Distribution Goias, US$ 37 million by us, US$ 31 million by Enel Distribution Ceara, and US$ 15 million by EGP Volta Grande); and |
| (viii) | US$ 59 million of payments of lease liabilities. |
For a description of liquidity risks resulting from the inability of our subsidiaries to transfer funds, please see “Item 3. Key Information — D. Risk Factors — We depend on payments from our subsidiaries and associates to meet our payment obligations.”
We coordinate the overall financing strategy of our controlled subsidiaries. However, our operating subsidiaries independently develop their capital expenditure plans and finance their capital expansion programs through internally generated funds or direct financings. We have no legal obligations or other commitments to support our subsidiaries financially. In some cases, our subsidiaries may be financed by us through intercompany loans. For information regarding our commitments for capital expenditures, see “Item 4. Information on the Company — A. History and Development of the Company — Capital Investments, Capital Expenditures, and Divestitures” and our contractual obligations table set forth below under “Item 5. Operating and Financial Review and Prospects — F. Tabular Disclosure of Contractual Obligations. Notwithstanding our corporate policy in connection with the expectation of financial autonomy for our subsidiaries, we have provided financial support to some of our foreign subsidiaries to a minimal extent in the past.
163
As of December 31, 2020, our consolidated debt totaled US$ 6,090 million. Our consolidated interest-bearing debt had the following maturity profile:
| | | | | | | | |
Company | | 2021 | | 2022-2023 | | 2024-2025 | | After 2025 |
|
| (in millions of US$) | ||||||
Enel Américas | | 2,017 | | 1,453 | | 1,269 | | 1,351 |
Set forth below is a breakdown by country for debt maturing in 2021:
| | |
Country | | 2021 |
|
| (in millions of US$) |
Argentina | | 6 |
Brazil | | 807 |
Colombia | | 459 |
Peru | | 258 |
Chile | | 487 |
We have accessed the international equity capital markets (including several SEC-registered ADS issuances by our predecessor) in 1993, 1996, 2000, 2003, 2013, and 2019. Since 1996, we have also issued a total of US$ 1,750 million in bonds in the United States (“Yankee Bonds”).
The following table lists the Yankee Bonds issued by us outstanding as of December 31, 2020. The weighted -average annual coupon interest rate for such bonds is 4.00%, without giving effect to each bond’s duration or put options.
| | | | | | | | | | |
| | | | | | | | Aggregate Principal Amount | ||
Issuer |
| Term |
| Maturity |
| Coupon |
| Issued |
| Outstanding |
| | | | | | (%) | | (in millions of US$) | ||
Enel Américas | | 10 years | | October 2026 | | 4.00 | | 600 | | 600 |
Enel Américas(1) | | 30 years | | December 2026 | | 6.60 | | 150 | | 1 |
Total | | | | | | 4.00(2) | | 750 | | 601 |
| (1) | Holders of our 6.6% Yankee Bonds due 2026 exercised a put option on December 1, 2003, for an aggregate principal amount of US$ 149 million, leaving less than US$ 1 million outstanding. |
| (2) | Weighted-average coupon by outstanding amount. |
The following table lists Emgesa’s bond issued in the United States. The bond is denominated in Colombian pesos, with an annual interest rate of 9.11%.
| | | | | | | | | | | | |
| | | | | | | | Aggregate Principal Amount | ||||
Issuer |
| Term |
| Maturity |
| Coupon |
| Issued |
| Outstanding | ||
| | | | | | (%) | | (in billions of COP$) | | (in billions of COP$) | | (in millions of US$)(1) |
Emgesa | | 10 years | | January 2021 | | 9.11 | | 737 | | 737 | | 215 |
| (1) | Calculated based on the exchange rate as of December 31, 2020, which was COP$ 3,432.50 per US$ 1.00. |
We, and our subsidiaries in the countries in which we operate, have access to the domestic capital markets where we have issued debt instruments, including commercial paper and medium and long-term bonds that are primarily sold to pension funds, life insurance companies, and other institutional investors.
164
The following table lists UF-denominated Chilean bonds issued by us outstanding as of December 31, 2020.
| | | | | | | | | | | | |
| | | | | | | | Aggregate Principal Amount | ||||
Issuer |
| Term |
| Maturity |
| Coupon |
| Issued |
| Outstanding | ||
| | | | | | (%) | | (in millions of UF) | | (in millions of UF) | | (in millions of US$) |
Enel Américas Series B2 | | 21 years | | June 2022 | | 5.75 | | 2.5 | | 0.3 | | 11 |
For a complete description of local bonds issued by us, see “Secured and unsecured liabilities by company” in Note 20 of the Notes to our consolidated financial statements.
The following table lists our foreign subsidiaries’ local bonds, outstanding as of December 31, 2020. We present aggregate information for each company. The maturity column for each company reflects the issuance with the longest maturity, and the coupon rate corresponds to the weighted-average coupon of all issuances for each company.
| | | | | | |
Issuer |
| Maturity |
| Coupon(1) |
| Aggregate Principal |
| | | | (%) | | (in millions of US$) |
Enel Distribution Sao Paulo | | May 2026 | | 4.56 | | 717 |
Codensa | | April 2030 | | 5.71 | | 694 |
Emgesa | | May 2030 | | 6.31 | | 567 |
Enel Distribution Peru | | November 2038 | | 6.10 | | 339 |
Enel Distribution Ceara | | June 2025 | | 6.84 | | 294 |
Enel Distribution Rio | | March 2024 | | 2.99 | | 192 |
EGP Volta Grande | | October 2029 | | 8.22 | | 146 |
Enel Generation Peru | | January 2028 | | 6.00 | | 17 |
Total | | | | | | 2,967 |
| (1) | Many of the coupon rates are variable rates based on local indices, such as inflation. The table reflects the coupon rate taking into account each local index as of December 31, 2020. |
We frequently participate in the international commercial bank markets and have access to fully committed credit lines. As of December 31, 2020, the outstanding balance of the committed credit lines was as follows:
| | | | | | | | |
Borrower |
| Type |
| Maturity |
| Facility Amount |
| Amount Drawn |
| | | | | | (in millions of US$) | | (in millions of US$) |
Enel Américas | | Syndicated revolving loan | | February 2021 | | 1,000 | | 175 |
Enel Américas | | Syndicated revolving loan | | February 2021 | | 150 | | 150 |
Enel Américas | | Syndicated revolving loan | | May 2021 | | 150 | | 150 |
Total | | | | | | 1,300 | | 475 |
As detailed below, our subsidiaries also had access to fully committed credit lines in the local markets as of December 31, 2020.
| | | | | | | | |
Borrower |
| Type |
| Last Maturity |
| Facility Amount |
| Amount Drawn |
| | | | | | (in millions of US$) | | (in millions of US$) |
Enel Brasil | | Bilateral revolving loan | | June 2021 | | 206 | | — |
Emgesa | | Bilateral revolving loan | | March 2021 | | 65 | | — |
Enel Distribution Peru | | Bilateral revolving loan | | September 2021 | | 62 | | — |
Codensa | | Bilateral revolving loan | | March 2021 | | 60 | | — |
Total | | | | | | 393 | | — |
165
We have access to fully committed undrawn revolving loans, both international and domestic. The disbursements are not subject to compliance with a condition precedent regarding the non-occurrence of a “Material Adverse Effect” (or MAE, as defined contractually), thus allowing us total flexibility to draw down, under any circumstances including situations involving a MAE, up to US$ 1.7 billion in the aggregate as of December 31, 2020. Additionally, in February 2021, we entered into a committed syndicated revolving loan for a total amount of US$ 500 million, maturing in February 2024, with an interest rate of 1.08% plus LIBOR multiplied by the Statutory Reserve Rate. As of March 31, 2021 the outstanding balance amounted to US$ 113 million.
We also borrow routinely from uncommitted Chilean bank facilities with approved lines of credit for US$ 1 million in the aggregate, none of which are currently drawn. Unlike the committed lines described above, which are not subject to any MAE condition precedent before disbursements, these facilities are subject to a greater risk of not being disbursed in the event of an MAE. They could limit our liquidity under such circumstances. Our subsidiaries also have access to uncommitted local bank facilities for a total amount of US$ 316 million, which were undrawn as of December 31, 2020 and as of the date of this report.
Except for our SEC-registered Yankee Bonds, which are not subject to financial covenants, our outstanding debt facilities include financial covenants. The types of financial covenants, and their respective limits, vary from one kind of debt to another. As of December 31, 2020, the most restrictive financial covenant affecting us was the Ratio of Assets subject to Guarantees, corresponding to the Series B2 Chilean bonds due in June 2022. Under such covenant, the maximum additional assets that could be subject to guarantees without a breach is US$ 3.2 billion. As of December 31, 2020, and as of the date of this Report, our subsidiaries and we comply with the covenants contained in our debt instruments.
As is customary in the credit and capital market debt facilities, a significant portion of our financial indebtedness is subject to cross-default provisions. Each of the revolving credit facilities described above and our Yankee Bonds have cross-default provisions with different definitions, criteria, materiality thresholds, and applicability as to the subsidiaries that could give rise to a cross-default.
The cross-default provision of our syndicated revolving loans may be triggered by one of our other debts, on an individual basis, with an outstanding principal exceeding US$ 150 million.
Cross-default provisions of our Yankee Bonds, issued in 2016, maturing in October 2026, may be triggered by another debt of ours or by Significant Subsidiaries, as defined in the indenture. A matured default on an individual basis could result in a cross-default to our Yankee Bonds if such matured default, on an individual basis, has a principal exceeding US$ 150 million or its equivalent in other currencies. Additionally, in the Yankee Bonds issued in 1996, maturing in December 2026, the cross-default could be triggered only by other debt of Enel Américas, on an individual basis, exceeding US$ 30 million or its equivalent in other currencies.
In the case of a matured default above the materiality threshold, Yankee Bondholders would have the option to accelerate the debt if either the trustee or bondholders representing no less than 25% of the aggregate debt of a particular series then outstanding choose to do so. All of our Yankee Bonds are unsecured and not subject to any guarantees by any of our subsidiaries or parent company or contain any financial covenants. Our local bonds do not have subsidiary cross-default provisions. They can be triggered only by default of Enel Américas if the amount in default, on an individual or aggregate basis, exceeds 3% of the Total Consolidated Assets, as defined in its respective contract.
Payment of dividends and distributions by our subsidiaries and affiliates represent an essential source of funds for us. The payment of dividends and distributions by certain subsidiaries and affiliates are potentially subject to legal restrictions, such as legal reserve requirements, capital and retained earnings criteria, and other contractual conditions. Legal counsel in the countries where our subsidiaries and affiliates operate has informed us of the current legal restrictions regarding the payment of dividends or distributions in the jurisdictions where such subsidiaries or affiliates are incorporated. We are currently in compliance with legal restrictions that could otherwise affect the payment of dividends or distributions to us. Certain credit facilities and investment agreements of our subsidiaries or affiliates restrict dividends or distributions in exceptional circumstances. For a description of liquidity risks resulting from our company status, please see “Item 3. Key Information — D. Risk Factors —We depend on payments from our subsidiaries and associates to meet our payment obligations.”
166
We expect to be able to refinance our indebtedness as it becomes due, fund our purchase obligations with internally generated cash, and fund capital expenditures with a mixture of internally generated cash and borrowings.
LIBOR Transition
The U.K. Financial Conduct Authority found that the London Interbank Offered Rate (“LIBOR”) had inconsistencies in its calculations and recommended that it be based on actual transactions. As a result, the authority agreed to stop requiring banks to comply with the submission of interbank rates to calculate LIBOR as of December 31, 2021. On March 5, 2021, LIBOR succession dates (December 31, 2021 for EUR, CHF, JPY, and GBP LIBOR for all tenors and one week and two month USD LIBOR and June 30, 2023 for all other USD LIBOR tenors) were announced. LIBOR will be discontinued, and alternative benchmark rates are expected to replace it. Currently, there is no consensus as to a replacement benchmark rate. Still, market participants expect a risk-free rate, such as the Secured Overnight Financing Rate (“SOFR”), a broad measure of the cost of overnight borrowing, collateralized by U.S. Treasury securities, to replace LIBOR in operations involving U.S. banks.
This reform may affect us in the following ways:
| ● | Interest payments on loans and derivatives: Financial risks arising from using a new benchmark rate, where interest payments previously based on LIBOR may increase or decrease. There is also a risk concerning data availability relating to the timely disclosure of market information, which may also affect the effectiveness of hedges. |
| ● | Financial systems: Operational risk arising from the necessity to modify and adapt our financial systems to report, evaluate, or calculate payments under the new required benchmark rates. |
| ● | Fair value measurement: Financial risks arising from how changes to benchmark rates in our debt obligations could adversely affect fair value measurements. |
| ● | Contracts: Legal and financial risk relating to the renegotiation of ISDA and local derivative contracts. |
In February 2021, Enel Américas executed a Senior Unsecured Revolving Credit Agreement with third parties that includes specific language regarding the replacement of LIBOR with an alternative interest rate that accounts for the prevailing market convention for determining a rate of interest for syndicated loans in the United States at that time.
As of December 31, 2020, our debt exposure to LIBOR was US$ 605 million. Although we have debt obligations that refer to LIBOR that expire after 2021, all of them include provisions to transition from LIBOR to an alternative benchmark rate. However, at this time, we cannot determine the extent that these changes will affect us.
C. Research and Development, Patents and Licenses, etc.
None.
D. | Trend Information. |
Through our subsidiaries and affiliates, we engage in the generation, distribution, and transmission of electricity in Argentina, Brazil, Colombia, and Peru. With the merger with EGP Américas effective on April 1, 2021, we added exposure to other countries in Central America, including Costa Rica, Guatemala and Panama.
The electricity sector continues to experience more restrictive government regulations, new technologies and business models, and greater competition. Our businesses depend on a wide range of conditions that may result in significant variability in our earnings and cash flows from year to year. We seek to establish a conservative and well-balanced commercial policy on a country-by-country basis to control relevant variables, reduce risks, and stabilize the results of our operations.
167
Generation
With the consolidation of EGP Américas, we added 3.6 GW of installed capacity, and in advance development stage that runs until 2024 there are another 4.3 GW. We expect that renewable energy will boost the growth of our generation business in the long term. The merger with EGP Américas increased our capacity by 70%, from 11.3 GW to 19.1 GW, with a high weighting on additional power, especially from Brazil, Colombia, and Peru. We have a potential pipeline of an additional 22 GW, which will be the base for our expected renewable energy growth after 2024.
Several factors may affect our operating income, including contracted electricity prices, prevailing hydrological conditions, fuel cost used to generate thermal electricity, contracted obligations, generation mix, and the electricity prices in the spot market, among others.
Sales prices and energy costs in each market where we operate are among the main drivers of the results of operations of our electricity generation business. The quantity of electricity sold has been generally stable over time, with increases reflecting economic and demographic growth. Our profits from contracted sales rely on our ability to generate or buy electricity at a cost lower than contracted prices. However, the applicable price for electricity sales and purchases in the spot market is more challenging to predict because the spot generation price is influenced by several factors, including hydrology and fuel prices, which can differ significantly in each of the countries where we operate. Abundant hydrological conditions generally lower spot prices, while dry conditions increase them. However, renewable energy generation may partially mitigate these effects on prices.
Our operating income might not be adversely impacted even when we must buy electricity at high prices in the spot market if our commercial policy is appropriately managed. Our goal is to have a conservative and well-balanced commercial policy that controls relevant variables, stabilizes our profits and mitigates our exposure to the spot market’s volatility. We do so by contracting a significant portion of our expected electricity generation through long-term electricity supply contracts. The optimal level of electricity supply commitments protects us against low marginal cost conditions, such as those existing during a rainy season, while still taking advantage of high marginal cost conditions, such as higher spot market prices during dry years. To determine the optimal mix of long-term contracts and sales in the spot market, we project our aggregate generation considering our diversified generation mix and incorporating new projects under construction under dry hydrology. We then create demand estimates using standard economic theory and forecast the system’s marginal cost using proprietary stochastic models. This commercial policy is not applicable in Argentina, where contracted sales are immaterial, and our margin is strongly dependent on the regulatory framework.
Distribution
We anticipate that our distribution companies will maintain their profitability during the periods between periodic tariff-setting processes, according to the price cap tariff model, due to growth and economies of scale. After tariffs have been set, the companies can increase their efficiency and obtain extra profits associated with such efficiencies.
Adverse Effects of Covid-19 Pandemic
Recent increases in infection rates indicate that there will be another wave of coronavirus infections in 2021. As of the date of this Report, the South American countries where we operate have not implemented a widespread vaccination program. Even when such a vaccination program begins, we may also experience virus strains for which there are no known antibodies yet.
Additionally, as a result of increases in infection rates in March 2021, the government in some countries where we operate established certain measures, including the following, which took effect in April 2021:
In Colombia, the government implemented curfews and restrictions on commercial activities, banking and notary services, public events, and the sale of alcohol during the weekends.
In Argentina, the government put limits on the public transportation system, enforced nighttime curfews, and established that local jurisdictions may expand, but not reduce, measures related to the Covid-19 pandemic.
In Brazil, ANEEL approved new measures to preserve electricity distribution services, which will be in force between April 1 and June 30, 2021. The measures prohibit distribution companies from cutting service to low-income
168
customers, customers with life support equipment and health services units, manufacturers and distributors of vaccines and serums, blood banks and medical and hospital systems. It also forbids distribution companies from cutting service due to non-payment for up to 90 days for all customers.
Although our operations are principally outside of Chile, our headquarters and senior management are located in Chile. As a result of increases in infection rates in March 2021, the Chilean government established new quarantine measures, placing more than 80% of the population in complete lockdown, including the entire Santiago metropolitan region. The government also announced the tightening of Chile’s borders through the month of April 2021. Chilean citizens and residents may enter Chile but are not allowed to depart from the country unless they qualify for exceptional consideration. Non-resident foreigners will not be allowed to enter Chile but will be permitted to depart from the country.
E. Off-balance Sheet Arrangements.
We are not a party to any off-balance sheet arrangements.
F. Tabular Disclosure of Contractual Obligations.
The table below sets forth our cash payment obligations as of December 31, 2020:
| | | | | | | | | | |
| | Payments due by Period | ||||||||
US$ Million |
| Total |
| 2021 |
| 2022-2023 |
| 2024-2025 |
| After 2025 |
Purchase obligations(1) | | 74,055 | | 18,773 | | 18,185 | | 14,241 | | 22,856 |
Interest expense | | 910 | | 235 | | 339 | | 194 | | 142 |
Yankee bonds | | 816 | | 215 | | 0 | | 0 | | 601 |
Local bonds(2) | | 2,969 | | 300 | | 1,116 | | 864 | | 689 |
Lease Obligations | | 167 | | 57 | | 49 | | 24 | | 37 |
Pension and post-retirement obligations(3) | | 3,707 | | 296 | | 525 | | 470 | | 2,416 |
Other debt(4) | | 759 | | 569 | | 71 | | 47 | | 72 |
Bank debt | | 1,269 | | 739 | | 312 | | 197 | | 21 |
Total contractual obligations | | 84,652 | | 21,184 | | 20,597 | | 16,037 | | 26,835 |
| (1) | Includes generation and distribution business purchase obligations, comprised mainly of energy purchases, operating and maintenance contracts, and other services. Of the total contractual obligations of US$ 74,055 million, 95% corresponds to energy purchased for distribution, and 4% primarily to fuel supply, maintenance of medium- and low-voltage lines, supplies of cable and utility poles, and energy purchased for generation. The remaining 1% corresponds to miscellaneous services, such as LNG regasification, fuel transport, and coal handling. |
| (2) | Local bond debt includes the value of derivatives. |
| (3) | We have funded and unfunded pension and post-retirement benefit plans. Our funded plans have annual contractual commitments for contributions, which do not change based on funding status. Cash flow estimates in the table are based on such obligations, including certain estimated variable factors such as interest. Cash flow estimates in the table relating to our unfunded plans are based on future discounted payments necessary to meet all our pension and post-retirement obligations. |
| (4) | Other debt includes governmental loan facilities, supplier credits, and short-term commercial paper, among others. |
G. Safe Harbor.
The information contained in Items 5.E and 5.F includes statements that may constitute forward-looking statements. See “Forward-Looking Statements” in the “Introduction” of this Report for safe harbor provisions.
169
Item 6. Directors, Senior Management and Employees
A. Directors and Senior Management.
Directors
Our board of directors consists of seven members elected for a three-year term at the Ordinary Shareholders’ Meeting (“OSM”). If a vacancy occurs in the interim, the board of directors elects a temporary director to fill the vacancy until the next OSM, at which time the entire board of directors will be selected. Our executive officers are appointed and hold office at the discretion of the board of directors.
The members of our board of directors as of December 31, 2020, were as follows:
| | | | | | |
Directors |
| Position |
| Age(1) | | Current Position Held Since |
Borja Acha B. | | Chairman | | 56 | | 2015 |
Domingo Cruzat A. | | Director | | 65 | | 2016 |
Patricio Gómez S. | | Director | | 57 | | 2016 |
Hernán Somerville S. | | Director | | 80 | | 1999 |
José Antonio Vargas L. | | Director | | 57 | | 2016 |
Enrico Viale | | Director | | 63 | | 2016 |
| (1) | As of April 30, 2021. |
Our board of directors in office as of December 31, 2020, was elected at the OSM held on April 30, 2019, for a three-year term. However, due to the resignation of one of our directors, Livio Gallo, in November 2020, a new board of directors was elected at the OSM held on April 29, 2021, for a three-year term that ends in April 2024.
Set forth below are brief biographical descriptions of the members of our board of directors, of whom three reside outside Chile, and three live in Chile, as of December 31, 2020:
Borja Acha B.
Mr. Acha is also the Secretary of the board of directors and Director of Legal Affairs and Corporate Matters of Endesa, S.A., a Spanish subsidiary of Enel. Previously, he was the Secretary and General Counsel of Enel (2012-2015) and General Counsel of Endesa, S.A. (1998-2013). Mr. Acha holds a law degree from Universidad Complutense de Madrid.
Domingo Cruzat A.
Mr. Cruzat is director of Conpax, Stars, Empresa de Servicios Sanitarios de Los Lagos, and Corporación Esperanza. He has also been a board member of Tech Pack S.A., Viña San Pedro Tarapacá, Compañia Sud Americana de Vapores, Solfrut, Alto Inmobiliaria Plaza Santo Domingo, and Principal Financial Group. He was CEO of Watt’s Alimentos and Bellsouth Comunicaciones S.A. Mr. Cruzat holds a civil engineering degree from Universidad de Chile and an MBA from Wharton.
Patricio Gómez-Sabaini C.
Mr. Gómez-Sabaini has been an executive director and partner of Sur Capital Partners since 2005. He has been a board member of BO Packaging since 2013, El Tejar Ltda. since 2007, and Nortel since 2016. Mr. Gómez-Sabaini holds a degree in business administration from George Mason University and an MBA from George Washington University.
Hernán Somerville S.
Mr. Somerville has been managing director and partner of Fintec since 1989. In 1992-2010, Mr. Somerville was the chairman of the Asociación de Bancos e Instituciones Financieras. From 2000-2010, he was a member of the Asia-Pacific Economic Cooperation Forum (APEC) and the chairman of the Fundación Chilena del Pacífico, a foundation that strengthens Pacific Ocean countries’ integration. Mr. Somerville holds a law degree from the Universidad de Chile.
170
José Antonio Vargas L.
Mr. Vargas has also been the chairman of Codensa and Emgesa since 2006. He has more than 20 years of experience in the Colombian energy sector, especially in the gas, coal, and electricity industries. From 1999-2006, he was CEO of Empresa de Energía de Bogotá S.A. (now Grupo Energía Bogotá S.A.). Mr. Vargas holds a law degree from Colegio Mayor de Nuestra Señora del Rosario, focusing on private and public administration.
Enrico Viale
Mr. Viale was chairman of the board of Enel Generation Chile until April 2016. From 2008-2014, he was Enel’s chief operating officer, managed Enel’s interest in OGK-5 and Rusenergosbyt, and supported Sever Energia’s upstream gas operations before becoming the country manager and CEO of Enel Russia. Mr. Viale holds a civil engineering degree from the Politecnico di Torino and an MBA from the University of Santa Clara.
Executive Officers
Set forth below are our executive officers as of December 31, 2020.
The business address of our executive officers is c/o Enel Américas S.A., Santa Rosa 76, Santiago, Chile.
| | | | | | | | |
Executive Officers |
| Position |
| Age(1) |
| Joined Enel |
| Current Position Held Since |
Maurizio Bezzeccheri | | Chief Executive Officer | | 62 | | 1999 | | 2018 |
Aurelio Ricardo Bustilho de Oliveira | | Chief Financial Officer | | 52 | | 1999 | | 2018 |
Raffaele Cutrignelli(2) | | Internal Audit Officer | | 39 | | 2005 | | 2016 |
Francisco Miqueles Ruz | | Planning and Control Officer | | 48 | | 2004 | | 2020 |
Simone Tripepi | | Enel X South America Officer | | 50 | | 2003 | | 2019 |
Domingo Valdés P.(2) | | General Counsel | | 57 | | 1993 | | 1999 |
| (1) | The age is as of the date of this Report. |
| (2) | Messrs. Cutrignelli and Valdés are executive officers of Enel Américas but are paid exclusively by Enel Chile S.A. They provide services to the Company under an intercompany agreement. |
Set forth below are brief biographical descriptions of our executive officers, of whom two reside outside Chile, and four live in Chile, as of December 31, 2020:
Maurizio Bezzeccheri: Mr. Bezzeccheri was the country manager of Enel Argentina in 2015-2018. He joined Enel as vice president of EGP Europe and director of Iberia and Latam. Mr. Bezzeccheri held managerial positions in multinational companies located in Europe, the Middle East, and the Americas. He holds a degree in chemical engineering from Università degli Studi di Napoli.
Aurelio Ricardo Bustilho de Oliveira: Mr. Bustilho was CFO of Enel Brasil and served as finance director of Enel Green Power Cachoeira Dourada S.A. Mr. Bustilho holds a degree in business administration and an MBA from Coppead / UFRJ.
Raffaele Cutrignelli: Mr. Cutrignelli was the audit officer for Enel affiliates in Colombia (2015-2016) and the head of Latin American audit for EGP in Brazil (2013-2015). Mr. Cutrignelli holds a degree in international business from Nottingham Trent University and a graduate degree in audit and internal controls from Universitá di Pisa.
Francisco Miqueles: Mr. Miqueles was the manager of planning, reporting, and financial control of Enel Américas in 2017-2019 and held several managerial positions between 2004 and 2017 for Enel Distribution. Mr. Miqueles has a degree in business administration from Universidad Central.
Simone Tripepi: Since joining Enel in 2003, Mr. Tripepi has worked in generation, energy management, and the CO2 trading desk. In 2017, he created Enel X Latam’s regional structure and became head of Enel X South America. Mr. Tripepi holds a degree in engineering management from Università degli Studi di Roma “Tor Vergata.”
171
Domingo Valdés P.: Mr. Valdés is the general counsel of Legal and Corporate Affairs for both Enel Américas and Enel Chile and serves as secretary of both their boards of directors. He is a tenured professor of economic and antitrust law at Universidad de Chile, and graduated summa cum laude from this law school. Mr. Valdés also holds a master of law degree from the University of Chicago.
B. | Compensation. |
At the OSM held on April 29, 2021, our shareholders approved our board of directors’ compensation policy. Director compensation consists of a monthly fixed compensation of UF 216 per month and an additional fee of UF 79.2 per meeting, up to a maximum of 16 sessions in total, including ordinary and extraordinary meetings, within the corresponding fiscal year. The Chairman of the Board is entitled to double the compensation compared to other directors under this policy.
Our Directors Committee members are paid a monthly fixed compensation of UF 72 per month and an additional fee of UF 26.4 per meeting, up to a maximum of 16 sessions in total, including ordinary and extraordinary meetings, within the corresponding fiscal year.
If a director serves on one or more boards of directors of the subsidiaries or associate companies or serves as director of other companies or corporations where the economic group holds an interest directly or indirectly, the director can only receive compensation in one of these boards.
Our Company’s executive officers and our subsidiaries or affiliates will not receive compensation if they serve as directors of any subsidiary, associate company, or are affiliated in any way to our Company. However, the officer may receive compensation to the extent that it is expressly and previously authorized as an advance payment of the variable portion of the wage to be paid by the respective subsidiaries or associate companies, where the executive officer signed a work contract.
In 2020, the total compensation paid to each of our directors, including fees for attending directors committee meetings, was as follows
| | | | | | | | | | | | |
| | Year ended December 31, 2020 (1) | ||||||||||
Director |
| Fixed |
| General and Extraordinary Session | | Directors’ | | General and Extraordinary Session (Directors Committee) | | Variable |
| Total |
| | (in ThUS$) | ||||||||||
Borja Acha B.(2) | | — | | — | | — | | — | | — | | — |
Domingo Cruzat A. | | 94 | | 49 | | 31 | | 15 | | — | | 189 |
Livio Gallo | | — | | — | | — | | — | | — | | — |
Patricio Gómez S. | | 94 | | 49 | | 31 | | 15 | | — | | 189 |
Hernán Somerville S. | | 94 | | 49 | | 31 | | 15 | | — | | 189 |
José Antonio Vargas L.(2) | | — | | — | | — | | — | | — | | — |
Enrico Viale(2) | | — | | — | | — | | — | | — | | — |
Total | | 282 | | 147 | | 94 | | 46 | | — | | 568 |
| (1) | The U.S. dollar equivalent of compensation paid in Chilean pesos was translated for these purposes using the average exchange rate for the year ended on December 31, 2020, of Ch$ 790.92 per US$ 1.00. |
| (2) | Messrs. Acha, Gallo, Vargas, and Viale waived their compensation for their current positions as Directors of the Company since they are employees of other companies in the Enel group. |
We do not disclose any information about an individual executive officer’s compensation. Executive officers are eligible for variable compensation under a bonus plan. The annual bonus plan is paid to our executive officers for achieving company-wide objectives and for their contribution to our results and objectives. The yearly bonus plan provides a range of bonus amounts according to seniority level and consists of a certain multiple of gross monthly salaries. For the year ended December 31, 2020, the aggregate gross compensation, paid or accrued, for all our executive officers, attributable to the fiscal year 2020, was US$ 3.49 million in fixed compensation and US$ 0.15 million in benefits. For expatriate executive officers, no variable compensation was paid by us since they received their variable bonus from their home country in 2020. The other executive officers have been paid exclusively by Enel Chile and
172
provide services to the Company under an intercompany agreement. Therefore, their variable bonus was paid by Enel Chile in 2020.
We entered into severance indemnity agreements with all our executive officers. We will pay a severance indemnity for voluntary resignation or termination by mutual understanding among the parties. The severance indemnity does not apply if the termination is due to willful misconduct, prohibited negotiations, unjustified absences, or abandonment of duties, among other causes, as defined in Article 160 of the Chilean Labor Code. All of our employees are entitled to severance indemnity pay if terminated due to our needs, as described in Article 161 of the Chilean Labor Code. We did not pay severance indemnity to our executive officers in 2020.
C. | Board Practices. |
Our board of directors in office as of December 31, 2020, was elected at the OSM held on April 30, 2019, for three years. However, due to one of our directors’ resignation, a new board of directors was elected at an OSM on April 29, 2021, for a three-year term. For information about the directors in 2020 and the year they began their service on the board of directors, see “Item 6. Directors, Senior Management and Employees — A. Directors and Senior Management” above. Members of the board of directors do not have service contracts with us or with any of our subsidiaries that provide them benefits upon the termination of their service.
Corporate Governance
We are managed by a board of directors, following our bylaws, consisting of seven directors elected by our shareholders at the OSM, each serving for a three-year term. Following the end of their term, they may be re-elected indefinitely or replaced. Staggered terms are not permitted under Chilean law. If a vacancy occurs on the board of directors during the years, the board of directors may appoint a temporary director to fill the vacancy. A vacancy triggers an election for every seat on the board of directors at the next OSM.
Chilean corporate law provides that a company’s board of directors is responsible for managing and representing a company in all matters concerning its corporate purpose, subject to its bylaws’ provisions and the shareholders’ resolutions. In addition to the bylaws, our board of directors has adopted regulations and policies that guide our corporate governance principles.
Our corporate governance policies are mainly included in the following policies or procedures: the Manual for the Management of Information of Interest to the Market (the “Manual”), the Human Rights Policy, the Code of Ethics, the Zero Tolerance Anti-Corruption Plan (the “ZTAC Plan”), the Penal Risk Prevention Model, the Enel Global Compliance Program on Corporate Criminal Liability (the “Enel Global Compliance Program”), the Risk Management Control System, and procedures issued in compliance with General Norms’ Regulation 385 (“NCG 385” in its Spanish Acronym), issued by the CMF, which deals with disclosure obligations regarding corporate governance matters.
To ensure compliance with Securities Market Law 18,045 and CMF regulations, our board of directors approved the Manual at its meeting held on February 26, 2010. This document addresses applicable standards regarding the information in connection with transactions of our securities and those of our affiliates, entered into by directors, management, principal executives, employees, and other related parties, the existence of blackout periods for such transactions undertaken by directors, principal executives and other related parties, the presence of mechanisms for the continuous disclosure of information that is of interest to the market and tools that protect confidential information. The Manual is posted on our website at www.enelamericas.com. The provisions of this Manual apply to our board members and our executives and employees who have access to confidential information, especially those who work in areas related to the securities markets.
Our board of directors approved a procedure for relationships between Politically Exposed People and our Company, which established a specific regulation for their commercial and contractual relationships. The Human Rights Policy incorporates and adapts the United Nations’ general principles related to human rights into corporate reality.
Our board of directors also approved the Code of Ethics and the ZTAC Plan to supplement the aforementioned corporate governance regulations. The Code of Ethics is based on general principles such as impartiality, honesty, integrity, and other ethical standards of equal importance, all of which are expected from our employees. The ZTAC Plan reinforces the Code of Ethics principles, emphasizing avoiding corruption through bribes, preferential treatment, and other similar matters.
173
Our board of directors approved the Penal Risk Prevention Model and the Enel Global Compliance Program. The Penal Risk Prevention Model satisfies the standards imposed by Chilean Law 20,393, which imposes criminal responsibility for legal entities for certain crimes, including money laundering, financing of terrorism, and bribery of public officials. The law encourages companies to adopt this model, whose implementation involves compliance with managerial and supervision duties. The adoption of the Penal Risk Prevention Model mitigates, and in some cases relieves, the effects of criminal responsibility even when a crime is committed. The Enel Global Compliance Program is designed as a tool to reinforce the group’s commitment to the highest ethical, legal, and professional standards for enhancing and preserving the group’s reputation. It sets several preventive measures for corporate criminal liability.
We follow the Risk Management Control System guidelines defined by Enel for the standards, procedures, and systems applied at different levels of our companies to identify, analyze, evaluate, manage, and communicate risks. Each of our companies defines its risk management, control, and management policy, which is reviewed and approved at the beginning of each year by its Board of Directors, observing and applying local requirements in terms of risk culture, specific procedures concerning certain risks, corporate functions, or group businesses. The policies include limits and indicators that are subsequently monitored.
The Risk Control area is ISO 31000:2018 (G31000) certified and acts under the guidelines of these international standards. The primary objective is to identify internal and external risks preemptively and to analyze, evaluate, and quantify the probability of their occurrence and impact on our companies. Each area manages risks using mitigation measures stipulated in action plans. In the risk management phase, necessary actions determined by internal policies and procedures are considered. The strict observance of ISO and OHSAS international standards and governmental regulations may require risk management actions to be documented to guarantee good governance practices and ensure business continuity.
In 2015, the CMF issued NCG 385 to enhance transparency standards and introduce corporate social responsibility practices by promoting, among other things, management diversity. All publicly held limited liability corporations are required to provide the CMF, on an annual basis, with answers to a survey related to the board’s functions and composition; relationships between the company, shareholders, and public in general; third-party assessments; and internal control and risk management. The Appendix to NCG 385 is divided into the following four sections concerning which companies must report the corporate practices that have been adopted: (i) the functioning and composition of the board, (ii) relations between the company, shareholders, and the general public, (iii) risk management and control, and (iv) assessment by a third party. Publicly held limited liability corporations should send the information concerning corporate governance practices to the CMF no later than March 31 every year, using the Appendix’s contents to this regulation as criteria. If none of them is adopted, the company must explain its reasons to the CMF. The information should refer to December 31 of the calendar year that just ended. Simultaneously, such information should also be at the public’s disposal on the company’s website and must be sent to the stock exchanges.
In 2018, the board of directors approved a policy dealing with environmental and biodiversity issues. Environmental, social, and corporate governance criteria (“ESG”) are integrated into our business model. In compliance with NCG 385, the board periodically receives reports by management to identify and assess all risks associated with ESG and climate change issues, including compliance with board policies.
Compliance with the New York Stock Exchange Listing Standards on Corporate Governance
The following summarizes the significant differences between our corporate governance practices and those applicable to U.S. domestic issuers under the NYSE’s corporate governance rules.
174
Independence and Functions of the Directors Committee (Audit Committee)
Chilean law requires that at least two-thirds of the Directors Committee be independent directors. The CMF may, through a general norms’ regulation, set forth the requirements and conditions that must be met by board members to be independent directors. Notwithstanding the above, according to Article 50 bis of Law No.18,046, a member would not be considered independent if, at any time, within the last 18 months he (i) had any relationship of a relevant nature and amount with the company, with other companies of the same group, with its controlling shareholder or with the principal officers of any of them or has been a director, manager, administrator or officer of any of them (with the CMF authorized to set forth the criteria of what will be deemed “relevant nature and amount”); (ii) had a family relationship with any of the members described in (i) above; (iii) has been a director, manager, administrator or principal officer of a non-profit organization that has received contributions from (i) above; (iv) has been a partner or a shareholder that has controlled, directly or indirectly, 10% or more of the capital stock or has been a director, manager, administrator or principal officer of an entity that has provided consulting or legal services for a relevant consideration or external audit services to the persons listed in (i) above; and (v) has been a partner or a shareholder that has controlled, directly or indirectly, 10% or more of the capital stock or has been a director, manager, administrator or principal officer of the top competitors, suppliers or customers. In case there are not enough independent directors on the board to serve on the Directors Committee, Chilean law determines that the independent director nominates the rest of the Directors Committee members among the remaining board members that do not meet the Chilean law independence requirements. Chilean law also requires that all publicly held limited liability stock corporations that have a market capitalization of at least UF 1,500,000 (US$ 61.3 million as of December 31, 2020) and at least 12.5% of its voting shares are held by shareholders that individually control or own less than 10% of such shares, must have at least one independent director and a Directors Committee.
Under the NYSE corporate governance rules, all members of the Audit Committee must be independent. The Audit Committee of a U.S. company must perform the functions detailed in and otherwise comply with the requirements of NYSE Listed Company Manual Rules 303A.06 and 303A.07. As of July 31, 2005, non-U.S. companies have been required to comply with Rule 303A.06, but not with Rule 303A.07. Since July 31, 2005, we have complied with the independence and the functional requirement of Rule 303A.06.
On June 29, 2005, our board of directors created an Audit Committee composed of three directors who were also members of the board of directors, as required by the Sarbanes-Oxley Act (“SOX”) and the NYSE corporate governance rules. On April 22, 2010, our bylaws were amended at an ESM, and the Audit Committee was merged with the Directors Committee.
Under our bylaws, all Directors Committee members must satisfy the requirements of independence, as stipulated by the NYSE. The Directors Committee comprises three members of the board. It complies with Article 50 bis of Law No.18,046 and the criteria and requirements of independence prescribed by the SOX, the SEC, and the NYSE. As of the date of this Report, the Directors Committee complies with the Audit Committee’s conditions as required by the SOX, the SEC, and the NYSE corporate governance rules. As a result, we have a single Committee, the Directors Committee, which includes the duties performed by an Audit Committee among its functions.
Our Directors Committee performs the following functions:
• | reviews financial statements and the reports of the external auditors before their submission for shareholders’ approval; |
• | presents proposals to the board of directors, who then undertake their recommendations to shareholders’ meetings for the selection of external auditors and private rating agencies; |
• | reviews information related to our transactions with related parties and reports the opinion of the Directors Committee to the board of directors; |
• | proposes to the board of directors a general policy on conflicts of interest, as well as reviews the related-party policy; |
• | examines the compensation framework and plans for managers, executive officers, and employees; |
• | prepares an Annual Management Report, including recommendations to shareholders; |
• | provides information to the board of directors about the convenience of recruiting external auditors to provide non-auditing services, when such services are not prohibited by law, depending on whether such services might affect the external auditors’ independence; |
• | oversees the work of external auditors; |
175
• | reviews and approves the annual auditing plan by the external auditors; |
• | evaluates the qualifications, independence, and quality of the auditing services; |
• | elaborates policies regarding the employment of former members of the external auditing firm; |
• | reviews and discusses problems or disagreements between management and external auditors regarding the auditing process; |
• | establishes procedures for receiving and dealing with complaints regarding accounting, internal controls, and auditing matters; |
• | carries out other functions mandated to the Committee by the bylaws, our board of directors, or our shareholders. |
Corporate Governance Guidelines
The NYSE’s corporate governance rules require U.S.-listed companies to adopt and disclose corporate governance guidelines. Chilean law provides for this practice through the procedures related to NCG 385 and the Manual. We have also adopted the Code of Ethics. Our bylaws include provisions that govern the creation, composition, attributions, functions, and compensation of the Directors Committee described above, including the duties performed by an Audit Committee.
D. Employees.
The following table sets forth the total number of our personnel (both permanent and temporary employees) and the number of personnel (both permanent and temporary employees) of each of our consolidated subsidiaries as of December 31, 2020, 2019, and 2018:
| | | | | | |
Company |
| 2020 |
| 2019 |
| 2018 |
Argentina | | | | | | |
Edesur | | 3,500 | | 3,519 | | 3,760 |
Costanera | | 395 | | 398 | | 418 |
Dock Sud | | 86 | | 86 | | 88 |
El Chocón | | 49 | | 48 | | 49 |
Enel Trading Argentina | | 26 | | 31 | | 29 |
CTM and TESA | | 4 | | 4 | | 4 |
Enel Argentina | | 4 | | — | | — |
Total personnel in Argentina | | 4,064 | | 4,086 | | 4,348 |
| | | | | | |
Brazil | | | | | | |
Enel Distribution Sao Paulo(1) | | 5,845 | | 6,484 | | 7,278 |
Enel Distribution Goias | | 1,123 | | 1,119 | | 1,101 |
Enel Distribution Rio(2) | | 1,123 | | 1,112 | | 1,118 |
Enel Distribution Ceara | | 1,122 | | 1,118 | | 1,135 |
Cachoeira Dourada | | 124 | | 106 | | 94 |
Enel Brasil | | 74 | | 75 | | 76 |
Fortaleza | | 61 | | 63 | | 64 |
Cien | | 38 | | 33 | | 34 |
EGP Volta Grande | | 13 | | 14 | | — |
Total personnel in Brazil | | 9,523 | | 10,124 | | 10,900 |
| | | | | | |
Chile | | | | | | |
Enel Américas | | 51 | | 53 | | 57 |
Total personnel in Chile | | 51 | | 53 | | 57 |
| | | | | | |
Colombia | | | | | | |
Codensa | | 1,535 | | 1,500 | | 1,529 |
Emgesa | | 615 | | 606 | | 615 |
Total personnel in Colombia | | 2,150 | | 2,106 | | 2,144 |
| | | | | | |
176
Peru | | | | | | |
Enel Distribution Peru | | 597 | | 598 | | 590 |
Enel Generation Peru | | 306 | | 286 | | 285 |
Enel Generation Piura | | 31 | | 36 | | 40 |
Enel X Peru | | 9 | | 6 | | — |
Total personnel in Peru | | 943 | | 926 | | 915 |
| | | | | | |
Total personnel(3) | | 16,731 | | 17,295 | | 18,364 |
| (1) | The total personnel was reduced in 2020 as compared to 2019 as a result of an organizational restructuring process that Enel Distribution Sao Paulo is currently undergoing in accordance with a plan implemented by the investment committee to increase efficiency. |
| (2) | Includes Enel X Brasil, formerly known as Enel Soluções S.A. |
| (3) | The total number of temporary employees is not significant. |
The Chilean Labor Code entitles all employees in Chile who are fired for reasons other than misconduct to a severance indemnity payment. In most cases, contracted employees are entitled to a legal minimum severance indemnity payment of one month’s salary for each year (and every fraction thereof beyond six months) worked, subject to a maximum of 11 months’ salary.
Our employment contracts typically provide severance indemnity payments higher than those required by the Chilean Labor Code. In most cases, we respect seniority in accordance with the time that the employee first joined us or an affiliate. Therefore, employees hired by one of our Chilean affiliates or predecessor companies maintain their seniority in the company and are treated contractually as if we had hired them. Under such contracts, severance indemnity payments for most of our employees consist of one month’s salary for each full year worked (and every fraction thereof beyond six months), subject to a maximum of 25 months. Under our collective bargaining agreements and other employment contracts not covered by such agreements, we are typically obligated to make severance indemnity payments to all covered employees in cases of voluntary resignation or death in specified amounts that increase according to seniority and often exceed the amounts required under Chilean law.
Chile
We have the following collective bargaining agreements:
| | | | | |
Company |
|
| Signed in |
| In Force until |
Enel Américas - Collective Bargaining Agreement 1 | | | July 2019 | | July 2022 |
Enel Américas - Collective Bargaining Agreement 2 | | | January 2020 | | December 2022 |
Argentina
We have the following collective bargaining agreements:
| | | | | |
Company(1) |
|
| Signed in |
| In Force until |
Edesur - Collective Bargaining Agreement 1 | | | 2004 | | 2007 |
Edesur - Collective Bargaining Agreement 2 | | | 2004 | | 2007 |
El Chocón - Collective Bargaining Agreement 1 | | | 2012 | | 2017 |
Costanera - Collective Bargaining Agreement 1 | | | 2011 | | 2014 |
Costanera - Collective Bargaining Agreement 2 | | | 2012 | | 2015 |
| (1) | Under Argentine law, the working conditions under the expired agreements continue until the signing of a new agreement, under the principle of ultra-activity established by Law 14,250 (Art. 12). |
177
Brazil
We have the following collective bargaining agreements:
| | | | | |
Company(1) |
|
| Signed in |
| In Force until |
Enel Distribution Sao Paulo - Collective Bargaining Agreement | | | July 2020 | | May 2022 |
Enel Distribution Rio - Collective Bargaining Agreement | | | December 2019 | | September 2021 |
Enel Distribution Ceara - Collective Bargaining Agreement | | | February 2021 | | November 2022 |
Cien - Collective Bargaining Agreement | | | April 2019 | | April 2021 |
Cachoeira Dourada - Collective Bargaining Agreement | | | May 2018 | | April 2021 |
Fortaleza - Collective Bargaining Agreement | | | May 2019 | | April 2021 |
Enel Distribution Goias - Collective Bargaining Agreement | | | November 2020 | | April 2022 |
Enel Brasil - Collective Bargaining Agreement | | | December 2019 | | September 2021 |
| (1) | Under Brazilian law, collective bargaining agreements cannot last for more than two years. |
Colombia
We have the following collective bargaining agreements:
| | | | | |
Company |
|
| Signed in |
| In Force until |
Codensa - Collective Bargaining Agreement 1 | | | November 2019 | | December 2022 |
Codensa - Collective Bargaining Agreement 2(1) | | | May 2016 | | December 2019 |
Emgesa - Collective Bargaining Agreement 1 | | | January 2021 | | December 2021 |
Emgesa - Collective Bargaining Agreement 2(1) | | | May 2016 | | December 2019 |
| (1) | These collective bargaining agreements are under a process of arbitration, and there is no negotiation end date. |
Peru
We have the following collective bargaining agreements:
| | | | | |
Company |
|
| Signed in |
| In Force until |
Enel Distribution Peru - Collective Bargaining Agreement 1 | | | January 2020 | | December 2023 |
Enel Distribution Peru - Collective Bargaining Agreement 2 | | | January 2020 | | December 2023 |
Enel Distribution Peru - Collective Bargaining Agreement 3(1) | | | January 2018 | | December 2020 |
Enel Generation Peru - Collective Bargaining Agreement 1 | | | January 2019 | | December 2021 |
Enel Generation Piura - Collective Bargaining Agreement 1 | | | January 2018 | | December 2021 |
| (1) | These collective bargaining agreements are still under negotiation as of the date of this Report. |
E. Share Ownership.
To the best of our knowledge, none of our directors or officers owns more than 0.1% of our shares or holds any stock options to the best of our knowledge. It is not possible to confirm whether any of our directors or officers has a beneficial, rather than direct, interest in our shares. Any share ownership by all our directors and officers, in the aggregate, amounts to significantly less than 10% of our outstanding shares.
Item 7.Major Shareholders and Related Party Transactions
A.Major Shareholders.
We have only one class of capital stock, and Enel, our ultimate controlling shareholder, has the same voting rights as our other shareholders. As of April 21, 2021 our 23,200 shareholders of record held our 107,281,698,561 shares of common stock outstanding. Enel owned 88,260,048,702 shares of our common stock, representing an 82.3% direct ownership interest in us. There were five record holders of our ADS, as of such date.
178
It is not practicable for us to determine the number of ADS or common shares beneficially owned in the United States. The depositary for our ADS only knows the record holders, including the Depositary Trust Company and its nominees. As such, we are not able to ascertain the domicile of the ultimate beneficial holders represented by the five ADS record holders in the United States, nor are we able to determine the domicile of any of our foreign stockholders who hold our common stock, either directly or indirectly.
As of April 21, 2021, Chilean private pension funds (“AFPs”) owned 6.2% of our shares in the aggregate. Chilean stockbrokers, mutual funds, insurance companies, foreign equity funds, and other Chilean institutional investors collectively held 8.3% of our shares. ADS holders owned 2.3% of our shares, and 23,013 minority shareholders held the remaining 0.9% of our shares.
The following table sets forth information concerning ownership of the common stock as of April 21, 2021, concerning each stockholder known by us to own more than 5% of the outstanding shares of common stock:
| | | | |
|
| Number of Shares |
| Percentage of Shares |
Enel S.p.A. (Italy) | | 88,260,048,702 | | 82.3% |
(1) | Includes 31,195,387,525 shares issued in the 2021 Merger on April 1, 2021 and 7,608,559,104 shares (including shares represented by ADSs) acquired in the 2021 Tender Offer concluded on April 13, 2021. |
Enel, our ultimate controlling shareholder, is an Italian utility company with multinational operations whose principal business is the production, distribution, and sale of electricity, focusing primarily on Europe and Latin America. Enel operates in 32 countries across five continents and produces energy through a managed installed capacity of 87 GW, including more than 47 GW of renewable sources, making Enel one of the world’s largest private renewables operators. Enel is among the largest network operators, distributing electricity to more than 74 million end users. With almost 70 million customers worldwide, Enel has one of the most extensive customer bases among European competitors. Enel’s shares are listed on the Mercato Telematico Azionario organized and managed by Borsa Italiana S.p.A.
B.Related-Party Transactions.
Article 146 of Law 18,046 (the “Chilean Corporations Law”) defines related-party transactions as all transactions involving a company and any entity belonging to the corporate group, its parent companies, controlling companies, subsidiaries or related companies, board members, managers, administrators, senior officers or company liquidators, including their spouses, some of their relatives, and all entities controlled by them, in addition to individuals who may appoint at least one member of the company’s board of directors or who hold 10% or more of voting capital, or companies in which a board member, manager, administrator, senior officer, or company liquidator has been serving in the same position within the last 18 months.
Article 147 of the Chilean Corporation Law (“Article 147”) requires that related-party transactions must consider the corporate interest, as well as the prices, terms, and conditions prevailing in the market at the time of their approval. Article 147 provides that board members, managers, administrators, senior officers, or company liquidators having a personal interest or acting in negotiations of a related-party transaction must immediately inform the board of directors. Such a transaction shall only be approved if an absolute majority of the directors (excluding interested directors) consider the transaction beneficial for the corporate interest. Chilean law requires an interested director to abstain from voting on such a transaction. If an absolute majority of the directors are obliged to abstain from voting on any particular transaction, it shall only be approved if authorized unanimously by the independent directors or during an ESM. Board resolutions approving related-party transactions must be reported to the company’s shareholders at the next shareholders’ meeting.
The law described above, which also applies to our affiliates, provides for some exceptions. In some instances, the board’s approval would suffice for related-party transactions, under certain transaction thresholds when the transactions are conducted with another entity in which we hold 95% or more of their capital, or when such transactions are conducted in compliance with the related-party policies defined by the company’s board. At its meeting held on June 28,
179
2017, our board of directors updated our related-party transaction policy. This policy is available on our website at www.enelamericas.com.
If a transaction is not in compliance with Article 147, this will not affect its validity. Still, our shareholders or we may demand compensation for damages from the individual associated with the infringement as provided by law.
In the countries where we operate, we do not manage our subsidiaries’ cash flows even when intercompany transactions are permitted; however, these may have adverse tax consequences.
The following are related-party transactions entered into between January 1, 2020, and April 1, 2021.
| (i) | In May 2020, Enel Américas entered into a revolving credit agreement with EFI for US$ 150 million, due in May 2021, with an interest rate of LIBOR + 1.35%. As of March 31, 2021, the outstanding balance of the loan amounted to US$ 150 million. |
| (ii) | In June 2020, Enel Brasil entered into a revolving credit agreement with EFI for R$ 800 million, due in June 2021, with a variable interest rate indexed to the interbank deposit certificate rate plus 2.50%. As of March 31, 2021, there was no outstanding amount. |
| (iii) | In December 2020, Enel Distribution Rio entered into a credit agreement with EFI for R$ 750 million, due in January 2024, with a fixed interest rate of 3.4%. As of March 31, 2021, the outstanding balance of the loan amounted to the equivalent of US$ 132 million. |
| (iv) | In February 2021, Enel Américas entered into a revolving credit agreement with EFI for US$ 500 million due in February 2024, with an interest rate of LIBOR+ 1.08%. As of March 31, 2021, the outstanding balance amounted to US$ 113 million. |
| (v) | In February 2021, Enel Distribution Ceara entered into a credit agreement with EFI for R$ 500 million, due in March 2025, with a variable interest rate indexed to the interbank deposit certificate rate plus 1.00%. As of March 31, 2021, the outstanding balance of the loan amounted to the equivalent of US$ 88 million. |
| (vi) | In March 2021, Enel Distribution Goias entered into a credit agreement with EFI for R$ 600 million, due in March 2023, with a variable interest rate indexed to the interbank deposit certificate rate plus 1.10%. As of March 31, 2021, the outstanding balance of the loan amounted to the equivalent of US$ 105 million. |
| (vii) | On April 1, 2021, Enel Américas completed the 2021 Merger. Please see “Item 4. Information on the Company — A. History and Development of the Company— Merger with EGP Américas and Related Tender Offer.” |
There are various contractual relationships between Enel Chile and us to provide intercompany services. Enel Chile entered into intercompany agreements under which it provides services directly and indirectly to us. The services rendered by Enel Chile include specific legal, finance, treasury, insurance, capital markets, financial and documentary compliance, accounting, human resources, communications, security, relations with contractors, IT, tax, and other corporate support and administrative services. These services are provided and charged at market prices if there is a comparable reference service. If there are no similar services in the market, they will be provided at cost plus a specified percentage. The intercompany services contracts are valid for five years as of January 1, 2017, with renewable terms.
As of the date of this Report, the abovementioned transactions have not experienced material changes. As of December 31, 2020, there were also some commercial transactions with related parties. Please see Note 11 of the Notes to our consolidated financial statements for more information regarding transactions with related parties.
C. Interests of Experts and Counsel.
Not applicable.
180
A. | Consolidated Statements and Other Financial Information. |
See “Item 18. Financial Statements.”
Legal Proceedings
Our subsidiaries and we are parties to legal proceedings arising in the ordinary course of business. We believe it is unlikely that any loss associated with pending lawsuits will significantly affect the normal development of our business.
For detailed information as of December 31, 2020, on the status of the material pending lawsuits filed against us and our subsidiaries, please refer to Note 35.3 of the Notes to our consolidated financial statements.
Concerning the legal proceedings reported in the Notes to our consolidated financial statements, we use the criterion of disclosing lawsuits above a minimum threshold of US$ 20 million of potential impact to us, and, in some cases, qualitative criteria according to the materiality of the plausible effect on the conduct of our business. The lawsuit status includes a general description, the process status, and the estimate of the amount involved in each lawsuit.
Dividend Policy
Our board of directors presents an annual proposal for approval to the OSM for a final dividend payable each year. The dividend is accrued in the prior year and cannot be less than the legal minimum of 30% of annual net income. The proposal also states the dividend policy for the current fiscal year. Additionally, our board of directors generally establishes an interim dividend for the current fiscal year, payable in January of the following year and deducted from the final dividend payable in May of the following year. The board of directors establishes the interim dividend, which is not subject to restrictions under Chilean law.
For dividends accrued in the fiscal year 2019, on November 25, 2019, the board of directors agreed to distribute an interim dividend of 0.16 US cents per share of common stock on January 24, 2020, equal to 15% of consolidated net income as of September 30, 2019. The interim dividend was paid in Chilean pesos, considering the U.S. dollar Observed Exchange Rate as of January 17, 2020. At the OSM held on April 30, 2020, our shareholders approved a final dividend equivalent to 1.06 US cents per share of common stock for the fiscal year 2019, of which 0.89 US cents was distributed on May 29, 2020, after deducting the interim dividend paid in January 2020. The final dividend amounts to a payout ratio of 50% of annual net income for 2019.
For dividends accrued in the fiscal year 2020, on November 26, 2020, the board of directors agreed to distribute an interim dividend of 0.09 US cents per share of common stock on January 29, 2021, equal to 15% of consolidated net income as of September 30, 2020. The interim dividend was paid in Chilean pesos, considering the U.S. dollar Observed Exchange Rate as of January 22, 2021. At the OSM held on April 29, 2021, our shareholders approved a final dividend of US$ 412,598,667 for the fiscal year 2020, of which US$ 339,606,949 will be distributed in May 2021, after deducting the interim dividend paid in January 2021. The final dividend amounts to a payout ratio of 50% of annual net income for 2020.
For dividends corresponding to the fiscal year 2021, our board of directors presented the following dividend policy at the OSM held on April 29, 2021:
● | An interim dividend, accrued in the fiscal year 2021 and amounting to 15% of consolidated net income as of September 30, 2021, to be paid in January 2022. |
● | A final dividend payout equal to 50% of the annual net income for the fiscal year 2021, to be paid in May 2022, from which the interim dividend paid in January 2022 will be deducted. |
This dividend policy is conditioned on generating net profits in each period and expectations of future profit levels and other conditions that may exist at the time of such dividend declaration. The proposed dividend policy is subject to our board of directors’ right to change the amount and timing of the dividends under prevailing circumstances at the time of the payment.
181
Dividend payments are potentially subject to legal restrictions, such as legal reserve requirements, capital and retained earnings criteria, and other contractual restrictions such as the non-default on credit agreements. For example, Enel Generation Piura may not pay dividends unless it complies with certain financial covenants. However, these potential legal and contractual restrictions do not currently affect our ability or any of our subsidiaries’ ability to pay dividends. For additional information, see “Item 5. Operating and Financial Review and Prospects — B. Liquidity and Capital Resources.”
Shareholders of each subsidiary and affiliate agree on the final dividend payments. There are currently no material currency controls that prohibit us from repatriating the dividend payments from our non-Chilean principal subsidiaries and affiliates.
Dividends are paid to shareholders of record as of midnight of the fifth business day before the payment date. Holders of ADS on the applicable record dates will be entitled to receive dividend payments.
Dividends
For each of the years indicated, the table below sets forth the dividends distributed by us in U.S. cents per common share and ADS. For additional information, see “Item 10. Additional Information — D. Exchange Controls”.
| | | | |
| | Dividends distributed(1) | ||
| | US cents | | US cents |
Year |
| per share |
| per ADS(2) |
2020 | | 1.06 | | 53.00 |
2019 | | 0.84 | | 42.00 |
2018 | | 0.62 | | 31.00 |
| | | | |
| | Dividends distributed(1) | ||
| | Ch$ | | US cents |
| | per share |
| per ADS(2) |
2017 | | 3.33 | | 27.00 |
| (1) | This table reports dividends paid rather than dividends accrued within any given year. These amounts do not reflect a reduction for Chilean withholding taxes, if applicable. Figures have been rounded. |
| (2) | One ADS = 50 shares of common stock. The U.S. cents per ADS amount for 2017 were calculated by applying the exchange rate as of December 31, 2017. Since 2018, dividends are presented in U.S. dollars, our reporting currency for those years. |
For a discussion of Chilean withholding taxes and access to the formal currency market in Chile in connection with the payment of dividends and sales of ADS and the underlying common stock, see “Item 10. Additional Information — E. Taxation” and “Item 10. Additional Information — D. Exchange Controls.”
B. | Significant Changes. |
None.
A. | Offer and Listing Details. |
Our shares of common stock are listed and traded on the Chilean Stock Exchanges under the trading symbol “ENELAM,” and our ADS are listed and traded on the NYSE under the trading symbol “ENIA.”
B. | Plan of Distribution. |
Not applicable.
182
C. | Markets. |
In Chile, our common stock is traded on the following stock exchanges: the Bolsa de Santiago (Santiago Stock Exchange or “SSE”) and the Bolsa Electrónica de Chile (Electronic Stock Exchange or “ESE”). As of December 31, 2020, more than 200 companies had shares listed on the SSE. As of December 31, 2020, the SSE accounted for 93% of our total equity traded in Chile. Also, 7% of our equity trading was conducted on the ESE, an electronic trading market created by banks and non-member brokerage houses.
Equities, closed-end funds, fixed-income securities, short-term and money market securities, gold, U.S. dollars, and futures contracts for stock indices and U.S. dollars trade on the SSE. It operates on business days from 9:30 a.m. to 4:00 p.m., which may differ from New York City time by up to two hours, depending on the season.
In August 2016, the SSE and the S&P Dow Jones Indices (“S&P DJI”) signed an Operating Agreement and Index Licensing. The alliance between the SSE and the S&P DJI, the leading global provider of concepts, data, and research on indices, includes implementing international methodological standards and integrating operational processes and business strategies that enhance the visibility, governance, and transparency of the existing indices. The agreement also enables the development, granting of licenses, distribution, and administration of current and future indices, developed as innovative and practical tools at local and international investors’ service. The SSE indices will use the shared brand “S&P/CLX” and may be used as underlying liquid financial products, thereby contributing to the expansion and depth of the Chilean capital markets. Under this agreement, S&P DJI assumed the calculation, production, maintenance, licensing, and distribution of the indices on August 6, 2018. Since that date, the IGPA and the IPSA, the former general and selective stock indices, are referred to as the SPCLXIGPA and the SPCLXIPSA.
The SPCLXIGPA is calculated considering, among other things, the prices of the shares traded during at least 25% of the days of the year, with a total of annual transactions exceeding UF10,000 (approximately US$ 409,000 as of December 31, 2020) and a free float of at least 5%. The SPCLXIGPA index is rebalanced annually after the close of the third Friday in March. The number of shares per component of the index is updated quarterly after the close of the third Friday in June, September, and December. On December 31, 2020, the SPCLXIGPA index closed at 21,007.46 points.
The SPCLXIPSA is calculated considering, among other things, the prices of the 30 shares with the highest trading volume during the previous six months, market trading on at least 90% of trading days, and a market capitalization above Ch$ 200 billion (US$ 281 million as of December 31, 2020). The SPCLXIPSA index is rebalanced every six months after the closing of the third Friday of March and September and is re-weighted quarterly after the close of the third Friday in June and December. On December 31, 2020, the SPCLXIPSA index closed at 4,177.22 points.
From October 1993 until the completion of the spin-off of Enel Chile in April 2016, shares of our common stock traded on the OTC market in the United States under our predecessor’s trading symbol “ENI.” Since the completion of the spin-off in 2016, our shares have traded under the trading symbol “ENIA” on the NYSE, our primary market, in the form of ADS. Each ADS represents 50 shares of common stock, with the ADS in turn evidenced by American Depositary Receipts (“ADRs”). The ADRs were issued under the Third Amended and Restated Deposit Agreement dated as of March 28, 2013, among us, Citibank, N.A. as Depositary (the “Depositary”), and the holders and beneficial owners from time to time of ADRs issued thereunder (the “Deposit Agreement”). The Depositary treats only persons in whose names ADRs are registered on the Depositary books as owners of ADRs.
As of December 31, 2020, ADRs evidencing 51,636,542 ADS (equivalent to 2,581,827,078 shares of common stock) were outstanding, representing 3.4% of the total number of outstanding shares. It is not practicable for us to determine the proportion of ADS beneficially owned by U.S. final beneficial holders. The trading volume of our shares on the NYSE and other U.S. exchanges in 2020 amounted to 407 million ADS, equivalent to approximately US$ 3,158 million.
The NYSE is open for trading Monday through Friday from 9:30 a.m. to 4:00 p.m., except for holidays declared in advance by the NYSE. On the trading floor, the NYSE trades in a continuous auction format, where traders can execute stock transactions on behalf of investors. Specialist brokers act as auctioneers in an open outcry auction market to bring buyers and sellers together and manage the actual auction. Customers can also send orders for immediate electronic execution or route orders to the floor for trade in the auction market. The NYSE works with U.S. regulators, such as the SEC and the Commodity Futures Trading Commission, to coordinate risk management measures in the electronic trading environment by implementing mechanisms such as circuit breakers and liquidity replenishment points.
183
The following table contains information regarding the amount of total traded shares of common stock and the
corresponding percentage traded per market during 2020:
The following table contains information regarding the amount of total traded shares of common stock and the corresponding percentage traded per market during 2020: | | | | |
|
| Number of shares of |
| Percentage |
Market | | | | |
Chile(1) | | 35,799,627,363 | | 63.7% |
United States (One ADS = 50 shares of common stock)(2) | | 20,371,653,000 | | 36.3% |
Total | | 56,171,280,363 | | 100.0% |
| (1) | Includes the SSE and ESE. |
| (2) | Includes the NYSE and over-the-counter trading. |
D. Selling Shareholders.
Not applicable.
E. Dilution.
Not applicable.
F. Expenses of the Issue.
Not applicable.
Item 10.Additional Information
A. | Share Capital. |
Not applicable.
B. | Memorandum and Articles of Association. |
Description of Share Capital
Set forth below is certain information concerning our share capital and a summary of certain significant Chilean law provisions and our bylaws.
General
Shareholders’ rights in Chilean companies are governed by the company’s bylaws (estatutos), which have the same purpose as the articles or the certificate of incorporation and the bylaws of a company incorporated in the United States, and the Chilean Corporations Law (Law No. 18,046). Under the Chilean Corporations Law, shareholders’ legal actions to enforce their rights as shareholders of the company must be brought in Chile in arbitration proceedings or, at the plaintiff’s option, before Chilean courts. Members of the board of directors, managers, officers, and principal executives of the company, or shareholders that individually own shares with a book value or stock value higher than UF5,000 (US$ 204,447 as of December 31, 2020) do not have the option to bring the procedure to the courts.
The CMF regulates the Chilean securities markets under the Securities Market Law (Law No. 18,045) and the Chilean Corporations Law. These two laws state the disclosure requirements, restrictions on insider trading and price manipulation, and protect minority shareholders. The Securities Market Law sets forth requirements for public offerings, stock exchanges, and brokers and outlines disclosure requirements for companies that issue publicly offered securities. The Chilean Corporations Law and the Securities Market Law, both as amended, state rules regarding takeovers, tender
184
offers, transactions with related parties, qualified majorities, share repurchases, directors’ committees, independent directors, stock options, and derivative actions.
Public Register
We are a publicly held stock corporation incorporated under the laws of Chile. We were incorporated by public deed issued on June 19, 1981, by the Santiago Notary Public, Mr. Patricio Zaldívar M. Our existence was approved by CMF Resolution 409-S of July 17, 1981, and we were registered on July 21, 1981, in the Commercial Register (Registro de Comercio del Conservador de Bienes Raíces y Comercio de Santiago), on pages 13099 No. 7269. We are registered with the CMF under entry number 0175. We also registered with the United States Securities and Exchange Commission under the commission file number 001-12440 on October 19, 1993.
Reporting Requirements Regarding Acquisition or Sale of Shares
Under Article 12 of the Securities Market Law and General Rule No. 269 of the CMF, certain information regarding transactions in shares of a publicly held stock corporation or in contracts or securities whose price or financial results depend on, or are conditioned in whole or in a significant part on the price of such shares, must be reported to the CMF and the Chilean Stock Exchanges. Since ADS are deemed to represent the shares of common stock underlying the ADRs, transactions in ADRs will be subject to these reporting requirements and those established in Circular 1375 of the CMF. Shareholders of publicly held stock corporations are required to report to the CMF and the Chilean Stock Exchanges:
● | any direct or indirect acquisition or sale of shares made by a holder who owns, directly or indirectly, at least 10% of a publicly held stock corporation’s subscribed capital; |
● | any direct or indirect acquisition or sale of contracts or securities whose price or financial results depend on or are conditioned in whole or in a significant part on the price of shares made by a holder who owns, directly or indirectly, at least 10% of a publicly held stock corporation’s subscribed capital; |
● | any direct or indirect acquisition of shares made by a holder who, due to a purchase of shares of such publicly held stock company, results in the holder acquiring, directly or indirectly, at least 10% of a publicly held stock company’s subscribed capital; |
● | any direct or indirect acquisition or sale of shares in any amount, made by a director, receiver, principal executive, general manager, or manager of a publicly held stock corporation; and |
● | any direct or indirect acquisition or sale of contracts or securities whose price or financial results depend on or are conditioned in whole or in a significant part on the price of shares made by a director, receiver, principal executive, general manager, or manager of a publicly held stock corporation. |
The majority shareholders of a publicly held stock corporation must inform the CMF and the Chilean Stock Exchanges if such acquisitions are entered into to acquire control of the company or make a passive financial investment instead.
Under Article 54 of the Securities Market Law and General Rule No. 104 enacted by the CMF, unless the tender offer regulation applies, any person who directly or indirectly intends to take control of a publicly held stock corporation must disclose this intent to the market at least ten business days in advance of the proposed change of control and, in any event, as soon as the negotiations for the change of control have taken place or reserved information of the publicly held stock corporation has been provided.
Corporate Objectives and Purposes
Article 4 of our bylaws states that our corporate objectives and purposes are, among other things, to conduct the exploration, development, operation, generation, distribution, transmission, transformation, or sale of energy in any form, directly or through other companies, as well as to provide engineering consulting services related to these objectives, and to participate in the telecommunications business.
185
Board of Directors
Our board of directors consists of seven members appointed by shareholders at an OSM for a three-year term, at the end of which they will be re-elected or replaced.
The seven directors elected at the OSM are the seven individual nominees who receive the highest majority of the votes, provided one of those individuals must be an independent director. Each shareholder may vote his shares in favor of one nominee or may apportion his shares among any number of nominees.
The effect of these voting provisions is to ensure that a shareholder owning more than 12.5% of our shares can elect a board member. However, depending on the distribution of the rest of the votes at the OSM, a director may in some cases be elected with the votes of less than 12.5% of our shares. This number is derived from the reciprocal of the number of directors plus one. In our case, there are seven directors, and the reciprocal of eight is equal to 12.5%.
The compensation of the directors is established annually at the OSM. See “Item 6. Directors, Senior Management and Employees — B. Compensation.”
Agreements entered into by us with related parties can only be executed when such agreements serve our interest, and their price, terms, and conditions are consistent with prevailing market conditions at the time of their approval and comply with all the requirements and procedures indicated in Article 147 of the Chilean Corporations Law.
Certain Powers of the Board of Directors
As of the date of this Report, every agreement or contract that we enter into with our controlling shareholder, our directors or executives, or their related parties, must be previously approved by the board of directors and be included in the Board meetings, as set forth by the Chilean Corporations Law.
Our bylaws do not contain provisions related to:
● | the directors’ power, in the absence of an independent quorum, to vote on compensation for themselves or any members of their body; |
● | borrowing powers exercisable by the directors and how such borrowing powers can be changed; |
● | retirement or non-retirement of directors under an age limit requirement; or |
● | the number of shares, if any, required for directors’ qualification. |
Certain Provisions Regarding Shareholder Rights
As of the date of this Report, our capital comprises only one class of shares, all of which are common shares and have the same rights.
Our bylaws do not contain any provisions relating to:
● | redemption provisions; |
● | sinking funds; or |
● | liability for capital reductions by us. |
Under Chilean law, the rights of our shareholders may only be modified by an amendment to the bylaws that complies with the requirements explained below under “Item 10. Additional Information — B. Memorandum and Articles of Association. — Shareholders’ Meetings and Voting Rights.”
186
Capitalization
Under Chilean law, only the shareholders of a company acting at an ESM have the power to authorize a capital increase. When an investor subscribes shares, these are officially issued and registered under his name. The subscriber is treated as a shareholder for all purposes, except the receipt of dividends and for return of capital if the shares have been subscribed but not paid. The subscriber becomes eligible to receive dividends only for the shares that he has paid for or, if the subscriber has paid for only a portion of such shares, the pro-rata portion of the dividends declared with respect to such shares unless the company’s bylaws provide otherwise. If a subscriber does not fully pay for shares for which the subscriber has subscribed on or before the date agreed upon for payment, notwithstanding the actions intended by the company to collect payment, the company is entitled to auction on the stock exchange where such shares are traded, for the account and risk of the debtor, the number of shares held by the debtor necessary for the company to pay the outstanding balances and disposal expenses. However, until such shares are sold at auction, the subscriber continues to hold all the shareholder rights, except the right to receive dividends and return of capital. The Chief Executive Officer, or the person replacing him, will reduce in the shareholders’ register the number of shares in the name of the debtor shareholder to the number of shares that remain, deducting the shares sold by the company and settling the debt in the amount necessary to cover the result of such disposal after the related expenses.
When there are authorized and issued shares for which full payment has not been made within the period fixed by shareholders at the same ESM at which the subscription was authorized (which may not exceed three years from the date of such meeting, unless a stock option plan is approved, in which case the period to pay for the shares under such program may be up to five years), these shall be reduced in the non-subscribed amount until that date. Concerning the shares subscribed and not paid following the term mentioned above, the board must proceed to collect payment, unless the shareholders’ meeting authorizes the board not to do so (by two-thirds of the voting shares), in which case the capital shall be reduced by force of law to the amount effectively paid. Once collection actions have been exhausted, the board should propose to the shareholders’ meeting the approval by a simple majority of the write-off of the outstanding balance and the reduction of capital to the amount effectively collected.
As of December 31, 2020, the Company’s subscribed and fully paid capital totaled US$ 9.8 billion consisting of 76,086,311,036 shares. As of April 1, 2021, the Company’s subscribed and fully paid capital totaled US$ 15,799,498,544 consisting of 107,281,698,561 shares.
Preemptive Rights and Increases of Share Capital
Except for capital increases needed to carry out a merger, Chilean regulation requires Chilean stock corporations to grant shareholders preemptive rights to purchase a sufficient number of shares, or any other securities convertible into shares or that confer future rights over shares, to maintain their existing ownership percentage of such company whenever such company issues new shares, or any other securities convertible into shares or that confer future rights over shares.
Under Chilean law, preemptive rights are exercisable or freely transferable by shareholders for 30 days. The options to subscribe for shares in capital increases of the company or of any other securities convertible into shares or that confer future rights over these shares should be offered, at least once, to the shareholders pro-rata to the shares held registered in their name at midnight on the fifth business day before the date of the start of the preemptive rights period. The preemptive rights offering and the beginning of the 30 days for exercising them shall be communicated through the publication of a prominent notice, at least once, in the newspaper that should be used for notifications of shareholders’ meetings. During such 30 days, and for an additional period of at least 30 days immediately following the initial 30-day period, publicly held stock corporations are not permitted to offer any unsubscribed shares to third parties under more favorable terms than those provided to their shareholders. At the end of the second 30-day period, a Chilean publicly held stock corporation is authorized to sell non-subscribed shares to third parties on any terms, provided they are sold on one of the Chilean Stock Exchanges.
Shareholders’ Meetings and Voting Rights
An OSM must be held within the first four months following the end of our fiscal year. Our last OSM was held on April 29, 2021. An ESM may be called by the board of directors when deemed appropriate. An ESM and OSM, as the case may be, must be called when requested by shareholders representing at least 10% of the issued shares with voting rights or by the CMF. To convene an OSM or ESM, notice must be given three times in a newspaper located in our
187
corporate domicile, at least ten days in advance of the scheduled meeting. The newspaper designated by our shareholders is El Mercurio de Santiago. Notice must also be mailed to each shareholder, the CMF, and the Chilean Stock Exchanges.
The OSM or ESM shall be held on the day stated in the notice and should remain in session until all the matters stated in the notice have been addressed. However, once constituted, upon the proposal of the Chairman or shareholders representing at least 10% of the shares with voting rights, the majority of the shareholders present may agree to suspend it and to continue it within the same day and place, with no new constitution of the meeting or qualification of powers being necessary, recorded in one set of minutes. Only those shareholders who were present or represented may attend the recommencement of the meeting with voting rights.
Under Chilean law, a quorum for a shareholders’ meeting is established by the presence, in person or by proxy, of shareholders representing at least a majority of the issued shares with voting rights of a company. If a quorum is not present at the first meeting, a reconvened meeting can occur at which the shareholders present are deemed to constitute a quorum regardless of the percentage of the shares represented. This second meeting must take place within 45 days following the scheduled date for the first meeting. Shareholders’ meetings adopt resolutions by the affirmative vote of a majority of those shares present or represented at the meeting unless a qualified majority is required.
Regardless of the quorum present, a vote of at least a two-thirds majority of the outstanding shares with voting rights is required to adopt any of the following actions:
● | a transformation of the company into a form other than a publicly held stock corporation under the Chilean Corporations Law, a merger or split-up of the company; |
● | an amendment to the term of duration or early dissolution of the company; |
● | a change in the company’s domicile; |
● | a decrease of corporate capital; |
● | an approval of capital contributions in kind and non-monetary assessments; |
● | a modification of the authority reserved to shareholders or limitations on the board of directors; |
● | a reduction in the number of members of the board of directors; |
● | the disposition of 50% or more of the assets of the company, whether it includes the disposition of liabilities or not, as well as the approval or the amendment of the business plan that contemplates the disposition of assets in an amount greater than such percentage; |
● | the disposition of 50% or more of the assets of a subsidiary, as long as such subsidiary represents at least 20% of the assets of the corporation, as well as any disposition of its shares that results in the parent company losing its position as controlling shareholder; |
● | the form of distributing corporate benefits; |
● | issue of guarantees for third-party liabilities which exceed 50% of the assets, except when the third party is a subsidiary of the company, in which case approval of the board of directors is deemed sufficient; |
● | the purchase of the company’s own shares; |
● | other actions established by the bylaws or the laws; |
● | certain remedies for the nullification of the company’s bylaws; |
188
● | inclusion in the bylaws of the right to purchase shares from minority shareholders, when the controlling shareholders reaches 95% of the company’s shares through a tender offer for all of the company’s shares, where at least 15% of the shares have been acquired from unrelated shareholders; and |
● | approval or ratification of acts or contracts with related parties. |
Bylaw amendments for creating a new class of shares, or an amendment to or an elimination of those classes of shares that already exist, must be approved by at least two-thirds of the outstanding shares of the affected series.
Chilean law does not require a publicly held stock corporation to provide its shareholders the same level and type of information required by the U.S. securities laws regarding proxies’ solicitation. However, shareholders are entitled to examine the financial statements and corporate books of a publicly held stock corporation and its subsidiaries within the 15 days before its scheduled shareholders’ meeting. Under Chilean law, publicly held stock corporations must also inform, at least ten days in advance of the scheduled meeting and in the manner to be established by the CMF, the fact that an ESM or OSM has been summoned, indicating the date, a reference to the matters to be discussed, and how complete copies of the documents that support the issues submitted for voting can be obtained, which must also be made available to the shareholders on the company’s website. In the case of an OSM, our annual report of activities, which includes audited financial statements, must also be made available to shareholders and published on our website at www.enelamericas.com.
The Chilean Corporations Law provides that, upon the request by the Directors Committee or by shareholders representing at least 10% of the issued shares with voting rights, a Chilean company’s annual report must include, in addition to the materials provided by the board of directors to shareholders, such shareholders’ comments and proposals concerning the company’s affairs. Under Article 136 of the Chilean Corporations Regulation (Reglamento de Sociedades Anónimas), the shareholder(s) holding or representing at least 10% of the shares issued with voting rights may:
● | make comments and proposals relating to the progress of the corporate businesses in the corresponding year, no shareholder can make individually or jointly more than one presentation. These observations should be presented in writing to the company concisely, responsibly, and respectfully. The respective shareholder(s) should state their willingness to be included as an appendix to the annual report. The Board shall include in an appendix to the annual report of the year a faithful summary of the pertinent comments and proposals the interested parties had made, provided they are presented during the year or within 30 days after its ending; or |
● | make comments and proposals on matters that the Board submits for the shareholders’ knowledge or voting. The Board shall include a faithful summary of those comments and proposals in all information it sends to shareholders, provided the shareholders’ proposal is received at the offices of the company at least ten days before the date of dispatch of the information by the company. |
The shareholders should present their comments and proposals to the company, expressing their willingness to be included in the appendix to the respective annual report or in information sent to shareholders, as the case may be. The observations referred to in Article 136 may be made separately by each shareholder holding at least 10% of the shares issued with voting rights or shareholders who together hold that percentage, who should act as one.
Similarly, the Chilean Corporations Law provides that whenever the board of directors of a publicly held stock corporation convenes an OSM or ESM and solicits proxies for the meeting, or circulates information supporting its decisions or other similar material, it is obligated to include the pertinent comments and proposals that may have been made by the Directors Committee or by shareholders owning at least 10% of the shares with voting rights who request that such comments and proposals be so included.
Only shareholders registered as such with us, as of midnight on the fifth business day before a meeting date, are entitled to attend and vote their shares. A shareholder may appoint another individual, who does not need to be a shareholder, as his proxy to attend the meeting and vote on his behalf. Proxies for such representation shall be given for all the shares held by the owner. The proxy may contain specific instructions to approve, reject, or abstain concerning
189
any of the matters submitted for voting at the meeting and included in the notice. Every shareholder entitled to attend and vote at a shareholders’ meeting shall have one vote for every share subscribed.
There are no limitations imposed by Chilean law or our bylaws on the right of nonresidents or foreigners to hold or vote shares of common stock. However, the registered holder of the shares of common stock represented by ADS, and evidenced by outstanding ADS, is the custodian for the Depositary (Citibank, N.A.), currently Banco Santander-Chile, or any successor custodian. Accordingly, holders of ADS are not entitled to receive notice of shareholders’ meetings or vote the underlying shares of common stock represented by ADS directly. The Deposit Agreement contains provisions under which the Depositary has agreed to request instructions from registered holders of ADS regarding the exercise of the voting rights of the shares of common stock represented by the ADS. Subject to compliance with the requirements of the Deposit Agreement and receipt of such instructions, the Depositary has agreed to endeavor, insofar as practicable and permitted under Chilean law and the provisions of the bylaws, to vote or cause to be voted (or grant a discretionary proxy to the Chairman of the Board or to a person designated by the Chairman of the Board to vote) the shares of common stock represented by the ADS under any such instruction. The Depositary shall not itself exercise any voting discretion over any shares of common stock underlying ADS. If the Depositary receives no voting instructions from a holder of ADS concerning the shares of common stock represented by the ADS, on or before the date established by the Depositary for such purpose, the shares of common stock represented by the ADS may, in some situations, be voted in the manner directed by the Chairman of the Board, or by a person designated by the Chairman of the Board, subject to the limitations outlined in the Deposit Agreement.
Dividends and Liquidation Rights
According to the Chilean Corporations Law, unless otherwise decided by a unanimous vote of its issued shares eligible to vote, all publicly held stock corporations must distribute a cash dividend in an amount equal to at least 30% of their consolidated net income, unless and except to the extent we have carried forward losses. The law provides that the board of directors must agree to the dividend policy and inform such policy to the shareholders at the OSM.
For any dividend above 30% of net income, publicly held stock corporations may grant their shareholders an option to receive those dividends in cash, or shares issued by such publicly held stock corporation, or in shares of publicly held corporations owned by such company. Shareholders who do not expressly elect to receive a dividend other than cash are legally presumed to have decided to accept the dividend in cash.
Dividends declared but not paid within the appropriate period outlined in the Chilean Corporations Law (30 days after declaration for the minimum dividend, and the date set for payment at the time of declaration for additional dividends) are adjusted to reflect the change in the value of UF, from the date set for payment to the date such dividends are paid. Such dividends also accrue interest at the then-prevailing rate for UF-denominated deposits during such period. The right to receive a dividend lapses if it is not claimed within five years from the date such dividend is payable. Payments not collected in such a period are transferred to the Chilean volunteer fire department.
In the event of our liquidation, the shareholders would participate in the assets available in proportion to the number of paid-in shares held by them after payment to all creditors.
Approval of Financial Statements
The board of directors is required to submit our consolidated financial statements to the shareholders annually for their approval. If the shareholders by a vote of a majority of shares present (in person or by proxy) at the shareholders’ meeting reject the financial statements, the board of directors must submit new financial statements no later than 60 days from the date of such meeting. If the shareholders reject the new financial statements, the entire board of directors is deemed removed from office, and a new board is elected at the same meeting. Directors who individually approved such financial statements are disqualified for reelection for the following period. Our shareholders have never rejected the financial statements presented by the board of directors.
Change of Control
The Capital Markets Law establishes a comprehensive regulation related to tender offers. The law defines a tender offer as the offer to purchase shares of companies that publicly offer their shares or convertible securities. This offer is
190
made to shareholders to purchase their shares under conditions that allow the bidder to reach a certain percentage of ownership of the company within a fixed period. These provisions apply to both voluntary and hostile tender offers.
Acquisition of Shares
No provision in our bylaws discriminates against any existing or prospective holder of shares due to such shareholder owning a substantial number of shares.
Right of Dissenting Shareholders to Tender Their Shares
The Chilean Corporations Law provides that upon adopting any of the resolutions enumerated below at a shareholders’ meeting, dissenting shareholders acquire the right to withdraw from the company and compel the company to repurchase their shares, subject to the fulfillment of specific terms and conditions. To exercise such withdrawal rights, holders of ADRs must first withdraw the shares represented by their ADRs under the Deposit Agreement’s terms. In case of a bankruptcy proceeding, the withdrawal right from an adopted resolution is suspended until the existing debt has been paid.
“Dissenting” shareholders are defined as those at a shareholders’ meeting who vote against a resolution that results in the withdrawal right, or who, if absent from such meeting, state in writing their opposition to the respective resolution within the 30-days following the shareholders’ meeting. Shareholders present or represented at the meeting and who abstain from exercising their voting rights shall not be considered dissenting. The right to withdraw should be exercised for all the shares that the dissenting shareholder had registered in their name on the date on which the right is determined to participate in the meeting at which the resolution is adopted that motivates the withdrawal and which remains on the date on which their intention to withdraw is communicated to the company. The price paid to a dissenting shareholder of a publicly held stock corporation whose shares are quoted and actively traded on one of the Chilean Stock Exchanges is the weighted-average of the sales prices for the shares as reported on the Chilean Stock Exchanges on which the shares are quoted for the 60-trading-days between the ninetieth and the thirtieth trading day before the shareholders’ meeting giving rise to the withdrawal right. If the CMF determines that the shares are not actively traded on a stock exchange, the price paid to the dissenting shareholder shall be the book value. Book value for this purpose must be equal to equity attributable to the parent company, divided by the total number of subscribed shares, whether entirely or partially paid. This calculation is made using the latest consolidated statements of financial position, as adjusted to reflect inflation up to the date of the shareholders’ meeting that gave rise to the withdrawal right.
Article 126 of the Chilean Corporations Regulation (Reglamento de Sociedades Anónimas) establishes that in cases where the right to withdraw arises, the company is obliged to inform the shareholders of this situation, the value per share that will be paid to shareholders exercising their right to withdraw and the term for exercising it. Such information should be given to shareholders at the same meeting at which the resolutions are adopted, giving rise to the right of withdrawal, prior to its voting. A special communication should be given to the shareholders with rights within two days following the date on which the rights to withdraw arise. In the case of publicly held companies, such information must be communicated by a prominent notice in a newspaper with a wide national circulation, as well as on the newspaper’s website, and via a written communication addressed to the shareholders with rights at the address they have registered with the company. The notice of the shareholders’ meeting to vote on a matter that could give rise to withdrawal rights should mention this circumstance.
The resolutions that result in a shareholder’s right to withdraw include, among others, the following:
● | the transformation of the company into an entity which is not a publicly held stock corporation governed by the Chilean Corporations Law; |
● | the merger of the company with another company; |
● | disposition of 50% or more of the assets of the company, whether it includes the disposition of liabilities or not, as well as the approval or the amendment of the business plan that contemplates the disposition of assets in an amount greater than such percentage; |
191
● | the disposition of 50% or more of the assets of a subsidiary, as long as such subsidiary represents at least 20% of the assets of the company, as well as any disposition of its shares that results in the parent company losing its position of controlling shareholder; |
● | issue of guarantees for third parties’ liabilities that exceed 50% of the assets (if the third party is a subsidiary of the company, the approval of the board of directors is sufficient and shall not give rise to the right to withdraw); |
● | the creation of preferential rights for a class of shares or an amendment to the existing ones. In this case, the right to withdraw only accrues to the dissenting shareholders of the class or classes of shares adversely affected; |
● | certain remedies for the nullification of the corporate bylaws; and |
● | such other causes as may be established by the law or by the company’s bylaws. |
Investments by AFPs
The Pension Fund System Law permits AFPs to invest their funds in companies subject to Title XII, and these companies are subject to greater restrictions than other companies. The determination of which stocks may be purchased by AFPs is made by the Risk Classification Committee. The Risk Classification Committee establishes investment guidelines and is empowered to approve or disapprove those companies that are eligible for AFP investments. Except for March 2003 to March 2004, we were a Title XII company from 1985 until April 1, 2021, and we were approved by the Risk Classification Committee during that time. As a result of the effectiveness of the 2021 Merger, we are no longer a Title XII company.
Registrations and Transfers
Shares issued by us are registered with an administrative agent, which is DCV Registros S.A. This entity is also responsible for our shareholders’ registry. In the case of jointly owned shares, an attorney-in-fact must be appointed to represent the joint owners in dealing with us.
C. | Material Contracts. |
None.
D. | Exchange Controls. |
The Central Bank of Chile is responsible for, among other things, monetary policies and exchange controls in Chile. Currently, applicable foreign exchange regulations are outlined in the Compendium of Foreign Exchange Regulations (the “Compendium”) approved by the Central Bank of Chile.
a) | Chapter XIV |
The following is a summary of certain provisions of Chapter XIV that apply to all existing shareholders (and ADS holders). This summary does not intend to be complete and is qualified in its entirety by reference to Chapter XIV. Chapter XIV regulates the following type of investments: credits, deposits, investments, and equity contributions. A Chapter XIV investor may repatriate at any time investment made in us upon the sale of our shares, and the profits derived from there, with no monetary ceiling, subject to the then-effective regulations, which must be reported to the Central Bank of Chile.
Except for compliance with tax regulations and some reporting requirements, currently there are no rules in Chile affecting repatriation rights, except that the remittance of foreign currency must be made through a Formal Exchange Market entity. However, the Central Bank of Chile has the authority to change such rules and impose exchange controls.
192
b) | The Compendium and International Bond Issuances |
Chilean issuers may offer bonds internationally, subject to the reporting requirements outlined in Chapter XIV of the Compendium.
E. Taxation.
Chilean Tax Considerations
The following discussion summarizes Chilean material income and withholding tax consequences to foreign holders arising from the ownership and disposition of shares and ADS. The summary that follows does not purport to be a comprehensive description of all of the tax considerations that may be relevant to a decision to purchase, own or dispose of shares or ADS, if any, and does not purport to deal with the tax consequences applicable to all categories of investors, some of which may be subject to special rules. Holders of shares and ADS are advised to consult their own tax advisors concerning the Chilean and other tax consequences of the ownership of shares or ADS.
The summary that follows is based on Chilean law, in effect on the date hereof, and is subject to any changes in these or other laws occurring after such date, possibly with retroactive effect. Under Chilean law, provisions in statutes such as tax rates applicable to foreign investors, the computation of taxable income for Chilean purposes, and how Chilean taxes are imposed and collected may be amended only by another law. The Chilean tax authorities also enact rulings and regulations of either general or specific application and interpret the Chilean Income Tax Law provisions. Chilean tax may not be assessed retroactively against taxpayers who act in good faith, relying on such rulings, regulations, and interpretations, but Chilean tax authorities may change their rulings, regulations, and interpretations in the future. The discussion that follows is also based, in part, on representations of the Depositary and assumes that each obligation in the Deposit Agreement and any related agreements will be performed under its terms. As of this date, there is currently no applicable income tax treaty in effect between the United States and Chile. However, in 2010 the United States and Chile signed an income tax treaty that will enter into force once the treaty is ratified by both countries, which has not happened as of the date of this Report. There can be no assurance that either country will ratify the treaty. The following summary assumes that there is no applicable income tax treaty in effect between the United States and Chile.
As used in this Report, the term “foreign holder” means either:
● | In the case of an individual holder, a person who is not a resident of Chile. For purposes of Chilean taxation, (a) any person who remains in Chile, uninterrupted or not, for a period or periods that in total exceed 183 days, within any period of twelve months or (b) an individual is domiciled in Chile if he resides in Chile and has the intention of remaining in Chile (such intention to be evidenced by circumstances such as the acceptance of employment in Chile or the relocation of the individual’s family to Chile), or |
● | in the case of a legal entity holder, an entity that is not organized under Chile’s laws, unless the shares or ADS are assigned to a branch, agent, representative, or permanent establishment of such entity in Chile. |
Taxation of Shares and ADS
Taxation of Cash Dividends and Property Distributions
Cash dividends paid concerning the shares or ADS held by a foreign holder will be subject to Chilean withholding tax, which is withheld and paid by the company. The amount of the Chilean withholding tax is determined by applying a 35% rate to a “grossed-up” distribution amount (such amount equal to the sum of the actual distribution amount and the correlative Chilean corporate income tax (“CIT”), paid by the issuer), and then subtracting as a credit 65% of such Chilean CIT paid by the issuer, in case the residence country of the holder of shares or ADS does not have a tax treaty with Chile. If there is a tax treaty between both countries (in force or signed before January 1, 2020), the Foreign Holder can apply 100% of the CIT as a credit. For 2020, the Chilean CIT applicable to us is a rate of 27%, and depending on the circumstances mentioned above, the Foreign Holder may apply 100% or 65% of the CIT as a credit.
193
In February 2020, tax reform contemplating only a partially integrated tax regime was enacted. Under the current Chilean Income Tax Law, publicly held limited liability stock companies, such as we, are subject to this regimen, consisting of a cash basis shareholder taxation.
Under the cash basis regime (or partially integrated regime), a company pays CIT on its annual income tax result. Foreign and local individual shareholders will only pay in Chile the relevant tax on effective profit distributions. They will be allowed to use the CIT paid by the distributing company as credit, with certain limitations. Only 65% of the CIT is creditable against the 35% shareholder-level tax. However, in those cases where tax treaties between Chile and the jurisdiction of the shareholder’s residence are signed before January 1, 2020 (even if not yet in effect), the CIT is entirely creditable against the 35% withholding tax. This is the case with the tax treaty signed between Chile and the United States, which was signed before this date, but which is not in effect as of the date of this Report. In the case of treaties signed before January 1, 2020, but not ratified as of December 31, 2026, the shareholder may apply 100% of the CIT as a credit if a dividend distribution is made before December 31, 2026, on a transitional basis. Under the Chilean Tax Law in force at the date of this Report, the transitional treatment of applying the full 100% of the CIT as a credit against withholding tax of the U.S. Holders in case of dividend distributions will terminate on December 31, 2026, if the tax treaty between the United States and Chile is not ratified by that date. In that particular case, effective as of January 1, 2027, only 65% of the CIT will be creditable against the 35% U.S. Holders’ tax. On the other hand, if a tax treaty with a foreign jurisdiction is ratified by December 31, 2026, shareholders from that particular jurisdiction can continue to apply 100% of the CIT as a credit beyond such date.
The example below illustrates the effective Chilean withholding tax burden on a cash dividend received by a Foreign Holder, assuming a Chilean withholding tax base rate of 35%, an effective Chilean CIT rate of 27% (the CIT rate for 2020 under cash basis regime) and a distribution of 50% of the net income of the company distributable after payment of the Chilean CIT:
| | | | | | |
Line |
| Concept and calculation assumptions |
| Amount Tax treaty resident |
| Amount Tax treaty resident |
1 | | Company taxable income (based on Line 1 = 100) | | 100.0 | | 100.0 |
2 | | Chilean corporate income tax: 27% x Line 1 | | 27 | | 27 |
3 | | Net distributable income: Line 1—Line 2 | | 73 | | 73 |
4 | | Dividend distributed (50% of net distributable income): 50% of Line 3 | | 36.5 | | 36.5 |
5 | | Withholding tax: (35% of (the sum of Line 4 and 50% of Line 2)) | | 17.5 | | 17.5 |
6 | | Credit for 50% of Chilean corporate income tax: 50% of Line 2 | | 13.5 | | 13.5 |
7 | | CIT partial restitution (Line 6 x 35)%(1) | | — | | 4.7 |
8 | | Net withholding tax: Line 5 - Line 6 + Line 7 | | 4 | | 8.7 |
9 | | Net dividend received: Line 4 - Line 8 | | 32.5 | | 27.8 |
10 | | Effective dividend withholding rate: Line 8 / Line 4 | | 11.0 | | 23.9 |
| (1) | Only applicable to non-tax treaty jurisdiction residents. From a practical standpoint, the foregoing means that the CIT is only partially creditable (65%) against the withholding tax (i.e., CIT of 8.7%). |
However, for purposes of the foregoing, the tax authority has not clarified whether the taxpayer residence will be the ADS holder’s address or the depository’s address.
Taxation on sale or exchange of ADS outside of Chile
Gains obtained by a foreign holder from the sale or exchange of ADS outside Chile are not subject to Chilean taxation.
Taxation on sale or exchange of Shares
The Chilean Income Tax Law includes a tax exemption on capital gains from the sale of shares of listed companies traded in stock markets. Although there are certain restrictions, in general terms, the law provides that in order to qualify for the capital gain exemption: (i) the shares must be of a publicly held stock corporation with a “sufficient stock market liquidity” status in the Chilean Stock Exchanges; (ii) the sale must be carried out in a Chilean Stock Exchange
194
authorized by the CMF, or in a tender offer subject to Chapter XXV of the Chilean Securities Market Law or as the consequence of a contribution to a fund as regulated in Section 109 of the Chilean Income Tax Law; (iii) the shares which are being sold must have been acquired on a Chilean Stock Exchange, or in a tender offer subject to Chapter XXV of the Chilean Securities Market Law, or in an initial public offering (due to the creation of a company or to a capital increase), or due to the exchange of convertible publicly offered securities, or due to the redemption of a fund’s quota as regulated in Section 109 of the Chilean Income Tax Law; and (iv) the shares must have been acquired after April 19, 2001. For purposes of considering the ADS as convertible publicly offered securities, they should be registered in the Chilean foreign securities registry (unless expressly excluded from such registry by the CMF).
Shares are considered to have a “high presence” in the Chilean Stock Exchanges when (i) they have been traded for a certain number of days at or beyond a volume threshold specified under Chilean law and regulations or (ii) in case the issuer has retained a market maker, in accordance with Chilean law and regulations. As of this date, our shares are considered to have a high presence in the Chilean Stock Exchanges, and we have not retained any market maker. Should our shares cease to have a “high presence” in the Chilean Stock Exchanges, a transfer of our shares may be subject to capital gains taxes from which holders of “high presence” securities are exempted, and which will apply at varying levels depending on the time of the transfer concerning the date of loss of sufficient trading volume to qualify as a “high presence” security. If our shares regain a “high presence,” the tax exemptions will again be available to holders.
If the shares do not qualify for the exemption, capital gains on their sale or exchange of shares (as distinguished from sales or exchanges of ADS representing such shares of common stock) could be subject to the general tax regime, with a 27% Chilean CIT, the rate applicable during 2020, and a 35% Chilean withholding tax, the former being creditable against the latter.
The date of acquisition of the ADS is the date of purchase of the shares for which the ADS are exchanged.
Taxation of Share Rights and ADS Rights
For Chilean tax purposes and to the extent we issue any share rights or ADS rights, the receipt of share rights or ADS rights by a Foreign Holder of shares or ADS under a rights offering is a nontaxable event. Also, there are no Chilean income tax consequences to Foreign Holders upon the exercise or the expiration of the share rights or the ADS rights.
Any gain on the sale, exchange, or transfer of any ADS rights by a Foreign Holder is not subject to taxes in Chile.
Any gain on the sale, exchange, or transfer of the share rights by a Foreign Holder is subject to a 35% Chilean withholding tax.
Other Chilean Taxes
There is no gift, inheritance, or succession tax applicable to foreign holders’ ownership, transfer, or disposition of ADS. Still, such taxes will generally apply to the transfer at death or by a gift of the shares by a foreign holder. There is no Chilean stamp, issue, registration, or similar taxes or duties payable by holders of shares or ADS.
Material U.S. Federal Income Tax Considerations
This discussion is based on the U.S. Internal Revenue Code of 1986, as amended (the “Code”), administrative pronouncements, judicial decisions, and final, temporary, and proposed Treasury regulations, all as of the date of this Report. These authorities are subject to change, possibly with retroactive effect. This discussion assumes that the depositary’s activities are clearly and appropriately defined to ensure that the tax treatment of ADS will be identical to the tax treatment of the underlying shares.
The following are the material U.S. federal income tax consequences to U.S. Holders (as defined herein) of receiving, owning, and disposing of shares or ADS. Still, it does not purport to be a comprehensive description of all of the tax considerations that may be relevant to a particular person’s decision to hold such securities and is based on the assumption stated above under “Chilean Tax Considerations” that there is no applicable income tax treaty in effect between the United States and Chile. The discussion applies only if the beneficial owner holds shares or ADS as capital assets for U.S. federal income tax purposes. It does not describe all of the tax consequences relevant in light of the
195
beneficial owner’s particular circumstances. For instance, it does not describe all the tax consequences that may be relevant to:
● | certain financial institutions; |
● | insurance companies; |
● | dealers and traders in securities who use a mark-to-market method of tax accounting; |
● | persons holding shares or ADS as part of a “straddle” integrated transaction or similar transaction; |
● | persons whose functional currency for U.S. federal income tax purposes is not the U.S. dollar; |
● | partnerships or other entities classified as partnerships for U.S. federal income tax purposes or partners in such partnerships; |
● | persons liable for the alternative minimum tax; |
● | tax-exempt organizations; |
● | persons holding shares or ADS that own or are deemed to own ten percent or more of our stock; or |
● | persons holding shares or ADS connected with a trade or business conducted outside of the United States. |
Persons or entities described above, including partnerships holding shares or ADS and partners in such partnerships, should consult their tax advisors about the particular U.S. federal income tax consequences of holding and disposing of shares or ADS.
You will be a “U.S. Holder” for purposes of this discussion if you become a beneficial owner of our shares or ADS and if you are, for U.S. federal income tax purposes:
● | a citizen or an individual resident of the United States; or |
● | a corporation, or other entity taxable as a corporation, created or organized in or under the laws of the United States or any political subdivision thereof; or |
● | an estate, the income of which is subject to U.S. federal income taxation regardless of its source; or |
● | a trust (i) that validly elects to be treated as a U.S. person for U.S. federal income tax purposes or (ii) if (A) a court within the United States is able to exercise primary supervision over the administration of the trust and (B) one or more U.S. persons have the authority to control all substantial decisions of the trust. |
For U.S. federal income tax purposes, it is generally expected that a U.S. Holder of ADS will be treated as the beneficial owner of the underlying shares represented by the ADS. The remainder of this discussion assumes that a U.S. Holder of our ADS will be treated in this manner for U.S. federal income tax purposes. Accordingly, deposits or withdrawals of shares for ADS will generally not be subject to U.S. federal income tax.
The U.S. Treasury has expressed concerns that parties to whom ADS are released before shares are delivered to the depositary (pre-release) or intermediaries in the chain of ownership between beneficial owners and the issuer of the security underlying the ADS may be taking actions that are inconsistent with the claiming of foreign tax credits for beneficial owners of depositary shares. Such actions would also be inconsistent with claiming the reduced tax rate, described below, applicable to dividends received by certain non-corporate beneficial owners. Accordingly, the analysis of the creditability of Chilean taxes and the availability of the reduced tax rate for dividends received by certain non-corporate holders, each described below, could be affected by actions taken by such parties or intermediaries.
196
This discussion assumes that we will not be a passive foreign investment company, as described below. The discussion below does not address the effect of any U.S. state, local, estate, or gift tax law or non-U.S. tax law or tax considerations that arise from rules of general application to all taxpayers on a U.S. Holder of the shares or ADS or of any future administrative guidance interpreting provisions thereof. U.S. Holders should consult their own tax advisors concerning their particular tax consequences of owning or disposing of shares or ADS, including the applicability and effect of state, local, non-U.S., and other tax laws and the possibility of changes in tax laws, including the effect of any future administrative guidance interpreting provisions thereof.
Taxation of Distributions
The following discussion of cash dividends and other distributions is subject to the discussion below under “Passive Foreign Investment Company Rules.” Distributions received by a U.S. Holder on shares or ADS, including the amount of any Chilean taxes withheld, other than certain pro-rata distributions of shares to all shareholders, will constitute foreign-source income to the extent paid out of our current or accumulated earnings and profits (as determined for U.S. federal income tax purposes). Because we do not maintain calculations of our earnings and profits under U.S. federal income tax principles, it is expected that distributions generally will be reported to U.S. Holders as dividends. The amount of dividend income paid in Chilean pesos that a U.S. Holder will be required to include in income will equal the U.S. dollar value of the distributed Chilean peso, calculated by reference to the exchange rate in effect on the date the payment is received, regardless of whether the payment is converted into U.S. dollars on the date of receipt. If the dividend is converted into U.S. dollars on the date of receipt, a U.S. Holder will generally not be required to recognize foreign currency gain or loss regarding the dividend income. A U.S. Holder may have foreign currency gain or loss if the dividend is converted into U.S. dollars after the date of its receipt, which would be ordinary income or loss and would be treated as income from U.S. sources for foreign tax credit purposes. Dividends will be included in a U.S. Holder’s income on the date of the U.S. Holder’s, or in the case of ADS, the depositary’s, receipt of the dividend.
Subject to certain exceptions for short-term and hedged positions, the discussion above regarding concerns expressed by the U.S. Treasury and the discussion below regarding rules intended to be promulgated by the U.S. Treasury, the U.S. dollar amount of dividends received by a non-corporate U.S. Holder in respect of shares or ADS generally will be subject to taxation at preferential rates if the dividends are “qualified dividends.” Dividends paid on the ADS generally will be treated as qualified dividends if (i) the ADS are readily tradable on an established securities market in the United States (ii) we were not, in the year before the year in which the dividend was paid, and is not, in the year in which the dividend is paid, a passive foreign investment company (“PFIC”) and (iii) the holder thereof has satisfied certain holding period requirements. The ADS are listed on the New York Stock Exchange and generally will qualify as readily tradable on an established securities market in the United States so long as they are so listed. We do not expect that we will be treated as having been a PFIC for U.S. federal income tax purposes with respect to our 2020 taxable year. In addition, based on our current expectations regarding the value and nature of our assets, the sources and nature of our income, and relevant market and shareholder data, we do not anticipate becoming a PFIC for our 2021 taxable year. However, because PFIC status depends upon the composition of a company’s income and assets and the market value of its assets from time to time, and because it is unclear whether certain types of our income constitute passive income for PFIC purposes, there can be no assurance that we will not be considered a PFIC for any current, prior or future taxable year.
Based on existing guidance, it is not entirely clear whether dividends received with respect to shares will be treated as qualified dividends because they are not themselves listed on a U.S. exchange. In addition, the U.S. Treasury has announced its intention to promulgate rules under which holders of ADS and intermediaries through whom such securities are held will be permitted to rely on certifications from issuers to establish that dividends are treated as qualified dividends. Because such procedures have not yet been issued, it is not clear whether we will comply with them. A U.S. Holder should consult its own tax advisors to determine whether the favorable rate will apply to dividends it receives and whether it is subject to any special rules limiting its ability to be taxed at this favorable rate.
The amount of a dividend generally will be treated as foreign-source dividend income to a U.S. Holder for foreign tax credit purposes. As discussed in more detail below under “Foreign Tax Credits,” it is not free from doubt whether Chilean withholding taxes imposed on distributions on shares or ADS will be treated as income taxes eligible for a foreign tax credit for U.S. federal income tax purposes. If a Chilean withholding tax is treated as an eligible foreign income tax, subject to generally applicable limitations, you may claim a credit against your U.S. federal income tax liability for the eligible Chilean taxes withheld from distributions on shares or ADS. If the dividends are taxed as
197
qualified dividend income (as discussed above), special rules will apply in determining the amount of the dividend taken into account to calculate the foreign tax credit limitation. The rules relating to foreign tax credits are complex. U.S. Holders are urged to consult their own tax advisors regarding the treatment of Chilean withholding taxes imposed on distributions on shares or ADS.
Sale or Other Disposition of Shares or ADS
If a beneficial owner is a U.S. Holder, for U.S. federal income tax purposes, the gain or loss a beneficial owner realizes on the sale or other disposition of shares or ADS will be a capital gain or loss and will be a long term capital gain or loss if the beneficial holder has held the shares or ADS for more than one year. The amount of a beneficial owner’s gain or loss will equal the difference between the beneficial owner’s tax basis in the shares or ADS disposed of and the amount realized on the disposition, in each case as determined in U.S. dollars. Such gain or loss will generally be U.S.-source gain or loss for foreign tax credit purposes. In addition, certain limitations exist on the deductibility of capital losses by both corporate and individual taxpayers.
In certain circumstances, Chilean taxes may be imposed upon the sale of shares (but not ADS). See “Item 10. Additional Information — E. Taxation — Chilean Tax Considerations — Taxation of Shares and ADS.” If a Chilean tax is imposed on the sale or disposition of shares, a beneficial owner that is a U.S. Holder may be eligible to claim a credit against its U.S. federal income tax liability for the eligible Chilean taxes withheld under a sale or disposition of shares or ADS as discussed in “Foreign Tax Credits” below.
Foreign Tax Credits
Subject to applicable limitations that may vary depending upon a U.S. Holder’s circumstances and subject to the discussion above regarding concerns expressed by the U.S. Treasury, you may be eligible to claim a credit against your U.S. tax liability for Chilean income taxes (or taxes imposed in lieu of an income tax) imposed in connection with distributions on and proceeds from the sale or other disposition of our shares or ADS. Chilean dividend withholding taxes generally are expected to be income taxes eligible for the foreign tax credit. The Chilean capital gains tax is likely to be treated as an income tax (or a tax paid in lieu of an income tax) and thus eligible for the foreign tax credit; however, you generally may claim a foreign tax credit only after taking into account any available opportunity to reduce the Chilean capital gains tax, such as the reduction for the credit for Chilean corporate income tax that is taken into account when calculating Chilean withholding tax. If a Chilean tax is imposed on the sale or disposition of our shares or ADS, and a U.S. Holder does not receive significant foreign source income from other sources, such U.S. Holder may not be able to credit such Chilean tax against its U.S. federal income tax liability. If a Chilean tax is not treated as an income tax (or a tax paid in lieu of an income tax) for U.S. federal income tax purposes, a U.S. Holder would be unable to claim a foreign tax credit for any such Chilean tax withheld; however, a U.S. Holder may be able to deduct such tax in computing its U.S. federal income tax liability, subject to applicable limitations. In addition, instead of claiming a credit, a U.S. Holder may, at the U.S. Holder’s election, deduct such Chilean taxes in computing the U.S. Holder’s taxable income, subject to generally applicable limitations under U.S. law. An election to deduct foreign taxes instead of claiming foreign tax credits applies to all taxes paid or accrued in the taxable year to foreign countries and possessions of the U.S. The calculation of foreign tax credits and, in the case of a U.S. Holder that elects to deduct foreign income taxes, the availability of deductions, involves the application of complex rules that depend on such U.S. Holder’s particular circumstances. U.S. Holders are urged to consult their own tax advisors regarding the availability of foreign tax credits in their particular circumstances.
Passive Foreign Investment Company Rules
We were not a “passive foreign investment company” or PFIC for U.S. federal income tax purposes for our 2020 taxable year. We do not anticipate being a PFIC for our 2021 taxable year. However, because PFIC status depends upon the composition of a company’s income and assets and the market value of its assets from time to time, and because it is unclear whether certain types of our income constitute passive income for PFIC purposes, there can be no assurance that we will not be considered a PFIC for any current, prior or future taxable year. If we were to become a PFIC for any taxable year during which a beneficial owner held shares or ADS, certain adverse consequences could apply to the U.S. Holder, including the imposition of higher amounts of tax than would otherwise apply and additional filing requirements. In addition, if we were treated as a PFIC in a taxable year in which we pay a dividend or in the prior taxable year, the favorable dividend rates discussed above with respect to dividends paid to certain non-corporate U.S. Holders would not apply (see “— Taxation of Distributions” above). U.S. Holders should consult their own tax advisors regarding the consequences to them if we were to become a PFIC and the availability and advisability of making any election that might mitigate the adverse consequences of PFIC status.
198
Required Disclosure with Respect to Foreign Financial Assets
Certain U.S. Holders are required to report information relating to an interest in our shares or ADS, subject to certain exceptions (including an exception for our shares or ADS held in accounts maintained by certain financial institutions), by attaching a completed IRS Form 8938, Statement of Specified Foreign Financial Assets, with their tax return for each year in which they hold an interest in our shares or ADS. U.S. Holders are urged to consult their own U.S. tax advisors regarding information reporting requirements relating to their ownership of our shares or ADS.
Information Reporting and Backup Withholding
Payments of dividends and sales proceeds that are made within the United States or through certain U.S.- related financial intermediaries generally are subject to information reporting and backup withholding unless: (i) the U.S. Holder is an exempt recipient or (ii) in the case of backup withholding, the beneficial owner provides a correct taxpayer identification number and certifies that the U.S. Holder is not subject to backup withholding.
The amount of any backup withholding from a payment to a beneficial owner will be allowed as a credit against the beneficial owner’s U.S. federal income tax liability and may entitle the U.S. Holder to a refund, provided that the required information is furnished in a timely fashion to the U.S. Internal Revenue Service.
Medicare Contribution Tax
A U.S. Holder that is an individual or estate, or a trust that does not meet certain requirements for an exemption, is subject to a tax of 3.8% on its “net investment income.” Among other items, net investment income generally includes gross income from dividends and net gain attributable to the disposition of certain property, like the shares or ADS, less certain deductions. A U.S. Holder should consult the holder’s own tax advisor regarding the applicability of the “net investment income” tax regarding such beneficial owner’s particular circumstances.
U.S. Holders should consult their own tax advisors with respect to the particular consequences to them of owning or disposing of shares or ADS
F. | Dividends and Paying Agents. |
Not applicable.
G. | Statement by Experts. |
Not applicable.
H. | Documents on Display. |
We are subject to the information requirements of the Exchange Act, except that as a foreign private issuer, we are not subject to the SEC proxy rules (other than general anti-fraud rules) or the short-swing profit disclosure rules of the Exchange Act. Under these statutory requirements, we file or furnish reports and other information with the SEC. Reports, information statements, and other information we file with or furnish to the SEC are available electronically on the SEC’s website, which can be accessed at http://www.sec.gov and on our website www.enelamericas.com. Copies of such material may also be inspected at the offices of the New York Stock Exchange, at 11 Wall Street, New York, New York 10005, on which our ADS are listed.
I.Subsidiary Information.
For information on our principal subsidiaries, see “Item 4. Information on the Company — C. Organizational Structure — Principal Subsidiaries and Affiliates.”
199
Item 11.Quantitative and Qualitative Disclosures about Market Risk
We are exposed to risks arising from volatility in commodity prices, interest rates, and foreign exchange rates that affect the generation, transmission, and distribution businesses in the countries where we operate.
Commodity Price Risk
In our electricity generation and transmission business segments, we are exposed to market risks arising from the price volatility of electricity, natural gas, diesel oil, and coal. We seek to ensure our fuel supply by securing long-term contracts with our suppliers for periods expected to match our generation assets’ lifetime. These contracts generally have provisions that allow us to purchase natural gas with a pricing formula that combines Henry Hub natural gas and Brent diesel oil at market prices.
Enel Américas has designed a commercial policy that aligns sale commitment levels with the generation capacity during a dry year by including risk mitigation clauses with unregulated customers in some contracts to reduce risk under extreme drought conditions. In the case of regulated customers subject to long-term tender processes, indexed polynomials are determined to minimize commodity exposure.
Considering the operating conditions faced in the electricity generation market, drought, and the volatility of commodity prices in international markets, we continually evaluate if it is in our best interests to engage in hedging to mitigate the impact of price changes on profits.
As of December 31, 2020, no energy futures purchase agreements had been settled to cover the contracting portfolio. As of December 31, 2019, 5.28 GWh of energy futures purchase agreements had been settled to cover the contracting portfolio.
We continually analyze strategies to hedge commodity price risk, including transferring commodity price variations to customers’ contract prices, adjusting commodity indexed price formulas for new PPAs according to our exposure, or analyzing ways to mitigate risk through hydrological insurance in dry years. We may consider using price-sensitive instruments in the future.
200
Interest Rate and Foreign Currency Risk
As of December 31, 2020, the carrying value according to maturity and the corresponding fair value of our interest-bearing debt are detailed below. The amounts do not include derivatives. The rates in the table below are the result of the weighted average of the effective interest rates of each obligation, including expenses associated with financing and withholding taxes on interest payments related to financing obtained outside the country of domicile of each company.
| | | | | | | | | | | | | | | | |
| | Expected maturity date | ||||||||||||||
For the year ended December 31, |
| 2021 |
| 2022 |
| 2023 |
| 2024 |
| 2025 |
| Thereafter |
| Total |
| Fair |
| | (in millions of US$)(1) | ||||||||||||||
Fixed Rate | | | | | | | | | | | | | | | | |
Ch$/UF | | — | | — | | — | | — | | — | | — | | — | | — |
Weighted average interest rate | | — | | — | | — | | — | | — | | — | | — | | n.a. |
US$ | | 408 | | 98 | | 7 | | 9 | | 7 | | 647 | | 1,175 | | 1,236 |
Weighted average interest rate | | 2.5% | | 2.0% | | 0.5% | | 1.6% | | 0.3% | | 4.0% | | 3.3% | | n.a. |
Other currencies(3) | | 558 | | 345 | | 176 | | 180 | | 103 | | 181 | | 1,543 | | 1,662 |
Weighted average interest rate | | 5.7% | | 6.9% | | 5.4% | | 5.5% | | 6.3% | | 6.3% | | 6.0% | | n.a. |
| | | | | | | | | | | | | | | | |
Total fixed rate | | 966 | | 443 | | 183 | | 188 | | 110 | | 828 | | 2,718 | | 2,898 |
Weighted average interest rate | | 4.4% | | 5.8% | | 5.2% | | 5.3% | | 5.9% | | 4.5% | | 4.8% | | n.a. |
Variable Rate | | | | | | | | | | | | | | | | |
Ch$/UF | | 7 | | 4 | | — | | — | | — | | — | | 11 | | 12 |
Weighted average interest rate | | 6.4% | | 6.4% | | — | | — | | — | | — | | 6.4% | | n.a. |
US$ | | 604 | | — | | — | | 1 | | — | | — | | 605 | | 605 |
Weighted average interest rate | | 1.5% | | — | | — | | 2.3% | | — | | — | | 1.5% | | n.a. |
Other currencies (3) | | 382 | | 375 | | 547 | | 517 | | 312 | | 594 | | 2,726 | | 2,747 |
Weighted average interest rate | | 4.4% | | 4.6% | | 4.6% | | 5.4% | | 6.4% | | 6.5% | | 5.3% | | n.a. |
| | | | | | | | | | | | | | | | |
Total variable rate | | 992 | | 378 | | 547 | | 518 | | 312 | | 594 | | 3,341 | | 3,363 |
Weighted average interest rate | | 2.6% | | 4.6% | | 4.6% | | 5.4% | | 6.4% | | 6.5% | | 4.6% | | n.a. |
| | | | | | | | | | | | | | | | |
Total | | 1,958 | | 822 | | 730 | | 706 | | 422 | | 1,421 | | 6,059 | | 6,262 |
| (1) | Calculated based on the foreign exchange rate of the applicable foreign currency to the U.S. dollar as of December 31, 2020. |
| (2) | Fair values were calculated based on the discounted value of future cash flows expected to be paid (or received), considering current discount rates that reflect the different risks involved. |
| (3) | “Other currencies” include the Brazilian real, Colombian peso, Argentine peso, Peruvian Nuevo Sol, and Euro. |
201
As of December 31, 2019, the carrying values according to maturity and the corresponding fair value of our interest-bearing debt are detailed below, which do not include derivatives. The rates in the table below are the result of the weighted average of the effective interest rates of each obligation, including expenses associated with financing and withholding taxes on interest payments related to financing obtained outside the country of domicile of each company.
| | | | | | | | | | | | | | | | |
| | Expected maturity date | ||||||||||||||
For the year ended December 31, |
| 2020 |
| 2021 |
| 2022 |
| 2023 |
| 2024 |
| Thereafter |
| Total |
| Fair Value(2) |
| | (in millions of US$)(1) | ||||||||||||||
Fixed Rate | | | | | | | | | | | | | | | | |
Ch$/UF | | — | | — | | — | | — | | — | | — | | — | | — |
Weighted average interest rate | | 0.60% | | 0.60% | | 0.00% | | 0.00% | | 0.00% | | 0.00% | | 0.60% | | n.a. |
US$ | | 273 | | 92 | | 57 | | 5 | | 6 | | 632 | | 1,066 | | 1,104 |
Weighted average interest rate | | 3.70% | | 4.00% | | 2.90% | | 0.80% | | 2.20% | | 4.10% | | 3.90% | | n.a. |
Other currencies (3) | | 407 | | 306 | | 332 | | 148 | | 115 | | 296 | | 1,604 | | 1,727 |
Weighted average interest rate | | 6.70% | | 8.30% | | 7.50% | | 6.80% | | 6.40% | | 6.20% | | 6.90% | | n.a. |
| | | | | | | | | | | | | | | | |
Total fixed rate | | 680 | | 398 | | 389 | | 153 | | 121 | | 928 | | 2,669 | | 2,831 |
Weighted average interest rate | | 6.30% | | 7.30% | | 6.80% | | 6.00% | | 6.20% | | 4.80% | | 5.70% | | n.a. |
Variable Rate | | | | | | | | | | | | | | | | |
Ch$/UF | | 6 | | 7 | | 3 | | — | | — | | — | | 16 | | 21 |
Weighted average interest rate | | 8.40% | | 8.40% | | 8.40% | | 0.00% | | 0.00% | | 0.00% | | 8.40% | | n.a. |
US$ | | 412 | | 246 | | — | | — | | 1 | | — | | 659 | | 661 |
Weighted average interest rate | | 3.40% | | 4.00% | | 0.00% | | 0.00% | | 3.60% | | 0.00% | | 3.60% | | n.a. |
Other currencies (3) | | 308 | | 378 | | 425 | | 618 | | 412 | | 856 | | 2,997 | | 3,020 |
Weighted average interest rate | | 7.60% | | 7.30% | | 7.10% | | 7.00% | | 7.50% | | 7.30% | | 7.30% | | n.a. |
| | | | | | | | | | | | | | | | |
Total variable rate | | 726 | | 631 | | 428 | | 618 | | 414 | | 856 | | 3,672 | | 3,702 |
Weighted average interest rate | | 5.20% | | 6.00% | | 7.10% | | 7.00% | | 7.50% | | 7.30% | | 6.60% | | n.a. |
| | | | | | | | | | | | | | | | |
Total | | 1,406 | | 1,029 | | 817 | | 771 | | 535 | | 1,784 | | 6,342 | | 6,533 |
| (1) | Calculated based on the foreign exchange rate of the applicable foreign currency to the U.S. dollar as of December 31, 2019. |
| (2) | Fair values were calculated based on the discounted value of future cash flows expected to be paid (or received), considering current discount rates that reflect the different risks involved. |
| (3) | “Other currencies” include the Brazilian real, Colombian peso, Argentine peso, Peruvian Nuevo Sol, and Euro. |
Interest Rate Risk
Our policy aims to minimize the average cost of debt and reduce the volatility of our financial results. Depending on our estimates and debt structure, we sometimes manage interest rate risk using interest rate derivatives.
As of December 31, 2020, and 2019, 38% and 39%, respectively, of our total outstanding debt was denominated in fixed terms, and 62% and 61%, respectively, was subject to variable interest rates. Because of the exposure to variable interest rate risks, we engage in derivative hedging instruments.
As of December 31, 2020, the carrying value for financial reporting purposes and the corresponding fair value of the instruments that hedge the interest rate risk of our interest-bearing debt were as follows:
| | | | | | | | | | | | | | | | |
| | Expected Maturity Date | ||||||||||||||
For the year ended December 31, |
| 2021 |
| 2022 |
| 2023 | | 2024 | | 2025 |
| Thereafter |
| Total |
| Fair |
| | (in millions of US$) | ||||||||||||||
Variable to fixed rates | | — | | — | | — | | — | | — | | — | | — | | — |
Variable to variable rates | | — | | — | | — | | — | | — | | 154 | | 154 | | 19 |
Total | | — | | — | | — | | — | | — | | 154 | | 154 | | 19 |
| (1) | Fair values were calculated based on the discounted value of future cash flows expected to be paid (or received), considering current discount rates that reflect the different risks involved. |
| (2) | We carry out a derivative hedging instrument in Brazil from IPCA to the CDI index. |
202
As of December 31, 2019, the carrying values for financial reporting purposes and the corresponding fair value of the instruments that hedge the interest rate risk of our interest-bearing debt were as follows:
| | | | | | | | | | | | | | | | |
| | Expected Maturity Date | ||||||||||||||
For the year ended December 31, |
| 2020 |
| 2021 |
| 2022 |
| 2023 |
| 2024 |
| Thereafter |
| Total |
| Fair |
| | (in millions of US$) | ||||||||||||||
Variable to fixed rates | | — | | — | | — | | — | | — | | — | | — | | — |
Variable to variable rates(2) | | — | | — | | — | | — | | — | | 198 | | 198 | | 12 |
Total | | — | | — | | — | | — | | — | | 198 | | 198 | | 12 |
| (1) | Fair values were calculated based on the discounted value of future cash flows expected to be paid (or received), considering current discount rates that reflect the different risks involved. |
| (2) | We carry out a derivative hedging instrument in Brazil from IPCA to the CDI index. |
Foreign Currency Risk
Our policy seeks to maintain a balance between the currencies in which cash flows are indexed and each company’s principal debt. Most of our subsidiaries have access to funding in the same currency as their revenues, thereby reducing the impact of exchange rate volatility. In some cases, we cannot fully benefit from this. Therefore, we try to manage the exposure with financial derivatives such as cross-currency swaps or currency forwards. However, this may not always be available under reasonable terms due to market conditions. For instance, in Costanera, whose revenues are in Argentine pesos, and a substantial part of its debt is denominated in U.S. dollars, we cannot hedge such debt under reasonable market conditions. Costanera’s debt denominated in U.S. dollars amounted to US$ 47 million as of December 31, 2020.
As of December 31, 2020, the carrying values for financial accounting purposes and the corresponding fair value of the instruments that hedge the foreign exchange risk of our interest-bearing debt were as follows:
| | | | | | | | | | | | | | | | |
| | Expected Maturity Date | ||||||||||||||
For the year ended December 31, |
| 2021 |
| 2022 |
| 2023 | | 2024 |
| 2025 |
| Thereafter |
| Total |
| Fair |
| | (in millions of US$) | ||||||||||||||
US$ to R$ | | 400 | | 77 | | 77 | | — | | — | | — | | 554 | | 95 |
US$ to other currencies | | — | | — | | — | | — | | — | | — | | — | | — |
Other currencies to US$(2) | | — | | — | | — | | — | | — | | — | | — | | — |
Total | | 400 | | 77 | | 77 | | — | | — | | — | | 554 | | 95 |
| (1) | Fair values were calculated based on the discounted value of future cash flows expected to be paid (or received), considering current discount rates that reflect the different risks involved. |
| (2) | “Other currencies” may include the Euro, Colombian peso, Argentine peso, and Peruvian Nuevo Sol. |
As of December 31, 2019, the carrying values for financial accounting purposes and the corresponding fair value of the instruments that hedge the foreign exchange risk of our interest-bearing debt were as follows:
| | | | | | | | | | | | | | | | |
| | Expected Maturity Date | ||||||||||||||
For the year ended December 31, |
| 2020 |
| 2021 |
| 2022 |
| 2023 | | 2024 |
| Thereafter |
| Total |
| Fair Value(1) |
| | (in millions of US$) | ||||||||||||||
US$ to R$ | | 271 | | 315 | | 50 | | — | | — | | — | | 636 | | 45 |
US$ to other currencies | | — | | — | | — | | — | | — | | — | | — | | — |
Other currencies to US$(2) | | — | | — | | — | | — | | — | | — | | — | | — |
Total | | 271 | | 315 | | 50 | | — | | — | | — | | 636 | | 45 |
| (1) | Fair values were calculated based on the discounted value of future cash flows expected to be paid (or received), considering current discount rates that reflect the different risks involved. |
| (2) | “Other currencies” may include the Euro, Colombian peso, Argentine peso, and Peruvian Nuevo Sol. |
Please refer to Note 22 of the Notes to our consolidated financial statements for further detail.
203
(d) Safe Harbor
The information in this “Item 11. Quantitative and Qualitative Disclosures About Market Risk” contains information that may constitute forward-looking statements. See “Forward-Looking Statements” in the Introduction of this Report for safe harbor provisions.
Item 12. Description of Securities Other Than Equity Securities
A. Debt Securities.
Not applicable.
B. Warrants and Rights.
Not applicable.
C. Other Securities.
Not applicable.
D. American Depositary Shares.
Depositary Fees and Charges
Our ADS program’s Depositary is Citibank, N.A. The Depositary collects fees for delivery and surrender of ADS directly from investors depositing shares or surrendering ADS for withdrawal or from intermediaries acting for them. The Depositary fees payable for cash distributions are deducted from the cash being distributed. For non-cash distributions, the Depositary will invoice the applicable ADS record date holders. The Depositary may generally refuse to provide the requested services until its fees for those services are paid. Under the terms of the Deposit Agreement, an ADS holder may have to pay the following service fees to the Depositary:
| | |
Service Fees |
| Fees |
(1) Issuance of ADS upon deposit of shares (excluding issuances as a result of distributions described in paragraph (4) below) | | Up to US$ 5 per 100 ADS (or fraction thereof) issued |
(2) Delivery of deposited securities against surrender of ADS | | Up to US$ 5 per 100 ADS (or fraction thereof) surrendered |
(3) Distribution of cash dividends or other cash distributions (i.e., sale of rights and other entitlements) | | Up to US$ 5 per 100 ADS (or fraction thereof) held |
(4) Distribution of ADS under (i) stock dividends or other free stock distributions, or (ii) exercise of rights to purchase additional ADS | | Up to US$ 5 per 100 ADS (or fraction thereof) held |
(5) Distribution of securities other than ADS or rights to purchase additional ADS (i.e., a spin-off of shares) | | Up to US$ 5 per 100 ADS (or fraction thereof) held |
(6) Depositary services | | Up to US$ 5 per 100 ADS (or fraction thereof) held on the applicable record date(s) established by the Depositary |
The Depositary collects fees for delivery and surrender of ADS directly from investors depositing shares or surrendering ADS for withdrawal or from intermediaries acting for them. The Depositary fees payable for cash distributions are deducted from the cash being distributed. In the case of distributions other than cash, the Depositary will invoice the applicable ADS record date holders.
Depositary Payments for Fiscal Year 2020
The Depositary has agreed to reimburse certain expenses incurred by us in connection with our ADS program. In 2020, the Depositary reimbursed expenses related primarily to investor relations’ activities for a total amount of US$ 0.9 million (after the deduction of applicable U.S. taxes).
204
Item 13.Defaults, Dividend Arrearages and Delinquencies
None.
Item 14. Material Modifications to the Rights of Security Holders and Use of Proceeds
None.
Item 15.Controls and Procedures
(a) | Disclosure Controls and Procedures |
We carried out an evaluation under the supervision and with the participation of our senior management, including the Chief Executive Officer and Chief Financial Officer, of the effectiveness of the design and operation of our disclosure controls and procedures (as defined in Rules 13a-15(e) and 15d-15(e) under the Exchange Act) as of December 31, 2020.
There are inherent limitations to the effectiveness of any system of disclosure controls and procedures, including the possibility of human error and the circumvention or overriding of the controls and procedures. Accordingly, our disclosure controls and procedures are designed to provide reasonable assurance of achieving their control objectives.
Based upon our evaluation, the Chief Executive Officer and the Chief Financial Officer concluded that, as a result of the material weakness in internal control over financial reporting as described below, our disclosure controls and procedures were not effective as of December 31, 2020. In light of the material weakness, management performed additional analysis and other procedures, and concluded that our consolidated financial statements included in this Annual Report on Form 20-F present fairly, in all material respects, our consolidated financial position, results of operations and cash flows as of the dates and for the periods presented, in conformity with IFRS, as issued by the IASB.
(b) | Management’s Annual Report on Internal Control Over Financial Reporting |
Management is responsible for establishing and maintaining adequate internal control over financial reporting (as defined in Rules 13a-15(f) and 15d-15(f) under the Exchange Act). Our internal control over financial reporting is designed to provide reasonable assurance regarding the reliability of financial reporting and the preparation of consolidated financial statements for external purposes in accordance with IFRS, as issued by the IASB.
Because of its inherent limitations, internal control over financial reporting may not necessarily prevent or detect some misstatements. It can only provide reasonable assurance regarding financial statement preparation and presentation. Also, projections of any evaluation of effectiveness for future periods are subject to the risk that the controls may become inadequate because of changes in conditions or because the degree of compliance with the policies or procedures may deteriorate over time.
A material weakness is a deficiency, or a combination of deficiencies, in internal control over financial reporting, such that there is a reasonable possibility that a material misstatement of the Company's annual or interim consolidated financial statements will not be prevented or detected on a timely basis.
Our management, with participation of the Chief Executive Officer and the Chief Financial Officer, under the oversight of our Board of Directors, assessed the effectiveness of our internal control over financial reporting as of December 31, 2020 based on criteria established in Internal Control – Integrated Framework (2013), issued by the Committee of Sponsoring Organizations of the Treadway Commission. Based on this assessment, our management concluded that the Company did not establish effective general information technology controls (GITCs), specifically program change controls and access controls, that support the consistent operation of the Company’s information technology (IT) operating system, database and IT application layers of technology over the electricity distribution business revenue process. These deficiencies also affected the effectiveness of business process automated controls, manual controls with an automated component, and the database of the reports that were used to execute certain automated and manual controls. As a result, we were unable to maintain effective control activities over the electricity
205
distribution business revenue process. Furthermore, the control deficiencies described above created a reasonable possibility that a material misstatement to the consolidated financial statements would not be prevented or detected on a timely basis. Therefore, we concluded that the deficiencies represent a material weakness in the Company’s internal control over financial reporting and our internal control over financial reporting was not effective as of December 31, 2020.
The material weakness did not result in any identified misstatements to the Company’s consolidated financial statements and there were no changes to previously released financial results.
Our independent registered public accounting firm, KPMG Auditores Consultores SpA, who audited the consolidated financial statements included in this Annual Report on Form 20-F, issued an adverse opinion on the effectiveness of the Company’s internal control over financial reporting, which is on pages F-3 and F-4 of this Annual Report on Form 20-F.
(c) Management’s Remediation Plan
We are committed to making further progress in our remediation efforts during 2021. In order to remediate the material weakness described above, we have been implementing and will continue to implement actions to revise and enhance our GITCs to ensure, for the affected IT application, full enforcement of procedures related to access control and the tracking of changes, including through (i) integrating the affected IT application with additional tools to improve access review and the tracking of changes, (ii) additional training to increase awareness of control operators, and (iii) control design reviews related to the tracking of changes.
The material weakness will not be considered remediated until the applicable controls have been fully designed, documented, implemented and operate for a sufficient period of time for management to conclude, through testing, that these controls are operating effectively.
(d) | Changes in Internal Control Over Financial Reporting |
Except as noted above with respect to the implementation of the remediation plan, there were no changes in our internal control over financial reporting identified in connection with the evaluation required by Rules 13a-15(d) or 15d-15(d) under the Exchange Act that occurred during 2020 that have materially affected, or are reasonably likely to materially affect, our internal control over financial reporting. We are in the process of implementing the remediation plan described above to address the identified material weakness in our internal control over financial reporting.
Item 16. Reserved
Item 16A. Audit Committee Financial Expert
As of December 31, 2020, the Directors Committee performed the Audit Committee’s functions. The committee’s financial expert is Mr. Hernán Somerville, as determined by the board of directors. Mr. Somerville is an independent member of the Directors Committee under the requirements of both Chilean law and NYSE corporate governance rules.
Our standards of ethical conduct are mainly governed through the following five corporate rulings or policies: the Code of Ethics, the Zero Tolerance Anti-Corruption Plan (the “ZTAC Plan”), the Human Rights Policy, the Manual for the Management of Information of Interest to the Market (the “Manual”) and the Diversity Policy.
The Manual, adopted by our board of directors, addresses the following issues: applicable standards and blackout periods regarding the information in connection with transactions of our securities or those of our affiliates, entered into by directors, management, principal executives, employees, and other related parties; the existence of mechanisms for the continuous disclosure of information that is of interest to the market; and procedures that protect confidential information.
In addition to the corporate governance rules described above, our board approved the Code of Ethics, the ZTAC Plan, and the Human Rights Policy. The Code of Ethics is based on general principles such as impartiality, honesty,
206
integrity, among others, translated into detailed behavioral criteria. The ZTAC Plan reinforces the Code of Ethics principles, emphasizing avoiding corruption such as bribes, preferential treatment, and other similar matters. The Human Rights Policy incorporates and adapts the general human rights principles championed by the United Nations.
Our Diversity Policy defines the fundamental principles required to spread a culture that focuses on diversity, respect, and the prevention of arbitrary discrimination. It encourages equal opportunities and inclusion as fundamental values in our activities. Through this policy, we seek to improve our work environment and quality of life at work. We are committed to creating an inclusive work environment where workers can develop their potential and maximize their contribution.
A copy of these documents is available on our webpage at www.enelamericas.com as well as upon request, free of charge, by writing or calling us at:
Enel Américas S.A.
Investor Relations Department
Santa Rosa 76, Piso 15
Santiago, Chile
(56-2) 2353-4400
In 2020, there have been no amendments to any provisions of the documents described above. Likewise, no waivers from any Code of Ethics provisions, the ZTAC Plan, or the Manual were expressly or implicitly granted to the Chief Executive Officer, the Chief Financial Officer, or any other senior financial officers of the Company.
Item 16C.Principal Accountant Fees and Services
In 2020, the shareholders appointed KPMG Auditores Consultores SpA (“KPMG”) as the Company’s new independent registered public accounting firm to replace EY Servicios Profesionales de Auditoría y Asesorias SpA (“EY”).
The following table provides information on the aggregate fees for approved services billed by our independent registered accounting firm and the other member firms of KPMG, EY, and their respective affiliates by type of services for the periods indicated.
| | | | |
Services Rendered |
| 2020 |
| 2019 |
| | (in thousands of US$) | ||
Audit fees(1) | | 2,282 | | 3,473 |
Audit-related fees(2) | | 2,039 | | 1,479 |
Tax fees | | — | | — |
All other fees | | — | | — |
Total | | 4,321 | | 4,952 |
| (1) | The ThUS$ 1,191 decrease in audit fees in 2020 was mainly due to the change of rates resulting from hiring KPMG as a new independent registered public accounting firm. |
| (2) | The ThUS$ 560 increase in audit-related fees in 2020 includes non-recurring services in connection with the proposed merger with EGP Américas, for ThUS$ 1,713, offset by non-recurring services associated with Enel Américas’ 2019 capital increase for ThUS$ 683. |
All the fees disclosed under audit-related fees and all other fees were pre-approved by the Directors Committee pre-approval policies and procedures.
The amounts included in the table above and the related footnotes have been classified in accordance with SEC guidance.
Directors Committee Pre-Approval Policies and Procedures
Our shareholders appoint our external auditors at the OSM. Similarly, our subsidiaries’ shareholders appoint their external auditors according to applicable law and regulation in each respective country.
207
The Directors Committee, which performs the Audit Committee’s functions, reviews engagement letters with external auditors, ensures quality control regarding the services provided, reviews and controls independence issues, and other related matters.
The Directors Committee has a pre-approval policy regarding contracting our external auditor or any external auditor’s affiliate for professional services. The professional services covered by such policy include audit and non-audit services provided to us.
Fees payable in connection with recurring audit services are pre-approved as part of our annual budget. Fees payable in connection with non-recurring audit services, once the Chief Financial Officer has examined them, are submitted to the Directors Committee for its final consideration.
The pre-approval policy established by the Directors Committee for non-audit services and audit-related fees is as follows:
● | The business unit that has requested the service and the audit firm expected to perform the service must request that the Chief Financial Officer review the nature of the service to be provided. |
● | The Chief Financial Officer then analyzes the request and requires the selected audit firm to issue a certificate signed by the partner responsible for the audit of our consolidated financial statements confirming such an audit firm’s independence. |
● | Finally, the proposal is submitted to the Directors Committee for approval or denial. |
The Directors Committee has designed, approved, and implemented the necessary procedures to fulfill the SEC rules regarding the Audit Committee’s pre-approval of certain tax services.
Item 16D. Exemptions from the Listing Standards for Audit Committees
Not applicable.
Item 16E.Purchases of Equity Securities by the Issuer and Affiliated Purchasers
The following table sets forth, for each of the calendar months in 2020, the total number of shares of common stock purchased by the Company, or on the Company’s behalf, or by any affiliated purchaser (which includes Enel), the average price paid per share, the number of shares purchased under a publicly-announced plan or program.
Purchases of Equity Securities
2020 (1) | (a) | (b) | (c) | (d) |
|---|---|---|---|---|
January 1-31 | — | — | — | 5% of outstanding shares of |
February 1-29 | — | — | — | 5% of outstanding shares of |
March 1-31 | 760,863,100(2) | US$ 0.20 | 760,863,100 | 3,043,452,441(2)(3)(4) |
208
2020 (1) | (a) | (b) | (c) | (d) |
|---|---|---|---|---|
April 1-30 | 2,492,146,691 | US$ 0.16 | 2,492,146,691 | 2,634,386,995(3)(4)(5) |
May 1-31 | 551,305,750 | US$ 0.17 | 551,305,750 | 2,083,081,245(5) |
June 1-30 | 1,432,455,895(5)(6) | US$ 0.17 | 1,432,455,895 | 650,625,350(5) |
July 1-31 | — | — | — | 650,625,350(5) |
August 1-31 | 650,625,350 | US$ 0.15 | 650,625,350 | — |
September 1-30 | — | — | — | — |
October 1-31 | — | — | — | — |
November 1-30 | — | — | — | — |
December 1-31 | — | — | — | — |
2021 | (a) | (b) | (c) | (d) |
January 1-31 | — | — | — | — |
February 1-28 | — | — | — | — |
March 1-31 | — | — | — | 7,608,631,104 (7) |
April 1-30 | 7,608,559,104(8) | US$ 0.20 | 7,608,559,104 | — |
| (1) | Reflects the settlement date of all purchases. |
| (2) | Represents two swap transactions entered into by Enel on June 28, 2019, to purchase up to 4% of our outstanding shares of common stock and ADS representing up to 1% of our outstanding shares of common stock. Under these swap transactions, Enel purchased 15,217,262 ADS on March 16, 2020, at US$ 9.78 per ADS and 2,492,146,691 shares of our common stock on April 14, 2020, at US$ 0.16 per share, and the swap transactions terminated. |
| (3) | Represents a swap transaction entered into by Enel on January 28, 2020, to acquire up to 8,065,149 ADS. On May 11, 2020, Enel purchased 8,065,149 ADS at US$ 9.20 per ADS, and the swap transaction terminated. |
| (4) | Represents a swap transaction entered into by Enel on March 17, 2020, to acquire up to 2,960,966 ADS. On May 27, 2020, Enel purchased 2,960,966 ADS at US$ 5.96 per ADS, and the swap transaction terminated. |
| (5) | Represents two swap transactions entered into by Enel on April 2, 2020, to purchase up to 1,249,848,795 of our outstanding shares of common stock and 16,664,649 ADS. On June 3, 2020, Enel elected to settle the share swap transaction through an auctioneer or electronic auction, which took place on June 8, 2020. As a result, Enel purchased 1,249,848,795 shares of our common stock at US$ 0.17 per share, and the swap transaction terminated. On August 17, 2020, Enel acquired 13,012,507 ADS at US$ 7.65 per ADS, and the swap transaction terminated. |
| (6) | Represents a swap transaction entered into by Enel on June 3, 2020, to acquire up to 182,607,100 shares of our common stock. On June 12, 2020, Enel elected to settle the share swap transaction through an auctioneer or electronic auction, which took place on June 17, 2020. As a result, Enel purchased 182,607,100 shares of our common stock at US$ 0.15 per share, and the swap transaction terminated. |
| (7) | On March 15, 2021, Enel launched the 2021 Tender Offer for the acquisition of our shares of common stock and ADS for up to a maximum of 7,608,631,104 shares of common stock, equivalent to 10% of our share capital, for a price of Ch$ 140 per share and Ch$ 7,000 per ADS (in its equivalent in U.S. dollars at the time of settlement in the case of ADS). |
| (8) | In total, 20,194,895,308 shares (including 1,872,063,500 shares represented by 37,441,270 ADSs) were validly tendered and not properly withdrawn pursuant to the 2021 Tender Offer, resulting in a proration factor of approximately 37.7%. As a result of applying the proration factor, on April 16, 2021, Enel accepted for purchase |
209
| 6,903,312,254 shares and 14,104,937 ADSs, representing an additional 705,246,850 shares in the 2021 Tender Offer. |
As a result of the transactions described above, Enel increased its beneficial ownership in us from 57.3% as of December 31, 2019, to 65% as of December 31, 2020 and to 82.3% as of the date of this Report. Enel’s control increased in 2021 as a result of the 2021 Merger and the 2021 Tender Offer.
Item 16F. Change in Registrant’s Certifying Accountants
There has been no change in independent accountants for the Company during the two most recent fiscal years or any subsequent interim period except as previously reported in the Company’s Annual Report on Form 20-F for the fiscal year ended December 31, 2019. There have been no disagreements of the type required to be disclosed by Item 16F (b).
Item 16G. Corporate Governance
For a summary of the significant differences between our corporate governance practices and those applicable to domestic issuers under the corporate governance rules of the NYSE, see “Item 6. Directors, Senior Management and Employees — C. Board Practices.”
Item 16H. Mine Safety Disclosure
Not applicable.
210
Not Applicable.
ENEL AMÉRICAS S.A. and Subsidiaries
Index to the Consolidated Financial Statements
Reports of Independent Registered Public Accounting Firms: | |
| |
Report of KPMG Auditores Consultores SpA — Enel Américas S.A. — 2020 | F-1 |
F-3 | |
F-5 | |
| |
Consolidated Financial Statements: | |
Consolidated Statements of Financial Position as of December 31, 2020 and 2019 | F-9 |
F-11 | |
Consolidated Statements of Changes in Equity for the years ended December 31, 2020, 2019, and 2018 | F-13 |
Consolidated Statements of Direct Cash Flows for the years ended December 31, 2020, 2019, and 2018 | F-14 |
F-15 |
Ch$ | Chilean pesos |
US$ | U.S. dollars |
UF | A Chilean inflation-indexed, Chilean peso-denominated monetary unit that is set daily in advance based on the previous month’s inflation rate. |
ThCh$ | Thousands of Chilean pesos |
ThUS$ | Thousands of U.S. dollars |
ARS | Argentine pesos |
COP | Colombian pesos |
BRL | Brazilian Reals |
PEN | Peruvian Soles |
EUR | Euro |
| ||
101.INS |
| XBRL Instance Document |
101.SCH | | XBRL Taxonomy Extension Schema Document |
101.CAL | | XBRL Taxonomy Extension Calculation Linkbase Document |
101.DEF | | XBRL Taxonomy Extension Definition Linkbase Document |
101.LAB | | XBRL Taxonomy Extension Label Linkbase Document |
101.PRE | | XBRL Taxonomy Extension Presentation Linkbase Document |
We will furnish to the Securities and Exchange Commission, upon request, copies of any not filed instruments that define the rights of stakeholders of Enel Américas.
211
SIGNATURES
The registrant hereby certifies that it meets all of the requirements for filing on Form 20-F and that it has duly caused and authorized the undersigned to sign this annual report on its behalf.
| | | |
| |||
ENEL AMÉRICAS S.A. | |||
| | | |
| By: | /s/ Maurizio Bezzeccheri | |
| Name: | Maurizio Bezzeccheri | |
| Title: | Chief Executive Officer | |
| | | |
Date: | April 30, 2021 | | |
212
| iesco 5435, piso 4, Santiago | | |
| | | |
Report of Independent Registered Public Accounting Firm
To the Stockholders and Board of Directors
Enel Américas S.A.:
Opinion on the Consolidated Financial Statements
We have audited the accompanying consolidated statement of financial position of Enel Américas S.A. and subsidiaries (the Company) as of December 31, 2020, the related consolidated statements of comprehensive income, changes in equity, and cash flows for the year ended December 31, 2020, and the related notes (collectively, the consolidated financial statements). In our opinion, the consolidated financial statements present fairly, in all material respects, the financial position of the Company as of December 31, 2020, and the results of its operations and its cash flows for the year ended December 31, 2020, in conformity with International Financial Reporting Standards as issued by the International Accounting Standards Board.
We also have audited, in accordance with the standards of the Public Company Accounting Oversight Board (United States) (PCAOB), the Company’s internal control over financial reporting as of December 31, 2020, based on criteria established in Internal Control – Integrated Framework (2013) issued by the Committee of Sponsoring Organizations of the Treadway Commission, and our report dated April 30, 2021 expressed an adverse opinion on the effectiveness of the Company’s internal control over financial reporting.
Basis for Opinion
These consolidated financial statements are the responsibility of the Company’s management. Our responsibility is to express an opinion on these consolidated financial statements based on our audit. We are a public accounting firm registered with the PCAOB and are required to be independent with respect to the Company in accordance with the U.S. federal securities laws and the applicable rules and regulations of the Securities and Exchange Commission and the PCAOB.
We conducted our audit in accordance with the standards of the PCAOB. Those standards require that we plan and perform the audit to obtain reasonable assurance about whether the consolidated financial statements are free of material misstatement, whether due to error or fraud. Our audit included performing procedures to assess the risks of material misstatement of the consolidated financial statements, whether due to error or fraud, and performing procedures that respond to those risks. Such procedures included examining, on a test basis, evidence regarding the amounts and disclosures in the consolidated financial statements. Our audit also included evaluating the accounting principles used and significant estimates made by management, as well as evaluating the overall presentation of the consolidated financial statements. We believe that our audit provides a reasonable basis for our opinion.
KPMG Auditores Consultores SpA, a Chilean joint-stock company and a member firm of the KPMG global organization of independent member firms affiliated with KPMG International Limited, a private English company limited by guarantee. All rights reserved.
F-1

Critical Audit Matter
The critical audit matter communicated below is a matter arising from the current period audit of the consolidated financial statements that was communicated or required to be communicated to the audit committee and that: (1) relates to accounts or disclosures that are material to the consolidated financial statements and (2) involved our especially challenging, subjective, or complex judgments. The communication of a critical audit matter does not alter in any way our opinion on the consolidated financial statements, taken as a whole, and we are not, by communicating the critical audit matter below, providing a separate opinion on the critical audit matter or on the accounts or disclosures to which it relates.
Unbilled revenue
As discussed in Notes 3q and 28 to the consolidated financial statements, revenue from sales to customers includes estimates of energy provided and not billed as of December 31, 2020, amounting to ThUS$1,051,011 related to the distribution and generation entities in Brazil, Colombia, Perú, and Argentina. These estimates are made based on the quantity of energy consumed by customers during the period, at the prices stipulated in the electricity tariffs in accordance with the current regulation or, if applicable, contractual arrangements with customers.
We identified the revenue recognition of energy provided and not invoiced as a critical audit matter due to the auditor judgment required to assess the complexity of the non-standardized determination of energy consumed by customers and the calculation of price formulas established in the contracts and regulations. In addition, auditor judgment was required to assess the adequacy of the nature and extent of the audit evidence obtained.
The following are the primary procedures we performed to address this critical audit matter. We evaluated the design and tested the operating effectiveness of certain internal controls related to the unbilled revenue process for the generation entities. This included controls related to:
• | the price used for estimation of unbilled sales to customers |
• | inputs used to estimate the quantity of energy consumed by customers, such as energy purchased from the Company and the customer’s historical consumption information, including the energy consumption by customers in the previous month |
• | the comparison between the estimate of unbilled revenue at the end of the month versus the actual volume of energy subsequently measured and billed to customers (back-testing) for the generation entities. |
We compared the volume used in the estimate of unbilled revenue at the end of the year versus the actual volume of energy subsequently measured and billed to customers (back-testing) or to external data provided by the local regulator, as applicable. We reassessed a sample of the price used to calculate the unbilled sales to customers based on current contracts and decrees issued by the local regulator. We evaluated the reconciliation of the sales ledger to the actual sales report as of year end. In addition, we assessed the sufficiency of the nature and extent of the audit evidence obtained, as well as the Company’s disclosures of this matter in Note 28 to the consolidated financial statements.
/s/ KPMG
KPMG Auditores Consultores SpA
We have served as the Company’s auditor since 2020.
Santiago, Chile
April 30, 2021
| | | |
KPMG Auditores Consultores SpA, a Chilean joint-stock company and a member firm of the KPMG global organization of independent member firms affiliated with KPMG International Limited, a private English company limited by guarantee. All rights reserved. | |||
F-2
| iesco 5435, piso 4, Santiago | | |
| | | |
Report of Independent Registered Public Accounting Firm
To the Stockholders and Board of Directors
Enel Américas S.A.:
Opinion on Internal Control Over Financial Reporting
We have audited Enel Américas S.A. and subsidiaries’ (the Company) internal control over financial reporting as of December 31, 2020, based on criteria established in Internal Control – Integrated Framework (2013) issued by the Committee of Sponsoring Organizations of the Treadway Commission. In our opinion, because of the effect of the material weakness, described below, on the achievement of the objectives of the control criteria, the Company has not maintained effective internal control over financial reporting as of December 31, 2020, based on criteria established in Internal Control – Integrated Framework (2013) issued by the Committee of Sponsoring Organizations of the Treadway Commission.
We also have audited, in accordance with the standards of the Public Company Accounting Oversight Board (United States) (PCAOB), the consolidated statement of financial position of the Company as of December 31, 2020, the related consolidated statements of comprehensive income, changes in equity, and cash flows for the year ended December 31, 2020, and the related notes (collectively, the consolidated financial statements), and our report dated April 30, 2021 expressed an unqualified opinion on those consolidated financial statements.
A material weakness is a deficiency, or a combination of deficiencies, in internal control over financial reporting, such that there is a reasonable possibility that a material misstatement of the company’s annual or interim financial statements will not be prevented or detected on a timely basis. The following material weakness has been identified and included in management’s assessment. The Company did not establish effective general information technology controls, specifically program change controls and access controls, that support the consistent operation of the Company’s information technology (IT) operating system, database, and IT application layers of technology over the electricity distribution business revenue process. These deficiencies also affected the effectiveness of business process automated controls, manual controls with an automated component, and the database of the reports that were used to execute certain automated and manual controls.
The material weakness was considered in determining the nature, timing, and extent of audit tests applied in our audit of the 2020 consolidated financial statements, and this report does not affect our report on those consolidated financial statements.
Basis for Opinion
The Company’s management is responsible for maintaining effective internal control over financial reporting and for its assessment of the effectiveness of internal control over financial reporting, included in the accompanying Management’s Annual Report on Internal Control Over Financial Reporting. Our responsibility is to express an opinion on the Company’s internal control over financial reporting based on our audit. We are a public accounting firm registered with the PCAOB and are required to be independent with respect to the Company in accordance with the U.S. federal securities laws and the applicable rules and regulations of the Securities and Exchange Commission and the PCAOB.
KPMG Auditores Consultores SpA, a Chilean joint-stock company and a member firm of the KPMG global organization of independent member firms affiliated with KPMG International Limited, a private English company limited by guarantee. All rights reserved.
F-3

We conducted our audit in accordance with the standards of the PCAOB. Those standards require that we plan and perform the audit to obtain reasonable assurance about whether effective internal control over financial reporting was maintained in all material respects. Our audit of internal control over financial reporting included obtaining an understanding of internal control over financial reporting, assessing the risk that a material weakness exists, and testing and evaluating the design and operating effectiveness of internal control based on the assessed risk. Our audit also included performing such other procedures as we considered necessary in the circumstances. We believe that our audit provides a reasonable basis for our opinion.
Definition and Limitations of Internal Control Over Financial Reporting
A company’s internal control over financial reporting is a process designed to provide reasonable assurance regarding the reliability of financial reporting and the preparation of financial statements for external purposes in accordance with generally accepted accounting principles. A company’s internal control over financial reporting includes those policies and procedures that (1) pertain to the maintenance of records that, in reasonable detail, accurately and fairly reflect the transactions and dispositions of the assets of the company; (2) provide reasonable assurance that transactions are recorded as necessary to permit preparation of financial statements in accordance with generally accepted accounting principles, and that receipts and expenditures of the company are being made only in accordance with authorizations of management and directors of the company; and (3) provide reasonable assurance regarding prevention or timely detection of unauthorized acquisition, use, or disposition of the company’s assets that could have a material effect on the financial statements.
Because of its inherent limitations, internal control over financial reporting may not prevent or detect misstatements. Also, projections of any evaluation of effectiveness to future periods are subject to the risk that controls may become inadequate because of changes in conditions, or that the degree of compliance with the policies or procedures may deteriorate.
/s/ KPMG
KPMG Auditores Consultores SpA
Santiago, Chile
April 30, 2021
KPMG Auditores Consultores SpA, a Chilean joint-stock company and a member firm of the KPMG global organization of independent member firms affiliated with KPMG International Limited, a private English company limited by guarantee. All rights reserved.
F-4
| | | |
| EY Chile Avda. Presidente Riesco 5435, piso 4, Las Condes, Santiago | | Tel: +56 (2) 2676 1000 www.eychile.cl |

Report of Independent Registered Public Accounting Firm
To the Shareholders and the Board of Directors of Enel Américas S.A.
Opinion on the Financial Statements
We have audited the accompanying consolidated statement of financial position of Enel Américas S.A. and subsidiaries (the Company) as of December 31, 2019, the related consolidated statements of comprehensive income, shareholders' equity and cash flows for each of the two years in the period ended December 31, 2019, and the related notes (collectively referred to as the “consolidated financial statements”). In our opinion, the consolidated financial statements present fairly, in all material respects, the financial position of the Company at December 31, 2019, and the results of its operations and its cash flows for each of the two years in the period ended December 31, 2019, in conformity with International Financial Reporting Standards as issued by the International Accounting Standards Board.
Basis for Opinion
These financial statements are the responsibility of the Company's management. Our responsibility is to express an opinion on the Company’s financial statements based on our audits. We are a public accounting firm registered with the PCAOB and are required to be independent with respect to the Company in accordance with the U.S. federal securities laws and the applicable rules and regulations of the Securities and Exchange Commission and the PCAOB.
We conducted our audits in accordance with the standards of the PCAOB. Those standards require that we plan and perform the audit to obtain reasonable assurance about whether the financial statements are free of material misstatement, whether due to error or fraud. Our audits included performing procedures to assess the risks of material misstatement of the financial statements, whether due to error or fraud, and performing procedures that respond to those risks. Such procedures included examining, on a test basis, evidence regarding the amounts and disclosures in the financial statements. Our audits also included evaluating the accounting principles used and significant estimates made by management, as well as evaluating the overall presentation of the financial statements. We believe that our audits provide a reasonable basis for our opinion.
Critical Audit Matters
The critical audit matters communicated below are matters arising from the current period audit of the financial statements that were communicated or required to be communicated to the audit committee and that: (1) relate to accounts or disclosures that are material to the financial statements and (2) involved our especially challenging, subjective, or complex judgments. The communication of critical audit matters does not alter in any way our opinion on the financial statements, taken as a whole, and we are not, by communicating the critical audit matters below, providing separate opinions on the critical audit matters or on the accounts or disclosures to which they relate.
F-5
|
|
Goodwill Impairment Test
Description of the Matter
As of December 31, 2019, the Company’s consolidated financial statements present goodwill in the amount of US$1.17 billion. As discussed in Note 3 c) to the consolidated financial statements, goodwill is tested for impairment at least annually at the reporting unit level. The Company’s goodwill is initially assigned to its reporting units as of the acquisition date using a relative fair value allocation. The impairment tests required the use of significant assumptions to determine the fair value of the related reporting unit. Those assumptions are described in Note 3 e) to the Company´s consolidated financial statements, and include market evolution, future price estimations, discount rates and the consideration of risks specific to the relevant cash generating unit.
Auditing the Company´s goodwill impairment test is complex due to the significant estimation uncertainties involved in determining the fair values of the reporting units. Those fair value estimates are sensitive to changes in significant assumptions such as discount rate and projected cash flows that may be affected by future market or economic conditions.
How We Addressed the Matter in Our Audit
We obtained an understanding, evaluated the design and tested the operating effectiveness of controls over the goodwill impairment test. For example, we tested controls over the significant assumptions, such as discount rate and projected cash flows used in the valuation process.
To test the fair values of the reporting units, our audit procedures included, among others, evaluating the methodologies used by the Company with the assistance of our valuation specialists; testing the significant assumptions used to develop the prospective financial information; comparing those significant assumptions to historical results of the Company's business; benchmarking those assumptions against market participant data within the same industry and performing an independent calculation of the discount rate considering market information about the cost of capital from comparable energy companies.
We also evaluated the Company’s disclosure of this matter in Note 16 to the consolidated financial statements.
Unbilled Revenue in the Distribution Business
Description of the Matter
As described in Note 11 to the consolidated financial statements, the Company presents revenue from sales to customers that includes estimates of energy provided and not yet billed as of December 31, 2019, amounting to US$601.6 million related to the distribution entities in Brazil, Colombia, Peru and Argentina. The distribution entities calculate the unbilled revenue based on the estimated quantity of energy consumed by customers during the period, at the prices stipulated in the electricity tariffs in accordance with the current regulation or, if applicable, contractual arrangements with customers.
F-6
|
|
Auditing the unbilled revenue is complex due to the uncertainties involved in management’s estimation of energy consumed by the customers that is based on energy purchases during the period and the effects of historical customers consumption information. Changes in those estimates could have a material effect on the amount of unbilled energy consumed.
How We Addressed the Matter in Our Audit
We obtained an understanding, evaluated the design and tested the operating effectiveness of controls over the Company´s unbilled revenue process. For example, we tested controls over the inputs used to estimate the quantity of energy consumed by customers such as energy purchased by the Company and the effects of historical customers consumption information, including the energy consumption by customers in the previous month, and in some distribution entities we tested a control over the comparison between the estimate of consumed energy and the energy billed in the following months (back-testing).
To test the unbilled revenue, our audit procedures included, among others, testing the accuracy and completeness of data used in management’s estimation of the unbilled energy amounts; evaluating the inputs used to calculate the unbilled revenue and comparing the quantity of energy obtained from the unbilled consumption reports with the quantity of energy subsequently billed to the final customers (back-testing).
We also evaluated the Company’s disclosures of this matter in Note 10 to the consolidated financial statements.
Realization of Deferred Tax Assets
Description of the Matter
As described in Notes 2.4.1 and 19 to the consolidated financial statements, during the year ended December 31, 2019, Enel Distribución Sao Paulo incorporated its direct parent company Enel Brasil Investimentos Sudeste S.A. As a consequence of the reverse merger, the Company recognized an economic benefit due to the probable future reduction of taxes in the amount of US$553.2 million, to be amortized through 2058, considering the tax amortization related to the current concession term and the expectation of renewal of the same. This subject is disclosed in note 3.d.1 to the consolidated financial statements.
Auditing the realization of future tax benefits is complex due to the uncertainties involved in preparing prospective financial information using various scenarios such as forecasts of future market and business conditions, related to the business environment in which the Company operates, to estimate the amount and the corresponding year in which these tax benefits will be realized in the normal course of the Company's operations.
How We Addressed the Matter in Our Audit
We obtained an understanding, evaluated the design and operating effectiveness of controls over management´s projections of future taxable income.
F-7
Among other audit procedures performed, we tested the projections of future profits prepared by the management, as well as the consistency of these projections with historical data of past estimates and also with the actual achievements of them; we evaluated the assumptions and methodology used by the Company when preparing these estimates of future profits and consistency with those used for the annual goodwill impairment test; we involved our tax personnel to evaluate the deductibility of the tax benefit generated in the reverse merger transaction, as well as the documentation required for the operation, in its form, to allow deductibility.
We also evaluated the Company’s disclosures of this matter in Note 19 to the consolidated financial statements.
/s/ EY Audit SpA. |
EY Audit SpA. |
We served as the Company’s auditor from 2011 to 2020. |
Santiago, Chile |
April 30, 2020 |
F-8
ENEL AMÉRICAS S.A. AND SUBSIDIARIES
Consolidated Statements of Financial Position
As of December 31, 2020 and 2019
(In thousands of US Dollars – ThUS$)
| | | | | | |
| | | | 12-31-2020 | | 12-31-2019 |
ASSETS |
| Note |
| ThUS$ |
| ThUS$ |
| | | | | | |
CURRENT ASSETS | | | | | | |
| | | | | | |
Cash and cash equivalents | | 7 | | 1,506,993 | | 1,938,997 |
Other current financial assets | | 8 | | 230,279 | | 120,383 |
Other current non-financial assets | | 9 | | 560,786 | | 486,162 |
Trade and other receivables, current | | 10 | | 3,234,935 | | 3,504,457 |
Current accounts receivable from related parties | | 11 | | 46,950 | | 16,369 |
Inventories | | 12 | | 471,433 | | 396,239 |
Current tax assets | | 13 | | 127,880 | | 107,321 |
Total current assets other than assets or groups of assets for disposal classified as held for sale or as held for distribution to owners | | | | 6,179,256 | | 6,569,928 |
| | | | | | |
Non-current assets or disposal groups held for sale or for distribution to owners | | 5.1 | | — | | 11,326 |
| | | | | | |
TOTAL CURRENT ASSETS | | | | 6,179,256 | | 6,581,254 |
| | | | | | |
NON-CURRENT ASSETS | | | | | | |
| | | | | | |
Other non-current financial assets | | 8 | | 2,790,863 | | 3,049,811 |
Other non-current non-financial assets | | 9 | | 2,332,856 | | 2,735,890 |
Trade and other non-current receivables | | 10 | | 578,524 | | 587,957 |
Non-current accounts receivable from related parties | | 11 | | 32 | | 847 |
Investments accounted for using the equity method | | 14 | | 2,273 | | 1,978 |
Intangible assets other than goodwill | | 15 | | 4,524,826 | | 5,527,879 |
Goodwill | | 16 | | 945,512 | | 1,173,043 |
Property, plant and equipment | | 17 | | 8,354,672 | | 8,763,438 |
Investment property | | | | 7,942 | | 10,254 |
Right-of-use assets | | 18 | | 222,420 | | 255,799 |
Deferred tax assets | | 19 | | 994,382 | | 1,088,234 |
| | | | | | |
TOTAL NON-CURRENT ASSETS | | | | 20,754,302 | | 23,195,130 |
| | | | | | |
TOTAL ASSETS | | | | 26,933,558 | | 29,776,384 |
The accompanying notes are an integral part of these consolidated financial statements.
F-9
ENEL AMÉRICAS S.A. AND SUBSIDIARIES
Consolidated Statements of Financial Position (continued)
As of December 31, 2020 and 2019
(In thousands of US Dollars – ThUS$)
| | | | | | |
| | | | 12-31-2020 | | 12-31-2019 |
LIABILITIES AND EQUITY |
| Note |
| ThUS$ |
| ThUS$ |
| | | | | | |
CURRENT LIABILITIES | | | | | | |
| | | | | | |
Other current financial liabilities | | 20 | | 1,825,130 | | 1,408,407 |
Current lease liabilities | | 21 | | 51,495 | | 81,644 |
Trade and other payables, current | | 24 | | 4,093,576 | | 3,920,045 |
Current accounts payable to related parties | | 11 | | 597,122 | | 494,511 |
Other current provisions | | 25 | | 220,425 | | 286,052 |
Current tax liabilities | | 13 | | 222,870 | | 220,727 |
Other current non-financial liabilities | | 9 | | 266,604 | | 320,755 |
Total current liabilities other than those associated with groups of assets for disposal classified as held for sale or as held for distribution to owners | | | | 7,277,222 | | 6,732,141 |
| | | | | | |
Non-current liabilities associated with disposal groups held for sale or for distribution to owners | | 5.1 | | | | 3,791 |
| | | | | | |
TOTAL CURRENT LIABILITIES | | | | 7,277,222 | | 6,735,932 |
| | | | | | |
NON-CURRENT LIABILITIES | | | | | | |
| | | | | | |
Other non-current financial liabilities | | 20 | | 3,837,706 | | 4,781,833 |
Non-current lease liabilities | | 21 | | 91,070 | | 108,625 |
Trade payables, non-current | | 24 | | 2,061,475 | | 2,335,997 |
Non-current accounts payable to related parties | | 11 | | 144,391 | | — |
Other long-term provisions | | 25 | | 833,900 | | 976,327 |
Deferred tax liabilities | | 19 | | 612,953 | | 643,854 |
Non-current provisions for employee benefits | | 26 | | 1,624,217 | | 1,836,362 |
Other non-current non-financial liabilities | | 9 | | 116,961 | | 111,268 |
| | | | | | |
TOTAL NON-CURRENT LIABILITIES | | | | 9,322,673 | | 10,794,266 |
| | | | | | |
TOTAL LIABILITIES | | | | 16,599,895 | | 17,530,198 |
| | | | | | |
EQUITY | | | | | | |
Share and paid-in capital | | 27.1.1 | | 9,763,078 | | 9,783,875 |
Retained earnings | | | | 5,415,698 | | 5,474,411 |
Other reserves | | 27.5 | | (7,072,917) | | (5,291,999) |
Equity attributable to shareholders of Enel Américas | | | | 8,105,859 | | 9,966,287 |
| | | | | | |
Non-controlling interests | | 27.6 | | 2,227,804 | | 2,279,899 |
| | | | | | |
TOTAL EQUITY | | | | 10,333,663 | | 12,246,186 |
| | | | | | |
TOTAL LIABILITIES AND EQUITY | | | | 26,933,558 | | 29,776,384 |
The accompanying notes are an integral part of these consolidated financial statements.
F-10
ENEL AMÉRICAS S.A. AND SUBSIDIARIES
Consolidated Statements of Comprehensive Income, by Nature
For the years ended December 31, 2020, 2019 and 2018
(In thousands of US Dollars – ThUS$)
| | | | | | | | | |
| | | | For the years ended December 31, | | ||||
CONSOLIDATED STATEMENTS OF COMPREHENSIVE INCOME | | |
| 2020 | | 2019 | | 2018 | |
Profit (loss) |
| Note |
| ThUS$ | | ThUS$ |
| ThUS$ | |
Revenue | | 28 | | 11,238,976 | | 13,053,376 | | 11,924,761 | |
Other income, by nature | | 28 | | 953,698 | | 1,260,736 | | 1,064,928 | |
Revenues and Other income, by nature | | | | 12,192,674 | | 14,314,112 | | 12,989,689 | |
Raw materials and consumables used | | 29 | | (7,555,915) | | (8,541,023) | | (7,948,400) | |
Contribution Margin | | | | 4,636,759 | | 5,773,089 | | 5,041,289 | |
Other work performed by the entity and capitalized | | | | 147,151 | | 181,565 | | 177,997 | |
Employee benefits expenses | | 30 | | (565,046) | | (809,753) | | (840,493) | |
Depreciation and amortization expense | | 31 | | (858,099) | | (948,330) | | (862,440) | |
Impairment (loss) reversal recognized in profit or loss | | 31 | | — | | 2,126 | | 61,753 | |
Impairment (loss) impairment gain and reversal of impairment loss determined in accordance with IFRS 9 | | 31 | | (242,372) | | (279,125) | | (122,501) | |
Other expense, by nature | | 32 | | (1,065,278) | | (1,150,709) | | (1,021,085) | |
Operating income | | | | 2,053,115 | | 2,768,863 | | 2,434,520 | |
| | | | | | | | | |
Other gains (losses) | | | | 4,671 | | 14,196 | | 681 | |
Finance income | | 33 | | 321,477 | | 449,661 | | 358,081 | |
Finance costs | | 33 | | (768,453) | | (1,088,631) | | (1,071,759) | |
Share of profit (loss) of associates and joint ventures accounted for using the equity method | | 14 | | 3,133 | | 583 | | 2,452 | |
Foreign currency translation differences | | 33 | | 57,171 | | 136,960 | | 110,635 | |
Gains (losses) from indexed assets and liabilities | | 33 | | 76,698 | | 124,477 | | 270,380 | |
| | | | | | | | | |
Profit (loss) before taxes | | | | 1,747,812 | | 2,406,109 | | 2,104,990 | |
Income tax expense | | 19 | | (566,560) | | (236,346) | | (437,932) | |
PROFIT (LOSS) | | | | 1,181,252 | | 2,169,763 | | 1,667,058 | |
Profit (loss) attributable to | | | | | | | | | |
Profit (loss) attributable to owners of the parent | | | | 825,197 | | 1,614,085 | | 1,201,381 | |
Profit (loss) attributable to non-controlling interests | | 27.6 | | 356,055 | | 555,678 | | 465,677 | |
Profit (loss) | | | | 1,181,252 | | 2,169,763 | | 1,667,058 | |
| | | | | | | | | |
Basic earnings per share | | | | | | | | | |
| | | | | | | | | |
Basic earnings (losses) per share | | US$/Share | | 0.01085 | | 0.02465 | | 0.02091 | |
Weighted average number of outstanding shares | | | | 76,086,311,036 | | 65,480,640,658 | | 57,452,641,516 | |
The accompanying notes are an integral part of these consolidated financial statements.
F-11
ENEL AMÉRICAS S.A. AND SUBSIDIARIES
Consolidated Statements of Comprehensive Income, by Nature (continued)
For the years ended December 31, 2020, 2019 and 2018
(In thousands of US Dollars – ThUS$)
| | | | | | | | | |
| | | | For the years ended December 31, | | ||||
| | | | 2020 | | 2019 | | 2018 | |
CONSOLIDATED STATEMENTS OF COMPREHENSIVE INCOME |
| Note |
| ThUS$ |
| ThUS$ | | ThUS$ |
|
| | | | | | | | | |
Gains (losses) | | | | 1,181,252 | | 2,169,763 | | 1,667,058 | |
| | | | | | | | | |
Components of other comprehensive income that will not be reclassified subsequently to profit or loss before taxes | | | | | | | | | |
| | | | | | | | | |
Profit (loss) from defined benefit plans | | 26 | | (476,805) | | (576,143) | | (177,527) | |
| | | | | | | | | |
Other comprehensive income that will not be reclassified subsequently to profit or loss | | | | (476,805) | | (576,143) | | (177,527) | |
| | | | | | | | | |
Components of other comprehensive income that will be reclassified subsequently to profit or loss before taxes | | | | | | | | | |
| | | | | | | | | |
Gains (losses) from foreign currency translation difference | | 2.9 | | (2,249,915) | | (765,005) | | (1,575,134) | |
Gains (losses) from measuring financial assets at fair value through other comprehensive income | | | | (10) | | (598) | | (458) | |
Gains (losses) from cash flow hedges | | | | (15,547) | | 6,100 | | (5,763) | |
Adjustments from reclassification of cash flow hedges, transferred to profit or loss | | | | 2,571 | | (194) | | 3,036 | |
| | | | | | | | | |
Other comprehensive income that will be reclassified subsequently to profit or loss | | | | (2,262,901) | | (759,697) | | (1,578,319) | |
| | | | | | | | | |
Total components of other comprehensive income (loss) before taxes | | | | (2,739,706) | | (1,335,840) | | (1,755,846) | |
| | | | | | | | | |
Income tax related to components of other comprehensive income that will not be reclassified subsequently to profit or loss | | | | | | | | | |
| | | | | | | | | |
Income tax related to defined benefit plans | | | | 161,766 | | 195,098 | | 59,684 | |
| | | | | | | | | |
Income tax related to components of other comprehensive income that will not be reclassified subsequently to profit or loss | | | | 161,766 | | 195,098 | | 59,684 | |
| | | | | | | | | |
Income tax related to components of other comprehensive income that will be reclassified subsequently to profit or loss | | | | | | | | | |
Income tax related to cash flow hedge | | | | 5,038 | | (2,165) | | 1,354 | |
| | | | | | | | | |
Income tax related to components of other comprehensive income that will be reclassified subsequently to profit or loss | | | | 5,038 | | (2,165) | | 1,354 | |
| | | | | | | | | |
Total Other Comprehensive Income (Loss) | | | | (2,572,902) | | (1,142,907) | | (1,694,808) | |
| | | | | | | | | |
TOTAL OTHER COMPREHENSIVE INCOME (LOSS) | | | | (1,391,650) | | 1,026,856 | | (27,750) | |
| | | | | | | | | |
Comprehensive income (loss) attributable to: | | | | | | | | | |
Owners of Enel Américas | | | | (1,521,532) | | 623,512 | | (121,326) | |
Non-controlling interests | | | | 129,882 | | 403,344 | | 93,576 | |
TOTAL COMPREHENSIVE INCOME (LOSS) | | | | (1,391,650) | | 1,026,856 | | (27,750) | |
The accompanying notes are an integral part of these consolidated financial statements.
F-12
ENEL AMÉRICAS S.A. AND SUBSIDIARIES
Consolidated Statements of Changes in Equity
For years ended December 31, 2020, 2019 and 2018
(In thousands of US Dollars – ThUS$)
| | | | | | | | | | | | | |
| | | Changes in Other Reserves | | | | | ||||||
Consolidated Statement of Changes in Equity | Share and paid-in capital | Treasury | Reserve for | Reserves for | Reserve for Gains | Reserve for Gains and Losses on Remeasuring Financial Asset at Fair Value of Other Comprehensive Income | Other | Amounts recognized in | Total Other | Retained | Equity Attributable | Non-Controlling | Total Equity |
Equity at beginning of period 1/1/2020 | 9,783,875 | — | (2,283,155) | (1,334) | — | (687) | (3,006,823) | — | (5,291,999) | 5,474,411 | 9,966,287 | 2,279,899 | 12,246,186 |
Increase (decrease) through changes in accounting policies (1) | — | — | — | — | — | — | — | — | — | — | — | — | — |
Equity at beginning of period 1/1/2020 (As Restated) | 9,783,875 | — | (2,283,155) | (1,334) | — | (687) | (3,006,823) | — | (5,291,999) | 5,474,411 | 9,966,287 | 2,279,899 | 12,246,186 |
Changes in equity | | | | | | | | | | | | | |
Comprehensive income: | — | — | — | — | — | — | — | — | — | — | — | — | — |
Profit (loss) | — | — | — | — | — | — | — | — | — | 825,197 | 825,197 | 356,055 | 1,181,252 |
Other comprehensive income (loss) | — | — | (2,025,141) | (8,049) | (313,534) | (5) | — | — | (2,346,729) | — | (2,346,729) | (226,173) | (2,572,902) |
Comprehensive income | — | — | — | — | — | — | — | — | — | — | (1,521,532) | 129,882 | (1,391,650) |
Share issuance | — | — | — | — | — | — | — | — | — | — | — | | — |
Dividends | — | — | — | — | — | — | — | — | — | (570,376) | (570,376) | (306,309) | (876,685) |
Increase (decrease) due to other changes | (20,797) | — | — | — | 313,534 | — | 252,277 | — | 565,811 | (313,534) | 231,480 | 124,332 | 355,812 |
Increase (decrease) through treasury share transactions | | | | | | | | | | | | | — |
Total changes in equity | (20,797) | — | (2,025,141) | (8,049) | — | (5) | 252,277 | — | (1,780,918) | (58,713) | (1,860,428) | (52,095) | (1,912,523) |
Equity at end of period 12/31/2020 | 9,763,078 | — | (4,308,296) | (9,383) | — | (692) | (2,754,546) | — | (7,072,917) | 5,415,698 | 8,105,859 | 2,227,804 | 10,333,663 |
| | | | | | | | | | | | | |
| | | Changes in Other Reserves | | | | | ||||||
Consolidated Statement of Changes in Equity | Share and paid-in capital | Treasury | Reserve for | Reserves for | Reserve for Gains | Reserve for Gains and Losses on Remeasuring Financial Asset at Fair Value of Other Comprehensive Income | Other | Amounts recognized in | Total Other | Retained | Equity Attributable | Non-Controlling | Total Equity |
Equity at beginning of period 1/1/2019 | 6,763,204 | — | (1,666,109) | (5,094) | — | (397) | (3,209,283) | — | (4,880,883) | 4,841,687 | 6,724,008 | 2,107,892 | 8,831,900 |
Changes in equity | | | | | | | | | | | | | |
Comprehensive income | | | | | | | | | | | | | |
Profit (loss) | — | — | — | — | — | — | — | — | — | 1,614,085 | 1,614,085 | 555,678 | 2,169,763 |
Other comprehensive income (loss) | — | — | (617,046) | 3,760 | (376,997) | (290) | — | — | (990,573) | — | (990,573) | (152,334) | (1,142,907) |
Comprehensive income (loss) | — | — | — | — | — | — | — | — | — | — | 623,512 | 403,344 | 1,026,856 |
Share issuance | 3,020,671 | — | — | — | — | — | — | | — | — | 3,020,671 | — | 3,020,671 |
Dividends | — | — | — | — | — | — | — | — | — | (604,364) | (604,364) | (289,052) | (893,416) |
Increase (decrease) due to other changes | | — | — | — | 376,997 | — | 202,460 | — | 579,457 | (376,997) | 202,460 | 57,715 | 260,175 |
Total changes in equity | 3,020,671 | — | (617,046) | 3,760 | — | (290) | 202,460 | — | (411,116) | 632,724 | 3,242,279 | 172,007 | 3,414,286 |
Equity at end of period 12/31/2019 | 9,783,875 | — | (2,283,155) | (1,334) | — | (687) | (3,006,823) | — | (5,291,999) | 5,474,411 | 9,966,287 | 2,279,899 | 12,246,186 |
| | | | | | | | | | | | | |
| | | Changes in Other Reserves | | | | | ||||||
Consolidated Statement of Changes in Equity | Share and paid-in capital | Treasury | Reserve for | Reserves for | Reserve for Gains | Reserve for Gains and Losses on Remeasuring Financial Asset at Fair Value of Other Comprehensive Income | Other | Amounts recognized in | Total Other | Retained | Equity Attributable | Non-Controlling | Total Equity |
Equity at beginning of period 1/1/2018 (As Restated) | 6,763,204 | — | (453,995) | (3,472) | — | (175) | (3,408,922) | — | (3,866,564) | 3,583,831 | 6,480,471 | 1,798,036 | 8,278,507 |
Increase (decrease) due to changes in accounting policies (1) | — | — | — | — | | — | — | — | — | 667,447 | 667,447 | 286,583 | 954,030 |
Equity at beginning of period 1/1/2017 (As Restated) | 6,763,204 | — | (453,995) | (3,472) | — | (175) | (3,408,922) | — | (3,866,564) | 4,251,278 | 7,147,918 | 2,084,619 | 9,232,537 |
Changes in equity | | | | | | | | | | | | | |
Comprehensive income | — | — | — | — | — | — | — | — | — | — | — | — | — |
Profit (loss) | — | — | — | — | — | — | — | — | — | 1,201,381 | 1,201,381 | 465,677 | 1,667,058 |
Other comprehensive income (loss) | — | — | (1,212,114) | (1,622) | (108,749) | (222) | — | — | (1,322,707) | — | (1,322,707) | (372,101) | (1,694,808) |
Comprehensive income | — | — | — | — | — | — | — | — | — | — | (121,326) | 93,576 | (27,750) |
Dividends | — | — | — | — | — | — | — | — | | (502,223) | (502,223) | (255,242) | (757,465) |
Increase (decrease) due to other changes | — | — | — | — | 108,749 | — | 199,639 | — | 308,388 | (108,749) | 199,639 | 184,939 | 384,578 |
Total changes in equity | — | — | (1,212,114) | (1,622) | — | (222) | 199,639 | — | (1,014,319) | 590,409 | (423,910) | 23,273 | (400,637) |
Equity at end of period 12/31/2018 | 6,763,204 | — | (1,666,109) | (5,094) | — | (397) | (3,209,283) | — | (4,880,883) | 4,841,687 | 6,724,008 | 2,107,892 | 8,831,900 |
| (1) | Considers a charge to retains earnings of ThUS$5,804 due to the application of IFRS 9, a charge to retain earning of ThUS$1,272 due to the application of IFRS 15 and a credit to retains earnings of ThUS$961,107 due to the application of IAS 29. |
The accompanying notes are an integral part of these consolidated financial statements.
F-13
ENEL AMÉRICAS S.A. AND SUBSIDIARIES
Consolidated Statements of Cash Flows, Direct
For the years ended December 31, 2020, 2019 and 2018
(In thousands of US Dollars – ThUS$)
| | | | | | | | | |
| | | | For the years ended December 31, | | ||||
| | | | 2020 | | 2019 | | 2018 | |
Consolidated Statements of Cash Flows, Direct Method |
| Note |
| ThUS$ |
| ThUS$ |
| ThUS$ |
|
Cash flows from (used in) operating activities | | | | | | | | | |
| | | | | | | | | |
Types of collection from operating activities | | | | | | | | | |
Collections from the sale of goods and services | | | | 14,770,122 | | 18,408,759 | | 16,445,981 | |
Collections from royalties, payments, commissions, and other revenue | | | | 36,171 | | 38,223 | | 48,659 | |
Collections from premiums and services, annual payments, and other benefits from policies held | | | | 28,364 | | 26,940 | | 48,028 | |
Other collections from operating activities | | | | 1,269,911 | | 828,859 | | 752,842 | |
Payments to suppliers for goods and services | | | | (8,185,560) | | (9,343,478) | | (8,597,388) | |
Payments to and on behalf of employees | | | | (731,887) | | (867,683) | | (786,892) | |
Payments of premiums and services, annual payments, and other obligations from policies held | | | | (13,014) | | (11,723) | | (11,345) | |
Other payments for operating activities | | 7.c | | (4,013,788) | | (5,723,433) | | (5,227,832) | |
Interests paid | | | | (4,675) | | (8,343) | | — | |
| | | | | | | | | |
Cash flows from (used in) operating activities | | | | | | | | | |
Income taxes paid | | | | (527,952) | | (561,805) | | (593,948) | |
Other cash inflows (outflows) | | | | (202,182) | | (258,805) | | (233,540) | |
| | | | | | | | | |
Net cash flows from (used in) operating activities | | | | 2,425,510 | | 2,527,511 | | 1,844,565 | |
| | | | | | | | | |
Cash flows from (used in) investing activities | | | | | | | | | |
Cash flows used to obtain control of subsidiaries or other businesses | | | | — | | — | | (1,590,435) | |
Cash flows used in the purchase of non-controlling interests | | | | — | | (97,517) | | — | |
Other collections from the sale of equity or debt instruments belonging to other entities | | | | 176,383 | | 284,939 | | 294,562 | |
Other payments to acquire equity or debt instruments of other entities | | | | (215,626) | | (245,390) | | (335,668) | |
Proceeds from the sale of property, plant and equipment | | | | — | | — | | 1,000 | |
Purchases of property, plant and equipment | | | | (813,827) | | (891,599) | | (750,435) | |
Purchases of intangible assets | | | | (739,664) | | (767,291) | | (790,184) | |
Payments from future, forward, option and swap contracts | | | | (5,070) | | (3,909) | | (3,079) | |
Collections from future, forward, option and swap contracts | | | | 21,037 | | 14,981 | | 14,003 | |
Dividends received | | | | 2,120 | | 1,521 | | 1,524 | |
Interest received | | | | 43,400 | | 111,730 | | 99,648 | |
Other cash inflows (outflows) | | | | (4,369) | | (7,263) | | (10,125) | |
| | | | | | | | | |
Net cash flows from (used in) investing activities | | | | (1,535,616) | | (1,599,798) | | (3,069,189) | |
| | | | | | | | | |
Cash flows from (used in) financing activities | | | | | | | | | |
Proceeds from issuance of shares | | 27.1.1 | | — | | 2,999,874 | | — | |
Total proceeds from loans | | 7.d | | 1,646,135 | | 4,898,823 | | 4,538,165 | |
Proceeds from long-term loans | | | | 437,284 | | 1,164,306 | | 2,836,717 | |
Proceeds from short-term loans | | | | 1,208,851 | | 3,734,517 | | 1,701,448 | |
Loans from related parties | | | | 295,299 | | — | | 2,686,387 | |
Payment of borrowings | | 7.d | | (1,775,865) | | (4,782,344) | | (4,301,358) | |
Payment of lease liabilities | | 7.d | | (77,292) | | (59,177) | | (31,619) | |
Payment of loans to related parties | | 7.d | | — | | (2,662,433) | | — | |
Dividends paid | | | | (1,057,692) | | (723,983) | | (591,958) | |
Interest paid | | 7.d | | (326,703) | | (614,599) | | (439,552) | |
Other cash inflows (outflows) | | 7.d | | 109,583 | | 120,935 | | 7,001 | |
| | | | | | | | | |
Net cash flows from (used in) financing activities | | | | (1,186,535) | | (822,904) | | 1,867,066 | |
| | | | | | | | | |
Net increase (decrease) in cash and cash equivalents before effect of exchange rate changes | | | | (296,641) | | 104,809 | | 642,442 | |
| | | | | | | | | |
Effect of exchange rate changes on cash and cash equivalents | | | | | | | | | |
Effect of exchange rate changes on cash and cash equivalents | | | | (135,363) | | (70,097) | | (210,920) | |
Net increase (decrease) in cash and cash equivalents | | | | (432,004) | | 34,712 | | 431,522 | |
Cash and cash equivalents at beginning of period | | 7.d | | 1,938,997 | | 1,904,285 | | 1,472,763 | |
Cash and cash equivalents at end of period | | 7.d | | 1,506,993 | | 1,938,997 | | 1,904,285 | |
The accompanying notes are an integral part of these consolidated financial statements.
F-14
ENEL AMÉRICAS S.A. AND SUBSIDIARIES
NOTES TO THE CONSOLIDATED FINANCIAL STATEMENTS
| | | ||
Contents | Page | |||
F-18 | ||||
BASIS OF PRESENTATION OF THE CONSOLIDATED FINANCIAL STATEMENTS | F-19 | |||
F-19 | ||||
F-19 | ||||
Responsibility for the information, judgments and estimates provided | F-25 | |||
F-26 | ||||
| F-27 | |||
| 2.4.2 Consolidated companies with an economic equity interest of less than 50% | F-28 | ||
F-28 | ||||
F-29 | ||||
F-29 | ||||
F-32 | ||||
F-32 | ||||
F-35 | ||||
F-35 | ||||
F-35 | ||||
| F-36 | |||
| F-37 | |||
| F-37 | |||
F-37 | ||||
F-39 | ||||
F-40 | ||||
| F-40 | |||
| F-41 | |||
| F-42 | |||
| F-43 | |||
| g.5) Derivative financial instruments and hedging transactions | F-43 | ||
| F-45 | |||
| F-45 | |||
| F-45 | |||
F-46 | ||||
F-47 | ||||
F-47 | ||||
F-47 | ||||
F-48 | ||||
F-48 | ||||
| m.1) Provisions for post-employment benefits and similar obligations | F-49 | ||
F-49 | ||||
F-50 | ||||
F-50 | ||||
F-51 | ||||
F-52 | ||||
F-52 | ||||
F-53 | ||||
F-53 | ||||
F-53 | ||||
F-47 | ||||
F-74 | ||||
F-15
| | | ||
F-75 | ||||
F-75 | ||||
F-75 | ||||
F-76 | ||||
F-76 | ||||
F-79 | ||||
F-81 | ||||
F-82 | ||||
F-83 | ||||
F-87 | ||||
F-87 | ||||
| F-87 | |||
| F-88 | |||
| F-89 | |||
| F-89 | |||
F-90 | ||||
| F-91 | |||
| F-91 | |||
| c) Guarantees given by the Company in favor of the directors | F-92 | ||
F-93 | ||||
| F-93 | |||
| b) Guarantees established by the Company in favor of key management personnel | F-93 | ||
F-93 | ||||
F-94 | ||||
F-94 | ||||
F-95 | ||||
F-97 | ||||
F-99 | ||||
F-101 | ||||
F-103 | ||||
F-105 | ||||
| F-105 | |||
| F-107 | |||
F-110 | ||||
F-110 | ||||
F-113 | ||||
F-116 | ||||
F-117 | ||||
F-118 | ||||
F-118 | ||||
F-120 | ||||
F-127 | ||||
F-127 | ||||
F-128 | ||||
F-128 | ||||
F-129 | ||||
F-129 | ||||
F-130 | ||||
F-131 | ||||
F-131 | ||||
F-132 | ||||
F-135 | ||||
F-136 | ||||
F-137 | ||||
| | | ||
F-138 | ||||
F-16
F-138 | ||||
F-139 | ||||
F-144 | ||||
F-146 | ||||
F-146 | ||||
F-147 | ||||
F-147 | ||||
Restrictions on subsidiaries transferring funds to the parent | F-148 | |||
F-148 | ||||
F-150 | ||||
F-151 | ||||
F-152 | ||||
F-152 | ||||
F-152 | ||||
F-153 | ||||
F-154 | ||||
F-156 | ||||
F-156 | ||||
F-158 | ||||
F-160 | ||||
F-162 | ||||
THIRD PARTY GUARANTEES, CONTINGENT ASSETS, LIABILITIES, AND OTHER COMMITMENTS | F-166 | |||
F-166 | ||||
F-166 | ||||
F-167 | ||||
F-184 | ||||
F-188 | ||||
F-190 | ||||
F-190 | ||||
F-195 | ||||
F-197 | ||||
F-199 | ||||
APPENDIX 1 DETAILS OF ASSETS AND LIABILITIES IN FOREIGN CURRENCY: | F-201 | |||
APPENDIX 2 ADDITIONAL INFORMATION OFFICIAL BULLETIN No. 715 OF FEBRUARY 3, 2012: | F-203 | |||
APPENDIX 2.1 SUPPLEMENTARY INFORMATION ON TRADE RECEIVABLES: | F-205 | |||
APPENDIX 2.2 ESTIMATED SALES AND PURCHASES OF ENERGY AND CAPACITY: | F-207 | |||
F-208 | ||||
F-17
ENEL AMÉRICAS S.A. AND SUBSIDIARIES
NOTES TO THE CONSOLIDATED FINANCIAL STATEMENTS
AS OF DECEMBER 31, 2020 AND 2019 AND FOR THE YEARS ENDED DECEMBER 31, 2020, 2019 AND 2018.
(In thousands of U.S. dollars – ThUS$)
Enel Américas S.A. (hereinafter “Enel Américas”, the “Company” or the “Parent Company”) and its subsidiaries comprise the Enel Américas Group (hereinafter “the Group”).
The Company is a publicly traded corporation with registered address and head office located at Avenida Santa Rosa, No. 76, in Santiago, Chile. The Company is registered with the securities register of the Financial Market Commission of Chile, hereinafter “CMF”, under number 0175. In addition, the Company is registered with the Securities and Exchange Commission of the United States of America (hereinafter the “U.S. SEC”) and its shares have been listed on the New York Stock Exchange since 1993.
The Company is a subsidiary of Enel S.p.A. (hereinafter “Enel”), an entity that currently owns a 82.3% interest (see Note 40 Subsequent events, iv and v).
The Company was initially incorporated in 1981 under the corporate name Compañía Chilena Metropolitana de Distribución Eléctrica S.A. Subsequently, on August 1, 1988 the Company became Enersis S.A., by means of an amendment to the articles of incorporation. Within the context of the reorganization process carried out by the Group, on March 1, 2016, the Company became Enersis Américas S.A. On December 1, 2016, the corporate name was changed, therefore Enersis Américas S.A. became Enel Américas S.A. For tax purposes, the Company operates under Chilean tax identification number 94.271.000-3.
The Group recorded a staff of 16,731 employees as of December 31, 2020. On average, during the period 2020 the Group had 16,969 employees. For more information regarding the distribution of our employees, by category and geographic location, see Note 36.
The Company’s corporate purpose consists of exploring for, developing, operating, generating, distributing, transmitting, transforming, and/or selling energy of any kind or form, whether in Chile or abroad, either directly or through other companies. It is also engaged in telecommunications activities, and it provides engineering consulting services in Chile and abroad. The Company’s corporate purpose also includes investing in, and managing, its investments in subsidiaries and associates which generate, transmit, distribute, or sell electricity, or whose corporate purpose includes any of the following:
| (i) | Energy of any kind or form, |
| (ii) | Supplying public services, or services whose main component is energy, |
| (iii) | Telecommunications and information technology services, and |
F-18
2. BASIS OF PRESENTATION OF THE CONSOLIDATED FINANCIAL STATEMENTS
| 2.1 | Accounting principles |
The consolidated financial statements of Enel Américas as of December 31, 2020, approved by its Board of Directors at its meeting held on April 29, 2021, have been prepared in accordance with International Financial Reporting Standards (IFRS), as issued by the International Accounting Standards Board (IASB).
These consolidated financial statements present fairly the financial position of Enel Américas and its subsidiaries as of December 31, 2020 and 2019, and the results of operations, changes in equity and cash flows for the years ended December 31, 2020, 2019 and 2018, and the related notes.
These consolidated financial statements have been prepared under going concern assumptions on a historical cost basis except when, in accordance with IFRS, those assets and liabilities are measured at fair value.
Appendix 1 – Detail of Assets and Liabilities in Foreign Currency; Appendix 2 – Additional Information Circular No. 715 of February 2, 2012; Appendix 2.1 – Supplementary Information on Trade Receivables; Appendix 2.2 – Estimated Sales and Purchases of Capacity and Toll and Appendix 3 – Detail of Due Dates of Payments to Suppliers, form an integral part of these consolidated financial statements.
| 2.2 | New accounting pronouncements |
| a) | The following accounting pronouncements have been adopted by the Group effective as of January 1, 2020: |
8 | | |
New Standards and Interpretations |
| Mandatory |
| | |
Conceptual Framework (Revised) | | Annual periods beginning on or after January 1, 2020 |
| | |
| | |
Amendments to IFRS 3: Definition of a Business | | Annual periods beginning on or after January 1, 2020 |
| | |
| | |
Amendments to IAS 1 and IAS 8: Definition of Material or Relative Importance | | Annual periods beginning on or after January 1, 2020 |
| | |
| | |
Amendments to IFRS 9, IAS 39 and IFRS 7: Interest Rate Benchmark Reform (Phase 1) | | Annual periods beginning on or after January 1, 2020 |
| | |
| ● | Conceptual Framework (Revised) |
The IASB issued the Conceptual Framework (Revised) in March 2018. It incorporates some new concepts, provides updated definitions and recognition criteria for assets and liabilities and clarifies certain important matters. Revisions to the Conceptual Framework may affect the application of IFRS when no standard applies to a particular transaction or event.
The IASB has also issued a separate accompanying document, "Amendments to References to the Conceptual Framework in IFRS Standards," which establishes amendments to IFRSs in order to update references to the new Conceptual Framework.
F-19
The Conceptual Framework (Revised), as well as the Amendments to the References to the Conceptual Framework in IFRS, became effective beginning on January 1, 2020, with prospective application, with no impact generated in the Group’s consolidated financial statements.
| ● | Amendments to IFRS 3 Definition of a Business. |
IFRS 3 Business Combinations was amended by the IASB in October 2018, to clarify the definition of a business, in order to help entities determine whether a transaction should be accounted for as a business combination or as the acquisition of an asset. To be considered as a business combination, an acquired integrated set of activities and assets must include, at least, an input and a substantive process that together contribute significantly to the ability to create output.
The amendment also adds guidance and illustrative examples to assess whether a substantive process has been acquired and introduces an optional fair value concentration test.
The amendment became effective beginning on January 1, 2020, with prospective application for business combinations and asset acquisitions carried out beginning on such date, with no impact generated in the consolidated financial statements of the Group.
| ● | Amendments to IAS 1 and IAS 8 Definition of Material or relative importance”. |
In October 2018, the IASB amended IAS 1 Presentation of Financial Statements and IAS 8 Accounting Policies, Changes in Accounting Estimates and Errors, to improve the definition of material and the explanations accompanying the definition. The amendments ensure that the definition of material is consistent in all IFRSs.
Information is material if omitting, misstating or obscuring it could reasonably be expected to influence the decisions that the primary users of general-purpose financial statements make on the basis of those financial statements, which provide financial information about a specific reporting entity.
The amendments became effective beginning on January 1, 2020, with prospective application, with no impact generated in the Group’s consolidated financial statements.
| ● | Amendments to IFRS 9, IAS 39 and IFRS 7 – Interest rate benchmark reform (Phase 1). |
On September 26, 2019, the IASB issued amendments to IFRS 9 Financial Instruments and IAS 39 Financial Instruments: Recognition and Measurement, and IFRS 7 Financial Instruments: Disclosures, in response to the reform that gradually eliminates benchmark interest rates, such as interbank offered rates (IBORs). The amendments provide temporary relief measures which enable hedge accounting to continue during the period of uncertainty before the replacement of an existing interest rate benchmark with an alternative nearly risk-free interest rate (an RFR). These amendments became effective beginning on January 1, 2020.
The amendments to IFRS 9 include a number of relief measures, which apply to all hedging relationships that are directly affected by the interest rate benchmark reform. A hedging relationship is affected if the reform gives rise to uncertainties about the timing and/or amount of benchmark-based cash flows of the hedged item or the hedging instrument.
The first three relief measures provide for:
| - | The assessment of whether a forecasted transaction (or component thereof) is highly probable. |
| - | Assessing when to reclassify the amount in the cash flow hedge reserve to profit and loss. |
| - | The assessment of the economic relationship between the hedged item and the hedging instrument. |
F-20
For each of these relief measures, it is assumed that the benchmark on which the hedged cash flows are based (whether or not contractually specified) and/or, for the third relief measure, the benchmark on which the cash flows of the hedging instrument are based, are not altered as a result of the reform.
A fourth relief measure provides that, for a benchmark component of interest rate risk that is affected by the reform, the requirement that the risk component is separately identifiable need be met only at the inception of the hedging relationship.
The exceptions will continue to be applied indefinitely in the absence of any of the events described in the amendments. Upon the designation of a group of items as a hedged item or a combination of financial instruments, as a hedging instrument, the exceptions will cease being applied separately to each individual item or financial instrument, when there is no longer uncertainty arising from the interest rate benchmark reform.
The application of these amendments has not had an impact on the Group’s consolidated financial statements, as there are currently no hedging relationships that are directly affected by the interest rate benchmark reform.
| b) | Accounting pronouncements applicable beginning on January 1, 2021 and thereafter: |
As of the date of issuance of these consolidated financial statements, the following accounting pronouncements had been issued by the IASB, but their application was not mandatory:
| | |
Amendments and Improvements | | Mandatory |
| | |
Amendments to IFRS 16: COVID-19-Related Rent Concessions | | June 1, 2020 |
| | |
| | |
Amendments to IFRS 9, IAS 39, IFRS 7, IFRS 4 and IFRS 16: Interest Rate Benchmark Reform – Phase 2 | | Annual periods beginning on or after January 1, 2021 |
| | |
| | |
Amendments to IFRS 3: References to the Conceptual Framework | | Annual periods beginning on or after January 1, 2022 |
| | |
| | |
Amendments to IAS 16: Proceeds before Intended Use | | Annual periods beginning on or after January 1, 2022 |
| | |
| | |
Amendments to IAS 37: Onerous Contracts – Cost of Fulfilling a Contract | | Annual periods beginning on or after January 1, 2022 |
| | |
| | |
Annual improvements to IFRS: 2018-2020 Cycle | | Annual periods beginning on or after January 1, 2022 |
| | |
| | |
Amendments to IAS 1: Classification of Liabilities as Current or Non-current | | Annual periods beginning on or after January 1, 2023 |
| | |
F-21
| > | Amendments to IFRS 16: “COVID-19-Related Rent Concessions” |
As a result of the COVID-19 pandemic, lessees in many countries have been granted rent payment concessions, such as grace periods and delaying of lease payments for a period of time, sometimes followed by an increase in the payment in future periods. Within this context, on May 28, 2020, the IASB issued amendments to IFRS 16: Leases, in order to provide a practical expedient for lessees, through which they can opt for not evaluating whether the rent concessions are a modification of the lease. Lessees that elect this option, will account for such rent concessions as a variable payment.
The practical expedient is only applicable to rent concessions that occur as a direct consequence of the COVID-19 pandemic and only if they comply with all the following conditions:
| i) | the change in lease payments is the product of a revised lease payment that is substantially the same, or less than the lease payment immediately before the change; |
| ii) | any reduction in lease payments affects only the payments originally due up to June 30, 2021; and |
| iii) | there is no substantial change in the other terms and conditions of the lease. |
The amendments are applicable to annual periods beginning on June 1, 2020. Early application is permitted. These amendments must be applied retroactively, recognizing the accumulated effect from initial application as an adjustment in the beginning balance of retained earnings (or other equity component, as applicable) at the beginning of the annual period in which the amendment is applied for the first time.
Management believes that the application of these improvements will not generate an impact on the consolidated financial statements of the Group.
| > | Amendments to IFRS 9, IAS 39, IFRS 7, IFRS 4 and IFRS 16: Interest Rate Benchmark Reform (Phase 2) |
On August 27, 2020, the IASB issued the Interest Rate Benchmark Reform (Phase 2) which supplements the amendments to IFRS 9, IAS 39 and IFRS 7 issued in 2019, and additionally incorporates amendments to IFRS 4 and IFRS 16. This final phase of the project focuses on the effects on the financial statements when a company replaces the previous interest rate benchmark with an alternative interest rate benchmark as a result of the reform.
The amendments refer to:
| - | Changes in contractual cash flows: a company will not have to derecognize accounts or adjust the carrying amounts of financial instruments due to changes required by the reform, but rather will update the effective interest rate to reflect the change in the alternative interest rate benchmark; |
| - | Hedge accounting: a company will not have to discontinue its hedge accounting solely because it makes the changes required by the reform, if the hedge complies with other hedge accounting criteria; and |
Disclosures: a company will be required to disclose information about new risks that arise from the reform and how it manages the transition to alternative interest rate benchmarks.
These amendments are effective for annual periods beginning on January 1, 2021, and early adoption is permitted. The amendments are applicable retroactively, with certain exceptions. The application of these amendments had no impact on the consolidated financial statements of Enel Américas and its subsidiaries. However, the Group intends to use the practical solutions provided in Phase 2 in future periods, when the
F-22
replacement of the current reference rates in the contracts of non-derivative financial instruments and derivative instruments affected by the reform is completed.
In this context, the Group is carrying out an IBOR transition project, which is at the stage of determining the scope in terms of the number and nominal value of the affected contracts, mainly debt contracts and derivative instruments, in order to move towards the stage of impact analysis, determination of fallback rates for new operations and contract modifications. The contractual modifications will begin to be implemented gradually towards the end of 2021, although this may vary depending on the evolution of reforms in connection with the determination of risk-free alternative reference interest rates, associated with market liquidity.
The Group has evaluated the impact of the uncertainty generated by the reforms its current hedging relationships, with respect to both hedging instruments and hedged items, and has determine that as of December 31, 2020 there are no hedging relationships directly affected by the reform of benchmark interest rates.
| > | Amendments to IFRS 3: "References to the Conceptual Framework". |
On May 14, 2020, the IASB issued a package of limited-scope amendments, including amendments to IFRS 3: Business Combinations. The amendments update references to the Conceptual Framework issued in 2018, in order to determine an asset or a liability in a business combination. In addition, the IASB added a new exception to IFRS 3 for liabilities and contingent liabilities, which specifies that, for certain types of liabilities and contingent liabilities, an entity that applies IFRS 3 must refer to IAS 37 “Provisions, Contingent Liabilities and Contingent Assets”, or IFRIC 21: “Levies”, instead of the 2018 Conceptual Framework. Without this exception, an entity would have recognized certain liabilities in a business combination that would not be recognized in accordance with IAS 37.
The amendments are applicable prospectively to business combinations with acquisition dates beginning on the first annual period beginning on January 1, 2022. Early application is permitted.
Management is evaluating the potential impact of the application of these amendments on the Group’s consolidated financial statements.
| > | Amendments to IAS 16: “Proceeds before Intended Use” |
As part of the package of limited-scope amendments issued in May 2020, the IASB issued amendments to IAS 16 Property, Plant and Equipment, which prohibit a company from deducting from the cost of property, plant and equipment amounts received from selling items produced while the company is preparing the asset for its intended use. Instead, the company will recognize such sales proceeds and related costs in profit or loss for the period. The amendments also clarify that an entity is “testing whether an asset operates correctly” when it evaluates the technical and physical performance of the asset.
These amendments are applicable to annual reporting periods beginning on January 1, 2022. Early application is permitted. The amendments will be applied retroactively, but only from the beginning of the first period presented in the financial statements in which the entity applies the amendments for the first time. The accumulated effect of initial application of the amendments will be recognized as an adjustment to the opening balance of retained earnings (or other equity components as applicable) at the beginning of the first reported period.
Management is evaluating the potential impact of the application of these amendments on the Group’s consolidated financial statements.
| > | Amendments to IAS 37: “Onerous Contracts: Cost of Fulfilling a Contract” |
The third standard amended by the IASB in the package of limited-scope amendments issued in May 2020 was IAS 37 Provisions, Contingent Liabilities and Contingent Assets. The amendments specify which costs a company should include when evaluating whether a contract is onerous. In this sense, the amendments clarify
F-23
that the direct cost of fulfilling a contract comprises both the incremental costs of fulfilling this contract (for example, direct labor and materials), as well as the allocation of other costs that are directly related to compliance with the contracts (for example, an allocation of the depreciation charge for an item of property, plant and equipment used to fulfill the contract).
These amendments are applicable for reported annual periods beginning as of January 1, 2022. Early application is allowed. Companies must apply these amendments to contracts for which all obligations have still not been fulfilled at the beginning of the reported annual period in which the amendments are applied for the first time. They do not require restatement of comparative information. The accumulated effect of initially applying the amendments will be recognized as an adjustment to the opening balance of retained earnings (or another equity component as applicable) on the date of initial application.
Management is evaluating the potential impact of the application of these amendments on the Group’s consolidated financial statements.
| > | Annual Improvements to IFRS: 2018-2020 Cycle |
On May 14, 2020, the IASB issued a number of minor amendments to IFRSs, in order to clarify or correct minor issues or overcome possible inconsistencies in the requirements of certain standards. The amendments with potential impact on the Group are the following:
| • | IFRS 9 Financial Instruments: clarifies that for the purpose of the 10% test for derecognition of financial liabilities, when determining commissions paid net of commissions received, the borrower must only consider the commissions paid or received between the borrower and the lender. |
These improvements are applicable to reported annual periods beginning on January 1, 2022. Early application is allowed. Entities must apply these amendments to financial liabilities that are modified or exchanged at the beginning of the reported annual period, in which the amendments are applied for the first time.
| • | Examples that accompany IFRS 16 Leases: amendment of illustrative example 13, in order to eliminate a possible confusion regarding the treatment of lease incentives. The example included as part of its background information, a reimbursement from the lessor to the lessee, related to leasehold improvements. Since the example was not sufficiently clear as to whether the reimbursement complied with the definition of a lease incentive, the IASB decided to eliminate from the illustrative example any reference to this reimbursement, thus avoiding any possibility of confusion. |
Management believes that the application of these improvements will not generate an impact on the consolidated financial statements of the Group.
| > | Amendments to IAS 1: “Classification of Liabilities as Current and Non-Current” |
On January 23, 2020, the IASB issued limited-scope amendments to IAS 1: Presentation of Financial Statements, in order to clarify how to classify debt and other liabilities as current or non-current. The amendments clarify that a liability is classified as non-current if the entity has, at the end of the reporting period, the substantial right to defer settlement of the liability during at least 12 months. The classification is not affected by the expectations of the entity or by events after the reporting date. The amendments include clarification of the classification requirements for debt that a company could settle converting it to equity.
The amendments only affect the presentation of liabilities as current and non-current in the statement of financial position, not the amount and timing of their recognition, or the related disclosures. However, they could lead to companies reclassifying certain current liabilities to non-current and vice versa. This could affect compliance with covenants in the debt agreements of companies.
F-24
These amendments are applicable retroactively beginning on January 1, 2023. In response to the COVID-19 pandemic, in July 2020 the IASB extended its mandatory effective date established initially for January 1, 2022, by a year in order to provide companies more time to implement any change in classification resulting from these amendments. Early application is permitted.
Management is evaluating the potential impact of the application of these amendments on the Group’s consolidated financial statements.
| 2.3 | Responsibility for the information, judgments and estimates provided |
The Company’s Board of Directors is responsible for the information contained in these consolidated financial statements and expressly states that all IFRS principles and standards have been fully implemented.
In preparing the consolidated financial statements, certain judgments and estimates made by the Group’s management have been used to quantify some of the assets, liabilities, revenue, expenses and commitments recognized.
The most significant areas where critical judgment was required are:
| - | In a service concession agreement, determination of whether a grantor controls or regulates what services the operator must provide, to whom and at what price, are critical factors for the application of IFRIC 12 Service Concession Arrangements (see Note 3.d.1). |
| - | The identification of Cash Generating Units (CGU) for impairment testing (see Note 3.e). |
| - | The hierarchy of information used to measure assets and liabilities at fair value (see Note 3.h). |
| - | The determination of the Group’s functional currency (see Note 2.8). |
| - | Application of the revenue recognition model in accordance with IFRS 15 (see Note 3.q). |
| - | The estimates refer basically to: |
| - | The valuations performed to determine the existence of impairment losses in assets and goodwill (see Note 3.e). |
| - | The assumptions used to calculate the actuarial liabilities and obligations with employees, such as discount rates, mortality tables, salary increases, etc. (see Notes 3.m.1 and 26). |
| - | The useful lives of property, plant and equipment and intangible assets (see Notes 3.a and 3.d). |
| - | The assumptions used to calculate the fair value of financial instruments (see Notes 3.h and 23). |
| - | The energy supplied to customer whose meters have not yet been read (see Note 3.q). |
| - | Certain assumptions inherent in the electricity system affecting transactions with other companies, such as production, customer billings, energy consumption, that allow for estimation of electricity system settlements that occur on the corresponding final settlement dates, but that are pending as of the date of issuance of the consolidated financial statements and could affect the balances of assets, liabilities, income and expenses recognized in the financial statements (see Appendix 2.2). |
| - | The probability that uncertain or contingent liabilities will be incurred and their related amounts (see Note 3.m). |
| - | Future disbursements for closure of facilities and restoration of land, as well as associated discount rates to be used (see Note 3.a). |
| - | The tax results of the different Group subsidiaries that will be reported to the respective tax authorities in the future, and other estimates have been used as a basis for recording the different income tax related balances in these consolidated financial statements (see Note 3.p). |
| - | The fair value of assets acquired, and liabilities assumed, and any pre-existing interest in an entity acquired in a business combination. |
| - | Determination of expected credit losses on financial assets (see Note 3.g.3). |
| - | Determination of the lease term of contracts with renewal options, as well as the rates to be used to discount lease payments (see Note 3.f). |
In relation to the COVID-19 pandemic, the degree of uncertainty generated in the macroeconomic and financial environment in which the Group operates, could affect the valuations and estimates made by Management to determine the carrying amounts of the more volatile assets and liabilities. As of December 31, 2020, according to the information available and considering a scenario in constant evolution, the main areas that required Management to use their judgment and make estimates were the following: i) measurement of expected credit losses on financial assets; ii) determination of impairment losses on non-financial assets; and iii) measurement of employee benefits, including actuarial assumptions.
Although these judgments and estimates have been based on the best information available as of the date of issuance of these consolidated financial statements, future events may occur that would require a change (increase or decrease) to these judgments and estimates in subsequent periods. This change would be made prospectively, recognizing the effects of this change in judgment or estimation in the related future consolidated financial statements.
| 2.4 | Subsidiaries |
Subsidiaries are defined as those entities controlled either, directly or indirectly by Enel Américas. Control is exercised if and only if the following conditions are met: the Company has i) power over the subsidiary; ii) exposure, or rights to variable returns from these entities; and iii) the ability to use its power to influence the amount of these returns.
Enel Américas has power over its subsidiaries when it holds the majority of the substantive voting rights or, should that not be the case, when it has rights granting the practical ability to direct the entities’ relevant activities; i.e., the activities that significantly affect the returns from the subsidiary.
The Group will reassess whether or not it controls a subsidiary if facts and circumstances indicate that there are changes to one or more of the control elements listed above.
Subsidiaries are consolidated as described in Note 2.7.
F-26
The entities in which the Group has the ability to exercise control and consequently are included in consolidation in these consolidated financial statements are detailed below:
| | | | | | | | | | | | | |
| | | | | | Functional | | % Ownership as of | % Ownership as of | ||||
Taxpayer ID No. |
| Company |
| Country | | Currency |
| Direct | Indirect | Total | Direct | Indirect | Total |
| | | | | | | | | | | | | |
Foreign | | Enel Distribución Río S.A. | | Brazil | | Brazilian real | | - | 99.73% | 99.73% | - | 99.73% | 99.73% |
Foreign | | EGP Cachoeira Dourada S.A. | | Brazil | | Brazilian real | | - | 99.75% | 99.75% | - | 99.75% | 99.75% |
Foreign | | Enel Generación Fortaleza S.A. | | Brazil | | Brazilian real | | - | 100.00% | 100.00% | - | 100.00% | 100.00% |
Foreign | | Enel Cien S.A. | | Brazil | | Brazilian real | | - | 100.00% | 100.00% | - | 100.00% | 100.00% |
Foreign | | Enel Distribución Ceará S.A. | | Brazil | | Brazilian real | | - | 74.05% | 74.05% | - | 74.05% | 74.05% |
Foreign | | Enel Brasil S.A. | | Brazil | | Brazilian real | | 100.00% | - | 100.00% | 100.00% | - | 100.00% |
Foreign | | Enel X Brasil S.A. | | Brazil | | Brazilian real | | - | 100.00% | 100.00% | - | 100.00% | 100.00% |
Foreign | | Enel Distribución Goias S.A. | | Brazil | | Brazilian real | | - | 99.96% | 99.96% | - | 99.93% | 99.93% |
Foreign | | Enel Distribución Sao Paulo S.A. | | Brazil | | Brazilian real | | - | 100.00% | 100.00% | - | 100.00% | 100.00% |
Foreign | | Enel Green Power Proyectos I (Volta Grande) | | Brazil | | Brazilian real | | - | 100.00% | 100.00% | - | 100.00% | 100.00% |
Foreign | | Luz de Angra Energía S.A. | | Brazil | | Brazilian real | | - | 51.00% | 51.00% | - | - | - |
Foreign | | Central Generadora Fotovoltaica Sao Francisco Ltda. | | Brazil | | Brazilian real | | - | 100.00% | 100.00% | - | 100.00% | 100.00% |
Foreign | | Enel Tecnología de Redes S.A. | | Brazil | | Brazilian real | | - | 100.00% | 100.00% | - | 100.00% | 100.00% |
Foreign | | Enel Trading Brasil S.A. | | Brazil | | Brazilian real | | - | 100.00% | 100.00% | - | 100.00% | 100.00% |
Foreign | | Enel Uruguay S.A. (1) | | Uruguay | | American Dollar | | - | 100.00% | 100.00% | - | 100.00% | 100.00% |
Foreign | | Central Dock Sud S.A. | | Argentina | | Argentine Peso | | - | 70.24% | 70.24% | - | 70.24% | 70.24% |
Foreign | | Compañía de Transmisión del Mercosur S.A. - CTM | | Argentina | | Argentine Peso | | - | 100.00% | 100.00% | - | 100.00% | 100.00% |
Foreign | | Distrilec Inversora S.A. | | Argentina | | Argentine Peso | | 51.50% | - | 51.50% | 51.50% | - | 51.50% |
Foreign | | Empresa Distribuidora Sur S.A. - Edesur | | Argentina | | Argentine Peso | | - | 99.45% | 99.45% | - | 99.45% | 99.45% |
Foreign | | Enel Argentina S.A. | | Argentina | | Argentine Peso | | 99.92% | - | 99.92% | 99.92% | - | 99.92% |
Foreign | | Enel Trading Argentina S.R.L. | | Argentina | | Argentine Peso | | 55.00% | 45.00% | 100.00% | 55.00% | 45.00% | 100.00% |
Foreign | | Enel Generación Costanera S.A. | | Argentina | | Argentine Peso | | - | 75.68% | 75.68% | - | 75.68% | 75.68% |
Foreign | | Enel Generación El Chocón S.A. | | Argentina | | Argentine Peso | | - | 67.67% | 67.67% | - | 67.67% | 67.67% |
Foreign | | Hidroinvest S.A. | | Argentina | | Argentine Peso | | 41.94% | 54.76% | 96.70% | 41.94% | 54.76% | 96.70% |
Foreign | | Inversora Dock Sud S.A. | | Argentina | | Argentine Peso | | 57.14% | - | 57.14% | 57.14% | - | 57.14% |
Foreign | | Transportadora de Energía S.A. - TESA | | Argentina | | Argentine Peso | | - | 100.00% | 100.00% | - | 100.00% | 100.00% |
Foreign | | Compañía Distribuidora y Comercializadora de Energía S.A. - Codensa | | Colombia | | Colombian Peso | | 48.30% | - | 48.30% | 48.30% | - | 48.30% |
Foreign | | Emgesa S.A. E.S.P. | | Colombia | | Colombian Peso | | 48.48% | - | 48.48% | 48.48% | - | 48.48% |
Foreign | | Inversora Codensa S.A.S. | | Colombia | | Colombian Peso | | - | 100.00% | 100.00% | - | 100.00% | 100.00% |
Foreign | | Sociedad Portuaria Central Cartagena S.A. | | Colombia | | Colombian Peso | | - | 99.99% | 99.99% | - | 99.99% | 99.99% |
Foreign | | Enel X Colombia S.A.S | | Colombia | | Colombian Peso | | - | 100.00% | 100.00% | - | 100.00% | 100.00% |
Foreign | | Bogotá ZE S.A.S. | | Colombia | | Colombian Peso | | - | 100.00% | 100.00% | - | - | - |
Foreign | | Enel Perú S.A.C. | | Peru | | Peruvian Sol | | 100.00% | - | 100.00% | 100.00% | - | 100.00% |
Foreign | | Chinango S.A.C. | | Peru | | Peruvian Sol | | - | 80.00% | 80.00% | - | 80.00% | 80.00% |
Foreign | | Enel Generación Perú S.A.A. | | Peru | | Peruvian Sol | | - | 83.60% | 83.60% | - | 83.60% | 83.60% |
Foreign | | Enel Distribución Perú S.A.A. | | Peru | | Peruvian Sol | | - | 83.15% | 83.15% | - | 83.15% | 83.15% |
Foreign | | Enel Generación Piura S.A. | | Peru | | Peruvian Sol | | - | 96.50% | 96.50% | - | 96.50% | 96.50% |
Foreign | | Enel X Perú S.A.C. | | Peru | | Peruvian Sol | | - | 99.99% | 99.99% | - | 99.99% | 99.99% |
Foreign | | Compañía Energética Veracruz S.A.C. | | Peru | | Peruvian Sol | | - | 100.00% | 100.00% | - | 100.00% | 100.00% |
(1)Nuxer Trading S.A. changed its name in 2020 to Enel Uruguay S.A.
2020
| - | On September 22, 2020, the Company’s subsidiary Enel X Brasil S.A. acquired 51% of the share capital of Luz de Angra Energía S.A., whose corporate purpose is to perform works and services related to public lighting and signage in streets, ports and airports. |
| - | On October 22, 2020, Bogotá ZE SAS was incorporated, which is 100% owned by the Company’s subsidiary Enel X Colombia S.A.S. The new company is engaged in performing any acts related to sustainable electromobility in Colombia and abroad. |
2019
| - | The Company’s subsidiary Enel X Perú S.A.C was incorporated in the first quarter of 2019. This subsidiary, among others, is engaged in the development, implementation and sale of products and services related to energy that incorporate innovation, state-of-the-art technology and trends of the future, other than the electricity distribution under concession and the related services. |
| - | The company Enel Tecnología de Redes S.A. was incorporated in September 2019. This company is 100% owned by Enel Brasil S.A., and is engaged in the planning, development and execution of energy generation, distribution, transmission and/or commercialization, as well as the marketing of equipment intended for energy distribution, measurement and control. |
F-27
| ● | In October of 2019, Enel Trading Brasil S.A. was included in the Group's consolidation. This company is 100% owned by Enel Brasil S.A., and is engaged in the performance of wholesale and retail activities involving energy and other unspecified products, import and export, management activities, such as those associated with products and related services, as well as holding ownership interests in other companies. |
| ● | On November 6, 2019, Enel Brasil Investimento Sudeste S.A. was acquired by Enel Distribución Sao Paulo S.A., where the latter became the legal successor company. |
| ● | On November 27, 2019, within the framework of the public tender offer for the acquisition of shares in the Company’s subsidiary Enel Distribución Sao Paulo S.A., the market was informed that the Company’s subsidiary Enel Brasil S.A acquired 2,959,302 shares, equivalent to 1.5% of the total shares of this company, for BRL146.2 million (approximately US$ 35.2 million). Subsequently, on December 5, 2019, Enel Distribución Sao Paulo S.A. redeemed the remaining 5,174,050 shares, representing 2.62% of total shares, by paying BRL256 million (approximately US $ 62 million). Through these transactions, Enel Brasil S.A. obtained the control of 100% of the shares of Enel Distribución Sao Paulo S.A. |
Although the Group has an interest of less than 50% in Codensa S.A. E.S.P. and Emgesa S.A. E.S.P. in Colombia, representing 48.3% and 48.48%, respectively, these companies are considered to be “subsidiaries” since Enel Américas exercises control over them by virtue of a shareholders’ agreement or as a result of its share structure, composition and classes. In this respect Enel Américas has 57.15% and 56.43% of the voting shares of Codensa S.A. E.S.P., and Emgesa S.A. E.S.P., respectively.
| 2.5 | Investments in associates |
Associates are those entities over which Enel Américas, either directly or indirectly, exercises significant influence.
Significant influence is the power to participate in the decisions related to the financial and operating policy of the associate but without having control or joint control over those policies. In assessing significant influence, the Group takes into account the existence and effect of currently exercisable voting rights or convertible rights at the end of each reporting period, including currently exercisable voting rights held by the Company or other entities. In general, significant influence is presumed to be present in those cases in which the Group has more than 20% of the voting power of the investee.
Associates are accounted for in the consolidated financial statements using the equity method of accounting as described in Note 3.i.
The detail of the companies that qualify as associates is the following:
| | | | | | | | | |
| | | Functional | % Ownership as of | % Ownership as of | ||||
Taxpayer ID No. | Associates and Joint Ventures | Country | Currency | Direct | Indirect | Total | Direct | Indirect | Total |
Foreign | Sacme S.A. | Argentina | Argentine peso | — | 50.00% | 50.00% | — | 50.00% | 50.00% |
Foreign | Yacylec S.A | Argentina | Argentine peso | 33.33% | — | 33.33% | 33.33% | — | 33.33% |
Foreign | Central Térmica Manuel Belgrano (*) | Argentina | Argentine peso | — | 0.00% | 0.00% | — | 25.60% | 25.60% |
Foreign | Central Térmica San Martin (*) | Argentina | Argentine peso | — | 0.00% | 0.00% | — | 25.60% | 25.60% |
Foreign | Central Vuelta Obligado S.A. | Argentina | Argentine peso | — | 40.90% | 40.90% | — | 40.90% | 40.90% |
(*) See Note 14.1
F-28
| 2.6 | Joint arrangements |
Joint arrangements are defined as those entities in which the Group exercises control under an agreement with other shareholders and jointly with them, i.e., when decisions on the entities’ relevant activities require the unanimous consent of the parties sharing control.
Depending on the rights and obligations of the participants, joint agreements are classified as:
| - | Joint venture: an agreement whereby the parties exercising joint control have rights to the entity’s net assets. Joint ventures are included in the consolidated financial statements using the equity method of accounting, as described in Note 3.i. |
| - | Joint operation: an agreement whereby the parties exercising joint control have rights to the assets and obligations with respect to the liabilities relating to the arrangement. Joint operations are included in the consolidated financial statements recognizing the proportional interest in the assets and liabilities impacted by such operation. |
In determining the type of joint arrangement in which it is involved, the Group’s Management assesses its rights and obligations arising from the arrangement by considering the structure and legal form of the arrangement, the terms agreed by the parties in the contractual arrangement and, when relevant, other facts and circumstances. If facts and circumstances change, the Group reassesses whether the type of joint arrangement in which it is involved has changed.
Currently, the Company is not involved in any joint arrangement that qualifies as a joint operation..
| 2.7 | Basis of consolidation and business combinations |
The subsidiaries are consolidated and all their assets, liabilities, revenues, expenses, and cash flows are included in the consolidated financial statements once the adjustments and eliminations of intra-group transactions have been made.
The comprehensive income from subsidiaries is included in the consolidated statement of comprehensive income from the date when the parent company obtains control of the subsidiary until the date on which it loses control of the subsidiary.
The Group records its business combinations using the acquisition method when the set of activities and assets acquired meet the definition of a business, and control is transferred to the Group. To be considered a business, a set of activities and assets acquired must include, as a minimum, an input and a substantive process applied to it which, as a whole, significantly contribute to the capacity to create products. IFRS 3 offers the option to apply a “concentration test” as a simplified evaluation of whether or not an acquired set of activities and assets is a business. The concentration test is positive if substantially all of the fair value of the gross assets acquired is concentrated in a single identifiable asset or group of similar identifiable assets.
The operations of the Parent company and its subsidiaries have been consolidated under the following basic principles:
| 1. | At the date the parent obtains control, the subsidiary’s assets acquired, and its liabilities assumed are recorded at fair value, except for certain assets and liabilities that are recorded using valuation principles established in other IFRS standards. If the fair value of the consideration transferred plus the fair value of any non-controlling interests exceeds the fair value of the net assets acquired, this difference is recorded as goodwill. In the case of a bargain purchase, the resulting gain is recognized in profit or loss after reassessing whether all of the assets acquired and the liabilities assumed have been properly identified and following a review of the procedures used to measure the fair value of these amounts. |
F-29
For each business combination, IFRS allow valuation of the non-controlling interests in the acquiree on the date of acquisition: i) at fair value; or ii) for the proportional ownership of the identifiable net assets of the acquiree, with the latter being the methodology that the Group has systematically applied to its business combinations.
If the fair value of all assets acquired and liabilities assumed at the acquisition date has not been completed, the Group reports the provisional values accounted for in the business combination. During the measurement period, which shall not exceed one year from the acquisition date, the provisional values recognized will be adjusted retrospectively as if the accounting for the business combination had been completed at the acquisition date, and also additional assets or liabilities will be recognized to reflect new information obtained about events and circumstances that existed on the acquisition date, but which were unknown to Management at that time. Comparative information for prior periods presented in the financial statements is revised as needed, including making any change in depreciation, amortization or other income effects recognized in completing the initial accounting.
For business combinations achieved in stages, the Company measures at fair value the participation previously held in the equity of the acquiree on the date of acquisition and the resulting gain or loss, if any, is recognized in profit or loss of the period.
| 2. | Non-controlling interests in equity and in the comprehensive income of the consolidated subsidiaries are presented, respectively, under the line items “Total Equity: Non-controlling interests” in the consolidated statement of financial position and “Profit (loss) attributable to non-controlling interests” and “Comprehensive income attributable to non-controlling interests” in the consolidated statement of comprehensive income. |
| 3. | Balances and transactions between consolidated companies have been fully eliminated on consolidation. |
| 4. | Changes in the ownership interests in subsidiaries that do not result in the Group obtaining or losing control are recognized as equity transactions. The carrying amounts of the controlling and non-controlling interests are adjusted to reflect the changes in their relative interests in the subsidiaries. Any difference between the amount by which the non-controlling interests are adjusted and the fair value of the consideration paid or received is recognized directly in equity attributable to shareholders of the Parent. |
| 5. | Business combinations under common control are accounted for using the “pooling of interest” method. Under this method, the assets and liabilities involved in the transaction remain reflected at the same carrying amounts at which they were recorded in the ultimate parent company, although subsequent accounting adjustments may be needed to align the accounting policies of the companies involved. The Group does not apply a retrospective item of business combinations under common control. |
Any difference between assets and liabilities contributed to the consolidation and the consideration paid is recorded directly in equity, as a debit or credit to “Other reserves.”
| 2.8 | Functional Currency |
The functional currency of Enel Américas is the United States Dollar (US$), as is the presentation currency of the Group's consolidated financial statements.
The functional currency has been determined, considering the economic environment in which the Company operates. This conclusion is based on the fact that the US$ is the currency that fundamentally influences its
F-30
financing, capital issuance and cash and cash equivalent activities. Accordingly, the US$ reflects the underlying transactions, events and conditions for Enel Américas.
Any information presented in US$ has been rounded to the closest thousand (ThUS$) or million (MUS$), unless indicated otherwise.
| 2.9 | Conversion of financial statements denominated in foreign currency |
Conversion of the financial statements of the Group companies that have functional currencies different than US$, and do not operate in hyperinflationary economies, is carried out as follows:
a.Assets and liabilities, using the exchange rate prevailing at the closing date of the financial statements.
b.Comprehensive income statements using the average exchange rate for the period (unless this average is not a reasonable approximation of the cumulative effect of the exchange rate existing on the transaction dates, in which case the exchange rate on the date of each transaction is used).
c.Equity is maintained at the historical exchange rate on the date of its acquisition or contribution, and at the average exchange rate as of the date of generation for retained earnings.
d.Foreign currency translation differences generated in the conversion of the financial statements are recorded under “Foreign currency translation gains (losses)” in the consolidated comprehensive income statement: Other comprehensive income (see Note 27.2).
The financial statements of subsidiaries whose functional currency is that of a hyperinflationary economy, are first adjusted for inflation, recording any gain or loss in the net monetary position in profit or loss. Subsequently, all items (assets, liabilities, equity items, expenses and revenue) are converted at the exchange rate prevailing at the closing date of the most recent statement of financial position.
Argentine Hyperinflation
Beginning on July 2018, the Argentine economy has been considered to be hyperinflationary in accordance with the criteria established in IAS 29 “Financial Reporting in Hyperinflationary Economies”. This determination was made on the basis of a number of qualitative and quantitative criteria, especially the presence of accumulated inflation in excess of 100% during the three previous years.
In accordance with IAS 29, the financial statements of investees in Argentina have been restated retrospectively, applying the general price index at historical cost, in order to reflect changes in the purchasing power of the Argentine peso, as of the closing date of these financial statements.
Non-monetary assets and liabilities were restated from February 2003, the last date on which an inflation adjustment was applied for accounting purposes in Argentina. Within this context, note that the Group carried out its transition to IFRS on January 1, 2004, and applied the deemed cost exception to property, plant and equipment.
For consolidation purposes in Enel Américas and as a result of the application of IAS 29, the results of our subsidiaries in Argentina were converted at the prevailing period-closing exchange rate (ARS/US$), in accordance with IAS 21 “Effects of Changes in Foreign Exchange Rates”, when dealing with a hyperinflationary economy. Previously, the profit or loss of Argentine subsidiaries were converted using the average exchange rate for the period, as used for the other subsidiaries operating in other countries whose economies are not considered to be hyperinflationary.
F-31
The general price indexes used at the end of the reporting periods are as follows:
| |
| General price index |
From January to December 2018 | 47.84% |
From January to December 2019 | 53.64% |
From January to December 2020 | 36.13% |
The first-time application of IAS 29 led to a positive adjustment in the retained earnings of Enel Américas, of ThUS$ 961,107 (net of taxes) as of January 1, 2018, of which ThUS$ 668,693 were attributable to the shareholders of Enel Américas. The effects of the application of this standard on these consolidated financial statements are detailed in Note 33.
Exchange rates
The exchange rates used to convert the financial statements of the different foreign subsidiaries are detailed as follows (local currency versus the US$):
| | | | | |
| 12-31-2020 | 12-31-2019 | 12-31-2018 | ||
Currency | Closing Date | Mid Average | Closing Date | Mid Average | Mid Average |
Argentine peso | 84.15 | 84.07 | 59.89 | 59.88 | 37.67 |
Brazilian real | 5.20 | 5.16 | 4.03 | 3.94 | 3.65 |
Peruvian sol | 3.62 | 3.50 | 3.32 | 3.34 | 3.28 |
Colombian peso | 3,432.50 | 3,693.52 | 3,277.14 | 3,281.39 | 2,952.39 |
The main accounting policies used in preparing the accompanying consolidated financial statements are the following:
a) |
Property, plant and equipment are generally measured at acquisition cost, net of accumulated depreciation and any impairment losses experienced. In addition to the price paid to acquire each item, the cost also includes, the following concepts, where applicable:
| ● | Finance costs accrued during the construction period that are directly attributable to the acquisition, construction, or production of qualifying assets, which require a substantial period of time before being ready for use such as; e.g., electricity generation or distribution facilities. The Group defines “substantial period” as a period exceeding twelve months. The interest rate used is that of the specific financing or, if none exists, the weighted average financing rate of the company making the investment (see Note 17.b.1). |
| ● | Employee expenses directly related to construction in progress (see Note 17.b.2). |
| ● | Future disbursements that the Group will have to make to close its facilities are added to the value of the asset at fair value, recognizing the related provision for dismantling or restoration. The Group reviews its estimate of these future disbursements on an annual basis, increasing or decreasing the value of the asset based on the results of this estimate (see Note 25). |
Assets under construction are transferred to operating assets once the testing period has been completed and they are available for use, at which time depreciation begins.
Expansion, modernization or improvement costs that represent an increase in productivity, capacity or efficiency, or a longer useful life are capitalized as an increase in the cost of the related assets.
F-32
The replacement or overhaul of entire components that increase the asset’s useful life or economic capacity are recorded as an increase in cost of the related assets, derecognizing the replaced or overhauled components.
Expenditures for periodic maintenance and repair are recognized directly as an expense for the year in which they are incurred.
Property, plant and equipment, net of its residual value, is depreciated by distributing the cost of the different items that comprise it on a straight-line basis over its estimated useful life, which is the period during which the Group expects to use the assets. Useful life estimates and residual values are reviewed on an annual basis and if appropriate adjusted prospectively.
In addition, the Group recognizes right-of-use assets for leases relating to property, plant and equipment in accordance with the criterion established in Note 3.f.
The following are the main categories of property, plant and equipment with their related estimated useful lives:
| | |
Classes of property, plant and equipment | | Years of estimated useful life |
Buildings | | 10 – 85 |
Plant and equipment | | 10 – 85 |
IT equipment | | 3 – 15 |
Fixtures and fittings | | 3 – 75 |
Motor vehicles | | 5 – 20 |
In addition, for further information, the following is a more detailed breakdown of the class plant and equipment class:
| | |
Classes of property, plant and equipment |
| Years of estimated useful life |
Generating plant and equipment: | | |
Hydroelectric plants | | |
Civil engineering works | | 10 – 85 |
Electromechanical equipment | | 10 – 60 |
Coal/Fuel power plants | | 10 – 40 |
Combined cycle power plants | | 10 – 50 |
Distribution plant and equipment: | | |
High-voltage network | | 15 – 50 |
Low- and medium-voltage network | | 30 – 50 |
Measuring and remote control equipment | | 10 – 30 |
Primary substations | | 20 – 40 |
Land is not depreciated since it has an indefinite useful life, unless it relates to a right-of-use asset in which case it is depreciated over the term of the lease.
F-33
Regarding the administrative concessions held by the Group’s electric companies, the following table lists the remaining periods until expiration of the concessions that do not have an indefinite term:
| | | | |
Concession holder and operator | Country | Year concession | Concession | Remaining |
Empresa Distribuidora Sur S.A. - Edesur (Distribution) | Argentina | 1992 | 95 years | 67 years |
Enel Generación El Chocón S.A. (Generation) (*) | Argentina | 1993 | 30 years | 3 years |
Transportadora de Energía S.A. (Transmission) | Argentina | 2002 | 85 years | 67 years |
Compañía de Transmisión del Mercosur S.A. (Transmission) | Argentina | 2000 | 87 years | 67 years |
EGP Cachoeira Dourada S.A. (Generation) | Brazil | 1997 | 30 years | 7 years |
Enel Generación Fortaleza S.A (Generation) | Brazil | 2001 | 30 years | 11 years |
Enel CIEN S.A. (Garabi I) (Transmission) (**) | Brazil | 2000 | 22 years | 1,6 years |
Enel CIEN S.A. (Garabi II) (Transmission) (**) | Brazil | 2002 | 20 years | 1,6 years |
(*) The Chocón Complex Concession Contract (Chocón and Arroyito plants) expires on August 11, 2023. This contract does not foresee any extension or new call for proposals, but rather the restitution to the licensor (Argentine State). However, some proceedings are being carried out to achieve a temporary extension.
(**) The main assets of our subsidiary Enel CIEN are the Garabi I and Garabi II energy interconnection systems, which through two frequency conversion stations and 2,200 MW transmission lines, transport energy between Brazil and Argentina. In June 2020, the Ministry of Mines and Energy of Brazil enacted an ordinance that allows Enel CIEN to continue operating the Garabi I line after the end of the concession on June 20, 2020, approving its term to correspond with the concession of the Garabi II line, up to July 31, 2022. During 2021, there will be a new tender for the operation of both lines, and Enel CIEN has the possibility of participating in such process. If the concession is not renewed, Enel CIEN will recover the carrying amount of the underlying assets.
To the extent that the Group recognizes the assets as Property, plant and equipment, these are amortized over their economic life or the concession term, whichever is shorter, when the economic benefit from the asset is limited to its use during the concession term.
Any required investment, improvement or replacement made by the Group is considered in the impairment test to Property, plant, and equipment as a future contractual cash outflow that is necessary to obtain future cash inflows.
The Group’s Management analyzed the specific contract terms of each of the aforementioned concessions, which vary depending on the by country, business activity and jurisdiction, and concluded that, with the exception of Enel CIEN, there are no determining factors indicating that the grantor, which in every case is a government entity, controls the infrastructure and, at the same time, can continuously set the price to be charged for the services. These requirements are essential for applying IFRIC 12, Service Concession Arrangements, an interpretation that establishes how to recognize and measure certain types of concessions (see Note 3.d.1)
On April 19, 2011, the Company’s subsidiary Enel CIEN successfully completed its change in business model. Under the new agreement, the Brazilian government continues to control the infrastructure, but Enel CIEN receives fixed payments, which places it at an equal level with a public transmission concession (with regulated prices). Under this business model, its concessions fall within the scope of IFRIC 12; however, the infrastructure has not been derecognized due to the fact that Enel CIEN has not substantially transferred the significant risks and benefits to the Brazilian government.
An item of property, plant and equipment is derecognized when it is sold or otherwise disposed of, or when no future economic benefits are expected from its use, sale or other disposal.
F-34
Gains or losses arising from the sale or disposal of items of property, plant and equipment are recognized as “Other gains (losses)” in the statement of comprehensive income and calculated by deducting the amount received for the sale from the net carrying amount of the asset and the selling value.
b) |
“Investment property” basically includes land and buildings that are kept for the purpose of obtaining gains from future sales or lease arrangements.
Investment property is measured at acquisition cost, net of accumulated depreciation and any impairment losses experienced. Investment property, excluding land, is depreciated by distributing the cost of the several elements that comprise it on a straight-line basis over the years of useful life.
An investment property is derecognized on disposal, or when no future economic benefits are expected from use or disposal.
Gains or losses arising from the sale or disposal of items of investment property are recognized as “Other gains (losses)” in the statement of comprehensive income and determined as the difference between the sales amount and the net carrying amount of the asset.
c) |
Goodwill arising from business combinations, and reflected upon consolidation, represents the excess value of the consideration paid plus the amount of any non-controlling interests over the Group’s share of the net value of the assets acquired and liabilities assumed, measured at fair value at the acquisition date. If the accounting for a business combination is completed within the following year after the acquisition date, and thus the goodwill determination as well, the entity recognizes the related adjustments to the provisional amounts as if the accounting for the business combination had been completed at the acquisition date. If the accounting for a business combination is completed within the following year after the acquisition date, and thus the goodwill determination as well, the entity recognizes the related adjustments to the provisional amounts as if the accounting for the business combination had been completed at the acquisition date (see Note 2.7.1).
Goodwill arising from acquisition of companies with functional currencies other than the functional currency of the Parent is measured in the functional currency of the acquiree and translated to U.S. dollar using the exchange rate effective as of the date of the statement of financial position.
Goodwill is not amortized; instead, at the end of each reporting period or when there are indicators that an impairment might have occurred, the Group estimates whether any impairment loss has reduced its recoverable amount to an amount less than the carrying amount and, if so, an impairment loss is immediately recognized in profit or loss (see Note 3.e).
d) |
Intangible assets are initially recognized at their acquisition cost or production cost, and are subsequently measured at their cost, net of their accumulated amortization and impairment losses experienced.
Intangible assets are amortized on a straight line basis during their useful lives, starting from the date when they are ready for use, except for those with an indefinite useful life, which are not amortized. As of December 31, 2020 and 2019, there are no significant amounts in intangible assets with an indefinite useful life.
The criteria for recognizing these assets’ impairment losses and, if applicable, recovery of impairment losses recorded in previous periods are explained in Note e) below.
F-35
An intangible asset is derecognized when it is sold or otherwise disposed of, or when no future economic benefits are expected from its use, sale or other disposal.
Gains or losses arising from sales of intangible assets are recognized in profit or loss for the period and determined as the difference between the amount of the sale and the carrying amount of the asset.
Public-to-private service concession agreements are recognized according to IFRIC 12: Service Concession Arrangements. This accounting interpretation applies if:
| a) | The grantor controls or regulates what services the operator should provide with the infrastructure, to whom it must provide them, and at what price; and |
| b) | The grantor controls – through ownership, beneficial entitlement, or otherwise – any significant residual interest in the infrastructure at the end of the term of the arrangement. |
If both of the above conditions are met simultaneously, the consideration received by the Group for the constructed infrastructure is initially recognized at its fair value, as either
-An intangible asset when the Group receives the right to charge users of the public service, as long as these charges are conditional on the degree to which the service is used;
-A financial asset when the Group has an unconditional contractual right to receive cash or another financial asset directly from the grantor or from a third party.
However, both types of considerations are classified as a contract asset during the construction or improvement period, in accordance with IFRS 15 (see Note 9).
The Group recognizes the contractual obligations assumed for maintenance of the infrastructure during its use, or for its return to the grantor at the end of the concession agreement within the conditions specified in the agreement, as long as it does not involve an activity that generates income, in accordance with the Group’s accounting policy to recognize provisions (see Note 3.m).
Finance costs attributable to the concession arrangements are capitalized based on the criteria established in a) above, provided that the operator has a contractual right to receive an intangible asset.
The Company’s subsidiaries that have recognized an intangible asset and/or a financial asset from their service concession arrangements are the following:
| | | | |
Concession holder and operator | Country | Year | Concession | Remaining period to expiration |
Enel Distribución Río S.A. (formerly Ampla) (Distribution) (*) | Brazil | 1996 | 30 years | 6 years |
Enel Distribución Ceará S.A. (formerly Coelce) (Distribution) (*) | Brazil | 1997 | 30 years | 7 years |
Enel Distribución Goiás S.A. (Distribution) (*) | Brazil | 2015 | 30 years | 24 years |
Enel Green Power Proyectos I (Volta Grande) (**) | Brazil | 2017 | 30 years | 27 years |
Enel Distribución Sao Paulo S.A. (Distribution) (*) | Brazil | 1998 | 30 years | 8 years |
(*) Because part of the rights acquired by these subsidiaries are unconditional an intangible asset and financial asset at fair value through profit and loss have been recognized for the concession (See Notes 3.g.1 and Note 8).
(**) Because all of the rights acquired by this subsidiary are unconditional, only a financial asset measured at amortized cost has been recognized for this concession (see Note 3.g.1 and Note 8).
F-36
At the end of each concession period, this can be renewed at the discretion of the granting authority, otherwise all assets and facilities will be returned to the Government or its assignee, upon reimbursement for investments made and not yet amortized.
d.2) Research & development expenses
The Group recognizes the costs incurred in a project’s development phase as intangible assets in the statement of financial position as long as the project’s technical feasibility and future economic benefits have been demonstrated.
Research costs are recorded as an expense in the consolidated statement of comprehensive income in the period in which they are incurred.
Other intangible assets correspond to computer software, water rights, and easements. They are initially recognized at acquisition or production cost and are subsequently measured at cost less accumulated amortization and impairment losses, if any.
Computer software is amortized (on average) over five years. Certain easements and water rights have indefinite useful lives and are therefore not amortized, while others have useful lives ranging from 40 to 60 years, depending on their characteristics, and they are amortized over that term.
e) |
During the period, and mainly at the end of each reporting period, the Group evaluates whether there is any indication that an asset has been impaired. If any such indication exists, the Group estimates the recoverable amount of that asset to determine the amount of the impairment loss. For identifiable assets that do not generate cash flows independently, the Group estimates the recoverable amount of the Cash Generating Unit (CGU) to which the asset belongs, which is understood to be the smallest identifiable group of assets that generates independent cash inflows.
Notwithstanding the preceding paragraph, for CGUs to which goodwill or intangible assets with indefinite useful life have been allocated, a recoverability analysis is performed routinely at each year-end.
The criteria used to identify the CGUs are based, in line with Management’s strategic and operating vision, within the specific characteristics of the business, the operating rules and regulations of the market in which the Group operates and corporate organization.
Recoverable amount is the higher of fair value less costs of disposal and value in use, which is defined as the present value of the estimated future cash flows. In order to calculate the recoverable amount of Property, plant, and equipment, as well as of goodwill and intangible assets, the Group uses value in use criteria in practically all cases.
To estimate value in use, the Group prepares future pre-tax cash flow forecasts based on the most recent budgets available. These budgets include Management’s best estimates of a CGU’s revenue and costs using sector forecasts, past experience and future expectations.
In general, these projections cover the next five years, estimating cash flows for subsequent years by applying reasonable growth rates which, in no case, are increasing rates nor exceed the average long-term growth rates for the
F-37
particular sector and country in which the Group operates. The growth rates used to extrapolate the projections as of December 31, 2020 and 2019 were the following:
| | | | | | | |
| | | | 12/31/2020 | 12/31/2019 | ||
Country |
| Currency | | Minimum | Maximum | Minimum | Maximum |
Argentina | | Argentine peso | | 10.1% | 12.8% | 5.0% | 6.7% |
Brazil | | Brazilian real | | 3.5% | 3.8% | ||
Peru | | Peruvian sol | | 2.5% | 2.5% | ||
Colombia | | Colombian peso | | 3.0% | 3.0% | ||
Future cash flows are discounted to calculate their present value at a pre-tax rate that covers the cost of capital for the business activity and the geographic area in which it is being carried out. The time value of money and risk premiums generally used among analysts for the business activity and the geographic zone are taken into account to calculate the pre-tax rate.
The following are the pre-tax discount rates applied as of December 31, 2020 and 2019, expressed in nominal terms:
| | | | | | |
| | | December 31, 2020 | December 31, 2019 | ||
Country |
| Currency | Minimum | Maximum | Minimum | Maximum |
Argentina | | Argentine peso | 35.8% | 63.4% | 24.7% | 50.6% |
Brazil | | Brazilian reais | 9.6% | 40.2% | 10.1% | 23.4% |
Peru | | Peruvian soles | 7.4% | 11.1% | 7.8% | 12.9% |
Colombia | | Colombian peso | 8.7% | 10.5% | 8.7% | 11.8% |
The Company’s approach to allocate value to each key assumption used to project cash flows, considers:
| ● | Evolution of demand: the growth estimate has been calculated based on the projected increase in the Gross Domestic Product (GDP), in addition to other assumptions used by the Company regarding the evolution of consumption. |
| ● | Energy purchase and sale prices: based on specifically developed internal projection models. The price of the planned “pool” is estimated by considering a number of determining factors, such as the different technologies costs and productions and energy demand, among other items. |
| ● | Regulatory measures: an important part of the Company’s business is regulated and subject to extensive standards, which could undergo revisions, either as a result of new laws or the amendment of existing laws, and therefore the projections include adequate application of the current standards and those that are currently being developed, and those expected to be effective during the projected period. |
| ● | Installed capacity: in the estimating of the Group’s installed capacity, the existing facilities are taken into account, as well as the plans for both increasing capacity and capacity closure. The investment plan is constantly updated based on the evolution of the business, quality of service regulations determined by the regulator and changes in the business development strategy adopted by management. The necessary investments are taken into account to maintain the installed capacity in appropriate operating conditions. |
| ● | Hydrology and NCRE: the projections are made from historical series of meteorological conditions and projecting an average year, based on these. |
| ● | Fuel costs: to estimate fuel costs, existing supply contracts are taken into account and long-term projections of oil, gas or coal prices are made, based on forward markets and available analyst estimates. |
| ● | Fixed costs: these are projected considering the foreseen level of business activities, both in terms of the evolution of the workforce (considering salary raises in line with the CPI), and in term of other operating and maintenance costs, the level of projected inflation and long-term existing maintenance or other contracts. The efficiencies that the Group is adopting over time are also considered, such as those that arise from the initiatives for the digitalization for the internal processes. |
| ● | External sources are always considered to verify the assumptions related to the macroeconomic environment such as price evolution, GDP growth, demand, inflation, interest rates and exchange rates, among others. |
F-38
Past experience has demonstrated the reliability of the Company’s forecasts, which allows it to base key assumptions on historical information. During 2020, the deviations observed with respect to the projections used to perform impairment testing as of December 31, 2019, were not significant and cash flows generated in 2020 remained in a reasonable variance range compared to those expected for that period, with the exception of the effects generated by the COVID-19 pandemic.
If the recoverable amount of the CGU is less than the net carrying amount of the asset, the related impairment loss is recognized for the difference, and charged to “Impairment loss (impairment reversals) recognized in profit or loss” in the consolidated statement of comprehensive income. The impairment is first allocated to the CGU’s goodwill carrying amount, if any, and then to the other assets comprising it, prorated on the basis of the carrying amount of each one, limited to the fair value less costs of disposal, or value in use, where no negative amount could be obtained.
Impairment losses recognized in prior periods for an asset other than goodwill are reversed, if and only if, there has been a change in the estimates used to determine the asset’s recoverable amount since the last impairment loss was recognized. If this is the case, the carrying amount of the asset is increased to its recoverable amount with a credit to profit or loss, but so that the increased carrying amount does not exceed the carrying amount that would have been determined had no impairment loss been recognized for the asset. For goodwill, impairment losses are not reversed in subsequent periods.
f) |
In order to determine whether an arrangement is, or contains, a lease, the Company assesses the economic substance of the agreement, assessing whether the agreement conveys the right to control the use of an identified asset for a period of time in exchange for consideration. Control is considered to exist if the customer has i) the right to obtain substantially all the economic benefits arising from the use of an identified asset; and ii) the right to direct the use of the asset.
f.1) Lessee
When the Group acts as a lessee at the commencement of the lease (i.e. on the date on which the underlying asset is available for use) it records a right-of-use asset and a lease liability in the statement of financial position.
The Group initially recognizes right-of-use assets at cost. The cost of right-of-.use assets comprises: (i) the amount of the initial measurement of the lease liability; (ii) lease payments (made until the commencement date less lease incentives received), (iii) initial direct costs incurred; and (iv) the estimate of decommissioning or restoration costs.
Subsequently, the right-of-use asset is measured at cost, adjusted by any re measurement of the lease liability, less accumulated depreciation and accumulated impairment losses. A right-of-use asset is depreciated on the same terms as other similar depreciable assets, as long as there is reasonable certainty that the lessee will acquire ownership of the asset at the end of the lease. If no such certainty exists, the leased assets are depreciated over the shorter of the useful lives of the assets and their lease term. The same criteria detailed in Note 3.e are applied to determine whether the right-of-use asset has become impaired.
The lease liability is initially measured at the present value of the lease payments, discounted at the Company's incremental borrowing rate, if the interest rate implicit in the lease cannot be readily determined. The incremental borrowing rate is the interest rate that the company would have to pay to borrow over a similar term, and with similar security, the funds necessary to obtain an asset of similar value to the right-of-use asset in a similar economic environment. The Group determines its incremental borrowing rate using observable data (such as market interest rates) or by making specific estimates when there are no observable rates available (e.g., for subsidiaries that do not carry out financing transactions) or when they must be adjusted to reflect the terms and conditions of the lease (e.g., when the leases are not in the functional currency of the subsidiary).
F-39
Lease payments included in the measurement of liabilities comprise: i) fixed payments, less any lease incentive receivable; ii) variable lease payments that depend on an index or a rate; iii) residual value guarantees; iv) the exercise price of a purchase option, if the Group is it is reasonably certain to exercise that option; and v) penalties for terminating the lease, if any.
After the commencement date, the lease liability increases to reflect the accrual of interest and is reduced by the lease payments made. In addition, the carrying amount of the liability is remeasured if there is a change in the terms of the lease (changes in the lease term, in the amount of expected payments related to a residual value guarantee, in the evaluation of a purchase option or in an index or rate used to determine lease payments). Interest expense is recognized as finance cost and distributed over the years making up the lease period, so that a constant interest rate is obtained in each year on the outstanding balance of the lease liability.
Short-term leases of one year or less or leases of low value assets are exempt from the application of the recognition criteria described above, with the payments associated with the lease recorded as an expense on a straight-line basis over the term of the lease.
Right-of-use assets and lease liabilities are presented separately from other assets and liabilities, respectively in the consolidated statement of financial position.
f.2) Lessor
When the Group acts as a lessor, it classifies at the commencement of the agreement whether the lease is an operating or finance lease, based on the substance of the transaction. Leases in which all the risks and rewards incidental to ownership of an underlying asset are substantially transferred are classified as finance leases. All other leases are classified as operating leases.
For finance leases, at the commencement date, the company recognizes in its statement of financial position the assets held under finance leases and presents them as an account receivable, for an amount equal to the net investment in the lease, calculated as the sum of the present value of the lease payments and the present value of any accrued residual value, discounted at the interest rate implicit in the lease. Subsequently, finance income is recognized over the term of the lease, based on a model that reflects a constant rate of return on the net financial investment made in the lease.
For operating leases, lease payments are recognized as income on a straight-line basis, over the term of the lease unless another type of systematic basis of distribution is deemed more representative. The initial direct costs incurred in obtaining an operating lease are added to the carrying amount of the underlying asset and are recognized as expense throughout the lease period, applying the same basis as for rental income.
g) |
Financial instruments are contracts that give rise to both a financial asset in one entity and a financial liability or equity instrument in another entity.
g.1) Financial assets other than derivatives
The Group classifies its non-derivative financial assets, whether permanent or temporary, excluding investments accounted for using the equity method (see Notes 3.i and 14) and non-current assets and disposal groups held for sale or distribution to owners (see Note 3.k), into three categories:
| (i) | Amortized cost: |
This category includes the financial assets that meet the following conditions (i) the business model that supports the financial assets seeks to maintain such financial assets to obtain contractual cash flows, and
F-40
(ii) the contractual terms of such financial assets give rise on specific dates to cash flows that are solely payments of principal and interest (SPPI criterion).
Financial assets that meet the conditions established in IFRS 9, to be valued at amortized cost in the Group are: cash equivalents, accounts receivable and, loans. Such assets are recorded at amortized cost, which is the initial fair value, less repayments of principal, plus uncollected accrued interest, calculated using the effective interest method.
The effective interest method is a method for calculating the amortized cost of a financial asset or a financial liability (or a group of financial assets or financial liabilities) and allocating the finance income or finance costs throughout the relevant period. The effective interest rate is the discount rate that exactly matches the estimated cash flows to be received or paid over the expected useful life of the financial instrument (or when appropriate in a shorter period of time), with the net carrying amount of the financial asset or financial liability.
| (ii) | Financial Assets Recorded at Fair Value through Other Comprehensive Income: |
This category includes the financial assets that the meet the following conditions: (i) they are classified in a business model, the purpose of which is to maintain the financial assets both to collect the contractual cash flows and to sell them, and (ii) the contractual conditions meet the SPPI criterion.
These financial assets are recognized in the consolidated statement of financial position at fair value when this can be determined reliably. For the holdings in unlisted companies or companies with low liquidity, it is usually not possible to determine the fair value reliably. Therefore, when this occurs, such holdings are valued at their acquisition cost or for a lower amount if there is evidence of their impairment.
Changes in fair value, net of their tax effect, are recorded in the consolidated statement of comprehensive income: Other comprehensive income, until the disposal of these financial assets, where the accumulated amount in this section is fully allocated to profit or loss for the period except for investments in equity instruments where the accumulated balance in other comprehensive income is never reclassified to profit or loss.
In the event that the fair value is lower than the acquisition cost, if there is objective evidence that the asset has suffered an impairment that cannot be considered as temporary, the difference is recorded directly in the loss for the period.
| (iii) | Financial Assets Recorded at Fair Value through Profit or Loss: |
This category includes the trading portfolio of the financial assets that have been allocated as such upon their initial recognition and which are managed and assessed according to the fair value criterion, and the financial assets that do not meet the conditions to be classified in the two categories indicated above.
These are measured at fair value in the consolidated statement of financial position and any changes in value are recorded directly in profit or loss when they occur.
g.2) Cash and cash equivalents
This item within the consolidated statement of financial position includes cash and bank balances, time deposits, and other highly liquid investments (with original maturity of less than or equal to 90 days) that are readily convertible into cash and are subject to insignificant risk of changes in value.
F-41
g.3) Impairment of financial assets
Under IFRS 9, the Group applies an impairment model based on expected credit losses, based on the Group’s past history, existing market conditions, and prospective estimates at the end of each reporting period. The impairment model is applied to financial assets measured at amortized cost or those measured at fair value through other comprehensive income, except for investments in equity instruments.
Expected credit loss is the difference between the contractual cash flows that are due in accordance with the contract and all the cash flows that are expected to be received, i.e. all cash shortfalls), discounted at the original effective interest rate. It is determined considering: i) the probability of default (PD); ii) loss given default (LGD), and iii) exposure at default (EAD).
To determine the expected credit losses the Group applies two separate approaches:
| ● | General approach: applied to financial assets other than trade accounts receivable, contractual assets or lease receivables. This approach is based on the evaluation of significant increases in the credit risk of financial assets, from the date of initial recognition. If on the reporting date of the financial statements the credit risk has not increased significantly, the impairment losses are measured related to the expected credit losses in the next 12 months; if, on the contrary, the credit risk has increased significantly, the impairment is measured considering the expected credit losses throughout the lifetime of the asset. |
In general, the measurement of expected credit losses for financial assets other than trade accounts receivable, contractual assets or lease receivables, are performed separately.
| ● | Simplified approach: The Group applies a simplified approach for trade receivables, contract assets and lease receivables so that the impairment provision is always recognized related to the lifetime expected credit losses for the asset. This is the approach that the Group has mostly most applied because trade receivables represent the main financial asset of Enel Américas and its subsidiaries. |
For trade accounts receivable, contractual assets and lease receivables, the Group applies two types of evaluations of expected credit losses:
| ● | Collective evaluation: based on grouping accounts receivable into specific groups or “clusters”, taking into account each business and the local regulatory context. Accounts receivable are grouped according to the characteristics of customer portfolios in terms of credit risk, maturity information and recovery rates. A specific definition of default is considered for each group. |
To measure the expected credit losses collectively, the Group considers the following assumptions:
PD: average default estimate, calculated for each group of trade receivables, taking into account a minimum of 24-month historical data.
LGD: calculated based on the recovery rates of a predetermined section, discounted at the effective interest rate; and
EAD: accounting exposure on reporting date, net of cash deposits, including invoices issued, but not due and invoices to be issued.
F-42
| ● | Analytical or individual evaluation: if accounts receivables are considered individually significant by Management and there is specific information regarding any significant increase in the credit risk, the Group applies an individual evaluation of accounts receivable. For the individual evaluation, the PD is obtained mainly from an external supplier, when it is possible to do so, and the LGD through an internal model that considers the recovery rate and other contractual and financial characteristics of accounts receivable. The expected credit loss is obtained by multiplying both factors by the EAD, which is defined as the accounting exposure at the reporting date, including the invoices issued but not due and invoices to be issued for services rendered, net of potential cash deposits obtained as guarantees. |
On the basis of the benchmark market and the regulatory context of the sector, as well as the recovery expectations after 90 days, for those accounts receivable, the Group mainly applies a predetermined definition of 180 days overdue to determine expected credit losses, since this is considered an effective indicator of a significant increase in credit risk. Consequently, financial assets that are more than 90 days overdue generally are not considered to be in default.
Based on specific evaluations performed by management, the prospective adjustment can be applied considering qualitative and quantitative information to reflect possible future events and macroeconomic scenarios, which may affect the risk of the portfolio or the financial instrument.
g.4) Financial liabilities other than derivatives
General financial liabilities are initially recognized, at fair value net of any costs incurred in the transaction. In subsequent periods, these obligations are measured at their amortized cost using the effective interest method (see Note 3.g.1).
Lease liabilities are initially measured at the present value of future lease payments, determined in accordance with the criteria described in Note 3.f.
In the particular case that a liability is the hedged item in a fair value hedge, as an exception, such liability is measured at its fair value for the portion of the hedged Risk.
In order to calculate the fair value of debt, both when it is recorded in the statement of financial position and for fair value disclosure purposes as shown in Note 23, debt has been divided into fixed interest rate debt (hereinafter “fixed-rate debt”) and floating interest rate debt (hereinafter “floating-rate debt”). Fixed-rate debt is that on which fixed-interest coupons established at the beginning of the transaction are paid explicitly or implicitly over its term. Floating-rate debt is that debt issued at floating interest rate, i.e., each coupon is established at the beginning of each period based on the benchmark interest rate. All debt has been measured by discounting expected future cash flows with a market interest rate curve based on the payment currency.
g.5) Derivative financial instruments and hedge accounting
Derivatives held by the Group are transactions entered into to hedge interest and/or exchange rate risk, intended to eliminate or significantly reduce these risks in the underlying transactions being hedged.
Derivatives are recorded at fair value at the end of each reporting period as follows: if their fair value is positive, they are recorded within “Other financial assets” and if their fair value is negative, they are recorded within “Other financial liabilities”. For derivatives on commodities, positive fair value is recorded in “Trade and other receivables”, and negative fair value, if any, is recognized in “Trade and other liabilities.”
Changes in fair value are recorded directly in profit or loss, except when the derivative has been designated for hedge accounting purposes as a hedging instrument and all of the conditions for applying
F-43
hedge accounting established by IFRS are met, including that the hedge is highly effective. In this case, changes are recognized as follows:
| ● | Fair value hedges: The underlying portion for which the risk is being hedged and the hedging instrument are measured at fair value, and any changes in the value of both items are recognized in the statement of comprehensive income offsetting the effects in the same caption of the statement comprehensive income. |
| ● | Cash flow hedges: Changes in the fair value of the effective portion of the hedged item and hedging instrument are recognized in other comprehensive income and accumulated in an equity reserve referred to as “Hedging reserve.” The cumulative loss or gain in this caption is transferred to the consolidated statement of comprehensive income to the extent that the hedged item impacts the consolidated statement of comprehensive income offsetting the effect in the same comprehensive income statement caption. Gains or losses from the ineffective portion of the hedging relationship are recognized directly in the statement of comprehensive income. |
Hedge accounting is discontinued only when the hedging relationship (or a part of the relationship) fails to meet the required criteria, after making any rebalancing of the hedging relationship, if applicable. If it is not possible to continue the hedging relationship, including when the hedging instrument expires, is sold, settled or exercised, any gain or loss accumulated in equity at that date remains in the equity until the forecast transaction affects the statement of comprehensive income. When a forecast transaction is no longer expected to occur, the gain or loss accumulated in equity is immediately transferred to the statement of income.
The Group does not apply hedge accounting to its investments abroad.
As a general rule, long-term commodity purchases or sales agreements are recognized in the statement of financial position at their fair value at the end of each reporting period, recognizing any differences in value directly in profit or loss, except for, when all of the following conditions are met:
| ● | The sole purpose of the agreement is for its own use, which is understood as: for fuel purchase agreements such use is to generate electricity; for electrical energy purchased for sale, its sale is to the end-customers; and for electricity sales its sale is to the end-customers. |
| ● | The Group’s future projections evidence the existence of these agreements for own use. |
| ● | Past experience with agreements shows that they have been used for the Group’s “own use”, except for certain isolated cases when for exceptional reasons or reasons associated with logistical issues, these have been used for other purposes beyond the Group’s control and expectations. |
| ● | The agreement does not establish net settlement of differences and there has been no practice to settle similar differences in similar contracts in the past. |
The long-term commodity purchase or sale agreements maintained by the Group, which are mainly for electricity, fuel, and other supplies, meet the conditions described above. Accordingly, the purpose of fuel purchase agreements is to use them to generate electricity, electricity purchase contracts for use in sales to end-customers, and electricity sale contracts for sale of the Group’s own products.
The Group also evaluates the existence of derivatives embedded in contracts or financial instruments to determine if their characteristics and risk are closely related to the host contract, provided that when taken as a whole they are not being accounted for at fair value. If they are not closely related, they are recorded separately and changes in value are accounted for directly in the statement of comprehensive income.
F-44
g.6) Derecognition of financial assets and liabilities
Financial assets are derecognized when:
| ● | The contractual rights to receive cash flows from the financial asset expire or have been transferred or, even when, the Group has assumed a contractual obligation to pay these cash flows to one or more recipients. |
| ● | The Group has substantially transferred all the risks and rewards of their ownership, or, if it has neither assigned nor retained substantially all the risks and rewards, when it does not retain control of the financial asset. |
For transactions in which the Group retains substantially all the inherent risks and rewards of ownership of the financial asset assigned, it recognizes them as a financial liability for the consideration received. Transactions costs are recognized in profit and loss by using the effective interest method (see Note 3.g.1).
Financial liabilities are derecognized when they are extinguished; i.e, when the obligation arising from the liability has been paid or cancelled, or has expired. An exchange for a debt instrument with substantially different conditions, or a substantial modification in the current conditions of an existing financial liability (or a part thereof), is recorded as a cancellation of the original financial liability, and a new financial liability is recognized.
g.7) Offsetting of financial assets and financial liabilities
The Group offsets financial assets and liabilities and the net amount is presented in the statement of financial position only when:
| ● | there is a legally binding right to offset the amounts recognized; and |
| ● | the Group intends to settle them on a net basis, or to realize the asset and settle the liability simultaneously. |
Such rights may only be legally enforceable in the normal course of business, or in the event of default, or in the event of insolvency or bankruptcy, of one or all the counterparties.
g.8) Financial guarantee contracts
The financial guarantee contracts, defined as the guarantees issued by the Group to third parties, are initially measured at their fair value, adjusted for transaction costs that are directly attributable to the issuance of the guarantee.
Subsequent to initial recognition, financial guarantee contracts are recognized at the higher of:
| ● | the amount of the liability determined in accordance with the accounting policy described in Note 3.m; and |
| ● | the amount of the asset initially recognized less, if applicable, any accumulated amortization recognized in accordance with the revenue recognition policies described in Note 3.q. |
F-45
h) |
The fair value of an asset or liability is defined as the price that would be received from the sale of an asset or paid to transfer a liability in an orderly transaction between market participants at the measurement date.
Fair value measurement assumes that the transaction to sell an asset or transfer a liability occurs in the principal market, namely, the market with the greatest volume and level of activity for that asset or liability. In the absence of a principal market, it is assumed that the transaction is carried out in the most advantageous market available to the entity, namely, the market that maximizes the amount that would be received to sell the asset or minimizes the amount that would be paid to transfer the liability.
In estimating fair value, the Group uses valuation techniques that are appropriate for the circumstances and for which there is sufficient data to perform the measurement where it maximizes the use of relevant observable data and minimizes the use of unobservable data.
Given the hierarchy explained below, data used in the valuation techniques, assets and liabilities measured at fair value can be classified at the following levels:
Level 1: Quoted prices (unadjusted) in active markets for identical assets or liabilities;
Level 2: Inputs other than quoted prices included in Level 1 that are observable for the assets or liabilities, either directly (i.e. as prices) or indirectly (i.e. derived from prices). The methods and assumptions used to determine the fair values at Level 2 by type of financial assets or financial liabilities take into consideration estimated future cash flows discounted at market rates. Future cash flows for financial assets and financial liabilities are discounted with the zero coupon interest rate curves for each currency (these valuations are performed using external tools such as Bloomberg); and
Level 3: Inputs for assets or liabilities that are not based on observable market data (unobservable inputs).
The Group takes into account the characteristics of the asset or liability when measuring fair value, in particular:
| ● | For non-financial assets, fair value measurement takes into account the ability of a market participant to generate economic benefits by using the asset in its highest and best use or by selling it to another market participant that would use the asset at its highest and best use; |
| ● | For liabilities and equity instruments, the fair value measurement assumes that the liability would not be settled and an equity instrument would not be cancelled or otherwise extinguished on the measurement date. The fair value of the liability reflects the effect of non-performance risk, namely, the risk that an entity will not fulfill the obligation, which includes but is not limited to, the Company’s own credit risk; |
| ● | For derivatives not traded in active markets, the fair value is determined by using the discounted cash flow method and generally accepted options valuation models, based on current and future market conditions as of the closing date of the financial statements. This methodology also adjusts the value based on the Company’s own credit risk (Debt Valuation Adjustment, DVA), and the counterparty risk (Credit Valuation Adjustment, CVA). These CVA and DVA adjustments are measured on the basis of the potential future exposure of the instrument (asset or liability position) and the risk profile of both the counterparties and the Group itself. |
| ● | For financial assets and financial liabilities with offsetting positions in market risks or counterparty credit risks, measuring the fair value on a net basis is allowed. However, this must be consistent with the manner in which market participants would price the net risk exposure at the measurement date. |
Financial assets and financial liabilities measured at fair value are shown in Note 23.3.
F-46
i) |
The Group’s interests in joint ventures and associates are recognized using the equity method of accounting.
Under the equity method of accounting, an investment in an associate or joint venture is initially recognized at cost. As of the acquisition date, the investment is recognized in the statement of financial position based on the share of equity that the Group’s interest represents in capital, adjusted for, if appropriate, the effect of transactions with the Group plus any goodwill generated in acquiring the company. If the resulting amount is negative, zero is recorded for that investment in the statement of financial position, unless the Group has a present obligation (either legal or constructive) to reinstate the Company’s equity position, in which case a provision is recognized.
The financial statements of associates or joint ventures are prepared for the same reporting period as the Group. When required, adjustments are made to align the accounting policies with those of the Group.
Goodwill from the associate or joint venture is included in the carrying amount of the investment. It is not amortized but is subject to impairment testing as part of the overall investment carrying amount when there are indicators of impairment.
Dividends received from these investments are deducted from the carrying amount of the investment, and any profit or loss obtained from them to which the Group is entitled based on its ownership interest is recognized under “Share of profit (loss) of associates accounted for using the equity method of accounting.”
The companies classified as “Associates” and “Joint Ventures” (see Notes 2.5 and 2.6, respectively) in these consolidated financial statements are accounted for under the equity this method of accounting.
j) |
Inventories are measured at their weighted average acquisition cost or the net realizable value, whichever is lower.
The net realizable value is the estimated selling price in the ordinary course of business less the applicable costs to sell.
The cost of inventories includes all costs of purchase and all necessary costs incurred in bringing the inventories to their present location and condition net of trade discounts and other rebates.
k) | Non-current assets (or disposal groups of assets) held for sale or held for distribution to owners and discontinued operations |
Non-current assets, including property, plant and equipment; intangible assets; investments accounted for using the equity method of accounting and joint ventures and disposal groups (a group of assets for disposal or distribution together with liabilities directly associated with those assets), are classified as:
| ● | Held for sale, if their carrying amount will be recovered mainly through a sale transaction rather than through continuing use, or |
| ● | Held for distribution to owners, when the entity is committed to distribute the assets (or disposal groups) to the owners. |
For the above classifications, the assets must be available for immediate sale or distribution in their present condition and their sale or distribution must be highly probable. For a transaction to be considered highly probable, management must be committed to the sale or distribution and actions to complete the transaction must have been initiated and should be expected to be completed within one year from the date of classification.
F-47
Actions required to complete the sale or distribution plan should indicate that it is unlikely that significant changes to the plan can be made or that the plan will be cancelled. The probability of shareholders’ approval (if required in the jurisdiction) should be considered as part of the assessment of whether the sale or distribution is highly probable.
The assets or disposal groups classified as held-for-sale or held for distribution to owners are measured at the lower of their carrying amount and fair value less costs to sell or costs to distribute, as appropriate.
Depreciation and amortization on these assets cease when they meet the criteria to be classified as non-current assets held for sale or held for distribution to owners.
Assets that are no longer classified as held for sale or held for distribution to owners, or are no longer part of a disposal group, are measured at the lower of their carrying amounts before being classified as held for sale or held for distribution, less any depreciation, amortization or revaluation that would have been recognized had they had not been classified as held for sale or held for distribution to owners and their recoverable amount at the date of reclassification non-current assets.
Non-current assets held for sale and the components of the disposal groups classified as held for sale or held for distribution to owners are presented in the consolidated statement of financial position as a single line item within assets referred to as “Non-current assets or disposal groups held for sale or for distribution to owners”, and the related liabilities are presented as a single line item within liabilities referred to as “Liabilities included in disposal groups held for sale or for distribution to owners”.
The Group classifies as discontinued operations those components of the Group that either have been disposed of, or are classified as held for sale and:
| (i) | represent a separate major line of business or geographical area of operations; |
| (ii) | is part of a single coordinated plan to dispose of a separate major line of business or geographical area of operations; or |
| (iii) | is a subsidiary acquired exclusively with a view to resale it. |
The after-tax results of discontinued operations are presented in a single line of the statement of comprehensive income referred to as "Profit (loss) from discontinued operations", as well as the gain or loss recognized from the measurement at fair value less costs to sell or from the disposal of the assets or groups for disposal comprising the discontinued operation.
l) |
Treasury shares are presented deducting the caption “Total equity” in the consolidated statement of financial position and measured at acquisition cost.
Gains and losses from the disposal of treasury shares are recognized directly in “Total Equity – Retained earnings (losses)”, without affecting profit or loss for the period.
m) |
Provisions are recognized when the Group has a present obligation (legal or constructive) as a result of a past event, it is probable that an outflow of economic benefits will be required to settle the obligation, and a reliable estimate can be made of the amount of the obligation.
The amount recognized as a provision is the best estimate of the consideration required to settle the present obligation at the end of the reporting period, taking into account the risks and uncertainties surrounding the obligation. When a provision is measured using the cash flows estimated to settle the present obligation, it’s carrying amount is the present
F-48
value of those cash flows (when the effect of the time value of money is material). The unwinding of the discount is recognized as finance cost. Incremental legal costs expected to be incurred in resolving a legal claim are included in measuring of the provision.
Provisions are reviewed at the end of each reporting period and adjusted to reflect the current best estimate. If it is no longer probable that an outflow of resources embodying economic benefits will be required to settle the obligation, the provision is reversed.
A contingent liability does not result in the recognition of a provision. Legal costs expected to be incurred in defending a legal claim are expensed as incurred. Significant contingent liabilities are disclosed unless the likelihood of an outflow of resources embodying economic benefits is remote.
m.1) Provisions for post-employment benefits and similar obligations
Certain of the Group’s companies have entered into pension and other similar commitments with their employees. Those defined benefit and defined contribution commitments are basically through pension plans, except for those related to certain benefits in lieu of payment, basically commitments to supply electric energy, which, due to their nature have not been outsourced and their coverage is provided through the related internal provision.
For defined benefit plans, the companies record the related expense for these commitments following the accrual criteria over the service life of the employees through timely actuarial studies performed as of the reporting date calculated applying the projected credit unit method. The cost of past services which correspond to variances in benefits is recognized immediately.
The defined benefit plan obligations in the statement of financial position represent the present value of the accrued obligations, upon deduction of the fair value of the different plans’ assets, if any.
For each defined benefit plan, if the difference between the actuarial liability for past services and the plan assets is positive, it is recognized under line item “Provisions for employee benefits” in liabilities in the consolidated statement of financial position, and if such difference is negative is recognized under line item “Other financial assets” in the consolidated statement of financial position, provided that is recoverable for the Group, usually through a reduction in future contributions and taking into consideration the limit established in IFRIC 14, IAS 19 The Limit on a Defined Benefit Asset, Minimum Funding Requirements, and their interaction.
Actuarial gains and losses arising from measurements of both the plan liabilities and the plan assets, including the limit in IFRIC 14, are recognized directly as a component of other comprehensive income.
Contributions to defined contribution benefit plans are recognized as an expense when the employees have rendered provide their services.
n) |
Transactions performed by each entity in a currency other than its functional currency are recognized using the exchange rates prevailing as of the date of the transactions. During the period, differences arising between the prevailing exchange rate at the date of the transaction and the exchange rate as of the date of collection or payment are recognized as “Foreign currency translation differences” in the consolidated statement of comprehensive income.
Likewise, at the end of each reporting period, balances receivable or payable denominated in a currency other than each entity’s functional currency are remeasured using the closing date exchange rate. Any differences are recorded as “Foreign currency translation differences” in the consolidated statement of comprehensive income.
The Group has established a policy to hedge the portion of revenue from its consolidated entities that is directly linked to variations in the U.S. dollar, through obtaining financing in such currency. Exchange differences related to this debt, which is regarded as the hedging instrument in cash flow hedge transactions, are recognized, net of taxes, in
F-49
other comprehensive income and are accumulated in an equity reserve and recorded in profit or loss in the term in which the cash flows hedged will be realized. This term has been estimated as ten years.
o) |
In these consolidated statements of financial position, assets and liabilities expected to be recovered or settled within twelve months are presented as current assets or liabilities, except for post-employment and other similar obligations. Those assets and liabilities expected to be recovered or settled in more than twelve months are presented as non-current items. Deferred income tax assets and liabilities are classified as non-current.
When the Group has any obligations that mature in less than twelve months but can be refinanced over the long term at the Group’s discretion, through unconditionally available loan agreements with long-term maturities, such obligations are classified as non-current liabilities.
p) |
Income tax expense for the period is determined as the sum of current taxes from each of the Group’s subsidiaries and results from applying the tax rate to the taxable income for the period, after deductions allowed have been made, plus any changes in deferred tax assets and liabilities and tax credits, both for tax losses and deductions. Differences between the carrying amount and tax basis of assets and liabilities generate deferred tax assets and liabilities, which are calculated using the tax rates expected to be applied when the assets and liabilities are realized or settled, based on tax rates that have been enacted or substantively enacted by the end of the reporting period.
Deferred tax assets are recognized for all deductible temporary differences, tax losses and unused tax credits to the extent that it is probable that sufficient future taxable profits exist to recover the deductible temporary differences and use the tax credits. Such deferred tax asset is not recognized if the deductible temporary difference arises from the initial recognition of an asset or liability that:
| ● | did not arise from a business combination; and |
| ● | at initial recognition provide it affected neither accounting profit nor taxable profit (loss). |
With respect to deductible temporary differences associated with investments in subsidiaries, associates and joint arrangements, deferred tax assets are recognized only to the extent that it is probable that the temporary differences will reverse in the foreseeable future and taxable profits will be available against which the temporary differences can be utilized.
Deferred tax liabilities are recognized for all temporary differences, except for those derived from the initial recognition of goodwill and those that arose from investments in subsidiaries, associates and joint ventures in which the Group can control their reversal and where it is probable that they will not be reversed in the foreseeable future.
Current tax and changes in deferred tax assets or liabilities are recorded in profit or loss or in equity, depending on where the gains or losses that triggered these tax entries have been recognized.
Any tax deductions that can be applied to current tax liabilities are credited to earnings within the line item “Income tax expenses”, except when uncertainty exists about their tax realization, in which case they are not recognized until they are effectively realized, or when they relate to specific tax incentives, in which case they are recorded as grants.
At the end of each reporting period, the Group reviews the deferred tax assets and liabilities recognized, and makes, any necessary adjustments based on the results of this analysis.
Deferred tax assets and deferred tax liabilities are offset in the consolidated statement of financial position if the Group has a legally enforceable right to set off current tax assets against current tax liabilities, and only when the deferred taxes relate to income taxes levied by the same tax authority.
F-50
q) |
Revenue is recognized when (or as) the control over a good or service is transferred to the customer. Revenue is measured based on the consideration to which the Group is expected to be entitled for said transfer of control, excluding the amounts collected on behalf of third parties.
The Group analyzes and takes into consideration all the relevant facts and circumstances for revenue recognition, applying the five step model established by IFRS 15: 1) Identifying the contract with a customer; 2) Identifying the performance obligations; 3) Determining the transaction price; 4) Allocating the transaction price; and 5) Recognizing revenue.
The following are the criteria for revenue recognition by type of good or service provided by the Group:
| ● | Electricity supply (sale and transportation): Corresponds to a single performance obligation that transfers to the customer a number of different goods/services that are substantially the same and that have the same transfer pattern. Since the customer receives and simultaneously consumes the benefits provided by the Company, it is considered a performance obligation met over time. In these cases, the Group applies an output method to recognize revenue in the amount to which it is entitled to bill for electricity supplied to date. |
| ● | Generation: revenue is recorded according to the physical deliveries of energy and power, at the prices established in the respective contracts, at the prices established in the electricity market by the current regulations, or at the marginal cost of energy and power, depending on whether they are unregulated customers, regulated customers or energy trading in the spot market are involved, respectively. |
| ● | Distribution of electricity: Revenue is recognized based on the amount of energy supplied to customers during the period, at prices established in the related contracts or at prices stipulated in the electricity market by applicable regulations, as appropriate. |
These revenues include an estimate of the service provided and not invoiced, at the reporting date (see Notes 2.3 and 28 and Appendix 2.2).
| ● | Other Services: mainly the provision of supplementary services to the electricity business, construction of works and engineering and consulting services. Customers control committed assets as they are created or improved. Therefore, the Company recognizes this revenue over time based on the progress, measuring progress through output methods (percentage of completion through the present date , milestones reached, etc.), or costs incurred (resources consumed, hours of labor spent, etc.), as appropriate in each case. |
| ● | Sale of goods: revenue from the sale of goods is recognized at a certain time, when control of the goods has been transferred to the customer, which generally occurs at the time of the physical delivery. Revenues are measured at the independent sale price of each good, and any type of applicable variable compensation. |
In contracts in which multiple committed goods and services are identified, the recognition criteria will be applied to each of the identifiable performance obligations of the transaction, based on the control transfer pattern of each good or service that is separate and an independent selling price allocated to each of them, or jointly to two or more transactions, when these are linked to contracts with customers that are negotiated with a single business purpose and the goods and services committed represent a single performance obligation and their selling prices are not independent.
Enel Américas determines the existence of significant financing components in its contracts, adjusting the value of the consideration if applicable, to reflect the effects of the time value of money. However, the Group applies the practical expedient provided by IFRS 15, and will not adjust the value of the consideration committed for the purpose of a significant financing component, if it expects, at the beginning of the contract, that the period between the payment and the transfer of goods or service to the customer is one year or less.
F-51
The Group excludes the gross revenue of economic benefits received when acting as an agent or broker on behalf of third parties from the revenue amount. The Group only records as revenue the payment or commission to which it expects to be entitled.
Because the Group mainly recognizes revenue for the amount to which it has the right to invoice, it has decided to apply the disclosure practical expedient provided in IFRS 15, through which it is not required to disclose the aggregate amount of the transaction price allocated to the performance obligations not met (or not met partially) at the end of the reporting period.
In addition, the Group evaluates the existence of incremental costs of obtaining a contract and costs directly related to the fulfillment of a contract. These costs are recognized as an asset, if their recovery is expected, and amortized in a manner consistent with the transfer of the related goods or services. As a practical expedient, the incremental costs of obtaining a contract are recognized as an expense, if the depreciation period of the asset that has been recognized is one year or less. Costs that do not qualify for capitalization are recognized as expenses at the time they are incurred, unless they are explicitly attributable to the customer.
As of December 31, 2020 and 2019, the Group has not incurred costs to obtain or perform a contract which meet the conditions for their capitalization. The costs incurred to obtain a contract are substantially commission payments for sales that, although are incremental costs, relate to short-term contracts or performance obligations that are met at a certain time, therefore, the Group has decided to recognize these costs as an expense when they occur.
Interest income (expenses) are recorded considering the effective interest rate applicable to the principal pending amortization, during the related accrual period.
r) |
Basic earnings per share are calculated by dividing net income attributable to shareholders of the Parent Company by the weighted average number of ordinary shares outstanding during the period, excluding the average number of shares of the Company held by other subsidiaries within the Group, if any.
Basic earnings per share for continuing and discontinued operations are calculated by dividing net income from continuing and discontinued operations attributable to shareholders of the Company (the numerator) by the weighted average number of shares of common stock outstanding (the denominator) during the year, excluding the average number of shares of the Company held by other subsidiaries within the Group.
Diluted earnings per share is calculated by dividing profit attributable to shareholders of the Parent Company by the weighted average number of ordinary shares outstanding during the period plus the weighted average number of ordinary shares of that would be issued on conversion of all the potential dilutive securities into ordinary shares, if any.
s) |
Article No. 79 of Law No. 18,046 (the Chilean Corporations Law) establishes that, unless unanimously agreed otherwise by the shareholders of all issued shares, listed corporations must distribute a cash dividend to shareholders on an annual basis, pro rata among the shares owned or the proportion established in the Company’s by-laws if there are preferred shares, of at least 30% of profit for each year, except when accumulated losses from prior years must be absorbed.
As it is practically impossible to achieve a unanimous agreement given Enel Américas’ highly fragmented share ownership, at the end of each reporting period the amount of the minimum statutory dividend obligation to its shareholders is determined, net of interim dividends approved during the period, and then accounted for in “Trade and other payables, current” and “Current accounts payable to related parties”, as appropriate, and recognized in equity.
F-52
The interim and final dividends are deducted from equity when approved by the relevant authority, which in the first case is normally the Board of Directors and in the second case is the responsibility of the shareholders as agreed at a General Shareholders’ Meeting.
t) |
Share issuance costs, only when they represent incremental expenses directly attributable to the transaction, are recognized directly in net equity as a deduction from “Share premiums,” net of any applicable taxes.
If the share premium account has a zero balance or if the costs described exceed the balance, they are recognized in “Other reserves”. Subsequently, these costs must be deducted from paid-in capital, and this deduction must be approved at the Extraordinary Shareholders’ Meeting, which occurs immediately after the date on which the disbursements were incurred.
Share issuance and placement expenses directly related to a probable future transaction are recorded as prepaid expenses in the statement of financial position. These expenses are recorded in equity upon issuance and placement of the shares, or in profit or loss when the conditions change and the transaction is no longer expected to occur.
u) |
The statement of cash flows reflects changes in cash and cash equivalents that took place during the period, determined with the direct method. It uses the following definitions and related meanings :
| ● | Cash flows: inflows and outflows of cash or cash equivalents, which are defined as highly liquid investments maturing in less than three months with a low risk of changes in value. |
| ● | Operating activities: the principal revenue-producing activities of the Group and other activities that cannot be considered investing or financing activities. |
| ● | Investing activities: the acquisition and disposal of long-term assets and other investments not included in cash and cash equivalents. |
| ● | Financing activities: activities that result in changes in the size and composition of the total equity and borrowings of the Group. |
4. SECTOR REGULATION AND ELECTRICITY SYSTEM OPERATIONS
a) Argentina
Argentina has shown signs of intervention in the electric market since the 2002 crisis. Within this context, the Government announced in 2012 its intention to replace the regulatory framework with a framework based on average cost.
Resolution No. 95/2013 was issued in March 2013, significantly changing the system for the remuneration of generation companies and setting new prices for capacity depending on the type of technology used and availability. It also established new values for the remuneration of non-fuel variable costs in addition to consider additional remuneration for energy generated. This Resolution also defined remuneration by type of technology and size of the plants, establishing for each case a recognition of fixed costs (to be determined based on fulfillment of availability), and variable costs plus additional remuneration (these two concepts are determined based on energy generated). Part of the additional remuneration is consolidated in a trust for future investments.
F-53
The commercial management and fuel delivery are centralized by Compañía Administradora del Mercado Mayorista de Electricidad Sociedad Anónima (CAMMESA).
On February 2, 2017, the Secretariat of Electric Energy (SEE) issued Resolution No. 19/2017 replacing Resolution No. 22/2016 issued by the SEE, which set the remuneration guidelines for existing power generating plants. Such resolution defines the minimum remuneration for the energy capacity by technology and scale, and allows thermal units to offer availability commitments with differentiated remuneration that is equal for all technologies. Thermal generators may declare the price of firm capacity to be committed for a three-year period per unit each summer period, and may also provide the information by summer and winter periods (adjustments can be made during the period). Remuneration will be received by each generation unit with committed capacity and will be proportional to its compliance, with the minimum remuneration calculated based on the minimum price. In addition, the thermal generator could offer additional capacity availability for bi-annual periods, which will be auctioned at a maximum price.
In relation to hydroelectric power plants, a new scheme is defined to assess energy capacity based on actual energy capacity available (that will result in a higher value for capacity than under the previous regulation). Likewise, a base capacity amount and an additional selected amount are defined for the period from May 2017 to October 2017, and another amount beginning in November 2017.
The remuneration amounts included in Resolution No. 19/2017 are denominated in U.S. dollars and will be translated to Argentine pesos using the last business day exchange rate published by the Argentine Central Bank, and will be effective for the term established in CAMMESA’s procedures. Subsequently, the SEE established that the exchange rate to be used to translate to Argentine pesos should correspond to the spot exchange rate from the day before the transaction due date, starting from November 2017.
Accordingly, the SEE instructed CAMMESA to acquire natural gas under fixed and uninterruptable conditions through the Electronic Gas Market (MEGSA) to supply thermal power generation.
On Wednesday, November 7, 2018, Resolution 2018-70-APN-SGE was published in the Official Gazette, enabling MEM Generators, Co-Generators, and Self-Generators to acquire their own supply of fuel for electricity generation, and allowing generators to obtain an additional margin when producing using their own fuel, only if the purchase price of gas is lower than the price recognized by CAMMESA. With this resolution, generators charge the Variable Cost of Production (CVP) according to the prices recognized and CAMMESA is responsible for continued supply to all other generators that do not acquire their own fuel.
On February 28, 2019, SRR and ME Resolution No. 1/2019 replaced SEE Resolution No. 19/2017 which established the guidelines for the remuneration of existing power plants.
On September 12, an agreement was entered into between Enel Generación Costanera, Enel Generación El Chocón, Enel Trading and CAMMESA, which establishes that there are no pending issues to be claimed on Availability Contracts and other financing contracts. This agreement provides the aforementioned companies with the following benefits: for Costanera the risk of penalties, interest contingencies and the waiver of future tariffs (provided in the agreements) were eliminated. In addition, this agreement allows for the collection of receivables assigned to Enel Generación Costanera in the transaction from Enel Generación El Chocón and Enel Trading.
In December 2019, through Resolution No. 12/2019, the new government decided to repeal Resolution No. 2018-70-APN-SGE, which allowed companies to manage their own fuel supply, leaving CAMMESA in charge again.
On February 27, 2020, the Department of Energy issued Resolution SE 31/2020, which replaced SRR and ME Resolution No. 1/2019, effective from February 1, 2020. Under this resolution, remuneration prices are set in pesos at the exchange rate of ARS 60 = US$ 1 and the resolution established the update of values in Argentine pesos. Resolution SE 31/2020 defines minimum power remuneration for technology and scale according to real availability, and additionally for thermal units the possibility of offering commitments on availability with equal differential remuneration for all technologies. CAMMESA will enable the thermal generator to file a statement up to 30 days
F-54
before the beginning of each quarterly period stating the firm power value to be committed by each unit, differentiating by summer, winter and the remainder of the year (adjustments can be made in the same period). The remuneration that a unit with power commitment will receive will be proportional to its compliance, and the minimum value is calculated based on the minimum price. The power remuneration will be affected depending on the usage factor of thermal generation equipment.
Through Decree 732 dated September 4, 2020, the Secretariat of Energy became part of the Ministry of Economy.
Non-Conventional Renewable Energy
In Argentina, on October 21, 2015, Law No. 27,191 for Renewable Energy was issued, replacing Law No. 26,190. The new regulation postpones reaching an 8% share in the national demand of energy with renewable sources for generation to December 31, 2017 and establishes a second stage goal of reaching a 20% share in 2025 by establishing milestones of 12% at the end of 2019 , 16% at the end of 2021 and 18% at the end of 2023. The enacted law creates a Fiduciary Fund (“FODER”) to finance works, grant tax benefits for renewable energy projects and establish exemptions for specific taxes and nationwide, provincial and municipality royalties until December 31, 2025. Customers classified as Large Users (>300 Kw) will comply on an individual basis with the renewable share goals, establishing that the price of contracts will not exceed US$ 113 per MWh, and establishing sanctions for those not fulfilling the goals.
Tariff Revisions
On February 1, 2017, ENRE issued Resolution No. 64/2017, which finalized the RTI and as a result establishes the annual remuneration recognized to Edesur of ARS14,539,836,941.
In connection with the new tariff structure and charges, MEyM instructed ENRE to limit the VAD increase as a result of the RTI process to be applied beginning on February 1, 2017 to 42% as compared to the VAD currently effective. The application of the remaining VAD increase would be made in two stages: the first stage in November 2017 and the second stage in February 2018.
In addition, it instructed ENRE to compensate Edesur and Edenor. for the difference in VAD as a result of the gradual application of the tariff increases in the RTI, in 48 installments beginning on February 1, 2018, which would be incorporated to the VAD determined on that date.
The new regulation also sets the method for updating the revenues of distribution companies based on fluctuations in economic prices, and all other matters related to service quality and supply requirements.
On December 1, 2017 through Resolution 602 the ENRE resolved to approve Edesur’s new Inherent Distribution Cost value, through the application of the mechanisms foreseen in the RTI. It jointly issued the Tariff Tables that reflect the Seasonal Prices (generation and transportation) contained in the Department of Electric Energy Resolution No. 1091 of 2017, as well as the new subsidy schemes for the Social Tariff and consumption savings bonus for residential users.
As a continuation of the same event, on January 31, 2018, the ENRE approved the new values in effect as of February 1, 2018. These tables include a new reduction in the subsidies of the wholesale price, taking it to a value of 90% of the seasonal price in 2017. In addition, it maintained the subsidies on the social tariff and a lower stimulation plan bonus, for reduction of electrical consumption. Accordingly, the Edesur tariff amounts to ARS 2.2828 / kWh without taxes beginning on February 1, 2018.
Simultaneously and in order to resume the normal structural conditions, the Argentine National Government decided not to extend the validity of the Electric Emergency Law (effective until December 31, 2017) and the Economic Emergency (effective until January 6, 2018).
F-55
In addition, on April 17, 2017, the MEyM issued a note which instructs the SEE to determine within 120 working days if there are pending obligations of the Agreement and the treatment to be granted, and to issue a final resolution report during the following 30 days. For these purposes, the SEE requested that Edesur, ENRE and CAMMESA provide the relevant information.
On July 30, 2018, and within the framework of the Ministry of Energy’s intention to make tariff increases more gradually, a commitment was signed between the MINE and Edesur through which Edesur would receive 50% of the increase related to the adjustment mechanism foreseen in the tariff beginning on August 1, 2018 and would receive the remaining 50% in 6 adjusted installments beginning on February 1, 2019 , and maintain the Investments Plan agreed in the RTI. The same commitment was also signed by Edenor simultaneously.
Under the agreed commitment, on August 1, 2018, 50% (7.925%) of the increase corresponding to the August 2018 application of the MMC to Distribution Added Value was applied. Together with this increase the intention to eliminate subsidies to the wholesale price of energy continued, which had been delayed by the devaluation in June and July. With an increase of almost 50%, this led to the price of the Distributors’ Large Users (demand greater than 300 kW/month) at approximately ARS$2,700 per MWh and the rest of the distributors’ demand at approximately ARS$1,400 per MWh. In addition, the ex-post adjustments were applied corresponding to the reimbursement of the AT Transportation costs of the previous Tariff Schedule (amendment of regulations) and to the amounts recognized as compensation for the Debit/Credit tax and the Safety and Hygiene Rates.
On December 10, ENRE issued Resolution 318/2018 in which it approved the methodology and updated the values of remuneration for the sub-transmission service (PAFTT) offered among the distributors Edesur, Edenor and Edelap, effective beginning on March 6, 2017. This was pending in the Comprehensive Tariff Review. This mechanism makes it possible to remunerate operating and maintenance costs, as well as the recognition of the related losses and the transfer to the tariff of the costs incurred by Edesur for this concept.
Additionally, by means of Resolution No. 366 of the Secretariat of Energy of December 27, 2018, it was announced that the new supply cost was approximately US$ 68 per MWh, which was 13% lower than that established in August 2018 due to the improvements in the gas contracts obtained by CAMMESA and the decrease in the international price of oil. In addition, the future Seasonal Prices to be transferred to the end users’ tariff continue with subsidy reductions foreseen by the authorities going from around 30% in February to a 15% subsidy in August 2019. However, these prices translated into local currency mean an initial increase of 26% in February 2019 and subsequent increases of 6% in May and August 2019.
On February 1, 2019, ENRE Resolutions 24/2019 and 26/2019 were issued in the Official Gazette. The former approved the values of the Rate Table effective from the invoicing related to the reading of meters after midnight on February 1, 2019 according to the increases in the Energy Stabilized Price and the Reference Price of power, as established by Resolution SGE 366/2019. Also, the FNEE increase is included, from ARS$ 15.50 per MWh to ARS$ 80 per MWh, while the AT Transport Cost had no changes. The second resolution (Resolution 26/2019) approves the new values of the Own Distribution Cost effective from the same period as the first (February 2019), stating that they will be applied from March 1, 2019.
In relation to the Social Rate that was no longer funded by the National State from January 1, 2019, both the Autonomous City of Buenos Aires and the Province of Buenos Aires undertook the commitment of continuing with this effective system. This is the reason why ENRE provides instructions Edesur to continue the application of the Social Rate, including Maximum Amounts.
On May 2, 2019, the new table of rates was issued; containing an update of the Seasonal Price for May through July 2019. The new feature is a differential price for the residential segment in order to keep it from increasing (per measures announced by the government on April 17, 2019). It will be applied beginning with consumption starting on May 1, 2019.
On July 18, 2019 by means of Resolution No. 189/19, ENRE finalized the regulations to be applied to the User-Generators (distributed generation). The most relevant aspects of the resolution are:
F-56
•The approval of the Injection Tariffs for Users-Generators of the various tariff categories, corresponding to the Stabilized Energy Prices (PEE) and the Stabilized Transport Price (PET).
•The parameters established for the Users-Generators of the T1 category with respect to the maximum value registered between the energy acquired or demanded and the energy injected.
•The parameters set for the User-Generators of the T2 and T3 categories with respect to the Capacity to be Invoiced for Distribution Service which will be the maximum value registered between the power consumed and the power injected.
Note that the whole set of regulations issued from those under Law 27,424 (on the Promotion of Distributed Generation) to ENRE Resolutions No. 111/19 and 189/19 affirm the position of Argentine regulation for the protection of Edesur's remuneration.
On September 19, 2019, Edesur entered into a Rate Chart Maintenance Agreement with the Argentine national government, by means of which the latter instructed ENRE, during the six-month period starting from August 1, 2019, to maintain the rate charts effective prior to such period for all tariff categories, which implies that Edesur will continue to receive the compensations included therein due for previous recoveries and deferrals (Resolution No. 26/19 issued by ENRE). The difference generated in VAD and the difference related to seasonal prices for the period between August 1, 2019 and December 31, 2019, will be recovered in 7 monthly installments starting from January 1, 2020. Within this framework, an agreement was reached to postpone the payment of all sanctions until March 1, 2020 at their original value plus any adjustments applicable at the time of payment, in 6 monthly installments, and Edesur committed to maintain the quality of its services.
On Friday, December 20, 2019, the National Congress approved Law No. 27,541 on Social Solidarity Reactivation of Production in the Public Emergency Framework of The Public Emergency, which declared a public emergency in economic, financial, fiscal, administrative, pension, tariff, energy, health and social matters until December 31, 2020. Article 5 empowers the National Executive Power to maintain the tariffs under federal jurisdiction for electricity and gas and to initiate a process of renegotiation of the Comprehensive Tariff Review in force in an extraordinary manner for a maximum period of up to 180 days, aimed at reducing the actual tariff burden on households, businesses and industries for the year 2020. Article 6 enables ENRE to maintain its competency during the emergency by, in Article 7, suspending the validity of the second paragraph of Article 124 of Law No.27,467
On Friday, December 27, 2019, the ENRE, under the provisions of Article 7 of Law No. 27,541, instructed Edesur not to modify the Tariff Schedule in force even though it is no longer subject to federal jurisdiction.
On March 17, 2020, through the Need and Urgent Decree issued by the National Executive Power No. 277/2020 an administrator was appointed for ENRE until December 31, 2020. This action together with the requirement to perform a technical, legal and financial audit and review of the previous management, was implemented in order to provide information and/or documentation to the PEN and to propose actions and measures that should be adopted.
On March 25, 2020 DNU 311/2020 was issued setting forth a limitation on the possibility of suspending basic services (180 consecutive days) including for users who had already been notified that they would be disconnected. Note that due to the Group’s efforts, especially through ADEERA, we determined that on the one hand the universe reached was restricted, and on the other this was an unprecedented event in measures of this type given its scope that encompasses telephone, internet and cable television. Although from the point of view of the media, the limitation will be communicated without clarification by the authorities, the fine print restricts the universe of users impacted to those that currently have a social tariff or those that receive some type of allowance or particular subsidy (Public Welfare Entities, Neighborhood Clubs, etc.).
On June 18, 2020 and before the expiration of the 180-day term established by Article 5 of Law 27,541 on Production Solidarity and Reactivation, Edesur proactively and through General Manager Note 55, sent a “Report” to ENRE, without implying consent to jurisdiction, which contained a detailed analysis of the evolution of the Integral Rate Review defined under the scope of ENRE Resolution No. 64/17, also considering its comparison with the actual
F-57
evolution from the effective date thereof on February 1, 2017, to December 31, 2020. Accordingly, the “Report” would be part of the Extraordinary Tariff Review established by that law. It was accompanied by the relevant claim for the related tariff update. Simultaneously, notes and copies were issued to the licensors (CABA and PBA) and the Secretariat of Energy, different municipalities in the concessions area, and the related public defenders’ offices. Finally, and almost simultaneously, on June 19, 2020 the Need and Urgent Decree (DNU) No. 543 was published in the Official Gazette, establishing, in the first place, the 180-day extension with a new deadline for this review on December 17, 2020. Secondly, it extended the benefits established by DNU 311/20 (restrictions to disruption of energy supply) in the case of users recording payment default in up to 6 consecutive or alternate bills (previously in up to 3), with due dates from March 1, 2020.
In order to progress toward a solution that allows for regularization of the debts of the authorities of the Province of Buenos Aires and the National State in relation to the supply in Underprivileged Neighborhoods, on August 8, 2020, authorities of Edesur met with the Governor of the Province of Buenos Aires. The proposal made by Edesur consists in an agreed procedure that guarantees to the Government of the Province of Buenos Aires that the funds that are received for that purpose will be used by Edesur exclusively for the execution of the electrical infrastructure in that Province.
Decree 756 was issued on September 21, 2020 and extends the benefits of DNU 311/2020 and 543/2020 in case of default or lack of payment of up to seven (7) consecutive or alternate invoices, due from March 1, 2020 for vulnerable customers (previously 3 and then 6); and extension of the term of application up to December 31, 2020.
On December 1, 2020, the lawyer María Soledad Manin (D.N.I. No. 28.447.869) was named as administrator for ENRE beginning on November 11, 2020, under the conditions and in accordance with the terms of Article 1 of Decree No. 277 of March 16, 2020. The most significant aspects of such article are summarized below.
On December 17, 2020, the National Executive Power issued DNU 1020, which postpones the tariff freeze for a maximum of 90 days, or until the tariff chart associated with a Transition Agreement becomes effective, whichever occurs first. It begins the Comprehensive Tariff Renegotiation Process, the final result of which will be a Final Renegotiation Agreement within a term lower than 2 years. This negotiation exclusively falls upon the regulatory entities. It authorizes regulators to set transition rates and segment rate categories. And for the purpose of complying with that indicated above, the DNU assigns powers to the entities (ENRE and ENARGAS). These powers include, in addition to those required by renegotiation processes, the capacity to perform transactions and/or settlements, compensations, etc.
On December 27, 2020, authorized representatives of the Argentine Government, the Province of Buenos Aires, the ENRE, Edenor and Edesur entered into an agreement to formalize the debt payment mechanism associated with the Framework Agreement, where companies assumed the commitment to assign those funds to works to improve the energy supply service.
b) Brazil
The legislation in Brazil allows the participation of private equity in the electricity sector, upholds free competition among companies in electricity generation and transmission, and defines criteria to avoid certain levels of economic concentration and/or market practices that may cause a decline in free competition.
In relation to the indicative plans made by authorities based on the contract requirements stated by distribution companies, the Ministry of Energy is involved in the expansion of the electricity system, both setting capacity quotas by technology and, promoting separate tender processes for thermal, hydraulic or renewable energies, or directly holding tender processes for specific projects. In addition, the operation is centrally where an independent operator (National System Operator “ONS” in its Portuguese acronym) coordinates centralized load dispatch based on variable production costs and seeks to ensure the supply of demand at minimum cost for the system. The spot market price is denominated Difference Settlement Price (PLD).
F-58
Generation companies are entitled to sell their energy on the regulated or unregulated market through contracts and trade their surpluses or deficits on the spot market. The unregulated market is aimed at significant users, with a limit of 2000 kW if they buy energy from any source or 500 kW if they buy Non-Conventional Renewable Energy (NCRE) (this limit changed to 2,500 kW from July 1, 2019, and to 2,000 kW from January 1, 2020 and will change to 1,500 kW, 1,000kW and 500kW, respectively from January 1, 2021, 2022 and 2023).
In the unregulated market, suppliers and their clients directly negotiate energy purchase conditions. In the regulated market, where distribution companies operate, the energy purchase must be performed through a bidding process instead, which is coordinated by the National Electricity Agency (“ANEEL” in its Portuguese acronym). Accordingly, the regulated purchase price used in the determination of tariffs for end users is based on average prices of open bids, and there are separate bidding processes for existing and new energy. Bidding processes for new energy consider long-term generation contracts in which new generation projects must address the growth of demand foreseen by distributors. The open bids for existing energy consider shorter contractual terms and are intended to address the distributors’ contractual requirements needs arising from maturity date of previous contracts. Each bidding process is centrally coordinated, Where ANEEL establishes maximum prices and, as a result, contracts where all distributors involved in the process buy pro rata from each offering generator are entered to.
These regulatory mechanisms ensure the creation of regulatory assets/liabilities, whose tariff adjustment for possible deficits will be made from in the subsequent tariff adjustments (March 15 for Enel Distribución Río S.A. (formerly Ampla) April 22 for Enel Distribución Ceará S.A. (formerly Coelce), July 4, for Enel Distribución São Paulo (formerly Eletropaulo) and October 22 for Enel Distribución Goiás). This mechanism has existed since 2001, and is called the Securities Compensation Account - Part A “CVA” in its Portuguese acronym) which is aimed at maintaining consistent operating margins for the dealer by allowing tariff revenue from costs of Part A.
The CVA helps maintain market stability and allows for the creation of deferred costs, which can be compensated through rate adjustments based on the necessary rates to compensate deficits from the previous year. These regulatory assets (CVAs and others) are part of the assets that can be compensated at the end of the concession, in the event these cannot be compensated through rates. Accordingly, in compliance with IFRS, these regulatory assets can be recorded in the accounting records (see Note 3.d.1).
In 2014, Brazil experienced severe drought conditions. In November 2014, the system reached its maximum risk of energy rationing. The average reservoir limits were 1% below the last rationing. To cover the overpriced cost of energy, the government created the ACR account through bank loans to be paid off within two years through the rates. Payments into the ACR account ended in September 2019, and the remaining balance of this fund was accredited to distributors in October 2019.
In January 2015, based on the mismatches between the costs recognized in tariffs and actual costs other than those related to operations of distribution entities, ANEEL began the application of a Pricing System known as “Tariffs Flags” of additional monthly charges over the tariff to the customers, provided that the marginal cost of the system is higher than the regulatory standard.
The Tariff Flags System is comprised of three levels of colored flags: Red, Yellow and Green.
From January 2015 until the reporting date of these financial statements, the supplemental values of the flags have been changing based on new expectations of future generation costs. The values currently used (since November 2019) for the flags are:
| ● | Green flag rate: Favorable generation conditions |
| ● | Yellow flag rate: BRL1,343 per 100 (kWh) |
| ● | Red flag rate - level 1: BRL4,169 per 100 (kWh) |
| ● | Red flag rate - level 2: BRL6,243 per 100 (kWh) |
F-59
In conclusion, under this tariff system the generation cost that is currently transferred to the customer only once a year (when the annual tariff adjustment is performed), will have a variation on a monthly basis and the customer will be able to better manage its electricity consumption.
Energy tenders
Regarding energy tenders under regulated regime, the Brazilian government performs several tenders each year in order to change the composition of the energy bid.
Given the measures to address COVID-19, the tenders in 2020 were postponed and a future date has not yet been defined, based on Ordinance No. 134/2020 issued by the Ministry of Mining and Energy.
Energy exports
On June 2, 2020, Enel Green Power Cachoeira Dourada S.A. (CDSA) was authorized to export electricity to Argentina and Uruguay, as per MME Ordinance No. 226/2020. The authorization will be effective until December 31, 2022.
Energy sales
On April 17, 2020 Enel Trading Brasil S.A. (Enel Trading), a company from the Group established for energy sales, was authorized to act as an Electric Energy Commercialization Agent in Brazil.
Distributed Generation
General features
Regulatory REN Resolution 482/2012 and its revision in 2015 regulated the connection of the distributed generation systems to consumers connected to the distribution network, as well as the Electricity Compensation System (“SCEE”), where the energy injected by the Distributed Generation systems is compensated in the energy billed to the consumer that has this system. This situation created a large incentive for investment in Distributed Generation, as it expanded the market share of the companies that created products for sale to consumers.
Definitions of Distributed Generation
Distributed generation allows the use of any source of renewable energy and qualified co-generation. The term distributed micro-generation refers to power plants with an installed power capacity of up to 75 kilowatts (kW) and distributed mini-generation refers to power plants with higher than 75 kW and less than or equal to 5 MW, which are connected to the distribution network through the consumption units installation.. The regulation prohibits power stations from qualifying as distributed microgeneration when they have been subject to registration, concession, permission or authorization, or have: (i) begun commercial operation; (ii) transferred their electric energy to a distribution concessionary or permission holder, where the distributor has to identify those cases.
Reviews, Tariff Adjustment and others
The Electricity Compensation System, established by Regulatory Resolution No. 482/12 presents distortions in the remuneration of the distribution and transmission infrastructure, as well as in charges, by consumers who have a Distributed Generation system. These distortions affect the remuneration of the distributors’ investment and also the energy rate of other consumers in the concession area, who do not have distributed generation installed. A review of the regulations is planned for 2021, with changes to the incentives currently in force.
F-60
Tariff Review of Enel Distribución Rio (2018)
On March 13, 2018, ANEEL approved the provisional result of the Fourth Periodic Tariff Review of Enel Distribución Rio, starting from February 15, 2018, which was consolidated upon evaluation of the contributions made in the Public Hearing No. 078/2017. The result leads to an average effect for consumers of 21.04%, and 19.94% for consumers connected to High Voltage – HV, and 21.46% for those connected to Low Voltage – LV. It established the T component of X Factor at 0.00% and technical losses at 9.1%.
Tariff Adjustment of Enel Distribución Ceará S.A (2018)
On April 17, 2018, ANEEL approved the result of the adjustment of Enel Distribución Ceará, starting from April 22, 2018. The result leads to an average effect for consumers of 4.96 %, and 7.96% for consumers connected to High Voltage – HV and 3.8% for those connected to Low Voltage – LV.
Adjustment of Enel CIEN (2018)
Resolution No. 2408, dated October 22, 2018, established the permitted annual revenue (RAP). The values for Enel CIEN are: Garabi I (RAP: BRL 172,667,795.35 and adjusted PA: BRL 6,579,727.76) and Garabi II (RAP: BRL 179,367,079,58 and adjusted PA: BRL 6,834,803.35).
Tariff Adjustment of Enel Distribución São Paulo (2018)
On July 4, 2018, ANEEL approved the tariffs applicable for consumers. The result of this process was a tariff adjustment index of +16.4%, composed of an economic adjustment of +10.5% and a financial adjustment of +5.9%. Upon removal of the financial adjustment of the previous year (0.6%), the average effect for the consumer was +15.8%, wich was larger for consumers connected to High Voltage (+17.7%) as compared those connected to Low Voltage who recorded a low increase of 15.1%.
Tariff Adjustment of Enel Distribución Goiás S.A. (2018)
On October 16, 2018, ANEEL approved the result of the review of Enel Distribución Goiás, starting from April 22, 2018. The result leads to an average effect for consumers of 18.54%, with 26.52% for consumers connected to High Voltage - HV and 15.31% for those connected to Low Voltage – LV.
Enel Generación Fortaleza
The Fortaleza Thermal Power Generation Plant (CGTF), a thermal power plant that runs on natural gas, had a discrepancy with Petrobras, the power plant's gas supplier, leading to the unilateral termination of the supply contract by Petrobras. Enel filed a lawsuit against Petrobras to reestablish the gas supply to the plant, and secured fuel supply under the court's rulings, until August 31, 2020 when CGTF and Petrobras reached a mutual agreement to withdraw the lawsuit, without prejudice to the maintenance of the contract. These processes are expected to be finalized in the short-term.
Proposal for a solution to the short-term lack of market liquidity
Brazil has been a short-term illiquid market since 2015, the year in which several legal limits were granted to hydro generators for their assumption of non-hydrological risks. This is because the thermal dispatch performed outside the cost merit order, the import of energy without physical guarantee and the impact of the structuring power plants (Belo Monte, Jirau and Santo Antônio power plants) displaced their generation and exposed them to the short-term market under non-manageable factors unrelated to hydrological risk. Accordingly, the hydro generators would be exempted to pay their debts in the short-term market, which currently amounts to BRL 8 billion and represents about 70% of the total amount recognized of the market.
F-61
After the enactment of Law No. 14,052/2020 on September 8, 2020, which establishes new conditions for renegotiating the hydrological risk, ANEEL opened a public consultation to regulate the compensation of non-hydrological risks assumed by hydropower plants during the period 2013 through the present date. The term to submit contributions ends on October 23, 2020 and, after the issuance of a Regulatory Resolution, the agents will know the individual economic compensation per power plant and the related extension term of their concession, which is limited to 7 years. Considering this information, and subject to the waiver of legal proceedings and payment of their debts through the present date sustained by precautionary measures, the agents will be able to enter into the contract with ANEEL within 60 days after becoming aware of the results.
After the enactment of Law 14,052 on September 8, 2020, which establishes new conditions for the renegotiation of hydrological risk, on December 1, 2020, ANEEL issued Regulatory Resolution 895/2020 (REN 895/2020) to regulate the compensation of non-hydrological risks assumed by hydropower plants since 2013. As the next steps to take, within 90 days following the REN 895/2020, the CCEE must issue the economic compensation by plant and the related extension period for its concession, limited to 7 years, and the agents will have over 60 days to enter into the agreement and withdraw from the judicial processes. This agreement will resolve the impasse noted by the hydraulic generators in the courts, and will reestablish the liquidity in the Brazilian market in the short term.
Official Communication No. 18 of January 4, 2019
ANEEL, under its regulatory attributions, ordered that, when a billing error occurs for reasons attributable to the distributor, the limit of setback to refund consumers will be 10 years instead of 36 months.
Tariff adjustment of Enel Distribución Rio (2019)
Enel Distribución Rio’s tariff review was provisionally approved on March 13, 2018, according to Resolution No. 2.377, when tariffs were adjusted to 21.04%. At that time, the values of the Regulatory Remuneration Base (RRB) and the history of non-technical losses from 2019 to 2022 were provisional. The final calculation of these issues occurred in the Tariff Adjustment of 2019, based on the final calculation of the remuneration basis, BRL 20,052,539.92 were added to Plot B and the difference between the amount approved in 2018 and the final value of 2019 resulted in BRL 21,819,141.88, at the price of March 2019, included as financing items in the Tariffs Adjustment (RTA) of 2019.
The following values were defined for non-technical losses: 19.80% (for 2019), 19.39% (for 2020), 18.98% (for 2021) and 18.57% (for 2022).
The tariff adjustment of Enel Distribución Rio was approved by ANEEL on March 12, 2019, with an average effect for consumers of 9.70%, with 9.72% for low voltage consumers and 9.65% for medium and high voltage customers. This adjustment was effective from March 15, 2019 to March 31, 2019.
ANEEL authorizes CCEE to reach agreement with banks for payment of ACR account
ANEEL authorized the Chamber of Electricity Commercialization (CCEE) to conclude an agreement with a group of eight banks to push up the approval of the so-called ACR Account, a mechanism for the transfer of funds to distributors to cover costs with involuntary exposure in the short-term market and the thermal power plant dispatch between February and December 2014. The measure will withdraw BRL 8.4 billion from electricity rates until 2020, and allow for an average reduction in rate adjustments of 3.7% in 2019 and 1.2% in 2020.
ANEEL incorporated the effects of the agreement into the tariffs of the companies for which adjustments were made between December 2018 and March 2019 through an extraordinary tariff review: Cepisa, Ceron, Electroacre, Energisa Borborema, Light, and Enel Distribución Rio.
F-62
Extraordinary Tariff Review of Enel Distribución Rio
The extraordinary review was necessary due to the decision of ANEEL’s Board of Directors on March 20, 2019, which authorized CCEE to reach the agreement with the group of eight banks to anticipate the payment of the so-called CDE Conta- ACR by September 2019. This decision was reflected in Enel Distribución Rio’s tariff, which was 7.59% (average for all consumers). For low-voltage consumers, the adjustment changed the increase from 9.72% to 7.49%, and for medium- and high-voltage customers, the approved rate changed from 9.65% to 7.89%. The review was applied from April 1, 2019 to March 14, 2020.
Tariff Review of Enel Distribución Ceará (2019)
On April 18, 2019, ANEEL approved the result of the fifth periodic tariff review of Enel Distribución Ceará, effective from April 22, 2019. The result leads to an average effect on consumer rates of 8.22%, which is 7.87% for high-voltage consumers and 8.35% for low- voltage consumers. The T component of X the Factor was adjusted by 1.17%, recording technical losses of 9.52% in injected energy and non-technical losses of 7.56% in the low-voltage market.
Adjustment of Enel CIEN (2019)
Resolution No. 2,565, dated June 25, 2019, established the annual income allowed (RAP) resulting in the values of Enel CIEN: Garabi I (RAP: BRL 180,711,108.53 and PA: BRL -6,391,867.71) and Garabi II (RAP: BRL 187,722,462.73 and PA: BRL -6,662,275.47).
It should be noted that Enel CIEN should have updated its tariffs in 2019, but the regulator postponed this process until 2020, and its effects were considered in the related adjustment during 2020.
ANEEL Regulatory Resolution No. 853/2019
On August 16, 2019, ANEEL established the provisions related to the quality of the public services for energy transmission, associated with the availability and operating capacity of the Transmission Functions - FT Converter; the new rules become effective starting from January 1, 2020.
Tariff Review of Enel Distribución São Paulo (2019)
On July 2, 2019, ANEEL approved the result of the Fifth Periodic Tariff Review of Enel Distribución Sao Paulo, starting from July 4, 2019, which was consolidated after the evaluation of the contributions submitted at the Public Hearing No. 011/2019. The result is an average effect on consumers rates of 7.03%, with 8.46% for high-voltage consumers and 6.48% for low-voltage consumers.
During the review, the parameters that will be effective for 4 years were established, until the next review in 2023. Such parameters are: technical and non-technical losses (commercial), RAB, operating costs, doubtful accounts and X Factor (productivity and regulatory operating costs).
Tariff Adjustment of Enel Distribución Goiás S.A. (2019)
On October 22, 2019, ANEEL approved the result of the adjustment of Enel Distribución Goiás, starting from October 22, 2019. The average effect on consumer rates is -3.90% and consisted of (i) an economic adjustment of -4.42%, with -5.18% on Plot A and + 0.76% on Plot B, and (ii) financial components of + 6.25% discounting the financial components considered in the last tariff process quantified at 5.73%.
The result leads to an average effect on consumers of -3.90%, with -2.89% for high-voltage consumers” and -4.32% for low-voltage consumers.
Tariff Adjustment of Enel Distribución Rio (2020)
F-63
On March 10, 2020, ANEEL approved the result of the adjustment of Enel Distribución Rio, starting from March 15, 2020. The result leads to an average effect on consumers of +2.71 %, with +3.38% for high-voltage consumers and +2.48% for low-voltage consumers.
Tariff Adjustment of Enel Distribución Ceará (2020)
On April 14, 2020, ANEEL approved the tariff adjustment of Enel Distribución Ceará, with an average effect of 3.94% on end consumers. The regulator entity postponed the tariff increases for the next three months, as a response to the economic emergency created by the COVID-19 crisis and for the purpose of protecting captive customers. The tariffs will be fixed until June 30, 2020 and will be adjusted on July 1, 2020.
It should be noted that the loss of revenue due to the non-application of the new tariffs in the mentioned period will be compensated with a delay in the payment of the CDE installments, for May, June and July 2020. Those payments will be duly adjusted by the Selic rate and recomposed to the CDE fund for Enel Distribución Ceará in up to 5 equal installments starting from August 2020. Lastly, the difference in revenue between the approved tariff and extended tariff will be adjusted by the market occurring up to June 30, 2020 and considered in the subsequent tariff process.
CIEN Designation
On June 19, the Ministry of Mining and Energy published ordinance No. 255, which establishes that Enel CIEN by official designation will continue operating the facilities of Garabi I until a new operator is designated through a tender process, probably starting from August 2022. Until that date, Enel CIEN will receive annual revenue (RAP) calculated based on current criteria and methodology.
Tariff Review of Enel CIEN (2019)
Through Regulatory Resolution No. 2700, dated June 23, 2020, ANEEL approved the final result of the tariff review of Enel Cien, relating to 2019, which was proposed for 2020. The new permitted annual revenue will become effective retroactively from July 1, 2019 and will still be updated upon tariff adjustment of 2020.
The values for Enel CIEN are: Garabi I (RAP: BRL 145,870,451.38) and Garabi II (RAP: BRL 175,884,264.79).
Tariff Adjustment of Enel Distribución São Paulo (2020):
On June 30, 2020, ANEEL approved the tariff adjustment of Enel Distribución São Paulo, with an average effect of 4.23% on end consumers, with 6.00% average, for high-voltage consumers and 3.58% for low-voltage consumers.
It should be noted that the adjustment already considered the effects due to anticipation of the COVID-19 account, thus reducing a greater increase in tariffs for the consumer, which without such resource would be 12.22%.
Tariff Adjustment of Enel CIEN (2020)
Resolution No. 2,725, dated July 14, 2020, established the permitted annual revenue (RAP) for public service concessionaries for energy transmission, due to availability of the transmission facilities under their responsibility.
The values for Enel CIEN are: Garabi I (RAP: BRL 148,620,461.29 and PA: BRL -34,591,321.34) and Garabi II (RAP: BRL 179,251,086.59 and PA: BRL -12,198,352.85).
Rate Adjustment of Enel Distribución Goiás S.A. (2020)
On October 20, 2020, ANEEL approved the result of the rate adjustment by Enel Distribución Goiás, starting October 22, 2020.
F-64
The result leads to an average effect on consumers of +4.28%, with +6.63% for consumers connected at High Voltage - HV and +3.36% for those connected at Low Voltage - LV.
ANEEL considered a negative financial adjustment of -7.84%, due to the amounts received in the COVID-19 Account.
ANEEL Regulatory Resolution No. 874/2020
On March 10, 2020, ANEEL approved the new methodology for the calculation and frequency for updating the remuneration rate of regulatory capital (WACC) used to review the tariff or revenue of electric energy distributors, transmitters and generators. Enel Distribución Sao Paulo, Enel Distribución Goias, Enel Distribución Rio and Enel Distribución Ceará will only know the WACC in 2023, which will be applied for their new tariff review. It should be noted that ANEEL also defined the WACC for transmitters that should have performed their Tariff Review in 2019, but was postponed until 2020 (as in the case of Enel CIEN).
ANEEL Regulatory Resolution No. 877/2020
On March 17, 2020, ANEEL approved the methodological review of the Xp Factor associated with productivity (Pd component), applicable to distributors from April 1, 2020. The purpose of the new methodology is to reflect the recent history of productivity gains and cyclical market variances.
For companies whose concession contracts have not been extended, the value of the Xp factor is established in the tariff review, recording no subsequent tariff adjustments. Accordingly, for Enel Distribución Sao Paulo and Enel Distribución Ceará, the adjustment of the Xp factor will only be applied in 2023. In the case of distributors with a new contract (Enel Distribución Goiás and Enel Distribución Rio), the value of the component is calculated in the annual tariff adjustments, based on current data.
ANEEL Regulatory Resolution No. 878/2020
For 90 days (starting from March 24, 2020), this regulatory resolution established measures to preserve the provision of electricity distribution public service due to the public emergency related to the COVID-19 pandemic, which include: prohibiting the suspension of supply according to consumption units (customers from urban and rural areas) allowing the suspension of delivery of the monthly printed invoice to consumers (replacing it with electronic invoices or bar codes), prioritizing emergency services and those destined to attend to essential services, among various other measures, to contribute to social isolation actions and prioritize the continuous and reliable supply of electric energy.
This was amended on July 21, 2020 by Regulatory Resolution 891/2020, which extended its term to December 31, 2020, and reduced the prohibition of shut offs for consumers in the low-income residential sub-class.
Federal Government Provisional Measure No. 950/2020
This measure is intended to increase the discount of the Social Tariff for consumers to 100% with billing of up to 220 KW per month, using CDE resources for this coverage, and allow financial resources to be assumed by CDE in order to face the impact on the electricity sector as a result of the COVID-19 pandemic.
ANEEL Dispatch No. 986/2020
The difference in spot prices in 2019 brought CCEE to an amount of BRL 2 billion. On April 7, ANEEL approved the transfer of this surplus to free consumers (BRL 500 billion) and distributors (BRL 1.4 billion) for future costs of ancillary service charges and operation restrictions.
Reduction of Transmission Charges
As a measure to provide liquidity to the electricity sector due to the effects of COVID-19, on April 20, 2020, ANEEL approved the anticipation of the financial effects of the Adjustment Installment for the months of April, May, and
F-65
June 2020. The immediate effect is BRL 144 million of discounts to charges for the use of the transmission system by distribution companies (90%) and free consumers (10%), recording similar discounts in May and June.
Decree No. 10,350/2020
On May 18, 2020, the Brazilian government published Decree No. 10,350/2020 that regulated the COVID-19 account, a sector rescue loan to distribution companies in response to the COVID-19 pandemic. The COVID-19 account consists of a loan obtained from a group of public and private banks, destined to preserve the liquidity of companies from the sector and, at the same time, alleviate the impacts of the crisis affecting the consumers. Subsequently, these values will be included in the 2021 rate adjustments and continue for 5 years until the loan is fully repaid.
ANEEL Dispatch No. 1,511/2020
Due to the COVID-19 pandemic, on June 1st, 2020 ANEEL suspended, in an exceptional and temporary manner, the application of the Tariff Flags system, until December 31, 2020.
ANEEL Regulatory Resolution No. 885/2020
Regulatory Resolution No. 885/220 was published on June 23, 2020, which regulates Decree No. 10,350/20 and established (i) the cost structure of the COVID-19 account, (ii) the conditions for transferring funds, (iii) the manner in which the account is managed, (iv) the structure of charges for amortization of financial transactions, (v) the settlement of credit transactions, (vi) clauses regulating the acceptance term for the decree provisions, and (vii) limits to the collection of funds by the Distribution Companies, for a total amount of BRL 16 billion.
ANEEL Regulatory Resolution No. 888/2020
Regulatory Resolution No 888/2020, was published on July 9, 2020, and regulates the electricity supply conditions for the public lighting service. Electricity distribution companies will no longer be able to charge for collecting the municipal tax (COSIP) after the next tariff review. Until then, the charge is limited to 1%.
Federal Government Provisional Measure No. 988/2020
On September 1, 2020 the Federal Government entered into a contract to establish a Provisional Measure with special measures to reduce tariffs in the pandemic period and also in the medium and long-term. The measure is effective for 120 days, after which it no longer valid.
After an extensive political and regulatory debate, on February 4, 2021, MP 998 was passed by the Federal Senate and sent to the president for approval as law. Enel made a significant contribution to the definition of this law, in order to guarantee positive impacts for the group and mitigate problems and risks found in the initial formulations. The approved text includes (i) a capacity contracting mechanism; (ii) the removal of incentives for renewable energy starting 12 months after the publication of the law; (iii) the approval of the use of funds to contain increases in the Distribution rate; (iv) instructions for developing competitive mechanisms that will allow Distributors to dispose of energy surplus; (v) definition of a special type of sales agent to represent small-scale free consumers in the free market, with the possibility of suspending the offer in the case of payment default. The bill was expected to be passed, without veto, by the end of February.
ANEEL Dispatches No. 2,177/20, 2,353/20, 2.640/20, 2,914/20, 3,197/20 and 3,490/20
The dispatches established the values of the resources of the COVID-19 account transferred to the distribution concessionaries, which were received from July to December 2020.
F-66
ANEEL Order No. 3,364/2020
Given the adverse hydropower conditions, on November 30, 2020, ANEEL decided to revoke Order No. 1,511/2020 and reactivated the rate flag system, which was reinstated on December 1, 2020.
Non-Conventional Renewable Energy
ANEEL holds auctions by technology considering the expansion plan set by the planning agency, the Empresa de Pesquisa Energética (“EPE”), so that the target amount set for non-conventional renewable energy capacity is met.
Tariff revisions
In Brazil, there are three types of tariff adjustments: i) Ordinary Tariff Reviews (“RTO”) which are conducted periodically in accordance with the provisions in the concession contracts (for Enel Distribución Ceará and Enel Distribución São Paulo every 4 years and for Enel Distribución Río and Enel Distribución Goiás every 5 years); (ii) Annual Adjustments (“IRT”) since Brazil, unlike other countries, does not automatically index its tariffs to inflation; and (iii) Extraordinary Reviews (“RTE”) when important events have occurred that may affect the financial situation of the distributors.
The final tariff revisions of Enel distributors were performed in 2018 (Enel Distribución Río and Enel Distribución Goiás) and 2019 (Enel Distribución Ceará and Enel Distribución São Paulo). The Enel distributors’ next revisions will be performed in 2023.
c) Colombia
In 1994, Act 142 or the Public Utility Act (Ley de Servicios Públicos Domiciliarios) and Act 143 or the Electricity Act (Ley Eléctrica) were issued, which established the general criteria and policies regulating the public utility service provision in Colombia, as well as the procedures and mechanisms for its regulation, monitor and oversight.
The Electricity Act make the constitutional approach viable, regulates the generation, transmission, distribution and sale of electricity, creates a market and competitive environment, strengthens the industry and delimit the government intervention. Considering the characteristics of each activity or business, general guidelines were established for the development of the regulatory framework, creation and implementation of the rules that would allow free competition in the power generation and sales industries, while the guidelines for the transmission and distribution industries were aimed to address these activities as monopolies, looking for competitive conditions if possible.
The main institution in the electricity sector is the Ministry Mining and Energy, which through the Mining Energy Planning Unit, (Unidad de Planeación Minero Energética, or UPME) develops the national Energy Plan and the Generation and Transmission Expansion Plan. The Energy and Gas Regulatory Commission (Comisión de Regulación de Energía y Gas or CREG) and the Public Service Superintendency (Superintendencia de Servicios Públicos, or SSPD) regulate and oversee, respectively, the companies in the industry. In addition, the Superintendency of Industry and Commerce is the national authority for free trade protection issues.
The electricity industry operates on the basis of electricity-selling companies and the large consumers are able to buy and sell energy through bilateral contracts or on a short-term energy exchange market, called the “energy exchange” that operates freely according to supply and demand conditions. In addition, there are two mechanisms to promote the expansion of the system: i) auctions of Firm Energy within a “Reliable Charge” scheme and ii) long-term auctions to enhance the Non-conventional Renewable Energy Sources (FRNCE). The market is operated and managed by XM, which is in charge of the National Dispatch Center (Centro Nacional de Despacho, CND), and the Manager of the Commercial Exchange System (Administrador del Sistema de Intercambios Comerciales, ASIC).
Act 1715 of 2014 was created, "By means of which the integration of non-conventional renewable energies into the National Energy System is regulated", which is also intended to promote the efficient management of energy, addressing both energy efficiency and the response to the demand. Such act also promotes the development and use
F-67
of non-conventional resources, mainly those of a renewable nature, in the national energy system, through their integration into the electricity market, their participation in non-interconnected areas and other energy uses as a necessary means for sustainable economic development, the reduction of greenhouse gas emissions, and the security of energy supply.
In 2019, the CREG established general rules of market behavior for agents performing activities of home utility services of electric power and fuel gas. CREG considers it is necessary to establish a regulatory framework that, in addition to the specific market rules and obligations, defines general rules of behavior that promote and allow further development of: free access to networks and facilities that are monopolies by nature, free choice of service providers and the possibility of user migration, transparency, neutrality, economic efficiency, free competition and the non-abuse of dominant positions.
Due to the worldwide and national situation caused by the COVID-19 pandemic, in March 2020 the National Government declared a State of Economic, Social and Ecological Emergency throughout the national territory and ordered the mandatory preventive lockdown of all the inhabitants of the territory; these measures have generated the issuance of different transitory standards and regulations by the MME, CREG and SSPD among others, which looks forward to guarantee the continuous and stable provision of public residential services and mitigate the economic and social effects in the electric energy and natural gas sectors.
The National Government has published the final documents containing the analysis and proposals of the “Energy Transformation Assignment" which will be established in the sector route sheet, as a guide for the main transformations that will be adopted in the future. The Mission's recommendations were disseminated and reported to the sector's agents for review and comment in February 2020.
Non-Conventional Renewable Energy
In 2014, Law No. 1,715 was enacted, creating a legal framework for the development of non-conventional renewable energies, which established guidelines on the declaration of public utility, tax, tariff and accounting incentives. As part of the regulation, the Ministry of Mining and Energy issued Decree No. 2,469 of 2014, which established the energy policy guidelines for the delivery of self-generation surpluses. The regulations issued by the CREG have been aimed at allowing the participation of Non-Conventional Renewable Energy Sources (NCREs) in the Reliability Charge mechanism, and strengthened the participation of demand through large- and small-scale self generation.
In this manner, for the purpose of having an electric energy generation matrix that is resilient and complementary while reducing the emission of greenhouse effect gasses (GEI) and promoting competition in the sector, the Ministry of Mining and Energy (MME), the Mining Energy Planning Unit (UPME) and the Energy and Gas Commission (CREG) have made a number of adjustments to the tender regulations, defining two separate, sealed envelope tenders with voluntary participation, exclusively for new FNCER projects, with a price ceiling, the product of which is a 15-year pay of what was contracted contract model in COP/kWh and with an inception date of January 1, 2022.
In May 2019, Law 1955 - 2018-2022 National Development Plan “Pacto por Colombia, Pacto por la Equidad” was approved. The following items of the final wording are emphasized: i. Tax Benefit: whoever makes investments in FNCER shall have a right to deduct from their income in a period of no more than 15 years, 50% of the total investment made. ii. Energy matrix – FNCER Energy Purchase in long-term contracts: commercializing agents will be obliged to purchase electric energy from FNCER (between 8% and 10% of their purchases). However, the Ministry of Mining and Energy or the delegated entity, shall regulate the scope of the obligation.
Tariff Revisions
CREG is the entity that defines the method by which distribution networks are paid. Distribution charges are reviewed every five years and updated monthly according to the Producer Price Index (“PPI”). Currently, these charges include the new replacement value of all operational assets, the Administration, Operation and Maintenance (“AOM”) and non-electrical assets used in the distribution business.
F-68
The current distribution charges for Codensa were issued by CREG in October 2009.
Additionally, CREG issued Resolution No. 95 in 2015, which defined a method for calculating the regulated remuneration tariff (“WACC”) for electricity transmission and distribution, as well as for natural gas transportation and distribution.
In February 2018, CREG issued Resolution No. 015 of 2018, which definitively decides on the Distribution Remuneration Methodology for the new tariff period, which determines the remuneration over the existing asset base, the presentation of investment plans, the remuneration of operating and maintenance expenses and defines ways to decrease losses and service quality. Finally, in December 2019, the Commission published CREG Resolution 189 of 2019, which approves the necessary variables for calculating the revenue and charges associated with the electricity distribution activity for the commercialization market in which Codensa operates.
In September 2018, CREG issued Resolution No. 114 of 2018, by which it determined the general principles and conditions that must be met by the mechanisms for the marketing of electric energy in order for its prices to be recognized in the component of costs of energy purchases from the regulated user.
In February 2019, CREG issued Resolution No. 015 of 2019, which modifies the rate of return for the electricity distribution activity (with 11.79% for the year 2019, 11.64% for the year 2020, 11.5% for the year 2021 and 11.36% from the year 2022 onwards), which responds to the aforementioned methodology.
In May 2019, the Ministry of Mining and Energy issued Resolution No. 40,459. This new regulation from the ministry revises the public policy guidelines on Advanced Measurement Infrastructures (AMI) in the public electric power service.
In May 2019, Law No.1,955, the National Development Plan, was approved, which contains the following guidelines:
| ● | Subsidies to customers in categories 1, 2 and 3 are extended until December 31, 2022. |
| ● | A special transitional regime is created to ensure the sustainability of efficient service provision: i) surcharge per kilowatt hour consumed to support the Business Fund in the national territory (COP 4/kWh); and ii) additional 1% contribution to the SSPD regulated in article 85 of Law No.142 of 1994. |
| ● | Law No.143 of 1994 is revised to extend the restriction on vertical integration and restrict integration through business groups. |
| ● | The Ministry of Mining and Energy (or the entity designated to perform this function) will regulate the scope of the aforementioned measures. |
In September 2019, the SSPD issued the regulation of the national surcharge of COP 4 / kWh, as part of the measures required to guarantee the provision of electric power service under the charge of the companies operated by the SSPD. This rate applies to strata 4.5 and 6; commercial and industrial and will be in force from November and will be retroactive to July and its collection is considered third party income.
In October 2019, CREG issued Resolution No. 129 of 2019; which establishes the formula for the transfer in the energy purchase component to the regulated user of the prices of the contracting mechanism that sign contracts resulting from the auction referred to in Resolution No. 40,590 of 2019 of the Ministry of Mining and Energy.
In December 2019, CREG issued draft Resolution No. 155 of 2019, which contains the conceptual bases for the remuneration of the marketing activity.
In December 2019 CREG issued Resolution No. 198 of 2019, extending the application of the subsidies to leave 1 and tier 2 customers.
F-69
On March 17, 2020, the National Government declared a state of economic, social and environmental emergency throughout the country, to reflect the public crisis affecting the country due to the new coronavirus (COVID-19), which has been extended until February 28, 2021.
On June 24, 2020, CREG issued Resolution No. 122 of 2020, approving the final distribution for Enel Codensa. In its approval, CREG resolved the appeal filed by the Company with respect to Resolution No. 189 of 2019.
In addition, CREG in its final approval makes the correction of the Base of Assets, the incorporation of additional events in the calculation of quality indicators and the retroactive application of service quality incentives.
The Constitutional Court declared the unenforceability of Article 313 of Law 1955 of 2019, through ruling C-504, which indicates that the surcharge collection agents must abstain from billing, charging, or collecting the surcharge during billing periods immediately following December 3, 2020. The portfolio cannot be written off, and collection proceedings must be arranged to be transferred to the corporate fund.
The Constitutional Court declared the unenforceability of Article 18 of Law 1955 of 2019, through ruling C-484, which implies that, as of 2021, the contribution will be reliquidated both for CREG and SSPD, implying a reduction in both contributions.
d) Peru
Law No. 25,844, the Law on Electricity Concessions, indicates that the Peruvian electricity sector is divided into three large segments: generation, transmission and distribution, such that no more than one activity can be developed by the same company. The Peruvian electricity system is known as the National Interconnected Electricity System (SEIN), in addition to some isolated electricity systems.
According to the abovementioned Law, generation companies’ operations will be subject to the provisions of the Economic Operations Committee for the National Interconnected System (COES) for the purpose of coordinating their operations at minimum cost, guaranteeing the secure supply of electricity and best use of energy resources. The COES manages power and energy transfers between generators, considering contractual injections and withdrawals, and values these transfers on a monthly basis, as well as compensations to the transmission system owners and compensations to other generators according to the regulations established by OSINERGMIN in this regard.
The main purposes of Law No. 28,832 are i) to ensure the sufficiency of efficient electricity generation, which reduces the electricity system's exposure to price volatility and the risk of rationing due to energy shortage; and to ensure a competitive electricity rate for consumers; ii) to reduce administrative intervention in the determination of generation prices through market solutions; and iii) to promote effective competition in the generation market.
The main changes introduced by the law refer to the short-term market participation of generation companies, distribution companies, and free large customers, including both distributors and free customers as participants in the COES, and modifying the latter's structure. It also added the bid mechanism to be followed by electricity distribution companies for the purposes of entering into electricity supply contracts with generation companies for the public supply of electricity and, optionally, in the case of free users.
The sale of energy by generators to distributors for the purpose of the public supply of electricity, shall be performed through bids or bilateral contracts (with a regulated maximum price - bar rate). The bid mechanism has the purpose of establishing a system that promotes investments in new generation capacity through long-term electricity supply contracts and firm rates with distribution companies.
Supreme Decree No. 026-2016-EM approves the Wholesale Electricity Market Regulations (MME Regulations) and incorporates the definition of “MME” which is composed of the short-term market (“MCP”) and the complementary service allocation, operative inflexibility, and congestion income allocation mechanisms. The participants authorized to purchase in the MCP are: generators to meet their supply contracts, distributors to meet the needs of their free users (up to 10% of maximum demand), and large users to meet up to 10% of maximum demand. The COES will calculate
F-70
marginal energy costs and marginal congestion costs, provisional daily values of the transactions in the MME, and the results will be reported to participants on the COES website. The participants must have payment guarantees, and the COES will take action in the event of non-compliance with these.
Legislative Decree No. 1,002 creates a promotional regime for non-conventional renewable sources of energy “RER”; through tenders for specific technologies (to cover up to 5% of the electrical power demand) with a mechanism of guaranteed revenue paid by the demand through a tariff charge in the connection fee.
Legislative Decree No. 1,221 amends the Law on Electricity Concessions, mainly introducing the following changes:
| ● | The Ministry of Energy and Mining will determine a Technical Responsibility Zone for each distribution concessionary. |
| ● | It establishes the performance of studies and the setting of Value-Added Distribution (VAD) for each distribution concessionary providing services to more than 50,000 suppliers. |
| ● | Recognition of an additional charge for technological innovation projects previously approved by OSINERGMIN, equivalent to a maximum percentage of the annual revenue. |
| ● | Incentives to improve the quality of the service from the actual quality until the target value is achieved. |
Through Executive Decree No. 018‑2016‑EM the Regulations of the Electricity Concessions Law is amended, which are mainly: the incorporation of the possibility to install supplies with intelligent metering owned by the distribution Company and its investment costs and operation and maintenance costs (O&M) will be considered in the VAD; the proposed Technical Responsibility Zones (ZRT) will be published; technological innovation projects will be included in the VAD and they will be compensated through a charge for power.
In addition, with respect to customers who may choose to belong to the regulated or unregulated market, Executive Decree No. 018-2016 maintained the following provisions:
| ● | The range for customers who may choose to be regulated or unregulated fluctuated between 200 and 2,500 kW. |
| ● | The condition change shall be notified to the current supplier at least one year in advance. The user must remain in the new condition for at least 3 years. |
| ● | Customers whose maximum demand is greater than 2,500 kW are necessarily unregulated customers. |
Legislative Decree No. 1041 modified various articles of the Law on Electricity Concessions (D. Law No. 25,844) and the Law to Ensure Efficient Development of Electricity Generation (Law No.28,832). Through Executive Decree No. 001-2010-EM, D. Leg No. 1041 was regulated, which amends the electricity regulatory framework to dispatch natural gas and the remuneration of power and energy. Concerning the transmission regime, the payment responsibility of the rate base of the Guaranteed Transmission System was finally amended to assign it exclusively to the users.
Law No. 29970 declares the national interest in implementing measures to guarantee the country's energy security through the diversification of energy sources, the reduction of external dependency, and the reliability of the energy supply chain. Law No. 30543, published on March 3, 2017 and regulated by Supreme Decree No. 022-2017-EM published on August 16, 2017, eliminates the energy security guarantee charge (CASE) derived from Law No. 29970.
Through Legislative Decree No. 1,451 the article 122 of the Law on Electricity Concessions was amended, which incorporates provisions for those cases of vertical integration that do not qualify as acts of concentration according to the related regulations.
F-71
The Regulations of the Electricity Wholesale Market were approved through Executive Decree No. 026‑2016‑EM and are expected to be effective from January 1, 2018 through Executive Decree No. 033-2017-EM.
Through Executive Decree No. 022-2018-EM (amended by Executive Decree No. 026-2018-EM) the Regulation of Electricity Supply Tenders, approved by Executive Decree No. 052-2007-EM, was amended in order to establish provisions on the procedure for the evaluation of proposals to amend contracts resulting from tenders.
Through Executive Decree No. 237-2019-EFthe National Competitiveness and Productivity Plan was approved, which is intended to promote economic growth that will improve the population’s well-being in the medium term. There are 9 priority objectives, including Environmental Sustainability (OP9), which guidelines (9.1) include the Strategy for Financing Climate Change Measures and (9.4) the Strategy for Renewable Energy, Electromobility and Clean Fuels
Through Executive Resolution No. 006-2019-EM the Multisectoral Commission for the Reform of the Electricity Subsector was created. Its purpose is to perform an analysis of the electricity market, in order to make proposals aimed at the adoption of measures that guarantee the sustainability and development of the Electricity Sub-sector. The commission is effective for 24 months.
Through Resolution OSINERGMIN No.144-2019-OS/CD, the Technical Procedure of COES No. 26 “Calculation of Firm Capacity” was amended. This parameter is used to determine the revenue from capacity of the generators in the COES, as well as the contracting level that they can achieve. Starting from September 2019, the Firm Capacity for RER power plants using wind, solar or tidal technology will be determined considering the energy production in the peak hours of the system.
On January 6, 2021, Law No. 31,112 was published to establish prior control of corporate concentration operations. By publishing this law, which supposes the prior approval of its regulations and other regulatory modifications provided by the law itself, the content of Law No. 26,876 is repealed, with the exception of article 13, which modifies article 122 of Decree Law No. 25,844, the Law on Electricity Concessions (related to restrictions to concentration in the electricity sector), as well as the Emergency Decree No. 013-2019 which established prior control of corporate concentration operations starting March 1, 2021.
Supreme Decree No. 044-2020-PCM of March 15, 2020 and its modifying regulations, declared a National State of Emergency, which has been extended until February 28, 2021, due to the Coronavirus outbreak in the country. During this period, different mandatory social distancing measures were established, along with restrictions to the freedom of assembly and freedom of transit. Likewise, it establishes that the State guarantees access to public services and essential products and services (established in the Supreme Decree).
Through Vice-ministerial Resolution No. 001-2020-MINEM/VME, published on March 19, 2020, it was established that electricity generation, transmission and distribution companies must: (i) activate their security protocols in order to safeguard their employees, contractors or third parties; (ii) prioritize actions to ensure continuity of electricity services, and (iii) present to the OSINERGMIN and MINEM their Contingency Plans to ensure continuity of the service specifying the coordinator in charge.
Through Executive Decree No. 035-2020, published on April 3, 2020, it was established that distribution companies can divide in up to 24 months the receipts issued in March 2020 or which comprise any consumption during the state of national emergency of vulnerable users (those with consumption of up to 100 kWh/month or users from non-conventional rural electrical systems supplied with autonomous photovoltaic power). The Government recognizes compensatory interest for the mentioned division, which is paid to companies using the resources of the Energy Social Inclusion Fund. In addition, it considers the suspension of meter reading activities and delivery of physical receipts (the delivery of digital receipts is authorized), suspending the obligation to physically attend to users in Customer Service Centers and authorizes billing using an average of consumption.
Through Executive Decree No. 062-2020, issued on May 28, 2020, the range of customers that can access division of their bills was extended to those with consumption that is greater than 100 kWh/month and less than 300 kWh/month.
F-72
In this case, the standard establishes that the division can be applied to bills from May and those that comprise consumption while the State of Emergency is in force, with the compensatory interest being partly subsidized by the Government (according to the consumption range) and the difference is assumed by the users. Finally, the standard also establishes that non-compliance with the Electricity Service Quality Technical Standard and the Rural Electricity Service Quality Technical Standard will not lead to payment of compensation and sanctions until 60 calendar days subsequent to the end of the State of Emergency.
Through Emergency Decree No. 074-2020, issued on June 27, 2020, the “Electricity Bonus” was created, which is a subsidy that covers consumption pending payments in the period from March to December 2020 and that are not involved in a user complaint process with consumption of up to 125 kWh/month (subject to conditions). Such bonus will cover the debts up to PEN 160, since the resources will be transferred directly to the distribution companies.
The procedure for application of the Electricity Bond was approved through Resolution No. 080-2020-OS/CD issued by the Governing Board of OSINERMGIN, and was issued on July 9, 2020. Such standard establishes the considerations that distribution companies must consider to identify the beneficiaries of the Electricity Bonus and the procedure for its execution.
Urgent Decree No. 105-2020, issued on September 10, 2020, modified Urgent Decree No. 074-2020 including customers with prepayment supply and those associated to collective supply in the “Electricity Bonus.”
Supreme Decree No. 031-2020-EM, published on December 21, 2020, repeals Supreme Decree No. 043-2017-EM, which establishes the provisions for determining the prices of natural gas for electricity generation.
OSINERGMIN Directors’ Council Resolution No. 218-2020-OS/CD, published on December 24, 2020, approves the “Activities-Based Costs Manual, applicable to electricity distribution companies.”
Non-Conventional Renewable Energy
In Peru, a target up to 5% has been set as the non-conventional renewable energy share in the country’s energy system (“ERNC” in its Spanish acronym). It is a nonbinding target and the regulatory agency, OSINERGMIN, holds differential quota tenders by technology and limited prices to help reach the goal.
In 2016, the Fourth Tender of Energy Supply with Renewable Energy Resources (“RER” in its Spanish acronym) was carried out. The tender was awarded to thirteen projects consisting of two biomass plants, two solar plants, three wind plants and six hydroelectrical plants, and will add 430.1 MW to the SEIN.
Tariff Revisions
In Peru, the process for the determination of the distribution rate is carried out every 4 years, and is called "Value Added Distribution Fixation" (“VAD”). Exceptionally, the last process lasted 5 years, since one year was required to implement the last reforms approved in 2015 by Legislative Decree No. 1221.
The process of determining the VAD for Enel Distribución Perú corresponding to the 2018-2022 period took place during 2018. The regulator reviewed the cost studies proposed, made observations and the distribution companies technically supported their proposals. At the end of that tariff process, in general, the company, in general, maintained its annual income received in the 2013-2017 tariff period.
It should be noted that the Peruvian regulation follows the regulatory scheme of an efficient model company, so that in each tariff period the efficient investment costs are established, as well as the standard operation and maintenance costs that will be recognized to each distribution company under the parameters and criteria defined by the OSINERGMIN (regulatory body). As of the tariff period of 2018, the efficient model company is built individually for each distributor with more than 50,000 customers.
F-73
ii.Limits on integration and concentration
In general, all of the countries have legislation in effect that defends free competition and, together with specific regulations that apply to the electricity market, defines criteria to avoid certain levels of economic concentration and/or abusive market practices.
In principle, the regulators allow the participation of companies in different activities (e.g. generation, distribution, and commercialization) as long as there is an adequate separation of each activity, for both accounting and company purposes. Nevertheless, most of the restrictions imposed involve the transmission sector mainly due to its nature and to the need to guarantee adequate access to all agents. In Argentina and Colombia, there are specific restrictions if generation or distribution companies want to become majority shareholders in transmission companies.
Regarding concentration in a specific sector, in Argentina, there are no specific limits that affect the vertical or horizontal integration of a company. In Peru, integration is subject to the authorization of the Instituto Nacional de Defensa de la Competencia y Protección de la Propiedad Intelectual (“INDECOPI”), an antitrust authority that is able to establish commercial conduct. In Colombia, no company may have a direct or indirect market share of over 25% in electricity sale activities, although two criteria have been established for generating activity. In May 2019, Law No.1,955 of the National Development indicates that in order to ensure the sustainability of the provision of the service on the Caribbean Coast, the limits on the participation in the commercialization activity may be higher, than the current regulatory limit by possibly as much as 10 additional percentage points.
One of these relates to participation limits depending on market concentration (HHI) and the size of the players according to their Firm Energy, and the other relates to pivotally conditions in the market depending on the availability of resources to meet system demand. In addition, Colombian companies created after the Public Service Law was enacted in 1994, can only engage in activities that complement generation/sales and distribution/sales. Finally, in Brazil, with the changes taking place in the power industry under Law No. 10,848/2004 and Decree No. 5,163/2004, the ANEEL gradually perfected regulations, eliminating concentration limits as no longer compatible with the prevailing regulatory environment. However, regulatory approval is required for consolidations or mergers to take place between players operating within the same business segment.
In July 2019, in Colombia, CREG No. 079 of 2019, the purpose of which is to ensure that the level of contracting between vertically integrated and/or controlled companies does not change until CREG approves its own definitive path with respect to maximum contracting.
F-74
iii.Unregulated customers market
In all of the countries where the Group operates, distributing companies can supply their customers under regulated or freely-agreed conditions. The supply limitations imposed on the unregulated market are as follows:
| | | |
Country |
| kW threshold |
|
Argentina | | >30 kW | |
Brazil | | >2,000 kW or >500 kW (1) | |
Colombia | | >100 kW or 55 MWh/month | |
Peru | | >200 kW (2) | |
(1): The > 500 kW limit is applied if energy from renewable sources is purchased, which is encouraged by the Government through a toll discount. As of January 1, 2021, the limit of 2,000 KW decreases to 1,500 KW.
(2): D.S. 018-2016-EM established that:
5. NON-CURRENT ASSETS OR DISPOSAL GROUPS HELD FOR SALE OR HELD FOR DISTRIBUTION TO OWNERS AND DISCONTINUED OPERATIONS
5.1. Operation Central Rio Negro (CODENSA).
In October 2018, Codensa’s Board of Directors approved the start of the sale process of the Small Hydroelectric Power Plant PCH Rio Negro (the “Río Negro SHP”).
The Rio Negro SHP was received as a result of the merger with Empresa de Energía de Cundinamarca, or EEC, in 2016. Considering that Codensa was constituted after 1992, the restriction of vertical integration is applicable and therefore it cannot operate or commercially represent any generation asset. Due to the above, the SHP was operated by Emgesa S.A. E.S.P. under a usufruct agreement.
After a selling process in 2019, the transaction was successfully carried out with the signing of the asset’s purchase/sales contract on December 26, 2019. 82% of the agreed purchase price was effectively collected by Codensa and the balance is subject to the total transfer of real estate, whose process is in progress.
Taking into account the sales process and what is established in IFRS 5 “Non-current assets held for sale and discontinued operations”, prior to the classification as non-current asset held for sale, the PCH was recorded at fair value. During 2019, there were additions due to mandatory compliance with environmental issues and fair value was updated.
As of June 30, 2020, assets and liabilities held for sale were derecognized, since to date Codensa does not have control over the transferred assets.
F-75
Non-current assets and liabilities held for sale as of December 31, 2019, are detailed as follows:
| | |
| | 12.31.2019 |
| | ThUS$ |
| | |
| | |
| Property, plant and equipment | 11,326 |
| | |
| TOTAL NON-CURRENT ASSETS | 11,326 |
| | |
| | |
| Other non-current non-financial liabilities | 3,791 |
| | |
| TOTAL NON-CURRENT LIABILITIES | 3,791 |
| 6.1. | ACQUISITION OF ENEL DISTRIBUCIÓN PAULO S.A. (FORMERLY ELETROPAULO METROPOLITANA DE ELETRICIDADE DE SAO PAULO S.A.) |
On April 17, 2018, subsidiary Enel Brasil S.A. through wholly-owned subsidiary Enel Investimentos Sudeste S.A. (Enel Sudeste) launched a voluntary public tender offer for all the shares issued by the Brazilian electric energy distributor Enel Distribución Sao Paulo S.A., subject to the acquisition of more than 50% of those shares in order to obtain control of it.
On June 4, Enel Sudeste received approval from the Free Competition authority in Brazil, the Conselho Administrativo de Defensa Econômica (“CADE”). On that same date, the success of the public tender offer and acquisition of the initial auction was confirmed, and completed through payment of the price and transfer of shares in favor of Enel Sudeste, which took place on June 7, 2018, the date from which the accounting for the purchase as established in IFRS 3 Business Combinations was applied. Specifically, 122,799,289 shares were acquired, all of the same class, corresponding to 73.38% of the share capital of Enel Distribución Sao Paulo S.A. for a total of BRL5,552,984 (US$1,484 million).
Complementing the above, on June 11, 2018, Agência Nacional de Energía Eléctrica (ANEEL) issued a technical note approving the acquisition of control of Enel Distribución Sao Paulo S.A., which was produced with the purchase of the shares mentioned in the previous paragraphs. This technical note was issued by ANEEL on June 26, 2018.
Since the shareholders of Enel Distribución Sao Paulo S.A. had a deadline of July 4, 2018 to sell the remaining shares to Enel Sudeste at the same price offered in the public tender offer (BRL 45.22 per share), during June and July the additional participation increases took place. In effect, on June 22 and June 30 and on July 2 and July 4, 2018,the amount of 4,692,338, 4,856,462, 14,525,826 and 9,284,666 shares were acquired, respectively, equivalent to a total of BRL 1,516,362 (US$ 384 million). These subsequent acquisitions represented an increase in ownership from 73.38% to 95.05%.
On September 19, 2018, the Management Council of Enel Distribución Sao Paulo S.A. approved an increase in the company’s share capital of BRL 1,500,000, through the issuance of 33,171,164 new shares. Enel Sudeste concurred in this capital increase, acquiring 33,164,964 of the new shares (US$ 395 million) with which it increased its ownership in the company to 95.88%.
F-76
The functional currency of Enel Distribución Sao Paulo S.A. is the Brazilian Real. Enel Américas has converted the initial effects of the business combination to its presentation currency, using the exchange rates current as of the acquisition date. As of the closing date of each reporting period, the financial statements of Enel Distribución Sao Paulo S.A. are converted following the accounting criteria detailed in Note 2.7.3.
Enel Distribución Sao Paulo S.A. has an area under concession that encompasses 4,526 km², which concentrates most of the gross domestic product and the highest demographic density in Brazil, with 1,581 consumer units per km², which corresponds to 33.3% of total electric energy consumed in the State of Sao Paulo and 9.3% of Brazil’s total. It covers the demand of approximately 7.2 million consumer units, it has 7,355 internal collaborators and has an infrastructure composed of 156 substations.
As of the acquisition date, Enel Distribución Sao Paulo S.A. contributed revenue from operating activities in the amount of ThUS$2,214,855 and profit before taxes in the amount of ThUS$39,227 to the income of Enel Américas for the year ended December 31, 2018. If the acquisition had occurred on January 1, 2018, it is estimated that, for the year ended December 31, 2018 consolidated revenue from operating activities would have increased by ThUS$3,587,161 and profit before taxes would have decreased by ThUS$14,678.
Assets acquired and liabilities assumed at the acquisition date
Definitive values
| | | |
Identifiable net assets acquired | Fair Value | | Fair Value |
| ThR$ | | ThUS$ |
Cash and cash equivalents | 1,037,105 | | 273,439 |
Other current non-financial assets | 400,311 | | 105,544 |
Trade and other current receivables | 3,948,137 | | 1,040,949 |
Inventories | 275,129 | | 72,539 |
Current tax assets | 41,179 | | 10,857 |
Other non-current financial assets | 3,205,469 | | 845,140 |
Other non-current non-financial assets | 1,056,711 | | 278,608 |
Trade and other non-current receivables | 205,249 | | 54,115 |
Intangible assets other than goodwill | 11,055,574 | | 2,914,866 |
Property, plant and equipment | 65,804 | | 17,350 |
Investment property | 44,049 | | 11,614 |
Deferred tax assets | 3,229,417 | | 851,455 |
Other current financial liabilities | (2,266,501) | | (597,576) |
Trade and other current payables | (3,551,676) | | (936,420) |
Other current provision | (759,862) | | (200,342) |
Other current non-financial liabilities | (600,990) | | (158,454) |
Other non-current financial liabilities | (2,505,299) | | (660,537) |
Other non-current payables | (567,355) | | (149,586) |
Other non-current provision (*) | (2,788,278) | | (735,146) |
Deferred tax liabilities | (3,009,203) | | (793,394) |
Provisions for non-current employee benefits | (3,327,621) | | (877,347) |
Total | 5,187,349 | | 1,367,674 |
(*) includes contingent liabilities in the amount of ThBRL 1,252,000 (ThUS$330,097), which the Company recorded as liabilities assumed at the date of acquisition. The main contingent liabilities identified in the business combination are disclosed in note 35.3.b.32-48.
F-77
Determination of goodwill
Definitive values
| | |
| ThR$ | ThUS$ |
Cash consideration transferred | 7,069,345 | 1,863,874 |
Non-controlling interests assumed in the acquisition | 256,616 | 67,658 |
(-) Net assets acquired and liabilities assumed | (5,187,349) | (1,367,674) |
Goodwill determined | 2,138,612 | 563,858 |
Goodwill is mainly attributable to the value of the synergies that are expected to be achieved through the integration of Enel Distribución Sao Paulo S.A. into the Group. These synergies are related, among others, to the generation of new businesses, efficiencies in investments and administrative costs.
The amounts paid to obtain control of Enel Distribución Sao Paulo S.A. are shown below:
| |
Cash and Cash equivalents to obtain control of Enel Distribución Sao Paulo | ThUS$ |
| |
Amounts paid for the acquisition in cash and cash equivalents | (1,863,874) |
Amounts of cash and cash equivalents in the acquired entity | 273,439 |
Total | (1,590,435) |
F-78
a) The details of cash and cash equivalents as of December 31, 2020 and 2019 are as follows:
| | |
| Balance as of | |
Cash and Cash Equivalents | 12-31-2020 | 12-31-2019 |
Cash balances | 308 | 830 |
Bank balances | 641,870 | 593,747 |
Time deposits | 749,671 | 1,168,331 |
Other fixed-income instruments | 115,144 | 176,089 |
Total | 1,506,993 | 1,938,997 |
Time deposits have a maturity of three months or less from their date of acquisition and accrue the market interest for this type of short-term investment. Other fixed-income investments are mainly comprised of resale agreements maturing in 90 days or less from the date of investment. There are no restrictions for significant amounts of cash availability.
b) The detail of cash and cash equivalents by currency is as follows:
| | | | | |
| | Balance as of | |||
Currency |
| 12-31-2020 |
| 12-31-2019 |
|
Chilean peso | | 637 | | 142,875 | |
Argentine peso | | 65,480 | | 49,848 | |
Colombian peso | | 381,754 | | 185,424 | |
Brazilian real | | 741,282 | | 699,418 | |
Peruvian sol | | 147,458 | | 188,655 | |
U.S. dollar | | 170,335 | | 672,694 | |
Euros | | 47 | | 83 | |
Total | | 1,506,993 | | 1,938,997 | |
c) The following table records the components of “Other payments for operating activities” line item in the Statement of Cash Flows:
| | | | | | | |
Other Payments from Operating Activities |
| 12-31-2020 |
| 12-31-2019 |
| 12-31-2018 |
|
Payment for other taxes (VAT, ICMS, PIS/COFINS, Sales taxes, Custom taxes, taxes on bank transfers) (1) | | (2,587,437) | | (3,613,564) | | (2,774,024) | |
Payments for collections made under Codensa Hogar contract (2) | | (349,481) | | (578,708) | | (514,595) | |
Payments for the Energy Development Account (CDE) (3) | | (736,116) | | (1,148,756) | | (926,642) | |
Other miscellaneous itemized payments for operating activities (4) | | (340,754) | | (382,405) | | (1,012,571) | |
Total other payments from operating activities | | (4,013,788) | | (5,723,433) | | (5,227,832) | |
F-79
(1) The main elements of payments for other taxes are related to:
| ● | ICMS: This is a state value added tax (VAT) in Brazil, applied on the sale of telecommunications and transportation goods and services. The ICMS payments were ThUS$2,025,223, ThUS$2,672,785 and ThUS$2,154,158 for the years ended December 31, 2020, 2019 and 2018, respectively. |
| ● | PIS/COFINS taxes. In Brazil, the “Programa de Integração Social” (PIS) is a social contribution tax, payable by corporations, targeted to finance the payment of unemployment insurance and allowance for low paid employees, while the “Contribuição para o Financiamento da Seguridade Social” (COFINS) is a federal contribution tax, based on gross revenues of business sales. The total amounts paid for PIS/COFINS were ThUS$442,734, ThUS$827,589 and ThUS$474,826 for the years ended December 31, 2020, 2019 and 2018, respectively. |
| ● | Payment for taxes on sales in Peru for ThUS$86,768, ThUS$85,089 and ThUS$81,694 for the years ended December 31, 2020, 2019 and 2018, respectively. |
(2) Our Colombian subsidiary Codensa entered into an arrangement with a third party that develops a business with Codensa’s customers. By virtue of this arrangement, Codensa manages the collection of that third party’s receivables, since they are billed as part of the Codensa’s invoices issued monthly. The payments are related to the monthly collected amounts under the collection management contract, whereas the collections are presented in the line item “Other collections from operating activities”.
(3) In Brazil, Law No. 10,438/2002 created the “Conta de Desenvolvimento Energético” (“CDE”). The CDE is a government fund that aims to promote the development of alternative energy sources, promote globalization of energy services and subsidizes low-income residential customers. The fund is financed through charges included in consumers and generators tariffs and government contributions.
(4) Other miscellaneous payments for operating activities includes several types of individually non-significant payments related to operating activities.
d) Reconciliation of liabilities arising from financing activities:
| | | | | | | | | | | |
| | Cash flows from financing | Changes that do not represent cash flows | | |||||||
Liabilities from financing activities | Balance at | From | Used | Paid interest | Total | Changes in fair | Exchange | Financial costs (1) | New financial | Other changes | Balance at |
| ThUS$ | ThUS$ | ThUS$ | ThUS$ | ThUS$ | ThUS$ | ThUS$ | ThUS$ | ThUS$ | ThUS$ | ThUS$ |
Short-term loans | 1,422,681 | 1,359,012 | (1,689,240) | (320,948) | (651,176) | 3,990 | (80,673) | 323,080 | — | 957,126 | 1,975,028 |
Long-term loans | 4,818,468 | 582,583 | (91,207) | — | 491,376 | 9 | (516,196) | 9,757 | — | (784,683) | 4,018,731 |
Lease liabilities | 190,269 | — | (77,292) | (5,755) | (83,047) | — | (15,290) | 9,286 | 45,639 | (4,297) | 142,560 |
Assets held to cover liabilities arising from financing activities | (67,937) | 114,004 | — | — | 114,004 | 9,691 | (152,874) | (15,286) | — | (1,907) | (114,309) |
Total | 6,363,481 | 2,055,599 | (1,857,739) | (326,703) | (128,843) | 13,690 | (765,033) | 326,837 | 45,639 | 166,239 | 6,022,010 |
| | | | | | | | | | | |
| | Cash flows from financing | Changes that do not represent cash flows | ||||||||
Liabilities from financing activities | Balance at | From | Used | Paid interest | Total | Changes in fair | Exchange | Financial costs (1) | New financial | Other changes | Balance at |
| ThUS$ | ThUS$ | ThUS$ | ThUS$ | ThUS$ | ThUS$ | ThUS$ | ThUS$ | ThUS$ | ThUS$ | ThUS$ |
Short-term loans | 4,264,806 | 3,401,133 | (7,150,100) | (605,522) | (4,354,489) | 4,812 | 8,608 | 571,136 | — | 927,808 | 1,422,681 |
Long-term loans | 4,535,549 | 1,525,820 | (297,385) | — | 1,228,435 | — | (50,138) | — | — | (895,378) | 4,818,468 |
Lease liabilities | 121,973 | — | (59,177) | (9,077) | (68,254) | — | 10,866 | 11,666 | 114,963 | (945) | 190,269 |
Assets held to cover liabilities arising from financing activities | (113,974) | 95,512 | — | — | 95,512 | (10,363) | (32,030) | — | | (7,082) | (67,937) |
Total | 8,808,354 | 5,022,465 | (7,506,662) | (614,599) | (3,098,796) | (5,551) | (62,694) | 582,802 | 114,963 | 24,403 | 6,363,481 |
| | | | | | | | | | | | |
| | Cash flows from financing | Changes that do not represent cash flows | | ||||||||
Liabilities from financing activities | Balance at | From | Used | Paid interest | Total | Acquisition of subsidiaries | Changes in fair value | Exchange differences | Financial costs (1) | New | Other changes | Balance at |
| ThUS$ | ThUS$ | ThUS$ | ThUS$ | ThUS$ | ThUS$ | ThUS$ | ThUS$ | ThUS$ | ThUS$ | ThUS$ | ThUS$ |
Short-term loans | 688,497 | 4,295,111 | (2,902,062) | (432,515) | 960,534 | 612,755 | 413 | (230,631) | 560,160 | — | 1,673,078 | 4,264,806 |
Long-term loans | 4,352,974 | 2,929,441 | (1,393,822) | — | 1,535,619 | 758,494 | — | (418,440) | | — | (1,693,098) | 4,535,549 |
Lease liabilities | 104,492 | — | (31,619) | (7,037) | (38,656) | 22,677 | — | (2,992) | 8,170 | 28,143 | 139 | 121,973 |
Assets held to cover liabilities arising from financing activities | (21,964) | 15,926 | — | — | 15,926 | — | 1,123 | (135,348) | 26,289 | | — | (113,974) |
Total | 5,123,999 | 7,240,478 | (4,327,503) | (439,552) | 2,473,423 | 1,393,926 | 1,536 | (787,411) | 594,619 | 28,143 | (19,881) | 8,808,354 |
| (1) | This relates to accrual of interest. |
F-80
The detail of other financial assets as of December 31, 2020 and 2019, is as follows:
| | | | | | | | | |
| | Balance as of | |||||||
| | Current | Non-Current | ||||||
Other Financial Assets |
| 12-31-2020 |
| 12-31-2019 |
| 12-31-2020 |
| 12-31-2019 |
|
Financial assets at fair value through profit or loss (1) | | 118,383 | | 57,623 | | 25,460 | | 70 | |
Financial assets measured at amortized cost (1) | | 13,827 | | 30,040 | | — | | 3,139 | |
Financial assets at fair value with changes in results IFRIC 12 (2) | | — | | — | | 2,468,149 | | 2,652,064 | |
Financial assets at fair value with changes in other comprehensive income | | — | | — | | 268 | | 320 | |
Financial assets measured at amortized cost IFRIC 12 (3) | | 10,283 | | 12,689 | | 267,351 | | 342,599 | |
Hedging derivatives (4) | | 86,465 | | 18,508 | | 29,635 | | 51,619 | |
Non-hedging derivatives (5) | | 1,321 | | 1,523 | | — | | — | |
Total | | 230,279 | | 120,383 | | 2,790,863 | | 3,049,811 | |
| (1) | The amounts included in financial assets measured at fair value with changes to profit and loss and financial assets at amortized cost mainly correspond to time deposits and other highly liquid investments that are easily convertible in cash and are subject to low risk of change in their value but that do not strictly meet the definition of cash equivalents as defined in Note 3.g.2 (for example with maturity date above 90 days at the time of investment). |
| (2) | Corresponding to concession agreements that include Enel Distribución Río S.A., Enel Distribución Ceará S.A., Enel Distribución Goias S.A. and Enel Distribución Sao Paulo S.A. (with balances as of December 31, 2020 of ThUS$831,941 (ThUS$898,154, as of December 31, 2019), ThUS$582,649 (ThUS$589,684 as of December 31, 2019), ThUS$43,318 (ThUS$37,589 as of December 31, 2019) and ThUS$1,010,241 (ThUS$1,126,637 as of December 31, 2019), respectively. The current legislation in effect, among other aspects, establishes that the Government in its capacity of grantor will use the New Replacement Value (VNR) in order to pay the applicable amounts to concession companies as compensation for those assets not amortized at the end of the concession term. On a monthly basis, distributors adjust the carrying amount of financial assets, once the present value of the estimated cash flows have been computed, using the rate of interest in effect for the payment corresponding to the end of concession; see Note 3.d.1. |
| (3) | Corresponding to the concession agreement in Enel Green Power Project I (Volta Grande); see Note 3.d.1. |
| (4) | See Note 23.2.a) |
| (5) | See Note 23.2.b) |
F-81
9. OTHER NON-FINANCIAL ASSETS AND LIABILITIES
| a) | The detail of other non-financial assets as of December 31, 2020 and 2019, is as follows: |
| | | | |
| Balance as of | |||
Other non-financial assets | Current | Non-Current | ||
| 12.31.2020 | 12.31.2019 | 12.31.2020 | 12.31.2019 |
| ThUS$ | ThUS$ | ThUS$ | ThUS$ |
VAT Credit and Other Taxes | 68,200 | 57,124 | 118,268 | 141,807 |
Contributions fund to Enel Distribución Goiás (1) | 7,536 | 3,357 | 180,824 | 234,947 |
Ongoing services provided by third parties | 9,993 | 10,929 | — | — |
Ongoing I & D and Energy Efficiency service | 90,349 | 94,672 | — | — |
Judicial Deposits | — | — | 267,266 | 340,477 |
Assets under construction IFRIC 12 (2) | — | — | 314,825 | 358,289 |
Recoverable taxes - Pis/Cofins (3) | 211,611 | 169,404 | 1,366,883 | 1,435,282 |
Prepaid expenses | 53,783 | 18,193 | — | — |
Other | 119,314 | 132,483 | 84,790 | 225,088 |
Total | 560,786 | 486,162 | 2,332,856 | 2,735,890 |
(1) Through Law 17,555 of January 20, 2012, the state of Goiás in Brazil created the Contribution Fund for Enel Distribución Goiás (Fundo de Aporte à CELG D - FUNAC), regulated by Decree No. 7,732, dated September 28, 2012, with the purpose of collecting and allocating financial resources for reimbursement to Enel Distribución Goiás of the payments of contingencies of any nature which had taken place up until the transfer of equity control to Eletrobrás, which occurred during January 2015, according to the terms of the agreement between the shareholders and the management, as well as FUNAC’s cooperation terms. The resources of the aforementioned fund depend on the contributions made by the government of the State of Goiás and the credits received for lawsuits won by Enel Distribución Goiás, which occurred during January 2015, which are reimbursed to the respective fund.
During 2019, the State of Goiás enacted a law, which limits the period of coverage of Law 17,555, from January 2015 to April 2012. The Group is taking all appropriate measures to maintain the rights acquired at the time of the purchase of Enel Distribución Goiás, which are guaranteed by the State of Goiás itself, as established in the purchase and sale agreement signed on February 14, 2017. The appeals presented by the Group argue that the right to the guarantee is legal and contractual, given that the actions of the State of Goiás are clearly illegal, and the possibility that the legal actions will not result in a favorable ruling for the Company are considered remote. (see Note 35.3.b.19).
In addition, since the resources are not final, as of December 2020 and as of the 2019 year-end an impairment loss was recognized in the amount of ThUS$14,479 and ThUS$110,774, , respectively, corresponding to the amount of accounts receivable generated from April 2012 to January 2015.
(2) Corresponds to assets under construction referring to concessions of the subsidiaries Enel Distribución Río S.A., Enel Distribución Ceará S.A., Enel Distribución Goiás S.A. and Enel Distribución Sao Paulo S.A.
(3) In March 2017, the Federal Supreme Court of Brazil (STF) resolved a matter of general applicability, related to the calculation of PIS and COFINS taxes. The STF confirmed the view that the ICMS tax should not be part of the base for calculation of PIS and COFINS taxes; however, the Brazilian federal government filed an appeal, in order to determine the temporary effects and make some clarifications.
Our subsidiaries in Brazil that were affected by the resolution of the STF, filed legal actions in this sense, in the respective Federal Regional Courts. In 2019, Enel Distribución Sao Paulo and Enel Distribución Ceará were notified of the final decisions issued by those Courts, recognizing their right to deduct the ICMS applied to their own operations from the calculation bases of the PIS and COFINS, for the periods from December 2003 to December 2014 for Enel Distribución Sao Paulo, and from May 2001 and onward for Enel Distribución Ceará. In March 2020, Enel Distribución Sao Paulo received a similar notification for the period from January 2015 and onward.
F-82
Considering various analyses both internal and provided by legal advisors, as well as the best estimates available, Enel Distribución Sao Paulo and Enel Distribución Ceará recognized assets in the amount of ThUS$1,326,297 and ThUS$252,197 , respectively, at year end 2020 (ThUS$1,244,266 and ThUS$360,420, respectively, as of December 31, 2019).
Since the excess payment of the PIS and COFINS taxes was passed down to the end customers at the time, simultaneous to recognizing these recoverable taxes, our subsidiaries have recognized a regulatory liability for the same amounts indicated above, net of any cost incurred or to be incurred by the Companies in these legal proceedings. These liabilities represent the obligation to reimburse the taxes recovered to the end customers.
The Group will adopt the tax credit recovery procedures in accordance with legal provisions. The transfer to consumers will depend on the effective use of the tax credit by the Companies and will take place in accordance with the regulations of the Agencia Nacional de Energía Eléctrica (ANEEL).
On the other hand, the legal actions filed by our subsidiaries Enel Distribución Rio and Enel Distribución Goias are pending resolution, waiting for the final decision of the respective Regional Courts.
It is important to note that the PIS and the COFINS are federal contributions paid by companies in Brazil intended to finance programs for employees, public health, social assistance and social security and are applied to the gross income of the companies. The “tax on movement of goods and services” (ICMS) is a state value-added tax (VAT) in Brazil, applied to the sale of telecommunications and transportation goods and services. (See Note 24 and 35.3.b.25).
| b) | The detail of other non-financial liabilities as of December 31, 2020 and 2019, is as follows: |
| | | | |
| Balance as of | |||
Other non-financial liabilities | Current | Non-Current | ||
| 12.31.2020 | 12.31.2019 | 12.31.2020 | 12.31.2019 |
| ThUS$ | ThUS$ | ThUS$ | ThUS$ |
VAT Credit and Other Taxes | 230,395 | 286,816 | 48,266 | 57,009 |
Other | 36,209 | 33,939 | 68,695 | 54,259 |
Total | 266,604 | 320,755 | 116,961 | 111,268 |
10. TRADE AND OTHER RECEIVABLES
| a) | The detail of trade and other receivables as of December 31, 2020 and 2019, is as follows: |
| | | | |
| Balance as of | |||
| Current | Non-Current | ||
Trade and Other Receivables, Gross | 12-31-2020 | 12-31-2019 | 12-31-2020 | 12-31-2019 |
| | | | |
Trade and other receivables, gross | 3,924,946 | 4,243,413 | 643,923 | 617,218 |
Trade receivables, gross | 3,693,052 | 3,219,045 | 354,376 | 122,428 |
Accounts receivable from finance leases, gross | 584 | — | 8,214 | — |
Other receivables, gross | 231,310 | 1,024,368 | 281,333 | 494,790 |
| | | | |
| Balance as of | |||
| Current | Non-Current | ||
Trade and Other Receivables, Net | 12-31-2020 | 12-31-2019 | 12-31-2020 | 12-31-2019 |
| | | | |
Trade and other receivables, net | 3,234,935 | 3,504,457 | 578,524 | 587,957 |
Trade receivables, net | 3,008,544 | 2,576,458 | 289,361 | 99,876 |
Accounts receivable from finance leases, net | 568 | — | 8,000 | — |
Other receivables, net | 225,823 | 927,999 | 281,163 | 488,081 |
F-83
| | | | |
| Balance as of | |||
| Current | Non-Current | ||
Detail of other accounts receivable, net (1) | 12-31-2020 | 12-31-2019 | 12-31-2020 | 12-31-2019 |
| ThUS$ | ThUS$ | ThUS$ | ThUS$ |
Sectorial assets Brazil (i) | - | 557,504 | - | 166,040 |
Accounts receivable "low income" (ii) | 27,593 | 168,025 | - | - |
Receivables VOSA project (iii) | 43,800 | 42,442 | 268,075 | 308,077 |
Accounts receivables from employees | 7,869 | 11,024 | 12,798 | 12,850 |
Advances to suppliers | 28,441 | 21,226 | - | - |
Subsidy and contribution mechanisms | 33,545 | 27,133 | - | - |
Other | 84,575 | 100,645 | 290 | 1,114 |
Total | 225,823 | 927,999 | 281,163 | 488,081 |
| (i) | Regulatory (or industry-wide) assets and liabilities are recorded as a result of the signing in December 2014 of significant amendments to the original concession agreements entered into by our electricity distribution subsidiaries in Brazil. These amendments established that, in addition to the compensation amounts derived from investments not amortized during the respective concession periods (see Note 9 (2)), the balances of regulatory assets and liabilities that had not been recovered or returned through the tariff cycles will also be subject to compensation or return by the Brazilian government. This implies that the realization of these assets or the settlement of liabilities does not depend on the invoicing made to customers during the concession period. |
These regulatory assets and liabilities arise from the differences between the actual cost and the cost considered in the tariff adjustments and generate an asset to the extent that the actual cost is greater than the one considered in the tariff, or a liability when the actual costs are lower than those considered in the tariff. These differences are considered by ANEEL, which is the government entity that regulates electricity tariffs in Brazil, in the subsequent tariff adjustment process of each concessionaire company.
In general, as a result of the normal operation of the companies, these regulatory assets and liabilities are collected or settled through invoices to customers over a period that is on average between 10 and 24 months.
CONTA-COVID
On May 18, 2020, Decree No. 10,350 was issued in the Official Gazette of Brazil, which authorized the creation of CONTA-COVID, which establishes a cash-advance mechanism for electricity distribution companies in respect to accounts receivable already accrued, which under normal circumstances would be recovered through future customer billing, once the corresponding tariff update processes have been carried out. The CONTA-COVID is managed by the Electric Energy Commercialization Chamber – CCEE.
CONTA-COVID is regulated by Regulatory Resolution No. 885 issued by the Ministry of Mining and Energy, dated June 23, 2020, and its funds were obtained through a “sectorial loan”, entered into by a group of banks. The CCEE centralized the contracting of loan transactions and transferred the funds to the electricity distribution companies, in accordance with the limit established by ANEEL for each company.
CONTA-COVID guarantees the economic resources necessary to compensate for the loss of income due to the pandemic and to protect the rest of the electricity sector’s production chain, by allowing electricity distribution companies to continue complying with their contracts. Additionally, CONTA-COVID avoided significant adjustments in electricity tariffs, since without this mechanism, there would have been an impact for consumers in the next readjustments, with payment in 12 months. With this mechanism, the impact will be diluted over a total period of 60 months.
F-84
As of December 31, 2020, the amounts received by electricity distribution subsidiaries in Brazil (presented in the consolidated statement cash flows, under Other receipts from operating activities), which are recorded against the corresponding sectorial assets and liabilities, are summarized as follows (in thousands of U.S. dollars):
| |
CONTA COVID | 12-31-2020 |
Enel Distribución Sao Paulo | 263,102 |
Enel Distribución Río | 150,728 |
Enel Distribución Goiás | 99,009 |
Enel Distribución Ceará | 85,005 |
Total | 597,844 |
The tariff increases deferred in this period will be paid by customers in up to 5 years from 2021, through a sectorial tariff charged by distributors and transferred to the CCEE. The CCEE, in turn, will amortize the loan entered into with the syndicate of the sectorial loan creditor banks.
| (ii) | Accounts receivable to “low income” consumers to which a social discount is applied creating a “low income” final tariff, in which the Brazilian government replenishes such discount to our subsidiaries Enel Distribución Río S.A., Enel Distribución Ceará S.A., Enel Distribución Goias and Enel Distribución Sao Paulo S.A. through a state subsidy. |
| (iii) | Account receivables related to the Argentine Project. |
There are no significant trade and other receivables balances held by the Group that are not available for its use.
The Group does not have customers to which it has sales representing 10% or more of its operating revenue for the years ended December 31, 2020 and 2019.
Refer to Note 11.1 for detailed information on amounts, terms and conditions associated with accounts receivable from related companies.
F-85
| b) | As of December 31, 2020 and 2019, the analysis of trade accounts receivables due and unpaid, but of which no impairment losses have been recorded, is as follows: |
| | |
| Balance as of | |
Trade accounts receivables due and unpaid, but of which no impairment losses have been recorded | 12-31-2020 | 12-31-2019 |
Less than three months | 555,004 | 551,817 |
Between three and six months | 92,337 | 95,451 |
Between six and twelve months | 75,779 | 87,226 |
More than twelve months | 169,477 | 213,357 |
Total | 892,597 | 947,851 |
c) The reconciliation of changes in the allowance for credit losses of trade receivables is as follows:
| |
| Current and |
Trade accounts receivables due and unpaid, with impairment losses | Non-Current |
Balance as of January 1, 2019 | 799,865 |
Increases (decreases) for the year | 159,250 |
Amounts written off | (168,889) |
Foreign currency translation differences | (22,009) |
Balance as of December 31, 2019 | 768,217 |
Increases (decreases) for the year (*) | 211,536 |
Amounts written off | (112,591) |
Foreign currency translation differences | (111,752) |
Balance as of December 31, 2020 | 755,410 |
(*) Impairment losses on trade accounts receivable amounted to ThUS$ 211,536 as of December 31, 2020, which represented an increase of 32.8% in comparison to the loss of ThUS$ 159,250 recorded in the 2019. This increase originated mainly due to the effects of a higher level of default generated by COVID-19, mainly from our Brazil distribution subsidiaries, in the amount of ThUS$ 113,095 offset by the effects of conversion of different foreign currencies in respect to the U.S. dollar in the amount of ThUS$ 62,278. See Note 31.b) Trade and Other Accounts Receivable Impairment Losses.
Write-offs for doubtful accounts
Past-due debt is written off once all collection measures and legal proceedings have been exhausted and the debtors’ insolvency has been demonstrated. In our power generation business, this process normally takes at least one year of procedures for the few cases that arise in each country. In our distribution business, considering the differences in each country, the process takes at least 6 months in Argentina and Brazil and 12 months in Colombia and Peru. Overall, the risk of bad debt, and therefore the risk of writing off our trade receivables, is limited (see Notes 3.g.3 and 22.5).
d) Additional information:
| > | Additional statistical information required under Official Bulletin 715 of the CMF, of February 3, 2012. See Appendix 2. |
| ● | Complementary Trade Accounts Information. See Appendix 2.1. |
F-86
11. BALANCES AND TRANSACTIONS WITH RELATED PARTIES
Related party transactions are performed at current market conditions.
Transactions between the companies belonging to the Group have been eliminated on consolidation and are not itemized in this note.
As of the date of these financial statements, no guarantees have been given or received nor has any allowance for bad or doubtful accounts been recorded with respect to receivable balances for related party transactions.
The controlling shareholder of the Company is the Italian corporation Enel S.p.A.
11.1 Balances and transactions with related parties
The balances of accounts receivable and payable as of December 31, 2020 and 2019 are as follows:
| a) | Receivables from related companies |
| | | | | | | | | | |
| | | | | | | Balance as of | |||
| | | | | | | Current | Non-Current | ||
Taxpayer ID N° | Company | Country | Relationship | Currency | Description of Transaction | Term of Transaction | 12-31-2020 | 12-31-2019 | 12-31-2020 | 12-31-2019 |
Foreign | Enel X S.R.L. | Italy | Common Immediate Parent | EUR | Technical services | Less than 90 days | — | 145 | | — |
Foreign | Enel Global Infrastructure And Network | Italy | Common Immediate Parent | EUR | Other services | Less than 90 days | 543 | 119 | | — |
Foreign | Enel S.P.A. | Italy | Parent | EUR | Other services | More than 90 days | — | 254 | | — |
Foreign | Enel S.P.A. | Italy | Parent | EUR | Other services | Less than 90 days | 1,003 | 1,027 | | — |
Foreign | Enel S.P.A. | Italy | Parent | BRL | Other services | Less than 90 days | — | 38 | | — |
Foreign | Enel S.P.A. | Italy | Parent | BRL | Other services | Less than 90 days | 243 | 421 | | — |
Foreign | E-Distribuzione S.P.A | Italy | Common Immediate Parent | EUR | Other services | Less than 90 days | 16 | 17 | | — |
Foreign | E-Distribuzione S.P.A | Italy | Common Immediate Parent | ARS | Other services | Less than 90 days | — | 4 | | — |
Foreign | Enel Green Power Argentina | Argentina | Common Immediate Parent | ARS | Other services | Less than 90 days | — | 101 | | — |
Foreign | Enel Green Power S.P.A. | Italy | Common Immediate Parent | EUR | Other services | Less than 90 days | 265 | 188 | | — |
Foreign | Enel Global Trading S.P.A. | Italy | Common Immediate Parent | EUR | Other services | Less than 90 days | 1 | 36 | | — |
Foreign | Endesa España | Spain | Common Immediate Parent | EUR | Other services | Less than 90 days | 18 | 18 | | — |
Foreign | Enel Iberia S.R.L. | Spain | Common Immediate Parent | EUR | Other services | Less than 90 days | 1,289 | 1,288 | | — |
Foreign | Enel Iberia S.R.L. | Spain | Common Immediate Parent | COP | Other services | Less than 90 days | — | 29 | | — |
Foreign | Endesa Operaciones y Servicios Comerciales S.L. | Spain | Common Immediate Parent | EUR | Other services | Less than 90 days | 86 | 115 | | — |
Foreign | Endesa Energía S.A. | Spain | Common Immediate Parent | EUR | Other services | Less than 90 days | 46 | 53 | | — |
Foreign | Enel Energia S.P.A | Italy | Common Immediate Parent | EUR | Other services | Less than 90 days | — | 81 | | — |
Foreign | Enel Global Thermal Generation S.R.L. | Italy | Common Immediate Parent | EUR | Other services | Less than 90 days | 102 | 47 | | — |
Foreign | Enel Global Thermal Generation S.R.L. | Italy | Common Immediate Parent | BRL | Other services | Less than 90 days | 105 | 67 | | — |
Foreign | Energética Monzon S.A.C. | Peru | Common Immediate Parent | PEN | Other services | Less than 90 days | — | 445 | | — |
Foreign | Proyectos Y Soluciones Renovables S.A.C. | Peru | Common Immediate Parent | PEN | Other services | Less than 90 days | 133 | 501 | | — |
Foreign | Energía Nueva Energía Limpia Mexico S.R.L | Mexico | Common Immediate Parent | PEN | Other services | Less than 90 days | 33 | 37 | | — |
Foreign | Enel North América Inc. | United States | Common Immediate Parent | US$ | Other services | Less than 90 days | 93 | | | — |
Foreign | Enel North América Inc. | United States | Common Immediate Parent | PEN | Other services | Less than 90 days | 43 | 41 | | — |
Foreign | Enel Green Power Perú | Peru | Common Immediate Parent | PEN | Other services | Less than 90 days | 2,271 | 2,853 | | — |
Foreign | Enel Green Power Perú | Peru | Common Immediate Parent | PEN | Energy sales | Less than 90 days | — | 8 | | — |
Foreign | Enel Green Power Colombia S.A.S | Colombia | Common Immediate Parent | COP | Other services | Less than 90 days | 709 | 675 | | — |
Foreign | Enel X North America | United States | Common Immediate Parent | US$ | Other services | Less than 90 days | — | 325 | | — |
Foreign | SACME | Argentina | Associated | ARS | Other services | Less than 90 days | 7 | 13 | 32 | 68 |
76.536.353-5 | Enel Chile S.A. | Chile | Common Immediate Parent | US$ | Other services | Less than 90 days | 430 | 882 | | — |
76.536.353-5 | Enel Chile S.A. | Chile | Common Immediate Parent | ARS | Other services | Less than 90 days | — | 97 | | — |
76.536.353-5 | Enel Chile S.A. | Chile | Common Immediate Parent | COP | Other services | Less than 90 days | 7 | — | | — |
76.536.353-5 | Enel Chile S.A. | Chile | Common Immediate Parent | CLP | Other services | Less than 90 days | 2,377 | 1,792 | | — |
76.536.353-5 | Enel Chile S.A. | Chile | Common Immediate Parent | BRL | Other services | Less than 90 days | 222 | 46 | | — |
96.800.570-7 | Enel Distribución Chile S.A. | Chile | Common Immediate Parent | CLP | Other services | Less than 90 days | 802 | 746 | | — |
91.081.000-6 | Enel Generación Chile S.A. | Chile | Common Immediate Parent | ARS | Other services | Less than 90 days | 22 | 22 | | — |
91.081.000-6 | Enel Generación Chile S.A. | Chile | Common Immediate Parent | CLP | Other services | Less than 90 days | 92 | 15 | | — |
76.412.562-2 | Enel Green Power Chile S.A. | Chile | Common Immediate Parent | US$ | Other services | Less than 90 days | 2 | 2 | | — |
Foreign | Grupo Enel Green Power Brasil Participações Ltda | Brazil | Common Immediate Parent | BRL | Other services | Less than 90 days | 3,208 | 2,684 | | — |
Foreign | Grupo Enel Green Power Brasil Participações Ltda | Brazil | Common Immediate Parent | BRL | Tolls | Less than 90 days | 17 | 15 | | — |
Foreign | Grupo Enel Green Power Brasil Participações Ltda | Brazil | Common Immediate Parent | BRL | Energy sales | Less than 90 days | 32,544 | 1,122 | | 779 |
Foreign | Enel X Argentina S.A.U. | Argentina | Common Immediate Parent | ARS | Other services | Less than 90 days | 22 | — | | — |
Foreign | E-Distributie Muntenia | Italy | Common Immediate Parent | US$ | Other services | Less than 90 days | 58 | — | | — |
Foreign | Electric Motor Werks, Inc. | United States | Common Immediate Parent | EUR | Other services | Less than 90 days | 141 | — | | — |
| | Total | | | | | 46,950 | 16,369 | 32 | 847 |
F-87
| b) | Accounts payable to related companies |
| | | | | | | | | | |
| | | | | | | Balance as of | |||
| | | | | | | Current | Non-Current | ||
Taxpayer ID N° | Company | Country | Relationship | Currency | Description of Transaction | Term of Transaction | 12-31-2020 | 12-31-2019 | 12-31-2020 | 12-31-2019 |
Foreign | Enel X S.R.L. | Italy | Common Immediate Parent | EUR | Technical services | Less than 90 days | 3,685 | 2,830 | — | — |
Foreign | Enel X S.R.L. | Italy | Common Immediate Parent | EUR | Other services | Less than 90 days | 3,702 | 336 | — | — |
Foreign | Enel X S.R.L. | Italy | Common Immediate Parent | EUR | IT services | Less than 90 days | 252 | — | — | — |
Foreign | Enel X S.R.L. | Italy | Common Immediate Parent | US$ | Other services | Less than 90 days | 67 | 57 | — | — |
Foreign | Enel Finance International NV (*) | Holland | Common Immediate Parent | BRL | Loans payable | More than 90 days | 145 | — | 144,391 | — |
Foreign | Enel Finance International NV (*) | Holland | Common Immediate Parent | US$ | Loans payable | More than 90 days | 150,269 | — | — | — |
Foreign | Enel Finance International NV | Holland | Common Immediate Parent | BRL | Other services | More than 90 days | 745 | — | — | — |
Foreign | Endesa Latinoamérica S.A. | Argentina | Common Immediate Parent | ARS | Dividends | Less than 90 days | — | 18 | — | — |
Foreign | Endesa Generación S.A. | Spain | Common Immediate Parent | EUR | Other services | Less than 90 days | 217 | 221 | — | — |
Foreign | Endesa Generación S.A. | Spain | Common Immediate Parent | EUR | Engineering services | Less than 90 days | 25 | — | — | — |
Foreign | Endesa Generación S.A. | Spain | Common Immediate Parent | US$ | Other services | Less than 90 days | 8 | 11 | — | — |
Foreign | Enel Sole | Spain | Common Immediate Parent | EUR | Other services | Less than 90 days | 1,116 | 1,259 | — | — |
Foreign | Enel Global Infrastructure and Network | Italy | Common Immediate Parent | EUR | Technical services | Less than 90 days | 31,107 | 33,938 | — | — |
Foreign | Enel Global Infrastructure and Network | Italy | Common Immediate Parent | EUR | Other services | Less than 90 days | 2,348 | 2,167 | — | — |
Foreign | Enel Global Infrastructure and Network | Italy | Common Immediate Parent | EUR | IT services | Less than 90 days | 16,858 | — | — | — |
Foreign | Enel Global Infrastructure and Network | Italy | Common Immediate Parent | BRL | Other services | Less than 90 days | — | 1,117 | — | — |
Foreign | Enel Italia S.R.L | Italy | Common Immediate Parent | EUR | Purchase of materials | Less than 90 days | 1,501 | — | — | — |
Foreign | Enel S.P.A. | Italy | Parent | EUR | Other services | Less than 90 days | 9,063 | 8,504 | — | — |
Foreign | Enel S.P.A. | Italy | Parent | EUR | Technical services | Less than 90 days | 51,334 | 50,841 | — | — |
Foreign | Enel S.P.A. | Italy | Parent | EUR | IT services | Less than 90 days | 3,417 | — | — | — |
Foreign | Enel S.P.A. | Italy | Parent | CLP | Dividends | Less than 90 days | 160,914 | 277,267 | — | — |
Foreign | Enel Italia S.R.L | Italy | Common Immediate Parent | EUR | Other services | Less than 90 days | 2,129 | 30,186 | — | — |
Foreign | Enel Italia S.R.L | Italy | Common Immediate Parent | EUR | Technical services | Less than 90 days | 4 | 11,695 | — | — |
Foreign | Enel Italia S.R.L | Italy | Common Immediate Parent | EUR | IT services | Less than 90 days | 1,547 | 11,702 | — | — |
Foreign | E-Distribuzione S.P.A | Italy | Common Immediate Parent | EUR | Other services | Less than 90 days | 54 | 212 | — | — |
Foreign | Enel Produzione | Italy | Common Immediate Parent | EUR | Other services | Less than 90 days | 1,321 | 9,934 | — | — |
Foreign | Enel Produzione | Italy | Common Immediate Parent | EUR | Technical services | Less than 90 days | 7,113 | 1,424 | — | — |
Foreign | Enel Produzione | Italy | Common Immediate Parent | EUR | Engineering services | Less than 90 days | 2,978 | 4,883 | — | — |
Foreign | Enel Produzione | Italy | Common Immediate Parent | COP | Other services | Less than 90 days | — | 63 | — | — |
Foreign | Enel Green Power S.P.A. | Italy | Common Immediate Parent | EUR | Other services | Less than 90 days | 629 | 506 | — | — |
Foreign | Enel Green Power S.P.A. | Italy | Common Immediate Parent | EUR | Technical services | Less than 90 days | 8,196 | 4,434 | — | — |
Foreign | Enel Green Power S.P.A. | Italy | Common Immediate Parent | EUR | IT services | Less than 90 days | 942 | — | — | — |
Foreign | Enel Global Trading S.P.A. | Italy | Common Immediate Parent | EUR | Technical services | Less than 90 days | 3,967 | 2,350 | — | — |
Foreign | Enel Global Trading S.P.A. | Italy | Common Immediate Parent | EUR | Other services | Less than 90 days | 304 | 1,462 | — | — |
Foreign | Enel Global Trading S.P.A. | Italy | Common Immediate Parent | EUR | IT services | Less than 90 days | 785 | — | — | — |
Foreign | Endesa España | Spain | Common Immediate Parent | EUR | Other services | Less than 90 days | 2,586 | 1,958 | — | — |
Foreign | Enel Iberia S.R.L. | Spain | Common Immediate Parent | EUR | Other services | Less than 90 days | 1,394 | 1,295 | — | — |
Foreign | Enel Iberia S.R.L. | Spain | Common Immediate Parent | BRL | Other services | Less than 90 days | — | 223 | — | — |
Foreign | Endesa Energía S.A. | Spain | Common Immediate Parent | EUR | Other services | Less than 90 days | 318 | 122 | — | — |
Foreign | Endesa Energía S.A. | Spain | Common Immediate Parent | US$ | Other services | Less than 90 days | — | 87 | — | — |
Foreign | Enel Global Thermal Generation S.R.L. | Italy | Common Immediate Parent | EUR | Technical services | Less than 90 days | 15,279 | 3,581 | — | — |
Foreign | Enel Global Thermal Generation S.R.L. | Italy | Common Immediate Parent | EUR | IT services | Less than 90 days | 6,755 | — | — | — |
Foreign | Enel Global Thermal Generation S.R.L. | Italy | Common Immediate Parent | EUR | Other services | Less than 90 days | 892 | 547 | — | — |
Foreign | Proyectos y Soluciones Renovables S.A.C. | Peru | Common Immediate Parent | PEN | Other services | Less than 90 days | 220 | 141 | — | — |
Foreign | Edistribución Redes Digitales, S.L. | Spain | Common Immediate Parent | EUR | Other services | Less than 90 days | 704 | 464 | — | — |
Foreign | Edistribución Redes Digitales, S.L. | Spain | Common Immediate Parent | US$ | Technical services | Less than 90 days | 18 | 23 | — | — |
Foreign | Cesi S.P.A. | Italy | Common Immediate Parent | EUR | Engineering services | Less than 90 days | 52 | 48 | — | — |
Foreign | Enel Green Power Perú | Peru | Common Immediate Parent | PEN | Energy purchases | Less than 90 days | 1,328 | 1,672 | — | — |
Foreign | Enel Green Power Perú | Peru | Common Immediate Parent | PEN | Other services | Less than 90 days | 70 | 153 | — | — |
Foreign | Enel Green Power Colombia S.A.S | Colombia | Common Immediate Parent | COP | Energy purchases | Less than 90 days | 2,637 | 1,549 | — | — |
Foreign | Enel Green Power Colombia S.A.S | Colombia | Common Immediate Parent | COP | Other services | Less than 90 days | 16 | 7 | — | — |
Foreign | Enel X North America | United States | Common Immediate Parent | US$ | Other services | Less than 90 days | 1 | 38 | — | — |
Foreign | SACME | Argentina | Associated | ARS | Other services | Less than 90 days | 163 | 229 | — | — |
76.536.353-5 | Enel Chile S.A. | Chile | Common Immediate Parent | US$ | Other services | Less than 90 days | 1,583 | 3,237 | — | — |
76.536.353-5 | Enel Chile S.A. | Chile | Common Immediate Parent | CLP | Other services | Less than 90 days | 2,126 | 3,518 | — | — |
76.536.353-5 | Enel Chile S.A. | Chile | Common Immediate Parent | CLP | IT services | Less than 90 days | 631 | 806 | — | — |
Foreign | Yacylec S.A. | Argentina | Associated | ARS | Other services | Less than 90 days | 11 | — | — | — |
96.800.570-7 | Enel Distribución Chile S.A. | Chile | Common Immediate Parent | US$ | Other services | Less than 90 days | 766 | 902 | — | — |
96.800.570-7 | Enel Distribución Chile S.A. | Chile | Common Immediate Parent | CLP | Other services | Less than 90 days | 345 | 205 | — | — |
91.081.000-6 | Enel Generación Chile S.A. | Chile | Common Immediate Parent | US$ | Other services | Less than 90 days | 240 | 272 | — | — |
91.081.000-6 | Enel Generación Chile S.A. | Chile | Common Immediate Parent | US$ | Engineering services | Less than 90 days | — | 552 | — | — |
91.081.000-6 | Enel Generación Chile S.A. | Chile | Common Immediate Parent | CLP | Other services | Less than 90 days | 780 | 412 | — | — |
91.081.000-6 | Enel Generación Chile S.A. | Chile | Common Immediate Parent | CLP | Engineering services | Less than 90 days | 1,777 | 945 | — | — |
91.081.000-6 | Enel Generación Chile S.A. | Chile | Common Immediate Parent | COP | Other services | Less than 90 days | — | 212 | — | — |
76.412.562-2 | Enel Green Power Chile S.A. | Chile | Common Immediate Parent | US$ | Other services | Less than 90 days | 4 | — | — | — |
76.412.562-2 | Enel Green Power Chile S.A. | Chile | Common Immediate Parent | CLP | Other services | Less than 90 days | 430 | 387 | — | — |
76.924.079-9 | Enel X Chile S.P.A | Chile | Common Immediate Parent | CLP | Other services | Less than 90 days | — | 1 | — | — |
Foreign | Grupo Enel Green Power Brasil Participações Ltda | Brazil | Common Immediate Parent | BRL | Energy purchases | Less than 90 days | 33,395 | 12,577 | — | — |
Foreign | Grupo Enel Green Power Brasil Participações Ltda | Brazil | Common Immediate Parent | BRL | Other services | Less than 90 days | 1,182 | 931 | — | — |
Foreign | Energética Monzon S.A.C. | Peru | Common Immediate Parent | PEN | Other services | Less than 90 days | 24 | — | — | — |
Foreign | Enel Global Services S.r.L | Italy | Common Immediate Parent | EUR | IT services | Less than 90 days | 6,110 | — | — | — |
Foreign | Enel Global Services S.r.L | Italy | Common Immediate Parent | EUR | Other services | Less than 90 days | 34,999 | — | — | — |
Foreign | Enel Global Services S.r.L | Italy | Common Immediate Parent | EUR | Technical services | Less than 90 days | 12,885 | — | — | — |
Foreign | Servizio Elettrico Nazionale SpA | Italy | Common Immediate Parent | EUR | Other services | Less than 90 days | 146 | — | — | — |
Foreign | Enel X Argentina S.A.U. | Argentina | Common Immediate Parent | ARS | Other services | Less than 90 days | 3 | — | — | — |
Foreign | Electric Motor Werks, Inc. | United States | Common Immediate Parent | EUR | Other services | Less than 90 days | 510 | — | — | — |
| | Total | | | | | 597,122 | 494,511 | 144,391 | — |
F-88
c) Significant transactions and effects on profit or loss:
As of December 31, 2020, 2019 and 2018 the significant transactions with related companies that are not consolidated, are as follows:
| | | | | | | |
| | | | | For the years ended, | ||
Taxpayer ID N° | Company | Country | Relationship | Description of Transaction | 12-31-2020 | 12-31-2020 | 12-31-2018 |
76.536.353-5 | Enel Chile S.A. | Chile | Common Immediate Parent | Management services and other | (7,158) | (7,707) | (8,128) |
Foreign | Enel Finance International NV | Holland | Common Immediate Parent | Financial expenses | (2,441) | (127,977) | (43,873) |
Foreign | Enel Global Infrastructure and Network | Italy | Common Immediate Parent | IT services | (7,418) | — | — |
Foreign | Enel Global Infrastructure and Network | Italy | Common Immediate Parent | Technical services | (30,448) | (16,685) | — |
Foreign | Enel Global Thermal Generation S.R.L. | Italy | Common Immediate Parent | Technical services | (7,268) | (3,536) | (5,561) |
Foreign | Grupo Enel Green Power Brasil Participações Ltda | Brazil | Common Immediate Parent | Energy sales | 54,158 | 1,134 | 24,333 |
Foreign | Grupo Enel Green Power Brasil Participações Ltda | Brazil | Common Immediate Parent | Energy purchases | (147,841) | (93,299) | (126,627) |
Foreign | Grupo Enel Green Power Brasil Participações Ltda | Brazil | Common Immediate Parent | Electricity tolls | 215 | — | — |
Foreign | Grupo Enel Green Power Brasil Participações Ltda | Brazil | Common Immediate Parent | Other services | (1,472) | — | — |
Foreign | Enel Green Power Colombia S.A.S | Colombia | Common Immediate Parent | Other services | 839 | — | — |
Foreign | Enel Green Power Perú | Peru | Common Immediate Parent | Other services | 1,993 | — | — |
Foreign | Enel Green Power Perú | Peru | Common Immediate Parent | Energy purchases | (2,913) | — | — |
Foreign | Enel Green Power Perú | Peru | Common Immediate Parent | Energy sales | 66 | — | — |
Foreign | Enel Green Power Colombia S.A.S | Spain | Common Immediate Parent | Energy purchases | (8,483) | (7,156) | — |
Foreign | Enel Green Power S.P.A | Italy | Common Immediate Parent | Technical services | (3,757) | — | — |
Foreign | Enel Italia S.R.L | Italy | Common Immediate Parent | IT services | (758) | (12,278) | (12,211) |
Foreign | Enel Italia S.R.L | Italy | Common Immediate Parent | Technical services | — | (6,778) | (4,158) |
Foreign | Enel S.P.A. | Italy | Parent | Other services | (4,045) | (2,827) | (1,077) |
Foreign | Enel S.P.A. | Italy | Parent | Technical services | (11,542) | (11,554) | (2,083) |
Foreign | Enel X S.R.L. | Italy | Common Immediate Parent | Technical services | (2,852) | — | — |
Foreign | Proyectos y Soluciones Renovables S.A.C. | Peru | Common Immediate Parent | Other services | (31) | — | — |
Foreign | Enel Global Services S.r.L | Italy | Common Immediate Parent | IT services | (7,051) | — | — |
d) Significant transactions Enel Américas:
| > | On September 26, 2018, Enel Finance International NV executed with Enel Brasil a credit agreement in reais for the amount of BRL 9,400 million, which was actually disbursed on October 5, 2018 at a fixed interest rate of 7.676% a year and was not secured by any collateral, with a single repayment of principal and interest at maturity on July 2, 2019. The funds were used for the prepayment of promissory notes held by Enel Brasil and Enel Sudeste issued for the purchase of Eletropaulo, currently Enel Distribución Sao Paulo. The debt was paid off on the maturity date, of July 2, 2019. |
| > | On December 14, 2018, Enel Finance International NV executed with Enel Distribución Ceará a credit agreement in reais for the amount of BRL 300 million, which was disbursed on December 18, 2018, at a fixed annual interest rate of 8% for one year, with no guarantees provided and with a single principal and interest payment on the maturity date of December 18, 2019 (1 year term). The funds of this financing were used for working capital and it was paid off on its maturity date. |
| > | On December 14, 2018, Enel Finance International NV executed with Enel Distribución Sao Paulo, a credit agreement in reais for the amount of BRL 420 million, which was disbursed on December 18, 2018, at a fixed annual interest rate of 8% for one year, with no guarantees provided and with a single principal and interest payment on the maturity date of December 18, 2019 (1 year term). The funds of this financing were used for working capital and it was terminated on its maturity date. |
| > | On May 20, 2020, Enel Américas S.A. formalized and completely used, a committed revolving credit facility with Enel Finance International N.V. for a total of US$150 million at a variable interest rate of LIBOR 1M, 3M or 6M plus a 1.35% margin, with monthly, quarterly or biannual interest payments with expiration date of May 20, 2021. This revolving credit facility has no guarantees. As of December 31, 2020, this facility was fully drawn. |
| > | On June 17, 2020, Enel Finance International NV entered into a revolving credit agreement with Enel Brasil S.A. denominated in Brazilian reais for an amount of BRL 800 million at a variable interest rate and with a maturity date of June 12, 2021. As of December 31, 2020, this revolving credit facility has not been drawn. |
| > | On December 21, 2020, Enel Finance International NV formalized an unsecured loan agreement with Enel Distribución Río, denominated in Brazilian reais, in the amount of BRL 750 million, at a fixed interest rate of |
| 3.4%, with payments of interest made annually to be paid in full on the maturity date, January 22, 2024 , which is the date when its principal and interest amortize. |
11.2 Board of directors and key management personnel
The Company is managed by a Board of Directors which consists of seven members. Each director serves for a three-year term after which they can be reelected.
The Board of Directors as of December 31, 2020 was elected at the General Shareholders Meeting held on April 30, 2019, and is composed of the following members:
| > | Mr. Francisco de Borja Acha Besga |
| > | Mr. José Antonio Vargas Lleras |
| > | Mr. Enrico Viale |
| > | Mr. Hernán Somerville Senn |
| > | Mr. Patricio Gómez Sabaini |
| > | Mr. Domingo Cruzat Amunátegui |
On November 9, 2020, Mr. Livio Gallo resigned as Director of the Company and, to date, the Board of Directors has not appointed a replacement. According to the provisions of Law 18,046 (the Chilean Corporations Law), during the next Ordinary Shareholders’ Meeting held by the Company, the entire Board of Directors must be renewed.
At the Board of Directors’ meeting held on April 29, 2016, Mr. Francisco de Borja Acha Besga was appointed as Chairman of the Board, Mr. José Antonio Vargas Lleras was appointed as Vice Chairman of the Board and Mr. Domingo Cruzat Amunátegui was appointed as Secretary of the Board.
Likewise, at the same Board of Directors Meeting, the Directors’ Committee was elected under the requirements of Law 18,046 (the Chilean Corporations Law) and the Sarbanes-Oxley Act. The Directors’ Committee is composed of the following independent directors: Mr. Hernán Sommerville Senn (as Chairman), Mr. Patricio Gómez Sabaini and Mr. Domingo Cruzat Amunátegui (as Secretary).
The Board of Directors determined that Mr. Hernan Sommerville Senn is a financial expert for the Directors’ Committee of the Company.
F-90
a) Accounts receivable and payable and other transactions
| ● | Accounts receivable and payable |
There are no outstanding amounts receivable or payable between the Company and the members of the Board of Directors and key management personnel.
| ● | Other transactions |
No transactions other than the payment of compensation has taken place between the Company and the members of the Board of Directors and key management personnel.
In accordance with Article 33 of Law No. 18,046 (the Chilean Corporations Law) governing stock corporations, the compensation of Directors is established each year at the General Shareholders Meeting of the Company.
The compensation consists of paying each member of the Board of Directors monthly compensation, one part in a fixed monthly fee and another part dependent on meetings attended. The breakdown of this compensation is as follows:
| > | UF 216 as a fixed monthly fee, and |
| > | UF 79.2 as a per diem for each Board meeting attended with a maximum of 16 sessions in total whether ordinary or extraordinary, within the corresponding exercise. |
According to the provisions of the bylaws, the remuneration of the Chairman of the Board will be twice that of a Director.
In the event a Director of Enel Américas participates in more than one Board of Directors of domestic or foreign subsidiaries and / or affiliates or acts as director or consultant for other domestic or foreign companies or legal entities in which Enel Américas has a direct or indirect interest, he/she may receive remuneration only in one of said Boards of Directors or Management Boards.
The executive officers of Enel Américas S.A. and/or its domestic or foreign subsidiaries or affiliates will not receive remunerations or per diem allowances if acting as directors in any of the domestic or foreign Enel Américas’ subsidiaries, affiliates or investee in any way. Therefore, said remunerations or per diem allowances may be received by the executive officers as long as this is previously and expressly authorized as an advance of their variable portion of remuneration by the corresponding companies with which they are associated through an employment contract.
Directors’ Committee:
Each member will be paid monthly compensation, one part in a fixed monthly fee and another part dependent on meetings attended.
This compensation is broken down as follows:
| > | UF 72 as a fixed monthly fee, in any event, and |
| > | UF 26.4 as a per diem for each Board meeting attended, all with a maximum of 16 meetings in total, whether ordinary or extraordinary, within the corresponding fiscal year. |
The following tables show details of the compensation paid to the members of the Board of Directors of the Company for the years ended December 31, 2020, 2019 and 2018:
F-91
| | | | | | |
| | | December 31, 2020 | |||
Taxpayer ID | | | | Enel Américas | Board of | Directors' |
No. | Name | Position | Period in position | ThUS$ | ThUS$ | ThUS$ |
Foreigner | Francisco de Borja Acha Besga | Chairman | January - December 2020 | — | — | — |
Foreigner | José Antonio Vargas Lleras | Vice Chairman | January - December 2020 | — | — | — |
Foreigner | Enrico Viale | Director | January - December 2020 | — | — | — |
Foreigner | Livio Gallo | Director | January - November 2020 | — | — | — |
4.132.185-7 | Hernán Somerville Senn | Director | January - December 2020 | 143 | — | 47 |
Foreigner | Patricio Gómez Sabaini | Director | January - December 2020 | 143 | — | 47 |
6.989.304-K | Domingo Cruzat Amunátegui | Director | January - December 2020 | 143 | — | 47 |
| TOTAL | | | 429 | — | 141 |
| | | | | | |
| | | December 31, 2019 | |||
Taxpayer ID | | | | Enel Américas | Board of | Directors' |
No. | Name | Position | Period in position | ThUS$ | ThUS$ | ThUS$ |
Foreigner | Francisco de Borja Acha Besga | Chairman | January - December 2019 | — | — | — |
Foreigner | José Antonio Vargas Lleras | Vice Chairman | January - December 2019 | — | — | — |
Foreigner | Enrico Viale | Director | January - December 2019 | — | — | — |
Foreigner | Livio Gallo | Director | January - December 2019 | — | — | — |
4.132.185-7 | Hernán Somerville Senn | Director | January - December 2019 | 159 | — | 48 |
Foreigner | Patricio Gómez Sabaini | Director | January - December 2019 | 159 | — | 48 |
6.989.304-K | Domingo Cruzat Amunátegui | Director | January - December 2019 | 159 | — | 48 |
| TOTAL | | | 477 | — | 144 |
| | | | | | |
| | | December 31, 2018 | |||
Taxpayer ID | | | | Enel Américas | Board of | Directors' |
No. | Name | Position | Period in position | ThUS$ | ThUS$ | ThUS$ |
Foreigner | Francisco de Borja Acha Besga | Chairman | January - December 2018 | — | — | — |
Foreigner | José Antonio Vargas Lleras | Vice Chairman | January - December 2018 | — | — | — |
Foreigner | Enrico Viale | Director | January - December 2018 | — | — | — |
Foreigner | Livio Gallo | Director | January - December 2018 | — | — | — |
4.132.185-7 | Hernán Somerville Senn | Director | January - December 2018 | 166 | — | 50 |
Foreigner | Patricio Gómez Sabaini | Director | January - December 2018 | 163 | — | 50 |
6.989.304-K | Domingo Cruzat Amunátegui | Director | January - December 2018 | 166 | — | 50 |
| TOTAL | | | 495 | — | 150 |
c) Guarantees given by the Company in favor of the directors
No guarantees have been given to the directors.
F-92
11.3 Compensation of key management personnel
a) Remunerations received by key management personnel
| | |
Key Management Personnel | ||
Taxpayer ID No. | Name | Position |
Foreigner | Maurizio Bezzeccheri (1) | Chief Executive Officer |
Foreigner | Aurelio Ricardo Bustilho de Oliveira (2) | Administration, Finance and Control Manager |
10.560.169-7 | Francisco Miqueles Ruz (3) | Planning and Control Manager |
25.067.660-3 | Simone Tripepi (4) | Enel X South America Manager |
Foreigner | Raffaele Cutrignelli (5) | Internal Audit Manager |
6.973.465-0 | Domingo Valdés Prieto (5) | Attorney and Secretary of the Board |
Incentive plans for key management personnel
Enel Américas has implemented an annual bonus plan for its executives based on meeting company-wide objectives and on the level of their individual contribution in achieving the overall goals of the Group. The plan provides for a range of bonus amounts according to seniority level. The bonuses paid to the executives consist of a certain number of monthly gross remunerations.
Compensation of key management personnel is the following:
| | | |
| For the years ended December 31, | ||
| 2020 | 2019 | 2018 |
| ThUS$ | ThUS$ | ThUS$ |
Remuneration | 3,495 | 2,407 | 2,586 |
Short-term benefits for employees | 148 | 106 | 21 |
Other long-term benefits - IAS | 7 | — | — |
Total | 3,650 | 2,513 | 2,607 |
b) Guarantees established by the Company in favor of key management personnel
No guarantees have been given to key management personnel.
11.4 Compensation plans linked to share price
There are no payment plans granted to the Directors or key management personnel based on the share price of the Company.
F-93
The detail of inventories as of December 31, 2020 and 2019 is as follows:
| | | | |
| Balance as of | |||
| 12-31-2020 |
| 12-31-2019 |
|
Classes of Inventories | ThUS$ | | ThUS$ | |
Supplies for Production | 26,685 | | 35,589 | |
Oil | 16,686 | | 25,475 | |
Coal | 9,999 | | 10,114 | |
Spare parts | 53,013 | | 32,145 | |
Electrical materials | 391,735 | | 328,505 | |
Total | 471,433 | | 396,239 | |
There are no inventories acting as security for liabilities.
For the years ended December 31, 2020, 2019 and 2018, raw materials and inputs recognized as fuel cost amount to ThUS$137,850, ThUS$277,117 and ThUS$226,843 respectively (see Note 29).
For the years ended December 31, 2020, 2019 and 2018 there have been no impairments recognized in inventories.
13. CURRENT TAX ASSETS AND LIABILITIES
| a) | The detail of current tax receivables as of December 31, 2020 and 2019, is as follows: |
| | | | |
| Balance as of | |||
| 12-31-2020 |
| 12-31-2019 |
|
Tax Receivables | ThUS$ | | ThUS$ | |
Monthly provisional tax payments | 118,609 | | 98,158 | |
Other | 9,271 | | 9,163 | |
Total | 127,880 | | 107,321 | |
| b) | The detail of current tax payables as of December 31, 2020 and 2019, is as follows: |
| | | | |
| Balance as of | | ||
| 12-31-2020 |
| 12-31-2019 |
|
Tax Payables | ThUS$ | | ThUS$ | |
Income tax | 222,870 | | 220,727 | |
Total | 222,870 | | 220,727 | |
F-94
14. INVESTMENTS ACCOUNTED FOR USING THE EQUITY METHOD
14.1 Investments accounted for using the equity method
| a) | The investments of the Group accounted for using the equity method and their changes during the years ended December 31, 2020 and 2019, are detailed as follows: |
| | | | | | | | | | | | | | |
| | | | | | | | | | | Other | | Argentine | |
| | | | | | Balance as of | | | | Foreign Currency | Comprehensive | Other | hyperinflationary | Balance as of |
Taxpayer ID | | | | | Ownership Interest | 1/1/2020 | Additions | Share of Profit (Loss) | Dividends Declared | Translation | Income | Increase (Decrease) | economy | 12/31/2020 |
No, | Associates and Joint Ventures | Relationship | Country | Functional Currency | % | ThUS$ | ThUS$ | ThUS$ | ThUS$ | ThUS$ | ThUS$ | ThUS$ | ThUS$ | ThUS$ |
Foreigner | Yacylec S.A. | Associate | Argentina | Argentine peso | 33.33% | 1,220 | — | 475 | (345) | (252) | — | — | (103) | 995 |
Foreigner | Sacme S.A. | Associate | Argentina | Argentine peso | 50.00% | 186 | — | 28 | — | (54) | — | (75) | 48 | 133 |
Foreigner | Central Térmica Manuel Belgrano (1) | Associate | Argentina | Argentine peso | — | 32 | — | 687 | (483) | (9) | — | (227) | — | — |
Foreigner | Central Térmica San Martin (1) | Associate | Argentina | Argentine peso | — | 249 | — | 732 | (548) | (72) | — | (361) | — | — |
Foreigner | Central Vuelta Obligado S.A. | Associate | Argentina | Argentine peso | 40.90% | 291 | — | 1,211 | (481) | (84) | — | 208 | — | 1,145 |
| | | | | TOTAL | 1,978 | — | 3,133 | (1,857) | (471) | — | (455) | (55) | 2,273 |
| | | | | | | | | | | | | | |
| | | | | | | | | | | | | | |
| | | | | | | | | | | Other | | Argentine | |
| | | | | | Balance as of | | | | Foreign Currency | Comprehensive | Other | hyperinflationary | Balance as of |
Taxpayer ID | | | | | Ownership Interest | 1/1/2019 | Additions | Share of Profit (Loss) | Dividends Declared | Translation | Income | Increase (Decrease) | economy | 12/31/2019 |
No, | Associates and Joint Ventures | Relationship | Country | Functional Currency | % | ThUS$ | ThUS$ | ThUS$ | ThUS$ | ThUS$ | ThUS$ | ThUS$ | ThUS$ | ThUS$ |
Foreigner | Yacylec S.A. | Associate | Argentina | Argentine peso | 33.33% | 556 | — | (227) | — | (362) | — | 668 | 585 | 1,220 |
Foreigner | Sacme S.A. | Associate | Argentina | Argentine peso | 50.00% | 236 | — | 20 | (62) | (87) | — | — | 79 | 186 |
Foreigner | Central Termica Manuel Belgrano | Associate | Argentina | Argentine peso | 25.60% | 868 | — | 117 | (631) | (322) | — | — | — | 32 |
Foreigner | Central Termica San Martin | Associate | Argentina | Argentine peso | 25.60% | 931 | — | 165 | (501) | (346) | — | — | — | 249 |
Foreigner | Central Vuelta Obligado S.A. | Associate | Argentina | Argentine peso | 40.90% | 5 | — | 508 | (220) | (2) | — | — | — | 291 |
| | | | | TOTAL | 2,596 | — | 583 | (1,414) | (1,119) | — | 668 | 664 | 1,978 |
(1) During November 2020, all conditions were met to allow the Argentine government to enter into the ownership of the Manuel Belgrano Thermal Power Plant and the San Martin Thermal Power Plant. This situation caused the Group to lose significant influence in those plants (see Note 35.6).
Based on the above, the Group reclassified these investments as financial assets at fair value through profit or loss, generating a finance income of ThUS$ 24,893 at year end of 2020 (see Note 33).
| b) | Additional financial information on investments in associates: |
| - | Investments with significant influence |
The following tables set forth financial information as of December 31, 2020 and 2019, from the financial statements of the investments in associates where the Group has significant influence:
| | | | | | | | | | | | | | | | | | | | |
| December 31, 2020 | | ||||||||||||||||||
| Ownership |
| Current |
| Non-Current |
| Current |
| Non-Current |
| Revenue |
| Expenses |
| Profit |
| Other |
| Comprehensive |
|
Investments with Significant Influence | % | | ThUS$ | | ThUS$ | | ThUS$ | | ThUS$ | | ThUS$ | | ThUS$ | | ThUS$ | | ThUS$ | | ThUS$ | |
Yacylec S.A. | 33.33% | | 3,975 | | 1,314 | | 866 | | 1,437 | | 3,388 | | (1,963) | | 1,425 | | (755) | | 670 | |
F-95
| | | | | | | | | | | | | | | | | | | | |
| December 31, 2019 | | ||||||||||||||||||
| Ownership | | Current | | Non-Current | | Current | | Non-Current | | Revenue | | Expenses | | Profit | | Other | | Comprehensive | |
Investments with Significant Influence | % | | ThUS$ | | ThUS$ | | ThUS$ | | ThUS$ | | ThUS$ | | ThUS$ | | ThUS$ | | ThUS$ | | ThUS$ | |
Yacylec S.A. | 33.33% | | 4,831 | | 1,323 | | 932 | | 1,562 | | 3,085 | | (4,155) | | (1,070) | | (1,585) | | (2,655) | |
| | | | | | | | | | | | | | | | | | | | |
None of our associates have issued price quotations.
There are no significant commitments and contingencies, or restrictions to the availability of funds in associated companies and joint ventures.
F-96
15. INTANGIBLE ASSETS OTHER THAN GOODWILL
The following table presents intangible assets other than Goodwill as of December 31, 2020 and 2019:
| | |
Classes of Intangible Assets, gross | 12-31-2020 | 12-31-2019 |
Intangible Assets, Gross | 8,525,990 | 10,206,344 |
Easements and water rights | 50,415 | 47,752 |
Concessions | 8,042,389 | 9,787,352 |
Development costs | 14,544 | 14,494 |
Patents, registered trademarks and other rights | 44,596 | 46,644 |
Computer software | 372,455 | 308,336 |
Other identifiable intangible assets | 1,591 | 1,766 |
| | |
Intangible Assets, Amortization and Impairment | 12-31-2020 | 12-31-2019 |
Accumulated Amortization and Impairment, Total | (4,001,164) | (4,678,465) |
Easements and water rights | (16,969) | (16,265) |
Concessions | (3,807,526) | (4,505,624) |
Development costs | (9,708) | (9,948) |
Patents, registered trademarks and other rights | (23,499) | (21,154) |
Computer software | (141,994) | (123,906) |
Other identifiable intangible assets | (1,468) | (1,568) |
| | |
Classes of Intangible Assets, Net | 12-31-2020 | 12-31-2019 |
Intangible Assets, Net | 4,524,826 | 5,527,879 |
Easements and water rights | 33,446 | 31,487 |
Concessions, Net(1) | 4,234,863 | 5,281,728 |
Development costs | 4,836 | 4,546 |
Patents, registered trademarks and other rights | 21,097 | 25,490 |
Computer software | 230,461 | 184,430 |
Other identifiable intangible assets | 123 | 198 |
(1) The detail of concessions is the following:
F-97
| | |
Concession Holder | 12-31-2020 | 12-31-2019 |
Enel Distribución Río S.A. (*) | 534,325 | 688,901 |
Enel Distribución Ceará S.A. (*) | 434,656 | 543,441 |
Enel Distribución Goias S.A. (*) | 1,240,641 | 1,457,864 |
Enel Distribución Sao Paulo S.A. (*) | 1,965,083 | 2,591,522 |
EGP Cachoeira Dourada S.A. | 60,158 | — |
TOTAL | 4,234,863 | 5,281,728 |
(*) Public service concession agreements to a private operator are recorded in accordance with IFRIC 12 Service Concession Agreements (see Note 3.d.1).
The reconciliations of the carrying amounts of intangible assets as of December 31, 2020 and 2019 are as follows:
| | | | | | | |
| | | | Patents, Registered | | | |
| Development | | | Trademarks and | Computer | Other Identifiable | Intangible Assets, |
| Costs | Easements | Concessions | Other Rights | Software | Intangible Assets | Net |
Changes in Intangible Assets | ThUS$ | ThUS$ | ThUS$ | ThUS$ | ThUS$ | ThUS$ | ThUS$ |
Opening balance as of January 1, 2020 | 4,546 | 31,487 | 5,281,728 | 25,490 | 184,430 | 198 | 5,527,879 |
Changes in identifiable intangible assets: | | | | | | | — |
Increases other than from business combinations | — | — | 738,387 | — | 82,988 | — | 821,375 |
Increase (decrease) from foreign currency translation differences, net | (263) | (1,472) | (1,192,132) | (1,705) | (20,661) | (16) | (1,216,249) |
Amortization | (146) | (1,257) | (357,855) | (3,149) | (29,963) | (59) | (392,429) |
Increases (decreases) from transfers and other changes | 488 | 4,688 | (996) | 461 | (4,641) | — | — |
Increases (decreases) from transfers | 488 | 4,688 | (996) | 461 | (4,641) | — | — |
Disposals and removal from service | — | — | (16,522) | — | — | — | (16,522) |
Removals from service | — | — | (16,522) | — | — | — | (16,522) |
Argentine hyperinflationary economy | — | — | 37 | — | 9,991 | — | 10,028 |
Other increases (decreases) | 211 | — | (217,784) | — | 8,317 | — | (209,256) |
Total changes in identifiable intangible assets | 290 | 1,959 | (1,046,865) | (4,393) | 46,031 | (75) | (1,003,053) |
Closing balance as of December 31, 2020 | 4,836 | 33,446 | 4,234,863 | 21,097 | 230,461 | 123 | 4,524,826 |
| | | | | | | |
| | | | Patents, Registered | | | |
| Development | | | Trademarks and | Computer | Other Identifiable | Intangible Assets, |
| Costs | Easements | Concessions | Other Rights | Software | Intangible Assets | Net |
Changes in Intangible Assets | ThUS$ | ThUS$ | ThUS$ | ThUS$ | ThUS$ | ThUS$ | ThUS$ |
Opening balance as of January 1, 2019 | 4,255 | 43,235 | 5,637,387 | 14,118 | 128,218 | 76 | 5,827,289 |
Changes in identifiable intangible assets: | | | | | | | — |
Increases other than from business combinations | 13 | 178 | 601,792 | 1,042 | 83,051 | | 686,076 |
Increase (decrease) from foreign currency translation differences, net | 38 | (187) | (202,951) | (85) | (8,651) | | (211,836) |
Amortization | (387) | (1,181) | (437,962) | (3,486) | (22,429) | (62) | (465,507) |
Increases (decreases) from transfers and other changes | — | 1,804 | — | (5,040) | 3,236 | — | — |
Increases (decreases) from transfers | — | 1,804 | — | (5,040) | 3,236 | | — |
Disposals and removal from service | — | — | (15,675) | — | — | — | (15,675) |
Removals from service | — | — | (15,675) | — | — | — | (15,675) |
Argentine hyperinflationary economy | — | — | — | — | 7,391 | — | 7,391 |
Other increases (decreases) | 627 | (12,362) | (300,863) | 18,941 | (6,386) | 184 | (299,859) |
Total changes in identifiable intangible assets | 291 | (11,748) | (355,659) | 11,372 | 56,212 | 122 | (299,410) |
Closing balance as of December 31, 2019 | 4,546 | 31,487 | 5,281,728 | 25,490 | 184,430 | 198 | 5,527,879 |
As of December 31, 2020, the main additions to concession intangible assets in the amount of ThUS$738,387 arise mainly from Enel Distribución Río S.A., Enel Distribución Ceará S.A., Enel Distribución Sao Paulo S.A. and Enel Distribución Goiás S.A. for investments in networks and extensions to optimize their operation, in order to improve the efficiency and quality of the level of service. These are recorded under concessions, in accordance with IFRIC 12 (See Note 3.d.1). As of December 31, 2019, the main additions to intangible assets for a total of ThUS$601,792 arise mainly from Enel Distribución Río S.A., Enel Distribución Ceará S.A., Enel Distribución Sao Paulo S.A. and Enel Distribución Goiás S.A.
Additions to intangible assets for the year ended December 31, 2020 and 2019, amounted to ThUS$821,375 and ThUS$686,076, respectively.
F-98
The amortization of intangible assets amounted to ThUS$376,465, ThUS$449,463 and ThUS$351,114 for the years ended December 31, 2020, 2019 and 2018, respectively, which are presented net of PIS and COFINS taxes in the Brazilian subsidiaries.
The financial expenses capitalized for the years ended December 31, 2020, 2019 and 2018 were ThUS$ 1,185 ThUS$ 7,611 and ThUS$14,407, respectively (see Note 33). The average financing rate by averaging the financing rates from different geographical areas as 4.98%, 9.27% and 8.95% for the years ended December 31, 2020, 2019 and 2018, respectively.
During the years ended December 31, 2020, 2019 and 2018 the expenses for personnel directly related to constructions in progress were activated for the item of concessions for the amount of ThUS$76,470, ThUS$89,154 and ThUS$82,662, respectively.
No impairment losses have been recognized as of December 31, 2020, and 2019. According to the estimates and projections of the Group management, the projections for the cash flows attributed to intangible assets allow recovering the net value of these assets recorded as of December 31, 2020 and 2019 (see Note 3.e).
As of December 31, 2020 and 2019, the Company has no intangible assets of indefinite useful life that can represent significant amounts.
The following table sets forth goodwill by cash-generating unit or group of cash-generating units to which it belongs and changes for the years ended December 31, 2020 and 2019:
| | | | | | | | | | | | | | | | |
| | | Opening | | Foreign | | Argentine | | Closing | | | | Argentine | | Closing | |
| | | balance | | Currency | | hyperinflationary | | balance | | Foreign Currency | | hyperinflationary | | balance | |
| | | 1/1/2019 | | Translation | | economy | | 12/31/2019 | | Translation | | economy | | 12/31/2020 | |
Company | Cash Generating Unit |
| ThUS$ |
| ThUS$ |
| ThUS$ | | ThUS$ |
| ThUS$ |
| ThUS$ |
| ThUS$ | |
Enel Distribución Río S.A. (formerly Ampla) | Enel Distribución Río S.A. | | 219,380 | | (8,013) | | — | | 211,367 | | (47,672) | | — | | 163,695 | |
Compañía Distribuidora y Comercializadora de Energía S.A. | Compañía Distribuidora y Comercializadora de Energía S.A. | | 13,343 | | (152) | | — | | 13,191 | | (529) | | — | | 12,662 | |
Enel Generación El Chocón S.A. | Enel Generación El Chocón S.A. | | 26,255 | | (9,741) | | 8,858 | | 25,372 | | (7,299) | | 6,530 | | 24,603 | |
Enel Distribución Perú S.A.A. | Enel Distribución Perú | | 68,347 | | 1,300 | | — | | 69,647 | | (5,801) | | — | | 63,846 | |
EGP Cachoeira Dourada S.A. | EGP Cachoeira Dourada S.A. | | 80,441 | | (2,938) | | — | | 77,503 | | (17,480) | | — | | 60,023 | |
Enel Generación Perú S.A. | Enel Generación Perú | | 128,643 | | 2,447 | | — | | 131,090 | | (10,918) | | — | | 120,172 | |
Emgesa S.A. E.S.P. | Emgesa S.A. E.S.P. | | 5,902 | | (67) | | — | | 5,835 | | (234) | | — | | 5,601 | |
Enel Perú S.A. | Enel Distribución Perú | | 20 | | 3 | | — | | 23 | | (3) | | — | | 20 | |
Enel Brasil S.A. | Enel Brasil S.A. | | 1,021 | | (37) | | — | | 984 | | (222) | | — | | 762 | |
Enel Distribución Ceará S.A. (formerly Coelce) | Enel Distribución Ceará S.A. | | 110,429 | | (4,033) | | — | | 106,396 | | (23,997) | | — | | 82,399 | |
Enel Distribucion Sao Paulo | Enel Distribucion Sao Paulo | | 551,789 | | (20,154) | | — | | 531,635 | | (119,906) | | — | | 411,729 | |
| | | | | | | | | | | | | | | | |
Total | | | 1,205,570 | | (41,385) | | 8,858 | | 1,173,043 | | (234,061) | | 6,530 | | 945,512 | |
According to the Group management’s estimates and projections, the expected future cash flows projections attributable to the cash-generating units or groups of cash-generating units, to which the acquired goodwill has been allocated, allow the recovery of its carrying amount as of December 31, 2020 (see Note 3.e).
The origin of the goodwill is detailed below:
1.- Enel Distribución Rio S.A. (formerly Ampla Energia e Serviços S.A.)
On November 20, 1996, the Company and Enel Distribución Chile S.A. (formerly named Chilectra S.A.), together with Endesa, S.A. and Electricidad de Portugal, acquired a controlling equity interest in Cerj S.A. (now Enel Distribución Rio S.A.) of Rio de Janeiro in Brazil. The Company and Enel Distribución Chile S.A. together acquired 42% of the total shares in an international public bidding process held by the Brazilian government. The Company
F-99
and Enel Distribución Chile S.A. also acquired an additional 18.5% on December 31, 2000, as such, holding, directly and indirectly, a total 60.5% ownership interest.
2.- Enel Distribución Ceará S.A. (formerly Compañía Energética Do Ceará S.A.)
Between 1998 and 1999, the Company and its former subsidiary Enel Distribución Chile S.A., together with Endesa, S.A., acquired Compañía de Distribución Eléctrica del Estado de Ceará (now named Enel Distribución Ceará S.A.) in northeast Brazil in an international public bidding process held by the Brazilian government.
3.- Compañía Distribuidora y Comercializadora de Energía S.A. (Codensa S.A.)
On October 23, 1997, Enel Américas S.A. and its former subsidiary Enel Distribución Chile S.A., together with Endesa, S.A., acquired a 48.5% equity interest in Codensa, a company that distributes electricity in Santa Fé de Bogotá in Colombia. The acquisition took place through an international public bidding process held by the Colombian government.
4.- Enel Generación El Chocón S.A.
On August 31, 1993, Enel Generación Chile S.A. (formerly known as Endesa Chile) acquired a 59% equity interest of Enel Generación El Chocón S.A. in an international public bidding process held by the Argentine government.
5.- Enel Distribución Perú S.A.A.
On October 15, 2009, in a transaction on the Lima Stock Exchange, the Company acquired an additional 24% interest in Enel Distribución Perú S.A.A.
6.- EGP Cachoeira Dourada S.A.
On September 5, 1997, the Company’s former subsidiary Enel Generación Chile S.A. acquired 79% of EGP Cachoeira Dourada S.A. in the state of Goiás in a public bidding process held by the Brazilian government.
7.- Enel Generación Perú S.A.A (formerly Edegel S.A.A. )
On October 9, 2009, in a transaction on the Lima Stock Exchange in Peru, the Company’s former subsidiary Enel Generación Chile S.A. acquired an additional 29.3974% equity interest in Enel Generación Perú S.A.
8.- Emgesa S.A. E.S.P.
On October 23, 1997, the Company’s former subsidiary Enel Generación Chile S.A., together with Endesa, S.A., acquired a 48.5% equity interest in Emgesa S.A. E.S.P. in Colombia. The acquisition was made in an international public bidding process held by the Colombian government.
9.- Enel Distribución Sao Paulo S.A.
On June 7, 2018, the Company’s subsidiary Enel Brasil acquired majority stock ownership in Enel Distribución Sao Paulo S.A. (see Note 6.1).
F-100
17. PROPERTY, PLANT AND EQUIPMENT
The following table sets forth the property, plant and equipment as of December 31, 2020 and 2019:
| | | | | |
| | 12-31-2020 | | 12-31-2019 | |
Classes of Property, Plant and Equipment, Gross |
| ThUS$ |
| ThUS$ |
|
Property, Plant and Equipment, Gross | | 15,691,168 | | 15,957,450 | |
Construction in progress | | 1,107,981 | | 1,189,709 | |
Land | | 158,894 | | 163,522 | |
Buildings | | 479,161 | | 493,914 | |
Plant and equipment | | 6,894,543 | | 6,942,941 | |
Network Infrastructure | | 6,647,840 | | 6,743,394 | |
Fixtures and fittings | | 402,749 | | 423,970 | |
| | | | | |
| | 12-31-2020 | | 12-31-2019 | |
Classes of Accumulated Depreciation and Impairment in Property, Plant and Equipment | | ThUS$ | | ThUS$ | |
Accumulated Depreciation and Impairment in Property, Plant and Equipment | | (7,336,496) | | (7,194,012) | |
Buildings | | (225,850) | | (236,767) | |
Plant and equipment | | (3,509,839) | | (3,357,348) | |
Network Infrastructure | | (3,379,182) | | (3,374,311) | |
Fixtures and fittings | | (221,625) | | (225,586) | |
| | | | | |
| | 12-31-2020 | | 12-31-2019 | |
Classes of Property, Plant and Equipment, Net | | ThUS$ | | ThUS$ | |
Property, Plant and Equipment, Net | | 8,354,672 | | 8,763,438 | |
Construction in progress | | 1,107,981 | | 1,189,709 | |
Land | | 158,894 | | 163,522 | |
Buildings | | 253,311 | | 257,147 | |
Plant and equipment | | 3,384,704 | | 3,585,593 | |
Network Infrastructure | | 3,268,658 | | 3,369,083 | |
Fixtures and fittings | | 181,124 | | 198,384 | |
F-101
The composition and movements of the property, plant and equipment accounts for the year ended December 31, 2020 and 2019, are detailed as follows:
| | | | | | | |
| Construction | Land | Buildings, Net | Plant and | Network Infrastructure, Net | Fixtures and | Property, Plant and |
Changes in 2020 | ThUS$ | ThUS$ | ThUS$ | ThUS$ | ThUS$ | ThUS$ | ThUS$ |
Opening balance as of January 1, 2020 | 1,189,709 | 163,522 | 257,147 | 3,585,593 | 3,369,083 | 198,384 | 8,763,438 |
Increases other than from business combinations | 583,727 | — | 744 | 246 | — | 21,846 | 606,563 |
Increases (decreases) from foreign currency translation differences, net | (214,324) | (11,335) | (25,179) | (282,132) | (412,848) | (38,472) | (984,290) |
Depreciation | — | — | (11,198) | (207,624) | (203,165) | (23,264) | (445,251) |
Increases (decreases) from transfers and other changes | (483,505) | 2,076 | 23,769 | 159,526 | 276,955 | 21,179 | — |
Increases (decreases) from transfers from construction in progress | (483,505) | 2,076 | 23,769 | 159,526 | 276,955 | 21,179 | — |
Disposals and removal from service | — | (79) | — | (2,961) | (5,035) | (3,916) | (11,991) |
Disposals | — | (78) | — | (2,014) | (9) | (142) | (2,243) |
Removals | — | (1) | — | (947) | (5,026) | (3,774) | (9,748) |
Argentine hyperinflationary economy | 115,905 | 3,815 | 7,330 | 98,418 | 247,568 | (1,881) | 471,155 |
Other increases (decreases) | (83,531) | 895 | 698 | 33,638 | (3,900) | 7,248 | (44,952) |
Total changes | (81,728) | (4,628) | (3,836) | (200,889) | (100,425) | (17,260) | (408,766) |
Closing balance as of December 31, 2020 | 1,107,981 | 158,894 | 253,311 | 3,384,704 | 3,268,658 | 181,124 | 8,354,672 |
| | | | | | | |
| Construction | Land | Buildings, Net | Plant and | Network Infrastructure, Net | Fixtures and | Property, Plant and |
Changes in 2019 | ThUS$ | ThUS$ | ThUS$ | ThUS$ | ThUS$ | ThUS$ | ThUS$ |
Opening balance as of January 1, 2019 | 1,059,070 | 163,660 | 137,455 | 3,722,183 | 3,226,015 | 195,089 | 8,503,472 |
Increases other than from business combinations | 775,595 | 414 | 907 | 3,558 | — | 15,418 | 795,892 |
Increases (decreases) from foreign currency translation differences, net | (156,075) | (5,955) | (10,400) | (145,309) | (387,169) | (2,993) | (707,901) |
Depreciation | — | — | (14,011) | (227,473) | (193,738) | (23,006) | (458,228) |
Impairment (losses) reversals recognized in profit or loss | — | — | (1,307) | — | — | — | (1,307) |
Increases (decreases) from transfers and other changes | (677,665) | 1,865 | 18,298 | 205,682 | 430,453 | 21,367 | — |
Increases (decreases) from transfers from construction in progress | (677,665) | 1,865 | 18,298 | 205,682 | 430,453 | 21,367 | — |
Disposals and removals from service | — | (855) | (5,180) | — | (7,416) | (3,428) | (16,879) |
Disposals | — | (794) | (412) | — | — | | (1,206) |
Removals | �� | (61) | (4,768) | — | (7,416) | (3,428) | (15,673) |
Decreases to be classified as maintained to distribute to owners | 163,990 | 4,731 | 9,150 | 75,860 | 340,626 | 19,819 | 614,176 |
Other increases (decreases) | 24,794 | (338) | 122,235 | (48,908) | (39,688) | (23,882) | 34,213 |
Total changes | 130,639 | (138) | 119,692 | (136,590) | 143,068 | 3,295 | 259,966 |
Closing balance as of December 31, 2019 | 1,189,709 | 163,522 | 257,147 | 3,585,593 | 3,369,083 | 198,384 | 8,763,438 |
Additional information on property, plant and equipment, net
| a) | Main investments |
The main additions to property, plant and equipment correspond to investments in operating plants, distribution networks and new projects for ThUS$606,563 and ThUS$795,892 the years ended December 31, 2020 and 2019, respectively.
In the generation business, investments in combined cycle power plants and hydroelectric power plants in the subsidiaries Enel Generación Perú S.A., Emgesa and Enel Generación Costanera that involved additions as of December 31, 2020, amounted to ThUS$163,418 (as of December 31, 2019, investments in combined cycle power plants and hydroelectric power plants in the subsidiaries Enel Generación Perú S.A., Emgesa and Enel Generación Costanera were in the amount of ThUS$221,257), whereas in the distribution businesses the largest investments have been in extensions and networks to optimize their operation, in order to improve the efficiency and quality of the level of service, which were in the amount of ThUS$442,833 as of December 31, 2020 (ThUS$551,787 as of December 31, 2019).
The depreciation of property, plant and equipment are presented net of PIS and COFINS taxes in the Brazilian subsidiaries.
| b) | Capitalized cost |
b.1) Capitalized financial expenses
The capitalized cost for financial expenses for the years ended December 31, 2020, 2019 and 2018 amounted to ThUS$6,376, ThUS$8,092 and ThUS$4,922, respectively (see Note 33). The average funding rate mainly depends on the geographic area and amounted to 6.04%, 7.49% and 7.25% as of December 31, 2020, 2019 and 2018, respectively.
F-102
b.2) Capitalized personnel expenses
The capitalized cost for personnel expenses directly related to construction in progress for the years ended December 31, 2020, 2019 and 2018 amounted to ThUS$70,681, ThUS$92,411 and ThUS$95,335, respectively.
c) Other information
| i) | As of December 31, 2020, the Group had contractual commitments for the acquisition of property, plant and equipment amounting to ThUS$1,078,846 (ThUS$986,935 as of December 31, 2019) (including commitments to acquire intangibles from our Brazilian distribution subsidiaries). |
| ii) | As of December 31, 2020, the Group had property, plant and equipment pledged as security for liabilities for ThUS$104,577 (ThUS$114,699 as of December 31, 2019 (see Note 35.1). |
| iii) | The Company and its foreign subsidiaries have insurance policies for all risks, earthquake and machinery breakdown and damages for business interruption with a €1,000 million (ThUS$1,226,950) limit, including business interruption coverage. Additionally, the Company has Civil Liability insurance to meet claims from third parties with a €400 million (ThUS$490,780) limit. The premiums associated with these policies are presented proportionally for each company under the line item “other non-financial assets”. |
| iv) | For Enel Generación Costanera, due to the application of IAS 29 - Financial Information in Hyperinflationary Economies, (see Note 2.9), the book value of property, plant and equipment as of January 1, 2018 exceeded its recoverable value, which resulted in a deterioration of ThUS $162,274 (equivalent to ThARS 3,102,739 at the exchange rate on that date). At the end of fiscal year 2018, the Enel Generación Costanera recorded a partial reversal of the aforementioned impairment of ThUS $70,513 (equivalent to ThARS 2,656,082 using the exchange rate as of December 31, 2018), which was recognized in the results for the year, mainly as a result of the positive impact that the depreciation of the Argentine peso had on the company’s income, whose revenues are denominated in dollars. |
a)Right-of-use assets
Right-of-use assets for the year ended December 31, 2020 and 2019, are detailed as follows:
| | | | |
Changes 2020 | Land | Buildings, Net | Other Plant and equipment, Net | Right-of-use assets, Net |
| ThUS$ | ThUS$ | ThUS$ | ThUS$ |
Opening balance as of January 1, 2020 | 3,023 | 66,858 | 185,918 | 255,799 |
New contracts of right-of-use assets | 14,080 | 551 | 4,546 | 19,177 |
Increases (decreases) from foreign currency translation differences | 555 | (10,472) | (21,080) | (30,997) |
Removals | - | (75) | (159) | (234) |
Depreciation | (1,357) | (11,366) | (23,768) | (36,491) |
Other increases (decreases) | 132 | 82 | 14,952 | 15,166 |
Total changes | 13,410 | (21,280) | (25,509) | (33,379) |
Closing balance as of December 31, 2020 | 16,433 | 45,578 | 160,409 | 222,420 |
F-103
| | | | |
Changes 2019 | Land | Buildings, Net | Other Plant and equipment, Net | Right-of-use assets, Net |
| ThUS$ | ThUS$ | ThUS$ | ThUS$ |
Opening balance as of January 1, 2019 before application of IFRS 16 | - | 1,424 | 181,931 | 183,355 |
Effects first application IFRS 16 | 3,448 | 50,840 | 17,538 | 71,826 |
Opening balance as of January 1, 2019 after application of IFRS 16 | 3,448 | 52,264 | 199,469 | 255,181 |
Increases (decreases) from foreign currency translation differences | (90) | (1,328) | 1,557 | 139 |
Depreciation | (618) | (13,049) | (27,111) | (40,778) |
Other increases (decreases) | 283 | 28,971 | 12,003 | 41,257 |
Total changes | (425) | 14,594 | (13,551) | 618 |
Closing balance as of December 31, 2019 | 3,023 | 66,858 | 185,918 | 255,799 |
As of December 31, 2020 and 2019, the main right-of-use assets and lease liabilities are detailed as follows:
- Lease contract with Banco de Crédito del Perú, for a 9-year term at a 5.8% fixed rate in U.S. dollars, with quarterly amortization that began on March 31, 2014. This lease was signed to finance the “Cold Generation Reserve” Unit.
- On July 21, 2016, a lease contract was signed with Banco de Crédito del Perú. That lease is for a 5-year term at a fixed rate of 3.68% in U.S. dollars, with quarterly amortization that began the second half of 2018. This lease was signed to finance a compressor and a natural gas station for the “Cold Generation Reserve” Unit of the Malacas thermal power plant (TG5).
- Lease contract signed on December 16, 2015, with Scotiabank, which is for a six and a half-year term, at a fixed rate of 3.75% in U.S. dollars, with quarterly amortization that began in September 2017. This lease was signed to finance the new TG-6 turbine for the Malacas thermal power plant (TG6).
- In addition, as a consequence of the application of IFRS 16 (see Note 3.f), the Group recognized as of January 1, 2019 rights of use assets related to property, plant and equipment in the amount of ThUS$71,826.
The present value of future payments derived from those contracts is detailed as follows:
| | | | | | |
| 12-31-2020 | 12-31-2019 | ||||
| Gross | Interest | Present Value | Gross | Interest | Present Value |
| ThUS$ | ThUS$ | ThUS$ | ThUS$ | ThUS$ | ThUS$ |
Less than one year | 56,509 | 5,017 | 51,492 | 88,846 | 7,203 | 81,643 |
From one to two years | 32,680 | 4,718 | 27,962 | 49,186 | 6,478 | 42,708 |
From two to three years | 16,395 | 3,454 | 12,941 | 31,187 | 4,946 | 26,241 |
From three to four years | 12,393 | 2,818 | 9,575 | 17,065 | 3,392 | 13,673 |
From one to five years | 11,798 | 2,073 | 9,725 | 10,055 | 2,128 | 7,927 |
More than five years | 36,747 | 5,882 | 30,865 | 20,318 | 2,243 | 18,075 |
Total | 166,522 | 23,962 | 142,560 | 216,657 | 26,390 | 190,267 |
b)Short-term and low value leases
The consolidated statement of income for the years ended December 31, 2020 and 2019 includes expenses in the amount of ThUS$10,641 and ThUS$10,341, respectively, that correspond to short-term rental payments for a total amount of ThUS$3,046 in 2020 and ThUS$4,040 in 2019, lease of low value underlying assets in the amount of ThUS$1,281 in 2020 and ThUS$226 in 2019 and amounts related to variable leases in the amount of ThUS$6,314 in 2020 and ThUS$6,075 in 2019, which are exempt from the application of IFRS 16 (See Note 3.f).
F-104
As of December 31, 2020, and 2019 future payments derived from those contracts are detailed as follows:
| | |
| 12-31-2020 | 12-31-2019 |
| ThUS$ | ThUS$ |
Less than one year | 196 | 866 |
From one to two years | 1,281 | 0 |
From two to three years | — | 0 |
From three to four years | — | 0 |
From four to five years | — | 0 |
More than five years | — | 0 |
Total | 1,477 | 866 |
19. INCOME TAX AND DEFERRED TAXES
a) |
The components of income tax for the years ended December 31, 2020, 2019 and 2018 are detailed as follows:
| | | | | | |
| For the years ended December 31, | | ||||
| 2020 | | 2019 | | 2018 | |
Current Income Tax and Adjustments to Current Income Tax for Previous Periods | ThUS$ |
| ThUS$ |
| ThUS$ | |
Income tax benefit (expense) | (559,077) | | (676,112) | | (697,569) | |
Tax benefit from tax losses, tax credits or temporary differences not previously recognized for the current period (current tax credits and/or benefits) | 8,956 | | 7,426 | | 20,104 | |
Adjustments to current tax from the previous period | 4,250 | | 23,419 | | 7,692 | |
Current tax (expenses) / benefit (related to cash flow hedges) | 18 | | 845 | | (894) | |
Other (expenses) / benefit from Current Tax | — | | — | | (20) | |
| | | | | | |
Current tax expense, net | (545,853) | | (644,422) | | (670,687) | |
Benefit / (expense) from deferred taxes for origination and reversal of temporary differences | (20,707) | | 415,513 | | 228,093 | |
Benefit / (expense) from deferred taxes due to changes in tax rates or the introduction of new taxes | — | | (7,437) | | 4,662 | |
Total deferred tax benefit / (expense) | (20,707) | | 408,076 | | 232,755 | |
Income tax expense | (566,560) | | (236,346) | | (437,932) | |
F-105
The following table reconciles income taxes resulting from applying the local current tax rate to “Net income before taxes” and the actual income tax expense recognized in the consolidated statement of comprehensive income for the years ended December 31, 2020, 2019 and 2018:
| | | | | | |
| | | | | | |
| | 2020 | | 2019 | | 2018 |
Reconciliation of Tax Expense | Tax Rate | ThUS$ | Tax Rate | ThUS$ | Tax Rate | ThUS$ |
ACCOUNTING INCOME BEFORE TAX | | 1,747,812 | | 2,406,109 | | 2,104,990 |
Total tax income (expense) using statutory rate | (27.00)% | (471,909) | (27.00)% | (649,649) | (27.00)% | (568,347) |
Tax effect of rates applied in other countries | (4.67)% | (81,699) | (5.23)% | (125,912) | (6.64)% | (139,772) |
Tax effect of tax-exempt revenue and other positive effects impacting the effective rate | 5.41% | 94,578 | 26.31% | 633,125 | 19.14% | 402,989 |
Tax effect of non-deductible expenses for determining taxable profit (loss) | (6.40)% | (111,780) | (4.57)% | (109,892) | (6.90)% | (145,156) |
Tax effect of changes in income tax rates | | — | (0.31)% | (7,437) | 0.22% | 4,662 |
Tax effect of adjustments to income taxes in previous periods | 0.24% | 4,250 | 0.97% | 23,419 | 0.37% | 7,692 |
Total adjustments to tax expense using statutory rate | (5.42)% | (94,651) | 17.18% | 413,303 | 6.20% | 130,415 |
Income tax benefit (expense) | (32.42)% | (566,560) | (9.82)% | (236,346) | (20.80)% | (437,932) |
The main temporary differences are described below:
F-106
| b) | Deferred taxes |
The table below shows the balances of the deferred tax assets and liabilities presented in the consolidated statement of financial position at December 31, 2020 and 2019:
| | | | | | | | |
| December 31, 2020 | | December 31, 2019 | | ||||
Assets/(Liabilities) for Deferred Taxes | Assets | | Liabilities | | Assets | | Liabilities | |
| ThUS$ |
| ThUS$ |
| ThUS$ |
| ThUS$ |
|
Depreciations | 17,717 | | (448,711) | | 25,659 | | (508,172) | |
Amortizations | 4,161 | | (16,505) | | 6,158 | | (22,213) | |
Obligations for post-employment benefits | 498,424 | | — | | 552,760 | | (154) | |
Revaluations of financial instruments | 2,274 | | (31,883) | | 1,211 | | (11,626) | |
Tax loss | 209,339 | | — | | 281,080 | | — | |
Provisions | 630,331 | | (205,151) | | 636,653 | | (237,040) | |
Provision for Civil Contingencies | 247,400 | | — | | 241,520 | | — | |
Provision Contingencies Workers | 28,467 | | — | | 36,878 | | — | |
Provision uncontainable accounts | 121,764 | | — | | 122,104 | | — | |
Provision of Human Resources accounts | 18,724 | | — | | 16,339 | | — | |
Financial assets IFRIC 12 | — | | (194,045) | | — | | (207,425) | |
Other Provisions | 213,976 | | (11,106) | | 219,812 | | (29,615) | |
Other Deferred Taxes | 197,727 | | (476,294) | | 194,989 | | (474,925) | |
Amortization PPA - (Enel Distribución Goiás and Sao Paulo) | — | | (75,497) | | — | | (105,236) | |
Monetary Correction - Argentina | — | | (289,158) | | — | | (285,210) | |
Other Deferred Taxes | 197,727 | | (111,639) | | 194,989 | | (84,479) | |
Deferred taxes Assets/(Liabilities) before compensation | 1,559,973 | | (1,178,544) | | 1,698,510 | | (1,254,130) | |
Compensation deferred taxes Assets/Liabilities | (565,591) | | 565,591 | | (610,276) | | 610,276 | |
Deferred taxes Assets/(Liabilities) after compensation | 994,382 | | (612,953) | | 1,088,234 | | (643,854) | |
The origin and changes in deferred tax assets and liabilities as of December 31, 2020 and 2019 are as follows:
| | | | | | |
| | Movements | | |||
Deferred Taxes Assets/(Liabilities) | Net balance as of January 1, 2020 | Recognized in profit or loss | Recognized in comprehensive income | Foreign currency translation difference | Other increases (decreases) | Net balance as of December 31, 2020 |
| ThUS$ | ThUS$ | ThUS$ | ThUS$ | ThUS$ | ThUS$ |
Depreciations | (482,513) | (8,120) | — | 94,913 | (35,274) | (430,994) |
Amortizations | (16,055) | 91 | — | 3,620 | — | (12,344) |
Obligations for post-employment benefits | 552,606 | (93,757) | 161,330 | (122,045) | 290 | 498,424 |
Revaluations of financial instruments | (10,415) | (26,693) | 5,056 | 2,446 | (3) | (29,609) |
Tax loss | 281,080 | (10,184) | — | (63,849) | 2,292 | 209,339 |
Provisions | 399,613 | 83,431 | — | (88,945) | 31,081 | 425,180 |
Provision for Civil Contingencies | 241,520 | (1,643) | — | (26,933) | 34,456 | 247,400 |
Provision Contingencies Workers | 36,878 | 3,618 | — | (7,150) | (4,879) | 28,467 |
Provision for doubtful trade accounts | 122,104 | 53,041 | — | (44,237) | (9,144) | 121,764 |
Provision of Human Resources accounts | 16,339 | 3,395 | — | (1,010) | — | 18,724 |
Financial assets IFRIC 12 | (207,425) | (34,068) | — | 46,864 | 584 | (194,045) |
Other Provisions | 190,197 | 59,088 | — | (56,479) | 10,064 | 202,870 |
Other Deferred Taxes | (279,936) | 34,525 | — | 12,380 | (45,536) | (278,567) |
Amortization PPA - (Enel Distribución Goiás) | (105,236) | 3,054 | — | 22,828 | 3,857 | (75,497) |
Monetary Correction - Argentina | (285,210) | (4,001) | — | 290 | (237) | (289,158) |
Other Deferred Taxes | 110,510 | 35,472 | — | (10,738) | (49,156) | 86,088 |
Deferred Taxes Assets/(Liabilities) | 444,380 | (20,707) | 166,386 | (161,480) | (47,150) | 381,429 |
F-107
| | | | | | |
| | Movements | | |||
Deferred Taxes Assets/(Liabilities) | Net balance as of January 1, 2019 | Recognized in profit or loss | Recognized in comprehensive income | Foreign currency translation difference | Other increases (decreases) | Net balance as of December 31, 2019 |
| ThUS$ | ThUS$ | ThUS$ | ThUS$ | ThUS$ | ThUS$ |
Depreciations | (349,781) | (38,520) | — | 82,756 | (176,968) | (482,513) |
Amortizations | (17,194) | 119 | — | (308) | 1,328 | (16,055) |
Obligations for post-employment benefits | 373,951 | (1,962) | 195,098 | (17,182) | 2,701 | 552,606 |
Revaluations of financial instruments | (5,074) | 1,339 | (1,320) | (162) | (5,198) | (10,415) |
Tax loss | 258,589 | 1,481 | — | (10,630) | 31,640 | 281,080 |
Provisions | 593,249 | (112,506) | — | (30,273) | (50,857) | 399,613 |
Provision for Civil Contingencies | 256,544 | (46,541) | — | (11,377) | 42,894 | 241,520 |
Provision Contingencies Workers | 32,360 | 146 | — | 116 | 4,256 | 36,878 |
Provision for doubtful trade accounts | 235,875 | 7,096 | — | (9,042) | (111,825) | 122,104 |
Provision of Human Resources accounts | 14,730 | 680 | — | (223) | 1,152 | 16,339 |
Financial assets IFRIC 12 | (196,683) | (36,402) | — | 12,177 | 13,483 | (207,425) |
Other Provisions | 250,423 | (37,485) | — | (21,924) | (817) | 190,197 |
Other Deferred Taxes | (966,773) | 558,125 | — | 37,743 | 90,969 | (279,936) |
Amortization PPA - (Enel Distribución Goiás) | (682,399) | 563,517 | — | 13,646 | — | (105,236) |
Monetary Correction - Argentina | (265,047) | 370 | — | 629 | (21,162) | (285,210) |
Other Deferred Taxes | (19,327) | (5,762) | — | 23,468 | 112,131 | 110,510 |
Deferred Taxes Assets/(Liabilities) | (113,033) | 408,076 | 193,778 | 61,944 | (106,385) | 444,380 |
Recovery of deferred tax assets will depend on whether sufficient taxable profits are obtained in the future. The Company’s management believes that the future profit projections for its subsidiaries will allow these assets to be recovered.
The Group has not recognized deferred tax liabilities for taxable temporary differences relating to investment in subsidiaries and joint ventures, as it is able to control the timing of the reversal of the temporary differences and considers that it is probable that such temporary differences will not reverse in the foreseeable future. As of December 31, 2020, the aggregate amount of taxable temporary differences relating to investments in subsidiaries and joint ventures for which deferred tax liabilities have not been recognized were ThUS$2,839,057 (ThUS$3,427,371 as of December 31, 2019). On the other hand, the total amount of deductible temporary differences relating to investments in subsidiaries and joint ventures for which as of December 31, 2020, it is probable that will not reverse in the foreseeable future or there will be not sufficient taxable profits in the future to recover such temporary differences was ThUS$4,213,400 (ThUS$2,362,974 as of December 31, 2019).
The Group companies are potentially subject to income tax audits by the tax authorities of each country in which the Group operates. Such tax audits are limited to a number of annual tax periods and once these have expired, audits of these periods can no longer be performed. Tax audits by nature are often complex and can require several years to complete. The following table presents a summary of tax years potentially subject to examination:
| |
Country | Period |
Chile | 2017 - 2019 |
Argentina | 2014 - 2019 |
Brazil | 2015 - 2019 |
Colombia | 2016 - 2019 |
Peru | 2015 - 2019 |
Given the range of possible interpretations of tax standards, the results of any future inspections carried out by tax authorities for the years subject to audit can give rise to tax liabilities that cannot currently be quantified objectively.
F-108
Nevertheless, the Company’s management estimates that the liabilities, if any, that may arise from such audits, would not significantly impact the Group companies’ future results.
The effects of deferred taxes on the components of other comprehensive income attributable to both controlling and non-controlling interests for the years ended December 31, 2020, 2019 and 2018, are as follows:
| | | | | | | | | | | | | | | | | | |
| December 31, 2020 | | December 31, 2019 | | December 31, 2018 | | ||||||||||||
Effects of Income Tax on the Components of Other Comprehensive Income | Amount | | Income Tax | | Amount | | Amount | | Income | | Amount | | Amount | | Income | | Amount | |
| ThUS$ |
| ThUS$ |
| ThUS$ |
| ThUS$ |
| ThUS$ |
| ThUS$ |
| ThUS$ |
| ThUS$ |
| ThUS$ |
|
Financial assets at fair value through other comprehensive income | (10) | | — | | (10) | | (598) | | — | | (598) | | (458) | | — | | (458) | |
Cash flow hedges | (12,976) | | 5,038 | | (7,938) | | 5,906 | | (2,165) | | 3,741 | | (2,727) | | 1,354 | | (1,373) | |
Foreign currency translation | (2,249,915) | | — | | (2,249,915) | | (765,005) | | — | | (765,005) | | (1,575,134) | | — | | (1,575,134) | |
Actuarial gains (losses) from defined benefit pension plans | (476,805) | | 161,766 | | (315,039) | | (576,143) | | 195,098 | | (381,045) | | (177,527) | | 59,684 | | (117,843) | |
Income tax related to components of other income and expenses with a charge or credit in equity | (2,739,706) | | 166,804 | | (2,572,902) | | (1,335,840) | | 192,933 | | (1,142,907) | | (1,755,846) | | 61,038 | | (1,694,808) | |
The effects of deferred taxes on the components of other comprehensive income attributable to both controlling and non-controlling interests for the years ended December 31, 2020, 2019 and 2018, are as follows:
| | | | | | |
| For the years ended December 31, | | ||||
| 2020 | | 2019 | | 2018 | |
Reconciliation of deferred tax movements between Balance Sheet and income taxes in Comprehensive income | ThUS$ |
| ThUS$ |
| ThUS$ | |
| | | | | | |
Total increases (decreases) for deferred taxes of other comprehensive income | 166,386 | | 193,778 | | 60,144 | |
Income tax of changes in cash flow hedge transactions | (18) | | (845) | | 894 | |
Deferred taxes of changes from defined benefit pension plans | 436 | | — | | — | |
Total income tax relating to components of other comprehensive income | 166,804 | | 192,933 | | 61,038 | |
As a result of this increase in rates, the Colombian subsidiaries recognized as of December 31, 2018 variations in their deferred tax assets and liabilities. The net credit to results amounted to ThUS$ 4,662.
The main actions for the Company stated within the Act, as well as its regulations are as follows:
Act No. 27,430 provided that the corporate income tax rate would be reduced from 30% to 25% and that the additional tax on dividends or profits distributed to individuals from Argentina and abroad and legal entities from abroad would increase from 7% to 13% for fiscal periods beginning January 1, 2020. The amendment ended that rate change and preserved the original 30% and 7% rates, respectively, for annual fiscal years beginning on January 1, 2022, inclusive.
Act No. 27,468 provided that for the first three annual fiscal (tax) years beginning on January 1, 2019 the positive or negative inflationary adjustment should be distributed as follows: one-third in the annual fiscal year in which the
F-109
adjustment was determined and two equal thirds in the next two immediate annual fiscal years. The amendment modified that distribution and established that the positive or negative adjustment corresponding to the first and second fiscal year beginning as of January 1, 2019, must be distributed as follows: one-sixth on the annual fiscal year in which the adjustment is determined and the remaining five-sixths in the next five immediate fiscal periods. On the other hand, 100% of the adjustment may be deducted in the year in which it is determined for annual fiscal years beginning on January 1, 2021.
On December 31, 2019, Argentine subsidiaries recorded the variations of their deferred tax assets and liabilities as a result of this increase in rates. The net charges to profit and loss amounted to ThUS$7,437.
| f) | On November 6, 2019 and after its approval at an Extraordinary Shareholder’s Meeting, Enel Distribución Sao Paulo merged the assets and liabilities of its parent, Enel Brasil Investimentos Sudeste S.A. (“Enel Sudeste”). The merged assets include amounts related to the concessionaire’s intangibles, as well as the recognition of the deferred tax liability on the concessionaire’s intangibles mentioned above (see Note 6.2). Once the merger was carried out, the deferred tax obligations were reversed, since the differences between the tax and accounting base at the time of the acquisition of Enel Distribución Sao Paulo were equal and will be written off in the concessionaire’s future payments. As mentioned above, the company recognized a deferred tax benefit in earnings amounting to ThUS$ 553,225 for the 2019 fiscal year. |
20. OTHER FINANCIAL LIABILITIES
The balance of other financial liabilities as of December 31, 2020 and 2019, is as follows:
| | | | | | | | |
| December 31, 2020 | | December 31, 2019 | | ||||
| Current | | Non-Current | | Current | | Non-Current | |
Other Financial Liabilities | ThUS$ |
| ThUS$ |
| ThUS$ |
| ThUS$ |
|
Interest-bearing borrowings | 1,815,160 | | 3,837,697 | | 1,397,187 | | 4,780,797 | |
Hedging derivatives (*) | 6,730 | | 9 | | 9,500 | | 1,036 | |
Non-hedging derivatives (**) | 3,240 | | — | | 1,720 | | — | |
Total | 1,825,130 | | 3,837,706 | | 1,408,407 | | 4,781,833 | |
(*) | See Note 23.2.a |
(**) | See Note 23.2.b |
| a) | 20.1 Interest-bearing borrowings. |
The detail of current and non-current interest-bearing borrowings as of December 31, 2020 and 2019 is as follows:
| | | | | | | | |
| December 31, 2020 | | December 31, 2019 | | ||||
| Current | | Non-Current | | Current | | Non-Current | |
Classes of Interest-Bearing Borrowings | ThUS$ |
| ThUS$ |
| ThUS$ |
| ThUS$ |
|
Secured bank loans | 235,404 | | 247,150 | | 258,976 | | 585,107 | |
Unsecured bank loans | 927,075 | | 149,057 | | 447,954 | | 37,173 | |
Unsecured bonds | 409,087 | | 2,864,794 | | 264,634 | | 3,357,885 | |
Secured bonds | 154,955 | | 395,289 | | 395,987 | | 696,529 | |
Other obligations | 88,639 | | 181,407 | | 29,636 | | 104,103 | |
Total | 1,815,160 | | 3,837,697 | | 1,397,187 | | 4,780,797 | |
F-110
Bank loans by currency and contractual maturity as of December 31, 2020 and 2019 are as follows:
| - | Summary of bank loans by currency and maturity |
| | | | | | | | | | | | | |
| | | | | Current | Non-Current | |||||||
| | | | | Maturity | | Maturity | | |||||
| | Effective | Nominal | Secured / | One to three | Three to twelve | Total | One to two | Two to three years | Three to | Four to | More than five years | Total Non- |
Country | Currency | Rate | Rate | Unsecured | ThUS$ | ThUS$ | ThUS$ | ThUS$ | ThUS$ | ThUS$ | ThUS$ | ThUS$ | ThUS$ |
Chile | US$ | 2.65% | 0.94% | Unsecured | 175,040 | 150,196 | 325,236 | — | — | — | — | — | — |
Chile | CLP | 6.00% | 6.00% | Unsecured | 1 | — | 1 | — | — | — | — | — | — |
Peru | PEN | 2.62% | 2.59% | Unsecured | — | 25,043 | 25,043 | — | — | — | — | — | — |
Peru | PEN | 2.75% | 2.71% | Unsecured | 157 | 168,609 | 168,766 | 46,989 | 38,697 | — | — | — | 85,686 |
Brazil | US$ | 3.98% | 3.63% | Secured | 134,692 | 75,656 | 210,348 | 164,746 | — | 2,778 | — | — | 167,524 |
Brazil | BRL | 5.52% | 5.41% | Secured | 7,747 | 15,847 | 23,594 | 21,268 | 15,779 | 9,881 | 8,953 | 20,922 | 76,803 |
Brazil | US$ | 2.21% | 2.20% | Unsecured | 127,016 | 86,730 | 213,746 | — | — | — | — | — | — |
Brazil | BRL | 2.20% | 2.19% | Unsecured | 37,377 | 30,014 | 67,391 | — | — | — | — | — | — |
Colombia | COP | 0.01% | 0.01% | Secured | 281 | 1,181 | 1,462 | 1,575 | 1,248 | — | — | — | 2,823 |
Colombia | COP | 3.68% | 3.62% | Unsecured | 153 | 126,739 | 126,892 | 11,346 | 20,478 | 20,478 | 10,737 | 332 | 63,371 |
| | Total | | | 482,464 | 680,015 | 1,162,479 | 245,924 | 76,202 | 33,137 | 19,690 | 21,254 | 396,207 |
| | | | | | | | | | | | | |
| | | | | | | | | | | | | |
| | | | | Current | Non-Current | |||||||
| | | | | Maturity | | Maturity | | |||||
| | Effective | Nominal | Secured / | One to three months | Three to twelve months | Total | One to two years | Two to three years | Three to | Four to five years | More than five years | Total Non- |
Country | Currency | Rate | Rate | Unsecured | ThUS$ | ThUS$ | ThUS$ | ThUS$ | ThUS$ | ThUS$ | ThUS$ | ThUS$ | ThUS$ |
Chile | US$ | 4.99% | 2.67% | Unsecured | — | 351,820 | 351,820 | — | — | — | — | — | — |
Chile | CLP | 6.00% | 6.00% | Unsecured | 1 | — | 1 | — | — | — | — | — | — |
Peru | PEN | 4.16% | 4.10% | Unsecured | — | — | — | 22,614 | — | — | — | — | 22,614 |
Brazil | US$ | 4.44% | 4.16% | Secured | 7,281 | 151,859 | 159,140 | 318,251 | 148,012 | — | 2,786 | — | 469,049 |
Brazil | BRL | 6.70% | 6.60% | Secured | 7,458 | 92,378 | 99,836 | 27,916 | 26,338 | 15,975 | 10,576 | 35,253 | 116,058 |
Brazil | US$ | 4.66% | 4.65% | Unsecured | 495 | 60,534 | 61,029 | — | — | — | — | — | — |
Brazil | BRL | 6.53% | 6.52% | Unsecured | 876 | — | 876 | — | — | — | — | — | — |
Colombia | COP | 5.73% | 5.61% | Unsecured | 1,396 | 32,832 | 34,228 | 7,524 | 3,575 | 1,038 | 1,038 | 1,384 | 14,559 |
| | Total | | | 17,507 | 689,423 | 706,930 | 376,305 | 177,925 | 17,013 | 14,400 | 36,637 | 622,280 |
| - | Fair value measurement and hierarchy |
The fair value of current and non-current bank borrowings as of December 31, 2020 was ThUS$1,552,781 (ThUS$1,309,690 as of December 31, 2019). The borrowings have been classified as Level 2 fair value measurement based on the entry data used in the valuation techniques (see Note 3.h).
F-111
| | | | | | | | | | | | | | | | | | | | | | | | | | | | | | | | | | | | |
| | | | | | | | | | | | | | | | | | | | | December 31, 2020 | | ||||||||||||||
| | | | | | | | | | | | | | | | | | | | | Current | | Non-Current | | ||||||||||||
Taxpayer | | | | | Taxpayer | | | | | | | | Effective | | Nominal | | | | | | Less than | | More than | | One to two | | Two to | | Three to | | Four to | | More than | | Total Non- | |
ID No. | Company |
| Country |
| ID No. |
| Financial Institution |
| Country |
| Currency |
| Rate |
| Rate |
| Type of Amortization | | Secured |
| ThUS$ |
| ThUS$ |
| ThUS$ |
| ThUS$ |
| ThUS$ |
| ThUS$ |
| ThUS$ |
| ThUS$ | |
Foreign | Enel Distribución Río S.A. | | Brazil | | Foreign | | BNP PARIBAS | | U.S.A | | US$ | | 8.73% | | 8.40% | | Upon expiration | | Yes | | 2,641 | | — | | 77,010 | | — | | — | | — | | — | | 77,010 | |
Foreign | Enel Distribución Río S.A. | | Brazil | | Foreign | | BNDES | | Brazil | | BRL | | 3.01% | | 3.00% | | Monthly | | Yes | | 402 | | 1,192 | | 1,590 | | 662 | | — | | — | | — | | 2,252 | |
Foreign | Enel Distribución Río S.A. | | Brazil | | Foreign | | BNP PARIBAS | | Brazil | | US$ | | 2.72% | | 2.71% | | Upon expiration | | Yes | | 14 | | — | | 39,235 | | — | | — | | — | | — | | 39,235 | |
Foreign | Enel Distribución Río S.A. | | Brazil | | Foreign | | ITAÚ | | Brazil | | US$ | | 4.35% | | 4.34% | | Monthly | | Yes | | 1,575 | | 75,656 | | — | | — | | — | | — | | — | | — | |
Foreign | Enel Distribución Río S.A. | | Brazil | | Foreign | | CITIBANK | | Brazil | | US$ | | 1.76% | | 1.46% | | Monthly | | Yes | | 96,923 | | — | | — | | — | | — | | — | | — | | — | |
Foreign | Codensa | | Colombia | | Foreign | | FINDETER | | Colombia | | COP | | 0.01% | | 0.01% | | Upon expiration | | Yes | | 26 | | 237 | | 316 | | 290 | | — | | — | | — | | 606 | |
Foreign | Codensa | | Colombia | | Foreign | | FINDETER | | Colombia | | COP | | 0.01% | | 0.01% | | Upon expiration | | Yes | | 119 | | 537 | | 715 | | 596 | | — | | — | | — | | 1,311 | |
Foreign | Codensa | | Colombia | | Foreign | | FINDETER | | Colombia | | COP | | 0.01% | | 0.01% | | Upon expiration | | Yes | | 136 | | 407 | | 543 | | 362 | | — | | — | | — | | 905 | |
Foreign | Codensa | | Colombia | | Foreign | | BANCO BBVA COLOMBIA S.A. | | Colombia | | COP | | 2.63% | | 2.60% | | Biannual | | No | | — | | 4,880 | | 2,435 | | — | | — | | — | | — | | 2,435 | |
Foreign | Codensa | | Colombia | | Foreign | | BANCO DE BOGOTÁ | | Colombia | | COP | | 3.00% | | 2.97% | | Monthly | | No | | 11 | | 664 | | 996 | | 996 | | 996 | | 996 | | 332 | | 4,316 | |
Foreign | Codensa | | Colombia | | Foreign | | BANCO BBVA COLOMBIA S.A. | | Colombia | | COP | | 3.16% | | 3.12% | | Biannual | | No | | 142 | | — | | 7,914 | | 19,482 | | 19,482 | | 9,741 | | — | | 56,619 | |
Foreign | Codensa | | Colombia | | Foreign | | MUFG BANK LTD | | Japan | | COP | | 5.93% | | 5.80% | | Upon expiration | | No | | — | | 121,194 | | — | | — | | — | | — | | — | | — | |
Foreign | Enel Distribución Ceará S.A. | | Brazil | | Foreign | | BNDES | | Brazil | | COP | | 3.01% | | 3.00% | | Monthly | | Yes | | 201 | | 595 | | 793 | | 397 | | — | | — | | — | | 1,190 | |
Foreign | Enel Distribución Ceará S.A. | | Brazil | | Foreign | | BANCO DO BRASIL (BOND D) | | Brazil | | BRL | | 2.33% | | 1.67% | | Upon expiration | | Yes | | 3 | | — | | — | | — | | 1,143 | | — | | — | | 1,143 | |
Foreign | Enel Distribución Ceará S.A. | | Brazil | | Foreign | | BANCO DO BRASIL (BOND P) | | Brazil | | BRL | | 6.31% | | 6.30% | | Upon expiration | | Yes | | 21 | | — | | — | | — | | 1,636 | | — | | — | | 1,636 | |
Foreign | Enel Distribución Ceará S.A. | | Brazil | | Foreign | | BNB Nº 16.2018.204.23875 | | Brazil | | BRL | | 6.27% | | 6.26% | | Monthly | | Yes | | 2,404 | | 3,525 | | 4,700 | | 4,700 | | 4,700 | | 4,700 | | 10,967 | | 29,767 | |
Foreign | Enel Distribución Ceará S.A. | | Brazil | | Foreign | | BNB Nº 16.2018.204.23875 | | Brazil | | BRL | | 6.27% | | 6.26% | | Monthly | | Yes | | 2,166 | | 3,176 | | 4,235 | | 4,235 | | 4,235 | | 4,235 | | 9,881 | | 26,821 | |
Foreign | Enel Distribución Ceará S.A. | | Brazil | | Foreign | | SCOTIABANK | | Brazil | | BRL | | 2.22% | | 2.21% | | Upon expiration | | No | | 37,251 | | — | | — | | — | | — | | — | | — | | — | |
Foreign | Enel Distribución Ceará S.A. | | Brazil | | Foreign | | TOKIO | | Brazil | | BRL | | 1.69% | | 1.68% | | Upon expiration | | No | | 31,769 | | — | | — | | — | | — | | — | | — | | — | |
Foreign | Enel Distribución Ceará S.A. | | Brazil | | Foreign | | TOKIO | | Brazil | | BRL | | 1.79% | | 1.78% | | Upon expiration | | No | | 10,637 | | — | | — | | — | | — | | — | | — | | — | |
Foreign | Enel Distribución Ceará S.A. | | Brazil | | Foreign | | SCOTIABANK | | Brazil | | BRL | | 2.18% | | 2.17% | | Upon expiration | | No | | 127 | | 30,014 | | — | | — | | — | | — | | — | | — | |
Foreign | Enel Distribución Ceará S.A. | | Brazil | | Foreign | | FINEP | | Brazil | | BRL | | 6.48% | | 5.80% | | Upon expiration | | Yes | | — | | — | | — | | 18 | | 18 | | 18 | | 74 | | 128 | |
Foreign | Enel Distribución Perú S.A. | | Peru | | Foreign | | BANCO DE CREDITO DEL PERÚ S.A. | | Peru | | PEN | | 4.16% | | 4.10% | | Upon expiration | | No | | 38 | | 20,731 | | — | | — | | — | | — | | — | | — | |
Foreign | Enel Distribución Perú S.A. | | Peru | | Foreign | | BANCO INTERCIONAL DEL PERÚ S.A.A. | | Peru | | PEN | | 3.75% | | 3.70% | | Upon expiration | | No | | 58 | | — | | 46,989 | | — | | — | | — | | — | | 46,989 | |
Foreign | Enel Distribución Perú S.A. | | Peru | | Foreign | | BANCO DE CREDITO DEL PERÚ S.A. | | Peru | | PEN | | 2.61% | | 2.58% | | Upon expiration | | No | | 62 | | — | | — | | 38,698 | | — | | — | | — | | 38,698 | |
Foreign | Enel Distribución Goias S.A. | | Brazil | | Foreign | | BNDES CG | | Brazil | | BRL | | 9.61% | | 9.60% | | Monthly | | Yes | | 1,990 | | 5,604 | | 7,471 | | 3,113 | | — | | — | | — | | 10,584 | |
Foreign | Enel Distribución Goias S.A. | | Brazil | | Foreign | | SCOTIABANK | | U.S.A | | US$ | | 2.98% | | 2.30% | | Upon expiration | | Yes | | 390 | | — | | — | | — | | — | | — | | — | | — | |
Foreign | Enel Distribución Goias S.A. | | Brazil | | Foreign | | BNP | | U.S.A | | US$ | | 2.64% | | 1.84% | | Upon expiration | | Yes | | 33,124 | | — | | 48,504 | | — | | — | | — | | — | | 48,504 | |
94.271.000-3 | Enel Américas S.A. | | Chile | | Foreign | | BNP PARIBAS NY | | U.S.A | | US$ | | 4.99% | | 0.85% | | Upon expiration | | No | | 45,000 | | — | | — | | — | | — | | — | | — | | — | |
94.271.000-3 | Enel Américas S.A. | | Chile | | Foreign | | CITIBANK N.A | | U.S.A | | US$ | | 4.99% | | 0.85% | | Upon expiration | | No | | 15,000 | | — | | — | | — | | — | | — | | — | | — | |
94.271.000-3 | Enel Américas S.A. | | Chile | | Foreign | | CREDIT AGRICOLE CIB | | U.S.A | | US$ | | 4.99% | | 0.85% | | Upon expiration | | No | | 15,035 | | — | | — | | — | | — | | — | | — | | — | |
94.271.000-3 | Enel Américas S.A. | | Chile | | Foreign | | JPMORGAN CHASE BANK | | U.S.A | | US$ | | 4.99% | | 0.85% | | Upon expiration | | No | | 15,000 | | — | | — | | — | | — | | — | | — | | — | |
94.271.000-3 | Enel Américas S.A. | | Chile | | Foreign | | SUMITOMO MITSUI BANKING | | U.S.A | | US$ | | 4.99% | | 0.85% | | Upon expiration | | No | | 30,000 | | — | | — | | — | | — | | — | | — | | — | |
94.271.000-3 | Enel Américas S.A. | | Chile | | Foreign | | SOCIETE GENERALE | | U.S.A | | US$ | | 4.99% | | 0.85% | | Upon expiration | | No | | 15,000 | | — | | — | | — | | — | | — | | — | | — | |
94.271.000-3 | Enel Américas S.A. | | Chile | | Foreign | | BBVA NEW YORK BRANCH | | U.S.A | | US$ | | 4.99% | | 0.85% | | Upon expiration | | No | | 15,000 | | — | | — | | — | | — | | — | | — | | — | |
94.271.000-3 | Enel Américas S.A. | | Chile | | Foreign | | BBVA S.A NEW YORK BRANCH | | U.S.A | | US$ | | 1.38% | | 1.38% | | Upon expiration | | No | | — | | 50,196 | | — | | — | | — | | — | | — | | — | |
94.271.000-3 | Enel Américas S.A. | | Chile | | Foreign | | CREDIT AGRICOLE CIB | | U.S.A | | US$ | | 1.38% | | 1.38% | | Upon expiration | | No | | — | | 50,000 | | — | | — | | — | | — | | — | | — | |
94.271.000-3 | Enel Américas S.A. | | Chile | | Foreign | | THE BANK OF NOVA SCOTIA | | U.S.A | | US$ | | 1.38% | | 1.38% | | Upon expiration | | No | | — | | 50,000 | | — | | — | | — | | — | | — | | — | |
94.271.000-3 | Enel Américas S.A. | | Chile | | Foreign | | BNP PARIBAS NY | | U.S.A | | US$ | | 0.84% | | 0.84% | | Upon expiration | | No | | 7,500 | | — | | — | | — | | — | | — | | — | | — | |
94.271.000-3 | Enel Américas S.A. | | Chile | | Foreign | | CITIBANK N.A | | U.S.A | | US$ | | 0.84% | | 0.84% | | Upon expiration | | No | | 2,500 | | — | | — | | — | | — | | — | | — | | — | |
94.271.000-3 | Enel Américas S.A. | | Chile | | Foreign | | CREDIT AGRICOLE CIB | | U.S.A | | US$ | | 0.84% | | 0.84% | | Upon expiration | | No | | 2,504 | | — | | — | | — | | — | | — | | — | | — | |
94.271.000-3 | Enel Américas S.A. | | Chile | | Foreign | | JPMORGAN CHASE BANK | | U.S.A | | US$ | | 0.84% | | 0.84% | | Upon expiration | | No | | 2,500 | | — | | — | | — | | — | | — | | — | | — | |
94.271.000-3 | Enel Américas S.A. | | Chile | | Foreign | | SUMITOMO MITSUI BANKING | | U.S.A | | US$ | | 0.84% | | 0.84% | | Upon expiration | | No | | 5,000 | | — | | — | | — | | — | | — | | — | | — | |
94.271.000-3 | Enel Américas S.A. | | Chile | | 97036000-k | | SOCIETE GENERALE | | | U.S.A | | US$ | | 0.84% | | 0.84% | | Upon expiration | | No | | 2,500 | | — | | — | | — | | — | | — | | — | | — | |
94.271.000-3 | Enel Américas S.A. | | Chile | | Foreign | | BBVA NEW YORK BRANCH | | | U.S.A | | US$ | | 0.84% | | 0.84% | | Upon expiration | | No | | 2,500 | | — | | — | | — | | — | | — | | — | | — | |
94.271.000-3 | Enel Américas S.A. | | Chile | | Foreign | | LINEA SOBREGIRO (BANCO SANTANDER) | | | Chile | | CLP | | 6.00% | | 6.00% | | Upon expiration | | No | | 1 | | — | | — | | — | | — | | — | | — | | — | |
Foreign | Enel Distribución Sao Paulo | | Brazil | | Foreign | | FINEP - 2º PROTOCOLO | | | Brazil | | BRL | | 3.96% | | 3.95% | | Monthly | | Yes | | 584 | | 1,755 | | 2,478 | | 2,653 | | 927 | | — | | — | | 6,058 | |
Foreign | Enel Distribución Sao Paulo | | Brazil | | Foreign | | TOKIO | | | Brazil | | BRL | | 1.79% | | 1.78% | | Upon expiration | | No | | 32,668 | | — | | — | | — | | — | | — | | — | | — | |
Foreign | Enel Distribución Sao Paulo | | Brazil | | Foreign | | SCOTIABANK | | Brazil | | BRL | | 2.15% | | 2.14% | | Upon expiration | | No | | 51,421 | | — | | — | | — | | — | | — | | — | | — | |
Foreign | Enel Distribución Sao Paulo | | Brazil | | Foreign | | BNP | | Brazil | | US$ | | 3.61% | | 3.60% | | Upon expiration | | No | | 521 | | 86,730 | | — | | — | | — | | — | | — | | — | |
Foreign | Enel Generación Piura S.A | | Peru | | Foreign | | SCOTIABANK | | Peru | | US$ | | 2.62% | | 2.59% | | Upon expiration | | No | | — | | 25,043 | | — | | — | | — | | — | | — | | — | |
Foreign | Enel Perú S.A.C | | Peru | | Foreign | | BBVA | | Peru | | PEN | | 0.48% | | 0.48% | | Biannual | | No | | — | | 147,879 | | — | | — | | — | | — | | — | | — | |
Total | | | | 482,464 | | 680,015 | | 245,924 | | 76,202 | | 33,137 | | 19,690 | | 21,254 | | 396,207 | | |||||||||||||||||
| | | | | | | | | | | | | | | | | | |
|---|---|---|---|---|---|---|---|---|---|---|---|---|---|---|---|---|---|---|
| | | | | | | | | | | December 31, 2019 | |||||||
| | | | | | | | | | | Current | Non-Current | ||||||
Taxpayer | | | Taxpayer | | | | Effective | Nominal | | | Less than | More than | One to two | Two to | Three to | Four to | More than | Total Non- |
ID No. | Company | Country | ID No. | Financial Institution | Country | Currency | Rate | Rate | Type of Amortization | Secured | ThUS$ | ThUS$ | ThUS$ | ThUS$ | ThUS$ | ThUS$ | ThUS$ | ThUS$ |
Foreign | Enel Distribución Río S.A. | Brazil | Foreign | ITAU BBA INTERNATIONAL PLC | United Kingdom | US$ | 4.40% | 4.39% | At Maturity | Yes | 1,586 | — | 75,769 | — | — | — | — | 75,769 |
Foreign | Enel Distribución Río S.A. | Brazil | Foreign | CITIBANK TRADE 51301 (II) | U.S.A | US$ | 3.59% | 3.58% | At Maturity | Yes | 8 | — | 97,075 | — | — | — | — | 97,075 |
Foreign | Enel Distribución Río S.A. | Brazil | Foreign | BNP PARIBAS 4131 | U.S.A | US$ | 8.74% | 7.14% | At Maturity | Yes | 3,411 | — | — | 99,436 | — | — | — | 99,436 |
Foreign | Enel Distribución Río S.A. | Brazil | Foreign | BNDES CAPEX 2012 FINAME | Brazil | BRL | 3.01% | 3.00% | Monthly | Yes | 522 | 1,539 | 2,053 | 2,053 | 855 | — | — | 4,961 |
Foreign | Enel Distribución Río S.A. | Brazil | Foreign | BNDES CAPEX 2012-A | Brazil | BRL | 9.11% | 8.93% | Monthly | Yes | 1,524 | 1,514 | — | — | — | — | — | — |
Foreign | Enel Distribución Río S.A. | Brazil | Foreign | BNDES CAPEX 2012-B | Brazil | BRL | 10.13% | 9.93% | Monthly | Yes | 1,525 | 1,514 | — | — | — | — | — | — |
Foreign | Enel Distribución Río S.A. | Brazil | Foreign | BNDES CAPEX 2012-F | Brazil | BRL | 6.27% | 6.13% | Monthly | Yes | 33 | 98 | — | — | — | — | — | — |
Foreign | Enel Distribución Río S.A. | Brazil | Foreign | SCOTIABANK 4131 | Brazil | US$ | 3.21% | 3.20% | Quarterly | Yes | 620 | 53,436 | — | — | — | — | — | — |
F-112
| | | | | | | | | | | | | | | | | | |
|---|---|---|---|---|---|---|---|---|---|---|---|---|---|---|---|---|---|---|
| | | | | | | | | | | December 31, 2019 | |||||||
| | | | | | | | | | | Current | Non-Current | ||||||
Taxpayer | | | Taxpayer | | | | Effective | Nominal | | | Less than | More than | One to two | Two to | Three to | Four to | More than | Total Non- |
ID No. | Company | Country | ID No. | Financial Institution | Country | Currency | Rate | Rate | Type of Amortization | Secured | ThUS$ | ThUS$ | ThUS$ | ThUS$ | ThUS$ | ThUS$ | ThUS$ | ThUS$ |
Foreign | Codensa | Colombia | Foreign | Banco BBVA COLOMBIA S.A. | Colombia | COP | 5.18% | 5.09% | Bi-Annually | No | — | 5,108 | 5,074 | 2,537 | — | — | — | 7,611 |
Foreign | Codensa | Colombia | Foreign | Banco de Bogotá | Colombia | COP | 5.47% | 5.36% | Monthly | No | 20 | — | 692 | 1,038 | 1,038 | 1,038 | 1,384 | 5,190 |
Foreign | Codensa | Colombia | Foreign | Banco BBVA COLOMBIA S.A. | Colombia | COP | 5.13% | 5.03% | Quarterly | No | 75 | — | — | — | — | — | — | — |
Foreign | Codensa | Colombia | Foreign | Banco BBVA COLOMBIA S.A. | Colombia | COP | 5.18% | 5.08% | Quarterly | No | 64 | — | — | — | — | — | — | — |
Foreign | Codensa | Colombia | Foreign | Banco BBVA COLOMBIA S.A. | Colombia | COP | 5.21% | 5.11% | Quarterly | No | 35 | — | — | — | — | — | — | — |
Foreign | Codensa | Colombia | Foreign | Banco BBVA COLOMBIA S.A. | Colombia | COP | 5.13% | 5.03% | Quarterly | No | 126 | 123 | — | — | — | — | — | — |
Foreign | Codensa | Colombia | Foreign | Banco BBVA COLOMBIA S.A. | Colombia | COP | 5.18% | 5.08% | Quarterly | No | 81 | 80 | — | — | — | — | — | — |
Foreign | Codensa | Colombia | Foreign | Banco BBVA COLOMBIA S.A. | Colombia | COP | 5.21% | 5.11% | Quarterly | No | 77 | 77 | — | — | — | — | — | — |
Foreign | Codensa | Colombia | Foreign | Banco BBVA COLOMBIA S.A. | Colombia | COP | 5.86% | 5.74% | Quarterly | No | 189 | 562 | 167 | — | — | — | — | 167 |
Foreign | Codensa | Colombia | Foreign | Banco BBVA COLOMBIA S.A. | Colombia | COP | 5.78% | 5.66% | Quarterly | No | 97 | 272 | 158 | — | — | — | — | 158 |
Foreign | Codensa | Colombia | Foreign | Banco BBVA COLOMBIA S.A. | Colombia | COP | 5.83% | 5.71% | Quarterly | No | 144 | 417 | 242 | — | — | — | — | 242 |
Foreign | Codensa | Colombia | Foreign | Banco Agrario | Colombia | COP | 6.23% | 6.09% | Quarterly | No | 488 | 1,400 | 1,191 | — | — | — | — | 1,191 |
Foreign | Codensa | Colombia | Foreign | MUFG BANK LTD | Japan | COP | 9.11% | 8.82% | At Maturity | No | — | 24,793 | — | — | — | — | — | — |
Foreign | Enel Distribución Ceará S.A. | Brazil | Foreign | BNDES CAPEX 12 A | Brazil | BRL | 9.11% | 8.93% | Monthly | Yes | 843 | 837 | — | — | — | — | — | — |
Foreign | Enel Distribución Ceará S.A. | Brazil | Foreign | BNDES CAPEX 12 B | Brazil | BRL | 10.13% | 9.93% | Monthly | Yes | 843 | 837 | — | — | — | — | — | — |
Foreign | Enel Distribución Ceará S.A. | Brazil | Foreign | BNDES CAPEX 12 F | Brazil | BRL | 6.27% | 6.13% | Monthly | Yes | 16 | 47 | — | — | — | — | — | — |
Foreign | Enel Distribución Ceará S.A. | Brazil | Foreign | BNDES CAPEX 12 FINAME | Brazil | BRL | 3.01% | 3.00% | Monthly | Yes | 261 | 768 | 1,024 | 1,024 | 512 | — | — | 2,560 |
Foreign | Enel Distribución Ceará S.A. | Brazil | Foreign | BANCO DO BRASIL (BOND D) | Brazil | US$ | 3.73% | 3.72% | At Maturity | Yes | 7 | — | — | — | — | 1,145 | — | 1,145 |
Foreign | Enel Distribución Ceará S.A. | Brazil | Foreign | BANCO DO BRASIL (BOND P) | Brazil | US$ | 6.39% | 6.38% | At Maturity | Yes | 21 | — | — | — | — | 1,641 | — | 1,641 |
Foreign | Enel Distribución Ceará S.A. | Brazil | Foreign | BNB Nº 16.2018.204.23875 | Brazil | BRL | 6.59% | 6.58% | Monthly | Yes | 313 | 3,709 | 5,564 | 5,564 | 5,564 | 5,564 | 18,545 | 40,801 |
Foreign | Enel Distribución Ceará S.A. | Brazil | Foreign | BNB Nº 16.2018.204.23875 | Brazil | BRL | 6.59% | 6.58% | Monthly | Yes | 282 | 3,342 | 5,012 | 5,012 | 5,012 | 5,012 | 16,708 | 36,756 |
Foreign | Enel Distribución Ceará S.A. | Brazil | Foreign | BNP 4131 | Brazil | BRL | 4.42% | 4.41% | Monthly | Yes | 76 | 71,338 | — | — | — | — | — | — |
Foreign | Enel Distribución Perú S.A. | Perú | Foreign | Banco de Credito del Perú | Perú | PEN | 4.16% | 4.10% | At Maturity | No | — | — | 22,614 | — | — | — | — | 22,614 |
Foreign | Enel Distribución Goias S.A. | Brazil | Foreign | BNDES -FINAME CAPITAL DE GIRO | Brazil | BRL | 9.89% | 9.88% | Quarterly | Yes | 245 | 4,703 | 8,062 | 8,062 | 4,032 | — | — | 20,156 |
Foreign | Enel Distribución Goias S.A. | Brazil | Foreign | CITIBANK 4131 CELG I | U.S.A | US$ | 4.16% | 4.15% | At Maturity | Yes | 812 | — | 145,407 | — | — | — | — | 145,407 |
Foreign | Enel Distribución Goias S.A. | Brazil | Foreign | SCOTIABANK 4131 CELG | U.S.A | US$ | 3.06% | 1.95% | Quarterly | Yes | 391 | — | — | 48,576 | — | — | — | 48,576 |
Foreign | Enel Distribución Goias S.A. | Brazil | Foreign | SCOTIABANK 4131 CELG II | U.S.A | US$ | 3.37% | 3.36% | Quarterly | Yes | 123 | 48,028 | — | — | — | — | — | — |
Foreign | Enel Distribución Goias S.A. | Brazil | Foreign | BNP 4131 | France | US$ | 3.78% | 3.77% | At Maturity | Yes | 302 | 50,395 | — | — | — | — | — | — |
94.271.000-3 | Enel Américas S.A. | Chile | Foreign | BNP Paribas NY | U.S.A | US$ | 4.99% | 2.67% | At Maturity | No | — | 105,546 | — | — | — | — | — | — |
94.271.000-3 | Enel Américas S.A. | Chile | Foreign | Citibank N.A | U.S.A | US$ | 4.99% | 2.67% | At Maturity | No | — | 35,182 | — | — | — | — | — | — |
94.271.000-3 | Enel Américas S.A. | Chile | Foreign | Credit Agricole CIB | U.S.A | US$ | 4.99% | 2.67% | At Maturity | No | — | 35,182 | — | — | — | — | — | — |
94.271.000-3 | Enel Américas S.A. | Chile | Foreign | JPMorgan Chase Bank | U.S.A | US$ | 4.99% | 2.67% | At Maturity | No | — | 35,182 | — | — | — | — | — | — |
94.271.000-3 | Enel Américas S.A. | Chile | Foreign | Sumitomo Mitsui Banking | U.S.A | US$ | 4.99% | 2.67% | At Maturity | No | — | 70,364 | — | — | — | — | — | — |
94.271.000-3 | Enel Américas S.A. | Chile | Foreign | Societe Generale | U.S.A | US$ | 4.99% | 2.67% | At Maturity | No | — | 35,182 | — | — | — | — | — | — |
94.271.000-3 | Enel Américas S.A. | Chile | Foreign | BBVA New York Branch | U.S.A | US$ | 4.99% | 2.67% | At Maturity | No | — | 35,182 | — | — | — | — | — | — |
94.271.000-3 | Enel Américas S.A. | Chile | 97036000-k | Linea sobregiro (banco santander) | Chile | CLP | 6.00% | 6.00% | At Maturity | No | 1 | — | — | — | — | — | — | — |
Foreign | Enel Generación Fortaleza | Brazil | Foreign | Banco Citibank | U.S.A | US$ | 4.66% | 4.65% | At Maturity | No | 495 | 60,534 | — | — | — | — | — | — |
Foreign | Enel Distribución Sao Paulo | Brazil | Foreign | FINEP - 1º Protocolo | Brazil | BRL | 4.00% | 4.00% | Monthly | Yes | 253 | — | — | — | — | — | — | — |
Foreign | Enel Distribución Sao Paulo | Brazil | Foreign | FINEP - 2º Protocolo | Brazil | BRL | 5.24% | 5.00% | Monthly | Yes | 722 | 2,132 | 6,201 | 4,623 | — | — | — | 10,824 |
Foreign | Enel Distribución Sao Paulo | Brazil | Foreign | 6ª Nota Promissória | Brazil | BRL | 6.53% | 6.52% | Monthly | No | 876 | — | — | — | — | — | — | — |
Total | | 17,507 | 689,423 | 376,305 | 177,925 | 17,013 | 14,400 | 36,637 | 622,280 | |||||||||
The detail of Unsecured bonds by currency and maturity as of December 31, 2020 and 2019 is as follows:
| ● | Summary of Unsecured bonds by currency and maturity |
| | | | | | | | | | | | | | | | | | | | | | | | | |
| | | | | | | | Current | | Non-Current | | ||||||||||||||
| | | | | | | | Maturity | | | | Maturity | | | | ||||||||||
| | | | Nominal | | Secured / | | One to three | | Three to | | Total Current | | One to two | | Two to three | | Three to | | Four to | | More than | | Total Non- | |
Country |
| Currency |
| Rate |
| Unsecured |
| ThUS$ |
| ThUS$ |
| ThUS$ |
| ThUS$ |
| ThUS$ |
| ThUS$ |
| ThUS$ |
| ThUS$ |
| ThUS$ |
|
| | | | | | | | | | | | | | | | | | | | | | | | | |
Chile | | US$ | | 5.30% | | Unsecured | | — | | 4,405 | | 4,405 | | — | | — | | — | | — | | 588,112 | | 588,112 | |
Chile | | UF | | 5.75% | | Unsecured | | — | | 7,103 | | 7,103 | | 3,611 | | — | | — | | — | | — | | 3,611 | |
Peru | | US$ | | 6.34% | | Unsecured | | — | | 275 | | 275 | | — | | — | | — | | — | | 10,017 | | 10,017 | |
Peru | | PEN | | 6.24% | | Unsecured | | 3,531 | | 29,344 | | 32,875 | | 31,787 | | 44,225 | | 42,126 | | 38,697 | | 161,837 | | 318,672 | |
Brazil | | BRL | | 6.24% | | Unsecured | | 5,425 | | 33,691 | | 39,116 | | 67,383 | | 62,493 | | 361,796 | | 92,308 | | 175,405 | | 759,385 | |
Colombia | | COP | | 5.74% | | Unsecured | | 245,073 | | 80,240 | | 325,313 | | 254,173 | | 223,554 | | 202,170 | | 220,981 | | 284,119 | | 1,184,997 | |
| | | | | | | | | | | | | | | | | | | | | | | | | |
Total | 254,029 | | 155,058 | | 409,087 | | 356,954 | | 330,272 | | 606,092 | | 351,986 | | 1,219,490 | | 2,864,794 | | |||||||
| | | | | | | | | | | | | | | | | | | | | | | | | |
| | | | | | | | Current | | Non-Current | | ||||||||||||||
| | | | | | | | Maturity | | | | Maturity | | | | ||||||||||
| | | | Nominal | | Secured / | | One to three | | Three to | | Total Current | | One to two | | Two to three | | Three to | | Four to | | More than | | Total Non- | |
Country | | Currency | | Rate | | Unsecured | | ThUS$ | | ThUS$ | | ThUS$ | | ThUS$ | | ThUS$ | | ThUS$ | | ThUS$ | | ThUS$ | | ThUS$ | |
| | | | | | | | | | | | | | | | | | | | | | | | | |
Chile | | US$ | | 5.30% | | Unsecured | | — | | 4,471 | | 4,471 | | — | | — | | — | | — | | 586,224 | | 586,224 | |
Chile | | UF | | 5.75% | | Unsecured | | — | | 6,228 | | 6,228 | | 6,543 | | 3,223 | | — | | — | | — | | 9,766 | |
Peru | | US$ | | 6.06% | | Unsecured | | 418 | | 10,002 | | 10,420 | | — | | — | | — | | — | | 10,001 | | 10,001 | |
F-113
Peru | | PEN | | 6.26% | | Unsecured | | 3,992 | | 41,588 | | 45,580 | | 30,152 | | 34,675 | | 48,244 | | 45,954 | | 218,755 | | 377,780 | |
Brazil | | BRL | | 7.33% | | Unsecured | | 61,962 | | 2,064 | | 64,026 | | 43,503 | | 85,696 | | 240,094 | | 298,609 | | 316,363 | | 984,265 | |
Colombia | | COP | | 7.71% | | Unsecured | | 33,128 | | 100,781 | | 133,909 | | 307,641 | | 264,755 | | 232,874 | | 134,501 | | 450,078 | | 1,389,849 | |
| | | | | | | | | | | | | | | | | | | | | | | | | |
Total | 99,500 | | 165,134 | | 264,634 | | 387,839 | | 388,349 | | 521,212 | | 479,064 | | 1,581,421 | | 3,357,885 | | |||||||
| | | | | | | | | | | | | | | | | | | | | | | | | | | | | | | | | | | | |
| | | | | | | | | | | | | | | | | | |
| December 31, 2020 | ||||||||||||||||
| | | | | | | | | | | | | | | | | | | | Current | | Non0Current | ||||||||||||||
Taxpayer | | | | | | Taxpayer | | | | | | | | Effective | | Nominal | | | | Less than |
| More than |
| Total |
| One to two |
| Two to |
| Three to |
| Four to |
| More than |
| Total Non0 |
ID No. |
| Company |
| Country |
| ID No. |
| Name |
| Country |
| Currency |
| Rate |
| Rate |
| Maturity |
| ThUS$ |
| ThUS$ |
| ThUS$ |
| ThUS$ |
| ThUS$ |
| ThUS$ |
| ThUS$ |
| ThUS$ |
| ThUS$ |
Foreign | | Codensa | | Colombia | | Foreign | | Bonds B12013 | | Colombia | | COP | | 6.36% | | 6.22% | | Upon expiration | | 450 | | — | | 450 | | — | | — | | — | | 56,499 | | — | | 56,499 |
Foreign | | Codensa | | Colombia | | Foreign | | Bonds B7014 | | Colombia | | COP | | 5.07% | | 4.98% | | Upon expiration | | 51 | | 54,062 | | 54,113 | | — | | — | | — | | — | | — | | — |
Foreign | | Codensa | | Colombia | | Foreign | | Bonds E4016 | | Colombia | | COP | | 7.60% | | 7.39% | | Upon expiration | | 4,729 | | — | | 4,729 | | 78,901 | | — | | — | | — | | — | | 78,901 |
Foreign | | Codensa | | Colombia | | Foreign | | Bonds E5017 | | Colombia | | COP | | 6.46% | | 6.31% | | Upon expiration | | 241 | | — | | 241 | | — | | — | | 58,445 | | — | | — | | 58,445 |
Foreign | | Codensa | | Colombia | | Foreign | | Bonds E7017 | | Colombia | | COP | | 6.74% | | 6.58% | | Upon expiration | | 863 | | — | | 863 | | — | | — | | — | | 58,445 | | — | | 58,445 |
Foreign | | Codensa | | Colombia | | Foreign | | Bonds E7018 | | Colombia | | COP | | 5.14% | | 5.04% | | Upon expiration | | 529 | | — | | 529 | | — | | — | | — | | — | | 46,756 | | 46,756 |
Foreign | | Codensa | | Colombia | | Foreign | | Bonds B12018 | | Colombia | | COP | | 4.35% | | 4.28% | | Upon expiration | | 467 | | — | | 467 | | — | | 56,984 | | — | | — | | — | | 56,984 |
Foreign | | Codensa | | Colombia | | Foreign | | Bonds B5018 | | Colombia | | COP | | 6.29% | | 6.15% | | Upon expiration | | 343 | | — | | 343 | | — | | 81,823 | | — | | — | | — | | 81,823 |
Foreign | | Codensa | | Colombia | | Foreign | | Bonds E4019 | | Colombia | | COP | | 5.10% | | 5.01% | | Upon expiration | | 204 | | — | | 204 | | — | | — | | — | | — | | 58,445 | | 58,445 |
Foreign | | Codensa | | Colombia | | Foreign | | Bonds B10019 | | Colombia | | COP | | 4.69% | | 4.61% | | Upon expiration | | 341 | | — | | 341 | | — | | — | | 73,057 | | — | | — | | 73,057 |
Foreign | | Codensa | | Colombia | | Foreign | | DEBÊNTURES 5ª EMISSÃO 0 1 SÉRIE (CEAR15) | | Colombia | | COP | | 3.98% | | 3.92% | | Upon expiration | | 289 | | — | | 289 | | — | | — | | — | | — | | 73,057 | | 73,057 |
Foreign | | Enel Distribución Ceará S.A. | | Brazil | | Foreign | | DEBÊNTURES 5ª EMISSÃO 0 2 SÉRIE (CEAR25) | | Brazil | | BRL | | 3.60% | | 3.59% | | Annual | | 79 | | 33,691 | | 33,770 | | 33,691 | | — | | — | | — | | — | | 33,691 |
Foreign | | Enel Distribución Ceará S.A. | | Brazil | | Foreign | | DEBÊNTURES 6ª EMISSÃO 0 1 SÉRIE (CEAR16) | | Brazil | | BRL | | 10.41% | | 10.40% | | Annual | | 83 | | — | | 83 | | — | | 17,550 | | 14,439 | | — | | — | | 31,989 |
Foreign | | Enel Distribución Ceará S.A. | | Brazil | | Foreign | | DEBÊNTURES 6ª EMISSÃO 0 2 SÉRIE (CEAR26) | | Brazil | | BRL | | 3.76% | | 3.75% | | Upon expiration | | 10 | | — | | 10 | | — | | 7,701 | | — | | — | | — | | 7,701 |
Foreign | | Enel Distribución Ceará S.A. | | Brazil | | Foreign | | DEBÊNTURES 7ª EMISSÃO 0 1 SÉRIE (COCE17) | | Brazil | | BRL | | 10.61% | | 10.60% | | Annual | | 151 | | — | | 151 | | — | | — | | 31,524 | | 25,017 | | — | | 56,541 |
Foreign | | Enel Distribución Ceará S.A. | | Brazil | | Foreign | | DEBÊNTURES 7ª EMISSÃO 0 1 SÉRIE (COCE27) | | Brazil | | BRL | | 3.29% | | 3.28% | | Annual | | 473 | | — | | 473 | | 33,691 | | 33,050 | | — | | — | | — | | 66,741 |
Foreign | | Enel Distribución Ceará S.A. | | Brazil | | Foreign | | BANCO CONTINENTAL Terc Prog 8va Emision Serie A | | Brazil | | BRL | | 9.27% | | 9.26% | | Upon expiration | | 2,202 | | — | | 2,202 | | — | | 4,193 | | 57,703 | | — | | — | | 61,896 |
Foreign | | Enel Generación Perú S.A. | | Peru | | Foreign | | BANCO CONTINENTAL Terc Prog 1ra Emision Serie A | | Peru | | US$ | | 6.44% | | 6.34% | | Upon expiration | | — | | 275 | | 275 | | — | | — | | — | | — | | 10,017 | | 10,017 |
Foreign | | Enel Generación Perú S.A. | | Peru | | Foreign | | BANCO SCOTIABANK Cuarto Prog 5ta Emision Serie A | | Peru | | PEN | | 6.41% | | 6.31% | | Upon expiration | | 12 | | — | | 12 | | 6,910 | | — | | — | | — | | — | | 6,910 |
Foreign | | Enel Distribución Perú S.A. | | Peru | | Foreign | | Bonds 4ta Programa 0 5ta misión Serie A | | Peru | | PEN | | 6.48% | | 6.38% | | Upon expiration | | — | | 150 | | 150 | | 11,056 | | — | | — | | — | | — | | 11,056 |
Foreign | | Enel Distribución Perú S.A. | | Peru | | Foreign | | Bonds 4ta Programa 0 9na emisión Serie A | | Peru | | PEN | | 6.25% | | 6.15% | | Upon expiration | | — | | 119 | | 119 | | — | | — | | — | | — | | 13,820 | | 13,820 |
Foreign | | Enel Distribución Perú S.A. | | Peru | | Foreign | | Bonds 4ta Programa 0 11ra emisión Serie A | | Peru | | PEN | | 5.72% | | 5.64% | | Upon expiration | | 273 | | — | | 273 | | 13,820 | | — | | — | | — | | — | | 13,820 |
Foreign | | Enel Distribución Perú S.A. | | Peru | | Foreign | | Bonds 4ta Programa 0 13ra emisión Serie A | | Peru | | PEN | | 5.13% | | 5.06% | | Upon expiration | | — | | 83 | | 83 | | — | | — | | — | | 11,056 | | — | | 11,056 |
Foreign | | Enel Distribución Perú S.A. | | Peru | | Foreign | | Bonds 4ta Programa 0 15va emision Serie A | | Peru | | PEN | | 5.26% | | 5.19% | | Upon expiration | | 307 | | — | | 307 | | — | | — | | — | | — | | 13,820 | | 13,820 |
Foreign | | Enel Distribución Perú S.A. | | Peru | | Foreign | | Bonds 4ta Programa 0 12va emision Serie A | | Peru | | PEN | | 7.55% | | 7.41% | | Upon expiration | | 254 | | — | | 254 | | — | | — | | — | | — | | 9,813 | | 9,813 |
Foreign | | Enel Distribución Perú S.A. | | Peru | | Foreign | | Bonds 5to Programa 0 1ra emision Serie A | | Peru | | PEN | | 7.65% | | 7.51% | | Upon expiration | | — | | 139 | | 139 | | — | | — | | — | | — | | 16,585 | | 16,585 |
Foreign | | Enel Distribución Perú S.A. | | Peru | | Foreign | | Bonds 5to Programa 0 5ta emision Serie A | | Peru | | PEN | | 7.02% | | 6.90% | | Upon expiration | | — | | 28,057 | | 28,057 | | — | | — | | — | | — | | — | | — |
Foreign | | Enel Distribución Perú S.A. | | Peru | | Foreign | | Bonds 5to Programa 0 1ra emision Serie B | | Peru | | PEN | | 6.55% | | 6.44% | | Upon expiration | | — | | 56 | | 56 | | — | | 16,585 | | — | | — | | — | | 16,585 |
Foreign | | Enel Distribución Perú S.A. | | Peru | | Foreign | | Bonds 5to Programa 0 8va emision Serie A | | Peru | | PEN | | 6.55% | | 6.44% | | Upon expiration | | 401 | | — | | 401 | | — | | — | | 22,113 | | — | | — | | 22,113 |
Foreign | | Enel Distribución Perú S.A. | | Peru | | Foreign | | Bonds 5to Programa 0 9na emision Serie A | | Peru | | PEN | | 8.46% | | 8.29% | | Upon expiration | | 454 | | — | | 454 | | — | | — | | — | | — | | 19,349 | | 19,349 |
Foreign | | Enel Distribución Perú S.A. | | Peru | | Foreign | | Bonds 5to Programa 0 10ma emision Serie A | | Peru | | PEN | | 6.28% | | 6.19% | | Upon expiration | | 819 | | — | | 819 | | — | | 27,641 | | — | | — | | — | | 27,641 |
Foreign | | Enel Distribución Perú S.A. | | Peru | | Foreign | | Bonds 5to Programa 0 2da emision Serie A | | Peru | | PEN | | 6.18% | | 6.09% | | Upon expiration | | — | | 264 | | 264 | | — | | — | | 20,013 | | — | | — | | 20,013 |
Foreign | | Enel Distribución Perú S.A. | | Peru | | Foreign | | Bonds 5to Programa 0 19na emision Serie A | | Peru | | PEN | | 5.88% | | 5.80% | | Upon expiration | | — | | 211 | | 211 | | — | | — | | — | | 27,641 | | — | | 27,641 |
Foreign | | Enel Distribución Perú S.A. | | Peru | | Foreign | | Bonds 5to Programa 0 20da emision Serie A | | Peru | | PEN | | 5.52% | | 5.45% | | Upon expiration | | 413 | | — | | 413 | | — | | — | | — | | — | | 27,641 | | 27,641 |
Foreign | | Enel Distribución Perú S.A. | | Peru | | Foreign | | Bonds 5to Programa 0 21ma emision Serie A | | Peru | | PEN | | 6.08% | | 5.99% | | Upon expiration | | — | | 265 | | 265 | | — | | — | | — | | — | | 35,933 | | 35,933 |
Foreign | | Enel Distribución Perú S.A. | | Peru | | Foreign | | Bonds 6to Programa 0 1 emision Serie A | | Peru | | PEN | | 5.19% | | 5.13% | | Upon expiration | | 598 | | — | | 598 | | — | | — | | — | | — | | 24,877 | | 24,877 |
Foreign | | Emgesa S.A. E.S.P. | | Colombia | | Foreign | | Bonds 6to Programa 0 2 emision Serie A | | Colombia | | COP | | 7.67% | | 7.46% | | Upon expiration | | 168 | | — | | 168 | | — | | — | | 16,219 | | — | | — | | 16,219 |
Foreign | | Emgesa S.A. E.S.P. | | Colombia | | Foreign | | Bonds 6to Programa 0 3 emision Serie A | | Colombia | | COP | | 6.10% | | 0.00% | | Upon expiration | | 487 | | 26,178 | | 26,665 | | — | | — | | — | | — | | — | | — |
Foreign | | Emgesa S.A. E.S.P. | | Colombia | | Foreign | | Bonds 6to Programa 0 4 emision Serie A | | Colombia | | COP | | 9.11% | | 8.75% | | Upon expiration | | 28,540 | | — | | 28,540 | | — | | — | | — | | — | | — | | — |
Foreign | | Emgesa S.A. E.S.P. | | Colombia | | Foreign | | Bonds B15009 | | Colombia | | COP | | 9.11% | | 8.75% | | Upon expiration | | 205,098 | | — | | 205,098 | | — | | — | | — | | — | | — | | — |
Foreign | | Emgesa S.A. E.S.P. | | Colombia | | Foreign | | Bonds B12009 | | Colombia | | COP | | 5.06% | | 4.97% | | Upon expiration | | 226 | | — | | 226 | | 87,644 | | — | | — | | — | | — | | 87,644 |
Foreign | | Emgesa S.A. E.S.P. | | Colombia | | Foreign | | Bonds exterior | | Colombia | | COP | | 5.18% | | 5.09% | | Upon expiration | | 154 | | — | | 154 | | — | | — | | — | | — | | 58,408 | | 58,408 |
Foreign | | Emgesa S.A. E.S.P. | | Colombia | | Foreign | | Bonds quimbo | | Colombia | | COP | | 6.56% | | 6.41% | | Upon expiration | | 389 | | — | | 389 | | — | | — | | — | | 106,036 | | — | | 106,036 |
Foreign | | Emgesa S.A. E.S.P. | | Colombia | | Foreign | | Bonds Quimbo B10 | | Colombia | | COP | | 5.70% | | 5.58% | | Upon expiration | | 333 | | — | | 333 | | — | | — | | — | | — | | 47,453 | | 47,453 |
Foreign | | Emgesa S.A. E.S.P. | | Colombia | | Foreign | | Bonds Quimbo B15 | | Colombia | | COP | | 5.38% | | 5.27% | | Upon expiration | | 361 | | — | | 361 | | — | | — | | 54,450 | | — | | — | | 54,450 |
Foreign | | Emgesa S.A. E.S.P. | | Colombia | | Foreign | | Bonds Quimbo B12013 | | Colombia | | COP | | 6.25% | | 6.11% | | Upon expiration | | 721 | | — | | 721 | | — | | 84,745 | | — | | — | | — | | 84,745 |
Foreign | | Emgesa S.A. E.S.P. | | Colombia | | Foreign | | Bonds Quimbo B16014 | | Colombia | | COP | | 7.59% | | 7.38% | | Upon expiration | | 88 | | — | | 88 | | 87,630 | | — | | — | | — | | — | | 87,630 |
942,710,003 | | Enel Américas S.A. | | Chile | | Foreign | | Bonds Quimbo B10014 | | U.S.A | | US$ | | 7.76% | | 6.60% | | Upon expiration | | — | | 5 | | 5 | | — | | — | | — | | — | | 858 | | 858 |
942,710,003 | | Enel Américas S.A. | | Chile | | Foreign | | Bonds Quimbo B6014 | | Chile | | UF | | 7.02% | | 5.75% | | Biannual | | — | | 7,103 | | 7,103 | | 3,611 | | — | | — | | — | | — | | 3,611 |
942,710,003 | | Enel Américas S.A. | | Chile | | Foreign | | Bonds B6014 | | U.S.A | | US$ | | 4.21% | | 4.00% | | Upon expiration | | — | | 4,400 | | 4,400 | | — | | — | | — | | — | | 587,253 | | 587,253 |
Foreign | | Enel Distribución Río S.A. | | Brazil | | Foreign | | Bonds B7016 | | Brazil | | BRL | | 3.01% | | 2.99% | | Biannual | | 1,153 | | — | | 1,153 | | — | | — | | 192,318 | | — | | — | | 192,318 |
Foreign | | Enel Distribución Sao Paulo | | Brazil | | Foreign | | Bonds E6016 | | Brazil | | BRL | | 3.61% | | 3.60% | | Annual | | 459 | | — | | 459 | | — | | — | | 65,811 | | 67,292 | | — | | 133,103 |
Foreign | | Enel Distribución Sao Paulo | | Brazil | | Foreign | | Yankee Bonds due 2026 | | Brazil | | BRL | | 8.73% | | 8.72% | | Upon expiration | | 816 | | — | | 816 | | — | | — | | — | | — | | 175,405 | | 175,405 |
| | 254,029 | | 155,058 | | 409,087 | | 356,954 | | 330,272 | | 606,092 | | 351,986 | | 1,219,490 | | 2,864,794 | ||||||||||||||||||
F-114
| | | | | | | | | | | | | | | | | | | | | | | | | | | | | | | | | | | | |
| | | | | | | | | | | | | | | | | | | | December 31, 2019 | ||||||||||||||||
| | | | | | | | | | | | | | | | | | | | Current | | Non Current | ||||||||||||||
Taxpayer | | | | | | Taxpayer | | | | | | | | Effective | | Nominal | | | | Less than | | More than | | Total | | One to two | | Two to | | Three to | | Four to | | More than | | Total Non0 |
ID No. |
| Company |
| Country |
| ID No. |
| Name |
| Country |
| Currency |
| Rate |
| Rate |
| Maturity |
| ThUS$ |
| ThUS$ |
| ThUS$ |
| ThUS$ |
| ThUS$ |
| ThUS$ |
| ThUS$ |
| ThUS$ |
| ThUS$ |
Foreign | | Codensa | | Colombia | | Foreign | | Bonds B12013 | | Colombia | | COP | | 8.83% | | 8.55% | | Upon expiration | | 648 | | — | | 648 | | — | | — | | — | | — | | 58,860 | | 58,860 |
Foreign | | Codensa | | Colombia | | Foreign | | Bonds B7014 | | Colombia | | COP | | 7.50% | | 7.30% | | Upon expiration | | 79 | | — | | 79 | | 56,321 | | — | | — | | — | | — | | 56,321 |
Foreign | | Codensa | | Colombia | | Foreign | | Bonds E4016 | | Colombia | | COP | | 7.70% | | 7.49% | | Upon expiration | | 96 | | 27,398 | | 27,494 | | — | | — | | — | | — | | — | | — |
Foreign | | Codensa | | Colombia | | Foreign | | Bonds E5017 | | Colombia | | COP | | 7.39% | | 7.39% | | Upon expiration | | 4,959 | | — | | 4,959 | | — | | 82,198 | | — | | — | | — | | 82,198 |
Foreign | | Codensa | | Colombia | | Foreign | | Bonds E7017 | | Colombia | | COP | | 6.46% | | 6.31% | | Upon expiration | | 253 | | — | | 253 | | — | | — | | — | | 60,887 | | — | | 60,887 |
Foreign | | Codensa | | Colombia | | Foreign | | Bonds E7018 | | Colombia | | COP | | 6.74% | | 6.58% | | Upon expiration | | 900 | | — | | 900 | | — | | — | | — | | — | | 60,887 | | 60,887 |
Foreign | | Codensa | | Colombia | | Foreign | | Bonds B12018 | | Colombia | | COP | | 7.57% | | 7.36% | | Upon expiration | | 805 | | — | | 805 | | — | | — | | — | | — | | 48,710 | | 48,710 |
Foreign | | Codensa | | Colombia | | Foreign | | Bonds B5018 | | Colombia | | COP | | 6.77% | | 6.60% | | Upon expiration | | 751 | | — | | 751 | | — | | — | | 59,365 | | — | | — | | 59,365 |
Foreign | | Codensa | | Colombia | | Foreign | | Bonds E4019 | | Colombia | | COP | | 6.30% | | 6.16% | | Upon expiration | | 360 | | — | | 360 | | — | | — | | 85,242 | | — | | — | | 85,242 |
Foreign | | Codensa | | Colombia | | Foreign | | Bonds B10019 | | Colombia | | COP | | 7.53% | | 7.33% | | Upon expiration | | 306 | | — | | 306 | | — | | — | | — | | — | | 60,887 | | 60,887 |
Foreign | | Enel Distribución Ceará S.A. | | Brazil | | Foreign | | DEBÊNTURES 5ª EMISSÃO 0 1 SÉRIE (CEAR15) | | Brazil | | BRL | | 7.26% | | 7.25% | | Annual | | 177 | | — | | 177 | | 43,503 | | 42,915 | | — | | — | | — | | 86,418 |
Foreign | | Enel Distribución Ceará S.A. | | Brazil | | Foreign | | DEBÊNTURES 5ª EMISSÃO 0 2 SÉRIE (CEAR25) | | Brazil | | BRL | | 10.99% | | 10.50% | | Annual | | 98 | | — | | 98 | | — | | — | | 21,525 | | 18,447 | | — | | 39,972 |
Foreign | | Enel Distribución Ceará S.A. | | Brazil | | Foreign | | DEBÊNTURES 6ª EMISSÃO 0 1 SÉRIE (CEAR16) | | Brazil | | BRL | | 6.95% | | 6.95% | | Upon expiration | | 21 | | — | | 21 | | — | | — | | 9,944 | | — | | — | | 9,944 |
Foreign | | Enel Distribución Ceará S.A. | | Brazil | | Foreign | | DEBÊNTURES 6ª EMISSÃO 0 2 SÉRIE (CEAR26) | | Brazil | | BRL | | 10.02% | | 9.10% | | Annual | | 179 | | — | | 179 | | — | | — | | — | | 36,218 | | 33,388 | | 69,606 |
Foreign | | Enel Distribución Ceará S.A. | | Brazil | | Foreign | | DEBÊNTURES 7ª EMISSÃO 0 1 SÉRIE (COCE17) | | Brazil | | BRL | | 6.48% | | 6.47% | | Annual | | 1,400 | | — | | 1,400 | | — | | 42,781 | | 43,142 | | — | | — | | 85,923 |
Foreign | | Enel Distribución Ceará S.A. | | Brazil | | Foreign | | DEBÊNTURES 7ª EMISSÃO 0 1 SÉRIE (COCE27) | | Brazil | | BRL | | 8.22% | | 7.36% | | Upon expiration | | 2,752 | | — | | 2,752 | | — | | — | | — | | 76,539 | | — | | 76,539 |
Foreign | | Enel Generación Perú S.A. | | Perú | | Foreign | | BANCO CONTINENTAL Terc Prog 8va Emision Serie A | | Perú | | US$ | | 6.44% | | 6.34% | | Upon expiration | | 273 | | — | | 273 | | — | | — | | — | | — | | 10,001 | | 10,001 |
Foreign | | Enel Generación Perú S.A. | | Perú | | Foreign | | BANCO CONTINENTAL Terc Prog 1ra Emision Serie A | | Perú | | PEN | | 6.41% | | 6.31% | | Upon expiration | | — | | 12 | | 12 | | — | | 7,538 | | — | | — | | — | | 7,538 |
Foreign | | Enel Generación Perú S.A. | | Perú | | Foreign | | BANCO SCOTIABANK Cuarto Prog 5ta Emision Serie A | | Perú | | US$ | | 5.86% | | 5.78% | | Upon expiration | | 145 | | 10,002 | | 10,147 | | — | | — | | — | | — | | — | | — |
Foreign | | Enel Distribución Perú S.A. | | Perú | | Foreign | | Bonds 4ta Programa 0 5ta misión Serie A | | Perú | | PEN | | 7.58% | | 7.44% | | Upon expiration | | 269 | | 9,046 | | 9,315 | | — | | — | | — | | — | | — | | — |
Foreign | | Enel Distribución Perú S.A. | | Perú | | Foreign | | Bonds 4ta Programa 0 9na emisión Serie A | | Perú | | PEN | | 6.38% | | 6.28% | | Upon expiration | | — | | 162 | | 162 | | — | | 12,061 | | — | | — | | — | | 12,061 |
Foreign | | Enel Distribución Perú S.A. | | Perú | | Foreign | | Bonds 4ta Programa 0 11ra emisión Serie A | | Perú | | PEN | | 6.15% | | 6.06% | | Upon expiration | | — | | 127 | | 127 | | — | | — | | — | | — | | 15,076 | | 15,076 |
Foreign | | Enel Distribución Perú S.A. | | Perú | | Foreign | | Bonds 4ta Programa 0 13ra emisión Serie A | | Perú | | PEN | | 5.64% | | 5.56% | | Upon expiration | | 295 | | — | | 295 | | — | | 15,076 | | — | | — | | — | | 15,076 |
Foreign | | Enel Distribución Perú S.A. | | Perú | | Foreign | | Bonds 4ta Programa 0 15va emision Serie A | | Perú | | PEN | | 5.06% | | 5.00% | | Upon expiration | | — | | 89 | | 89 | | — | | — | | — | | — | | 12,061 | | 12,061 |
Foreign | | Enel Distribución Perú S.A. | | Perú | | Foreign | | Bonds 4ta Programa 0 12va emision Serie A | | Perú | | PEN | | 5.19% | | 5.13% | | Upon expiration | | 333 | | — | | 333 | | — | | — | | — | | — | | 15,076 | | 15,076 |
Foreign | | Enel Distribución Perú S.A. | | Perú | | Foreign | | Bonds 5to Programa 0 1ra emision Serie A | | Perú | | PEN | | 6.86% | | 6.75% | | Upon expiration | | 359 | | 15,075 | | 15,434 | | — | | — | | — | | — | | — | | — |
Foreign | | Enel Distribución Perú S.A. | | Perú | | Foreign | | Bonds 5to Programa 0 5ta emision Serie A | | Perú | | PEN | | 7.41% | | 7.28% | | Upon expiration | | 275 | | — | | 275 | | — | | — | | — | | — | | 10,704 | | 10,704 |
Foreign | | Enel Distribución Perú S.A. | | Perú | | Foreign | | Bonds 5to Programa 0 1ra emision Serie B | | Perú | | PEN | | 6.61% | | 6.50% | | Upon expiration | | — | | 15,185 | | 15,185 | | — | | — | | — | | — | | — | | — |
Foreign | | Enel Distribución Perú S.A. | | Perú | | Foreign | | Bonds 5to Programa 0 8va emision Serie A | | Perú | | PEN | | 7.51% | | 7.38% | | Upon expiration | | — | | 148 | | 148 | | — | | — | | — | | — | | 18,091 | | 18,091 |
Foreign | | Enel Distribución Perú S.A. | | Perú | | Foreign | | Bonds 5to Programa 0 9na emision Serie A | | Perú | | PEN | | 6.90% | | 6.78% | | Upon expiration | | — | | 449 | | 449 | | 30,152 | | — | | — | | — | | — | | 30,152 |
Foreign | | Enel Distribución Perú S.A. | | Perú | | Foreign | | Bonds 5to Programa 0 10ma emision Serie A | | Perú | | PEN | | 6.44% | | 6.34% | | Upon expiration | | — | | 57 | | 57 | | — | | — | | 18,091 | | — | | — | | 18,091 |
Foreign | | Enel Distribución Perú S.A. | | Perú | | Foreign | | Bonds 5to Programa 0 2da emision Serie A | | Perú | | PEN | | 6.44% | | 6.34% | | Upon expiration | | 434 | | — | | 434 | | — | | — | | — | | 24,122 | | — | | 24,122 |
Foreign | | Enel Distribución Perú S.A. | | Perú | | Foreign | | Bonds 5to Programa 0 19na emision Serie A | | Perú | | PEN | | 8.29% | | 8.12% | | Upon expiration | | 491 | | — | | 491 | | — | | — | | — | | — | | 21,108 | | 21,108 |
Foreign | | Enel Distribución Perú S.A. | | Perú | | Foreign | | Bonds 5to Programa 0 20da emision Serie A | | Perú | | PEN | | 6.19% | | 6.09% | | Upon expiration | | 888 | | — | | 888 | | — | | — | | 30,153 | | — | | — | | 30,153 |
Foreign | | Enel Distribución Perú S.A. | | Perú | | Foreign | | Bonds 5to Programa 0 21ma emision Serie A | | Perú | | PEN | | 6.09% | | 6.00% | | Upon expiration | | — | | 284 | | 284 | | — | | — | | — | | 21,832 | | — | | 21,832 |
Foreign | | Enel Distribución Perú S.A. | | Perú | | Foreign | | Bonds 6to Programa 0 1 emision Serie A | | Perú | | PEN | | 5.80% | | 5.72% | | Upon expiration | | — | | 225 | | 225 | | — | | — | | — | | — | | 30,152 | | 30,152 |
Foreign | | Enel Distribución Perú S.A. | | Perú | | Foreign | | Bonds 6to Programa 0 2 emision Serie A | | Perú | | PEN | | 5.45% | | 5.38% | | Upon expiration | | — | | 446 | | 446 | | — | | — | | — | | — | | 30,152 | | 30,152 |
Foreign | | Enel Distribución Perú S.A. | | Perú | | Foreign | | Bonds 6to Programa 0 3 emision Serie A | | Perú | | PEN | | 5.99% | | 5.91% | | Upon expiration | | — | | 283 | | 283 | | — | | — | | — | | — | | 39,198 | | 39,198 |
Foreign | | Enel Distribución Perú S.A. | | Perú | | Foreign | | Bonds 6to Programa 0 4 emision Serie A | | Perú | | PEN | | 5.13% | | 5.06% | | Upon expiration | | 648 | | — | | 648 | | — | | — | | — | | — | | 27,137 | | 27,137 |
Foreign | | Emgesa S.A. E.S.P. | | Colombia | | Foreign | | Bonds B15009 | | Colombia | | COP | | 10.16% | | 9.80% | | Upon expiration | | 231 | | — | | 231 | | — | | — | | — | | 16,897 | | — | | 16,897 |
Foreign | | Emgesa S.A. E.S.P. | | Colombia | | Foreign | | Bonds B12009 | | Colombia | | COP | | 10.17% | | 9.81% | | Upon expiration | | 667 | | — | | 667 | | 27,271 | | — | | — | | — | | — | | 27,271 |
Foreign | | Emgesa S.A. E.S.P. | | Colombia | | Foreign | | Bonds exterior | | Colombia | | COP | | 9.11% | | 8.75% | | Upon expiration | | 2,333 | | — | | 2,333 | | 27,152 | | — | | — | | — | | — | | 27,152 |
Foreign | | Emgesa S.A. E.S.P. | | Colombia | | Foreign | | Bonds quimbo | | Colombia | | COP | | 9.11% | | 8.75% | | Upon expiration | | 16,766 | | — | | 16,766 | | 196,897 | | — | | — | | — | | — | | 196,897 |
Foreign | | Emgesa S.A. E.S.P. | | Colombia | | Foreign | | Bonds Quimbo B10 | | Colombia | | COP | | 7.50% | | 7.29% | | Upon expiration | | 347 | | — | | 347 | | — | | 91,293 | | — | | — | | — | | 91,293 |
Foreign | | Emgesa S.A. E.S.P. | | Colombia | | Foreign | | Bonds Quimbo B15 | | Colombia | | COP | | 7.62% | | 7.41% | | Upon expiration | | 235 | | — | | 235 | | — | | — | | — | | — | | 60,844 | | 60,844 |
Foreign | | Emgesa S.A. E.S.P. | | Colombia | | Foreign | | Bonds Quimbo B12013 | | Colombia | | COP | | 8.94% | | 8.65% | | Upon expiration | | 556 | | — | | 556 | | — | | — | | — | | — | | 110,458 | | 110,458 |
Foreign | | Emgesa S.A. E.S.P. | | Colombia | | Foreign | | Bonds Quimbo B16014 | | Colombia | | COP | | 8.15% | | 7.91% | | Upon expiration | | 493 | | — | | 493 | | — | | — | | — | | — | | 49,432 | | 49,432 |
Foreign | | Emgesa S.A. E.S.P. | | Colombia | | Foreign | | Bonds Quimbo B10014 | | Colombia | | COP | | 7.82% | | 7.60% | | Upon expiration | | 543 | | — | | 543 | | — | | — | | — | | 56,717 | | — | | 56,717 |
Foreign | | Emgesa S.A. E.S.P. | | Colombia | | Foreign | | Bonds Quimbo B6014 | | Colombia | | COP | | 7.39% | | 7.20% | | Upon expiration | | 362 | | 39,897 | | 40,259 | | — | | — | | — | | — | | — | | — |
Foreign | | Emgesa S.A. E.S.P. | | Colombia | | Foreign | | Bonds B6014 | | Colombia | | COP | | 7.39% | | 7.20% | | Upon expiration | | 304 | | 33,486 | | 33,790 | | — | | — | | — | | — | | — | | — |
Foreign | | Emgesa S.A. E.S.P. | | Colombia | | Foreign | | Bonds B7016 | | Colombia | | COP | | 8.71% | | 8.44% | | Upon expiration | | 1,042 | | — | | 1,042 | | — | | — | | 88,267 | | — | | — | | 88,267 |
Foreign | | Emgesa S.A. E.S.P. | | Colombia | | Foreign | | Bonds E6016 | | Colombia | | COP | | 7.59% | | 7.38% | | Upon expiration | | 92 | | — | | 92 | | — | | 91,264 | | — | | — | | — | | 91,264 |
942,710,003 | | Enel Américas S.A. | | Chile | | Foreign | | Yankee Bonds due 2026 | | United States | | US$ | | 7.76% | | 6.60% | | Upon expiration | | — | | 5 | | 5 | | — | | — | | — | | — | | 858 | | 858 |
942,710,003 | | Enel Américas S.A. | | Chile | | Foreign | | Bonds UF 269 | | Chile | | UF | | 7.02% | | 5.75% | | Biannual | | — | | 6,228 | | 6,228 | | 6,543 | | 3,223 | | — | | — | | — | | 9,766 |
942,710,003 | | Enel Américas S.A. | | Chile | | Foreign | | Yankee Bonds due 2026 | | United States | | US$ | | 4.21% | | 4.00% | | Upon expiration | | — | | 4,466 | | 4,466 | | — | | — | | — | | — | | 585,366 | | 585,366 |
Foreign | | Enel Distribución Río S.A. | | Brazil | | Foreign | | DEBENTURES 10 EMISSION (AMPL10) | | Brazil | | BRL | | 6.42% | | 6.42% | | Biannual | | 3,923 | | — | | 3,923 | | — | | — | | 165,483 | | 82,762 | | — | | 248,245 |
Foreign | | Enel Distribución Sao Paulo | | Brazil | | Foreign | | DEBÊNTURES 0 24ª EMISSÃO 1ª SÉRIE | | Brazil | | BRL | | 6.80% | | 6.79% | | Annual | | — | | 1,120 | | 1,120 | | — | | — | | — | | 84,643 | | 86,760 | | 171,403 |
Foreign | | Enel Distribución Sao Paulo | | Brazil | | Foreign | | DEBÊNTURES 0 24ª EMISSÃO 2ª SÉRIE | | Brazil | | BRL | | 6.82% | | 6.27% | | Upon expiration | | — | | 944 | | 944 | | — | | — | | — | | — | | 196,215 | | 196,215 |
Foreign | | Enel Distribución Sao Paulo | | Brazil | | Foreign | | 6ª Nota Promissória | | Brazil | | BRL | | 6.17% | | 6.17% | | Monthly | | 53,412 | | — | | 53,412 | | — | | — | | — | | — | | — | | — |
Total | | 99,500 | | 165,134 | | 264,634 | | 387,839 | | 388,349 | | 521,212 | | 479,064 | | 1,581,421 | | 3,357,885 | ||||||||||||||||||
F-115
The detail of Secured bonds by currency and maturity as for the years ended December 31, 2020 and 2019, is as follows.
| ● | Summary of secured bonds by currency and maturity |
| | | | | | | | | | | | |
| | | | Current | Non-Current | |||||||
| | Nominal | Secured / | Maturity | Total current | Maturity | Total Non- | |||||
Country | Currency | Interest Rate | Unsecured | One to three | Three to twelve months | 12-31-2020 | One to two years | Two to three years | Three to four years | Four to five years | More than five years | 12-31-2020 |
| | | | ThUS$ | ThUS$ | ThUS$ | ThUS$ | ThUS$ | ThUS$ | ThUS$ | ThUS$ | ThUS$ |
Brazil | BRL | 7.31% | Unsecured | 3,478 | 151,477 | 154,955 | 149,733 | 150,272 | 16,027 | 16,027 | 63,230 | 395,289 |
Total | | | | 3,478 | 151,477 | 154,955 | 149,733 | 150,272 | 16,027 | 16,027 | 63,230 | 395,289 |
| | | | | | | | | | | | |
| | | | | | | | | | | | |
| | | | Current | Non-Current | |||||||
| | Nominal | Secured / | Maturity | Total current | Maturity | Total Non- | |||||
Country | Currency | Interest Rate | Unsecured | One to three | Three to twelve months | 12-31-2019 | One to two years | Two to three years | Three to four years | Four to five years | More than five years | 12-31-2019 |
| | | | ThUS$ | ThUS$ | ThUS$ | ThUS$ | ThUS$ | ThUS$ | ThUS$ | ThUS$ | ThUS$ |
Brazil | BRL | 7.31% | Secured | 11,275 | 384,712 | 395,987 | 194,043 | 192,045 | 192,727 | 19,628 | 98,086 | 696,529 |
Total | | | | 11,275 | 384,712 | 395,987 | 194,043 | 192,045 | 192,727 | 19,628 | 98,086 | 696,529 |
| - | Secured liabilities by company |
| | | | | | | | | | | | | | | | | | |
| | | | | | | | | | December 31, 2020 | ||||||||
| | | | | | | | | | Current | Non-Current | |||||||
Taxpayer | Company | Country | Taxpayer | Name | Country | Currency | Effective | Nominal | Maturity | Less than | More than | Total current | One to two | Two to | Three to | Four to | More than | Total Non- |
| | | | | | | | | | ThUS$ | ThUS$ | ThUS$ | ThUS$ | ThUS$ | ThUS$ | ThUS$ | ThUS$ | ThUS$ |
Foreign | Enel Green Power Volta Grande | Brazil | Foreign | DEBÊNTURES 1ª EMISSÃO (EGVG11) - 1ª Série | Brazil | BRL | 8,24% | 8,23% | Annual | 727 | 10,570 | 11,297 | 10,620 | 10,595 | 10,595 | 10,595 | 41,778 | 84,183 |
Foreign | Enel Green Power Volta Grande | Brazil | Foreign | DEBÊNTURES 1ª EMISSÃO (EGVG21) - 2ª Série | Brazil | BRL | 8,22% | 8,21% | Annual | 317 | 5,495 | 5,812 | 5,446 | 5,446 | 5,432 | 5,432 | 21,452 | 43,208 |
Foreign | Enel Distribución Sao Paulo | Brazil | Foreign | DEBÊNTURES 1ª EMISSÃO (EGVG11) - 1ª Série | Brazil | BRL | 3,02% | 3,01% | Upon Expiration | 758 | 135,412 | 136,170 | - | - | - | - | - | - |
Foreign | Enel Distribución Sao Paulo | Brazil | Foreign | DEBÊNTURES 1ª EMISSÃO (EGVG21) - 2ª Série | Brazil | BRL | 3,10% | 3,08% | Annual | 1,676 | - | 1,676 | 133,681 | 134,231 | - | - | - | 267,912 |
Total | | | | | | | | | | 3,478 | 151,477 | 154,955 | 149,747 | 150,272 | 16,027 | 16,027 | 63,230 | 395,303 |
| | | | | | | | | | | | | | | | | | |
| | | | | | | | | | | | | | | | | | |
| | | | | | | | | | | | | | | | | | |
| | | | | | | | | | December 31, 2019 | ||||||||
| | | | | | | | | | Current | Non-Current | |||||||
Taxpayer | Company | Country | Taxpayer | Name | Country | Currency | Effective | Nominal | Maturity | Less than | More than | Total current | One to two | Two to | Three to | Four to | More than | Total Non- |
| | | | | | | | | | ThUS$ | ThUS$ | ThUS$ | ThUS$ | ThUS$ | ThUS$ | ThUS$ | ThUS$ | ThUS$ |
Foreign | Enel Distribución Río S.A. | Brazil | Foreign | DEBENTURES 9 EMISSION (AMPL19) | Brazil | BRL | 6,80% | 6,78% | Upon Expiration | 226 | 148,960 | 149,186 | - | - | - | - | - | - |
Foreign | Enel Distribución Goias S.A. | Brazil | Foreign | 3ª Nota Promissoria ITAÚ | Brazil | BRL | 6,69% | 6,68% | Upon Expiration | 1,516 | 216,039 | 217,555 | - | - | - | - | - | - |
Foreign | Enel Green Power Volta Grande | Brazil | Foreign | DEBÊNTURES 1ª EMISSÃO (EGVG11) - 1ª Série | Brazil | BRL | 9,17% | 8,17% | Biannual | 713 | 12,980 | 13,693 | 12,987 | 12,988 | 12,988 | 12,989 | 64,866 | 116,818 |
Foreign | Enel Green Power Volta Grande | Brazil | Foreign | DEBÊNTURES 1ª EMISSÃO (EGVG21) - 2ª Série | Brazil | BRL | 9,17% | 8,17% | Monthly | 288 | 6,733 | 7,021 | 6,638 | 6,639 | 6,639 | 6,639 | 33,220 | 59,775 |
Foreign | Enel Distribución Sao Paulo | Brazil | Foreign | DEBÊNTURES - 23ª EMISSÃO 1ª SÉRIE | Brazil | BRL | 6,45% | 6,43% | Upon Expiration | 2,812 | - | 2,812 | 174,418 | - | - | - | - | 174,418 |
Foreign | Enel Distribución Sao Paulo | Brazil | Foreign | DEBÊNTURES - 23ª EMISSÃO 2ª SÉRIE | Brazil | BRL | 6,62% | 6,60% | Annual | 5,720 | - | 5,720 | - | 172,418 | 173,100 | - | - | 345,518 |
Total | | | | | | | | | | 11,275 | 384,712 | 395,987 | 194,043 | 192,045 | 192,727 | 19,628 | 98,086 | 696,529 |
F-116
| ● | Fair value measurement and hierarchy |
The fair value of current and non-current secured and unsecured liabilities as of December 31, 2020 totaled ThUS$4,017,861 (ThUS$4,877,583 as of December 31, 2019). These liabilities have been classified as Level 2 fair value measurement based on the entry data used in the valuation techniques used (see Note 3.h). It is important to note that these financial liabilities are measured at amortized cost (see Note 3 g.4.)
| ● | Detail of other obligations |
| | | | | | | | | | | | | | | | | |
| | | | | | | | | December 31, 2020 | ||||||||
| | | | | | | | | Current | Non-Current | |||||||
Taxpayer | | | Taxpayer | | | | Nominal | | Less than | More than | Total | One to | Two to | Three to | Four to | More than | Total Non- |
ID No. | Company | Country | ID No. | Company | Country | Currency | Rate | Maturity | ThUS$ | ThUS$ | ThUS$ | ThUS$ | ThUS$ | ThUS$ | ThUS$ | ThUS$ | ThUS$ |
Foreign | Enel Distribución Ceará S.A. | Brazil | Foreign | ELETROBRAS 0244/2009 | Brazil | BRL | 6.00% | Monthly | 21 | — | 21 | — | — | — | — | — | — |
Foreign | Enel Distribución Ceará S.A. | Brazil | Foreign | ELETROBRAS 0265/2009 | Brazil | BRL | 6.00% | Monthly | 82 | 165 | 247 | — | — | — | — | — | — |
Foreign | Enel Distribución Ceará S.A. | Brazil | Foreign | ELETROBRAS 292/2010 | Brazil | BRL | 6.00% | Monthly | 69 | 206 | 275 | 160 | — | — | — | — | 160 |
Foreign | Enel Distribución Ceará S.A. | Brazil | Foreign | ELETROBRAS 310/2010 | Brazil | BRL | 6.00% | Monthly | 78 | 233 | 311 | 311 | 259 | — | — | — | 570 |
Foreign | Enel Generación Costanera S.A. | Argentina | Foreign | MITSUBISHI (DEUDA GARANTIZADA) | Argentina | US$ | 0.25% | Biannual | — | 6,088 | 6,088 | 6,494 | 7,594 | 7,494 | 7,494 | 11,709 | 40,785 |
Foreign | Enel Distribución Goias S.A. | Brazil | Foreign | FIDC SÉRIE A | Brazil | BRL | 6.15% | Monthly | 1,670 | 7,240 | 8,910 | 7,493 | 3,141 | — | — | — | 10,634 |
Foreign | Enel Distribución Goias S.A. | Brazil | Foreign | FIDC SÉRIE B | Brazil | BRL | 12.32% | Monthly | 1,033 | 4,245 | 5,278 | 3,563 | 777 | — | — | — | 4,340 |
Foreign | Enel Distribución Goias S.A. | Brazil | Foreign | MÚTUO CELGPAR 41211376/2014 | Brazil | BRL | 6.80% | Monthly | 613 | 1,736 | 2,349 | 1,630 | 1,797 | 1,975 | 2,165 | 4,506 | 12,073 |
Foreign | Enel Distribución Goias S.A. | Brazil | Foreign | ELETROBRAS | Brazil | BRL | 6.00% | Monthly | 113 | 339 | 452 | 318 | 318 | 159 | — | — | 795 |
Foreign | Emgesa S.A. E.S.P. | Colombia | Foreign | BANK OF NOVA SCOTIA | Colombia | COP | 0.30% | Quarterly | 49 | — | 49 | — | — | — | — | — | — |
Foreign | Codensa | Colombia | Foreign | BANK OF NOVA SCOTIA | Colombia | COP | 0.02% | Monthly | 45 | — | 45 | — | — | — | — | — | — |
Foreign | Enel Distribución Sao Paulo | Brazil | Foreign | FUNDAÇÃO CESP (*) | Brazil | BRL | 9.47% | Quarterly | 51,685 | 12,929 | 64,614 | 34,477 | 34,477 | 34,477 | 8,619 | — | 112,050 |
Total | 55,458 | 33,181 | 88,639 | 54,446 | 48,363 | 44,105 | 18,278 | 16,215 | 181,407 | ||||||||
| | | | | | | | | | | | | | | | | |
| | | | | | | | | December 31, 2019 | ||||||||
| | | | | | | | | Current | Non-Current | |||||||
Taxpayer | | | Taxpayer | | | | Nominal | | Less than | More than | Total | One to | Two to | Three to | Four to | More than | Total Non- |
ID No. | Company | Country | ID No. | Company | Country | Currency | Rate | Maturity | ThUS$ | ThUS$ | ThUS$ | ThUS$ | ThUS$ | ThUS$ | ThUS$ | ThUS$ | ThUS$ |
Foreign | Enel Distribución Ceará S.A. | Brazil | Foreign | ELETROBRAS 0244/2009 | Brazil | BRL | 6.00% | Monthly | 81 | 244 | 325 | 27 | — | — | — | — | 27 |
Foreign | Enel Distribución Ceará S.A. | Brazil | Foreign | ELETROBRAS 0265/2009 | Brazil | BRL | 6.00% | Monthly | 106 | 319 | 425 | 319 | — | — | — | — | 319 |
Foreign | Enel Distribución Ceará S.A. | Brazil | Foreign | ELETROBRAS 292/2010 | Brazil | BRL | 6.00% | Monthly | 89 | 266 | 355 | 355 | 207 | — | — | — | 562 |
Foreign | Enel Distribución Ceará S.A. | Brazil | Foreign | ELETROBRAS 310/2010 | Brazil | BRL | 6.00% | Monthly | 100 | 301 | 401 | 402 | 402 | 335 | — | — | 1,139 |
Foreign | Enel Generación Costanera S.A. | Argentina | Foreign | Mitsubishi (garanteed debt) | Argentina | US$ | 0.25% | Biannual | — | 7,281 | 7,281 | 2,834 | 3,221 | 6,753 | 8,013 | 19,827 | 40,648 |
Foreign | Enel Distribución Goias S.A. | Brazil | Foreign | FIDC Series A | Brazil | BRL | 9.11% | Monthly | 3,526 | 7,992 | 11,518 | 11,022 | 11,022 | 5,403 | — | — | 27,447 |
Foreign | Enel Distribución Goias S.A. | Brazil | Foreign | FIDC Series B | Brazil | BRL | 14.42% | Monthly | 2,113 | 3,659 | 5,772 | 5,522 | 5,522 | 2,194 | — | — | 13,238 |
Foreign | Enel Distribución Goias S.A. | Brazil | Foreign | Eletrobras | Brazil | BRL | 6.00% | Monthly | 178 | 534 | 712 | 620 | 620 | 620 | 310 | — | 2,170 |
Foreign | Enel Distribución Goias S.A. | Brazil | Foreign | MÚTUO CELGPAR 41211376/2014 | Brazil | BRL | 6.80% | Monthly | 748 | 2,099 | 2,847 | 2,058 | 2,260 | 2,475 | 2,705 | 9,055 | 18,553 |
Total | 6,941 | 22,695 | 29,636 | 23,159 | 23,254 | 17,780 | 11,028 | 28,882 | 104,103 | ||||||||
(*) See Note 26.2.c)
The debt denominated in U.S. dollars for ThUS$35,064 held by the Group as of December 31, 2020, is related to future cash flow hedges for the Group’s U.S. dollar-linked operating revenues (ThUS$29,474 and ThUS$40,867 as of December 31, 2019 and 2018, respectively) (see Note 3.n).
The following table details changes in “Reserve for cash flow hedges” for the years ended December 31, 2020, 2019 and 2018, due to exchange differences from this debt:
F-117
| | | |
| 12-31-2020 | 12-31-2019 | 12-31-2018 |
| ThUS$ | ThUS$ | ThUS$ |
Balance in hedging reserves (hedging revenues) at the beginning of the year, net | (9,453) | (9,882) | (9,754) |
Foreign currency exchange differences recorded in equity, net | (1,319) | 424 | (1,181) |
Recognition of foreign currency exchange differences revenue, net | 913 | 189 | 634 |
Foreign currency translation differences | 756 | (184) | 419 |
Balance in hedging reserves (hedging revenues) at the end of the year, net | (9,103) | (9,453) | (9,882) |
As of December 31, 2020, the Group does not have unconditional long-term, lines of credit at their disposal (ThUS$706,000 as of December 31, 2019).
f) Future undiscounted debt flows
The following table shows the estimates of undiscounted cash flows by type of financial debt:
| - | Summary of bank loans by currencies and maturities |
| | | | | | | | | | | |
| | | Current | Non-Current | |||||||
| | | Maturity | Total Current | Maturity | Total Non-Current | |||||
| | Nominal Interest | One to three months | Three to twelve months | | One to two years | Two to three years | Three to four years | Four to five years | More than five years | |
Country | Currency | Rate | ThUS$ | ThUS$ | ThUS$ | ThUS$ | ThUS$ | ThUS$ | ThUS$ | ThUS$ | ThUS$ |
| | | | | | | | | | | |
Chile | US$ | 0.94% | 175,940 | 150,366 | 326,306 | — | — | — | — | — | — |
Peru | PEN | 2.71% | 1,102 | 171,132 | 172,234 | 48,505 | 39,557 | — | — | — | 88,062 |
Peru | US$ | 2.59% | 151 | 25,050 | 25,201 | — | — | — | — | — | — |
Colombia | COP | 3.62% | 2,746 | 125,276 | 128,022 | 15,435 | 23,344 | 21,204 | 10,775 | 334 | 71,092 |
Brazil | US$ | 2.91% | 294,873 | 107,696 | 402,569 | 49,366 | 127 | 2,819 | — | — | 52,312 |
Brazil | BRL | 3.80% | 10,496 | 112,467 | 122,963 | 143,573 | 18,697 | 11,953 | 10,476 | 22,414 | 207,113 |
Total | 485,308 | 691,987 | 1,177,295 | 256,879 | 81,725 | 35,976 | 21,251 | 22,748 | 418,579 | ||
| | | | | | | | | | | |
| | | Current | Non-Current | |||||||
| | | Maturity | Total Current | Maturity | Total Non-Current | |||||
| | Nominal Interest | One to three months | Three to twelve months | | One to two years | Two to three years | Three to four years | Four to five years | More than five years | |
Country | Currency | Rate | ThUS$ | ThUS$ | ThUS$ | ThUS$ | ThUS$ | ThUS$ | ThUS$ | ThUS$ | ThUS$ |
| | | | | | | | | | | |
Chile | US$ | 3.33% | 2,859 | 350,952 | 353,811 | — | — | — | — | — | — |
Peru | PEN | 4.10% | 235 | 704 | 939 | 23,080 | — | — | — | — | 23,080 |
Colombia | COP | 5.61% | 2,221 | 34,131 | 36,352 | 8,228 | 3,875 | 1,200 | 1,145 | 1,439 | 15,887 |
Brazil | US$ | 4.40% | 6,217 | 298,443 | 304,660 | 322,374 | 49,552 | 140 | 2,827 | — | 374,893 |
Brazil | BRL | 6.56% | 11,071 | 32,956 | 44,027 | 39,125 | 129,934 | 22,224 | 13,671 | 37,964 | 242,918 |
Argentina | ARS | 0.00% | — | — | — | — | — | — | — | — | — |
Total | 22,603 | 717,186 | 739,789 | 392,807 | 183,361 | 23,564 | 17,643 | 39,403 | 656,778 | ||
F-118
| - | Summary of secured and unsecured bonds by currency and maturity |
| | | | | | | | | | | |
| | | Current | Non-Current | |||||||
| | | Maturity | Total Current | Maturity | Total Non-Current | |||||
| | Nominal Interest | One to three months | Three to twelve months | | One to two years | Two to three years | Three to four years | Four to five years | More than five years | |
Country | Currency | Rate | ThUS$ | ThUS$ | ThUS$ | ThUS$ | ThUS$ | ThUS$ | ThUS$ | ThUS$ | ThUS$ |
Chile | US$ | 5.30% | 6,248 | 18,743 | 24,991 | 24,991 | 24,991 | 24,991 | 24,991 | 621,693 | 721,657 |
Chile | UF | 5.75% | 172 | 7,482 | 7,654 | 3,807 | — | — | — | — | 3,807 |
Peru | US$ | 6.34% | 157 | 471 | 628 | 628 | 628 | 628 | 628 | 11,309 | 13,821 |
Peru | PEN | 6.24% | 5,292 | 42,218 | 47,510 | 50,087 | 60,314 | 56,162 | 50,510 | 209,399 | 426,472 |
Colombia | COP | 5.74% | 236,187 | 138,040 | 374,227 | 321,820 | 270,759 | 238,759 | 247,208 | 332,765 | 1,411,311 |
Brazil | BRL | 5.94% | 17,348 | 236,255 | 253,603 | 278,779 | 393,232 | 312,535 | 106,090 | 261,456 | 1,352,092 |
Total | 265,404 | 443,209 | 708,613 | 680,112 | 749,924 | 633,075 | 429,427 | 1,436,622 | 3,929,160 | ||
| | | | | | | | | | | |
| | | Current | Non-Current | |||||||
| | | Maturity | Total Current | Maturity | Total Non-Current | |||||
| | Nominal Interest | One to three months | Three to twelve months | | One to two years | Two to three years | Three to four years | Four to five years | More than five years | |
Country | Currency | Rate | ThUS$ | ThUS$ | ThUS$ | ThUS$ | ThUS$ | ThUS$ | ThUS$ | ThUS$ | ThUS$ |
Chile | US$ | 5.30% | 6,265 | 18,794 | 25,059 | 25,059 | 25,059 | 25,059 | 25,059 | 646,809 | 747,045 |
Chile | UF | 5.75% | 340 | 7,080 | 7,420 | 7,247 | 3,555 | — | — | — | 10,802 |
Peru | US$ | 6.06% | 305 | 10,768 | 11,073 | 632 | 632 | 632 | 632 | 11,948 | 14,476 |
Peru | PEN | 6.31% | 6,444 | 57,879 | 64,323 | 51,881 | 54,694 | 65,866 | 61,329 | 283,798 | 517,568 |
Colombia | COP | 7.18% | 28,377 | 182,656 | 211,033 | 394,102 | 338,555 | 283,029 | 173,072 | 535,052 | 1,723,810 |
Brazil | BRL | 7.34% | 88,674 | 487,188 | 575,862 | 349,956 | 374,265 | 503,825 | 360,895 | 463,679 | 2,052,620 |
Total | 130,405 | 764,365 | 894,770 | 828,877 | 796,760 | 878,411 | 620,987 | 1,941,286 | 5,066,321 | ||
| - | Summary of lease obligations by currency and maturity |
| | | | | | | | | | | |
| | | Current | Non-Current | |||||||
| | | Maturity | | Maturity | | |||||
Country | Currency | Nominal Interest Rate | One to three months | Three to twelve months | Total Current 12/31/2020 | One to two years | Two to three years | Three to four years | Four to five years | More than five years | Total Non-Current 12/31/2020 |
| | | ThUS$ | ThUS$ | ThUS$ | ThUS$ | ThUS$ | ThUS$ | ThUS$ | ThUS$ | ThUS$ |
Argentina | US$ | 0.25% | 1,946 | 4,296 | 6,242 | 3,781 | 4,374 | 7,494 | 7,494 | 18,590 | 41,733 |
Colombia | COP | 0.32% | 94 | - | 94 | - | - | - | - | - | - |
Brazil | BRL | 7.19% | 58,113 | 34,017 | 92,130 | 56,158 | 44,720 | 37,124 | 11,104 | 4,796 | 153,902 |
Total | 60,153 | 38,313 | 98,466 | 59,939 | 49,094 | 44,618 | 18,598 | 23,386 | 195,635 | ||
| | | | | | | | | | | |
| | | Current | Non-Current | |||||||
| | | Maturity | | Maturity | | |||||
Country | Currency | Nominal Interest Rate | One to three months | Three to twelve months | Total Current 12/31/2019 | One to two years | Two to three years | Three to four years | Four to five years | More than five years | Total Non-Current 12/31/2019 |
| | | ThUS$ | ThUS$ | ThUS$ | ThUS$ | ThUS$ | ThUS$ | ThUS$ | ThUS$ | ThUS$ |
Argentina | US$ | 0.25% | 1,195 | 6,339 | 7,534 | 5,340 | 5,175 | 5,383 | 4,770 | 21,881 | 42,549 |
Brazil | BRL | 7.54% | 9,081 | 27,222 | 36,303 | 30,630 | 28,683 | 17,293 | 3,711 | 9,943 | 90,260 |
Colombia | COP | 0.00% | - | - | - | - | - | - | - | - | - |
Total | 10,276 | 33,561 | 43,837 | 35,970 | 33,858 | 22,676 | 8,481 | 31,824 | 132,809 | ||
F-119
As of December 31, 2020, and 2019, the balance of lease liabilities is as follows:
| | | | |
| 12-31-2020 | 12-31-2019 | ||
| Current ThUS$ | Non-Current ThUS$ | Current ThUS$ | Non-Current ThUS$ |
Lease liability | 51,495 | 91,070 | 81,644 | 108,625 |
Total | 51,495 | 91,070 | 81,644 | 108,625 |
21.1 |
| | | | | | | | | | | | | | | | | |
|---|---|---|---|---|---|---|---|---|---|---|---|---|---|---|---|---|---|
| | | | | | | | | December 31, 2020 | ||||||||
| | | | | | | | | Current | Non-Current | |||||||
Taxpayer | | | Taxpayer | | | | Nominal | Maturity | Less than | More than | Total | One to two | Two to | Three to | Four to | More than | Total Non- |
ID No. | Company | Country | ID No. | Company | Country | Currency | Rate | | ThUS$ | ThUS$ | ThUS$ | ThUS$ | ThUS$ | ThUS$ | ThUS$ | ThUS$ | ThUS$ |
Foreign | Codensa | Colombia | Foreign | MAREAUTO COLOMBIA SAS | Colombia | COP | 12,94% | Monthly | 68 | 10 | 78 | — | — | — | — | — | — |
Foreign | Codensa | Colombia | Foreign | TRANSPORTES ESPECIALES ALIADOS S.A.S | Colombia | COP | 12,50% | Monthly | 75 | 130 | 205 | — | — | — | — | — | — |
Foreign | Codensa | Colombia | Foreign | PATRIMONIOS AUTONOMOS FIDUCIARIA BO | Colombia | COP | 7,44% | Monthly | 82 | — | 82 | — | — | — | — | — | — |
Foreign | Codensa | Colombia | Foreign | ANA MARIA RESTREPO PEREA | Colombia | COP | 7,44% | Monthly | 19 | 46 | 65 | — | — | — | — | — | — |
Foreign | Codensa | Colombia | Foreign | MARIA VICTORIA RESTREPO DE MARTINEZ | Colombia | COP | 7,44% | Monthly | 19 | 46 | 65 | — | — | — | — | — | — |
Foreign | Codensa | Colombia | Foreign | LONDONO DE ARENAS MARIA DEL PILAR | Colombia | COP | 7,44% | Monthly | 15 | 34 | 49 | — | — | — | — | — | — |
Foreign | Codensa | Colombia | Foreign | MARTINEZ ISAACS ROBERTO EDUARDO | Colombia | COP | 7,44% | Monthly | 5 | 11 | 16 | — | �� | — | — | — | — |
Foreign | Codensa | Colombia | Foreign | PATRIMONIOS AUTONOMOS FIDUCIARIA BO | Colombia | COP | 7,44% | Monthly | 24 | — | 24 | — | — | — | — | — | — |
Foreign | Codensa | Colombia | Foreign | PATRIMONIOS AUTONOMOS FIDUCIARIA BO | Colombia | COP | 7,93% | Monthly | 129 | 304 | 433 | — | — | — | — | — | — |
Foreign | Codensa | Colombia | Foreign | PATRIMONIOS AUTONOMOS FIDUCIARIA BO | Colombia | COP | 4,20% | Monthly | 102 | 240 | 342 | — | — | — | — | — | — |
Foreign | Codensa | Colombia | Foreign | CALDWELL MANAGEMENT SAS | Colombia | COP | 7,56% | Monthly | 54 | 109 | 163 | — | — | — | — | — | — |
Foreign | Codensa | Colombia | Foreign | CASTRO OCHOA LUIS ANTONIO | Colombia | COP | 7,71% | Monthly | 12 | — | 12 | — | — | — | — | — | — |
Foreign | Codensa | Colombia | Foreign | SITUANDO LTDA | Colombia | COP | 7,56% | Monthly | 37 | 12 | 49 | — | — | — | — | — | — |
Foreign | Codensa | Colombia | Foreign | JULIO ALBERTO FLECHAS VEGA | Colombia | COP | 7,44% | Monthly | 7 | 21 | 28 | — | — | — | — | — | — |
Foreign | Codensa | Colombia | Foreign | PAEZ RUIZ Y ASOCIADOS LTDA | Colombia | COP | 7,60% | Monthly | 15 | 45 | 60 | — | — | — | — | — | — |
Foreign | Codensa | Colombia | Foreign | ACCI S.A.S | Colombia | COP | 7,99% | Monthly | 51 | 32 | 83 | — | — | — | — | — | — |
Foreign | Codensa | Colombia | Foreign | SITUANDO LTDA | Colombia | COP | 4,20% | Monthly | 21 | — | 21 | — | — | — | — | — | — |
Foreign | Codensa | Colombia | Foreign | CONSTRUCCIONES E INVERSIONES | Colombia | COP | 7,80% | Monthly | 14 | 9 | 23 | — | — | — | — | — | — |
Foreign | Codensa | Colombia | Foreign | CANALES ANDRADE Y CIA SAS | Colombia | COP | 7,57% | Monthly | 26 | 52 | 78 | — | — | — | — | — | — |
Foreign | Codensa | Colombia | Foreign | MERCURIO CENTRO COMERCIAL | Colombia | COP | 7,57% | Monthly | 1 | 3 | 4 | — | — | — | — | — | — |
Foreign | Codensa | Colombia | Foreign | MUNOZ HERMANOS FYN Y COMPAN A SAS | Colombia | COP | 7,87% | Monthly | 6 | 18 | 24 | 26 | 28 | — | — | — | 54 |
Foreign | Codensa | Colombia | Foreign | MUNOZ HERMANOS FYN Y COMPAN A SAS | Colombia | COP | 7,87% | Monthly | 6 | 17 | 23 | 24 | 26 | — | — | — | 50 |
Foreign | Codensa | Colombia | Foreign | E Y D Y COMPAÑIA S.C | Colombia | COP | 4,20% | Monthly | 2 | 5 | 7 | 5 | — | — | — | — | 5 |
Foreign | Codensa | Colombia | Foreign | INTERCOLOMBIA S.A. E.S.P. | Colombia | COP | 7,88% | Monthly | 13 | 15 | 28 | 26 | 28 | 30 | 33 | 942 | 1,059 |
Foreign | Codensa | Colombia | Foreign | C.I. ALLIANCE S.A. | Colombia | COP | 7,50% | Monthly | 95 | 224 | 319 | 254 | 273 | 294 | 316 | 4,802 | 5,939 |
Foreign | Codensa | Colombia | Foreign | TERRAPUERTO SAS | Colombia | COP | 7,50% | Monthly | 67 | 113 | 180 | 178 | 192 | 206 | 221 | 3,368 | 4,165 |
Foreign | Codensa | Colombia | Foreign | COMPAÑIA GENERAL DE | Colombia | COP | 7,50% | Monthly | 57 | 107 | 164 | 152 | 163 | 176 | 189 | 2,904 | 3,584 |
Foreign | Codensa | Colombia | Foreign | MINISTERIO DEFENSA NAL EJERCITO NAC | Colombia | COP | 7,72% | Monthly | 95 | 56 | 151 | 51 | — | — | — | — | 51 |
Foreign | Codensa | Colombia | Foreign | NEARDENTAL SAS | Colombia | COP | 7,40% | Monthly | 16 | — | 16 | — | — | — | — | — | — |
Foreign | Codensa | Colombia | Foreign | TRANSPORTES ESPECIALES FSG | Colombia | COP | 7,10% | Monthly | 7 | 17 | 24 | 2 | — | — | — | — | 2 |
Foreign | Codensa | Colombia | Foreign | ALD AUTOMOTIVE | Colombia | COP | 9,25% | Monthly | 1 | 3 | 4 | 4 | 5 | 5 | — | — | 14 |
Foreign | Codensa | Colombia | Foreign | ALD AUTOMOTIVE | Colombia | COP | 9,25% | Monthly | 2 | 4 | 6 | 5 | 6 | 6 | — | — | 17 |
Foreign | Codensa | Colombia | Foreign | ALD AUTOMOTIVE | Colombia | COP | 9,25% | Monthly | 3 | 6 | 9 | 9 | 10 | 10 | — | — | 29 |
Foreign | Codensa | Colombia | Foreign | ALD AUTOMOTIVE | Colombia | COP | 9,25% | Monthly | 2 | 4 | 6 | 6 | 6 | 6 | — | — | 18 |
Foreign | Codensa | Colombia | Foreign | ALD AUTOMOTIVE | Colombia | COP | 9,25% | Monthly | 2 | 4 | 6 | 5 | 6 | 6 | — | — | 17 |
Foreign | Codensa | Colombia | Foreign | ALD AUTOMOTIVE | Colombia | COP | 9,25% | Monthly | 2 | 4 | 6 | 5 | 6 | 6 | — | — | 17 |
Foreign | Codensa | Colombia | Foreign | ALD AUTOMOTIVE | Colombia | COP | 9,25% | Monthly | 2 | 3 | 5 | 5 | 5 | 5 | — | — | 15 |
Foreign | Codensa | Colombia | Foreign | ALD AUTOMOTIVE | Colombia | COP | 9,25% | Monthly | 2 | 4 | 6 | 6 | 6 | 6 | — | — | 18 |
Foreign | Codensa | Colombia | Foreign | ALD AUTOMOTIVE | Colombia | COP | 9,25% | Monthly | 2 | 4 | 6 | 6 | 6 | 6 | — | — | 18 |
Foreign | Codensa | Colombia | Foreign | ALD AUTOMOTIVE | Colombia | COP | 9,25% | Monthly | 2 | 4 | 6 | 6 | 6 | 6 | — | — | 18 |
Foreign | Codensa | Colombia | Foreign | ALD AUTOMOTIVE | Colombia | COP | 9,25% | Monthly | 1 | 3 | 4 | 4 | 4 | 4 | — | — | 12 |
Foreign | Codensa | Colombia | Foreign | ALD AUTOMOTIVE | Colombia | COP | 9,25% | Monthly | 2 | 4 | 6 | 6 | 6 | 6 | — | — | 18 |
Foreign | Codensa | Colombia | Foreign | AMERICAS BUSINESS PROCESS SERVICES | Colombia | COP | 7,59% | Monthly | 9 | 23 | 32 | — | — | — | — | — | — |
Foreign | Codensa | Colombia | Foreign | AMERICAS BUSINESS PROCESS SERVICES | Colombia | COP | 7,59% | Monthly | 22 | 60 | 82 | — | — | — | — | — | — |
Foreign | Enel Distribución Perú S.A. | Peru | Foreign | BANCO INTERBANK DEL PERU | Peru | PEN | 6,24% | Quarterly | 617 | 1,863 | 2,480 | 2,620 | — | — | — | — | 2,620 |
Foreign | Enel Distribución Perú S.A. | Peru | Foreign | BANCO INTERBANK DEL PERU | Peru | PEN | 5,54% | Quarterly | 99 | 298 | 397 | 311 | 106 | — | — | — | 417 |
Foreign | Enel Distribución Perú S.A. | Peru | Foreign | BANCO CONTINENTAL | Peru | PEN | 4,37% | Quarterly | 1,758 | 5,328 | 7,086 | 7,374 | 1,893 | — | — | — | 9,267 |
Foreign | Enel Distribución Perú S.A. | Peru | Foreign | BANCO CONTINENTAL | Peru | PEN | 1,61% | Quarterly | — | 95 | 95 | 382 | 95 | — | — | — | 477 |
Foreign | Enel Distribución Perú S.A. | Peru | Foreign | BUILDINGINMUEBLES PANAMERICANA S.A. | Peru | PEN | 5,19% | Monthly | 54 | 164 | 218 | 229 | 240 | 253 | 87 | — | 809 |
Foreign | Enel Distribución Perú S.A. | Peru | Foreign | BUILDINGMZ-INMOBILIARIA & DESARROLLADORA S.A. | Peru | PEN | 4,65% | Monthly | 11 | — | 11 | — | — | — | — | — | — |
Foreign | Enel Distribución Perú S.A. | Peru | Foreign | RENTAEQUIPOS LEASING PERU S.A. | Peru | US$ | 4,70% | Monthly | 26 | 75 | 101 | 107 | — | — | — | — | 107 |
Foreign | Enel Distribución Perú S.A. | Peru | Foreign | CORP MG | Peru | US$ | 2,27% | Monthly | 1 | 766 | 767 | 1,697 | 1,697 | 1,697 | 1,697 | 7,777 | 14,565 |
F-120
| | | | | | | | | | | | | | | | | |
|---|---|---|---|---|---|---|---|---|---|---|---|---|---|---|---|---|---|
| | | | | | | | | December 31, 2020 | ||||||||
| | | | | | | | | Current | Non-Current | |||||||
Taxpayer | | | Taxpayer | | | | Nominal | Maturity | Less than | More than | Total | One to two | Two to | Three to | Four to | More than | Total Non- |
ID No. | Company | Country | ID No. | Company | Country | Currency | Rate | | ThUS$ | ThUS$ | ThUS$ | ThUS$ | ThUS$ | ThUS$ | ThUS$ | ThUS$ | ThUS$ |
Foreign | Enel Distribución Perú S.A. | Peru | Foreign | SOVI INVERSIONES S.A.C. | Peru | US$ | 3,19% | Monthly | 22 | 102 | 124 | 93 | 93 | 46 | — | — | 232 |
Foreign | Enel Generación Piura S.A. | Peru | Foreign | SCOTIABANK PERU | Peru | US$ | 3,70% | Quarterly | 2,418 | 7,268 | 9,686 | 2,397 | — | — | — | — | 2,397 |
Foreign | Enel Generación Piura S.A. | Peru | Foreign | BANCO DE CREDITO DEL PERU | Peru | US$ | 3,63% | Quarterly | 627 | 628 | 1,255 | — | — | — | — | — | — |
Foreign | Enel Generación Piura S.A. | Peru | Foreign | BBVA CONTINENTAL | Peru | US$ | 2,84% | Quarterly | — | 1,432 | 1,432 | 1,463 | — | — | — | — | 1,463 |
Foreign | Enel Generación Piura S.A. | Peru | Foreign | RENTING S.A.C. | Peru | PEN | 7,57% | Monthly | 8 | 11 | 19 | — | — | — | — | — | — |
Foreign | Emgesa S.A. E.S.P. | Colombia | Foreign | AVIS MAREAUTO COLOMBIA S.A.S | Colombia | COP | 7,47% | Monthly | 8 | 6 | 14 | — | — | — | — | — | — |
Foreign | Emgesa S.A. E.S.P. | Colombia | Foreign | COMPAÑÍA NAVIERA DEL GUAVIO LTDA. | Colombia | COP | 5,72% | Monthly | 52 | 156 | 208 | 72 | — | — | — | — | 72 |
Foreign | Emgesa S.A. E.S.P. | Colombia | Foreign | PATRIMONIOS AUTONOMOS | Colombia | COP | 7,93% | Monthly | 69 | 164 | 233 | — | — | — | — | — | — |
Foreign | Emgesa S.A. E.S.P. | Colombia | Foreign | TRANSPORTES ESPECIALES FSG | Colombia | COP | 7,10% | Monthly | 208 | 632 | 840 | 72 | — | — | — | — | 72 |
Foreign | Emgesa S.A. E.S.P. | Colombia | Foreign | CALDWELL MANAGEMENT SAS | Colombia | COP | 7,56% | Monthly | 55 | 112 | 167 | — | — | — | — | — | — |
Foreign | Emgesa S.A. E.S.P. | Colombia | Foreign | AVIS Mareauto Colombia S.A.S | Colombia | COP | 13,30% | Monthly | 5 | 17 | 22 | 2 | — | — | — | — | 2 |
Foreign | Emgesa S.A. E.S.P. | Colombia | Foreign | AVIS MAREAUTO COLOMBIA S.A.S | Colombia | COP | 14,08% | Monthly | — | 1 | 1 | 6 | 1 | — | — | — | 7 |
Foreign | Emgesa S.A. E.S.P. | Colombia | Foreign | NEARDENTAL S.A.S | Colombia | COP | 7,40% | Monthly | 7 | — | 7 | — | — | — | — | — | — |
Foreign | Emgesa S.A. E.S.P. | Colombia | Foreign | GESTIÓN INMOBILIARIA MIC S.A.S | Colombia | COP | 7,48% | Monthly | 2 | — | 2 | — | — | — | — | — | — |
Foreign | Emgesa S.A. E.S.P. | Colombia | Foreign | EMPRESA INMOBILIARIA DE CUNDINAMARCA | Colombia | COP | 6,90% | Monthly | 13 | 4 | 17 | — | — | — | — | — | — |
Foreign | Emgesa S.A. E.S.P. | Colombia | Foreign | PAOLA ANDREA LONDOÑO | Colombia | COP | 8,18% | Monthly | 3 | 9 | 12 | 3 | — | — | — | — | 3 |
Foreign | Emgesa S.A. E.S.P. | Colombia | Foreign | ALD AUTOMOTIVE | Colombia | COP | 9,25% | Monthly | 106 | 162 | 268 | 209 | 121 | 28 | — | — | 358 |
Foreign | Enel Distribución Sao Paulo | Brazil | Foreign | CASTELLO BRANCO OFFICE PARK - FUNDO DE INVESTIMENTO IMOBILIÁRIO (50%) / CSHG REAL ESTATE - FUNDO DE INVESTIMENTO IMOBILIÁRIO (50%) | Brazil | BRL | 10,55% | Monthly | 622 | 1,040 | 1,662 | 1,515 | 1,674 | 1,851 | 2,046 | 2,461 | 9,547 |
Foreign | Enel Distribución Sao Paulo | Brazil | Foreign | MICHEL ESPER SAAD JUNIOR / SELMA MICHEL SAAD / DORA SAAD | Brazil | BRL | 6,66% | Monthly | 75 | 160 | 235 | 226 | 119 | — | — | — | 345 |
Foreign | Enel Distribución Sao Paulo | Brazil | Foreign | SIFONT - COMÉRCIO DE PRODUTOS ADESIVOS LTDA - PPE / DAISAN CONSULTORIA E NEGÓCIOS IMOBILIÁRIOS LTDA | Brazil | BRL | 8,22% | Monthly | 22 | 45 | 67 | 62 | 65 | 70 | 76 | 20 | 293 |
Foreign | Enel Distribución Sao Paulo | Brazil | Foreign | GABRIEL CHUCAIR / SANDRA REGINA MARQUES PEREIRA CHUCAIR / EDUARDO CHUCAIR / MAURÍCIO CHUCAIR | Brazil | BRL | 2,42% | Monthly | 11 | — | 11 | — | — | — | — | — | — |
Foreign | Enel Distribución Sao Paulo | Brazil | Foreign | JOAQUIM VICENTE MARTINS / MARIA FERNANDA DOS SANTOS MARTINS | Brazil | BRL | 4,44% | Monthly | 28 | 53 | 81 | 12 | — | — | — | — | 12 |
Foreign | Enel Distribución Sao Paulo | Brazil | Foreign | DINARTEK ADMINISTRAÇÃO E PARTICIPAÇÃO | Brazil | BRL | 4,44% | Monthly | 18 | 40 | 58 | — | — | — | — | — | — |
Foreign | Enel Distribución Sao Paulo | Brazil | Foreign | LUIZ ROBERTO GIL CONSULTORIA | Brazil | BRL | 6,66% | Monthly | 9 | 16 | 25 | 23 | 23 | — | — | — | 46 |
Foreign | Enel Distribución Sao Paulo | Brazil | Foreign | RECOLOR MERCANTIL LTDA | Brazil | BRL | 5,37% | Monthly | 18 | 41 | 59 | 28 | — | — | — | — | 28 |
Foreign | Enel Distribución Sao Paulo | Brazil | Foreign | FADL IBRAHIM MADJOUB / WADAD ABDUL MANDJOUB | Brazil | BRL | 5,83% | Monthly | 13 | 29 | 42 | 40 | 3 | — | — | — | 43 |
Foreign | Enel Distribución Sao Paulo | Brazil | Foreign | ROGERIO PEREIRA DA SILVA / SIMONE DA SILVA | Brazil | BRL | 5,83% | Monthly | 11 | 22 | 33 | 31 | — | — | — | — | 31 |
Foreign | Enel Distribución Sao Paulo | Brazil | Foreign | CONSTRUTORA AVILA DE AZEVEDO EIRELI | Brazil | BRL | 5,28% | Monthly | 3 | 7 | 10 | 6 | — | — | — | — | 6 |
Foreign | Enel Distribución Sao Paulo | Brazil | Foreign | FABIO HIROYUKI OGAWA / MÔNICA HITOMI KONDO | Brazil | BRL | 3,33% | Monthly | 3 | 2 | 5 | — | — | — | — | — | — |
Foreign | Enel Distribución Sao Paulo | Brazil | Foreign | SERGIO PEREIRA LEITE | Brazil | BRL | 9,34% | Monthly | 3 | 3 | 6 | — | — | — | — | — | — |
Foreign | Enel Distribución Sao Paulo | Brazil | Foreign | JOSÉ CARLOS RIBEIRO / ANA CLÁUDIA LAPORTE RIBEIRO | Brazil | BRL | 4,92% | Monthly | 1 | 3 | 4 | 3 | — | — | — | — | 3 |
Foreign | Enel Distribución Sao Paulo | Brazil | Foreign | M.O. INCORPORAÇÕES & PARTICIPAÇÕES LTDA. | Brazil | BRL | 5,28% | Monthly | 1 | 3 | 4 | 2 | — | — | — | — | 2 |
Foreign | Enel Distribución Sao Paulo | Brazil | Foreign | EMILIANA RIBEIRO / SUZANA APARECIDA RIBEIRO / VICTOR JESUS RIBEIRO / JOSEPH AUGUSTO RIBEIRO | Brazil | BRL | 3,33% | Monthly | 3 | 2 | 5 | — | — | — | — | — | — |
Foreign | Enel Distribución Sao Paulo | Brazil | Foreign | LOURIVAL ASSUNÇÃO DE ABREU | Brazil | BRL | 5,28% | Monthly | 2 | 5 | 7 | 5 | — | — | — | — | 5 |
Foreign | Enel Distribución Sao Paulo | Brazil | Foreign | DHL LOGISTICS LTDA | Brazil | BRL | 10,32% | Monthly | 85 | 183 | 268 | 266 | 242 | — | — | — | 508 |
Foreign | Enel Distribución Sao Paulo | Brazil | Foreign | JSL LOCAÇÕES LTDA | Brazil | BRL | 8,97% | Monthly | 6 | — | 6 | — | — | — | — | — | — |
Foreign | Enel Distribución Sao Paulo | Brazil | Foreign | CSC COMPUTER SCIENCES BRASIL S.A. | Brazil | BRL | 8,97% | Monthly | 28 | — | 28 | — | — | — | — | — | — |
Foreign | Enel Distribución Sao Paulo | Brazil | Foreign | DIRCE GONÇALVES GOMES | Brazil | BRL | 7,41% | Monthly | 10 | 20 | 30 | 28 | 30 | 18 | — | — | 76 |
Foreign | Enel Distribución Sao Paulo | Brazil | Foreign | FRANCISCO FREXOSO SALAZAR | Brazil | BRL | 7,41% | Monthly | 7 | 12 | 19 | 17 | 18 | 11 | — | — | 46 |
Foreign | Enel Distribución Sao Paulo | Brazil | Foreign | DARCIO ANTONIO LEARDINI / RITA DE CASSIA PONTIERI LEARDINI / VINICIUS LEARDINI / PATRICIA LEARDINI SOUZA / MURILO LEARDINI | Brazil | BRL | 7,35% | Monthly | 7 | 13 | 20 | 19 | 20 | 11 | — | — | 50 |
Foreign | Enel Distribución Sao Paulo | Brazil | Foreign | JOSÉ HENRIQUE DOS SANTOS SOUSA / JOSÉ ANTUNES GOMES DE SOUSA | Brazil | BRL | 6,93% | Monthly | 1 | 3 | 4 | 4 | 4 | 1 | — | — | 9 |
Foreign | Enel Distribución Sao Paulo | Brazil | Foreign | MARIA ANGELA RODRIGUES LODO MOTA | Brazil | BRL | 7,35% | Monthly | 1 | 2 | 3 | 3 | 3 | 2 | — | — | 8 |
Foreign | Enel Distribución Sao Paulo | Brazil | Foreign | HONÓRIO PEREIRA DOMINGUES | Brazil | BRL | 7,41% | Monthly | 1 | 2 | 3 | 3 | 3 | 2 | — | — | 8 |
Foreign | Enel Distribución Sao Paulo | Brazil | Foreign | EDNEIA DE SOUZA SOARES | Brazil | BRL | 7,41% | Monthly | 1 | 2 | 3 | 3 | 3 | 1 | — | — | 7 |
Foreign | Enel Distribución Sao Paulo | Brazil | Foreign | MADALENA OLIVEIRA DA SILVA / RENAN OLIVEIRA SILVA / SULIVAN OLIVEIRA SILVA | Brazil | BRL | 7,35% | Monthly | 1 | 2 | 3 | 4 | 4 | 2 | — | — | 10 |
Foreign | Enel Distribución Sao Paulo | Brazil | Foreign | ADAQUIR PRISCO | Brazil | BRL | 7,82% | Monthly | 2 | 3 | 5 | 5 | 5 | 3 | — | — | 13 |
Foreign | Enel Distribución Sao Paulo | Brazil | Foreign | NEWTON PEREIRA DA SILVA | Brazil | BRL | 6,93% | Monthly | 2 | 5 | 7 | 7 | 7 | 2 | — | — | 16 |
Foreign | Enel Distribución Sao Paulo | Brazil | Foreign | DALMAS PARTICIPAÇÕES LTDA. | Brazil | BRL | 8,02% | Monthly | 5 | 9 | 14 | 13 | 14 | 9 | — | — | 36 |
Foreign | Enel Distribución Sao Paulo | Brazil | Foreign | ACG PROJETOS & DECORAÇÕES LTDA | Brazil | BRL | 11,25% | Monthly | 3 | 6 | 9 | 8 | 9 | 7 | — | — | 24 |
Foreign | Enel Distribución Sao Paulo | Brazil | Foreign | ADA MARIA VASONE / OLGA MARIA VASONE DE CASTRO CONDE / PATRICIA MARIA VASONE SPINGOLA / ARMANDO VASONE FILHO | Brazil | BRL | 7,82% | Monthly | 9 | 18 | 27 | 26 | 28 | 2 | — | — | 56 |
Foreign | Enel Distribución Sao Paulo | Brazil | Foreign | FUNDAÇÃO PADRE ANCHIETA - CENTRO PAULISTA DE RÁDIO TV EDUCATIVAS | Brazil | BRL | 7,82% | Monthly | 121 | 127 | 248 | 181 | 162 | — | — | — | 343 |
Foreign | Enel Distribución Sao Paulo | Brazil | Foreign | RUJO CONSTRUÇÕES E EMPREENDIMENTOS IMOBILIÁRIOS LTDA | Brazil | BRL | 7,41% | Monthly | 11 | 22 | 33 | 32 | 34 | 18 | — | — | 84 |
Foreign | Enel Distribución Sao Paulo | Brazil | Foreign | TIVIT TERCEIRIZAÇÃO DE PROCESSOS, SERVIÇOS E TECNOLOGIA S.A. | Brazil | BRL | 8,93% | Monthly | 776 | — | 776 | — | — | — | — | — | — |
Foreign | Enel Distribución Sao Paulo | Brazil | Foreign | FUNDAÇÃO COELCE DE SEGURIDADE SOCIAL - FAELCE | Brazil | BRL | 2,42% | Monthly | 527 | — | 527 | — | — | — | — | — | — |
Foreign | Enel Distribución Sao Paulo | Brazil | Foreign | FUNDAÇÃO AMPLA DE SEGURIDADE SOCIAL - BRASILETROS | Brazil | BRL | 5,83% | Monthly | 85 | 189 | 274 | 153 | — | — | — | — | 153 |
Foreign | Enel Distribución Sao Paulo | Brazil | Foreign | ITAPOAM ADMINISTRADORA DE BENS LTDA | Brazil | BRL | 9,87% | Monthly | 67 | 86 | 153 | 124 | 137 | 151 | 138 | — | 550 |
Foreign | Enel Distribución Sao Paulo | Brazil | Foreign | JSL | Brazil | BRL | 9,45% | Monthly | 1,228 | 1,641 | 2,869 | 2,368 | 2,592 | 2,836 | 3,104 | 3,207 | 14,107 |
Foreign | Enel Distribución Sao Paulo | Brazil | Foreign | MAESTRO | Brazil | BRL | 7,28% | Monthly | 133 | 413 | 546 | 586 | 309 | — | — | — | 895 |
Foreign | Enel Distribución Sao Paulo | Brazil | Foreign | VAMOS | Brazil | BRL | 7,28% | Monthly | 202 | 629 | 831 | 892 | 311 | — | — | — | 1,203 |
Foreign | Enel Distribución Sao Paulo | Brazil | Foreign | DHL | Brazil | BRL | 13,39% | Monthly | 69 | 294 | 363 | 252 | 305 | — | — | — | 557 |
Foreign | Enel Distribución Sao Paulo | Brazil | Foreign | AGASUS | Brazil | BRL | 6,57% | Monthly | 505 | 902 | 1,407 | 520 | — | — | — | — | 520 |
Foreign | Enel Generación Perú S.A. | Peru | Foreign | BBVA | Peru | US$ | 2,81% | Quarterly | 2,233 | 4,529 | 6,762 | — | — | — | — | — | — |
Foreign | Enel Generación Perú S.A. | Peru | Foreign | BBVA | Peru | PEN | 1,59% | Quarterly | — | 45 | 45 | 181 | 45 | — | — | — | 226 |
Foreign | Enel Generación Perú S.A. | Peru | Foreign | RENTAEQUIPOS LEASING PERU S.A. | Peru | US$ | 4,12% | Monthly | 3 | 3 | 6 | — | — | — | — | — | — |
Foreign | Enel Generación Perú S.A. | Peru | Foreign | ELIAS MARCELO LAOS HUAMAN | Peru | US$ | 2,23% | Quarterly | 6 | 14 | 20 | — | — | — | — | — | — |
Foreign | Enel Generación Perú S.A. | Peru | Foreign | RENTING S.A.C. | Peru | PEN | 5,45% | Monthly | 2 | 3 | 5 | — | — | — | — | — | — |
Foreign | Enel Generación Perú S.A. | Peru | Foreign | RENTAEQUIPOS LEASING PERU S.A. | Peru | US$ | 4,51% | Monthly | 7 | 21 | 28 | 26 | — | — | — | — | 26 |
Foreign | Enel Generación Perú S.A. | Peru | Foreign | RENTAEQUIPOS LEASING PERU S.A. | Peru | US$ | 2,23% | Monthly | — | 362 | 362 | 802 | 802 | 802 | 802 | 3,674 | 6,882 |
Foreign | EGP Cachoeira Dourada S.A. | Brazil | Foreign | FUNDAÇÃO AMPLA DE SEGURIDADE SOCIAL - BRASILETROS | Brazil | BRL | 12,42% | Monthly | 12 | 36 | 48 | 31 | — | — | — | — | 31 |
Foreign | ENEL BRASIL S.A. | Brazil | Foreign | FUNDAÇÃO AMPLA DE SEGURIDADE SOCIAL - BRASILETROS | Brazil | BRL | 10,93% | Monthly | 9 | 27 | 36 | 22 | — | — | — | — | 22 |
Foreign | ENEL X BRASIL | Brazil | Foreign | FUNDAÇÃO AMPLA DE SEGURIDADE SOCIAL - BRASILETROS | Brazil | BRL | 12,42% | Monthly | 15 | 46 | 61 | 38 | — | — | — | — | 38 |
Foreign | ENEL X BRASIL | Brazil | Foreign | VINICOLA DO VALE DO SÃO FRANCISCO | Brazil | EUR | 9,31% | Monthly | 15 | 2 | 17 | 3 | 4 | 4 | 4 | 371 | 386 |
Foreign | ENEL X BRASIL | Brazil | Foreign | BM LOGÍSTICA S.A. | Brazil | BRL | 5,94% | Monthly | 10 | 5 | 15 | — | — | — | — | — | — |
Foreign | ENEL X BRASIL | Brazil | Foreign | VINICOLA DO VALE DO SÃO FRANCISCO | Brazil | BRL | 13,11% | Monthly | 38 | — | 38 | — | — | — | — | 138 | 138 |
Foreign | ENEL X BRASIL | Brazil | Foreign | LM TRANSPORTES INTERESTADUAIS SERVIÇOS E COMÉRCIO S.A. | Brazil | BRL | 6,23% | Monthly | — | — | — | 3 | 3 | — | — | 2 | 8 |
Foreign | ENEL X BRASIL | Brazil | Foreign | LOCALIZA RENT A CAR | Brazil | BRL | 7,41% | Monthly | — | — | — | — | — | — | — | 6 | 6 |
Foreign | Enel Distribución Ceará S.A. | Brazil | Foreign | INTER EMPRENDIMENTOS IMOBILIARIOS L | Brazil | BRL | 4,76% | Monthly | 4 | 11 | 15 | 6 | — | — | — | — | 6 |
Foreign | Enel Distribución Ceará S.A. | Brazil | Foreign | GABRIELA DA SILVA BRAGA | Brazil | BRL | 2,42% | Monthly | 3 | 1 | 4 | — | — | — | — | — | — |
Foreign | Enel Distribución Ceará S.A. | Brazil | Foreign | MAIANA DE FÁTIMA BEZERRA PINHEIRO | Brazil | BRL | 2,42% | Monthly | 4 | 1 | 5 | — | — | — | — | — | — |
Foreign | Enel Distribución Ceará S.A. | Brazil | Foreign | SJ ADMINISTRAÇÃO DE IMÓVEIS | Brazil | BRL | 9,67% | Monthly | 1 | — | 1 | — | — | — | — | — | — |
Foreign | Enel Distribución Ceará S.A. | Brazil | Foreign | VALTER FURTADO ADVOGADOS ASSOCIADOS | Brazil | BRL | 7,41% | Monthly | 2 | 6 | 8 | 9 | 2 | — | — | — | 11 |
Foreign | Enel Distribución Ceará S.A. | Brazil | Foreign | CARLOS NILBERTO LIMA VENANCIO | Brazil | BRL | 10,01% | Monthly | 1 | 3 | 4 | — | — | — | — | — | — |
F-121
| | | | | | | | | | | | | | | | | |
|---|---|---|---|---|---|---|---|---|---|---|---|---|---|---|---|---|---|
| | | | | | | | | December 31, 2020 | ||||||||
| | | | | | | | | Current | Non-Current | |||||||
Taxpayer | | | Taxpayer | | | | Nominal | Maturity | Less than | More than | Total | One to two | Two to | Three to | Four to | More than | Total Non- |
ID No. | Company | Country | ID No. | Company | Country | Currency | Rate | | ThUS$ | ThUS$ | ThUS$ | ThUS$ | ThUS$ | ThUS$ | ThUS$ | ThUS$ | ThUS$ |
Foreign | Enel Distribución Ceará S.A. | Brazil | Foreign | FUNDAÇÃO COELCE DE SEGURIDADE SOCIAL - FAELCE | Brazil | BRL | 3,47% | Monthly | 45 | — | 45 | — | — | — | — | — | — |
Foreign | Enel Distribución Ceará S.A. | Brazil | Foreign | FUNDAÇÃO AMPLA DE SEGURIDADE SOCIAL - BRASILETROS | Brazil | BRL | 10,93% | Monthly | 29 | 86 | 115 | 72 | — | — | — | — | 72 |
Foreign | Enel Distribución Ceará S.A. | Brazil | Foreign | UNIMÓVEIS | Brazil | BRL | 10,01% | Monthly | 4 | 1 | 5 | — | — | — | — | — | — |
Foreign | Enel Distribución Ceará S.A. | Brazil | Foreign | ELUÍSIO SOARES DA SILVA | Brazil | BRL | 10,01% | Monthly | — | 1 | 1 | — | — | — | — | — | — |
Foreign | Enel Distribución Ceará S.A. | Brazil | Foreign | FRANCISCO FELIPE DE SOUSA | Brazil | BRL | 8,01% | Monthly | 1 | 2 | 3 | 3 | 3 | 3 | 2 | — | 11 |
Foreign | Enel Distribución Ceará S.A. | Brazil | Foreign | F OLIVEIRA CORRETOR | Brazil | BRL | 6,93% | Monthly | 2 | 6 | 8 | 8 | 8 | 3 | — | — | 19 |
Foreign | Enel Distribución Ceará S.A. | Brazil | Foreign | FRANCISCO DE ASSIS ROCHA RODRIGUES | Brazil | BRL | 6,93% | Monthly | 2 | 6 | 8 | 8 | 9 | 1 | — | — | 18 |
Foreign | Enel Distribución Ceará S.A. | Brazil | Foreign | MADELINE CORDEIRO CAVALCANTE | Brazil | BRL | 8,31% | Monthly | 1 | 2 | 3 | 3 | 3 | 4 | 4 | 12 | 26 |
Foreign | Enel Distribución Ceará S.A. | Brazil | Foreign | MARIA OTACIANA NOGUEIRA CASTRO | Brazil | BRL | 5,83% | Monthly | 1 | 3 | 4 | 2 | — | — | — | — | 2 |
Foreign | Enel Distribución Ceará S.A. | Brazil | Foreign | MARIA DAS GRACAS TIMBO D MARTINS | Brazil | BRL | 7,75% | Monthly | 1 | 1 | 2 | 1 | 1 | 2 | 2 | 13 | 19 |
Foreign | Enel Distribución Ceará S.A. | Brazil | Foreign | FRANCISCO CANUTO LINS | Brazil | BRL | 12,51% | Monthly | 1 | 3 | 4 | 4 | 4 | 5 | 6 | 11 | 30 |
Foreign | Enel Distribución Ceará S.A. | Brazil | Foreign | LUIZA MARTINS CAVALCANTI | Brazil | BRL | 6,48% | Monthly | 1 | 2 | 3 | 2 | — | — | — | — | 2 |
Foreign | Enel Distribución Ceará S.A. | Brazil | Foreign | S.M. ALVES MOURA-ME | Brazil | BRL | 5,91% | Monthly | 1 | 4 | 5 | 4 | — | — | — | — | 4 |
Foreign | Enel Distribución Ceará S.A. | Brazil | Foreign | BERTRANS BERTOTTI TRANSPORTES DE CARGAS SECAS | Brazil | BRL | 4,44% | Monthly | 171 | 85 | 256 | — | — | — | — | — | — |
Foreign | Enel Distribución Ceará S.A. | Brazil | Foreign | CLAUDIO SEBASTIÃO DE LIMA | Brazil | BRL | 5,37% | Monthly | 1 | 2 | 3 | — | — | — | — | — | — |
Foreign | Enel Distribución Ceará S.A. | Brazil | Foreign | SOLI EMPREENDIMENTOS E CONSTRUÇÕES LTDA | Brazil | BRL | 5,83% | Monthly | 38 | 22 | 60 | 28 | — | — | — | — | 28 |
Foreign | Enel Distribución Ceará S.A. | Brazil | Foreign | EXPEDITO ARAGÃO PONTES | Brazil | BRL | 6,78% | Monthly | 1 | 3 | 4 | 4 | 2 | — | — | — | 6 |
Foreign | Enel Cien S.A. | Brazil | Foreign | FUNDAÇÃO COELCE DE SEGURIDADE SOCIAL - FAELCE | Brazil | BRL | 4,66% | Monthly | 13 | — | 13 | — | — | — | — | — | — |
Foreign | Enel Cien S.A. | Brazil | Foreign | FUNDAÇÃO AMPLA DE SEGURIDADE SOCIAL - BRASILETROS | Brazil | BRL | 12,42% | Monthly | 3 | 8 | 11 | 7 | — | — | — | — | 7 |
Foreign | Enel Cien S.A. | Brazil | Foreign | ELETROSUL CENTRAIS ELETRICAS S.A. | Brazil | BRL | 6,50% | Monthly | 11 | 5 | 16 | 4 | — | — | — | — | 4 |
Foreign | Enel Distribución Río S.A. | Brazil | Foreign | VINÍCIUS ANJOS DE SOUZA | Brazil | BRL | 8,55% | Monthly | 6 | 15 | 21 | 22 | 24 | 26 | 28 | 30 | 130 |
Foreign | Enel Distribución Río S.A. | Brazil | Foreign | MAURÍCIO MANHÃE DE LIMA | Brazil | BRL | 5,30% | Monthly | 10 | 24 | 34 | — | — | — | — | — | — |
Foreign | Enel Distribución Río S.A. | Brazil | Foreign | MOACYR JOSÉ DA CRUZ | Brazil | BRL | 5,34% | Monthly | 24 | 16 | 40 | — | — | — | — | — | — |
Foreign | Enel Distribución Río S.A. | Brazil | Foreign | PAULO ALBERTO SILVA DE ANDRADE | Brazil | BRL | 10,01% | Monthly | 4 | 13 | 17 | 4 | — | — | — | — | 4 |
Foreign | Enel Distribución Río S.A. | Brazil | Foreign | JOSÉ CLAUDIO MACHADO | Brazil | BRL | 9,89% | Monthly | 1 | 3 | 4 | 2 | — | — | — | — | 2 |
Foreign | Enel Distribución Río S.A. | Brazil | Foreign | OLIVER DA SILVA BARRETO | Brazil | BRL | 9,67% | Monthly | 1 | — | 1 | — | — | — | — | — | — |
Foreign | Enel Distribución Río S.A. | Brazil | Foreign | MAURO JOSÉ RODRIGUES FELGA | Brazil | BRL | 11,78% | Monthly | 4 | 9 | 13 | 13 | 14 | 16 | 18 | 20 | 81 |
Foreign | Enel Distribución Río S.A. | Brazil | Foreign | FUNDAÇÃO COELCE DE SEGURIDADE SOCIAL - FAELCE | Brazil | BRL | 3,47% | Monthly | 140 | — | 140 | — | — | — | — | — | — |
Foreign | Enel Distribución Río S.A. | Brazil | Foreign | FUNDAÇÃO AMPLA DE SEGURIDADE SOCIAL - BRASILETROS | Brazil | BRL | 10,93% | Monthly | 167 | 498 | 665 | 415 | — | — | — | — | 415 |
Foreign | Enel Distribución Río S.A. | Brazil | Foreign | MARILENE DAFLON JAPOR TORRES | Brazil | BRL | 4,76% | Monthly | 2 | 7 | 9 | 3 | — | — | — | — | 3 |
Foreign | Enel Distribución Río S.A. | Brazil | Foreign | FUNDO DE INVESTIMENTO IMOBILIÁRIO PATRIMONIAL III | Brazil | BRL | 8,54% | Monthly | 1,851 | — | 1,851 | 717 | 778 | 844 | 919 | 1,022 | 4,280 |
Foreign | Enel Distribución Río S.A. | Brazil | Foreign | LIGIA RIBEIRO GARCIA DE REZENDE | Brazil | BRL | 10,32% | Monthly | 1 | 2 | 3 | 3 | 2 | — | — | — | 5 |
Foreign | Enel Distribución Río S.A. | Brazil | Foreign | LUIZ ANTONIO SIQUEIRA GONÇALVES | Brazil | BRL | 10,01% | Monthly | 4 | 5 | 9 | — | — | — | — | — | — |
Foreign | Enel Distribución Río S.A. | Brazil | Foreign | CONSÓRCIO GDA SERVIÇOS DE TRANSPOR | Brazil | BRL | 8,97% | Monthly | 7 | — | 7 | — | — | — | — | — | — |
Foreign | Enel Distribución Río S.A. | Brazil | Foreign | JOSUÉ COUTO DE OLIVEIRA | Brazil | BRL | 7,11% | Monthly | 1 | 2 | 3 | — | — | — | — | — | — |
Foreign | Enel Distribución Río S.A. | Brazil | Foreign | ALOYSIO DOS SANTOS ERTHAL | Brazil | BRL | 7,30% | Monthly | 1 | 1 | 2 | 2 | 2 | 1 | — | — | 5 |
Foreign | Enel Distribución Río S.A. | Brazil | Foreign | MIGUEL GUERREIRO MARTINS | Brazil | BRL | 6,30% | Monthly | 1 | 4 | 5 | 1 | — | — | — | — | 1 |
Foreign | Enel Distribución Río S.A. | Brazil | Foreign | NITERÓI EMPRESA DE LAZER E TURISMO S/A | Brazil | BRL | 12,94% | Monthly | 15 | 2 | 17 | 3 | 3 | 3 | 4 | 22 | 35 |
Foreign | Enel Distribución Río S.A. | Brazil | Foreign | LEONARDO CAMPOS | Brazil | BRL | 10,32% | Monthly | 1 | 3 | 4 | 5 | 5 | — | — | — | 10 |
Foreign | Enel Distribución Río S.A. | Brazil | Foreign | JOÃO LOPES MEZAVILLA JUNIOR | Brazil | BRL | 9,44% | Monthly | 10 | 3 | 13 | 4 | 4 | 5 | 5 | 11 | 29 |
Foreign | Enel Distribución Río S.A. | Brazil | Foreign | ALICE ALT BITTENCOURT | Brazil | BRL | 9,89% | Monthly | 11 | 6 | 17 | 6 | — | — | — | — | 6 |
Foreign | Enel Distribución Río S.A. | Brazil | Foreign | JOÃO COELHO DE ALENCAR | Brazil | BRL | 9,44% | Monthly | 4 | 9 | 13 | 12 | 14 | 15 | 16 | 37 | 94 |
Foreign | Enel Distribución Río S.A. | Brazil | Foreign | ISIDRO DA SILVA FERREIRA | Brazil | BRL | 10,88% | Monthly | 1 | 3 | 4 | 4 | 4 | 5 | 6 | 17 | 36 |
Foreign | Enel Distribución Río S.A. | Brazil | Foreign | JOSÉ MARTINS FILHO | Brazil | BRL | 8,55% | Monthly | — | 1 | 1 | 2 | 2 | 2 | — | — | 6 |
Foreign | Enel Distribución Goias S.A. | Brazil | Foreign | AGNOS COMÉRCIO DE PARAF. LTDA | Brazil | BRL | 4,97% | Monthly | 2 | 1 | 3 | — | — | — | — | — | — |
Foreign | Enel Distribución Goias S.A. | Brazil | Foreign | LUSIA GOMES JESUS | Brazil | BRL | 4,66% | Monthly | 1 | — | 1 | — | — | — | — | — | — |
Foreign | Enel Distribución Goias S.A. | Brazil | Foreign | FUNDAÇÃO COELCE DE SEGURIDADE SOCIAL - FAELCE | Brazil | BRL | 4,66% | Monthly | 113 | — | 113 | — | — | — | — | — | — |
Foreign | Enel Distribución Goias S.A. | Brazil | Foreign | FUNDAÇÃO AMPLA DE SEGURIDADE SOCIAL - BRASILETROS | Brazil | BRL | 5,73% | Monthly | 27 | 81 | 108 | 65 | — | — | — | — | 65 |
Foreign | Enel Distribución Goias S.A. | Brazil | Foreign | ITA EMPRESA DE TRANSPORTES LTDA | Brazil | BRL | 8,93% | Monthly | 587 | 167 | 754 | — | — | — | — | — | — |
Foreign | Enel Distribución Goias S.A. | Brazil | Foreign | ITA EMPRESA DE TRANSPORTES LTDA | Brazil | BRL | 5,81% | Monthly | 102 | — | 102 | — | — | — | — | — | — |
Foreign | Enel Distribución Goias S.A. | Brazil | Foreign | RAMES ABRAHÃO BASÍLIO | Brazil | BRL | 6,08% | Monthly | 19 | — | 19 | — | — | — | — | — | — |
Foreign | Enel Distribución Goias S.A. | Brazil | Foreign | ANTÔNIO FRANCISCO DE MIRANDA | Brazil | BRL | 9,10% | Monthly | 1 | 2 | 3 | 4 | 4 | 2 | — | — | 10 |
Foreign | Enel Distribución Goias S.A. | Brazil | Foreign | ANTÔNIO SERGIO MACHADO | Brazil | BRL | 8,86% | Monthly | 1 | 2 | 3 | 2 | 3 | 1 | — | — | 6 |
Foreign | Enel Distribución Goias S.A. | Brazil | Foreign | SANT'ANA DINIZ & MOURA AGORPECUÁRIA LTDA. | Brazil | BRL | 9,34% | Monthly | 13 | — | 13 | — | — | — | — | — | — |
Foreign | Enel Distribución Goias S.A. | Brazil | Foreign | NERCI BERNARDO DA COSTA | Brazil | BRL | 9,10% | Monthly | 1 | 3 | 4 | 4 | 5 | — | — | — | 9 |
Foreign | Enel Distribución Goias S.A. | Brazil | Foreign | JOÃO FRANCISCO DOURADO | Brazil | BRL | 11,25% | Monthly | 1 | 3 | 4 | 4 | 4 | — | — | — | 8 |
Foreign | Enel Distribución Goias S.A. | Brazil | Foreign | FLÁVIO DE OLIVEIRA BRAGA | Brazil | BRL | 8,01% | Monthly | 1 | 5 | 6 | 7 | 8 | 8 | — | — | 23 |
Foreign | Enel Distribución Goias S.A. | Brazil | Foreign | EDIVALDO GODOI DA SILVA | Brazil | BRL | 7,30% | Monthly | 1 | 2 | 3 | 3 | 3 | 3 | — | — | 9 |
Foreign | Enel Distribución Goias S.A. | Brazil | Foreign | ADAIR DEODORO SILVA | Brazil | BRL | 8,01% | Monthly | 1 | 3 | 4 | 5 | 5 | 5 | — | — | 15 |
Foreign | Enel Distribución Goias S.A. | Brazil | Foreign | SELSSI GUEDES DOURADO | Brazil | BRL | 9,84% | Monthly | 1 | 2 | 3 | 3 | 3 | 3 | 1 | — | 10 |
Foreign | Enel Distribución Goias S.A. | Brazil | Foreign | ANA MARIA IANNACONI BORGES | Brazil | BRL | 9,84% | Monthly | 4 | 4 | 8 | 6 | 6 | 7 | 2 | — | 21 |
Foreign | Enel Distribución Goias S.A. | Brazil | Foreign | TEREZINHA DO CARMOS DE JESUS | Brazil | BRL | 9,84% | Monthly | 1 | 2 | 3 | 3 | 3 | 4 | — | — | 10 |
Foreign | Enel Generación Fortaleza | Brazil | Foreign | FUNDAÇÃO AMPLA DE SEGURIDADE SOCIAL - BRASILETROS | Brazil | BRL | 12,42% | Monthly | 11 | 34 | 45 | 29 | — | — | — | — | 29 |
Foreign | EDESUR | Argentina | Foreign | SOCIEDAD DE HECHO ENTRE DEL TORO LEONARDO Y DEL TORO DOMINGO | Argentina | ARS | 0,62% | Monthly | — | 78 | 78 | 45 | — | — | — | — | 45 |
Foreign | Enel Green Power Volta Grande | Brazil | Foreign | FUNDAÇÃO COELCE DE SEGURIDADE SOCIAL - FAELCE | Brazil | BRL | 6,50% | Monthly | 1 | 1 | 2 | — | — | — | — | — | — |
Foreign | Enel Green Power Volta Grande | Brazil | Foreign | FUNDAÇÃO AMPLA DE SEGURIDADE SOCIAL - BRASILETROS | Brazil | BRL | 7,67% | Monthly | 1 | 2 | 3 | 11 | 1 | — | — | — | 12 |
94.271.000-3 | Enel Américas S.A. | Chile | 96.800.570-7 | COMPAÑIA DE LEASING TATTERSALL S A. | Chile | UF | 0,01% | Monthly | 11 | 8 | 19 | — | — | — | — | — | — |
Total | | 17,959 | 33,536 | 51,495 | 27,969 | 12,935 | 9,573 | 9,726 | 30,867 | 91,070 | |||||||
F-122
21.1 Individualization of Lease Liabilities, continued
| | | | | | | | | | | | | | | | | |
|---|---|---|---|---|---|---|---|---|---|---|---|---|---|---|---|---|---|
| | | | | | | | | December 31, 2019 | ||||||||
| | | | | | | | | Current | Non-Current | |||||||
Taxpayer | | | Taxpayer | | | | Nominal | | Less than | More than | Total | One to two | Two to | Three to | Four to | More than | Total Non- |
ID No. | Company | Country | ID No. | Company | Country | Currency | Rate | | ThUS$ | ThUS$ | ThUS$ | ThUS$ | ThUS$ | ThUS$ | ThUS$ | ThUS$ | ThUS$ |
Foreign | Codensa | Colombia | Foreign | INVERSIONES Y CONSTRUCCIONES 79 SAS (PAGADOR ALTERNO: FIDUBOGOTÁ GE) | Colombia | COP | 7.44% | Monthly | 118 | 356 | 474 | — | — | — | — | — | — |
Foreign | Codensa | Colombia | Foreign | INVERSIONES Y CONSTRUCCIONES 79 SAS (PAGADOR ALTERNO: FIDUBOGOTÁ GE) | Colombia | COP | 7.44% | Monthly | 35 | 105 | 140 | — | — | — | — | — | — |
Foreign | Codensa | Colombia | Foreign | ANA MARIA RESTREPO PEREA (33,33%) | Colombia | COP | 7.44% | Monthly | 19 | 56 | 75 | 2 | — | — | — | — | 2 |
Foreign | Codensa | Colombia | Foreign | MARIA VICTORIA RESTREPO DE MARTINEZ (33,33%) | Colombia | COP | 7.44% | Monthly | 19 | 56 | 75 | 2 | — | — | — | — | 2 |
Foreign | Codensa | Colombia | Foreign | LONDONO DE ARENAS MARIA DEL PILAR (25%) | Colombia | COP | 7.44% | Monthly | 14 | 42 | 56 | 2 | — | — | — | — | 2 |
Foreign | Codensa | Colombia | Foreign | MARTINEZ ISAACS ROBERTO EDUARDO (8,34%) | Colombia | COP | 7.44% | Monthly | 5 | 14 | 19 | 1 | — | — | — | — | 1 |
Foreign | Codensa | Colombia | Foreign | PATRIMONIOS AUTONOMOS FIDUCIARIA BOGOTA | Colombia | COP | 7.39% | Monthly | 102 | 171 | 273 | — | — | — | — | — | — |
Foreign | Codensa | Colombia | Foreign | CASTRO OCHOA LUIS ANTONIO | Colombia | COP | 7.71% | Monthly | 15 | 60 | 75 | 62 | 49 | — | — | — | 111 |
Foreign | Codensa | Colombia | Foreign | SITUANDO LTDA | Colombia | COP | 7.56% | Monthly | 35 | 114 | 149 | 84 | — | — | — | — | 84 |
Foreign | Codensa | Colombia | Foreign | JULIO ALBERTO FLECHAS VEGA | Colombia | COP | 7.44% | Monthly | 7 | 21 | 28 | — | — | — | — | — | — |
Foreign | Codensa | Colombia | Foreign | PAEZ RUIZ Y ASOCIADOS LTDA | Colombia | COP | 7.60% | Monthly | 14 | 50 | 64 | 52 | — | — | — | — | 52 |
Foreign | Codensa | Colombia | Foreign | ACCI S.A.S | Colombia | COP | 7.99% | Monthly | 40 | 190 | 230 | 151 | 163 | 176 | 53 | — | 543 |
Foreign | Codensa | Colombia | Foreign | SITUANDO LTDA | Colombia | COP | 7.40% | Monthly | 31 | 62 | 93 | — | — | — | — | — | — |
Foreign | Codensa | Colombia | Foreign | CONSTRUCCIONES E INVERSIONES AMC S.A. | Colombia | COP | 7.80% | Monthly | 12 | 50 | 62 | 48 | 52 | 14 | — | — | 114 |
Foreign | Codensa | Colombia | Foreign | CANALES ANDRADE Y CIA SAS | Colombia | COP | 7.57% | Monthly | 25 | 83 | 108 | 68 | — | — | — | — | 68 |
Foreign | Codensa | Colombia | Foreign | MERCURIO CENTRO COMERCIAL | Colombia | COP | 7.57% | Monthly | 1 | 4 | 5 | 3 | — | — | — | — | 3 |
Foreign | Codensa | Colombia | Foreign | PATRIMONIOS AUTONOMOS FIDUCIARIA BOGOTA | Colombia | COP | 7.93% | Monthly | 112 | 510 | 622 | 431 | 465 | 502 | — | — | 1,398 |
Foreign | Codensa | Colombia | Foreign | MUNOZ HERMANOS FYN Y COMPANIA SAS | Colombia | COP | 7.87% | Monthly | 6 | 27 | 33 | 24 | 44 | — | — | — | 68 |
Foreign | Codensa | Colombia | Foreign | MUNOZ HERMANOS FYN Y COMPANIA SAS | Colombia | COP | 7.87% | Monthly | 6 | 26 | 32 | 23 | 42 | — | — | — | 65 |
Foreign | Codensa | Colombia | Foreign | CALDWELL MANAGEMENT SAS | Colombia | COP | 7.56% | Monthly | 52 | 175 | 227 | 142 | — | — | — | — | 142 |
Foreign | Codensa | Colombia | Foreign | INTERCONEXIÓN ELÉCTRICA S.A. E.S.P. | Colombia | COP | 7.88% | Monthly | 15 | 170 | 185 | 25 | 27 | 29 | 32 | 860 | 973 |
Foreign | Codensa | Colombia | Foreign | MINISTERIO DEFENSA NAL EJERCITO NAC | Colombia | COP | 7.72% | Monthly | 12 | 91 | 103 | 49 | 39 | — | — | — | 88 |
Foreign | Codensa | Colombia | Foreign | NEARDENTAL S.A.S | Colombia | COP | 7.40% | Monthly | 9 | 14 | 23 | — | — | — | — | — | — |
Foreign | Codensa | Colombia | Foreign | AMERICAS BUSINESS PROCESS SERVICES S.A | Colombia | COP | 7.59% | Monthly | 9 | 30 | 39 | 28 | — | — | — | — | 28 |
Foreign | Codensa | Colombia | Foreign | AMERICAS BUSINESS PROCESS SERVICES S.A | Colombia | COP | 7.59% | Monthly | 23 | 77 | 100 | 74 | — | — | — | — | 74 |
Foreign | Codensa | Colombia | Foreign | TRANSPORTES ESPECIALES FSG | Colombia | COP | 7.10% | Monthly | 6 | 17 | 23 | 23 | 3 | — | — | — | 26 |
Foreign | Codensa | Colombia | Foreign | EQUIRENT S.A. | Colombia | COP | 9.52% | Monthly | 11 | 19 | 30 | — | — | — | — | — | — |
Foreign | Codensa | Colombia | Foreign | MAREAUTO COLOMBIA SAS | Colombia | COP | 12.09% | Monthly | 223 | 672 | 895 | 92 | — | — | — | — | 92 |
Foreign | Codensa | Colombia | Foreign | TRANSPORTES ESPECIALES ALIADOS S.A.S | Colombia | COP | 12.50% | Monthly | 69 | 220 | 289 | 214 | — | — | — | — | 214 |
Foreign | Enel Distribución Perú S.A. | Peru | Foreign | BANCO INTERBANK | Peru | PEN | 6.24% | Quarterly | 642 | 1,954 | 2,596 | 2,692 | 2,857 | — | — | — | 5,549 |
Foreign | Enel Distribución Perú S.A. | Peru | Foreign | BANCO INTERBANK | Peru | PEN | 5.54% | Quarterly | 103 | 308 | 411 | 431 | 339 | 116 | — | — | 886 |
Foreign | Enel Distribución Perú S.A. | Peru | Foreign | BANCO CONTINENTAL | Peru | PEN | 4.37% | Quarterly | — | 4,932 | 4,932 | 6,801 | 7,085 | 3,650 | — | — | 17,536 |
Foreign | Enel Distribución Perú S.A. | Peru | Foreign | BUILDINGINMUEBLES PANAMERICANA S.A. | Peru | US$ | 5.19% | Monthly | 51 | 156 | 207 | 217 | 228 | 240 | 252 | 87 | 1,024 |
Foreign | Enel Distribución Perú S.A. | Peru | Foreign | BUILDINGMZ-INMOBILIARIA & DESARROLLADORA S.A. | Peru | US$ | 4.65% | Monthly | 10 | 29 | 39 | 10 | — | — | — | — | 10 |
Foreign | Enel Distribución Perú S.A. | Peru | Foreign | RENTAEQUIPOS LEASING PERU S.A. | Peru | US$ | 4.35% | Monthly | 16 | 26 | 42 | — | — | — | — | — | — |
Foreign | Enel Distribución Perú S.A. | Peru | Foreign | RENTAEQUIPOS LEASING PERU S.A. | Peru | US$ | 4.35% | Monthly | 7 | 4 | 11 | — | — | — | — | — | — |
Foreign | Enel Distribución Perú S.A. | Peru | Foreign | FM EDIFICACIONES | Peru | US$ | 5.05% | Monthly | 4 | 11 | 15 | 16 | 16 | 10 | — | — | 42 |
Foreign | Enel Distribución Perú S.A. | Peru | Foreign | RENTAEQUIPOS LEASING PERU S.A. | Peru | US$ | 4.70% | Monthly | 31 | 87 | 118 | 129 | 97 | — | — | — | 226 |
Foreign | Enel Generación Piura S.A. | Peru | Foreign | BANCO DE CREDITO DEL PERU | Peru | US$ | 5.68% | Quarterly | 1,981 | 18,315 | 20,296 | — | — | — | — | — | — |
Foreign | Enel Generación Piura S.A. | Peru | Foreign | BANCO DE CREDITO DEL PERU | Peru | PEN | 5.58% | Quarterly | 687 | 6,354 | 7,041 | — | — | — | — | — | — |
Foreign | Enel Generación Piura S.A. | Peru | Foreign | SCOTIABANK PERU | Peru | US$ | 3.70% | Quarterly | 2,427 | 7,181 | 9,608 | 9,574 | 2,394 | — | — | — | 11,968 |
Foreign | Enel Generación Piura S.A. | Peru | Foreign | BANCO DE CREDITO DEL PERU | Peru | US$ | 3.63% | Quarterly | 607 | 1,840 | 2,447 | 1,252 | — | — | — | — | 1,252 |
Foreign | Enel Generación Piura S.A. | Peru | Foreign | RENTING SAC | Peru | PEN | 7.57% | Monthly | 9 | 26 | 35 | 21 | — | — | — | — | 21 |
Foreign | Enel Generación Piura S.A. | Peru | Foreign | BBVA CONTINENTAL | Peru | US$ | 2.84% | Quarterly | 1 | — | 1 | 556 | 568 | — | — | — | 1,124 |
Foreign | Emgesa S.A. E.S.P. | Colombia | Foreign | EQUIRENT S.A. | Colombia | COP | 11.02% | Monthly | 5 | 10 | 15 | — | — | — | — | — | — |
Foreign | Emgesa S.A. E.S.P. | Colombia | Foreign | MAREAUTO COLOMBIA S.A.S | Colombia | COP | 11.02% | Monthly | 19 | 44 | 63 | 15 | — | — | — | — | 15 |
Foreign | Emgesa S.A. E.S.P. | Colombia | Foreign | JAIRO ALBERTO BAQUERO PRADA | Colombia | COP | 7.00% | Monthly | 10 | 22 | 32 | 25 | — | — | — | — | 25 |
Foreign | Emgesa S.A. E.S.P. | Colombia | Foreign | PATRIMONIOS AUTONOMOS FIDUCIARIA BOGOTA | Colombia | COP | 8.00% | Monthly | 52 | 162 | 214 | 230 | 249 | 268 | 118 | — | 865 |
Foreign | Emgesa S.A. E.S.P. | Colombia | Foreign | CALDWELL MANAGEMENT SAS | Colombia | COP | 8.00% | Monthly | 53 | 154 | 207 | 163 | — | — | — | — | 163 |
Foreign | Emgesa S.A. E.S.P. | Colombia | Foreign | GESTIÓN INMOBILIARIA MIC S.A.S | Colombia | COP | 7.00% | Monthly | 3 | 8 | 11 | 2 | — | — | — | — | 2 |
Foreign | Emgesa S.A. E.S.P. | Colombia | Foreign | COMPAÑÍA NAVIERA DEL GUAVIO LTDA. | Colombia | COP | 7.00% | Monthly | 57 | 19 | 76 | — | — | — | — | — | — |
Foreign | Emgesa S.A. E.S.P. | Colombia | Foreign | TRANSPORTES ESPECIALES FSG | Colombia | COP | 7.00% | Monthly | 198 | 614 | 812 | 870 | 75 | — | — | — | 945 |
Foreign | Emgesa S.A. E.S.P. | Colombia | Foreign | AVIS MAREAUTO COLOMBIA S.A.S | Colombia | COP | 13.00% | Monthly | 5 | 15 | 20 | 23 | 2 | — | — | — | 25 |
Foreign | Emgesa S.A. E.S.P. | Colombia | Foreign | AVIS MAREAUTO COLOMBIA S.A.S | Colombia | COP | 13.00% | Monthly | 3 | 3 | 6 | — | — | — | — | — | — |
Foreign | Emgesa S.A. E.S.P. | Colombia | Foreign | NEARDENTAL S.A.S | Colombia | COP | 7.00% | Monthly | 12 | 9 | 21 | — | — | — | — | — | — |
Foreign | Enel Distribución Sao Paulo | Brazil | Foreign | CASTELLO BRANCO OFFICE PARK - FUNDO DE INVESTIMENTO IMOBILIÁRIO (50%) / CSHG REAL ESTATE - FUNDO DE INVESTIMENTO IMOBILIÁRIO (50%) | Brazil | BRL | 10.55% | Monthly | 777 | 1,216 | 1,993 | 1,768 | 1,955 | 2,162 | 2,390 | 5,819 | 14,094 |
Foreign | Enel Distribución Sao Paulo | Brazil | Foreign | MICHEL ESPER SAAD JUNIOR / SELMA MICHEL SAAD / DORA SAAD | Brazil | BRL | 10.32% | Monthly | 81 | 154 | 235 | 224 | 247 | 133 | — | — | 604 |
Foreign | Enel Distribución Sao Paulo | Brazil | Foreign | SIFONT - COMÉRCIO DE PRODUTOS ADESIVOS LTDA - PPE / DAISAN CONSULTORIA E NEGÓCIOS IMOBILIÁRIOS LTDA | Brazil | BRL | 10.10% | Monthly | 25 | 42 | 67 | 62 | 68 | 75 | 82 | 115 | 402 |
Foreign | Enel Distribución Sao Paulo | Brazil | Foreign | GABRIEL CHUCAIR / SANDRA REGINA MARQUES PEREIRA CHUCAIR / EDUARDO CHUCAIR / MAURÍCIO CHUCAIR | Brazil | BRL | 9.35% | Monthly | 50 | 104 | 154 | — | — | — | — | — | — |
Foreign | Enel Distribución Sao Paulo | Brazil | Foreign | JOAQUIM VICENTE MARTINS / MARIA FERNANDA DOS SANTOS MARTINS | Brazil | BRL | 4.01% | Monthly | 26 | — | 26 | — | — | — | — | — | — |
Foreign | Enel Distribución Sao Paulo | Brazil | Foreign | DINARTEK ADMINISTRAÇÃO E PARTICIPAÇÃO | Brazil | BRL | 7.11% | Monthly | 21 | 45 | 66 | 64 | — | — | — | — | 64 |
Foreign | Enel Distribución Sao Paulo | Brazil | Foreign | LUIZ ROBERTO GIL CONSULTORIA | Brazil | BRL | 9.35% | Monthly | 9 | 17 | 26 | — | — | — | — | — | — |
Foreign | Enel Distribución Sao Paulo | Brazil | Foreign | RECOLOR MERCANTIL LTDA | Brazil | BRL | 9.89% | Monthly | 22 | 40 | 62 | 58 | 31 | — | — | — | 89 |
Foreign | Enel Distribución Sao Paulo | Brazil | Foreign | FADL IBRAHIM MADJOUB / WADAD ABDUL MANDJOUB | Brazil | BRL | 4.01% | Monthly | 10 | — | 10 | — | — | — | — | — | — |
Foreign | Enel Distribución Sao Paulo | Brazil | Foreign | ROGERIO PEREIRA DA SILVA / SIMONE DA SILVA | Brazil | BRL | 4.01% | Monthly | 5 | — | 5 | — | — | — | — | — | — |
Foreign | Enel Distribución Sao Paulo | Brazil | Foreign | CONSTRUTORA AVILA DE AZEVEDO EIRELI | Brazil | BRL | 9.89% | Monthly | 3 | 7 | 10 | 10 | 6 | — | — | — | 16 |
Foreign | Enel Distribución Sao Paulo | Brazil | Foreign | FABIO HIROYUKI OGAWA / MÔNICA HITOMI KONDO | Brazil | BRL | 9.34% | Monthly | 2 | 5 | 7 | 4 | — | — | — | — | 4 |
Foreign | Enel Distribución Sao Paulo | Brazil | Foreign | FRANCISCO PERINE | Brazil | BRL | 9.35% | Monthly | 2 | 3 | 5 | — | — | — | — | — | — |
Foreign | Enel Distribución Sao Paulo | Brazil | Foreign | SERGIO PEREIRA LEITE | Brazil | BRL | 9.34% | Monthly | 4 | 9 | 13 | 7 | — | — | — | — | 7 |
Foreign | Enel Distribución Sao Paulo | Brazil | Foreign | JOSÉ CARLOS RIBEIRO / ANA CLÁUDIA LAPORTE RIBEIRO | Brazil | BRL | 9.35% | Monthly | 2 | 2 | 4 | — | — | — | — | — | — |
Foreign | Enel Distribución Sao Paulo | Brazil | Foreign | M.O. INCORPORAÇÕES & PARTICIPAÇÕES LTDA. | Brazil | BRL | 9.89% | Monthly | 1 | 3 | 4 | 4 | 3 | — | — | — | 7 |
Foreign | Enel Distribución Sao Paulo | Brazil | Foreign | EMILIANA RIBEIRO / SUZANA APARECIDA RIBEIRO / VICTOR JESUS RIBEIRO / JOSEPH AUGUSTO RIBEIRO | Brazil | BRL | 9.34% | Monthly | 3 | 6 | 9 | 5 | — | — | — | — | 5 |
Foreign | Enel Distribución Sao Paulo | Brazil | Foreign | LOURIVAL ASSUNÇÃO DE ABREU | Brazil | BRL | 9.89% | Monthly | 2 | 5 | 7 | 7 | 5 | — | — | — | 12 |
Foreign | Enel Distribución Sao Paulo | Brazil | Foreign | DHL LOGISTICS LTDA | Brazil | BRL | 10.32% | Monthly | 104 | 214 | 318 | 311 | 343 | 313 | — | — | 967 |
Foreign | Enel Distribución Sao Paulo | Brazil | Foreign | JSL LOCAÇÕES LTDA | Brazil | BRL | 8.97% | Monthly | 13 | 9 | 22 | — | — | — | — | — | — |
Foreign | Enel Distribución Sao Paulo | Brazil | Foreign | CSC COMPUTER SCIENCES BRASIL S.A. | Brazil | BRL | 8.97% | Monthly | 157 | 432 | 589 | — | — | — | — | — | — |
Foreign | Enel Distribución Sao Paulo | Brazil | Foreign | DIRCE GONÇALVES GOMES | Brazil | BRL | 11.25% | Monthly | 11 | 18 | 29 | 26 | 29 | 32 | 20 | — | 107 |
F-123
| | | | | | | | | | | | | | | | | |
|---|---|---|---|---|---|---|---|---|---|---|---|---|---|---|---|---|---|
| | | | | | | | | December 31, 2019 | ||||||||
| | | | | | | | | Current | Non-Current | |||||||
Taxpayer | | | Taxpayer | | | | Nominal | | Less than | More than | Total | One to two | Two to | Three to | Four to | More than | Total Non- |
ID No. | Company | Country | ID No. | Company | Country | Currency | Rate | | ThUS$ | ThUS$ | ThUS$ | ThUS$ | ThUS$ | ThUS$ | ThUS$ | ThUS$ | ThUS$ |
Foreign | Enel Distribución Sao Paulo | Brazil | Foreign | FRANCISCO FREXOSO SALAZAR | Brazil | BRL | 11.25% | Monthly | 6 | 11 | 17 | 17 | 19 | 21 | 13 | — | 70 |
Foreign | Enel Distribución Sao Paulo | Brazil | Foreign | DARCIO ANTONIO LEARDINI / RITA DE CASSIA PONTIERI LEARDINI / VINICIUS LEARDINI / PATRICIA LEARDINI SOUZA / MURILO LEARDINI | Brazil | BRL | 11.25% | Monthly | 6 | 12 | 18 | 18 | 20 | 22 | 12 | — | 72 |
Foreign | Enel Distribución Sao Paulo | Brazil | Foreign | JOSÉ HENRIQUE DOS SANTOS SOUSA / JOSÉ ANTUNES GOMES DE SOUSA | Brazil | BRL | 8.43% | Monthly | 1 | 3 | 4 | 4 | 5 | 5 | 2 | — | 16 |
Foreign | Enel Distribución Sao Paulo | Brazil | Foreign | MARIA ANGELA RODRIGUES LODO MOTA | Brazil | BRL | 11.25% | Monthly | 1 | 2 | 3 | 3 | 3 | 3 | 2 | — | 11 |
Foreign | Enel Distribución Sao Paulo | Brazil | Foreign | HONÓRIO PEREIRA DOMINGUES | Brazil | BRL | 11.25% | Monthly | 1 | 2 | 3 | 3 | 3 | 4 | 2 | — | 12 |
Foreign | Enel Distribución Sao Paulo | Brazil | Foreign | EDNEIA DE SOUZA SOARES | Brazil | BRL | 8.43% | Monthly | 1 | 2 | 3 | 3 | 4 | 4 | 1 | — | 12 |
Foreign | Enel Distribución Sao Paulo | Brazil | Foreign | MADALENA OLIVEIRA DA SILVA / RENAN OLIVEIRA SILVA / SULIVAN OLIVEIRA SILVA | Brazil | BRL | 11.25% | Monthly | 1 | 2 | 3 | 3 | 4 | 4 | 2 | — | 13 |
Foreign | Enel Distribución Sao Paulo | Brazil | Foreign | ADAQUIR PRISCO | Brazil | BRL | 11.25% | Monthly | 2 | 4 | 6 | 5 | 6 | 6 | 3 | — | 20 |
Foreign | Enel Distribución Sao Paulo | Brazil | Foreign | NEWTON PEREIRA DA SILVA | Brazil | BRL | 8.43% | Monthly | 2 | 5 | 7 | 7 | 8 | 8 | 3 | — | 26 |
Foreign | Enel Distribución Sao Paulo | Brazil | Foreign | DALMAS PARTICIPAÇÕES LTDA. | Brazil | BRL | 11.25% | Monthly | 5 | 9 | 14 | 13 | 14 | 16 | 10 | — | 53 |
Foreign | Enel Distribución Sao Paulo | Brazil | Foreign | ACG PROJETOS & DECORAÇÕES LTDA | Brazil | BRL | 11.25% | Monthly | 4 | 7 | 11 | 10 | 11 | 12 | 9 | — | 42 |
Foreign | Enel Distribución Sao Paulo | Brazil | Foreign | ADA MARIA VASONE / OLGA MARIA VASONE DE CASTRO CONDE / PATRICIA MARIA VASONE SPINGOLA / ARMANDO VASONE FILHO | Brazil | BRL | 8.43% | Monthly | 10 | 20 | 30 | 29 | 31 | 34 | 3 | — | 97 |
Foreign | Enel Distribución Sao Paulo | Brazil | Foreign | FUNDAÇÃO PADRE ANCHIETA - CENTRO PAULISTA DE RÁDIO TV EDUCATIVAS | Brazil | BRL | 10.32% | Monthly | 71 | 137 | 208 | 199 | 220 | 200 | — | — | 619 |
Foreign | Enel Distribución Sao Paulo | Brazil | Foreign | RUJO CONSTRUÇÕES E EMPREENDIMENTOS IMOBILIÁRIOS LTDA | Brazil | BRL | 11.25% | Monthly | 13 | 20 | 33 | 30 | 33 | 37 | 20 | — | 120 |
Foreign | Enel Distribución Sao Paulo | Brazil | Foreign | TIVIT TERCEIRIZAÇÃO DE PROCESSOS, SERVIÇOS E TECNOLOGIA S.A. | Brazil | BRL | 8.93% | Monthly | 1,216 | 2,728 | 3,944 | 630 | — | — | — | — | 630 |
Foreign | Enel Distribución Sao Paulo | Brazil | Foreign | FUNDAÇÃO COELCE DE SEGURIDADE SOCIAL - FAELCE | Brazil | BRL | 9.35% | Monthly | 33 | 157 | 190 | — | — | — | — | — | — |
Foreign | Enel Distribución Sao Paulo | Brazil | Foreign | FUNDAÇÃO AMPLA DE SEGURIDADE SOCIAL - BRASILETROS | Brazil | BRL | 9.89% | Monthly | 98 | 338 | 436 | 489 | 308 | — | — | — | 797 |
Foreign | Enel Distribución Sao Paulo | Brazil | Foreign | ARVAL BRASIL LTDA. | Brazil | BRL | 4.65% | Monthly | 647 | — | 647 | — | — | — | — | — | — |
Foreign | Enel Distribución Sao Paulo | Brazil | Foreign | JSL S.A. | Brazil | BRL | 9.45% | Monthly | 1,310 | 1,423 | 2,733 | 2,054 | 2,248 | 2,461 | 2,693 | 6,173 | 15,629 |
Foreign | Enel Distribución Sao Paulo | Brazil | Foreign | JSL S.A. | Brazil | BRL | 9.45% | Monthly | 408 | 458 | 866 | 660 | 723 | 791 | 866 | 1,716 | 4,756 |
Foreign | Enel Distribución Sao Paulo | Brazil | Foreign | JSL S.A. | Brazil | BRL | 4.65% | Monthly | 33 | 31 | 64 | — | — | — | — | — | — |
Foreign | Enel Distribución Sao Paulo | Brazil | Foreign | JSL S.A. | Brazil | BRL | 9.45% | Monthly | 52 | 55 | 107 | 79 | 87 | 95 | 104 | 260 | 625 |
Foreign | Enel Distribución Sao Paulo | Brazil | Foreign | MAESTRO LOCADORA DE VEÍCULOS S.A. | Brazil | BRL | 7.28% | Monthly | 383 | 497 | 880 | 705 | 756 | 399 | — | — | 1,860 |
Foreign | Enel Distribución Sao Paulo | Brazil | Foreign | VAMOS LOCAÇÃO DE CAMINHÕES, MÁQUINAS E EQUIPAMENTOS LTDA | Brazil | BRL | 7.28% | Monthly | 421 | 757 | 1,178 | 1,073 | 1,151 | 402 | — | — | 2,626 |
Foreign | Enel Distribución Sao Paulo | Brazil | Foreign | DHL LOGISTICS LTDA | Brazil | BRL | 13.39% | Monthly | 78 | 390 | 468 | 372 | 422 | 254 | — | — | 1,048 |
Foreign | Enel Distribución Sao Paulo | Brazil | Foreign | AGASUS S.A. | Brazil | BRL | 6.57% | Monthly | 353 | 1,475 | 1,828 | 1,540 | 671 | — | — | — | 2,211 |
Foreign | Enel Generación Perú S.A. | Peru | Foreign | BBVA | Peru | US$ | 3.38% | Quarterly | — | 1,269 | 1,269 | 3,873 | — | — | — | — | 3,873 |
Foreign | Enel Generación Perú S.A. | Peru | Foreign | RENTAEQUIPOS LEASING PERU S.A. | Peru | US$ | 4.12% | Monthly | 10 | 18 | 28 | — | — | — | — | — | — |
Foreign | Enel Generación Perú S.A. | Peru | Foreign | RENTAEQUIPOS LEASING PERU S.A. | Peru | US$ | 4.12% | Monthly | 3 | 9 | 12 | 6 | — | — | — | — | 6 |
Foreign | Enel Generación Perú S.A. | Peru | Foreign | RENTAEQUIPOS LEASING PERU S.A. | Peru | US$ | 4.31% | Monthly | 2 | 4 | 6 | — | — | — | — | — | — |
Foreign | Enel Generación Perú S.A. | Peru | Foreign | RENTAEQUIPOS LEASING PERU S.A. | Peru | US$ | 4.11% | Monthly | 2 | 1 | 3 | — | — | — | — | — | — |
Foreign | Enel Generación Perú S.A. | Peru | Foreign | RENTAEQUIPOS LEASING PERU S.A. | Peru | US$ | 4.11% | Monthly | 4 | 8 | 12 | — | — | — | — | — | — |
Foreign | Enel Generación Perú S.A. | Peru | Foreign | ELIAS MARCELO LAOS HUAMAN | Peru | US$ | 2.23% | Quarterly | 6 | 19 | 25 | 22 | — | — | — | — | 22 |
Foreign | Enel Generación Perú S.A. | Peru | Foreign | FM EDIFICACIONES | Peru | US$ | 4.83% | Monthly | 3 | 10 | 13 | 5 | 5 | 3 | — | — | 13 |
Foreign | Enel Generación Perú S.A. | Peru | Foreign | RENTING S.A.C. | Peru | PEN | 5.45% | Monthly | 2 | 7 | 9 | 7 | — | — | — | — | 7 |
Foreign | Enel Generación Perú S.A. | Peru | Foreign | RENTAEQUIPOS LEASING PERU S.A. | Peru | US$ | 4.51% | Monthly | 8 | 23 | 31 | 34 | 25 | — | — | — | 59 |
Foreign | EGP Cachoeira Dourada S.A. | Brazil | Foreign | FUNDAÇÃO COELCE DE SEGURIDADE SOCIAL - FAELCE | Brazil | BRL | 6.04% | Monthly | 1 | 3 | 4 | — | — | — | — | — | — |
Foreign | EGP Cachoeira Dourada S.A. | Brazil | Foreign | FUNDAÇÃO AMPLA DE SEGURIDADE SOCIAL - BRASILETROS | Brazil | BRL | 6.30% | Monthly | 12 | 8 | 20 | 11 | 7 | — | — | — | 18 |
Foreign | ENEL BRASIL S.A. | Brazil | Foreign | FUNDAÇÃO COELCE DE SEGURIDADE SOCIAL - FAELCE | Brazil | BRL | 6.04% | Monthly | 10 | 23 | 33 | — | — | — | — | — | — |
Foreign | ENEL BRASIL S.A. | Brazil | Foreign | FUNDAÇÃO AMPLA DE SEGURIDADE SOCIAL - BRASILETROS | Brazil | BRL | 6.30% | Monthly | 79 | 55 | 134 | 77 | 47 | — | — | — | 124 |
Foreign | ENEL BRASIL S.A. | Brazil | Foreign | EL CORTE INGLES | Spain | EUR | 0.10% | Monthly | 5 | — | 5 | — | — | — | — | — | — |
Foreign | ENEL BRASIL S.A. | Brazil | Foreign | COLUNA IMOBILIÁRIA LTDA | Brazil | BRL | 9.35% | Monthly | 87 | 6 | 93 | — | — | — | — | — | — |
Foreign | ENEL X BRASIL | Brazil | Foreign | FUNDAÇÃO AMPLA DE SEGURIDADE SOCIAL - BRASILETROS | Brazil | BRL | 6.30% | Monthly | 10 | 22 | 32 | 31 | 19 | — | — | — | 50 |
Foreign | ENEL X BRASIL | Brazil | Foreign | PAULO ANDRADE DE SOUZA PINTO FILHO | Brazil | BRL | 6.08% | Monthly | 13 | 30 | 43 | — | — | — | — | — | — |
Foreign | ENEL X BRASIL | Brazil | Foreign | BM LOGÍSTICA S.A. | Brazil | BRL | 5.94% | Monthly | 13 | 29 | 42 | 17 | — | — | — | — | 17 |
Foreign | ENEL X BRASIL | Brazil | Foreign | VINICOLA DO VALE DO SÃO FRANCISCO | Brazil | BRL | 13.11% | Monthly | 23 | — | 23 | — | — | — | — | 178 | 178 |
Foreign | ENEL X BRASIL | Brazil | Foreign | PMINAS BRASIL CONSTRUÇÃO CIVIL E SE | Brazil | BRL | 8.97% | Monthly | 26 | — | 26 | — | — | — | — | — | — |
Foreign | Enel Distribución Ceará S.A. | Brazil | Foreign | INTER EMPRENDIMENTOS IMOBILIARIOS L | Brazil | BRL | 7.11% | Monthly | 9 | 13 | 22 | 18 | 8 | — | — | — | 26 |
Foreign | Enel Distribución Ceará S.A. | Brazil | Foreign | VALDERLI LIMA CARDOSO | Brazil | BRL | 4.77% | Monthly | 2 | 1 | 3 | — | — | — | — | — | — |
Foreign | Enel Distribución Ceará S.A. | Brazil | Foreign | GABRIELA DA SILVA BRAGA | Brazil | BRL | 5.57% | Monthly | 6 | 1 | 7 | — | — | — | — | — | — |
Foreign | Enel Distribución Ceará S.A. | Brazil | Foreign | MAIANA DE FÁTIMA BEZERRA PINHEIRO | Brazil | BRL | 6.04% | Monthly | 10 | 15 | 25 | 7 | — | — | — | — | 7 |
Foreign | Enel Distribución Ceará S.A. | Brazil | Foreign | SJ ADMINISTRAÇÃO DE IMÓVEIS | Brazil | BRL | 4.01% | Monthly | 4 | — | 4 | — | — | — | — | — | — |
Foreign | Enel Distribución Ceará S.A. | Brazil | Foreign | VALTER FURTADO ADVOGADOS ASSOCIADOS | Brazil | BRL | 4.01% | Monthly | 5 | — | 5 | — | — | — | — | — | — |
Foreign | Enel Distribución Ceará S.A. | Brazil | Foreign | CARLOS NILBERTO LIMA VENANCIO | Brazil | BRL | 7.11% | Monthly | 3 | 4 | 7 | 5 | — | — | — | — | 5 |
Foreign | Enel Distribución Ceará S.A. | Brazil | Foreign | EXPEDITO FILHO XIMENES CARNEIRO | Brazil | BRL | 6.08% | Monthly | 7 | 9 | 16 | — | — | — | — | — | — |
Foreign | Enel Distribución Ceará S.A. | Brazil | Foreign | FUNDAÇÃO COELCE DE SEGURIDADE SOCIAL - FAELCE | Brazil | BRL | 6.08% | Monthly | 168 | 510 | 678 | — | — | — | — | — | — |
Foreign | Enel Distribución Ceará S.A. | Brazil | Foreign | FUNDAÇÃO AMPLA DE SEGURIDADE SOCIAL - BRASILETROS | Brazil | BRL | 6.30% | Monthly | 198 | 179 | 377 | 250 | 153 | — | — | — | 403 |
Foreign | Enel Distribución Ceará S.A. | Brazil | Foreign | UNIMÓVEIS | Brazil | BRL | 9.34% | Monthly | 2 | 2 | 4 | 2 | — | — | — | — | 2 |
Foreign | Enel Distribución Ceará S.A. | Brazil | Foreign | ELUÍSIO SOARES DA SILVA | Brazil | BRL | 7.11% | Monthly | 1 | 2 | 3 | 2 | — | — | — | — | 2 |
Foreign | Enel Distribución Ceará S.A. | Brazil | Foreign | FUNTELC - FUND. TELEDUCAÇÃO - CE | Brazil | BRL | 6.08% | Monthly | 21 | 7 | 28 | — | — | — | — | — | — |
Foreign | Enel Distribución Ceará S.A. | Brazil | Foreign | TELEVISAO VERDES MARES LTDA | Brazil | BRL | 4.01% | Monthly | 9 | 1 | 10 | — | — | — | — | — | — |
Foreign | Enel Distribución Ceará S.A. | Brazil | Foreign | LOK MOTORS | Brazil | BRL | 8.97% | Monthly | 71 | 68 | 139 | — | — | — | — | — | — |
Foreign | Enel Distribución Ceará S.A. | Brazil | Foreign | FUNDAÇÃO COELCE DE SEGURIDADE SOCIAL - FAELCE | Brazil | BRL | 6.08% | Monthly | 11 | 33 | 44 | — | — | — | — | — | — |
Foreign | Enel Distribución Ceará S.A. | Brazil | Foreign | FUNDAÇÃO COELCE DE SEGURIDADE SOCIAL - FAELCE | Brazil | BRL | 6.08% | Monthly | 5 | 17 | 22 | — | — | — | — | — | — |
Foreign | Enel Distribución Ceará S.A. | Brazil | Foreign | FUNDAÇÃO COELCE DE SEGURIDADE SOCIAL - FAELCE | Brazil | BRL | 6.08% | Monthly | 29 | 89 | 118 | — | — | — | — | — | — |
Foreign | Enel Distribución Ceará S.A. | Brazil | Foreign | FUNDAÇÃO COELCE DE SEGURIDADE SOCIAL - FAELCE | Brazil | BRL | 6.08% | Monthly | 8 | 26 | 34 | — | — | — | — | — | — |
Foreign | Enel Distribución Ceará S.A. | Brazil | Foreign | FUNDAÇÃO COELCE DE SEGURIDADE SOCIAL - FAELCE | Brazil | BRL | 6.08% | Monthly | 9 | 28 | 37 | — | — | — | — | — | — |
Foreign | Enel Distribución Ceará S.A. | Brazil | Foreign | FUNDAÇÃO COELCE DE SEGURIDADE SOCIAL - FAELCE | Brazil | BRL | 6.08% | Monthly | 4 | 13 | 17 | — | — | — | — | — | — |
Foreign | Enel Distribución Ceará S.A. | Brazil | Foreign | FUNDAÇÃO COELCE DE SEGURIDADE SOCIAL - FAELCE | Brazil | BRL | 6.08% | Monthly | 3 | 9 | 12 | — | — | — | — | — | — |
Foreign | Enel Distribución Ceará S.A. | Brazil | Foreign | FUNDAÇÃO COELCE DE SEGURIDADE SOCIAL - FAELCE | Brazil | BRL | 6.08% | Monthly | 37 | 8 | 45 | — | — | — | — | — | — |
Foreign | Enel Distribución Ceará S.A. | Brazil | Foreign | FRANCISCO FELIPE DE SOUSA | Brazil | BRL | 8.01% | Monthly | 2 | 2 | 4 | 3 | 4 | 4 | 4 | 3 | 18 |
Foreign | Enel Distribución Ceará S.A. | Brazil | Foreign | F OLIVEIRA CORRETOR | Brazil | BRL | 8.36% | Monthly | 5 | 6 | 11 | 8 | 9 | 10 | 11 | 4 | 42 |
Foreign | Enel Distribución Ceará S.A. | Brazil | Foreign | FRANCISCO DE ASSIS ROCHA RODRIGUES | Brazil | BRL | 8.43% | Monthly | 5 | 7 | 12 | 10 | 10 | 11 | 1 | — | 32 |
Foreign | Enel Distribución Ceará S.A. | Brazil | Foreign | MADELINE CORDEIRO CAVALCANTE | Brazil | BRL | 12.71% | Monthly | 2 | 1 | 3 | 2 | 2 | 2 | 3 | 13 | 22 |
Foreign | Enel Distribución Ceará S.A. | Brazil | Foreign | MARIA OTACIANA NOGUEIRA CASTRO | Brazil | BRL | 8.01% | Monthly | 2 | 2 | 4 | 4 | 4 | 4 | 4 | 3 | 19 |
Foreign | Enel Distribución Ceará S.A. | Brazil | Foreign | MARIA DAS GRACAS TIMBO D MARTINS | Brazil | BRL | 9.56% | Monthly | 1 | 1 | 2 | 1 | 1 | 2 | 2 | 18 | 24 |
Foreign | Enel Distribución Ceará S.A. | Brazil | Foreign | FRANCISCO CANUTO LINS | Brazil | BRL | 12.51% | Monthly | 4 | 3 | 7 | 5 | 5 | 6 | 6 | 22 | 44 |
Foreign | Enel Distribución Ceará S.A. | Brazil | Foreign | PRIME PLUS LOCACAO VEICULOS E TRANS | Brazil | BRL | 8.97% | Monthly | 48 | 8 | 56 | — | — | — | — | — | — |
Foreign | Enel Distribución Ceará S.A. | Brazil | Foreign | LUIZA MARTINS CAVALCANTI | Brazil | BRL | 6.30% | Monthly | 2 | 2 | 4 | 3 | 2 | — | — | — | 5 |
Foreign | Enel Distribución Ceará S.A. | Brazil | Foreign | S.M. ALVES MOURA-ME | Brazil | BRL | 6.30% | Monthly | 3 | 5 | 8 | 6 | 4 | — | — | — | 10 |
Foreign | Enel Distribución Ceará S.A. | Brazil | Foreign | BERTRANS BERTOTTI TRANSPORTES DE CARGAS SECAS | Brazil | BRL | 9.89% | Monthly | 70 | 98 | 168 | 142 | — | — | — | �� | 142 |
Foreign | Enel Cien S.A. | Brazil | Foreign | FUNDAÇÃO COELCE DE SEGURIDADE SOCIAL - FAELCE | Brazil | BRL | 6.08% | Monthly | 2 | 8 | 10 | — | — | — | — | — | — |
F-124
| | | | | | | | | | | | | | | | | |
|---|---|---|---|---|---|---|---|---|---|---|---|---|---|---|---|---|---|
| | | | | | | | | December 31, 2019 | ||||||||
| | | | | | | | | Current | Non-Current | |||||||
Taxpayer | | | Taxpayer | | | | Nominal | | Less than | More than | Total | One to two | Two to | Three to | Four to | More than | Total Non- |
ID No. | Company | Country | ID No. | Company | Country | Currency | Rate | | ThUS$ | ThUS$ | ThUS$ | ThUS$ | ThUS$ | ThUS$ | ThUS$ | ThUS$ | ThUS$ |
Foreign | Enel Cien S.A. | Brazil | Foreign | FUNDAÇÃO AMPLA DE SEGURIDADE SOCIAL - BRASILETROS | Brazil | BRL | 6.30% | Monthly | 22 | 18 | 40 | 25 | 15 | — | — | — | 40 |
Foreign | Enel Cien S.A. | Brazil | Foreign | ELETROSUL CENTRAIS ELETRICAS S.A. | Brazil | BRL | 5.81% | Monthly | 5 | 8 | 13 | — | — | — | — | — | — |
Foreign | Enel Cien S.A. | Brazil | Foreign | ELETROSUL CENTRAIS ELETRICAS S.A. | Brazil | BRL | 6.50% | Monthly | 4 | 6 | 10 | 8 | 5 | — | — | — | 13 |
Foreign | Enel Distribución Río S.A. | Brazil | Foreign | VINÍCIUS ANJOS DE SOUZA | Brazil | BRL | 10.55% | Monthly | 10 | 15 | 25 | 23 | 25 | 28 | 30 | 71 | 177 |
Foreign | Enel Distribución Río S.A. | Brazil | Foreign | MAURÍCIO MANHÃE DE LIMA | Brazil | BRL | 7.11% | Monthly | 13 | 28 | 41 | 40 | — | — | — | — | 40 |
Foreign | Enel Distribución Río S.A. | Brazil | Foreign | MOACYR JOSÉ DA CRUZ | Brazil | BRL | 5.34% | Monthly | 30 | 91 | 121 | 52 | — | — | — | — | 52 |
Foreign | Enel Distribución Río S.A. | Brazil | Foreign | LEIDIMAR BELIENY DE CASTRO ANDRADE | Brazil | BRL | 5.57% | Monthly | 7 | — | 7 | — | — | — | — | — | — |
Foreign | Enel Distribución Río S.A. | Brazil | Foreign | JOSÉ CLAUDIO MACHADO | Brazil | BRL | 9.89% | Monthly | 2 | 3 | 5 | 4 | 3 | — | — | — | 7 |
Foreign | Enel Distribución Río S.A. | Brazil | Foreign | OLIVER DA SILVA BARRETO | Brazil | BRL | 5.57% | Monthly | 3 | — | 3 | — | — | — | — | — | — |
Foreign | Enel Distribución Río S.A. | Brazil | Foreign | MOACYR JOSÉ DA CRUZ | Brazil | BRL | 6.08% | Monthly | 40 | 33 | 73 | — | — | — | — | — | — |
Foreign | Enel Distribución Río S.A. | Brazil | Foreign | MAURO JOSÉ RODRIGUES FELGA | Brazil | BRL | 10.55% | Monthly | 8 | 10 | 18 | 15 | 16 | 18 | 20 | 46 | 115 |
Foreign | Enel Distribución Río S.A. | Brazil | Foreign | FUNDAÇÃO COELCE DE SEGURIDADE SOCIAL - FAELCE | Brazil | BRL | 6.04% | Monthly | 24 | 74 | 98 | — | — | — | — | — | — |
Foreign | Enel Distribución Río S.A. | Brazil | Foreign | FUNDAÇÃO AMPLA DE SEGURIDADE SOCIAL - BRASILETROS | Brazil | BRL | 6.30% | Monthly | 265 | 550 | 815 | 773 | 473 | — | — | — | 1,246 |
Foreign | Enel Distribución Río S.A. | Brazil | Foreign | MARILENE DAFLON JAPOR TORRES | Brazil | BRL | 9.89% | Monthly | 4 | 7 | 11 | 10 | 4 | — | — | — | 14 |
Foreign | Enel Distribución Río S.A. | Brazil | Foreign | FUNDO DE INVESTIMENTO IMOBILIÁRIO PATRIMONIAL III | Brazil | BRL | 8.54% | Monthly | 1,399 | — | 1,399 | 853 | 925 | 1,005 | 1,090 | 2,507 | 6,380 |
Foreign | Enel Distribución Río S.A. | Brazil | Foreign | LIGIA RIBEIRO GARCIA DE REZENDE | Brazil | BRL | 10.32% | Monthly | 2 | 2 | 4 | 3 | 4 | 3 | — | — | 10 |
Foreign | Enel Distribución Río S.A. | Brazil | Foreign | OSWALDO CARDOSO LIMA | Brazil | BRL | 5.34% | Monthly | 9 | 18 | 27 | — | — | — | — | — | — |
Foreign | Enel Distribución Río S.A. | Brazil | Foreign | LUIZ ANTONIO SIQUEIRA GONÇALVES | Brazil | BRL | 7.11% | Monthly | 3 | 6 | 9 | 8 | — | — | — | — | 8 |
Foreign | Enel Distribución Río S.A. | Brazil | Foreign | CONSÓRCIO GDA SERVIÇOS DE TRANSPOR | Brazil | BRL | 8.97% | Monthly | 184 | 217 | 401 | — | — | — | — | — | — |
Foreign | Enel Distribución Río S.A. | Brazil | Foreign | JOSUÉ COUTO DE OLIVEIRA | Brazil | BRL | 7.11% | Monthly | 1 | 2 | 3 | 3 | 1 | — | — | — | 4 |
Foreign | Enel Distribución Río S.A. | Brazil | Foreign | ALOYSIO DOS SANTOS ERTHAL | Brazil | BRL | 7.30% | Monthly | 1 | 2 | 3 | 2 | 2 | 3 | 1 | — | 8 |
Foreign | Enel Distribución Río S.A. | Brazil | Foreign | MIGUEL GUERREIRO MARTINS | Brazil | BRL | 6.30% | Monthly | 3 | 5 | 8 | 7 | 2 | — | — | — | 9 |
Foreign | Enel Distribución Río S.A. | Brazil | Foreign | LOACIR ANTONIO DE CARVALHO | Brazil | BRL | 4.01% | Monthly | 2 | — | 2 | — | — | — | — | — | — |
Foreign | Enel Distribución Río S.A. | Brazil | Foreign | ANTONIO EDUARDO SARKIS | Brazil | BRL | 6.08% | Monthly | 8 | 8 | 16 | — | — | — | — | — | — |
Foreign | Enel Distribución Río S.A. | Brazil | Foreign | NITERÓI EMPRESA DE LAZER E TURISMO S/A | Brazil | BRL | 12.94% | Monthly | 2 | 2 | 4 | 3 | 4 | 4 | 5 | 34 | 50 |
Foreign | Enel Distribución Río S.A. | Brazil | Foreign | LEONARDO CAMPOS | Brazil | BRL | 10.32% | Monthly | 3 | 4 | 7 | 5 | 6 | 6 | — | — | 17 |
Foreign | Enel Distribución Río S.A. | Brazil | Foreign | JOÃO LOPES MEZAVILLA JUNIOR | Brazil | BRL | 12.51% | Monthly | 9 | 3 | 12 | 5 | 5 | 6 | 7 | 26 | 49 |
Foreign | Enel Distribución Río S.A. | Brazil | Foreign | ALICE ALT BITTENCOURT | Brazil | BRL | 9.89% | Monthly | 6 | 7 | 13 | 10 | 7 | — | — | — | 17 |
Foreign | Enel Distribución Río S.A. | Brazil | Foreign | FUNDAÇÃO CERJ DE SEGURIDADE SOCIAL - BRASILETROS | Brazil | BRL | 5.57% | Monthly | 19 | — | 19 | — | — | — | — | — | — |
Foreign | Enel Distribución Río S.A. | Brazil | Foreign | JOÃO COELHO DE ALENCAR | Brazil | BRL | 12.51% | Monthly | 11 | 11 | 22 | 17 | 19 | 21 | 24 | 90 | 171 |
Foreign | Enel Distribución Río S.A. | Brazil | Foreign | ISIDRO DA SILVA FERREIRA | Brazil | BRL | 10.88% | Monthly | 1 | 3 | 4 | 5 | 5 | 6 | 6 | 30 | 52 |
Foreign | Enel Distribución Goias S.A. | Brazil | Foreign | AGNOS COMÉRCIO DE PARAF. LTDA | Brazil | BRL | 9.34% | Monthly | 4 | 5 | 9 | 2 | — | — | — | — | 2 |
Foreign | Enel Distribución Goias S.A. | Brazil | Foreign | LUSIA GOMES JESUS | Brazil | BRL | 9.34% | Monthly | 2 | 4 | 6 | 1 | — | — | — | — | 1 |
Foreign | Enel Distribución Goias S.A. | Brazil | Foreign | MARY CELMA ALVES DE ASSIS | Brazil | BRL | 4.01% | Monthly | 3 | 1 | 4 | — | — | — | — | — | — |
Foreign | Enel Distribución Goias S.A. | Brazil | Foreign | JOSÉ FERNANDES DE CASTRO | Brazil | BRL | 9.34% | Monthly | 1 | 1 | 2 | — | — | — | — | — | — |
Foreign | Enel Distribución Goias S.A. | Brazil | Foreign | EULER ANTÔNIO DE ARAÚJO | Brazil | BRL | 9.35% | Monthly | 1 | 1 | 2 | — | — | — | — | — | — |
Foreign | Enel Distribución Goias S.A. | Brazil | Foreign | ANA DA MOTA YESÃO GONÇALVES | Brazil | BRL | 9.35% | Monthly | 4 | 3 | 7 | — | — | — | — | — | — |
Foreign | Enel Distribución Goias S.A. | Brazil | Foreign | FUNDAÇÃO COELCE DE SEGURIDADE SOCIAL - FAELCE | Brazil | BRL | 6.08% | Monthly | 22 | 68 | 90 | — | — | — | — | — | — |
Foreign | Enel Distribución Goias S.A. | Brazil | Foreign | FUNDAÇÃO AMPLA DE SEGURIDADE SOCIAL - BRASILETROS | Brazil | BRL | 6.30% | Monthly | 194 | 159 | 353 | 224 | 137 | — | — | — | 361 |
Foreign | Enel Distribución Goias S.A. | Brazil | Foreign | ITA EMPRESA DE TRANSPORTES LTDA | Brazil | BRL | 8.93% | Monthly | 821 | 1,835 | 2,656 | 853 | — | — | — | — | 853 |
Foreign | Enel Distribución Goias S.A. | Brazil | Foreign | ITA EMPRESA DE TRANSPORTES LTDA | Brazil | BRL | 5.81% | Monthly | 17 | 45 | 62 | — | — | — | — | — | — |
Foreign | Enel Distribución Goias S.A. | Brazil | Foreign | RAMES ABRAHÃO BASÍLIO | Brazil | BRL | 6.08% | Monthly | 31 | 15 | 46 | — | — | — | — | — | — |
Foreign | Enel Distribución Goias S.A. | Brazil | Foreign | ANTÔNIO FRANCISCO DE MIRANDA | Brazil | BRL | 9.35% | Monthly | 3 | 1 | 4 | — | — | — | — | — | — |
Foreign | Enel Distribución Goias S.A. | Brazil | Foreign | HEBERT CHAVES DE SOUZA | Brazil | BRL | 9.35% | Monthly | 4 | 3 | 7 | — | — | — | — | — | — |
Foreign | Enel Distribución Goias S.A. | Brazil | Foreign | ISABELLA FERNANDES/LETÍCIA FERNANDES | Brazil | BRL | 6.04% | Monthly | 3 | 3 | 6 | — | — | — | — | — | — |
Foreign | Enel Distribución Goias S.A. | Brazil | Foreign | MARA LILIAM DE OLIVEIRA | Brazil | BRL | 9.35% | Monthly | 2 | 1 | 3 | — | — | — | — | — | — |
Foreign | Enel Distribución Goias S.A. | Brazil | Foreign | SILVIO LUCIANO SAG GIN | Brazil | BRL | 9.35% | Monthly | 4 | 3 | 7 | — | — | — | — | — | — |
Foreign | Enel Distribución Goias S.A. | Brazil | Foreign | VILMA ALVES PIM | Brazil | BRL | 9.35% | Monthly | 6 | 4 | 10 | — | — | — | — | — | — |
Foreign | Enel Distribución Goias S.A. | Brazil | Foreign | ANTÔNIO SERGIO MACHADO | Brazil | BRL | 9.35% | Monthly | 1 | — | 1 | — | — | — | — | — | — |
Foreign | Enel Distribución Goias S.A. | Brazil | Foreign | SANT'ANA DINIZ & MOURA AGORPECUÁRIA LTDA. | Brazil | BRL | 9.34% | Monthly | 30 | 47 | 77 | 16 | — | — | — | — | 16 |
Foreign | Enel Distribución Goias S.A. | Brazil | Foreign | JOÃO FRANCISCO DOURADO | Brazil | BRL | 11.25% | Monthly | 2 | 3 | 5 | 4 | 5 | 5 | — | — | 14 |
Foreign | Enel Distribución Goias S.A. | Brazil | Foreign | NERCI BERNARDO DA COSTA | Brazil | BRL | 11.25% | Monthly | 2 | 3 | 5 | 5 | 5 | 6 | 1 | — | 17 |
Foreign | Enel Distribución Goias S.A. | Brazil | Foreign | FLÁVIO DE OLIVEIRA BRAGA | Brazil | BRL | 8.01% | Monthly | 4 | 5 | 9 | 8 | 9 | 10 | 11 | — | 38 |
Foreign | Enel Distribución Goias S.A. | Brazil | Foreign | DANÚBIA DE FREITAS QUEIROZ | Brazil | BRL | 5.34% | Monthly | 2 | 3 | 5 | — | — | — | — | — | — |
Foreign | Enel Distribución Goias S.A. | Brazil | Foreign | ADAIR DEODORO SILVA | Brazil | BRL | 8.01% | Monthly | 3 | 4 | 7 | 6 | 6 | 7 | 6 | — | 25 |
Foreign | Enel Distribución Goias S.A. | Brazil | Foreign | EDIVALDO GODOI DA SILVA | Brazil | BRL | 7.30% | Monthly | 1 | 2 | 3 | 3 | 4 | 4 | 3 | — | 14 |
Foreign | Enel Generación Fortaleza | Brazil | Foreign | FUNDAÇÃO COELCE DE SEGURIDADE SOCIAL - FAELCE | Brazil | BRL | 6.04% | Monthly | 1 | 3 | 4 | — | — | — | — | — | — |
Foreign | Enel Generación Fortaleza | Brazil | Foreign | FUNDAÇÃO AMPLA DE SEGURIDADE SOCIAL - BRASILETROS | Brazil | BRL | 6.30% | Monthly | 11 | 7 | 18 | 10 | 6 | — | — | — | 16 |
Foreign | EDESUR | Argentina | Foreign | SOCIEDAD DE HECHO ENTRE DEL TORO LEONARDO Y DEL TORO DOMINGO | Argentina | ARS | 0.62% | Monthly | — | 7 | 7 | 7 | — | — | — | — | 7 |
Foreign | Enel Green Power Volta Grande | Brazil | Foreign | FUNDAÇÃO COELCE DE SEGURIDADE SOCIAL - FAELCE | Brazil | BRL | 6.50% | Monthly | 1 | 2 | 3 | 3 | — | — | — | — | 3 |
Foreign | Enel Green Power Volta Grande | Brazil | Foreign | FUNDAÇÃO AMPLA DE SEGURIDADE SOCIAL - BRASILETROS | Brazil | BRL | 7.67% | Monthly | 3 | 5 | 8 | 14 | 15 | 1 | — | — | 30 |
94.271.000-3 | Enel Américas S.A. | Chile | 96.800.570-7 | COMPAÑIA DE LEASING TATTERSALL S A. | Chile | UF | 0.01% | Monthly | 2 | 9 | 11 | 8 | — | — | — | — | 8 |
Total | | 18,896 | 62,748 | 81,644 | 42,709 | 26,241 | 13,673 | 7,927 | 18,075 | 108,625 | |||||||
F-125
21.2 | Undiscounted debt cash flows |
Undiscounted debt cash flows are detailed as follows:
| | | | | | | | | | | |
| | | Current | Non-Current | |||||||
| | | Maturity | | Maturity | | |||||
Country | Currency | Nominal Interest Rate | One to three months | Three to twelve months | Total Current 12/31/2020 | One to two years | Two to three years | Three to four years | Four to five years | More than five years | Total Non-Current 12/31/2020 |
| | | ThUS$ | ThUS$ | ThUS$ | ThUS$ | ThUS$ | ThUS$ | ThUS$ | ThUS$ | ThUS$ |
Argentina | ARS | 0.62% | 25 | 75 | 100 | 22 | 29 | 14 | - | - | 65 |
Peru | US$ | 3.29% | 7,031 | 13,852 | 20,883 | 6,804 | 2,634 | 2,541 | 2,494 | 11,431 | 25,904 |
Peru | PEN | 4.69% | 2,787 | 8,399 | 11,186 | 11,328 | 2,383 | 264 | 88 | - | 14,063 |
Colombia | COP | 8.00% | 1,836 | 3,984 | 5,820 | 2,644 | 2,254 | 2,016 | 1,836 | 14,460 | 23,210 |
Brazil | BRL | 7.75% | 7,332 | 15,333 | 22,665 | 14,310 | 11,040 | 8,874 | 8,194 | 7,278 | 49,696 |
Brazil | BRL | 9.31% | 29 | 86 | 115 | 56 | 56 | 56 | 56 | 1,794 | 2,018 |
Chile | UF | 0.01% | 10 | 10 | 20 | - | - | - | - | - | - |
| | | | | | | | | | | |
Total | 19,050 | 41,739 | 60,789 | 35,164 | 18,396 | 13,765 | 12,668 | 34,963 | 114,956 | ||
| | | | | | | | | | | |
| | | Current | Non-Current | |||||||
| | | Maturity | | Maturity | | |||||
Country | Currency | Nominal Interest Rate | One to three months | Three to twelve months | Total Current 12/31/2019 | One to two years | Two to three years | Three to four years | Four to five years | More than five years | Total Non-Current 12/31/2019 |
| | | ThUS$ | ThUS$ | ThUS$ | ThUS$ | ThUS$ | ThUS$ | ThUS$ | ThUS$ | ThUS$ |
Argentina | ARS | 0.62% | 4 | 10 | 14 | 8 | - | - | - | - | 8 |
Peru | US$ | 3.97% | 5,688 | 29,899 | 35,587 | 16,035 | 3,178 | 13 | - | - | 19,226 |
Peru | PEN | 5.10% | 1,947 | 14,777 | 16,724 | 11,068 | 10,927 | 4,057 | 264 | 88 | 26,404 |
Colombia | COP | 8.26% | 1,819 | 4,866 | 6,685 | 3,215 | 1,384 | 1,056 | 550 | 1,084 | 7,289 |
Brazil | BRL | 8.01% | 12,973 | 24,711 | 37,684 | 23,324 | 18,660 | 14,356 | 11,592 | 17,770 | 85,702 |
Chile | UF | 0.01% | 3 | 8 | 11 | 8 | - | - | - | - | 8 |
| | | | | | | | | | | |
Total | 22,434 | 74,271 | 96,705 | 53,658 | 34,149 | 19,482 | 12,406 | 18,942 | 138,637 | ||
F-126
The Group companies follow the guidelines of the Risk Management Control System (SCGR) defined at the Holding level (Enel S.p.A.), which establishes rules for managing risks through the respective standards, procedures, systems, etc., applicable to the different levels of the Group companies in the ongoing business risk identification, analysis, evaluation, treatment, and communication processes. These are approved by the Enel S.p.A. Board of Directors, which includes a Risk and Controls Committee responsible for supporting the Enel Américas Board’s evaluation and decisions regarding internal control and risk management system, as well as those related to the approval of periodic financial statements.
To comply with this, each Company has its own specific Control Management and Risk Management policy, which is reviewed and approved at the beginning of each year by the Enel Américas Board of Directors, observing and applying all local requirements in terms of the risk culture.
The Company seeks protection against all risks that could affect the achievement of the business objectives. In January 2020, a new risk taxonomy has been approved for the Enel Group, which considers 6 macro-categories and 37 sub-categories.
The Enel Group risk management system considers three lines of action (defense) to obtain effective and efficient risk management and controls. Each of these three “lines” plays a different role within the organization's broader governance structure (Business and Internal Control areas acting as the first line, Risk Control as the second line, and Internal Audit as the third line of defense). Each line of defense has the obligation to report to and keep senior management and the Directors up-to-date on risk management. In this sense, the first and second lines of defense report to the senior management, and the second and third lines report to the Enel Américas Board of Directors.
Within each of the Group's companies, the risk management is decentralized. Each manager responsible for the operating process in which the risk arises is also responsible for treating the risk and adopting risk control and mitigating measures.
Changes in interest rates affect the fair value of assets and liabilities bearing fixed interest rates, as well as, the expected future cash flows of assets and liabilities subject to floating interest rates.
The objective of managing interest rate risk exposure is to achieve a balance in the debt structure to minimize the cost of debt with reduced volatility in profit or loss.
Depending on the Group’s estimates and the objectives of the debt structure, hedging transactions are performed by entering into derivatives contracts that mitigate interest rate risk. Derivative instruments currently used to comply with the risk management policy are interest rate swaps to set floating rate to a fixed rate.
The financial debt structure of the Group detailed by the mostly strongly hedged fixed and floating interest rates on total net debt, net of hedging derivative instruments, is as follows:
Gross position:
| | | | |
| 12-31-2020 | | 12-31-2019 | |
| % |
| % |
|
Fixed interest rate debt | 38% | | 39% | |
Risk control through specific processes and indicators allows companies to limit possible adverse financial impacts and at the same time, optimize the debt structure with an adequate degree of flexibility. In this sense, the volatility that characterized the financial markets during the first phase of the pandemic, in many cases went back to pre-COVID-19 levels and was offset by effective risk mitigation actions using derivative financial instruments.
F-127
| 22.2 | Exchange rate risk |
Exchange rate risks involve basically the following transactions:
| - | Debt taken on by the Group’s companies that is denominated in a currency other than the currency in which its cash flows are indexed. |
| - | Payments to be made in a currency other than that in which its cash flows are indexed for the acquisition of project-related materials and for corporate insurance policies. |
| - | Income in Group companies directly linked to changes in currencies other than the currency of its cash flows. |
- Cash flows from foreign subsidiaries to the Chilean parent company which are exposed to exchange rate fluctuations.
In order to mitigate foreign currency risk, the Group’s foreign currency risk management policy is based on cash flows and includes maintaining a balance between U.S. dollar flows and the levels of assets and liabilities denominated in this currency. The objective is to minimize the exposure to variability in cash flows that are attributable to foreign exchange risk.
The hedging instruments currently being used to comply with the policy are currency swaps and forward exchange contracts. In addition, the policy works to refinance debt in the functional currency of each of the Group’s companies.
During the last quarter of 2020, exchange rate risk management continued in the context of complying with the previously mentioned risk management policy, without difficulty to access the derivatives market. It should be noted that the volatility that characterized the financial markets during the first phase of the pandemic, in many cases went back to pre-COVID-19 levels and was offset by risk mitigation actions through derivative financial instruments.
| 22.3 | Commodities risk |
The Group has a risk exposure to price fluctuations in certain commodities, basically due to:
| - | Purchases of fuel used to generate electricity. |
| - | Energy purchase/sale transactions that take place in local markets. |
In order to reduce the risk in situations of extreme drought, the Group has designed a commercial policy that defines the levels of sales commitments in line with the capacity of its generating power plants in a dry year. It also includes risk mitigation terms in certain contracts with unregulated customers and with regulated customers subject to long-term tender processes, establishing indexation polynomials that allow for reducing commodities exposure risk.
Considering the operating conditions faced by the power generation market, with drought and highly volatile commodity prices on international markets, the Company is constantly evaluating the use of hedging to minimize the impacts that these price fluctuations have on its results.
As of December 31, 2020, there are no current transactions for the purpose of hedging the contracting portfolio.
As of December 31, 2019, 5.28 GWh of energy purchases had been settled, in order to cover the contracting portfolio.
Thanks to the mitigation strategies implemented, the Group was able to minimize the effects of basic product price volatility on the results for the fourth quarter of 2020.
F-128
The Group maintains a liquidity risk management policy that consists of entering into long-term committed banking facilities and temporary financial investments for amounts that cover the projected needs over a period of time that is determined based on the situation and expectations for debt and capital markets.
The projected needs mentioned above include maturities of financial debt net of financial derivatives. For further details regarding the features and conditions of financial obligations and financial derivatives (see Notes 20 and 23).
As of December 31, 2020, the Group presents liquidity in the amount of ThUS$1,506,993. As of December 31, 2019, the Group presents liquidity of ThUS$1,938,997 in cash and other cash equivalents and ThUS$706,000 in unconditionally available long-term lines of credit.
The Group closely monitors its credit risk.
Trade receivables:
The credit risk for receivables from the Group’s commercial activity has historically been very low, due to the short term period of collections from customers, resulting in non-significant cumulative receivables amounts. This situation applies to the electricity generating and distribution lines of business.
In our electricity generating business, some countries’ regulations allow suspending the energy service to customers with outstanding payments, and most contracts have termination clauses for payment default. The Company monitors its credit risk on an ongoing basis and measures quantitatively its maximum exposure to payment default risk, which, as stated above, is very low.
In our electricity distribution companies, the suspension of energy service to customers in payment default is permitted in all cases, in accordance with current regulations in each country. This facilitates our credit risk management, which is also low in this line of business. However, the suspension of energy service in the event of payment defaults by vulnerable customers was suspended during the health emergency period in the countries where Enel Américas operates.
In Argentina, according to Decree 311/2020 of March 24, 2020, subsequently extended, the measure will be in force until March 2021. In Brazil, according to Resolution 878 of March 24, 2020, however, to date they have resumed cutting activities, with the exception of Rio de Janeiro, which will maintain the measure until July 2021. In Colombia, according to Decree 417 and 457, of March 17, 2020, and in Peru, according to Decree 35-20 of March 16, 2020, however to date, both countries have resumed suspension activities as normal.
Regarding the impact of COVID-19, the results of specific internal analysis did not reveal significant statistical correlations between the main economic indicators (GDP, unemployment rate, etc.) and solvency. However, impairment losses have increased in 2020 as a result of an increase in expected credit losses from counterparties (see notes 3.g.3 and 10.c).
Financial assets:
Cash surpluses are invested in the highest-rated local and foreign financial entities (with risk rating equivalent to investment grade where possible) with thresholds established for each entity.
Banks that have received investment grade ratings from the three major international rating agencies (Moody’s, S&P, and Fitch) are selected for making investments.
F-129
Investments may be backed with treasury bonds from the countries in which the company operates and/or with commercial papers issued by the highest rated banks; the latter are preferable as they offer higher returns (always in line with current investment policies).
It is noted that the downturn in the macroeconomic scenario due to COVID-19 had no significant impact on the counterparties’ credit quality.
The Group measures the Value at Risk (VaR) of its debt positions and financial derivatives in order to monitor the risk assumed by the Company, thereby reducing volatility in the statement of income.
The portfolio of positions included for purposes of calculating the present Value at Risk include:
| - | Financial debt. |
- Hedge derivatives for debt.
The VaR determined represents the potential variation in value of the portfolio of positions described above in a quarter with a 95% confidence level. To determine the VaR, we take into account the volatility of the risk variables affecting the value of the portfolio of positions, including:
| - | U.S. dollar LIBOR interest rate. |
| - | The different currencies with which our companies operate and the customary local indices used in the banking industry. |
- The exchange rates of the various currencies used in the calculation.
The calculation of VaR is based on generating possible future scenarios (one quarter) of market values for the risk variables based on scenarios based on actual observations for the same period (one quarter) during five years.
The quarter 95% confidence VaR number is calculated as the 5% percentile most adverse of the quarterly possible fluctuations.
Taking into consideration the assumptions previously described, the quarter VaR of the previously discussed positions was ThUS$407,000.
This value represents the potential increase of the Debt and Derivatives’ Portfolio, thus these VaR are inherently related, among other factors, to the Portfolio’s value at each quarter end.
F-130
Financial instruments, classified by type and category
| a) | The detail of financial assets, classified by type and category, as of December 31, 2020 and 2019, is as follows: |
| | | | |
| December 31, 2020 | |||
| Financial assets at fair value through profit or loss | Financial assets measured at amortized cost | Financial assets at fair value through other comprehensive income | Hedging financial derivatives |
| ThUS$ | ThUS$ | ThUS$ | ThUS$ |
Trade and other accounts receivable | — | 3,281,885 | — | — |
Derivative instruments | 37,420 | — | — | 49,045 |
Other financial assets | 119,704 | 24,110 | — | — |
Total Current | 157,124 | 3,305,995 | — | 49,045 |
| | | | |
Equity instruments | — | — | 268 | — |
Trade and other accounts receivable | — | 578,556 | — | — |
Derivative instruments | 148 | — | — | 29,487 |
Other financial assets | 2,493,609 | 267,351 | — | — |
Total Non-Current | 2,493,757 | 845,907 | 268 | 29,487 |
Total | 2,650,881 | 4,151,902 | 268 | 78,532 |
| | | | |
| December 31, 2019 | |||
| Financial assets at fair value with changes in results | Financial assets measured at amortized cost | Financial assets at fair value with changes in other comprehensive income | Hedging financial derivatives |
| ThUS$ | ThUS$ | ThUS$ | ThUS$ |
Trade and other accounts receivable | — | 3,520,826 | — | — |
Derivative instruments | 232 | — | — | 18,276 |
Other financial assets | 59,146 | 42,729 | — | — |
Total Current | 59,378 | 3,563,555 | — | 18,276 |
| | | | |
Equity instruments | — | — | 320 | — |
Trade and other accounts receivable | — | 588,804 | — | — |
Derivative instruments | 17,514 | — | — | 34,105 |
Other financial assets | 2,652,134 | 345,738 | — | — |
Total Non-Current | 2,669,648 | 934,542 | 320 | 34,105 |
Total | 2,729,026 | 4,498,097 | 320 | 52,381 |
F-131
b) The detail of financial liabilities, classified by type and category, as of December 31, 2020 and 2019, is as follows:
| | | |
| December 31, 2020 | ||
| Financial liabilities at fair value through profit or loss | Financial liabilities measured at amortized cost | Hedging financial derivatives |
| ThUS$ | ThUS$ | ThUS$ |
Interest-bearing loans | — | 1,815,160 | — |
Trade and other accounts payable | — | 4,649,782 | — |
Derivative instruments | 6,202 | — | 528 |
Other financial liabilities | 3,240 | 51,495 | — |
Total Current | 9,442 | 6,516,437 | 528 |
| | | |
Interest-bearing loans | — | 3,837,697 | — |
Trade and other accounts payable | — | 2,205,194 | — |
Derivative instruments | — | — | 9 |
Other financial liabilities | — | 91,070 | — |
Total Non-Current | — | 6,133,961 | 9 |
Total | 9,442 | 12,650,398 | 537 |
| | | |
| December 31, 2019 | ||
| Financial liabilities at fair value through profit or loss | Financial liabilities measured at amortized cost | Hedging financial derivatives |
| ThUS$ | ThUS$ | ThUS$ |
Interest-bearing loans | — | 1,478,831 | — |
Trade and other accounts payable | — | 4,218,250 | — |
Other financial liabilities | — | — | — |
Total Current | 2,047 | 5,697,081 | 9,173 |
| | | |
Interest-bearing loans | — | 4,889,422 | — |
Trade and other accounts payable | — | 2,334,556 | — |
Derivative instruments | 1,036 | — | — |
Total Non-Current | 1,036 | 7,223,978 | — |
Total | 3,083 | 12,921,059 | 9,173 |
23.2 |
The risk management policy of the Group uses primarily interest rate and foreign exchange rate derivatives to hedge its exposure to interest rate and foreign currency risks.
The Company classifies its hedges as follows:
| > | Cash flow hedges: Those that hedge the cash flows of the underlying hedged item. |
| > | Fair value hedges: Those that hedge the fair value of the underlying hedged item. |
| > | Non-hedge derivatives: Financial derivatives that do not meet the requirements established by IFRS to be designated as hedging instruments are recognized at fair value through profit or loss (financial assets held for trading). |
F-132
a) Assets and liabilities for hedge derivative instruments
As of December 31, 2020 and 2019, financial derivative qualifying as hedging instruments resulted in recognition of the following assets and liabilities in the statement of financial position:
| | | | | | | | |
| December 31, 2020 | December 31, 2019 | ||||||
| Asset | Liability | Asset | Liability | ||||
| Current | Non-Current | Current | Non-Current | Current | Non-Current | Current | Non-Current |
| ThUS$ | ThUS$ | ThUS$ | ThUS$ | ThUS$ | ThUS$ | ThUS$ | ThUS$ |
Interest rate hedge: | 306 | 18,416 | — | — | — | 12,400 | 317 | — |
Cash flow hedge | — | — | — | — | — | 12,400 | 317 | — |
Fair value hedge | 306 | 18,416 | — | — | — | — | — | — |
Exchange rate hedge: | 86,159 | 11,219 | 6,730 | 9 | 18,508 | 39,219 | 9,183 | 1,036 |
Cash flow hedge | 51,661 | 11,219 | 6,716 | 9 | 18,508 | 21,705 | 9,174 | — |
Fair value hedge | 34,498 | — | 14 | — | — | 17,514 | 9 | 1,036 |
TOTAL | 86,465 | 29,635 | 6,730 | 9 | 18,508 | 51,619 | 9,500 | 1,036 |
| - | General Information Related to Hedging Derivative Instruments |
Hedging derivative instruments and their corresponding hedged instruments are shown in the following table:
| | | | |
Type of Hedge Instrument | Description of | Description of hedged item | Fair Value of | Fair Value of |
SWAP | Interest rate | Bank loans | 53,221 | 8,670 |
SWAP | Exchange rate | Bank loans | 56,494 | 48,930 |
SWAP | Exchange rate | Unsecured obligations (bonds) | 3,682 | (17) |
FORWARD | Exchange rate | Operational Income | (2,725) | 2,008 |
FORWARD | Exchange rate | Bank loans | (802) | — |
FORWARD | Exchange rate | Unsecured obligations (bonds) | (509) | — |
As of December 31, 2020 and 2019, the Group has not recognized significant gains or losses for ineffective cash flow hedges.
For fair value hedges, the gain or losses on the hedging derivative instrument and on the underlying hedged item recognized for the years ended December 31, 2020, 2019 and 2018, is detailed in the following table:
| | | | | | |
| December 31, 2020 | December 31, 2019 | December 31, 2018 | |||
| Gains | Losses | Gains | Losses | Gains | Losses |
Hedging derivative instrument | 21,235 | — | 1,618 | — | — | 21,128 |
Underlying hedged item | — | 429 | 381 | — | 1,218 | — |
TOTAL | 21,235 | 429 | 1,999 | — | 1,218 | 21,128 |
b)Financial derivative instruments assets and liabilities at fair value through profit or loss
As of December 31, 2020 and 2019, financial derivative transactions recognized at fair value through profit or loss, resulted in the recognition of the following assets and liabilities in the statement of financial position:
| | | | | | | | |
| December 31, 2020 | December 31, 2019 | ||||||
| Assets | Liabilities | Assets | Liabilities | ||||
| Current | Non-Current | Current | Non-Current | Current | Non-Current | Current | Non-Current |
Non-hedging derivative instrument (1) | 1,321 | - | 3,240 | - | 1,523 | — | 1,720 | — |
| (1) | Correspond to forward contracts entered into by the Group mainly to hedge foreign exchange risk related to dividends received or to be received from its foreign subsidiaries. Although, the hedge relationship has economic substance, they do not comply with all the hedging documentation requirements set forth by IFRS 9 Financial Instruments to qualify for hedge accounting. |
F-133
| c) | Other information on derivatives: |
The following table sets forth the fair value of hedging and non-hedging derivatives entered into by the Group as well as the remaining contractual maturities as of December 31, 2020 and 2019:
| | | | | | | |
| December 31, 2020 | ||||||
| | Notional amount | |||||
| Fair value | Less than 1 year | 1 - 2 years | 2 - 3 years | 3 - 4 years | More than five years | Total |
Financial Derivatives | ThUS$ | ThUS$ | ThUS$ | ThUS$ | ThUS$ | ThUS$ | ThUS$ |
Interest rate hedge: | 18,722 | — | — | — | — | 153,944 | 153,944 |
Cash flow hedge | | — | — | — | — | 153,944 | 153,944 |
Fair value hedge | 18,722 | — | — | — | — | — | — |
Exchange rate hedge: | 88,720 | 884,039 | 87,972 | 76,972 | — | — | 1,048,983 |
Cash flow hedge | 56,155 | 771,860 | 87,972 | 76,972 | — | — | 936,804 |
Fair value hedge | 34,484 | 61,578 | — | — | — | — | 61,578 |
Derivatives not designated for hedge accounting | (1,919) | 50,601 | — | — | — | — | 50,601 |
TOTAL | 107,442 | 884,039 | 87,972 | 76,972 | — | 153,944 | 1,202,927 |
| | | | | | | |
| December 31, 2019 | ||||||
| | Notional Amount | |||||
| Fair value | Less than 1 year | 1 - 2 years | 2 - 3 years | 3 - 4 years | More than five years | Total |
Financial Derivatives | ThUS$ | ThUS$ | ThUS$ | ThUS$ | ThUS$ | ThUS$ | ThUS$ |
Interest rate hedge: | 12,083 | — | — | — | — | — | — |
Cash flow hedge | 12,083 | — | — | | — | — | — |
Exchange rate hedge: | 47,508 | 385,662 | 315,082 | 49,619 | — | — | 750,363 |
Cash flow hedge | 31,039 | 385,662 | 235,691 | 49,619 | — | — | 670,972 |
Fair value hedge | 16,469 | — | 79,391 | — | — | — | 79,391 |
Derivatives not designated for hedge accounting | (198) | 42,015 | — | — | — | — | 42,015 |
TOTAL | 59,393 | 427,677 | 315,082 | 49,619 | — | — | 792,378 |
The contractual maturities of hedging and non-hedging derivatives do not represent the Group’s total risk exposure, as the amounts presented in the above tables have been drawn up based on undiscounted contractual cash inflows and outflows for their settlement.
F-134
23.3 |
Financial instruments recognized at fair value in the consolidated statement of financial position are classified based on the hierarchies described in Note 3.h.
The following table presents financial assets and liabilities measured at fair value as of December 31, 2020 and 2019:
| | | | |
Financial Instruments Measured at Fair Value | Fair Value Measured at End of Reporting Period Using: | |||
| 12-31-2020 | Level 1 | Level 2 | Level 3 |
| ThUS$ | ThUS$ | ThUS$ | ThUS$ |
Financial Assets : | | | | |
Financial derivatives designated as cash flow hedge | 62,878 | — | 62,878 | — |
Financial derivatives designated as fair value hedge | 53,222 | — | 53,222 | — |
Financial derivatives not designated for hedge accounting | 1,321 | — | 1,321 | — |
Financial assets at fair value through other comprehensive income | 268 | — | 268 | — |
Financial assets at fair value through profit or loss | 2,611,992 | 143,843 | 2,468,149 | — |
Total | 2,729,681 | 143,843 | 2,585,838 | — |
Financial Liabilities: | | | | |
Financial derivatives designated as cash flow hedge | 6,725 | — | 6,725 | — |
Financial derivatives designated as fair value hedge | 14 | — | 14 | — |
Financial derivatives not designated for hedge accounting | 3,240 | — | 3,240 | — |
Total | 9,979 | — | 9,979 | — |
| | | | |
Financial Instruments Measured at Fair Value | Fair Value Measured at End of Reporting Period Using: | |||
| 12-31-2019 | Level 1 | Level 2 | Level 3 |
| ThUS$ | ThUS$ | ThUS$ | ThUS$ |
Financial Assets : | | | | |
Financial derivatives designated as cash flow hedge | 52,613 | — | 52,613 | — |
Financial derivatives designated as fair value hedge | 17,514 | — | 17,514 | — |
Financial derivatives not designated for hedge accounting | 1,522 | — | 1,522 | — |
Financial assets at fair value through other comprehensive income | 320 | — | 320 | — |
Financial assets at fair value through profit or loss | 2,709,757 | 57,693 | 2,652,064 | — |
Total | 2,781,726 | 57,693 | 2,724,033 | — |
Financial Liabilities: | | | | |
Financial derivatives designated as cash flow hedge | 9,491 | — | 9,491 | — |
Financial derivatives designated as fair value hedge | 1,045 | — | 1,045 | — |
Financial derivatives not designated for hedge accounting | 1,720 | | 1,720 | — |
Total | 12,256 | — | 12,256 | — |
F-135
24. CURRENT AND NON-CURRENT PAYABLES
The detail of Trade and Other Current Payables as of December 31, 2020 and 2019 is as follows:
| | | | | | | | |
| Current | Non-Current | ||||||
| 12-31-2020 | | 12-31-2019 | | 12-31-2020 | | 12-31-2019 | |
Trade and Other Payables | ThUS$ | | ThUS$ | | ThUS$ | | ThUS$ | |
Trade payables | | | | | | | | |
Energy suppliers | 1,323,617 | | 1,133,816 | | 100,517 | | 156,230 | |
Fuel and gas suppliers | 24,621 | | 26,936 | | — | | — | |
Payables for goods and services | 1,071,248 | | 960,395 | | 3,155 | | 4,410 | |
Payables for assets acquisitions | 49,332 | | 17,051 | | 10,990 | | 10,868 | |
Subtotal | 2,468,818 | | 2,138,198 | | 114,662 | | 171,508 | |
| | | | | | | | |
Other payables | | | | | | | | |
Dividends payable to third parties | 145,875 | | 255,632 | | — | | — | |
Payables to CAMMESA (1) (3) | 337,317 | | 131,866 | | 27,475 | | 51,430 | |
Penalties and complaints (2) (3) | 18,817 | | 31,325 | | 56,013 | | 93,464 | |
Research and development obligations | 154,595 | | 124,753 | | 40,925 | | 102,762 | |
Taxes payables other than income tax | 40,916 | | 196,309 | | 672 | | 1,441 | |
Accounts payables to employees | 154,269 | | 158,143 | | 1,136 | | 997 | |
PIS/COFINS on VAT (payable to consumers) (4) | 211,611 | | 169,405 | | 1,474,165 | | 1,420,320 | |
Regulatory Liabilities Brazilian Subsidiaries (5) | 418,680 | | 432,625 | | 186,946 | | 218,182 | |
Agreement Enel Distribución Sao Paulo with Eletrobras (6) | 68,501 | | 85,219 | | 134,925 | | 253,108 | |
Other payables | 74,177 | | 196,570 | | 24,556 | | 22,785 | |
Subtotal | 1,624,758 | | 1,781,847 | | 1,946,813 | | 2,164,489 | |
| | | | | | | | |
Total Trade and Other Payables | 4,093,576 | | 3,920,045 | | 2,061,475 | | 2,335,997 | |
Note 22.4 for the description of the liquidity risk management policy.
(1) As of December 31, 2020, the balance includes ThUS$320,918 from our subsidiary Edesur related to the payables for energy purchases from CAMMESA (ThUS$115,067 as of December 31, 2019). In addition, it included a total amount of ThUS$ 43,874 (ThUS$68,229 as of December 31, 2019) related to the agreements signed with CAMMESA for (i) financing the functional operational needs of the power generating plant of our subsidiary Enel Generación Costanera, (ii) financing the maintenance needs of the turbosteam generators in our subsidiary Dock Sud, and (iii) financing the Extraordinary Investment Plan our subsidiary Edesur.
(2) Correspond mainly to fines and complaints for the current and previous years, that our subsidiary Edesur S.A. has received from the regulating entity due to commercial service quality, quality of the technical product and public road safety. These fines have not been paid, since some are suspended by the Agreement Declaration signed in 2007 with the Argentine government. The value of these fines is updated in line with the changes in Distribution Added Value due to the tariff adjustments. As of December 31, 2020, ThUS$ 38,007 (ThUS$ 78,308 as of December 31, 2019) is included as a result of the application of ENRE Resolution No. 1/2016.
(3) On June 14, 2019, the Extraordinary Shareholders’ Meeting of Edesur ratified the agreement reached with the Government Secretariat of Energy (acting on behalf of the Argentine National State) in relation to the Regularization of Obligations. This agreement ended the outstanding reciprocal claims that arose in the 2006-2016 transition period. In this agreement, Edesur agreed to pay off remaining debts that arose in the above-mentioned transition period and committed to make investments in addition to those established in the Comprehensive Tariff Review for a total amount of ThUS$74,638 (approximately ARS 6,280 million). These expenses will be made over a maximum period of 5 years, and they are designed to contribute to the improvement, reliability and security of the service.
In turn, the Argentine National State agreed to assume Edesur’s obligations arising from debts related to loan agreements, energy purchases and corporate debts generated in the years 2017 and 2018, and it also committed to forgive sanctions payable to the Public Administration.
F-136
(4) See Note 9, discussing the recoverable PIS/COFINS Taxes.
(5) See Note 10(i).
(6) This corresponds to an agreement between Enel Distribución Sao Paulo and Eletrobrás ending a lawsuit between both parties dating from 1986. These amounts were duly provisioned (see Notes 25).
The detail of trade payables, both up to date and past due as of December 31, 2020 and 2019 are presented in Appendix 3.
| a) | The detail of provisions as of December 31, 2020 and 2019, is as follows: |
| | | | |
| Current | Non-Current | ||
| 12-31-2020 | 12-31-2019 | 12-31-2020 | 12-31-2019 |
Provisions | ThUS$ | ThUS$ | ThUS$ | ThUS$ |
Provisions for legal proceedings (*) | 192,411 | 250,030 | 748,640 | 872,521 |
Decommissioning or restoration (**) | 22,635 | 32,325 | 69,959 | 96,984 |
Provision for environmental issues | 600 | 632 | 7,072 | 609 |
Other provisions | 4,779 | 3,065 | 8,229 | 6,213 |
Total | 220,425 | 286,052 | 833,900 | 976,327 |
(*) The main contingencies are disclosed in Note 35.3.
(**) As of December 31, 2020, Emgesa has established decommissioning provisions for the electromechanical equipment of the Quimbo power plant and the water plant of the Termozipa power plant; the Quimbo power plant equipment is expected to be dismantled by 2066, while the water plant is expected to be dismantled in 2021.
The expected timing and amount of any cash outflows related to the above provisions is uncertain and depends on the final resolution of the related matters.
F-137
| b) | Changes in provisions as of December 31, 2020 and 2019, are as follows: |
| | | | | | | | |
| Legal Proceedings | | Decommissioning | | Environmental | | Total | |
Provisions | ThUS$ |
| ThUS$ |
| ThUS$ |
| ThUS$ |
|
Changes in Provisions | | | | | | | | |
Balance as of January 1, 2020 | 1,122,551 | | 129,309 | | 10,519 | | 1,262,379 | |
Increase (decrease) in existing provisions | 199,922 | | (26,906) | | 8,860 | | 181,876 | |
Provision used | (120,184) | | (6,654) | | (748) | | (127,586) | |
Effects update | 84,576 | | 3,514 | | 1,623 | | 89,713 | |
Foreign currency translation | (243,627) | | (6,529) | | 441 | | (249,715) | |
Transfer to P&L | (102,187) | | (140) | | (15) | | (102,342) | |
Total Changes in Provisions | (181,500) | | (36,715) | | 10,161 | | (208,054) | |
Balance as of December 31, 2020 | 941,051 | | 92,594 | | 20,680 | | 1,054,325 | |
| | | | | | | | |
| Legal Proceedings | | Decommissioning | | Environmental | | Total | |
Provisions | ThUS$ |
| ThUS$ |
| ThUS$ |
| ThUS$ |
|
Changes in Provisions | | | | | | | | |
Balance as of January 1, 2019 | 1,691,736 | | 87,720 | | 7,383 | | 1,786,839 | |
Increase (decrease) in existing provisions (1) | (308,689) | | 46,020 | | 12,631 | | (250,038) | |
Provision used | (155,974) | | (10,196) | | (8,178) | | (174,348) | |
Effects update | 113,879 | | 5,933 | | 154 | | 119,966 | |
Foreign currency translation | (114,476) | | (168) | | (1,067) | | (115,711) | |
Transfer to P&L | (103,925) | | — | | (404) | | (104,329) | |
Total Changes in Provisions | (569,185) | | 41,589 | | 3,136 | | (524,460) | |
Balance as of December 31, 2019 | 1,122,551 | | 129,309 | | 10,519 | | 1,262,379 | |
(1) It includes reclassification made to Trade and other payables originating in an agreement between Enel Distribución Sao Paulo and Eletrobrás ending a lawsuit between both parties dating from 1986 (see Note 24).
26. POST-EMPLOYMENT BENEFIT OBLIGATIONS
The Company and certain of its subsidiaries in Brazil, Colombia, Peru and Argentina granted various post-employment benefits for all or certain of their active or retired employees. These benefits are calculated and recognized in the financial statements according to the policy described in Note 3.m.1, and include primarily the following:
| a) | Defined benefit plans: |
| ● | Complementary pension: The beneficiary is entitled to receive a monthly amount that supplements the pension obtained from the respective social security system. |
| ● | Health Plan: Pursuant to collective bargaining agreements, the companies provide a health plan to their employees. This benefit is granted to employees in the Brazilian (Enel Distribución Goiás, Enel Distribución Rio and Enel Distribución Ceará) and Colombian (Emgesa and Codensa) companies. |
| b) | Other benefits |
Five-year benefit: A benefit certain employees receive after 5 years and which begins to accrue from the second year onwards. This benefit is provided to Emgesa and Codensa employees.
F-138
Employee severance indemnities: The beneficiary receives a certain number of contractual salaries upon retirement. Such benefit is subject to a vesting minimum service requirement period of 5 years. This benefit is provided to Enel Américas employees.
Unemployment: A benefit paid regardless of whether the employee is fired or leaves voluntarily. This benefit is accrued on a daily basis and is paid at the time of contract termination (although the law allows for partial withdrawals for housing and education). This benefit is provided to Emgesa and Codensa employees.
Seniority bonuses in Peru: There is an agreement to give employees (“subject to the collective bargaining agreement”) an extraordinary bonus for years of service upon completion of the equivalent of five years of actual work based on the following:
| |
Years of Service | Benefit |
For completing 5, 10 and 15 years | 1 basic monthly remuneration |
For completing 20 years | 1 ½ basic monthly remuneration |
For completing 25, 30, 35 & 40 years | 2 ½ basic monthly remunerations |
Education and Energy Plans: According to the collective bargaining Agreement, the Colombian companies Emgesa and Codensa grant education and electricity discount rates to their employees.
| c) | Defined contribution benefits: |
The Group makes contributions to a retirement benefit plan where the beneficiary receives additional pension supplements upon his/her retirement, disability or death.
26.2 Details, changes and presentation in financial statements
| a) | The post-employment obligations associated with defined benefits plans and the related plan assets as of December 31, 2020 and 2019: |
General ledger accounts:
| | |
| Balance as of | |
| 12-31-2020 | 12-31-2019 |
| ThUS$ | ThUS$ |
Post-employment obligations | 3,706,545 | 4,876,960 |
(-) Plan assets (*) | (2,097,081) | (3,090,862) |
Total | 1,609,464 | 1,786,098 |
Amount not recognized due to limit on Plan Assets Ceiling (**) | 14,753 | 49,780 |
Minimum funding required (IFRIC 14) (***) | — | 484 |
Total Post-Employment Obligations, Net (i) | 1,624,217 | 1,836,362 |
Reconciliation with general ledger accounts:
| | |
| Balance as of | |
| 12-31-2020 | 12-31-2019 |
| ThUS$ | ThUS$ |
Long-term post-employment obligations | 1,624,217 | 1,836,362 |
Pension plans | 1,489,472 | 1,683,668 |
Health plans | 106,242 | 123,534 |
Other plans | 28,503 | 29,160 |
Total Post-Employment Obligations, Net | 1,624,217 | 1,836,362 |
F-139
(*) Plan assets to fund defined benefit plans only in our Brazilian subsidiaries (Enel Distribución Rio S.A., Enel Distribución Ceará S.A., Enel Distribución Sao Paulo S.A. and Enel Distribución Goiás).
(**) In Enel Distribución Ceará S.A., certain pension plans currently have an actuarial surplus amounting to ThUS$14,753 as of December 31, 2020 (ThUS$49,780 as of December 31, 2019), which actuarial surplus was not recognized as an asset in accordance with IFRIC 14 - The Limit on a Defined Benefit Asset, Minimum Funding Requirements and their Interaction, because the Complementary Social Security (SPC) regulations - CGPC Resolution No. 26/2008 states that the surplus can only be used by the sponsor if the contingency reserve on the balance sheet of Faelce (an institution providing pension funds exclusively to employees and retired employees of Enel Distribución Ceará S.A.) is at the maximum percentage (25% of reserves). This ensures the financial stability of the plan based on the volatility of these obligations. If the surplus exceeds this limit, it may be used by the sponsor to reduce future contributions or be reimbursed to the sponsor.
(***) In Enel Distribución Rio S.A. has been recognized in accordance with the provisions of IFRIC 14 - The Limit on a Defined Benefit Asset, Minimum Funding Requirements and their Interaction an additional liability as of December 31, 2019 has been registered ThUS$484. This corresponds to actuarial debt contracts that the company signed with Brasiletros (an institution providing pension funds exclusively to employees and retired employees of Enel Distribución Rio S.A.). This was done to equalize deficits on certain pension plans, since the sponsor assumes responsibility for these plans, in accordance with current legislation.
b) The following amounts were recognized in the consolidated statement of comprehensive income for the years ended December 31, 2020, 2019 and 2018:
| | | |
| 12-31-2020 | 12-31-2019 | 12-31-2018 |
Expense Recognized in Comprehensive Income | ThUS$ | ThUS$ | ThUS$ |
Current service cost for defined benefits plan | 6,278 | 11,255 | 6,384 |
Interest cost for defined benefits plan | 276,103 | 357,751 | 269,331 |
Interest income from the plan assets | (174,136) | (251,095) | (190,284) |
Past Service Costs | (18,949) | (8,643) | (850) |
Defined benefit plan obligation reductions | (69,859) | — | — |
Interest cost on asset ceiling components | 2,936 | 2,016 | 4,373 |
Total expenses recognized in Profit or Loss | 22,373 | 111,284 | 88,954 |
(Gains) losses from remeasurement of defined benefit plans | 476,805 | 576,143 | 177,527 |
Total expense recognized in Comprehensive Income | 499,178 | 687,427 | 266,481 |
F-140
c) The rollforward of net actuarial liabilities as of December 31, 2020 and 2019, are as follows:
| |
Net Actuarial Liability | ThUS$ |
Balance as of January 1, 2019 | 1,343,507 |
Net interest cost | 108,672 |
Service cost | 11,255 |
Benefits paid | (12,668) |
Contributions paid | (121,088) |
Actuarial (gains) losses from changes in financial assumptions | 678,722 |
Actuarial (gains) losses from changes in experience adjustments | 144,140 |
Return on plan assets, excluding interest | (268,916) |
Changes in the asset limit | 27,679 |
Minimum finding required (IFRIC 14) | (5,483) |
Past service credit defined benefit plan obligations | (8,643) |
Transfer of employees | (153) |
Foreign currency translation differences | (60,662) |
Balance as of December 31, 2019 | 1,836,362 |
Net interest cost | 104,903 |
Service cost | 6,278 |
Benefits paid | (10,602) |
Contributions paid | (133,195) |
Actuarial (gains) losses from changes in financial assumptions | 33,096 |
Actuarial (gains) losses from changes in experience adjustments | 568,564 |
Return on plan assets, excluding interest | (97,592) |
Changes in the asset limit | (26,886) |
Minimum finding required (IFRIC 14) | (377) |
Past service credit defined benefit plan obligations (*) | (18,949) |
Foreign currency translation differences | 226 |
Transfer to Financial Debt (*) | (390,993) |
Defined benefit plan obligation reductions (*) | (176,759) |
Defined benefit plan obligation reductions (*) | (69,859) |
Balance as of December 31, 2020 | 1,624,217 |
(*) Voluntary Pension migration to the new defined Contributions Plan.
On April 13, 2020, our subsidiary Enel Distribución Sao Paulo approved the regulatory reform to the complementary retirement and pensions plan (hereinafter “PSAP”), which was effective from May 1, 2020, for the purpose of closing access to new plan participants. Additionally, and together with the National Superintendence of Complementary Pensions (“PREVIC”), it approved of a voluntary migration process to a new Defined Contribution Plan (hereinafter, “CD II plan”), exclusively for the employees belonging to the PSAP. The migration consisted of the transfer of participants from a defined benefit plan (PSAP) to a defined contribution plan (CD II plan), which also generates a programmed withdrawal option (as opposed to life annuities as in the PSAP). This voluntary migration process ended on December 31, 2020.
At the end of the process, 21.4% of the PSAP plan participants agreed to voluntarily transfer their savings to the CD II plan.
This migration generated a reduction in the net actuarial liability in the amount of ThUS$265,169, which is explained as follows:
• ThUS$176,759 corresponding to the portion of the obligation transferred to the CD II plan, in the same ratio as the mathematical reserves of the participants that opted for the migration. This transfer was formalized through a new exclusively financial debt contract and was reclassified to Other financial liabilities (current and non-current).
• ThUS$88,965 corresponding to (i) the net effect of the liquidation produced as a result of the migration, in the amount of ThUS$69,859; and (ii) ThUS$19,106 related to past service costs. With the partial migration, all future legal or constructive obligations, in relation to all or part of the benefits offered by the defined benefits plan, in proportion to the migrated participants. This effect was recognized as lower personnel expenses in the consolidated statement of income.
F-141
The Company will analyze the next steps in the restructuring plan with the final results of the plan, to be authorized by the competent regulatory authority.
d) The balance and changes in post-employment defined benefit obligations as of December 31, 2020 and 2019 are as follows:
| |
Actuarial Value of Post-employment Obligations | ThUS$ |
Balance as of January 1, 2019 | 4,235,466 |
Current service cost | 11,255 |
Interest cost | 357,751 |
Contributions from plan participants | 2,295 |
Foreign currency translation | (171,481) |
Contributions paid | (372,392) |
Defined benefit plan obligations from business combinations | (8,643) |
Transfer of employees | (153) |
Actuarial (gains) losses from changes in financial assumptions (*) | 678,722 |
Actuarial (gains) losses from changes in experience adjustments (*) | 144,140 |
Balance as of December 31, 2019 | 4,876,960 |
Current service cost | 6,278 |
Interest cost | 276,103 |
Contributions from plan participants | 778 |
Foreign currency translation | (1,075,063) |
Contributions paid | (294,910) |
Past service credit defined benefit plan obligations | (18,949) |
Transfer of employees | 226 |
Actuarial (gains) losses from changes in financial assumptions (*) | 33,096 |
Actuarial (gains) losses from changes in experience adjustments (*) | 568,564 |
Defined benefit plan obligation reductions | (666,538) |
Balance as of December 31, 2020 | 3,706,545 |
As of December 31, 2020, the post-employment benefit obligations are allocated as follows: 0.08% is from defined benefit plans in the Chilean holding company (0.06% as of December 31, 2019), 96.02% is from defined benefit plans in Brazilian companies (96.86% as of December 31, 2019), 3.35% is from defined benefit plans in Colombian companies (2.66% as of December 31, 2019), 0.38% is from defined benefit plans in Argentine companies (0.29% as of December 31, 2019), and the remaining 0.17% is from defined benefit plans in Peruvian companies (0.13% as of December 31, 2019).
Changes in the fair value of the benefit plan assets are as follows:
| |
Fair Value of Plan Assets | ThUS$ |
Balance as of January 1, 2019 | (2,919,501) |
Interest income | (251,095) |
Return on plan assets, excluding interest | (268,916) |
Foreign currency translation differences | 112,309 |
Employer contributions | (121,088) |
Benefit paid | (2,295) |
Contributions paid | 359,724 |
Balance as of December 31, 2019 | (3,090,862) |
Interest income | (174,136) |
Return on plan assets, excluding interest | (97,592) |
Foreign currency translation differences | 695,254 |
Employer contributions | (133,195) |
Benefits paid | (778) |
Contributions paid | 284,308 |
Transfer to Financial Debt | (176,759) |
Defined benefit plan obligation reductions | 596,679 |
Balance as of December 31, 2020 | (2,097,081) |
F-142
e) The main categories of benefit plan assets are as follows:
| | | | |
| 12-31-2020 | 12-31-2019 | ||
Category of Plan Assets | ThUS$ | % | ThUS$ | % |
Equity instruments (variable income) | 206,176 | 9.83% | 321,268 | 10.39% |
Fixed-income assets | 1,774,894 | 84.64% | 2,557,928 | 82.76% |
Real estate investments | 62,392 | 2.98% | 121,194 | 3.92% |
Other | 53,619 | 2.56% | 90,472 | 2.93% |
Total | 2,097,081 | 100% | 3,090,862 | 100% |
The plans for retirement benefits and pension funds held by our Brazilian subsidiaries, Enel Distribución Rio S.A., Enel Distribución Ceará, Enel Distribución Goias and Enel Distribución Sao Paulo, maintain investments as determined by the resolutions of the National Monetary Council, ranked in fixed income, equities and real estate. Fixed income investments are predominantly invested in federal securities. Regarding equities, i) Faelce (an institution providing pension funds exclusively to employees and retired employees of Enel Distribución Ceará) holds common shares of Enel Distribución Ceará, ii) Brasiletros (a similar institution for employees of Enel Distribución Rio), Eletra (an institution pension fund exclusively for employees and retired staff of Enel Distribución Goias) and Funcesp, (the private pension entity responsible for the administration of the benefit plans sponsored by Enel Distribución Sao Paulo) hold shares in investment funds with a portfolio traded on Bovespa (the São Paulo Stock Exchange). Finally, with regard to real estate, the foundations Faelce and Brasiletros have properties that are currently leased to Enel Distribución Rio and Enel Distribución Ceará, while in Eletra the real estate investments are exclusively for the own use of the foundation.
F-143
The following table sets forth the assets affected by the plans and invested in shares, leases and real estate owned by the Group.
| | |
| 12-31-2020 | 12-31-2019 |
| ThUS$ | ThUS$ |
Real Estate | 20,522 | 28,776 |
Total | 20,522 | 28,776 |
f) Reconciliation of asset ceiling:
| |
Reconciliation of Asset Ceiling | ThUS$ |
Balance as of January 1, 2019 | 21,463 |
Interest on assets not recognized | 2,016 |
Other changes in assets not recognized due to asset limit | 27,679 |
Foreign currency translation differences | (1,378) |
Balance as of December 31, 2019 | 49,780 |
Interest on assets not recognized | 2,936 |
Other changes in assets not recognized due to asset limit | (26,886) |
Foreign currency translation differences | (11,077) |
Total asset ceiling as of December 31, 2020 | 14,753 |
26.3 |
| ● | Actuarial assumptions: |
As of December 31, 2020 and 2019, the following assumptions were used in the actuarial calculation of defined benefit plans:
| | | | | | | | | | |
| Chile | Brazil | Colombia | Argentina | Peru | |||||
| 12-31-2020 | 12-31-2019 | 12-31-2020 | 12-31-2019 | 12-31-2020 | 12-31-2019 | 12-31-2020 | 12-31-2019 | 12-31-2020 | 12-31-2019 |
Discount rates used | 2.55% | 3.40% | 4,88% - 7,95% | 6,13% - 7,38% | 5.74% | 5,81 %- 5,85% | 49,36% - 54,46% | 49.42% | 3.50% | 4.30% |
Expected rate of salary increases | 3.80% | 3.80% | 4,52% - 5,04% | 5.04% | 4.85% | 4.90% | 37.68% - 42.25% | 42.30% | 4.00% | 4.00% |
Mortality tables | CB-H-2014 y RV-M-2014 | CB-H-2014 y RV-M-2014 | AT 2000 | AT 2000 | RV 2008 | RV 2008 | CB-H-2014 y RV-M-2014 | CB-H-2014 y RV-M-2014 | SPP-S-2017 | CB-H-2014 y RV-M-2014 |
Turnover rate | 7.25% | 8.02% | 5.19% | 5.63% | 0.46% | 0.45% | 1.26% | 1.28% | 5.20% | 5.02% |
| ● | Sensitivity: |
As of December 31, 2020, the sensitivity of the value of the actuarial liability for post-employment benefits to variations of 100 basis points in the discount rate assumes a decrease of ThUS$319,395 (ThUS$436,798 as of December 31, 2019) if the rate rises and an increase of ThUS$379,682 (ThUS$521,892 as of December 31, 2019) if the rate falls.
| ● | Defined contribution: |
The contributions made to the defined contribution plans are recorded in the item “employee expenses” in the consolidated statement of comprehensive income. The amounts recorded for this concept for the years ended December 31, 2020, 2019 and 2018 were ThUS$10,689, ThUS$13,419, and ThUS$11,736, respectively.
| ● | Future disbursements: |
According to the available estimate, the disbursements foreseen (net of assets) to cover the defined benefits plans for 2020 amount to ThUS$111,573.
F-144
| ● | Length of commitments: |
The Group’s obligations have a weighted average length of 9.72 years, and the outflows of benefits for the next 10 years and more is expected to be as follows:
| |
Years | ThUS$ |
1 | 295,800 |
2 | 282,531 |
3 | 277,690 |
4 | 272,007 |
5 | 264,229 |
Over 5 to 10 | 1,229,740 |
| ● | Multi-employer plans Enel Distribución Sao Paulo: |
FUNCESP is the entity in charge of the benefit plans sponsored by Enel Distribución Sao Paulo. Through negotiations with representative trade unions, the Company reformulated the plan in 1997, considering as its main characteristic a mixed model made up by 70% of the actual wage contributed as defined benefit and 30% of the actual wage contributed as established contribution. The purpose of this reformulation was to consider the actuarial technical deficit and to reduce the risk of future deficits.
The cost of the defined benefit plan is evenly divided between the Company and the employees according to the rates mentioned above. Rates of costs vary between 1.45% and 4.22%, according to the range of wages and they are annually reassessed by an independent actuary. The cost of the defined contribution is based on the percentage freely chosen by the participant (from 1% to 100% over 30% of the actual wage contributed), with a contribution of the Company of up to the limit of 5% over the 30% basis of the contribution remuneration (the contributions paid by the company were ThUS$ 113,203 and ThUS$87,632 for the years ended December 31, 2020 and 2019, respectively).
The Settled Proportional Supplementary Benefit - BSPS guarantees the plan participating employees that adhered to the model implemented in the Company’s privatization. This benefit will ensure the proportional value corresponding to the previous service period to the adherence date to the new mixed plan. This benefit will be paid from the date in which the participant completes the minimum times required under the regulation of the new plan.
F-145
27.1 |
27.1.1 | Subscribed and paid capital and number of shares |
The issued capital of the Company for the year ended December 31, 2020 is ThUS$9,763,078 divided into 76,086,311,036 authorized, subscribed and paid shares. The issued capital as of December 31, 2019 was ThUS$9,783,875 divided into 76,086,311,036 authorized, subscribed and paid shares. All of the shares issued by the Company are subscribed and paid, and they are listed for trade on the Bolsa de Comercio de Santiago de Chile, the Bolsa Electrónica de Chile, and the New York Stock Exchange (NYSE).
As of December 31, 2020, and 2019, the Group did not engage in any transaction of any kind with potential dilutive effects leading to diluted earnings per share that could differ from basic earnings per share.
At an Extraordinary Shareholders’ Meeting of Company held on April 30, 2019, shareholders approved a capital increase for an amount of US$3,000,000 by issuing 18,729,788,686 ordinary shares, no-par value, of the same series. The purpose of this capital increase was to enable the Company’s subsidiary Enel Brasil to repay a loan provided by Enel Finance International N.V., which replaced bank debt incurred by Enel Brasil for the acquisition of the Brazilian company Eletropaulo Metropolitana Eletricidade de Sao Paulo S.A. (currently Enel Distribución Sao Paulo), and to restructure the liabilities of the Enel Distribución Sao Paulo’s pension funds.
All new ordinary shares were offered preferably to shareholders on a pro rata basis based on the shares they own as of record in the Enel Américas shareholders registry, over two subscription periods. On June 26, 2019, the Company’s Board of Directors agreed that the subscription price of the 18,729,788,686 new shares, both in the first and second preemptive right subscription periods, would be US$ 0.162108214203236 per share.
During the first preemptive rights offering period held between June 27 and July 26, 2019, a total of 18,224,843,129 shares were subscribed and paid, representing 97.3% of the total of the new shares authorized for issuance under the capital increase mentioned above, for a total amount of ThUS$ 2,954,397.
During the subsequent rights offering period held between August 6 and August 29, 2019, a total of 408,826,391 shares were subscribed and paid, representing 80.96% of the total shares not subscribed in the first preemptive rights offer period and offered in the subsequent period, for a total amount of ThUS$ 66,274.
On September 12, 2019, the Company’s Board of Directors agreed not to place the remaining 96,119,166 shares and charged them to the capital increase which approximately amounted to 0.51% of the total shares which were pending subscription and payment after the end of the subsequent rights offering period. Therefore, and in accordance with the agreement of the Board, once the one-year period beginning April 30, 2019 has elapsed, the Company’s capital will be fully reduced to the amount actually paid at the expiration of the offerings indicated above.
As a result, during the capital increase process, a total of 18,633,669,520 shares were subscribed and paid for a total amount of ThUS$ 3,020,671.
At the extraordinary shareholders’ meeting held on December 18, 2020, the Company approved the following:
F-146
In order to complete the Merger, the Board approved a capital increase for Enel Américas in the amount of US$6,036,419,845, through the issuance of 31,195,387,525 new ordinary, nominative shares, of a single series and no par value. These will be fully subscribed and paid for in exchange for the incorporation of the EGP Américas equity, as an absorbed company, once the Merger becomes effective. For this purpose, 0.41 Enel Américas shares will be delivered for each share in EGP Américas held by EGP Américas’ sole shareholder, not considering fractions of shares.
The Merger is subject to compliance with certain conditions precedent agreed upon by the Board, which are detailed in the Merger Terms and Conditions which, at that date of these financial statements, are pending finalization (see Note 40).
27.1.2Dividends
The following table sets forth the dividends paid in the last four years:
| | | | | | | |
Dividend No. |
| Type of | Agreement Date | Payment Date | Total ThUS$ | Dolar per | Charged to |
96 | | Interim | 11-29-2017 | 01-26-2018 | 57,583 | 0.00100 | 2017 |
97 | | Final | 04-26-2018 | 05-25-2018 | 296,939 | 0.00517 | 2017 |
98 | | Interim | 11-26-2018 | 01-25-2019 | 76,900 | 0.00134 | 2018 |
99 | | Final | 04-30-2019 | 05-17-2019 | 403,652 | 0.00703 | 2018 |
100 | | Interim | 11-25-2019 | 01-24-2020 | 123,254 | 0.00162 | 2019 |
101 | | Final | 04-30-2020 | 05-29-2020 | 683,789 | 0.00899 | 2019 |
102 | | Interim | 11-26-2020 | 01-29-2021 | 72,992 | 0.00096 | 2020 |
27.2 |
The following table sets forth foreign currency translation differences attributable to the shareholders of the Company for the years ended December 31, 2020, 2019 and 2018:
| | | | | | |
| Balance as of December 31, | | ||||
Reserves for Accumulated Currency Translation Differences (*) | 2020 ThUS$ |
| 2019 ThUS$ |
| 2018 ThUS$ |
|
Empresa Distribuidora Sur S.A. | (715,165) | | (548,877) | | (378,929) | |
Compañía Distribuidora y Comercializadora de Energía S.A. | 87,339 | | 111,815 | | 115,658 | |
Enel Distribución Perú S.A.A. | (7,279) | | 50,466 | | 38,887 | |
Dock Sud | (122,728) | | (93,738) | | (63,680) | |
Enel Brasil S.A. | (2,924,373) | | (1,430,604) | | (1,133,980) | |
Enel Generación Costanera S.A. | (124,781) | | (88,477) | | (42,260) | |
Emgesa S.A. E.S.P. | (74,309) | | (38,296) | | (33,476) | |
Enel Generación El Chocón S.A. | (377,364) | | (318,303) | | (239,155) | |
Enel Peru S.A | 190,007 | | 190,030 | | 191,047 | |
Enel Generacion Perú S.A | (168,547) | | (94,082) | | (110,613) | |
Enel Generación Piura S.A. | (4,854) | | 7,583 | | 4,926 | |
Other | (66,242) | | (30,672) | | (14,534) | |
| | | | | | |
TOTAL | (4,308,296) | | (2,283,155) | | (1,666,109) | |
(*) See Note 2.9
27.3 |
The Company’s objective is to maintain an adequate level of capitalization in order to be able to secure its access to the financial markets, so as to fulfill its medium- and long-term goals while maximizing the return to its shareholders and maintaining a robust financial position.
F-147
27.4 | Restrictions on subsidiaries transferring funds to the parent (equity note) |
The company has certain subsidiaries that must comply with certain financial ratios or covenants, which require a minimum level of equity or contain other characteristics that restrict the transfer of assets to the parent company. As of December 31, 2020, the company’s participation in the net restricted assets of its subsidiaries Enel Distribución Río, Enel Distribución Ceará, Enel Distribución Perú amount to ThUS$432,412, ThUS$55,226, ThUS$325,800, respectively.
27.5 |
Other reserves for the years ended December 31, 2020, 2019 and 2018, are as follows:
| | | | | | | |
| | Balance as of January 1, 2020 | | 2020 changes | | Balance as of December 31, 2020 | |
|
| ThUS$ |
| ThUS$ |
| ThUS$ |
|
| | | | | | | |
Foreign currency translation difference (a) | | (2,283,155) | | (2,025,141) | | (4,308,296) | |
Cash flow hedges (b) | | (1,334) | | (8,049) | | (9,383) | |
Financial assets at fair value through other comprehensive income | | (687) | | (5) | | (692) | |
Other miscellaneous reserves (c) | | (3,006,823) | | 252,277 | | (2,754,546) | |
TOTAL | | (5,291,999) | | (1,780,918) | | (7,072,917) | |
| | | | | | | |
| | Balance as of January 1, 2019 | | 2019 changes | | Balance as of December 31, 2019 | |
| | ThUS$ | | ThUS$ | | ThUS$ | |
| | | | | | | |
Foreign currency translation difference (a) | | (1,666,109) | | (617,046) | | (2,283,155) | |
Cash flow hedges (b) | | (5,094) | | 3,760 | | (1,334) | |
Financial assets at fair value through other comprehensive income | | (397) | | (290) | | (687) | |
Other miscellaneous reserves (c) | | (3,209,283) | | 202,460 | | (3,006,823) | |
TOTAL | | (4,880,883) | | (411,116) | | (5,291,999) | |
| | | | | | | |
| | Balance as of January 1, 2018 | | 2018 changes | | Balance as of December 31, 2018 | |
| | ThUS$ | | ThUS$ | | ThUS$ | |
| | | | | | | |
Foreign currency translation difference (a) | | (453,995) | | (1,212,114) | | (1,666,109) | |
Cash flow hedges (b) | | (3,472) | | (1,622) | | (5,094) | |
Financial assets at fair value through other comprehensive income | | (175) | | (222) | | (397) | |
Other miscellaneous reserves (c) | | (3,408,922) | | 199,639 | | (3,209,283) | |
TOTAL | | (3,866,564) | | (1,014,319) | | (4,880,883) | |
| a) | Reserves for foreign currency translation differences: These reserves arise primarily from exchange differences relating to: |
| - | Translation of the financial statements of our subsidiaries with functional currencies other than the US dollar (see Note 2.9); and |
| - | Translation of goodwill arising from the acquisition of companies with functional currencies other than the US dollar (see Note 3.c). |
| b) | Cash flow hedge reserves: These reserves represent the cumulative effective portion of gains and losses on cash flow hedges (see Note 3.g.5). |
| c) | Other miscellaneous reserves. |
| - | The main items and their effects are the following: |
| | | | | | | |
Other Miscellaneous Reserves |
| 12-31-2020 ThUS$ |
| 12-31-2019 ThUS$ |
| 12-31-2018 ThUS$ |
|
| | | | | | | |
Reserve for capital increase in 2013 (1) | | (1,345,368) | | (1,345,368) | | (1,345,368) | |
Company restructuring reserve ("Division") (2) | | 716,712 | | 716,712 | | 716,712 | |
Reserve for subsidiaries transactions (3) | | (456,349) | | (456,349) | | (439,290) | |
Reserve for transition to IFRS (4) | | (1,490,605) | | (1,490,605) | | (1,490,605) | |
Reserve for Merger of Enel Américas, Endesa Américas and Chilectra Américas (5) | | (730,748) | | (730,748) | | (730,748) | |
Reserve for Tender Offer of Endesa Américas and withdrawal rights (6) | | (57,101) | | (57,101) | | (57,101) | |
Argentine hyperinflation (7) | | 675,139 | | 446,196 | | 205,130 | |
Reserve for Capital Increase year 2019 (8) | | — | | (20,797) | | — | |
Other miscellaneous reserves (9) | | (66,226) | | (68,763) | | (68,013) | |
| | | | | | | |
Total | | (2,754,546) | | (3,006,823) | | (3,209,283) | |
| | | | | | | |
| 1) | Reserve originated from the capital increase that the Company made during the first quarter of 2013. |
| 2) | Reserve for corporate reorganization (Spin-Offs of companies) completed on March 1, 2016. Corresponds to the effects from the reorganization of Enersis Américas and the separation of the Chilean business into a new entity, Enel Chile S.A. |
| 3) | Reserve from transactions with our subsidiaries. It corresponds to the effect of purchases of equity interests in subsidiaries that were accounted for as transactions between entities under common control. |
| 4) | Reserve for transition to IFRS. In accordance with Official Bulletin No. 456 from the SVS (Superintendencia de Valores y Seguros de Chile), included in this line item is the price-level restatement of paid-in capital from the date of transition to IFRS, January 1, 2004 to December 31, 2008. |
| 5) | Reserve for Merger of Endesa Américas and Chilectra Américas with and into the Company, completed on December 1, 2016. This represents the recognition of the difference between the capital increase in the Company and the carrying amount of the non-controlling interests that became part of the equity attributable to the owners of Enel Américas after completion of the Merger. The difference between the fair market value of the consideration received or paid and the amount by which the non-controlling interests is adjusted is being recognized in equity attributable to the owners of Enel Américas. |
| 6) | Reserve for Tender Offer of Endesa Américas and withdrawal rights. This represents the recognition of the difference between the carrying amount and the price paid for the non-controlling interests acquired in the Tender Offer on Endesa Américas, which resulted in a charge to other reserves for ThUS$56,578. It also, includes ThUS$523 related to the recognition of the difference between the carrying amount and the price paid for the shares of those shareholders who exercised their withdrawal rights. |
| 7) | Corresponds to the effect that our subsidiaries in Argentina have recognized through the application of IAS 29 on equity accounts. |
| 8) | Reserve for Capital Increase in 2019. As of December 31, 2019, the Company has recorded a charge of ThUS$20,797, which corresponds to expenses for the issuance and placement of shares, determined according to the accounting criteria described in Note 3.t). In December 2020, this reserve was reclassified and the Company’s capital was reduced (see Note 27.1.1). |
| 9) | Other miscellaneous reserves from transactions made in prior years. |
F-149
27.6 |
The detail of non-controlling interests as of December 31, 2020, 2019 and 2018, is as follows:
| | | | | | | | | | | | | |
| | Non-controlling interests | | ||||||||||
| | | | Equity | | Profit (Loss) | | ||||||
Companies |
| 12-31-2020 |
| 12-31-2020 |
| 12-31-2019 |
| 12-31-2020 |
| 12-31-2019 |
| 12-31-2018 |
|
Enel Distribución Río S.A. | | 0.27% | | 1,883 | | 2,510 | | 28 | | 192 | | 128 | |
Enel Distribución Ceará S.A. | | 25.95% | | 170,552 | | 214,442 | | 13,387 | | 26,753 | | 26,409 | |
Enel Distribución Sao Paulo | | 0.00% | | — | | — | | — | | 26,366 | | 907 | |
Compañía Distribuidora y Comercializadora de Energía S.A. | | 51.59% | | 513,182 | | 494,477 | | 117,923 | | 129,624 | | 106,363 | |
Emgesa S.A. E.S.P. | | 51.52% | | 779,121 | | 747,014 | | 178,980 | | 193,449 | | 178,045 | |
Enel Distribución Perú S.A. | | 16.85% | | 123,704 | | 121,098 | | 13,131 | | 21,651 | | 17,601 | |
Enel Generacion Perú S.A. | | 16.40% | | 133,466 | | 152,227 | | 20,705 | | 20,091 | | 25,177 | |
Chinango S.A.C. | | 33.12% | | 20,888 | | 22,604 | | 6,076 | | 6,318 | | 6,836 | |
Empresa Distribuidora Sur S.A. | | 27.91% | | 198,054 | | 223,785 | | (20,297) | | 50,352 | | 25,609 | |
Enel Generacion Costanera S.A. | | 24.38% | | 43,751 | | 40,738 | | 4,248 | | 14,125 | | 22,248 | |
Enel Generacion El Chocón S.A. | | 34.31% | | 97,986 | | 97,763 | | 18,141 | | 28,142 | | 31,031 | |
Inversora Dock Sud S.A. | | 42.86% | | 71,077 | | 77,378 | | 1,130 | | 18,723 | | 12,027 | |
Central Dock Sud S.A. | | 29.76% | | 64,709 | | 76,533 | | 1,271 | | 18,486 | | 11,921 | |
Enel Generacion Piura S.A. | | 3.50% | | 4,905 | | 5,463 | | 373 | | 778 | | 613 | |
Enel Distribución Goias | | 0.04% | | 462 | | 971 | | 10 | | (19) | | 313 | |
Luz de Angra Energia S.A. | | 49.00% | | 383 | | — | | — | | — | | — | |
Other | | | | 3,681 | | 2,896 | | 949 | | 647 | | 449 | |
TOTAL | | | | 2,227,804 | | 2,279,899 | | 356,055 | | 555,678 | | 465,677 | |
F-150
28. REVENUE AND OTHER OPERATING INCOME
The detail of revenue presented in the statement of comprehensive income for the years ended December 31, 2020, 2019 and 2018, is as follows:
| | | |
| For the years ended December 31, | ||
Revenues | 2020 | 2019 | 2018 |
Energy sales (1) | 9,655,212 | 11,282,254 | 10,409,176 |
Generation | 2,144,039 | 2,091,002 | 2,122,966 |
Regulated customers | 397,653 | 450,145 | 650,064 |
Unregulated customers | 883,045 | 1,045,965 | 989,311 |
Spot market sales | 852,363 | 577,579 | 464,030 |
Other customers | 10,978 | 17,313 | 19,561 |
Distribution | 7,511,173 | 9,191,252 | 8,286,210 |
Residential | 4,334,457 | 5,038,300 | 4,212,029 |
Business | 1,760,922 | 2,302,100 | 2,107,183 |
Industrial | 685,246 | 872,531 | 860,401 |
Other customers | 730,548 | 978,321 | 1,106,597 |
| | | |
Other sales | 36,968 | 58,752 | 48,968 |
Gas sales | 24,145 | 39,815 | 36,305 |
Other fuel sales | 6,861 | 9,037 | 8,322 |
Sales of goods and services | 5,962 | 9,900 | 4,341 |
| | | |
Revenue from other services | 1,546,796 | 1,712,370 | 1,466,617 |
Tolls and transmission | 1,280,994 | 1,433,538 | 1,187,546 |
Metering equipment leases | 126 | 118 | 130 |
Services and Business Advisories provided (Public lighting, connections and electrical advisories) | 177,818 | 191,392 | 212,023 |
Other services | 87,858 | 87,322 | 66,918 |
| | | |
Total revenues | 11,238,976 | 13,053,376 | 11,924,761 |
| | | |
| For the years ended December 31, | ||
Other Income | 2020 | 2019 | 2018 |
Revenue from construction contracts | 807,671 | 770,356 | 833,313 |
Regulatory agreement revenue (2) | 17,842 | 261,185 | — |
Other | 128,185 | 229,195 | 231,615 |
Total other income | 953,698 | 1,260,736 | 1,064,928 |
| (1) | As of December 31, 2020, a total of ThUS$1,051,011 is included in total revenue, corresponding to estimated and unbilled sales, which are related to estimates of energy sold in the month of December 2020. As of December 31, 2019 and 2018, the amounts correspond to ThUS$803,499 and ThUS$1,080,269, respectively. |
| (2) | 2020: see Note 35.6 (ii) Framework Agreement. |
2019: see Note 24. (3).
Includes inflation adjustment for the application of IAS 29 in Argentina (hyperinflationary economies), for US $57,752.
.
F-151
29. RAW MATERIALS AND CONSUMABLES USED
The detail of raw materials and consumables used presented in profit or loss for the years ended December 31, 2020, 2019 and 2018, is as follows:
| | | |
| For the years ended December 31, | ||
| 2020 | 2019 | 2018 |
Raw Materials and Consumables Used | ThUS$ | ThUS$ | ThUS$ |
Energy purchases | (5,337,887) | (6,096,863) | (5,654,358) |
Fuel consumption | (137,850) | (277,117) | (226,843) |
Gas | (113,992) | (246,044) | (184,654) |
Oil | (3,587) | (13,101) | (37,065) |
Coal | (20,271) | (17,972) | (5,124) |
Transportation costs | (1,016,486) | (1,110,921) | (944,304) |
Costs from construction contracts | (807,671) | (770,356) | (833,313) |
Other variable supplies and services | (256,021) | (285,766) | (289,582) |
Total Raw Materials and Consumables Used | (7,555,915) | (8,541,023) | (7,948,400) |
The detail of employee expenses for the years ended December 31, 2020, 2019 and 2018, are as follows:
| | | |
| For the years ended December 31, | ||
| 2020 | 2019 | 2018 |
Employee Benefits Expenses | ThUS$ | ThUS$ | ThUS$ |
Wages and salaries | (390,791) | (482,009) | (476,809) |
Post-employment benefit expense | 71,841 | (16,031) | (17,269) |
Social security and other contributions | (219,754) | (286,459) | (266,566) |
Other employee expenses | (26,342) | (25,254) | (79,849) |
Total Employee Benefits Expenses | (565,046) | (809,753) | (840,493) |
31. DEPRECIATION, AMORTIZATION AND IMPAIRMENT LOSSES OF PROPERTY, PLANT AND EQUIPMENT AND FINANCIAL ASSETS UNDER-IFRS 9
| a) | The detail of depreciation and amortization for the years ended December 31, 2020, 2019 and 2018, is as follows: |
| | | |
| For the years ended December 31, | ||
| 2020 | 2019 | 2018 |
Depreciation | (481,634) | (498,867) | (511,326) |
Amortization | (376,465) | (449,463) | (351,114) |
Subtotal | (858,099) | (948,330) | (862,440) |
F-152
| b) | The detail of the items related to impairment for the years ended December 31, 2020, 2019 and 2018, is as follows: |
| | | | | | | | | | | | | | | | | | | | | | | | | |
| | Generation | | Distribution | | Other | | For the year ended December 31, | | ||||||||||||||||
| | 2020 | | 2019 | | 2018 | | 2020 | | 2019 | | 2018 | | 2020 | | 2019 | | 2018 | | 2020 | | 2019 | | 2018 | |
Information on Impairment Losses by Reportable Segment |
| ThUS$ |
| ThUS$ |
| ThUS$ |
| ThUS$ |
| ThUS$ |
| ThUS$ |
| ThUS$ |
| ThUS$ |
| ThUS$ |
| ThUS$ |
| ThUS$ |
| ThUS$ |
|
Assets or disposal groups held for sale (See Note 5) | | — | | — | | — | | — | | 3,433 | | (5,234) | | | | | | | | — | | 3,433 | | (5,234) | |
Property, plants and equipment (see note 18) | | — | | (1,307) | | 66,987 | | — | | 9 | | — | | | | | | | | — | | (1,307) | | 66,987 | |
Total impairment (losses) reversals recognized in profit | | — | | (1,307) | | 66,987 | | — | | 3,433 | | (5,234) | | — | | — | | — | | — | | 2,126 | | 61,753 | |
Trade and other receivables (see note 10) | | (349) | | 645 | | (4,462) | | (211,289) | | (159,909) | | (110,209) | | 102 | | 14 | | | | (211,536) | | (159,250) | | (7,830) | |
Other assets | | (585) | | — | | (536) | | (30,251) | | (119,325) | | (6,495) | | — | | (550) | | (799) | | (30,836) | | (119,875) | | (114,671) | |
Impairment profit and reversals from impairment losses in accordance with IFRS 9 | | (934) | | 645 | | (4,998) | | (241,540) | | (279,234) | | (116,704) | | 102 | | (536) | | (799) | | (242,372) | | (279,125) | | (122,501) | |
Other miscellaneous operating expenses for the years ended December 31, 2020, 2019 and 2018, are as follows:
| | | |
| For the years ended December 31, | ||
| 2020 | 2019 | 2018 |
Other expenses | ThUS$ | ThUS$ | ThUS$ |
Professional, outsourced and other services | (473,655) | (518,101) | (473,787) |
Administrative expenses | (99,813) | (106,433) | (91,376) |
Repairs and maintenance | (232,305) | (253,036) | (203,381) |
Indemnities and fines | (8,886) | (11,535) | (11,966) |
Taxes and charges | (24,470) | (25,673) | (20,548) |
Insurance premiums | (39,525) | (38,755) | (37,793) |
Leases and rental costs | (10,641) | (10,341) | (27,885) |
Public relations and advertising | (9,175) | (11,811) | (12,737) |
Other supplies and services | (161,673) | (155,940) | (126,511) |
Travel expenses | (2,892) | (16,324) | (12,790) |
Environmental expenses | (2,243) | (2,760) | (2,311) |
Total | (1,065,278) | (1,150,709) | (1,021,085) |
Research expenses are recognized directly in income for the year. The amount of these expenses for the years ended December 31, 2020, 2019 and 2018, amounted to ThUS$54, ThUS$86 and ThUS$856, respectively.
F-153
Finance income and costs for the years ended December 31, 2020, 2019 and 2018, are as follows:
| | | |
| For the years ended December 31, | ||
| 2020 | 2019 | 2018 |
Finance Income | ThUS$ | ThUS$ | ThUS$ |
Cash and cash equivalents | 59,510 | 64,794 | 93,774 |
Financial income on plan assets (Brazil) (1) | 15 | 27 | 42 |
Financial income from concessions IFRIC 12 (Brazil) (2) | 99,071 | 73,345 | 73,911 |
Interest collected to customers on energy bills and invoices | 66,080 | 76,122 | 58,604 |
Other financial income (3) | 96,801 | 235,373 | 131,750 |
Total financial income | 321,477 | 449,661 | 358,081 |
| | | |
| For the years ended December 31, | ||
| 2020 | 2019 | 2018 |
Finance Costs | ThUS$ | ThUS$ | ThUS$ |
Finance Costs | (768,453) | (1,088,631) | (1,071,759) |
Bank loans | (70,023) | (134,024) | (162,192) |
Bonds payable | (208,630) | (281,359) | (312,204) |
Lease obligations | (9,396) | (11,712) | (8,170) |
Valuation of financial derivatives | (10,207) | (18,610) | (14,094) |
Financial restatement of provisions (4) | (89,713) | (119,966) | (147,194) |
Capitalized finance expenses | 7,561 | 15,703 | 19,329 |
Post-employment benefit obligations (1) | (104,918) | (108,699) | (83,463) |
Formalization of debt and other associated expenses | (7,134) | (11,323) | (17,883) |
Financial expenses - related parties (5) | (2,662) | (127,977) | (43,874) |
Other financial costs (6) | (273,331) | (290,664) | (302,014) |
Gains (losses) from indexed assets and liabilities (*) | 76,698 | 124,477 | 270,380 |
Foreign currency exchange differences (**) | 57,171 | 136,960 | 110,635 |
| | | |
Total financial costs | (634,584) | (827,194) | (690,744) |
| | | |
Total financial results | (313,107) | (377,533) | (332,663) |
| (1) | See Note 26.2. c). |
| (2) | For the years ended December 31, 2020, 2019 and 2018, this item corresponds to the financial update of non-amortized assets at their new replacement value at the end of the concession in the distribution companies Enel Distribución Río S.A., Enel Distribución Ceará S.A., Enel Distribución Goias S.A. and Enel Distribución Sao Paulo S.A. |
| (3) | For the year ended December 31, 2020, the Company records finance income generated by a financial restatement of PIS/COFINS taxes receivable of Enel Generación Fortaleza of ThUS$ 546 (ThUS$ 14,330 and ThUS$ 0 at December 31, 2019 and 2018, respectively), finance income from regulatory assets related to the Brazilian subsidiaries of ThUS$ 32,715 (ThUS$ 48,228 and ThUS$ 28,579 at December 31, 2019 and 2018, respectively), finance income from VOSA accounts receivable of Argentine generation subsidiaries of ThUS$ 12,387 (ThUS$ 80,738 and ThUS$ 12,894 as of December 31, 2019 and 2018, respectively), income from revaluation of investments due to change in ownership of Central Térmica Manuel Belgrano and Central Térmica San Martín for ThUS$ 24,893 (see Note 14) and other income for ThUS$ 26,260 (ThUS$ 92,077 and ThUS$ 90,277 as of December 31, 2019 and 2018, respectively). |
| (4) | For the year ended December 31, 2020, the Company includes ThUS$13,754 (ThUS$56,225 and ThUS$61,454 as of December 31, 2019 and 2018, respectively) of our subsidiary Edesur, corresponding to the finance cost generated by the update of the penalty for service quality due to the application of ENRE Resolution No. 1/2016 (See Note 24). Additionally, our Brazilian subsidiaries have recognized ThUS$70,622, and ThUS$54,002 and ThUS$61,087 during the years ended December 31, 2020, 2019 and 2018, respectively, for accounting update of legal claims. |
F-154
| (5) | For the year ended December 31, 2020, interest for debt with Enel Finance International NV for ThUS$ 2,662 (ThUS$ 127,977 and ThUS$ 43,874 as of December 31, 2019 and 2018, respectively) is included, related to the refinancing for the purchase Enel Distribución Sao Paulo (see note 11.d). |
| (6) | For the year ended December 31, 2020, it includes interest from the debt with CAMMESA for ThUS$ 88,415 (ThUS$ 91,864 and ThUS$ 111,680 as of December 31, 2019 and 2018, respectively), banking expenses for ThUS$ 32,533 (ThUS$ 53,458 and ThUS$ as of December 31, 2019 and 2018, respectively), finance costs for the sale of portfolio corresponding to the assignment of accounts receivable in our subsidiaries in Peru, Colombia and Brazil amounting to ThUS$ 0 (ThUS$5,950 and ThUS$ 23,471 as of December 31, 2019 and 2018, respectively), and others for ThUS$ 152,383 (ThUS$139,392 and ThUS$ 110,675 as of December 31, 2019 and 2018, respectively). |
(*) The effects on financial results by adjustment units and (**) exchange differences are as follows:
| | | | | | | |
| | For the years ended December 31, | | ||||
| | 2020 | | 2019 | | 2018 | |
Gains (losses) from Indexed Assets and Liabilities (*) | | ThUS$ | | ThUS$ | | ThUS$ | |
Inventories | | 27,150 | | 25,670 | | 2,099 | |
Investments accounted for using the equity method | | 48 | | 79 | | 128 | |
Intangible assets other than goodwill | | 11,601 | | 8,867 | | 5,218 | |
Goodwill | | 6,530 | | 8,858 | | 8,494 | |
Property, plant and equipment | | 485,353 | | 646,811 | | 621,219 | |
Deferred tax assets | | 14,665 | | 20,861 | | — | |
Deferred tax liabilities | | (89,669) | | (119,471) | | — | |
Total Equity | | (355,914) | | (382,962) | | (318,132) | |
Revenues | | (150,056) | | (346,360) | | (282,564) | |
Raw materials and consumables used | | 126,134 | | 241,081 | | 207,965 | |
Financial results | | 2,818 | | (1,559) | | 20,434 | |
Other Expenses | | (3,317) | | 95 | | (264) | |
Corporate tax | | 1,355 | | 22,507 | | 5,783 | |
| | | | | | | |
Gain from inflation-adjusted units | | 76,698 | | 124,477 | | 270,380 | |
| | | | | | | |
| | | | | | | |
| | | | | | | |
| | For the years ended December 31, | | ||||
| | 2020 | | 2019 | | 2018 | |
Foreign Currency Exchange Differences (**) | | ThUS$ | | ThUS$ | | ThUS$ | |
| | | | | | | |
Cash and cash equivalents | | 8,277 | | 3,553 | | 28,247 | |
Other financial assets | | 130,570 | | 57,818 | | 143,279 | |
Other non-financial assets | | 27,195 | | 379 | | 5,356 | |
Trade and other receivables | | 57,226 | | 210,587 | | 193,532 | |
Current tax assets (liabilities) | | — | | — | | 2,473 | |
Other financial liabilities (financial debt and derivative instruments) | | (30,988) | | (43,692) | | (144,669) | |
Trade and other payables | | (46,073) | | (45,142) | | (76,575) | |
Other non-financial liabilities | | (89,036) | | (46,543) | | (41,008) | |
| | | | | | | |
Total | | 57,171 | | 136,960 | | 110,635 | |
| 1) | Corresponds to the financial effect derived from the application of IAS 29 "Financial Reporting in Hyperinflationary Economies". (See Note 2.9) |
F-155
The Group’s activities operate under a matrix management structure with dual and cross management responsibilities (based on business and geographical areas of responsibility), and its subsidiaries are engaged in either the Generation and Transmission Business or the Distribution Business.
The Group adopted a “bottom-up” approach to determine its reportable segments. The Generation and Transmission and the Distribution reportable segments have been defined based on IFRS 8.9 and on the criteria described in IFRS 8.12, taking into account the aggregation of the operating segments having similar economic drivers that are common in all countries.
Generation and Transmission Business: The Generation and Transmission Reportable Segment is comprised of a group of electricity companies that own electricity generating plants, whose energy is transmitted and distributed to end customers.
The following four operating segments have been aggregated into one combined set of information for the Generation and Transmission Reportable Segment:
Generation and Transmission Reportable Segment:
| > | Generation and Transmission Business in Argentina |
| > | Generation and Transmission Business in Brazil |
| > | Generation and Transmission Business in Colombia |
| > | Generation and Transmission Business in Peru |
The Generation and Transmission Business is conducted: in Argentina through Enel Trading Argentina (formerly Cemsa), Central Dock Sud, Enel Generación Costanera, and Enel Generación El Chocón; in Brazil through EGP Cachoeira Dourada, Enel CIEN, EGP Proyecto I, Fortaleza, Enel Tecnología de Redes, Central Geradora Fotovolcaica Sao Francisco Ltda y Enel Trading Brasil S.A., in Colombia through Emgesa; and in Peru through Enel Generación Perú and Enel Generación Piura and Chinango.
Distribution Business: The Distribution Reportable Segment is comprised of a group of electricity companies operating under a public utility concession, with service obligations and regulated tariffs for supplying regulated customers in four different countries.
The following four operating segments have been aggregated into one combined set of information for the Distribution Reportable Segment:
Distribution Reportable Segment:
| > | Distribution Business in Argentina |
| > | Distribution Business in Brazil |
| > | Distribution Business in Colombia |
| > | Distribution Business in Peru |
The Distribution Business is conducted: in Argentina through Edesur; in Brazil through Enel Distribución Río S.A., Enel Distribución Ceará S.A., Enel Distribución Goias and Enel Distribución Sao Paulo (formerly Eletropaulo); in Colombia through Codensa; and in Peru through Enel Distribución Perú.
Each of the operating segments generates separate financial information, which is aggregated into one combined set of information for the Generation and Transmission Business, and another set of combined information for the
F-156
Distribution Business at the reportable segment level. In addition, in order to assist the decision maker process, the Planning & Control Department at the parent company level prepares internal reports containing combined information at the reportable segment level about the main key performance indicators (KPIs), such as: Gross Operating Result, Gross Margin, Total Capex, Total Opex, Net income, Total Energy Generation and Transmission, among others. The presentation of information under this business/country approach has been made taking into consideration that the KPIs are similar and comparable in all countries, in each of the following aspects:
| a) | the nature of the activities: generation and transmission, on one hand, and distribution on the other; |
| b) | the nature of the production processes: The Generation and Transmission Business deals with the generation of electricity and its transmission to dispatch centers, while the Distribution Business does not generate electricity, but distributes electricity to end customers; |
| c) | the type or class of customer for their products and services: The Generation and Transmission Business provides services mainly to unregulated customers, while the Distribution Business provides energy to regulated customers; |
| d) | the methods used to distribute their products or provide their services: generators generally sell the energy through energy auctions, while distributors provide energy in their concession area; and |
| e) | the nature of the regulatory environment (public utilities): the regulatory frameworks differs in the Generation and Transmission Business and Distribution Business |
The Company’s chief operating decision maker (“CODM”) in conjunction with the country managers reviews on a monthly basis these internal reports and uses the KPI information to make decisions on the allocation of resources and the assessment of the performance of the operating segments for each reportable segment.
The information disclosed in the following tables is based on the financial information of the companies forming each segment. The accounting policies used to determine the segment information are the same as those used in the preparation of the Group’s consolidated financial statements.
F-157
34.2 Generation and transmission, distribution and others
| | | | | | | | |
| Generation and Transmission | Distribution | Holdings, Eliminations and Others | Total | ||||
Line of business | 12-31-2020 | 12-31-2019 | 12-31-2020 | 12-31-2019 | 12-31-2020 | 12-31-2019 | 12-31-2020 | 12-31-2019 |
ASSETS | ThUS$ | ThUS$ | ThUS$ | ThUS$ | ThUS$ | ThUS$ | ThUS$ | ThUS$ |
CURRENT ASSETS | 1,752,168 | 1,401,368 | 4,321,551 | 4,513,289 | 105,537 | 666,597 | 6,179,256 | 6,581,254 |
Cash and cash equivalents | 678,856 | 593,058 | 748,245 | 649,538 | 79,892 | 696,401 | 1,506,993 | 1,938,997 |
Other current financial assets | 77,146 | 62,287 | 151,746 | 49,098 | 1,387 | 8,998 | 230,279 | 120,383 |
Other current non-financial assets | 70,693 | 68,906 | 430,800 | 374,419 | 59,293 | 42,837 | 560,786 | 486,162 |
Trade and other current receivables | 699,288 | 446,026 | 2,524,640 | 3,044,634 | 11,007 | 13,797 | 3,234,935 | 3,504,457 |
Current accounts receivable from related parties | 110,101 | 129,961 | 19,689 | 26,237 | (82,840) | (139,829) | 46,950 | 16,369 |
Inventories | 86,375 | 68,525 | 384,790 | 327,751 | 268 | (37) | 471,433 | 396,239 |
Current tax assets | 29,709 | 32,605 | 61,641 | 30,286 | 36,530 | 44,430 | 127,880 | 107,321 |
| | | | | | | — | — |
Non-current assets or disposal groups held-for-sale or held for distribution to owners | — | — | — | 11,326 | | | — | 11,326 |
| | | | | | | — | — |
NON-CURRENT ASSETS | 5,023,349 | 5,481,408 | 14,821,340 | 16,610,174 | 909,613 | 1,103,548 | 20,754,302 | 23,195,130 |
Other non-current financial assets | 293,011 | 345,968 | 2,497,735 | 2,703,694 | 117 | 149 | 2,790,863 | 3,049,811 |
Other non-current non-financial assets | 44,772 | 67,688 | 2,284,187 | 2,663,918 | 3,897 | 4,284 | 2,332,856 | 2,735,890 |
Trade and other non-current receivables | 280,119 | 311,858 | 297,872 | 275,915 | 533 | 184 | 578,524 | 587,957 |
Non-current accounts receivable from related parties | 43,945 | 54,002 | 32 | 68 | (43,945) | (53,223) | 32 | 847 |
Investments accounted for using the equity method | 111,027 | 104,875 | 1,596 | 1,710 | (110,350) | (104,607) | 2,273 | 1,978 |
Intangible assets other than goodwill | 136,560 | 67,708 | 4,370,876 | 5,441,246 | 17,390 | 18,925 | 4,524,826 | 5,527,879 |
Goodwill | — | — | — | — | 945,512 | 1,173,043 | 945,512 | 1,173,043 |
Property, plant and equipment | 3,953,188 | 4,351,508 | 4,396,560 | 4,399,515 | 4,924 | 12,415 | 8,354,672 | 8,763,438 |
Investment properties | — | — | 7,942 | 10,254 | — | — | 7,942 | 10,254 |
Right-of-use asset | 127,537 | 147,005 | 94,180 | 108,112 | 703 | 682 | 222,420 | 255,799 |
Deferred tax assets | 33,190 | 30,796 | 870,360 | 1,005,742 | 90,832 | 51,696 | 994,382 | 1,088,234 |
| | | | | | | | |
TOTAL ASSETS | 6,775,517 | 6,882,776 | 19,142,891 | 21,123,463 | 1,015,150 | 1,770,145 | 26,933,558 | 29,776,384 |
| | | | | | | | |
Line of business | Generation and Transmission | Distribution | Holdings, Eliminations and Others | Total | ||||
LIABILITIES AND EQUITY | 12-31-2020 | 12-31-2019 | 12-31-2020 | 12-31-2019 | 12-31-2020 | 12-31-2019 | 12-31-2020 | 12-31-2019 |
CURRENT LIABILITIES | 1,652,616 | 1,222,704 | 5,178,351 | 5,027,059 | 446,255 | 486,169 | 7,277,222 | 6,735,932 |
Other current financial liabilities | 317,285 | 240,865 | 1,020,125 | 847,463 | 487,720 | 362,965 | 1,825,130 | 1,451,293 |
Current lease liability | 21,478 | 580,450 | 29,753 | 38,758 | 264 | 237,036 | 51,495 | 856,244 |
Trade and other current payables | 881,993 | 122,443 | 3,081,693 | 3,102,559 | 129,890 | (146,000) | 4,093,576 | 3,079,002 |
Current accounts payable to related parties | 155,817 | 80,023 | 651,021 | 518,068 | (209,716) | 565 | 597,122 | 598,656 |
Other current provisions | 79,356 | 144,418 | 141,067 | 205,464 | 2 | 6,236 | 220,425 | 356,118 |
Other current non-financial liabilities | 45,960 | 54,505 | 185,313 | 240,883 | 25,367 | 25,367 | 256,640 | 320,755 |
| | | | | | | | |
Liabilities associated with groups of assets or disposal groups held for sale or distribution to owners | — | — | — | — | — | — | — | — |
| | | | | | | | |
NON-CURRENT LIABILITIES | 1,280,831 | 1,690,280 | 7,759,713 | 8,548,777 | 282,129 | 555,209 | 9,322,673 | 10,794,266 |
Other non-current financial liabilities | 727,682 | 1,051,275 | 2,518,301 | 3,134,569 | 591,723 | 595,989 | 3,837,706 | 4,781,833 |
Non-current lease liability | 11,591 | 20,506 | 78,882 | 87,742 | 597 | 377 | 91,070 | 108,625 |
Trade and other non-current payables | 979 | 4,178 | 2,049,498 | 2,320,943 | 10,998 | 10,876 | 2,061,475 | 2,335,997 |
Non-current accounts payable to related parties | 19,252 | 15,258 | 444,950 | 34,662 | (319,811) | (49,920) | 144,391 | — |
Other long-term provisions | 84,179 | 101,159 | 749,514 | 874,836 | 207 | 332 | 833,900 | 976,327 |
Deferred tax liabilities | 335,101 | 382,097 | 282,397 | 267,181 | (4,545) | (5,424) | 612,953 | 643,854 |
Non-current provisions for employee benefits | 32,753 | 33,720 | 1,588,504 | 1,799,663 | 2,960 | 2,979 | 1,624,217 | 1,836,362 |
Other non-current non-financial liabilities | 69,294 | 82,087 | 47,667 | 29,181 | — | — | 116,961 | 111,268 |
| | | | | | | | |
EQUITY | 3,842,070 | 3,969,792 | 6,204,827 | 7,547,627 | 286,766 | 728,767 | 10,333,663 | 12,246,186 |
Equity attributable to shareholders of Enel Américas | 3,842,070 | 3,969,792 | 6,204,827 | 7,547,627 | 286,766 | 728,767 | 8,105,859 | 9,966,287 |
Share and paid-in capital | 1,821,697 | 1,968,025 | 2,902,092 | 3,558,565 | 5,039,289 | 4,257,285 | 9,763,078 | 9,783,875 |
Retained earnings (losses) | 1,122,697 | 1,190,915 | (82,505) | 318,239 | 4,375,506 | 3,965,257 | 5,415,698 | 5,474,411 |
Issuance premiums | 37,138 | 38,888 | 55,685 | 58,011 | (92,823) | (96,899) | — | — |
Treasury shares in portfolio | (54) | — | — | — | 54 | — | — | — |
Other reserves | 860,592 | 771,964 | 3,329,555 | 3,612,812 | (9,035,260) | (7,396,876) | (7,072,917) | (5,291,999) |
| | | | | | | | |
Non-controlling interests | — | — | — | — | — | — | 2,227,804 | 2,279,899 |
| | | | | | | | |
Total Liabilities and Equity | 6,775,517 | 6,882,776 | 19,142,891 | 21,123,463 | 1,015,150 | 1,770,145 | 26,933,558 | 29,776,384 |
The Holding, Eliminations and Other column corresponds to transactions between companies in different lines of business and country, primarily purchases and sales of energy and services.
F-158
| | | | | | | | | | | | | | | | | | | | | | | | | |
| | Generation | | Distribution | | Holdings, Eliminations and Others | | Total | | ||||||||||||||||
Line of business |
| 12-31-2020 |
| 12-31-2019 |
| 12-31-2018 |
| 12-31-2020 |
| 12-31-2019 |
| 12-31-2018 |
| 12-31-2020 |
| 12-31-2019 |
| 12-31-2018 |
| 12-31-2020 |
| 12-31-2019 |
| 12-31-2018 |
|
REVENUE AND OTHER OPERATING INCOME | | 3,000,829 | | 3,057,056 | | 3,036,418 | | 9,969,814 | | 12,116,249 | | 10,739,115 | | (777,969) | | (859,193) | | (785,844) | | 12,192,674 | | 14,314,112 | | 12,989,689 | |
Revenues | | 2,977,178 | | 3,007,419 | | 2,961,895 | | 9,039,284 | | 10,905,824 | | 9,748,895 | | (777,486) | | (859,867) | | (786,029) | | 11,238,976 | | 13,053,376 | | 11,924,761 | |
Energy sales | | 2,880,510 | | 2,885,369 | | 2,814,879 | | 7,511,207 | | 9,734,017 | | 8,806,468 | | (736,505) | | (821,024) | | (692,024) | | 9,655,212 | | 11,798,362 | | 10,929,323 | |
Other sales | | 32,291 | | 48,946 | | 44,810 | | 5,221 | | 9,805 | | 4,158 | | (544) | | 1 | | — | | 36,968 | | 58,752 | | 48,968 | |
Other services rendered | | 64,377 | | 73,104 | | 102,206 | | 1,522,856 | | 1,162,002 | | 938,269 | | (40,437) | | (38,844) | | (94,005) | | 1,546,796 | | 1,196,262 | | 946,470 | |
Other income | | 23,651 | | 49,637 | | 74,523 | | 930,530 | | 1,210,425 | | 990,220 | | (483) | | 674 | | 185 | | 953,698 | | 1,260,736 | | 1,064,928 | |
| | | | | | | | | | | | | | | | | | | | | | | | | |
RAW MATERIALS AND CONSUMABLES USED | | (1,375,163) | | (1,218,451) | | (1,280,555) | | (6,953,255) | | (8,175,432) | | (7,456,629) | | 772,503 | | 852,860 | | 788,784 | | (7,555,915) | | (8,541,023) | | (7,948,400) | |
Energy purchases | | (918,086) | | (578,373) | | (757,914) | | (5,149,046) | | (6,323,836) | | (5,637,926) | | 729,245 | | 805,346 | | 741,482 | | (5,337,887) | | (6,096,863) | | (5,654,358) | |
Fuel consumption | | (137,850) | | (277,116) | | (226,843) | | — | | — | | — | | — | | (1) | | — | | (137,850) | | (277,117) | | (226,843) | |
Transportation expenses | | (226,531) | | (260,281) | | (187,111) | | (838,996) | | (903,489) | | (811,849) | | 49,041 | | 52,849 | | 54,656 | | (1,016,486) | | (1,110,921) | | (944,304) | |
Other miscellaneous supplies and services | | (92,696) | | (102,681) | | (108,687) | | (965,213) | | (948,107) | | (1,006,854) | | (5,783) | | (5,334) | | (7,354) | | (1,063,692) | | (1,056,122) | | (1,122,895) | |
| | | | | | | | | | | | | | | | | | | | | | | | | |
CONTRIBUTION MARGIN | | 1,625,666 | | 1,838,605 | | 1,755,863 | | 3,016,559 | | 3,940,817 | | 3,282,486 | | (5,466) | | (6,333) | | 2,940 | | 4,636,759 | | 5,773,089 | | 5,041,289 | |
| | | | | | | | | | | | | | | | | | | | | | | | | |
Other work performed by the entity and capitalized | | 3,946 | | 10,023 | | 9,467 | | 143,146 | | 171,479 | | 168,530 | | 59 | | 63 | | — | | 147,151 | | 181,565 | | 177,997 | |
Employee benefits expense | | (101,339) | | (114,226) | | (122,858) | | (442,217) | | (671,025) | | (694,262) | | (21,490) | | (24,502) | | (23,373) | | (565,046) | | (809,753) | | (840,493) | |
Other expenses | | (145,700) | | (136,526) | | (140,031) | | (859,869) | | (937,650) | | (816,247) | | (59,709) | | (76,533) | | (64,807) | | (1,065,278) | | (1,150,709) | | (1,021,085) | |
| | | | | | | | | | | | | | | | | | | | | | | | | |
GROSS OPERATING RESULT | | 1,382,573 | | 1,597,876 | | 1,502,441 | | 1,857,619 | | 2,503,621 | | 1,940,507 | | (86,606) | | (107,305) | | (85,240) | | 3,153,586 | | 3,994,192 | | 3,357,708 | |
| | | | | | | | | | | | | | | | | | | | | | | | | |
Depreciation and amortization expense | | (240,241) | | (261,958) | | (295,719) | | (614,224) | | (683,668) | | (567,471) | | (3,634) | | (2,704) | | 750 | | (858,099) | | (948,330) | | (862,440) | |
Impairment (losses) reversals recognized in profit or loss | | — | | (1,307) | | 66,987 | | — | | 3,433 | | (5,234) | | — | | — | | — | | — | | 2,126 | | 61,753 | |
Gains (losses) for impairment in accordance with IFRS 9 | | (934) | | 645 | | (4,998) | | (241,540) | | (279,234) | | (116,704) | | 102 | | (536) | | (799) | | (242,372) | | (279,125) | | (122,501) | |
| | | | | | | | | | | | | | | | | | | | | | | | | |
OPERATING INCOME | | 1,141,398 | | 1,335,256 | | 1,268,711 | | 1,001,855 | | 1,544,152 | | 1,251,098 | | (90,138) | | (110,545) | | (85,289) | | 2,053,115 | | 2,768,863 | | 2,434,520 | |
| | | | | | | | | | | | | | | | | | | | | | | | | |
FINANCIAL RESULT | | (56,160) | | 4,788 | | 70,220 | | (219,907) | | (261,637) | | (216,603) | | (37,040) | | (120,684) | | (186,280) | | (313,107) | | (377,533) | | (332,663) | |
Financial income | | 93,720 | | 153,668 | | 116,829 | | 223,020 | | 285,720 | | 223,121 | | 4,737 | | 10,273 | | 18,131 | | 321,477 | | 449,661 | | 358,081 | |
Cash and cash equivalents | | 32,879 | | 99,237 | | 84,253 | | 14,687 | | 26,372 | | 27,301 | | 11,944 | | 19,923 | | 21,626 | | 59,510 | | 145,532 | | 133,180 | |
Other financial income | | 60,841 | | 54,431 | | 32,576 | | 208,333 | | 259,348 | | 195,820 | | (7,207) | | (9,650) | | (3,495) | | 261,967 | | 304,129 | | 224,901 | |
Financial costs | | (149,750) | | (178,978) | | (203,183) | | (598,296) | | (745,402) | | (690,462) | | (20,407) | | (164,251) | | (178,114) | | (768,453) | | (1,088,631) | | (1,071,759) | |
Bank borrowings | | (3,945) | | (12,603) | | (18,221) | | (56,676) | | (92,211) | | (101,105) | | (9,402) | | (29,210) | | (42,866) | | (70,023) | | (134,024) | | (162,192) | |
Secured and unsecured obligations | | (70,317) | | (80,638) | | (98,979) | | (113,505) | | (175,496) | | (135,140) | | (24,808) | | (25,225) | | (78,085) | | (208,630) | | (281,359) | | (312,204) | |
Other | | (75,488) | | (85,737) | | (85,983) | | (428,115) | | (477,695) | | (454,217) | | 13,803 | | (109,816) | | (57,163) | | (489,800) | | (673,248) | | (597,363) | |
Income from indexation units | | (85,734) | | (83,759) | | 8,815 | | 161,586 | | 206,845 | | 260,137 | | 846 | | 1,391 | | 1,428 | | 76,698 | | 124,477 | | 270,380 | |
Foreign exchange profits (losses) | | 85,604 | | 113,857 | | 147,759 | | (6,217) | | (8,800) | | (9,399) | | (22,216) | | 31,903 | | (27,725) | | 57,171 | | 136,960 | | 110,635 | |
| | | | | | | | | | | | | | | | | | | | | | | | | |
Share of profit (loss) of associates and joint ventures accounted for using the equity method | | 2,630 | | 790 | | 2,171 | | 28 | | 20 | | (160) | | 475 | | (227) | | 441 | | 3,133 | | 583 | | 2,452 | |
Other gains (losses) | | 3,764 | | 1,287 | | 135 | | 903 | | 12,909 | | 546 | | 4 | | — | | — | | 4,671 | | 14,196 | | 681 | |
Gain (loss) from other investments | | 50 | | 1,042 | | 51 | | — | | 6 | | — | | 4 | | — | | — | | 54 | | 1,048 | | 51 | |
Gain (loss) from the sale of assets | | 3,714 | | 245 | | 84 | | 903 | | 12,903 | | 546 | | — | | — | | — | | 4,617 | | 13,148 | | 630 | |
| | | | | | | | | | | | | | | | | | | | | | | | | |
Profit (loss) before taxes | | 1,091,632 | | 1,342,121 | | 1,341,237 | | 782,879 | | 1,295,444 | | 1,034,881 | | (126,699) | | (231,456) | | (271,128) | | 1,747,812 | | 2,406,109 | | 2,104,990 | |
| | | | | | | | | | | | | | | | | | | | | | | | | |
Income tax expense (income) | | (326,573) | | (419,338) | | (449,235) | | (278,107) | | 160,650 | | (24,007) | | 38,120 | | 22,342 | | 35,310 | | (566,560) | | (236,346) | | (437,932) | |
| | | | | | | | | | | | | | | | | | | | | | | | | |
Profit (loss) from continuing operations | | 765,059 | | 922,783 | | 892,002 | | 504,772 | | 1,456,094 | | 1,010,874 | | (88,579) | | (209,114) | | (235,818) | | 1,181,252 | | 2,169,763 | | 1,667,058 | |
PROFIT (LOSS) | | 765,059 | | 922,783 | | 892,002 | | 504,772 | | 1,456,094 | | 1,010,874 | | (88,579) | | (209,114) | | (235,818) | | 1,181,252 | | 2,169,763 | | 1,667,058 | |
| | | | | | | | | | | | | | | | | | | | | | | | | |
Profit (loss) attributable to | | 765,059 | | 922,783 | | 892,002 | | 504,772 | | 1,456,094 | | 1,010,874 | | (88,579) | | (209,114) | | (235,818) | | 1,181,252 | | 2,169,763 | | 1,667,058 | |
Profit (loss) attributable to owners of the parent | | — | | — | | — | | — | | — | | — | | — | | — | | — | | 1,614,085 | | 1,614,085 | | 1,201,381 | |
Profit (loss) attributable to non-controlling interests | | — | | — | | — | | — | | — | | — | | — | | — | | — | | 555,678 | | 555,678 | | 465,677 | |
| | | | | | | | | | | | | | | | | | | | | | | | | |
Line of Business | | Generation | | Distribution | | Eliminations | | Total | | ||||||||||||||||
STATEMENT OF CASH FLOWS | | 12-31-2020 | | 12-31-2019 | | 12-31-2018 | | 12-31-2020 | | 12-31-2019 | | 12-31-2018 | | 12-31-2020 | | 12-31-2019 | | 12-31-2018 | | 12-31-2020 | | 12-31-2019 | | 12-31-2018 | |
| | | | | | | | | | | | | | | | | | | | | | | | | |
Net cash flows from (used in) operating activities | | 1,109,985 | | 1,052,312 | | 1,197,918 | | 1,448,867 | | 1,603,242 | | 771,791 | | (133,342) | | (128,043) | | (125,144) | | 2,425,510 | | 2,527,511 | | 1,844,565 | |
Net cash flows from (used in) investing activities | | (164,687) | | (84,523) | | (103,167) | | (1,364,627) | | (1,471,137) | | (1,022,549) | | (6,302) | | (44,138) | | (1,943,473) | | (1,535,616) | | (1,599,798) | | (3,069,189) | |
Net cash flows from (used in) financing activities | | (797,743) | | (1,039,947) | | (865,538) | | 40,508 | | (64,693) | | 367,923 | | (429,300) | | 281,736 | | 2,364,681 | | (1,186,535) | | (822,904) | | 1,867,066 | |
The Holding, Eliminations and Other column corresponds to transactions between companies in different lines of business and country, primarily purchases and sales of energy and services.
F-159
34.3 Segment information by country
| | | | | | | | | | | | | | | | | | | | | | | | | | | | | |
| | Holding | Argentina | Brazil | Colombia | Peru | Eliminations | Total | |||||||||||||||||||||
Country |
| 12-31-2020 |
| 12-31-2019 |
| 12-31-2020 |
| 12-31-2019 |
| 12-31-2020 |
| 12-31-2019 |
| 12-31-2020 |
| 12-31-2019 |
| 12-31-2020 | | 12-31-2019 |
| 12-31-2020 |
| 12-31-2019 |
| 12-31-2020 |
| 12-31-2019 |
|
CURRENT ASSETS | | 249,106 | | 709,462 | | 603,494 | | 626,439 | | 4,138,518 | | 4,304,036 | | 850,472 | | 560,017 | | 546,260 | | 551,843 | | (208,594) | | (170,543) | | 6,179,256 | | 6,581,254 | |
Cash and cash equivalents | | 8,050 | | 634,221 | | 139,448 | | 130,856 | | 741,381 | | 699,524 | | 383,257 | | 186,762 | | 234,857 | | 287,634 | | — | | — | | 1,506,993 | | 1,938,997 | |
Other current financial assets | | 116 | | 1,637 | | 65,382 | | — | | 160,734 | | 115,002 | | 4,047 | | 3,512 | | — | | 232 | | — | | — | | 230,279 | | 120,383 | |
Other current non-financial assets | | 16,730 | | 3,811 | | 42,123 | | 47,708 | | 411,573 | | 376,857 | | 27,496 | | 12,941 | | 62,864 | | 44,845 | | — | | — | | 560,786 | | 486,162 | |
Trade and other current receivables | | 1,587 | | 839 | | 310,882 | | 386,317 | | 2,407,709 | | 2,691,586 | | 331,070 | | 260,132 | | 182,959 | | 164,630 | | 728 | | 953 | | 3,234,935 | | 3,504,457 | |
Current accounts receivable from related parties | | 213,077 | | 59,808 | | 148 | | 12,368 | | 38,761 | | 109,394 | | 1,790 | | 2,072 | | 2,496 | | 4,223 | | (209,322) | | (171,496) | | 46,950 | | 16,369 | |
Inventories | | — | | — | | 42,883 | | 31,075 | | 272,754 | | 236,485 | | 102,781 | | 83,152 | | 53,015 | | 45,527 | | — | | — | | 471,433 | | 396,239 | |
Current tax assets | | 9,546 | | 9,146 | | 2,628 | | 18,115 | | 105,606 | | 75,188 | | 31 | | 120 | | 10,069 | | 4,752 | | — | | — | | 127,880 | | 107,321 | |
| | | | | | | | | | | | | | | | | | | | | | | | | | | | | |
Non-current assets or disposal groups held-for-sale or held for distribution to owners | | — | | — | | — | | — | | — | | — | | — | | 11,326 | | — | | — | | — | | — | | — | | 11,326 | |
| | | | | | | | | | | | | | | | | | | | | | | | | | | | | |
NON-CURRENT ASSETS | | 10,473,781 | | 10,105,798 | | 2,468,259 | | 2,622,717 | | 11,374,761 | | 13,482,703 | | 4,397,892 | | 4,371,244 | | 2,382,886 | | 2,561,433 | | (10,343,277) | | (9,948,765) | | 20,754,302 | | 23,195,130 | |
Other non-current financial assets | | — | | — | | 25,461 | | 3,209 | | 2,765,194 | | 3,046,431 | | 153 | | 171 | | 55 | | — | | — | | — | | 2,790,863 | | 3,049,811 | |
Other non-current non-financial assets | | 2,980 | | 3,125 | | 898 | | 3,354 | | 2,272,857 | | 2,690,639 | | 33,029 | | 21,844 | | 23,092 | | 16,760 | | — | | 168 | | 2,332,856 | | 2,735,890 | |
Trade and other non-current receivables | | 77 | | 126 | | 268,536 | | 308,730 | | 276,346 | | 236,555 | | 33,565 | | 42,546 | | — | | — | | — | | — | | 578,524 | | 587,957 | |
Non-current accounts receivable from related parties | | 225,000 | | 375,000 | | 32 | | 68 | | — | | 17,039 | | — | | — | | — | | — | | (225,000) | | (391,260) | | 32 | | 847 | |
Investments accounted for using the equity method | | 10,245,701 | | 9,726,059 | | 315,981 | | 357,963 | | — | | — | | 127 | | 141 | | — | | — | | (10,559,536) | | (10,082,185) | | 2,273 | | 1,978 | |
Intangible assets other than goodwill | | — | | — | | 61,159 | | 30,519 | | 4,256,831 | | 5,306,273 | | 135,881 | | 125,795 | | 70,955 | | 65,292 | | — | | — | | 4,524,826 | | 5,527,879 | |
Goodwill | | — | | — | | 4,523 | | 4,665 | | 494,129 | | 638,031 | | 5,601 | | 5,835 | | — | | — | | 441,259 | | 524,512 | | 945,512 | | 1,173,043 | |
Property, plant and equipment | | — | | — | | 1,762,799 | | 1,888,301 | | 304,256 | | 401,190 | | 4,158,620 | | 4,162,924 | | 2,128,997 | | 2,311,023 | | — | | — | | 8,354,672 | | 8,763,438 | |
Investment properties | | — | | — | | — | | — | | 7,942 | | 10,254 | | — | 0 | — | 0 | — | 0 | — | | — | | — | | 7,942 | | 10,254 | |
Right-of-use asset | | 24 | | 19 | | 124 | | 18 | | 43,099 | | 75,419 | | 19,639 | | 11,988 | | 159,534 | | 168,355 | | — | | — | | 222,420 | | 255,799 | |
Deferred tax assets | | (1) | | 1,469 | | 28,746 | | 25,890 | | 954,107 | | 1,060,872 | | 11,277 | | — | | 253 | | 3 | | — | | — | | 994,382 | | 1,088,234 | |
| | | | | | | | | | | | | | | | | | | | | | | | | | | | | |
TOTAL ASSETS | | 10,722,887 | | 10,815,260 | | 3,071,753 | | 3,249,156 | | 15,513,279 | | 17,786,739 | | 5,248,364 | | 4,931,261 | | 2,929,146 | | 3,113,276 | | (10,551,871) | | (10,119,308) | | 26,933,558 | | 29,776,384 | |
| | | | | | | | | | | | | | | | | | | | | | | | | | | | | |
| | Holding | Argentina | Brazil | Colombia | Peru | Eliminations | Total | |||||||||||||||||||||
Country |
| 12-31-2020 |
| 12-31-2019 |
| 12-31-2020 |
| 12-31-2019 |
| 12-31-2020 |
| 12-31-2019 |
| 12-31-2020 |
| 12-31-2019 |
| 12-31-2020 |
| 12-31-2019 |
| 12-31-2020 |
| 12-31-2019 |
| 12-31-2020 |
| 12-31-2019 |
|
CURRENT LIABILITIES | | 595,828 | | 508,799 | | 689,017 | | 746,901 | | 4,192,739 | | 3,918,889 | | 1,206,026 | | 876,231 | | 627,532 | | 482,477 | | (33,920) | | 202,635 | | 7,277,222 | | 6,735,932 | |
Other current financial liabilities | | 339,842 | | 362,520 | | 6,088 | | 7,282 | | 797,217 | | 813,061 | | 454,167 | | 169,543 | | 227,816 | | 56,001 | | — | | — | | 1,825,130 | | 1,408,407 | |
Current lease liability | | 19 | | 11 | | 78 | | 7 | | 15,702 | | 26,422 | | 4,792 | | 6,002 | | 30,904 | | 49,202 | | — | | — | | 51,495 | | 81,644 | |
Trade and other current payables | | 46,970 | | 62,072 | | 527,729 | | 438,227 | | 2,758,445 | | 2,569,032 | | 492,040 | | 460,442 | | 207,027 | | 235,240 | | 61,365 | | 155,032 | | 4,093,576 | | 3,920,045 | |
Current accounts payable to related parties | | 208,628 | | 83,446 | | 31,787 | | 119,403 | | 337,202 | | 134,906 | | 72,213 | | 62,468 | | 42,577 | | 46,685 | | (95,285) | | 47,603 | | 597,122 | | 494,511 | |
Other current provisions | | — | | 561 | | 45,167 | | 44,825 | | 77,844 | | 144,977 | | 40,176 | | 38,297 | | 57,238 | | 57,392 | | — | | — | | 220,425 | | 286,052 | |
Current tax liabilities | | — | | — | | 44,383 | | 92,080 | | 33,986 | | 6,741 | | 110,724 | | 108,167 | | 33,777 | | 13,739 | | — | | — | | 222,870 | | 220,727 | |
Other current non-financial liabilities | | 369 | | 189 | | 33,785 | | 45,077 | | 172,343 | | 223,750 | | 31,914 | | 27,521 | | 28,193 | | 24,218 | | — | | — | | 266,604 | | 320,755 | |
| | | | | | | | | | | | | | | | | | | | | | | | | | | | | |
Liabilities associated with groups of assets or disposal groups held for sale or distribution to owners | | — | | — | | — | | — | | — | | — | | — | | 3,791 | | — | | — | | — | | — | | — | | 3,791 | |
| | | | | | | | | | | | | | | | | | | | | | | | | | | | | |
NON-CURRENT LIABILITIES | | 597,203 | | 598,977 | | 509,899 | | 616,239 | | 6,168,982 | | 7,528,770 | | 1,537,229 | | 1,648,410 | | 734,467 | | 805,168 | | (225,107) | | (403,298) | | 9,322,673 | | 10,794,266 | |
Other non-current financial liabilities | | 591,722 | | 595,990 | | 40,785 | | 40,649 | | 1,539,623 | | 2,330,394 | | 1,251,199 | | 1,404,406 | | 414,377 | | 410,394 | | — | | — | | 3,837,706 | | 4,781,833 | |
Non-current lease liability | | — | | 8 | | 45 | | 7 | | 35,901 | | 58,800 | | 15,639 | | 6,191 | | 39,485 | | 43,619 | | — | | — | | 91,070 | | 108,625 | |
Trade and other non-current payables | | — | | — | | 86,559 | | 152,240 | | 1,962,061 | | 2,171,886 | | 1,136 | | 997 | | 11,719 | | 10,868 | | — | | 6 | | 2,061,475 | | 2,335,997 | |
Non-current accounts payable to related parties | | — | | — | | — | | 16,228 | | 369,498 | | 387,076 | | — | | — | | — | | — | | (225,107) | | (403,304) | | 144,391 | | — | |
Other long-term provisions | | — | | — | | 19,760 | | 23,710 | | 714,757 | | 848,183 | | 78,504 | | 49,659 | | 20,879 | | 54,775 | | — | | — | | 833,900 | | 976,327 | |
Deferred tax liabilities | | 2,521 | | — | | 286,936 | | 311,503 | | 40,030 | | 26,428 | | 63,683 | | 51,332 | | 219,783 | | 254,591 | | — | | — | | 612,953 | | 643,854 | |
Non-current provisions for employee benefits | | 2,960 | | 2,979 | | 13,920 | | 14,178 | | 1,476,884 | | 1,683,453 | | 124,248 | | 129,507 | | 6,205 | | 6,245 | | — | | — | | 1,624,217 | | 1,836,362 | |
Other non-current non-financial liabilities | | — | | | | 61,894 | | 57,724 | | 30,228 | | 22,550 | | 2,820 | | 6,318 | | 22,019 | | 24,676 | | — | | — | | 116,961 | | 111,268 | |
| | | | | | | | | | | | | | | | | | | | | | | | | | | | | |
EQUITY | | 9,529,856 | | 9,707,484 | | 1,872,837 | | 1,886,016 | | 5,151,558 | | 6,339,080 | | 2,505,109 | | 2,406,620 | | 1,567,147 | | 1,825,631 | | (10,292,844) | | (9,918,645) | | 10,333,663 | | 12,246,186 | |
Equity attributable to shareholders of Enel Américas | | 9,529,856 | | 9,707,484 | | 1,872,837 | | 1,886,016 | | 5,151,558 | | 6,339,080 | | 2,505,109 | | 2,406,620 | | 1,567,147 | | 1,825,631 | | (10,292,844) | | (9,918,645) | | 8,105,859 | | 9,966,287 | |
Share and paid-in capital | | 9,763,079 | | 9,783,875 | | 953,561 | | 936,444 | | 3,695,565 | | 4,123,929 | | 195,415 | | 203,580 | | 1,483,352 | | 1,618,125 | | (6,327,894) | | (6,882,078) | | 9,763,078 | | 9,783,875 | |
Retained earnings (losses) | | 3,008,390 | | 3,186,021 | | (121,454) | | 238,459 | | 197,561 | | 597,534 | | 972,249 | | 854,096 | | 272,808 | | 434,988 | | 1,086,144 | | 163,313 | | 5,415,698 | | 5,474,411 | |
Issuance premiums | | — | | — | 0 | — | | — | | 575,327 | | 742,877 | | 88,781 | | 92,490 | | 1,612 | | 1,758 | | (665,720) | | (837,125) | | — | | — | |
Treasury shares in portfolio | | | | | | | | | | (21,375) | | — | | | | | | | | | | 21,375 | | — | | — | | — | |
Other reserves | | (3,241,613) | | (3,262,412) | | 1,040,730 | | 711,113 | | 704,480 | | 874,740 | | 1,248,664 | | 1,256,454 | | (190,625) | | (229,240) | | (4,406,749) | | (2,362,755) | | (7,072,917) | | (5,291,999) | |
| | | | | | | | | | | | | | | | | | | | | | | | | | | | | |
Non-controlling interests | | — | | — | | — | | — | | — | | — | | — | | — | | — | | — | | — | | — | | 2,227,804 | | 2,279,899 | |
| | | | | | | | | | | | | | | | | | | | | | | | | | | | | |
Total Liabilities and Equity | | 10,722,887 | | 10,815,260 | | 3,071,753 | | 3,249,156 | | 15,513,279 | | 17,786,739 | | 5,248,364 | | 4,931,261 | | 2,929,146 | | 3,113,276 | | (10,551,871) | | (10,119,308) | | 26,933,558 | | 29,776,384 | |
The Eliminations column corresponds to transactions between companies in different lines of business and country, primarily purchases and sales of energy and services.
F-160
| | | | | | | | | | | | | | | | | | | | | |
| Holding | Argentina | Brazil | Colombia | Peru | Eliminations | Total | ||||||||||||||
Country | 12-31-2020 | 12-31-2019 | 12-31-2018 | 12-31-2020 | 12-31-2019 | 12-31-2018 | 12-31-2020 | 12-31-2019 | 12-31-2018 | 12-31-2020 | 12-31-2019 | 12-31-2018 | 12-31-2020 | 12-31-2019 | 12-31-2018 | 12-31-2020 | 12-31-2019 | 12-31-2018 | 12-31-2020 | 12-31-2019 | 12-31-2018 |
REVENUE AND OTHER OPERATING INCOME | 165 | 902 | 1,335 | 1,030,361 | 1,782,532 | 1,516,392 | 7,580,444 | 8,608,890 | 7,489,756 | 2,337,750 | 2,538,922 | 2,671,192 | 1,243,993 | 1,382,940 | 1,311,262 | (39) | (74) | (248) | 12,192,674 | 14,314,112 | 12,989,689 |
Revenues | — | — | — | 995,970 | 1,481,493 | 1,488,830 | 6,696,125 | 7,685,111 | 6,520,243 | 2,311,045 | 2,513,971 | 2,642,886 | 1,235,836 | 1,372,801 | 1,272,802 | — | — | — | 11,238,976 | 13,053,376 | 11,924,761 |
Energy sales | — | — | — | 958,852 | 1,435,040 | 1,443,845 | 5,944,342 | 6,805,945 | 5,865,566 | 1,564,664 | 2,250,753 | 2,388,426 | 1,187,354 | 1,306,624 | 1,231,486 | — | — | — | 9,655,212 | 11,798,362 | 10,929,323 |
Other sales | — | — | — | 2,431 | 2,771 | 191 | 698 | 3,755 | 2,225 | 23,990 | 28,737 | 23,232 | 9,849 | 23,489 | 23,320 | — | — | — | 36,968 | 58,752 | 48,968 |
Other services rendered | — | — | — | 34,687 | 43,682 | 44,794 | 751,085 | 875,411 | 652,452 | 722,391 | 234,481 | 231,228 | 38,633 | 42,688 | 17,996 | — | — | — | 1,546,796 | 1,196,262 | 946,470 |
Other income | 165 | 902 | 1,335 | 34,391 | 301,039 | 27,562 | 884,319 | 923,779 | 969,513 | 26,705 | 24,951 | 28,306 | 8,157 | 10,139 | 38,460 | (39) | (74) | (248) | 953,698 | 1,260,736 | 1,064,928 |
| | | | | | | | | | | | | | | | | | | | | |
RAW MATERIALS AND CONSUMABLES USED | (99) | — | — | (551,514) | (903,365) | (769,333) | (5,450,908) | (5,906,736) | (5,366,693) | (930,528) | (1,054,749) | (1,208,848) | (622,866) | (676,173) | (603,957) | — | — | 431 | (7,555,915) | (8,541,023) | (7,948,400) |
Energy purchases | — | — | — | (490,953) | (715,723) | (656,647) | (3,896,510) | (4,311,902) | (3,855,878) | (500,924) | (596,652) | (721,047) | (449,500) | (473,129) | (422,384) | — | 543 | 1,598 | (5,337,887) | (6,096,863) | (5,654,358) |
Fuel consumption | — | — | — | (1,180) | (100,579) | (21,095) | (41,363) | (58,506) | (18,151) | (39,785) | (49,225) | (53,414) | (55,522) | (68,807) | (134,183) | — | — | — | (137,850) | (277,117) | (226,843) |
Transportation expenses | — | — | — | (24,348) | (25,949) | (37,414) | (675,394) | (739,219) | (631,737) | (247,325) | (261,082) | (268,498) | (69,419) | (84,128) | (5,488) | — | (543) | (1,167) | (1,016,486) | (1,110,921) | (944,304) |
Other miscellaneous supplies and services | (99) | — | — | (35,033) | (61,114) | (54,177) | (837,641) | (797,109) | (860,927) | (142,494) | (147,790) | (165,889) | (48,425) | (50,109) | (41,902) | — | — | — | (1,063,692) | (1,056,122) | (1,122,895) |
| | | | | | | | | | | | | | | | | | | | | |
CONTRIBUTION MARGIN | 66 | 902 | 1,335 | 478,847 | 879,167 | 747,059 | 2,129,536 | 2,702,154 | 2,123,063 | 1,407,222 | 1,484,173 | 1,462,344 | 621,127 | 706,767 | 707,305 | (39) | (74) | 183 | 4,636,759 | 5,773,089 | 5,041,289 |
| | | | | | | | | | | | | | | | | | | | | |
Other work performed by the entity and capitalized | — | — | — | 31,296 | 48,095 | 54,308 | 76,744 | 89,871 | 83,214 | 28,877 | 32,179 | 29,408 | 10,234 | 11,420 | 11,067 | — | — | — | 147,151 | 181,565 | 177,997 |
Employee benefits expense | (5,957) | (7,695) | (6,732) | (154,984) | (200,284) | (265,521) | (234,994) | (434,266) | (402,618) | (107,827) | (102,834) | (99,856) | (61,284) | (64,674) | (65,766) | — | — | — | (565,046) | (809,753) | (840,493) |
Other expenses | (21,054) | (23,211) | (27,113) | (169,255) | (175,437) | (139,867) | (632,746) | (713,637) | (603,682) | (148,088) | (146,478) | (161,656) | (94,174) | (92,020) | (88,585) | 39 | 74 | (182) | (1,065,278) | (1,150,709) | (1,021,085) |
| | | | | | | | | | | | | | | | | | | | | |
GROSS OPERATING RESULT | (26,945) | (30,004) | (32,510) | 185,904 | 551,541 | 395,979 | 1,338,540 | 1,644,122 | 1,199,977 | 1,267,040 | 1,267,040 | 1,230,240 | 475,903 | 561,493 | 564,021 | — | — | 1 | 3,240,442 | 3,994,192 | 3,357,708 |
| | | | | | | | | | | | | | | | | | | | | |
Depreciation and amortization expense | — | — | — | (160,424) | (143,179) | (173,774) | (393,848) | (488,163) | (375,937) | (181,986) | (195,488) | (193,432) | (121,841) | (121,500) | (119,297) | — | — | — | (858,099) | (948,330) | (862,440) |
Impairment (losses) reversals recognized in profit or loss | — | — | — | — | — | 66,987 | — | — | — | — | 3,433 | (5,234) | — | (1,307) | — | — | — | — | — | 2,126 | 61,753 |
Gains (losses) for impairment in accordance with IFRS 9 | — | — | — | (44,434) | (42,541) | (56,654) | (167,469) | (225,557) | (55,843) | (16,442) | (6,609) | (9,440) | (14,027) | (4,418) | (564) | — | — | — | (242,372) | (279,125) | (122,501) |
| | | | | | | | | | | | | | | | | | | | | |
OPERATING INCOME | (26,945) | (30,004) | (32,510) | (18,954) | 365,821 | 232,538 | 777,223 | 930,402 | 768,197 | 981,756 | 1,068,376 | 1,022,134 | 340,035 | 434,268 | 444,160 | — | — | 1 | 2,053,115 | 2,768,863 | 2,434,520 |
| | | | | | | | | | | | | | | | | | | | | |
FINANCIAL RESULT | (21,872) | (31,514) | (19,825) | 65,733 | 160,817 | 257,912 | (292,686) | (374,162) | (430,868) | (119,660) | (140,101) | (159,753) | (26,007) | (30,553) | (18,583) | 81,385 | 37,980 | 38,454 | (313,107) | (377,533) | (332,663) |
Financial income | 25,063 | 37,675 | 47,281 | 85,954 | 122,200 | 107,807 | 211,101 | 291,262 | 215,449 | 13,848 | 11,548 | 19,748 | 6,508 | 8,632 | 8,583 | (20,997) | (21,656) | (40,787) | 321,477 | 449,661 | 358,081 |
Cash and cash equivalents | 4,066 | 16,018 | 7,245 | 40,218 | 90,691 | 75,692 | 4,727 | 25,405 | 33,259 | 7,743 | 8,573 | 12,533 | 2,756 | 4,845 | 4,451 | — | — | — | 59,510 | 145,532 | 133,180 |
Other financial income | 20,997 | 21,657 | 40,036 | 45,736 | 31,509 | 32,115 | 206,374 | 265,857 | 182,190 | 6,105 | 2,975 | 7,215 | 3,752 | 3,787 | 4,132 | (20,997) | (21,656) | (40,787) | 261,967 | 304,129 | 224,901 |
Financial costs | (62,972) | (50,740) | (61,869) | (148,439) | (189,401) | (226,859) | (414,707) | (679,377) | (614,811) | (132,205) | (151,500) | (177,537) | (31,127) | (39,268) | (31,469) | 20,997 | 21,655 | 40,786 | (768,453) | (1,088,631) | (1,071,759) |
Bank borrowings | (9,190) | (11,379) | (8,084) | (3,334) | (4,019) | (177) | (45,544) | (106,312) | (131,557) | (8,732) | (10,896) | (19,659) | (3,223) | (1,418) | (2,715) | — | — | — | (70,023) | (134,024) | (162,192) |
Secured and unsecured obligations | (24,809) | (25,225) | (25,736) | (1) | — | — | (67,717) | (112,770) | (124,722) | (91,178) | (116,309) | (133,916) | (24,925) | (27,055) | (27,830) | — | — | — | (208,630) | (281,359) | (312,204) |
Other | (28,973) | (14,136) | (28,049) | (145,104) | (185,382) | (226,682) | (301,446) | (460,295) | (358,532) | (32,295) | (24,295) | (23,962) | (2,979) | (10,795) | (924) | 20,997 | 21,655 | 40,786 | (489,800) | (673,248) | (597,363) |
Income from indexation units | — | — | — | 76,698 | 124,477 | 270,380 | — | — | — | — | — | — | — | — | — | — | — | — | 76,698 | 124,477 | 270,380 |
Foreign exchange profits (losses) | 16,037 | (18,449) | (5,237) | 51,520 | 103,541 | 106,584 | (89,080) | 13,953 | (31,506) | (1,303) | (149) | (1,964) | (1,388) | 83 | 4,303 | 81,385 | 37,981 | 38,455 | 57,171 | 136,960 | 110,635 |
Positive | | 116,355 | 39,694 | | 238,739 | 262,165 | | 310,024 | 402,562 | | 16,563 | 12,950 | | 27,039 | 22,096 | | (118,866) | (183,342) | | | 589,854 |
Negative | | (134,804) | (44,931) | | (135,198) | (155,581) | | (296,071) | (434,068) | | (16,712) | (14,914) | | (26,956) | (17,793) | | 156,847 | 221,797 | | | (452,894) |
| | | | | | | | | | | | | | | | | | | | | |
Share of profit (loss) of associates and joint ventures accounted for using the equity method | 475 | (227) | 441 | 2,658 | 810 | 2,011 | — | — | — | — | | — | — | — | — | — | — | — | 3,133 | 583 | 2,452 |
Other gains (losses) | — | — | — | 61 | 1,080 | 74 | 870 | 2,144 | 386 | 124 | 308 | 190 | 3,616 | 10,664 | 31 | — | — | — | 4,671 | 14,196 | 681 |
Gain (loss) from other investments | — | — | — | 54 | 1,041 | 51 | — | 1 | — | — | 6 | — | — | — | — | — | — | — | 54 | 1,048 | 51 |
Gain (loss) from the sale of assets | — | — | — | 7 | 39 | 23 | 870 | 2,143 | 386 | 124 | 302 | 190 | 3,616 | 10,664 | 31 | — | — | — | 4,617 | 13,148 | 630 |
| | | | | | | | | | | | | | | | | | | | | |
Profit (loss) before taxes | (48,342) | (61,745) | (51,894) | 49,498 | 528,528 | 492,535 | 485,407 | 558,384 | 337,715 | 862,220 | 928,583 | 862,571 | 317,644 | 414,379 | 425,608 | 81,385 | 37,980 | 38,455 | 1,747,812 | 2,406,109 | 2,104,990 |
| | | | | | | | | | | | | | | | | | | | | |
Income tax expense (income) | (3,840) | 9,598 | (7,137) | (36,154) | (132,137) | (203,661) | (147,963) | 313,730 | 217,748 | (286,707) | (302,350) | (310,823) | (91,896) | (125,187) | (134,059) | — | — | — | (566,560) | (236,346) | (437,932) |
| | | | | | | | | | | | | | | | | | | | | |
Profit (loss) from continuing operations | (52,182) | (52,147) | (59,031) | 13,344 | 396,391 | 288,874 | 337,444 | 872,114 | 555,463 | 575,513 | 626,233 | 551,748 | 225,748 | 289,192 | 291,549 | 81,385 | 37,980 | 38,455 | 1,181,252 | 2,169,763 | 1,667,058 |
PROFIT (LOSS) | (52,182) | (52,147) | (59,031) | 13,344 | 396,391 | 288,874 | 337,444 | 872,114 | 555,463 | 575,513 | 626,233 | 551,748 | 225,748 | 289,192 | 291,549 | 81,385 | 37,980 | 38,455 | 1,181,252 | 2,169,763 | 1,667,058 |
| | | | | | | | | | | | | | | | | | | | | |
Profit (loss) attributable to | (52,182) | (52,147) | (59,031) | 13,344 | 396,391 | 288,874 | 337,444 | 872,114 | 555,463 | 575,513 | 626,233 | 551,748 | 225,748 | 289,192 | 291,549 | 81,385 | 37,980 | 38,455 | 1,181,252 | 2,169,763 | 1,667,058 |
Profit (loss) attributable to owners of the parent | (52,182) | — | — | — | — | — | — | — | — | | | — | — | — | — | — | — | — | 825,197 | 1,614,085 | 1,201,381 |
Profit (loss) attributable to non-controlling interests | — | — | — | — | — | — | — | — | — | | | — | — | — | — | — | — | — | 356,055 | 555,678 | 465,677 |
| | | | | | | | | | | | | | | | | | | | | |
Line of Business | Holding | Argentina | Brazil | Colombia | Peru | Eliminations | Total | ||||||||||||||
STATEMENT OF CASH FLOWS | 12-31-2020 | 12-31-2019 | 12-31-2018 | 12-31-2020 | 12-31-2019 | 12-31-2018 | 12-31-2020 | 12-31-2019 | 12-31-2018 | 12-31-2020 | 12-31-2019 | 12-31-2018 | 12-31-2020 | 12-31-2019 | 12-31-2018 | 12-31-2020 | 12-31-2019 | 12-31-2018 | 12-31-2020 | 12-31-2019 | 12-31-2018 |
| | | | | | | | | | | | | | | | | | | | | |
Net cash flows from (used in) operating activities | (52,803) | (49,135) | (34,496) | 272,134 | 241,095 | 157,539 | 922,297 | 999,122 | 299,827 | 939,651 | 865,922 | 1,030,940 | 342,021 | 454,719 | 390,044 | 2,210 | 15,788 | 711 | 2,425,510 | 2,527,511 | 1,844,565 |
Net cash flows from (used in) investing activities | 175,657 | (2,220,047) | 348,295 | (169,918) | (175,679) | (98,752) | (755,047) | (855,965) | (2,434,755) | (464,647) | (386,559) | (378,451) | (176,299) | (208,685) | (89,786) | (145,362) | 2,247,137 | (415,740) | (1,535,616) | (1,599,798) | (3,069,189) |
Net cash flows from (used in) financing activities | (719,042) | 2,475,888 | (52,458) | (59,659) | (47,566) | (23,844) | (55,832) | (66,875) | 2,389,830 | (303,393) | (705,497) | (601,744) | (192,090) | (215,929) | (259,879) | 143,481 | (2,262,925) | 415,161 | (1,186,535) | (822,904) | 1,867,066 |
The Eliminations column corresponds to transactions between companies in different lines of business and country, primarily purchases and sales of energy and services.
F-161
34.4 Generation and Transmission, and Distribution by Country
a) Generation and transmission
| | | | | | | | | | | | | |
| | | | | | | | | | | | | |
Line of business | | Argentina | Brazil | Colombia | Peru | Eliminations | Total | ||||||
Country |
| 12-31-2020 | 12-31-2019 | 12-31-2020 | 12-31-2019 | 12-31-2020 | 12-31-2019 | 12-31-2020 | 12-31-2019 | 12-31-2020 | 12-31-2019 | 12-31-2020 | 12-31-2019 |
CURRENT ASSETS | | 297,094 | 329,778 | 725,298 | 489,030 | 353,946 | 251,413 | 375,830 | 433,281 | — | (102,134) | 1,752,168 | 1,401,368 |
Cash and cash equivalents | | 80,741 | 91,497 | 167,713 | 179,541 | 239,549 | 86,361 | 190,853 | 235,659 | — | — | 678,856 | 593,058 |
Other current financial assets | | 41,991 | — | 31,382 | 58,849 | 3,773 | 3,206 | — | 232 | — | — | 77,146 | 62,287 |
Other current non-financial assets | | 12,401 | 28,264 | 25,705 | 30,114 | 9,254 | 2,858 | 23,333 | 7,670 | — | — | 70,693 | 68,906 |
Trade and other current receivables | | 111,216 | 161,872 | 444,478 | 113,029 | 70,578 | 78,136 | 73,008 | 92,989 | 8 | — | 699,288 | 446,026 |
Current accounts receivable from related parties | | 18,509 | 16,139 | 38,033 | 96,370 | 926 | 55,821 | 52,641 | 63,765 | (8) | (102,134) | 110,101 | 129,961 |
Inventories | | 29,608 | 13,944 | 320 | 391 | 29,866 | 25,031 | 26,581 | 29,159 | — | — | 86,375 | 68,525 |
Current tax assets | | 2,628 | 18,062 | 17,667 | 10,736 | — | — | 9,414 | 3,807 | — | — | 29,709 | 32,605 |
| | | | | | | | | | | | | |
| | | | | | | | | | | | | |
NON-CURRENT ASSETS | | 715,591 | 838,459 | 693,610 | 791,639 | 2,420,482 | 2,524,074 | 1,193,666 | 1,328,046 | — | (810) | 5,023,349 | 5,481,408 |
Other non-current financial assets | | 25,454 | 3,200 | 267,351 | 342,599 | 151 | 169 | 55 | — | — | — | 293,011 | 345,968 |
Other non-current non-financial assets | | 839 | 3,265 | 12,463 | 37,866 | 8,378 | 9,797 | 23,092 | 16,760 | — | — | 44,772 | 67,688 |
Trade and other non-current receivables | | 268,076 | 308,084 | 8,020 | 25 | 4,023 | 3,749 | — | — | — | — | 280,119 | 311,858 |
Non-current accounts receivable from related parties | | 18,411 | 34,662 | — | 1,758 | — | | 25,534 | 18,392 | — | (810) | 43,945 | 54,002 |
Investments accounted for using the equity method | | 1,145 | 572 | 55,520 | 45,123 | 2,475 | 2,579 | 51,887 | 56,601 | — | — | 111,027 | 104,875 |
Intangible assets other than goodwill | | 11,092 | 154 | 69,419 | 8,655 | 30,113 | 32,433 | 25,945 | 26,466 | — | — | 136,569 | 67,708 |
Property, plant and equipment | | 371,322 | 462,759 | 266,974 | 350,580 | 2,373,206 | 2,475,347 | 941,686 | 1,209,827 | — | — | 3,953,188 | 4,498,513 |
Right-of-use asset | | — | — | 184 | 202 | 2,136 | 3,626 | 125,217 | 143,177 | — | — | 127,537 | 147,005 |
Deferred tax assets | | 19,252 | 25,763 | 13,688 | 5,033 | — | | 250 | — | — | — | 33,190 | 30,796 |
| | | | | | | | | | | | | |
TOTAL ASSETS | | 1,012,685 | 1,168,237 | 1,418,908 | 1,280,669 | 2,774,428 | 2,775,487 | 1,569,496 | 1,761,327 | — | (102,944) | 6,775,517 | 6,882,776 |
| | | | | | | | | | | | | | | | | | | | | | | | | |
Line of business | | | | | | | | | | | | | | | | | | | | | | | | | |
Country | | Argentina | Brazil | Colombia | Peru | Eliminations | Total | ||||||||||||||||||
LIABILITIES AND EQUITY | | 12-31-2020 | | 12-31-2019 | | 12-31-2020 | | 12-31-2019 | | 12-31-2020 | | 12-31-2019 | | 12-31-2020 | | 12-31-2019 | | 12-31-2020 | | 12-31-2019 | | 12-31-2020 | | 12-31-2019 | |
CURRENT LIABILITIES | | 161,117 | | 338,950 | | 665,046 | | 344,845 | | 570,719 | | 387,805 | | 255,734 | | 241,747 | | — | | (90,643) | | 1,652,616 | | 1,222,704 | |
Other current financial liabilities | | 6,088 | | 7,282 | | 21,768 | | 82,099 | | 263,242 | | 100,218 | | 26,187 | | 51,266 | | — | | — | | 317,285 | | 240,865 | |
Current lease liability | | — | | — | | 138 | | 132 | | 1,793 | | 1,476 | | 19,547 | | 40,833 | | — | | — | | 21,478 | | 42,441 | |
Trade and other current payables | | 60,088 | | 109,347 | | 578,444 | | 229,009 | | 153,466 | | 142,993 | | 89,995 | | 99,101 | | — | | — | | 881,993 | | 580,450 | |
Current accounts payable to related parties | | 29,041 | | 118,028 | | 49,014 | | 17,809 | | 45,183 | | 41,035 | | 32,579 | | 36,214 | | — | | (90,643) | | 155,817 | | 122,443 | |
Other current provisions | | 1,380 | | — | | (3) | | — | | 29,096 | | 31,215 | | 48,883 | | 48,808 | | — | | — | | 79,356 | | 80,023 | |
Current tax liabilities | | 41,620 | | 73,629 | | 7,071 | | 6,076 | | 70,498 | | 63,076 | | 31,538 | | 1,637 | | — | | — | | 150,727 | | 144,418 | |
Other current non-financial liabilities | | 22,900 | | 30,664 | | 8,614 | | 9,852 | | 7,441 | | 9,268 | | 7,005 | | 4,721 | | — | | — | | 45,960 | | 54,505 | |
| | | | | | | | | | | | | | | | | | | | | | | | | |
| | | | | | | | | | | | | | | | | | | | | | | | | |
NON-CURRENT LIABILITIES | | 144,807 | | 221,136 | | 179,215 | | 205,761 | | 697,178 | | 943,881 | | 259,631 | | 331,803 | | — | | (12,301) | | 1,280,831 | | 1,690,280 | |
Other non-current financial liabilities | | 40,785 | | 40,650 | | 127,378 | | 176,714 | | 542,592 | | 818,533 | | 16,927 | | 35,884 | | — | | | | 727,682 | | 1,071,781 | |
Non-current lease liability | | — | | — | | 83 | | 120 | | 515 | | 2,041 | | 10,993 | | 18,345 | | — | | — | | 11,591 | | 20,506 | |
Trade and other non-current payables | | — | | 3,034 | | 215 | | 505 | | 764 | | 639 | | — | | — | | — | | | | 979 | | 4,178 | |
Non-current accounts payable to related parties | | — | | 16,228 | | 19,252 | | 11,331 | | — | | — | | — | | | | — | | (12,301) | | 19,252 | | 15,258 | |
Other long-term provisions | | 62 | | | | 1,730 | | 2,053 | | 61,967 | | 44,831 | | 20,420 | | 54,275 | | — | | — | | 84,179 | | 101,159 | |
Deferred tax liabilities | | 52,504 | | 101,043 | | 29,787 | | 13,171 | | 63,683 | | 51,223 | | 189,127 | | 216,660 | | — | | — | | 335,101 | | 382,097 | |
Non-current provisions for employee benefits | | 3,190 | | 3,172 | | — | | — | | 27,657 | | 28,655 | | 1,906 | | 1,893 | | — | | — | | 32,753 | | 33,720 | |
Other non-current non-financial liabilities | | 48,266 | | 57,009 | | 770 | | 1,987 | | — | | — | | 20,258 | | 23,091 | | — | | — | | 69,294 | | 82,087 | |
| | | | | | | | | | | | | | | | | | | | | | | | | |
EQUITY | | 706,761 | | 608,151 | | 574,647 | | 730,063 | | 1,506,531 | | 1,443,801 | | 1,054,131 | | 1,187,777 | | — | | — | | 3,842,070 | | 3,969,792 | |
Equity attributable to shareholders of Enel Américas | | 706,761 | | 608,151 | | 574,647 | | 730,063 | | 1,506,531 | | 1,443,801 | | 1,054,131 | | 1,187,777 | | — | | — | | 3,842,070 | | 3,969,792 | |
Share and paid-in capital | | 561,138 | | 569,466 | | 215,930 | | 268,415 | | 191,473 | | 199,473 | | 853,156 | | 930,671 | | — | | — | | 1,821,697 | | 1,968,025 | |
Retained earnings (losses) | | 11,406 | | 4,884 | | 237,270 | | 335,962 | | 665,670 | | 565,626 | | 208,351 | | 284,443 | | — | | — | | 1,122,697 | | 1,190,915 | |
Issuance premiums | | — | | — | | — | | — | | 33,096 | | 34,479 | | 4,042 | | 4,409 | | — | | — | | 37,138 | | 38,888 | |
Other reserves | | 134,217 | | 33,801 | | 121,501 | | 125,686 | | 616,292 | | 644,223 | | (11,418) | | (31,746) | | — | | — | | 860,592 | | 771,964 | |
| | | | | | | | | | | | | | | | | | | | | | | | | |
| | | | | | | | | | | | | | | | | | | | | | | | | |
TOTAL LIABILITIES AND EQUITY | | 1,012,685 | | 1,168,237 | | 1,418,908 | | 1,280,669 | | 2,774,428 | | 2,775,487 | | 1,569,496 | | 1,761,327 | | — | | (102,944) | | 6,775,517 | | 6,882,776 | |
The Eliminations column corresponds to transactions between companies in different lines of business and country, primarily purchases and sales of energy and services.
F-162
| | | | | | | | | | | | | | | | | | | | | | | | | | | | | | | | | | | | |
| | | | | | | | | | | | | | | | | | | | | | | | | | | | | | | | | | | | |
Line of business | Argentina | | Brazil | | Colombia | | Peru | | Eliminations | | Total | | ||||||||||||||||||||||||
Country | 12-31-2020 |
| 12-31-2019 |
| 12-31-2018 |
| 12-31-2020 |
| 12-31-2019 |
| 12-31-2018 |
| 12-31-2020 |
| 12-31-2019 |
| 12-31-2018 |
| 12-31-2020 |
| 12-31-2019 |
| 12-31-2018 |
| 12-31-2020 |
| 12-31-2019 |
| 12-31-2018 |
| 12-31-2020 |
| 12-31-2019 |
| 12-31-2018 |
|
REVENUE AND OTHER OPERATING INCOME | 230,575 | | 436,376 | | 327,613 | | 1,105,875 | | 777,501 | | 853,595 | | 1,159,133 | | 1,246,988 | | 1,259,471 | | 505,246 | | 596,240 | | 595,983 | | — | | (49) | | (244) | | 3,000,829 | | 3,057,056 | | 3,036,418 | |
Revenues | 224,081 | | 415,055 | | 314,689 | | 1,102,091 | | 761,534 | | 841,722 | | 1,150,185 | | 1,240,405 | | 1,242,506 | | 500,821 | | 590,425 | | 562,978 | | — | | — | | — | | 2,977,178 | | 3,007,419 | | 2,961,895 | |
Energy sales | 220,869 | | 413,343 | | 313,502 | | 1,040,995 | | 691,904 | | 759,653 | | 1,128,070 | | 1,213,754 | | 1,220,266 | | 490,576 | | 566,368 | | 521,458 | | — | | — | | — | | 2,880,510 | | 2,885,369 | | 2,814,879 | |
Other sales | 1,281 | | — | | 21 | | — | | — | | — | | 21,978 | | 26,479 | | 22,095 | | 9,032 | | 22,467 | | 22,694 | | — | | — | | — | | 32,291 | | 48,946 | | 44,810 | |
Other services rendered | 1,931 | | 1,712 | | 1,166 | | 61,096 | | 69,630 | | 82,069 | | 137 | | 172 | | 145 | | 1,213 | | 1,590 | | 18,826 | | — | | — | | — | | 64,377 | | 73,104 | | 102,206 | |
Other income | 6,494 | | 21,321 | | 12,924 | | 3,784 | | 15,967 | | 11,873 | | 8,948 | | 6,583 | | 16,965 | | 4,425 | | 5,815 | | 33,005 | | — | | (49) | | (244) | | 23,651 | | 49,637 | | 74,523 | |
| | | | | | | | | | | | | | | | | | | | | | | | | | | | | | | | | | | | |
RAW MATERIALS AND CONSUMABLES USED | (19,110) | | (129,661) | | (40,070) | | (781,186) | | (418,618) | | (574,420) | | (412,529) | | (465,768) | | (478,264) | | (162,338) | | (204,404) | | (188,230) | | — | | — | | 429 | | (1,375,163) | | (1,218,451) | | (1,280,555) | |
Energy purchases | (969) | | (877) | | (1,343) | | (710,206) | | (328,984) | | (525,539) | | (179,897) | | (209,204) | | (191,690) | | (27,014) | | (39,851) | | (40,938) | | — | | 543 | | 1,596 | | (918,086) | | (578,373) | | (757,914) | |
Fuel consumption | (1,180) | | (100,579) | | (21,095) | | (41,363) | | (58,505) | | (18,151) | | (39,785) | | (49,225) | | (53,414) | | (55,522) | | (68,807) | | (134,183) | | — | | — | | — | | (137,850) | | (277,116) | | (226,843) | |
Transportation expenses | (6,542) | | (8,959) | | (6,937) | | (23,874) | | (28,107) | | (30,474) | | (126,696) | | (138,544) | | (143,045) | | (69,419) | | (84,128) | | (5,488) | | — | | (543) | | (1,167) | | (226,531) | | (260,281) | | (187,111) | |
Other miscellaneous supplies and services | (10,419) | | (19,246) | | (10,695) | | (5,743) | | (3,022) | | (256) | | (66,151) | | (68,795) | | (90,115) | | (10,383) | | (11,618) | | (7,621) | | — | | — | | — | | (92,696) | | (102,681) | | (108,687) | |
| | | | | | | | | | | | | | | | | | | | | | | | | | | | | | | | | | | | |
CONTRIBUTION MARGIN | 211,465 | | 306,715 | | 287,543 | | 324,689 | | 358,883 | | 279,175 | | 746,604 | | 781,220 | | 781,207 | | 342,908 | | 391,836 | | 407,753 | | — | | (49) | | 185 | | 1,625,666 | | 1,838,605 | | 1,755,863 | |
| | | | | | | | | | | | | | | | | | | | | | | | | | | | | | | | | | | | |
Other work performed by the entity and capitalized | 375 | | 4,785 | | 5,011 | | 215 | | 653 | | 553 | | 2,438 | | 3,008 | | 2,468 | | 918 | | 1,577 | | 1,435 | | — | | — | | — | | 3,946 | | 10,023 | | 9,467 | |
Employee benefits expense | (30,398) | | (38,147) | | (45,672) | | (12,934) | | (16,422) | | (16,364) | | (31,049) | | (31,806) | | (30,726) | | (26,958) | | (27,851) | | (30,096) | | — | | — | | — | | (101,339) | | (114,226) | | (122,858) | |
Other expenses | (41,328) | | (28,259) | | (28,977) | | (14,876) | | (22,191) | | (19,683) | | (44,547) | | (42,102) | | (45,800) | | (44,949) | | (44,023) | | (45,395) | | — | | 49 | | (176) | | (145,700) | | (136,526) | | (140,031) | |
| | | | | | | | | | | | | | | | | | | | | | | | | | | | | | | | | | | | |
GROSS OPERATING RESULT | 140,114 | | 245,094 | | 217,905 | | 297,094 | | 320,923 | | 243,681 | | 673,446 | | 710,320 | | 707,149 | | 271,919 | | 321,539 | | 333,697 | | — | | — | | 9 | | 1,382,573 | | 1,597,876 | | 1,502,441 | |
| | | | | | | | | | | | | | | | | | | | | | | | | | | | | | | | | | | | |
Depreciation and amortization expense | (86,575) | | (89,645) | | (121,545) | | (23,371) | | (32,785) | | (32,681) | | (66,263) | | (73,761) | | (73,252) | | (64,032) | | (65,767) | | (68,241) | | — | | — | | — | | (240,241) | | (261,958) | | (295,719) | |
Impairment (losses) reversals recognized in profit or loss | — | | — | | 66,987 | | — | | — | | — | | — | | — | | — | | — | | (1,307) | | — | | — | | — | | — | | — | | (1,307) | | 66,987 | |
Gains (losses) for impairment in accordance with IFRS 9 | (96) | | (40) | | (7,671) | | (535) | | 32 | | (260) | | (315) | | 663 | | (822) | | 12 | | (10) | | 3,755 | | — | | | | | | (934) | | 645 | | (4,998) | |
| | | | | | | | | | | | | | | | | | | | | | | | | | | | | | | | | | | | |
OPERATING INCOME | 53,443 | | 155,409 | | 155,676 | | 273,188 | | 288,170 | | 210,740 | | 606,868 | | 637,222 | | 633,075 | | 207,899 | | 254,455 | | 269,211 | | — | | — | | 9 | | 1,141,398 | | 1,335,256 | | 1,268,711 | |
| | | | | | | | | | | | | | | | | | | | | | | | | | | | | | | | | | | | |
FINANCIAL RESULT | 6,766 | | 73,292 | | 116,452 | | 5,214 | | 19,427 | | 18,757 | | (70,522) | | (81,785) | | (101,982) | | 5,087 | | (6,146) | | 8,420 | | (2,705) | | — | | 28,573 | | (56,160) | | 4,788 | | 70,220 | |
Financial income | 72,368 | | 98,572 | | 69,536 | | 11,100 | | 41,484 | | 32,044 | | 5,465 | | 6,239 | | 8,361 | | 4,787 | | 7,373 | | 6,888 | | — | | — | | — | | 93,720 | | 153,668 | | 116,829 | |
Cash and cash equivalents | 27,765 | | 82,760 | | 65,748 | | (1,009) | | 7,644 | | 7,712 | | 3,792 | | 4,696 | | 7,025 | | 2,331 | | 4,137 | | 3,768 | | — | | — | | — | | 32,879 | | 99,237 | | 84,253 | |
Other financial income | 44,603 | | 15,812 | | 3,788 | | 12,109 | | 33,840 | | 24,332 | | 1,673 | | 1,543 | | 1,336 | | 2,456 | | 3,236 | | 3,120 | | — | | — | | — | | 60,841 | | 54,431 | | 32,576 | |
Financial costs | (29,397) | | (47,784) | | (52,457) | | (39,278) | | (31,209) | | (35,648) | | (76,221) | | (87,896) | | (110,076) | | (4,854) | | (12,089) | | (5,002) | | — | | — | | — | | (149,750) | | (178,978) | | (203,183) | |
Bank borrowings | (2,955) | | (62) | | (43) | | (579) | | (9,925) | | (11,321) | | — | | (2,522) | | (6,638) | | (411) | | (94) | | (219) | | — | | — | | — | | (3,945) | | (12,603) | | (18,221) | |
Secured and unsecured obligations | — | | — | | — | | (13,088) | | (2,415) | | (201) | | (55,682) | | (76,258) | | (95,921) | | (1,547) | | (1,965) | | (2,857) | | — | | — | | — | | (70,317) | | (80,638) | | (98,979) | |
Other | (26,442) | | (47,722) | | (52,414) | | (25,611) | | (18,869) | | (24,126) | | (20,539) | | (9,116) | | (7,517) | | (2,896) | | (10,030) | | (1,926) | | — | | — | | — | | (75,488) | | (85,737) | | (85,983) | |
Income from indexation units | (85,734) | | (83,759) | | 8,815 | | — | | — | | — | | — | | | | — | | — | | — | | — | | — | | — | | — | | (85,734) | | (83,759) | | 8,815 | |
Foreign exchange profits (losses) | 49,529 | | 106,263 | | 90,558 | | 33,392 | | 9,152 | | 22,361 | | 234 | | (128) | | (267) | | 5,154 | | (1,430) | | 6,534 | | (2,705) | | — | | 28,573 | | 85,604 | | 113,857 | | 147,759 | |
| | | | | | | | | | | | | | | | | | | | | | | | | | | | | | | | | | | | |
Share of profit (loss) of associates and joint ventures accounted for using the equity method | 2,630 | | 790 | | 2,171 | | — | | — | | — | | — | | — | | — | | — | | — | | — | | — | | — | | — | | 2,630 | | 790 | | 2,171 | |
Other gains (losses) | 50 | | 1,042 | | 74 | | — | | — | | — | | 103 | | 235 | | 24 | | 3,611 | | 10 | | 37 | | — | | — | | — | | 3,764 | | 1,287 | | 135 | |
Gain (loss) from other investments | 50 | | 1,042 | | 51 | | — | | — | | — | | — | | — | | — | | — | | — | | — | | — | | — | | — | | 50 | | 1,042 | | 51 | |
Gain (loss) from the sale of assets | — | | — | | 23 | | — | | — | | — | | 103 | | 235 | | 24 | | 3,611 | | 10 | | 37 | | — | | — | | — | | 3,714 | | 245 | | 84 | |
| | | | | | | | | | | | | | | | | | | | | | | | | | | | | | | | | | | | |
Profit (loss) before taxes | 62,889 | | 314,292 | | 274,373 | | 278,402 | | 307,597 | | 229,497 | | 536,449 | | 555,672 | | 531,117 | | 216,597 | | 248,319 | | 277,668 | | (2,705) | | — | | 28,582 | | 1,091,632 | | 1,342,121 | | 1,341,237 | |
| | | | | | | | | | | | | | | | | | | | | | | | | | | | | | | | | | | | |
Income tax expense (income) | (15,129) | | (48,085) | | (99,141) | | (66,505) | | (116,746) | | (78,870) | | (188,883) | | (180,207) | | (185,554) | | (56,056) | | (74,300) | | (85,670) | | — | | — | | — | | (326,573) | | (419,338) | | (449,235) | |
| | | | | | | | | | | | | | | | | | | | | | | | | | | | | | | | | | | | |
Profit (loss) from continuing operations | 47,760 | | 182,448 | | 175,232 | | 211,897 | | 190,851 | | 150,627 | | 347,566 | | 375,465 | | 345,563 | | 160,541 | | 174,019 | | 191,998 | | (2,705) | | — | | 28,582 | | 765,059 | | 922,783 | | 892,002 | |
PROFIT (LOSS) | 47,760 | | 182,448 | | 175,232 | | 211,897 | | 190,851 | | 150,627 | | 347,566 | | 375,465 | | 345,563 | | 160,541 | | 174,019 | | 191,998 | | (2,705) | | — | | 28,582 | | 765,059 | | 922,783 | | 892,002 | |
| | | | | | | | | | | | | | | | | | | | | | | | | | | | | | | | | | | | |
Country | Argentina | | Brazil | | Colombia | | Peru | | Eliminations | | Total | | ||||||||||||||||||||||||
STATEMENT OF CASH FLOWS | 12-31-2020 |
| 12-31-2019 |
| 12-31-2018 |
| 12-31-2020 |
| 12-31-2019 |
| 12-31-2018 |
| 12-31-2020 |
| 12-31-2019 |
| 12-31-2018 |
| 12-31-2020 |
| 12-31-2019 |
| 12-31-2018 |
| 12-31-2020 |
| 12-31-2019 |
| 12-31-2018 |
| 12-31-2020 |
| 12-31-2019 |
| 12-31-2018 |
|
| | | | | | | | | | | | | | | | | | | | | | | | | | | | | | | | | | | | |
Net cash flows from (used in) operating activities | 125,114 | | 128,806 | | 110,238 | | 193,848 | | 206,616 | | 206,457 | | 549,006 | | 509,622 | | 626,538 | | 242,006 | | 207,268 | | 254,685 | | 11 | | — | | — | | 1,109,985 | | 1,052,312 | | 1,197,918 | |
Net cash flows from (used in) investing activities | (59,107) | | 6,478 | | (16,483) | | (9,470) | | 34,463 | | (67,384) | | (54,430) | | (85,078) | | (109,801) | | (41,680) | | (40,386) | | 90,501 | | — | | — | | — | | (164,687) | | (84,523) | | (103,167) | |
Net cash flows from (used in) financing activities | (54,520) | | (115,161) | | (23,726) | | (162,012) | | (221,809) | | (90,783) | | (353,785) | | (545,075) | | (494,832) | | (227,426) | | (157,902) | | (256,197) | | — | | — | | — | | (797,743) | | (1,039,947) | | (865,538) | |
The Eliminations column corresponds to transactions between companies in different lines of business and country, primarily purchases and sales of energy and services.
F-163
b) Distribution
| | | | | | | | | | | | | | | | | | | | | | | | |
| Distribution | | ||||||||||||||||||||||
Line of business | Argentina | Brazil | Colombia | Peru | Eliminations | Total | ||||||||||||||||||
Country | 12-31-2020 | | 12-31-2019 | | 12-31-2020 | | 12-31-2019 | | 12-31-2020 | | 12-31-2019 | | 12-31-2020 | | 12-31-2019 | | 12-31-2020 | | 12-31-2019 | | 12-31-2020 | | 12-31-2019 | |
ASSETS | ThUS$ |
| ThUS$ |
| ThUS$ |
| ThUS$ |
| ThUS$ |
| ThUS$ |
| ThUS$ |
| ThUS$ |
| ThUS$ |
| ThUS$ |
| ThUS$ |
| ThUS$ |
|
CURRENT ASSETS | 274,170 | | 284,127 | | 3,356,268 | | 3,711,977 | | 499,983 | | 363,837 | | 191,178 | | 153,383 | | (48) | | (35) | | 4,321,551 | | 4,513,289 | |
Cash and cash equivalents | 8,016 | | 24,452 | | 557,280 | | 475,746 | | 141,721 | | 97,623 | | 41,228 | | 51,717 | | — | | — | | 748,245 | | 649,538 | |
Other current financial assets | 23,383 | | — | | 128,089 | | 48,792 | | 274 | | 306 | | — | | — | | — | | — | | 151,746 | | 49,098 | |
Other current non-financial assets | 29,464 | | 18,982 | | 374,088 | | 341,073 | | 18,191 | | 10,072 | | 9,057 | | 4,292 | | — | | — | | 430,800 | | 374,419 | |
Trade and other current receivables | 199,667 | | 222,959 | | 1,954,523 | | 2,568,600 | | 260,485 | | 181,485 | | 109,912 | | 71,574 | | 53 | | 16 | | 2,524,640 | | 3,044,634 | |
Current accounts receivable from related parties | 364 | | 602 | | 8,480 | | 11,350 | | 6,396 | | 4,904 | | 4,550 | | 9,432 | | (101) | | (51) | | 19,689 | | 26,237 | |
Inventories | 13,276 | | 17,132 | | 272,167 | | 236,130 | | 72,916 | | 58,121 | | 26,431 | | 16,368 | | — | | — | | 384,790 | | 327,751 | |
Current tax assets | — | | — | | 61,641 | | 30,286 | | — | | — | | — | | — | | — | | — | | 61,641 | | 30,286 | |
| | | | | | | | | | | | | | | | | | | | | | | | |
Non-current assets or disposal groups held-for-sale or held for distribution to owners | — | | — | | — | | — | | — | | 11,326 | | — | | — | | — | | — | | — | | 11,326 | |
| | | | | | | | | | | | | | | | | | | | | | | | |
NON-CURRENT ASSETS | 1,442,359 | | 1,456,918 | | 10,141,977 | | 12,004,828 | | 1,973,507 | | 1,842,861 | | 1,263,497 | | 1,305,567 | | — | | — | | 14,821,340 | | 16,610,174 | |
Other non-current financial assets | 6 | | 9 | | 2,497,727 | | 2,703,683 | | 2 | | 2 | | — | | — | | — | | — | | 2,497,735 | | 2,703,694 | |
Other non-current non-financial assets | 60 | | 84 | | 2,259,476 | | 2,651,786 | | 24,651 | | 12,048 | | — | | — | | — | | — | | 2,284,187 | | 2,663,918 | |
Trade and other non-current receivables | 460 | | 646 | | 267,871 | | 236,472 | | 29,541 | | 38,797 | | — | | — | | — | | — | | 297,872 | | 275,915 | |
Non-current accounts receivable from related parties | 32 | | 68 | | — | | — | | — | | — | | — | | — | | — | | — | | 32 | | 68 | |
Investments accounted for using the equity method | 133 | | 186 | | — | | — | | 1,463 | | 1,524 | | — | | — | | — | | — | | 1,596 | | 1,710 | |
Intangible assets other than goodwill | 50,067 | | 30,365 | | 4,174,705 | | 5,281,728 | | 103,745 | | 93,220 | | 42,359 | | 35,933 | | — | | — | | 4,370,876 | | 5,441,246 | |
Property, plant and equipment | 1,391,477 | | 1,425,560 | | 32,860 | | 115,163 | | 1,785,402 | | 1,697,270 | | 1,186,821 | | 1,269,634 | | — | | — | | 4,396,560 | | 4,507,627 | |
Investment properties | — | | — | | 7,942 | | 10,254 | | — | | — | | — | | — | | — | | — | | 7,942 | | 10,254 | |
Right-of-use asset | 124 | | 18 | | 42,236 | | 74,554 | | 17,503 | | 8,362 | | 34,317 | | 25,178 | | — | | — | | 94,180 | | 108,112 | |
Deferred tax assets | — | | | | 859,160 | | 1,005,742 | | | | — | | — | | — | | — | | — | | 859,160 | | 1,005,742 | |
| | | | | | | | | | | | | | | | | | | | | | | | |
TOTAL ASSETS | 1,716,529 | | 1,741,045 | | 13,498,245 | | 15,716,805 | | 2,473,490 | | 2,206,698 | | 1,454,675 | | 1,458,950 | | (48) | | (35) | | 19,142,891 | | 21,123,463 | |
| | | | | | | | | | | | | | | | | | | | | | | | |
Line of business | | | | | | | | | | | | | | | | | | | | | | | | |
Country | Argentina | Brazil | Colombia | Peru | Eliminations | Total | ||||||||||||||||||
| 12-31-2020 | | 12-31-2019 | | 12-31-2020 | | 12-31-2019 | | 12-31-2020 | | 12-31-2019 | | 12-31-2020 | | 12-31-2019 | | 12-31-2020 | | 12-31-2019 | | 12-31-2020 | | 12-31-2019 | |
LIABILITIES AND EQUITY | ThUS$ | | ThUS$ | | ThUS$ | | ThUS$ | | ThUS$ | | ThUS$ | | ThUS$ | | ThUS$ | | ThUS$ | | ThUS$ | | ThUS$ | | ThUS$ | |
CURRENT LIABILITIES | 591,523 | | 509,222 | | 509,222 | | 3,699,914 | | 640,775 | | 545,688 | | 249,069 | | 272,270 | | (48) | | (35) | | 1,990,541 | | 5,027,059 | |
Other current financial liabilities | — | | 7 | | — | | 756,949 | | 190,925 | | 75,327 | | 53,750 | | 53,938 | | — | | — | | 244,675 | | 886,221 | |
Current lease liability | 78 | | 7 | | 15,396 | | 25,856 | | 2,999 | | 4,526 | | 11,280 | | 8,369 | | — | | — | | 29,753 | | 38,758 | |
Trade and other current payables | 467,412 | | 328,700 | | | | 2,321,877 | | 338,490 | | 316,584 | | 116,577 | | 135,398 | | 2 | | — | | 922,481 | | 3,102,559 | |
Current accounts payable to related parties | 69,660 | | 109,013 | | 328,700 | | 286,621 | | 32,604 | | 79,684 | | 35,692 | | 42,785 | | (50) | | (35) | | 466,606 | | 518,068 | |
Other current provisions | 43,785 | | 44,825 | | 109,013 | | 144,973 | | 11,080 | | 7,082 | | 8,356 | | 8,584 | | — | | — | | 172,234 | | 205,464 | |
Current tax liabilities | — | | 12,264 | | 44,825 | | 665 | | 40,226 | | 45,041 | | 2,239 | | 12,103 | | — | | — | | 87,290 | | 70,073 | |
Other current non-financial liabilities | 10,588 | | 14,413 | | 14,413 | | 188,829 | | 24,451 | | 18,179 | | 21,175 | | 19,462 | | — | | — | | 70,627 | | 240,883 | |
| | | | | | | | | | | | | | | | | | | | | | | | |
Liabilities associated with groups of assets or disposal groups held for sale or distribution to owners | — | | — | | — | | — | | — | | 3,791 | | — | | — | | — | | — | | — | | 3,791 | |
| | | | | | | | | | | | | | | | | | | | | | | | |
NON-CURRENT LIABILITIES | 415,192 | | 429,766 | | 429,766 | | 6,946,561 | | 840,051 | | 704,526 | | 471,377 | | 467,924 | | — | | — | | 2,156,386 | | 8,548,777 | |
Other non-current financial liabilities | — | | — | | — | | 2,212,111 | | 708,607 | | 592,064 | | 397,449 | | 418,129 | | — | | — | | 1,106,056 | | 3,222,304 | |
Non-current lease liability | 45 | | 7 | | 35,221 | | 58,311 | | 15,124 | | 4,150 | | 28,492 | | 25,274 | | — | | — | | 78,882 | | 87,742 | |
Trade and other non-current payables | 86,559 | | 149,205 | | 149,205 | | 2,171,380 | | 372 | | 358 | | 729 | | | | — | | — | | 236,865 | | 2,320,943 | |
Non-current accounts payable to related parties | 50,566 | | 34,662 | | 34,662 | | — | | — | | — | | — | | | | — | | — | | 85,228 | | 34,662 | |
Other long-term provisions | 19,698 | | 23,710 | | 23,710 | | 845,798 | | 16,537 | | 4,828 | | 459 | | 500 | | — | | — | | 60,404 | | 874,836 | |
Deferred tax liabilities | 233,966 | | 210,460 | | 210,460 | | 13,257 | | — | | 107 | | 38,188 | | 43,357 | | — | | — | | 482,614 | | 267,181 | |
Non-current provisions for employee benefits | 10,730 | | 11,006 | | 11,006 | | 1,683,454 | | 96,591 | | 100,851 | | 4,299 | | 4,352 | | — | | — | | 122,626 | | 1,799,663 | |
Other non-current non-financial liabilities | 13,628 | | 716 | | 716 | | 20,561 | | 2,820 | | 6,318 | | 1,761 | | 1,586 | | — | | — | | 18,925 | | 29,181 | |
| | | | | | | | | | | | | | | | | | | | | | | | |
EQUITY | 709,814 | | 802,057 | | 802,057 | | 5,070,330 | | 992,664 | | 956,484 | | 734,229 | | 718,756 | | — | | — | | 3,238,764 | | 7,547,627 | |
Equity attributable to shareholders of Enel Américas | 709,814 | | 802,057 | | 802,057 | | 5,070,330 | | 992,664 | | 956,484 | | 734,229 | | 718,756 | | — | | — | | 3,238,764 | | 7,547,627 | |
Share and paid-in capital | 528,339 | | 544,855 | | 544,855 | | 2,849,227 | | 3,941 | | 4,106 | | 147,019 | | 160,377 | | — | | — | | 1,224,154 | | 3,558,565 | |
Retained earnings (losses) | (67,928) | | 223,667 | | 223,667 | | (673,567) | | 346,671 | | 282,082 | | 520,910 | | 486,057 | | — | | — | | 1,023,320 | | 318,239 | |
Issuance premiums | — | | — | | — | | | | 55,685 | | 58,011 | | — | | — | | — | | — | | 55,685 | | 58,011 | |
Other reserves | 249,403 | | 33,535 | | 33,535 | | 2,894,670 | | 586,367 | | 612,285 | | 66,300 | | 72,322 | | — | | — | | 935,605 | | 3,612,812 | |
| | | | | | | | | | | | | | | | | | | | | | | | |
| | | | | | | | | | | | | | | | | | | | | | | | |
TOTAL LIABILITIES AND EQUITY | 1,716,529 | | 1,741,045 | | 1,741,045 | | 15,716,805 | | 2,473,490 | | 2,206,698 | | 1,454,675 | | 1,458,950 | | (48) | | (35) | | 7,385,691 | | 21,123,463 | |
The Eliminations column corresponds to transactions between companies in different lines of business and country, primarily purchases and sales of energy and services.
F-164
| | | | | | | | | | | | | | | | | | | | | | | | | | | | | | | | | | | | |
| | | | | | | | | | | | | | | | | | | | | | | | | | | | | | | | | | | | |
Line of business | Argentina | | Brazil | | Colombia | | Peru | | Eliminations | | Total | | ||||||||||||||||||||||||
Country | 12-31-2020 ThUS$ |
| 12-31-2019 ThUS$ |
| 12-31-2018 ThUS$ |
| 12-31-2020 ThUS$ |
| 12-31-2019 ThUS$ |
| 12-31-2018 ThUS$ |
| 12-31-2020 ThUS$ |
| 12-31-2019 ThUS$ |
| 12-31-2018 ThUS$ |
| 12-31-2020 ThUS$ |
| 12-31-2019 ThUS$ |
| 12-31-2018 ThUS$ |
| 12-31-2020 ThUS$ |
| 12-31-2019 ThUS$ |
| 12-31-2018 ThUS$ |
| 12-31-2020 ThUS$ |
| 12-31-2019 ThUS$ |
| 12-31-2018 ThUS$ |
|
REVENUE AND OTHER OPERATING INCOME | 801,228 | | 1,346,888 | | 1,189,950 | | 6,734,986 | | 8,153,719 | | 6,922,417 | | 1,546,964 | | 1,665,317 | | 1,713,801 | | 886,663 | | 950,349 | | 912,950 | | (27) | | (24) | | (3) | | 9,969,814 | | 12,116,249 | | 10,739,115 | |
Revenues | 772,583 | | 1,066,437 | | 1,174,151 | | 5,855,047 | | 7,246,928 | | 5,965,107 | | 1,529,090 | | 1,646,864 | | 1,702,390 | | 882,564 | | 945,595 | | 907,247 | | — | | — | | — | | 9,039,284 | | 10,905,824 | | 9,748,895 | |
Energy sales | 737,983 | | 1,021,696 | | 1,130,353 | | 5,168,342 | | 6,441,861 | | 5,396,919 | | 760,540 | | 1,366,632 | | 1,422,918 | | 844,342 | | 903,828 | | 856,278 | | — | | — | | — | | 7,511,207 | | 9,734,017 | | 8,806,468 | |
Other sales | 1,695 | | 2,771 | | 170 | | 698 | | 3,755 | | 2,225 | | 2,011 | | 2,257 | | 1,137 | | 817 | | 1,022 | | 626 | | — | | — | | — | | 5,221 | | 9,805 | | 4,158 | |
Other services rendered | 32,905 | | 41,970 | | 43,628 | | 686,007 | | 801,312 | | 565,963 | | 766,539 | | 277,975 | | 278,335 | | 37,405 | | 40,745 | | 50,343 | | | | — | | — | | 1,522,856 | | 1,162,002 | | 938,269 | |
Other income | 28,645 | | 280,451 | | 15,799 | | 879,939 | | 906,791 | | 957,310 | | 17,874 | | 18,453 | | 11,411 | | 4,099 | | 4,754 | | 5,703 | | (27) | | (24) | | (3) | | 930,530 | | 1,210,425 | | 990,220 | |
| | | | | | | | | | | | | | | | | | | | | | | | | | | | | | | | | | | | |
RAW MATERIALS AND CONSUMABLES USED | (530,338) | | (773,693) | | (729,223) | | (4,937,646) | | (5,820,384) | | (5,084,253) | | (886,155) | | (962,174) | | (1,032,452) | | (599,116) | | (619,181) | | (610,701) | | — | | — | | — | | (6,953,255) | | (8,175,432) | | (7,456,629) | |
Energy purchases | (489,984) | | (714,844) | | (655,312) | | (3,451,265) | | (4,310,694) | | (3,621,322) | | (646,721) | | (717,608) | | (784,872) | | (561,076) | | (580,690) | | (576,420) | | — | | — | | — | | (5,149,046) | | (6,323,836) | | (5,637,926) | |
Transportation expenses | (17,806) | | (16,990) | | (30,477) | | (658,797) | | (720,945) | | (609,880) | | (162,393) | | (165,554) | | (171,492) | | — | | — | | — | | — | | — | | — | | (838,996) | | (903,489) | | (811,849) | |
Other miscellaneous supplies and services | (22,548) | | (41,859) | | (43,434) | | (827,584) | | (788,745) | | (853,051) | | (77,041) | | (79,012) | | (76,088) | | (38,040) | | (38,491) | | (34,281) | | — | | — | | — | | (965,213) | | (948,107) | | (1,006,854) | |
| | | | | | | | | | | | | | | | | | | | | | | | | | | | | | | | | | | | |
CONTRIBUTION MARGIN | 270,890 | | 573,195 | | 460,727 | | 1,797,340 | | 2,333,335 | | 1,838,164 | | 660,809 | | 703,143 | | 681,349 | | 287,547 | | 331,168 | | 302,249 | | (27) | | (24) | | (3) | | 3,016,559 | | 3,940,817 | | 3,282,486 | |
| | | | | | | | | | | | | | | | | | | | | | | | | | | | | | | | | | | | |
Other work performed by the entity and capitalized | 30,921 | | 43,311 | | 49,297 | | 76,469 | | 89,154 | | 82,661 | | 26,439 | | 29,171 | | 26,940 | | 9,317 | | 9,843 | | 9,632 | | — | | — | | — | | 143,146 | | 171,479 | | 168,530 | |
Employee benefits expense | (123,792) | | (162,137) | | (219,849) | | (207,724) | | (401,264) | | (369,620) | | (76,778) | | (71,028) | | (69,130) | | (33,923) | | (36,596) | | (35,663) | | — | | — | | — | | (442,217) | | (671,025) | | (694,262) | |
Other expenses | (128,108) | | (147,303) | | (110,973) | | (579,070) | | (638,654) | | (545,006) | | (103,675) | | (104,774) | | (116,190) | | (49,043) | | (46,943) | | (44,081) | | 27 | | 24 | | 3 | | (859,869) | | (937,650) | | (816,247) | |
| | | | | | | | | | | | | | | | | | | | | | | | | | | | | | | | | | | | |
GROSS OPERATING RESULT | 49,911 | | 307,066 | | 179,202 | | 1,087,015 | | 1,382,571 | | 1,006,199 | | 506,795 | | 556,512 | | 522,969 | | 213,898 | | 257,472 | | 232,137 | | — | | — | | — | | 1,857,619 | | 2,503,621 | | 1,940,507 | |
| | | | | | | | | | | | | | | | | | | | | | | | | | | | | | | | | | | | |
Depreciation and amortization expense | (73,850) | | (53,534) | | (52,229) | | (366,439) | | (451,835) | | (343,158) | | (115,540) | | (121,669) | | (120,115) | | (58,395) | | (56,630) | | (51,969) | | — | | — | | — | | (614,224) | | (683,668) | | (567,471) | |
Impairment (losses) reversals recognized in profit or loss | — | | — | | — | | — | | — | | — | | — | | 3,433 | | (5,234) | | — | | — | | — | | — | | — | | — | | — | | 3,433 | | (5,234) | |
Gains (losses) for impairment in accordance with IFRS 9 | (44,338) | | (42,501) | | (48,983) | | (167,035) | | (225,053) | | (54,784) | | (16,127) | | (7,272) | | (8,618) | | (14,040) | | (4,408) | | (4,319) | | — | | | | | | (241,540) | | (279,234) | | (116,704) | |
| | | | | | | | | | | | | | | | | | | | | | | | | | | | | | | | | | | | |
OPERATING INCOME | (68,277) | | 211,031 | | 77,990 | | 553,541 | | 705,683 | | 608,257 | | 375,128 | | 431,004 | | 389,002 | | 141,463 | | 196,434 | | 175,849 | | — | | — | | — | | 1,001,855 | | 1,544,152 | | 1,251,098 | |
| | | | | | | | | | | | | | | | | | | | | | | | | | | | | | | | | | | | |
FINANCIAL RESULT | 22,606 | | 54,470 | | 127,247 | | (168,300) | | (234,772) | | (263,904) | | (49,171) | | (58,397) | | (57,795) | | (25,042) | | (22,938) | | (22,151) | | — | | — | | — | | (219,907) | | (261,637) | | (216,603) | |
Financial income | 10,657 | | 22,964 | | 33,729 | | 200,021 | | 252,649 | | 173,459 | | 8,571 | | 5,668 | | 11,463 | | 3,771 | | 4,439 | | 4,470 | | — | | — | | — | | 223,020 | | 285,720 | | 223,121 | |
Cash and cash equivalents | 4,422 | | 1,908 | | 5,917 | | 5,954 | | 19,928 | | 15,225 | | 3,894 | | 3,859 | | 5,498 | | 417 | | 677 | | 661 | | — | | — | | — | | 14,687 | | 26,372 | | 27,301 | |
Other financial income | 6,235 | | 21,056 | | 27,812 | | 194,067 | | 232,721 | | 158,234 | | 4,677 | | 1,809 | | 5,965 | | 3,354 | | 3,762 | | 3,809 | | — | | — | | — | | 208,333 | | 259,348 | | 195,820 | |
Financial costs | (148,619) | | (168,782) | | (174,402) | | (366,558) | | (484,231) | | (421,956) | | (56,225) | | (64,047) | | (67,561) | | (26,894) | | (28,342) | | (26,543) | | — | | — | | — | | (598,296) | | (745,402) | | (690,462) | |
Bank borrowings | (379) | | (3,957) | | (133) | | (44,964) | | (78,675) | | (86,228) | | (8,732) | | (8,375) | | (13,022) | | (2,601) | | (1,204) | | (1,722) | | — | | — | | — | | (56,676) | | (92,211) | | (101,105) | |
Secured and unsecured obligations | (1) | | | | — | | (54,629) | | (110,355) | | (72,172) | | (35,496) | | (40,051) | | (37,995) | | (23,379) | | (25,090) | | (24,973) | | — | | — | | — | | (113,505) | | (175,496) | | (135,140) | |
Other | (148,239) | | (164,825) | | (174,269) | | (266,965) | | (295,201) | | (263,556) | | (11,997) | | (15,621) | | (16,544) | | (914) | | (2,048) | | 152 | | — | | — | | — | | (428,115) | | (477,695) | | (454,217) | |
Income from indexation units | 161,586 | | 206,845 | | 260,137 | | — | | — | | — | | — | | | | — | | — | | — | | — | | — | | — | | — | | 161,586 | | 206,845 | | 260,137 | |
Foreign exchange profits (losses) | (1,018) | | (6,557) | | 7,783 | | (1,763) | | (3,190) | | (15,407) | | (1,517) | | (18) | | (1,697) | | (1,919) | | 965 | | (78) | | — | | — | | — | | (6,217) | | (8,800) | | (9,399) | |
| | | | | | | | | | | | | | | | | | | | | | | | | | | | | | | | | | | | |
Share of profit (loss) of associates and joint ventures accounted for using the equity method | 28 | | 20 | | (160) | | — | | — | | — | | — | | — | | — | | — | | — | | — | | — | | — | | — | | 28 | | 20 | | (160) | |
Other gains (losses) | 7 | | 39 | | — | | 870 | | 2,143 | | 386 | | 21 | | 73 | | 166 | | 5 | | 10,654 | | (6) | | — | | — | | — | | 903 | | 12,909 | | 546 | |
Gain (loss) from other investments | — | | — | | — | | — | | — | | — | | — | | 6 | | — | | — | | | | — | | — | | — | | — | | — | | 6 | | — | |
Gain (loss) from the sale of assets | 7 | | 39 | | — | | 870 | | 2,143 | | 386 | | 21 | | 67 | | 166 | | 5 | | 10,654 | | (6) | | — | | — | | — | | 903 | | 12,903 | | 546 | |
| | | | | | | | | | | | | | | | | | | | | | | | | | | | | | | | | | | | |
Profit (loss) before taxes | (45,636) | | 265,560 | | 205,077 | | 386,111 | | 473,054 | | 344,739 | | 325,978 | | 372,680 | | 331,373 | | 116,426 | | 184,150 | | 153,692 | | — | | — | | — | | 782,879 | | 1,295,444 | | 1,034,881 | |
| | | | | | | | | | | | | | | | | | | | | | | | | | | | | | | | | | | | |
Income tax expense (income) | (22,866) | | (76,548) | | (101,101) | | (118,872) | | 414,913 | | 251,360 | | (97,881) | | (122,066) | | (125,242) | | (38,488) | | (55,649) | | (49,024) | | — | | — | | — | | (278,107) | | 160,650 | | (24,007) | |
| | | | | | | | | | | | | | | | | | | | | | | | | | | | | | | | | | | | |
Profit (loss) from continuing operations | (68,502) | | 189,012 | | 103,976 | | 267,239 | | 887,967 | | 596,099 | | 228,097 | | 250,614 | | 206,131 | | 77,938 | | 128,501 | | 104,668 | | — | | — | | — | | 504,772 | | 1,456,094 | | 1,010,874 | |
PROFIT (LOSS) | (68,502) | | 189,012 | | 103,976 | | 267,239 | | 887,967 | | 596,099 | | 228,097 | | 250,614 | | 206,131 | | 77,938 | | 128,501 | | 104,668 | | — | | — | | — | | 504,772 | | 1,456,094 | | 1,010,874 | |
| | | | | | | | | | | | | | | | | | | | | | | | | | | | | | | | | | | | |
Line of Business | Argentina | | Brazil | | Colombia | | Peru | | Eliminations | | Total | | ||||||||||||||||||||||||
STATEMENT OF CASH FLOWS | 12-31-2020 ThUS$ |
| 12-31-2019 ThUS$ |
| 12-31-2018 ThUS$ |
| 12-31-2020 ThUS$ |
| 12-31-2019 ThUS$ |
| 12-31-2018 ThUS$ |
| 12-31-2020 ThUS$ |
| 12-31-2019 ThUS$ |
| 12-31-2018 ThUS$ |
| 12-31-2020 ThUS$ |
| 12-31-2019 ThUS$ |
| 12-31-2018 ThUS$ |
| 12-31-2020 ThUS$ |
| 12-31-2019 ThUS$ |
| 12-31-2018 ThUS$ |
| 12-31-2020 ThUS$ |
| 12-31-2019 ThUS$ |
| 12-31-2018 ThUS$ |
|
| | | | | | | | | | | | | | | | | | | | | | | | | | | | | | | | | | | | |
Net cash flows from (used in) operating activities | 159,556 | | 116,487 | | 47,301 | | 797,144 | | 877,694 | | 154,589 | | 391,312 | | 357,362 | | 404,403 | | 100,855 | | 251,699 | | 165,498 | | — | | — | | — | | 1,448,867 | | 1,603,242 | | 771,791 | |
Net cash flows from (used in) investing activities | (115,347) | | (184,578) | | (82,268) | | (740,848) | | (818,838) | | (533,164) | | (381,939) | | (303,833) | | (296,082) | | (126,493) | | (163,888) | | (111,035) | | — | | — | | — | | (1,364,627) | | (1,471,137) | | (1,022,549) | |
Net cash flows from (used in) financing activities | (54,133) | | 75,332 | | (118) | | 56,395 | | 84,704 | | 551,548 | | 22,061 | | (158,135) | | (79,475) | | 16,185 | | (66,594) | | (104,032) | | — | | — | | — | | 40,508 | | (64,693) | | 367,923 | |
The Eliminations column corresponds to transactions between companies in different lines of business and country, primarily purchases and sales of energy and services.
F-165
35. GUARANTEES WITH THIRD PARTIES, CONTINGENT ASSETS AND, LIABILITIES, AND OTHER COMMITMENTS
| | | | | | | | | | | | | | | | | | | | | | | | |
| | | | Assets Committed | | | | | | | | | | | | | | | | | | | ||
| Debtor | | | | Carrying | | Outstanding balance as of | Guarantees released | | |||||||||||||||
Creditor of Guarantee | Company | Relationship | Type of Guarantee | Type | Currency | Amount |
| Currency | 12-31-2020 |
| 12-31-2019 | | 2020 |
| Assets |
| 2021 |
| Assets |
| 2022 |
| Assets |
|
Mitsubishi Corporation | Enel Generación Costanera S.A. | Creditor | Pledge | Combined cycle | ThUS$ | 39,285 | | ThUS$ | 46,802 | | 47,844 | | — | | — | | — | | — | | — | | — | |
BNDES | Enel Distribución Rio S.A. | Creditor | Pledge on collection and others | Collection accounts | ThUS$ | 3,966 | | ThUS$ | 3,845 | | 13,205 | | — | | — | | — | | — | | — | | — | |
Various Creditors | Enel Distribución Ceará S.A. | Creditor | Pledge on collection and others | Collection accounts | ThUS$ | 10,969 | | ThUS$ | 74,198 | | 98,388 | | — | | — | | — | | — | | — | | — | |
Banco Bradesco | Enel Distribución Goiás S.A. | Creditor | Pledge on collection and others | Collection accounts | ThUS$ | 19,911 | | ThUS$ | 43,802 | | 77,054 | | — | | — | | — | | — | | — | | — | |
Fundação Cesp | Enel Distribuicao Sao Paulo S.A. | Creditor | Pledge on collection and others | Collection accounts | ThUS$ | 21,775 | | ThUS$ | 816,798 | | 934,752 | | — | | — | | — | | — | | — | | — | |
Various Creditors | Enel Generación Piura S.A. | Creditor | Mortgage | Fixed assets | ThUS$ | 23,408 | | ThUS$ | 16,933 | | 56,835 | | — | | — | | — | | — | | — | | — | |
Various Creditors | Enel Distribución Perú S.A.A. | Creditor | Mortgage | Fixed assets | ThUS$ | 32,315 | | ThUS$ | 24,065 | | 33,187 | | — | | — | | — | | — | | — | | — | |
Banco Continental SA | Enel Generación Perú S.A. | Creditor | Mortgage | Fixed assets | ThUS$ | 9,569 | | ThUS$ | 7,129 | | 5,180 | | — | | — | | — | | — | | — | | — | |
As of December 31, 2020 and 2019, the carrying amount of property, plant and equipment pledged as security for liabilities amounted to ThUS$104,577 and ThUS$114,699, respectively (see Note 17.c.ii).
As of December 31, 2020, the Company had future energy purchase commitments amounting to ThUS$71,322,737 (ThUS$96,201,541 as of December 31, 2019).
| | | | | | | | | | | |
| | | | Debtor | | Outstanding balance as of | |||||
Type | Contract Name | Ending Date | Creditor of Guarantee | Company | Relationship | Type of Guarantee | Currency | 12-31-2020 |
| 12-31-2019 |
|
| | | | | | | | | | | |
Joint & Several | Bono H | October 2028 | Bondholders Enel Generación Chile Bonds Program (formerly Endesa Chile) | Enel Generación Chile S.A. | Divided companies of the orignal debtor, Endesa Chile (joint debor Endesa Américas and post merger Enel Américas) * | Joint co-debtor | US$ | 70,897 | | 67,285 | |
Joint & Several | Bono M | December 2029 | Bondholders Enel Generación Chile Bonds Program (formerly Endesa Chile) | Enel Generación Chile S.A. | Divided companies of the orignal debtor, Endesa Chile (joint debor Endesa Américas and post merger Enel Américas) * | Joint co-debtor | US$ | 335,240 | | 341,010 | |
Guarantor | DEBÊNTURES 9ª EMISSÃO (AMPL19) | December 2020 | DEBENTURES | Enel Distribución Rio S.A. | Enel Brasil | Guarantor | US$ | 0 | | 149,148 | |
Guarantor | BNP PARIBAS 4131 | February 2022 | BNP PARIBAS | Enel Distribución Rio S.A. | Enel Brasil | Guarantor | US$ | 79,612 | | 102,642 | |
Guarantor | CITIBANK 4131 II | March 2021 | CITIBANK | Enel Distribución Rio S.A. | Enel Brasil | Guarantor | US$ | 96,461 | | 96,891 | |
Guarantor | ITAÚ 4131 | July 2021 | ITAÚ | Enel Distribución Rio S.A. | Enel Brasil | Guarantor | US$ | 77,194 | | 77,203 | |
Guarantor | BNP PARIBAS 4131 II | December 2022 | BNP PARIBAS | Enel Distribución Rio S.A. | Enel Brasil | Guarantor | US$ | 39,230 | | — | |
Guarantor | CITIBANK 4131 | January 2021 | CITIBANK | Enel Distribución Goiás S.A. | Enel Brasil | Guarantor | US$ | 0 | | 145,929 | |
Guarantor | BNDES FINAME GIRO | May 2023 | BNDES | Enel Distribución Goiás S.A. | Enel Brasil | Guarantor | US$ | 18,170 | | 25,054 | |
Guarantor | SCOTIABANK 4131 CELG | August 2022 | SCOTIABANK | Enel Distribución Goiás S.A. | Enel Brasil | Guarantor | US$ | 48,870 | | 48,870 | |
Guarantor | NP 3ª Emissão | November 2020 | ITAÚ BBA INTERNATIONAL PLC | Enel Distribución Goiás S.A. | Enel Brasil | Guarantor | US$ | 0 | | 217,443 | |
Guarantor | SCOTIABANK 4131 CELG II | November 2020 | SCOTIABANK | Enel Distribución Goiás S.A. | Enel Brasil | Guarantor | US$ | 0 | | 48,056 | |
Guarantor | BNP PARIBAS 4131 II | March 2021 | BNP PARIBAS- CREDIT AGREEMENT | Enel Distribución Goiás S.A. | Enel Brasil | Guarantor | US$ | 33,108 | | — | |
Guarantor | DEBÊNTURES - 23ª EMISSÃO - 1ª serie | September 2021 | DEBENTURES | Enel Distribuicao Sao Paulo S.A. | Enel Brasil | Guarantor | US$ | 136,305 | | 177,479 | |
Guarantor | DEBÊNTURES - 23ª EMISSÃO - 2ª série | September 2023 | DEBENTURES | Enel Distribución Sao Paulo | Enel Brasil | Guarantor | US$ | 270,297 | | 352,037 | |
Guarantor | BNP PARIBAS 4131 | June 2020 | BNP PARIBAS- CREDIT AGREEMENT | Enel Distribución Goias (ex-CELG) | Enel Brasil | Guarantor | US$ | — | | 50,597 | |
Guarantor | CITI 4131 FORTALEZA | April 2020 | CITIBANK | Enel Generación Fortaleza | Enel Brasil | Guarantor | US$ | 0 | | 60,908 | |
Fine | FINEP - 1º Protocolo | February 2020 | FINEP | Enel Distribución Sao Paulo | n.a | Fine | US$ | 0 | | 253 | |
Fine | FINEP - 2º Protocolo | April 2024 | FINEP | Enel Distribución Sao Paulo | n.a | Fine | US$ | 0 | | 15,756 | |
| | | | | | Total | 1,205,384 | | 1,976,561 | | |
(*) Upon the demerger of the original issuer, between Endesa Chile (currently Enel Generación Chile S.A.) and Endesa Américas, and in accordance with the bond indenture, all entities arising from the demerger are liable for the debt, regardless that the payment obligation remains in Enel Generación Chile S.A. After the merger carried out in 2016, the Company became liable for the obligations of Endesa Américas.
F-166
35.3 Litigation and Arbitration Proceedings
As of the date of these consolidated financial statements, the most relevant litigation and arbitration proceedings of Enel Américas and its subsidiaries are the following:
a) Pending lawsuits, Enel Américas
The Chilean Tax Authority (SII) carried out a regular audit for the 2012 business year (Tax Year 2013). On September 4, 2015, it provided notice of a tax assessment for the additional tax due, based on article 74 of the Income Tax Act, justifying its position on the ground that a modification of the Taxable Profits Fund (Fondo Utilidad Tributaria or FUT) allegedly entailed a modification of the base for the additional tax. The company responded that the SII had accepted the income rectification and the income tax return it had filed, thereby accepting the declared tax amounts. On December 23, 2015, Enel Américas (formerly named Enersis S.A.) filed a tax claim before the Tax and Customs Courts (TTA), claiming that the tax obligation had been fully complied with, since the additional tax had been paid provisionally on a monthly basis, and the tax obligation had been fully settled and resolved when the income rectification was made on May 8, 2014, which included the rectification of the FUT amount. An unfavorable ruling was rendered and the company filed an appeal in January 2018. The case was pleaded before the Court of Appeals on September 12, 2018 and the decision on the appeal was unfavorable, with the dissenting vote of one judge. On November 15, 2018, the company filed another appeal, which was declared admissible by the Court of Appeals and is pending in the Supreme Court. In January 2019, the General Treasury of the Republic notified Enel Américas of a tax payment due. On March 1, 2019, the company requested the ruling of the Court of Appeals on the suspension of tax collection presented on November 8, 2018. On March 11, 2019, the Court of Appeals decided to suspend the collection of taxes for the maximum legal term of six months. On March 15, 2019, the case entered the Supreme Court for its substantive admissibility examination. On March 19, 2019, the company’s cassation appeal was accepted. In September 2019, the extension of the tax collection suspension was requested. On October 25, 2019, the Supreme Court agreed to renew the suspension of the tax collection. During the interim period while the Supreme Court had not yet issued a judgment on the suspension of tax collection, the General Treasury of the Republic seized funds in a current account of Enel Américas. The Treasury cannot dispose of such funds by order of the Supreme Court. In December 2019, a renewal of the tax collection suspension was requested. On January 3, 2020, the Court granted the company's request. On March 30, 2020, a renewal of the fund transfer suspension was requested. On April 7, 2020, the Court granted the company's request. On June 15, 2020, a renewal of the tax collection suspension was requested. On June 22, 2020, the Court granted the company's request. On September 4, 2020, at renewal of the tax collection suspension was requested. On September 9, 2020, the Court granted the company's request. On November 27, 2020, the Company requested a renewal of the tax collection suspension. On December 2, 2020, the Court granted the company's request.. The amount under dispute is ThCh$ 7,744,293, or approximately ThUS$ 10,900.
b) Subsidiary pending lawsuits:
Colombia:
| 1. | José Rodrigo Alvarez and approximately 1,400 other individuals — all of them residents of the municipality of Garzón — filed a class-action lawsuit, currently pending in the Fourth Civil Court of the Circuit of Bogotá, against Emgesa S.A. ESP. It is claimed that, as a consequence of the construction of El Quimbo hydroelectric project, their income from artisanal and business activities was reduced by an average of 30% even though the socioeconomic study of the project had taken this into account. The amount of the claim is ThUS$9,021 equivalent to ThCOP 30,870,677. The case has been in the evidentiary stage since 2016 and no expert opinion has been issued due to the counterparty’s lack of activity. On May 8, 2019, the court granted approximately US$200 for expert expenses, without the plaintiff having paid the expenses to date. The company is waiting for decision on the withdrawal of the request for the expert’s opinion and the final arguments to continue. |
| 2. | A lawsuit for nullity and restoration of rights was filed by Emgesa against the Colombian Directorate of National Taxes and Customs (DIAN) before the Administrative Court of Huila. Emgesa (formerly Central Betania) enjoyed a tax benefit on corporate income tax, known as the "Páez Law", which established a tax exemption for companies located in a specific area that suffered a catastrophe. The Colombian tax authorities (DIAN) |
F-167
| challenged the method used by Emgesa to determine the taxable base of the income tax using this benefit. In essence, DIAN’s position is that certain Emgesa revenues, such as adjustments for inflation and non-operating income, do not qualify for this tax exemption because they are not related to the electricity generation activity. However, Emgesa believes that, in accordance with the Páez Law, this special benefit applies to the company as an entity and not just to certain company revenues. On July 27, 2017, the Huila Administrative Court issued a ruling accepting the arguments of the DIAN, determining that no benefit should be applied to these revenues, since they do not come from the furtherance of the company's corporate purpose. The ruling did not provide a substantive legal basis and did not rule on various defenses presented by the company. Similarly, the Court confirmed the sanction of inaccuracy without analyzing the difference in criteria or defining the punishable act. Therefore, on August 10, 2017, Emgesa filed an appeal reiterating that the benefit falls on the company and the law does not discriminate in its application when it comes to non-operating income. New rulings of the Council of State that support the position of the company were considered. It was insisted that there is a difference in criteria and therefore the sanction of inaccuracy should be lifted. On September 22, 2017, the proceeding was assigned in the Council of State where the second instance review took place. On November 24, 2017, Emgesa’s lawyers presented the closing arguments and in January 2018 the file entered the magistrate's office for the final decision. On October 15, 2020, the State Council issued a second and final judgment unfavorable to Emgesa, which concluded that the exemption from the Páez Law only benefits operating income. The judgment ordered Emgesa to pay COP $63,766 million (ThUS$ 18,634) for the higher tax assessed, a penalty, indexation of the penalty and interest on arrears. This amount was paid on November 26, 2020. |
| 3. | Comepez S.A. and other fish farm and artisanal fishermen companies filed class action lawsuit No. 41001233300020140052400 against Emgesa S.A. ESP, the Colombian Ministry of Environment and Development and the Colombian Ministry of Mining and Energy, which is currently under review by the Huila Administrative Court. Fishermen are seeking the protection of collective rights and a healthy environment, public health, food security and safety and the prevention of technically foreseeable disasters. Furthermore, the plaintiffs are seeking the issuance of an order compelling the entities to immediately take the necessary corrective and preventive measures to halt the imminent danger of massive fish mortality in the Betania reservoir fish farming projects, relating to the filling of the reservoir and the operation of the El Quimbo hydroelectric project. This lawsuit does not have a specified monetary amount because of its nature as an action regarding the protection of collective rights. The matter has been pending decision since June 18, 2018. During the evidentiary stage, the environmental authorities ANLA and CAM jointly presented a report in which they stated that the company had complied with the obligations imposed by the Administrative Court within the injunctive measures, even though the matter has no quantified claims. The final arguments were presented by Emgesa on June 15, 2018, and the matter was submitted for consideration on June 18, 2018. The company expected that a first judgment would be issued before the end of the first quarter of 2021. On January 12, 2021, the first instance judgment by the Court of Huila (delivered by formal notice to the Company on February 1, 2021) became known, and, although it recognized that the oxygenation system implemented by Emgesa mitigated the risks associated with the protection of fauna in the Betania basin, the judgment imposed a number of obligations on the environmental authorities involved, as well as on Emgesa itself. In particular, Emgesa is required to implement a decontamination project aimed at ensuring that the water in the basin does not generate risks for the river's flora and fauna, which will be subject to verification by ANLA, as well as to permanently ensure the operation of the oxygenation system already implemented, adapting it to the parameters required by ANLA. The Company will file an appeal of the decision once the Court has responded to certain requests for clarification and integration of the judgment. The first instance judgment only ordered the Company to conduct a decontamination project and there was no economic recognition for the plaintiff. Should the judgment be confirmed such project will be assumed by the business line and no payments will be made. |
| 4. | In class-action lawsuit No. 1-001-33-34-001-2014-00056-00, filed by several residential complexes — including La Sabana Medical Center — against Codensa S.A. in the First Administrative Court of the Bogotá Capital District, the plaintiffs demand the refund of an alleged tariff cost excess that they were charged due to a failure to apply a tariff benefit to which the plaintiffs argue they are entitled as Voltage Level One users and infrastructure owners, as established in Resolution No. 082 of 2002, modified by Resolution No. 097 of 2008. Codensa responded to the complaint by rejecting it in its entirety. A conciliation hearing was held between the parties, without success. An evidence order was issued on May 15, 2018 and the joinder of new plaintiffs was denied. |
F-168
| The proceedings are in the evidentiary stage, and the estimated value of this lawsuit is approximately COP337,000 million (ThUS$98,480). A judgment has not yet been issued because there is no certainty of the plaintiffs' claim. |
| 5. | Henry Andrew Barbosa filed a class-action lawsuit against Codensa and the Special Public Services Administrative Unit (UAESP) under File No. 2009-0069 of the Bogotá Capital District before the Tenth Administrative Judge of the Bogotá Capital District. Subsequently, Codensa filed an action for nullification and restoration of rights against the UAESP, under File No. 2018-00718, which is currently pending before the Administrative Court of Cundinamarca. In the class action, the judge ordered Codensa and the UAESP to reassess the 1997 Public Lighting Agreement signed between them, since it was determined that there were 8,661 fewer streetlights than Codensa had taken into account in its billing. In 2014, the parties agreed to the reassessment and carried out a transaction for the periods 1998 to 2004, resulting in a debt of COP14,433 million (ThUS$4,218) owed by Codensa to the UAESP. By an order of June 1, 2017, the Court refused to consider the above-mentioned 2014 agreement and instead ordered the UAESP to carry out a unilateral assessment. In compliance with the order, the UAEPS issued Resolution No. 000730 of December 18, 2017, where it determined that Codensa should pay COP113,082 million (ThUS$33,046). The nullification and restoration of rights action filed against the UAESP was in the notification stage and the UAESP was in the process of answering the demand. On August 21, 2019, the Administrative Court of Cundinamarca at the initial hearing determined that no further evidence was needed and ruled against Codensa, subtracting any value from the reassessment agreed by the parties in 2014. An appeal was filed and submitted to the Council of State. The UAESP had begun the collection process, but the collection was suspended with the admission of the nullification action. Codensa paid COP24,400 million (ThUS$7,130), which it considers its obligation to pay under the 2014 reassessment agreements. In total, the nullification action has an approximate value of COP88,698 million (ThUS$25,920). |
| 6. | On December 4, 2017, Grupo Energía de Bogotá (GEB) notified Enel Américas of its intention to submit to arbitration the dispute between the parties regarding the distribution of the profits of the 2016 fiscal year for Emgesa and Codensa in accordance with the provisions of the Investment Framework Agreement (AMI). GEB claims that Enel Américas is acting contrary to its own previous conduct by voting for a 70% distribution of profits, under the allegedly incorrect interpretation that this proportion corresponds to “all available profits in accordance with good commercial practice.” Furthermore, GEB claims that Enel Américas’ conduct violates the provisions of Clause 3.8 of the AMI, which regulates the form of distribution of profits by obliging the parties to vote in favor of the distribution of all (100%) profits that may be distributed during each fiscal year. The claims seek a declaration of Enel Américas’ breach of the AMI and the consequent distribution of 100% of the profits of the 2016 fiscal year for each company. The amounts claimed not received by GEB as a consequence of the partial distribution of profits were COP63,619 million (ThUS$18,591) for Codensa and COP82,820 million (ThUS$24,202) for Emgesa. GEB decided to withdraw the claims to make amendments and to include new issues. On October 8, 2018, GEB filed a new arbitration claim with the Arbitration Center of the Chamber of Commerce of Bogotá for the alleged breach of the AMI in relation to the failure by Emgesa and Codensa to make full distributions of dividends in 2016, 2017, and 2018 and a breach of other provisions of the shareholders’ agreements and requesting compensation for damages. The new claims amount to ThCOP1,876,417,133 (ThUS$548,339), plus interest. The arbitration is in the closing arguments phase and a hearing was scheduled to receive final arguments on February 10, 2021. Ultimatelly, the parties requested a three-month extension, which may last until June 25, 2021, during which time the court proceedings are suspended. uring this period, conditions for incorporation of the joint investments into the renewable business, definition of new rules of corporate governance that are more closely aligned with the current objectives and opportunities of this new stage, and other conditions, must be set forth in order to reach a final agreement and conclude the arbitration dispute. If the conditions do not occur, the arbitral tribunal shall give a final judgment. |
| 7. | Thirty-seven applications for arbitration proceedings were filed by Grupo Energía Bogotá against Codensa (17) and Emgesa (20), seeking the nullification of the Minutes of the Board of Directors and the Shareholders’ General Meeting. These applications present, among others, the following arguments: i) Conflicts of Interest with economically-affiliated companies; ii) Impossibility of ratifying authorizations to contract; iii) Improper waiving of conflicts of interest; iv) Violation of the AMI in terms of distribution of profits; and v) insufficient information for decision making. The applications are similar in that they indicate that the decisions are flawed because they contravene fundamental principles, they are null and void due to their unlawful object and reason, they breach |
F-169
| AMI provisions regarding the distribution of profits and certain minutes were approved while the arbitration was pending. The amount is undetermined. However, the case involves decisions made about transactions with companies with a high-impact economic link to the business. On July 5, 2018, the selection of arbitrators took place given that there was no agreement regarding the appointment of arbitrators or the consolidation of the arbitrations with the arbitration against Enel Américas. These arbitration proceedings are in their initial phase. By order dated June 21, 2019, the Court of Arbitration consolidated the proceedings into a single arbitration because the claims are similar, they can be carried out in the same proceeding, are between the same parties, and use the same evidence. Accordingly, only one arbitration will be conducted with respect to Emgesa which caused GEB to revise its claim. With respect to Codensa, a similar decision was issued on October 25, 2019, ordering the consolidation of 17 arbitration proceedings into a single proceeding. In the Emgesa arbitration, the response to the claim was submitted; however, the parties mutually agreed to suspend the proceeding until December 28, 2020. In the Codensa arbitration, the response to the claim was submitted; however, the parties by mutual agreement requested suspension of the proceeding until December 28, 2020. Subsequently, there was an additional extension of this suspension. |
Peru:
| 8. | The Peruvian National Customs and Tax Authority (SUNAT) challenged Enel Generación Perú (formerly known as Edegel), through Notices of Assessments and Penalties, about the deduction as an expense of the depreciation corresponding to part of the highest book value assigned to the assets in the appraisal carried out as a result of their voluntary revaluation in 1996. The rejected value of the appraisal relates to financial interest paid during the construction stage of the power generation plants. SUNAT’s position is that Enel Generación Perú has neither reliably demonstrated that it was necessary to obtain financing in order to build the generation plants that were revalued, nor that such financing had actually been incurred. Enel Generación Perú’s position is that SUNAT cannot demand such proof, since the appraisal is intended to assign to the asset the market value appropriate to it at the time the appraisal is conducted, and not its historical value. In this case, the appraisal methodology took into consideration the fact that power plants of such magnitude are built with financing. If SUNAT did not agree with the valuation, it should have presented its own appraisal, which it did not do. |
For the year 1999: In February 2012, the Tax Court (“TF”) resolved the lawsuit regarding the 1999 tax year in favor of Enel Generación Perú with regard to two plants and against it with respect to four plants, reasoning that only the first two were proven to have been financed. Enel Generación Perú paid the taxes reassessed by SUNAT in June 2012, amounting to ThPEN37,710 (ThUS$10,423), which will have to be refunded if a favorable outcome is obtained in the complaint filed with the judicial courts (“PJ”) against the TF’s decision, filed in May 2012 against SUNAT and the TF.
In March 2018, Enel Generación Perú received the Court of Appeals’ decision declaring the PJ’s decision null and void and ordering the rendering of a determination on the claim. The file was referred to the PJ in June 2018. The judgment was notified to Enel Generación Perú in January 2020, whereby the PJ declared all claims groundless. In the same month, Enel Generación Perú filed an appeal.
In July 2020, Enel Generación Perú was notified of the resolution granting the appeal. In September 2020, the case was heard in the Court of Appeals and pleadings were filed. In October 2020, Enel Generación Perú was notified of the judgment issued by the Court of Appeals, which partially confirmed the first instance judgment, declaring the main claim groundless (partial nullity of the TF resolution, as it refused to include “interest during construction” in the calculation of the “new similar value”), as well as the second main claim (SUNAT is ordered to consider such interest in the calculation model) and their respective supplementary claims. Likewise, the Court of Appeals voided the judgment and ordered the file to be sent back to the PJ for a ruling on the subordinate claim (reimbursement of late interest for undue delay). This position placed Enel Generación Perú in an unusual situation since, on the one hand, it had to challenge the judgment before the Supreme Court through a cassation appeal and, on the other hand, the PJ would have to rule on the subordinate claim.
F-170
In November 2020, Enel Generación Perú filed a cassation appeal against the aforementioned judgment issued by the Court of Appeals. In that same month, Enel Generación Perú was notified of the Court of Appeal’s resolution, whereby the Court of Appeals deemed the cassation appeal to have been filed; however, Enel Generación Perú will not escalate the appeal to the Supreme Court until the PJ rules on the subordinate claim.
For the years 2000 and 2001: The reasoning adopted for the 1999 tax year was applied to the 2000 and 2001 periods and Enel Generación Perú paid ThPEN18,786 (ThUS$5,193).
Judicial case: In March 2018, the PJ rendered a decision declaring the lawsuit groundless, and ruled in favor of Enel Generación Perú. with respect to the non-application of interest on the advances from March to December 2001. During the same month, Enel Generación Perú. appealed the unfavorable portion of the judgment. In December 2018, the oral report was submitted and several briefs were submitted. In December 2018, the PJ issued a ruling to void the trial court decision, ordering that the trial court issue a new decision considering the arguments set out in its ruling. In March 2019, the PJ returned the case file to the trial court. In May 2020, Enel Generación Perú. learned that the trial court had issued a judgment declaring that the claim of Enel Generación Perú. was partially admissible, but only with respect to the claim related to the collection of late interest for failure to make payments on account for the periods from March to December 2001. The other claims were declared groundless. In August 2020, Enel Generación Perú. appealed the trial court's decision. In December 2020, Enel Generación Perú. was notified of the trial court’s resolution, which ordered a stay of execution for the appeal and the file was submitted to the PJ.
Administrative case: In August 2017, Enel Generación. Perú was notified of the Compliance Order, which was issued taking into consideration the TF’s ruling for the 1999 fiscal year, by means of which SUNAT reassessed the tax due for the period 2000-2001. According to SUNAT, Enel Generación Perú’s updated tax due amounted to PEN 220 million, because of the annual corporate tax for 2000, a related fine, and payments on account for the 2001 fiscal year. Also, the discounted credits in the company’s favor amounted to PEN 22 million for the 2001 corporate tax. In September 2017, Enel Generación Perú. was served with a decision in which SUNAT corrected the Compliance Order of August 2017, stating that it had applied an incorrect restatement factor to the assessed tax, which resulted in the tax assessed by SUNAT amounting to PEN 190 million, rather than PEN 220 million. In September 2017, Enel Generación Perú. appealed the above-mentioned Compliance Order. Enel Generación Perú. presented written arguments in July 2018. In October, the oral report was made, and arguments were presented.
Forthcoming legal actions:
For the year 1999: Enel Generación Perú S.A.A is awaiting the trial court’s issuance of a judgment on Enel Generación Perú´s lawsuit.
For the years 2000-2001: Enel Generación Perú is awaiting the TF’s issuance of the corresponding resolution and for the trial court to issue a ruling on Enel Generación Perú’s lawsuit.
The total amount involved in these lawsuits is estimated at ThPEN75,821 (ThUS$20,958).
| 9. | SUNAT disallowed recognition by Enel Distribución Perú. (formerly known as Edelnor) of the commercial energy losses recognized by the company between 2006 and 2011, equivalent to approximately 2% of the total purchased and self-generated energy. SUNAT challenged the cost of sale of that energy determined by Enel Distribución Perú S.A.A., on the basis of an energy theft crime that was not established by the courts of law. SUNAT’s position is that the infeasibility of a legal action can only be demonstrated through a police report and a resolution issued by the Attorney General (Public Prosecutor’s Office) declaring, on a definitive or provisional basis, the filing of the criminal action for energy theft. The TF has rendered some decisions stating that such a resolution is necessary. Enel Distribución Perú’s position is that since the law does not establish a specific mechanism on how the unfeasibility of a legal action will be demonstrated, it is possible to present any available, appropriate and reasonable evidence for this situation (free review of evidence). Enel Distribución Perú chose to demonstrate that it was futile to prosecute these crimes through legal actions, presenting reports produced by specialized engineers, reports issued by the General Directorate of Electricity (DGE) of the Ministry of Energy and the Mines and by the Energy and Mining Investment Supervisor Authority (OSINERGMIN), the Peruvian |
F-171
| electricity regulatory authority, demonstrating that there was no sense to go to the courts and prosecute a crime that would be futile because the perpetrators of the crime, the exact occurrence of theft, the specific place where it occurs and the amount stolen at each opportunity could not be identified. The TF has allowed this type of proof in case of theft in the distribution of water (an industry similar to the distribution of electricity) and has not indicated that a resolution issued by the Attorney General (Public Prosecutor’s Office) is the only admissible evidence demonstrating the futility of pursuing legal action in this case. |
The proceedings have progressed as follows:
For the year 2006: The TF ruled against Enel Distribución Perú in the appeal, although it agreed with Enel Distribución Perú’s position based on the disputed issue. Therefore, the TF upheld the defense after concluding that Enel Distribución Perú did not demonstrate the amount of commercial losses attributable to theft. This finding stems from the fact that commercial energy loss is not exclusively composed of stolen energy, but also of energy lost due to other reasons, such as measurement errors, billing errors and errors in estimating physical losses. Due to the immediate enforceability of the TF judgment, Enel Distribución Perú paid the tax due in full to SUNAT amounting to a total of PEN14,517 million (US$4,013 million). Following a decision partially in favor of Enel Distribución Perú, in January 2017, both SUNAT and Enel Distribución Perú filed cassation appeals with the Supreme Court of Justice. In January 2018, Enel Distribución Perú was served with the decision dismissing its cassation appeal and upholding SUNAT’s extraordinary appeal. In November 2019, Enel Distribución Perú was served with the judgment of the Supreme Court stating that the cassation appeal filed by SUNAT should be declared founded, and, consequently, nullified the second instance judgment, and ordered that a new decision had to be issued. In August 2020, Enel Distribución Perú was served with the judgment of the Court, which declared the subordinate claim admissible and, consequently, ordered the return of the administrative file to SUNAT, in order for SUNAT to determine, based on the existing evidence, the percentage of extraordinary losses due to electricity theft. In the same month, the TF and SUNAT filed appeals against the judgment, which were submitted to the Supreme Court in September 2020.
For the years 2007 and 2008: Considering the result obtained in connection with the 2006 tax year, Enel Distribución Perú initiated a new defense strategy: (i) theoretically, commercial energy losses may be composed of errors of measurement, billing and estimates of physical losses; (ii) since such losses are determined by “subtraction” (the energy that entered the system “minus” the energy supplied to customers and “minus” the physical loss of energy), commercial energy loss may actually be composed of such errors only in cases of under-measurement or under-invoicing or underestimation of physical losses; (iii) if there are no such errors, the amount shown as commercial energy loss is composed only of losses from theft, (iv) during the inspection, SUNAT reviewed both the billing and the physical loss report and neither challenged nor investigated them; therefore, in this respect, SUNAT cannot raise billing errors or errors in estimating physical losses as part of the commercial energy loss and (v) with respect to measurement errors, the margins for this type of errors are minimal as a business’s electrical energy distribution is regulated.
For the year 2007: Enel Distribución Perú presented evidence that a small amount of loss was attributable to under-measurement. At that time, commercial energy losses consisted mainly of theft (95%) and, to a lesser extent (5%), measurement errors. Enel Distribución Perú presented an oral report and its arguments.
For the year 2008: Enel Distribución Perú presented evidence that demonstrated an excess of measurement. Therefore, commercial energy losses were only theft. In December 2019, Enel Distribución Perú was notified of the TF’s ruling which rendered a partially favorable decision. In its decision, the TF (i) revoked and left without effect the position of the SUNAT related to the 2008 income tax; (ii) revoked the tax and fine assessments related to advance payments for the period March to December 2008; (iii) confirmed the tax and fine assessments related to the advance payments for the periods January and February 2008.
In August 2020, Enel Distribución Perú was notified that a Contentious Administrative Lawsuit against the decision of the TF had been filed by SUNAT. In September 2020, Enel Distribución Perú answered the lawsuit.
F-172
For the year 2009: SUNAT objected to the deduction of commercial energy losses, for the same reasons as in previous years. In November 2013, Enel Distribución Perú filed a claim in which, in addition to reiterating the reasons why the commercial loss of energy is deductible, provided evidence that demonstrated that the loss of commercial energy consisted mainly of theft (93%) and, to a lesser extent (7%), of measurement errors. In June 2014, SUNAT requested information on the details of the “standard energy loss” calculation. In July 2014, Enel Distribución Perú responded to the points requested by SUNAT. In August 2014, SUNAT served Enel Distribución Perú with the decision ruling on the latter’s claim. In that decision, SUNAT set aside the objection related to the standard loss of commercial energy, confirming the excess attributable to such amount. In September 2014, Enel Distribución Perú paid the debt it owed to SUNAT amounting to ThPEN5,274 (ThUS$1,458), which amount includes default interest on account payments and fines, and filed an appeal with the TF. In July 2019 Enel Distribución Perú was notified of the TF’s ruling which rendered an unfavorable decision against the company. In October 2018, Enel Distribución Perú filed a lawsuit against the TF ruling before the PJ, which was admitted by the court the same month. In December 2019, the PJ received the response to the claim from SUNAT and the TF, declared the process ready to proceed, set out the controversial points and admitted the evidence. In the same month, Enel Distribución Perú requested that a date was set for the oral report and requested a hearing. In July 2020, the oral report was scheduled for April 21, 2021.
For the year 2010: SUNAT only objected to the deduction of commercial energy losses corresponding to the excess of the standard commercial energy loss. In July 2015, Enel Distribución Perú paid the debt owed to SUNAT amounting to ThPEN5,084 (ThUS$1,405) including taxes, interest on late payments and fines. A claim was filed with SUNAT. In April 2016, Enel Distribución Perú was notified of SUNAT’s decision, which maintained the objections, and an appeal was filed that same month. In January 2020, Enel Distribución Perú was notified of the TF’s resolution confirming SUNAT's position: not allowing for the deduction of the excess of the standard energy loss. In June 2020, Enel Distribución Perú filed a Contentious Administrative Lawsuit against the TF’s resolution. In September 2020, the TF and SUNAT answered the claim.
For the year 2011: SUNAT also objected to the deduction of commercial energy losses corresponding to the excess of the standard commercial energy loss. In July 2016, Enel Distribución Perú paid the debt owed to SUNAT amounting to ThPEN3,126 (ThUS$864), which amount includes default interest on account payments and fines. In September 2016, Enel Distribución Perú was served with tax assessments and fines. In October 2016, Enel Distribución Perú filed a claim against the taxes and fines. In June 2017, Enel Distribución Perú received SUNAT’s decision which maintained the objections raised. In July 2017, Enel Distribución Perú filed an appeal. In February 2020, Enel Distribución Perú was notified of the TF’s decision that confirmed the position of SUNAT, which would not permit the deduction of the excess of the standard energy loss.
In June 2020, Enel Distribución Perú filed a Contentious Administrative Lawsuit against the TF resolution and was notified that the Contentious Administrative Lawsuit was accepted, and that SUNAT and the Tax Court had 10 business days to respond. In July 2020, the claim was deemed to have been answered. In August 2020, the proceedings were declared settled, the disputed points were resolved, and the evidence was admitted. In October 2020, the Court scheduled the oral report for June 18, 2021.
For the year 2014: SUNAT also objected to the deduction of commercial energy losses in excess of the standard commercial energy loss. It should be noted that Enel Distribución Perú paid the income tax associated with this expense, with the presentation of the original annual affidavit, which amounted to ThPEN 3,582 (ThUS$ 990). In January 2020, Enel Distribución Perú filed a claim against the tax assessment. In March 2020, Enel Distribución Perú submitted evidence and its brief, attaching additional supporting documentation. In December 2020, Enel Distribución Perú was notified of the SUNAT resolution which, among other things, reaffirmed the objection related to the excess of the standard commercial energy loss
Forthcoming legal actions:
F-173
For the year 2006: Enel Distribución Perú is waiting for the PJ’s Supreme Court to analyze the cassation appeals presented.
For the year 2007: Enel Distribución Perú is waiting for the TF to issue a resolution.
For the year 2008: Enel Distribución Perú is waiting for the case to be declared ready to proceed, the controversial points to be defined and the evidence to be admitted.
For the year 2009: Enel Distribución Perú is waiting for the oral report.
For the year 2010: Enel Distribución Perú is waiting for the case to be declared ready to proceed, the controversial points to be defined and the evidence to be admitted.
For the year 2011: Enel Distribución Perú is waiting for the oral report.
For the year 2014: Enel Distribución Perú will file an appeal against SUNAT’s resolution.
The total amount involved in these lawsuits is estimated at PEN 83,360 million (ThUS$23,041).
| 10. | In 1997, Enel Generación Perú, Perené and Simsa entered into a joint venture agreement for the development of the Chimay and Yanango power plants, agreeing to a payment of US$13 million for Enel Generación Perú. In 1998, Enel Generación Perú signed a contract with its parent company, Generandes (now Enel Perú, after the merger with Generandes), for Enel Perú to provide supervision services for the construction of the power plants, agreeing to a payment of US$13 million for Enel Perú. In turn, Enel Perú entered into contracts with its shareholders, Entergy Perú and Conosur, transferring its commitments with Enel Generación Perú and agreeing to a payment of US$3 million for each party. SUNAT challenged this transaction the following reasons: (i) in the case of Enel Generación Perú, for using the VAT as a tax credit that was surcharged by Enel Perú, and (ii) in the case of Enel Perú, for treating the expense as deductible from the company’s income tax and for using the VAT as a tax credit that was surcharged by its shareholders. SUNAT’s position is that the transactions are not valid because Enel Perú and its shareholders are holding companies that have no personnel to provide such services. The supervision services were provided directly by Enel Generación Perú through its own personnel. The TF has supported SUNAT’s position in resolutions Nos. 15281-8-2014 and 11180-5-2017 issued for the Enel Generación Perú and Enel Perú cases, respectively. Taking this into consideration, Enel Perú expects that the PJ will issue a new decision, indicating that there are no costs and no revenues. According to this expected new determination, there would be a payment due in excess of Enel Perú’s income tax paid, and this excess would be offset with VAT, eliminating the contingency for this case. |
The proceedings have progressed as follows:
After an adverse decision in the administrative process, Enel Perú paid SUNAT the tax owed of ThPEN 87,055 (ThUS$ 24,063) and filed a lawsuit against SUNAT and the TF. In September 2019, Enel Perú was notified of the ruling that declared the claim unfounded, except in a petition. In that same month, Enel Perú filed an appeal against the aforementioned ruling. In August 2020, Enel Perú was notified of the judgment of the appeals court that declared the judgment of the court void and ordered it to issue a new ruling.
The total amount involved for this lawsuit is ThPEN 87,055 (ThUS$ 24,063), which has been duly paid. The judicial file is pending again in the court for it to issue a new ruling.
| 11. | On July 5, 2016, Electroperú filed a request for arbitration against Enel Generación Perú due to disagreements regarding the interpretation of certain technical aspects (committed power, start date of the contract’s second stage, determination of the Base Gas Price) of an electric power supply contract entered into in 2003. The total amount of this arbitration is estimated at approximately PEN136.66 million (US$41.2 million). At the same time, the dispute stems from claims by Enel Generación Perú against Electroperú for approximately US$18.5 million. Electroperú filed its claim on June 4, 2017 and Enel Generación Perú filed its answer to the claim and its |
F-174
| counterclaim on August 4, 2017. On August 10, 2017, the arbitral panel notified Enel Generación Perú of the settlement of the arbitration expenses. On September 18, 2017, Electroperú filed its counter-argument to the answer to the claim and counterclaim that had been filed by Enel Generación Perú. On October 3, 2017, Electroperú filed its response to the counterclaim that had been filed by Enel Generación Perú. On November 2, 2017, Enel Generación Perú filed its answer to the response that had been filed by Electroperú. On November 17, 2017, Enel Generación Perú acknowledged proper service of the response to the counterclaim filed by Electroperú. On January 2, 2018, Enel Generación Perú filed its counter-response to the arguments made by Electroperú. Arbitration hearings were held on July 23, 24 and 25, 2018. On August 24, 2018, the parties filed their closing arguments. On August 20, 2019, the final arbitration award was rendered in which the majority of the arbitral panel decided: (i) in the first claim of Electroperú, Enel Generación Perú was ordered to pay Electroperú ThUS$41,289, plus interest; (ii) in the second claim of Electroperú, Enel Generación Perú was ordered to pay Electroperú PEN49,229, plus interest; (iii) Enel Generación Perú’s counterclaim was deemed unfounded; and (iv) Enel Generación Perú must fully assume the costs of the arbitration proceeding and must reimburse Electroperú the amount of ThUS$589. On September 11, 2019, Enel Generación Perú submitted an appeal to the arbitral panel requesting (i) the exclusion of the arbitral award for Electroperú’s claims not contained in Electroperú’s arbitration demand and (ii) an interpretation of the arbitral award to remedy errors in motivation and assessment of the evidence. On October 9, 2019, the arbitral panel issued its decision on the appeal, rejecting it in its entirety. On November 6, 2019, Enel Generación Perú filed an appeal for annulment of the arbitration award before the Courts. On September 22, 2020, Enel Generación Perú was notified of the judicial resolution admitting for processing the aforementioned appeal for annulment. As of December 31, 2020, the decision by the Judiciary regarding Enel Generación Perú’s request for suspending the effects of the arbitration award is pending issuance. Likewise, Electroperú has not yet answered the claim for annulment of the arbitration award. Additionally, on September 1, 2020, Enel Generación Perú was notified of a judicial resolution that (i) admits for processing a demand for enforcement of the referred arbitration award filed by Electroperú and (ii) orders Enel Generación Perú to comply with the payment obligation contained in the award. On September 7, 2020, Enel Generación Perú submitted a written opposition to the aforementioned resolution to enforce the arbitration award.. As of December 31, 2020, the Judiciary has not yet formally notified Electroperú of the writ of opposition filed by Enel Generación Perú on September 7, 2020. |
Brazil:
Enel Distribución Ceará (Companhia Energética do Ceará S.A. or “Coelce”)
| 12. | The Public Prosecutor’s Office has filed a public civil action against Enel Distribución Ceará, Enel Generación Fortaleza and ANEEL (the Brazilian Electricity Regulatory Agency) alleging that a) the electric power purchase agreement (PPA) signed between Enel Distribución Ceará and Enel Generación Fortaleza (companies of the same economic group) was illegal, the price of the contracted energy being very high, with excessive costs in the final consumers’ tariff and b) the tariff review conducted by ANEEL since 2002 was wrong, since it took into consideration inaccurate data in the process. It is seeking the exclusion of these components from the tariff and the return of the sums unduly collected by the concessionaire. The PPA’s legality was confirmed at the judicial courts of first and second instances, but the tariff review process (item b) was held to be erroneous at these rulings. On December 8, 2020, a special appeal filed by Enel Distribución Ceará was summarily dismissed. Enel Distribución Ceará filed motions for clarification of the decision, and to date they remain unresolved. The amount involved in this lawsuit cannot be estimated. |
| 13. | In 2001, the Public Prosecutor’s Office for Labor Matters filed a public civil action against Enel Distribución Ceará alleging that the company was hiring third parties for the provision of final services (“outsourcing”), which was contrary to Brazilian law (Ruling 331 of the Brazilian Superior Labor Court), which allegedly only allows the provision of non-essential services by third parties. The Superior Labor Court issued a ruling declaring the outsourcing illegal. An appeal filed by Enel Distribución Ceará is currently pending trial by the Collective Bargaining Section (the reviewing section of the Superior Labor Court). Enel Distribución Ceará submitted a complaint to the Federal Supreme Court due to procedural irregularities (under the plenary reservation clause of the Federal Constitution), which was accepted by the court as a precautionary measure. The Federal Supreme |
F-175
| Court ordered suspension of the ruling that prohibited the outsourcing of activities by Enel Distribución Ceará. The injunction is valid until the final resolution of the claim. The amount involved in this lawsuit cannot be estimated. |
| 14. | Several rural electricity cooperatives have filed lawsuits to review the lease fee for the energy supply network in the rural area of the State of Ceará allegedly owned by them. Although Enel Distribución Ceará regularly pays the network lease fee to 13 rural electricity companies, a discussion on the ownership of these assets is pending decision, since they allegedly have already been directly replaced by Enel Distribución Ceará throughout the more than 30 years of these lease contracts. |
| • | Cooperativa de Eletrificação Rural do Vale do Acaraú (COPERVA) versus Companhia Energética do Ceará (Coelce): There is no preliminary injunction and there is still no first instance decision from the Ceará state court |
| • | Cooperativa de Eletrificação Rural do Vale do Acaraú (COPERVA) versus Companhia Energética do Ceará (Coelce): The Court of Justice (court of second instance) ruled in favor of Enel Distribución Ceará, rejecting the request for lease review, and a special appeal was filed by COPERVA and is currently pending before the Superior Court of Justice (court of third instance). On November 5, 2018, the Superior Court of Justice rendered a single-judge decision on a special appeal filed by COPERVA and vacated the ruling on the clarification attachments requested. In summary, the ruling judge held that the decision by the Court of Justice failed to provide satisfactory clarification on the facts claimed in COPERVA’s clarification attachment petitions and declared a retrial to hear this appeal. Enel Distribución Ceará filed an appeal against this decision on December 3, 2018 with the Superior Court of Justice in order that an en-banc decision be rendered (since the ruling had been issued by a single judge), which is pending a decision. As of December 31, 2020, the amount involved in the two lawsuits was BRL 312.2 million (ThUS$60,110). |
| • | Cooperativa de Energia, Telefonia e Desenvolvimento Rural (COERCE) versus Companhia Energética do Ceará (Coelce): There is no preliminary injunction and there is still no first instance decision from the Ceará state court. As of December 31, 2020, the amount involved in this lawsuit was BRL187.3 million (ThUS$36,058). |
| • | Cooperativa de Energia, Telefonia e Desenvolvimento Rural (COPERCA): versus Companhia Energética do Ceará (Coelce): On June 13, 2019, the judge in the Ceará state court issued a decision ordering the transfer of the claim to the Federal Courts, considering ANEEL’s interest in the claim, which transfer occurred on November 28, 2019. As of December 31, 2020, the amount involved in this lawsuit was BRL 162.7 million (ThUS$31,321). |
| 15. | Fiação Nordeste do Brasil S/A (FINOBRASA), which has now been succeeded by Vicunha, filed a lawsuit against Enel Distribución Ceará claiming that the adjustment of electricity tariffs made through Decrees Nos. 38 and 45 (DNAEE) in February 1986 are illegal. It is seeking the declaration of illegality of the adjustments and an order that its effects be reflected in all subsequent adjustments and the return of amounts inappropriately collected. The Court of Justice (court of second instance) rendered a decision declaring the adjustment made in 1986 illegal, but it has rejected its reflection in the subsequent adjustments (cascade effect). A special appeal filed by FINOBRASA is currently pending before the Superior Court of Justice (court of third instance). As of December 31, 2020, the amount involved in the lawsuit was BRL 116.2 million (ThUS$22,363). |
| 16. | Enel Distribución Ceará must apply the “pro rata” rule to calculate the amount of the tax on movement of goods and services (“ICMS”) deductible with respect to the total ICMS included in energy purchases. The rule stipulates that the percentage represented by the income taxed by ICMS over the total income (whether or not subject to ICMS) is deductible. For the purposes of its inclusion in the pro rata denominator, Enel Distribución Ceará’s position is that the untaxed income is the result of applying the energy’s final selling price (the price after deducting the State of Ceará subsidy for low-income consumers) and the Brazilian Tax Authority maintains that the untaxed income is the price of the normal tariff (without deducting the State of Ceará subsidy for low-income consumers). Due to the differences that arose in the interpretation of these laws, Enel Distribución Ceará has a total of 10 lawsuits covering the years 2005 to 2014. The company continues its defense in the administrative and judicial proceedings. As of December 31, 2019, the total amount involved in these lawsuits was at BRL 246 million (ThUS$47,360). |
F-176
| 17. | The State of Ceará issued assessments to Enel Distribución Ceará for the periods 2003, and from 2004 to 2014, since it considered that the ICMS for the acquisition of property, plant and equipment had been incorrectly deducted. Enel Distribución Ceará has filed its administrative defenses in all administrative and judicial proceedings and is awaiting final decisions. As of December 31, 2020, the total amount involved in this lawsuit was estimated at BRL 207 million (ThUS$39,852). |
Enel Distribución Goiás S.A. (formerly CELG Distribuição S.A.)
| 18. | Several municipalities have filed lawsuits against Enel Distribución Goiás claiming that an agreement made with the State of Goiás and the Goiana Association of Municipalities (AGM) which provides for the direct transfer to Enel Distribución Goiás of ICMS amounts owed to the municipalities by the State of Goiás is illegal. The amounts transferred were used to pay late electric bills. Enel Distribución Goiás responded that despite the potential illegality of the agreement, the amounts were effectively due and it would not be possible to return them to the municipalities. The Court of Justice of Goiás is divided and there is still no decision, which will only be rendered by the Superior Court of Justice (the court of third instance). |
| - | Municipality of Aparecida de Goiânia versus CELG Distribuição S.A. As of December 31, 2020, the amount involved in the claim was ThBRL 628.7 (ThUS$ 121.03). |
| - | Municipality of Quirinópolis versus CELG Distribuição S.A. As of December 31, 2020, the amount involved in the claim was ThBRL 336.1 (ThUS$ 64.12). |
| - | Municipality of Anápolis versus CELG Distribuição S.A. As of December 31, 2020, the amount involved in the claim was ThBRL 322.7 (ThUS$ 62.12). |
| - | Municipality of Bela Vista de Goiás versus CELG Distribuição S.A. As of December 31, 2020, the amount involved in the claim was ThBRL 106 (ThUS$ 20.41). |
| - | Municipality of Caiapônia versus CELG Distribuição S.A. As of December 31, 2020, the amount involved in the claim was ThBRL 112.2 (ThUS$ 21.62). |
| - | Municipality of Cezarina versus CELG Distribuição S.A. As of December 31, 2020, the amount involved in the claim was ThBRL 141 (ThUS$ 27.15). |
| 19. | Enel Brasil S.A. and Enel Distribución Goiás have filed a security order against the tax authority of the State of Goiás so that the process for restitution of the amounts paid by Enel Distribución Goiás in relation to the claims guaranteed by Laws No. 17,555 (reimbursement for FUNAC) and 19,473 (reimbursement for ICMS – IVA Tax Credits) continues normally. The judge previously rejected a request for an injunction. Enel Brasil and Enel Distribución Goiás have filed an appeal against the decision, which was accepted by the Court of Justice of the State of Goiás, suspending the application of the new law and upholding the validity of Laws No. 17,555 (FUNAC) and 19,473 (Tax Credits). The injunction was subsequently revoked by the Court, as the Court did not recognize the urgency that justified an injunctive measure. Enel Brasil S.A. and Enel Distribución Goiás have filed an appeal against the decision, arguing that the right to the guaranty is legal and contractual, and the actions of the State of Goiás with the goal of suspending the integral application of the laws are clearly illegal. There is no first instance decision. The amount involved in the lawsuit is indeterminate. |
| 20. | Enel Brasil S.A and Enel Distribución Goiás have filed an ordinary action against the State of Goiás requesting that Law No. 20,468 and all its effects be suspended. In summary, Law No. 20,468 has completely revoked Law No. 19,473 (Tax Credits), which grants Enel Distribución Goiás, as an alternative to cash payment, the right to offset payments made by the company for litigation whose events arose before 2015 by means of ICMS (IVA) tax credits. The judge rejected the injunction request. Enel Brasil S.A. and Enel Distribución Goiás have filed an appeal against the decision, arguing that the repeal of Law No. 19,473 (Tax Credits) is unconstitutional, since the tax incentive provided in the Law was established in full conformity with applicable legislation and was characterized as an acquired right, which is inviolable in accordance with Article XXXVI of the Brazilian Constitution. |
In addition to characterizing the acquired right, article 178 of the Brazilian Tax Code establishes the impossibility of revocation of a tax incentive granted by certain conditions, an understanding confirmed by repeated statements
F-177
of the Federal Supreme Court (Súmula STF 544). There has not been a decision in the first instance. The amount involved in the lawsuit is indeterminate.
| 21. | A union representing 513 employees of CELG (now Enel Distribución Goiás) filed a lawsuit for recognition of work (other than work contracted for) by electricians. In the lawsuit, the union affirmed that the electricians were carrying out the work of qualified professional electricians. The judge ruled against CELG and CELG has filed an appeal against that decision. The Regional Labor Court issued a decision, rejecting CELG’s appeal. CELG appealed to the Superior Labor Court, which also rejected the appeal. The judgment is in the enforcement stage, with a large divergence in the amounts discussed. Enel has paid BRL 37.6 million (ThUS$ 7,246). As of December 31, 2020, the estimated amount involved in the lawsuit was BRL 329.6 million (ThUS$ 65,079). The amount of the ultimate payment obligation is still uncertain given the divergence in the discussed calculations.. |
| 22. | The Public Prosecutor’s Office for Labor Matters filed a public civil action against Enel Distribución Goiás alleging that the company was hiring third parties for the provision of final services (“outsourcing”), contrary to Brazilian law (Ruling 331 of the Brazilian Superior Labor Court). In the court of first instance, the labor judge declared the sub-contracting legal. The Regional Labor Court, accepted the appeal filed by the Public Prosecutor’s Office for Labor Matters, reversed the decision of the labor judge in the court of first instance and has declared the sub-contracting illegal. Enel Distribución Goiás filed an appeal to the Brazilian Superior Labor Court, which upheld the Regional Labor Court decision. The decision was suspended by the Federal Supreme Court until judgment of the constitutional complaint discussing the matter in the Federal Supreme Court. The amount involved in the lawsuit is indeterminate. |
| 23. | A union representing 1,715 employees filed a lawsuit against Enel Distribución Goiás questioning the legal nature of "food aid". The legal issue is the inclusion of this benefit in the compensation of the employees who received it before the company's adhesion to the PAT (Food Program for Workers) in 2008. A judgment was issued ordering the Company to pay the difference (integration of food aid to compensation of employees prior to May 7, 2008). Enel Distribución Goiás' appeal was rejected by the Regional Labor Court of the 18th Region (Goiás). Enel Distribución Goiás has appealed to the Superior Labor Court, which was preliminarily rejected. Enel Distribución Goiás has filed a clarification request against the decision, which is awaiting a resolution. As of December 31, 2020, the estimated amount involved in the lawsuit was BRL 216.9 million (ThUS$41,769). |
| 24. | Enel Distribución Goiás was audited by the Brazilian Tax Authority due to its position on the exclusion of ICMS amounts from the Social Contributions base (PIS/COFINS). The company excluded the ICMS before a final decision was made, and consequently the Brazilian Tax Authority issued four assessments against Enel Distribución Goiás, arguing that exclusion was not permitted. In an unrelated case with precedential value, the decision by the Superior Court acknowledged that ICMS should not be part of the PIS and COFINS tax base. A judgment on an appeal to this decision filed by the Brazilian Tax Authority is still pending. In the specific case of Enel Distribución Goiás, the final decision by the court on the right of Enel Distribución Goiás not to include the ICMS in the Social Contributions base is pending. The company obtained a firm and definitive decision in annulment action for the cancellation of two records collected in fiscal execution. Because of that the Brazilian Tax Authority canceled a large part of the assessment, which was reduced from BRL 398,447 to BRL 12,799. The court of first judicial instance issued a ruling favorable to the company on the remaining value and a judgment is awaited from the court of second judicial instance. The other assessments remain suspended. The total amount involved in this lawsuit (including the reduction) was BRL 237 million (ThUS$45,628). |
| 25. | In March 2017, the Federal Supreme Court of Brazil resolved a matter of general applicability, related to the calculation of PIS and COFINS taxes. The Federal Supreme Court confirmed the theory that the ICMS tax should not be part of the base for calculation of PIS and COFINS taxes; however, the Brazilian federal government filed an appeal, in order to determine the temporary effects and make some clarifications. |
Enel Brasil’s subsidiaries in Brazil that were affected by the Federal Supreme Court decision filed legal actions to this effect in the respective Federal Regional Courts. During 2019, Enel Distribución Sao Paulo and Enel Distribución Ceará were notified of the final judgments issued by their respective Federal Regional Courts, recognizing their right to deduct the ICMS applied to their own operations from the base for calculation of PIS
F-178
and COFINS taxes (for the periods beginning December 2003 onwards for Enel Distribución Sao Paulo and May 2001 onwards for Enel Distribución Ceará).
Considering various internal analyses and the advice of legal advisors, as well as the best available estimates, Enel Distribución Sao Paulo and Enel Distribución Ceará recognized assets amounting to BRL 6,889,081,808 (ThUS$1,326,297) and BRL 1,309,965,386 (ThUS$252,197), respectively, as of December 31, 2020. As the overpayment of PIS and COFINS taxes was passed on to end customers at the time, simultaneously with the recognition of these taxes to be recovered, Enel Brasil’s subsidiaries have recognized a liability of a regulatory nature for the same amounts indicated above, net of any costs incurred or to be incurred by the companies in these legal proceedings. These liabilities represent the obligation to refund to the end customers the taxes that are recovered.
The Enel Américas Group will adopt tax credit recovery procedures in accordance with legal requirements. The transfer to end customers will depend on the effective use of the tax credit by the companies and will be carried out in accordance with the regulations of the Brazilian Electricity Regulatory Agency (ANEEL).
The legal actions filed by Enel Distribución Sao Paulo’s subsidiaries, Enel Distribución Rio and Enel Distribución Goias, are pending resolution and awaiting the final judgment of the respective Regional Courts.
It should be noted that the "Programa de Integração Social" (Program of Social Integration or “PIS”) and the "Contribuição para o Financiamento da Seguridade Social" (Contribution for the Financing of Social Security or “COFINS”) are federal contributions paid by companies in Brazil intended to finance employee programs, public health, social assistance and social security, levied on the companies' gross income. The "imposto sobre circulação de mercadorias e serviços" (ICMS), is a Brazilian value-added tax (VAT), levied on the sale of telecommunications and transportation goods and services.
Enel Distribución Río (formerly Ampla Energia e Serviços S.A.)
| 26. | Companhia Brasileira de Antibióticos (CIBRAN) has filed several lawsuits against Enel Distribución Río seeking compensation for energy supply failures in the years 1987 to 1994 and 1995 to 1999. |
• CIBRAN versus Ampla Energia e Serviços S.A. (1995-1999). The Court of Justice of the State of Río de Janeiro (the court of second instance) ruled in Enel Distribución Río’s favor, dismissing the claim for compensation. On June 19, 2020, a decision was issued that rejected the "agravo" (grievance) in the special appeal filed by CIBRAN, against which CIBRAN has filed a new appeal. All CIBRAN's appeals were rejected and the decision in favor of Enel has become final. This lawsuit will be excluded from the report.
• CIBRAN versus Ampla Energia e Serviços S.A. (1987-1994). The court of first instance ruled against Enel Distribución Río, which Enel Distribución Río appealed. On November 6, 2019, the Court of Justice of the State of Río de Janeiro issued a ruling upholding Enel Distribución Río’s appeal and rejecting all CIBRAN’s requests. CIBRAN opposed the ruling and a petition for clarification of the decision is currently pending. As of December 31, 2020, the amount involved in this lawsuit was BRL 553 million(ThUS$106,460).
| 27. | Indústria de Papel e Embalagens S.A. (CIBRAPEL) filed a lawsuit against Enel Distribución Río seeking compensation due to energy supply failures. A final decision was rendered against Enel Distribución Río. The expert opinion fixed the compensation at BRL21.5 million, but the amount has been challenged by Enel Distribución Río, and the appeal is pending resolution. As of December 31, 2020, the amount involved in the lawsuit was BRL 234 million (ThUS$45,062). |
| 28. | The Niterói Workers Union filed a labor claim against Enel Distribución Río demanding the payment of a 26.05% wage differential from February 1989, by virtue of the Economic Plan instituted by Decree Law No. 2,335/87. Enel Distribución Río lost all of the preceding court instances, and an extraordinary appeal filed by Enel Distribución Río is currently pending before the Federal Supreme Court. In parallel, 796 former employees filed |
F-179
| 432 lawsuits for enforcement of the judgment against Enel Distribución Río. On December 31, 2020, the amount involved in the lawsuit was BRL 118 million (ThUS$22,711). |
| 29. | The Brazilian Tax Authority served a notice of infringement in 2003 against Enel Distribución Río to collect alleged COFINS tax deficiencies for the period from December 2001 until March 2002. After adverse rulings in the courts of first and second instance, Enel Distribución Río filed an extraordinary appeal with the Federal Supreme Court and received an unfavorable decision. Enel Distribución Río submitted a new appeal to the Federal Supreme Court. The appeal was decided against the company. Furthermore, in the view of the court's judges, the appeal filed was intended to cause a delay in the end of the litigation and, therefore, they applied a penalty of 5% on the value of the tax deficiency. The company filed an appeal to void the fine applied and is awaiting a ruling. The debt and fine amount to BRL 171.1 million (ThUS$32,941) and BRL 8.6 million (ThUS$1,656), respectively. |
| 30. | In 2005, the Brazilian Tax Authority notified Enel Distribución Río on the non-applicability of the special tax treatment that had reduced to zero the withholding tax rate on interest paid abroad on the Fixed Rate Notes (FRN) issued by the company in 1998. Enel Distribución Río is still litigating this issue in the judicial court of the first instance. As of December 31, 2020, the total amount of this dispute is estimated at BRL 1,314 million (ThUS$252,973). |
| 31. | The State of Río de Janeiro levied a tax assessment against Enel Distribución Río for the periods from 1996 to 1999 and from 2007 to 2017, since it believed that the ICMS recorded on the acquisition of property, plant and equipment had been incorrectly deducted. Enel Distribución Río filed its administrative and judicial defenses in all proceedings, and the company awaits final decisions for the judicial proceeding. The total amount of this litigation is estimated at BRL 131 million (ThUS$25,221). |
Enel Distribución Sao Paulo (formerly known as Eletropaulo)
| 32. | Eletropaulo filed an action seeking the annulment of ANEEL’s administrative decision No. 48500-006159/2012-75, which determined the retroactive exclusion of the tariffs applied by Eletropaulo before the date of its third periodic review, with the refund of sums associated with a possibly non-existent network and rejected a subsidiary request (made by Eletropaulo) for inclusion of other existing service assets (network), but not recorded in the company’s remuneration base. There is no first instance decision and the lawsuit is in its initial phase. As of December 31, 2020, the amount involved in the lawsuit was BRL 1,093.5 million (ThUS$210,531). |
| 33. | The São Paulo electric power industry workers’ union filed 5 class-actions seeking the payment of hazard allowance for all employees (except management positions) of Eletropaulo located in the Barueri office until the decommissioning of the generating unit that was in the attic (below the heliport), during the period from February 2012 to February 2016, the time of the decommissioning of the generator unit and its installation outside the building. On July 11, 2019, a decision favorable to Eletropaulo was issued. The union filed an appeal with the court, which was dismissed on August 13, 2020. As of December 31, 2020, the amount involved in the lawsuit was BRL 129.7 million (ThUS$24.971). |
| 34. | The Federal Public Prosecutor’s Office (MPF) has filed a public civil action against Eletropaulo and ANEEL seeking to block the inclusion in consumers’ tariffs of amounts contracted with affiliated parties (AES Tietê, at that time) and the reimbursement of double the amounts already collected. The court ruled in Eletropaulo’s favor, rejecting the actions, but the Federal Regional Court (TRF) admitted the MPF’s appeal and overturned the decision. An Eletropaulo appeal against the TRF’s decision is currently pending in the Superior Court of Justice. The amount involved in the claim is undetermined. |
| 35. | The Public Prosecutor’s Office for Labor Matters filed a public civil action against Eletropaulo alleging that the company was hiring third parties for the provision of final services (“outsourcing”), which is contrary to Brazilian law (Ruling 331 of the Brazilian Superior Labor Court), which allegedly only allows the provision of non-essential services by third parties. On April 5, 2019, the judge issued a judgment in which he rejected (i) the request for a declaration of the existence of outsourcing fraud and (ii) a link between the employees of the |
F-180
| suppliers with Eletropaulo, nevertheless, the judgment has ordered Eletropaulo to pay compensation for collective punitive damages in an amount of BRL 5 million (ThUS$963), and to align remuneration between Eletropaulo’s own employees and the suppliers’ employees, with a fine of BRL 1 million for non-compliance. Eletropaulo will appeal the judgment. The amount involved in the claim is undetermined. |
| 36. | Enel Distribución Sao Paulo filed a complaint requesting a declaration that the amounts of COFINS paid by the company were paid in accordance with the rules of the Amnesty Program of the Brazilian Federal Government (reduction of fines and interest) created in 1999. The complaint was filed by the company in September 1999. Following the decision in the court of second instance that decided partly in its favor regarding the principal amount, interest and fine, in April 2018, the company filed appeals with the Superior Court of Justice and the Federal Supreme Court which are currently pending. Of the total amount of BRL 811 million involved, (ThUS$156,269), BRL162 (ThUS$31,253) million comprise the attorneys’ fees (20%) paid by the Federal Tax Authority. The balance of BRL 649 million is related to the capital (tax) paid with amnesty benefits and the possibility of loss with respect to this portion is remote. As of December 31, 2020, the amount of possible loss involved in the litigation is BRL 162 million (ThUS$31,253). |
| 37. | In May 2008, the Brazilian Tax Authority filed a lawsuit against Eletropaulo seeking payment of the PIS (Social Integration Program) tax, corresponding to the rate increase for the period from March 1996 to December 1998. After unfavorable rulings in the courts of first and second instances, Eletropaulo filed appeals with the Superior Court of Justice and the Federal Supreme Court. The amounts subject to dispute have been covered by a bank guarantee. In this regard, while awaiting the outcome of this proceeding, the Attorney General of the Department of the National Treasury of Brazil requested the replacement of the bank guarantee letter with a legal deposit. This request was rejected and the Attorney General’s Office appealed this decision. In June 2019, the court of second instance confirmed the Attorney General’s appeal. In view of the decision, the company made a legal deposit in the amount involved and, in opposition to the decision, filed a petition for clarification of the decision which is currently pending. As of December 31, 2020, the amount in dispute is BRL 243 million (ThUS$46,912). |
| 38. | In accordance with a final decision issued after a trial, Eletropaulo was granted the right to offset claims for FINSOCIAL (the social contribution system established in March 1992 before COFINS) related to amounts paid from September 1989 to March 1992. However, due to differences in the calculation of the credits stipulated by the Brazilian Federal Tax Authority, part of the offsets requested by the company were not accepted and were determined to be due by the Tax Authority. Following a decision unfavorable to the company in the court of first instance, the company appealed this decision and this appeal is pending before the administrative court of second instance. As of December 31, 2020, the amount in dispute is BRL 226 million (ThUS$43,591). |
| 39. | The Brazilian Federal Tax Authority issued a tax assessment to Eletropaulo, based on the alleged non-payment of Personal Income Tax (IRPJ) and Social Contribution on Net Profit (CSLL) for the 2001 and 2002 fiscal years, because the company allegedly deducted integrated amounts paid to its pension fund from both the IRPJ and the CSLL, when the specific regulation establishes a 20% limit for such deductions. After the unfavorable final ruling in the administrative proceeding in October 2017, the dispute was submitted to the Courts of Law. In June 2019, a ruling favorable to Eletropaulo was issued in the court of first instance for re-adjudication of the company’s appeal in the Administrative Court. The Attorney General’s Office appealed this decision. As of December 31, 2020, the amount in dispute is BRL 173 million (ThUS$33,366). |
| 40. | The Tax Authority issued a tax assessment to Eletropaulo which rejected the offset related to the credits of the PIS originated by legislative changes introduced by Decrees 2,445 and 2,449/1988, which were declared unconstitutional by the Federal Supreme Court, that were offset against other federal taxes due in April and May 2013. The company filed its defense in September 2014. In January 2019, following a partially favorable ruling in the court of first instance, the company filed an appeal, which is pending before the Administrative Court of the second administrative instance. As of December 31, 2020, the amount in dispute is BRL 159 million (ThUS$30,682). |
| 41. | Eletropaulo filed a lawsuit seeking recognition of the right to offset the total tax credits resulting from Eletropaulo’s division against the Social Contribution on Net Profit (CSLL). Favorable rulings were issued in the |
F-181
| courts of first and second instance. In May 2017, the Tax Authority filed an interlocutory appeal with the Superior Court of Justice, which is pending. As of December 31, 2020, the amount in dispute is BRL 153 million (ThUS$29,570). |
| 42. | In July 2000, Eletropaulo filed a lawsuit seeking the recognition of credits arising from improper payments of PIS made pursuant to Decrees 2,445 and 2,449/1988, which were declared unconstitutional by the Federal Supreme Court. In May 2012, a final decision was issued in favor of the company recognizing the right to the credits. However, tax assessments were made on Eletropaulo by the Federal Tax Authority because the offsets were rejected due to the fact that they had been made before the legal action had ended, using federal tax debits in addition to PIS. The company claims that the offsets were made on the basis of the favorable court ruling and that the adopted procedure was correct. After unfavorable decisions were rendered in the court of first instance, the company filed appeals with the court of second instance. As of December 31, 2020, the amount in dispute BRL 659 million (ThUS$126,980). |
| 43. | Eletropaulo filed a complaint against the tax assessment issued by the Tax Authority of the Municipality of São Paulo, seeking payment of the Public Lighting Contribution (COSIP) related to the period from March 2011 to December 2015. These tax assessments are based on the alleged irregularities attributed to the company: (i) incorrect classification of customers, (ii) illegally applied tax exemption, and (iii) non-payment of the penalty for non-payment of contributions past due. In July 2018, the court of first instance rendered a decision partially favorable to the company that limited the interest charged by the Tax Authority to the Brazilian preferential rate (“SELIC”). Both parties filed appeals against this decision. In July 2019, a decision partially favorable to the company was issued, affirming the court of first instance’s decision. Given the Court of São Paulo’s recognition of the need for presentation of evidence, the company understood it was more appropriate to withdraw from the dispute in this litigation (which by its nature does not allow the procedural phase of evidence) and to file a new legal action. As of December 31, 2020, the amount in dispute is BRL 145 million (ThUS$27,918). |
| 44. | The Tax Authority of the State of São Paulo issued five tax assessments seeking payment of ICMS due to allegedly invalid setoffs in which the company used assigned credits in the acquisition of property, plant and equipment, and which the Tax Authority believed was not appropriate. In 2019, the Tax Authority of the State of São Paulo issued a new assessment. The company filed its administrative defenses in all the administrative procedures and is awaiting the final decisions. The company’s administrative defenses were presented to the court of first administrative instance, which are awaiting judgment. As of December 31, 2020, the amount in dispute is BRL 137 million (ThUS$26,563) |
| 45. | Eletropaulo filed a complaint against Federal Decree No. 8,426/2015, which reinstated the PIS/PASEP and COFINS taxes on financial income earned by companies subject to the non-cumulative PIS/PASEP and COFINS regime, at a rate of 4.65%, as of July 1, 2015. The status of the litigation is that unfavorable decisions were rendered in the court of first instance (November 2015) and at the court of second judicial instance (August 2017). In December 2017, the company filed appeals with the Superior Court of Justice and the Federal Supreme Court, with the rulings currently pending. As of December 31, 2020, the amount in dispute is BRL 145 million (ThUS$27,956). |
| 46. | Eletropaulo filed a complaint claiming the right not to consider in its bases of calculation of Legal Entity Income Tax (IRPJ) and Social Contribution on Net Profit (CSLL), the amounts related to interest derived from the delay in fulfilling contractual obligations on the part of third parties that maintain contractual relations of any type with the company (interest as an advance valuation of damages). In March 2012, the court of first instance issued a decision favorable to Eletropaulo. The Federal Tax Authority appealed this decision and the appeal is awaiting decision. Since the decision of the court of first instance was rendered, the company has not paid the disputed taxes to the federal government. As of December 31, 2020, the amount in dispute is BRL 71 million (ThUS$13,732). |
| 47. | Eletropaulo filed lawsuits against several tax assessments issued by the Tax Authority of the State of São Paulo claiming the payment of ICMS due to alleged irregularities in the debt reversal transactions. The company is |
F-182
| presently challenging five tax assessments, for which final decisions are pending. As of December 31, 2020, the amount in dispute is BRL 188 million (ThUS$36,371) |
| 48. | The Brazilian Federal Tax Authority issued tax assessments to Eletropaulo based on the alleged non-payment of PIS/PASEP and COFINS taxes for the period from 2013 to 2015, arising from the disallowance of credits assigned in the acquisition of goods and services. In 2020, Eletropaulo received two more infringement notices for not excluding credits related to the value of non-technical energy losses from August 2016 to December 2018. Eletropaulo has filed its defenses in the administrative proceedings and is awaiting the final decisions. As of December 31, 2020, the amount in dispute is BRL 236 million (ThUS$45,521). |
Enel CIEN S.A.
| 49. | Enel CIEN is a Group transmission company in Brazil. Its network connects the electrical system of Brazil and Argentina. Enel CIEN has signed contracts with two Brazilian companies (Furnas and Tractebel Energia S.A.) for the purchase and sale of energy with firm power and associated energy from Argentina. In 2005, due to the energy and economic crisis in Argentina, it was no longer possible to fulfil the terms of the contract. The two companies have filed actions for declaration of contractual termination, imposition of contractual penalties and claims for compensation (not estimable to date). |
Furnas versus Enel CIEN S.A. The court of first instance issued a decision favorable to Enel CIEN the decision is now final.
Tractebel Energía S.A. versus Enel CIEN S.A. There is no injunction and there is still no first instance decision. The case is currently in the generation of evidence stage (expert opinions). As of December 31, 2020, the amount involved in the lawsuit was BRL 512.1 million (ThUS$98,595).
Enel Generación Fortaleza S.A. (formerly Central Geradora Termoelétrica Fortaleza S.A. or “CGTF”)
| 50. | Petróleo Brasileiro S.A (Petrobrás) has notified Enel Generación Fortaleza of its intention to terminate the gas supply contract signed in 2003 (within the scope of the Brazilian government’s thermoelectric priority program) based on an alleged economic-financial imbalance. Enel Generación Fortaleza alleges that the contractual conditions of the gas supply are “guaranteed” by the Brazilian government and that the power generation by Enel Generación Fortaleza and other generation companies linked in this program guarantee the energy supply for the country. Since the beginning of this dispute, gas supply has been suspended at some points and later restored by a court order (the most recent ruling in effect since December 10, 2018). In addition, the issue of the forum for the dispute, either the court system or arbitration, had not yet been resolved. The lawsuit was still in its early stages and the generation of evidence had not started. On August 28, 2020, the parties signed an agreement to close the existing claims. The arbitration was formally closed on September 5, 2020 and the claims were formally closed in court in November 2020. |
| 51. | In February 2007, the Brazilian Tax Authority sent Enel Generación Fortaleza an assessment for PIS/COFINS taxes for the periods December 2003 and February 2004 to November 2004, regarding alleged differences between the amounts declared in the annual return (where PIS/COFINS amounts were reported under the non-cumulative regime) and the amounts declared in the monthly return (where the amounts due under the old cumulative regime were reported). After a ruling was rendered by the court of third administrative instance against Enel Generación Fortaleza, the company filed a plea for clarification, and the decision was unfavorable. In the judicial action for recovery, Enel Generación Fortaleza presented a guarantee and will submit its defense in the legally prescribed period. As of December 31, 2020, the total amount involved in this litigation is estimated at BRL 94 million (ThUS$18,186). |
Enel Brasil S.A.
F-183
| 52. | In 2014, the Brazilian Tax Authority issued an assessment to Enel Brasil claiming violations in the collection of income tax on dividends allegedly distributed in an amount larger than owed in 2009 and 2010. After adverse rulings at the first and second administrative instances, the company appealed to the third administrative level (special body) and the decision was denied. Enel Brasil appealed to the judiciary and the interim decision was unfavorable. The company appealed to the court of second instance but the decision was also unfavorable. The company presented a guarantee in the collection lawsuit and it was accepted. Enel Brasil submitted its defense within the legal deadline. The total amount involved in this litigation is estimated at BRL 358 million (ThUS$68,840) |
In relation to the litigation proceedings described above, the Group has established provisions for ThUS$153,328 as of December 31, 2020 (see Note 25). There are other lawsuits that also have associated provisions but they are not described in this note since they individually represent smaller amounts. Management believes that the provisions recorded adequately cover the risks of litigation. Therefore, they do not expect additional liabilities to arise from other than those already registered.
Several debt contracts of the Company, and of some of its subsidiaries include the obligation to comply with certain financial ratios, which is common in contracts of this nature. There are also affirmative and negative covenants that require monitoring of these commitments. In addition, there are restrictions in the sections of events of default that must be fulfilled to avoid acceleration of the debt.
Cross default
Certain financial debt contracts of the Company contain cross default clauses.
Under Enel Américas' bank loan agreement governed by the laws of the State of New York, executed in February 2018 and maturing in February 2021, the cross default clause for non-payment could be triggered by another debt of Enel Américas on a stand-alone basis or of a “Significant Subsidiary” (as defined contractually). In order for this loan to qualify for a possible acceleration under the cross payment default provision the amount in default of other indebtedness, individually or in the aggregate must exceed US$150 million, or its equivalent in other currencies. Other conditions must also be satisfied, including the expiration of any applicable grace periods and a formal notice of the intention to accelerate the debt by creditors representing more than two thirds of the amount owed or committed. As of December 31, 2020, the amount owed in connection with this loan was ThUS$175,039.
In the revolving credit contract of Enel Américas governed by the laws of the State of New York, executed in May 2020 and maturing in May 2021, the cross default for non-payment could be triggered by another debt of Enel Américas at an individual level. In order for the acceleration of the debt in this loan due to the cross-default originated in other debts to be required, the amount in default of the individual debt must exceed US$ 150 million or its equivalent in other currencies, and in addition other additional conditions must be fulfilled, including expiration of grace periods (if any exist in the contract that is not in compliance), and the formal notification of the intention to accelerate the debt by the creditors that represent more than 50% of the amount owed or committed. As of December 31, 2020, the amount owed on this loan totals ThUS$ 150,196.
A substantial part of the bonds of Enel Américas registered with the Securities and Exchange Commission (“SEC”) of the United States of America, commonly called “Yankee Bonds”, incorporate cross default clauses in case of non-payment. For Yankee Bonds issued in 2016 maturing in October 2026, the cross -default could be triggered by another debt of Enel Américas at an individual level, or that of any “Significant Subsidiary” (as contractually defined), for any amount in default, as long as the principal of the debt that originates the cross -default exceeds US$ 150 million, or its equivalent in other currencies. As of December 31, 2020, the amount owed for this bond totals ThUS$ 591,653.
F-184
In addition, in the Yankee Bonds issued in 1996, maturing in December 2026, the cross default can only be triggered by another debt of Enel Américas at an individual level, therefore, bankruptcy or insolvency events of subsidiaries abroad would not trigger the cross -default. For this, there needs to be an amount in default with principal of the debt that originates the cross -default, in excess of US$ 30 million, or its equivalent in other currencies. As of December 31, 2020, the amount owed for the concept of this Yankee Bond totals ThUS$ 863. In both cases, the debt acceleration due to cross -default does not occur automatically, as it must be required by the holders of at least 25% of the bonds of a certain series of Yankee Bonds.The Company’s bonds issued in Chile state that the cross payment default provision can be triggered only by the default of the issuer, either on a stand-alone or on an aggregate basis, when the amount in default exceeds 3% of total consolidated assets. Debt acceleration requires the agreement of at least 50% of the bondholders of the specific series. As of December 31, 2020, the outstanding amount for the Chilean bonds was ThUS$ 10,714.
Financial covenants
Financial covenants are contractual commitments with respect to minimum or maximum financial ratios that the Company is obliged to meet at certain periods of time (quarterly, annually, etc.) and in some cases only when certain conditions are met. Most of the financial covenants of the Company limit leverage and track the ability to generate cash flow that will service the companies’ indebtedness. Certain companies are also required to periodically certify these covenants. The types of covenants and their respective limits vary according to the type of debt and contract.
The Series B2 Chilean bonds of the Company include the following financial covenants, whose definitions and calculation formulas are set out in the respective contract:
| - | Consolidated Equity: Minimum Equity of Ch$718,053 million must be maintained, a limit adjusted at the end of each year as established in the indenture. Equity is defined as the sum of Equity attributable to the shareholders of Enel Américas and non-controlling interests. As of December 31, 2020, the Company’s equity was Ch$7,346,717 million (at the closing exchange rate). |
| - | Debt to Equity Ratio: A debt to equity ratio, defined as Total liabilities to equity, shall not exceed 2.24. Total liabilities are the sum of Total current and non-current liabilities, while Equity is the sum of Equity attributable to the shareholders of Enel Américas and non-controlling interests. As of December 31, 2020, the debt to equity ratio was 1.61. |
| - | Unsecured Assets: The ratio of Unsecured assets to Unsecured total liabilities must be equal or higher than 1. Total Unsecured or free assets is the difference between Total assets and Total secured assets. |
Total unsecured or free assets consists of Total Assets less the sum of Cash, Bank balances, Current accounts receivable from related parties, Current payments in advance, Non-current accounts receivable from related entities, and Gross identifiable intangible assets, while Total secured assets correspond to assets pledged as collateral. On the other hand, Total unsecured liabilities consist of the sum of Total current liabilities and Total non-current liabilities, less liabilities secured by direct and indirect guarantees. As of December 31, 2020, this ratio was 1.22.
On the other hand, the “Yankee Bonds” and any other debt of Enel Américas at an individual level, are not subject to compliance with financial covenants.
As of December 31, 2020, the most restrictive financial covenant of Enel Américas was the Ratio of Assets, which is susceptible to be pledged as collaterals for the local Series B2 bond.
In Peru, the debt of Enel Distribución Perú includes the following covenant:
| - | Local bonds of the fourth program, whose balance pending payment as of December 31, 2020 amounted to ThUS$ 64,504 and whose final maturity is in January 2033, include the Indebtedness Ratio covenant, calculated as Total Liabilities less Deferred Liabilities and Cash over Equity. |
F-185
On the other hand, the debt of Enel Generación Perú. includes the following covenants:
| - | Local bonds whose balance pending payment as of December 31, 2020 amounted to ThUS$17,214 and whose final maturity is in January 2028, include the Indebtedness Ratio covenant, calculated as Financial Debt less Cash over Net Equity. |
In Brazil, the debt of Enel Distribución Río includes the following covenants:
| - | Tenth issuance of local bonds, whose balance pending payment as of December 31, 2020 amounted to ThUS$193,471 and whose maturity is in March 2024, include Debt Payment Capacity covenants, calculated as Net Financial Debt over EBITDA. |
| - | Loans from Banco Nacional De Desenvolvimento (“BNDES”), whose balance pending payment as of December 31, 2020 amounted to ThUS$3,846 and final maturity is in May 2023, include the following covenants, in which their definitions vary according to the contract with BNDES: Debt Payment Capacity, calculated as Net Financial Debt over EBITDA and Net Financial Debt Ratio over the sum of Net Financial Debt and Net Equity. |
| - | Bank loans from Banco Citibank, Itaú, and Scotiabank, whose balances pending payment as of December 31, 2020 amounted to ThUS$174,154 and whose final maturity is in July 2021, include Debt Payment Capacity covenants, calculated as Net Financial Debt over EBITDA and the Itaú loan includes Indebtedness Ratio, calculated as Net Financial Debt over the sum of the Net Financial Debt and Net Equity. |
| - | As of December 31, 2020, the most restrictive financial covenant of Enel Distribución Río was the Indebtedness Ratio, contained in the loans with Citibank, Itaú and Scotiabank, and local bonds. |
Additionally, in Brazil, the debt of Enel Distribución Ceará includes the following covenants:
| - | Loans with Electrobrás, whose balances pending payment as of December 31, 2020 amounted to ThUS$1,584 and whose final maturity is in October 2023, include the Debt Payment Capacity covenant, calculated as Total Net Debt over EBITDA. |
| - | Loans with BNDES whose balances pending payment as of December 31, 2020 amounted to ThUS$1,986 and whose final maturity is in June 2023, include the Debt Payment Capacity covenants, calculated as Total Net Debt over Company EBITDA, and Indebtedness Ratio, calculated as Total Net Debt over the sum of Total Net Debt and Net Equity. |
| - | Fifth issuance, sixth issuance, seventh issuance of local bonds and loans with MUFG Bank, and Scotiabank, whose balances pending payment as of December 31, 2020 amounted to ThUS$405,046 and whose final maturity is in June 2025, including the Debt Payment Capacity covenant, calculated as Total Net Debt over EBITDA. |
| - | As of December 31, 2020, the most restrictive covenant held by Enel Distribución Ceará was the Debt Ratio/EBITDA corresponding to the loan with Electrobrás. |
Additionally, in Brazil, the debt of Enel Distribución Sao Paulo includes the following covenants:
| - | 23rd and 24th issuance of local bonds and loans with MUFG Bank, Scotiabank, and BNP whose balances pending payment as of December 31, 2020 amounted to ThUS$ 886,881 and whose final maturity is in May 2026, include the Debt Payment Capacity covenant, calculated as Total Net Debt over EBITDA. |
| - | As of December 31, 2020, the most restrictive covenant of Enel Distribución Sao Paulo was the Debt / EBITDA Ratio of the 23rd local bond issue. |
Finally, in Brazil, the debt of Enel Green Power Volta Grande includes the following covenant:
F-186
| - | 1st issuance of local bonds, whose balance pending payment as of December 31, 2020 amounted to ThUS$ 144,486 and whose final maturity is in October 2029, and which includes the Debt Payment Capacity covenant, calculated as Total Net Debt over EBITDA. |
In Colombia, the debt of Codensa S.A. (“Codensa”), includes the following covenants:
| - | Bank loan with MUFG Bank, whose balance pending payment as of December 31, 2020 amounted to ThUS$121,194 and whose final maturity is in May 2021, and which includes the Debt Payment Capacity covenant, calculated as Total Net Debt over EBITDA. |
The rest of the subsidiaries not mentioned in this Note are not subject to compliance with financial covenants. .
Lastly, in most of the contracts, debt acceleration due to non-compliance with these covenants is not automatic, and certain conditions must be met, such as expiration of the cure period, among other conditions.
As of December 31, 2020, none of the subsidiaries of Enel Américas was in non-compliance with its financial obligations summarized herein, or other financial obligations whose non-compliance might result in the early maturity of their financial commitments.
35.5 COVID-19 contingency
On January 30, 2020, the World Health Organization (WHO) declared the outbreak of the new coronavirus 2019, or COVID-19, to be a "Public Health Emergency of International Concern". On March 11, 2020, the WHO confirmed that the outbreak of COVID-19 had reached the level of a pandemic, which could significantly affect all the countries in which the Group operates, as well as the Group’s trade partners within and outside these countries.
To address this international public health emergency due to COVID-19, the governments of all the countries in which Group operates, have adopted various measures, essentially designed to restrict free movement of individuals, which include quarantines, social isolation and temporary closure of companies and businesses, among other measures. Governments have also taken measures to preserve access to essential services such as water and electricity during the health emergency, especially directed to residential customers with lower income, small and medium sized companies and institutions that provide other essential services such as health establishments.
These measures refer basically to the temporary suspension of disruption of electric supply due to customers recording payment defaults and deferral of the payment of electricity bills for a certain number of months, without interest or penalties charged to customers. In this sense, the Group issued guidelines intended to guarantee compliance with the measures introduced by the governments of the countries in which the Group operates and has taken a number of actions to adopt the most adequate procedures to prevent and/or mitigate the effects of COVID-19 infection in the workplace, while guaranteeing business continuity.
The above has been possible mainly due to:
• The use of telework for all employees whose jobs can be performed remotely (50% of the staff). This work mode was introduced in the Group a few years ago, which thanks to investment in digitalization, allows work to be performed remotely with the same level of efficiency and effectiveness;
• Digitalization of processes and infrastructure, which ensures the normal operation of our generation assets, continuity of the electrical service and remote management of all activities related to the market and customer relations.
All the company’s efforts continue to focus on guaranteeing the correct and safe operation of our businesses, while at the same time safeguarding the health and safety of our collaborators and helping the community with various solidary measures.
F-187
In relation to the degree of uncertainty generated in the macroeconomic and financial environment in which the Group operates and their effect on the Company’s income as of December 31, 2020, these are fundamentally related to an increase in the impairment loss on trade accounts (see Note 2.3, 3.g.3 and 10.c).
35.6 |
(i) Enel Generación Costanera S.A. - Enel Generación El Chocón S.A. – Central Dock Sud S.A.
Fund for necessary investments to increase the supply of electricity in the MEM “FONINVEMEM”
January 7, 2020 and February 10, 2020 were the 10-year anniversaries of the start of Commercial Operation of TMB and TSM, respectively, ending the electric energy supply contracts signed between the respective Trusts and CAMMESA at the time. Likewise, on the indicated dates, the respective Trust Agreements and Contracts for the Operation and Maintenance Management (CO&M) of both power plants came to an end. TMB and TSM, as managing companies, together with their current shareholders (which include the Company as a guarantor) must perform the company actions necessary to allow the entry of the Argentine national government in the equity of both companies. The corresponding ownership interest of the Argentine national government is a controversial matter, since the government claims a higher share percentage of both thermoelectric plants. In order to ensure the operation and maintenance of the power plants, the term of the respective CO&M contracts has been extended, with the corresponding extensions being signed on January 7 and January 9, 2020, respectively.
On May 4 and May 8, 2020 the Extraordinary Shareholders’ Meetings of TMB and TSM were held, respectively, whereby the shareholders agreed to increase the share capital in order for the Argentine national government to be able to subscribe to the capital increase, and in this manner, become the holder of 65.006% and 68.826 % of the shares of TMB and TSM, respectively, thus complying on time and in the proper manner with the condition precedent established in articles 1.01 and 7.03 of the Trust Agreements. Notwithstanding the above, the Company and the rest of the shareholders that participated in the meetings ratified the request (dated April 22, 2020) addressed to the Ministry of Productive Development by the Company together with other shareholders of TMB and TSM for the implementation of the share concentration scheme foreseen in the “Agreement for the Management and Operation of Projects, Increase in Thermoelectric Generation and Adaptation of the 2008-2011 Generation Remuneration”, and established a reserve for the damage claim actions in case such request was not accepted.
During November 2020, BICE, acting as trustee, confirmed fulfillment of the suspensive condition mentioned above, upon valid performance of the corporate acts for the inclusion of the Argentine national government in the equity of TMB and TSM. At the date of these financial statements, the Argentine national government has not yet subscribed for the shares resulting from the capital increase, although the contractual obligations are irrevocable. After such subscription, the Trustees must transfer the assets under trust to TMB and TSM.
Consequently, the Group holdings were reduced from 25.6% to 8.59% for the Manuel Belgrano Thermal Power Plant and 25.6% to 7.7% for the San Martín Thermal Power Plant.
Central Vuelta Obligado (VOSA)
On March 20, 2018, CAMMESA enabled the commercial operations of the TG and TV units in the Wholesale Electricity Market, operating as a combined cycle of the Vuelta de Obligado Plant, for up to 816 MW (net capacity). On February 7, 2019, VOSA entered into a Supply Contract, Operations Contract, and Management Contract, as well as pledge and assignment as collateral contracts, with CAMMESA. From March 2019, the Companies have been collecting monthly payments. As of December 1, 2020, the Companies have collected 22 of the 120 installments agreed in the contracts.
The outstanding balance as of December 31, 2020, is ThUS$ 311,875 (ThUS$ 350,519 in 2019). The breakdown by company is detailed as follows: (i) Enel Generación El Chocón S.A. amounting to ThUS$ 208,941 (ThUS$ 233,733 in 2019), (ii) Central Dock Sud S.A. amounting to ThUS$ 82,438 (ThUS$ 93,557 in 2019) and (iii) Enel Generación Costanera S.A. amounting to ThUS$ 20,496 (ThUS$ 23,229 in 2019) (See Note 10).
F-188
(ii) Edesur:
2019 Regulatory Agreement
On May 10, 2019, the Company entered into an Obligations Regularization Agreement with the Secretariat of Energy, on behalf of the Argentine State, which puts an end to the reciprocal claims arising during the transition period between 2006 and January 2017. On one hand, Edesur agrees to: (i) credit penalties to customers within a period of 3 years, adjusted at the prevailing rate of the Bank of the Argentine Nation (BNA); (ii) credit the fines contained in Appendix VIII of the 2006 Memorandum of Agreement, in up to 14 biannual installments, recalculated up to the date of effective payment according to the average increase registered by the own cost of distribution; (iii) based on the provisions of clause 5.4 of the Memorandum of Agreement, allocate the amounts of penalties for regular quality measurements during the transition period, to make additional investments over those established in the Integral Rate Review (RTI), which are intended to contribute to service improvement, reliability, and security. Moreover, new conditions were agreed upon in relation to the consumption loans granted by CAMMESA. Meanwhile, the Argentine State offset, in favor of the Company, commercial debts with CAMMESA for energy purchases performed in the Wholesale Electricity Market (MEM) prior to the effective date of the resolution issued by the National Electricity Regulator Body (ENRE) No. 1/2016, and the Argentine State's debts generated in 2017 and 2018 related to consumption in settlements measured by community meters, between July 2017 and December 31, 2018, in the proportion established in the New Framework Agreement and its successive renewals, and with the differences generated by the application of the maximum limit in the invoices issued to beneficiaries of the social rate. Moreover, the Argentine State forgave the sanctions owed to the Public Administration (see Note 24).
The effects of this agreement generated a reduction in liabilities recorded in operating revenue for 2019 in the amount of ThUS$ 203,433 (approximately ARS 12,183 million). As a result of the application of IAS 29 “Financial Reporting in Hyperinflationary Economies,” these values at the year ended December 2019 were ThUS$ 261,185 (approximately ARS 15,641 million) (see Note 28).
2020 Framework Agreement
The Province of Buenos Aires requested that the Argentine Ministry of Economy initiate a bid process to correct the situation related to the electricity supply in low income neighborhoods between October 2017 and December 2020. On December 22, 2020, the Argentine national government, through the Ministry of Economy and Secretariat of Energy, the National Electricity Regulatory Body (ENRE), and the companies Edenor and Edesur, entered into an agreement to develop a mechanism to pay off debt corresponding to the Framework Agreement for such period, while the companies assumed the commitment to allocate said funds to improve electric service works and the status of the network supplying these neighborhoods with collective meters and other sensitive zones in the concessions area, without implying that there would be an extension of downstream responsibility for those collective meters, according to the applicable regulations. By way of this agreement, during December 2020, ARS 1.5 billion (ThUS$ 17,842) has been recognized under “Other Revenue” in the 2020 statement of income (Note 28).
F-189
The Group personnel, including that of subsidiaries in the five Latin American countries where the Group operates, is distributed as follows as of December 31, 2020 and 2019:
| | | | | | | | |
| | 12-31-2020 | ||||||
| | Managers | | Professionals | | | | |
| | and key | | and | | Staff and | | |
Country | | executives |
| Technicians |
| others |
| Total |
Chile | | 8 | | 39 | | 4 | | 51 |
Argentina | | 35 | | 1,850 | | 2,179 | | 4,064 |
Brazil | | 51 | | 5,726 | | 3,746 | | 9,523 |
Peru | | 35 | | 908 | | — | | 943 |
Colombia | | 39 | | 2,111 | | — | | 2,150 |
Total | | 168 | | 10,634 | | 5,929 | | 16,731 |
Average | | 170 | | 10,679 | | 6,120 | | 16,969 |
| | | | | | | | |
| | 12-31-2019 | ||||||
| | Managers | | Professionals | | | | |
| | and key | | and | | Staff and | | |
Country | | executives | | Technicians | | others | | Total |
Chile | | 1 | | 48 | | 4 | | 53 |
Argentina | | 20 | | 1,858 | | 2,208 | | 4,086 |
Brazil | | 53 | | 5,947 | | 4,124 | | 10,124 |
Peru | | 38 | | 888 | | — | | 926 |
Colombia | | 39 | | 2,065 | | 2 | | 2,106 |
Total | | 151 | | 10,806 | | 6,338 | | 17,295 |
Average | | 156 | | 10,242 | | 7,273 | | 17,671 |
The main sanctions that the Group companies have received are described below.
| 1. | Edesur S.A. (Empresa Distribuidora del Sur S.A.) |
As of December 31, 2020, considering the pending sanctions imposed by the National Electricity Regulator (ENRE) from the period beginning on October 1, 2020, Edesur has been penalized two times for violations of public road safety regulations – accidents and anomalies – (ENRE Resolutions 71/20 and 87/20) for an amount of ARS 1.5 million (ThUS$ 16). Edesur has appealed both sanctions.
| 2. | Enel Distribución Río S.A (Ampla Energia e Serviços S.A. or “Ampla”) |
Tax sanctions: The Brazilian Tax Authority imposed a fine on the company after denying the authorization to offset federal taxes. Individual fines have been imposed on the company for 50% of the compensation requested and denied by the Brazilian authority The company filed its administrative defenses against the fines and is awaiting a ruling. There are also late penalties on federal tax offsets. The principal of the offset was accepted by the federal administration, but it acknowledged a payment delay, resulting in the collection of the fine of ThBRL 11,611 (ThUS$2,235).
| 3. | Enel Distribución Ceará S.A (Companhia Energetica do Ceará S.A. or “Coelce”) |
− In 2012, the Brazilian National Electricity Regulatory Agency (ANEEL) imposed a fine of BRL 20.6 million on Enel Distribución Ceará for alleged errors in the records of the company’s asset base. Enel Distribución Ceará appealed against the fine resulting in a reduction of BRL 11.2 million. Considering the need to legalize the company’s status with the ANEEL, Enel Distribución Ceará posted a bond and filed a lawsuit for the fine’s total nullification. On July 26, 2019, a decision was issued that dismissed the lawsuit filed by Enel Distribución Ceará.
F-190
On August 27, 2019, Enel Distribución Ceará filed an appeal, which is pending resolution. A favorable decision would result in a refund of the amount paid by Enel Distribución Ceará. As of December 31, 2020, the amount involved in the penalty was BRL 21.4 million (ThUS$4,120).
− In 2020, ANEEL, through the Regulatory Agency of Delegated Public Services of the State of Ceará (Arce), imposed a fine on Enel of ThBRL 26.2 (ThUS$ 5,076) for non-compliance with energy supply quality indicators. Enel filed an appeal against the fine, which to date remains unresolved. On December 31, 2020, the amount involved in the penalty was BRL 26.2 million (ThUS$5,044).
| 4. | Enel Distribución Goiás (formerly CELG Distribuição S.A.) |
− In 2016, the Brazilian National Electricity Regulatory Agency (ANEEL) imposed a fine of BRL 61 million on Enel Distribución Goiás for failure to fulfill a sector obligation (linked to the Account for the Development of Energy (Conta de Desenvolvimento Energético or CDE). Enel Distribución Goiás filed an appeal against the fine which is pending resolution. Enel Distribución Goiás posted a bond and filed a lawsuit for the fine’s total nullification, which is still pending resolution. As of December 31, 2020, the amount involved in the penalty was BRL 39.2 million (ThUS$7,547).
− In 2019, the Brazilian National Electricity Regulatory Agency (ANEEL) imposed a fine of BRL 62 million on Enel Distribución Goiás for non-compliance of customer service and energy supply quality indicators. Enel Distribución Goiás filed an appeal against the fine, which is pending resolution. As of December 31, 2020, the amount involved in the penalty was BRL 61.6 million (ThUS$11,860).
− In 2020, the Agência Goiana de Regulação - AGR imposed a fine on Enel of BRL 44 million (ThUS$ 8,471) for non-compliance with maintenance and violations of quality indicators (SAIDI/SAIFI). Enel filed an appeal against the fine with ANEEL, which is pending resolution. On December 31, 2020, the amount involved in the penalty was BRL 43.2 million (ThUS$ 8,317).
| 5. | Enel Distribución Sao Paulo (formerly Eletropaulo) |
− ANEEL fined Eletropaulo for alleged errors in the records of the company’s asset base. Eletropaulo filed an appeal which was dismissed. Eletropaulo filed a lawsuit seeking the total nullification of the fine. The judge rendered a decision dismissing Eletropaulo’s claim, and Eletropaulo has filed an appeal with the court of second instance, which is pending resolution. As of December 31, 2020, the amount involved in the penalty was BRL 186.4 million (ThUS$35,888).
− ANEEL fined Eletropaulo for alleged formal inconsistencies of asset accounting records. Eletropaulo asserted that the errors have not generated any negative practical consequences for tariffs, and even less for the service provided by the company. Eletropaulo’s administrative appeal was dismissed, and Eletropaulo filed a lawsuit for the total nullification of the fine. On May 29, 2019, the judge issued a judgment dismissing the claims made by Eletropaulo. On June 5, 2019, Eletropaulo submitted a petition for clarification against the judgment, for which the hearing is pending. On December 27, 2019, a decision was issued confirming the impossibility of ANEEL to register Eletropaulo in its system of payment arrears and imposing the fine until the decision is final. As of December 31, 2020, the amount involved in the penalty was BRL 92.4 million (ThUS$17,790).
− In 2012, ANEEL imposed a fine on Eletropaulo for alleged formal inconsistencies of records of consumer supply quality indices, as well as a payment of compensation to customers for non-compliance with these indices. Eletropaulo filed its administrative defenses and is awaiting the decision of ANEEL’s Board of Directors. In April 2020, Enel filed an annulment lawsuit with the court and a decision was issued suspending all the effects of the penalties. As of December 31, 2020, the amount involved in the penalty was BRL 29.5 million (ThUS$5,680).
F-191
− On December 4, 2018, ANEEL imposed a fine on Eletropaulo for customer service quality issues. On December 14, 2018, Eletropaulo filed its administrative defenses against the fine and is awaiting the analysis and decision of ANEEL’s Electric Services Oversight Authority (SFE). As of December 31, 2020 the amount involved in the penalty was BRL 24.8 million (ThUS$4,775).
− ANEEL imposed a fine on Eletropaulo for not complying with consumer supply quality indices during 2013. Eletropaulo filed its administrative defenses against the fine, which was decided unfavorably to the company. On July 24, 2018, Eletropaulo filed a lawsuit seeking the nullification of the fine, which is still pending resolution. As of December 31, 2020, the amount involved in the penalty was BRL 68.9 million (ThUS$13,265).
− ANEEL imposed a fine on Eletropaulo for not complying with consumer supply quality indices during 2014. Eletropaulo filed its administrative defenses against the fine, which was decided unfavorably to the company. On July 31, 2018, Eletropaulo filed a lawsuit seeking the nullification or reduction of the fine. On October 17, 2019, the court rejected Eletropaulo’s request for nullification, against which the company filed a petition for clarification of the decision. On December 16, 2019, the petition was rejected. As of December 31, 2020, the amount involved in the penalty is BRL 35.2 million (ThUS$6,777).
− ANEEL imposed a fine on Eletropaulo for nonconformity in the doubful Settlement Credit Budget process. Eletropaulo filed its administrative defenses against the fine, which was decided unfavorably to the company. Eletropaulo filed a lawsuit seeking the nullification or reduction of the fine. The first instance ruling was unfavorable to Eletropaulo, which filed an appeal that is pending resolution. As of December 31, 2020, the amount involved in the penalty is BRL 24.7 million (ThUS$4,775).
− ANEEL imposed a fine on Eletropaulo for nonconformity in the Doubtful Settlement Credit Budget process. Eletropaulo filed its administrative defenses against the fine, which was decided unfavorably to the company. Eletropaulo filed a lawsuit seeking the nullification or reduction of the fine. The first instance ruling was favorable to Eletropaulo. However, ANEEL filed an appeal which is pending resolution. As of December 31, 2020, the amount involved in the penalty is BRL 77.3 million (ThUS$14,883).
− In February 2003, the Municipality of Jandira imposed a fine on Eletropaulo for violation of municipal laws with respect to the road network in the municipality. Eletropaulo’s administrative defenses against the fines were decided unfavorably to the company. Eletropaulo filed a lawsuit seeking the nullification of the fine. The first instance ruling was unfavorable to Eletropaulo, which filed an appeal that is pending resolution. Eletropaulo filed an appeal with the Superior Courts (Superior Tribunal de Justiça and Supremo Tribunal Federal) for which, to date, no final decision has been issued. As of December 31, 2020, the amount involved is BRL 21.8 million (ThUS$4,197).
− In July 2002, the Municipality of Jandira fined Eletropaulo for violation of municipal laws with respect to the road network in the municipality. As a final ruling Eletropaulo’s administrative defenses against the fines were decided unfavorably to the company. Eletropaulo filed a lawsuit seeking the nullification of the fine. The first instance ruling was favorable to Eletropaulo. The municipality filed an appeal which was dismissed by the Superior Tribunal de Justiça. The municipality filed a subsequent appeal for review by the panel of judges, who dismissed the appeal. As of December 31, 2020, the amount involved is BRL 25.3 million (ThUS$4,871).
− The Municipality of Sao Paulo fined Eletropaulo for violation of municipal traffic laws involving a restricted area of circulation. Eletropaulo’s administrative defenses against the fines were decided unfavorably to the company. In 2011, Eletropaulo filed a lawsuit seeking the nullification of the fine. The first instance ruling was unfavorable to Eletropaulo, which filed an appeal that is pending resolution. As of December 31, 2020, the amount involved is BRL 33.8 million (ThUS$6,507).
− In February 2012, the Municipality of Itapevi fined Eletropaulo for violation of municipal laws with respect to the road network in the municipality. Eletropaulo’s administrative defenses against the fines were decided
F-192
unfavorably to the company. Eletropaulo filed a lawsuit seeking the nullification of the fine. The first instance ruling was unfavorable to Eletropaulo, which filed an appeal that is pending resolution. As of December 31, 2020, the amount involved is BRL 30.6 million (ThUS$5,891).
− Tax sanctions: The Brazilian Tax Authority imposed a fine on the company after denying the authorization to offset federal taxes. Individual fines have been imposed on the company for 50% of the compensation requested and denied by the Brazilian authority. The company filed its administrative defense against the fines and is awaiting a decision. As of December 31, 2020, the amount involved is BRL 48,9 million (ThUS$9,432).
| 6. | Enel Generación Perú S.A.A. (formerly Edegel S.A.A.) |
As of December 31, 2019, Enel Generación Perú has incurred the following tax fines:
− As part of a corporate tax audit procedure for the 1999 fiscal year, SUNAT issued a Notice of Fines No. 0120020004919 to Enel Generación Perú by means of which it imposed a fine of PEN 2,076,888 (ThUS$574) by way of annual corporate income tax, whose default interest as of the payment date amounted to PEN 10,501,965 (ThUS$2,903). The imposition of this penalty is being challenged in the judicial courts.
− As part of a corporate tax audit procedure for 2000 and 2001, SUNAT issued a Notice of Fines No. 0120020008723 to Enel Generación Perú by means of which it imposed a fine by way of corporate income tax for the year 2000. Considering several payments made and the reassessment made by SUNAT, to date, this penalty amounts to PEN 6,460,523 (ThUS$1,786), and the default interest to date amounts to PEN 15,043,925 (ThUS$4,158). Enel Generación Perú is currently challenging the reassessment of the fine at the Tax Court and the underlying substantive issue in the judicial courts. PEN 7,928,535 (ThUS$2,192) has already been duly paid.
− As part of an audit procedure for the Ad Valorem General Sales Tax (IGV) and Municipal Promotion Tax (IPM) on imports for 2008 and 2009, SUNAT issued Division Resolution No. 0003X4100/2013-000440 to Banco Scotiabank del Perú (who is the legal owner of Central Santa Rosa under a finance lease agreement, whereby Enel Generación Perú is responsible for all contingencies arising therefrom), whereby a fine amounting to ThUS$2,974 was imposed (the customs fines were paid in dollars). The imposition of this fine is being discussed in the Judiciary, for which PEN 5,832,129 (ThUS$1,612) had to be paid, the default interest of which, to date, amounted to PEN 3,395,224 (ThUS$938). The full amount of the tax debt related to the aforementioned fine was not paid, since part of it was barred by the statute of limitations.
| 7. | Enel Perú S.A.C. (formerly Generandes) |
As of December 31, 2019, Enel Perú had incurred the following tax fine
As part of an audit procedure for corporate tax and IGV for fiscal year 2000, SUNAT issued a Notice of Fines No. 0240030008355 to Enel Perú by means of which it imposed a fine of PEN 2,920,104 (ThUS$807) by way of annual corporate income tax and whose default interest as of the payment date amounted to PEN 14,053,695 (ThUS$3,885). Similarly, SUNAT issued Notices of Fines Nos. 0240020022829 through 0240020022831 to Enel Perú by means of which it imposed fines of PEN 1,771,933 (ThUS$490) for the improper application of the IGV for the periods of April, June and October 2000, whose default interest as of the payment date amounted to PEN10,231,619 (ThUS$2,828). The imposition of these penalties is being challenged in the judicial courts.
| 8. | Enel Generación Piura (formerly EEPSA) |
As of December 31, 2019, Enel Generación Piura has incurred the following tax fine:
− As part of a tax audit procedure for the IGV and IPM on imports for the 2011 fiscal year, SUNAT issued Notice of Fines No. 0003Y4100/2014-000211 to Banco de Crédito del Perú (who is the legal owner of the Malacas Power Plant under a finance lease agreement, whereby Enel Generación Piura is responsible for all contingencies
F-193
arising therefrom) by means of which it imposed a penalty of PEN 6,868,256 (ThUS$1,898), whose current default interest to date amounts to PEN4,844,855 (ThUS$1,339). Note that the imposition of this penalty is being challenged in the judicial courts.
− As part of the audit procedure for the Ad Valorem General Sales Tax (IGV) and Municipal Promotion Tax (IPM) on imports for 2016, SUNAT issued Division Resolution No. 253- 2020-SUNAT-323100 to Bank Scotiabank del Perú (who is the legal owner of the Malacas Power Plant Replacement Project – Unit TG6, under a finance lease agreement, whereby Enel Generación Piura is responsible for all contingencies arising therefrom), whereby a fine amounting to PEN 4,552,490 (ThUS $ 1,258) was partially canceled (reduced by 60%) resulting in a fine amounting to PEN 1,820,995 (ThUS $ 503) plus default interest in the amount of PEN 1,165,075 (ThUS $ 322), as of the date of payment. The imposition of the aforementioned fine is being discussed before SUNAT.
In relation to the sanctions described above, the Group has established provisions for ThUS $ 49,856 as of December 31, 2020 (see Note 25). There are other sanctions that also have associated provisions, but they are not described in this note, since they individually represent smaller amounts. Management believes that the provisions recorded adequately cover the risks due to penalties, Therefore, they do not expect additional liabilities to arise from those already registered.
F-194
Environmental expenses for the years ended December 31, 2020, 2019 and 2018, are as follows:
| | | | | | | | | | |
| | | | 12-31-2020 | 12-31-2019 | |||||
Disbursing Company | Project Name | Environmental Description | Project Status [Finished, | Disbursement amount | Capitalized amount | Expense amount | Future disbursement amount | Estimated date of future disbursement | Total disbursements | Amount of prior period disbursement |
| | Monitoring & hydrometeorological studies | In progress | 480 | - | 480 | - | | 480 | 522 |
Emgesa S.A. E.S.P. | Central Hidroelectrica El Quimbo | Other | In progress | 276 | - | 276 | - | | 276 | 208 |
| Project | Law 99 | In progress | - | - | - | 4,221 | 12-31-2022 | 4,221 | 4,588 |
Empresa Distribuidora Sur S.A. | Contaminating Material | Manipulation of contaminating material | In progress | 74 | - | 74 | - | | 74 | 133 |
| Pcbs Decommissioning | Under Law 1196 of 2008, Colombia adopted the Stockholm Convention and this was regulated with the Ministry of the Environment's Resolution 222 of December 15, 2011, recognizing the provision for the decommissioning of transformers contaminated with PCBs. | In progress | 2,341 | 2,180 | 161 | 5,375 | 12-31-2027 | 7,716 | 7,838 |
Compañía Distribuidora y Comercializadora de Energía S.A. | Nueva Esperanza Environmental Compensation | Compensations included in Resolution 1061 and Agreement 017 of 2013 issued by the Ministry of the Environment and the Autonomous Regional Corporation of Cundinamarca, respectively, which approves the substitution of the protecting and producing forestry reserve of the upper basin of the Bogota River, committing the Company to undertaking a compensation and reforestation plan in the construction zone of the Nueva Esperanza, Gran Sabana and Compartir substations | In progress | 83 | 83 | - | 309 | 12-31-2022 | 392 | 309 |
| Prevention Activities | Protection of environmental biodiversity, treatment of waste waters and studies of environmental aspects | Completed | 222 | - | 222 | - | 12-31-2020 | 222 | 78 |
| Environmental Studies | Studies of environmental aspects | Completed | 103 | - | 103 | - | | 103 | 116 |
Enel Generación Perú S.A. | Waste Management | Handling of hazardous waste | Completed | 204 | - | 204 | - | | 204 | 342 |
| Mitigation and Restoration | Protection and recovery of soil and water | Completed | 6 | - | 6 | - | | 6 | 29 |
| Environmental Monitoring | Protection of the air and climate, noise reduction, protection against radiation | Completed | 111 | - | 111 | - | | 111 | 86 |
| Landscaping and Green Areas | Maintaining green areas and small fauna | Completed | 89 | - | 89 | - | | 89 | 90 |
| Prevention Activities | Protection of environmental biodiversity, treatment of waste waters | Completed | 55 | - | 55 | - | | 55 | 35 |
| Environmental Studies | Environmental aspect studies | Completed | 22 | - | 22 | - | | 22 | 29 |
Enel Generación Piura S.A. | Waste Management | Handling of hazardous waste | Completed | 37 | - | 37 | - | | 37 | 76 |
| Environmental Monitoring | Protection of the air and climate, noise reduction | Completed | 28 | - | 28 | - | | 28 | 42 |
| Landscaping and Green Areas | Maintaining green areas and small fauna | Completed | 42 | - | 42 | - | | 42 | - |
| Prevention Activities | Protection of the air and climate, noise reduction, protection against radiation | Completed | 72 | - | 72 | - | | 72 | - |
| Environmental Studies | Environmental aspect studies | Completed | 31 | - | 31 | - | | 31 | 24 |
Chinango S.A.C. | Waste Management | Handling of hazardous waste | Completed | 115 | - | 115 | - | | 115 | 53 |
| Mitigation and Restoration | Protection and recovery of soil and water | Completed | 7 | - | 7 | - | | 7 | 19 |
| Environmental Monitoring | Protection of the air and climate, noise reduction, protection against radiation | Completed | 108 | - | 108 | - | | 108 | 277 |
Total | 4,506 | 2,263 | 2,243 | 9,905 | - | 14,411 | 14,894 | |||
| | | | 12-31-2019 | |||||
|---|---|---|---|---|---|---|---|---|---|
Disbursing Company | Project Name | Environmental Description | Project Status [Finished, | Disbursement amount | Capitalized amount | Expense amount | Future disbursement amount | Estimated date of future disbursement | Total disbursements |
| | Monitoring & hydrometeorological studies | In progress | 522 | - | 522 | - | - | 522 |
Emgesa S.A. E.S.P. | Central Hidroelectrica El Quimbo | Other | In progress | 208 | - | 208 | - | - | 208 |
| Project | Law 99 | In progress | - | - | - | 4,588 | 12-31-2021 | 4,588 |
Empresa Distribuidora Sur S.A. | Contaminating Material | Manipulation of contaminating material | In progress | 133 | - | 133 | - | | 133 |
| Pcbs Decommissioning | Under Law 1196 of 2008, Colombia adopted the Stockholm Convention and this was regulated with the Ministry of the Environment's Resolution 222 of December 15, 2011, recognizing the provision for the decommissioning of transformers contaminated with PCBs. | In progress | 1,693 | 1,399 | 294 | 6,145 | 12-31-2027 | 7,838 |
Compañía Distribuidora y Comercializadora de Energía S.A. | Nueva Esperanza Environmental Compensation | Compensations included in Resolution 1061 and Agreement 017 of 2013 issued by the Ministry of the Environment and the Autonomous Regional Corporation of Cundinamarca, respectively, which approves the substitution of the protecting and producing forestry reserve of the upper basin of the Bogota River, committing the Company to undertaking a compensation and reforestation plan in the construction zone of the Nueva Esperanza, Gran Sabana and Compartir substations | In progress | 204 | 189 | 15 | 105 | 12-31-2019 | 309 |
| Prevention Activities | Protection of environmental biodiversity, treatment of waste waters | In progress | 78 | - | 78 | - | 12-31-2019 | 78 |
| Environmental Studies | Environmental aspect studies | In progress | 116 | - | 116 | - | 12-31-2019 | 116 |
| Waste Management | Handling of hazardous waste | In progress | 342 | - | 342 | - | 12-31-2019 | 342 |
Enel Generación Perú S.A. | Mitigation and Restoration | Protection and recovery of soil and water | In progress | 29 | - | 29 | - | 12-31-2019 | 29 |
| Environmental Monitoring | Protection of the air and climate, noise reduction, protection against radiation | In progress | 86 | - | 86 | - | 12-31-2019 | 86 |
| Landscaping and Green Areas | Maintaining green areas and small fauna | In progress | 90 | - | 90 | - | 12-31-2019 | 90 |
| Prevention Activities | Protection of environmental biodiversity, treatment of waste waters | In progress | 35 | - | 35 | - | 12-31-2019 | 35 |
| Environmental Studies | Environmental aspect studies | In progress | 29 | - | 29 | - | 12-31-2019 | 29 |
F-195
| | | | 12-31-2019 | |||||
|---|---|---|---|---|---|---|---|---|---|
Disbursing Company | Project Name | Environmental Description | Project Status [Finished, | Disbursement amount | Capitalized amount | Expense amount | Future disbursement amount | Estimated date of future disbursement | Total disbursements |
Enel Generación Piura S.A. | Waste Management | Handling of hazardous waste | In progress | 76 | - | 76 | - | 12-31-2019 | 76 |
| Environmental Monitoring | Protection of the air and climate, noise reduction. | In progress | 42 | - | 42 | - | 12-31-2019 | 42 |
| Landscaping and Green Areas | Maintaining green areas and small fauna | In progress | 49 | - | 49 | - | 12-31-2019 | 49 |
| Environmental Studies | Environmental aspect studies | In progress | 24 | - | 24 | - | 12-31-2019 | 24 |
| Waste Management | Handling of hazardous waste | In progress | 53 | - | 53 | - | 12-31-2019 | 53 |
Chinango S.A.C. | Mitigation and Restoration | Protection and recovery of soil and water | In progress | 19 | - | 19 | - | 12-31-2019 | 19 |
| Environmental Monitoring | Protection of the air and climate, noise reduction, protection against radiation | In progress | 277 | - | 277 | - | 12-31-2019 | 277 |
Enel Distribución S.A. | Waste Management | Elimination of particles and other special waste | Completed | 243 | - | 243 | - | 12-31-2019 | 243 |
Total | | | | 4,348 | 1,588 | 2,760 | 10,838 | - | 15,186 |
ti | | | | | | | | | |
| | | | 12-31-2018 | |||||
Disbursing Company | Project Name | Environmental Description | Project Status [Finished, | Disbursement amount | Capitalized amount | Expense amount | Future disbursement amount | Estimated date of future disbursement | Total disbursements |
Emgesa S.A. E.S.P. | Central Hidroelectrica El Quimbo Project | Environmental Management Plan El Quimbo | In progress | - | - | - | 7,495 | 12-31-2020 | 7,495 |
Empresa Distribuidora Sur S.A. | Contaminating Material | Manipulation of contaminating material | In progress | 130 | - | 130 | - | - | 130 |
| Prevention Activities | Protection of environmental biodiversity | In progress | 57 | - | 57 | - | 12-31-2018 | 57 |
| Environmental Studies | Environmental aspect studies | In progress | 63 | - | 63 | - | 12-31-2018 | 63 |
Chinango S.A.C. | Waste Management | Handling of hazardous waste | In progress | 44 | - | 44 | - | 12-31-2018 | 44 |
| Mitigation and Restoration | Protection and recovery of soil and water | In progress | - | - | - | - | 12-31-2018 | - |
| Environmental Monitoring | Protection of the air and climate, noise reduction, protection against radiation | In progress | 426 | - | 426 | - | 12-31-2018 | 426 |
| Landscaping and Green Areas | Maintaining green areas and small fauna | In progress | 11 | - | 11 | - | 12-31-2018 | 11 |
| Pcbs Decommissioning | Under Law 1196 of 2008, Colombia adopted the Stockholm Convention and this was regulated with the Ministry of the Environment's Resolution 222 of December 15, 2011, recognizing the provision for the decommissioning of transformers contaminated with PCBs. | In progress | 373 | 113 | 260 | 7 | 12-31-2018 | 380 |
Compañía Distribuidora y Comercializadora de Energía S.A. | Nueva Esperanza Environmental Compensation | Compensations included in Resolution 1061 and Agreement 017 of 2013 issued by the Ministry of the Environment and the Autonomous Regional Corporation of Cundinamarca, respectively, which approves the substitution of the protecting and producing forestry reserve of the upper basin of the Bogota River, committing the Company to undertaking a compensation and reforestation plan in the construction zone of the Nueva Esperanza, Gran Sabana and Compartir substations | In progress | 493 | 481 | 12 | 1 | 12-31-2019 | 494 |
| Prevention Activities | Protection of environmental biodiversity, treatment of waste waters | In progress | 301 | - | 301 | - | 12-31-2018 | 301 |
| Environmental Studies | Environmental aspect studies | In progress | 256 | - | 256 | - | 12-31-2018 | 256 |
| Waste Management | Handling of hazardous waste | In progress | 314 | - | 314 | - | 12-31-2018 | 314 |
Enel Generación Perú S.A. | Mitigation and Restoration | Protection and recovery of soil and water | In progress | 37 | - | 37 | - | 12-31-2018 | 37 |
| Environmental Monitoring | Protection of the air and climate, noise reduction, protection against radiation | In progress | 180 | - | 180 | - | 12-31-2018 | 180 |
| Landscaping and Green Areas | Maintaining green areas and small fauna | In progress | 220 | - | 220 | - | 12-31-2018 | 220 |
Total | | | | 2,905 | 594 | 2,311 | 7,503 | - | 10,408 |
F-196
39. |
As of December 31, 2020, 2019 and 2018, summarized financial information of our main subsidiaries prepared under IFRS is as follows:
| | | | | | | | | | | | | | | | | | | |
| 12-31-2020 | ||||||||||||||||||
| Financial | Current | Non-Current Assets | Total Assets | Current | Non- Current Liabilities | Equity | Total Liabilities and Equity | Revenue | Raw Materials and Consumables Used | Contribution | Gross | Operating | Financial | Income Before Taxes | Income | Profit (Loss) | Other Comprehensive Income | Total Comprehensive Income |
Enel Argentina S.A. | Separate | 40,432 | 65,563 | 105,995 | 1,293 | - | 104,702 | 105,995 | - | (600) | (600) | (2,459) | (2,459) | 11,264 | 12,146 | 874 | 13,020 | (37,029) | (24,009) |
Enel Generación Costanera S.A. | Separate | 96,321 | 253,484 | 349,805 | 96,132 | 74,375 | 179,298 | 349,805 | 112,931 | (4,963) | 107,968 | 60,965 | 18,811 | (9,445) | 9,497 | 7,928 | 17,425 | (47,631) | (30,206) |
Enel Generación El Chocón S.A. | Separate | 91,441 | 268,572 | 360,013 | 30,857 | 43,537 | 285,619 | 360,013 | 48,505 | (4,543) | 43,962 | 35,964 | 21,800 | 37,910 | 62,211 | (9,332) | 52,879 | (66,592) | (13,713) |
Empresa Distribuidora Sur S.A. | Separate | 274,169 | 1,442,360 | 1,716,529 | 591,523 | 415,191 | 709,815 | 1,716,529 | 801,229 | (530,338) | 270,891 | 49,912 | (68,276) | 22,605 | (45,636) | (22,866) | (68,502) | (230,171) | (298,673) |
Enel Trading Argentina S.R.L. | Separate | 12,882 | 1,263 | 14,145 | 10,573 | - | 3,572 | 14,145 | 3,086 | (189) | 2,897 | 706 | 414 | (130) | 284 | (103) | 181 | (1,006) | (825) |
Dock Sud S.A. | Separate | 97,880 | 172,641 | 270,521 | 10,749 | 28,575 | 231,197 | 270,521 | 66,334 | (10,025) | 56,309 | 42,590 | 14,445 | 3,472 | 17,968 | (13,426) | 4,542 | (68,182) | (63,640) |
Grupo Enel Argentina | Consolidated | 312,760 | 841,974 | 1,154,734 | 124,270 | 115,750 | 914,714 | 1,154,734 | 161,093 | (11,572) | 149,521 | 92,860 | 36,542 | 61,778 | 71,522 | 1,130 | 72,652 | (258,557) | (185,905) |
Enel Brasil S.A. | Separate | 567,492 | 4,484,221 | 5,051,713 | 344,060 | 225,338 | 4,482,315 | 5,051,713 | 502 | (139) | 363 | (41,809) | (42,724) | (127,544) | 168,090 | 36,441 | 204,531 | (1,088,424) | (883,893) |
Enel Generación Fortaleza S.A. | Separate | 76,390 | 133,672 | 210,062 | 52,283 | 19,535 | 138,244 | 210,062 | 187,227 | (118,673) | 68,554 | 61,986 | 51,176 | (521) | 50,655 | (19,628) | 31,027 | (31,881) | (854) |
EGP Cachoeira Dourada S.A. | Separate | 584,030 | 130,285 | 714,315 | 563,242 | 20,520 | 130,553 | 714,315 | 812,275 | (666,295) | 145,980 | 134,715 | 129,601 | (6,103) | 123,498 | (41,504) | 81,994 | (15,502) | 66,492 |
EGP Volta Grande | Separate | 31,525 | 274,019 | 305,544 | 31,433 | 138,557 | 135,554 | 305,544 | 62,398 | (10,548) | 51,850 | 48,505 | 48,484 | (11,785) | 36,700 | (12,486) | 24,214 | (32,034) | (7,820) |
Enel Cien S.A. | Separate | 31,496 | 141,069 | 172,565 | 17,527 | 407 | 154,631 | 172,565 | 52,705 | (83,694) | (30,989) | (37,406) | (45,046) | 23,435 | (21,612) | 7,275 | (14,337) | (48,724) | (63,061) |
Compañía de Transmisión del Mercosur S.A. | Separate | 2,554 | 10,089 | 12,643 | 10,443 | - | 2,200 | 12,643 | 45,439 | - | 45,439 | 44,911 | 44,472 | (17,275) | 27,197 | (996) | 26,201 | 14,795 | 40,996 |
Transportadora de Energía S.A. | Separate | 2,144 | 11,705 | 13,849 | 8,490 | 482 | 4,877 | 13,849 | 37,973 | - | 37,973 | 37,284 | 35,806 | (13,356) | 22,450 | 801 | 23,251 | 15,236 | 38,487 |
Enel Distribución Ceará S.A. | Separate | 575,851 | 1,322,709 | 1,898,560 | 589,631 | 651,669 | 657,260 | 1,898,560 | 1,141,882 | (835,325) | 306,557 | 167,515 | 74,542 | (4,767) | 70,014 | (18,464) | 51,550 | (178,829) | (127,279) |
Enel Distribución Rio S.A. | Separate | 705,578 | 1,588,563 | 2,294,141 | 574,409 | 1,011,309 | 708,423 | 2,294,141 | 1,220,592 | (869,354) | 351,238 | 199,503 | 62,080 | (46,093) | 16,145 | (5,706) | 10,439 | (229,670) | (219,231) |
Enel Distribución Goiás S.A. | Separate | 566,168 | 2,032,002 | 2,598,170 | 925,334 | 517,983 | 1,154,853 | 2,598,170 | 1,392,402 | (1,026,859) | 365,543 | 167,630 | 83,459 | (41,127) | 42,806 | (16,729) | 26,077 | (306,258) | (280,181) |
Enel X Brasil S.A. | Separate | 19,617 | 22,477 | 42,094 | 20,560 | 583 | 20,951 | 42,094 | 13,357 | (4,454) | 8,903 | (3,705) | (6,711) | (2,009) | (8,720) | 973 | (7,747) | (4,323) | (12,070) |
Enel Distribuicao Sao Paulo S.A. | Separate | 1,515,162 | 5,198,704 | 6,713,866 | 1,614,149 | 3,852,132 | 1,247,585 | 6,713,866 | 2,980,109 | (2,206,107) | 774,002 | 552,367 | 333,460 | (76,312) | 257,148 | (77,974) | 179,174 | (677,886) | (498,712) |
Grupo Enel Brasil | Consolidated | 4,143,213 | 11,396,553 | 15,539,766 | 4,211,671 | 6,169,465 | 5,158,630 | 15,539,766 | 7,581,035 | (5,450,909) | 2,130,126 | 1,337,914 | 774,682 | (321,390) | 454,162 | (148,157) | 306,005 | (1,678,028) | (1,372,023) |
Emgesa S.A. E.S.P. | Separate | 353,946 | 2,420,483 | 2,774,429 | 570,718 | 697,179 | 1,506,532 | 2,774,429 | 1,159,134 | (412,530) | 746,604 | 673,446 | 606,868 | (70,522) | 536,449 | (188,883) | 347,566 | (19,348) | 328,218 |
Compañía Distribuidora y Comercializadora de Energía S.A. | Separate | 499,983 | 1,973,507 | 2,473,490 | 640,774 | 840,051 | 992,665 | 2,473,490 | 1,546,963 | (886,155) | 660,808 | 506,794 | 375,127 | (49,171) | 325,977 | (97,881) | 228,096 | (14,970) | 213,126 |
Enel Perú, S.A.C. | Separate | 34,757 | 1,288,805 | 1,323,562 | 180,490 | 10,990 | 1,132,082 | 1,323,562 | - | - | - | (215) | (215) | (6,072) | 156,138 | - | 156,138 | (96,339) | 59,799 |
Enel Generación Perú S.A.A. | Separate | 315,244 | 880,207 | 1,195,451 | 191,039 | 208,495 | 795,917 | 1,195,451 | 408,604 | (140,350) | 268,254 | 210,702 | 162,140 | 10,361 | 186,817 | (42,052) | 144,765 | (66,777) | 77,988 |
Chinango S.A.C. | Separate | 8,892 | 131,158 | 140,050 | 7,061 | 26,392 | 106,597 | 140,050 | 41,000 | (4,496) | 36,504 | 31,273 | 27,319 | (87) | 27,232 | (8,152) | 19,080 | (8,334) | 10,746 |
Enel Generación Piura S.A. | Separate | 60,425 | 164,399 | 224,824 | 58,135 | 24,746 | 141,943 | 224,824 | 63,874 | (23,435) | 40,439 | 30,016 | 18,512 | (4,873) | 17,249 | (5,852) | 11,397 | (12,361) | (964) |
Enel Distribución Perú S.A.A. | Separate | 191,178 | 1,263,496 | 1,454,674 | 249,068 | 471,377 | 734,229 | 1,454,674 | 886,663 | (598,157) | 288,506 | 213,898 | 141,464 | (25,042) | 116,427 | (38,488) | 77,939 | (62,468) | 15,471 |
Grupo Enel Perú | Consolidated | 546,260 | 2,382,886 | 2,929,146 | 627,532 | 734,466 | 1,567,148 | 2,929,146 | 1,243,994 | (621,907) | 622,087 | 475,905 | 339,421 | (26,007) | 317,029 | (91,896) | 225,133 | (246,279) | (21,146) |
| | | | | | | | | | | | | | | | | | | |
| 12-31-2019 | ||||||||||||||||||
| Financial | Current | Non-Current Assets | Total Assets | Current | Non- Current Liabilities | Equity | Total Liabilities and Equity | Revenue | Raw Materials and Consumables Used | Contribution | Gross | Operating | Financial | Income Before Taxes | Income | Profit (Loss) | Other Comprehensive Income | Total Comprehensive Income |
Enel Argentina S.A. | Separate | 43,219 | 87,644 | 130,863 | 2,152 | - | 128,711 | 130,863 | - | - | - | (463) | (463) | 8,963 | 39,714 | (2,453) | 37,261 | (53,938) | (16,677) |
Enel Generación Costanera S.A. | Separate | 113,909 | 270,423 | 384,332 | 112,412 | 105,047 | 166,873 | 384,332 | 213,606 | (68,969) | 144,637 | 100,244 | 59,860 | 22,628 | 82,582 | (24,642) | 57,940 | (41,288) | 16,652 |
Enel Generación El Chocón S.A. | Separate | 101,114 | 315,842 | 416,956 | 75,003 | 56,983 | 284,970 | 416,956 | 71,807 | (5,957) | 65,850 | 58,055 | 42,906 | 59,477 | 103,800 | (21,770) | 82,030 | (70,096) | 11,934 |
Empresa Distribuidora Sur S.A. | Separate | 284,126 | 1,456,918 | 1,741,044 | 509,223 | 429,766 | 802,055 | 1,741,044 | 1,346,888 | (773,693) | 573,195 | 307,066 | 211,031 | 54,470 | 265,560 | (76,548) | 189,012 | (237,185) | (48,173) |
Enel Trading Argentina S.R.L | Separate | 23,432 | 1,551 | 24,983 | 21,486 | - | 3,497 | 24,983 | 7,497 | (950) | 6,547 | 3,599 | 3,321 | (92) | 3,229 | (1,295) | 1,934 | (600) | 1,334 |
Dock Sud S.A. | Separate | 105,726 | 256,881 | 362,607 | 52,678 | 52,732 | 257,197 | 362,607 | 146,958 | (54,326) | 92,632 | 81,806 | 50,775 | 12,036 | 63,132 | (1,007) | 62,125 | (74,649) | (12,524) |
Grupo Enel Argentina | Consolidated | 326,191 | 927,948 | 1,254,139 | 185,096 | 151,167 | 917,876 | 1,254,139 | 285,277 | (74,927) | 210,350 | 157,774 | 102,242 | 112,784 | 299,022 | (54,044) | 244,978 | (270,493) | (25,515) |
Enel Brasil S.A. | Separate | 371,174 | 5,186,673 | 5,557,847 | 145,721 | 376,140 | 5,035,986 | 5,557,847 | 977 | (85) | 892 | (57,320) | (58,076) | (85,784) | 88,858 | 15,025 | 103,883 | (149,216) | (45,333) |
Enel Generación Fortaleza S.A. | Separate | 119,719 | 193,438 | 313,157 | 108,806 | 737 | 203,614 | 313,157 | 309,525 | (183,394) | 126,131 | 114,170 | 99,940 | 13,389 | 113,329 | (36,130) | 77,199 | (5,465) | 71,734 |
EGP Cachoeira Dourada S.A. | Separate | 213,201 | 98,107 | 311,308 | 193,295 | 3,280 | 114,733 | 311,308 | 494,303 | (394,776) | 99,527 | 85,746 | 79,065 | (100) | 78,965 | (25,671) | 53,294 | 2,285 | 55,579 |
EGP Volta Grande | Separate | 42,230 | 345,708 | 387,938 | 29,751 | 185,505 | 172,682 | 387,938 | 106,792 | (42,895) | 63,897 | 59,632 | 59,607 | (13,583) | 46,024 | (15,173) | 30,851 | (844) | 30,007 |
Enel Cien S.A. | Separate | 113,996 | 151,707 | 265,703 | 13,358 | 16,240 | 236,105 | 265,703 | 70,295 | (967) | 69,328 | 61,376 | 49,598 | 19,722 | 69,320 | (39,773) | 29,547 | (4,600) | 24,947 |
Compañía de Transmisión del Mercosur S.A. | Separate | 6,856 | 701 | 7,557 | 50,954 | 8,030 | (51,427) | 7,557 | 1,142 | - | 1,142 | 789 | (530) | (10,469) | (10,999) | 296 | (10,703) | 15,634 | 4,931 |
Transportadora de Energía S.A. | Separate | 4,914 | 3,924 | 8,838 | 52,590 | 9,207 | (52,959) | 8,838 | 1,112 | - | 1,112 | 601 | (923) | (10,288) | (11,212) | 333 | (10,879) | 16,154 | 5,275 |
Enel Distribución Ceará S.A. | Separate | 629,655 | 1,624,665 | 2,254,320 | 525,921 | 902,000 | 826,399 | 2,254,320 | 1,373,202 | (991,979) | 381,223 | 224,266 | 140,695 | (18,246) | 122,937 | (19,875) | 103,062 | (26,723) | 76,339 |
Enel Distribución Rio S.A. | Separate | 722,394 | 1,962,608 | 2,685,002 | 910,507 | 830,069 | 944,426 | 2,685,002 | 1,514,836 | (1,029,220) | 485,616 | 299,779 | 163,829 | (55,984) | 109,105 | (37,009) | 72,096 | (46,182) | 25,914 |
Enel Distribución Goiás S.A. | Separate | 665,187 | 2,355,246 | 3,020,433 | 795,562 | 903,997 | 1,320,874 | 3,020,433 | 1,544,899 | (1,100,077) | 444,822 | 220,030 | 22,568 | (59,708) | (36,744) | 11,462 | (25,282) | (59,597) | (84,879) |
Enel X Brasil S.A. | Separate | 17,886 | 15,089 | 32,975 | 13,676 | 307 | 18,992 | 32,975 | 19,359 | (6,434) | 12,925 | (1,373) | (4,677) | (311) | (4,988) | 539 | (4,449) | (679) | (5,128) |
Enel Distribuicao Sao Paulo S.A. | Separate | 1,701,300 | 6,062,310 | 7,763,610 | 1,474,482 | 4,310,495 | 1,978,633 | 7,763,610 | 3,720,782 | (2,699,108) | 1,021,674 | 638,496 | 378,591 | (100,835) | 277,756 | 460,335 | 738,091 | (412,571) | 325,520 |
Grupo Enel Brasil | Consolidated | 4,211,380 | 13,471,236 | 17,682,616 | 3,919,122 | 7,528,800 | 6,234,694 | 17,682,616 | 8,611,146 | (5,906,735) | 2,704,411 | 1,645,516 | 928,952 | (356,940) | 574,154 | 314,359 | 888,513 | (559,512) | 329,001 |
Emgesa S.A. E.S.P. | Separate | 251,413 | 2,524,074 | 2,775,487 | 387,804 | 943,882 | 1,443,801 | 2,775,487 | 1,246,989 | (465,768) | 781,221 | 710,320 | 637,221 | (81,785) | 555,672 | (180,207) | 375,465 | 7,209 | 382,674 |
Compañía Distribuidora y Comercializadora de Energía S.A. | Separate | 363,838 | 1,842,861 | 2,206,699 | 545,689 | 704,527 | 956,483 | 2,206,699 | 1,665,318 | (962,174) | 703,144 | 556,513 | 431,004 | (58,397) | 372,680 | (122,066) | 250,614 | (615) | 249,999 |
Enel Perú, S.A.C. | Separate | 37,589 | 1,403,189 | 1,440,778 | 41,359 | 10,868 | 1,388,551 | 1,440,778 | 11 | - | 11 | (1,155) | (1,155) | (1,473) | 127,289 | (8) | 127,281 | 27,105 | 154,386 |
Enel Generación Perú S.A.A. | Separate | 361,697 | 974,784 | 1,336,481 | 172,150 | 259,367 | 904,964 | 1,336,481 | 478,155 | (178,102) | 300,053 | 243,359 | 191,690 | (4,886) | 200,977 | (56,340) | 144,637 | 18,483 | 163,120 |
Chinango S.A.C. | Separate | 6,346 | 153,370 | 159,716 | 6,349 | 38,766 | 114,601 | 159,716 | 45,030 | (5,081) | 39,949 | 34,113 | 29,868 | (723) | 29,145 | (8,685) | 20,460 | 2,791 | 23,251 |
Enel Generación Piura S.A. | Separate | 75,118 | 180,365 | 255,483 | 64,559 | 33,669 | 157,255 | 255,483 | 82,155 | (27,861) | 54,294 | 44,074 | 32,902 | (317) | 32,595 | (9,275) | 23,320 | 2,948 | 26,268 |
Enel Distribución Perú S.A.A. | Separate | 153,382 | 1,305,567 | 1,458,949 | 272,268 | 467,924 | 718,757 | 1,458,949 | 950,350 | (619,181) | 331,169 | 257,473 | 196,436 | (22,938) | 184,153 | (55,649) | 128,504 | 13,065 | 141,569 |
Grupo Enel Perú | Consolidated | 551,844 | 2,562,083 | 3,113,927 | 482,477 | 805,168 | 1,826,282 | 3,113,927 | 1,382,941 | (676,173) | 706,768 | 561,494 | 433,368 | (30,553) | 413,480 | (125,187) | 288,293 | 64,392 | 352,685 |
F-197
| | | | | | | | | | | | | | | | | | | |
| 12-31-2018 | ||||||||||||||||||
| Financial | Current | Non-Current Assets | Total Assets | Current | Non- Current Liabilities | Equity | Total Liabilities and Equity | Revenue | Raw Materials and Consumables Used | Contribution | Gross | Operating | Financial | Income Before Taxes | Income | Profit (Loss) | Other Comprehensive Income | Total Comprehensive Income |
Enel Argentina S.A. | Separate | 6,657 | 139,508 | 146,165 | 776 | - | 145,389 | 146,165 | - | - | - | (618) | (618) | 2,812 | 3,657 | (669) | 2,988 | (138,136) | (135,148) |
Enel Generación Costanera S.A. | Separate | 132,613 | 267,952 | 400,565 | 136,446 | 99,309 | 164,810 | 400,565 | 162,894 | (15,271) | 147,623 | 103,430 | 89,235 | 19,250 | 108,963 | (17,345) | 91,618 | (43,235) | 48,383 |
Enel Generación El Chocón S.A. | Separate | 95,054 | 370,645 | 465,699 | 82,599 | 85,399 | 297,701 | 465,699 | 67,134 | (4,675) | 62,459 | 53,087 | 32,994 | 106,969 | 141,617 | (51,466) | 90,151 | (130,515) | (40,364) |
Empresa Distribuidora Sur S.A. | Separate | 312,128 | 1,381,972 | 1,694,100 | 710,707 | 347,653 | 635,740 | 1,694,100 | 1,189,950 | (729,223) | 460,727 | 179,203 | 77,990 | 127,247 | 205,078 | (101,101) | 103,977 | (347,881) | (243,904) |
Enel Trading Argentina S.R.L | Separate | 14,550 | 1,008 | 15,558 | 13,940 | - | 1,618 | 15,558 | 4,738 | (305) | 4,433 | 1,357 | 1,083 | (2,456) | (1,370) | (408) | (1,778) | (571) | (2,349) |
Dock Sud S.A. | Separate | 55,921 | 263,659 | 319,580 | 63,756 | 55,240 | 200,584 | 319,580 | 94,769 | (20,986) | 73,783 | 58,725 | 33,999 | 35,743 | 69,850 | (29,790) | 40,060 | (104,651) | (64,591) |
Grupo Enel Argentina | Consolidated | 263,345 | 916,274 | 1,179,619 | 221,534 | 182,169 | 775,916 | 1,179,619 | 229,458 | (19,945) | 209,513 | 155,467 | 121,179 | 140,459 | 307,883 | (72,221) | 235,662 | (355,051) | (119,389) |
Enel Brasil S.A. | Separate | 1,681,474 | 3,892,112 | 5,573,586 | 2,720,641 | 225,312 | 2,627,633 | 5,573,586 | 174 | (96) | 78 | (46,334) | (46,374) | (119,900) | (106,575) | 44,864 | (61,711) | (441,136) | (502,847) |
Enel Generación Fortaleza S.A. | Separate | 140,483 | 189,912 | 330,395 | 123,850 | 60,960 | 145,585 | 330,395 | 211,536 | (207,475) | 4,061 | (6,852) | (16,483) | (5,857) | (22,340) | 7,309 | (15,031) | (25,888) | (40,919) |
EGP Cachoeira Dourada S.A. | Separate | 301,315 | 103,975 | 405,290 | 244,418 | 3,075 | 157,797 | 405,290 | 540,344 | (417,506) | 122,838 | 109,049 | 102,351 | 7,959 | 110,311 | (37,719) | 72,592 | (18,168) | 54,424 |
EGP Volta Grande | Separate | 94,170 | 355,666 | 449,836 | 274,015 | - | 175,821 | 449,836 | 81,939 | (10,644) | 71,295 | 68,654 | 68,653 | (15,031) | 53,622 | (18,732) | 34,890 | (30,953) | 3,937 |
Enel Cien S.A. | Separate | 120,897 | 183,601 | 304,498 | 9,403 | 18,424 | 276,671 | 304,498 | 82,608 | (1,626) | 80,982 | 72,831 | 56,219 | 31,686 | 87,905 | (29,729) | 58,176 | (40,853) | 17,323 |
Compañía de Transmisión del Mercosur S.A. | Separate | 9,097 | 2,196 | 11,293 | 50,940 | 2,493 | (42,140) | 11,293 | 1,193 | - | 1,193 | 716 | (650) | (21,535) | (22,185) | 44 | (22,141) | 13,101 | (9,040) |
Transportadora de Energía S.A. | Separate | 6,912 | 5,755 | 12,667 | 50,780 | 5,431 | (43,544) | 12,667 | 1,140 | - | 1,140 | 591 | (986) | (21,519) | (22,506) | (176) | (22,682) | 13,664 | (9,018) |
Enel Distribución Ceará S.A. | Separate | 538,216 | 1,209,995 | 1,748,211 | 517,761 | 440,495 | 789,955 | 1,748,211 | 1,410,602 | (1,037,015) | 373,587 | 213,754 | 140,035 | (17,507) | 122,528 | (22,092) | 100,436 | (128,063) | (27,627) |
Enel Distribución Rio S.A. | Separate | 611,450 | 1,964,754 | 2,576,204 | 865,349 | 781,211 | 929,644 | 2,576,204 | 1,510,676 | (1,026,864) | 483,812 | 294,177 | 172,577 | (96,634) | 75,943 | (27,646) | 48,297 | (152,089) | (103,792) |
Enel Distribución Goiás S.A. | Separate | 694,885 | 2,478,860 | 3,173,745 | 613,692 | 1,154,300 | 1,405,753 | 3,173,745 | 1,541,938 | (1,106,151) | 435,787 | 254,481 | 157,911 | (51,253) | 107,044 | 318,307 | 425,351 | (199,597) | 225,754 |
Enel X Brasil S.A. | Separate | 14,153 | 9,180 | 23,333 | 5,512 | 42 | 17,779 | 23,333 | 17,882 | (8,136) | 9,746 | (559) | (1,412) | (169) | (1,581) | 394 | (1,187) | (2,104) | (3,291) |
Enel Distribuicao Sao Paulo S.A. | Separate | 1,535,494 | 4,426,898 | 5,962,392 | 1,438,355 | 2,871,158 | 1,652,879 | 5,962,392 | 2,459,201 | (1,914,222) | 544,979 | 243,789 | 137,736 | (98,509) | 39,227 | (17,209) | 22,018 | (202,092) | (180,074) |
Grupo Enel Brasil | Consolidated | 4,112,113 | 11,587,158 | 15,699,271 | 6,524,502 | 5,555,695 | 3,619,074 | 15,699,271 | 7,492,092 | (5,366,693) | 2,125,399 | 1,201,286 | 766,565 | (435,467) | 331,484 | 217,615 | 549,099 | (689,804) | (140,705) |
Emgesa S.A. E.S.P. | Separate | 336,791 | 2,511,365 | 2,848,156 | 510,844 | 1,032,101 | 1,305,211 | 2,848,156 | 1,259,471 | (478,264) | 781,207 | 707,149 | 633,075 | (101,981) | 531,118 | (185,554) | 345,564 | (117,250) | 228,314 |
Compañía Distribuidora y Comercializadora de Energía S.A. | Separate | 414,711 | 1,686,783 | 2,101,494 | 650,760 | 598,455 | 852,279 | 2,101,494 | 1,713,801 | (1,032,452) | 681,349 | 522,969 | 389,002 | (57,795) | 331,372 | (125,242) | 206,130 | (81,177) | 124,953 |
Enel Perú, S.A.C. | Separate | 36,807 | 1,376,103 | 1,412,910 | 69,295 | 10,460 | 1,333,155 | 1,412,910 | - | - | - | 337 | 337 | (4,852) | 185,519 | - | 185,519 | (56,062) | 129,457 |
Enel Generación Perú S.A.A. | Separate | 333,468 | 914,287 | 1,247,755 | 169,579 | 234,383 | 843,793 | 1,247,755 | 480,540 | (163,879) | 316,661 | 257,625 | 209,490 | 13,325 | 263,975 | (69,105) | 194,870 | (35,507) | 159,363 |
Chinango S.A.C. | Separate | 5,798 | 137,059 | 142,857 | 7,946 | 25,562 | 109,349 | 142,857 | 44,180 | (5,215) | 38,965 | 33,910 | 29,643 | (255) | 29,388 | (8,562) | 20,826 | (4,445) | 16,381 |
Enel Generación Piura S.A. | Separate | 85,080 | 175,196 | 260,276 | 51,046 | 68,377 | 140,853 | 260,276 | 78,012 | (25,883) | 52,129 | 42,112 | 30,028 | (4,368) | 25,685 | (8,003) | 17,682 | (6,155) | 11,527 |
Enel Distribución Perú S.A.A. | Separate | 112,287 | 1,210,429 | 1,322,716 | 268,883 | 431,856 | 621,977 | 1,322,716 | 912,950 | (610,701) | 302,249 | 232,137 | 175,848 | (22,150) | 153,693 | (49,024) | 104,669 | (25,666) | 79,003 |
Grupo Enel Perú | Consolidated | 488,824 | 2,401,685 | 2,890,509 | 490,068 | 770,021 | 1,630,420 | 2,890,509 | 1,505,635 | (798,330) | 707,305 | 564,020 | 443,246 | (18,583) | 451,681 | (134,059) | 317,622 | (127,835) | 189,787 |
F-198
| i. | January 17, 2021 was the legal deadline for the dissenting shareholders of Enel Américas S.A. to exercise their statutory merger dissenters’ withdrawal rights in connection with the merger by incorporation of EGP Américas S.p.A. into Enel Américas S.A. (the “Merger”), approved by the Company’s Extraordinary Shareholders’ Meeting held on December 18, 2020 (the “Meeting”). |
During this 30-day period, dissenting shareholders representing a total of 1,787,514 of the Company's shares exercised their withdrawal rights, equivalent to 0.002% of the total shares. In accordance with the applicable legislation and, in particular, Official Letter No. 32,435 issued by the CMF on November 7, 2017, the price of said shares was paid by Enel Américas on the date on which the terms and conditions of the Merger approved by the Meeting were satisfied. The foregoing was communicated in a timely manner as an essential fact of the Company.
As a consequence, one of the conditions precedent established for the Merger was thereby fulfilled, that is, that the withdrawal rights duly exercised by the dissenting shareholders of Enel Américas as a result of the Merger did not surpass 10% of the Company's issued shares with voting rights.
| ii. | On January 29, 2021, Enel Américas, as the controlling shareholder of its Colombian subsidiaries Emgesa S.A. ESP and Codensa S.A. ESP entered into a new investment framework agreement with Grupo Energía de Bogotá SA ESP (GEB), its partner in those subsidiaries. This new investment framework agreement, which will only go into effect upon fulfillment of certain conditions precedent and upon obtaining the corporate authorizations required by both partners, looks to govern the future relations between Enel Américas and GEB as shareholders of Emgesa and Codensa. |
Among the main agreements reached, this new framework agreement will allow the renewable business to be incorporated among its joint investments, define new corporate governance rules that are better aligned with the new objectives and opportunities of this new phase, and allow parties to propose settlement agreements for the existing cases between the parties under arbitration.
The financial effects of this agreement are not quantifiable to date.
| iii. | With respect to the Merger process approved by the shareholders of Enel Américas at the Meeting, on February 1, 2021, Enel Américas acknowledged the completion of the international merger between the Italian company, Enel Rinnovabili S.r.l. and the Chilean company, EGP Américas SpA. For these purposes, the representatives of both companies granted a single public deed of declaration to certify full compliance with the formalities, requirements, and procedures applicable under Chilean and Italian laws for the completion of this international merger. |
By virtue of the above, EGP Américas SpA acquired all assets and liabilities of Enel Rinnovabili S.r.l, including the business of owning and operating the non-conventional renewable energy generation assets developed and held by Enel Green Power S.p.A. in Central and South America (except Chile).
Likewise, EGP Américas SpA obtained all consents and authorizations to be granted by certain banks in Brazil providing financing.
With the completion of the abovementioned international merger and the obtainment of consent from banks in Brazil providing financing, this fulfilled other conditions precedent to the Merger approved by the Enel Américas’ shareholders at the Meeting.
| iv. | On March 4, 2021, the Peruvian National Regulator of Customs and Tax Administration (“SUNAT” in its Spanish acronym) issued a certificate in connection with the Merger, fulfilling the last pending condition precedent. As a result, Enel Américas and EGP Américas issued a single declaratory public deed, pursuant to which they established compliance with every condition precedent that the validity of the Merger was subject to (the "Public Deed of Compliance with the Merger Conditions"). As a result, the Merger was completed on April 1, 2021, the first day of |
F-199
| the month following the date on which the Public Deed of Compliance with the Merger Conditions was issued, as approved by the Meeting. |
On April 1, 2021, Enel Américas acquired through the Merger, all of EGP Américas SpA’s assets and liabilities, including the business of owning and operating the non-conventional renewable energy generation assets that it held in Central and South America (except Chile), and assumed all its rights and liabilities, incorporating into Enel Américas EGP Américas SpA’s shareholder, Enel S.p.A., through the issuance of 31,195,387,525 new Enel Américas shares in exchange for all outstanding EGP Américas SpA’s shares and, as a result of the above, EGP Américas SpA was fully dissolved, without liquidation.
Similarly, on April 1, 2021, and, together with the Merger, the amendment to Enel Américas’ by-laws approved by the Meeting took effect. The amendment consisted of the elimination of the limitations and restrictions set out in the by-laws under Title XII of Decree Law No. 3.500 issued in 1980 – except for the Investment and Financing Policy – and, particularly the provisions that restrict a shareholder from holding more than 65% of Enel Américas’ voting capital. As a result of this merger, Enel S.p.A. increased its stake in Enel Américas from 65% to 75.18%.
| vi. | At the OSM held on April 29, 2021, our new Board of Directors was elected for a term of three years starting from the date of the meeting. At the Board of Directors meeting held on April 29, 2021, the Directors agreed to appoint Hernán Somerville Senn, Patricio Gómez Sabaini and Domingo Cruzat Amunátegui as members of the Directors’ Committee. Additionally, Hernán Somerville Senn was appointed as Financial Expert of the Directors’ Committee. |
The members of our new Board of Directors are as follows:
• Mr. Francisco de Borja Acha (Chairman)
• Mr. José Antonio Vargas Lleras
• Ms. Giulia Genuardi
• Ms. Francesca Gostinelli
• Mr. Hernán Somerville Senn
• Mr. Patricio Gómez Sabaini
• Mr. Domingo Cruzat Amunátegui
Between January 1, 2021 and the date of issuance of these consolidated financial statements, the Company has no knowledge of any financial or other events which significantly affect its financial position and results presented.
F-200
APPENDIX 1 DETAIL OF ASSETS AND LIABILITIES IN FOREIGN CURRENCY
This appendix forms an integral part of these consolidated financial statements.
The detail of assets and liabilities denominated in foreign currency is as follows:
| | | | | | | | | | | |
| | 12-31-2020 | |||||||||
| ASSETS | UF | Chilean Peso | Dollar | Euro | Colombian Peso | Peruvian Sol | Argentine Peso | Brazilian Real | Other Currency | Total |
Current Assets | | | | | | | | | | | |
| Cash and cash equivalents | - | 637 | 170,335 | 47 | 381,754 | 147,458 | 65,480 | 741,282 | - | 1,506,993 |
| Other current financial assets | - | 116 | 95 | - | 4,047 | - | 65,287 | 160,734 | - | 230,279 |
| Other current non-financial assets | - | 16,730 | 2,177 | 36 | 27,088 | 62,864 | 40,572 | 411,220 | 99 | 560,786 |
| Trade and other current receivables | - | 1,587 | 22,201 | 81 | 330,871 | 165,342 | 306,606 | 2,408,247 | - | 3,234,935 |
| Current accounts receivable from related parties | - | 3,271 | 547 | 3,566 | 716 | 2,480 | 29 | 36,341 | - | 46,950 |
| Inventories | - | - | 1,035 | 987 | 102,781 | 53,015 | 40,892 | 272,723 | - | 471,433 |
| Current tax assets | - | 9,546 | 11,457 | - | 31 | 10,069 | 2,628 | 94,149 | - | 127,880 |
Total Current Assets | - | 31,887 | 207,847 | 4,717 | 847,288 | 441,228 | 521,494 | 4,124,696 | 99 | 6,179,256 | |
| | | | | | | | | | | |
Non-Current Assets | | | | | | | | | | | |
| Other non-current financial assets | - | - | - | - | 153 | 55 | 25,461 | 2,765,194 | - | 2,790,863 |
| Other non-current non-financial assets | - | 2,980 | - | - | 33,029 | 23,092 | 898 | 2,272,857 | - | 2,332,856 |
| Trade and other non-current receivables | - | 77 | 244,126 | - | 33,565 | - | 24,410 | 276,346 | - | 578,524 |
| Non-current accounts receivable from related parties | - | - | - | - | - | - | 32 | - | - | 32 |
| Investments accounted for using the equity method | - | - | - | - | - | - | 2,273 | - | - | 2,273 |
| Intangible assets other than goodwill | - | - | - | - | 135,881 | 70,955 | 61,160 | 4,256,830 | - | 4,524,826 |
| Goodwill | - | - | - | - | 18,264 | 184,037 | 24,603 | 718,608 | - | 945,512 |
| Property, plant and equipment | - | - | 176 | - | 4,158,620 | 2,128,830 | 1,762,799 | 304,247 | - | 8,354,672 |
| Investment property | - | - | - | - | - | - | - | 7,942 | - | 7,942 |
| Right-of-use asset | 24 | - | - | - | 19,639 | 159,534 | 124 | 43,099 | - | 222,420 |
| Deferred tax assets | - | - | 192,057 | - | 11,277 | 253 | 28,746 | 762,049 | - | 994,382 |
Total Non-Current Assets | 24 | 3,057 | 436,359 | - | 4,410,428 | 2,566,756 | 1,930,506 | 11,407,172 | - | 20,754,302 | |
| | | | | | | | | | | |
Total Assets | 24 | 34,944 | 644,206 | 4,717 | 5,257,716 | 3,007,984 | 2,452,000 | 15,531,868 | 99 | 26,933,558 | |
| | | | | | | | | | | |
| | | | | | | | | | | |
| | 12-31-2019 | |||||||||
| ASSETS | UF | Chilean Peso | Dollar | Euro | Colombian Peso | Peruvian Sol | Argentine Peso | Brazilian Real | Other Currency | Total |
Current Assets | | | | | | | | | | | |
| Cash and cash equivalents | - | 142,875 | 672,694 | 83 | 185,424 | 188,655 | 49,848 | 699,418 | - | 1,938,997 |
| Other current financial assets | - | 114 | 1,522 | - | 3,512 | 232 | - | 115,003 | - | 120,383 |
| Other current non-financial assets | - | 3,811 | 14,021 | - | 12,941 | 44,845 | 33,746 | 376,798 | - | 486,162 |
| Trade and other current receivables | - | 839 | 20,699 | - | 260,132 | 145,388 | 385,814 | 2,691,585 | - | 3,504,457 |
| Current accounts receivable from related parties | - | 2,552 | 1,209 | 3,418 | 678 | 3,883 | 237 | 4,392 | - | 16,369 |
| Inventories | - | - | 3,095 | 515 | 83,152 | 45,527 | 27,480 | 236,470 | - | 396,239 |
| Current tax assets | - | 9,146 | - | - | 120 | 4,752 | 18,115 | 75,188 | - | 107,321 |
| Current assets other than assets or groups of assets for disposal classified as held for sale | - | - | - | - | 11,326 | - | - | - | - | 11,326 |
Total Current Assets | - | 159,337 | 713,240 | 4,016 | 557,285 | 433,282 | 515,240 | 4,198,854 | - | 6,581,254 | |
| | | | | | | | | | | |
Non-Current Assets | | | | | | | | | | | |
| Other non-current financial assets | - | - | 3,139 | - | 171 | - | 70 | 3,046,431 | - | 3,049,811 |
| Other non-current non-financial assets | - | 3,125 | - | - | 21,844 | 16,760 | 3,354 | 2,690,807 | - | 2,735,890 |
| Trade and other non-current receivables | - | 126 | 79,475 | - | 42,546 | - | 229,256 | 236,554 | - | 587,957 |
| Non-current accounts receivable from related parties | - | - | - | - | - | - | 68 | 779 | - | 847 |
| Investments accounted for using the equity method | - | - | - | - | - | - | 1,978 | - | - | 1,978 |
| Intangible assets other than goodwill | - | - | - | - | 125,795 | 65,292 | 30,519 | 5,306,273 | - | 5,527,879 |
| Goodwill | - | - | 524,511 | - | 5,835 | - | 4,665 | 638,032 | - | 1,173,043 |
| Property, plant and equipment | - | 19 | 222 | - | 4,162,275 | 2,311,459 | 1,888,301 | 401,162 | - | 8,763,438 |
| Investment property | - | - | - | - | - | - | - | 10,254 | - | 10,254 |
| Right-of-use asset | - | - | 19 | - | 11,988 | 168,355 | 18 | 75,419 | - | 255,799 |
| Deferred tax assets | - | 1,469 | - | - | - | 3 | 25,890 | 1,060,872 | - | 1,088,234 |
Total Non-Current Assets | - | 4,739 | 607,366 | - | 4,370,454 | 2,561,869 | 2,184,119 | 13,466,583 | - | 23,195,130 | |
| | | | | | | | | | | |
Total Assets | - | 164,076 | 1,320,606 | 4,016 | 4,927,739 | 2,995,151 | 2,699,359 | 17,665,437 | - | 29,776,384 | |
F-201
| | | | | | | | | | | |
| | 12-31-2020 | |||||||||
| LIABILITIES | UF | Chilean Peso | Dollar | Euro | Colombian Peso | Peruvian Sol | Argentine Peso | Brazilian Real | Other Currency | Total |
Current Liabilities | | | | | | | | | | | |
| Other current financial liabilities | 7,103 | - | 789,559 | - | 453,666 | 201,641 | 36 | 373,125 | - | 1,825,130 |
| Current lease liability | 19 | - | 20,470 | 17 | 4,792 | 10,434 | 78 | 15,685 | - | 51,495 |
| Trade and other current payables | - | 46,970 | 206,653 | 12,519 | 471,331 | 194,903 | 517,715 | 2,643,452 | 33 | 4,093,576 |
| Current accounts payable to related parties | - | 167,003 | 152,956 | 236,546 | 2,652 | 1,643 | 177 | 36,145 | - | 597,122 |
| Other current provisions | - | - | 44,308 | - | 40,176 | 12,931 | 45,167 | 77,843 | - | 220,425 |
| Current tax liabilities | - | - | - | - | 110,724 | 33,777 | 44,383 | 33,986 | - | 222,870 |
| Other current non-financial liabilities | - | 369 | 11,908 | - | 31,914 | 28,193 | 21,876 | 172,249 | 95 | 266,604 |
Total Current Liabilities | 7,122 | 214,342 | 1,225,854 | 249,082 | 1,115,255 | 483,522 | 629,432 | 3,352,485 | 128 | 7,277,222 | |
| | | | | | | | | | | |
Non-Current Liabilities | | | | | | | | | | | |
| Other non-current financial liabilities | 3,611 | - | 806,446 | - | 1,251,190 | 404,359 | - | 1,372,100 | - | 3,837,706 |
| Non-current lease liability | - | - | 25,668 | 386 | 15,639 | 13,816 | 45 | 35,516 | - | 91,070 |
| Trade and other non-current payables | - | - | 10,990 | - | 1,136 | 729 | 86,559 | 1,962,061 | - | 2,061,475 |
| Non-current accounts receivable from related parties | - | - | - | 144,391 | - | - | - | - | - | 144,391 |
| Other long-term provisions | - | - | - | - | 78,504 | 20,879 | 19,760 | 714,757 | - | 833,900 |
| Deferred tax liabilities | - | 2,521 | - | - | 208,618 | 74,847 | 286,936 | 40,031 | - | 612,953 |
| Non-current provisions for employee benefits | - | 2,960 | 1,906 | - | 124,248 | 4,299 | 13,920 | 1,476,884 | - | 1,624,217 |
| Other non-current non-financial liabilities | - | - | 31,600 | - | 19,707 | 5,132 | 30,294 | 30,228 | - | 116,961 |
Total Non-Current Liabilities | 3,611 | 5,481 | 876,610 | 144,777 | 1,699,042 | 524,061 | 437,514 | 5,631,577 | - | 9,322,673 | |
| | | | | | | | | | | |
Total Liabilities | 10,733 | 219,823 | 2,102,464 | 393,859 | 2,814,297 | 1,007,583 | 1,066,946 | 8,984,062 | 128 | 16,599,895 | |
| | | | | | | | | | | |
| | | | | | | | | | | |
| | 12-31-2019 | |||||||||
| LIABILITIES | UF | Chilean Peso | Dollar | Euro | Colombian Peso | Peruvian Sol | Argentine Peso | Brazilian Real | Other Currency | Total |
Current Liabilities | | | | | | | | | | | |
| Other current financial liabilities | 6,227 | 1 | 594,317 | - | 169,525 | 45,579 | 84 | 592,674 | - | 1,408,407 |
| Current lease liability | 11 | - | 33,751 | 5 | 6,004 | 15,455 | 7 | 26,411 | - | 81,644 |
| Trade and other current payables | - | 62,073 | 205,848 | 13,770 | 433,753 | 217,115 | 418,518 | 2,568,851 | 117 | 3,920,045 |
| Current accounts payable to related parties | - | 6,273 | 211,872 | 257,476 | 1,832 | 1,967 | 247 | 14,844 | - | 494,511 |
| Other current provisions | - | 561 | 45,458 | - | 38,297 | 11,934 | 44,825 | 144,973 | 4 | 286,052 |
| Current tax liabilities | - | - | - | - | 108,167 | 13,739 | 92,080 | 6,741 | - | 220,727 |
| Other current non-financial liabilities | - | 189 | 4,445 | - | 27,521 | 24,218 | 40,633 | 223,731 | 18 | 320,755 |
| Liabilities associated with disposal groups held for sale | - | - | - | - | 3,791 | - | - | - | - | 3,791 |
Total Current Liabilities | 6,238 | 69,097 | 1,095,691 | 271,251 | 788,890 | 330,007 | 596,394 | 3,578,225 | 139 | 6,735,932 | |
| | | | | | | | | | | |
Non-Current Liabilities | | | | | | | | | | | |
| Other non-current financial liabilities | 9,766 | - | 1,106,962 | - | 1,404,407 | 400,395 | - | 1,860,303 | - | 4,781,833 |
| Non-current lease liability | 8 | - | 18,317 | - | 6,190 | 25,300 | 7 | 58,803 | - | 108,625 |
| Trade and other non-current payables | - | - | 7 | - | 997 | 10,868 | 152,240 | 2,171,885 | - | 2,335,997 |
| Other long-term provisions | - | - | - | - | 49,659 | 54,775 | 23,710 | 848,183 | - | 976,327 |
| Deferred tax liabilities | - | - | - | - | 51,332 | 254,591 | 311,503 | 26,428 | - | 643,854 |
| Non-current provisions for employee benefits | - | 2,979 | - | - | 129,507 | 6,245 | 14,178 | 1,683,453 | - | 1,836,362 |
| Other non-current non-financial liabilities | - | - | 3,563 | - | 6,318 | 24,676 | 54,162 | 22,549 | - | 111,268 |
Total Non-Current Liabilities | 9,774 | 2,979 | 1,128,849 | - | 1,648,410 | 776,850 | 555,800 | 6,671,604 | - | 10,794,266 | |
| | | | | | | | | | | |
Total Liabilities | 16,012 | 72,076 | 2,224,540 | 271,251 | 2,437,300 | 1,106,857 | 1,152,194 | 10,249,829 | 139 | 17,530,198 | |
F-202
APPENDIX 2 ADDITIONAL INFORMATION OFFICIAL BULLETIN No. 715 OF FEBRUARY 3, 2012
This appendix is part of Note 10, “Trade and Other Receivables,” and forms an integral part of these consolidated financial statements.
| a) | Portfolio stratification |
- Trade and other receivables by maturity:
| | | | | | |
| 12-31-2020 | |||||
Trade and other current receivables | Up-to-date | 1 - 90 days in | 91 - 180 days in | More than 181 days in arrears | Total Current | Total Non- |
Trade receivables, gross | 2,135,722 | 580,640 | 124,262 | 852,428 | 3,693,052 | 354,376 |
Allowance for impairment | (19,775) | (25,636) | (31,925) | (607,172) | (684,508) | (65,015) |
Accounts receivable for financial leasing | 584 | - | - | - | 584 | 8,214 |
Allowance for impairment | (16) | - | - | - | (16) | (214) |
Other receivables, gross | 231,310 | - | - | - | 231,310 | 281,333 |
Allowance for impairment | (5,487) | - | - | - | (5,487) | (170) |
Total | 2,342,338 | 555,004 | 92,337 | 245,256 | 3,234,935 | 578,524 |
| | | | | | |
| 12-31-2019 | |||||
Trade and other current receivables | Up-to-date | 1 - 90 days in | 91 - 180 days in | More than 181 days in arrears | Total Current | Total Non- |
Trade receivables, gross | 1,634,722 | 569,852 | 121,125 | 893,346 | 3,219,045 | 122,428 |
Allowance for impairment | (6,115) | (18,035) | (25,674) | (592,763) | (642,587) | (22,552) |
Other receivables, gross | 1,024,368 | - | - | - | 1,024,368 | 494,790 |
Allowance for impairment | (96,369) | - | - | - | (96,369) | (6,709) |
Total | 2,556,606 | 551,817 | 95,451 | 300,583 | 3,504,457 | 587,957 |
- By type of portfolio:
| | | | | | | | | | | | |
| 12-31-2020 | 12-31-2019 | ||||||||||
Time in Arrears | Non-renegotiated portfolio | Renegotiated portfolio | Total Gross Portfolio | Non-renegotiated portfolio | Renegotiated portfolio | Total Gross Portfolio | ||||||
| Number of | Gross amount | Number of | Gross amount | Number of | Gross amount | Number of | Gross amount | Number of | Gross amount | Number of | Gross amount |
Up-to-date | 9,945,761 | 2,211,900 | 6,354,193 | 278,198 | 16,299,954 | 2,490,098 | 10,442,984 | 1,570,017 | 2,243,270 | 187,133 | 12,686,254 | 1,757,150 |
1 to 30 days | 9,176,101 | 314,733 | 659,102 | 24,711 | 9,835,203 | 339,444 | 10,554,688 | 367,028 | 274,004 | 19,590 | 10,828,692 | 386,618 |
31 to 60 days | 3,701,107 | 108,544 | 323,324 | 15,590 | 4,024,431 | 124,134 | 2,891,196 | 113,544 | 168,392 | 11,307 | 3,059,588 | 124,851 |
61 to 90 days | 2,534,180 | 106,748 | 202,523 | 10,314 | 2,736,703 | 117,062 | 1,646,411 | 47,895 | 145,445 | 10,488 | 1,791,856 | 58,383 |
91 to 120 days | 1,724,446 | 35,933 | 193,115 | 9,759 | 1,917,561 | 45,692 | 1,298,837 | 36,572 | 147,648 | 10,110 | 1,446,485 | 46,682 |
121 to 150 days | 1,523,287 | 33,667 | 177,697 | 9,147 | 1,700,984 | 42,814 | 1,071,803 | 29,595 | 126,358 | 8,851 | 1,198,161 | 38,446 |
151 to 180 days | 1,139,659 | 27,439 | 140,387 | 8,317 | 1,280,046 | 35,756 | 1,178,308 | 28,208 | 116,975 | 7,789 | 1,295,283 | 35,997 |
181 to 210 days | 775,377 | 58,020 | 132,352 | 6,387 | 907,729 | 64,407 | 844,830 | 53,458 | 109,466 | 7,522 | 954,296 | 60,980 |
211 to 250 days | 504,524 | 23,907 | 167,038 | 6,891 | 671,562 | 30,798 | 586,763 | 38,692 | 115,965 | 7,463 | 702,728 | 46,155 |
More than 251 days | 13,507,750 | 670,403 | 1,701,673 | 86,820 | 15,209,423 | 757,223 | 12,673,241 | 702,719 | 1,560,492 | 83,492 | 14,233,733 | 786,211 |
Total | 44,532,192 | 3,591,294 | 10,051,404 | 456,134 | 54,583,596 | 4,047,428 | 43,189,061 | 2,987,728 | 5,008,015 | 353,745 | 48,197,076 | 3,341,473 |
| b) | Portfolio in default and in legal collection process. |
| | | | | |
| | 2020 | 2019 | ||
Portfolio in Default and in Legal Collection Process | Number of | Amount | Number of | Amount | |
Notes receivable in default | | 1,218,370 | 252,488 | 907,062 | 111,016 |
Notes receivable in legal collection process (*) | | 13,661 | 54,986 | 9,399 | 44,329 |
Total | 1,232,031 | 307,474 | 916,461 | 155,345 | |
(*) | Legal collections are included in the portfolio in arrears. |
F-203
| c) | Provisions and write-offs |
| | |
Provisions and write-offs | 12-31-2020 | 12-31-2019 |
Provision for non-renegotiated portfolio | 204,419 | 107,628 |
Provision for renegotiated portfolio | 38,529 | 52,617 |
Recoveries | (576) | (995) |
Total | 242,372 | 159,250 |
| d) | Number and amount of operations |
| | | | |
| 12-31-2020 | 12-31-2019 | ||
Number and Amount of Transactions | Total detail by type of transaction Last | Total detail by type of operation Year-to- date | Total detail by type of transaction Last | Total detail by type of operation Year-to- date |
Allowance for impairment and recoveries: | | | | |
Number of transactions | 377,287 | 3,800,417 | 1,261,020 | 3,887,467 |
Amount of the transactions | 49,648 | 242,372 | 60,327 | 159,250 |
F-204
APPENDIX 2.1 SUPPLEMENTARY INFORMATION ON TRADE RECEIVABLES
This appendix is part of Note 10, “Trade and Other Receivables,” and forms an integral part of these consolidated financial statements.
a) | Portfolio stratification |
- Trade receivables by time in arrears:
| | | | | | | | | | | | | |
| 12-31-2020 | ||||||||||||
Trade receivables | Up-to-date | 1 - 30 days | 31 - 60 days | 61 - 90 days | 91 - 120 days | 121 - 150 days | 151 - 180 days | 181 - 210 days | 211 - 250 days | More than 251 | More than 365 | Total Current | Total Non- |
Trade receivables, Generation and Transmission | 570,481 | 20,280 | 886 | 43,848 | 49 | 1 | 79 | 2,325 | 288 | 3,042 | 2,665 | 643,944 | 29,555 |
- Large Clients | 76,662 | 20,098 | 863 | 3,946 | - | - | - | 2,065 | - | 2,968 | - | 106,602 | 29,536 |
- Institutional Clients | 55,544 | - | - | - | - | - | - | - | - | - | - | 55,544 | - |
- Other | 438,275 | 182 | 23 | 39,902 | 49 | 1 | 79 | 260 | 288 | 74 | 2,665 | 481,798 | 19 |
Allowance for impairment | (455) | (6) | (3) | - | (1) | - | - | (307) | - | (2,968) | (2,456) | (6,196) | (29,103) |
| | | | | | | | | | | | | |
Unbilled services | 514,703 | - | - | - | - | - | - | - | - | - | - | 514,703 | - |
Billed services | 55,778 | 20,280 | 886 | 43,848 | 49 | 1 | 79 | 2,325 | 288 | 3,042 | 2,665 | 129,241 | 29,555 |
| | | | | | | | | | | | | |
Trade receivables, Distribution | 1,565,241 | 319,164 | 123,248 | 73,214 | 45,643 | 42,813 | 35,677 | 62,082 | 30,510 | 91,245 | 660,271 | 3,049,108 | 324,821 |
- Mass-market Clients | 1,069,469 | 238,880 | 90,411 | 42,427 | 31,033 | 30,426 | 24,545 | 47,689 | 19,323 | 61,763 | 438,879 | 2,094,845 | 262,530 |
- Large Clients | 374,227 | 58,211 | 20,058 | 10,984 | 8,380 | 7,597 | 7,364 | 10,669 | 6,000 | 20,894 | 142,121 | 666,505 | 15,498 |
- Institutional Clients | 121,545 | 22,073 | 12,779 | 19,803 | 6,230 | 4,790 | 3,768 | 3,724 | 5,187 | 8,588 | 79,271 | 287,758 | 46,793 |
Allowance for impairment | (19,320) | (4,185) | (10,913) | (10,529) | (9,643) | (13,056) | (9,225) | (40,673) | (18,550) | (51,215) | (491,003) | (678,312) | (35,912) |
| | | | | | | | | | | | | |
Unbilled services | 506,230 | - | - | - | - | - | - | - | - | - | - | 506,230 | - |
Billed services | 1,059,011 | 319,164 | 123,248 | 73,214 | 45,643 | 42,813 | 35,677 | 62,082 | 30,510 | 91,245 | 660,271 | 2,542,878 | 324,821 |
| | | | | | | | | | | | | |
Total trade receivables, gross | 2,135,722 | 339,444 | 124,134 | 117,062 | 45,692 | 42,814 | 35,756 | 64,407 | 30,798 | 94,287 | 662,936 | 3,693,052 | 354,376 |
Total Allowance for impairment | (19,775) | (4,191) | (10,916) | (10,529) | (9,644) | (13,056) | (9,225) | (40,980) | (18,550) | (54,183) | (493,459) | (684,508) | (65,015) |
Total trade receivables, net | 2,115,947 | 335,253 | 113,218 | 106,533 | 36,048 | 29,758 | 26,531 | 23,427 | 12,248 | 40,104 | 169,477 | 3,008,544 | 289,361 |
| | | | | | | | | | | | | |
| | | | | | | | | | | | | |
| 12-31-2019 | ||||||||||||
Trade receivables | Up-to-date | 1 - 30 days | 31 - 60 days | 61 - 90 days | 91 - 120 days | 121 - 150 days | 151 - 180 days | 181 - 210 days | 211 - 250 days | More than 251 | More than 365 | Total Current | Total Non- |
Trade receivables, Generation and Transmission | 343,351 | 17,089 | 8,196 | 184 | 856 | 32 | 47 | 89 | 629 | 6,354 | 44,283 | 421,110 | 90 |
- Large Clients | 88,188 | 16,659 | 7,975 | 30 | 42 | 28 | 42 | - | 2 | 2,973 | 5 | 115,944 | 9 |
- Institutional Clients | 138,566 | - | - | - | - | - | - | - | - | - | - | 138,566 | - |
- Other | 116,597 | 430 | 221 | 154 | 814 | 4 | 5 | 89 | 627 | 3,381 | 44,278 | 166,600 | 81 |
Allowance for impairment | 5,124 | (16) | (178) | (30) | (42) | (28) | (39) | - | (2) | (2,973) | (11,586) | (9,770) | - |
| | | | | | | | | | | | | |
Unbilled services | 212,248 | - | - | - | - | - | - | - | - | - | - | 212,248 | - |
Billed services | 131,103 | 17,089 | 8,196 | 184 | 856 | 32 | 47 | 89 | 629 | 6,354 | 44,283 | 208,862 | 90 |
| | | | | | | | | | | | | |
Trade receivables, Distribution | 1,291,371 | 369,529 | 116,655 | 58,199 | 45,826 | 38,414 | 35,950 | 60,891 | 45,526 | 97,339 | 638,235 | 2,797,935 | 122,338 |
- Mass-market Clients | 721,018 | 258,671 | 87,270 | 39,214 | 31,694 | 25,209 | 25,146 | 47,492 | 31,098 | 63,599 | 451,530 | 1,781,941 | 34,580 |
- Large Clients | 415,100 | 76,194 | 16,643 | 8,992 | 7,701 | 5,947 | 4,194 | 7,462 | 5,329 | 18,712 | 118,248 | 684,522 | 15,956 |
- Institutional Clients | 155,253 | 34,664 | 12,742 | 9,993 | 6,431 | 7,258 | 6,610 | 5,937 | 9,099 | 15,028 | 68,457 | 331,472 | 71,802 |
Allowance for impairment | (11,239) | (3,769) | (7,136) | (6,906) | (7,310) | (8,266) | (9,989) | (40,989) | (25,358) | (54,280) | (457,575) | (632,817) | (22,552) |
| | | | | | | | | | | | | |
Unbilled services | 554,064 | - | - | - | - | - | - | - | - | - | - | 554,064 | - |
Billed services | 737,307 | 369,529 | 116,655 | 58,199 | 45,826 | 38,414 | 35,950 | 60,891 | 45,526 | 97,339 | 638,235 | 2,243,871 | 122,338 |
| | | | | | | | | | | | | |
Total trade receivables, gross | 1,634,722 | 386,618 | 124,851 | 58,383 | 46,682 | 38,446 | 35,997 | 60,980 | 46,155 | 103,693 | 682,518 | 3,219,045 | 122,428 |
Total Allowance for impairment | (6,115) | (3,785) | (7,314) | (6,936) | (7,352) | (8,294) | (10,028) | (40,989) | (25,360) | (57,253) | (469,161) | (642,587) | (22,552) |
Total trade receivables, net | 1,628,607 | 382,833 | 117,537 | 51,447 | 39,330 | 30,152 | 25,969 | 19,991 | 20,795 | 46,440 | 213,357 | 2,576,458 | 99,876 |
Since not all of our commercial databases in our Group’s different consolidated entities distinguish whether the final electricity service consumer is an individual or legal entity, the main management segmentation used by all consolidated entities to monitor and follow up on trade receivables is the following:
- Mass-market customers
- Large customers
- Institutional customers
F-205
- By type of portfolio:
| | | | | | | | | | | | | |
| 12-31-2020 | ||||||||||||
Type of Portfolio | Up-to-date | 1 - 30 days | 31 - 60 days | 61 - 90 days | 91 - 120 days | 121 - 150 days | 151 - 180 days | 181 - 210 days | 211 - 250 days | More than 251 | More than 365 | Total Current | Total Non- |
GENERATION AND TRANSMISSION | | | | | | | | | | | | | |
Non-renegotiated portfolio | 570,481 | 20,280 | 886 | 43,848 | 49 | 1 | 79 | 2,325 | 288 | 5,707 | - | 643,944 | 628 |
- Large Clients | 76,662 | 20,098 | 863 | 3,946 | - | - | - | 2,065 | - | 2,968 | - | 106,602 | - |
- Institutional Clients | 55,544 | - | - | - | - | - | - | - | - | - | - | 55,544 | - |
- Other | 438,275 | 182 | 23 | 39,902 | 49 | 1 | 79 | 260 | 288 | 2,739 | - | 481,798 | 628 |
Renegotiated portfolio | - | - | - | - | - | - | - | - | - | - | - | - | 28,927 |
- Large Clients | - | - | - | - | - | - | - | - | - | - | - | - | 28,927 |
- Institutional Clients | - | - | - | - | - | - | - | - | - | - | - | - | - |
- Other | - | - | - | - | - | - | - | - | - | - | - | - | - |
| | | | | | | | | | | | | |
DISTRIBUTION | | | | | | | | | | | | | |
Non-renegotiated portfolio | 1,444,504 | 294,453 | 107,658 | 62,900 | 35,884 | 33,666 | 27,360 | 55,695 | 23,619 | 664,696 | - | 2,750,435 | 196,287 |
- Mass-market Clients | 979,330 | 221,045 | 79,769 | 34,801 | 23,547 | 23,670 | 19,382 | 43,181 | 14,971 | 443,333 | - | 1,883,029 | 191,559 |
- Large Clients | 349,489 | 53,788 | 17,629 | 9,207 | 7,070 | 6,316 | 5,195 | 9,579 | 4,769 | 147,615 | - | 610,657 | 4,512 |
- Institutional Clients | 115,685 | 19,620 | 10,260 | 18,892 | 5,267 | 3,680 | 2,783 | 2,935 | 3,879 | 73,748 | - | 256,749 | 216 |
Renegotiated portfolio | 120,737 | 24,711 | 15,590 | 10,314 | 9,759 | 9,147 | 8,317 | 6,387 | 6,891 | 86,820 | - | 298,673 | 128,534 |
- Mass-market Clients | 90,140 | 17,835 | 10,642 | 7,626 | 7,484 | 6,755 | 5,164 | 4,508 | 4,353 | 57,309 | - | 211,816 | 99,922 |
- Large Clients | 24,737 | 4,423 | 2,429 | 1,777 | 1,311 | 1,282 | 2,169 | 1,090 | 1,230 | 15,400 | - | 55,848 | 8,561 |
- Institutional Clients | 5,860 | 2,453 | 2,519 | 911 | 964 | 1,110 | 984 | 789 | 1,308 | 14,111 | - | 31,009 | 20,051 |
| | | | | | | | | | | | | |
Total gross portfolio | 2,135,722 | 339,444 | 124,134 | 117,062 | 45,692 | 42,814 | 35,756 | 64,407 | 30,798 | 757,223 | - | 3,693,052 | 354,376 |
| | | | | | | | | | | | | |
| | | | | | | | | | | | | |
| | | | | | | | | | | | | |
| 12-31-2019 | ||||||||||||
Type of Portfolio | Up-to-date | 1 - 30 days | 31 - 60 days | 61 - 90 days | 91 - 120 days | 121 - 150 days | 151 - 180 days | 181 - 210 days | 211 - 250 days | More than 251 | More than 365 | Total Current | Total Non- |
GENERATION AND TRANSMISSION | | | | | | | | | | | | | |
Non-renegotiated portfolio | 291,263 | 17,089 | 8,196 | 184 | 856 | 32 | 47 | 89 | 629 | 50,592 | - | 368,977 | 82 |
- Large Clients | 88,188 | 16,659 | 7,975 | 30 | 42 | 28 | 41 | - | 2 | 2,978 | - | 115,943 | - |
- Institutional Clients | 96,283 | - | - | - | - | - | - | - | - | - | - | 96,283 | - |
- Other | 106,792 | 430 | 221 | 154 | 814 | 4 | 6 | 89 | 627 | 47,614 | - | 156,751 | 82 |
Renegotiated portfolio | 52,088 | - | - | - | - | - | - | - | - | 45 | - | 52,133 | 8 |
- Large Clients | - | - | - | - | - | - | - | - | - | - | - | - | 8 |
- Institutional Clients | 42,283 | - | - | - | - | - | - | - | - | - | - | 42,283 | - |
- Other | 9,805 | - | - | - | - | - | - | - | - | 45 | - | 9,850 | - |
| | | | | | | | | | | | | |
DISTRIBUTION | | | | | | | | | | | | | |
Non-renegotiated portfolio | 1,216,141 | 349,939 | 105,348 | 47,711 | 35,716 | 29,563 | 28,161 | 53,369 | 38,063 | 652,127 | - | 2,556,138 | 62,531 |
- Mass-market Clients | 676,406 | 244,837 | 78,862 | 32,485 | 25,178 | 19,480 | 19,818 | 42,643 | 26,041 | 460,446 | - | 1,626,196 | 9,309 |
- Large Clients | 402,342 | 73,848 | 15,150 | 7,146 | 5,982 | 4,874 | 3,200 | 6,532 | 4,586 | 124,871 | - | 648,531 | 8,111 |
- Institutional Clients | 137,393 | 31,254 | 11,336 | 8,080 | 4,556 | 5,209 | 5,143 | 4,194 | 7,436 | 66,810 | - | 281,411 | 45,111 |
Renegotiated portfolio | 75,230 | 19,590 | 11,307 | 10,488 | 10,110 | 8,851 | 7,789 | 7,522 | 7,463 | 83,447 | - | 241,797 | 59,807 |
- Mass-market Clients | 44,612 | 13,834 | 8,409 | 6,730 | 6,516 | 5,730 | 5,328 | 4,849 | 5,055 | 54,682 | - | 155,745 | 25,271 |
- Large Clients | 12,758 | 2,346 | 1,492 | 1,845 | 1,719 | 1,072 | 994 | 930 | 744 | 12,089 | - | 35,989 | 7,845 |
- Institutional Clients | 17,860 | 3,410 | 1,406 | 1,913 | 1,875 | 2,049 | 1,467 | 1,743 | 1,664 | 16,676 | - | 50,063 | 26,691 |
| | | | | | | | | | | | | |
Total gross portfolio | 1,634,722 | 386,618 | 124,851 | 58,383 | 46,682 | 38,446 | 35,997 | 60,980 | 46,155 | 786,211 | - | 3,219,045 | 122,428 |
F-206
APPENDIX 2.2 ESTIMATED SALES AND PURCHASES OF CAPACITY AND TOLL
This appendix forms an integral part of these consolidated financial statements.
| | | | | | | | | | | | | | | | | | | | |
Country | COLOMBIA | PERU | ARGENTINA | BRAZIL | TOTAL | |||||||||||||||
| 12-31-2020 | 12-31-2019 | 12-31-2020 | 12-31-2019 | 12-31-2020 | 12-31-2019 | 12-31-2020 | 12-31-2019 | 12-31-2020 | 12-31-2019 | ||||||||||
BALANCE | Energy and | Tolls | Energy and | Tolls | Energy and | Tolls | Energy and | Tolls | Energy and | Tolls | Energy and | Tolls | Energy and | Tolls | Energy and | Tolls | Energy and | Tolls | Energy and | Tolls |
Current accounts receivable from related parties | - | - | - | - | - | - | - | - | - | - | - | - | 31,286 | 19 | 2,452 | 15 | 31,286 | 19 | 2,452 | 15 |
Non-current accounts receivable from related parties | - | - | - | - | - | - | - | - | - | - | - | - | - | - | - | - | - | - | - | - |
Trade and other receivables, current | 139,254 | 11,961 | 131,740 | 8,820 | 61,975 | 12,240 | 62,526 | 12,538 | 77,421 | - | 110,830 | - | 745,630 | 3,952 | 475,319 | 6,531 | 1,024,280 | 28,153 | 780,415 | 27,889 |
Trade and other receivables, non-current | - | - | - | - | - | - | - | - | - | - | - | - | - | - | - | - | - | - | - | - |
Total Asset Estimate | 139,254 | 11,961 | 131,740 | 8,820 | 61,975 | 12,240 | 62,526 | 12,538 | 77,421 | - | 110,830 | - | 766,916 | 3,971 | 477,771 | 6,546 | 1,055,566 | 28,172 | 782,867 | 27,904 |
Current accounts payable to related parties | 677 | - | 763 | - | - | - | - | - | - | - | - | - | 33,351 | - | 12,957 | 519 | 34,028 | - | 13,720 | 519 |
Non-urrent accounts payable to related parties | - | - | - | - | - | - | - | - | - | - | - | - | - | - | - | - | - | - | - | - |
Trade and other payables, current | 30,139 | 12,246 | 43,633 | 13,176 | 52,233 | 9,763 | 37,502 | 11,837 | 38,689 | - | 55,194 | - | 1,120,722 | 59,673 | 697,292 | 159,478 | 1,241,783 | 81,682 | 833,621 | 184,491 |
Trade and other payables, non-current | - | - | - | - | - | - | - | - | - | - | - | - | - | - | - | - | - | - | - | - |
Total Liability Estimate | 30,816 | 12,246 | 44,396 | 13,176 | 52,233 | 9,763 | 37,502 | 11,837 | 38,689 | - | 55,194 | - | 1,154,073 | 59,673 | 710,249 | 159,997 | 1,275,811 | 81,682 | 847,341 | 185,010 |
| | | | | | | | | | | | | | | | | | | | |
| | | | | | | | | | | | | | | | | | | | |
Country | COLOMBIA | PERU | ARGENTINA | BRAZIL | TOTAL | |||||||||||||||
| 2020 | 2019 | 2020 | 2019 | 2020 | 2019 | 2020 | 2019 | 2020 | 2019 | ||||||||||
INCOME STATEMENT | Energy and | Tolls | Energy and | Tolls | Energy and | Tolls | Energy and | Tolls | Energy and | Tolls | Energy and | Tolls | Energy and | Tolls | Energy and | Tolls | Energy and | Tolls | Energy and | Tolls |
Energy sales | 129,017 | 11,081 | 131,876 | 8,830 | 64,115 | 12,663 | 62,137 | 12,459 | 75,346 | - | 121,961 | - | 782,533 | 4,193 | 487,525 | 6,814 | 1,051,011 | 27,937 | 803,499 | 28,103 |
Energy purchases | 28,552 | 11,345 | 44,440 | 13,189 | 54,038 | 10,100 | 37,269 | 11,763 | 38,686 | - | 55,194 | - | 1,167,029 | 60,048 | 727,249 | 163,126 | 1,288,305 | 81,493 | 864,152 | 188,078 |
F-207
APPENDIX 3 DETAIL OF DUE DATES OF PAYMENTS TO SUPPLIERS
This appendix is part of Note 24, “Current and Non-Current Payables,” and forms an integral part of the Group’s financial statements.
| | | | | | | | | | | | | | | | |
| | Balance as of | | Balance as of | ||||||||||||
| | 12-31-2020 | | 12-31-2019 | ||||||||||||
Suppliers with Payments Up-to-Date | | Goods | | Services | | Other | | Total | | Goods | | Services | | Other | | Total |
Up to 30 days | | 104,782 | | 469,913 | | 1,321,209 | | 1,895,904 | | 181,353 | | 424,827 | | 1,108,119 | | 1,714,299 |
From 31 to 60 days | | 52,007 | | 233,753 | | 96,755 | | 382,515 | | 51,522 | | 167,440 | | 83,664 | | 302,626 |
From 61 to 90 days | | 3,877 | | 30,449 | | 15,620 | | 49,946 | | 6,192 | | 24,320 | | 3,071 | | 33,583 |
From 91 to 120 days | | 373 | | 23,619 | | 124,617 | | 148,609 | | 1,088 | | 10,437 | | 3,375 | | 14,900 |
From 121 to 365 days | | 6,462 | | 16,912 | | 19,770 | | 43,144 | | 10,394 | | 5,528 | | 98,859 | | 114,781 |
More than 365 days | | - | | 3,075 | | 111,587 | | 114,662 | | - | | 4,318 | | 167,190 | | 171,508 |
Total | | 167,501 | | 777,721 | | 1,689,558 | | 2,634,780 | | 250,549 | | 636,870 | | 1,464,278 | | 2,351,697 |
| | | | | | | | | | | | | | | | |
| | | | | | | | | | | | | | | | |
| | Balance as of | | Balance as of | ||||||||||||
| | 12-31-2020 | | 12-31-2019 | ||||||||||||
Suppliers with Payments Up-to-Date | | Goods | | Services | | Other | | Total | | Goods | | Services | | Other | | Total |
Up to 30 days | | 908 | | 24,552 | | 17,040 | | 42,500 | | 2,209 | | 70,595 | | - | | 72,804 |
From 31 to 60 days | | - | | - | | 16,401 | | 16,401 | | - | | - | | - | | - |
From 61 to 90 days | | - | | - | | 18,485 | | 18,485 | | - | | - | | - | | - |
From 91 to 120 days | | - | | - | | 39,312 | | 39,312 | | - | | - | | - | | - |
From 121 to 365 days | | - | | - | | 152,921 | | 152,921 | | - | | - | | - | | - |
More than 365 days | | - | | - | | - | | - | | - | | 272 | | - | | 272 |
Total | | 908 | | 24,552 | | 244,159 | | 269,619 | | 2,209 | | 70,867 | | - | | 73,076 |
| | | | | | | | | | | | | | | | |
| | | | | | | | | | | | | | | | |
| | Balance as of | | Balance as of | ||||||||||||
| | 12-31-2020 | | 12-31-2019 | ||||||||||||
Suppliers with Payments Up-to-Date | | Goods | | Services | | Other | | Total | | Goods | | Services | | Other | | Total |
Energy suppliers | | 60,184 | | 56,933 | | 1,627,935 | | 1,745,052 | | 92,284 | | 59,014 | | 1,253,815 | | 1,405,113 |
Fuel and gas suppliers | | 17,410 | | 7,211 | | - | | 24,621 | | 19,102 | | 7,834 | | - | | 26,936 |
Asset acquisitions | | 12,693 | | 34,671 | | 12,958 | | 60,322 | | 16,670 | | 381 | | 10,868 | | 27,919 |
Payables due for goods and services | | 78,122 | | 703,458 | | 292,824 | | 1,074,404 | | 124,702 | | 640,508 | | 199,595 | | 964,805 |
Cuentas por pagar con CAMMESA EDESUR | | - | | - | | - | | - | | - | | - | | - | | - |
Total | | 168,409 | | 802,273 | | 1,933,717 | | 2,904,399 | | 252,758 | | 707,737 | | 1,464,278 | | 2,424,773 |
F-208