UNITED STATES
SECURITIES AND EXCHANGE COMMISSION
Washington, D.C. 20549
FORM 10-K
ANNUAL REPORT PURSUANT TO SECTION 13 OR 15(d)
OF THE SECURITIES EXCHANGE ACT OF 1934
For the fiscal year ended December 31, 2010
Commission file number 0-24159
MIDDLEBURG FINANCIAL CORPORATION
(Exact name of registrant as specified in its charter)
Virginia (State or other jurisdiction of incorporation or organization) | 54-1696103 (I.R.S. Employer Identification No.) |
111 West Washington Street Middleburg, Virginia (Address of principal executive offices) | 20117 (Zip Code) |
Registrant’s telephone number, including area code (703) 777-6327
Securities registered pursuant to Section 12(b) of the Act:
Title of each class | Name of each exchange on which registered |
| Common Stock, par value $2.50 per share | Nasdaq Stock Market |
Securities registered pursuant to Section 12(g) of the Act:
None
(Title of class)
Indicate by check mark if the registrant is a well-known seasoned issuer, as defined in Rule 405 of the Securities Act. Yes £ No R
Indicate by check mark if the registrant is not required to file reports pursuant to Section 13 or Section 15(d) of the Act. Yes £ No R
Indicate by check mark whether the registrant (1) has filed all reports required to be filed by Section 13 or 15(d) of the Securities Exchange Act of 1934 during the preceding 12 months (or for such shorter period that the registrant was required to file such reports), and (2) has been subject to such filing requirements for the past 90 days. Yes R No £
Indicate by check mark whether the registrant has submitted electronically and posted on its corporate web side, if any every interactive data file required toe be submitted and posted pursuant to Rule 405 of Regulation S-T(§232.405 of this chapter) during the preceding 12 months (or for such shorter period that the registrant was required to submit and post such files). Yes £ No £
Indicate by check mark if disclosure of delinquent filers pursuant to Item 405 of Regulation S-K is not contained herein, and will not be contained, to the best of registrant’s knowledge, in definitive proxy or information statements incorporated by reference in Part III of this Form 10-K or any amendment to this Form 10-K. £
Indicate by check mark whether the registrant is a large accelerated filer, an accelerated filer, a non-accelerated filer, or a smaller reporting company. See definitions of “large accelerated filer,” “accelerated filer” and “smaller reporting company” in Rule 12b-2 of the Exchange Act.
Large accelerated filer £ | Accelerated filer R | |
Non-accelerated filer £ (Do not check if a smaller reporting company) | Smaller reporting company £ |
Indicate by check mark whether the registrant is a shell company (as defined in Rule 12b-2 of the Act). Yes £ No R
State the aggregate market value of the voting and non-voting common equity held by non-affiliates computed by reference to the price at which the common equity was last sold, or the average bid and asked price of such common equity, as of the last business day of the registrant’s most recently completed second fiscal quarter. $96,183,296
Indicate the number of shares outstanding of each of the registrant’s classes of common stock, as of the latest practicable date. 6,925,437 shares of Common Stock as of February 28, 2011
DOCUMENTS INCORPORATED BY REFERENCE
Portions of the Proxy Statement for the 2011 Annual Meeting of Shareholders – Part III
| Page | |||
| PART I | |||
| BUSINESS | 3 | ||
| RISK FACTORS | 19 | ||
| UNRESOLVED STAFF COMMENTS | 26 | ||
| PROPERTIES | 26 | ||
| LEGAL PROCEEDINGS | 26 | ||
| REMOVED AND RESERVED | 26 | ||
| MARKET FOR REGISTRANT’S COMMON EQUITY, RELATED | |||
| STOCKHOLDER MATTERS AND ISSUER PURCHASES OF | |||
| EQUITY SECURITIES | 27 | ||
| SELECTED FINANCIAL DATA | 29 | ||
| MANAGEMENT’S DISCUSSION AND ANALYSIS OF FINANCIAL | |||
| CONDITION AND RESULTS OF OPERATIONS | 30 | ||
| QUANTITATIVE AND QUALITATIVE DISCLOSURES ABOUT | |||
| MARKET RISK | 59 | ||
| FINANCIAL STATEMENTS AND SUPPLEMENTARY DATA | 60 | ||
| CHANGES IN AND DISAGREEMENTS WITH ACCOUNTANTS | |||
| ON ACCOUNTING AND FINANCIAL DISCLOSURE | 60 | ||
| CONTROLS AND PROCEDURES | 60 | ||
| OTHER INFORMATION | 61 | ||
| DIRECTORS, EXECUTIVE OFFICERS AND CORPORATE | |||
| GOVERNANCE | 62 | ||
| EXECUTIVE COMPENSATION | 62 | ||
| SECURITY OWNERSHIP OF CERTAIN BENEFICIAL | |||
| OWNERS AND MANAGEMENT AND RELATED | |||
| STOCKHOLDER MATTERS | 62 | ||
| CERTAIN RELATIONSHIPS AND RELATED TRANSACTIONS, | |||
| AND DIRECTOR INDEPENDENCE | 62 | ||
| PRINCIPAL ACCOUNTING FEES AND SERVICES | 62 | ||
| EXHIBITS, FINANCIAL STATEMENT SCHEDULES | 62 | ||
ITEM 1. BUSINESS
General
Middleburg Financial Corporation (the “Company”) is a bank holding company that was incorporated under Virginia law in 1993. The Company conducts its primary operations through two wholly owned subsidiaries, Middleburg Bank and Middleburg Investment Group, Inc., both of which are chartered under Virginia law. The Company has one other wholly owned subsidiary, MFC Capital Trust II, which is a Delaware Business Trust that the Company formed in connection with the issuance of trust preferred debt in December 2003.
Middleburg Bank
Middleburg Bank opened for business on July 1, 1924 and has continuously offered banking products and services to surrounding communities since that date. Middleburg Bank has seven full service facilities and two limited service facilities. The main office is located at 111 West Washington Street, Middleburg, Virginia 20117. Middleburg Bank has two full service facilities and one limited service facility in Leesburg, Virginia. Other full service facilities are located in Ashburn, Gainesville, Purcellville, Reston, Warrenton, and Williamsburg, Virginia. Middleburg Bank has a limited service facility located in Marshall, Virginia.
Middleburg Bank serves the Virginia counties of Loudoun, Fairfax, Fauquier and western Prince William as well as the town of Williamsburg. Loudoun County is in northwestern Virginia and included in the Washington-Baltimore metropolitan statistical area. According to the U.S. Census Bureau, the county’s estimated population was approximately 312,311 as of January 1, 2011. The local economy is driven by service industries, including but not limited to, professional and technical services requiring a high skill level; federal, state and local government; construction; and retail trade. Fairfax County is in northern Virginia and is included in the Washington-Baltimore metropolitan statistical area. According to the latest data U.S. Census Bureau, the county’s population was 1,081,726 as of January 1, 2011. The local economy is driven by service industries and federal, state and local governments. Fauquier County is in northern Virginia and is included in the Washington-Baltimore metropolitan statistical area. Fauquier County’s estimated population on January 1, 2011 was 65,203 according the U.S. Census Bureau. The local economy is driven by service industries and agriculture. Prince William County is in northern Virginia and is included in the Washington-Baltimore metropolitan statistical area. Prince William County’s estimated population on January 1, 2011 was 402,002 according the U.S. Census Bureau. Williamsburg is in the Tidewater region of Virginia and has an estimated population of 12,729 according to U.S. Census Bureau.
Middleburg Bank has one wholly owned subsidiary, Middleburg Bank Service Corporation. Middleburg Bank Service Corporation is a partner in two limited liability companies, Bankers Title Shenandoah, LLC, which sells title insurance through its members, and Bankers Insurance, LLC, which acts as a broker for insurance sales for its member banks. In the first quarter of 2008, Middleburg Bank Service Corporation was a partner in Bank Investment Group, LLC. In April 2008, Bankers Investment Group was acquired by Infinex Financial Group. As part of the acquisition, Middleburg Bank Service Corporation received an ownership interest in Infinex Financial Group. Infinex Financial Group acts as a broker-dealer for sales of investment products to clients of its member banks.
Middleburg Bank owns 57.1% of the issued and outstanding membership interest units of Southern Trust Mortgage, LLC. The remaining 42.9% of issued and outstanding membership interest units are owned by other partners. The ownership of these partners is represented in the financial statements as “Minority Interest in Consolidated Subsidiary.” Southern Trust Mortgage is a regional mortgage lender headquartered in Virginia Beach, Virginia and has offices in Virginia, Maryland, Georgia, North Carolina and South Carolina.
Middleburg Investment Group
Middleburg Investment Group is a non-bank holding company that was formed in the fourth quarter of 2005. It has one wholly-owned subsidiary, Middleburg Trust Company which in turn wholly owns Middleburg Investment Advisors, Inc.
Middleburg Trust Company is chartered under Virginia law and opened for business in January 1994. Its main office is located at 821 East Main Street, Richmond, Virginia, 23219. Middleburg Trust Company serves primarily the greater Richmond area including the counties of Henrico, Chesterfield, Hanover, Goochland and Powhatan. Richmond is the capital of the Commonwealth of Virginia, and the greater Richmond area had an estimated population in excess of 1.2 million in 2008 based on the 2000 U.S. Census. In 2008, Middleburg Trust Company opened a new office in Williamsburg, Virginia. According to the 2000 U.S. Census, Williamsburg and the surrounding counties had an estimated population of 135,000 in 2008. Middleburg Trust Company also serves the counties of Fairfax, Fauquier and Loudoun with staff available to several of Middleburg Bank’s facilities.
Middleburg Investment Advisors, Inc. is an investment advisor registered with the Securities and Exchange Commission (the “SEC”). Its main office is located at 1901 North Beauregard Street, Alexandria, Virginia, 22311. Middleburg Investment Advisors primarily serves the District of Columbia metropolitan area including contingent markets in Virginia and Maryland but also has clients in 24 other states.
Prior to December of 2009, Middleburg Investment Advisors, Inc. was a wholly owned subsidiary of Middleburg Investment Group. In December of 2009, Middleburg Investment Group transferred its ownership in Middleburg Investment Advisors to Middleburg Trust Company and on January 3, 2011, Middleburg Investment Advisors became a wholly owned subsidiary of Middleburg Trust Company.
Products and Services
The Company, through its subsidiaries, offers a wide range of banking, fiduciary and investment management services to both individuals and small businesses. Middleburg Bank’s services include various types of checking and savings deposit accounts, and the making of business, real estate, development, mortgage, home equity, automobile and other installment, demand and term loans. Also, Middleburg Bank offers ATMs at eight facilities and at two offsite locations. Additional banking services available to the Company’s clients include, but are not limited to, internet banking, travelers’ checks, money orders, safe deposit rentals, collections, notary public and wire services. Southern Trust Mortgage offers mortgage banking services to residential borrowers in six states within the southeastern United States. Southern Trust Mortgage operates as Middleburg Mortgage within all of the Company’s financial service centers to provide mortgage banking services for the Company’s clients.
Middleburg Investment Group offers wealth management services through its two subsidiaries and through the investment services department of Middleburg Bank. Middleburg Trust Company provides a variety of investment management and fiduciary services including trust and estate settlement. Middleburg Trust Company can also serve as escrow agent, attorney-in-fact, and guardian of property or trustee of an IRA. Middleburg Investment Advisors provides fee based investment management services for the Company’s clients. The investment services department of Middleburg Bank provides investment brokerage services for the Company’s clients.
Employees
As of December 31, 2010, the Company and its subsidiaries had a total of 350 full time equivalent employees, including 183 employees at Southern Trust Mortgage. The Company considers relations with its employees to be excellent. The Company’s employees are not represented by a collective bargaining unit.
U.S. Securities and Exchange Commission Filings
The Company maintains an internet website at www.middleburgbank.com. Shareholders of the Company and the public may access the Company’s periodic and current reports (including annual reports on Form 10-K, quarterly reports on Form 10-Q and current reports on Form 8-K, and any amendments to those reports) filed with or furnished to the SEC pursuant to Section 13(a) or 15(d) of the Securities Exchange Act of 1934, as amended, through the “Shareholder Relations” section of the Company’s website. The reports are made available on this website as soon as practicable following the filing of the reports with the SEC. The information is free of charge and may be reviewed, downloaded and printed from the website at any time.
Segment Reporting
The Company operates in a decentralized fashion in three principal business activities: commercial and retail banking services; wealth management services; and mortgage banking services. Revenue from commercial and retail banking activities consists primarily of interest earned on loans and investment securities and service charges on deposit accounts.
Revenue from the wealth management activities is comprised mostly of fees based upon the market value of the accounts under administration as well as commissions on investment transactions. The wealth management services are conducted by Middleburg Trust Company, Middleburg Investment Advisors, Inc. and the investment services department of Middleburg Bank.
Revenue from the mortgage banking activities is comprised of interest earned on loans and fees received as a result of the mortgage origination process. The Company recognizes gains on the sale of mortgages as part of Other Income. The mortgage banking services are conducted by Southern Trust Mortgage.
Middleburg Bank and the Company have assets in custody with Middleburg Trust Company and accordingly pay Middleburg Trust Company a monthly fee. Middleburg Bank also pays interest to Middleburg Trust Company, Middleburg Investment Advisors and Southern Trust Mortgage on deposit accounts that each company has at Middleburg Bank. Southern Trust Mortgage has an outstanding line of credit for which it pays interest to Middleburg Bank. Middleburg Bank provides office space and data processing services to Southern Trust Mortgage for which it receives rental and fee income. Middleburg Investment Advisors pays the Company a management fee each month for accounting and other services provided. Transactions related to these relationships are eliminated to reach consolidated totals.
The following tables present segment information for the years ended December 31, 2010 , 2009 and 2008.
| 2010 | ||||||||||||||||||||
| Commercial & | ||||||||||||||||||||
| Retail | Wealth | Mortgage | Intercompany | |||||||||||||||||
| Banking | Management | Banking | Eliminations | Consolidated | ||||||||||||||||
| Revenues: | (In Thousands) | |||||||||||||||||||
| Interest income | $ | 47,098 | $ | 9 | $ | 2,315 | $ | (1,391 | ) | $ | 48,031 | |||||||||
| Wealth management fees | - | 4,060 | - | (103 | ) | 3,957 | ||||||||||||||
| Other income | 2,703 | - | 19,354 | (11 | ) | 22,046 | ||||||||||||||
| Total operating income | 49,801 | 4,069 | 21,669 | (1,505 | ) | 74,034 | ||||||||||||||
| Expenses: | ||||||||||||||||||||
| Interest expense | 13,783 | - | 1,782 | (1,390 | ) | 14,175 | ||||||||||||||
| Salaries and employee benefits | 12,887 | 2,866 | 13,841 | - | 29,594 | |||||||||||||||
| Provision for loan losses | 11,122 | - | 883 | - | 12,005 | |||||||||||||||
| Other expense | 17,589 | 1,356 | 4,318 | (115 | ) | 23,148 | ||||||||||||||
| Total operating expenses | 55,381 | 4,222 | 20,824 | (1,505 | ) | 78,922 | ||||||||||||||
| Income (loss) before income taxes | ||||||||||||||||||||
| and non-controlling interest | (5,580 | ) | (153 | ) | 845 | - | (4,888 | ) | ||||||||||||
| Income tax expense (benefit) | (2,575 | ) | 13 | - | - | (2,562 | ) | |||||||||||||
| Net income (loss) | (3,005 | ) | (166 | ) | 845 | - | (2,326 | ) | ||||||||||||
| Non-controlling interest in | ||||||||||||||||||||
| consolidated subsidiary | - | - | (362 | ) | - | (362 | ) | |||||||||||||
| Net income (loss) attributable to | ||||||||||||||||||||
| Middleburg Financial | ||||||||||||||||||||
| Corporation | $ | (3,005 | ) | $ | (166 | ) | $ | 483 | $ | - | $ | (2,688 | ) | |||||||
| Total assets | $ | 1,081,231 | $ | 5,931 | $ | 70,512 | $ | (53,107 | ) | $ | 1,104,567 | |||||||||
| Capital expenditures | 852 | - | 87 | 939 | ||||||||||||||||
| Goodwill and other intangibles | - | 4,493 | 1,867 | - | 6,360 | |||||||||||||||
| 2009 | ||||||||||||||||||||
| Commercial & | ||||||||||||||||||||
| Retail | Wealth | Mortgage | Intercompany | |||||||||||||||||
| Banking | Management | Banking | Eliminations | Consolidated | ||||||||||||||||
| Revenues: | (In Thousands) | |||||||||||||||||||
| Interest income | $ | 49,143 | $ | 8 | $ | 8,855 | $ | (1,260 | ) | $ | 56,746 | |||||||||
| Wealth management fees | - | 3,873 | - | (76 | ) | 3,797 | ||||||||||||||
| Other income | 3,965 | - | 13,228 | (78 | ) | 17,115 | ||||||||||||||
| Total operating income | 53,108 | 3,881 | 22,083 | (1,414 | ) | 77,658 | ||||||||||||||
| Expenses: | ||||||||||||||||||||
| Interest expense | 18,495 | - | 1,846 | (1,259 | ) | 19,082 | ||||||||||||||
| Salaries and employee benefits | 12,559 | 2,895 | 12,560 | 28 | 28,042 | |||||||||||||||
| Provision for loan losses | 4,564 | - | (13 | ) | - | 4,551 | ||||||||||||||
| Other expense | 15,492 | 1,500 | 4,011 | (183 | ) | 20,820 | ||||||||||||||
| Total operating expenses | 51,110 | 4,395 | 18,404 | (1,414 | ) | 72,495 | ||||||||||||||
| Income (loss) before income taxes | ||||||||||||||||||||
| and non-controlling interest | 1,998 | (514 | ) | 3,679 | - | 5,163 | ||||||||||||||
| Income tax expense (benefit) | 255 | (191 | ) | - | - | 64 | ||||||||||||||
| Net income (loss) | 1,743 | (323 | ) | 3,679 | - | 5,099 | ||||||||||||||
| Non-controlling interest in | ||||||||||||||||||||
| consolidated subsidiary | - | - | (1,577 | ) | - | (1,577 | ) | |||||||||||||
| Net income (loss) attributable to | ||||||||||||||||||||
| Middleburg Financial | ||||||||||||||||||||
| Corporation | $ | 1,743 | $ | (323 | ) | $ | 2,102 | $ | - | $ | 3,522 | |||||||||
| Total assets | $ | 966,004 | $ | 6,293 | $ | 56,978 | $ | (52,901 | ) | $ | 976,374 | |||||||||
| Capital expenditures | 1,922 | 11 | 46 | - | 1,979 | |||||||||||||||
| Goodwill and other intangibles | - | 4,664 | 1,867 | - | 6,531 | |||||||||||||||
| 2008 | ||||||||||||||||||||
| Commercial & | ||||||||||||||||||||
| Retail | Wealth | Mortgage | Intercompany | |||||||||||||||||
| Banking | Management | Banking | Eliminations | Consolidated | ||||||||||||||||
| (In Thousands) | ||||||||||||||||||||
| Revenues: | ||||||||||||||||||||
| Interest income | $ | 50,103 | $ | 29 | $ | 5,990 | $ | (200 | ) | $ | 55,922 | |||||||||
| Wealth management fees | - | 4,253 | - | (83 | ) | 4,170 | ||||||||||||||
| Other income | 2,357 | 95 | 10,412 | (130 | ) | 12,734 | ||||||||||||||
| Total operating income | 52,460 | 4,377 | 16,402 | (413 | ) | 72,826 | ||||||||||||||
| Expenses: | ||||||||||||||||||||
| Interest expense | 21,128 | - | 1,791 | (200 | ) | 22,719 | ||||||||||||||
| Salaries and employee benefits | 12,065 | 2,795 | 10,516 | - | 25,376 | |||||||||||||||
| Provision for loan losses | 3,621 | - | 1,640 | - | 5,261 | |||||||||||||||
| Other expense | 11,644 | 1,560 | 4,232 | (213 | ) | 17,223 | ||||||||||||||
| Total operating expenses | 48,458 | 4,355 | 18,179 | (413 | ) | 70,579 | ||||||||||||||
| Income (loss) before income taxes | ||||||||||||||||||||
| and non-controlling interest | 4,002 | 22 | (1,777 | ) | - | 2,247 | ||||||||||||||
| Income tax expense | 362 | 82 | - | - | 444 | |||||||||||||||
| Net income (loss) | 3,640 | (60 | ) | (1,777 | ) | - | 1,803 | |||||||||||||
| Non-controlling interest in | ||||||||||||||||||||
| consolidated subsidiary | - | - | - | 757 | 757 | |||||||||||||||
| Net income (loss) attributable to | ||||||||||||||||||||
| Middleburg Financial | ||||||||||||||||||||
| Corporation | $ | 3,640 | $ | (60 | ) | $ | (1,777 | ) | $ | 757 | $ | 2,560 | ||||||||
| Total assets | $ | 933,652 | $ | 6,514 | $ | 51,709 | $ | (6,684 | ) | $ | 985,191 | |||||||||
| Capital expenditures | 3,162 | 282 | 275 | - | 3,719 | |||||||||||||||
| Goodwill and other intangibles | - | 4,877 | 1,867 | - | 6,744 | |||||||||||||||
Competition
The Company’s commercial and retail banking segment faces significant competition for both loans and deposits. Competition for loans comes from commercial banks, savings and loan associations and savings banks, mortgage banking subsidiaries of regional commercial banks, subsidiaries of national mortgage bankers, insurance companies, and other institutional lenders. Its most direct competition for deposits has historically come from commercial banks, credit unions, savings banks, savings and loan associations and other financial institutions. Based upon total deposits at June 30, 2010, as reported to the Federal Deposit Insurance Corporation (the “FDIC”), the Company has the largest share of deposits among banking organizations operating in Loudoun County, Virginia, with 18.33% of the $4 billion in deposits in the County. The Company’s Reston location, as of the latest FDIC report, has 1.81% of the $2.7 billion in deposits in the market. The Company’s market share among banking organizations operating in Fauquier County, as of the latest FDIC report, is 5.85% of the nearly $1.3 billion in deposits. The Company also faces competition for deposits from short-term money market mutual funds and other corporate and government securities funds.
The Company’s wealth management segment faces competition on several fronts. Middleburg Trust Company competes for clients and accounts with banks, other financial institutions and money managers. Even though many of these institutions have been engaged in the trust or investment management business for a considerably longer period of time than Middleburg Trust Company and have significantly greater resources, Middleburg Trust Company has grown through its commitment to quality trust and investment management services and a local community approach to business. Middleburg Investment Advisors competes for its clients and accounts with other money managers and investment brokerage firms. Like the rest of the Company, Middleburg Investment Advisors is dedicated to quality service and high investment performance for its clients. Middleburg Investment Advisors has successfully operated in its markets for 30 years. The investment services department of Middleburg Bank competes with local and on-line investment brokerage firms.
Competition for the Company’s mortgage banking segment, Southern Trust Mortgage is largely from other mortgage banking entities. Traditional financial institutions, investment banking companies and internet sources for mortgages also add to the competitive market for mortgages.
Lending Activities
Credit Policies
The principal risk associated with each of the categories of loans in Middleburg Bank’s portfolio is the creditworthiness of its borrowers. Within each category, such risk is increased or decreased, depending on prevailing economic conditions. In an effort to manage the risk, Middleburg Bank’s loan policy gives loan amount approval limits to individual loan officers based on their position and level of experience. The risk associated with real estate mortgage loans, commercial and consumer loans varies, based on market employment levels, consumer confidence, fluctuations in the value of real estate and other conditions that affect the ability of borrowers to repay indebtedness. The risk associated with real estate construction loans varies, based on the supply and demand for the type of real estate under construction.
Middleburg Bank has written policies and procedures to help manage credit risk. Middleburg Bank utilizes an outside third party loan review process that includes regular portfolio reviews to establish loss exposure and to ascertain compliance with Middleburg Bank’s loan policy.
Middleburg Bank has three levels of lending authority. Individual loan officers are the first level and are limited to their lending authority. The second level is the Officers Loan Committee, which is composed of four officers of Middleburg Bank, including the Company’s Chairman, the President and Chief Executive Officer, and the Senior Lending Officer. The Officers Loan Committee approves loans that exceed the individual loan officers’ lending authority and reviews loans to be presented to the Directors Loan Committee. The Directors Loan Committee is composed of seven Directors, of which five are independent Directors. The Directors Loan Committee approves new, modified and renewed credits that exceed Officer Loan Committee authorities. The Chairman of the Directors Loan Committee is the Chairman of the Company. A quorum is reached when four committee members are present, of which at least three must be independent Directors. An application requires four votes to receive approval by this committee. In addition, the Directors Loan Committee reports all new loans reviewed and approved to Middleburg Bank’s Board of Directors monthly. Monthly reports shared with the Directors Loan Committee include names and monetary amounts of all new credits in excess of $12,500 or which had been extended; a watch list including names, monetary amounts, risk rating and payment status; non accruals and charge offs as recommended and a list of overdrafts in excess of $1,500 and which have been overdrawn more than four days. The Directors Loan Committee also reviews lending policies proposed by management.
In the normal course of business, Middleburg Bank makes various commitments and incurs certain contingent liabilities which are disclosed but not reflected in its annual financial statements including commitments to extend credit. At December 31, 2010, commitments to extend credit totaled $83.3 million.
Construction Lending
Middleburg Bank makes local construction loans, primarily residential, and land acquisition and development loans. The construction loans are primarily secured by residential houses under construction and the underlying land for which the loan was obtained. At December 31, 2010, construction, land and land development loans outstanding were $74.7 million, or 11.3%, of total loans. Approximately 73.6% of these loans are concentrated in the Loudoun, Fairfax and Fauquier County, Virginia markets. The average life of a construction loan is approximately 12 months and will reprice monthly to meet the market, typically the prime interest rate plus one percent. Because the interest rate charged on these loans floats with the market, the
construction loans help the Company in managing its interest rate risk. Construction lending entails significant additional risks, compared with residential mortgage lending. Construction loans often involve larger loan balances concentrated with single borrowers or groups of related borrowers. Another risk involved in construction lending is attributable to the fact that loan funds are advanced upon the security of the land or home under construction, which value is estimated prior to the completion of construction. Thus, it is more difficult to evaluate accurately the total loan funds required to complete a project and related loan-to-value ratios. To mitigate the risks associated with construction lending, Middleburg Bank generally limits loan amounts to 75% to 85% of appraised value, in addition to analyzing the creditworthiness of its borrowers. Middleburg Bank also obtains a first lien on the property as security for its construction loans and typically requires personal guarantees from the borrowing entity’s principal owners.
Commercial Business Loans
Commercial business loans generally have a higher degree of risk than residential mortgage loans, but have higher yields. To manage these risks, Middleburg Bank generally obtains appropriate collateral and personal guarantees from the borrowing entity’s principal owners and monitors the financial condition of its business borrowers. Residential mortgage loans generally are made on the basis of the borrower’s ability to make repayment from his employment and other income and are secured by real estate whose value tends to be readily ascertainable. In contrast, commercial business loans typically are made on the basis of the borrower’s ability to make repayment from cash flow from its business and are secured by business assets, such as commercial real estate, accounts receivable, equipment and inventory. As a result, the availability of funds for the repayment of commercial business loans is substantially dependent on the success of the business itself. Furthermore, the collateral for commercial business loans may depreciate over time and generally cannot be appraised with as much precision as residential real estate. Middleburg Bank has an outside third party loan review and monitoring process to regularly assess the repayment ability of commercial borrowers. At December 31, 2010, commercial loans totaled $56.4 million, or 8.6% of total loans.
Commercial Real Estate Lending
Commercial real estate loans are secured by various types of commercial real estate in Middleburg Bank’s market area, including multi-family residential buildings, commercial buildings and offices, small shopping centers and churches. At December 31, 2010, commercial real estate loans aggregated $257.1 million, or 39.1%, of Middleburg Bank’s total loans.
In its underwriting of commercial real estate, Middleburg Bank may lend, under internal policy, up to 80% of the secured property’s appraised value. Commercial real estate lending entails significant additional risk, compared with residential mortgage lending. Commercial real estate loans typically involve larger loan balances concentrated with single borrowers or groups of related borrowers. Additionally, the payment experience on loans secured by income producing properties is typically dependent on the successful operation of a business or a real estate project and thus may be subject, to a greater extent, to adverse conditions in the real estate market or in the economy generally. Middleburg Bank’s commercial real estate loan underwriting criteria require an examination of debt service coverage ratios and the borrower’s creditworthiness, prior credit history and reputation. Middleburg Bank also evaluates the location of the security property and typically requires personal guarantees or endorsements of the borrowing entity’s principal owners.
One-to-Four-Family Residential Real Estate Lending
Residential lending activity may be generated by Middleburg Bank’s loan originator solicitation, referrals by real estate professionals, existing or new bank clients and purchases of whole loans from Southern Trust Mortgage. Loan applications are taken by a Bank loan officer. As part of the application process, information is gathered concerning income, employment and credit history of the applicant. Loan originations are underwritten using Middleburg Bank’s underwriting guidelines. Security for the majority of Middleburg Bank’s residential lending is in the form of owner occupied one-to-four-family dwellings. The valuation of
residential collateral is provided by independent fee appraisers who have been approved by Middleburg Bank’s Board of Directors.
Middleburg Bank also originates a non-conforming adjustable rate product (“ARM”) with a higher entry level rate and margin than that of the conforming adjustable rate products. This non-conforming loan provides yet another outlet for loans not meeting secondary market guidelines. Middleburg Bank keeps these loans in its loan portfolio. Interest rates on ARM products offered by Middleburg Bank are tied to fixed rates issued by the Federal Home Loan Bank of Atlanta plus a spread. Middleburg Bank’s ARM products contain interest rate caps at adjustment periods and rate ceilings based on a cap over and above the original interest rate.
At December 31, 2010, $242.6 million, or 36.8%, of Middleburg Bank’s loan portfolio consisted of one-to four-family residential real estate loans and home equity lines. Of the $242.6 million, $160.3 million were fixed rate mortgages while the remaining $82.3 million were adjustable rate mortgages. The fixed rate loans are typically 3, 5, 7 or 10 year balloon loans amortized over a 30 year period. Middleburg Bank has about $67.6 million in fixed rate loans that have maturities of 15 years or greater. Approximately $93.6 million of fixed rate loans have maturities of 5 years or less.
In connection with residential real estate loans, Middleburg Bank requires title insurance, hazard insurance and if required, flood insurance. Flood determination letters with life of loan tracking are obtained on all federally related transactions with improvements serving as security for the transaction.
Consumer Lending
Middleburg Bank offers various secured and unsecured consumer loans, including unsecured personal loans and lines of credit, automobile loans, deposit account loans, installment and demand loans. At December 31, 2010, Middleburg Bank had consumer loans of $12.4 million or 1.9% of gross loans. Such loans are generally made to customers with whom Middleburg Bank has a pre-existing relationship. Middleburg Bank currently originates all of its consumer loans in its geographic market area. Most of the consumer loans are tied to the prime lending rate and reprice monthly.
Consumer loans may entail greater risk than residential mortgage loans, particularly in the case of consumer loans which are unsecured, such as lines of credit, or secured by rapidly depreciable assets such as automobiles. In such cases, any repossessed collateral for a defaulted consumer loan may not provide an adequate source of repayment of the outstanding loan balance as a result of the greater likelihood of damage, loss or depreciation. The remaining deficiency often does not warrant further substantial collection efforts against the borrower. In addition, consumer loan collections are dependent on the borrower’s continuing financial stability, and thus are more likely to be adversely affected by job loss, divorce, illness or personal bankruptcy. Furthermore, the application of various federal and state laws, including federal and state bankruptcy and insolvency laws, may limit the amount which can be recovered on such loans. Such loans may also give rise to claims and defenses by a consumer borrower against an assignee of collateral securing the loan such as Middleburg Bank, and a borrower may be able to assert against such assignee claims and defenses which it has against the seller of the underlying collateral. Consumer loan delinquencies often increase over time as the loans age.
The underwriting standards employed by Middleburg Bank for consumer loans include a determination of the applicant’s payment history on other debts and an assessment of ability to meet existing obligations and payments on the proposed loan. The stability of the applicant’s monthly income may be determined by verification of gross monthly income from primary employment, and additionally from any verifiable secondary income. Although creditworthiness of the applicant is of primary consideration, the underwriting process also includes an analysis of the value of the security in relation to the proposed loan amount.
Supervision and Regulation
General
As a bank holding company, the Company is subject to regulation under the Bank Holding Company Act of 1956, as amended, and the examination and reporting requirements of the Board of Governors of the Federal Reserve System. As a state-chartered commercial bank, Middleburg Bank is subject to regulation, supervision and examination by the Virginia State Corporation Commission’s Bureau of Financial Institutions. It is also subject to regulation, supervision and examination by the Federal Reserve Board. Other federal and state laws, including various consumer and compliance laws, govern the activities of Middleburg Bank, the investments that it makes and the aggregate amount of loans that it may grant to one borrower.
The following description summarizes the significant federal and state laws applicable to the Company and its subsidiaries. To the extent that statutory or regulatory provisions are described, the description is qualified in its entirety by reference to that particular statutory or regulatory provision.
The Bank Holding Company Act
Under the Bank Holding Company Act, the Company is subject to periodic examination by the Federal Reserve and required to file periodic reports regarding its operations and any additional information that the Federal Reserve may require. Activities at the bank holding company level are limited to:
| · | banking, managing or controlling banks; |
| · | furnishing services to or performing services for its subsidiaries; and |
| · | engaging in other activities that the Federal Reserve has determined by regulation or order to be so closely related to banking as to be a proper incident to these activities. |
Some of the activities that the Federal Reserve Board has determined by regulation to be proper incidents to the business of a bank holding company include making or servicing loans and specific types of leases, performing specific data processing services and acting in some circumstances as a fiduciary or investment or financial adviser.
With some limited exceptions, the Bank Holding Company Act requires every bank holding company to obtain the prior approval of the Federal Reserve before:
| · | acquiring substantially all the assets of any bank; |
| · | acquiring direct or indirect ownership or control of any voting shares of any bank if after such acquisition it would own or control more than 5% of the voting shares of such bank (unless it already owns or controls the majority of such shares); or |
| · | merging or consolidating with another bank holding company. |
In addition, and subject to some exceptions, the Bank Holding Company Act and the Change in Bank Control Act, together with their regulations, require Federal Reserve approval prior to any person or company acquiring “control” of a bank holding company. Control is conclusively presumed to exist if an individual or company acquires 25% or more of any class of voting securities of a bank holding company. Control is rebuttably presumed to exist if a person acquires 10% or more, but less than 25%, of any class of voting securities and either has registered securities under Section 12 of the Securities Exchange Act of 1934 (the “Exchange Act”) or no other person owns a greater percentage of that class of voting securities immediately after the transaction. The regulations provide a procedure for challenging this rebuttable control presumption.
In November 1999, Congress enacted the Gramm-Leach-Bliley Act (the “GLBA”), which made substantial revisions to the statutory restrictions separating banking activities from other financial activities. Under the GLBA, bank holding companies that are well-capitalized and well-managed and meet other conditions can elect to become “financial holding companies.” As financial holding companies, they and their
subsidiaries are permitted to acquire or engage in previously impermissible activities such as insurance underwriting, securities underwriting and distribution, travel agency activities, insurance agency activities, merchant banking and other activities that the Federal Reserve determines to be financial in nature or complementary to these activities. Financial holding companies continue to be subject to the overall oversight and supervision of the Federal Reserve, but the GLBA applies the concept of functional regulation to the activities conducted by subsidiaries. For example, insurance activities would be subject to supervision and regulation by state insurance authorities. Although the Company has not elected to become a financial holding company in order to exercise the broader activity powers provided by the GLBA, the Company may elect do so in the future.
Payment of Dividends
The Company is a legal entity separate and distinct from its banking and non-banking subsidiaries. The majority of the Company’s revenues are from dividends paid to the Company by its subsidiaries. Middleburg Bank is subject to laws and regulations that limit the amount of dividends it can pay. In addition, both the Company and Middleburg Bank are subject to various regulatory restrictions relating to the payment of dividends, including requirements to maintain capital at or above regulatory minimums. Banking regulators have indicated that banking organizations should generally pay dividends only if the organization’s net income available to common shareholders is sufficient to fully fund the dividends and the prospective rate of earnings retention appears consistent with the organization’s capital needs, asset quality and overall financial condition. The Company does not expect that any of these laws, regulations or policies will materially affect the ability of Middleburg Bank to pay dividends. During the year ended December 31, 2010, Middleburg Bank paid $1.7 million in dividends to the Company. No dividends were paid to the Company from the non-banking subsidiaries.
The FDIC has the general authority to limit the dividends paid by insured banks if the payment is deemed an unsafe and unsound practice. The FDIC has indicated that paying dividends that deplete a bank’s capital base to an inadequate level would be an unsound and unsafe banking practice.
Insurance of Accounts, Assessments and Regulation by the FDIC
The deposits of Middleburg Bank are insured by the FDIC up to the limits set forth under applicable law. The deposits of Middleburg Bank subsidiary are subject to the deposit insurance assessments of the Deposit Insurance Fund (“DIF”) of the FDIC.
The FDIC has implemented a risk-based deposit insurance assessment system under which the assessment rate for an insured institution may vary according to regulatory capital levels of the institution and other factors, including supervisory evaluations. In addition to being influenced by the risk profile of the particular depository institution, FDIC premiums are also influenced by the size of the FDIC insurance fund in relation to total deposits in FDIC insured banks. Beginning April 1, 2011, an institution’s assessment base will be its consolidated total assets less its average tangible equity as defined by the FDIC. The FDIC has authority to impose special assessments from time to time.
The maximum deposit insurance amount per depositor has been increased from $100,000 to $250,000. Also, all funds in a ‘noninterest-bearing transaction account’ are insured in full by the FDIC from December 31, 2010, through December 31, 2012. This temporary unlimited coverage is in addition to, and separate from, the coverage of at least $250,000 available to depositors under the FDIC’s general deposit insurance rules. The FDIC issued a rule including Interest on Lawyers Trust Accounts (IOLTAs) in the temporary unlimited coverage for noninterest-bearing transaction accounts.
The FDIC is authorized to prohibit any DIF-insured institution from engaging in any activity that the FDIC determines by regulation or order to pose a serious threat to the respective insurance fund. Also, the FDIC may initiate enforcement actions against banks, after first giving the institution’s primary regulatory
authority an opportunity to take such action. The FDIC may terminate the deposit insurance of any depository institution if it determines, after a hearing, that the institution has engaged or is engaging in unsafe or unsound practices, is in an unsafe or unsound condition to continue operations, or has violated any applicable law, regulation, order or any condition imposed in writing by the FDIC. It also may suspend deposit insurance temporarily during the hearing process for the permanent termination of insurance, if the institution has no tangible capital. If deposit insurance is terminated, the deposits at the institution at the time of termination, less subsequent withdrawals, shall continue to be insured for a period from six months to two years, as determined by the FDIC. The Company is not aware of any existing circumstances that could result in termination of any of Middleburg Bank’s deposit insurance.
Capital Requirements
The Federal Reserve Board has issued risk-based and leverage capital guidelines applicable to banking organizations that it supervises. Under the risk-based capital requirements, the Company and Middleburg Bank are each generally required to maintain a minimum ratio of total risk-based capital to risk-weighted assets (including certain off-balance sheet activities, such as standby letters of credit) of 8%. At least half of the total risk-based capital must be composed of “Tier 1 Capital,” which is defined as common equity, retained earnings and qualifying perpetual preferred stock, less certain intangibles and ineligible deferred tax assets. The remainder may consist of “Tier 2 Capital,” which is defined as specific subordinated debt, some hybrid capital instruments and other qualifying preferred stock and a limited amount of the loan loss allowance. In addition, each of the federal banking regulatory agencies has established minimum leverage capital requirements for banking organizations. Under these requirements, banking organizations must maintain a minimum ratio of Tier 1 capital to adjusted average quarterly assets equal to 4%, subject to federal bank regulatory evaluation of an organization’s overall safety and soundness. In sum, the capital measures used by the federal banking regulators are:
| · | the Total Capital ratio, which includes Tier 1 Capital and Tier 2 Capital; |
| · | the Tier 1 Capital ratio; and |
| · | the leverage ratio. |
Under these regulations, a bank will be:
| · | “well capitalized” if it has a Total Capital ratio of 10% or greater, a Tier 1 Capital ratio of 6% or greater, and a leverage ratio of 5% or greater and is not subject to any written agreement, order, capital directive, or prompt corrective action directive by a federal bank regulatory agency to meet and maintain a specific capital level for any capital measure; |
| · | “adequately capitalized” if it has a Total Capital ratio of 8% or greater, a Tier 1 Capital ratio of 4% or greater, and a leverage ratio of 4% or greater – or 3% in certain circumstances – and is not well capitalized; |
| · | “undercapitalized” if it has a Total Capital ratio of less than 8%, a Tier 1 Capital ratio of less than 4% - or 3% in certain circumstances; |
| · | “significantly undercapitalized” if it has a Total Capital ratio of less than 6%, a Tier 1 Capital ratio of less than 3%, or a leverage ratio of less than 3%; or |
| · | “critically undercapitalized” if its tangible equity is equal to or less than 2% of average quarterly tangible assets. |
The risk-based capital standards of the Federal Reserve Board explicitly identify concentrations of credit risk and the risk arising from non-traditional activities, as well as an institution’s ability to manage these
risks, as important factors to be taken into account by the agency in assessing an institution’s overall capital adequacy. The capital guidelines also provide that an institution’s exposure to a decline in the economic value of its capital due to changes in interest rates be considered by the agency as a factor in evaluating a banking organization’s capital adequacy.
The FDIC may take various corrective actions against any undercapitalized bank and any bank that fails to submit an acceptable capital restoration plan or fails to implement a plan accepted by the FDIC. These powers include, but are not limited to, requiring the institution to be recapitalized, prohibiting asset growth, restricting interest rates paid, requiring prior approval of capital distributions by any bank holding company that controls the institution, requiring divestiture by the institution of its subsidiaries or by the holding company of the institution itself, requiring new election of directors, and requiring the dismissal of directors and officers. The Company and Middleburg Bank presently maintain sufficient capital to remain in compliance with these capital requirements.
The Dodd-Frank Wall Street Reform and Consumer Protection Act (the “Dodd-Frank Act”) contains a number of provisions dealing with capital adequacy of insured depository institutions and their holding companies, which may result in more stringent capital requirements. Under the Collins Amendment to the Dodd-Frank Act, federal regulators have been directed to establish minimum leverage and risk-based capital requirements for, among other entities, banks and bank holding companies on a consolidated basis. These minimum requirements can’t be less than the generally applicable leverage and risk-based capital requirements established for insured depository institutions nor quantitatively lower than the leverage and risk-based capital requirements established for insured depository institutions that were in effect as of July 21, 2010. These requirements in effect create capital level floors for bank holding companies similar to those in place currently for insured depository institutions. The Collins Amendment also excludes trust preferred securities issued after May 19, 2010 from being included in Tier 1 capital unless the issuing company is a bank holding company with less than $500 million in total assets. Trust preferred securities issued prior to that date will continue to count as Tier 1 capital for bank holding companies with less than $15 billion in total assets, and such securities will be phased out of Tier 1 capital treatment for bank holding companies with over $15 billion in total assets over a three-year period beginning in 2013. Accordingly, our trust preferred securities will continue to qualify as Tier 1 capital.
Other Safety and Soundness Regulations
There are a number of obligations and restrictions imposed on bank holding companies and their depository institution subsidiaries by federal law and regulatory policy that are designed to reduce potential loss exposure to the depositors of such depository institutions and to the FDIC insurance funds in the event that the depository institution is insolvent or is in danger of becoming insolvent. For example, under the requirements of the Federal Reserve Board with respect to bank holding company operations, a bank holding company is required to serve as a source of financial strength to its subsidiary depository institutions and to commit resources to support such institutions in circumstances where it might not do so otherwise. In addition, the “cross-guarantee” provisions of federal law require insured depository institutions under common control to reimburse the FDIC for any loss suffered or reasonably anticipated by the FDIC as a result of the insolvency of commonly controlled insured depository institutions or for any assistance provided by the FDIC to commonly controlled insured depository institutions in danger of failure. The FDIC may decline to enforce the cross-guarantee provision if it determines that a waiver is in the best interests of the deposit insurance funds. The FDIC’s claim for reimbursement under the cross guarantee provisions is superior to claims of shareholders of the insured depository institution or its holding company but is subordinate to claims of depositors, secured creditors and nonaffiliated holders of subordinated debt of the commonly controlled insured depository institutions.
Monetary Policy
The commercial banking business is affected not only by general economic conditions but also by the monetary policies of the Federal Reserve Board. The instruments of monetary policy employed by the Federal
Reserve Board include open market operations in United States government securities, changes in the discount rate on member bank borrowing and changes in reserve requirements against deposits held by all federally insured banks. The Federal Reserve Board’s monetary policies have had a significant effect on the operating results of commercial banks in the past and are expected to continue to do so in the future. In view of changing conditions in the national and international economy and in the money markets, as well as the effect of actions by monetary fiscal authorities, including the Federal Reserve Board, no prediction can be made as to possible future changes in interest rates, deposit levels, loan demand of Middleburg Bank or the business and earnings of the Company.
Federal Reserve System
In 1980, Congress enacted legislation that imposed reserve requirements on all depository institutions that maintain transaction accounts or non-personal time deposits. NOW accounts, money market deposit accounts and other types of accounts that permit payments or transfers to third parties fall within the definition of transaction accounts and are subject to these reserve requirements, as are any non-personal time deposits at an institution. For net transaction accounts in 2011, the first $10.7 million will be exempt from reserve requirements consistent with 2010. A three percent reserve ratio will be assessed on net transaction accounts over $10.7 million up to and including $48.1 million, compared to $10.7 million up to and including $44.5 million in 2010. A ten percent reserve ratio will be applied above $48.1 million in 2011, compared to $44.5 million in 2010. These percentages are subject to adjustment by the Federal Reserve Board. Because required reserves must be maintained in the form of vault cash or in a non-interest-bearing account at, or on behalf of, a Federal Reserve Bank, the effect of the reserve requirement is to reduce the amount of the institution’s interest-earning assets.
Transactions with Affiliates
Transactions between banks and their affiliates are governed by Sections 23A and 23B of the Federal Reserve Act. An affiliate of a bank is any bank or entity that controls, is controlled by or is under common control with such bank. Generally, Sections 23A and 23B:
| · | limit the extent to which a bank or its subsidiaries may engage in “covered transactions” with any one affiliate to an amount equal to 10% of such institution’s capital stock and surplus, and maintain an aggregate limit on all such transactions with affiliates to an amount equal to 20% of such capital stock and surplus; and |
| · | require that all such transactions be on terms substantially the same, or at least as favorable, to the association or subsidiary as those provided to a non-affiliate. |
The term “covered transaction” includes the making of loans, purchase of assets, issuance of a guarantee and similar other types of transactions.
Transactions with Insiders
The Federal Reserve Act and related regulations impose specific restrictions on loans to directors, executive officers and principal shareholders of banks. Under Section 22(h) of the Federal Reserve Act, loans to a director, an executive officer and to a principal shareholder of a bank, and some affiliated entities of any of the foregoing, may not exceed, together with all other outstanding loans to such person and affiliated entities, the bank’s loan-to-one borrower limit. Loans in the aggregate to insiders and their related interests as a class may not exceed two times the bank’s unimpaired capital and unimpaired surplus until the bank’s total assets equal or exceed $100,000,000, at which time the aggregate is limited to the bank’s unimpaired capital and unimpaired surplus. Section 22(h) also prohibits loans, above amounts prescribed by the appropriate federal banking agency, to directors, executive officers and principal shareholders of a bank or bank holding company, and their respective affiliates, unless such loan is approved in advance by a majority of the board of directors of the bank with any “interested” director not participating in the voting. The FDIC has prescribed the loan amount, which includes all other outstanding loans to such person, as to which such prior board of director approval is required,
as being the greater of $25,000 or 5% of capital and surplus (up to $500,000). Section 22(h) requires that loans to directors, executive officers and principal shareholders be made on terms and underwriting standards substantially the same as offered in comparable transactions to other persons.
The Dodd-Frank Act also provides that banks may not “purchase an asset from, or sell an asset to” a bank insider (or their related interests) unless (i) the transaction is conducted on market terms between the parties, and (ii) if the proposed transaction represents more than 10 percent of the capital stock and surplus of the bank, it has been approved in advance by a majority of the bank’s non-interested directors.
Community Reinvestment Act
Under the Community Reinvestment Act and related regulations, depository institutions have an affirmative obligation to assist in meeting the credit needs of their market areas, including low and moderate-income areas, consistent with safe and sound banking practice. The Community Reinvestment Act requires the adoption by each institution of a Community Reinvestment Act statement for each of its market areas describing the depository institution’s efforts to assist in its community’s credit needs. Depository institutions are periodically examined for compliance with the Community Reinvestment Act and are periodically assigned ratings in this regard. Banking regulators consider a depository institution’s Community Reinvestment Act rating when reviewing applications to establish new branches, undertake new lines of business, and/or acquire part or all of another depository institution. An unsatisfactory rating can significantly delay or even prohibit regulatory approval of a proposed transaction by a bank holding company or its depository institution subsidiaries.
The Gramm-Leach-Bliley Act and federal bank regulators have made various changes to the Community Reinvestment Act. Among other changes, Community Reinvestment Act agreements with private parties must be disclosed and annual reports must be made to a bank’s primary federal regulator. A bank holding company will not be permitted to become a financial holding company and no new activities authorized under the GLBA may be commenced by a holding company or by a bank financial subsidiary if any of its bank subsidiaries received less than a “satisfactory” rating in its latest Community Reinvestment Act examination.
Fair Lending; Consumer Laws
In addition to the Community Reinvestment Act, other federal and state laws regulate various lending and consumer aspects of the banking business. Governmental agencies, including the Department of Housing and Urban Development, the Federal Trade Commission and the Department of Justice, have become concerned that prospective borrowers experience discrimination in their efforts to obtain loans from depository and other lending institutions. These agencies have brought litigation against depository institutions alleging discrimination against borrowers. Many of these suits have been settled, in some cases for material sums, short of a full trial.
These governmental agencies have clarified what they consider to be lending discrimination and have specified various factors that they will use to determine the existence of lending discrimination under the Equal Credit Opportunity Act and the Fair Housing Act, including evidence that a lender discriminated on a prohibited basis, evidence that a lender treated applicants differently based on prohibited factors in the absence of evidence that the treatment was the result of prejudice or a conscious intention to discriminate, and evidence that a lender applied an otherwise neutral non-discriminatory policy uniformly to all applicants, but the practice had a discriminatory effect, unless the practice could be justified as a business necessity.
Banks and other depository institutions also are subject to numerous consumer-oriented laws and regulations. These laws, which include the Truth in Lending Act, the Truth in Savings Act, the Real Estate Settlement Procedures Act, the Electronic Funds Transfer Act, the Equal Credit Opportunity Act, and the Fair Housing Act, require compliance by depository institutions with various disclosure requirements and requirements regulating the availability of funds after deposit or the making of some loans to customers.
Gramm-Leach-Bliley Act of 1999
The GLBA covers a broad range of issues, including a repeal of most of the restrictions on affiliations among depository institutions, securities firms and insurance companies. The following description summarizes some of its significant provisions.
The GLBA permits unrestricted affiliations between banks and securities firms. It also permits bank holding companies to elect to become financial holding companies. A financial holding company may engage in or acquire companies that engage in a broad range of financial services, including securities activities such as underwriting, dealing, investment, merchant banking, insurance underwriting, sales and brokerage activities. In order to become a financial holding company, a bank holding company and all of its affiliated depository institutions must be well-capitalized, well-managed and have at least a satisfactory Community Reinvestment Act rating.
The GLBA provides that the states continue to have the authority to regulate insurance activities, but prohibits the states in most instances from preventing or significantly interfering with the ability of a bank, directly or through an affiliate, to engage in insurance sales, solicitations or cross-marketing activities. Although the states generally must regulate bank insurance activities in a nondiscriminatory manner, the states may continue to adopt and enforce rules that specifically regulate bank insurance activities in specific areas identified under the law. Under the new law, the federal bank regulatory agencies adopted insurance consumer protection regulations that apply to sales practices, solicitations, advertising and disclosures.
The GLBA adopts a system of functional regulation under which the Federal Reserve Board is designated as the umbrella regulator for financial holding companies, but financial holding company affiliates are principally regulated by functional regulators such as the FDIC for state nonmember bank affiliates, the SEC for securities affiliates, and state insurance regulators for insurance affiliates. It repeals the broad exemption of banks from the definitions of “broker” and “dealer” for purposes of the Exchange Act, as amended. It also identifies a set of specific activities, including traditional bank trust and fiduciary activities, in which a bank may engage without being deemed a “broker,” and a set of activities in which a bank may engage without being deemed a “dealer.” Additionally, the new law makes conforming changes in the definitions of “broker” and “dealer” for purposes of the Investment Company Act of 1940, as amended, and the Investment Advisers Act of 1940, as amended.
The GLBA contains extensive customer privacy protection provisions. Under these provisions, a financial institution must provide to its customers, both at the inception of the customer relationship and on an annual basis, the institution’s policies and procedures regarding the handling of customers’ nonpublic personal financial information. The law provides that, except for specific limited exceptions, an institution may not provide such personal information to unaffiliated third parties unless the institution discloses to the customer that such information may be so provided and the customer is given the opportunity to opt out of such disclosure. An institution may not disclose to a non-affiliated third party, other than to a consumer reporting agency, customer account numbers or other similar account identifiers for marketing purposes. The GLBA also provides that the states may adopt customer privacy protections that are stricter than those contained in the act.
Bank Secrecy Act
Under the Bank Secrecy Act, a financial institution is required to have systems in place to detect certain transactions, based on the size and nature of the transaction. Financial institutions are generally required to report cash transactions involving more than $10,000 to the United States Treasury. In addition, financial institutions are required to file suspicious activity reports for transactions that involve more than $5,000 and which the financial institution knows, suspects or has reason to suspect, involves illegal funds, is designed to evade the requirements of the BSA or has no lawful purpose. The USA PATRIOT Act of 2001, enacted in response to the September 11, 2001 terrorist attacks, requires bank regulators to consider a financial institution’s compliance with the BSA when reviewing applications from a financial institution. As part of its BSA program, the USA PATRIOT Act also requires a financial institution to follow customer identification procedures when
opening accounts for new customers and to review lists of individuals who and entities which are prohibited from opening accounts at financial institutions.
Dodd-Frank Act
In July 2010, the Dodd-Frank Act was signed into law, incorporating numerous financial institution regulatory reforms. Many of these reforms will be implemented over the course of 2011 and beyond through regulations to be adopted by various federal banking and securities regulatory agencies. The Dodd-Frank Act implements far-reaching reforms of major elements of the financial landscape, particularly for larger financial institutions. Many of its provisions do not directly impact community-based institutions like the Bank. For instance, provisions that regulate derivative transactions and limit derivatives trading activity of federally-insured institutions, enhance supervision of “systemically significant” institutions, impose new regulatory authority over hedge funds, limit proprietary trading by banks, and phase-out the eligibility of trust preferred securities for Tier 1 capital are among the provisions that do not directly impact the Bank either because of exemptions for institutions below a certain asset size or because of the nature of the Bank’s operations. Provisions that could impact the Bank include the following:
| · | FDIC Assessments. The Dodd-Frank Act changes the assessment base for federal deposit insurance from the amount of insured deposits to average consolidated total assets less its average tangible equity. In addition, it increases the minimum size of the Deposit Insurance Fund (“DIF”) and eliminates its ceiling, with the burden of the increase in the minimum size on institutions with more than $10 billion in assets. |
| · | Deposit Insurance. The Dodd-Frank Act makes permanent the $250,000 limit for federal deposit insurance and provides unlimited federal deposit insurance until December 31, 2012 for non-interest-bearing demand transaction accounts at all insured depository institutions. |
| · | Interest on Demand Deposits. The Dodd- Frank Act also provides that, effective one year after the date of enactment, depository institutions may pay interest on demand deposits, including business transaction and other accounts. |
| · | Interchange Fees. The Dodd-Frank Act requires the Federal Reserve to set a cap on debit card interchange fees charged to retailers. While banks with less than $10 billion in assets, such as the Bank, are exempted from this measure, it is likely that, if this measure is implemented, all banks could be forced by market pressures to lower their interchange fees or face potential rejection of their cards by retailers. |
| · | Consumer Financial Protection Bureau. The Dodd-Frank Act centralizes responsibility for consumer financial protection by creating a new agency, the Consumer Financial Protection Bureau, responsible for implementing federal consumer protection laws, although banks below $10 billion in assets will continue to be examined and supervised for compliance with these laws by their federal bank regulator. |
| · | Mortgage Lending. New requirements are imposed on mortgage lending, including new minimum underwriting standards, prohibitions on certain yield-spread compensation to mortgage originators, special consumer protections for mortgage loans that do not meet certain provision qualifications, prohibitions and limitations on certain mortgage terms and various new mandated disclosures to mortgage borrowers. |
| · | Holding Company Capital Levels. Bank regulators are required to establish minimum capital levels for holding companies that are at least as stringent as those currently applicable to banks. In addition, all trust preferred securities issued after May 19, 2010 will be counted as Tier 2 capital, but the Company’s currently outstanding trust preferred securities will continue to qualify as Tier 1 capital. |
| · | De Novo Interstate Branching. National and state banks are permitted to establish de novo interstate branches outside of their home state, and bank holding companies and banks must be well-capitalized and well managed in order to acquire banks located outside their home state. |
| · | Transactions with Affiliates. The Dodd-Frank Act enhances the requirements for certain transactions with affiliates under Section 23A and 23B of the Federal Reserve Act, including an expansion of the definition of “covered transactions” and increasing the amount of time for which collateral requirements regarding covered transactions must be maintained. |
| · | Transactions with Insiders. Insider transaction limitations are expanded through the strengthening of loan restrictions to insiders and the expansion of the types of transactions subject to the various limits, including derivative transactions, repurchase agreements, reverse repurchase agreements and securities lending or borrowing transactions. Restrictions are also placed on certain asset sales to and from an insider to an institution, including requirements that such sales be on market terms and, in certain circumstances, approved by the institution’s board of directors. |
| · | Corporate Governance. The Dodd-Frank Act includes corporate governance revisions that apply to all public companies, not just financial institutions, including with regard to executive compensation and proxy access to shareholders. |
Many aspects of the Dodd-Frank Act are subject to rulemaking and will take effect over several years, and their impact on the Company or the financial industry is difficult to predict before such regulations are adopted.
Future Regulatory Uncertainty
Because federal regulation of financial institutions changes regularly and is the subject of constant legislative debate, the Company cannot forecast how federal regulation of financial institutions may change in the future and impact its operations. Although Congress in recent years has sought to reduce the regulatory burden on financial institutions with respect to the approval of specific transactions, the Company fully expects that the financial institution industry will remain heavily regulated in the near future and that additional laws or regulations may be adopted further regulating specific banking practices.
Middleburg Trust Company
Middleburg Trust Company operates as a trust subsidiary of Middleburg Investment Group, which is a subsidiary of the Company. It is subject to supervision and regulation by the Virginia State Corporation Commission’s Bureau of Financial Institutions and the Federal Reserve Board.
State and federal regulators have substantial discretion and latitude in the exercise of their supervisory and regulatory authority over Middleburg Trust Company, including the statutory authority to promulgate regulations affecting the conduct of business and the operations of Middleburg Trust Company. They also have the ability to exercise substantial remedial powers with respect to Middleburg Trust Company in the event that it determines that Middleburg Trust Company is not in compliance with applicable laws, orders or regulations governing its operations, is operating in an unsafe or unsound manner, or is engaging in any irregular practices.
Middleburg Investment Advisors
Middleburg Investment Advisors operates as a subsidiary of Middleburg Trust Company, which is a subsidiary of Middleburg Investment Group, which in turn is a subsidiary of the Company. It is subject to supervision and regulation by the Securities and Exchange Commission under the Investment Advisors Act of 1940. The Investment Advisors Act of 1940 requires registered investment advisers to comply with numerous and pervasive obligations, including, among other things, record-keeping requirements, operational procedures, registration and reporting and disclosure obligations. State regulatory authorities also provide similar oversight and regulation.
ITEM 1A. RISK FACTORS
The Company is subject to various risks, including the risks described below. The Company’s (“We” or “Our”) operations, financial condition and performance and, therefore, the market value of our securities could be materially adversely affected by any of these risks or additional risks not presently known or that we currently deem immaterial.
We may not be able to successfully manage our growth or implement our growth strategies, which may adversely affect our results of operations and financial condition.
A key aspect of our business strategy is our continued growth and expansion. Our ability to continue to grow depends, in part, upon our ability to:
| · | open new financial service centers; |
| · | attract deposits to those locations; and |
| · | identify attractive loan and investment opportunities. |
We may not be able to successfully implement our growth strategy if we are unable to identify attractive markets, locations or opportunities to expand in the future. Our ability to manage our growth successfully also will depend on whether we can maintain capital levels adequate to support our growth, maintain cost controls and asset quality and successfully integrate any new financial service centers into our organization.
As we continue to implement our growth strategy by opening new financial service centers, we expect to incur construction costs and increased personnel, occupancy and other operating expenses. We generally must absorb those higher expenses while we begin to generate new deposits, and there is a further time lag involved in redeploying new deposits into attractively priced loans and other higher yielding earning assets. Thus, our plans to grow could depress our earnings in the short run, even if we efficiently execute this growth.
Our future success is dependent on our ability to compete effectively in the highly competitive banking industry.
Our banking subsidiary faces vigorous competition from banks and other financial institutions, including savings and loan associations, savings banks, finance companies and credit unions for deposits, loans and other financial services in our market area. A number of these banks and other financial institutions are significantly larger than we are and have substantially greater access to capital and other resources, as well as larger lending limits and branch systems, and offer a wider array of banking services. Our non-banking subsidiary faces competition from money managers and investment brokerage firms.
To a limited extent, our banking subsidiary also competes with other providers of financial services, such as money market mutual funds, brokerage firms, consumer finance companies, insurance companies and governmental organizations which may offer more favorable financing than we can. Many of our non-bank competitors are not subject to the same extensive regulations that govern us. As a result, these non-bank competitors have advantages over us in providing certain services. This competition may reduce or limit our margins and our market share and may adversely affect our results of operations and financial condition.
We may incur losses if we are unable to successfully manage interest rate risk.
Our profitability will depend in substantial part upon the spread between the interest rates earned on investments and loans and interest rates paid on deposits and other interest-bearing liabilities. Changes in interest rates will affect our operating performance and financial condition in diverse ways including the pricing of securities, loans and deposits, the volume of loan originations in our mortgage banking business and the value we can recognize on the sale of mortgage and home equity loans in the secondary market. We attempt to minimize our exposure to interest rate risk, but we will be unable to eliminate it. Based on our asset/liability position at December 31, 2010, a rise in interest rates would reduce our net interest income in the short term. Our net interest spread will depend on many factors that are partly or entirely outside our control, including competition, federal economic, monetary and fiscal policies, and economic conditions generally.
Our concentration in loans secured by real estate may increase our credit losses, which would negatively affect our financial results.
We offer a variety of secured loans, including commercial lines of credit, commercial term loans, real estate, construction, home equity, consumer and other loans. Many of our loans are secured by real estate (both residential and commercial) in our market area. At December 31, 2010, approximately 41.8% and 36.2% of our $659.3 million total loan portfolio were secured by commercial and residential real estate, respectively. A major change in the real estate market, such as deterioration in the value of this collateral, or in the local or national economy, could adversely affect our clients’ ability to pay these loans, which in turn could negatively impact us. While we are in one of the fastest growing real estate markets in the United States, risk of loan defaults and foreclosures are unavoidable in the banking industry, and we try to limit our exposure to this risk by monitoring our extensions of credit carefully. We cannot fully eliminate credit risk, and as a result credit losses may occur in the future.
We may be adversely affected by further deterioration of economic conditions in our market area.
Our banking operations are located primarily in the Virginia counties of Loudoun, Fairfax, Fauquier and Prince William and also in the town of Williamsburg. Because our lending is concentrated in this market, we will be affected by the general economic conditions in the greater Washington, D.C. metropolitan area. Changes in the economy may influence the growth rate of our loans and deposits, the quality of the loan portfolio and loan and deposit pricing. A further decline in general economic conditions caused by inflation, recession, unemployment or other factors beyond our control would impact the demand for banking products and services generally, which could negatively affect our financial condition and performance.
A loss of our senior officers could impair our relationship with our customers and adversely affect our business.
Many community banks attract customers based on the personal relationships that the banks’ officers and customers establish with each other and the confidence that the customers have in the officers. We depend on the performance of our senior officers. These officers have many years of experience in the banking industry and have numerous contacts in our market area. The loss of the services of any of our senior officers, or the failure of any of them to perform management functions in the manner anticipated by our board of directors, could have a material adverse effect on our business. Our success will be dependent upon the board’s ability to attract and retain quality personnel, including these individuals. We do not carry key man life insurance on our senior officers.
Many of the loans in our loan portfolio are too new to show any sign of problems.
Due to the economic growth in our market area and the opening of new financial service centers, a significant portion of our loans have been originated in the past several years. In general, loans do not begin to show signs of credit deterioration or default until they have been outstanding for some period of time, a process known as ‘seasoning.” As a result, a portfolio of older loans will usually behave more predictably than a newer portfolio. Although we believe we have conservative underwriting standards, it is more difficult to assess the future performance of the loan portfolio due to the recent origination of many of the loans. Thus, there can be no assurance that charge-offs in the future periods will not exceed the allowance for loan losses or that additional increases in the allowance for loan losses will not be required.
If we need additional capital in the future to continue our growth, we may not be able to obtain it on terms that are favorable. This could negatively affect our performance and the value of our common stock.
Our business strategy calls for continued growth. We anticipate that we will be able to support this growth through the generation of additional deposits at new branch locations as well as investment opportunities. However, we may need to raise additional capital in the future to support our continued growth
and to maintain our capital levels. Our ability to raise capital through the sale of additional securities will depend primarily upon our financial condition and the condition of financial markets at that time. We may not be able to obtain additional capital in the amounts or on terms satisfactory to us. Our growth may be constrained if we are unable to raise additional capital as needed.
Our profitability and the value of your investment may suffer because of rapid and unpredictable changes in the highly regulated environment in which we operate.
We are subject to extensive supervision by several governmental regulatory agencies at the federal and state levels. Recently enacted, proposed and future banking legislation and regulations have had, and will continue to have, or may have a significant impact on the financial services industry. These regulations, which are intended to protect depositors and not our shareholders, and the interpretation and application of them by federal and state regulators, are beyond our control, may change rapidly and unpredictably and can be expected to influence our earnings and growth. Our success depends on our continued ability to maintain compliance with these regulations. Some of these regulations may increase our costs and thus place other financial institutions that are not subject to similar regulation in stronger, more favorable competitive positions.
Revenue from our mortgage lending investment is sensitive to changes in economic conditions, decreased economic activity, a slowdown in the housing market or higher interest rates and may adversely impact our profits.
Maintaining our revenue stream from our mortgage banking subsidiary, Southern Trust Mortgage, is dependent upon its ability to originate loans and sell them to investors. Loan production levels are sensitive to changes in economic conditions and can suffer from decreased economic activity, a slowdown in the housing market or higher interest rates. Generally, any sustained period of decreased economic activity or higher interest rates could adversely affect Southern Trust Mortgage’s mortgage originations and, consequently, reduce its income from mortgage lending activities. As a result, these conditions may ultimately adversely affect our net income.
Banking regulators have broad enforcement power, but regulations are meant to protect depositors, and not investors.
The Company is subject to supervision by several governmental regulatory agencies. Bank regulations, and the interpretation and application of them by regulators, are beyond our control, may change rapidly and unpredictably and can be expected to influence earnings and growth. In addition, these regulations may limit the Company’s growth and the return to investors by restricting activities such as the payment of dividends, mergers with, or acquisitions by, other institutions, investments, loans and interest rates, interest rates paid on depositors and the creation of financial service centers. Information on the regulations that impact the Company are included in Item 1., “Business – Supervision and Regulation,” above. Although these regulations impose costs on the Company, they are intended to protect depositors, and should not be assumed to protect the interest of shareholders. The regulations to which we are subject may not always be in the best interest of investors.
Trading in our common stock has been sporadic and volume has been light. As a result, shareholders may not be able to quickly and easily sell their common stock.
Although our common stock trades on the Nasdaq Capital Market and a number of brokers offer to make a market in common stock on a regular basis, trading volume to date has been limited and there can be no assurance that an active and liquid market for the common stock will develop.
Our directors and officers have significant voting power.
Our directors and executive officers beneficially own 5.26% of our common stock and may purchase additional shares of our common stock by exercising vested stock options. By voting against a proposal
submitted to shareholders, the directors and officers may be able to make approval more difficult for proposals requiring the vote of shareholders such as mergers, share exchanges, asset sales and amendment to the Company’s articles of incorporation.
An inadequate allowance for loan losses would reduce our earnings.
Our earnings are significantly affected by our ability to properly originate, underwrite and service loans. We maintain an allowance for loan losses based upon many factors, including the following:
| · | actual loan loss history; |
| · | volume, growth, and composition of the loan portfolio; |
| · | the amount of non-performing loans and the value of their related collateral; |
| · | the effect of changes in the local real estate market on collateral values; |
| · | the effect of current economic conditions on a borrower’s ability to pay; and |
| · | other factors deemed relevant by management. |
These determinations are based upon estimates that are inherently subjective, and their accuracy depends on the outcome of future events; therefore, realized losses may differ from current estimates. Changes in economic, operating, and other conditions, including changes in interest rates, which are generally beyond our control, could increase actual loan losses significantly. As a result, actual losses could exceed our current allowance estimate. We cannot provide assurance that our allowance for loan losses is sufficient to cover actual loan losses should such losses differ significantly from the current estimates.
In addition, there can be no assurance that our methodology for assessing our asset quality will succeed in properly identifying impaired loans or calculating an appropriate loan loss allowance. We could sustain losses if we incorrectly assess the creditworthiness of our borrowers or fail to detect or respond to deterioration in asset quality in a timely manner. If our assumptions and judgments prove to be incorrect and the allowance for loan losses is inadequate to absorb losses, or if bank regulatory authorities require us to increase the allowance for loan losses as a part of their examination process, our earnings and capital could be significantly and adversely affected.
Difficult market conditions have adversely affected our industry.
Dramatic declines in the housing market, with falling home prices and increasing foreclosures, unemployment and under-employment, have negatively impacted the credit performance of real estate related loans and resulted in significant write-downs of asset values by financial institutions. These write-downs, initially of asset-backed securities but spreading to other securities and loans, have caused many financial institutions to seek additional capital, to reduce or eliminate dividends, to merge with larger and stronger institutions and, in some cases, to fail. Reflecting concern about the stability of the financial markets generally and the strength of counterparties, many lenders and institutional investors have reduced or ceased providing funding to borrowers, including to other financial institutions. This market turmoil and tightening of credit have led to an increased level of commercial and consumer delinquencies, lack of consumer confidence, increased market volatility and widespread reduction of business activity generally. The resulting economic pressure on consumers and lack of confidence in the financial markets has adversely affected our business and results of operations. Market developments may affect consumer confidence levels and may cause adverse changes in payment patterns, causing increases in delinquencies and default rates, which may impact our charge-offs and provision for credit losses. A worsening of these conditions would likely exacerbate the adverse effects of these difficult market conditions on us and others in the financial institutions industry.
Current levels of market volatility are unprecedented.
The capital and credit markets have been experiencing volatility and disruption for several years sometimes reaching unprecedented levels. In some cases, the markets have produced downward pressure on stock prices and credit availability for certain issuers without regard to those issuers’ underlying financial
strength. If current levels of market disruption and volatility continue or worsen, there can be no assurance that we will not experience an adverse effect, which may be material, on our ability to access capital and on our business, financial condition and results of operations.
The soundness of other financial institutions could adversely affect us.
Our ability to engage in routine funding transactions could be adversely affected by the actions and commercial soundness of other financial institutions. Financial services institutions are interrelated as a result of trading, clearing, counterparty or other relationships. We have exposure to many different industries and counterparties, and we routinely execute transactions with counterparties in the financial industry. As a result, defaults by, or even rumors or questions about, one or more financial services institutions, or the financial services industry generally, have led to market-wide liquidity problems and could lead to losses or defaults by us or by other institutions. Many of these transactions expose us to credit risk in the event of default of our counterparty or client. In addition, our credit risk may be exacerbated when the collateral held by us cannot be realized upon or is liquidated at prices not sufficient to recover the full amount of the financial instrument exposure due us. There is no assurance that any such losses would not materially and adversely affect our results of operations.
Government measures to regulate the financial industry, including the recently enacted Dodd-Frank Act, subject us to increased regulation and could aversely affect us.
As a financial institution, we are heavily regulated at the state and federal levels. As a result of the financial crisis and related global economic downturn that began in 2007, we have faced, and expect to continue to face, increased public and legislative scrutiny as well as stricter and more comprehensive regulation of our financial services practices. In July 2010, the Dodd-Frank Act was signed into law. The Dodd-Frank Act includes significant changes in the financial regulatory landscape and will impact all financial institutions, including the Company and the Bank. Many of the provisions of the Dodd-Frank Act have begun to be or will be implemented over the next several months and years and will be subject both to further rulemaking and the discretion of applicable regulatory bodies. Because the ultimate impact of the Dodd-Frank Act will depend on future regulatory rulemaking and interpretation, we cannot predict the full effect of this legislation on our businesses, financial condition or results of operations. Among other things, the Dodd-Frank Act and the regulations implemented thereunder could limit debit card interchange fees, increase FDIC assessments, impose new requirements on mortgage lending, and establish more stringent capital requirements on bank holding companies. As a result of these and other provisions in the Dodd-Frank Act, we could experience additional costs, as well as limitations on the products and services we offer and on our ability to efficiently pursue business opportunities, which may adversely affect our businesses, financial condition or results of operations.
Our ability to pay dividends is limited and we may be unable to pay future dividends.
Our ability to pay dividends is limited by regulatory restrictions and the need to maintain sufficient capital in the Company and in our subsidiaries. The ability of our bank subsidiary to pay dividends to us is limited by the bank’s obligations to maintain sufficient capital, earnings and liquidity and by other general restrictions on their dividends under federal and state bank regulatory requirements. In October 2010, we announced that we had cut the regular quarterly dividend to $0.05 per share, from $0.10 per share. We cannot be certain as to when, if ever, the dividend may be increased, nor can we be certain that further reductions of the dividend will not be made.
In addition, as a bank holding company, our ability to declare and pay dividends is subject to the guidelines of the Board of Governors of the Federal Reserve System, or the Federal Reserve, regarding capital adequacy and dividends. The Federal Reserve guidelines generally require us to review the effects of the cash payment of dividends on common stock and other Tier 1 capital instruments (i.e., perpetual preferred stock and trust preferred debt) on our financial condition. These guidelines also require that we review our net income for
the current and past four quarters, and the level of dividends on common stock and other Tier 1 capital instruments for those periods, as well as our projected rate of earnings retention.
Under the Federal Reserve’s policy, the board of directors of a bank holding company should also consider different factors to ensure that its dividend level is prudent relative to the organization’s financial position and is not based on overly optimistic earnings scenarios such as any potential events that may occur before the payment date that could affect its ability to pay while still maintaining a strong financial position. As a general matter, the Federal Reserve has indicated that the board of directors of a bank holding company should consult with the Federal Reserve and eliminate, defer, or significantly reduce the bank holding company’s dividends if: (i) its net income available to shareholders for the current period is not sufficient to fully fund the dividends; (ii) its prospective rate of earnings retention is not consistent with the its capital needs and overall current and prospective financial condition; or (iii) it will not meet, or is in danger of not meeting, its minimum regulatory capital adequacy ratios. If we do not satisfy these regulatory requirements or the Federal Reserve’s policies, we will be unable to pay dividends on our common stock.
Further, we cannot pay any dividends on the common stock, or acquire any shares of common stock, if any distributions on our trust preferred securities are in arrears.
A substantial decline in the value of our Federal Home Loan Bank of Atlanta common stock may result in an other than temporary impairment charge.
We are a member of the Federal Home Loan Bank of Atlanta, or FHLB, which enables us to borrow funds under the Federal Home Loan Bank advance program. As a FHLB member, we are required to own FHLB common stock, the amount of which increases with the level of our FHLB borrowings. The carrying value of our FHLB common stock was $4.6 million as of December 31, 2010. The FHLB has suspended daily repurchases of FHLB common stock, which adversely affects the liquidity of these shares. Consequently, there is a risk that our investment could be deemed other-than-temporarily impaired at some time in the future.
Increases in FDIC insurance premiums may cause our earnings to decrease.
The limit on FDIC coverage has been increased to $250,000 for all accounts. In addition, the costs associated with bank resolutions or failures have substantially depleted the Deposit Insurance Fund. As a result, the FDIC has implemented a new methodology by which it will assess premium amounts. The FDIC adopted a final rule effective April 1, 2011, to change the FDIC’s assessment rates as well as providing that the assessment base will be the institution’s average consolidated total assets less its average tangible equity. These actions could increase our noninterest expense for the foreseeable future.
Revenue from our mortgage lending investment is sensitive to changes in economic conditions, decreased economic activity, a slowdown in the housing market, higher interest rates or new legislation and may adversely impact our profits.
Our mortgage banking subsidiary, Southern Trust Mortgage, has provided a significant portion of our consolidated business and maintaining our revenue stream in this segment is dependent upon our ability to originate loans and sell them to investors. For the fiscal year ended December 31, 2010, Southern Trust Mortgage produced net income of approximately $482,000 attributable to Middleburg. Loan production levels are sensitive to changes in economic conditions and can suffer from decreased economic activity, a slowdown in the housing market or higher interest rates. Generally, any sustained period of decreased economic activity or higher interest rates could adversely affect Southern Trust Mortgage’s mortgage originations and, consequently, reduce its income from mortgage lending activities. In addition, new legislation, including proposed legislation that would require Southern Trust Mortgage to retain five percent of the credit risk of securitized exposures, could adversely affect its operations.
We could also experience a reduction in the carrying value of our equity investment in Southern Trust Mortgage if Southern Trust Mortgage operations are negatively impacted. The carrying value for Southern Trust
Mortgage at December 31, 2010 was approximately $1.9 million. A reduction in our carrying value could negatively impact our net income through an impairment expense.
Deteriorating economic conditions may also cause home buyers to default on their mortgages. In certain of these cases where Southern Trust Mortgage has originated loans and sold them to investors, it may be required to repurchase loans or provide a financial settlement to investors if it is proven that the borrower failed to provide full and accurate information on or related to their loan application or for which appraisals have not been acceptable or when the loan was not underwritten in accordance with the loan program specified by the loan investor. Such repurchases or settlements would also adversely affect our net income.
ITEM 1B. UNRESOLVED STAFF COMMENTS
None.
ITEM 2. PROPERTIES
The Company’s corporate headquarters, and that of Middleburg Bank, is located at 111 West Washington Street, Middleburg, Virginia, 20117. The Company’s subsidiaries own or lease various other offices in the counties and municipalities in which they operate. At December 31, 2010, Middleburg Bank operated 10 branches in the Virginia communities of Ashburn, Gainesville, Leesburg, Marshall, Middleburg, Purcellville, Reston, Warrenton and Williamsburg. All of the Offices of Middleburg Trust Company, Middleburg Investment Advisors, and Southern Trust Mortgage are leased. Additionally, Middleburg Bank owns an operations center building located at 106 Catoctin Circle, SE, Leesburg, Virginia 20175. See the Note 1 “Nature of Banking Activities and Significant Accounting Policies” and Note 5 “Premises and Equipment, Net” in the “Notes to the Consolidate Financial Statements” of this Form 10-K for information with respect to the amounts at which bank premises and equipment are carried and commitments under long-term leases.
All of the Company’s properties are well maintained, are in good operating condition and are adequate for the Company’s present and anticipated future needs.
ITEM 3. LEGAL PROCEEDINGS
There are no material pending legal proceedings to which the Company is a party or of which the property of the Company is subject.
ITEM 4. REMOVED AND RESERVED
| MARKET FOR REGISTRANT’S COMMON EQUITY, RELATED STOCKHOLDER MATTERS AND ISSUER PURCHASES OF EQUITY SECURITIES |
Shares of the Company’s Common Stock trade on the Nasdaq Capital Market under the symbol “MBRG.” The high and low sale prices per share for the Company’s Common Stock for each quarter of 2010 and 2009, and the amount of cash dividends per share in each quarter, are set forth in the table below.
Market Price and Dividends
| Sales Price ($) | Dividends ($) | |||
| High | Low | |||
2010: 1st quarter 2nd quarter 3rd quarter 4th quarter | .................................... .................................... .................................... .................................... | 15.30 17.99 15.93 14.50 | 12.70 13.71 13.90 13.76 | 0.10 0.10 0.10 0.05 |
2009: 1st quarter 2nd quarter 3rd quarter 4th quarter | .................................... .................................... .................................... .................................... | 14.91 15.70 14.19 13.10 | 10.25 11.25 10.68 11.65 | 0.19 0.19 0.10 0.10 |
As of March 15, 2011, the Company had approximately 482 shareholders of record and at least 2,523 additional beneficial owners of shares of Common Stock.
The Company historically has paid cash dividends on a quarterly basis. The final determination of the timing, amount and payment of dividends on the Common Stock is at the discretion of the Company’s Board of Directors and will depend upon the earnings of the Company and its subsidiaries, principally Middleburg Bank, the financial condition of the Company and other factors, including general economic conditions and applicable governmental regulations and policies as discussed in Item 1., “Business – Supervision and Regulation – Payment of Dividends,” above.
The Company did not repurchase any shares of Common Stock during the fourth quarter of 2010. On June 16, 1999, the Company adopted a repurchase plan, which authorized management to purchase up to $5 million of the Company’s common stock from time to time. Subsequently, the plan was amended to authorize management to purchase up to 100,000 shares and to eliminate the $5 million limit. As of March 16, 2011, the Company has 24,084 shares eligible for repurchase under the plan.
The following graph compares the cumulative total return to the shareholders of the Company for the last five fiscal years with the total return on the NASDAQ Composite Index and the SNL $500M-$1B Bank Index as reported by SNL Financial LC, assuming an investment of $100 in shares of Common Stock on December 31, 2005 and the reinvestment of dividends.
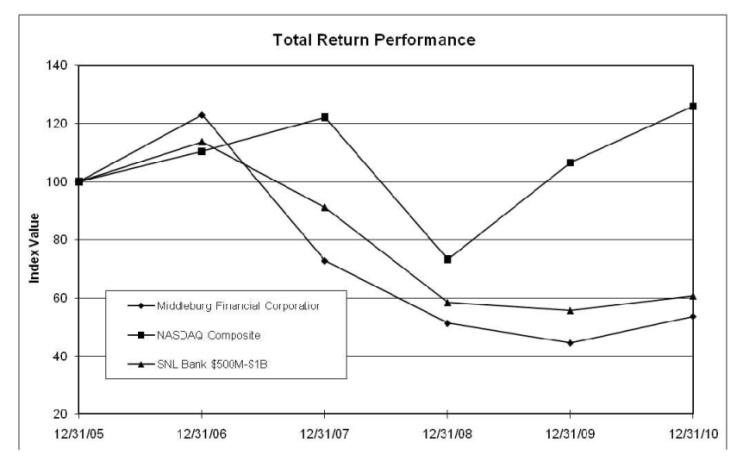
| Period Ending | ||||||
| Index | 12/31/05 | 12/31/06 | 12/31/07 | 12/31/08 | 12/31/09 | 12/31/10 |
| Middleburg Financial Corporation | 100.00 | 123.00 | 72.83 | 51.30 | 44.51 | 53.70 |
| NASDAQ Composite | 100.00 | 110.39 | 122.15 | 73.32 | 106.57 | 125.91 |
| SNL Bank $500M-$1B | 100.00 | 113.73 | 91.14 | 58.40 | 55.62 | 60.72 |
ITEM 6. SELECTED FINANCIAL DATA
The following consolidated summary sets forth the Company’s selected financial data for the periods and at the dates indicated. The selected financial data have been derived from the Company’s audited financial statements for each of the five years that ended December 31, 2010, 2009, 2008, 2007 and 2006.
| Years Ended December 31, | ||||||||||||||||||||
| 2010 | 2009 | 2008 | 2007 | 2006 | ||||||||||||||||
| (In thousands, except ratios and per share data) | ||||||||||||||||||||
| Balance Sheet Data: | ||||||||||||||||||||
| Assets (1) | $ | 1,104,487 | $ | 976,374 | $ | 985,191 | $ | 841,400 | $ | 772,305 | ||||||||||
| Loans, net (2) | 703,706 | 680,104 | 702,651 | 638,692 | 564,750 | |||||||||||||||
| Securities | 258,338 | 178,924 | 181,312 | 129,142 | 135,435 | |||||||||||||||
| Deposits | 890,306 | 805,648 | 744,782 | 588,769 | 570,599 | |||||||||||||||
| Shareholders’ equity | 96,593 | 100,312 | 75,677 | 77,904 | 77,898 | |||||||||||||||
| Average shares outstanding, basic | 6,933 | 5,629 | 4,528 | 4,506 | 4,132 | |||||||||||||||
| Average shares outstanding, diluted | 6,933 | 5,630 | 4,554 | 4,578 | 4,223 | |||||||||||||||
| Income Statement Data: | ||||||||||||||||||||
| Interest income | $ | 48,031 | $ | 56,746 | $ | 55,922 | $ | 49,628 | $ | 45,398 | ||||||||||
| Interest expense | 14,175 | 19,082 | 22,719 | 22,441 | 18,487 | |||||||||||||||
| Net interest income | 33,856 | 37,664 | 33,203 | 27,187 | 26,911 | |||||||||||||||
| Provision for loan losses | 12,005 | 4,551 | 5,261 | 1,786 | 499 | |||||||||||||||
| Net interest income after | ||||||||||||||||||||
| provision for loan losses | 21,851 | 33,113 | 27,942 | 25,401 | 26,412 | |||||||||||||||
| Non-interest income | 26,240 | 19,914 | 17,817 | 7,832 | 8,420 | |||||||||||||||
| Securities gains (losses) | 237 | 998 | (913 | ) | (130 | ) | (305 | ) | ||||||||||||
| Non-interest expense | 52,742 | 48,862 | 42,599 | 29,455 | 23,210 | |||||||||||||||
| Income (loss) before income taxes and non-controlling | ||||||||||||||||||||
| interest in consolidated subsidiary (3) | (4,888 | ) | 5,163 | 2,247 | 3,648 | 11,317 | ||||||||||||||
| Income taxes | (2,562 | ) | 64 | 444 | 584 | 3,299 | ||||||||||||||
| Non-controlling interest in consolidated subsidiary | (362 | ) | (1,577 | ) | 757 | -- | -- | |||||||||||||
| Net income (loss) | (2,688 | ) | 3,522 | 2,560 | 3,064 | 8,018 | ||||||||||||||
| Per Share Data: | ||||||||||||||||||||
| Net income (loss), basic | $ | (0.39 | ) | $ | 0.37 | $ | 0.57 | $ | 0.68 | $ | 1.94 | |||||||||
| Net income (loss), diluted | (0.39 | ) | 0.37 | 0.56 | 0.67 | 1.90 | ||||||||||||||
| Cash dividends | 0.35 | 0.58 | 0.57 | 0.76 | 0.76 | |||||||||||||||
| Book value at period end | 14.02 | 14.52 | 16.69 | 17.21 | 17.29 | |||||||||||||||
| Tangible book value at period end (6) | 13.10 | 13.57 | 15.20 | 16.06 | 16.06 | |||||||||||||||
| Asset Quality Ratios: | ||||||||||||||||||||
| Non-performing loans to total portfolio loans | 4.79 | % | 1.80 | % | 1.19 | % | 1.03 | % | 0.00 | % | ||||||||||
| Non-performing loans to total assets | 3.62 | 1.86 | 1.58 | 0.79 | 0.00 | |||||||||||||||
| Net charge-offs to average loans | 0.88 | 0.76 | 0.51 | 0.04 | 0.01 | |||||||||||||||
| Allowance for loan losses to loans | ||||||||||||||||||||
| outstanding at end of period (2) | 2.08 | 1.33 | 1.41 | 1.10 | 0.98 | |||||||||||||||
| Selected Ratios: | ||||||||||||||||||||
| Return on average assets | (0.25 | )% | 0.35 | % | 0.28 | % | 0.38 | % | 1.05 | % | ||||||||||
| Return on average equity | (2.71 | ) | 3.21 | 3.37 | 3.83 | 12.25 | ||||||||||||||
| Dividend payout | NA | 145.00 | 100.79 | 111.76 | 39.41 | |||||||||||||||
| Efficiency ratio (4) | 85.55 | 82.63 | 80.53 | 81.25 | 63.85 | |||||||||||||||
| Net interest margin (5) | 3.61 | 4.17 | 4.02 | 3.80 | 3.97 | |||||||||||||||
Equity to assets (including non-controlling interest in consolidated subsidiary) | 9.05 | 10.59 | 7.68 | 9.26 | 10.09 | |||||||||||||||
| Tier 1 risk-based capital | 12.80 | 13.86 | 10.25 | 11.55 | 12.79 | |||||||||||||||
| Total risk-based capital | 14.06 | 15.06 | 11.50 | 12.59 | 13.70 | |||||||||||||||
| Leverage | 9.02 | 10.40 | 8.40 | 9.44 | 10.26 | |||||||||||||||
| (1) | Amounts have been adjusted to reflect the application of FASB Interpretation No. 46R. The common equity portion of the Trust Preferred entities has been deconsolidated and is included in Assets for all years reported. |
| (2) | Includes mortgages held for sale. |
| (3) | Consolidated Southern Trust Mortgage, LLC in 2010, 2009 and 2008 based on the Company’s 57.1% ownership at year end. |
| (4) | The efficiency ratio is not a measurement under accounting principles generally accepted in the United States but is a key performance indicator in the Company’s industry. The Company monitors this ratio in tandem with other key indicators for signals of potential trends that should be considered when making decisions regarding strategies related to such areas as asset liability management, business line development, and growth and expansion planning. The ratio is computed by dividing non-interest expense by the sum of net interest income on a tax equivalent basis and non-interest income, net of any securities gains or losses. It is a measure of the relationship between operating expenses to earnings. Net interest income on a tax equivalent basis for the years ended December 31, 2010, 2009, 2008, 2007, and 2006 were $35,152,000, $39,218,000, $34,328,000, $28,190,000, and $27,705,000. See Item 7, “Management’s Discussion and Analysis of Financial Condition and Results of Operation – Critical Accounting Policies,” below for additional information. |
| (5) | Net interest margin is calculated by dividing tax equivalent net interest income by total average earning assets. |
| (6) | Tangible book value is not a measurement under accounting principles generally accepted in the United States. It is computed by subtracting identified intangible assets and goodwill from total Middleburg Financial Corporation shareholders’ equity and then dividing the result by the number of shares of common stock issued and outstanding at the end of the accounting period. |
| MANAGEMENT’S DISCUSSION AND ANALYSIS OF FINANCIAL CONDITION AND RESULTS OF OPERATIONS |
The following discussion provides information about the major components of the results of operations and financial condition, liquidity, and capital resources of the Company. This discussion and analysis should be read in conjunction with the Company’s Consolidated Financial Statements and Notes to Consolidated Financial Statements. It should also be read in conjunction with the “Caution About Forward Looking Statements” section at the end of this discussion.
Overview
The Company is headquartered in Middleburg, Virginia and conducts its primary operations through two wholly owned subsidiaries, Middleburg Bank and Middleburg Investment Group, Inc and a majority owned subsidiary, Southern Trust Mortgage, LLC. Middleburg Bank is a community bank serving the Virginia counties of Prince William, Loudoun, Fairfax, Fauquier and the town of Williamsburg with nine financial service centers and two limited service facilities. Middleburg Investment Group is a non-bank holding company with one wholly owned subsidiary, Middleburg Trust Company, which in turn wholly owns Middleburg Investment Advisors, Inc. Middleburg Trust Company is a trust company headquartered in Richmond, Virginia, and maintains offices in Williamsburg, Virginia and in several of Middleburg Bank’s facilities. Middleburg Investment Advisors is a registered investment advisor headquartered in Alexandria, Virginia serving clients in 24 states. Southern Trust Mortgage is a regional mortgage company headquartered in Virginia Beach, Virginia and maintains offices in Virginia, Maryland, Georgia, North Carolina and South Carolina.
The Company generates a significant amount of its income from the net interest income earned by Middleburg Bank. Net interest income is the difference between interest income and interest expense. Interest income depends on the amount of interest-earning assets outstanding during the period and the interest rates earned thereon. Middleburg Bank’s cost of money is a function of the average amount of deposits and borrowed money outstanding during the period and the interest rates paid thereon. The quality of the assets further influences the amount of interest income lost on non-accrual loans and the amount of additions to the allowance for loan losses or potential other-than-temporary impairment of securities. Middleburg Investment Group’s subsidiaries, Middleburg Trust Company and Middleburg Investment Advisors, generate fee income by providing investment management and trust services to its clients. Investment management and trust fees are generally based upon the value of assets under management, and, therefore can be significantly affected by fluctuations in the values of securities caused by changes in the capital markets. Southern Trust Mortgage generates fees from the origination and sale of mortgages loans. Southern Trust Mortgage also maintains a real estate construction portfolio and receives interest and fee income from these loans, which, net of interest expense, is included in net interest income.
At December 31, 2010, total assets were $1.1 billion, an increase of 13.1% or $128.2 million from total assets of $976.4 million at December 31, 2009. Total loans, including mortgages held for sale increased $29.4 million from $689.3 million at December 31, 2009 to $718.7 million at December 31, 2010. Total deposits increased by $84.7 million or 10.5% from $805.6 million at December 31, 2009 to $890.3 million at December 31, 2010. Lower cost deposits, including demand checking, interest checking and savings increased $64.5 million or 12.8% from the year ended December 31, 2009 to $567.2 million for the year ended December 31, 2010. Higher cost time deposits, excluding brokered certificates of deposit, increased 9.3% or $22.2 million from the year ended December 31, 2009 to $261.1 million for the year ended December 31, 2010. The shift in the mix of deposits as well as lower interest rates paid on deposits and borrowings during 2010 contributed to the 72 basis point decrease in the overall cost of interest-bearing liabilities from 2009 to 2010. The net interest margin, a non-GAAP measure more fully described in the “Results of Operations” section below, decreased from 4.17% for the year ended December 31, 2009 to 3.61% for the year ended December 31, 2010. The decrease is attributed to the 72 basis point decrease in yield of total interest bearing liabilities as compared to the 114 basis point decrease, on a tax equivalent basis, in yield of total interest bearing assets. The provision for loan losses increased by $7.5 million for the year ended December 31, 2010 to $12.0 million compared to $4.5 million for the same period in 2009. The Company recognized other-than-temporary impairment on trust preferred securities of $1.1 million for the year ended December 31, 2010 compared to $1.1 million for the same period in 2009. Total non-interest income increased by $5.1 million for the year ended December 31, 2010, compared to same period in 2009. The increase is largely due to gains on the sale of loans by the Company’s mortgage banking subsidiary, Southern Trust Mortgage. Non-interest expense in 2010 increased $3.9 million, up 7.9% from 2009, driven primarily by commissions related to the increased production at Southern Trust Mortgage, increased occupancy expenses related to the opening of the Gainesville financial service center, higher advertising expenses, increased OREO expenses, and a valuation adjustment on former branch sites.
Total non-interest expenses for the years ended December 31, 2010, 2009, and 2008 include the consolidated expenses of Southern Trust Mortgage. Although the Company is focused on keeping growth in non-interest expense low in the future, because of the Company’s plans to engage in growth and expansion, it is expected that non-interest expense will continue to grow in the future at a rate similar to previous years. The Company remains well capitalized with risk-adjusted core capital and total capital ratios well above the regulatory minimums.
With the creation of Middleburg Investment Group, the Company has expanded the integration of Middleburg Trust Company, Middleburg Investment Advisors and Middleburg Bank’s investment services department into a more focused wealth management program for all of the Company’s clients. The Company intends to make each of its wealth management services available within all of its financial service centers. Also, through the affiliation with Southern Trust Mortgage, Middleburg Bank plans to continue to increase its loan portfolio by purchasing high credit quality, low loan to value first deeds of trusts on residential property. Middleburg Bank plans to continue its focus on low cost deposit growth with advertising campaigns and product development.
The Company is not aware of any current recommendations by any regulatory authorities that, if they were implemented, would have a material effect on the registrant’s liquidity, capital resources or results of operations.
Critical Accounting Policies
General
The financial condition and results of operations presented in the Consolidated Financial Statements, the accompanying Notes to the Consolidated Financial Statements and this section are, to some degree, dependent upon the accounting policies of the Company. The selection and application of these accounting policies involve judgments, estimates, and uncertainties that are susceptible to change.
Presented below is discussion of those accounting policies that management believes are the most important (“Critical Accounting Policies”) to the portrayal and understanding of Middleburg Financial Corporation’s financial condition and results of operations. The Critical Accounting Policies require management’s most difficult, subjective and complex judgments about matters that are inherently uncertain. In the event that different assumptions or conditions were to prevail, and depending upon the severity of such changes, the possibility of materially different financial condition or results of operations is a reasonable likelihood.
Allowance for Loan Losses
Middleburg Bank monitors and maintains an allowance for loan losses to absorb an estimate of probable losses inherent in the loan portfolio. Middleburg Bank maintains policies and procedures that address the systems of controls over the following areas of maintenance of the allowance: the systematic methodology used to determine the appropriate level of the allowance to provide assurance they are maintained in accordance with accounting principles generally accepted in the United States of America; the accounting policies for loan charge-offs and recoveries; the assessment and measurement of impairment in the loan portfolio; and the loan grading system.
Middleburg Bank evaluates various loans individually for impairment as required by applicable accounting standards. Loans evaluated individually for impairment include non-performing loans, such as loans on non-accrual, loans past due by 90 days or more, restructured loans and other loans selected by management. The evaluations are based upon discounted expected cash flows or collateral valuations. If the evaluation shows that a loan is individually impaired, then a specific reserve is established for the amount of impairment. If a loan evaluated individually is not impaired, then the loan is assessed for impairment with a group of loans that have similar characteristics.
For loans without individual measures of impairment, Middleburg Bank makes estimates of losses for groups of loans as required by applicable accounting standards. Loans are grouped by similar characteristics, including the type of loan, the assigned loan grade and the general collateral type. A loss rate reflecting the expected loss inherent in a group of loans is derived based upon estimates of default rates for a given loan grade, the predominant collateral type for the group and the terms of the loan. The resulting estimate of losses for groups of loans are adjusted for relevant environmental factors and other conditions of the portfolio of loans, including: borrower and industry concentrations; levels and trends in delinquencies, charge-offs and recoveries; changes in underwriting standards and risk selection; level of experience, ability and depth of lending management; and national and local economic conditions.
The amount of estimated impairment for individually evaluated loans and groups of loans is added together for a total estimate of loans losses. This estimate of losses is compared to the allowance for loan losses of Middleburg Bank as of the evaluation date and, if the estimate of losses is greater than the allowance, an additional provision to the allowance would be made. If the estimate of losses is less than the allowance, the degree to which the allowance exceeds the estimate is evaluated to determine whether the allowance falls outside a range of estimates. If the estimate of losses is below the range of reasonable estimates, the allowance would be reduced by way of a credit to the provision for loan losses. Middleburg Bank recognizes the inherent imprecision in estimates of losses due to various uncertainties and variability related to the factors used, and therefore a reasonable range around the estimate of losses is derived and used to ascertain whether the allowance is too high. If different assumptions or conditions were to prevail and it is determined that the allowance is not adequate to absorb the new estimate of probable losses, an additional provision for loan losses would be made, which amount may be material to the Consolidated Financial Statements.
Intangibles and Goodwill
The Company has approximately $6.4 million in intangible assets and goodwill at December 31, 2010, a decrease of $171,000 since December 31, 2009, which was attributable to regular amortization of intangible assets. On April 1, 2002, the Company acquired Middleburg Investment Advisors, a registered investment
advisor, for $6.0 million. Approximately $5.9 million of the purchase price was allocated to intangible assets and goodwill. In connection with this investment, a purchase price valuation was completed to determine the appropriate allocation to identified intangibles. The valuation concluded that approximately 42% of the purchase price was related to the acquisition of customer relationships with an amortizable life of 15 years. Another 19% of the purchase price was allocated to a non-compete agreement with an amortizable life of 7 years. The remainder of the purchase price has been allocated to goodwill. As of January 3, 2011, Middleburg Investment Advisors was merged into Middleburg Trust Company. Approximately $1.0 million of the $6.4 million in intangible assets and goodwill at December 31, 2010 is attributable to the Company’s investment in Middleburg Trust Company. With the consolidation of Southern Trust Mortgage, the Company recognized $1.9 million in goodwill as part of its equity investment.
The purchase price allocation process requires management estimates and judgment as to expectations for the life span of various customer relationships as well as the value that key members of management add to the success of the Company. For example, customer attrition rates were determined based upon assumptions that the past five years may predict the future. If the actual attrition rates, among other assumptions, differed from the estimates and judgments used in the purchase price allocation, the amounts recorded in the Consolidated Financial Statements could result in a possible impairment of the intangible assets and goodwill or require acceleration in the amortization expense.
In addition, current accounting standards require that goodwill be tested annually using a two-step process. The first step is to identify a potential impairment. The second step measures the amount of the impairment loss, if any. Processes and procedures have been identified for the two-step process. The most recent evaluation was conducted as of September 30, 2010.
As of December 31, 2010, the Company recognized two consolidated subsidiaries as reporting units for the purpose of goodwill evaluation and reporting: Southern Trust Mortgage (“STM”) and Middleburg Investment Group (“MIG”). MIG is the parent company of Middleburg Trust Company and the former Middleburg Investment Advisors. The following table shows the allocation of goodwill between the two reporting units and the percentage by which the fair value of each reporting unit as of September 30, 2010 (the most recent fair value evaluation date) exceeded the carrying value as of that date:
| Allocation of Goodwill to Reporting Units | ||||||||||||||||||||
| (Dollars in Thousands) | ||||||||||||||||||||
| Percentage by | ||||||||||||||||||||
| (1) | (1) | which Fair Value | ||||||||||||||||||
| Carrying Value | Carrying Value | Estimated Fair Value | of Reporting | |||||||||||||||||
| Reporting | of Goodwill | of Reporting Unit | of Reporting Unit | Unit Exeeds | ||||||||||||||||
| Unit | September 30, 2010 | September 30, 2010 | September 30, 2010 | Carrying Value | ||||||||||||||||
| STM | $ | 1,867 | $ | 6,547 | $ | 7,797 | 19.09 | % | ||||||||||||
| MIG | 3,422 | 5,952 | (2 | ) | 6,790 | 14.08 | % | |||||||||||||
| Total | $ | 5,289 | $ | 12,499 | $ | 14,587 | 16.71 | % | ||||||||||||
| (1) Reported amounts reflect only Middleburg Financial Corporation shareholders' ownership interests. Estimated fair values are as of September 30, 2010. Management does not believe the estimated fair values have changed significantly from September 30, 2010 to December 31, 2010. | ||||||||||||||||||||
| (2) Includes $1.1 million of amortizing intangible assets. | ||||||||||||||||||||
Management estimates fair value utilizing multiple methodologies which include discounted cash flows, comparable companies, third-party sale and assets under management analysis. Determining the fair value of the Company’s reporting units requires management to make judgments and assumptions related to various items,
including estimates of future operating results, allocations of indirect expenses, and discount rates. Management believes its estimates and assumptions are reasonable; however, the fair value of each reporting unit could be different in the future if actual results or market conditions differ from the estimates and assumptions used.
The Company’s forecasted cash flows for its reporting units assume a stable economic environment and consistent long-term growth in loan originations and assets under management over the projected periods. Additionally, expenses are assumed to be consistently correlated with projected asset and revenue growth over the time periods projected. Although we believe the key assumptions underlying the financial forecasts to be reasonable, they are inherently uncertain and involve a number of risks and uncertainties that are beyond the control of the Company. Accordingly, there can be no assurance that the forecasted results will be realized and variations from the forecast may be material. If weak economic conditions continue or worsen for a prolonged period of time, or if the reporting unit loses key personnel, the fair value of the reporting unit may be adversely affected which may result in impairment of goodwill or other intangible assets in the future. Any changes in the key management estimates or judgments could result in an impairment charge, and such a charge could have an adverse effect on the Company’s financial condition and results of operations.
Tax-Equivalent Interest Income
Tax-equivalent interest income is gross interest income adjusted for the non-taxable interest income earned on loans, municipal securities and corporate securities, which are dividend-received deduction eligible. The effective tax rate of 34% is used in calculating tax equivalent income related to loans, municipal securities and corporate securities. A dividend-received deduction of 70% is used in determining tax-equivalent income related to corporate securities, as well.
Other-Than-Temporary Impairment (OTTI)
Approximately $1.1 million in losses related to other-than-temporary impairment on trust-preferred securities was recognized in 2010. At December 31, 2010, the Company $800,000 in trust preferred securities in its portfolio.
In accordance with applicable accounting guidance, we determine other-than-temporary impairment for the trust preferred securities in the securities portfolio based on an evaluation of the underlying collateral. We developed cash flow projections based upon assumptions of default/deferral rates, recovery rates, and prepayment rates for the collateral. The present value of the projected cash flows was calculated by discounting the projected cash flows using the effective yield at purchase in accordance with applicable accounting guidance. Finally the present values of the projected cash flows were compared to the carrying values of the securities. If the present values were less than the carrying value, we determined that the security had an other-than-temporary impairment equal to the difference between the present value and the carrying value of the bond.
The Company may need to recognize additional other-than-temporary impairments related to trust preferred securities in 2011. We evaluate our default assumptions and cash flow projections in relation to the credit performance of the collateral that underlies the trust preferred securities. Should additional deferrals/defaults occur on the collateral, projected cash flows from the collateral could be reduced which could result in other-than-temporary impairments in 2011.
Results of Operations
Net Income (Loss)
The Company had a net loss for 2010 of $2.7 million, compared to net income of $3.5 million in 2009. For 2010, the loss per diluted share was $0.39 compared to earnings per diluted share of $0.37 and $0.56 for 2009 and 2008, respectively.
Return on average assets (“ROA”) measures how effectively the Company employs its assets to produce net income. The ROA for the Company was -0.25% for the year ended December 31, 2010 compared to 0.35% and 0.28% for the years ended December 31, 2009 and 2008 respectively. Return on average equity (“ROE”), another measure of earnings performance, indicates the amount of net income earned in relation to the total average equity capital invested. ROE declined to -2.7% for the year ended December 31, 2010. ROE was 3.2% and 3.4% for the years ended December 31, 2009 and 2008, respectively.
The following table reflects an analysis of the Company’s net interest income using the daily average balances of the Company’s assets and liabilities as of December 31. Non-accrual loans are included in the loan average balances.
Average Balances, Income and Expenses, Yields and Rates
(Years Ended December 31)
| 2010 | 2009 | 2008 | ||||||||||||||||||||||||||||||||||
| Average | Income/ | Yield/ | Average | Income/ | Yield/ | Average | Income/ | Yield/ | ||||||||||||||||||||||||||||
| Balance | Expense | Rate | Balance | Expense | Rate | Balance | Expense | Rate | ||||||||||||||||||||||||||||
| (Dollars in thousands) | ||||||||||||||||||||||||||||||||||||
| Assets : | ||||||||||||||||||||||||||||||||||||
| Securities: | ||||||||||||||||||||||||||||||||||||
| Taxable | $ | 159,326 | $ | 4,838 | 3.04 | % | $ | 105,765 | $ | 4,830 | 4.57 | % | $ | 108,482 | $ | 5,483 | 5.05 | % | ||||||||||||||||||
| Tax-exempt (1) | 59,654 | 3,810 | 6.39 | % | 64,305 | 4,461 | 6.94 | % | 47,975 | 3,306 | 6.89 | % | ||||||||||||||||||||||||
| Total securities | $ | 218,980 | $ | 8,648 | 3.95 | % | $ | 170,070 | $ | 9,291 | 5.46 | % | $ | 156,457 | $ | 8,789 | 5.62 | % | ||||||||||||||||||
| Loans | ||||||||||||||||||||||||||||||||||||
| Taxable | $ | 707,135 | $ | 40,548 | 5.73 | % | $ | 710,745 | $ | 48,834 | 6.87 | % | $ | 689,210 | $ | 48,088 | 6.98 | % | ||||||||||||||||||
| Tax-exempt (1) | - | - | 0.00 | % | 1 | - | 0.00 | % | 8 | 1 | 12.50 | % | ||||||||||||||||||||||||
| Total loans | $ | 707,135 | $ | 40,548 | 5.73 | % | $ | 710,746 | $ | 48,834 | 6.87 | % | $ | 689,218 | $ | 48,089 | 6.98 | % | ||||||||||||||||||
| Federal funds sold | - | - | 0.00 | % | 20,607 | 42 | 0.20 | % | 7,604 | 139 | 1.83 | % | ||||||||||||||||||||||||
| Interest bearing deposits in | ||||||||||||||||||||||||||||||||||||
| other financial institutions | 47,836 | 131 | 0.27 | % | 38,485 | 95 | 0.25 | % | 4,097 | 165 | 4.03 | % | ||||||||||||||||||||||||
| Total earning assets | $ | 973,951 | $ | 49,327 | 5.06 | % | $ | 939,908 | $ | 58,262 | 6.20 | % | $ | 857,376 | $ | 57,182 | 6.67 | % | ||||||||||||||||||
| Less: allowances for credit losses | (11,119 | ) | (9,160 | ) | (9,251 | ) | ||||||||||||||||||||||||||||||
| Total nonearning assets | 94,005 | 83,698 | 77,029 | |||||||||||||||||||||||||||||||||
| Total assets | $ | 1,056,837 | $ | 1,104,446 | $ | 925,154 | ||||||||||||||||||||||||||||||
| Liabilities: | ||||||||||||||||||||||||||||||||||||
| Interest-bearing deposits: | ||||||||||||||||||||||||||||||||||||
| Checking | $ | 283,294 | $ | 2,294 | 0.81 | % | $ | 251,781 | $ | 3,091 | 1.23 | % | $ | 188,886 | $ | 3,755 | 1.99 | % | ||||||||||||||||||
| Regular savings | 77,864 | 725 | 0.93 | % | 59,095 | 749 | 1.27 | % | 54,891 | 951 | 1.73 | % | ||||||||||||||||||||||||
| Money market savings | 53,894 | 427 | 0.79 | % | 42,985 | 473 | 1.10 | % | 39,267 | 465 | 1.18 | % | ||||||||||||||||||||||||
| Time deposits: | ||||||||||||||||||||||||||||||||||||
| $100,000 and over | 160,063 | 4,298 | 2.69 | % | 135,149 | 4,342 | 3.21 | % | 127,398 | 5,021 | 3.94 | % | ||||||||||||||||||||||||
| Under $100,000 | 161,338 | 4,289 | 2.66 | % | 187,115 | 6,959 | 3.72 | % | 127,114 | 5,299 | 4.17 | % | ||||||||||||||||||||||||
| Total interest-bearing deposits | $ | 736,453 | $ | 12,033 | 1.63 | % | $ | 676,125 | $ | 15,614 | 2.31 | % | $ | 537,556 | $ | 15,491 | 2.88 | % | ||||||||||||||||||
| Short-term borrowings | 10,419 | 393 | 3.77 | % | 19,424 | 593 | 3.05 | % | 44,983 | 1,988 | 4.42 | % | ||||||||||||||||||||||||
| Securities sold under agreements | ||||||||||||||||||||||||||||||||||||
| to repurchase | 25,314 | 205 | 0.81 | % | 21,122 | 40 | 0.19 | % | 40,924 | 831 | 2.03 | % | ||||||||||||||||||||||||
| Long-term debt | 55,303 | 1,544 | 2.79 | % | 69,407 | 2,835 | 4.08 | % | 100,308 | 4,398 | 4.38 | % | ||||||||||||||||||||||||
| Federal funds purchased | 25 | - | - | % | - | - | - | % | 397 | 11 | 2.77 | % | ||||||||||||||||||||||||
| Total interest-bearing liabilities | $ | 827,514 | $ | 14,175 | 1.71 | % | $ | 786,078 | $ | 19,082 | 2.43 | % | $ | 724,168 | $ | 22,719 | 3.14 | % | ||||||||||||||||||
| Non-interest bearing liabilities | ||||||||||||||||||||||||||||||||||||
| Demand deposits | 120,475 | 107,936 | 114,466 | |||||||||||||||||||||||||||||||||
| Other liabilities | 6,850 | 10,620 | 7,328 | |||||||||||||||||||||||||||||||||
| Total liabilities | $ | 954,839 | $ | 904,634 | $ | 845,961 | ||||||||||||||||||||||||||||||
| Non-controlling interest in consolidated Subsidiary | 2,876 | 2,774 | 3,232 | |||||||||||||||||||||||||||||||||
| Shareholders’ equity | 99,122 | 107,038 | 75,961 | |||||||||||||||||||||||||||||||||
| Total liabilities and Shareholders’ equity | $ | 1,056,837 | $ | 1,104,446 | $ | 925,154 | ||||||||||||||||||||||||||||||
| Net interest income | $ | 35,152 | $ | 39,180 | $ | 34,463 | ||||||||||||||||||||||||||||||
| Interest rate spread | 3.35 | % | 3.77 | % | 3.53 | % | ||||||||||||||||||||||||||||||
| Interest expense as a percent of | ||||||||||||||||||||||||||||||||||||
| average earning assets | 1.46 | % | 2.03 | % | 2.65 | % | ||||||||||||||||||||||||||||||
| Net interest margin | 3.61 | % | 4.17 | % | 4.02 | % | ||||||||||||||||||||||||||||||
___________
(1) Income and yields are reported on tax equivalent basis assuming a federal tax rate of 34%.
Net Interest Income
Net interest income represents the principal source of earnings of the Company. Net interest income is the amount by which interest generated from earning assets exceeds the expense of funding those assets. Changes in volume and mix of interest earning assets and interest bearing liabilities, as well as their respective yields and rates, have a significant impact on the level of net interest income.
Net interest income was $33.9 million for the year ended December 31, 2010 This is a decrease of 10.1% over the $37.7 million reported for the same period in 2009. Net interest income for 2009 increased 13.6% over the $33.2 million reported for 2008. The net interest margin decreased 56 basis points to 3.61% in 2010. The net interest margin is calculated by dividing tax equivalent net interest income by total average earning assets. Because a portion of interest income earned by the Company is nontaxable, the tax equivalent net interest income is considered in the calculation of this ratio. Tax equivalent net interest income is calculated by adding the tax benefit realized from interest income that is nontaxable to total interest income then subtracting total interest expense. The tax rate utilized in calculating the tax benefit for each of 2010, 2009 and 2008 is 34%. The reconciliation of tax equivalent net interest income, which is not a measurement under accounting principles generally accepted in the United States, to net interest income is reflected in the table below.
| Reconciliation of Net Interest Income to | ||||||||||||
| Tax Equivalen Net Interest Income | ||||||||||||
| For the Year Ended December 31, | ||||||||||||
| (in thousands) | 2010 | 2009 | 2008 | |||||||||
| GAAP measures: | ||||||||||||
| Interest Income - Loans | $ | 40,548 | $ | 48,834 | $ | 48,088 | ||||||
| Interest Income - Investments & Other | 7,483 | 7,912 | 7,834 | |||||||||
| Interest Expense - Deposits | 12,033 | 15,614 | 15,492 | |||||||||
| Interest Expense - Other Borrowings | 2,142 | 3,468 | 7,227 | |||||||||
| Total Net Interest Income | $ | 33,856 | $ | 37,664 | $ | 33,203 | ||||||
| Plus: | ||||||||||||
| NON-GAAP measures: | ||||||||||||
| Tax Benefit Realized on Non-Taxable Interest Income - Loans | $ | - | $ | - | $ | 1 | ||||||
| Tax Benefit Realized on Non-Taxable Interest Income - Municipal | ||||||||||||
| Securities | 1,296 | 1,516 | 1,259 | |||||||||
| Total Tax Benefit Realized on Non-Taxable Interest Income | $ | 1,296 | $ | 1,516 | $ | 1,260 | ||||||
| Total Tax Equivalent Net Interest Income | $ | 35,152 | $ | 39,180 | $ | 34,463 | ||||||
The decrease in net interest income in 2010 resulted from a decrease in yields on earning assets which was not entirely offset by reduced funding costs. Interest income and fees from loans and investments decreased 15.36% during 2010. The cost of interest bearing liabilities in 2010 decreased to 1.71%, down 72 basis points relative to 2009.
The yield on the loan portfolio decreased 114 basis points in 2010 to 5.73% versus 2009. On average, the loan portfolio decreased by $3.6 million or 0.5% over the year ended December 31, 2009. Interest income from loans decreased $8.3 million or 16.97% over the year ended December 31, 2009. The average balance in the securities portfolio increased by $48.9 million in 2010, while the tax-equivalent yield decreased 151 basis points to 3.95%.
The average balance of interest bearing accounts (interest bearing checking, savings and money market accounts) increased 17.3% to $415.0 million at December 31, 2010. The cost of such funding decreased 39 basis points over the year ended December 31, 2009. The average balance of interest bearing checking increased 12.5% with a corresponding cost decrease of 42 basis points. The average balances in total time deposits was relatively unchanged while the cost of those deposits decreased 82 basis points. The increase in the average balance of time deposits greater than $100,000 was $25.0 million. These deposits typically have a higher cost when compared to all other interest bearing deposits and do not include brokered certificates of deposit.
During 2010, non-deposit interest bearing liabilities decreased on average by $18.9 million. The Company decreased its average short-term borrowings by $9.0 million or 46.3% over the year ended December 31, 2009. The Company decreased its average long term debt by $14.1 million or 20.3% over the year ended December 31, 2009. Much of the decrease in borrowings was offset by the increases in deposits as the Company focused its efforts on deposit generation. Total interest expense for 2010 was $14.2 million, a decrease of $4.9 million compared to the total interest expense for 2009. The cost of interest-bearing liabilities decreased 72 basis points over the year ended December 31, 2009.
Management believes that the net interest margin could compress further during 2011. Based on conservative internal interest rate risk models and the assumption of a sustained low rate environment, the Company expects net interest income to trend downward slightly throughout the next 12 months as loan related assets reprice and the decline in funding costs slows. The expected decrease to net interest income over a 12 month period could be 3.1% or $1.1 million if interest rates were to rise 100 basis points immediately. It is anticipated that targeted growth in earning assets and liability repricing opportunities will help mitigate the above mentioned impact to the Company’s net interest margin. The Asset/Liability Management Committee continues to focus on various strategies to maintain the net interest margin.
The following table analyzes changes in net interest income attributable to changes in the volume of interest-bearing assets and liabilities compared to changes in interest rates. The change in interest due to both volume and rate has been allocated to volume and rate changes in proportion to the relationship of the absolute dollar amounts of the change in each. Non-accruing loans are included in the average outstanding loans.
Volume and Rate Analysis
(Tax Equivalent Basis)
(Years Ended December 31)
| 2010 vs. 2009 | 2009 vs. 2008 | |||||||||||||||||||||||
| Increase (Decrease) Due | Increase (Decrease) Due | |||||||||||||||||||||||
| to Changes in: | to Changes in: | |||||||||||||||||||||||
| (In Thousands) | ||||||||||||||||||||||||
| Volume | Rate | Total | Volume | Rate | Total | |||||||||||||||||||
| Earning Assets: | ||||||||||||||||||||||||
| Securities: | ||||||||||||||||||||||||
| Taxable | $ | 2,446 | $ | (2,438 | ) | $ | 8 | $ | (166 | ) | $ | (487 | ) | $ | (653 | ) | ||||||||
| Tax-exempt (1) | (323 | ) | (328 | ) | (651 | ) | 1,133 | 22 | 1,155 | |||||||||||||||
| Loans: | ||||||||||||||||||||||||
| Taxable | (248 | ) | (8,038 | ) | (8,286 | ) | 1,458 | (712 | ) | 746 | ||||||||||||||
| Tax-exempt (1) | -- | -- | -- | -- | (1 | ) | (1 | ) | ||||||||||||||||
| Federal funds sold | (42 | ) | -- | (42 | ) | (202 | ) | (299 | ) | (97 | ) | |||||||||||||
| Interest bearing deposits in other | ||||||||||||||||||||||||
| financial institutions | 23 | 13 | 36 | 79 | (149 | ) | (70 | ) | ||||||||||||||||
| Total earning assets | $ | 1,856 | $ | (10,791 | ) | $ | (8,935 | ) | $ | 2,302 | $ | (1,626 | ) | $ | 676 | |||||||||
| Interest-Bearing Liabilities: | ||||||||||||||||||||||||
| Interest checking | $ | 387 | $ | (1,184 | ) | $ | (797 | ) | $ | 4,468 | $ | (5,132 | ) | $ | (664 | ) | ||||||||
| Regular savings deposits | 262 | (286 | ) | (24 | ) | 130 | (322 | ) | (192 | ) | ||||||||||||||
| Money market deposits | 120 | (166 | ) | (46 | ) | 32 | (24 | ) | 8 | |||||||||||||||
| Time deposits | ||||||||||||||||||||||||
| $100,000 and over | 800 | (844 | ) | (44 | ) | 333 | (1,012 | ) | (679 | ) | ||||||||||||||
| Under $100,000 | (1,007 | ) | (1,663 | ) | (2,670 | ) | 2,119 | (459 | ) | 1,660 | ||||||||||||||
| Total interest bearing deposits | $ | 562 | $ | (4,143 | ) | $ | (3,581 | ) | $ | 7,082 | $ | (6,949 | ) | $ | 133 | |||||||||
| Short-term borrowings | $ | (275 | ) | $ | 75 | $ | (200 | ) | $ | (903 | ) | $ | (492 | ) | $ | (1,395 | ) | |||||||
| Securities sold under agreement | ||||||||||||||||||||||||
| to repurchase | 8 | 157 | 165 | (276 | ) | (515 | ) | (791 | ) | |||||||||||||||
| Long-term debt | (576 | ) | (715 | ) | (1,291 | ) | (1,279 | ) | (284 | ) | (1,563 | ) | ||||||||||||
| Federal funds purchased | - | - | - | (11 | ) | - | (11 | ) | ||||||||||||||||
| Total interest bearing | ||||||||||||||||||||||||
| Liabilities | $ | (281 | ) | $ | (4,626 | ) | $ | (4,907 | ) | $ | 4,613 | $ | (8,240 | ) | $ | (3,627 | ) | |||||||
| Change in net interest income | $ | 2,137 | $ | (6,165 | ) | $ | ( 4,028 | ) | $ | (2,311 | ) | $ | 6,614 | $ | 4,303 | |||||||||
_______________
(1) Income and yields are reported on tax equivalent basis assuming a federal tax rate of 34%.
Provision for Loan Losses
The Company’s loan loss provision during 2010 and 2009 was $12.0 million and $4.5 million, respectively. The Company is committed to making loan loss provisions that maintain an allowance that adequately reflects the risk inherent in the loan portfolio. This commitment is more fully discussed in the “Allowance for loan losses” section below.
Non-interest Income
Non-interest income has been and will continue to be an important factor for increasing profitability. Management recognizes this and continues to review and consider areas where non-interest income can be increased. Non-interest income includes fees generated by the commercial and retail banking segment, the wealth management segment and the mortgage banking segment of the Company. Non-interest income (excluding securities gains and losses and impairment losses) increased 32.2% to $26.3 million for the year ended December 31, 2010, compared to $19.9 million for 2009. The increases in the sub-categories of non-interest income were largely the result of increases in gain-on-sale of mortgage loans.
Service charges, which include deposit fees and certain loan processing fees, decreased 2.5% to $2.4 million for the year ended December 31, 2010, compared to $2.4 million for the year ended December 31, 2009.
Income from the wealth management segment is produced by Middleburg Investment Advisors, Middleburg Trust Company and the investment services department of Middleburg Bank. Middleburg Investment Advisors was absorbed into Middleburg Trust Company on January 3, 2011. Investment advisory fees from Middleburg Investment Advisors decreased 13.6% to $1.2 million for the year ended December 31, 2010, compared to $1.4 million for the year ended December 31, 2009. Middleburg Investment Advisors is predominantly a fixed income money manager that bases its fee upon the market value of the accounts under management. Assets under management at Middleburg Investment Advisors were $314.7 million at December 31, 2010, unchanged from the same period in 2009. Middleburg Trust Company produced fiduciary fees that increased 16.7% to $2.1 million for the year ended December 31, 2010, compared to $1.8 million for the same period in 2009. Assets under management at Middleburg Trust Company increased 20.9% or $160.9 million to $932.4 million at December 31, 2010. The increase in assets under management at Middleburg Trust Company resulted primarily from an overall increase in market values of the accounts under management as well as improved business development activities resulting in more accounts under management. Middleburg Bank holds a large portion of its investment portfolio in custody with Middleburg Trust Company. Commissions on investment services fees from the investment services department of Middleburg Bank increased to $622,000 for the year ended December 31, 2010, compared to $580,000 for the year ended December 31, 2009.
The revenues, expenses, assets and liabilities of Southern Trust Mortgage for the year ended December 31, 2010 are reflected in the Company’s financial statements on a consolidated basis, with the proportionate share of Southern Trust Mortgage’s income not owned by the Company reported as “Net income (loss) attributable to non-controlling interest”. Accordingly, gains and fees on mortgages held for sale of $17.2 million and $1.9 million, respectively, which were generated by Southern Trust Mortgage for the year ended December 31, 2010, are being reported as part of the consolidated Non-interest income. For the year ended December 31, 2010, Southern Trust Mortgage closed $782 million in loans, compared to $990 million in loans for the year ended 2009. During 2010, Southern Trust Mortgage continued to address problem loans through charge-offs and increases in the allowance for loan losses in anticipation of additional charge-offs. The majority of the problem loans are due to credit risk in their remaining construction portfolio and early payment defaults of loans sold to investors, both of which are issues facing mortgage bankers in the current economic climate. Southern Trust Mortgage continues to analyze the problem loans and its construction portfolio as well as refine its methodology to estimate the expected loss and required reserve.
Income earned from Middleburg Bank’s $15.5 million investment in Bank Owned Life Insurance (BOLI) contributed $503,000 to total other income for the year ended December 31, 2010. The Company purchased $6.0 million of BOLI in the third quarter of 2004, $4.8 million in the fourth quarter of 2004, $485,000 in the second quarter of 2007, $453,000 in the fourth quarter of 2009, and $682,000 in the second quarter of 2010 to help subsidize increasing employee benefit costs and expenses related to the restructuring of its supplemental retirement plans.
The Company had net realized gains of $866,000 from sales of securities for the year ended December 31, 2010, compared to $2.1 million for the year ended December 31, 2009. Additionally, $1.1 million and $1.1 million in losses related to other-than-temporary impairment on trust-preferred securities were recognized in 2010 and 2009 respectively.
Other operating income increased by $79,000 to $390,000 for the year ended December 31, 2010, compared to the same period in 2009. Other operating income includes equity earnings recognized by Southern Trust Mortgage from its investments in several mortgage partnerships of $243,700 and equity earnings recognized by Middleburg Bank Service Corporation from its equity investments.
Non-interest income (excluding securities gains and losses and impairment losses) increased 11.8% to $19.9 million for the year ended December 31, 2009, compared to $17.8 million for 2008.
Service charges, which include deposit fees and certain loan fees, decreased 2.2% to $2.4 million for the year ended December 31, 2009, compared to $2.5 million for the year ended December 31, 2008. Investment advisory fees of $1.4 million for the year ended December 31, 2009 are from Middleburg Investment Advisors which was absorbed into Middleburg Trust Company on January 3, 2011. Investment advisory fees decreased $406,000 for the year ended December 31, 2009 compared to the 2008 investment advisory fee amount of $1.8 million. Middleburg Trust Company produced fiduciary fees that decreased 5.9% to $1.8 million for the year ended December 31, 2009, compared to $1.9 million for the same period in 2008.
Investment sales fees increased to $580,000 for the year ended December 31, 2009, compared to $433,000 for the year ended December 31, 2008.
Non-interest Income
(Years Ended December 31)
| 2010 | 2009 | 2008 | ||||||||||
| (In thousands) | ||||||||||||
| Service charges, commissions and fees | $ | 2,351 | $ | 2,412 | $ | 2,467 | ||||||
| Trust fee income | 2,121 | 1,812 | 1,925 | |||||||||
| Investment advisory fee income | 1,214 | 1,406 | 1,812 | |||||||||
| Commission on investment sales | 622 | 580 | 433 | |||||||||
| Gains on loans held for sale | 17,158 | 11,860 | 8,656 | |||||||||
| Fees on mortgages held for sale | 1,881 | 1,044 | 1,440 | |||||||||
| Bank-owned life insurance | 503 | 489 | 469 | |||||||||
| Other operating income | 390 | 311 | 615 | |||||||||
| Non-interest income | $ | 26,240 | $ | 19,914 | $ | 17,817 | ||||||
| Gains (Losses) on securities available for sale, net, and impairment losses | (237 | ) | 998 | (913 | ) | |||||||
| Total non-interest income | $ | 26,003 | $ | 20,912 | $ | 16,904 | ||||||
Non-interest Expense
Non-interest expense increased 7.8% to $52.7 million for the year ended December 31, 2010, compared to $48.9 million for 2009. When taken as a percentage of total average assets for the year ended December 31, 2010, the expense was 4.9% of total average assets, an increase from 4.4% for the same period in 2009.
Salaries and employee benefits increased $1.6 million to $29.6 million when comparing the year ended December 31, 2010 to the same period in 2009. The increase is largely due to an increase in commissions resulting from higher loan originations by Southern Trust Mortgage in 2010. The remainder of the increase is the result of an increase in the number of full time employees in 2010. The Company had 350 full-time equivalent employees at December 31, 2010 compared with 340 at December 31, 2009.
Net occupancy and equipment expenses increased 5.1% to $6.2 million for the year ended December 31, 2010, compared to $5.9 million for the same period in 2009. The increase was largely due to the costs associated with opening a financial service center in Gainesville, Virginia.
Advertising expense increased 40.9% in 2010 to $1.1 million compared to $760,000 in 2009. The increase was largely due to promotions for various deposit products.
Computer operations expense increased 2.6% to $1.3 million for the year ended December 31, 2010 compared to the same period ended December 31, 2009.
Expense relating to other real estate owned decreased by 47.4% to $2.0 million for the year ended December 31, 2010 compared to $3.8 million for the year ended December 31, 2009.
Other tax expense increased 36% to $798,000 for the year ended December 31, 2010 compared to $587,000 for the year ended December 31, 2009 primarily due to an increase in state franchise taxes.
FDIC expense decreased to $1.9 million for the year ended December 31, 2010 compared to $2.1 million for the year ended December 31, 2009. The decrease in FDIC expense in 2010 was related to a special assessment in June of 2009 which resulted in higher FDIC expenses in that year.
Non-interest expense increased 14.7% to $48.9 million in 2009 compared to 2008. Salaries and employee benefits increased $2.6 million to $28.0 million when comparing the year ended December 31, 2009 to the same period in 2008. The consolidation of Southern Trust Mortgage contributed $10.5 million to the increase in salaries and employee benefits for the year ended December 31, 2008. The Company had 340 full-time equivalent employees at December 31, 2009 compared with 333 at December 31, 2008.
Net occupancy and equipment expenses increased 1.3% to $5.9 million for the year ended December 31, 2009 compared to $5.8 million for the same period in 2008. Advertising expense decreased 17.1% in 2000 to $760,000, compared to $917,000 in 2008. Expense related to other real estate owned was $3.8 million for the year ended December 31, 2009, compared to $1.3 million for the year ended December 31, 2008, and included losses on dispositions. The increase was due to legal expenses related to foreclosure, valuation adjustments and losses on the sales of these assets.
Non-interest Expenses
(Years Ended December 31)
| 2010 | 2009 | 2008 | |||||||||||
| (In thousands) | |||||||||||||
| Salaries and employee benefits | $ | 29,594 | $ | 28,042 | $ | 25,376 | |||||||
| Net occupancy and equipment expense | 6,249 | 5,904 | 5,826 | ||||||||||
| Advertising | 1,071 | 760 | 917 | ||||||||||
| Computer operations | 1,324 | 1,290 | 1,110 | ||||||||||
| Other real estate owned | 2,468 | 3,794 | 1,286 | ||||||||||
| Other taxes | 798 | 587 | 642 | ||||||||||
| Federal Deposit Insurance Corporation expense | 1,907 | 2,051 | 513 | ||||||||||
| Other operating expenses | 9,331 | 6,434 | 6,929 | ||||||||||
| Total | $ | 52,742 | $ | 48,862 | $ | 42,599 | |||||||
Income Taxes
Reported income tax benefit was $2.6 million for the year ended December 31, 2010, compared to income tax expense of $64,000 for the year ended December 31, 2009. The effective tax rate for 2010 was (52.4%) compared to 1.2% in 2009 and 19.8% in 2008. The income tax benefit for the year ended December 31, 2010 compared to the same period in 2009 was primarily due to the operating losses in the third quarter of 2010. Note 10 of the Company’s Consolidated Financial Statements provides a reconciliation between the amount of income tax expense computed using the federal statutory rate and the Company’s actual income tax expense. Also included in Note 10 to the Consolidated Financial Statements is information regarding the principal items giving rise to deferred taxes for the two years ended December 31, 2010.
Summary of Financial Results by Quarter
The following table summarizes the major components of the Company’s results of operations for each quarter of the last three fiscal years.
| 2010 Quarter Ended | ||||||||||||||||
| Dollars in thousands except per share data | March 31 | June 30 | September 30 | December 31 | ||||||||||||
| Net interest income | $ | 8,456 | $ | 8,432 | $ | 7,958 | $ | 9,010 | ||||||||
| Net interest income (loss) after provision | ||||||||||||||||
| for loan losses | 7,527 | 7,141 | (1,172 | ) | 8,355 | |||||||||||
| Other income | 4,717 | 6,191 | 7,335 | 7,997 | ||||||||||||
| Net securities gains (losses) and impairment losses | 355 | (134 | ) | (438 | ) | (20 | ) | |||||||||
| Other expense | 11,943 | 12,266 | 14,387 | 14,146 | ||||||||||||
| Income (loss) before income taxes | 656 | 932 | (8,662 | ) | 2,186 | |||||||||||
| Net income (loss) | 569 | 857 | (5,365 | ) | 1,613 | |||||||||||
| Less: net income (loss) attributable to | ||||||||||||||||
| non-controlling interest | 245 | (133 | ) | (423 | ) | (51 | ) | |||||||||
| Net income (loss) attributable to Middleburg | ||||||||||||||||
| Financial Corporation | 814 | 724 | (5,788 | ) | 1,562 | |||||||||||
| Diluted earnings (loss) per common share | $ | 0.12 | $ | 0.10 | $ | (0.83 | ) | $ | 0.23 | |||||||
| Dividends per common share | 0.10 | 0.10 | 0.10 | 0.05 | ||||||||||||
| 2009 Quarter Ended | ||||||||||||||||
| Dollars in thousands except per share data | March 31 | June 30 | September 30 | December 31 | ||||||||||||
| Net interest income | $ | 9,684 | $ | 9,910 | $ | 9,356 | $ | 8,714 | ||||||||
| Net interest income after provision for | ||||||||||||||||
| loan losses | 8,647 | 8,327 | 8,392 | 7,747 | ||||||||||||
| Other income | 4,757 | 5,468 | 4,590 | 5,099 | ||||||||||||
| Net securities gains (losses) and impairment losses | 230 | 661 | (258 | ) | 365 | |||||||||||
| Other expense | 11,832 | 13,019 | 11,905 | 12,106 | ||||||||||||
| Income before income taxes | 1,802 | 1,437 | 544 | 1,380 | ||||||||||||
| Net income | 1,662 | 1,416 | 636 | 1,385 | ||||||||||||
| Less: net income attributable to | ||||||||||||||||
| non-controlling interest | (678 | ) | (603 | ) | (26 | ) | (270 | ) | ||||||||
| Net income attributable to Middleburg | ||||||||||||||||
| Financial Corporation | 984 | 813 | 610 | 1,115 | ||||||||||||
| Diluted earnings per common share | $ | 0.17 | $ | 0.11 | $ | 0.05 | $ | 0.07 | ||||||||
| Dividends per common share | 0.19 | 0.19 | 0.10 | 0.10 | ||||||||||||
| 2008 Quarter Ended | ||||||||||||||||
| Dollars in thousands except per share data | March 31 | June 30 | September 30 | December 31 | ||||||||||||
| Net interest income | $ | 7,727 | $ | 8,447 | $ | 8,566 | $ | 8,463 | ||||||||
| Net interest income after provision for | ||||||||||||||||
| loan losses | 5,663 | 6,140 | 8,248 | 7,891 | ||||||||||||
| Non-interest income | 4,694 | 4,637 | 4,761 | 3,725 | ||||||||||||
| Net securities gains (losses) and impairment losses | 108 | (367 | ) | (784 | ) | 130 | ||||||||||
| Non-interest expense | 10,507 | 10,410 | 10,044 | 11,638 | ||||||||||||
| Income (loss) before income taxes | (42 | ) | - | 2,181 | 108 | |||||||||||
| Net income | 122 | 68 | 1,526 | 87 | ||||||||||||
| Less: net loss attributable to | ||||||||||||||||
| non-controlling interest | 31 | 293 | 29 | 404 | ||||||||||||
| Net income attributable to Middleburg | ||||||||||||||||
| Financial Corporation | 153 | 361 | 1,555 | 491 | ||||||||||||
| Diluted earnings per common share | $ | 0.03 | $ | 0.08 | $ | 0.34 | $ | 0.11 | ||||||||
| Dividends per common share | 0.19 | 0.19 | 0.19 | - | ||||||||||||
Financial Condition
Assets, Liabilities and Shareholders Equity
The Company’s total assets were $1.10 billion at December 31, 2010, an increase of $127.6 million or 13.2% compared to $976.4 million as of December 31, 2009. Securities increased $79.3 million or 45.9% from 2009 to 2010. Loans, net of allowance for loan losses and deferred loan costs, increased by $9.2 million or 1.4% from 2009 to 2010. Total liabilities were $1.00 billion as of December 31, 2010, compared to $873 million as of December 31, 2009. Total shareholders’ equity at year end 2010 and 2009 was $97.0 million and $100.3 million, respectively.
Loans
The Company’s loan portfolio is its largest and most profitable component of earning assets, totaling 72.6% of average earning assets. The Company places great focus on originating and maintaining high credit quality loans. In 2010, the tax equivalent yield on loans was 5.73% while non-accrual loans and loans past due more than 90 days was 4.65% of average loans. The Company continues to focus on loan portfolio quality and diversification as a means of increasing earnings. Total loans were $718.7 million at December 31, 2010, an increase of 4.3% from December 31, 2009’s total of $689.3 million. Total loans decreased 3.4% from $712.7 million at December 31, 2008 to $689.3 million at December 31, 2009. The total loan to deposit ratio decreased to 74.0% at December 31, 2010, compared to 85.5% at December 31, 2009 and 95.5% at December 31, 2008.
Loan Portfolio
(At December 31)
| Dollars in thousands | 2010 | 2009 | 2008 | 2007 | 2006 | ||||||||||||||||
| Commercial, financial and agricultural | $ | 56,385 | $ | 43,331 | $ | 44,127 | $ | 46,482 | $ | 37,501 | |||||||||||
| Real estate construction | 68,110 | 73,019 | 105,717 | 96,576 | 69,033 | ||||||||||||||||
| Real estate mortgage | |||||||||||||||||||||
| Residential (1-4 family) | 191,969 | 209,735 | 216,034 | 202,822 | 189,341 | ||||||||||||||||
| Home equity lines | 50,651 | 56,828 | 54,974 | 48,039 | 39,670 | ||||||||||||||||
| Non-farm, non-residential (1) | 268,262 | 241,903 | 230,153 | 229,153 | 217,061 | ||||||||||||||||
| Secured by farmland | 11,532 | 2,491 | 2,522 | 2,476 | 2,473 | ||||||||||||||||
| Mortgages held for sale | 59,361 | 45,010 | 40,301 | - | - | ||||||||||||||||
| Consumer | 12,403 | 16,972 | 18,868 | 20,237 | 15,253 | ||||||||||||||||
| Total loans | 718,673 | 689,289 | 712,696 | 645,785 | 570,332 | ||||||||||||||||
| Less: Allowance for loan losses | 14,967 | 9,185 | 10,020 | 7,093 | 5,582 | ||||||||||||||||
| Net loans | $ | 703,706 | $ | 680,104 | $ | 702,676 | $ | 638,692 | $ | 564,750 | |||||||||||
____________
| (1) | This category generally consists of commercial and industrial loans where real estate constitutes a source of collateral. |
At December 31, 2010, residential real estate (1-4 family) portfolio loans constituted 26.7% of total loans and decreased $17.8 million during the year. Real estate construction loans consist primarily of pre-sold 1-4 family residential loans along with a marginal amount of commercial construction loans. Real estate construction loans constituted 9.5% of total loans and decreased 6.7%. The Company’s one time closing construction/permanent loan product competes successfully in a high growth market like Loudoun County because the Company is local and can respond quickly to inspections and construction draw requests. Non-farm, non-residential real estate loans are typically owner-occupied commercial buildings. Non-farm, non-residential loans were 37.3% of the total loan portfolio at December 31, 2010. The increase in the non-farm, non-residential real estate loans is the result of the Company’s diversification strategy. Home equity lines and agricultural real estate loans were 7.1% and 1.6% of total loans, respectively, at December 31, 2010.
The Company’s commercial, financial and agricultural loan portfolio consists of secured and unsecured loans to small businesses. At December 31, 2010, these loans comprised 7.8% of the total loan portfolio. This portfolio increased 30.1% during 2010 to $56.4 million. Consumer installment loans primarily consist of unsecured installment credit and account for 1.7% of the total loan portfolio.
Consistent with its focus on providing community-based financial services, the Company generally does not extend loans outside its principal market area. The Company’s market area for its lending services encompasses Fairfax, Fauquier and Loudoun Counties, where it operates full service financial centers.
The Company’s unfunded loan commitments totaled $83.3 million at December 31, 2010 and $84.6 million at December 31, 2009.
At December 31, 2010, the Company had no concentration of loans in any one industry in excess of 10% of its total loan portfolio. However, because of the nature of the Company’s market, loan collateral is predominantly real estate.
The following table reflects the maturity distribution of selected loan categories:
Remaining Maturities of Selected Loan Categories
(At December 31, 2010)
(In Thousands)
| Commercial, Financial and Agricultural | Real Estate Construction | |||||||
| Within 1 year | $ | 4,389 | $ | 39,253 | ||||
| Variable Rate: | ||||||||
| 1-5 years | 18,159 | 5,507 | ||||||
| After 5 years | 8,520 | 559 | ||||||
| Total | 26,679 | 6,066 | ||||||
| Fixed Rate: | ||||||||
| 1-5 years | 10,397 | 13,651 | ||||||
| After 5 years | 14,920 | 9,141 | ||||||
| Total | $ | 25,317 | $ | 22,792 | ||||
| Total Maturities | $ | 56,385 | $ | 68,111 | ||||
Asset Quality
The Company has policies and procedures designed to control credit risk and to maintain the quality of its loan portfolio. These include underwriting standards for new originations and ongoing monitoring and reporting of asset quality and adequacy of the allowance for loan losses. There were $39.9 million total non-performing assets, which consist of non-accrual loans, restructured loans and foreclosed property at December 31, 2010. This is an increase of $21.8 million when compared to the December 31, 2009 balance of $18.1 million. Foreclosed property at Middleburg Bank increased 28.9% to $8.4 million at December 31, 2010, compared to $6.5 million at December 31, 2009. Loans more than 90 days past due still accruing were $909,000 at December 31, 2010.
Non-performing Assets
Loans are placed on non-accrual status when collection of principal and interest is doubtful, generally when a loan becomes 90 days past due. There are three negative implications for earnings when a loan is placed on non-accrual status. First, all interest accrued but unpaid at the date that the loan is placed on non-accrual status is either deducted from interest income or written off as a loss. Second, accruals of interest are discontinued until it becomes certain that both principal and interest can be repaid. Finally, there may be actual losses that require additional provisions for loan losses to be charged against earnings. For real estate loans, upon foreclosure, the balance of the loan is transferred to “Other Real Estate Owned” (“OREO”) and carried at the lower of the outstanding loan balance or the fair market value of the property based on current appraisals and other current market trends, less selling costs. If a write down of the OREO property is necessary at the time of foreclosure, the amount is charged-off against the allowance for loan losses. A review of the recorded property value is performed in conjunction with normal loan reviews, and if market conditions indicate that the recorded value exceeds the fair market value, additional write downs of the property value are charged directly to operations.
| Nonperforming Assets | ||||||||||||||||||||
| Middleburg Financial Corporation | ||||||||||||||||||||
| December 31, | ||||||||||||||||||||
| 2010 | 2009 | 2008 | 2007 | 2006 | ||||||||||||||||
| (In thousands) | ||||||||||||||||||||
| Nonperforming assets: | ||||||||||||||||||||
| Nonaccrual loans | $ | 29,386 | $ | 8,606 | $ | 6,890 | $ | 6,635 | $ | - | ||||||||||
| Restructured loans (1) | 1,254 | 2,096 | - | - | - | |||||||||||||||
| Accruing loans greater than | ||||||||||||||||||||
| 90 days past due | 909 | 908 | 1,117 | 30 | 19 | |||||||||||||||
| Total nonperforming loans | $ | 31,549 | $ | 11,610 | $ | 8,007 | $ | 6,665 | $ | 19 | ||||||||||
| Foreclosed property | 8,394 | 6,511 | 7,597 | - | - | |||||||||||||||
| Total Nonperforming assets | $ | 39,943 | $ | 18,121 | $ | 15,604 | $ | 6,665 | $ | 19 | ||||||||||
| Allowance for loan losses | $ | 14,967 | $ | 9,185 | $ | 10,020 | $ | 7,093 | $ | 5,582 | ||||||||||
| Nonperforming loans to | ||||||||||||||||||||
| period end portfolio loans | 4.79 | % | 1.80 | % | 1.19 | % | 1.03 | % | 0.00 | % | ||||||||||
| Allowance for loan losses | ||||||||||||||||||||
| to nonperforming loans | 47 | % | 79 | % | 125 | % | 106 | % | 29,379 | % | ||||||||||
| Nonperforming assets to | ||||||||||||||||||||
| period end assets | 3.62 | % | 1.86 | % | 1.58 | % | 0.79 | % | 0.00 | % | ||||||||||
| (1) Amount reflects restructured loans that are not included in nonaccrual loans. | ||||||||||||||||||||
Nonperforming loans increased $19.1 million from December 31, 2009 to December 31, 2010 while the allowance for loan losses balance increased $5.8 million during the same period, representing an increase in the allowance for loan losses balance of approximately 30.3% of the dollar amount increase in nonperforming loans. The increase in nonperforming loans was due primarily to four large credit relationships being transferred to non-accrual during 2010. These four relationships had an aggregate outstanding loan balance of $15.8 million with an associated aggregate loan loss reserve of $2.1 million. The following table provides additional information on the largest four relationships classified as non-accrual during the year ended December 31, 2010:
| Non-Accrual Loans - Large Credit Relationships | ||||||||||||||||||||||||
| December 31, 2010 | ||||||||||||||||||||||||
| (In Thousands) | Year | |||||||||||||||||||||||
| Year | ALLL | Date | Range | |||||||||||||||||||||
| Type of | Range | Non-accrual | Allocated | Placed on | of Last | |||||||||||||||||||
| Loan | Originated | Loan Balance | to Loans | Non-accrual | Collateral | Appraisal | ||||||||||||||||||
| 1 | CRE/LOC | 2006-2007 | $ | 9,721 | $ | 1,431 | 3Q2010 | Business Assets / Real Estate | 2006-2007 | |||||||||||||||
| 2 | MTG | 2005-2007 | 3,387 | - | 3Q2010 | Real Estate | 2010 | |||||||||||||||||
| 3 | MTG | 2005 | 1,806 | 613 | 3Q2010 | Real Estate | 2010 | |||||||||||||||||
| 4 | CRE | 2007-2008 | 911 | 65 | 3Q2010 | Real Estate | 2007 | |||||||||||||||||
| Totals | $ | 15,825 | $ | 2,109 | ||||||||||||||||||||
The allowance for loan losses was 47% of non-performing loans at December 31, 2010. At December 31, 2009 and 2008 the allowance for loan losses was 79% and 125% of non-performing loans, respectively. The decline in this ratio was caused by two primary factors. Loans classified as nonperforming during the periods required smaller specific reserves than previously classified nonperforming loans, and some previously
identified nonperforming loans with substantial associated specific reserve balances were charged off during 2009 and 2010. The combination of these two factors caused the decline in the nonperforming loans ratio from December 31, 2008 to December 31, 2010. Management evaluates non-performing loans relative to their collateral value and makes appropriate reductions in the carrying value of those loans based on that review.
During 2010 and 2009, approximately $722,000 and $207,000, respectively, in additional interest income would have been recorded if the Company’s non-accrual loans had been current and in accordance with their original terms.
Included in the “Nonperforming Assets” table above are troubled debt restructurings (“TDR’s”) that were classified as impaired as of December 31, 2010. The total balance of restructured loans at December 31, 2010 was $4.5 million of which $3.2 million were included in the Company’s non-accrual loan totals at that date and $1.3 million represented loans performing as agreed to the restructured terms. This compares with $2.1 million in restructured loans at December 31, 2009, an increase of $2.4 million or 114.3%. The amount of the valuation allowance related to TDR’s was $532,000 and $675,000 as of December 31, 2010 and 2009 respectively.
The $3.2 million in nonaccrual restructured loans as of December 31, 2010 is comprised of $1.5 million in real estate construction loans and $1.8 million in 1-4 family real estate loans. The $1.3 million in restructured loans which were performing as agreed under restructured terms as of December 31, 2010 is comprised of $291,000 in real estate construction loans, $113,000 in 1-4 family real estate loans, and $850,000 in other real estate loans. All loans classified as restructured are considered to be non-performing assets as of December 31, 2010.
The Company requires six timely consecutive monthly payments before a restructured loan that has been placed on non-accrual can be returned to accrual status. Approximately $647,000 in restructured loans were charged off during the year ended December 31, 2010. The Company does not utilize formal modification programs or packages when loans are considered for restructuring. Any loan restructuring is based on the borrower’s circumstances and may include modifications to more than one of the terms and conditions of the loan.
The Company’s accounting policy for foreclosed property does not provide for or allow any allowance for loan loss provision subsequent to the reclassification event which writes the loan down to fair value when moved into foreclosed property.
The Company has not performed any commercial real estate or other type of loan workout whereby the existing loan would have been structured into multiple new loans.
Allowance For Loan Losses
For a discussion of the Company’s accounting policies with respect to the allowance for loan losses, see “Critical Accounting Policies – Allowance for Loan Losses” above.
The following table depicts the transactions, in summary form, that occurred to the allowance for loan losses in each year presented:
Allowance for Loan Losses | ||||||||||||||||||||
| Years Ended December 31, | ||||||||||||||||||||
| 2010 | 2009 | 2008 | 2007 | 2006 | ||||||||||||||||
| (In Thousands) | ||||||||||||||||||||
Balance, beginning of year | $ | 9,185 | $ | 10,020 | $ | 7,093 | $ | 5,582 | $ | 5,143 | ||||||||||
Provision for loan losses | 12,005 | 4,551 | 5,261 | 1,786 | 499 | |||||||||||||||
| Southern Trust Mortgage consolidation | - | - | 1,238 | - | - | |||||||||||||||
Charge-offs: | ||||||||||||||||||||
| Real estate loans: | ||||||||||||||||||||
Construction | 1,226 | 836 | 2,131 | - | - | |||||||||||||||
| Secured by 1-4 family residential | 3,256 | 3,205 | 233 | - | - | |||||||||||||||
| Other real estate loans | 460 | 375 | - | - | - | |||||||||||||||
| Commercial loans | 942 | 343 | 511 | 76 | - | |||||||||||||||
Consumer loans | 500 | 725 | 744 | 263 | 112 | |||||||||||||||
| Total charge-offs | $ | 6,384 | $ | 5,484 | $ | 3,619 | $ | 339 | $ | 112 | ||||||||||
| Recoveries: | ||||||||||||||||||||
| Real estate loans: | ||||||||||||||||||||
Construction | $ | - | $ | - | $ | 9 | $ | - | $ | - | ||||||||||
| Secured by 1-4 family residential | 37 | 9 | - | - | - | |||||||||||||||
Other real estate loans | 4 | - | - | - | - | |||||||||||||||
| Commercial loans | 68 | 21 | 2 | - | - | |||||||||||||||
Consumer loans | 52 | 68 | 36 | 64 | 52 | |||||||||||||||
| Total recoveries | $ | 161 | $ | 98 | $ | 47 | $ | 64 | $ | 52 | ||||||||||
| Net charge-offs | 6,223 | 5,386 | 3,572 | 275 | 60 | |||||||||||||||
| Balance, end of year | $ | 14,967 | $ | 9,185 | $ | 10,020 | $ | 7,093 | $ | 5,582 | ||||||||||
| Ratio of allowance for loan losses | ||||||||||||||||||||
to portfolio loans outstanding at end of period | 2.27 | % | 1.43 | % | 1.49 | % | 1.09 | % | 0.97 | % | ||||||||||
| Ratio of net charge offs to average | ||||||||||||||||||||
| portfolio loans outstanding during the period | 0.88 | % | 0.76 | % | 0.53 | % | 0.04 | % | 0.01 | % | ||||||||||
The allowance for loan losses was $15.0 million at December 31, 2010, an increase of $5.8 million from $9.2 million at December 31, 2009. The ratio of the allowance for loan losses to total portfolio loans outstanding was 2.27% at December 31, 2010 compared to 1.43% at December 31, 2009. The allowance for loan losses was $10.0 million at December 31, 2008. In 2010, the Company’s net charge-offs increased $800,000 from the previous year’s net charge-offs of $5.4 million. Net charge-offs as a percentage of average portfolio loans were 0.88% and 0.76% for 2010 and 2009, respectively. The provision for loan losses was $12.0 million for 2010 and $4.6 million for 2009.
The following table shows the balance and percentage of the Company’s allowance for loan losses allocated to each major category of loan:
Allocation of Allowance for Loan Losses
(At December 31)
(In Thousands)
| Commercial, Financial, Agricultural | Real Estate Construction | Real Estate Mortgage | Consumer | |||||
| Balance | % Total Loans | Balance | % Total Loans | Balance | % Total Loans | Balance | % Total Loans | |
| 2010 | 1,162 | 5.40% | 4,684 | 16.80% | 8,736 | 74.54% | 385 | 3.26% |
| 2009 | 819 | 6.73% | 2,087 | 11.35% | 6,038 | 79.28% | 241 | 2.64% |
| 2008 | 911 | 6.57% | 3,245 | 15.75% | 5,292 | 74.87% | 572 | 2.81% |
| 2007 | 943 | 7.21% | 1,392 | 14.98% | 4,099 | 74.67% | 659 | 3.14% |
| 2006 | 771 | 6.58% | 964 | 12.12% | 3,642 | 78.62% | 205 | 2.68% |
The Company has allocated the allowance according to the amount deemed reasonably necessary to provide for the possibility of losses being incurred within each of the above categories of loans. The allocation of the allowance as shown in the table above should not be interpreted as an indication that loan losses in future years will occur in the same proportions that they may have in prior years or that the allocation indicates future loan loss trends. Additionally, the proportion allocated to each loan category is not the total amount that may be available for the future losses that could occur within such categories since the total allowance is a general allowance applicable to the total portfolio.
Securities
The Company manages its investment securities portfolio consistent with established policies that include guidelines for earnings, rate sensitivity, liquidity and pledging needs. The Company holds bonds issued from the Commonwealth of Virginia and its political subdivisions with an aggregate market value of $4.8 million at December 31, 2010. The aggregate holdings of these bonds approximate 5.0% of the Company’s shareholders’ equity.
The Company accounts for securities under applicable accounting standards. These standards require classification of investments into three categories, “held to maturity” (“HTM”), “available for sale” (“AFS”), or “trading,” as further defined in Note 1 to the Company’s Consolidated Financial Statements. The Company does not maintain a trading account and has classified no securities in this category. HTM securities are required to be carried on the financial statements at amortized cost. The Company does not classify any securities as HTM for the periods presented. AFS securities are carried on the financial statements at fair value. The unrealized gains or losses, net of deferred income taxes, are reflected in shareholders’ equity. The HTM classification places restrictions on the Company’s ability to sell securities or to transfer securities into the AFS classification.
The Company holds in its loan and securities portfolios investments that adjust or float according to changes in “prime” lending rate. These holdings are not considered speculative but instead necessary for good asset/liability management.
The carrying value of the securities portfolio was $252.0 million at December 31, 2010, an increase of $79.3 million or 45.9% from the carrying value of $172.7 million at December 31, 2009. The unrealized losses on the AFS securities were $3.7 million at December 31, 2010. These losses were offset by the December 31, 2010 unrealized gains of $2.1 million. The net market value loss at December 31, 2010 is reflective of the continued rise in market interest rates. The net unrealized loss on the AFS securities was $1.6 million at December 31, 2010.
Investment Securities Portfolio
(Years Ended December 31)
The carrying values of securities available for sale at the dates indicated were as follows:
| 2010 | 2009 | 2008 | ||||||||||
| (In thousands) | ||||||||||||
| U.S. Government securities | $ | - | $ | 3,087 | $ | - | ||||||
| U.S. Government agency securities | 4,649 | - | - | |||||||||
| State and political subdivision obligations | 59,140 | 69,044 | 59,923 | |||||||||
| Mortgage-backed securities | 178,385 | 100,179 | 111,284 | |||||||||
| Other securities | 9,868 | 389 | 3,689 | |||||||||
| $ | 252,042 | $ | 172,699 | $ | 174,896 | |||||||
The following table indicates the increased return experienced by the Company during 2010 on a tax equivalent basis. Mortgage-backed securities, which make up 70.8% and 58.0% of the securities portfolio on December 31, 2010 and 2009, respectively, had an increase in overall balance of $78.2 million from $100.2 million at December 31, 2009 to December 31, 2010. The focus on mortgage-backed securities was in maintaining the maturity distribution and proportion with regard to the total securities portfolio without sacrificing yields. Securities with maturities greater than five years total $146.2 million, of which $82.6 million or 56.5% are mortgage-backed securities with a weighted average yield of 2.79%. The securities portfolio represents approximately 26% of the average earning assets of the Company. For that reason, it is managed primarily to provide superior returns without sacrificing interest rate, market and credit risk. Secondarily, through the asset/liability process, the Company considers the securities portfolio as a liquidity source in the event that funding is needed quickly within a 30-day period of time.
Additionally, $1.1 million and $1.1 million in losses related to other-than-temporary impairment on trust-preferred securities were recognized in 2010 and 2009 respectively At December 31, 2010, the Company had $998 thousand of trust preferred securities in its portfolio. The unrealized losses related to these securities was $675 thousand at December 31, 2010. The Company may need to recognize additional other-than-temporary impairments related to trust preferred securities in 2011.
Maturity Distribution and Yields of Investment Securities
Taxable-Equivalent Basis
(At December 31, 2010)
| Due in 1 year | Due after 1 year | Due after 5 years | Due after 10 years | |||||||||||||||||||||||||||||||||||||
| or less | through 5 years | through 10 years | and Equities | Total | ||||||||||||||||||||||||||||||||||||
| Dollars in thousands | Amount | Yield | Amount | Yield | Amount | Yield | Amount | Yield | Amount | Yield | ||||||||||||||||||||||||||||||
| (Dollars in thousands) | ||||||||||||||||||||||||||||||||||||||||
| Securities available for sale | ||||||||||||||||||||||||||||||||||||||||
| U.S. government agency securities | $ | 234 | 3.28 | % | $ | 627 | 3.54 | % | $ | 873 | 3.59 | % | $ | 2,915 | 3.41 | % | $ | 4,649 | 3.42 | % | ||||||||||||||||||||
| Mortgage-backed securities | 36,778 | 2.82 | % | 58,981 | 3.13 | % | 28,289 | 2.17 | % | 54,337 | 3.12 | % | 178,385 | 3.01 | % | |||||||||||||||||||||||||
| Other (2) | - | 0.00 | % | 470 | 5.13 | % | 6,964 | 5.61 | % | 2,434 | 8.56 | % | 9,868 | 6.19 | % | |||||||||||||||||||||||||
| Total taxable | 37,012 | 2.87 | % | 60,078 | 3.49 | % | 36,126 | 3.78 | % | 59,686 | 4.11 | % | 192,902 | 3.04 | % | |||||||||||||||||||||||||
| Tax-exempt securities (1) | 272 | 6.52 | % | 8,491 | 6.23 | % | 25,306 | 6.37 | % | 25,071 | 6.42 | % | 59,140 | 6.39 | % | |||||||||||||||||||||||||
| Total securities (3) | $ | 37,284 | 2.90 | % | $ | 68,569 | 3.83 | % | $ | 61,432 | 4.97 | % | $ | 84,757 | 4.88 | % | $ | 252,042 | 4.32 | % | ||||||||||||||||||||
| (1) | Yields on tax-exempt securities, which includes tax-exempt obligations of states and political subdivisions have been computed on a tax-equivalent basis assuming a federal tax rate of 34%. |
| (2) | Includes corporate bonds and preferred stock. |
| (3) | Amounts exclude Federal Reserve Stock of $1,703,000 and Federal Home Loan Bank Stock of $4,592,000. |
Other Earning Assets
The Company’s average investments in federal funds sold in 2010 was $0, compared to $20.6 million in 2009.
Goodwill
The Company evaluated the carrying value of its goodwill related to Southern Trust Mortgage in the third quarter of 2010 and determined that there was no goodwill impairment. In the third quarter of 2010, the Company also evaluated the carrying value of its goodwill related to Middleburg Investment Advisers and Middleburg Trust Company and determined that there was no goodwill impairment.
Deposits
Deposits continue to be an important funding source and primary supply of the Company’s growth. The Company’s strategy has been to increase its core deposits at the same time that it is controlling its cost of funds. The maturation of the branch network, as well as increased advertising campaigns and bank mergers, have contributed to the significant growth in deposits over the last several years. By monitoring interest rates within the local market and that of alternative funding sources, the Company is able to price the deposits effectively to develop a core base of deposits in each market.
The following table is a summary of average deposits and average rates paid on those deposits:
Average Deposits and Rates Paid
(Years Ended December 31)
| 2010 | 2009 | 2008 | ||||||||||||||||||||||
| Amount | Rate | Amount | Rate | Amount | Rate | |||||||||||||||||||
| (Dollars in thousands) | ||||||||||||||||||||||||
| Non-interest-bearing deposits | $ | 120,475 | $ | 107,936 | $ | 114,466 | ||||||||||||||||||
| Interest-bearing accounts: | ||||||||||||||||||||||||
| Interest checking | 283,294 | 0.81 | % | 251,781 | 1.23 | % | 188,886 | 1.99 | % | |||||||||||||||
| Regular savings | 77,864 | 0.93 | % | 59,095 | 1.27 | % | 54,891 | 1.73 | % | |||||||||||||||
| Money market accounts | 53,894 | 0.79 | % | 42,985 | 1.10 | % | 39,267 | 1.18 | % | |||||||||||||||
| Time deposits: | ||||||||||||||||||||||||
| $ 100,000 and over | 160,063 | 2.69 | % | 135,149 | 3.21 | % | 127,398 | 3.94 | % | |||||||||||||||
| Under $ 100,000 | 161,338 | 2.66 | % | 187,115 | 3.72 | % | 127,114 | 4.17 | % | |||||||||||||||
| Total interest-bearing deposits | $ | 736,453 | 1.63 | % | $ | 676,125 | 2.31 | % | $ | 537,555 | 2.88 | % | ||||||||||||
| Total | $ | 856,928 | $ | 784,061 | $ | 652,021 | ||||||||||||||||||
Average total deposits increased 9.29% during 2010, 20.25% during 2009 and 14.4% during 2008. At December 31, 2010, the average balance of non-interest bearing deposits increased 11.62% during 2010 compared to 2009.
The average balance in interest checking and regular savings accounts increased 12.5% and 31.8%, respectively, during 2010. In March of 2004, Middleburg Bank developed an interest bearing product that integrates the use of the cash within client accounts at Middleburg Trust Company for overnight funding at Middleburg Bank. The overall balance of this product was $29.1 million at December 31, 2010 and is partially reflected in interest bearing deposit and partially reflected in securities sold under agreement to repurchase amounts on the balance sheet. At December 31, 2010, $26.7 million was classified as an interest bearing deposit balance.
The Company will continue to focus on core deposit growth as the primary source of liquidity and stability. The Company offers individuals and small to medium-sized businesses a variety of deposit accounts, including demand and interest checking, money market, savings and time deposit accounts. The Company also had $61.2 million in brokered time deposits as of December 31, 2010 compared to $64.0 million in brokered time deposits as of December 31, 2009. This is reflected in the balance of total time deposits.
The following table is a summary of the maturity distribution of certificates of deposit equal to or greater than $100,000 as of December 31, 2010:
Maturities of Certificates of Deposit of $100,000 and Greater
(At December 31, 2010)
| Within | Three to | Six to | Over | Percent | ||||||
| Three | Six | Twelve | One | of Total | ||||||
| Months | Months | Months | Year | Total | Deposits | |||||
| (In thousands) | ||||||||||
| $ 65,629 | $ 26,704 | $ 37,517 | $ 72,296 | $ 202,146 | 22.7% | |||||
Financial Instruments with Off-Balance-Sheet Risk and Credit Risk
and Contractual Obligations
Middleburg Bank is a party to financial instruments with off-balance-sheet risk in the normal course of business to meet the financing needs of its customers and to reduce its own exposure to fluctuations in interest rates. These financial instruments include commitments to extend credit, standby letters of credit and interest rate swaps. Those instruments involve, to varying degrees, elements of credit and interest rate risk in excess of the amount recognized in the balance sheet. The contract or notional amounts of those instruments reflect the extent of involvement Middleburg Bank has in particular classes of financial instruments.
Middleburg Bank’s exposure to credit loss in the event of nonperformance by the other party to the financial instrument for commitments to extend credit and standby letters of credit is represented by the contractual amount of those instruments. Middleburg Bank uses the same credit policies in making commitments and conditional obligations as it does for on-balance-sheet instruments.
A summary of the contract amount of Middleburg Bank’s exposure to off-balance-sheet risk as of December 31, 2010 and 2009 is as follows:
| 2010 | 2009 | |||||||
| Financial instruments whose contract amounts | ||||||||
| represent credit risk: | (In thousands) | |||||||
| Commitments to extend credit | $ | 83,299 | $ | 84,628 | ||||
| Standby letters of credit | 2,378 | 1,974 | ||||||
Commitments to extend credit are agreements to lend to a customer as long as there is no violation of any condition established in the contract. Commitments generally have fixed expiration dates or other termination clauses and may require payment of a fee. Since many of the commitments are expected to expire without being drawn upon, the total commitment amounts do not necessarily represent future cash requirements. Middleburg Bank evaluates each customer’s credit worthiness on a case-by-case basis. The amount of collateral obtained, if deemed necessary by Middleburg Bank upon extension of credit, is based on management’s credit evaluation of the counterparty. Collateral held varies but may include accounts receivable, inventory, property and equipment, and income-producing commercial properties.
Unfunded commitments under lines of credit are commitments for possible future extensions of credit to existing customers. Those lines of credit may not be drawn upon to the total extent to which Middleburg Bank is committed.
Standby letters of credit are conditional commitments issued by Middleburg Bank to guarantee the performance of a customer to a third party. Those guarantees are primarily issued to support public and private borrowing arrangements, including commercial paper, bond financing, and similar transactions. The credit risk involved in issuing letters of credit is essentially the same as that involved in extending loan facilities to customers. Middleburg Bank holds certificates of deposit, deposit accounts, and real estate as collateral supporting those commitments for which collateral is deemed necessary.
The Company enters into commitments to originate mortgage loans whereby the interest rate on the loan is determined prior to funding (“rate lock commitments”). Rate lock commitments on mortgage loans that are intended to be sold are considered to be derivatives. The period of time between a loan commitment and closing and sale of the loan generally ranges from 60 to 120 days. The Company mitigates its risk from changes in interest rates through the use of best effort forward delivery commitments, whereby the Company commits to sell a loan at the time the borrower commits to an interest rate with the intent that the buyer has assumed interest rate risk on the loan. As a result, the Company is not exposed to losses nor will it realize significant gains related to its rate lock commitments due to changes in interest rates. The correlation between the rate lock commitment and the best efforts contracts if very high due to their similarity.
The market value of rate lock commitments and best efforts contracts is not readily ascertainable with precision because rate lock commitments and best efforts contracts are not actively traded in stand-alone markets. The Company determines the fair value of rate lock commitments and best efforts contracts by measuring the change in the value of the underlying asset while taking into consideration the probability that the rate lock commitments will close. Because of the high correlation between rate lock commitments and best efforts contracts, no gain or loss occurs on the rate lock commitments.
A summary of the Company’s contractual obligations at December 31, 2010 is as follows:
| Payment due by period | ||||||||||||||||||||
| (In Thousands) | ||||||||||||||||||||
| Total | Less than 1 Year | 1 - 3 years | 3 - 5 Years | More than 5 Years | ||||||||||||||||
| Certificates of Deposit | $ | 323,100 | $ | 188,680 | $ | 129,391 | $ | 5,029 | $ | - | ||||||||||
| Short-term Borrowings | 38,882 | 38,882 | - | - | - | |||||||||||||||
| Long-Term Debt Obligations | 62,912 | 10,000 | 17,912 | 35,000 | - | |||||||||||||||
| Operating Leases | 28,480 | 2,464 | 4,072 | 3,847 | 18,097 | |||||||||||||||
| Trust Preferred Captial Notes | 5,155 | - | - | - | 5,155 | |||||||||||||||
| Total Obligations | $ | 458,529 | $ | 240,026 | $ | 151,375 | $ | 43,876 | $ | 23,252 | ||||||||||
The Company does not have any capital lease obligations, as classified under applicable FASB statements, or other purchase or long-term obligations.
Capital Resources and Dividends
The Company has an ongoing strategic objective of maintaining a capital base that supports the pursuit of profitable business opportunities, provides resources to absorb risks inherent in its activities and meets or exceeds all regulatory requirements.
The Federal Reserve Board has established minimum regulatory capital standards for bank holding companies and state member banks. The regulatory capital standards categorize assets and off-balance sheet items into four categories that weigh balance sheet assets according to risk, requiring more capital for holding higher risk assets. The minimum ratio of qualifying total capital to risk-weighted assets is 8.0%, of which at least 4.0% must be Tier 1 capital, composed of common equity and retained earnings. The Company had a ratio of total capital to risk-weighted assets of 14.1% and 15.1% at December 31, 2010 and 2009, respectively. The ratio of Tier 1 capital to risk-weighted assets was 12.8% and 13.9% at December 31, 2010 and 2009, respectively. Both ratios exceed the minimum capital requirements adopted by the federal banking regulatory agencies.
Analysis of Capital
(At December 31)
| 2010 | 2009 | |||||||
| (Dollars in thousands) | ||||||||
| Tier 1 Capital: | ||||||||
| Common stock | $ | 17,314 | $ | 17,273 | ||||
| Capital surplus | 43,058 | 42,807 | ||||||
| Retained earnings | 37,593 | 42,706 | ||||||
| Non-controlling interest in consolidated subsidiary | 3,040 | 3,047 | ||||||
| Trust preferred debt | 5,000 | 5,000 | ||||||
| Goodwill | (6,360 | ) | (6,531 | ) | ||||
| Unrealized loss on equity securities | (17 | ) | -- | |||||
| Total Tier 1 capital | $ | 99,628 | $ | 104,302 | ||||
| Tier 2 Capital: | ||||||||
| Disallowed trust preferred | $ | -- | $ | 20 | ||||
| Allowance for loan losses | 9,792 | 8,962 | ||||||
| Total tier 2 capital | $ | 9,792 | $ | 8,982 | ||||
| Total risk-based capital | $ | 109,420 | $ | 113,284 | ||||
| Risk weighted assets | $ | 778,149 | $ | 752,426 | ||||
| CAPITAL RATIOS: | ||||||||
| Tier 1 risk-based capital ratio | 12.8 | % | 13.9 | % | ||||
| Total risk-based capital ratio | 14.1 | % | 15.1 | % | ||||
| Tier 1 capital to average total assets | 9.0 | % | 10.4 | % | ||||
As noted above, regulatory capital levels for the Company meet those established for well-capitalized institutions. While we are currently considered well-capitalized, we may from time-to-time find it necessary to access the capital markets to meet our growth objectives or capitalize on specific business opportunities.
The Company’s core equity to asset ratio decreased to 9.0% at December 31, 2010, compared to 10.4% at December 31, 2009.
The primary source of funds for dividends paid by the Company to its shareholders is the dividends received from its subsidiaries. Federal regulatory agencies impose certain restrictions on the payment of dividends and the transfer of assets from the banking subsidiaries to the holding company. Historically, these restrictions have not had an adverse impact on the Company’s dividend policy.
As of March 10, 2011, warrants to purchase 104,101 shares of the Company’s common stock related to the issuance of Preferred Stock to the U.S. Treasury in 2009 remained outstanding to the U.S. Treasury, and the Company expects that the warrants will be sold by the U.S. Treasury at public auction.
Short-term Borrowings
Federal funds purchased and securities sold under agreements to repurchase have been a significant source of funds for Middleburg Bank. The Company has various unused lines of credit available from certain of its correspondent banks in the aggregate amount of $24.0 million and a borrowing capacity of $27.0 million with the Federal Reserve Bank of Richmond. These lines of credit, which bear interest at prevailing market rates, permit the Company to borrow funds in the overnight market, and are renewable annually subject to certain conditions. Securities sold under agreements to repurchase include an interest bearing product that the Company has developed which integrates the use of the cash within client accounts at Middleburg Trust
Company for overnight funding at Middleburg Bank. This account is referred to as Tredegar Institutional Select. The overall balance of this product was $29.1 million at December 31, 2010, of which $2.4 million is included in securities sold under agreements to repurchase amounts on the balance sheet. All repurchase agreements entered into by the Company are accounted for as collateralized financings. No repurchase agreements are accounted for as sales.
The following table shows the distribution of the Company’s short-term borrowings and the weighted-average interest rates thereon at the end of each of the last three years. Also provided are the maximum amount of borrowings and the average amount of borrowings as well as weighted-average interest rates for the last three years.
| Dollars in thousands | Federal Funds Purchased | Securities Sold Under Agreements to Repurchase | Short-term Borrowings | |||||||||||
| At December 31: | ||||||||||||||
| 2010 | $ | - | $ | 25,562 | $ | 13,320 | ||||||||
| 2009 | - | 17,199 | 3,538 | |||||||||||
| 2008 | - | 22,678 | 40,944 | |||||||||||
| Weighted-average interest rate at year-end: | ||||||||||||||
| 2010 | - | % | 0.94 | % | 5.13 | % | ||||||||
| 2009 | - | 0.16 | 5.00 | |||||||||||
| 2008 | - | 0.48 | 2.56 | |||||||||||
| Maximum amount outstanding at any month's end: | ||||||||||||||
| 2010 | $ | 5,000 | $ | 27,542 | $ | 21,875 | ||||||||
| 2009 | - | 25,210 | 50,719 | |||||||||||
| 2008 | - | 58,688 | 92,512 | |||||||||||
| Average amount outstanding during the year: | ||||||||||||||
| 2010 | $ | 25 | $ | 25,314 | $ | 10,419 | ||||||||
| 2009 | - | 21,122 | 15,513 | |||||||||||
| 2008 | 397 | 40,924 | 44,983 | |||||||||||
| Weighted-average interest rate during the year: | ||||||||||||||
| 2010 | - | % | 0.81 | % | 3.77 | % | ||||||||
| 2009 | - | 0.19 | 3.82 | |||||||||||
| 2008 | 2.77 | 2.03 | 4.42 | |||||||||||
Liquidity
Liquidity represents an institution’s ability to meet present and future financial obligations through either the sale or maturity of existing assets or the acquisition of additional funds through liability management. Liquid assets include cash, interest-bearing deposits with banks, federal funds sold, short-term investments, securities classified as available for sale and loans and securities maturing within one year. As a result of the Company’s management of liquid assets and the ability to generate liquidity through liability funding, management believes the Company maintains overall liquidity sufficient to satisfy its depositors’ requirements and meet its customers’ credit needs.
The Company also maintains additional sources of liquidity through a variety of borrowing arrangements. Middleburg Bank maintains federal funds lines with large regional and money-center banking institutions. These available lines total approximately $24.0 million, none of which were outstanding at December 31, 2010. The subsidiary bank of the Company is also able to borrow from the discount window of the Federal Reserve Bank of Richmond. Available borrowing capacity from this source at December 31, 2010 was $27.0 million. The average balance of federal funds purchased during 2010 was $25,000. Company did not
purchase federal funds during 2009. The average balance of federal funds purchase during 2008 was $397,000. At December 31, 2010 and 2009, Middleburg Bank had $18.1 million and $17.2 million, respectively, of outstanding borrowings pursuant to securities sold under agreement to repurchase transactions (“Repo Accounts”), with maturities of one day. The Repo Accounts are long-term commercial checking accounts with average balances that typically exceed $100,000. These accounts include $2.4 million from the non-FDIC eligible portion of the Tredegar Institutional Select. At December 31, 2010, Middleburg Bank had $7.7 million of outstanding borrowings pursuant to securities sold under agreement to repurchase transactions with remaining maturities of greater than one year.
Middleburg Bank has credit availability in the amount of $154.0 million at the Federal Home Loan Bank of Atlanta. This line may be utilized for short and/or long-term borrowing. Southern Trust Mortgage has a $44.0 million revolving line of credit with a regional bank, which is primarily used to fund its mortgages held for sale. At December 31, 2010, this line had an outstanding balance of $13.3 million and is included in total short-term borrowings.
At December 31, 2010, cash, interest-bearing deposits with financial institutions, federal funds sold, short-term investments and unencumbered securities available for sale were 26.2% of total deposits and liabilities.
Caution About Forward Looking Statements
Certain information contained in this discussion may include “forward-looking statements” within the meaning of Section 27A of the Securities Act of 1933, as amended, and Section 21E of the Securities Exchange Act of 1934, as amended. These forward-looking statements are generally identified by phrases such as “the Company expects,” “the Company believes” or words of similar import.
Such forward-looking statements involve known and unknown risks including, but not limited to, the following factors:
| · | further adverse changes in general economic and business conditions in the Company’s market area; |
| · | changes in banking and other laws and regulations applicable to the Company; |
| · | maintaining asset qualities; |
| · | the ability to properly identify risks in our loan portfolio and calculate an adequate loan loss allowance; |
| · | risks inherent in making loans such as repayment risks and fluctuating collateral values; |
| · | concentration in loans secured by real estate; |
| · | changing trends in customer profiles and behavior; |
| · | changes in interest rates and interest rate policies; |
| · | maintaining cost controls as the Company opens or acquires new facilities; |
| · | competition with other banks and financial institutions, and companies outside of the banking industry, including those companies that have substantially greater access to capital and other resources; |
| · | the ability to continue to attract low cost core deposits to fund asset growth; |
| · | the ability to successfully manage the Company’s growth or implement its growth strategies if it is unable to identify attractive markets, locations or opportunities to expand in the future; |
| · | reliance on the Company’s management team, including its ability to attract and retain key personnel; |
| · | demand, development and acceptance of new products and services; |
| · | problems with technology utilized by the Company; |
| · | maintaining capital levels adequate to support the Company’s growth; and |
| · | other factors described in Item 1A, “Risk Factors,” above. |
Although the Company believes that its expectations with respect to the forward-looking statements are based upon reliable assumptions within the bounds of its knowledge of its business and operations, there can be no assurance that actual results, performance or achievements of the Company will not differ materially from any future results, performance or achievements expressed or implied by such forward-looking statements.
| QUANTITATIVE AND QUALITATIVE DISCLOSURES ABOUT MARKET RISK |
Market risk is the risk of loss in a financial instrument arising from adverse changes in market rates or prices such as interest rates, foreign currency exchange rates, commodity prices and equity prices. The Company’s primary market risk exposure is interest rate risk, though it should be noted that the assets under management by Middleburg Trust Company are affected by equity price risk. The ongoing monitoring and management of this risk is an important component of the Company’s asset/liability management process, which is governed by policies established by its Board of Directors that are reviewed and approved every three years baring any significant changes. The Board of Directors delegates responsibility for carrying out asset/liability management policies to the Asset/Liability Committee (“ALCO”) of Middleburg Bank. In this capacity, ALCO develops guidelines and strategies that govern the Company’s asset/liability management related activities, based upon estimated market risk sensitivity, policy limits and overall market interest rate levels and trends.
Interest rate risk represents the sensitivity of earnings to changes in market interest rates. As interest rates change, the interest income and expense streams associated with the Company’s financial instruments also change, affecting net interest income, the primary component of the Company’s earnings. ALCO uses the results of a detailed and dynamic simulation model to quantify the estimated exposure of net interest income to sustained interest rate changes. While ALCO routinely monitors simulated net interest income sensitivity over a rolling two-year horizon, it also employs additional tools to monitor potential longer-term interest rate risk.
The simulation model captures the impact of changing interest rates on the interest income received and interest expense paid on all assets and liabilities reflected on the Company’s balance sheet. The simulation model is prepared and updated four times during each year. This sensitivity analysis is compared to ALCO policy limits, which specify a maximum tolerance level for net interest income exposure over a one-year horizon, assuming no balance sheet growth, given a 200 basis point (bp) upward shift and a 200 basis point downward shift in interest rates. The following reflects the range of the Company’s net interest income sensitivity analysis during the fiscal years of 2010 and 2009 as compared to the 20% Board-approved policy limit.
| Estimated Net Interest Income Sensitivity | ||||||
| Rate Change | December 31, 2010 | December 31, 2009 | ||||
| + 200 bps | (6.4%) | (11.47%) | ||||
| - 200 bps | (12.4%) | (9.96%) | ||||
At the end of 2010, the Company’s final 2010 interest rate risk model indicated that in a rate environment of an immediate 200 basis points increase, net interest income could decrease by 6.4% over a 12 month period. For the same time period, the final 2010 interest rate risk model indicated that, in a rate environment of an immediate 200 basis points decrease, net interest income could decrease by 12.4% over a 12 month period. Down rate scenarios were not meaningful in the interest rate environment that prevailed as of December 31, 2010. While these numbers are subjective based upon the parameters used within the model, management believes the balance sheet is very balanced and is working to minimize risks to rising rates in the future.
The Company’s specific goal is to lower (where possible) the cost of its borrowed funds.
The preceding sensitivity analysis does not represent a Company forecast and should not be relied upon as being indicative of expected operating results. These hypothetical estimates are based upon numerous assumptions, including the nature and timing of interest rate levels including yield curve shape, prepayments on loans and securities, deposit decay rates, pricing decisions on loans and deposits, reinvestment or replacement of asset and liability cash flows. While assumptions are developed based upon current economic and local market conditions, the Company cannot make any assurances about the predictive nature of these assumptions, including how customer preferences or competitor influences might change.
Also, as market conditions vary from those assumed in the sensitivity analysis, actual results will also differ due to factors such as prepayment and refinancing levels likely deviating from those assumed, the varying impact of interest rate change, caps or floors on adjustable rate assets, the potential effect of changing debt service levels on customers with adjustable rate loans, depositor early withdrawals and product preference changes, and other internal and external variables. Furthermore, the sensitivity analysis does not reflect actions that ALCO might take in response to or anticipation of changes in interest rates.
| FINANCIAL STATEMENTS AND SUPPLEMENTARY DATA |
The following financial statements are filed as a part of this report following Item 15 below:
| · | Report of Independent Registered Public Accounting Firm; |
| · | Consolidated Balance Sheets as of December 31, 2010 and 2009; |
| · | Consolidated Statements of Operations for the Years Ended December 31, 2010, 2009 and 2008; |
| · | Consolidated Statements of Changes in Shareholders’ Equity for the Years Ended December 31, 2010, 2009 and 2008; |
| · | Consolidated Statements of Cash Flows for the Years Ended December 31, 2010, 2009 and 2008; and |
| · | Notes to Consolidated Financial Statements. |
| CHANGES IN AND DISAGREEMENTS WITH ACCOUNTANTS ON ACCOUNTING AND FINANCIAL DISCLOSURE |
There were no changes in or disagreements with accountants on accounting and financial disclosure during the last two fiscal years.
| CONTROLS AND PROCEDURES |
Evaluation of Disclosure Controls and Procedures
The Company maintains “disclosure controls and procedures,” as such term is defined in Rule 13a-15(e) under the Securities Exchange Act of 1934, that are designed to ensure that information required to be disclosed in reports that it files or submits under the Exchange Act is recorded, processed, summarized, and reported within the time periods specified in SEC’s rules and forms, and that such information is accumulated and communicated to management, including the Chief Executive Officer and Chief Financial Officer, as appropriate, to allow timely decisions regarding required disclosure.
Based on their evaluation as of the end of the period covered by this Annual Report on Form 10-K, the Chief Executive Officer and Chief Financial Officer have concluded that the disclosure controls and procedures were effective and there has been no change in the Company’s internal controls over financial reporting that occurred during the fourth quarter of 2010 that has materially affected, or is reasonably likely to effect the Company’s internal controls over financial reporting.
Management’s Report on Internal Control over Financial Reporting
The management of the Company is responsible for the preparation, integrity and fair presentation of the Company’s financial statements for the year ended December 31, 2010. The financial statements have been prepared in conformity with accounting principles generally accepted in the United States of America and reflect management’s judgments and estimates concerning the effects of events and transactions that are accounted for or disclosed.
Management is also responsible for establishing and maintaining an effective internal control structure over financial reporting. The Company’s internal control over financial reporting includes those policies and procedures that pertain to the Company’s ability to record, process, summarize and report reliable financial data. The internal control system contains monitoring mechanisms, and appropriate actions are taken to correct identified deficiencies. Management believes that internal controls over financial reporting, which are subject to scrutiny by management and the Company’s internal auditors, support the integrity and reliability of the financial statements. Management recognizes that there are inherent limitations in the effectiveness of any internal control system, including the possibility of human error and the circumvention or overriding of internal controls. Accordingly, even effective internal control over financial reporting can provide only reasonable assurance with respect to financial statement preparation. In addition, because of changes in conditions and circumstances, the effectiveness of internal control over financial reporting may vary over time.
In order to insure that the Company’s internal control structure over financial reporting is effective, management assessed these controls as they conformed to accounting principles generally accepted in the United States of America and related call report instructions as of December 31, 2010 This assessment was based on criteria for effective internal control over financial reporting as described in “Internal Control - Integrated Framework” issued by the Committee of Sponsoring Organizations of the Treadway Commission (COSO). Based on this assessment, management believes that the Company maintained effective internal controls over financial reporting as of December 31, 2010. Management’s assessment did not determine any material weakness within the Company’s internal control structure.
The financial statements for the year ended December 31, 2010 have been audited by the independent registered public accounting firm of Yount, Hyde & Barbour, P.C. Personnel from that firm were given unrestricted access to all financial records and related data, including minutes of all meetings of the Board of Directors and Committees thereof.
Management believes that all representations made to the independent registered public accounting firm were valid and appropriate. The resulting report from Yount, Hyde & Barbour, P.C accompanies the financial statements.
Yount, Hyde & Barbour, P.C. has also issued an attestation report on the effectiveness of the Company’s internal controls over financial reporting. That report has also been made a part of the consolidated financial statements of the Company. See Item 8, “Financial Statements and Supplementary Data,” above for more information.
Changes in Internal Control over Financial Reporting
There were no changes in the internal control over financial reporting that occurred during the quarter ended December 31, 2010 that has materially affected, or is reasonably likely to materially affect, the internal control over financial reporting.
| OTHER INFORMATION |
None.
| DIRECTORS, EXECUTIVE OFFICERS AND CORPORATE GOVERNANCE |
Pursuant to General Instruction G(3) of Form 10-K, the information contained under the headings “Election of Directors – Nominees for Election for Terms Expiring in 2012” and “ – Executive Officers Who Are Not Directors,” “Security Ownership – Section 16(a) Beneficial Ownership Reporting Compliance,” and “Corporate Governance and the Board of Directors – Committees of the Board – Audit Committee” and “– Code of Ethics” in the Company’s Proxy Statement for the 2011 Annual Meeting of Shareholders is incorporated herein by reference.
| EXECUTIVE COMPENSATION |
Pursuant to General Instruction G(3) of Form 10-K, the information contained under the headings “Corporate Governance and the Board of Directors – Director Compensation” and “Executive Compensation” in the Company’s Proxy Statement for the 2011 Annual Meeting of Shareholders is incorporated herein by reference.
| SECURITY OWNERSHIP OF CERTAIN BENEFICIAL OWNERS AND MANAGEMENT AND RELATED STOCKHOLDER MATTERS |
Pursuant to General Instruction G(3) of Form 10-K, the information contained under the headings “Security Ownership – Security Ownership of Management” and “– Security Ownership of Certain Beneficial Owners” and “Executive Compensation – Equity Compensation Plans” in the Company’s Proxy Statement for the 2011 Annual Meeting of Shareholders is incorporated herein by reference.
| CERTAIN RELATIONSHIPS AND RELATED TRANSACTIONS, AND DIRECTOR INDEPENDENCE |
Pursuant to General Instruction G (3) of Form 10-K, the information contained under the heading “Executive Compensation – Transactions with Management” in the Company’s Proxy Statement for the 2011 Annual Meeting of Shareholders is incorporated herein by reference.
| PRINCIPAL ACCOUNTING FEES AND SERVICES |
Pursuant to General Instruction G(3) of Form 10-K, the information contained under the headings “Audit Information – Fees of Independent Public Accountants” and “– Pre-Approval Policies” in the Company’s Proxy Statement for the 2011 Annual Meeting of Shareholders is incorporated herein by reference.
| EXHIBITS, FINANCIAL STATEMENT SCHEDULES |
| (a) | (1) and (2). The response to this portion of Item 15 is submitted as a separate section of this report. |
(3). Exhibits:
| 3.1 | Amended and Restated Articles of Incorporation of the Company, attached as Exhibit 3.1 to the Company’s Annual Report on Form 10-K for the period ended December 31, 2008, incorporated herein by reference. | |
| 3.2 | Articles of Amendment to the Articles of Incorporation of the Company, attached as Exhibit 3.1 to the Company’s Current Report on Form 8-K, filed with the Commission on February 4, 2009, incorporated herein by reference. | |
| 3.3 | Bylaws of the Company (restated in electronic format as of October 28, 2010), attached as Exhibit 3.1 to the Company’s Current Report on Form 8-K, filed with the Commission on October 28, 2010, incorporated herein by reference. | |
| 4.1 | Warrant to Purchase Shares of Common Stock, dated January 30, 2009, attached as Exhibit 4.1 to the Company’s Annual Report on Form 10-K for the period ended December 31, 2009, incorporated herein by reference. | |
| 10.1 | Agreement, dated as of April 28, 2010, between the Company and Joseph L. Boling, attached as Exhibit 10.2 to the Company’s current Form 8-K filed with the Commission on April 29, 2010, incorporated herein by reference.* | |
| 10.2 | Middleburg Financial Corporation 2006 Equity Compensation Plan, as amended, attached as Exhibit 10.1 to the Company’s Current Report on Form 8-K, filed with the Commission on April 26, 2006, incorporated herein by reference.* | |
| 10.3 | Middleburg Financial Corporation Form of Performance Share Award Agreement, attached as Exhibit 10.3 to the Company’s Annual Report on Form 10-K for the year ended December 31, 2008, incorporated herein by reference.* | |
| 10.4 | Middleburg Financial Corporation Form of Restricted Share Award Agreement, attached as Exhibit 10.4 to the Company’s Annual Report on Form 10-K for the year ended December 31, 2008, incorporated herein by reference.* | |
| 10.5 | Middleburg Financial Corporation Form of Non-Qualified Stock Option Agreement, attached as Exhibit 10.1 to the Company’s Current Report on Form 8-K, filed with the Commission on March 20, 2009, incorporated herein by reference.* | |
| 10.6 | Middleburg Financial Corporation 2006 Management Incentive Plan, attached as Exhibit 10.3 to the Company’s Annual Report on Form 10-K for the year ended December 31, 2005, incorporated herein by reference .* | |
| 10.7 | Employment Agreement, dated as of April 28, 2010, between the Company and Gary R. Shook, attached as Exhibit 10.1 to the Company’s Current Report on Form 8-K, filed with the Commission on April 28, 2010, incorporated herein by reference.* | |
| 10.8 | Employment Agreement, dated as of May 7, 2010, between the Company and Raj Mehra, attached as Exhibit 10.1 to the Company’s Current Report on Form 8-K, filed with the Commission on May 13, 2010, incorporated herein by reference.* | |
| 10.9 | Letter Agreement, dated as of January 31, 2009, between the Company and the United States Department of the Treasury, attached as Exhibit 10.1 to the Company’s Current Report on Form 8-K, filed with the Commission on February 4, 2009, incorporated herein by reference. |
| 10.10 | Executive Retirement Plan, as amended and restated through April 28,, 2010, attached as Exhibit 10.1 to the Company’s Current Report on Form 8-K/A, Filed with the commission on October 14, 2010, incorporated herein by reference* | |
| 10.11 | Supplemental Benefit Plan, as amended and restated effective November 17, 2010, attached as Exhibit 10.1 to the Company’s Current Report on Form 8-K, filed with the Commission on November 22, 2010, incorporated herein by reference.* | |
| 10.12 | Stock Purchase Agreement, dated March 27, 2009, between the Company and David L. Sokol, attached as Exhibit 10.1 to the Company’s Current Report on Form 8-K, filed with the Commission on March 31, 2009, incorporated herein by reference.* | |
| 10.13 | First Amendment to Stock Purchase Agreement, dated October 27, 2010, between the Company and David L. Sokol, attached as Exhibit 10.1 to the Company’s Current Report on Form 8-K, filed with the Commission on October 28, 2010, incorporated herein by reference. | |
| 10.14 | Employment Agreement, dated as of April 28, 2010, between the Company and Jeffrey H. Culver.* | |
| 21.1 | Subsidiaries of the Company. | |
| 23.1 | Consent of Yount, Hyde & Barbour, P.C. | |
| 31.1 | Rule 13a-14(a) Certification of Chief Executive Officer | |
| 31.2 | Rule 13a-14(a) Certification of Chief Financial Officer. | |
| 32.1 | Statement of Chief Executive Officer and Chief Financial Officer Pursuant to 18 U.S.C. § 1350. | |
| * Management contracts and compensatory plans and arrangements. | ||
(All exhibits not incorporated herein by reference are attached as exhibits to the Company’s Annual Report on Form 10-K for the year ended December 31, 2010, as filed with the Securities and Exchange Commission.)
(b) Exhibits
The response to this portion of Item 15 as listed in Item 15(a)(3) above is submitted as a separate section of this report.
(c) Financial Statement Schedules
The response to this portion of Item 15 is submitted as a separate section of this report.
(All signatures are included with the Company’s Annual Report on Form 10-K for the year ended December 31, 2010, as filed with the Securities and Exchange Commission.)
SIGNATURES
Pursuant to the requirements of Section 13 or 15(d) of the Securities Exchange Act of 1934, as amended, the registrant has duly caused this report to be signed on its behalf by the undersigned, thereunto duly authorized.
| MIDDLEBURG FINANCIAL CORPORATION | |||
| Date: March 16, 2011 | By: | /s/ Joseph L. Boling | |
| Joseph L. Boling | |||
| Chairman of the Board | |||
| Date: March 16, 2011 | By: | /s/ Gary R. Shook | |
| Gary R. Shook | |||
| Chief Executive Officer | |||
Pursuant to the requirements of the Securities Exchange Act of 1934, as amended, this report has been signed below by the following persons on behalf of the registrant and in the capacities and on the dates indicated.
Signature | Title | Date |
| /s/ Joseph L. Boling | Chairman of the Board and Director | March 16, 2011 |
Joseph L. Boling | ||
| /s/ Gary R. Shook | Chief Executive Officer and President | March 16, 2011 |
Gary R. Shook | (Principal Executive Officer) | |
| /s/ Raj Mehra | Executive Vice President and Chief | March 16, 2011 |
Raj Mehra | Financial Officer (Principal Financial and Accounting Officer) | |
| /s/ Howard M. Armfield | Director | March 16, 2011 |
Howard M. Armfield | ||
| /s/ Henry F. Atherton, III | Director | March 16, 2011 |
Henry F. Atherton, III | ||
| /s/ Childs F. Burden | Director | March 16, 2011 |
Childs F. Burden | ||
| /s/ John Rust | Director | March 16, 2011 |
| John Rust | ||
| /s/ J. Bradley Davis | Director | March 16, 2011 |
| J. Bradley Davis | ||
| /s/ Alexander G. Green, III | Director | March 16, 2011 |
| Alexander G. Green, III |
Signature | Title | Date |
| /s/ Gary D. LeClair | Director | March 16, 2011 |
| Gary D. LeClair | ||
| /s/ John C. Lee, IV | Director | March 16, 2011 |
| John C. Lee, IV | ||
| /s/ Keith W. Meurlin | Director | March 16, 2011 |
| Keith W. Meurlin | ||
| /s/ Janet A. Neuharth | Director | March 16, 2011 |
Janet A. Neuharth | ||
| /s/ James R. Treptow | Director | March 16, 2011 |
James R. Treptow |
Exhibit Index
| Exhibit No. | Description | |
| 3.1 | Amended and Restated Articles of Incorporation of the Company, attached as Exhibit 3.1 to the Company’s Annual Report on Form 10-K for the period ended December 31, 2008, incorporated herein by reference. | |
| 3.2 | Articles of Amendment to the Articles of Incorporation of the Company, attached as Exhibit 3.1 to the Company’s Current Report on Form 8-K, filed with the Commission on February 4, 2009, incorporated herein by reference. | |
| 3.3 | Bylaws of the Company (restated in electronic format as of October 28, 2010), attached as Exhibit 3.1 to the Company’s Current Report on Form 8-K, filed with the Commission on October 28, 2010, incorporated herein by reference. | |
| 4.1 | Warrant to Purchase Shares of Common Stock, dated January 30, 2009, attached as Exhibit 4.1 to the Company’s Annual Report on Form 10-K for the period ended December 31, 2009, incorporated herein by reference. | |
| 10.1 | Agreement, dated as of April 28, 2010, between the Company and Joseph L. Boling, attached as Exhibit 10.2 to the Company’s current Form 8-K filed with the Commission on April 29, 2010, incorporated herein by reference.* | |
| 10.2 | Middleburg Financial Corporation 2006 Equity Compensation Plan, as amended, attached as Exhibit 10.1 to the Company’s Current Report on Form 8-K, filed with the Commission on April 26, 2006, incorporated herein by reference.* | |
| 10.3 | Middleburg Financial Corporation Form of Performance Share Award Agreement, attached as Exhibit 10.3 to the Company’s Annual Report on Form 10-K for the year ended December 31, 2008, incorporated herein by reference.* | |
| 10.4 | Middleburg Financial Corporation Form of Restricted Share Award Agreement, attached as Exhibit 10.4 to the Company’s Annual Report on Form 10-K for the year ended December 31, 2008, incorporated herein by reference.* | |
| 10.5 | Middleburg Financial Corporation Form of Non-Qualified Stock Option Agreement, attached as Exhibit 10.1 to the Company’s Current Report on Form 8-K, filed with the Commission on March 20, 2009, incorporated herein by reference.* | |
| 10.6 | Middleburg Financial Corporation 2006 Management Incentive Plan, attached as Exhibit 10.3 to the Company’s Annual Report on Form 10-K for the year ended December 31, 2005, incorporated herein by reference .* | |
| 10.7 | Employment Agreement, dated as of April 28, 2010, between the Company and Gary R. Shook, attached as Exhibit 10.1 to the Company’s Current Report on Form 8-K, filed with the Commission on April 28, 2010, incorporated herein by reference.* | |
| 10.8 | Employment Agreement, dated as of May 7, 2010, between the Company and Raj Mehra, attached as Exhibit 10.1 to the Company’s Current Report on Form 8-K, filed with the Commission on May 13, 2010, incorporated herein by reference.* | |
| 10.9 | Letter Agreement, dated as of January 31, 2009, between the Company and the United States Department of the Treasury, attached as Exhibit 10.1 to the Company’s Current Report on Form 8-K, filed with the Commission on February 4, 2009, incorporated herein by reference. | |
| 10.10 | Executive Retirement Plan, as amended and restated through April 28,, 2010, attached as Exhibit 10.1 to the Company’s Current Report on Form 8-K/A, Filed with the commission on October 14, 2010, incorporated herein by reference* | |
| 10.11 | Supplemental Benefit Plan, as amended and restated effective November 17, 2010, attached as Exhibit 10.1 to the Company’s Current Report on Form 8-K, filed with the Commission on November 22, 2010, incorporated herein by reference.* | |
| 10.12 | Stock Purchase Agreement, dated March 27, 2009, between the Company and David L. Sokol, attached as Exhibit 10.1 to the Company’s Current Report on Form 8-K, filed with the Commission on March 31, 2009, incorporated herein by reference.* | |
| 10.13 | First Amendment to Stock Purchase Agreement, dated October 27, 2010, between the Company and David L. Sokol, attached as Exhibit 10.1 to the Company’s Current Report on Form 8-K, filed with the Commission on October 28, 2010, incorporated herein by reference. | |
| 10.14 | Employment Agreement, dated as of April 28, 2010, between the Company and Jeffrey H. Culver.* | |
| Subsidiaries of the Company. | ||
| Consent of Yount, Hyde & Barbour, P.C. | ||
| Rule 13a-14(a) Certification of Chief Executive Officer | ||
| Rule 13a-14(a) Certification of Chief Financial Officer. | ||
| Statement of Chief Executive Officer and Chief Financial Officer Pursuant to 18 U.S.C. § 1350. | ||
| * Management contracts and compensatory plans and arrangements. | ||
MIDDLEBURG FINANCIAL CORPORATION
Middleburg, Virginia
FINANCIAL REPORT
DECEMBER 31, 2010
C O N T E N T S
| Page | |
| 3-5 | |
| CONSOLIDATED FINANCIAL STATEMENTS | |
| 6 | |
| 7 | |
| 8 | |
| 9 and 10 | |
| 11-57 |

To the Board of Directors and Shareholders
Middleburg Financial Corporation
Middleburg, Virginia
We have audited the accompanying consolidated balance sheets of Middleburg Financial Corporation and subsidiaries as of December 31, 2010 and 2009, and the related consolidated statements of operations, changes in shareholders' equity, and cash flows for the years ended December 31, 2010, 2009 and 2008. These financial statements are the responsibility of the Company's management. Our responsibility is to express an opinion on these financial statements based on our audits. We did not audit the 2009 and 2008 financial statements of Southern Trust Mortgage, LLC, a consolidated subsidiary, which statements reflect total assets constituting 6% in 2009 and total revenue constituting 28% and 23%, respectively, in 2009 and 2008, of the related consolidated totals. Those statements were audited by other auditors whose report has been furnished to us, and our opinion for 2009 and 2008, insofar as it relates to the amounts included for Southern Trust Mortgage LLC, is based solely on the report of the other auditors.
We conducted our audits in accordance with the standards of the Public Company Accounting Oversight Board (United States). Those standards require that we plan and perform the audit to obtain reasonable assurance about whether the financial statements are free of material misstatement. An audit includes examining, on a test basis, evidence supporting the amounts an disclosures in the financial statements. An audit also includes assessing the accounting principles used and significant estimates made by management, as well as evaluating the overall financial statement presentation. We believe that our audits provide a reasonable basis for our opinion.
In our opinion, based on our audits and the report of the other auditors, the consolidated financial statements referred to above present fairly, in all material respects, the financial position of Middleburg Financial Corporation and subsidiaries as of December 31, 2010 and 2009, and the results of their operations and their cash flows for the years ended December 31, 2010, 2009 and 2008, in conformity with U.S. generally accepted accounting principles.
We have also audited, in accordance with the standards of the Public Company Accounting Oversight Board (United States), Middleburg Financial Corporation and subsidiaries’ internal control over financial reporting as of December 31, 2010, based on criteria established in Internal Control — Integrated Framework issued by the Committee of Sponsoring Organizations of the Treadway Commission, and our report dated March 16, 2011 expressed an unqualified opinion on the effectiveness of Middleburg Financial Corporation and subsidiaries’ internal control over financial reporting.

Yount, Hyde & Barbour, P.C.
Winchester, Virginia
March 16, 2011
3
REPORT OF INDEPENDENT REGISTERED PUBLIC ACCOUNTING FIRM
To the Board of Directors and Shareholders
Middleburg Financial Corporation
Middleburg, Virginia
We have audited Middleburg Financial Corporation and subsidiaries’ internal control over financial reporting as of December 31, 2010, based on criteria established in Internal Control — Integrated Framework issued by the Committee of Sponsoring Organizations of the Treadway Commission. Middleburg Financial Corporation and subsidiaries’ management is responsible for maintaining effective internal control over financial reporting and for its assessment of the effectiveness of internal control over financial reporting included in the accompanying Management’s Report on Internal Control over Financial Reporting. Our responsibility is to express an opinion on the Company's internal control over financial reporting based on our audit.
We conducted our audit in accordance with the standards of the Public Company Accounting Oversight Board (United States). Those standards require that we plan and perform the audit to obtain reasonable assurance about whether effective internal control over financial reporting was maintained in all material respects. Our audit included obtaining an understanding of internal control over financial reporting, assessing the risk that a material weakness exists, and testing and evaluating the design and operating effectiveness of internal control based on the assessed risk. Our audit also included performing such other procedures as we considered necessary in the circumstances. We believe that our audit provides a reasonable basis for our opinion.
A company's internal control over financial reporting is a process designed to provide reasonable assurance regarding the reliability of financial reporting and the preparation of financial statements for external purposes in accordance with generally accepted accounting principles. A company's internal control over financial reporting includes those policies and procedures that (a) pertain to the maintenance of records that, in reasonable detail, accurately and fairly reflect the transactions and dispositions of the assets of the company; (b) provide reasonable assurance that transactions are recorded as necessary to permit preparation of financial statements in accordance with generally accepted accounting principles, and that receipts and expenditures of the company are being made only in accordance with authorizations of management and directors of the company; and (c) provide reasonable assurance regarding prevention or timely detection of unauthorized acquisition, use, or disposition of the company's assets that could have a material effect on the financial statements.
Because of its inherent limitations, internal control over financial reporting may not prevent or detect misstatements. Also, projections of any evaluation of effectiveness to future periods are subject to the risk that controls may become inadequate because of changes in conditions, or that the degree of compliance with the policies or procedures may deteriorate.
4
In our opinion, Middleburg Financial Corporation and subsidiaries maintained, in all material respects, effective internal control over financial reporting as of December 31, 2010, based on criteria established in Internal Control — Integrated Framework issued by the Committee of Sponsoring Organizations of the Treadway Commission.
We have also audited, in accordance with the standards of the Public Company Accounting Oversight Board (United States), the consolidated balance sheets as of December 31, 2010 and 2009, and the related consolidated statements of operations, changes in shareholders’ equity and cash flows for the years ended December 31, 2010, 2009 and 2008 of Middleburg Financial Corporation and subsidiaries and our report dated March 16, 2011 expressed an unqualified opinion.
Yount, Hyde & Barbour, P.C.
Winchester, Virginia
March 16, 2011
5
| CONSOLIDATED BALANCE SHEETS | ||||||||
| (In thousands, except for share and per share data) | ||||||||
| December 31, | ||||||||
| 2010 | 2009 | |||||||
| ASSETS | ||||||||
| Cash and due from banks | $ | 21,955 | $ | 18,365 | ||||
| Interest-bearing deposits with other institutions | 42,769 | 24,845 | ||||||
| Total cash and cash equivalents | 64,724 | 43,210 | ||||||
| Securities available for sale | 252,042 | 172,699 | ||||||
| Loans held for sale | 59,361 | 45,010 | ||||||
| Restricted securities, at cost | 6,296 | 6,225 | ||||||
| Loans receivable (net of allowance for loan losses of $14,967 in 2010 | ||||||||
| and $9,185 in 2009) | 644,345 | 635,094 | ||||||
| Premises and equipment, net | 21,112 | 23,506 | ||||||
| Goodwill and identified intangibles | 6,360 | 6,531 | ||||||
| Other real estate owned, net of valuation allowance | ||||||||
| of $1,486 in 2010 and $1,121 in 2009 | 8,394 | 6,511 | ||||||
| Prepaid federal deposit insurance | 5,154 | 6,923 | ||||||
| Accrued interest receivable and other assets | 36,779 | 30,665 | ||||||
| TOTAL ASSETS | $ | 1,104,567 | $ | 976,374 | ||||
| LIABILITIES | ||||||||
| Deposits: | ||||||||
| Non-interest-bearing demand deposits | $ | 130,488 | $ | 106,459 | ||||
| Savings and interest-bearing demand deposits | 436,718 | 396,294 | ||||||
| Time deposits | 323,100 | 302,895 | ||||||
| Total deposits | 890,306 | 805,648 | ||||||
| Securities sold under agreements to repurchase | 25,562 | 17,199 | ||||||
| Short-term borrowings | 13,320 | 3,538 | ||||||
| Federal Home Loan Bank borrowings | 62,912 | 35,000 | ||||||
| Subordinated notes | 5,155 | 5,155 | ||||||
| Accrued interest payable and other liabilities | 7,319 | 6,475 | ||||||
| TOTAL LIABILITIES | 1,004,574 | 873,015 | ||||||
| SHAREHOLDERS' EQUITY | ||||||||
| Common stock ($2.50 par value; 20,000,000 shares authorized, | ||||||||
| 6,925,437 issued; 6,925,437 and 6,909,293 outstanding at | ||||||||
| December 31, 2010 and 2009, respectively) | 17,314 | 17,273 | ||||||
| Capital surplus | 43,058 | 42,807 | ||||||
| Retained earnings | 37,593 | 42,706 | ||||||
| Accumulated other comprehensive loss | (1,012 | ) | (2,474 | ) | ||||
| Total Middleburg Financial Corporation shareholders' equity | 96,953 | 100,312 | ||||||
| Non-controlling interest in consolidated subsidiary | 3,040 | 3,047 | ||||||
| TOTAL SHAREHOLDERS' EQUITY | 99,993 | 103,359 | ||||||
| TOTAL LIABILITIES AND SHAREHOLDERS' EQUITY | $ | 1,104,567 | $ | 976,374 | ||||
See accompanying notes to the consolidated financial statements.
6
| CONSOLIDATED STATEMENTS OF OPERATIONS | ||||||||||||
| (In thousands, except for per share data) | ||||||||||||
| Year Ended December 31, | ||||||||||||
| 2010 | 2009 | 2008 | ||||||||||
| INTEREST INCOME | ||||||||||||
| Interest and fees on loans | $ | 40,548 | $ | 48,834 | $ | 48,088 | ||||||
| Interest on investment securities | ||||||||||||
| Tax-exempt | - | - | 4 | |||||||||
| Interest and dividends on securities available for sale | ||||||||||||
| Taxable | 4,733 | 4,743 | 5,026 | |||||||||
| Tax-exempt | 2,514 | 2,944 | 2,178 | |||||||||
| Dividends | 105 | 88 | 321 | |||||||||
| Interest on deposits in banks and federal funds sold | 131 | 137 | 305 | |||||||||
| Total interest and dividend income | 48,031 | 56,746 | 55,922 | |||||||||
| INTEREST EXPENSE | ||||||||||||
| Interest on deposits | 12,033 | 15,614 | 15,492 | |||||||||
| Interest on securities sold under agreements to | ||||||||||||
| repurchase | 205 | 40 | 831 | |||||||||
| Interest on short-term borrowings | 393 | 592 | 1,998 | |||||||||
| Interest on long-term debt | 1,544 | 2,836 | 4,398 | |||||||||
| Total interest expense | 14,175 | 19,082 | 22,719 | |||||||||
| NET INTEREST INCOME | 33,856 | 37,664 | 33,203 | |||||||||
| Provision for loan losses | 12,005 | 4,551 | 5,261 | |||||||||
| NET INTEREST INCOME AFTER PROVISION | ||||||||||||
| FOR LOAN LOSSES | 21,851 | 33,113 | 27,942 | |||||||||
| NONINTEREST INCOME | ||||||||||||
| Service charges on deposit accounts | 1,884 | 1,905 | 1,922 | |||||||||
| Trust and investment advisory fee income | 3,335 | 3,218 | 3,737 | |||||||||
| Gains on loans held for sale | 17,158 | 11,860 | 8,656 | |||||||||
| Gains on securities available for sale, net | 866 | 2,070 | 653 | |||||||||
| Total other-than-temporary impairment losses | (901 | ) | (2,224 | ) | (1,566 | ) | ||||||
| Portion of (gain) loss recognized in other | ||||||||||||
| comprehensive income | (202 | ) | 1,152 | - | ||||||||
| Net impairment losses | (1,103 | ) | (1,072 | ) | (1,566 | ) | ||||||
| Commissions on investment sales | 622 | 580 | 433 | |||||||||
| Fees on mortgages held for sale | 1,881 | 1,044 | 1,440 | |||||||||
| Other service charges, commissions and fees | 467 | 507 | 545 | |||||||||
| Bank-owned life insurance | 503 | 489 | 469 | |||||||||
| Other operating income | 390 | 311 | 615 | |||||||||
| Total noninterest income | 26,003 | 20,912 | 16,904 | |||||||||
| NONINTEREST EXPENSE | ||||||||||||
| Salaries and employees' benefits | 29,594 | 28,042 | 25,376 | |||||||||
| Net occupancy and equipment expense | 6,249 | 5,904 | 5,826 | |||||||||
| Advertising | 1,071 | 760 | 917 | |||||||||
| Computer operations | 1,324 | 1,290 | 1,110 | |||||||||
| Other real estate owned | 2,468 | 3,794 | 1,286 | |||||||||
| Other taxes | 798 | 587 | 642 | |||||||||
| Federal deposit insurance expense | 1,907 | 2,051 | 513 | |||||||||
| Other operating expenses | 9,331 | 6,434 | 6,929 | |||||||||
| Total noninterest expense | 52,742 | 48,862 | 42,599 | |||||||||
| Income (loss) before income taxes | (4,888 | ) | 5,163 | 2,247 | ||||||||
| Income tax expense (benefit) | (2,562 | ) | 64 | 444 | ||||||||
| NET INCOME (LOSS) | (2,326 | ) | 5,099 | 1,803 | ||||||||
| Net (income) loss attributable to non- | ||||||||||||
| controlling interest | (362 | ) | (1,577 | ) | 757 | |||||||
| Net income (loss) attributable to Middleburg | ||||||||||||
| Financial Corporation | (2,688 | ) | 3,522 | 2,560 | ||||||||
| Amortization of discount on preferred stock | - | 429 | - | |||||||||
| Dividends on preferred stock | - | 987 | - | |||||||||
| Net income (loss) available to common shareholders | $ | (2,688 | ) | $ | 2,106 | $ | 2,560 | |||||
| Earnings (loss) per share: | ||||||||||||
| Basic | $ | (0.39 | ) | $ | 0.37 | $ | 0.57 | |||||
| Diluted | $ | (0.39 | ) | $ | 0.37 | $ | 0.56 |
See accompanying notes to the consolidated financial statements.
7
| CONSOLIDATED STATEMENTS OF CHANGES IN SHAREHOLDERS' EQUITY | ||||||||||||||||||||||||||||||||||||
| Years Ended December 31, 2010, 2009 and 2008 | ||||||||||||||||||||||||||||||||||||
| (In thousands, except for share and per share data) | ||||||||||||||||||||||||||||||||||||
| Middleburg Financial Corporation Shareholders | ||||||||||||||||||||||||||||||||||||
| Accumulated | Total | |||||||||||||||||||||||||||||||||||
| Other | Compre- | Compre- | ||||||||||||||||||||||||||||||||||
| Compre- | hensive | Non- | hensive | |||||||||||||||||||||||||||||||||
| Preferred | Common | Capital | Retained | hensive | Income | Controlling | Income | |||||||||||||||||||||||||||||
| Stock | Stock | Surplus | Earnings | Income (Loss) | (Loss) | Interest | (Loss) | Total | ||||||||||||||||||||||||||||
| Balance, December 31, 2007 | $ | - | $ | 11,316 | $ | 23,817 | $ | 43,773 | $ | (1,002 | ) | $ | - | $ | 77,904 | |||||||||||||||||||||
| Consolidation of subsidiary shares from | ||||||||||||||||||||||||||||||||||||
| non-controlling interest | - - | - - | - - | - - | - - | 3,472 | 3,472 | |||||||||||||||||||||||||||||
| Comprehensive income (loss): | ||||||||||||||||||||||||||||||||||||
| Net income – 2008 | - - | - - | - - | 2,560 | - - | $ | 2,560 | (757 | ) | $ | 1,803 | 1,803 | ||||||||||||||||||||||||
| Other comprehensive loss net of tax: | ||||||||||||||||||||||||||||||||||||
| Unrealized holding losses arising during the | ||||||||||||||||||||||||||||||||||||
| period (net of tax, $742) | - - | - - | - - | - - | - - | (1,440 | ) | - - | (1,440 | ) | (1,440 | ) | ||||||||||||||||||||||||
| Reclassification adjustment (net of tax, $221) | - - | - - | - - | - - | - - | (432 | ) | - - | (432 | ) | (432 | ) | ||||||||||||||||||||||||
| Unrealized losses on securities for which an | ||||||||||||||||||||||||||||||||||||
| other-than-temporary impairment loss has | ||||||||||||||||||||||||||||||||||||
| been recognized in earnings, (net of tax, $532) | - - | - - | - - | - - | - - | 1,034 | - - | 1,034 | 1,034 | |||||||||||||||||||||||||||
| Change in benefit obligation and plan | ||||||||||||||||||||||||||||||||||||
| assets for defined benefit pension | ||||||||||||||||||||||||||||||||||||
| plan (net of tax, $691) | - - | - - | - - | - - | - - | (1,341 | ) | - - | (1,341 | ) | (1,341 | ) | ||||||||||||||||||||||||
| Total Other comprehensive loss (net of tax, $1,122) | - - | - - | - - | - - | (2,179 | ) | (2,179 | ) | - - | (2,179 | ) | (2,179 | ) | |||||||||||||||||||||||
| Total comprehensive income (loss) | - - | - - | - - | - - | - - | $ | 381 | (757 | ) | $ | (376 | ) | (376 | ) | ||||||||||||||||||||||
| Cash dividends – 2008 ($0.57 per share) | - - | - - | - - | (2,586 | ) | - - | - - | (2,586 | ) | |||||||||||||||||||||||||||
| Distributions to non-controlling interest | - - | - - | - - | - - | - - | (787 | ) | (787 | ) | |||||||||||||||||||||||||||
| Reduction due to change in pension measurement | ||||||||||||||||||||||||||||||||||||
| date | - - | - - | - - | (192 | ) | - - | - - | (192 | ) | |||||||||||||||||||||||||||
| Share-based compensation | - - | - - | 64 | - - | - - | - - | 64 | |||||||||||||||||||||||||||||
| Issuance of common stock (8,000 shares) | - - | 20 | 86 | - - | - - | - - | 106 | |||||||||||||||||||||||||||||
| Balance, December 31, 2008 | $ | - - | $ | 11,336 | $ | 23,967 | $ | 43,555 | $ | (3,181 | ) | $ | 1,928 | $ | 77,605 | |||||||||||||||||||||
| Comprehensive income (loss): | ||||||||||||||||||||||||||||||||||||
| Net income – 2009 | - - | - - | - - | 3,522 | - - | $ | 3,522 | $ | 1,577 | $ | 5,099 | 5,099 | ||||||||||||||||||||||||
| Other comprehensive income net of tax: | ||||||||||||||||||||||||||||||||||||
| Unrealized holding losses arising during the | ||||||||||||||||||||||||||||||||||||
| period (net of tax, $262) | - - | - - | - - | - - | - - | (510 | ) | - - | (510 | ) | (510 | ) | ||||||||||||||||||||||||
| Reclassification adjustment (net of tax, $704) | - - | - - | - - | - - | - - | (1,366 | ) | - - | (1,366 | ) | (1,366 | ) | ||||||||||||||||||||||||
| Unrealized losses on securities for which an | ||||||||||||||||||||||||||||||||||||
| other-than-temporary impairment loss has | ||||||||||||||||||||||||||||||||||||
| been recognized in earnings, (net of tax, $364) | - - | - - | - - | - - | - - | 708 | - - | 708 | 708 | |||||||||||||||||||||||||||
| Change in benefit obligation and plan | ||||||||||||||||||||||||||||||||||||
| assets for defined benefit pension | ||||||||||||||||||||||||||||||||||||
| plan (net of tax, $966) | - - | - - | - - | - - | - - | 1,875 | - - | 1,875 | 1,875 | |||||||||||||||||||||||||||
| Total Other comprehensive loss (net of tax, $364) | - - | - - | - - | - - | 707 | 707 | - - | 707 | 707 | |||||||||||||||||||||||||||
| Total comprehensive income (loss) | - - | - - | - - | - - | - - | $ | 4,229 | 1,577 | $ | 5,806 | 5,806 | |||||||||||||||||||||||||
| Cash dividends: | ||||||||||||||||||||||||||||||||||||
| Common stock ($0.48 per share) | - - | - - | - - | (2,955 | ) | - - | - - | (2,955 | ) | |||||||||||||||||||||||||||
| Preferred stock | - - | - - | - - | (987 | ) | - - | - - | (987 | ) | |||||||||||||||||||||||||||
| Distributions to non-controlling interest | - - | - - | - - | - - | - - | (458 | ) | (458 | ) | |||||||||||||||||||||||||||
| Share-based compensation | - - | - - | 119 | - - | - - | - - | 119 | |||||||||||||||||||||||||||||
| Issuance of preferred stock and related warrants | 21,571 | - - | 429 | - - | - - | - - | 22,000 | |||||||||||||||||||||||||||||
| Amortization of preferred stock discount | 429 | - - | - - | (429 | ) | - - | - - | - - | ||||||||||||||||||||||||||||
| Redemption of preferred stock | (22,000 | ) | - - | - - | - - | - - | - - | (22,000 | ) | |||||||||||||||||||||||||||
| Issuance of common stock (2,374,976 shares) | - - | 5,937 | 18,292 | - - | - - | - - | 24,229 | |||||||||||||||||||||||||||||
| Balance, December 31, 2009 | $ | - - | $ | 17,273 | $ | 42,807 | $ | 42,706 | $ | (2,474 | ) | $ | 3,047 | $ | 103,359 | |||||||||||||||||||||
| Comprehensive income (loss): | ||||||||||||||||||||||||||||||||||||
| Net income (loss) – 2010 | - - | - - | - - | (2,688 | ) | - - | $ | (2,688 | ) | $ | 362 | $ | (2,326 | ) | (2,326 | ) | ||||||||||||||||||||
| Other comprehensive income net of tax: | ||||||||||||||||||||||||||||||||||||
| Unrealized holding gains arising during the | ||||||||||||||||||||||||||||||||||||
| period (net of tax, $646) | - - | - - | - - | - - | - - | 1,254 | - - | 1,254 | 1,254 | |||||||||||||||||||||||||||
| Reclassification adjustment (net of tax, $294) | - - | - - | - - | - - | - - | (572 | ) | - - | (572 | ) | (572 | ) | ||||||||||||||||||||||||
| Unrealized losses on securities for which an | ||||||||||||||||||||||||||||||||||||
| other-than-temporary impairment loss has | ||||||||||||||||||||||||||||||||||||
| been recognized in earnings (net of tax, $375) | - - | - - | - - | - - | - - | 728 | - - | 728 | 728 | |||||||||||||||||||||||||||
| Unrealized gain on interest rate swaps (net of tax, $106 ) | - - | - - | - - | - - | - - | 206 | - - | 206 | 206 | |||||||||||||||||||||||||||
| Change in benefit obligation and plan | ||||||||||||||||||||||||||||||||||||
| assets for defined benefit pension | ||||||||||||||||||||||||||||||||||||
| plan (net of tax, $80) | - - | - - | - - | - - | - - | (154 | ) | - - | (154 | ) | (154 | ) | ||||||||||||||||||||||||
| Total Other comprehensive income (net of tax, $753) | - - | - - | - - | - - | 1,462 | 1,462 | - | 1,462 | 1,462 | |||||||||||||||||||||||||||
| Total comprehensive income (loss) | - - | - - | - - | - - | - - | $ | (1,226 | ) | 362 | $ | (864 | ) | (864 | ) | ||||||||||||||||||||||
| Cash dividends – ($0.35 per share) | - - | - - | - - | (2,425 | ) | (2,425 | ) | |||||||||||||||||||||||||||||
| Distributions to non-controlling interest | - - | - - | - - | - - | - - | (369 | ) | (369 | ) | |||||||||||||||||||||||||||
| Exercise of stock options (12,500 shares) | - - | 32 | 102 | - - | - - | - - | 134 | |||||||||||||||||||||||||||||
| Restricted stock vesting (3,650 shares) | - - | 9 | (9 | ) | - - | - - | - - | - - | ||||||||||||||||||||||||||||
| Share-based compensation | - - | - - | 158 | - - | - - | - - | 158 | |||||||||||||||||||||||||||||
| Balance, December 31, 2010 | $ | - - | $ | 17,314 | $ | 43,058 | $ | 37,593 | $ | (1,012 | ) | $ | 3,040 | $ | 99,993 | |||||||||||||||||||||
See accompanying notes to the consolidated financial statements.
8
| Consolidated Statements of Cash Flows | ||||||||||||
| Years Ended December 31, 2010, 2009 and 2008 | ||||||||||||
| (In Thousands) | ||||||||||||
| 2010 | 2009 | 2008 | ||||||||||
| Cash Flows From Operating Activities | ||||||||||||
| Net income (loss) | $ | (2,326 | ) | $ | 5,099 | $ | 1,803 | |||||
| Adjustments to reconcile net income (loss) to net cash | ||||||||||||
| provided by (used in) operating activities: | ||||||||||||
| Depreciation and amortization | 1,753 | 1,849 | 2,080 | |||||||||
| Equity in distributions in excess of earnings | ||||||||||||
| (undistributed earnings) of affiliate | (244 | ) | 115 | - - | ||||||||
| Provision for loan losses | 12,005 | 4,551 | 5,261 | |||||||||
| Net (gain) on securities available for sale | (866 | ) | (2,070 | ) | (653 | ) | ||||||
| Other than temporary impairment loss | 1,103 | 1,072 | 1,566 | |||||||||
| Net loss on sale of assets | 4 | 1 | 15 | |||||||||
| Discount accretion on securities, net | 2,622 | 294 | 136 | |||||||||
| Deferred income tax benefit | (3,173 | ) | (708 | ) | (1,599 | ) | ||||||
| Origination of loans held for sale | (782,172 | ) | (939,751 | ) | (636,138 | ) | ||||||
| Proceeds from sales of loans held for sale | 784,979 | 946,902 | 643,744 | |||||||||
| Net (gains) on mortgages held for sale | (17,158 | ) | (11,860 | ) | (8,656 | ) | ||||||
| Equity compensation | 158 | 119 | 64 | |||||||||
| Net loss on sale of other real estate owned | 190 | 183 | 653 | |||||||||
| Valuation adjustment on other real estate owned | 1,507 | 2,825 | - - | |||||||||
| Valuation adjustment on bank properties | 1,360 | - - | - - | |||||||||
| (Increase) / decrease in prepaid FDIC insurance | 1,769 | (6,923 | ) | - - | ||||||||
| Changes in assets and liabilities: | ||||||||||||
| (Increase) in other assets | (2,736 | ) | (1,665 | ) | (791 | ) | ||||||
| Increase (decrease) in other liabilities | 844 | (710 | ) | 773 | ||||||||
| Net cash provided by (used in) operating activities | $ | (381 | ) | $ | (677 | ) | $ | 8,258 | ||||
| Cash Flows from Investing Activities | ||||||||||||
| Proceeds from maturity, principal paydowns | ||||||||||||
| and calls of investment securities | $ | - - | $ | - - | $ | 155 | ||||||
| Proceeds from maturity, principal paydowns | ||||||||||||
| and calls of securities available for sale | 58,503 | 24,612 | 16,324 | |||||||||
| Proceeds from sale of investment securities | - - | - - | 526 | |||||||||
| Proceeds from sale of securities | ||||||||||||
| available for sale | 68,757 | 110,330 | 55,768 | |||||||||
| Purchase of securities available for sale | (206,910 | ) | (133,811 | ) | (128,306 | ) | ||||||
| Purchase of restricted stock | (570 | ) | (259 | ) | (6,776 | ) | ||||||
| Redemption of restricted stock | 499 | 450 | 7,821 | |||||||||
| Proceeds from sale of equipment | 18 | - - | - - | |||||||||
| Purchases of bank premises and equipment | (939 | ) | (1,979 | ) | (3,719 | ) | ||||||
| Net (increase) decrease in loans | (25,867 | ) | 18,098 | (14,036 | ) | |||||||
| Proceeds from sale of other real estate owned | 1,031 | 2,710 | 195 | |||||||||
| Investment by minority interest in consolidated subsidiary | - - | - - | 376 | |||||||||
| Proceeds form consolidation of subsidiary | - - | - - | 1,616 | |||||||||
| Purchase of bank-owned life insurance | (682 | ) | (453 | ) | - - | |||||||
| Net cash provided by (used in) investing activities | $ | (106,160 | ) | $ | 19,698 | $ | (70,056 | ) | ||||
9
| MIDDLEBURG FINANCIAL CORPORATION | ||||||||||||
| Consolidated Statements of Cash Flows | ||||||||||||
| (Continued) | ||||||||||||
| Years Ended December 31, 2010, 2009 and 2008 | ||||||||||||
| (In Thousands) | ||||||||||||
| 2010 | 2009 | 2008 | ||||||||||
| Cash Flows from Financing Activities | ||||||||||||
| Net increase in non-interest-bearing and interest- | ||||||||||||
| bearing demand deposits and savings accounts | $ | 64,453 | $ | 85,674 | $ | 51,995 | ||||||
| Net increase (decrease) in certificates of deposit | 20,205 | (24,809 | ) | 104,018 | ||||||||
| Increase (decrease) in securities sold under agreements | ||||||||||||
| to repurchase | 8,363 | (5,479 | ) | (29,103 | ) | |||||||
| Increase (decrease) in federal funds purchased | - - | - - | (500 | ) | ||||||||
| Proceeds from short-term borrowings | 129,963 | 383,885 | 907,861 | |||||||||
| Payments on short-term borrowings | (120,181 | ) | (421,291 | ) | (949,974 | ) | ||||||
| Proceeds from FHLB borrowings | 47,912 | - - | 16,000 | |||||||||
| Payments on FHLB borrowings | (20,000 | ) | (49,000 | ) | (20,000 | ) | ||||||
| Distributions to non-controlling interest | (369 | ) | (458 | ) | - - | |||||||
| Payment of dividends on preferred stock | - - | (987 | ) | - - | ||||||||
| Payment of dividends on common stock | (2,425 | ) | (2,955 | ) | (3,441 | ) | ||||||
| Net proceeds from issuance of preferred stock | - - | 22,000 | - - | |||||||||
| Repayment of preferred stock | - - | (22,000 | ) | - - | ||||||||
| Net proceeds from issuance of common stock | 134 | 24,229 | 106 | |||||||||
| Net cash provided by (used in) financing activities | $ | 128,055 | $ | (11,191 | ) | $ | 76,962 | |||||
| Increase in cash and and cash equivalents | 21,514 | 7,830 | 15,164 | |||||||||
| Cash and Cash Equivalents | ||||||||||||
| Beginning | 43,210 | 35,380 | 20,216 | |||||||||
| Ending | $ | 64,724 | $ | 43,210 | $ | 35,380 | ||||||
| Supplemental Disclosures of Cash Flow Information | ||||||||||||
| Cash payments for: | ||||||||||||
| Interest paid to depositors | $ | 12,497 | $ | 15,969 | $ | 16,854 | ||||||
| Interest paid on short-term obligations | 579 | 741 | 2,290 | |||||||||
| Interest paid on long-term debt | 1,714 | 3,030 | 4,452 | |||||||||
| $ | 14,790 | $ | 19,740 | $ | 23,596 | |||||||
| Income taxes | $ | - | $ | 1,791 | $ | 1,315 | ||||||
| Supplemental Disclosure of Noncash Transactions | ||||||||||||
| Unrealized gain (loss) on securities available for sale | $ | 2,138 | $ | (1,770 | ) | $ | (1,269 | ) | ||||
| Change in market value of interest rate swap | $ | 312 | $ | - | $ | - | ||||||
| Pension liability adjustment | $ | (234 | ) | $ | 2,841 | $ | (2,032 | ) | ||||
| Transfer of loans to other real estate owned | $ | 4,611 | $ | 4,632 | $ | 7,644 | ||||||
| See accompanying notes to the consolidated financial statements. | ||||||||||||
10
Notes to Consolidated Financial Statements
| Note 1. | Nature of Banking Activities and Significant Accounting Policies |
Middleburg Financial Corporation (the “Company”)’s banking subsidiary, Middleburg Bank, grants commercial, financial, agricultural, residential and consumer loans to customers principally in Loudoun County, Fauquier County’s and Fairfax County, Virginia. The loan portfolio is well diversified and generally is collateralized by assets of the customers. The loans are expected to be repaid from cash flow or proceeds from the sale of selected assets of the borrowers. Middleburg Trust Company and Middleburg Investment Advisors, Inc., non-banking subsidiaries of Middleburg Financial Corporation at December 31, 2010, offer a comprehensive range of fiduciary and investment management services to individuals and businesses. On January 3, 2011, Middleburg Investment Advisors Inc. was merged into Middleburg Trust Company and ceased operating as an independent company. Middleburg Financial Corporation has a controlling interest in Southern Trust Mortgage LLC, which originates and sells mortgages secured by personal residences primarily in the southeastern United States.
The accounting and reporting policies of the Company conform to U. S. generally accepted accounting principles and to accepted practice within the banking industry.
Principles of Consolidation
The consolidated financial statements of Middleburg Financial Corporation and its wholly owned subsidiaries, Middleburg Bank, Middleburg Investment Group, Inc., Middleburg Trust Company, Middleburg Investment Advisors, Inc., and Middleburg Bank Service Corporation include the accounts of all companies. Also included in the consolidation are Southern Trust Mortgage LLC and MFC Capital Trust II. The issued and outstanding interest of Southern Trust Mortgage not held by the Company is reported as Non-controlling Interest in Consolidated Subsidiary. Accounting Standards Codification Topic 810, Consolidation, requires that the Company no longer eliminate through consolidation the equity investment in MFC Capital Trust II, which approximated $155,000 for each of the years ended December 31, 2010 and 2009. The subordinate debt of the trust preferred entity is reflected as a liability of the Company. All material intercompany balances and transactions have been eliminated in consolidation.
Securities
Investments in debt securities with readily determinable fair values are classified as either held to maturity, available for sale, or trading based on management’s intent. Currently all debt securities are classified as available for sale. Equity investments in the FHLB and the Federal Reserve Bank of Richmond are separately classified as restricted securities and are carried at cost. Available-for-sale securities are carried at estimated fair value with the corresponding unrealized gains and losses excluded from earnings and reported in other comprehensive income. Purchase premiums and discounts are recognized in interest income using the interest method over the terms of the securities.
11
| Note 1. | Nature of Banking Activities and Significant Accounting Policies (Continued) |
Securities (Continued)
Impairment of securities occurs when the fair value of a security is less than its amortized cost. For debt securities, impairment is considered other-than-temporary and recognized in its entirety in net income if either (i) the intent is to sell the security or (ii) it is more likely than not that it will be necessary to sell the security prior to recovery of its amortized cost. If, however, management’s intent is not to sell the security and it is not more than likely that management will be required to sell the security before recovery, management must determine what portion of the impairment is attributable to credit loss, which occurs when the amortized cost of the security exceeds the present value of the cash flows expected to be collected from the security. If there is no credit loss, there is no other-than-temporary impairment. If there is a credit loss, other-than-temporary impairment exists and the credit loss must be recognized in net income and the remaining portion of impairment must be recognized in other comprehensive income.
For equity securities carried at cost as restricted securities, impairment is considered to be other-than-temporary based on our ability and intent to hold the investment until a recovery of fair value. Other-than-temporary impairment of an equity security results in a write-down that must be included in income. We regularly review each security for other-than-temporary impairment based on criteria that include the extent to which cost exceeds market price, the duration of that market decline, the financial health of and specific prospects for the issuer, our best estimate of the present value of cash flows expected to be collected from debt securities, the intention with regards to holding the security to maturity and the likelihood that we would be required to sell the security before recovery.
Loans
The Company’s subsidiary bank grants mortgage, commercial, and consumer loans to clients. The bank segments its loan portfolio into real estate loans, commercial loans, and consumer loans. Real estate loans are further divided into the following classes: Construction; Farmland; 1-4 family residential; and Other Real Estate Loans. Descriptions of the Company’s loan classes are as follows:
Commercial Loans: Commercial loans are typically secured with non-real estate commercial property. The Company makes commercial loans primarily to middle market businesses located within our market area.
Real Estate Loans – Construction: The Company originates construction loans for the acquisition and development of land and construction of condominiums, townhomes, and one-to-four family residences. This class also includes acquisition, development and construction loans for retail and other commercial purposes, primarily in our market areas.
Real Estate Loans- Farmland: This class of loans includes loans secured by agricultural property and not included in Real Estate – Other loans.
Real Estate Loans – 1-4 Family: This class of loans includes loans secured by one to four family homes. The Company’s general practice is to sell the majority of its newly originated fixed-rate residential real estate loans in the secondary mortgage market through its wholly owned subsidiary, Southern Trust Mortgage, and to hold in portfolio some adjustable rate residential real estate loans and loans in close proximity to its financial service centers.
Real Estate Loans – Other: This loan class consists primarily of loans secured by multi-unit residential property and owner and non-owner occupied commercial and industrial property. The class also includes loans secured by real estate which do not fall into other classifications.
Consumer Loans: Consumer loans include all loans made to individuals for consumer or personal purposes. They include new and used auto loans, unsecured loans and lines of credit and home equity loans and lines of credit.
A substantial portion of the loan portfolio is represented by mortgage loans throughout Loudoun County and Fauquier County, Virginia. The ability of the debtors to honor their contracts is dependent upon the real estate and general economic conditions in this area.
For all classes of loans, the Company considers loans to be past due when a payment is not received by the payment due date according to the contractual terms of the loan. The Company monitors past due loans according to the following categories: less than 30 days past due, 30 – 59 days past due, 60 – 89 days past due, and 90 days or greater past due.
12
Loans that management has the intent and ability to hold for the foreseeable future or until maturity or pay-off generally are reported at their outstanding unpaid principal balances adjusted for charge-offs, the allowance for loan losses, and any deferred fees or costs on originated loans. Interest income is accrued on the unpaid principal balance. Loan origination and commitment fees, net of certain direct loan origination costs, are deferred and recognized as an adjustment of the loan yield over the life of the related loan.
The accrual of interest on all classes of loans is discontinued at the time the loans are 90 days delinquent unless they are well-secured and in the process of collection.
All interest accrued but not collected for loans that are placed on nonaccrual or charged off is reversed against interest income. The interest on these loans is accounted for on the cash-basis or cost-recovery method, until qualifying for return to accrual. Loans are returned to accrual status when all the principal and interest amounts contractually due are brought current and future payments are reasonably assured.
Allowance for Loan Losses
The allowance for loan losses reflects management’s judgment of probable loan losses inherent in the portfolio at the balance sheet date. Management uses a disciplined process and methodology to establish the allowance for losses each quarter. To determine the total allowance for loan losses, the Company estimates the reserves needed for each segment of the portfolio, including loans analyzed individually and loans analyzed on a pooled basis. The allowance for loan losses consists of amounts applicable to: (i) the commercial loan portfolio; (ii) the real estate portfolio; and (iii) the consumer loan portfolio.
To determine the balance of the allowance account, loans are pooled by portfolio segment and losses are modeled using historical experience, and quantitative and other mathematical techniques over the loss emergence period. Each class of loan requires exercising significant judgment to determine the estimation that fits the credit risk characteristics of its portfolio segment. The Company uses internally developed models in this process. Management must use judgment in establishing additional input metrics for the modeling processes. The models and assumptions used to determine the allowance are independently validated and reviewed to ensure that their theoretical foundation, assumptions, data integrity, computational processes, reporting practices, and end user controls are appropriate and properly documented.
The establishment of the allowance for loan losses relies on a consistent process that requires multiple layers of management review and judgment and responds to changes in economic conditions, customer behavior, and collateral value, among other influences. From time to time, events or economic factors may affect the loan portfolio, causing management to provide additional amounts to or release balances from the allowance for loan losses. Qualitative factors considered in the allowance for loan losses evaluation include the levels and trends in delinquencies and nonperforming loans, trends in volume and terms of loans, the effects of any changes in lending policies, the experience, ability , and depth of management, national and local economic trends and conditions, concentrations of credit, the quality of the Company’s loan review system, and competition and regulatory requirements. The Company’s allowance for loan losses is sensitive to risk ratings assigned to individually evaluated loans and economic assumptions and delinquency trends driving statistically modeled reserves. Individual loan risk ratings are evaluated based on each situation by experienced senior credit officers.
Management monitors differences between estimated and actual incurred loan losses. This monitoring process includes periodic assessments by senior management of loan portfolios and the models used to estimate incurred losses in those portfolios. Additions to the allowance for loan losses are made by charges to the provision for loan losses. Credit exposures deemed to be uncollectible are charged against the allowance for loan losses. Recoveries of previously charged off amounts are credited to the allowance for loans losses.
13
Loan Charge-off Policies
Commercial and consumer loans are generally charged off when:
| · | they are 90 days past due; |
| · | the collateral is repossessed; or |
| · | the borrower has filed bankruptcy. |
All classes of real estate loans are charged down to the net realizable value when the Company determines that the sole source of repayment is liquidation of the collateral.
Impaired Loans
For all classes of loans, a loan is considered impaired when, based on current information and events, it is probable that the Company’s subsidiary bank will be unable to collect the scheduled payments of principal or interest when due according to the contractual terms of the loan agreement. Factors considered by management in determining impairment include payment status, collateral value, and the probability of collecting scheduled principal and interest payments when due. Loans that experience insignificant payment delays and payment shortfalls generally are not classified as impaired. Management determines the significance of payment delays and payment shortfalls on a case-by-case basis, taking into consideration all of the circumstances surrounding the loan and the borrower, including the length of the delay, the reasons for the delay, the borrower’s prior payment record, and the amount of the shortfall in relation to the principal and interest owed.
For all classes of loans, impairment is measured on a loan by loan basis by comparing the loan balance to either the present value of expected future cash flows discounted at the loan’s effective interest rate, the loan’s obtainable market price, or the fair value of the collateral if the loan is collateral-dependent. Any variance in values is charged off when determined.
Troubled Debt Restructurings
In situations where, for economic or legal reasons related to a borrower’s financial condition, management may grant a concession to the borrower that it would not otherwise consider, the related loan is classified as a troubled debt restructuring (“TDR”). Management strives to identify borrowers in financial difficulty early and work with them to modify their loan to more affordable terms before their loan reaches nonaccrual status. These modified terms may include rate reductions, principal forgiveness, payment forbearance and other actions intended to minimize the economic loss and to avoid foreclosure or repossession of the collateral. In cases where borrowers are granted new terms that provide for a reduction of either interest or principal, management measures any impairment on the restructuring as noted above for impaired loans.
The total balance of TDRs at December 31, 2010 was $4.5 million of which $3.2 million were included in the Company’s non-accrual loan totals at that date and $1.3 million represented loans performing as agreed to the restructured terms. This compares with $2.1 million in TDRs at December 31, 2009. The amount of the valuation allowance related to TDR’s was $532,000 and $675,000 as of December 31, 2010 and 2009, respectively.
The $3.2 million in nonaccrual restructured loans as of December 31, 2010 is comprised of $1.5 million in real estate construction loans and $1.8 million in 1-4 family real estate loans. The $1.3 million in restructured loans which were performing as agreed under restructured terms as of December 31, 2010 is comprised of $291,000 in real estate construction loans, $113,000 in 1-4 family real estate loans, and $850,000 in other real estate loans. All loans classified as TDRs are considered to be impaired as of December 31, 2010.
14
Mortgage Loans Held for Sale
Mortgage loans held for sale are carried at the lower of aggregate cost or fair value. The fair value of mortgage loans held for sale is determined using current secondary market prices for loans with similar coupons, maturities, and credit quality and fair value of loans committed at year-end.
Premises and Equipment
Land is carried at cost. Premises and equipment are stated at cost less accumulated depreciation. Depreciation of property and equipment is computed principally on the straight-line method over the following estimated useful lives:
| Years | ||||
| Buildings and improvements | 10-40 | |||
| Furniture and equipment | 3-15 | |||
Maintenance and repairs of property and equipment are charged to operations and major improvements are capitalized. Upon retirement, sale, or other disposition of property and equipment, the cost and accumulated depreciation are eliminated from the accounts and gain or loss is included in operations.
Other Real Estate
Real estate acquired by foreclosure is carried at fair market value less an allowance for estimated selling expenses on the future disposition of the property. Revenue and expenses from operations and changes in the valuation are included in the net expenses from other real estate.
Goodwill and Intangible Assets
Goodwill is subject to an annual assessment for impairment by applying a fair value-based test. Additionally, acquired intangible assets (customer relationships) are separately recognized and amortized over their useful life of 15 years.
Bank-Owned Life Insurance
The Company owns insurance on the lives of a certain group of key employees. The policies were purchased to help offset the increase in the costs of various fringe benefit plans, including healthcare. The cash surrender value of these policies is included as an asset on the consolidated balance sheets, and any increase in cash surrender value is recorded as other income on the consolidated statements of income. In the event of the death of an insured individual under these policies, the Company would receive a death benefit which would be recorded as other income.
15
Income Taxes
Deferred income tax assets and liabilities are determined using the balance sheet method. Under this method, the net deferred tax asset or liability is determined based on the tax effects of the temporary differences between the book and tax bases of the various balance sheet assets and liabilities and gives current recognition to changes in tax rates and laws.
When tax returns are filed, it is highly certain that some positions taken would be sustained upon examination by the taxing authorities, while others are subject to uncertainty about the merits of the position taken or the amount of the position that would be ultimately sustained. The benefit of a tax position is recognized in the financial statements in the period during which, based on all available evidence, management believes it is more likely than not that the position will be sustained upon examination, including the resolution of appeals or litigation processes, if any. Tax positions taken are not offset or aggregated with other positions. Tax positions that meet the more-likely-than-not recognition threshold are measured as the largest amount of tax benefit that is more than 50 percent likely of being realized upon settlement with the applicable taxing authority. The portion of the benefits associated with tax positions taken that exceeds the amount measured as described above is reflected as a liability for unrecognized tax benefits in the accompanying consolidated balance sheet along with any associated interest and penalties that would be payable to the taxing authorities upon examination. Interest and penalties associated with unrecognized tax benefits are classified as additional income taxes in the consolidated statements of income.
Trust Company Assets
Securities and other properties held by the Trust Company in a fiduciary or agency capacity are not assets of the Company and are not included in the accompanying consolidated financial statements.
Earnings Per Share
Basic earnings per share represents income available to common shareholders divided by the weighted-average number of common shares outstanding during the period. Diluted earnings per share reflects additional common shares that would have been outstanding if dilutive potential common shares had been issued, as well as any adjustment to income that would result from the assumed issuance. Potential common shares that may be issued by the Company relate solely to outstanding stock options and warrants and non-vested restricted stock awards, and are determined using the treasury stock method.
Cash and Cash Equivalents
For purposes of reporting cash flows, cash and cash equivalents include cash on hand, amounts due from banks and federal funds sold. Generally, federal funds are sold and purchased for one-day periods.
Use of Estimates
The preparation of consolidated financial statements in conformity with accounting principles generally accepted in the United States of America requires management to make estimates and assumptions that affect the reported amounts of assets and liabilities and disclosure of contingent assets and liabilities at the date of the consolidated financial statements and the reported amounts of revenues and expenses during the reporting period. Actual results could differ from those estimates. Material estimates that are particularly susceptible to significant change in the near term relate to the determination of the allowance for loan losses, goodwill and intangible assets, other real estate owned, other-than-temporary impairment of securities, pension plan assumptions, and the valuation of financial instruments.
Advertising Costs
The Company follows the policy of charging the costs of advertising to expense as incurred.
16
Comprehensive Income (Loss)
Accounting principles generally require that recognized revenue, expenses, gains, and losses be included in net income. Although certain changes in assets and liabilities, such as unrealized gains and losses on available-for-sale securities, changes in the fair value of interest rate swaps, and pension liability adjustments, are reported as a separate component of the equity section of the consolidated balance sheets, such items, along with net income, are components of comprehensive income (loss).
Securities Sold Under Agreements to Repurchase
Securities sold under agreements to repurchase are reflected at the amount of cash received in connection with the transaction. The Company does not account for repurchase agreement transactions as sales. All repurchase agreement transactions entered into by the Company are accounted for as collateralized financings. The Company may be required to provide additional collateral based on the fair value of the underlying securities.
17
| Note 1. | Nature of Banking Activities and Significant Accounting Policies (Continued) |
Derivative Financial Instruments
The Company enters into commitments to originate mortgage loans whereby the interest rate on the loan is determined prior to funding (rate lock commitments). Rate lock commitments on mortgage loans that are intended to be sold are considered to be derivatives. The period of time between issuance of a loan commitment and closing and sale of the loan generally ranges from 30 to 120 days. The Company protects itself from changes in interest rates through the use of best efforts forward delivery commitments, whereby the Company commits to sell a loan at the time the borrower commits to an interest rate with the intent that the buyer has assumed interest rate risk on the loan. As a result, the Company is not exposed to losses and will not realize significant gains related to its rate lock commitments due to changes in interest rates. The correlation between the rate lock commitments and the best efforts contracts is very high due to their similarity.
The market value of rate lock commitments and best efforts contracts is not readily ascertainable with precision because rate lock commitments and best efforts contracts are not actively traded in stand-alone markets. The Company determines the fair value of rate lock commitments and best efforts contracts by measuring the change in the value of the underlying asset while taking into consideration the probability that the rate lock commitments will close. Because of the high correlation between rate lock commitments and best efforts contracts, no gain or loss occurs on the rate lock commitments.
The Company utilizes interest rate swaps to manage interest rate risk. Interest rate swaps are recognized on the balance sheet at fair value. On the date the derivative contract is entered into, the Company designates the derivative as either a fair value hedge or a cash flow hedge according to current accounting guidance. The Company documents all relationships between hedging instruments and hedged items, as well as its risk management objective and strategy for undertaking various hedge transactions. This process includes linking all derivatives that are designated as fair value hedges or cash flow hedges to specific assets or liabilities on the balance sheet. The Company also formally assesses, both at the hedge’s inception and on an ongoing basis, whether the derivatives that are used in hedging transactions are highly effective in offsetting changes in fair values or cash flows of hedged items.
The Company has not designated any derivatives as fair value hedges as of December 31, 2010. For designated cash flow hedges, the effective portions of changes in the fair value of the derivative are recorded in other comprehensive income and are recognized in the income statement when the hedged item affects earnings. Ineffective portions of changes in the fair value of cash flow hedges are recognized in earnings.
Reclassifications
Certain reclassifications have been made to prior period balances to conform to current year provisions.
Transfers of Financial Assets
Transfers of financial assets are accounted for as sales when control over the assets has been surrendered. Control over transferred assets is deemed to be surrendered when (1) the assets have been isolated from the Company, (2) the transferee obtains the right (free of conditions that constrain it from taking advantage of that right) to pledge or exchange the transferred assets, and (3) the Company does not maintain effective control over the transferred assets through an agreement to repurchase them before their maturity.
Stock-Based Employee Compensation Plan
At December 31, 2010, the Company had a stock-based employee compensation plan which is described more fully in Note 8. Compensation cost relating to share-based payment transactions is recognized in the consolidated financial statements. That cost is measured based on the fair
18
value of the equity instruments issued. The Company recognized $158,000, $119,000, and $64,000 in compensation expense during 2010, 2009, and 2008, respectively, as a result of partially vested stock grants and vested stock options.
Recent Accounting Pronouncements
In June 2009, the Financial Accounting Standards Board (FASB) issued new guidance relating to the accounting for transfers of financial assets. The new guidance, which was issued as SFAS No. 166, “Accounting for Transfers of Financial Assets, an amendment to SFAS No. 140,” was adopted into the Accounting Standards Codification (Codification) in December 2009 through the issuance of Accounting Standards Update (ASU) 2009-16. The new standard provides guidance to improve the relevance, representational faithfulness, and comparability of the information that an entity provides in its financial statements about a transfer of financial assets; the effects of a transfer on its financial position, financial performance, and cash flows; and a transferor’s continuing involvement, if any, in transferred financial assets. ASU 2009-16 was effective for transfers on or after January 1, 2010. The adoption of the new guidance did not have a material impact on the Company’s consolidated financial statements.
In June 2009, the FASB issued new guidance relating to variable interest entities. The new guidance, which was issued as SFAS No. 167, “Amendments to FASB Interpretation No. 46(R),” was adopted into the Codification in December 2009. The objective of the guidance is to improve financial reporting by enterprises involved with variable interest entities and to provide more relevant and reliable information to users of financial statements. SFAS No. 167 was effective as of January 1, 2010. The adoption of the new guidance did not have a material impact on the Company’s consolidated financial statements.
In October 2009, the FASB issued ASU 2009-15, “Accounting for Own-Share Lending Arrangements in Contemplation of Convertible Debt Issuance or Other Financing.” ASU 2009-15 amends Subtopic 470-20 to expand accounting and reporting guidance for own-share lending arrangements issued in contemplation of convertible debt issuance. ASU 2009-15 is effective for fiscal years beginning on or after December 15, 2009 and interim periods within those fiscal years for arrangements outstanding as of the beginning of those fiscal years. The adoption of the new guidance did not have a material impact on the Company’s consolidated financial statements.
In January 2010, the FASB issued ASU 2010-04, Accounting for Various Topics – Technical Corrections to SEC Paragraphs. ASU 2010-04 makes technical corrections to existing Securities and Exchange Commission (SEC) guidance including the following topics: accounting for subsequent investments, termination of an interest rate swap, issuance of financial statements - subsequent events, use of residential method to value acquired assets other than goodwill, adjustments in assets and liabilities for holding gains and losses, and selections of discount rate used for measuring defined benefit obligation. The adoption of the new guidance did not have a material impact on the Company’s consolidated financial statements.
In January 2010, the FASB issued ASU 2010-06, “Fair Value Measurements and Disclosures (Topic 820): Improving Disclosures about Fair Value Measurements.” ASU 2010-06 amends Subtopic 820-10 to clarify existing disclosures, require new disclosures, and includes conforming amendments to guidance on employers’ disclosures about postretirement benefit plan assets. ASU 2010-06 is effective for interim and annual periods beginning after December 15, 2009, except for disclosures about purchases, sales, issuances, and settlements in the roll forward of activity in Level 3 fair value measurements. Those disclosures are effective for fiscal years beginning after December 15, 2010 and for interim periods within those fiscal years. The adoption of the new guidance did not have a material impact on the Company’s consolidated financial statements.
In February 2010, the FASB issued ASU 2010-09, “Subsequent Events (Topic 855): Amendments to Certain Recognition and Disclosure Requirements.” ASU 2010-09 addresses both the interaction of the requirements of Topic 855 with the SEC’s reporting requirements and the intended breadth of the reissuance disclosures provisions related to subsequent events. An entity that is an SEC filer is not required to disclose the date through which subsequent events have been
19
evaluated. ASU 2010-09 was effective immediately. The adoption of the new guidance did not have a material impact on the Company’s consolidated financial statements.
In July 2010, the FASB issued ASU 2010-20, “Disclosures about the Credit Quality of Financing Receivables and the Allowance for Credit Losses.” The new disclosure guidance significantly expands the existing requirements and will lead to greater transparency into a company’s exposure to credit losses from lending arrangements. The extensive new disclosures of information as of the end of a reporting period will become effective for both interim and annual reporting periods ending on or after December 15, 2010. Specific disclosures regarding activity that occurred before the issuance of the ASU, such as the allowance roll forward and modification disclosures, will be required for periods beginning on or after December 15, 2010. The Company has included the required disclosures in its consolidated financial statements.
On September 17, 2010, the SEC issued Release No. 33-9144, “Commission Guidance on Presentation of Liquidity and Capital Resources Disclosures in Management’s Discussion and Analysis.” This interpretive release is intended to improve discussion of liquidity and capital resources in Management’s Discussion and Analysis of Financial Condition and Results of Operations in order to facilitate understanding by investors of the liquidity and funding risks facing the registrant. This release was issued in conjunction with a proposed rule, “Short-Term Borrowings Disclosures,” that would require public companies to disclose additional information to investors about their short-term borrowing arrangements. Release No. 33-9144 was effective on September 28, 2010.
In January 2011, the FASB issued ASU 2011-01, “Deferral of the Effective Date of Disclosures about Troubled Debt Restructurings in Update No. 2010-20.” The amendments in this ASU temporarily delay the effective date of the disclosures about troubled debt restructurings in ASU 2010-20 for public entities. The delay is intended to allow the FASB time to complete its deliberations on what constitutes a troubled debt restructuring. The effective date of the new disclosures about troubled debt restructurings for public entities and the guidance for determining what constitutes a troubled debt restructuring will then be coordinated. Currently, that guidance is anticipated to be effective for interim and annual periods ending after June 15, 2011.
In December 2010, the FASB issued ASU 2010-29, “Disclosure of Supplementary Pro Forma Information for Business Combinations.” The guidance requires pro forma disclosure for business combinations that occurred in the current reporting period as though the acquisition date for all business combinations that occurred during the year had been as of the beginning of the annual reporting period. If comparative financial statements are presented, the pro forma information should be reported as though the acquisition date for all business combinations that occurred during the current year had been as of the beginning of the comparable prior annual reporting period. ASU 2010-29 is effective for business combinations for which the acquisition date is on or after the beginning of the first annual reporting period beginning on or after December 15, 2010. Early adoption is permitted. The adoption of the new guidance is not expected to have a material impact on the Company’s consolidated financial statements.
In December 2010, the FASB issued ASU 2010-28, “When to Perform Step 2 of the Goodwill Impairment Test for Reporting Units with Zero or Negative Carrying Amounts.” The amendments in this ASU modify Step 1 of the goodwill impairment test for reporting units with zero or negative carrying amounts. For those reporting units, an entity is required to perform Step 2 of the goodwill impairment test if it is more likely than not that a goodwill impairment exists. For public entities, the amendments in this Update are effective for fiscal years, and interim periods within those years, beginning after December 15, 2010. Early adoption is not permitted. The adoption of the new guidance is not expected to have a material impact on the Company’s consolidated financial statements.
The SEC has issued Final Rule No. 33-9002, Interactive Data to Improve Financial Reporting, which requires companies to submit financial statements in XBRL (extensible business reporting language) format with their SEC filings on a phased-in schedule. Large accelerated filers and foreign large accelerated filers using U.S. GAAP were required to provide interactive data reports starting with their first quarterly report for fiscal periods ending on or after June 15, 2010. All remaining filers are required to provide interactive data reports starting with their first quarterly report for fiscal periods ending on or after June 15, 2011.
20
| Note 2. | Securities |
Amortized costs and fair values of securities available for sale as of December 31, 2010 and 2009, are summarized as follows:
| 2010 | ||||||||||||||||
| Gross | Gross | |||||||||||||||
| Amortized | Unrealized | Unrealized | Fair | |||||||||||||
| Cost | Gains | Losses | Value | |||||||||||||
| (In Thousands) | ||||||||||||||||
| Available for Sale | ||||||||||||||||
| U.S. government agencies | $ | 4,699 | $ | 17 | $ | (67 | ) | $ | 4,649 | |||||||
| Obligations of states and | ||||||||||||||||
| political subdivisions | 61,187 | 174 | (2,221 | ) | 59,140 | |||||||||||
| Mortgage-backed securities: | ||||||||||||||||
| Agency | 150,952 | 1,722 | (370 | ) | 152,304 | |||||||||||
| Non-agency | 26,168 | 150 | (237 | ) | 26,081 | |||||||||||
| Corporate preferred stock | 39 | - | (26 | ) | 13 | |||||||||||
| Corporate securities | 9,609 | 7 | (84 | ) | 9,532 | |||||||||||
| Trust-preferred securities | 998 | - | (675 | ) | 323 | |||||||||||
| Total | $ | 253,652 | $ | 2,070 | $ | (3,680 | ) | $ | 252,042 | |||||||
21
| Note 2. | Securities (Continued) |
| 2009 | ||||||||||||||||
| Gross | Gross | |||||||||||||||
| Amortized | Unrealized | Unrealized | Fair | |||||||||||||
| Cost | Gains | Losses | Value | |||||||||||||
| (In Thousands) | ||||||||||||||||
| Available for Sale | ||||||||||||||||
| U.S. Treasury securities | $ | 3,084 | $ | 3 | $ | - | $ | 3,087 | ||||||||
| Obligations of states and | ||||||||||||||||
| political subdivisions | 70,586 | 228 | (1,770 | ) | 69,044 | |||||||||||
| Mortgage-backed securities: | ||||||||||||||||
| Agency | 89,933 | 949 | (642 | ) | 90,240 | |||||||||||
| Non-agency | 10,348 | 38 | (447 | ) | 9,939 | |||||||||||
| Corporate preferred stock | 39 | - | (5 | ) | 34 | |||||||||||
| Corporate securities | 100 | 4 | - | 104 | ||||||||||||
| Trust-preferred securities | 2,357 | - | (2,106 | ) | 251 | |||||||||||
| Total | $ | 176,447 | $ | 1,222 | $ | (4,970 | ) | $ | 172,699 | |||||||
The amortized cost and fair value of securities available for sale as of December 31, 2010, by contractual maturity are shown below. Maturities may differ from contractual maturities in corporate and mortgage-backed securities because the securities and mortgages underlying the securities may be called or repaid without any penalties. Therefore, these securities are not included in the maturity categories in the following maturity summary.
| December 31, 2010 | ||||||||
| Amortized | Fair | |||||||
| Cost | Value | |||||||
| (In Thousands) | ||||||||
| Due in one year or less | $ | 503 | $ | 507 | ||||
| Due after one year through | ||||||||
| five years | 9,403 | 9,225 | ||||||
| Due after five years through | ||||||||
| ten years | 34,203 | 33,183 | ||||||
| Due after ten years | 31,386 | 30,406 | ||||||
| Mortgage-backed securities | 177,120 | 178,385 | ||||||
| Corporate preferred stock | 39 | 13 | ||||||
| Trust-preferred securities | 998 | 323 | ||||||
| Total | $ | 253,652 | $ | 252,042 | ||||
Proceeds from sales of securities during 2010, 2009, and 2008 were $68,757,000, $110,330,000, and $56,294,000, respectively. Gross gains of $1,323,000, $3,061,000, and $822,000, and gross losses of $457,000, $991,000, and $169,000, were realized on those sales, respectively. Additionally, $1,103,000, $1,072,000, and $1,566,000 in losses were recognized for impaired securities in 2010, 2009, and 2008, respectively. The tax expense (benefit) applicable to these net realized gains and losses amounted to ($81,000), $339,000, and ($310,000), respectively.
The carrying value of securities pledged to qualify for fiduciary powers, to secure public monies and for other purposes as required by law amounted to $83,224,000 and $80,545,000 at December 31, 2010 and 2009, respectively.
22
| Note 2. | Securities (Continued) |
At December 31, 2010 and 2009, investments in an unrealized loss position that are temporarily impaired are as follows (in thousands):
| 2010 | ||||||||||||||||||||||||
| Less than Twelve Months | Twelve Months or Greater | Total | ||||||||||||||||||||||
| Gross | Gross | Gross | ||||||||||||||||||||||
| Fair | Unrealized | Fair | Unrealized | Fair | Unrealized | |||||||||||||||||||
| 2010 | Value | Losses | Value | Losses | Value | Losses | ||||||||||||||||||
| U.S. government agencies | $ | 3,408 | $ | (67 | ) | $ | - | $ | - | $ | 3,408 | $ | (67 | ) | ||||||||||
| Obligations of states and | ||||||||||||||||||||||||
| political subdivisions | 40,579 | (1,876 | ) | 4,266 | (345 | ) | 44,845 | (2,221 | ) | |||||||||||||||
| Mortgage backed securities: | ||||||||||||||||||||||||
| Agency | 50,338 | (370 | ) | - | - | 50,338 | (370 | ) | ||||||||||||||||
| Non-agency | 18,341 | (237 | ) | - | - | 18,341 | (237 | ) | ||||||||||||||||
| Corporate preferred stock | - | - | 12 | (26 | ) | 12 | (26 | ) | ||||||||||||||||
| Corporate securities | 9,385 | (84 | ) | - | - | 9,385 | (84 | ) | ||||||||||||||||
| Trust-preferred securities | - | - | 323 | (675 | ) | 323 | (675 | ) | ||||||||||||||||
| Total | $ | 122,051 | $ | (2,634 | ) | $ | 4,601 | $ | (1,046 | ) | $ | 126,652 | $ | (3,680 | ) | |||||||||
| 2009 | ||||||||||||||||||||||||
| Less than Twelve Months | Twelve Months or Greater | Total | ||||||||||||||||||||||
| Gross | Gross | Gross | ||||||||||||||||||||||
| Fair | Unrealized | Fair | Unrealized | Fair | Unrealized | |||||||||||||||||||
| 2009 | Value | Losses | Value | Losses | Value | Losses | ||||||||||||||||||
| Obligations of states and | ||||||||||||||||||||||||
| political subdivisions | $ | 31,312 | $ | (639 | ) | $ | 20,143 | $ | (1,131 | ) | $ | 51,455 | $ | (1,770 | ) | |||||||||
| Mortgage backed securities: | ||||||||||||||||||||||||
| Agency | 44,590 | (642 | ) | - | - | 44,590 | (642 | ) | ||||||||||||||||
| Non-agency | 6,601 | (447 | ) | - | - | 6,601 | (447 | ) | ||||||||||||||||
| Corporate preferred stock | - | - | 34 | (5 | ) | 34 | (5 | ) | ||||||||||||||||
| Trust-preferred securities | - | - | 252 | (2,106 | ) | 252 | (2,106 | ) | ||||||||||||||||
| Total | $ | 82,503 | $ | (1,728 | ) | $ | 20,429 | $ | (3,242 | ) | $ | 102,932 | $ | (4,970 | ) | |||||||||
A total of 100 securities have been identified by the Company as temporarily impaired at December 31, 2010. Of the 100 securities, 95 are investment grade and 5 are speculative grade. Agency, non-agency mortgage-backed securities, and municipal securities make up the majority of temporarily impaired securities at December 31, 2010. The speculative grade securities are asset backed securities that are collateralized by trust preferred issuances of financial institutions. Market prices change daily and are affected by conditions beyond the control of the Company. Although the Company has the ability to hold these securities until the temporary loss is recovered, decisions by management may necessitate a sale before the loss is fully recovered. No such sales were anticipated or required as of December 31, 2010. Investment decisions reflect the strategic asset/liability objectives of the Company. The investment portfolio is analyzed frequently by the Company and managed to provide an overall positive impact to the Company’s income statement and balance sheet.
Trust preferred securities
Trust preferred securities were evaluated within the scope of ASC 320 Investments – Debt and Equity Securities for potential impairment. The Company reviews current available information in estimating the future cash flows of these securities and determines whether there have been favorable or adverse changes in estimated cash flows from the cash flows previously projected. The Company considers the structure and term of the pool and the financial condition of the underlying issuers. Specifically, the evaluation incorporates factors such as interest rates and
23
appropriate risk premiums, the timing and amount of interest and principal payments and the allocation of payments to the various note classes. Current estimates of cash flows are based on the most recent trustee reports, announcements of deferrals or defaults, expected future default rates and other relevant market information. The Company analyzed the cash flow characteristics of these securities.
All of the pooled trust preferred securities in the Company’s portfolio have floating rate coupons. In performing the present value analysis of expected cash flows, we incorporate expected deferral and default rates. The deferral/default assumptions for each pooled trust preferred security were developed by reviewing the underlying collateral or issuing banks. The present value of expected future cashflows is discounted at the effective purchase yield, which in the case of the floating rate securities is equal to the credit spread at time of purchase plus the current 3-month LIBOR rate. We then compare the present value to the current book value for purposes of determining if there is an other-than-temporary impairment (“OTTI”). The discount rate used to determine OTTI for all periods is the effective purchase yield or the credit spread at time of purchase plus the 3-month LIBOR rate.
The Company reviewed the list of issuers underlying each trust preferred security as of December 31, 2010, and ranked each bank in order of expectations for future defaults and deferrals. We reviewed data on each bank such as earnings, capital ratios, credit metrics and loan loss reserves. We then assigned a default rate to each ranking, then the default rates were applied to each bank that was performing as of the reporting date. Finally, we summed the defaults and divided by the total remaining performing collateral in each pool. For Trust Preferred IV, the default rate was 50 basis points, for Trust Preferred V, the default rate was 0 basis points, for Trust Preferred XXII, the default rate was 40 basis points and for MM Community Funding, the default rate was 150 basis points.
Using the evaluation procedures described above, the Company identified five other than temporarily impaired securities within its portfolio. During the year ended December 31, 2010, the Company recognized credit related impairment losses of $1.1 million compared to $1.1 million for the year ended December 31, 2009.
The following table provides further information on the Company’s trust preferred securities that are considered other than temporarily impaired as of December 31, 2010 (in thousands):
| Cumulative | Amount | ||||||||||||
| Current | Other | of OTTI | (1) | (2) | Expected | ||||||||
| Moody's | Par | Book | Fair | Comprehensive | Related to | Excess | Inst. | Deferrals/ | Default | Expected | Lag | ||
| Security | Class | Rating | Value | Value | Value | (Income) Loss | Credit Loss | Subord. | Perf. | Defaults | Rate | Recovery | Years |
| MM Community Funding LTD | A | Ca | 208 | 208 | 155 | $53 | -- | 126.56% | 8 | 25.32% | 1.50% | 15% | 1 |
| MM Community Funding | B | Ca | $1,000 | $238 | $57 | $181 | $762 | -68.79% | 8 | 25.32% | 1.50% | 15% | 1 |
| MM Community Funding | B | Ca | 1,000 | $238 | 57 | 181 | 762 | -68.79% | 8 | 25.32% | 1.50% | 15% | 1 |
| Trust Preferred XXII | D | C | 1,979 | -- | -- | -- | 1,979 | -34.47% | 63 | 29.70% | 0.40% | 15% | 2 |
| Trust Preferred V | Mez | Ba3 | 304 | 71 | 30 | 41 | 368 | -768.50% | - | 100.00% | 0.00% | 15% | 2 |
| $4,491 | $755 | $299 | $456 | $3,871 | |||||||||
| (1) Excess subordination. See explanation in text below tables. | |||||||||||||
| (2) Number of institutions in class performing. | |||||||||||||
The Company also has the following investment in a trust preferred security not considered other than temporarily impaired as of December 31, 2010 (in thousands):
| Cumulative | ||||||||||||
| Current | Other | (1) | Expected | |||||||||
| Tranche | Moody's | Par | Book | Fair | Comprehensive | Institutions | Excess | Deferrals/ | Default | Expected | Lag | |
| Security | Level | Rating | Value | Value | Value | Loss | Performing | Subord. | Defaults | Rate | Recovery | Years |
| Trust Preferred IV | Mez | Ca | $244 | $244 | $24 | $220 | 4 | 19.28% | 27.10% | 0.50% | 15% | 2 |
| $244 | $244 | $24 | $220 | |||||||||
| (1) Excess subordination. See explanation in text below tables. | ||||||||||||
Both of the preceding tables present data on the excess subordination existing in each of the trust preferred issuances included in the Company’s investment portfolio. Excess subordination is the difference between the remaining performing collateral and the amount of bonds outstanding that
24
are senior to the class owned by the Company. Negative excess subordination indicates that there is not enough performing collateral in the pool to cover the outstanding balance of all classes senior to the classes owned by the Company.
The credit deferral/default assumptions utilized in the Company’s OTTI analysis methodology and included in the above tables consider specific collateral underlying each trust preferred security.
The following table presents a roll-forward of the credit loss component amount of OTTI recognized in earnings:
| OTTI Credit Losses Recognized in Earnings | |||
| Rollforward | |||
| Amount recognized through December 31, 2009 | $2,767 | ||
| Additions related to intial impairments | 368 | ||
| Additions related to subsequent impairments | 736 | ||
| Net impairment losses recognized in earnings through December 31, 2010 | $3,871 | ||
At December 31, 2010, the Company concluded that no other adverse change in cash flows had occurred and did not consider any other securities other-than-temporarily impaired. Based on this analysis and because the Company does not intend to sell these securities and it is more likely than not the Company will not be required to sell these securities before recovery of amortized cost basis, which may be at maturity; and, for debt securities related to corporate securities, determined that there was no other adverse change in the cash flows as viewed by a market participant, the Company does not consider the investments in these assets to be other-than-temporarily impaired at December 31, 2010. However, there is a risk that the Company’s continuing reviews could result in recognition of other-than-temporary impairment charges in the future.
The Company’s investment in FHLB stock totaled $4.6 million at December 31, 2010. FHLB stock is generally viewed as a long-term investment and as a restricted security which is carried at cost because there is no market for the stock other than the FHLB or member institutions. Therefore, when evaluating FHLB stock for impairment, its value is based on the ultimate recoverability of the par value rather than by recognizing temporary declines in value. Despite the FHLB’s temporary suspension of repurchases of excess capital stock in 2009, the Company does not consider this investment to be other-than-temporarily impaired at December 31, 2010, and no impairment has been recognized. FHLB stock is shown in restricted securities on the balance sheet and is not part to the available-for-sale portfolio.
25
Note 3. Loans, Net
The Company segregates its loan portfolio into three primary loan segments: Real Estate Loans, Commercial Loans, and Consumer Loans. Real estate loans are further segregated into the following classes: construction loans, loans secured by farmland, loans secured by 1-4 family residential real estate, and other real estate loans. Other real estate loans include commercial real estate loans. The consolidated loan portfolio was composed of the following:
| 2010 | 2009 | ||||||||||||||||
| Outstanding | Percent of | Outstanding | Percent of | ||||||||||||||
| Balance | Total Portfolio | Balance | Total Portfolio | ||||||||||||||
| (In Thousands) | |||||||||||||||||
| Real estate loans: | |||||||||||||||||
| Construction | $ | 68,110 | 10.3 | % | $ | 72,934 | 11.3 | % | |||||||||
| Secured by farmland | 11,532 | 1.7 | 2,491 | 0.4 | |||||||||||||
| Secured by 1-4 family residential | 242,620 | 36.8 | 267,713 | 41.6 | |||||||||||||
| Other real estate loans | 268,262 | 40.7 | 240,729 | 37.4 | |||||||||||||
| Commercial loans | 56,385 | 8.6 | 43,367 | 6.7 | |||||||||||||
| Consumer loans | 12,403 | 1.9 | 17,045 | 2.6 | |||||||||||||
| Total Gross Loans (1) | 659,312 | 100.0 | % | 644,279 | 100.0 | % | |||||||||||
| Less allowance for loan losses | 14,967 | 9,185 | |||||||||||||||
| Net loans | $ | 644,345 | $ | 635,094 | |||||||||||||
| (1) | Gross loan balances at December 31, 2010 and 2009 are net of deferred loan costs of $1.1 million and $728,000 respectively. | ||||||||||||||||
Loans presented in the table above exclude loans held for sale. The Company had $59.4 and $45.0 million in mortgages held for sale at December 31, 2010 and 2009, respectively.
The following table presents a contractual aging of the recorded investment in past due loans by class of loans as of December 31, 2010.
| (In Thousands) | ||||||||||||||||||||||||
| 30-59 Days | 60-89 Days | 90 Days | Total Past | Total | ||||||||||||||||||||
| Past Due | Past Due | Or Greater | Due | Current | Loans | |||||||||||||||||||
| Real estate loans: | ||||||||||||||||||||||||
| Construction | $ | 83 | $ | 7,423 | $ | 1,791 | $ | 9,297 | $ | 58,813 | $ | 68,110 | ||||||||||||
| Secured by farmland | - | - | - | - | 11,532 | 11,532 | ||||||||||||||||||
| Secured by 1-4 family residential | 2,938 | - | 7,729 | 10,667 | 231,953 | 242,620 | ||||||||||||||||||
| Other real estate loans | 4,438 | 3,887 | 1,385 | 9,710 | 258,552 | 268,262 | ||||||||||||||||||
| Commercial loans | 1,801 | 28 | 243 | 2,072 | 54,313 | 56,385 | ||||||||||||||||||
| Consumer loans | 22 | 41 | 242 | 305 | 12,098 | 12,403 | ||||||||||||||||||
| Total | $ | 9,282 | $ | 11,379 | $ | 11,390 | $ | 32,051 | $ | 627,261 | $ | 659,312 | ||||||||||||
The following table presents the recorded investment in nonaccrual loans and loans past due ninety days or more and still accruing by class of loans as of December 31 of the indicated year:
| 2010 | 2009 | |||||||||||||||
| Past due 90 | Past due 90 | |||||||||||||||
| days or more | days or more | |||||||||||||||
| Nonaccrual | and still accruing | Nonaccrual | and still accruing | |||||||||||||
| (In Thousands) | ||||||||||||||||
| Real estate loans: | ||||||||||||||||
| Construction | $ | 8,871 | $ | - | $ | 4,706 | $ | - | ||||||||
| Secured by 1-4 family residential | 10,817 | 676 | 2,327 | 805 | ||||||||||||
| Other real estate loans | 7,509 | 218 | 1,026 | - | ||||||||||||
| Commercial loans | 1,950 | 12 | 350 | 65 | ||||||||||||
| Consumer loans | 239 | 3 | 197 | 38 | ||||||||||||
| Total | $ | 29,386 | $ | 909 | $ | 8,606 | $ | 908 | ||||||||
If interest on nonaccrual loans had been accrued, such income would have approximated $722,000, $207,000, and $156,000 for the years ended December 31, 2010, 2009, and 2008 respectively.
26
The Company utilizes an internal asset classification system as a means of measuring and monitoring credit risk in the loan portfolio. Under the Company’s classification system, problem and potential problem loans are classified as “Special Mention”, “Substandard”, and “Doubtful”.
Special Mention: Loans classified as special mention have potential weaknesses that deserve management’s close attention. If left uncorrected, the potential weaknesses may result in the deterioration of the repayment prospects for the credit.
Substandard: Loans classified as substandard have a well-defined weakness that jeopardizes the liquidation of the debt. Either the paying capacity of the borrower or the value of the collateral may be inadequate to protect the Company from potential losses.
Doubtful: Loans classified as doubtful have a very high possibility of loss. However, because of important and reasonably specific pending factors, classification as a loss is deferred until a more exact status may be determined.
Loss: Loans are classified as loss when they are deemed uncollectable and are charged off immediately.
| As of December 31, 2010 | ||||||||||||||||||||||||||||
| (In Thousands) | Real Estate | Real Estate | ||||||||||||||||||||||||||
| Real Estate | Secured by | Secured by 1-4 | Other Real | |||||||||||||||||||||||||
| Construction | Farmland | Family Residential | Estate Loans | Commercial | Consumer | Total | ||||||||||||||||||||||
| Pass | $ | 31,744 | $ | 10,070 | 212,531 | $ | 244,982 | $ | 50,660 | $ | 12,016 | $ | 562,003 | |||||||||||||||
| Special Mention | 15,580 | 1,462 | 14,810 | 13,067 | 3,394 | 92 | 48,405 | |||||||||||||||||||||
| Substandard | 20,561 | - | 14,616 | 9,939 | 2,331 | 295 | 47,742 | |||||||||||||||||||||
| Doubtful | 225 | - | 663 | 274 | - | - | 1,162 | |||||||||||||||||||||
| Loss | - | - | - | - | - | - | - | |||||||||||||||||||||
| Ending Balance | $ | 68,110 | $ | 11,532 | 242,620 | $ | 268,262 | $ | 56,385 | $ | 12,403 | $ | 659,312 | |||||||||||||||
The following table presents loans individually evaluated for impairment by class of loans as of and for the year ended December 31, 2010:
| Unpaid | Average | Interest | ||||||||||||||||||
| (In Thousands) | Recorded | Principal | Related | Recorded | Income | |||||||||||||||
| Investment | Balance | Allowance | Investment | Recognized | ||||||||||||||||
| With no related allowance recorded: | ||||||||||||||||||||
| Real estate loans: | ||||||||||||||||||||
| Construction | $ | 3,415 | $ | 3,415 | $ | - | $ | 3,470 | $ | 4 | ||||||||||
| Secured by farmland | - | - | - | - | ||||||||||||||||
| Secured by 1-4 family residential | 5,450 | 6,281 | - | 5,992 | - | |||||||||||||||
| Other real estate loans | 1,303 | 1,303 | - | 1,316 | - | |||||||||||||||
| Commercial loans | 1,823 | 1,844 | - | 2,032 | - | |||||||||||||||
| Consumer loans | - | - | - | 28 | - | |||||||||||||||
| Total with no related allowance | 11,991 | 12,843 | - | 12,838 | 4 | |||||||||||||||
| With an allowance recorded: | ||||||||||||||||||||
| Real estate loans: | ||||||||||||||||||||
| Construction | 5,755 | 6,366 | 1,876 | 6,108 | - | |||||||||||||||
| Secured by farmland | - | - | - | - | ||||||||||||||||
| Secured by 1-4 family residential | 5,422 | 6,518 | 1,099 | 6,076 | - | |||||||||||||||
| Other real estate loans | 7,056 | 7,201 | 2,010 | 7,235 | 48 | |||||||||||||||
| Commercial loans | 127 | 127 | 108 | 128 | - | |||||||||||||||
| Consumer loans | 239 | 239 | 239 | 240 | - | |||||||||||||||
| Total with a related allowance | 18,599 | 20,452 | 5,332 | 19,787 | 48 | |||||||||||||||
| Total | $ | 30,590 | $ | 33,295 | $ | 5,332 | $ | 32,625 | $ | 52 | ||||||||||
The “Recorded Investment” amounts in the table above represent the outstanding principal balance on each loan represented in the table plus any accrued interest receivable on such loans. The “Unpaid Principal
27
Balance” represents the outstanding principal balance on each loan represented in the table plus any amounts that have been charged off on each loan.
Included in certain loan categories in the impaired loans are troubled debt restructurings (“TDR’s”) that were classified as impaired. The total balance of TDRs at December 31, 2010 was $4.5 million of which $3.2 million were included in the Company’s non-accrual loan totals at that date and $1.3 million represented loans performing as agreed to the restructured terms. This compares with $2.1 million in restructured loans at December 31, 2009, an increase of $2.4 million or 114.3%. The amount of the valuation allowance related to TDRs was $532,000 and $675,000 as of December 31, 2010 and 2009 respectively.
The $3.2 million in nonaccrual TDRs as of December 31, 2010 is comprised of $1.5 million in real estate construction loans and $1.8 million in 1-4 family real estate loans. The $1.3 million in TDRs which were performing as agreed under restructured terms as of December 31, 2010 is comprised of $291,000 in real estate construction loans, $113,000 in 1-4 family real estate loans, and $850,000 in other real estate loans. All loans classified as TDRs are considered to be impaired as of December 31, 2010.
| 2009 | ||||
| (In Thousands) | ||||
| Impaired loans with a related allowance for loan loss | $ | 12,282 | ||
| Impaired loans without a related allowance for loan loss | 10,441 | |||
| Related allowance for loan loss | 1,731 | |||
| Average recorded balance of impaired loans | 22,740 | |||
| Interest income recognized on impaired loans | 1,225 | |||
| Note 4. | Allowance for Loan Losses |
Changes in the allowance for loan losses are summarized as follows:
| Year Ended December 31, | ||||||
| 2010 | 2009 | 2008 | ||||
| (In Thousands) | ||||||
| Balance, beginning of year | $ | 9,185 | $10,020 | $7,093 | ||
| Provision for loan losses | 12,005 | 4,551 | 5,262 | |||
| Southern Trust Mortgage consolidation | - | - | 1,238 | |||
| Charge-offs: | ||||||
| Real estate loans: | ||||||
| Construction | 1,226 | 836 | 2,131 | |||
| Secured by 1-4 family residential | 3,256 | 3,205 | 233 | |||
| Other real estate loans | 460 | 375 | - | |||
| Commercial loans | 942 | 343 | 511 | |||
| Consumer loans | 500 | 725 | 744 | |||
| Total charge-offs | $ | 6,384 | $5,484 | $3,619 | ||
| Recoveries: | ||||||
| Real estate loans: | ||||||
| Construction | $ | - | $- | $9 | ||
| Secured by 1-4 family residential | 37 | 9 | - | |||
| Other real estate loans | 4 | - | - | |||
| Commercial loans | 68 | 21 | 2 | |||
| Consumer loans | 52 | 68 | 35 | |||
| Total recoveries | $ | 161 | $98 | $46 | ||
| Net charge-offs | 6,223 | 5,386 | 3,573 | |||
| Balance, end of year | $ | 14,967 | $9,185 | $10,020 | ||
| Ratio of allowance for loan losses | ||||||
| to portfolio loans outstanding at end of period | 2.27% | 1.43% | 1.49% | |||
| Ratio of net charge offs to average | ||||||
| portfolio loans outstanding during the period | 0.88% | 0.76% | 0.53% | |||
The following table presents the balance in the allowance for loan losses and the recorded investment in loans by loan type and based on impairment method as of December 31, 2010:
| Real Estate | Real Estate | |||||||||||||||||||||||||||
| (In Thousands) | Real Estate | Secured by | Secured by 1-4 | Other Real | ||||||||||||||||||||||||
| Construction | Farmland | Family Residential | Estate Loans | Commercial | Consumer | Total | ||||||||||||||||||||||
| Allowance for loan losses: | ||||||||||||||||||||||||||||
| Ending allowance balance attributable to loans: | ||||||||||||||||||||||||||||
| Individually evaluated for impairment | $ | 1,876 | $ | - | $ | 1,099 | $ | 2,010 | $ | 108 | $ | 239 | $ | 5,332 | ||||||||||||||
| Collectively evaluated for impairment | 2,808 | 107 | 2,866 | 2,761 | 947 | 146 | 9,635 | |||||||||||||||||||||
| Total ending allowance balance | $ | 4,684 | $ | 107 | $ | 3,965 | $ | 4,771 | $ | 1,055 | $ | 385 | $ | 14,967 | ||||||||||||||
| Loans: | ||||||||||||||||||||||||||||
| Individually evaluated for impairment | $ | 9,170 | $ | - | $ | 10,872 | $ | 8,359 | $ | 1,950 | $ | 239 | $ | 30,590 | ||||||||||||||
| Collectively evaluated for impairment | 58,940 | 11,532 | 231,748 | 259,903 | 54,435 | 12,164 | 628,722 | |||||||||||||||||||||
| Total ending loans balance | $ | 68,110 | $ | 11,532 | $ | 242,620 | $ | 268,262 | $ | 56,385 | $ | 12,403 | $ | 659,312 | ||||||||||||||
28
| Note 5. | Premises and Equipment, Net |
Premises and equipment consists of the following:
| 2010 | 2009 | |||||||
| (In Thousands) | ||||||||
| Land | $ | 2,379 | $ | 2,379 | ||||
| Facilities | 19,363 | 17,165 | ||||||
| Furniture, fixtures, and equipment | 12,345 | 11,563 | ||||||
| Construction in process and deposits on equipment | 1,536 | 5,522 | ||||||
| 35,623 | 36,629 | |||||||
| Less accumulated depreciation | (14,511 | ) | (13,123 | ) | ||||
| Total | $ | 21,112 | $ | 23,506 | ||||
Depreciation expense was $1,421,000, $1,459,000, and $1,557,000 for the years ended December 31, 2010, 2009, and 2008, respectively.
Pursuant to the terms of non-cancelable lease agreements in effect at December 31, 2010, pertaining to banking premises and equipment, future minimum rent commitments (in thousands) under various operating leases are as follows:
| 2011 | $ | 2,464 | ||
| 2012 | 2,078 | |||
| 2013 | 1,994 | |||
| 2014 | 1,948 | |||
| 2015 | 1,900 | |||
| Thereafter | 18,097 | |||
| $ | 28,480 |
Rent expense was $2,877,000, $2,704,000, and $2,698,000 for the years ended December 31, 2010, 2009, and 2008, respectively.
During 2010, two branch sites that had been held for future expansion were reclassified from the “Construction in process and deposits on equipment” account to a held for sale account as these properties are no longer being considered for potential branch sites and are being actively marketed to potential buyers. As a result of this change in classification, the carrying value of these properties was adjusted to the fair market value on the date of transfer of $1.9 million. The reclassification resulted in a charge to earnings of approximately $1.4 million. The properties are reflected in the Consolidated Balance Sheet as of December 31, 2010 under “Accrued interest receivable and other assets”.
| Note 6. | Deposits |
The Company has developed an interest bearing product that integrates the use of the cash within client accounts at Middleburg Trust Company for overnight funding at Middleburg Bank. The overall balance of this product was $29.0 million and $44.5 million at December 31, 2010 and 2009, respectively, and is partially reflected in the interest-bearing demand deposits and partially reflected in securities sold under agreements to repurchase amounts on the balance sheet.
29
The aggregate amount of jumbo time deposits, each with a minimum denomination of $100,000, was approximately $202,146,000 and $159,991,000 at December 31, 2010 and 2009, respectively.
At December 31, 2010, the scheduled maturities of time deposits (in thousands) are as follows:
| 2011 | $ | 188,680 | ||
| 2012 | 62,710 | |||
| 2013 | 48,419 | |||
| 2014 | 18,262 | |||
| 2015 | 5,029 | |||
| $ | 323,100 |
At December 31, 2010 and 2009, overdraft demand deposits reclassified to loans totaled $273,000 and $138,000, respectively.
At December 31, 2010, one depositor, with $33.0 million, held approximately 4 percent of the total deposits at Middleburg Bank.
Middleburg Bank obtains certain deposits through the efforts of third-party brokers. At December 31, 2010 and 2009, brokered deposits totaled $62.0 million and $64.0 million, respectively, and were included in time deposits on the Company’s financial statements.
| Note 7. | Borrowings |
Middleburg Bank has credit availability in the amount of $154 million at the Federal Home Loan Bank of Atlanta. This line may be utilized for short and/or long-term borrowing. Advances on the line are secured by all of the Company’s first lien residential real estate loans on one-to-four-unit, single-family dwellings; home equity lines of credit; and eligible commercial real estate loans. As of December 31, 2010, the book value of these loans totaled approximately $263,522,000. The amount of the available credit is limited to 75 percent of qualifying collateral for the first lien residential real estate loans, 50 percent of qualifying home equity lines of credit, and 50 percent of the eligible commercial real estate loans. Any borrowings in excess of the qualifying collateral require pledging of additional assets.
The outstanding balances and related information for Federal Funds Purchased, Securities Sold Under Agreements to Repurchase, and Short-term Borrowings are summarized as follows (in thousands):
| Federal Funds Purchased | Securities Sold Under Agreements to Repurchase | Short-term Borrowings | ||||||||||||
| At December 31: | ||||||||||||||
| 2010 | $ | - | $ | 25,562 | $ | 13,320 | ||||||||
| 2009 | - | 17,199 | 3,538 | |||||||||||
| 2008 | - | 22,678 | 40,944 | |||||||||||
| Weighted-average interest rate at year-end: | ||||||||||||||
| 2010 | - | % | 0.94 | % | 5.13 | % | ||||||||
| 2009 | - | 0.16 | 5.00 | |||||||||||
| 2008 | - | 0.48 | 2.56 | |||||||||||
| Maximum amount outstanding at any month's end: | ||||||||||||||
| 2010 | $ | 5,000 | $ | 27,542 | $ | 21,875 | ||||||||
| 2009 | - | 25,210 | 50,719 | |||||||||||
| 2008 | - | 58,688 | 92,512 | |||||||||||
| Average amount outstanding during the year: | ||||||||||||||
| 2010 | $ | 25 | $ | 25,314 | $ | 10,419 | ||||||||
| 2009 | - | 21,122 | 15,513 | |||||||||||
| 2008 | 397 | 40,924 | 44,983 | |||||||||||
| Weighted-average interest rate during the year: | ||||||||||||||
| 2010 | - | % | 0.81 | % | 3.77 | % | ||||||||
| 2009 | - | 0.19 | 3.82 | |||||||||||
| 2008 | 2.77 | 2.03 | 4.42 | |||||||||||
Southern Trust Mortgage has a two revolving lines of credit with a regional bank with a combined credit limit of $44,000,000. The lines are primarily used to fund its mortgages held for sale. Middleburg Bank guarantees the balance of these loans up to $10,000,000. At December 31, 2010, these lines had an outstanding balance of $13,320,000 and are included in total short-term borrowings. The lines of credit are based on the London Inter-Bank Offered Rate (“LIBOR”). The weighted-average interest rate on Southern Trust Mortgage’s lines of credit at December 31, 2010, was 5.13 percent.
Southern Trust Mortgage also has a $50,000,000 line of credit for financing mortgage notes it originates until such time the mortgage notes can be sold and a $5,000,000 line of credit for operating purposes with Middleburg Bank, of which $45,087,000 and $2,464,000, respectively, was outstanding at December 31, 2010. These lines of credit are eliminated in the consolidation process and are not reflected in the consolidated financial statements of the Company.
The Company’s had $62,912,000 of Federal Home Loan Bank advances outstanding as of December, 31, 2010. The interest rates on these advances ranged from 0.29 percent to 1.98 percent and the weighted-average rate was 1.43 percent. The Company’s Federal Home Loan Bank advances totaled $35,000,000 at December 31, 2009. The weighted-average interest rate on these advances at December 31, 2009 was 4.61 percent.
The contractual maturities of the Company’s long-term debt are as follows:
| 2010 | ||||
| (In thousands) | ||||
| Due in 2011 | $ | 10,000 | ||
| Due in 2012 | 17,912 | |||
| Due in 2014 | 35,000 | |||
| Total | $ | 62,912 | ||
The Company also has a line of credit with the Federal Reserve Bank of Richmond of $26,884,787 of which there was no outstanding balance at December 31, 2010.
The Company has an additional $24 million in lines of credit available from other institutions at December 31, 2010.
30
| Note 8. | Stock-Based Compensation Plan |
The Company sponsored one stock-based compensation plan, the 2006 Equity Compensation Plan, which provides for the granting of stock options, stock appreciation rights, stock awards, performance share awards, incentive awards, and stock units. The 2006 Equity Compensation Plan was approved by the Company’s shareholders at the Annual Meeting held on April 26, 2006, and has succeeded the Company’s 1997 Stock Incentive Plan. Under the plan, the Company may grant stock-based compensation to its directors, officers, employees, and other persons the Company determines have contributed to the profits or growth of the Company. The Company may grant awards with respect to up to 255,000 shares of common stock under the 2006 Equity Compensation Plan.
The Company granted 24,440 shares of restricted stock on March 15, 2010. The restricted stock award is divided equally between service-based shares and performance-based shares. The service-based portion of the stock award has a vesting period of 25% of the shares granted one year after the date of grant, another 25% two years after the date of grant, and the remaining 50% on the third year after the date of grant. Service-based stock awards are entitled to voting and dividend rights on all shares granted as of the grant date. The performance-based stock awards vest at 100% on the third year after the date of grant if pre-established financial performance targets are met. If the performance targets are not met as of the end of the fiscal year preceding the third anniversary date of the grant, the performance-based shares are forfeited. All unearned restricted stock grants are forfeited if the employee leaves the Company prior to vesting.
Additionally, 2,803 shares of service-based restricted stock were issued to certain executive officers on May 1, 2010. Of these shares, 1,430 vest on a graduated basis as discussed above. The remaining 1,373 shares will vest at 100% on May 1, 2011.
No stock option awards were granted during the year ended December 31, 2010.
For the years ended December 31, 2010, 2009, and 2008, the Company recorded $158,000, $94,000, and $64,000, respectively, in stock-based compensation expense related to previously issued restricted stock and option grants. The total income tax benefit related to stock-based compensation was $41,000, $2,000, and $12,000 in 2010, 2009, and 2008, respectively.
The following table summarizes restricted stock service awards awarded under the 2006 Equity Compensation Plan at December 31.
| 2010 | 2009 | 2008 | |||||||||||||||
| Shares | Weighted-Average Grant Date Fair Value | Aggregate Intrinsic Value | Shares | Weighted-Average Grant Date Fair Value | Aggregate Intrinsic Value | Shares | Weighted-Average Grant Date Fair Value | Aggregate Intrinsic Value | |||||||||
| Non-vested at the | |||||||||||||||||
| beginning of the year | 7,752 | $23.82 | 10,602 | $24.04 | 3,508 | $32.30 | |||||||||||
| Granted | 15,023 | 14.58 | - | - | 9,051 | 21.66 | |||||||||||
| Vested | (3,650) | 26.30 | (2,850) | 24.62 | (877) | 32.30 | |||||||||||
| Forfeited | (2,247) | 14.99 | - | - | (1,080) | 24.22 | |||||||||||
| Non-vested at end of | |||||||||||||||||
| the year | 16,878 | $16.24 | $241,000 | 7,752 | $23.82 | $94,000 | 10,602 | $24.04 | $155,000 | ||||||||
The weighted-average remaining contractual term for non-vested service award grants at December 31, 2010 and 2009, was 1.9 and 1.2 years, respectively. The weighted-average grant-date fair value of restricted stock service-based grants awarded during the year ended December 31, 2010 was $14.58. No service-based restricted stock was granted during the year ended December 31, 2009. As of December 31, 2010, there was $259,000 of total unrecognized compensation expense related to the non-vested service awards under the 2006 Equity Compensation Plan.
For the years ended December 31, 2010, 2009, and 2008, the Company recorded $131,000, $94,000, and $64,000, respectively, in compensation expense for service-based restricted stock awards
31
The following table summarizes restricted stock performance awards awarded under the 2006 Equity Compensation Plan at December 31.
| 2010 | 2009 | 2008 | |||||||||||||||
| Shares | Weighted-Average Grant Date Fair Value | Aggregate Intrinsic Value | Shares | Weighted-Average Grant Date Fair Value | Aggregate Intrinsic Value | Shares | Weighted-Average Grant Date Fair Value | Aggregate Intrinsic Value | |||||||||
| Non-vested at the | |||||||||||||||||
| beginning of the year | 16,078 | $18.11 | 16,078 | $18.11 | 3,508 | $32.30 | |||||||||||
| Granted | 12,220 | 13.92 | - | - | 12,881 | 14.59 | |||||||||||
| Vested | - | - | - | - | - | - | |||||||||||
| Forfeited | (6,596) | 23.00 | - | - | (311) | 32.30 | |||||||||||
| Non-vested at end of | |||||||||||||||||
| the year | 21,702 | $14.27 | $309,000 | 16,078 | $18.11 | $195,000 | 16,078 | $18.11 | $235,000 | ||||||||
32
| Note 8. | Stock-Based Compensation Plan (Continued) |
The weighted-average remaining contractual term for non-vested performance award grants at December 31, 2010 and 2009, was 1.6 and 1.2 years, respectively. The weighted-average grant-date fair value of performance-based restricted stock awarded during the year ended December 31, 2010 was $13.92. No performance-based restricted stock was granted during the year ended December 31, 2009. As of December 31, 2010, there was $310,000 of total unrecognized compensation expense related to the non-vested performance awards under the 2006 Equity Compensation Plan.
Performance-based restricted stock awards vest based on the target levels being reached over a three-year period. Performance standards for these awards have not yet been met and, as such, no expense has been recorded.
Stock options may be granted periodically to certain officers and employees under the Company’s stock-based compensation plan as determined by a committee. The Company recorded compensation expense of $27,000 and $25,000, respectively for the years ended December 31, 2010 and December 31, 2009 related to previously issued stock option awards. No stock option compensation expense was recorded for the year ended December 31, 2008. Shares issued in connection with stock option exercises may be issued from available treasury shares or from market purchases.
Options are granted to certain employees at prices equal to the market value of the stock on the date the options are granted. Options vest over a three-year time period over which 25 percent vests on each of the first and second anniversaries of the grant and 50 percent on the third anniversary of the grant. The effects are computed using option pricing models, using the following weighted-average assumptions for options granted during 2009 as of grant date: 1) a risk-free interest rate of 2.26 percent, 2) a dividend yield of 2.51 percent, 3) volatility of 26.71 percent and 4) an expected option life of 9.72 years. No options were granted during 2010 or 2008. As of December 31, 2010, there was $68,000 in unrecognized compensation cost related to unvested stock-based option awards granted.
The following table summarizes options outstanding under the 2006 Equity Compensation Plan and remaining outstanding unexercised options under the 1997 Stock Incentive Plan at the end of the reportable periods. The weighted-average remaining contractual term for options outstanding and exercisable at December 31, 2010, 2009, and 2008, was 2.8 years, 2.6 years and 2.9 years, respectively.
Options outstanding at December 31 are summarized as follows:
| 2010 | 2009 | 2008 | ||||||||||||||||||||||
| Weighted- | Weighted- | Weighted- | ||||||||||||||||||||||
| Average | Average | Average | ||||||||||||||||||||||
| Exercise | Exercise | Exercise | ||||||||||||||||||||||
| Shares | Price | Shares | Price | Shares | Price | |||||||||||||||||||
| Outstanding at | ||||||||||||||||||||||||
| beginning of year | 184,208 | $ | 19.34 | 158,380 | $ | 19.80 | 166,380 | $ | 19.41 | |||||||||||||||
| Granted | - | - | 77,263 | 14.00 | - | - | ||||||||||||||||||
| Exercised | (12,500 | ) | 10.63 | (8,100 | ) | 12.06 | (8,000 | ) | 11.75 | |||||||||||||||
| Forfeited | (5,793 | ) | 14.00 | (43,335 | ) | 12.87 | - | - | ||||||||||||||||
| Outstanding at end | ||||||||||||||||||||||||
| of year | 165,915 | $ | 20.18 | 184,208 | $ | 19.34 | 158,380 | $ | 19.80 | |||||||||||||||
| Options exercisable | ||||||||||||||||||||||||
| at year end | 117,729 | $ | 22.71 | 112,500 | $ | 22.74 | 158,380 | $ | 19.80 | |||||||||||||||
| Weighted average | ||||||||||||||||||||||||
| fair value of | ||||||||||||||||||||||||
| options granted | $ | - | $ | 1.84 | $ | - | ||||||||||||||||||
33
The total intrinsic value of options exercised during the years ended December 31, 2010, 2009, and 2008 was $43,000, $6,000, and $34,000, respectively. There was no aggregate intrinsic value of options outstanding at December 31, 2010.
As of December 31, 2010, options outstanding and exercisable are summarized as follows:
| Range of | Remaining | |||||||||||||
| Exercise | Options | Contractual | Options | |||||||||||
| Prices | Outstanding | Life | Exercisable | |||||||||||
| (years) | ||||||||||||||
| $ | 22.75 | 55,000 | 1.3 | 55,000 | ||||||||||
| 22.00 | 34,000 | 2.3 | 34,000 | |||||||||||
| 37.00 | 3,000 | 2.8 | 3,000 | |||||||||||
| 39.40 | 8,000 | 3.0 | 8,000 | |||||||||||
| 14.00 | 60,915 | 8.2 | 15,229 | |||||||||||
| 14.00 | 5,000 | 8.8 | 2,500 | |||||||||||
| $ | 14.00-$39.40 | 165,915 | 2.8 | 117,729 | ||||||||||
| Note 9. | Employee Benefit Plans |
| The Company has a noncontributory, defined benefit pension plan covering substantially all full-time employees of Middleburg Bank, Middleburg Trust Company, and Middleburg Investment Advisors. The Company funds pension costs in accordance with the funding provisions of the Employee Retirement Income Security Act. Benefit accruals and eligibility were frozen as of December 31, 2009. This had the effect of reducing the Projected Benefit Obligation by an estimated $1,577,000, which was recorded as a curtailment gain in 2009. |
| The defined benefit pension plan has been amended to be terminated and an application has been submitted to the Internal Revenue Service for approval of the termination amendment. Although an application for termination approval is in process, the date of possible Internal Revenue Service approval is unknown and there can be no assurance that the plan will be terminated during 2011. |
Information about the plan follows:
| 2010 | 2009 | 2008 | ||||||||||
| (In Thousands) | ||||||||||||
| Change in Benefit Obligation | ||||||||||||
| Benefit obligation, beginning of year | $ | 5,407 | $ | 7,139 | $ | 5,965 | ||||||
| Service cost | - | 872 | 1,013 | |||||||||
| Interest cost | 320 | 423 | 463 | |||||||||
| Actuarial loss (gain) | 299 | (865 | ) | (31 | ) | |||||||
| Benefits paid | (32 | ) | (585 | ) | (271 | ) | ||||||
| Curtailment gain | - | (1,577 | ) | - | ||||||||
| Benefit obligation, end of year | 5,994 | 5,407 | 7,139 | |||||||||
| Change in Plan Assets | ||||||||||||
| Fair value of plan assets, beginning of year | 4,897 | 3,481 | 4,961 | |||||||||
| Actual return on plan assets | 451 | 1,217 | (1,540 | ) | ||||||||
| Employer contributions | 27 | 784 | 331 | |||||||||
| Benefits paid | (32 | ) | (585 | ) | (271 | ) | ||||||
| Fair value of plan assets, ending | 5,343 | 4,897 | 3,481 | |||||||||
| Funded Status, recognized as accrued benefit | ||||||||||||
| cost included in other liabilities | $ | (651 | ) | $ | (510 | ) | $ | (3,658 | ) | |||
| Amounts Recognized in Accumulated | ||||||||||||
| Other Comprehensive Loss | ||||||||||||
| Net (Gain) / Loss | $ | 234 | $ | - | $ | 3,034 | ||||||
| Prior service costs | - | - | (193 | ) | ||||||||
| Deferred income tax benefit | (80 | ) | - | (966 | ) | |||||||
| Total amount recognized in accumulated | ||||||||||||
| other comprehensive loss | $ | 154 | $ | - | $ | 1,875 | ||||||
34
Note 9. Employee Benefit Plans (Continued)
The accumulated benefit obligation for the defined benefit pension plan was $5,994,000, $5,407,000, and $5,127,000 at December 31, 2010, 2009, and 2008 respectively.
| 2010 | 2009 | 2008 | ||||||||||
| (In Thousands) | ||||||||||||
| Components of Net Periodic Benefit Cost | ||||||||||||
| Service cost | $ | - | $ | 872 | $ | 810 | ||||||
| Interest cost | 320 | 423 | 371 | |||||||||
| Expected return on plan assets | (386 | ) | (329 | ) | (438 | ) | ||||||
| Amortization of prior service cost | - | (193 | ) | (1 | ) | |||||||
| Amortization of net obligation | ||||||||||||
| at transition | - | - | (4 | ) | ||||||||
| Recognized net gain due to curtailment | - | (424 | ) | - | ||||||||
| Recognized net actuarial loss | - | 128 | 23 | |||||||||
| Net periodic benefit cost | $ | (66 | ) | $ | 477 | $ | 761 | |||||
| Other Change in Plan Assets and Benefit | ||||||||||||
| Obligations Recognized in Accumulated Other | ||||||||||||
| Comprehensive (Income) Loss | ||||||||||||
| Net (gain) loss | $ | 234 | $ | (3,034 | ) | $ | 2,027 | |||||
| Amortization of prior service cost | - | 193 | 1 | |||||||||
| Amortization of net obligation at transition | - | - | 4 | |||||||||
| Deferred income tax expense (benefit) | (80 | ) | 966 | (691 | ) | |||||||
| Total recognized in other comprehensive (income) loss | $ | 154 | $ | (1,875 | ) | $ | 1,341 | |||||
| Total recognized in net periodic benefit costs | ||||||||||||
| and other comprehensive (income) loss | $ | 88 | $ | (1,398 | ) | $ | 2,102 | |||||
| Adjustment to Retained Earnings Due to | ||||||||||||
| Change in Measurement Date | ||||||||||||
| Service cost | $ | 202 | ||||||||||
| Interest cost | 93 | |||||||||||
| Expected return on plan assets | (109 | ) | ||||||||||
| Recognized net actuarial loss | 6 | |||||||||||
| Net periodic benefit cost | N/A | N/A | $ | 192 | ||||||||
| Weighted-Average Assumptions for Benefit | 2010 | 2009 | 2008 | |||||||||
| Obligations | ||||||||||||
| Discount rate | 5.50 | % | 6.00 | % | 6.25 | % | ||||||
| Expected return on plan assets | 8.00 | % | 8.00 | % | 8.50 | % | ||||||
| Rate of compensation increase | 4.00 | % | 4.00 | % | 4.00 | % | ||||||
| Weighted-Average Assumptions for Net Periodic | 2010 | 2009 | 2008 | |||||||||
| Benefit Costs | ||||||||||||
| Discount rate | 6.00 | % | 6.00 | % | 6.00 | % | ||||||
| Expected return on plan assets | 8.00 | % | 8.00 | % | 8.50 | % | ||||||
| Rate of compensation increase | 4.00 | % | 4.00 | % | 4.00 | % | ||||||
35
| Note 9. | Employee Benefit Plans (Continued) |
Long-Term Rate of Return
The plan sponsor selects the expected long-term rate of return on assets assumption in consultation with their investment advisors and actuary. This rate is intended to reflect the average rate of earnings expected to be earned on the funds invested to provide plan benefits. Historical performance is reviewed with respect to real rates of return (net of inflation) for the major asset classes held or anticipated to be held by the trust, and for the trust itself. Undue weight is not given to recent experience that may not continue over the measurement period, with higher significance placed on current forecasts of future long-term economic conditions.
Because assets are held in a qualified trust, anticipated returns are not reduced for taxes. Further, solely for this purpose, the plan is assumed to continue in force and not terminate during the period in which assets are invested. (See information regarding plan termination amendment below under the heading “Discount Rate”.) However, consideration is given to the potential impact of current and future investment policy, cash flow into and out of the trust, and expenses (both investment and non-investment) typically paid from plan assets to the extent such expenses are not explicitly estimated within periodic cost.
Discount Rate
Although the plan has been amended to be terminated, the amendment must be approved by the Internal Revenue Service before the plan can actually be terminated. The exact date of possible Internal Revenue Service approval is not known. Accordingly, the discount rate for the weighted average benefit obligation assumptions has been set in a manor consistent with prior years assuming the plan will continue in force throughout 2011.
Asset Allocation
The pension plan’s weighted-average asset allocations at December 31, 2010, and 2009, by asset category are as follows:
| December 31, | ||||||||
| 2010 | 2009 | |||||||
| Mutual funds - fixed income | - | % | 38 | % | ||||
| Mutual funds - equity | - | % | 61 | % | ||||
| Cash and equivalents | 100 | % | 1 | % | ||||
| Total | 100 | % | 100 | % | ||||
The investment manager selects investment fund managers with demonstrated experience and expertise and funds with demonstrated historical performance for the implementation of the plan’s investment strategy. The investment manager will consider both actively and passively managed investment strategies and will allocate funds across the classes to develop an efficient investment structure. Due to the possibility of plan termination during 2011, all assets of the plan have been invested in cash and equivalents.
It is the responsibility of the trustee to administer the investments of the trust within reasonable costs, being careful to avoid sacrificing quality. These costs include, but are not limited to, management and custodial fees, consulting fees, transaction costs, and other administrative costs chargeable to the trust.
36
| Note 9. | Employee Benefit Plans (Continued) |
The following table sets forth by level, within the fair value hierarchy, the plan’s assets at fair value as of December 31, 2010:
| December 31, 2010 | ||||||||||||||||
| (In Thousands) | Level I | Level II | Level III | Total | ||||||||||||
| Assets: | ||||||||||||||||
| Cash and cash equivalents | $ | 5,343 | $ | - | $ | - | $ | 5,343 | ||||||||
| Total assets at fair value | $ | 5,343 | $ | - | $ | - | $ | 5,343 | ||||||||
Cash and cash equivalents
The fair value approximates the carrying value.
Projected benefit payments
The defined benefit pension plan has been amended to be terminated upon approval from the Internal Revenue Service and the Company will make distributions to plan participants after the date of approval. Although the exact date of plan termination is not known, the Company expects to make a contribution to the plan during fiscal year 2011 in an amount sufficient bring the fair value of plan assets to the accumulated benefit obligation amount as of the distribution date. Estimated future benefit payments are $5,994,000.
401(k) Plan
The Company has a 401(k) plan whereby a majority of employees participate in the plan. Employees may contribute up to 100 percent of their compensation subject to certain limits based on federal tax laws. The Company makes matching contributions equal to 50 percent of the first 6 percent of an employee’s compensation contributed to the plan. Matching contributions vest to the employee equally over a five-year period. For the years ended December 31, 2010, 2009, and 2008, expense attributable to the plan amounted to $258,000, $219,000 and $233,000, respectively.
Deferred Compensation Plans
Several deferred compensation plans were adopted; including a defined benefit SERP and an elective deferral plan for the Chairman, and a defined contribution SERP for certain Executive Officers. The two plans for the Chairman made installment payouts in 2010 and 2009. The defined contribution SERP on the Executive Officers includes a vesting schedule, and is currently credited at a rate of the 10-year treasury plus 1.5%. The deferred compensation expense for 2010, 2009, and 2008, was $150,000, ($144,000), and $382,000, respectively. The negative expense in 2009 was due to a change to plan assumptions, which resulted in a benefit of $198,000 being recognized. The plans are unfunded; however, life insurance has been acquired on the life of the employees in amounts sufficient to help meet the costs of the obligations.
37
| Note 10. | Income Taxes |
The Company files income tax returns in the U.S. federal jurisdiction and the state of Virginia and various other states. With few exceptions, the Company is no longer subject to U.S. federal or state income tax examinations by tax authorities for years prior to 2007.
The Company believes it is more likely than not that the benefit of deferred tax assets will be realized. Consequently, no valuation allowance for deferred tax assets is deemed necessary at December 31, 2010 and 2009, in view of certain tax strategies, coupled with the anticipated future taxable income as evidenced by the Company’s earnings potential.
Net deferred tax assets consist of the following components as of December 31, 2010 and 2009:
| 2010 | 2009 | ||||||||||
| (In Thousands) | |||||||||||
| Deferred tax assets: | |||||||||||
| Allowance for loan losses | $ | 4,684 | $ | 2,865 | |||||||
| Deferred compensation | 502 | 470 | |||||||||
| Investment in affiliate | 905 | 950 | |||||||||
| Accrued pension costs | 227 | 173 | |||||||||
| Minimum pension adjustment | 80 | - | |||||||||
| Securities available for sale | 548 | 1,275 | |||||||||
| Other-than-temporary impairment | 1,316 | 941 | |||||||||
| Other real estate owned | 714 | 554 | |||||||||
| Other | 1,480 | 589 | |||||||||
| . | 10,456 | 7,817 | |||||||||
| Deferred tax liabilities: | |||||||||||
| Deferred loan costs, net | $ | 365 | $ | 248 | |||||||
| Interest rate swap | 106 | - | |||||||||
| Property and equipment | 352 | 356 | |||||||||
| Total gross deferred tax liabilities | 823 | 604 | |||||||||
| Net deferred tax assets | $ | 9,633 | $ | 7,213 | |||||||
The provision for income taxes charged to operations for the years ended December 31, 2010, 2009, and 2008, consists of the following:
| 2010 | 2009 | 2008 | ||||||||||
| (In Thousands) | ||||||||||||
| Current tax expense | $ | 611 | $ | 772 | $ | 2,043 | ||||||
| Deferred tax benefit | (3,173 | ) | (708 | ) | (1,599 | ) | ||||||
| Total income tax expense (benefit) | $ | (2,562 | ) | $ | 64 | $ | 444 | |||||
The income tax provision differs from the amount of income tax determined by applying the U.S. federal income tax rate to pretax income for the years ended December 31, 2010, 2009, and 2008, due to the following:
| 2010 | 2009 | 2008 | ||||||||||
| (In Thousands) | ||||||||||||
| Computed "expected" tax expense (benefit) | $ | (1,785 | ) | $ | 1,219 | $ | 1,021 | |||||
| Increase (decrease) in income taxes | ||||||||||||
| resulting from: | ||||||||||||
| Tax-exempt interest income | (1,026 | ) | (1,086 | ) | (663 | ) | ||||||
| Other, net | 249 | (69 | ) | 86 | ||||||||
| $ | (2,562 | ) | $ | 64 | $ | 444 | ||||||
38
| Note 11. | Related Party Transactions |
The Company’s subsidiary bank has had, and may be expected to have in the future, banking transactions in the ordinary course of business with directors, principal officers, their immediate families and affiliated companies in which they are principal stockholders (commonly referred to as related parties). Any loans made to related parties of the Company or related parties of any of its affiliates or subsidiaries were made on substantially the same terms, including interest rates and collateral, as those prevailing at the time of origination for comparable loans with persons not related to the lender; and did not involve more than the normal risk of collectability or present other unfavorable features.
These persons and firms were indebted to the subsidiary bank for loans as follows:
| 2010 | 2009 | |||||||
| (In Thousands) | ||||||||
| Balance, January 1 | $ | 5,760 | $ | 5,441 | ||||
| Principal additions | 10,926 | 1,989 | ||||||
| Principal payments | (4,039 | ) | (1,670 | ) | ||||
| Balance, December 31 | $ | 12,647 | $ | 5,760 | ||||
Additionally, unused commitments to extend credit to these persons and firms amounted to
$3.4 million at December 31, 2010 and $1.9 million at December 31, 2009.
These same persons and firms had accounts with the subsidiary bank for deposits totaling $1.5 million and $9.9 million at December 31, 2010 and 2009, respectively.
| Note 12. | Contingent Liabilities and Commitments |
In the normal course of business, there are outstanding various commitments and contingent liabilities, which are not reflected in the accompanying consolidated financial statements. The Company does not anticipate any material loss as a result of these transactions.
See Note 15 with respect to financial instruments with off-balance-sheet risk.
The Company must maintain a reserve against its deposits in accordance with Regulation D of the Federal Reserve Act. For the final weekly reporting period in the years ended December 31, 2010 and 2009, the aggregate amount of daily average required reserves was approximately $4,735,000 and $6,560,000, respectively.
| Note 13. | Earnings (Loss) Per Share |
The following shows the weighted-average number of shares used in computing earnings (loss) per share and the effect on weighted-average number of shares of diluted potential common stock. Potential dilutive common stock had no effect on income available to common stockholders.
| 2010 | 2009 | 2008 | ||||||||||||||||||||||
| Per | Per | Per | ||||||||||||||||||||||
| Share | Share | Share | ||||||||||||||||||||||
| Shares | Amount | Shares | Amount | Shares | Amount | |||||||||||||||||||
| Earnings (loss) per share, basic | 6,933,144 | $ | (0.39 | ) | 5,629,426 | $ | 0.37 | 4,528,073 | $ | 0.57 | ||||||||||||||
| Effect of dilutive securities: | ||||||||||||||||||||||||
| Stock options | - | 967 | 26,362 | |||||||||||||||||||||
| Earnings (loss) per share, diluted | 6,933,144 | $ | (0.39 | ) | 5,630,393 | $ | 0.37 | 4,554,435 | $ | 0.56 | ||||||||||||||
39
In 2010, 2009, and 2008, options to purchase 100,000, 225,578, and 100,500 common shares, respectively, ranging in price from $10.63 to $39.40 were not included in the calculation of earnings per share because they would have been antidilutive. In 2010, 104,101 warrants to purchase common shares with an exercise price of $15.85 and 16,878 shares of restricted stock ranging in price from $14.59 to $26.30 were not included in the calculation of earnings per share because to do so would have been anti-dilutive.
| Note 14. | Retained Earnings |
Transfers of funds from the banking subsidiary to the Parent Company in the form of loans, advances, and cash dividends are restricted by federal and state regulatory authorities. Federal regulations limit the payment of dividends to the sum of a bank’s current net income and retained net income of the two prior years. During the years ended December 31, 2010 and 2009, the Company required and received approval from federal and state regulatory authorities to transfer amounts in excess of dividend restrictions.
| Note 15. | Financial Instruments With Off-Balance-Sheet Risk and Credit Risk |
The Company is a party to financial instruments with off-balance-sheet risk in the normal course of business to meet the financing needs of its customers and to reduce its own exposure to fluctuations in interest rates. These financial instruments include commitments to extend credit, standby letters of credit, and interest rate swaps. Those instruments involve, to varying degrees, elements of credit and interest rate risk in excess of the amount recognized in the balance sheet. The contract or notional amounts of those instruments reflect the extent of involvement the Company has in particular classes of financial instruments. See Note 24 for more information regarding the Company’s use of interest rate swaps.
The Company's exposure to credit loss in the event of nonperformance by the other party to the financial instrument for commitments to extend credit and standby letters of credit is represented by the contractual amount of those instruments. The Company uses the same credit policies in making commitments and conditional obligations as it does for on-balance-sheet instruments.
A summary of the contract amount of the Company's exposure to off-balance-sheet risk as of December 31, 2010 and 2009, is as follows:
| 2010 | 2009 | |||||||
| (In Thousands) | ||||||||
| Financial instruments whose contract | ||||||||
| amounts represent credit risk: | ||||||||
| Commitments to extend credit | $ | 83,299 | $ | 84,628 | ||||
| Standby letters of credit | 2,378 | 1,974 | ||||||
Commitments to extend credit are agreements to lend to a customer as long as there is no violation of any condition established in the contract. Commitments generally have fixed expiration dates or other termination clauses and may require payment of a fee. Since many of the commitments are expected to expire without being drawn upon, the total commitment amounts do not necessarily represent future cash requirements. The Company evaluates each customer's creditworthiness on a case-by-case basis. The amount of collateral obtained, if deemed necessary by the Company upon extension of credit, is based on management's credit evaluation of the counterparty. Collateral held varies but may include accounts receivable, inventory, property and equipment, and income-producing commercial properties.
Unfunded commitments under lines of credit are commitments for possible future extensions of credit to existing customers. Those lines of credit may not be drawn upon to the total extent to which the Company is committed.
Standby letters of credit are conditional commitments issued by the Company to guarantee the
40
performance of a customer to a third party. Those guarantees are primarily issued to support public and private borrowing arrangements, including commercial paper, bond financing, and similar transactions. The credit risk involved in issuing letters of credit is essentially the same as that involved in extending loan facilities to customers. The Company holds certificates of deposit, deposit accounts, and real estate as collateral supporting those commitments for which collateral is deemed necessary.
The Company has approximately $13,913,000 in deposits in financial institutions in excess of amounts insured by the Federal Deposit Insurance Corporation (FDIC) at December 31, 2010.
| Note 16. | Fair Value Measurements |
The Company adopted ASC 820, Fair Value Measurements, on January 1, 2008, to record fair value adjustments to certain assets and liabilities and to determine fair value disclosures. ASC 820 clarifies that fair value of certain assets and liabilities is an exit price, representing the amount that would be received to sell an asset or paid to transfer a liability in an orderly transaction between market participants.
ASC 820 specifies a hierarchy of valuation techniques based on whether the inputs to those valuation techniques are observable or unobservable. Observable inputs reflect market data obtained from independent sources, while unobservable inputs reflect the Company’s market assumptions. The three levels of the fair value hierarchy under ASC 820 based on these two types of inputs are as follows:
| Level I: | Quoted prices are available in active markets for identical assets or liabilities as of the reported date. |
| Level II: | Pricing inputs are other than the quoted prices in active markets, which are either directly or indirectly observable as of the reported date. The nature of these assets and liabilities includes items for which quoted prices are available but traded less frequently and items that are fair-valued using other financial instruments, the parameters of which can be directly observed. |
| Level III: | Assets and liabilities that have little to no pricing observability as of the reported date. These items do not have two-way markets and are measured using management’s best estimate of fair value, where the inputs into the determination of fair value require significant management judgment or estimation. |
The following describes the valuation techniques used by the Company to measure certain financial assets and liabilities recorded at fair value on a recurring basis in the consolidated financial statements:
Securities Available for Sale
Securities available for sale are recorded at fair value on a recurring basis. Fair value measurement is based upon quoted market prices, when available (Level I). If quoted market prices are not available, fair values are measured utilizing independent valuation techniques of identical or similar securities for which significant assumptions are derived primarily from or corroborated by observable market data. Third party vendors compile prices from various sources and may determine the fair value of identical or similar securities by using pricing models that consider observable market data (Level II).
Derivatives
Derivatives are recorded at fair value on a recurring basis. Third party vendors compile prices from various sources and may determine the fair value of identical or similar instruments by using pricing models that consider observable market data (Level II).
41
The following tables present the balances of financial assets and liabilities measured at fair value on a recurring basis as of December 31, 2010 and December 31, 2009.
| December 31, 2010 (In Thousands) | ||||||||||||||||
| Total | Level I | Level II | Level III | |||||||||||||
| Assets: | ||||||||||||||||
| U.S. government agency | ||||||||||||||||
| securities | $ | 4,649 | $ | - | $ | 4,649 | $ | - | ||||||||
| Obligations of states and | ||||||||||||||||
| political subdivision | 59,140 | - | 59,140 | - | ||||||||||||
| Mortgage-backed securities: | ||||||||||||||||
| Agency | 152,304 | - | 152,304 | - | ||||||||||||
| Non-agency | 26,081 | - | 26,081 | - | ||||||||||||
| Corporate preferred stock | 13 | - | 13 | - | ||||||||||||
| Corporate bonds | 9,532 | - | 9,532 | - | ||||||||||||
| Trust preferred securities | 323 | - | 323 | - | ||||||||||||
| Derivative financial instruments | 312 | - | 312 | - | ||||||||||||
| December 31, 2009 (In Thousands) | ||||||||||||||||
| Description | Total | Level I | Level II | Level III | ||||||||||||
| Assets: | ||||||||||||||||
| U.S. Treasury securities | $ | 3,087 | $ | - | $ | 3,087 | $ | - | ||||||||
| Obligations of states and | ||||||||||||||||
| political subdivision | 69,044 | - | 65,937 | 3,107 | ||||||||||||
| Mortgage-backed securities: | ||||||||||||||||
| Agency | 90,240 | - | 90,231 | 9 | ||||||||||||
| Non-agency | 9,939 | - | 9,939 | - | ||||||||||||
| Corporate preferred stock | 34 | - | 34 | - | ||||||||||||
| Corporate bonds | 104 | - | 104 | - | ||||||||||||
| Trust preferred securities | 251 | - | 251 | - | ||||||||||||
The table below presents a reconciliation and statements of operations classification of gains and losses for all assets measured at fair value on a recurring basis using significant unobservable inputs (Level III) for the years ended December 31, 2010 and 2009:
| Available for Sale Securities | ||||
| (In Thousands) | ||||
| Balance December 31, 2008 | $ | 8,030 | ||
| Total realized and unrealized gains (losses): | ||||
| Included in earnings | (1,072 | ) | ||
| Included in other comprehensive income | 299 | |||
| Purchases, sales, issuances and settlements, net | 14,457 | |||
| Transfers in and (out) of Level III | (18,598 | ) | ||
| Balance December 31, 2009 | $ | 3,116 | ||
| Total realized and unrealized gains (losses): | ||||
| Included in earnings | - | |||
| Included in other comprehensive income | - | |||
| Purchases, sales, issuances and settlements, net | (2,136 | ) | ||
| Transfers in and (out) of Level III | (980 | ) | ||
| Balance December 31, 2010 | $ | - | ||
During 2010, a municipal security which had previously been categorized as a Level III asset was re-categorized as a Level II asset because the value for this security is determined by reference to quoted prices for similar assets which are readily available although such assets may be traded infrequently. Additionally, a large portion of this security was called during 2010. Accordingly, the “Purchases, sales, issuances and settlements, net” amount reflected in the above table includes $2,127,000 related to the partial call of this security and the “Transfers in and (out) of Level III” amount reflects the reclassification of the remaining $980,000 as a Level II valuation.
There were no changes in unrealized gains and losses recorded in earnings for the year ended December 31, 2010 or 2009, for Level III assets that were still held at December 31, 2010 and 2009.
Certain financial assets and certain financial liabilities are measured at fair value on a nonrecurring basis; that is, the instruments are not measured at fair value on a recurring basis but are subject to fair value adjustments in certain circumstances. Adjustments to the fair value of these assets usually result from the application of lower-of-cost-or-market accounting or impairment of individual assets.
42
The following describes the valuation techniques used by the Company to measure certain financial assets recorded at fair value on a nonrecurring basis in the consolidated financial statements:
Loans Held for Sale
Loans held for sale are carried at the lower of cost or market value. These loans currently consist of one-to-four-family residential loans originated for sale in the secondary market. Fair value is based on the price secondary markets are currently offering for similar loans using observable market data which is not materially different than cost due to the short duration between origination and sale (Level II). As such, the Company records any fair value adjustments on a nonrecurring basis. No nonrecurring fair value adjustments were recorded on loans held for sale during the years ended December 31, 2010 and 2009. Gains and losses on the sale of loans are recorded within income from mortgage banking on the consolidated statements of income.
Impaired Loans
Loans are designated as impaired when, in the judgment of management based on current information and events, it is probable that all amounts due according to the contractual terms of the loan agreement will not be collected. The measurement of loss associated with impaired loans can be based on either the observable market price of the loan or the fair value of the collateral. Fair value is measured based on the value of the collateral securing the loans. Collateral may be in the form of real estate or business assets including equipment, inventory, and accounts receivable. The vast majority of the collateral is real estate. The value of real estate collateral is determined utilizing an income or market valuation approach based on an appraisal conducted by an independent, licensed appraiser outside of the Company using observable market data (Level II). However, if the collateral is a house or building in the process of construction or if an appraisal of the real estate property is over two years old, then the fair value is considered Level III. As of December 31, 2010, five loans with a net balance of $739,000 were categorized as Level III valuations due to being in construction status. The value of business equipment is based upon an outside appraisal if deemed significant, or the net book value on the applicable business’ financial statements if not considered significant using observable market data. Likewise, values for inventory and accounts receivables collateral are based on financial statement balances or aging reports (Level III). Impaired loans allocated to the Allowance for Loan Losses are measured at fair value on a nonrecurring basis. Any fair value adjustments are recorded in the period incurred as provision for loan losses on the consolidated statements of income.
When collateral-dependent loans are performing in accordance with the original terms of their contract, the Company continues to use the appraisal that was done at origination as the basis for the collateral value. When collateral-dependent loans are considered non-performing, they are assessed to determine the next appropriate course of action: either foreclosure or modification with forbearance agreement. The loans would then be re-appraised prior to foreclosure or before a forbearance agreement is executed. Thereafter, collateral for loans under a forbearance agreement may be re-appraised as the circumstances warrant. This process does not vary by loan type.
The Company’s procedure to monitor the value of collateral for collateral dependent impaired loans between the receipt of an original appraisal and an updated appraisal is to review tax assessment records when they change annually. At the time of any change in tax assessment, an appropriate adjustment is made to the appraised value. Information considered in a determination not to order an updated appraisal includes the availability and reliability of tax assessment records and significant changes in capitalization rates for income properties since the original appraisal. Other facts and circumstances on a case by case basis may be considered relative to a decision not to order an updated appraisal. If, in the judgment of management, a reliable collateral value estimate can not be obtained by an alternative method, an updated appraisal would be obtained.
Circumstances that may warrant a re-appraisal for non-performing loans might include foreclosure proceedings or a material adverse change in the borrower’s condition or that of the collateral underlying the loan. Examples include bankruptcy filing by the debtor or guarantors,
43
loss of a major tenant in an income property, or a significant increase in capitalization rates for income properties. In some cases, management may decide that an updated appraisal for a non-performing loan is not necessary. In such cases, an estimate of the fair value of the collateral for the loans would be made by management by reference to current tax assessment records, the latest appraised value, and knowledge of collateral value fluctuations in a loan’s market area. If, in the judgment of management, a reliable collateral value estimate can not be obtained by an alternative method, an updated appraisal would be obtained.
For the purpose of the evaluation of the adequacy of our allowance for loan losses, new appraisals are discounted 10% for selling costs when determining the amount of the specific reserve. Thereafter, for collateral dependent impaired loans, we consider each loan on a case-by-case basis to determine whether or not the recorded values are appropriate given current market conditions. When warranted, new appraisals are obtained. If an appraisal is less than 12 months old, the only adjustment made to appraised values is the 10% discount for selling costs. If an appraisal is older than 12 months, management will use judgment based on knowledge of current market values and specific facts surrounding any particular property to determine if an additional valuation adjustment may be necessary.
For real estate-secured loans, if the Company doesn’t have an adequate appraisal a new one is ordered to determine fair value. An appraisal that would be considered adequate for real estate-secured loans is less than 12 months or one that is more than 12 months old but alternative methods with which to monitor the collateral value exist, such as reference to frequently updated tax assessments. Appraisals that would be considered inadequate for real estate-secured loans include appraisals older than 12 months and with a property located in a jurisdiction that does not reassess property values on a regular basis, or with a property to which substantial changes have been made since the last assessment. If the loan is secured by assets other than real estate and an appraisal is neither available nor feasible, the loan is treated as unsecured.
It is the Company’s policy to account for partially charged-off loans consistently both before and after updated appraisals are obtained. Partially charged-off loans are placed in non-accrual status and remain in that status until the borrower has made a minimum of six consecutive monthly payments on a timely basis and there is evidence that the borrower has the ability to repay the balance of the loan plus accrued interest in full. Partially charged-off loans are not returned to accrual status when updated appraisals are obtained.
Impaired loans allocated to the Allowance for Loan Losses are measured at fair value on a nonrecurring basis. Any fair value adjustments are recorded in the period incurred as provision for loan losses on the consolidated statements of operations.
| December 31, 2010 (In Thousands) | ||||||||||||||||
| Total | Level I | Level II | Level III | |||||||||||||
| Assets: | ||||||||||||||||
| Impaired loans | $ | 13,267 | $ | - | $ | 11,521 | $ | 1,746 | ||||||||
| Mortgages held for sale | 59,361 | - | 59,361 | - | ||||||||||||
| December 31, 2009 (In Thousands) | ||||||||||||||||
| Description | Total | Level I | Level II | Level III | ||||||||||||
| Assets: | ||||||||||||||||
| Impaired loans | $ | 10,551 | $ | - | $ | 10,551 | $ | - | ||||||||
| Mortgages held for sale | 45,010 | - | 45,010 | - | ||||||||||||
Other Real Estate Owned
The value of other real estate owned (“OREO”) is determined utilizing an income or market valuation approach based on an appraisal conducted by an independent, licensed appraiser
44
independent of the Company using observable market data (Level II). For other real estate owned properties, the Company’s policy is to obtain “as-is” appraisals on an annual basis as opposed to “as-completed” appraisals. This approach provides current values without regard to completion of any construction or renovation that may be in process on OREO properties. Accordingly, the Company considers the valuations to be Level II valuations even though some properties may be in process of renovation or construction. As of December 31, 2010, the Company had 2 OREO properties considered to be in construction with a carrying value of approximately $1.9 million.
For the purpose OREO valuations, appraisals are discounted 10% for selling and holding costs and it is the policy of the Company to obtain annual appraisals for properties held in OREO.
Any fair value adjustments are recorded in the period incurred as loss on other real estate owned on the consolidated statements of operations.
The following table summarizes the Company’s non-financial assets that were measured at fair value on a nonrecurring basis during the period.
| December 31, 2010 (In Thousands) | ||||||||||||||||
| Total | Level I | Level II | Level III | |||||||||||||
| Assets: | ||||||||||||||||
| Other real estate owned | $ | 8,394 | $ | - | $ | 8,394 | $ | - | ||||||||
| December 31, 2009 (In Thousands) | ||||||||||||||||
| Description | Total | Level I | Level II | Level III | ||||||||||||
| Assets: | ||||||||||||||||
| Other real estate owned | $ | 6,511 | $ | - | $ | 6,511 | $ | - | ||||||||
The fair value of a financial instrument is the current amount that would be exchanged between willing parties, other than in a forced liquidation. Fair value is best determined based upon quoted market prices. However, in many instances, there are no quoted market prices for the Company’s various financial instruments. In cases where quoted market prices are not available, fair values are based on estimates using present value or other valuation techniques. Those techniques are significantly affected by the assumptions used, including the discount rate and estimates of future cash flows. Accordingly, the fair value estimates may not be realized in an immediate settlement of the instrument. U.S. generally accepted accounting principles excludes certain financial instruments and all non-financial instruments from its disclosure requirements. Accordingly, the aggregate fair value amounts presented may not necessarily represent the underlying fair value of the Company.
The following methods and assumptions were used to estimate the fair value of each class of financial instruments for which it is practicable to estimate that value:
Cash and Cash Equivalents
For those cash equivalents, the carrying amount is a reasonable estimate of fair value.
Loans, Net and Loans Held for Sale
For variable-rate loans that reprice frequently and with no significant change in credit risk, fair values are based on carrying values. The fair value is estimated by discounting future cash flows using current market inputs at which loans with similar terms and qualities would be made to borrowers of similar credit quality. Where quoted market prices were available, primarily for certain residential mortgage loans, such market rates were utilized as estimates for fair value.
Accrued Interest Receivable and Payable
The carrying amounts of accrued interest approximate fair values.
45
Deposits
The fair value of demand deposits, savings accounts, and certain money market deposits is the amount payable on demand at the reporting date. For all other deposits, the fair value is determined using the discounted cash flow method. The discount rate was equal to the rate currently offered on similar products.
Securities Sold Under Agreements to Repurchase and Short-Term Debt
The carrying amounts approximate fair values.
Long-Term and Subordinated Debt
For variable rate long-term debt, fair values are based on carrying values. For fixed rate debt, fair values are estimated based on observable market prices and discounted cash flow analysis using interest rates for borrowings of similar remaining maturities and characteristics. The fair values of the Company's Subordinated Debentures are estimated using discounted cash flow analyses based on the Company's current incremental borrowing rates for similar types of borrowing arrangements.
Off-Balance-Sheet Financial Instruments
The fair value of commitments to extend credit is estimated using the fees currently charged to enter into similar agreements, taking into account the remaining terms of the agreements and the present creditworthiness of the counterparties. For fixed-rate loan commitments, fair value also considers the difference between current levels of interest rates and the committed rates. The fair value of standby letters of credit is based on fees currently charged for similar agreements or on the estimated cost to terminate them or otherwise settle the obligations with the counterparties at the reporting date. At December 31, 2009 and 2008, the fair values of loan commitments and standby letters of credit were deemed immaterial; therefore, they have not been included in the table below.
46
| Note 16. | Fair Value Measurements (Continued) |
The estimated fair values, and related carrying amounts, of the Company's financial instruments are as follows:
| 2010 | 2009 | |||||||||||||||
| Carrying | Fair | Carrying | Fair | |||||||||||||
| Amount | Value | Amount | Value | |||||||||||||
| (In Thousands) | ||||||||||||||||
| Financial assets: | ||||||||||||||||
| Cash and cash equivalents | $ | 64,724 | $ | 64,724 | $ | 43,210 | $ | 43,210 | ||||||||
| Securities | 252,042 | 252,042 | 172,699 | 172,699 | ||||||||||||
| Loans | 703,706 | 723,629 | 680,104 | 693,464 | ||||||||||||
| Accrued interest receivable | 3,655 | 3,655 | 3,842 | 3,842 | ||||||||||||
| Interest rate swap | 312 | 312 | - | - | ||||||||||||
| Financial liabilities: | ||||||||||||||||
| Deposits | $ | 890,306 | $ | 869,606 | $ | 805,648 | $ | 812,080 | ||||||||
| Securities sold under agreements | ||||||||||||||||
| to repurchase | 25,562 | 25,562 | 17,199 | 17,199 | ||||||||||||
| Short-term debt | 13,320 | 13,320 | 3,538 | 3,538 | ||||||||||||
| Long-term debt | 62,912 | 63,512 | 35,000 | 35,078 | ||||||||||||
| Trust preferred capital notes | 5,155 | 5,167 | 5,155 | 5,167 | ||||||||||||
| Accrued interest payable | 879 | 879 | 1,495 | 1,495 | ||||||||||||
The Company assumes interest rate risk (the risk that general interest rate levels will change) as a result of its normal operations. As a result, the fair values of the Company's financial instruments will change when interest rate levels change and that change may be either favorable or unfavorable to the Company. Management attempts to match maturities of assets and liabilities to the extent believed necessary to minimize interest rate risk. However, borrowers with fixed rate obligations are less likely to prepay in a rising rate environment and more likely to prepay in a falling rate environment. Conversely, depositors who are receiving fixed rates are more likely to withdraw funds before maturity in a rising rate environment and less likely to do so in a falling rate environment. Management monitors rates and maturities of assets and liabilities and attempts to minimize interest rate risk by adjusting terms of new loans and deposits and by investing in securities with terms that mitigate the Company's overall interest rate risk.
| Note 17. | Capital Requirements |
The Company, on a consolidated basis, and Middleburg Bank are subject to various regulatory capital requirements administered by the federal banking agencies. Failure to meet minimum capital requirements can initiate certain mandatory and possibly additional discretionary actions by regulators that, if undertaken, could have a direct material effect on the Company’s and Bank’s financial statements. Under capital adequacy guidelines and the regulatory framework for prompt corrective action, the Company and Middleburg Bank must meet specific capital guidelines that involve quantitative measures of the Company's and Middleburg Bank’s assets, liabilities, and certain off-balance-sheet items as calculated under regulatory accounting practices. The capital amounts and classification are also subject to qualitative judgments by the regulators about components, risk weightings, and other factors. Prompt corrective action provisions are not applicable to bank holding companies.
Quantitative measures established by regulation to ensure capital adequacy require the Company and Middleburg Bank to maintain minimum amounts and ratios (set forth in the table below) of total and Tier 1 capital to risk-weighted assets, and of Tier 1 capital to average assets. Management believes, as of December 31, 2010 and 2009, that the Company and Middleburg Bank meet all capital adequacy requirements to which they are subject.
47
| Note 17. | Capital Requirements (Continued) |
As of December 31, 2010, the most recent notification from the Federal Reserve Bank categorized Middleburg Bank as well capitalized under the regulatory framework for prompt corrective action. To be categorized as well capitalized, an institution must maintain minimum total risk-based, Tier 1 risk-based, and Tier 1 leverage ratios as set forth in the table. There are no conditions or events since that notification that management believes have changed the institution's category.
The Company’s and Middleburg Bank’s actual capital amounts and ratios are also presented in the following table.
| Minimum | ||||||||||||||||||||||||
| To Be Well | ||||||||||||||||||||||||
| Capitalized Under | ||||||||||||||||||||||||
| Minimum Capital | Prompt Corrective | |||||||||||||||||||||||
| Actual | Requirement | Action Provisions | ||||||||||||||||||||||
| Amount | Ratio | Amount | Ratio | Amount | Ratio | |||||||||||||||||||
| (Amount in Thousands) | ||||||||||||||||||||||||
| As of December 31, 2010: | ||||||||||||||||||||||||
| Total Capital (to Risk- | ||||||||||||||||||||||||
| Weighted Assets): | ||||||||||||||||||||||||
| Consolidated | $ | 109,420 | 14.1 | % | $ | 62,252 | 8.0 | % | N/A | N/A | ||||||||||||||
| Middleburg Bank | 105,064 | 13.5 | % | 62,082 | 8.0 | % | $ | 77,602 | 10.0 | % | ||||||||||||||
| Tier 1 Capital (to Risk- | ||||||||||||||||||||||||
| Weighted Assets): | ||||||||||||||||||||||||
| Consolidated | $ | 99,628 | 12.8 | % | $ | 31,126 | 4.0 | % | N/A | N/A | ||||||||||||||
| Middleburg Bank | 95,299 | 12.3 | % | 31,041 | 4.0 | % | $ | 46,561 | 6.0 | % | ||||||||||||||
| Tier 1 Capital (to | ||||||||||||||||||||||||
| Average Assets): | ||||||||||||||||||||||||
| Consolidated | $ | 99,628 | 9.0 | % | $ | 44,431 | 4.0 | % | N/A | N/A | ||||||||||||||
| Middleburg Bank | 95,299 | 8.6 | % | 44,311 | 4.0 | % | $ | 55,389 | 5.0 | % | ||||||||||||||
| As of December 31, 2009: | ||||||||||||||||||||||||
| Total Capital (to Risk- | ||||||||||||||||||||||||
| Weighted Assets): | ||||||||||||||||||||||||
| Consolidated | $ | 113,284 | 15.1 | % | $ | 60,194 | 8.0 | % | N/A | N/A | ||||||||||||||
| Middleburg Bank | 107,825 | 14.4 | % | 60,003 | 8.0 | % | $ | 75,003 | 10.0 | % | ||||||||||||||
| Tier 1 Capital (to Risk- | ||||||||||||||||||||||||
| Weighted Assets): | ||||||||||||||||||||||||
| Consolidated | $ | 104,302 | 13.9 | % | $ | 30,097 | 4.0 | % | N/A | N/A | ||||||||||||||
| Middleburg Bank | 98,863 | 13.2 | % | 30,001 | 4.0 | % | $ | 45,002 | 6.0 | % | ||||||||||||||
| Tier 1 Capital (to | ||||||||||||||||||||||||
| Average Assets): | ||||||||||||||||||||||||
| Consolidated | $ | 104,302 | 10.4 | % | $ | 40,112 | 4.0 | % | N/A | N/A | ||||||||||||||
| Middleburg Bank | 98,863 | 9.9 | % | 40,040 | 4.0 | % | $ | 50,049 | 5.0 | % | ||||||||||||||
48
| Note 18. | Goodwill and Intangible Assets |
Goodwill is not amortized, but is tested at least annually for impairment by the Company. Based on the testing for impairment of goodwill and intangible assets, there were no impairment charges for 2010, 2009, or 2008. Identifiable intangible assets are being amortized over the period of expected benefit, which is 15 years. Goodwill and intangible assets relate to the Company’s acquisition of Middleburg Trust Company and Middleburg Investment Advisors and the consolidation of Southern Trust Mortgage. Information concerning goodwill and intangible assets is presented in the following table:
| December 31, 2010 | December 31, 2009 | |||||||||||||||
| Gross | Gross | |||||||||||||||
| Carrying | Accumulated | Carrying | Accumulated | |||||||||||||
| Value | Amortization | Value | Amortization | |||||||||||||
| Identifiable intangibles | $ | 3,734,000 | $ | 2,663,167 | $ | 3,734,000 | $ | 2,491,834 | ||||||||
| Unamortizable goodwill | 5,289,213 | - | 5,289,213 | - | ||||||||||||
Amortization expense of intangible assets for each of the three years ended December 31, 2010, 2009, and 2008 totaled $171,333, $212,906, and $338,000 respectively. Estimated amortization expense of identifiable intangibles for the years ended December 31 follows:
| 2011 | $ | 171,333 | ||
| 2012 | 171,333 | |||
| 2013 | 171,333 | |||
| 2014 | 171,333 | |||
| 2015 | 171,333 | |||
| Thereafter | 214,168 | |||
| $ | 1,070,833 |
| Note 19. | Trust-Preferred Capital Notes |
On December 12, 2003, MFC Capital Trust II, a wholly owned subsidiary of the Company, was formed for the purpose of issuing redeemable Capital Securities. On December 19, 2003, $5 million of trust-preferred securities were issued through a pooled underwriting totaling approximately $344 million. The securities have a LIBOR-indexed floating rate of interest.
During 2010, the interest rates ranged from 3.10 percent to 3.33 percent. For the year ended December 31, 2010, the weighted-average interest rate was 3.25 percent. The securities have a mandatory redemption date of January 23, 2034, and are subject to varying call provisions beginning January 23, 2009. The principal asset of the trust is $5.2 million of the Company’s junior subordinated debt securities with like maturities and like interest rates to the Capital Securities. See Note 24 for information regarding a rate swap entered into by the Company during 2010 to manage the interest rate risk associated with these trust preferred securities.
The trust-preferred securities may be included in Tier 1 capital for regulatory capital adequacy determination purposes up to 25 percent of Tier 1 capital after its inclusion. The portion of the trust-preferred securities not considered as Tier 1 capital may be included in Tier 2 capital. On December 31, 2010, all of the Company’s trust-preferred securities are included in Tier I capital.
The obligations of the Company with respect to the issuance of the Capital Securities constitute a full and unconditional guarantee by the Company of the trusts’ obligations with respect to the Capital Securities.
Subject to certain exceptions and limitations, the Company may elect from time to time to defer interest payments on the junior subordinated debt securities, which would result in a deferral of distribution payments on the related Capital Securities.
49
| Note 20. | Consolidation of Southern Trust Mortgage |
In February 2008, Middleburg Bank approved a $5 million line of credit to Southern Trust Mortgage. The line of credit is secured by residential construction loans. As a result of the extension of credit, the Company was deemed to be the primary beneficiary as defined in ASC Topic 810, Consolidations. Accordingly, the Company consolidated the assets, liabilities, revenues, and expenses of Southern Trust Mortgage and reflected the issued and outstanding interest not held by the Company in its consolidated financial statements as Non-controlling Interest in Consolidated Subsidiary.
In May 2008, Middleburg Bank acquired the membership interest units of one of the partners of Southern Trust Mortgage for $1.6 million. As a result, the Company’s ownership interest exceeded 50 percent of the issued and outstanding membership units. At December 31, 2010, the Company owned 57.1 percent of the issued and outstanding membership interest units of Southern Trust Mortgage, through its subsidiary, Middleburg Bank.
50
Note 21. Condensed Financial Information – Parent Corporation Only
| BALANCE SHEETS | ||||||||
| December 31, | ||||||||
| 2010 | 2009 | |||||||
| (In Thousands) | ||||||||
| ASSETS | ||||||||
| Cash on deposit with subsidiary bank | $ | 1,940 | $ | 3,759 | ||||
| Money market fund | 7 | 6 | ||||||
| Investment securities available for sale | 13 | 34 | ||||||
| Investment in subsidiaries | 92,801 | 94,725 | ||||||
| Goodwill | 5,289 | 5,289 | ||||||
| Intangible assets, net | 1,071 | 1,242 | ||||||
| Other assets | 1,048 | 473 | ||||||
| TOTAL ASSETS | $ | 102,169 | $ | 105,528 | ||||
| LIABILITIES | ||||||||
| Trust-preferred capital notes | $ | 5,155 | $ | 5,155 | ||||
| Other liabilities | 61 | 61 | ||||||
| TOTAL LIABILITIES | 5,216 | 5,216 | ||||||
| SHAREHOLDERS' EQUITY | ||||||||
| Common stock | 17,314 | 17,273 | ||||||
| Capital surplus | 43,058 | 42,807 | ||||||
| Retained earnings | 37,593 | 42,706 | ||||||
| Accumulated other comprehensive loss, net | (1,012 | ) | (2,474 | ) | ||||
| TOTAL SHAREHOLDERS' EQUITY | 96,953 | 100,312 | ||||||
| TOTAL LIABILITIES AND SHAREHOLDERS' EQUITY | $ | 102,169 | $ | 105,528 | ||||
51
Note 21. Condensed Financial Information – Parent Corporation Only (Continued)
| STATEMENTS OF OPERATIONS | ||||||||||||
| Year Ended December 31, | ||||||||||||
| 2010 | 2009 | 2008 | ||||||||||
| (In Thousands) | ||||||||||||
| INCOME: | ||||||||||||
| Dividends from subsidiaries | $ | 1,732 | $ | 2,360 | $ | 2,670 | ||||||
| Interest and dividends from investments | 5 | 4 | 6 | |||||||||
| Management fees from subsidiaries | - | 40 | 40 | |||||||||
| Other income (loss) | 10 | (40 | ) | (65 | ) | |||||||
| Total income | 1,747 | 2,364 | 2,651 | |||||||||
| EXPENSES: | ||||||||||||
| Salaries and employee benefits | 366 | 132 | 234 | |||||||||
| Amortization | 171 | 213 | 358 | |||||||||
| Legal and professional fees | 141 | 293 | 104 | |||||||||
| Directors fees | 100 | 68 | 74 | |||||||||
| Interest expense | 184 | 191 | 317 | |||||||||
| Other | 339 | 93 | 394 | |||||||||
| Total expenses | 1,301 | 990 | 1,481 | |||||||||
| Income before allocated tax benefits and | ||||||||||||
| undistributed (distributions in excess of) | ||||||||||||
| income of subsidiaries | 446 | 1,374 | 1,170 | |||||||||
| Income tax (benefit) | (387 | ) | (365 | ) | (378 | ) | ||||||
| Income before equity in undistributed (distributions | ||||||||||||
| in excess of) income of subsidiaries | 833 | 1,739 | 1,548 | |||||||||
| Equity in undistributed (distributions in excess of) | ||||||||||||
| income of subsidiaries | (3,521 | ) | 1,783 | 1,012 | ||||||||
| Net income (loss) | $ | (2,688 | ) | $ | 3,522 | $ | 2,560 | |||||
52
| Note 21. | Condensed Financial Information – Parent Corporation Only (Continued) |
| CONDENSED STATEMENTS OF CASH FLOWS | ||||||||||||
| December 31 | ||||||||||||
| 2010 | 2009 | 2008 | ||||||||||
| CASH FLOWS FROM OPERATING ACTIVITIES | (In Thousands) | |||||||||||
| Net income (loss) | $ | (2,688 | ) | $ | 3,522 | $ | 2,560 | |||||
| Adjustments to reconcile net income (loss) to | ||||||||||||
| net cash provided by operating activities: | ||||||||||||
| Amortization | 171 | 213 | 358 | |||||||||
| Equity in undistributed (earnings) losses of subsidiaries | 3,350 | (971 | ) | (1,012 | ) | |||||||
| Share-based compensation | 159 | 119 | 64 | |||||||||
| Deferred income taxes | - | 929 | (11 | ) | ||||||||
| (Increase) decrease in other assets | (519 | ) | 1,535 | (72 | ) | |||||||
| Increase (decrease) in defined benefit pension | - | (3,032 | ) | 34 | ||||||||
| Increase (decrease) in other liabilities | - | (34 | ) | 47 | ||||||||
| Net cash provided by operating activities | 473 | 2,281 | 1,968 | |||||||||
| CASH FLOWS FROM INVESTING ACTIVITIES | ||||||||||||
| Proceeds from sale of securities available for sale | - | - | 39 | |||||||||
| Investment in subsidiary bank | - | (19,000 | ) | - | ||||||||
| Net cash (used in) investing activities | - | (19,000 | ) | - | ||||||||
| CASH FLOWS FROM FINANCING ACTIVITIES | ||||||||||||
| Net proceeds from issuance of common stock | 134 | 24,229 | 106 | |||||||||
| Net proceeds from issuance of preferred stock | - | 22,000 | - | |||||||||
| Repayment of preferred stock | - | (22,000 | ) | - | ||||||||
| Cash dividends paid on preferred stock | - | (987 | ) | - | ||||||||
| Cash dividends paid on common stock | (2,425 | ) | (2,955 | ) | (3,441 | ) | ||||||
| Net cash provided by (used in) financing activities | (2,291 | ) | 20,287 | (3,335 | ) | |||||||
| Increase (decrease) in cash and cash equivalents | (1,818 | ) | 3,568 | (1,328 | ) | |||||||
| CASH AND CASH EQUIVALENTS AT BEGINNING OF PERIOD | 3,765 | 197 | 1,525 | |||||||||
| CASH AND CASH EQUIVALENTS AT END OF PERIOD | $ | 1,947 | $ | 3,765 | $ | 197 | ||||||
53
Note 22. Segment Reporting
The Company has three reportable segments: retail banking; wealth management; and mortgage banking. Revenue from retail banking activity consists primarily of interest earned on loans and investment securities and service charges on deposit accounts.
Revenues from trust and investment advisory services are composed of fees based upon the market value of assets under administration. The trust and investment advisory services are conducted by two subsidiaries of the Company: Middleburg Trust Company and Middleburg Investment Advisors.
Information about reportable segments and reconciliation to the consolidated financial statements follows:
| 2010 | ||||||||||||||||||||
| Commercial & | ||||||||||||||||||||
| Retail | Wealth | Mortgage | Intercompany | |||||||||||||||||
| Banking | Management | Banking | Eliminations | Consolidated | ||||||||||||||||
| Revenues: | (In Thousands) | |||||||||||||||||||
| Interest income | $ | 47,098 | $ | 9 | $ | 2,315 | $ | (1,391 | ) | $ | 48,031 | |||||||||
| Wealth management fees | - | 4,060 | - | (103 | ) | 3,957 | ||||||||||||||
| Other income | 2,703 | - | 19,354 | (11 | ) | 22,046 | ||||||||||||||
| Total operating income | 49,801 | 4,069 | 21,669 | (1,505 | ) | 74,034 | ||||||||||||||
| Expenses: | ||||||||||||||||||||
| Interest expense | 13,783 | - | 1,782 | (1,390 | ) | 14,175 | ||||||||||||||
| Salaries and employee benefits | 12,887 | 2,866 | 13,841 | - | 29,594 | |||||||||||||||
| Provision for loan losses | 11,122 | - | 883 | - | 12,005 | |||||||||||||||
| Other expense | 17,589 | 1,356 | 4,318 | (115 | ) | 23,148 | ||||||||||||||
| Total operating expenses | 55,381 | 4,222 | 20,824 | (1,505 | ) | 78,922 | ||||||||||||||
| Income (loss) before income taxes | ||||||||||||||||||||
| and non-controlling interest | (5,580 | ) | (153 | ) | 845 | - | (4,888 | ) | ||||||||||||
Income tax expense (benefit) | (2,575 | ) | 13 | - | - | (2,562 | ) | |||||||||||||
| Net income (loss) | (3,005 | ) | (166 | ) | 845 | - | (2,326 | ) | ||||||||||||
| Non-controlling interest in | ||||||||||||||||||||
| consolidated subsidiary | - | - | (362 | ) | - | (362 | ) | |||||||||||||
| Net income (loss) attributable to | ||||||||||||||||||||
| Middleburg Financial | ||||||||||||||||||||
| Corporation | $ | (3,005 | ) | $ | (166 | ) | $ | 483 | $ | - | $ | (2,688 | ) | |||||||
| Total assets | $ | 1,081,231 | $ | 5,931 | $ | 70,512 | $ | (53,107 | ) | $ | 1,104,567 | |||||||||
| Capital expenditures | 852 | - | 87 | 939 | ||||||||||||||||
| Goodwill and other intangibles | - | 4,493 | 1,867 | - | 6,360 | |||||||||||||||
54
Note 22. Segment Reporting (Continued)
| 2009 | ||||||||||||||||||||
| Commercial & | ||||||||||||||||||||
| Retail | Wealth | Mortgage | Intercompany | |||||||||||||||||
| Banking | Management | Banking | Eliminations | Consolidated | ||||||||||||||||
| Revenues: | (In Thousands) | |||||||||||||||||||
| Interest income | $ | 49,143 | $ | 8 | $ | 8,855 | $ | (1,260 | ) | $ | 56,746 | |||||||||
| Wealth management fees | - | 3,873 | - | (76 | ) | 3,797 | ||||||||||||||
| Other income | 3,965 | - | 13,228 | (78 | ) | 17,115 | ||||||||||||||
| Total operating income | 53,108 | 3,881 | 22,083 | (1,414 | ) | 77,658 | ||||||||||||||
| Expenses: | ||||||||||||||||||||
| Interest expense | 18,495 | - | 1,846 | (1,259 | ) | 19,082 | ||||||||||||||
| Salaries and employee benefits | 12,559 | 2,895 | 12,560 | 28 | 28,042 | |||||||||||||||
| Provision for loan losses | 4,564 | - | (13 | ) | - | 4,551 | ||||||||||||||
| Other expense | 15,492 | 1,500 | 4,011 | (183 | ) | 20,820 | ||||||||||||||
| Total operating expenses | 51,110 | 4,395 | 18,404 | (1,414 | ) | 72,495 | ||||||||||||||
| Income (loss) before income taxes | ||||||||||||||||||||
| and non-controlling interest | 1,998 | (514 | ) | 3,679 | - | 5,163 | ||||||||||||||
| Income tax expense (benefit) | 255 | (191 | ) | - | - | 64 | ||||||||||||||
| Net income (loss) | 1,743 | (323 | ) | 3,679 | - | 5,099 | ||||||||||||||
| Non-controlling interest in | ||||||||||||||||||||
| consolidated subsidiary | - | - | (1,577 | ) | - | (1,577 | ) | |||||||||||||
| Net income (loss) attributable to | ||||||||||||||||||||
| Middleburg Financial | ||||||||||||||||||||
| Corporation | $ | 1,743 | $ | (323 | ) | $ | 2,102 | $ | - | $ | 3,522 | |||||||||
| Total assets | $ | 966,004 | $ | 6,293 | $ | 56,978 | $ | (52,901 | ) | $ | 976,374 | |||||||||
| Capital expenditures | 1,922 | 11 | 46 | - | 1,979 | |||||||||||||||
| Goodwill and other intangibles | - | 4,664 | 1,867 | - | 6,531 | |||||||||||||||
55
Note 22. Segment Reporting (Continued)
| 2008 | ||||||||||||||||||||
| Commercial & | ||||||||||||||||||||
| Retail | Wealth | Mortgage | Intercompany | |||||||||||||||||
| Banking | Management | Banking | Eliminations | Consolidated | ||||||||||||||||
| (In Thousands) | ||||||||||||||||||||
| Revenues: | ||||||||||||||||||||
| Interest income | $ | 50,103 | $ | 29 | $ | 5,990 | $ | (200 | ) | $ | 55,922 | |||||||||
| Wealth management fees | - | 4,253 | - | (83 | ) | 4,170 | ||||||||||||||
| Other income | 2,357 | 95 | 10,412 | (130 | ) | 12,734 | ||||||||||||||
| Total operating income | 52,460 | 4,377 | 16,402 | (413 | ) | 72,826 | ||||||||||||||
| Expenses: | ||||||||||||||||||||
| Interest expense | 21,128 | - | 1,791 | (200 | ) | 22,719 | ||||||||||||||
| Salaries and employee benefits | 12,065 | 2,795 | 10,516 | - | 25,376 | |||||||||||||||
| Provision for loan losses | 3,621 | - | 1,640 | - | 5,261 | |||||||||||||||
| Other expense | 11,644 | 1,560 | 4,232 | (213 | ) | 17,223 | ||||||||||||||
| Total operating expenses | 48,458 | 4,355 | 18,179 | (413 | ) | 70,579 | ||||||||||||||
| Income (loss) before income taxes | ||||||||||||||||||||
| and non-controlling interest | 4,002 | 22 | (1,777 | ) | - | 2,247 | ||||||||||||||
| Income tax expense | 362 | 82 | - | - | 444 | |||||||||||||||
| Net income (loss) | 3,640 | (60 | ) | (1,777 | ) | - | 1,803 | |||||||||||||
| Non-controlling interest in | ||||||||||||||||||||
| consolidated subsidiary | - | - | - | 757 | 757 | |||||||||||||||
| Net income (loss) attributable to | ||||||||||||||||||||
| Middleburg Financial | ||||||||||||||||||||
| Corporation | $ | 3,640 | $ | (60 | ) | $ | (1,777 | ) | $ | 757 | $ | 2,560 | ||||||||
| Total assets | $ | 933,652 | $ | 6,514 | $ | 51,709 | $ | (6,684 | ) | $ | 985,191 | |||||||||
| Capital expenditures | 3,162 | 282 | 275 | - | 3,719 | |||||||||||||||
| Goodwill and other intangibles | - | 4,877 | 1,867 | - | 6,744 | |||||||||||||||
| Note 23. | Capital Purchase Program and Stock Offerings |
On January 30, 2009, as part of the Capital Purchase Program established by the U.S. Department of the Treasury (the “Treasury”) under the Emergency Economic Stabilization Act of 2008, Middleburg Financial Corporation (the “Company”) entered into a Letter Agreement and Securities Purchase Agreement—Standard Terms (collectively, the “Purchase Agreement”) with the Treasury, pursuant to which the Company sold (i) 22,000 shares of the Company’s Fixed Rate Cumulative Perpetual Preferred Stock, Series A, par value $2.50 per share, having a liquidation preference of $1,000 per share (the “Preferred Stock”) and (ii) a warrant (the “Warrant”) to purchase 208,202 shares of the Company’s common stock, par value $2.50 per share (the “Common Stock”), at an initial exercise price of $15.85 per share. As a result of the completion of the Company’s public stock offering in August 2009, the number of shares of Common Stock underlying the Warrant was reduced by one-half to 104,101. The Company raised approximately $19.2 million through the issuance of 1,908,598 shares of common stock as a result of the offering, as well as another $5.0 million in a private offering to one shareholder which resulted in the issuance of an additional 454,545 shares of common stock.
On December 23, 2009, the Company redeemed all 22,000 shares of Preferred Stock pursuant to the Purchase Agreement. As of March 10, 2011, the Warrant remained outstanding to the U.S. Treasury, and the Company expects that the warrant will be sold by the U.S. Treasury at public auction.
Note 24. Derivatives
| During the fourth quarter of 2010, the Company entered into an interest rate swap agreement as part of the interest rate risk management process. The Company designated the swap as a cash flow hedge intended to hedge the variability of cash flows associated with the Company’s trust preferred capital securities described in Note 19. “Trust-Preferred Capital Notes”. The swap hedges the interest rate risk associated with the trust preferred capital notes wherein the Company receives LIBOR from a counterparty and pays a fixed rate of 2.59% to the same counterparty. The swap is |
56
| calculated on a notional amount of $5,155,000. The term of the swap is ten years and commenced on October 23, 2010. The swap was entered into with a counterparty that met the Company’s credit standards and the agreement contains collateral provisions protecting the at-risk party. The Company believes that the credit risk inherent in the contract is not significant. |
Amounts receivable or payable are recognized as accrued under the terms of the agreements. In accordance with ASC 815, Derivatives and Hedging, the interest rate swap is designated as a cash flow hedge, with the effective portion of the derivative’s unrealized gain or loss recorded as a component of other comprehensive income. The ineffective portion of the unrealized gain or loss, if any, would be recorded in other expense. The Company has assessed the effectiveness of the hedging relationship by comparing the changes in cash flows on the designated hedged item. There was no hedge ineffectiveness for this swap. At December 31, 2010, the fair value of the swap agreement was an unrealized gain of $312,000, the amount the Company would have expected to receive if the contract was terminated.
| Information concerning the derivative designated as an accounting hedge at December 31, 2010 is presented in the following table: |
| Positions | Notional | Receive | Pay | Life | ||||||||||||
| (#) | Amount | Asset | Liability | Rate | Rate | (Years) | ||||||||||
| Pay fixed - receive floating | ||||||||||||||||
| interest rate swap | 1 | $5,155,000 | $312,000 | $- | 0.29% | 2.59% | 9.8 | |||||||||
| Total derivatives used in hedging | ||||||||||||||||
| relationships | $5,155,000 | $312,000 | $- | 0.29% | 2.59% | 9.8 | ||||||||||
57