UNITED STATES
SECURITIES AND EXCHANGE COMMISSION
Washington, D.C. 20549
Form 10-K
(Mark One)
x ANNUAL REPORT PURSUANT TO SECTION 13 OR
15(d) OF THE SECURITIES EXCHANGE ACT OF 1934
For the fiscal year ended December 31, 2007
o TRANSITION REPORT PURSUANT TO SECTION 13 OR
15(d) OF THE SECURITIES ACT OF 1934
For the transition period from ________to__________
Commission file number 0-22904
PARKERVISION, INC.
(Exact name of registrant as specified in its charter)
| | 59-2971472 |
| (State of Incorporation) | | (I.R.S. Employer ID No.) |
7915 Baymeadows Way, Suite 400
Jacksonville, Florida 32256
(904) 737-1367
(Address of principal executive offices)
Securities registered pursuant to Section 12(b) of the Act:
None
Securities registered pursuant to Section 12(g) of the Act:
COMMON STOCK, $.01 PAR VALUE
COMMON STOCK RIGHTS
Indicate by check mark if the registrant is a well-known seasoned issuer, as defined in Rule 405 of the Securities Act. Yes o No x
Indicate by check mark if the registrant is not required to file reports pursuant to Section 13 or Section 15(d) of the Act. Yes o No x
Indicate by check mark whether the registrant (1) has filed all reports required to be filed by Section 13 or 15(d) of the Securities Exchange Act during the preceding 12 months (or for such shorter period that the registrant was required to file such reports), and (2) has been subject to such filing requirements for the past 90 days. Yes x No o
Indicate by check mark if disclosure of delinquent filers pursuant to Item 405 of Regulation S-K is not contained herein, and will not be contained, to the best of registrant's knowledge, in definitive proxy or information statements incorporated by reference in Part III of this Form 10-K or any amendment to this Form 10-K x.
Indicate by check mark whether the registrant is a large accelerated filer, an accelerated filer, a non-accelerated filer, or a smaller reporting company.
Large accelerated filer o Accelerated filer x Non-accelerated filer o Smaller reporting company o
Indicate by check mark whether the registrant is a shell company (as defined in Rule 12b-2 of the Act).
Yes o No x
As of June 29, 2007, the aggregate market value of the Issuer's Common Stock, $.01 par value, held by non-affiliates of the Issuer was approximately $255,997,286 (based upon $11.95 share closing price on that date, as reported by The Nasdaq Global Market).
As of March 6, 2008, 26,495,691 shares of the Issuer's Common Stock were outstanding.
Table of Contents
| Forward Looking Statements | 4 |
| | | |
| PART I | | |
| Item 1. | Business | 4 |
| Item 1A. | Risk Factors | 8 |
| Item 1B. | Unresolved Staff Comments | 11 |
| Item 2. | Properties | 11 |
| Item 3. | Legal Proceedings | 11 |
| Item 4. | Submission of Matters to a Vote of Security Holders | 11 |
| | | |
| PART II | | |
| Item 5. | Market for the Registrant’s Common Equity, Related Stockholder Matters and Issuer Purchases of Equity Securities | 11 |
| Item 6. | Selected Financial Data | 13 |
| Item 7. | Management’s Discussion and Analysis of Financial Condition and Results of Operations | 13 |
| Item 7A. | Quantitative and Qualitative Disclosures About Market Risk | 21 |
| Item 8. | Consolidated Financial Statements and Supplementary Data | 22 |
| Item 9. | Changes in and Disagreements with Accountants on Accounting and Financial Disclosure | 46 |
| Item 9A. | Controls and Procedures | 46 |
| Item 9B. | Other Information | 47 |
| | | |
| PART III | | |
| Item 10. | Directors, Executive Officers and Corporate Governance | 47 |
| Item 11. | Executive Compensation | 49 |
| Item 12. | Security Ownership of Certain Beneficial Owners and Management and Related Stockholder Matters | 60 |
| Item 13. | Certain Relationships and Related Transactions and Director Independence | 62 |
| Item 14. | Principal Accountant Fees and Services | 63 |
| | | |
| PART IV | | |
| Item 15. | Exhibits, Financial Statement Schedules and Reports on Form 8-K | 63 |
| | | |
| SIGNATURES | 68 |
| | | |
| SCHEDULES | 69 |
| | | |
| INDEX TO EXHIBITS | 70 |
Forward-Looking Statements
We believe that it is important to communicate our future expectations to our shareholders and to the public. This report contains forward-looking statements, including, in particular, statements about our future plans, objectives and expectations under the headings “Item 1. Business” and “Item 7. Management’s Discussion and Analysis of Financial Condition and Results of Operations” in this report. When used in this Form 10-K and in future filings by ParkerVision, Inc., with the Securities and Exchange Commission, the words or phrases “will likely result”, “management expects”, “we expect”, “will continue”, “is anticipated”, “estimated” or similar expressions are intended to identify “forward-looking statements” within the meaning of the Private Securities Litigation Reform Act of 1995. Readers are cautioned not to place undue reliance on such forward-looking statements, each of which speaks only as of the date made. Such statements are subject to certain risks and uncertainties that could cause actual results to differ materially from historical earnings and those presently anticipated or projected. Examples of such risks and uncertainties include the timely development and commercial acceptance of new products and technologies, reliance on key business and sales relationships, and reliance on our intellectual property. We have no obligation to publicly release the results of any revisions which may be made to any forward-looking statements to reflect anticipated events or circumstances occurring after the date of such statements.
PART I
Item 1. Business
ParkerVision, Inc. (the “Company” or “we”) was incorporated under the laws of the state of Florida on August 22, 1989. We are in the business of designing, developing and licensing our proprietary d2p™ and d2d™ wireless radio frequency (“RF”) technologies for use in semiconductor circuits for wireless radio applications. Our primary business strategy is to license our technologies to chip suppliers and/or mobile handset manufacturers for the incorporation of our technologies into mobile handsets. In addition, we have, from time to time, explored licensing and other opportunities outside the cellular industry to the extent that the applications are synergistic with our current development efforts.
Recent Developments
Initial Customer Agreements
In 2007, we entered into agreements for the incorporation of our technologies into RF products.
In May 2007, we executed an Engineering Services Agreement and a Licensing Agreement with ITT Corporation (“ITT”) for the design and use of our d2p technology in applications worldwide. Under the agreements, we will be paid royalties on a per unit basis for products sold by ITT that incorporate our d2p technology. We are also providing engineering consulting and design services to ITT on a time and materials basis, as requested, for the development of products using our technology.
In December 2007, we entered into a Licensing and Engineering Services Agreement with a mobile handset chip supplier for the design and use of our d2p and d2d technologies in chipsets initially targeted for the 3G mobile handset market worldwide. Under the terms of the agreement, we will be paid royalties on a per unit basis for chipsets sold which incorporate one or both of our RF technologies.
Sale of Equity Securities to Fund Operations
On March 5, 2008, we completed the sale of an aggregate of 1,240,199 shares of our common stock to a limited number of domestic institutional and other investors in a private placement transaction pursuant to an offering exemption under the Securities Act of 1933. Such shares represent 4.7% of our outstanding common stock on an after-issued basis. 1,110,999 shares were sold at a price of $7.50 per share, and 129,200 shares were sold to Mr. Jeffrey Parker, our chief executive officer and chairman, at $7.74 per share. The net proceeds from this transaction of approximately $9 million will be used for general working capital purposes. We will register the common stock issued in the private offering for re-offer and re-sale by the investors.
General Development of Business
From 2003 through June of 2005, we manufactured and sold branded wireless networking products that incorporated our d2d technology. Our product sales were primarily through retail and internet retail distribution channels. All of our product revenues through 2005 were generated from these retail products. In June 2005, we exited our manufacturing and retail sales activities in pursuit of our longer-term business strategy of establishing relationships with original equipment manufacturers (“OEMs”) for the incorporation of our technology into their products. Our decision to exit the retail activities was precipitated by advances in our wireless technology resulting in increased interest from OEM prospects, specifically in the mobile handset market. We determined that the investment required to increase brand awareness, introduce new product offerings, and expand the distribution channel for retail products, would detract from our ability to capitalize on OEM opportunities.
As of December 31, 2005, we had substantially completed our retail exit activities. Those activities included the sale of our remaining finished product inventories, including those reclaimed from our retail and distribution channel partners, and liquidation of our remaining raw materials inventory, our manufacturing and prototype assets and other property and equipment utilized in the retail business.
In the second half of 2005, we began educating prospective customers about the benefits of our technologies, with a focus on our d2p transmit technology. In 2006, we completed our first d2p integrated circuit (“IC”) which embodied many of the advancements of our technology and enabled us to begin demonstrating partially integrated prototypes. Throughout 2006 and 2007, we continued to further advance our prototype ICs while cultivating potential customer relationships. Our sales-related activities in 2006 and 2007 included prototype demonstrations of our increasingly integrated d2p platform, support of in-depth technical due-diligence by prospective customers, analysis of prospective customer product plans, delivery of initial proposals and terms, and, ultimately, negotiations of proposed business relationships.
Our initial target customer base was limited to top tier mobile handset manufacturers. However, in 2006 and increasingly in 2007, mobile handset manufacturers were shifting RF innovation and developments to their chipset providers. Accordingly, we expanded our target customer base to include not only the mobile handset manufacturers, but also their component suppliers. In addition, we expanded our market awareness campaign to include network providers who are significant influencers to the OEMs in the mobile handset industry.
Although our primary target market is the mobile handset industry, we have explored potential relationships outside this target market to the extent that the requirements of the prospective customers are in concert with the needs of our primary target market. This exploration resulted in our first license agreement, with ITT Corporation in May 2007.
To date, we have generated no royalty revenue from licensing of our wireless RF technologies. Our ability to generate revenues sufficient to offset costs is subject to our ability to successfully support our customers in completing their initial product designs incorporating our technologies and expand our market opportunities through additional product offerings with our current customers and/or the addition of new customers such that we are able to secure a reasonable share of the market.
We believe our technology has substantial advantages over competing technologies, especially in the third generation, or 3G, mobile handset market and generations that are likely to evolve beyond 3G, such as 4G mobile handset standards and applications. Current industry studies indicate that over 0.5 billion 3G handsets are expected to ship in the year 2009, which represents approximately 40 percent of the total mobile handset market.
Technology and Products
Our wireless technologies, collectively referred to as Energy Signal Processing or ESP™, represent unique, proprietary methods for processing RF waveforms in wireless applications. The technology applies to the
transmit (baseband data to an RF carrier signal) and receive (RF carrier signal to baseband data) functions of a radio transceiver. The transmit portion of the technology is called Direct2Power™, or d2p, and enables the transformation of a digital baseband signal to an RF carrier waveform, at the desired power output level, in a single unified operation. The receiver portion of the technology is called Direct2Data™, or d2d, and enables the direct conversion of an RF carrier to baseband data signal. Although our primary sales efforts have been focused on commercialization of our d2p technology solutions, our first customer in the mobile handset industry has licensed both the d2p and d2d solutions.
We have completed several engineering prototypes of our d2p-based ICs targeted at mobile handset applications. These ICs were produced using a Silicon Germanium (“SiGe”) process through a fabrication relationship with IBM Microelectronics (“IBM”). These ICs are utilized to verify that our technology can be highly integrated in silicon and to demonstrate the benefits of the technology to OEM target customers. The portion of the IC that embodies the core RF technology has been highly integrated in prototype ICs. We anticipate that OEM customers will engage us to customize the implementation of the core technology based on their specific interface and product requirements. Our current prototypes support multi-band (meaning multiple frequencies) and multi-mode (meaning multiple cellular standards and corresponding modulation formats) functionality. Our ICs support multiple bands of cellular and PCS frequencies and support the current and emerging cellular standards including GSM/EDGE, CDMA, W-CDMA, and HSUPA. We are also able to demonstrate 802.16e WiMax standards using PCS frequencies with our current ICs.
Our d2d (receiver) technology was first introduced in the form of transceiver ICs for the wireless local area networking (“WLAN”) market in 2002. In 2003, we began marketing ICs to OEMs and original design manufacturers (“ODM”s) who manufacture and sell WLAN products or application modules that incorporate WLAN capabilities. In order to mitigate the barriers to entry in the WLAN marketplace, we also initiated a business strategy of developing our own d2d-based WLAN products for marketing to end-users.
From 2003 to 2005, we produced WLAN products for retail distribution. In June 2005, we ceased production and development efforts for our WLAN end-user products and exited our retail business activities in order to focus exclusively on OEM opportunities, particularly with regard to our transmit technology implementation which we believe has broad adoption potential in the mobile handset market.
Our unique technologies process the RF waveform in a more optimal manner than existing technologies, thereby allowing OEMs to create handsets that have extended battery life, more easily incorporate multiple air interface standards and frequencies in smaller form factors, and reduce manufacturing costs. Our technologies provide such attractive benefits, in part, because of the unique integrated circuit architecture which enables efficient digital circuit processing, eliminating many of the limitations of legacy analog processing.
Marketing and Sales
Our marketing and sales activities are currently focused on developing and capitalizing on relationships in the mobile handset industry. Although we believe our direct customers are likely to be the chipset suppliers in this industry, we continue to cultivate our relationships with the mobile handset manufacturers who are significant influencers to their chipset suppliers.
Our sales and sales support activities include prototype demonstrations of both semi-integrated and highly integrated circuits that showcase the benefits of the technology; support of detailed technology due-diligence discussions and testing; analysis of potential customer product roadmaps and integration alternatives; and negotiations of specific terms of potential business relationships.
We believe the sales cycle, from the initial customer meeting to the consummation of a business arrangement, is generally 18-24 months. The length of the sales cycle is a result of many factors, including the unique nature of our technology; intense technology evaluation and due-diligence required based on the complex nature of radio frequency technology, in general, and the cellular specifications, in particular; our lack of tenure in the cellular industry; and the variety of licensing implementations and integration decisions that
must be evaluated by the customer in order to assess the specific value proposition for their needs. We believe the sales cycle will be significantly shortened as our technologies gain adoption in this market.
We executed our first two customer contracts in 2007. We believe additional customer design wins will occur and, furthermore, we believe that the rate of adoption of our technology will increase as we move toward completion of products with our existing customers. Future sales may be influenced by the terms negotiated with our customers and our ability to expand internal resources to support multiple customers.
Competition
We operate in a highly competitive industry against companies with substantially greater financial, technical, and sales and marketing resources. Our technologies, which are currently being marketed in the mobile handset industry, face competition from incumbent providers of transceivers and power amplifiers including companies such as RF Microdevices, Anadigics, Skyworks, ST Microelectronics, Qualcomm, and Freescale, among others. Each of our competitors, however, also has the potential of becoming a licensee of our technologies. We also compete against RF engineering groups within the research and development organizations of our target customers. To date, we are unaware of any competing or emerging RF technologies that provide all the simultaneous benefits that our technology enables.
We believe we can gain adoption, and therefore compete, based on the performance and cost advantages enabled by our unique circuit architecture, as supported by a solid and defensible intellectual property portfolio. Our intellectual property offering is capable of being compliant with mobile standards-based 3G requirements and can accept the same baseband data input as traditional or future offerings. In addition, we believe the improved power efficiencies enabled by our technology provide a solution to an existing problem in applications for 3G standards and beyond that the mobile handset industry is seeking to solve.
Production and Supply
Our current business strategy is focused on licensing our intellectual property. As a result, we expect that production capacity risk will shift to our customers. We currently have a fabrication relationship with IBM for the production of our prototype ICs on a SiGe process. We believe IBM has sufficient capacity to meet our foreseeable needs. In addition, our ICs can be produced using different materials and processes, if necessary, to satisfy capacity requirements and/or customer preferences.
Patents and Trademarks
We consider our intellectual property, including patents, patent applications, trademarks, and trade secrets to be significant to our competitive positioning. We have a program to file applications for and obtain patents, copyrights, and trademarks in the United States and in selected foreign countries where we believe filing for such protection is appropriate to establish and maintain our proprietary rights in our technology and products. As of December 31, 2007, we have obtained 59 U.S. and 54 foreign patents related to our RF technologies and have 98 patent applications pending in the United States and other countries. Our patents have been issuing at a rate of approximately four to six new patents each quarter. Since December 31, 2007, we have been granted four additional U.S patents and one additional foreign patent. We estimate the economic lives of our patents to be fifteen to twenty years.
Research and Development
For the years ended December 31, 2007, 2006 and 2005, we spent approximately $10.7 million, $9.5 million, and $10.3 million, respectively, on company-sponsored research and development activities. Our research and development efforts have been devoted to the development and advancement of RF technologies, including the development of prototype ICs for proof of concept purposes.
Employees
As of December 31, 2007, we had 53 full-time employees, of which 32 are employed in engineering research and development, 9 in sales and marketing, and 12 in executive management, finance and administration. Our employees are not represented by a labor union. We consider our employee relations satisfactory.
Available Information and Access to Reports
We file our annual report on Form 10-K and quarterly reports on Forms 10-Q, including amendments, as well as our proxy and other reports electronically with the Securities and Exchange Commission (“SEC”). The SEC maintains an Internet site (http://www.sec.gov) where these reports may be obtained at no charge. Copies of any materials filed with the SEC may also be obtained from the SEC’s Public Reference Room at 100 F Street, NE, Washington, DC 20549. Information on the operation of the SEC Public Reference Room may be obtained by calling the SEC at 1-800-SEC-0330. Copies of these reports may also be obtained via the Company’s website (http://www.parkervision.com) via the link “SEC filings”. This provides a direct link to our reports on the SEC Internet site. We will provide copies of this annual report on Form 10-K and the quarterly reports on Forms 10-Q, including amendments, filed during the current fiscal year upon written request to Investor Relations, 7915 Baymeadows Way, Suite 400, Jacksonville, Florida, 32256. These reports will be provided at no charge. In addition, exhibits may be obtained at a cost of $.25 per page plus $5.00 postage and handling.
Item 1A. Risk Factors
In addition to other information in this Annual Report on Form 10-K, the following risk factors should be carefully considered in evaluating our business because such factors may have a significant impact on our business, operating results, liquidity and financial condition. As a result of the risk factors set forth below, actual results could differ materially from those projected in any forward-looking statements.
We have had a history of losses which may ultimately compromise our ability to implement our business plan and continue in operation.
We have had losses in each year since our inception in 1989, and continue to have an accumulated deficit which, at December 31, 2007, was $167.6 million. The net loss for 2007 was $18.2 million. To date, our technologies and products have not produced revenues sufficient to cover operating, research and development and overhead costs. We also will continue to make expenditures on marketing, research and development, pursuit of patent protection for our intellectual property and operational costs for fulfillment of any contracts that we achieve for the sale of our products or technologies. We expect that our revenues in the near term will not bring the company to profitability. If we are not able to generate sufficient revenues or we have insufficient capital resources, we will not be able to implement our business plan and investors will suffer a loss in their investment. This may result in a change in our business strategies.
We expect to need additional capital in the future, which if we are unable to raise will result in our not being able to implement our business plan as currently formulated.
Because we have had net losses and, to date, have not generated positive cash flow from operations, we have funded our operating losses from the sale of equity securities from time to time and the sale of our video division in 2004. We anticipate that our business plan will continue to require significant expenditures for research and development, patent protection, sales and marketing and general operations. Our current capital resources, including cash and cash equivalents at December 31, 2007 of $13.4 million and the net proceeds of our March 5, 2008 private placement transaction of approximately $9 million, are expected to sustain operations through the first quarter of 2009, if not longer. Thereafter, unless we increase revenues to a level that they cover operating expenses or we reduce costs, we will require additional capital to fund these expenses. Financing, if any, may be in the form of loans or additional sales of equity securities. A loan or the sale of preferred stock may result in the imposition of operational limitations and other covenants and payment obligations, any of which may be burdensome to us. The sale of equity securities will result in dilution to the current stockholders’ ownership. The long-term continuation of our business plan is dependent upon the generation of sufficient revenues from the sale of our products, additional funding or reducing
expenses or a combination of the foregoing. The failure to generate sufficient revenues, raise capital or reduce expenses could have a material adverse effect on our ability to achieve our long-term business objectives.
Our industry is subject to rapid technological changes which if we are unable to match or surpass, will result in a loss of competitive advantage and market opportunity.
Because of the rapid technological development that regularly occurs in the microelectronics industry, we must continually devote substantial resources to developing and improving our technology and introducing new product offerings. For example, in fiscal years 2007 and 2006, we spent approximately $10.7 million and $9.5 million, respectively, on research and development, and we expect to continue to spend a significant amount in this area in the future. These efforts and expenditures are necessary to establish and increase market share and, ultimately, to grow revenues. If another company offers better products or our product development lags, a competitive position or market window opportunity may be lost, and therefore our revenues or revenue potential may be adversely affected.
If our products are not commercially accepted, our developmental investment will be lost and our future business continuation will be impaired.
There can be no assurance that our research and development will produce commercially viable technologies and products. If existing or new technologies and products are not commercially accepted, the funds expended will not be recoverable, and our competitive and financial position will be adversely affected. In addition, perception of our business prospects will be impaired with an adverse impact on our ability to do business and to attract capital and employees.
If our patents and intellectual property do not provide us with the anticipated market protections and competitive position, our business and prospects will be impaired.
We rely on our intellectual property, including patents and patent applications, to provide competitive advantage and protect us from theft of our intellectual property. We believe that many of our patents are for entirely new technologies. If the patents are not issued or issued patents are later shown not to be as broad as currently believed, or are otherwise challenged such that some or all of the protection is lost, we will suffer adverse effects from the loss of competitive advantage and our ability to offer unique products and technologies. In addition, there would be an adverse impact on our financial condition and business prospects.
If we cannot demonstrate that our technologies and products can compete in the marketplace and are better than current competitive solutions, then we will not be able to generate the sales we need to continue our business and our prospects will be impaired.
We expect to face competition from chip suppliers such as RF MicroDevices, Anadigics, Skyworks, ST Microelectronics, Qualcomm, and Freescale, among others. Our technology may also face competition from other emerging approaches or new technological advances which are under development and have not yet emerged. If our technologies and products are not established in the market place as improvements over current, traditional chip solutions in wireless communications, our business prospects and financial condition will be adversely affected.
We rely, in large part, on key business and sales relationships for the successful commercialization of our products, which if not developed or maintained, will have an adverse impact on achieving market awareness and acceptance and will result in a loss of business opportunity.
To achieve a wide market awareness and acceptance of our products, as part of our business strategy, we will attempt to enter into a variety of business relationships with other companies which will incorporate our intellectual property into their products and/or market products based on our technologies. The successful commercialization of our products will depend in part on our ability to meet obligations under contracts with respect to the products and related development requirements. The failure of the business relationships will limit the commercialization of our products which will have an adverse impact on our business development and our ability to generate revenues and recover development expenses.
We rely, in large part, on the ability of key customers to successfully develop and sell products incorporating our technologies, the failure of which will have an adverse impact on our business opportunities.
The successful commercialization of our products will depend, in part, on the success and timing of our customer’s product development and sales activities which may be impacted by factors outside of our control. Delays in or failure of our customers’ product development or sales activities will hinder the commercialization of our products which will have an adverse impact on our ability to generate revenues and recover development expenses.
We are highly dependent on Mr. Jeffrey Parker as our chief executive officer whose services, if lost, would have an adverse impact on our leadership, industry perception, and investor perception about our future.
Because of Mr. Parker’s position in the company and the respect he has garnered in both the industry in which we operate and the investment community, the loss of the services of Mr. Parker might be seen as an impediment to the execution of our business plan. If Mr. Parker were no longer available to the company, investors may experience an adverse impact on their investment. We do not currently have an employment agreement with Mr. Parker. We maintain key-employee life insurance for our benefit on Mr. Parker.
If we are unable to attract or retain highly skilled employees we will not be able to execute our research and development plans or provide the highly technical services that our products require.
Our business is very specialized, and therefore it is dependent on having skilled and specialized employees to conduct our research, development and customer support activities. The inability to obtain or retain these specialized employees will have an adverse impact on our business development because customers will not obtain the information or services expected which may prevent us from successfully implementing our current business plans.
The outstanding options and warrants may affect the market price and liquidity of the common stock.
At December 31, 2007, we had 25,182,892 shares of common stock outstanding and had 5,789,926 exercisable options and warrants for the purchase of shares of common stock, assuming no terminations or forfeitures of such options and warrants. On December 31, 2008 and 2009, respectively, there will be 5,593,646 and 5,631,169 currently exercisable options and warrants (assuming no new grants, exercises, terminations or forfeitures). All of the underlying common stock of these securities is registered for sale to the holder or for public resale by the holder. The amount of common stock available for the sales may have an adverse impact on our ability to raise capital and may affect the price and liquidity of the common stock in the public market. In addition, the issuance of these shares of common stock will have a dilutive effect on current stockholders’ ownership.
Provisions in the certificate of incorporation and by-laws could have effects that conflict with the interest of stockholders.
Some provisions in our certificate of incorporation and by-laws could make it more difficult for a third party to acquire control. For example, the board of directors has the ability to issue preferred stock without stockholder approval, and there are pre-notification provisions for director nominations and submissions of proposals from stockholders to a vote by all the stockholders under the by-laws. Florida law also has anti-takeover provisions in its corporate statute.
We have a shareholder protection rights plan that may delay or discourage someone from making an offer to purchase the company without prior consultation with the board of directors and management which may conflict with the interests of some of the stockholders.
On November 17, 2005, the board of directors adopted a shareholder protection rights plan which called for the issuance, on November 29, 2005, as a dividend, rights to acquire fractional shares of preferred stock. The rights are attached to the shares of common stock and transfer with them. In the future the rights may become exchangeable for shares of preferred stock with various provisions that may discourage a takeover bid. Additionally, the rights have what are known as “flip-in” and “flip-over” provisions that could make any acquisition of the company more costly. The principal objective of the plan is to cause someone interested in acquiring the company to negotiate with the board of directors rather than launch an unsolicited bid. This
plan may limit, prevent, or discourage a takeover offer that some stockholders may find more advantageous than a negotiated transaction. A negotiated transaction may not be in the best interests of the stockholders.
Item 1B. Unresolved Staff Comments.
None.
Item 2. Properties
Our headquarters are located in a 14,000 square foot leased facility in Jacksonville, Florida. We have an additional leased facility in Lake Mary, Florida primarily for engineering design activities. We believe our properties are in good condition and suitable for the conduct of our business.
Refer to “Lease Commitments” in Note 11 to the Consolidated Financial Statements included in Item 8 for information regarding our outstanding lease obligations.
Item 3. Legal Proceedings
We are subject to legal proceedings and claims arising in the ordinary course of business. Based upon the advice of outside legal counsel, we believe that the final disposition of such matters will not have a material adverse effect on our financial position, results of operations or liquidity.
Item 4. Submission of Matters to a Vote of Security Holders
None.
PART II
Item 5. Market for the Registrant’s Common Equity, Related Stockholder Matters and Issuer Purchases of Equity Securities
Market Information
Our common stock is traded under the symbol PRKR on the Nasdaq Global Market ("Nasdaq"), which is the principal market for the common stock. Listed below is the range of the high and low bid prices of the common stock for the last three fiscal years, as reported by Nasdaq. The amounts represent inter-dealer quotations without adjustment for retail markups, markdowns or commissions and do not necessarily represent the prices of actual transactions.
| | | 2007 | | 2006 | | 2005 | |
| | | High | | Low | | High | | Low | | High | | Low | |
1st Quarter | | $ | 13.98 | | $ | 9.28 | | $ | 10.91 | | $ | 7.61 | | $ | 13.27 | | $ | 6.61 | |
2nd Quarter | | | 13.75 | | | 10.15 | | | 12.00 | | | 9.02 | | | 8.50 | | | 3.70 | |
3rd Quarter | | | 16.00 | | | 10.94 | | | 9.63 | | | 5.30 | | | 10.24 | | | 4.72 | |
4th Quarter | | | 17.20 | | | 7.00 | | | 11.98 | | | 6.53 | | | 9.50 | | | 4.85 | |
Holders
As of February 25, 2008, there were 164 holders of record. We believe there are approximately 3,500 beneficial holders of our common stock.
Dividends
To date, we have not paid any dividends on our common stock. The payment of dividends in the future is at the discretion of the board of directors and will depend upon our ability to generate earnings, our capital requirements and financial condition, and other relevant factors. We do not intend to declare any dividends in the foreseeable future, but instead intend to retain all earnings, if any, for use in the business.
Sales of Unregistered Securities
On November 15, 2007, we granted 63,750 options to purchase common stock to officers and other employees that vest over three years and 2,281 options to an employee that were immediately vested. The options have an exercise price of $10.36 per share, expire seven years from the grant date and are exempt from registration under section 4(2). We will not receive any consideration for the options until the recipient exercises the option.
Issuer Repurchase of Equity Securities
None.
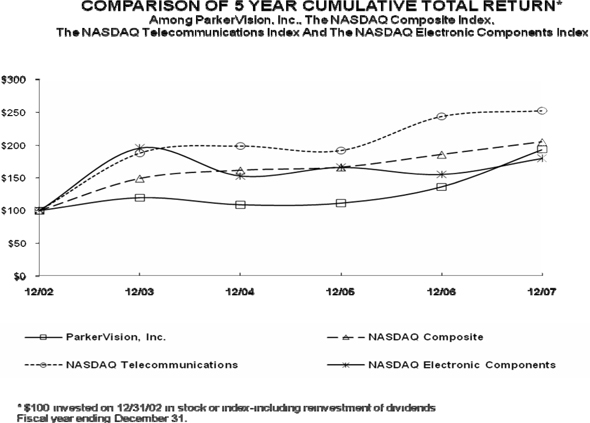
Performance Graph
The following graph shows a five-year comparison of cumulative total shareholder returns for our company, the Nasdaq U.S. Stock Market Index, the Nasdaq Electronic Components Index and Nasdaq Telecommunications Index for the five years ending December 31, 2007. The total shareholder returns assumes the investment on December 31, 2002 of $100 in our common stock, the Nasdaq U.S. Stock Market Index, the Nasdaq Electronic Components Index, and Nasdaq Telecommunications Index at the beginning of the period, with immediate reinvestment of all dividends.
Item 6. Selected Financial Data
The following table sets forth our consolidated financial data as of the dates and for the periods indicated. The data has been derived from our audited consolidated financial statements. The selected financial data should be read in conjunction with our consolidated financial statements and “Management’s Discussion and Analysis of Financial Condition and Results of Operations”. The selected financial data for the statements of operations for December 31, 2004 and December 31, 2003 has been restated to reflect the effects of discontinued operations.
| | | For the years ended December 31, | |
| (in thousands, except per share amounts) | | 2007 | | 2006 | | 2005 | | 2004 | | 2003 | |
Consolidated Statement of Operations Data: | | | | | | | | | | | | | | | | |
| Revenues, net | | $ | 284 | | $ | 0 | | $ | 996 | | $ | 441 | | $ | 23 | |
| Gross margin | | | 32 | | | 0 | | | (2,041 | ) | | (2,854 | ) | | (7 | ) |
| Operating expenses | | | 19,122 | | | 16,866 | | | 21,362 | | | 19,951 | | | 19,104 | |
| Interest and other income | | | 876 | | | 1,051 | | | 304 | | | 217 | | | 476 | |
| Loss from continuing operations | | | (18,213 | ) | | (15,816 | ) | | (23,099 | ) | | (22,588 | ) | | (18,635 | ) |
| Gain (loss) from discontinued operations | | | 0 | | | 0 | | | 0 | | | 7,773 | | | (3,380 | ) |
| Net loss | | | (18,213 | ) | | (15,816 | ) | | (23,099 | ) | | (14,815 | ) | | (22,015 | ) |
| | | | | | | | | | | | | | | | | |
| Basic and diluted net loss per common share | | | | | | | | | | | | | | | | |
| Continuing operations | | | (0.74 | ) | | (0.68 | ) | | (1.14 | ) | | (1.25 | ) | | (1.21 | ) |
| Discontinued operations | | | n/a | | | n/a | | | n/a | | | 0.43 | | | (0.22 | ) |
| Total basic and diluted net loss per common share | | | (0.74 | ) | | (0.68 | ) | | (1.14 | ) | | (0.82 | ) | | (1.43 | ) |
| | | | | | | | | | | | | | | | | |
Consolidated Balance Sheet Data: | | | | | | | | | | | | | | | | |
| Total assets | | $ | 26,577 | | $ | 26,675 | | $ | 23,832 | | $ | 28,081 | | $ | 42,483 | |
| Shareholders’ equity | | | 24,414 | | | 25,183 | | | 22,400 | | | 24,758 | | | 39,399 | |
| Working capital | | | 12,611 | | | 13,313 | | | 10,833 | | | 10,471 | | | 23,225 | |
Item 7. Management's Discussion and Analysis of Financial Condition and Results of Operations
Executive Overview
We are in the business of designing, developing and licensing our proprietary d2p and d2d wireless radio frequency (“RF”) technologies for use in semiconductor circuits for wireless radio applications. Our primary business strategy is to license our technologies to chip suppliers and/or mobile handset manufacturers for the incorporation of our technologies into mobile handsets. In addition, we have, from time to time, explored licensing and other opportunities outside the cellular industry to the extent that the applications are synergistic with our current development efforts.
In 2007, we entered into the first agreements for the incorporation of our technologies into RF products. In May 2007, we executed an Engineering Services Agreement and a Licensing Agreement with ITT for the design and use of our d2p technology in applications worldwide. Under the agreements, we will be paid royalties on a per unit basis for products sold by ITT that incorporate our d2p technology. We are also providing engineering consulting and design services to ITT on a time and materials basis, as requested, for the development of products using our technology.
In December 2007, we entered into a Licensing and Engineering Services Agreement with a mobile handset chip supplier for the design and use of our d2p and d2d technologies in chipsets initially targeted for the 3G mobile handset market worldwide. Under the terms of the agreement, we will be paid royalties on a per unit
basis for chipsets sold which incorporate one or both of our RF technologies.
To date, we have generated no royalty revenue from licensing of our wireless RF technologies and only limited revenue from engineering design services. Our ability to generate revenues sufficient to offset costs is subject to our ability to successfully support our customers in completing their initial product designs incorporating our technologies and expand our market opportunities through additional product offerings with our current customers and/or the addition of new customers. Although design cycles will vary from customer to customer, we believe the timeframe from consummation of the business arrangement to recognition of royalty revenue from product shipments will range from 12-24 months.
We believe our technology has substantial advantages over competing technologies, especially in the third generation, or 3G, mobile handset market and generations that are likely to evolve beyond 3G, such as 4G mobile handset standards and applications. We have made significant investments in developing our technologies and products, the returns on which are dependent upon the generation of future revenues for realization. Since we have not yet generated revenues sufficient to offset our operating expenses, we have used the proceeds largely from the sale of equity securities to fund our operations.
We intend to continue to use our working capital to support future marketing, sales, research and development and general operations. No assurance can be given that such expenditures will result in revenues, new products, or technological advances or that we have adequate capital to complete our products or gain market acceptance before requiring additional capital.
Exit from Retail Business Activities
In June 2005, we exited our manufacturing and retail sales activities in pursuit of our longer-term business strategy of establishing relationships with original equipment manufacturers (“OEMs”) for the incorporation of our technology into their products. Our decision to exit the retail activities was precipitated by advances in our wireless technology resulting in increased interest from OEM prospects, specifically in the mobile handset market. We determined that the investment required to increase brand awareness, introduce new product offerings, and expand the distribution channel for retail products, would detract from our ability to capitalize on OEM opportunities.
Exiting the retail business resulted in charges to our 2005 operating results of approximately $4.7 million. As of December 31, 2005, we had substantially completed our retail exit activities. Those activities included the sale of our remaining finished product inventories, including those reclaimed from our retail and distribution channel partners, and liquidation of our remaining raw materials inventory, our manufacturing and prototype assets and other property and equipment utilized in the retail business.
Critical Accounting Policies
We believe that the following are the critical accounting policies affecting the preparation of our consolidated financial statements:
Use of Estimates in the Preparation of Financial Statements
The preparation of financial statements in conformity with generally accepted accounting principles requires management to make estimates and assumptions that affect the reported amounts of assets and liabilities at the date of the financial statements and the reported amounts of revenues and expenses during the reporting periods. The more significant estimates made by management include the volatility, risk-free interest rate, forfeiture rate and estimated lives of share-based awards used in the estimate of the fair market value of share-based compensation, the assessment of recoverability of long-lived assets and amortization period for intangible and long-lived assets, and the valuation allowance for deferred taxes. Actual results could differ from the estimates made. Management periodically evaluates estimates used in the preparation of the consolidated financial statements for continued reasonableness. Appropriate adjustments, if any, to the estimates used are made prospectively based upon such periodic evaluation.
Intangible Assets
Patents, copyrights and other intangible assets are amortized using the straight-line method over their estimated period of benefit, ranging from three to twenty years. Management evaluates the recoverability of intangible assets periodically and takes into account events or circumstances that warrant revised estimates of useful lives or that indicate impairment exists.
Accounting for Stock Based Compensation
Effective January 1, 2006, we adopted the provisions of Statement of Financial Accounting Standards (“SFAS”) No. 123R, “Share-Based Payment,” (“FAS 123R”) which establishes accounting for equity instruments exchanged for employee services. Under the provisions of FAS 123R, share-based compensation cost is measured at the grant date, based on the calculated fair value of the award, and is recognized as an expense on a straight-line basis over the employee’s requisite service period (generally the vesting period of the equity grant). In March 2005, the Securities and Exchange Commission issued Staff Accounting Bulletin No. 107 (“SAB 107”) relating to FAS 123R. We have applied the provisions of SAB 107 in our adoption of FAS 123R.
Prior to January 1, 2006, we accounted for share-based compensation to employees in accordance with Accounting Principles Board Opinion (“APB”) No. 25, “Accounting for Stock Issued to Employees,” and related interpretations. We also followed the disclosure requirements of SFAS No. 123, “Accounting for Stock-Based Compensation”, as amended by SFAS 148, “Accounting for Stock-Based Compensation - Transition and Disclosure”. We elected to adopt the modified prospective transition method as provided by FAS 123R and, accordingly, financial statement amounts for the prior periods have not been retroactively adjusted to reflect the fair value method of expensing share-based compensation. Under the modified prospective method, share-based expense recognized after adoption includes: (a) share-based expense for all awards granted prior to, but not yet vested as of January 1, 2006, based on the grant date fair value estimated in accordance with the original provisions of SFAS No. 123, as amended by SFAS 148 and (b) share-based expense for all awards granted or modified subsequent to January 1, 2006, based on the grant-date fair value estimated in accordance with the provisions of FAS 123R. Further, as required under FAS123R, we estimate forfeitures for options granted which are not expected to vest. Changes in these inputs and assumptions can materially affect the measure of estimated fair value of our stock-based compensation expense.
In November 2005, the FASB issued FASB Staff Position (“FSP”) FAS No. 123R-3, Transition Election Related to Accounting for the Tax Effects of Share-Based Payment Awards, (“FSP FAS 123R-3”). FSP FAS 123R-3 provides a practical exception when a company transitions to the accounting requirements in FAS123R. FAS123R requires a company to calculate the pool of excess tax benefits available to absorb tax deficiencies recognized subsequent to adopting FAS123R (termed the “APIC Pool”), assuming the company had been following the recognition provisions prescribed by SFAS No. 123. We have elected to use the shortcut method under FSP FAS 123R-3 to calculate our APIC Pool.
Revenue Recognition
We account for service revenue under the provisions of Staff Accounting Bulletin No. 104 (“SAB 104”), “Revenue Recognition in Financial Statements” and AICPA Statement of Position No. 81-1 (“SOP 81-1”), “Accounting for Performance of Construction-Type and Certain Production-Type Contracts.” Under the provisions of SAB 104 and SOP 81-1, we recognize revenue when there is persuasive evidence of an arrangement, services have been rendered, the fee is fixed or determinable, and collection of the resulting receivable is reasonably assured. We use the percentage-of-completion method of accounting for cost reimbursement-type contracts which specify a certain billable fee amount. Revenues are recognized as costs are incurred assuming that collection is reasonably assured. Our cost of sales includes the direct labor costs of engineering staff providing services under these contracts, as well as indirect costs including depreciation and amortization and allocated facilities costs.
Revenue from product sales is generally recognized at the time the product is shipped, provided that
persuasive evidence of an arrangement exists, title and risk of loss has transferred to the customer, the sales price is fixed or determinable and collection of the receivable is reasonably assured. We did not recognize any product revenue in 2007 or 2006. Our 2005 product revenue relates primarily to products sold through retail distribution channels, with limited sales direct to end users through our own website and direct value added resellers.
Income Taxes
The provision for income taxes is based on loss before taxes as reported in the accompanying consolidated statements of operations. Deferred tax assets and liabilities are recognized for the expected future tax consequences of events that have been included in the financial statements or tax returns. Deferred tax assets and liabilities are determined based on differences between the financial statement carrying amounts and the tax bases of assets and liabilities using enacted tax rates in effect for the year in which the differences are expected to reverse. Valuation allowances are established to reduce deferred tax assets when, based on available objective evidence, it is more likely than not that the benefit of such assets will not be realized.
In addition, we adopted FASB Interpretation No. 48, “Accounting for Uncertainty in Income Taxes - an Interpretation of FASB Statement No. 109”, (“FIN 48”) on January 1, 2007, as more fully discussed in Note 7 to the consolidated financial statements.
Recent Accounting Pronouncements
In September 2006, the Financial Accounting Standards Board issued Statement of Financial Accounting Standard No. 157, “Fair Value Measurements” (“SFAS 157”). This statement defines fair value as used in numerous accounting pronouncements, establishes a framework for measuring fair value in generally accepted accounting principles (“GAAP”) and expands disclosure related to the use of fair value measures in financial statements. SFAS 157 does not expand the use of fair value measures in financial statements, but standardizes its definition and guidance in GAAP. SFAS 157 is effective for fiscal years beginning after November 15, 2008 for nonfinancial assets and liabilities. We will adopt the provisions of SFAS 157 on January 1, 2009. We have evaluated SFAS 157 and do not anticipate that it will have an impact on our financial statements when adopted.
In February 2007, the Financial Accounting Standards Board issued Statement of Financial Accounting Standard No. 159, “Fair Value Option for Financial Assets and Financial Liabilities” (“SFAS 159”). This statement permits entities to elect to measure many financial instruments and certain other items at fair value and also amends SFAS 115, “Accounting for Certain Investments in Debt and Equity Securities”. SFAS 159 is effective for fiscal years beginning after November 15, 2007. We will adopt the provisions of SFAS 159 on January 1, 2008. We have evaluated SFAS 159 and do not anticipate that it will have an impact on our financial statements when adopted.
Results of Operations for Each of the Years Ended December 31, 2007, 2006 and 2005
Revenues
Revenue for the year ended December 31, 2007 of approximately $284,000 represented revenue from services provided to ITT under the engineering services agreement entered into in May 2007. These services included analysis and evaluation of architectural design alternatives for incorporation of our d2p technology into RF circuits based on various product specifications provided by ITT.
ITT is utilizing that information to establish their product development plans for incorporation of the d2p technology. We anticipate that ITT will select a product development program that utilizes their internal resources, as needed, to design circuits based on our existing commercial prototype designs. As such, we currently do not anticipate any significant engineering services revenue from ITT during their initial product design cycle. We believe utilization of our commercial prototype designs will enable a faster product launch for ITT than would be expected if they had selected a program that involved a fully customized d2p design. We also continue to be engaged with ITT in reviewing various longer term product applications for our technology.
Based on the established royalty rates and other contract terms, as well as our understanding of ITT’s product plans, we currently estimate that we will achieve cumulative royalties under our agreement with ITT of approximately $25 million.
We also anticipate that royalties from our mobile handset chip customer will range from approximately $5 million to $10 million in the first full year of shipments depending upon the customer’s product mix and unit volume as well as the timing of incorporation of the d2d receiver technology into products. We also believe the opportunity exists to significantly expand our royalty revenue from this customer based on the expected growth of the market in which their products are targeted, additional product applications for our technology which are contemplated in the agreement and our customer’s ability to capture greater share of market for their products. We believe the initial ICs incorporating our technology will be completed in late 2008. We will collect royalties upon the sale of chipsets by our customer to the mobile handset providers who will then incorporate the chipset into mobile products.
We believe we will achieve additional design wins in the mobile handset market which will expand our future revenue opportunities both for royalties and engineering services.
We had no revenues for the year ended December 31, 2006 and our 2005 product revenue of approximately $996,000 represented revenue from sales of wireless consumer products through retail channels. Revenue for the period ended December 31, 2005 was net of an allowance (recovery) for sales returns of approximately $(80,000). Gross revenue was also reduced for price protection programs, customer rebates and cooperative marketing costs deemed to be sales incentives under Emerging Issues Task Force, (EITF) Issue 01-09, to derive net revenue. Revenue for the year ended December 31, 2005 included cooperative marketing costs of approximately $30,000.
Gross Margin
The gross margins for products and services for the years ended December 31, 2007 and 2005 were as follows:
| | | 2007 | | 2005 | |
| Engineering services | | $ | 32,361 | | $ | 0 | |
| Products | | | 0 | | | (2,040,823 | ) |
| Total | | $ | 32,361 | | $ | (2,040,823 | ) |
Our gross margin in 2007 is approximately 11% of service revenue and represents margin on services provided to ITT. Cost of sales for engineering services includes the direct labor costs of engineering staff, as well as depreciation, amortization and allocated facilities costs. Indirect costs are generally allocated to cost of sales based on a percentage of the labor hours incurred for customer design support. Allocated indirect costs represent approximately 38-40% of the total cost of sales. We expect that future margin on engineering services will vary based on the experience level of the engineers providing services, the operating costs of the research and development organization as a whole, and the number of service agreements over which the indirect costs are allocated.
Our product margin in 2005 reflects a write down of inventory to net realizable value of approximately $2.3 million. This write down was a result of our exit from retail activities in the second quarter of 2005, resulting in a mark down of remaining product inventory to estimated wholesale values.
Research and Development Expenses
Our research and development expenses increased by approximately $1.2 million, or 12%, from 2006 to 2007, and decreased by approximately $0.8 million, or 7% from 2005 to 2006.
The increase in research and development expenses from 2006 to 2007 was primarily due to increases in personnel costs, design consulting fees, equipment rental, and prototype chip production costs, offset
somewhat by decreases in depreciation expense. Personnel and related costs increased approximately $640,000 due to the addition of personnel, compensation increases for existing engineering staff and increases in performance bonuses earned in 2007 over 2006. Outside engineering design consulting increased approximately $550,000 from 2006 to 2007 due to increased use of outside design services to supplement in-house engineering resources, offset by the expiration of a stock-based consulting agreement which reduced stock-based compensation expense. Equipment rental expense increased approximately $90,000 from 2006 to 2007 due to increased rental of test and development equipment under operating leases allowing a reduction in capital expenditures for required equipment. Prototype chip production costs increased approximately $70,000 from 2006 to 2007. We maintain a fairly regular cycle of prototype chip runs; however, the fabrication costs vary based on the materials specified and the number of variants requested on each run. These increases were somewhat offset by a decrease in depreciation expense of approximately $80,000 from 2006 to 2007 as certain engineering assets became fully depreciated.
The decrease in research and development expenses from 2005 to 2006 was a result of cost reductions following the 2005 retail exit including a reduction in retail product development personnel and related costs of approximately $1.8 million and a reduction in depreciation and amortization of retail related assets of approximately $0.9 million. These decreases were offset by increases in expenses for the use of outside design firms of approximately $1.0 million, increases in employee stock compensation expense due the adoption of “FAS123R” of approximately $0.7 million, and increases in prototype costs of approximately $220,000 stemming from increases in the number of prototype chip production runs.
The markets for our products and technologies are characterized by rapidly changing technology, evolving industry standards and frequent new product introductions. Our ability to successfully develop and introduce, on a timely basis, new and enhanced products and technologies will be a significant factor in our ability to grow and remain competitive. Although the percentage of revenues invested in our research and development programs may vary from period to period, we are committed to continue investing in our technology development. We anticipate that we will use a substantial portion of our working capital for research and development activities in 2008.
Marketing and Selling Expenses
Marketing and selling expenses increased by approximately $0.6 million or 27%, from 2006 to 2007 and decreased by approximately $1.0 million, or 33%, from 2005 to 2006.
The increase in marketing and selling expenses from 2006 to 2007 was primarily due to increases in personnel costs, outside consulting and other professional fees and employee stock-based compensation expense. Personnel costs increased approximately $230,000 due to increases in personnel late in 2006, compensation increases for existing employees and increases in performance bonuses earned from 2006 to 2007. Outside consulting and other professional fees increased approximately $280,000 from 2006 to 2007 due to the use of consultants for expansion of network carrier and other potential customer relationships and legal fees incurred in relation to initial licensing agreements. Employee related stock-based compensation expense increased approximately $60,000 due to additional stock based awards for sales and marketing employees.
The decrease in marketing and selling expenses from 2005 to 2006 was primarily due to cost reductions in personnel and related costs of approximately $670,000 and reduced retail promotional costs of approximately $540,000 following the 2005 exit from retail business activities. These cost reductions were partially offset by an increase in employee stock compensation expense of approximately $320,000 following the adoption of “FAS123R.”
We are committed to continuing our investment in marketing and selling efforts in order to continue to increase market awareness and penetration of our products and technologies, although we do not anticipate any significant increases in overall sales and marketing expenses in 2008.
General and Administrative Expenses
General and administrative expenses consist primarily of executive, finance and administrative personnel costs and costs incurred for insurance, shareholder relations and outside professional services. Our general and administrative expenses increased by approximately $0.5 million, or 9%, from 2006 to 2007 and decreased by approximately $0.8 million or 13% from 2005 to 2006.
The increase in general and administrative expenses from 2006 to 2007 is due to increases in personnel costs and employee stock-based compensation, offset partially by decreases in insurance costs. Personnel costs increased approximately $340,000 from 2006 to 2007 primarily due to an increase of approximately $290,000 in performance bonuses earned in 2007 over 2006. These bonuses were largely paid through the issuance of stock awards to our chief executive officer and chief financial officer in early 2008. Employee stock-based compensation expense increased approximately $250,000 from 2006 to 2007 due largely to the fair value expense related to long term incentive awards for our executive officers in 2006 and 2007. The cost of our directors’ and officers’ liability insurance decreased by approximately $110,000 from 2006 to 2007 due to general market conditions. In addition, consulting and other professional fees, including stock-based consulting fees, decreased approximately $50,000 from 2006 to 2007. This decrease is primarily the result of increases in accounting and consulting fees related to our financial accounting system conversion in 2007 offset by a decrease in stock-based consulting fees primarily from a consulting agreement that expired in 2006.
The reduction in general and administrative costs from 2005 to 2006 is due to a reduction in personnel costs of approximately $470,000 stemming from staff reductions as well as the movement of certain senior management personnel to different areas of supervision. We had a reduction in bad debt expense of approximately $140,000 following the exit from retail, a reduction in share-based consulting fees of approximately $680,000, and a reduction in professional fees of approximately $310,000 from both legal and accounting fees. These reductions were partially offset by increases in employee and director stock compensation expense of approximately $860,000 following the adoption of “FAS123R.”
Impairment Loss and Loss (Gain) on Disposal of Equipment
For the years ended December 31, 2007 and 2006, we recognized an insignificant loss and gain, respectively, on the loss and/or disposal of assets.
For 2005, we recognized impairment charges on certain long-lived assets related to the exit of our retail activities. These charges include impairment of prepaid license fees of approximately $660,000, impairment of other intangible assets of approximately $580,000 and impairment of fixed assets, primarily the manufacturing and prototype facility assets, of approximately $630,000.
Interest Income and Other
Interest income and other consist of interest earned on our investments, net gains recognized on the sale of investments, and other miscellaneous income and expense. Interest income and other decreased approximately $0.2 million from 2006 to 2007 and increased approximately $0.7 million from 2005 to 2006. The decrease in interest income and other from 2006 to 2007 is primarily due to a reduction in miscellaneous income of approximately $110,000. The increase in interest and other income from 2005 to 2006 is primarily due to higher interest rates and higher average cash balances in 2006.
Loss and Loss per Common Share
Our net loss increased by approximately $2.4 million or $0.06 per common share from 2006 to 2007, and decreased by approximately $7.3 million or $0.46 per common share from 2005 to 2006. The increase in net loss from 2006 to 2007 is primarily due to a $2.3 million or 13% increase in operating expenses. The decrease in net loss from 2005 to 2006 is primarily due to a $4.5 million decrease in operating expenses from 2005 to 2006 as a result of our exit from retail business activities in 2005, as well as the $2.3 million
inventory impairment charge incurred in 2005.
Liquidity and Capital Resources
At December 31, 2007, we had working capital of approximately $12.6 million including approximately $13.4 million in cash and cash equivalents. For the year ended December 31, 2007, our cash and cash equivalents increased by $0.2 million. This increase is a result of approximately $8.4 million in proceeds from a February 2007 sale of equity securities and approximately $6.7 million received from the exercise of approximately 800,000 options and warrants in 2007, offset by the use of approximately $13.5 million in cash for operating activities and approximately $1.4 million for the purchase of property and equipment and for payment of patent costs in 2007.
For the year ended December 31, 2006, our cash and cash equivalents increased approximately $3.0 million as a result of $16.2 million in proceeds from the sale of equity securities, $0.2 million received from the exercise of options and warrants, and $0.3 million in proceeds from the maturity of investments, offset by $11.4 million of cash used for operations and an additional $2.4 million used for the purchase of property and equipment and for payment of patent costs.
For the year ended December 31, 2005, our cash and cash equivalents increased approximately $3.8 million as a result of $20.1 million in proceeds from the sale of equity securities, $0.4 million received from the exercise of options and warrants, and $1.0 million in proceeds from the maturity of investments, offset by $15.7 million of cash used for operations and an additional $2.0 million used for the purchase of property and equipment and for payment of patent costs.
At December 31, 2007, we were not subject to any significant commitments to make additional capital expenditures.
Our future business plans call for continued investment in sales, marketing, customer support and product development for our technologies and products. Our ability to generate revenues sufficient to offset costs is subject to our ability to successfully support our customers in completing their initial product designs incorporating our technologies and our ability to expand our market opportunities through additional product offerings with our current customers and/or the addition of new customers such that we are able to secure a reasonable share of the market. We do not expect that revenue for 2008 will be sufficient to cover our operational expenses for 2008. The expected continued losses and use of cash will continue to be funded from available working capital.
On March 5, 2008, we completed the sale of 1,240,199 shares of common stock in a private placement transaction for net proceeds of approximately $9.0 million. We plan to use these proceeds, together with the $13.4 million in cash and cash equivalents at December 31, 2007, to fund our future business plans. We believe that our current capital resources together with the proceeds of the March 2008 equity financing will be sufficient to support our liquidity requirements at least through the first quarter of 2009. The long-term continuation of our business plans is dependent upon generation of sufficient revenues from our technologies to offset expenses. In the event that we do not generate sufficient revenues, we will be required to obtain additional funding through public or private financing and/or reduce certain discretionary spending. Management believes certain operating costs could be reduced if working capital decreases significantly and additional funding is not available. In addition, we currently have no outstanding long-term debt obligations. Failure to generate sufficient revenues, raise additional capital and/or reduce certain discretionary spending could have a material adverse effect on our ability to achieve our intended long-term business objectives.
Off-Balance Sheet Transactions, Arrangements and Other Relationships; Contractual Obligations
As of December 31, 2007, we have outstanding warrants to purchase 1,814,528 shares of common stock that were issued in connection with the sale of equity securities in various private placement transactions in 2000, 2001, 2005 and 2006. These warrants have exercise prices ranging from $8.50 to $56.66 per share with a weighted average exercise price of $31.27 and a weighted average remaining contractual life of 3.4 years.
The estimated fair value of these warrants at their date of issuance of $17,492,097 is included in shareholders’ equity in our consolidated balance sheets. During the year ended December 31, 2007, warrants to purchase 641,208 shares of common stock were exercised at a weighted average exercise price of $8.64, resulting in proceeds of approximately $5.5 million. Refer to “Non Plan Options/Warrants” in Note 8 to the consolidated financial statements included in Item 8 for information regarding the outstanding warrants.
Our contractual obligations and commercial commitments at December 31, 2007 were as follows (see “Lease Commitments” in Note 11 to the consolidated financial statements included in Item 8):
| | | Payments due by period | |
Contractual Obligations: | | | Total | | | 1 year or less | | | 2-3 years | | | 4 - 5 years | | | After 5 years | |
| Operating leases | | $ | 1,979,000 | | $ | 650,000 | | $ | 1,087,000 | | $ | 242,000 | | $ | 0 | |
Item 7A. Quantitative and Qualitative Disclosures about Market Risk.
None.
Item 8. Consolidated Financial Statements and Supplementary Data
Index to Consolidated Financial Statements
| | Page |
| | |
| REPORT OF INDEPENDENT REGISTERED CERTIFIED PUBLIC ACCOUNTING FIRM | 23 |
| | |
| CONSOLIDATED FINANCIAL STATEMENTS: | |
| | |
| Consolidated Balance Sheets - December 31, 2007 and 2006 | 25 |
| | |
| Consolidated Statements of Operations - for the years ended December 31, 2007, 2006 and 2005 | 26 |
| | |
| Consolidated Statements of Shareholders’ Equity - for the years ended December 31, 2007, 2006 and 2005 | 27 |
| | |
| Consolidated Statements of Cash Flows - for the years ended December 31, 2007, 2006 and 2005 | 29 |
| | |
| Notes to Consolidated Financial Statements - December 31, 2007, 2006 and 2005 | 30 |
| | |
| FINANCIAL STATEMENT SCHEDULE: | |
| | |
Schedule II – Valuation and Qualifying Accounts | 69 |
| | |
| Schedules other than those listed have been omitted since they are either not required, not applicable or the information is otherwise included. | |
Report of Independent Registered Certified Public Accounting Firm
To the Board of Directors and Shareholders of ParkerVision, Inc.:
In our opinion, the consolidated financial statements listed in the accompanying index present fairly, in all material respects, the financial position of ParkerVision, Inc. and its subsidiary at December 31, 2007 and December 31, 2006, and the results of their operations and their cash flows for each of the three years in the period ended December 31, 2007 in conformity with accounting principles generally accepted in the United States of America. In addition, in our opinion, the financial statement schedule listed in the accompanying index presents fairly, in all material respects, the information set forth therein when read in conjunction with the related consolidated financial statements. Also in our opinion, the Company maintained, in all material respects, effective internal control over financial reporting as of December 31, 2007, based on criteria established in Internal Control - Integrated Framework issued by the Committee of Sponsoring Organizations of the Treadway Commission (“COSO”). The Company’s management is responsible for these financial statements and financial statement schedule, for maintaining effective internal control over financial reporting and for its assessment of the effectiveness of internal control over financial reporting, included in Management’s Report on Internal Control over Financial Reporting included under Item 9A. Our responsibility is to express opinions on these financial statements, on the financial statement schedule, and on the Company’s internal control over financial reporting based on our integrated audits. We conducted our audits in accordance with the standards of the Public Company Accounting Oversight Board (United States). Those standards require that we plan and perform the audits to obtain reasonable assurance about whether the financial statements are free of material misstatement and whether effective internal control over financial reporting was maintained in all material respects. Our audits of the financial statements included examining, on a test basis, evidence supporting the amounts and disclosures in the financial statements, assessing the accounting principles used and significant estimates made by management, and evaluating the overall financial statement presentation. Our audit of internal control over financial reporting included obtaining an understanding of internal control over financial reporting, assessing the risk that a material weakness exists, and testing and evaluating the design and operating effectiveness of internal control based on the assessed risk. Our audits also included performing such other procedures as we considered necessary in the circumstances. We believe that our audits provide a reasonable basis for our opinions.
As discussed in Note 7 to the consolidated financial statements, the Company changed the manner in which it accounts uncertain tax positions in 2007. As discussed in Note 8 to the consolidated financial statements, the Company changed the manner in which it accounts for share-based compensation in 2006.
A company’s internal control over financial reporting is a process designed to provide reasonable assurance regarding the reliability of financial reporting and the preparation of financial statements for external purposes in accordance with generally accepted accounting principles. A company’s internal control over financial reporting includes those policies and procedures that (i) pertain to the maintenance of records that, in reasonable detail, accurately and fairly reflect the transactions and dispositions of the assets of the company; (ii) provide reasonable assurance that transactions are recorded as necessary to permit preparation of financial statements in accordance with generally accepted accounting principles, and that receipts and expenditures of the company are being made only in accordance with authorizations of management and directors of the company; and (iii) provide reasonable assurance regarding prevention or timely detection of unauthorized acquisition, use, or disposition of the company’s assets that could have a material effect on the
financial statements.
Because of its inherent limitations, internal control over financial reporting may not prevent or detect misstatements. Also, projections of any evaluation of effectiveness to future periods are subject to the risk that controls may become inadequate because of changes in conditions, or that the degree of compliance with the policies or procedures may deteriorate.
PricewaterhouseCoopers LLP
Jacksonville, Florida
March 17, 2008
PARKERVISION, INC. AND SUBSIDIARY
CONSOLIDATED BALANCE SHEETS
DECEMBER 31, 2007 AND 2006
| | | 2007 | | 2006 | |
| CURRENT ASSETS: | | | | | | | |
| | | | | | | | |
| Cash and cash equivalents | | $ | 13,400,832 | | $ | 13,225,528 | |
| Prepaid expenses | | | 957,252 | | | 1,025,132 | |
| Other current assets | | | 71,700 | | | 121,903 | |
| Total current assets | | | 14,429,784 | | | 14,372,563 | |
| | | | | | | | |
| PROPERTY AND EQUIPMENT, net | | | 1,827,880 | | | 2,094,300 | |
| | | | | | | | |
OTHER ASSETS, net | | | 10,318,893 | | | 10,208,484 | |
| Total assets | | $ | 26,576,557 | | $ | 26,675,347 | |
| | | | | | | | |
| CURRENT LIABILITIES: | | | | | | | |
| Accounts payable | | $ | 393,225 | | $ | 382,489 | |
| Accrued expenses: | | | | | | | |
| Salaries and wages | | | 691,249 | | | 328,817 | |
| Professional fees | | | 360,713 | | | 231,372 | |
| Other accrued expenses | | | 373,184 | | | 116,713 | |
| Total current liabilities | | | 1,818,371 | | | 1,059,391 | |
| | | | | | | | |
| DEFERRED RENT | | | 343,747 | | | 433,340 | |
| Total liabilities | | | 2,162,118 | | | 1,492,731 | |
| | | | | | | | |
COMMITMENTS AND CONTINGENCIES (Notes 8, 9 and 11) | | | | | | | |
| | | | | | | | |
| SHAREHOLDERS' EQUITY: | | | | | | | |
| | | | | | | | |
| Common stock, $.01 par value, 100,000,000 shares authorized, 25,182,892 and 23,387,566 shares issued and outstanding at December 31, 2007 and 2006, respectively | | | 251,829 | | | 233,876 | |
| Warrants outstanding | | | 17,492,097 | | | 20,290,878 | |
| Additional paid-in capital | | | 174,282,736 | | | 154,056,663 | |
| Accumulated deficit | | | (167,612,223 | ) | | (149,398,801 | ) |
| Total shareholders' equity | | | 24,414,439 | | | 25,182,616 | |
| Total liabilities and shareholders' equity | | $ | 26,576,557 | | $ | 26,675,347 | |
The accompanying notes are an integral part of these consolidated financial statements.
PARKERVISION, INC. AND SUBSIDIARY
CONSOLIDATED STATEMENTS OF OPERATIONS
FOR THE YEARS ENDED DECEMBER 31, 2007, 2006 AND 2005
| | | 2007 | | 2006 | | 2005 | |
| | | | | | | | |
| Product revenue | | $ | 0 | | $ | 0 | | $ | 995,991 | |
| Engineering services revenue | | | 283,675 | | | 0 | | | 0 | |
| Net revenues | | | 283,675 | | | 0 | | | 995,991 | |
| | | | | | | | | | | |
| Cost of sales | | | 251,314 | | | 0 | | | 786,228 | |
| Write down of inventory to net realizable value | | | 0 | | | 0 | | | 2,250,586 | |
| | | | | | | | | | | |
| Gross margin | | | 32,361 | | | 0 | | | (2,040,823 | ) |
| | | | | | | | | | | |
| Research and development expenses | | | 10,700,181 | | | 9,521,194 | | | 10,284,305 | |
| Marketing and selling expenses | | | 2,692,887 | | | 2,117,827 | | | 3,141,187 | |
| General and administrative expenses | | | 5,711,276 | | | 5,232,652 | | | 6,037,796 | |
| Impairment loss and loss (gain) on disposal of equipment | | | 17,860 | | | (5,191 | ) | | 1,899,066 | |
| Total operating expenses | | | 19,122,204 | | | 16,866,482 | | | 21,362,354 | |
| | | | | | | | | | | |
| Interest income and other | | | 876,421 | | | 1,050,824 | | | 303,729 | |
| | | | | | | | | | | |
| Net loss | | | (18,213,422 | ) | | (15,815,658 | ) | | (23,099,448 | ) |
| | | | | | | | | | | |
| Unrealized gain (loss) on investment securities | | | 0 | | | 1,006 | | | (579 | ) |
| | | | | | | | | | | |
| Comprehensive loss | | $ | (18,213,422 | ) | $ | (15,814,652 | ) | $ | (23,100,027 | ) |
| | | | | | | | | | | |
| Basic and diluted net loss per common share | | $ | (0.74 | ) | $ | (0.68 | ) | $ | (1.14 | ) |
The accompanying notes are an integral part of these consolidated financial statements.
PARKERVISION, INC. AND SUBSIDIARY
CONSOLIDATED STATEMENTS OF SHAREHOLDERS' EQUITY
FOR THE YEARS ENDED DECEMBER 31, 2007, 2006 AND 2005
| | | 2007 | | 2006 | | 2005 | |
Common shares – beginning of year | | | 23,387,566 | | | 20,958,765 | | | 18,006,324 | |
| Issuance of common stock upon exercise of options and warrants | | | 802,885 | | | 39,250 | | | 63,900 | |
| Issuance of restricted common stock as employee compensation | | | 0 | | | 5,089 | | | 0 | |
| Issuance of common stock in private offering | | | 992,441 | | | 2,373,335 | | | 2,880,000 | |
| Issuance of common stock as payment for services | | | 0 | | | 11,127 | | | 8,541 | |
Common shares – end of year | | | 25,182,892 | | | 23,387,566 | | | 20,958,765 | |
| | | | | | | | | | | |
Par value of common stock – beginning of year | | $ | 233,876 | | $ | 209,588 | | $ | 180,063 | |
| Issuance of common stock upon exercise of options and warrants | | | 8,029 | | | 393 | | | 640 | |
| Issuance of restricted common stock as employee compensation | | | 0 | | | 51 | | | 0 | |
| Issuance of common stock in private offering | | | 9,924 | | | 23,733 | | | 28,800 | |
| Issuance of common stock as payment for services | | | 0 | | | 111 | | | 85 | |
Par value of common stock – end of year | | $ | 251,829 | | $ | 233,876 | | $ | 209,588 | |
| | | | | | | | | | | |
Warrants outstanding – beginning of year | | $ | 20,290,878 | | $ | 17,693,482 | | $ | 14,573,705 | |
| Issuance of warrants in connection with private offering | | | 0 | | | 2,597,396 | | | 3,119,777 | |
| Exercise of warrants | | | (2,798,781 | ) | | 0 | | | 0 | |
Warrants outstanding – end of year | | $ | 17,492,097 | | $ | 20,290,878 | | $ | 17,693,482 | |
| | | | | | | | | | | |
Additional paid-in capital – beginning of year | | $ | 154,056,663 | | $ | 138,080,663 | | $ | 120,488,205 | |
| Issuance of common stock upon exercise of options and warrants | | | 9,534,984 | | | 239,642 | | | 425,539 | |
| Issuance of restricted common stock as employee compensation | | | 0 | | | 50,228 | | | 0 | |
| Issuance of common stock in private offering | | | 8,390,324 | | | 13,625,721 | | | 16,967,923 | |
| Issuance of common stock as payment for services | | | 0 | | | 164,313 | | | 198,996 | |
| Stock-based compensation expense | | | 2,300,765 | | | 1,896,096 | | | 0 | |
Additional paid-in capital – end of year | | $ | 174,282,736 | | $ | 154,056,663 | | $ | 138,080,663 | |
The accompanying notes are an integral part of these consolidated financial statements.
PARKERVISION, INC. AND SUBSIDIARY
CONSOLIDATED STATEMENTS OF SHAREHOLDERS' EQUITY
FOR THE YEARS ENDED DECEMBER 31, 2007, 2006 AND 2005
| | | 2007 | | 2006 | | 2005 | |
Accumulated other comprehensive loss – beginning of year | | $ | 0 | | $ | (1,006 | ) | $ | (427 | ) |
| Change in unrealized gain (loss) on investments | | | 0 | | | 1,006 | | | (579 | ) |
Accumulated other comprehensive loss – end of year | | $ | 0 | | $ | 0 | | $ | (1,006 | ) |
| | | | | | | | | | | |
Accumulated deficit – beginning of year | | $ | (149,398,801 | ) | $ | (133,583,143 | ) | $ | (110,483,695 | ) |
| Net loss | | | (18,213,422 | ) | | (15,815,658 | ) | | (23,099,448 | ) |
Accumulated deficit – end of year | | $ | (167,612,223 | ) | $ | (149,398,801 | ) | $ | (133,583,143 | ) |
| | | | | | | | | | | |
Total shareholders’ equity – beginning of year | | $ | 25,182,616 | | $ | 22,399,584 | | $ | 24,757,851 | |
| Issuance of common stock upon exercise of options and warrants | | | 6,744,232 | | | 240,035 | | | 426,179 | |
| Issuance of restricted common stock as employee compensation | | | 0 | | | 50,279 | | | 0 | |
| Issuance of common stock and warrants in private offering | | | 8,400,248 | | | 16,246,850 | | | 20,116,500 | |
| Issuance of common stock as payment for services | | | 0 | | | 164,424 | | | 199,081 | |
| Stock-based compensation expense | | | 2,300,765 | | | 1,896,096 | | | 0 | |
| Comprehensive loss | | | (18,213,422 | ) | | (15,814,652 | ) | | (23,100,027 | ) |
Total shareholders’ equity – end of year | | $ | 24,414,439 | | $ | 25,182,616 | | $ | 22,399,584 | |
The accompanying notes are an integral part of these consolidated financial statements.
PARKERVISION, INC. AND SUBSIDIARY
CONSOLIDATED STATEMENTS OF CASH FLOWS
FOR THE YEARS ENDED DECEMBER 31, 2007, 2006 and 2005
| | | 2007 | | 2006 | | 2005 | |
| CASH FLOWS FROM OPERATING ACTIVITIES: | | | | | | | | | | |
| Net loss | | $ | (18,213,422 | ) | $ | (15,815,658 | ) | $ | (23,099,448 | ) |
| Adjustments to reconcile net loss to net cash used in operating activities: | | | | | | | | | | |
| Depreciation and amortization | | | 1,649,014 | | | 1,690,497 | | | 2,460,324 | |
| Amortization of premium on investments | | | 0 | | | 1,561 | | | 27,437 | |
| Provision for obsolete inventories | | | 0 | | | 0 | | | 67,940 | |
| Write-down of inventory to net realizable value | | | 0 | | | 0 | | | 2,250,586 | |
| Impairment loss on other assets | | | 0 | | | 0 | | | 1,245,792 | |
| Stock compensation | | | 2,327,522 | | | 2,350,853 | | | 940,783 | |
| Loss (gain) on sale of equipment | | | 17,860 | | | (5,191 | ) | | 653,702 | |
| Changes in operating assets and liabilities: | | | | | | | | | | |
| Accounts receivable, net | | | 0 | | | 14,854 | | | 295,546 | |
| Inventories | | | 0 | | | 0 | | | 307,237 | |
| Prepaid and other assets | | | 8,212 | | | 150,630 | | | 1,073,908 | |
| Accounts payable and accrued expenses | | | 750,663 | | | (348,400 | ) | | (1,483,338 | ) |
| Deferred revenue | | | 0 | | | 0 | | | (407,403 | ) |
| Deferred rent | | | (81,276 | ) | | 515,751 | | | 0 | |
| Total adjustments | | | 4,671,995 | | | 4,370,555 | | | 7,432,514 | |
| Net cash used in operating activities | | | (13,541,427 | ) | | (11,445,103 | ) | | (15,666,934 | ) |
| | | | | | | | | | | |
| CASH FLOWS FROM INVESTING ACTIVITIES: | | | | | | | | | | |
| Purchase of investments available for sale | | | 0 | | | 0 | | | (250,000 | ) |
| Proceeds from maturity/sale of investments | | | 0 | | | 295,000 | | | 1,290,000 | |
| Proceeds from sale of property and equipment | | | 0 | | | 36,867 | | | 273,874 | |
| Purchase of property and equipment | | | (469,916 | ) | | (1,087,889 | ) | | (744,043 | ) |
| Payment for patent costs | | | (957,833 | ) | | (1,333,868 | ) | | (1,606,842 | ) |
| Net cash used in investing activities | | | (1,427,749 | ) | | (2,089,890 | ) | | (1,037,011 | ) |
| | | | | | | | | | | |
| CASH FLOWS FROM FINANCING ACTIVITIES: | | | | | | | | | | |
| Net proceeds from issuance of common stock in private offering | | | 8,400,248 | | | 16,246,850 | | | 20,116,500 | |
| Proceeds from exercise of options and warrants | | | 6,744,232 | | | 240,036 | | | 426,179 | |
| Net cash provided by financing activities | | | 15,144,480 | | | 16,486,886 | | | 20,542,679 | |
| | | | | | | | | | | |
| NET CHANGE IN CASH AND CASH EQUIVALENTS | | | 175,304 | | | 2,951,893 | | | 3,838,734 | |
| | | | | | | | | | | |
| CASH AND CASH EQUIVALENTS, beginning of year | | | 13,225,528 | | | 10,273,635 | | | 6,434,901 | |
| | | | | | | | | | | |
| CASH AND CASH EQUIVALENTS, end of year | | $ | 13,400,832 | | $ | 13,225,528 | | $ | 10,273,635 | |
The accompanying notes are an integral part of these consolidated financial statements.
PARKERVISION, INC. AND SUBSIDIARY
NOTES TO CONSOLIDATED FINANCIAL STATEMENTS
DECEMBER 31, 2007, 2006 and 2005
1. THE COMPANY AND NATURE OF BUSINESS
ParkerVision, Inc. (the "Company”, “ParkerVision”, or “we”) was incorporated under the laws of the state of Florida on August 22, 1989 and operates in a single segment - wireless technologies and products.
In May 2007, we executed an Engineering Services Agreement and a Licensing Agreement with ITT Corporation (“ITT”) for the design and use of our d2p technology in applications worldwide. Under the agreements, we will be paid royalties on a per unit basis for products sold by ITT that incorporate our d2p technology. We are also providing engineering consulting and design services to ITT on a time and materials basis, to the extent necessary, for the development of products using our technology.
In December 2007, we entered into a Licensing and Engineering Services Agreement with a mobile handset chip supplier for the design and use of our d2p and d2d technologies in chipsets initially targeted for the 3G mobile handset market worldwide. Under the terms of the agreement, we will be paid royalties on a per unit basis for chipsets sold which incorporate one or both of our RF technologies.
2. LIQUIDITY AND CAPITAL RESOURCES
We operate in a highly competitive industry with rapidly changing and evolving technologies and an increasing number of market entrants and our potential competitors have substantially greater financial, technical and other resources. We have made significant investments in developing our technologies and products, the returns on which are dependent upon the generation of future revenues for realization.
We have incurred losses from operations and negative cash flows in every year since inception and have utilized the proceeds from the sale of our equity securities to fund operations. For the year ended December 31, 2007, we incurred a net loss of approximately $18.2 million and negative cash flows from operations of approximately $13.5 million. At December 31, 2007, we had an accumulated deficit of approximately $167.6 million and working capital of approximately $12.6 million.
We do not expect that revenues in 2008 will be sufficient to offset the expenses from continued investment in product development and marketing activities. Therefore, we expect operating losses and negative cash flows to continue in 2008 and possibly beyond.
On March 5, 2008, we completed the sale of an aggregate of 1,240,199 shares of our common stock to a limited number of domestic institutional and other investors in a private placement transaction pursuant to an offering exemption under the Securities Act of 1933. The shares represent 4.7% of our outstanding common stock on an after-issued basis. 1,110,999 shares were sold at a price of $7.50 per share, and 129,200 shares were sold to Mr. Jeffrey Parker, our chief executive officer and chairman, at $7.74 per share. The net proceeds from this transaction of approximately $9 million will be used for general working capital purposes.
The long-term continuation of our business plan is dependent upon the generation of sufficient revenues from our technologies and products to offset expenses. In the event that we do not generate sufficient revenues, we will be required to obtain additional funding through public or private financing and/or reduce certain discretionary spending. Management believes certain operating costs could be reduced if working capital decreases significantly and additional funding is not available. In addition, we currently have no outstanding long-term debt obligations. Failure to generate sufficient revenues, raise additional capital and/or reduce certain discretionary spending could have a material adverse effect on our ability to meet our future liquidity needs and achieve our intended long-term business objectives.
3. SUMMARY OF SIGNIFICANT ACCOUNTING POLICIES
Basis of Consolidation
ParkerVision formed a wholly owned subsidiary, D2D, LLC on October 2, 2000. The consolidated financial statements include the accounts of ParkerVision, Inc. and D2D, LLC, after elimination of all significant inter-company transactions and balances.
Basis of Presentation
Certain reclassifications have been made to the 2006 and 2005 consolidated financial statements in order to conform to the 2007 presentation.
Use of Estimates in the Preparation of Financial Statements
The preparation of financial statements in conformity with generally accepted accounting principles requires management to make estimates and assumptions that affect the reported amounts of assets and liabilities at the date of the financial statements and the reported amounts of revenues and expenses during the reporting periods. The more significant estimates made by management include the volatility, risk-free interest rate, forfeiture rate and estimated lives of share-based awards used in the estimate of the fair market value of share-based compensation, the assessment of recoverability of long-lived assets and amortization period for intangible and long-lived assets, and the valuation allowance for deferred taxes. Actual results could differ from the estimates made. Management periodically evaluates estimates used in the preparation of the consolidated financial statements for continued reasonableness. Appropriate adjustments, if any, to the estimates used are made prospectively based upon such periodic evaluation.
Cash and Cash Equivalents
For purposes of reporting cash flows, we consider cash and cash equivalents to include cash on hand, interest-bearing deposits, overnight repurchase agreements and investments with original maturities of three months or less when purchased.
Property and Equipment
Property and equipment are stated at cost, less accumulated depreciation. Depreciation is determined using the straight-line method over the following estimated useful lives:
| Manufacturing and office equipment | | 5-7 years |
| Leasehold improvements | | Remaining life of lease |
| Aircraft | | 20 years |
| Furniture and fixtures | | 7 years |
| Computer equipment and software | | 3-5 years |
The cost and accumulated depreciation of assets sold or retired are removed from their respective accounts, and any resulting net gain or loss is recognized in the accompanying consolidated statements of operations. The carrying value of long-lived assets is reviewed on a regular basis for the existence of facts, both internally and externally, that may suggest impairment. Recoverability of assets to be held and used is measured by comparing the carrying amount of an asset to the estimated undiscounted future cash flows expected to be generated by the asset. If the carrying amount of the assets exceeds its estimated undiscounted future net cash flows, an impairment charge is recognized in the amount by which the carrying amount of the asset exceeds the fair value of the assets.
Intangible Assets
Patents, copyrights and other intangible assets are amortized using the straight-line method over their estimated period of benefit, ranging from three to twenty years. Management evaluates the recoverability of intangible assets periodically and takes into account events or circumstances that warrant revised estimates of useful lives or that indicate impairment exists.
Accounting for Stock Based Compensation
Effective January 1, 2006, we adopted the provisions of Statement of Financial Accounting Standards (“SFAS”) No. 123R, “Share-Based Payment,” (“FAS 123R”) which establishes accounting for equity instruments exchanged for employee services. Under the provisions of FAS 123R, share-based compensation cost is measured at the grant date, based on the calculated fair value of the award, and is recognized as an expense on a straight-line basis over the employee’s requisite service period (generally the vesting period of the equity grant). In March 2005, the Securities and Exchange Commission issued Staff Accounting Bulletin No. 107 (“SAB 107”) relating to FAS 123R. We have applied the provisions of SAB 107 in our adoption of FAS 123R.
Prior to January 1, 2006, we accounted for share-based compensation to employees in accordance with Accounting Principles Board Opinion (“APB”) No. 25, “Accounting for Stock Issued to Employees,” and related interpretations. We also followed the disclosure requirements of SFAS No. 123, “Accounting for Stock-Based Compensation”, as amended by SFAS 148, “Accounting for Stock-Based Compensation – Transition and Disclosure”. We elected to adopt the modified prospective transition method as provided by FAS 123R and, accordingly, financial statement amounts for the prior periods have not been retroactively adjusted to reflect the fair value method of expensing share-based compensation. Under the modified prospective method, share-based expense recognized after adoption includes: (a) share-based expense for all awards granted prior to, but not yet vested as of January 1, 2006, based on the grant date fair value estimated in accordance with the original provisions of SFAS No. 123, as amended by SFAS 148 and (b) share-based expense for all awards granted or modified subsequent to January 1, 2006, based on the grant-date fair value estimated in accordance with the provisions of FAS 123R. Further, as required under FAS123R, we estimate forfeitures for options granted which are not expected to vest. Changes in these inputs and assumptions can materially affect the measure of estimated fair value of our stock-based compensation expense.
In November 2005, the FASB issued FASB Staff Position (“FSP”) FAS No. 123R-3, Transition Election Related to Accounting for the Tax Effects of Share-Based Payment Awards, (“FSP FAS 123R-3”). FSP FAS 123R-3 provides a practical exception when a company transitions to the accounting requirements in FAS123R. FAS123R requires a company to calculate the pool of excess tax benefits available to absorb tax deficiencies recognized subsequent to adopting FAS123R (termed the “APIC Pool”), assuming the company had been following the recognition provisions prescribed by SFAS No. 123. We have elected to use the shortcut method under FSP FAS 123R-3 to calculate our APIC Pool.
Revenue Recognition
We account for service revenue under the provisions of Staff Accounting Bulletin No. 104 (“SAB 104”), “Revenue Recognition in Financial Statements” and AICPA Statement of Position No. 81-1 (“SOP 81-1”), “Accounting for Performance of Construction-Type and Certain Production-Type Contracts.” Under the provisions of SAB 104 and SOP 81-1, we recognize revenue when there is persuasive evidence of an arrangement, services have been rendered, the fee is fixed or determinable, and collection of the resulting receivable is reasonably assured. We use the percentage-of-completion method of accounting for cost reimbursement-type contracts which specify a certain billable fee amount. Revenues are recognized as costs are incurred assuming that collection is reasonably assured. Our cost of sales includes the direct labor costs of engineering staff providing services under these contracts, as well as indirect costs including depreciation and amortization and allocated facilities costs.
Revenue from product sales is generally recognized at the time the product is shipped, provided that persuasive evidence of an arrangement exists, title and risk of loss has transferred to the customer, the sales price is fixed or determinable and collection of the receivable is reasonably assured. We did not recognize any product revenue in 2007 or 2006. Our 2005 product revenue relates primarily to products sold through retail distribution channels, with limited sales direct to end users through our own website and direct value added resellers.
In addition to reserves for sales returns, 2005 gross product revenue was reduced for price protection programs, customer rebates and cooperative marketing expenses deemed to be sales incentives to derive net
revenue. Revenue for the period ended December 31, 2005 was reduced for cooperative marketing costs in the amount of $29,932.
Research and Development Expenses
Research and development costs are expensed as incurred and include salaries and benefits, costs paid to third party contractors, prototype expenses, maintenance costs for software development tools, depreciation, amortization, and a portion of facilities costs.
Advertising Costs
Advertising costs are charged to operations when incurred. We incurred no advertising costs for the period ended December 31, 2007. We incurred advertising costs of $1,893 and $107,495, for the years ended December 31, 2006 and 2005, respectively.
Loss per Common Share
Basic loss per common share is determined based on the weighted-average number of common shares outstanding during each year. Diluted loss per common share is the same as basic loss per common share as all potential common shares are excluded from the calculation, as their effect is anti-dilutive. The weighted-average number of common shares outstanding for the years ended December 31, 2007, 2006 and 2005, was 24,620,727, 23,130,036, and 20,327,750, respectively. Options and warrants to purchase 6,631,255, 7,680,326, and 7,016,572, shares of common stock that were outstanding at December 31, 2007, 2006 and 2005 respectively, were excluded from the computation of diluted earnings per share as the effect of these options and warrants would have been anti-dilutive.
Other Comprehensive Loss
Other comprehensive loss is comprised of net unrealized losses (gains) on investments available-for-sale which are included, net of tax, in accumulated other comprehensive (loss) income in the consolidated statements of shareholders’ equity.
Leases
Our facilities are leased under operating leases. For those leases that contain rent escalations or rent concessions, we record the total rent payable during the lease term on a straight-line basis over the term of the leases with the difference between the rents paid and the straight-line rent recorded as a deferred rent liability in the accompanying consolidated balance sheets.
Consolidated Statements of Cash Flows
On May 31, 2006, we issued options, valued at approximately $63,000, under the terms of the 2000 Performance Equity Plan as consideration for professional services (see Note 8).
In March 2006, we recorded leasehold improvements of $437,314 with a corresponding entry to deferred rent, reflecting a tenant improvement allowance under the lease agreement for our new corporate location (see Note 11). The increase in deferred rent is included as a cash inflow in net cash used for operating activities and the related increase in leasehold improvements is included as a cash outflow in net cash used for investing activities in the accompanying consolidated statements of cash flows.
In connection with the private placement of 2,373,355 shares of our common stock on February 3, 2006, we issued warrants to purchase 593,335 shares of common stock. These warrants were recorded at their relative fair value of approximately $2.6 million (see Note 9).
We issued 5,092 shares of our common stock valued at approximately $53,000 on April 3, 2006, 6,035 shares of our common stock valued at approximately $53,000 on January 3, 2006 and 8,541 shares of our common stock valued at approximately $53,000 on October 3, 2005 as consideration for engineering consulting services (see Note 9).
In connection with the private placement of 2,880,000 shares of our common stock on March 10, 2005, we
issued warrants to purchase 720,000 shares of common stock. These warrants were recorded at their estimated fair value of approximately $3.1 million (see Note 9).
On April 12, 2005, we issued options, valued at approximately $146,000, under the terms of the 2000 Performance Equity Plan as consideration for professional services (see Note 8).
Income Taxes
The provision for income taxes is based on loss before taxes as reported in the accompanying consolidated statements of operations. Deferred tax assets and liabilities are recognized for the expected future tax consequences of events that have been included in the financial statements or tax returns. Deferred tax assets and liabilities are determined based on differences between the financial statement carrying amounts and the tax bases of assets and liabilities using enacted tax rates in effect for the year in which the differences are expected to reverse. Valuation allowances are established to reduce deferred tax assets when, based on available objective evidence, it is more likely than not that the benefit of such assets will not be realized. In addition, we adopted FASB Interpretation No. 48, “Accounting for Uncertainty in Income Taxes – an Interpretation of FASB Statement No. 109”, (“FIN 48”) on January 1, 2007, as more fully discussed in Note 7.
Recent Accounting Pronouncements
In September 2006, the Financial Accounting Standards Board issued SFAS No. 157, “Fair Value Measurements” (“SFAS 157”). This statement defines fair value as used in numerous accounting pronouncements, establishes a framework for measuring fair value in generally accepted accounting principles (“GAAP”) and expands disclosure related to the use of fair value measures in financial statements. SFAS 157 does not expand the use of fair value measures in financial statements, but standardizes its definition and guidance in GAAP. SFAS 157 is effective for fiscal years beginning after November 15, 2008 for nonfinancial assets and liabilities. We will adopt the provisions of SFAS 157 on January 1, 2009. We have evaluated SFAS 157 and do not anticipate that it will have an impact on our financial statements when adopted.
In February 2007, the Financial Accounting Standards Board issued Statement of Financial Accounting Standard No. 159, “Fair Value Option for Financial Assets and Financial Liabilities” (SFAS 159). This statement permits entities to elect to measure many financial instruments and certain other items at fair value and also amends SFAS 115, “Accounting for Certain Investments in Debt and Equity Securities”. SFAS 159 is effective for fiscal years beginning after November 15, 2007. We will adopt the provisions of SFAS 159 on January 1, 2008. We have evaluated SFAS 159 and do not anticipate that it will have an impact on our financial statements when adopted.
4. PREPAID EXPENSES
Prepaid expenses consisted of the following at December 31, 2007 and 2006:
| | | 2007 | | 2006 | |
| Prepaid insurance | | $ | 473,552 | | $ | 558,356 | |
| Other prepaid expenses | | | 483,700 | | | 466,776 | |
| | | $ | 957,252 | | $ | 1,025,132 | |
5. PROPERTY AND EQUIPMENT, NET
Property and equipment, at cost, consisted of the following at December 31, 2007 and 2006:
| | | 2007 | | 2006 | |
| Equipment and software | | $ | 8,559,427 | | $ | 8,249,267 | |
| Leasehold improvements | | | 778,117 | | | 762,076 | |
| Aircraft | | | 231,250 | | | 340,000 | |
| Furniture and fixtures | | | 494,561 | | | 502,643 | |
| | | | 10,063,355 | | | 9,853,986 | |
| Less accumulated depreciation and amortization | | | (8,235,475 | ) | | (7,759,686 | ) |
| | | $ | 1,827,880 | | $ | 2,094,300 | |
Depreciation expense related to property and equipment was $718,476, $829,797, and $1,321,477, in 2007, 2006, and 2005, respectively. In 2005, we recognized impairment charges on certain long-lived assets related to our retail activities. These charges include impairment of fixed assets, primarily the manufacturing and prototype facility assets, of approximately $626,000. These impairment charges are included as impairment loss in the consolidated statement of operations.
6. OTHER ASSETS
Other assets consisted of the following at December 31, 2007 and 2006:
| | | 2007 | |
| | | Gross Carrying Amount | | Accumulated Amortization | | Net Value | |
| Patents and copyrights | | $ | 14,383,987 | | $ | 4,538,265 | | $ | 9,845,722 | |
| Prepaid licensing fees | | | 705,000 | | | 705,000 | | | 0 | |
| Deposits and other | | | 473,171 | | | 0 | | | 473,171 | |
| | | $ | 15,562,158 | | $ | 5,243,265 | | $ | 10,318,893 | |
| | | | | | | | | | | |
| | 2006 |
| | | Gross Carrying Amount | | | Accumulated Amortization | | | Net Value | |
| Patents and copyrights | | $ | 13,426,154 | | $ | 3,706,477 | | $ | 9,719,677 | |
| Prepaid licensing fees | | | 705,000 | | | 606,250 | | | 98,750 | |
| Deposits and other | | | 390,057 | | | 0 | | | 390,057 | |
| | | $ | 14,521,211 | | $ | 4,312,727 | | $ | 10,208,484 | |
Patent costs represent legal and filing costs incurred to obtain patents and trademarks for product concepts and methodologies that we have developed. Capitalized patent costs are being amortized over the estimated lives of the related patents, ranging from fifteen to twenty years.
In 2005, we recognized impairment charges on certain long-lived assets related to our retail activities. These charges include impairment of prepaid license fees of approximately $662,000, and impairment of other intangible assets of approximately $584,000. These impairment charges are included as impairment loss in the consolidated statement of operations.
Amortization expense for the years ended December 31, 2007, 2006 and 2005 is as follows:
| | | | | Amortization Expense | |
| | | Weighted average estimated life (in years) | | 2007 | | 2006 | | 2005 | |
| | | | | | | | | | |
| Patents and copyrights | | | 17 | | $ | 831,788 | | $ | 669,700 | | $ | 574,324 | |
| Prepaid licensing fees | | | 4 | | | 98,750 | | | 191,000 | | | 424,333 | |
| Other intangibles | | | 3 | | | 0 | | | 0 | | | 140,190 | |
| Total amortization | | | | | $ | 930,538 | | $ | 860,700 | | $ | 1,138,847 | |
Future estimated amortization expenses for other assets that have remaining unamortized amounts as of December 31, 2007 were as follows:
| 2008 | | $ | 838,000 | |
| 2009 | | $ | 836,000 | |
| 2010 | | $ | 836,000 | |
| 2011 | | $ | 836,000 | |
| 2012 | | $ | 811,000 | |
7. INCOME TAXES AND TAX STATUS
A reconciliation between the provision for income taxes and the expected tax benefit using the federal statutory rate of 34% for the years ended December 31, 2007, 2006 and 2005 is as follows:
| | | 2007 | | 2006 | | 2005 | |
| Tax benefit at statutory rate | | $ | (6,192,563 | ) | $ | (5,377,324 | ) | $ | (7,853,812 | ) |
| State tax benefit | | | (637,470 | ) | | (553,548 | ) | | (808,481 | ) |
| Increase in valuation allowance | | | 6,276,369 | | | 6,340,888 | | | 9,454,464 | |
| Research and development credit | | | 118,540 | | | (597,550 | ) | | (642,769 | ) |
| Other | | | 435,124 | | | 187,534 | | | (149,402 | ) |
| | | $ | 0 | | $ | 0 | | $ | 0 | |
Our deferred tax assets and liabilities relate to the following sources and differences between financial accounting and the tax bases of our assets and liabilities at December 31, 2007 and 2006:
| | | 2007 | | 2006 | |
| Gross deferred tax assets: | | | | | |
| Net operating loss carryforward | | $ | 59,224,977 | | $ | 55,237,796 | |
| Research and development credit | | | 9,887,793 | | | 10,077,457 | |
| Patents and other | | | 1,144,800 | | | 1,202,489 | |
| Stock compensation | | | 1,274,557 | | | 588,358 | |
| Accrued liabilities | | | 58,915 | | | 50,100 | |
| | | | 71,591,042 | | | 67,156,200 | |
| Less valuation allowance | | | (71,476,474 | ) | | (67,042,100 | ) |
| | | | 114,568 | | | 114,100 | |
| Gross deferred tax liabilities: | | | | | | | |
| Fixed assets | | | 114,568 | | | 114,100 | |
| | | | 114,568 | | | 114,100 | |
| Net deferred tax asset | | $ | 0 | | $ | 0 | |
No current or deferred tax provision or benefit was recorded for 2007, 2006 and 2005 as a result of current losses and full deferred tax valuation allowances for all periods.
We have recorded a valuation allowance to state our deferred tax assets at their estimated net realizable value due to the uncertainty related to realization of these assets through future taxable income. At December 31, 2007, we had net operating loss (“NOL”) and research and development (“R&D”) tax credit carry-forwards for income tax purposes of $162,162,477 and $11,147,475, respectively, which expire in varying amounts from 2008 through 2027. The NOL carryforward for income tax purposes includes $576,903 related to windfall tax benefits from the exercise of stock-based compensation awards for which a benefit will be recorded in APIC when realized. Our ability to benefit from the NOL and R&D tax credit carry-forwards could be limited under certain provisions of the Internal Revenue Code if ownership of ParkerVision changes by more than 50%, as defined.
Uncertain Tax Positions
Effective January 1, 2007, we adopted the provisions of FIN 48. FIN 48 prescribes a more-likely-than-not threshold for financial statement recognition and measurement of a tax position taken or expected to be taken in a tax return. This interpretation also provides guidance on recognition and classification of income tax assets and liabilities, accounting for interest and penalties associated with tax positions, accounting for income taxes in interim periods and income tax disclosures. We file income tax returns in the U.S. federal jurisdiction and various state jurisdictions. We have identified our Federal and Florida tax returns as our only major jurisdictions, as defined. The periods subject to examination for those returns are the 1993 through 2007 tax years.
The application of FIN 48 would have resulted in a decrease to retained earnings, net of tax effect, of $1.4 million, except that the decrease was fully offset by a corresponding reduction of our valuation allowance. Additionally, as a result of the implementation of FIN 48, we decreased a deferred tax asset and its associated valuation allowance by approximately $1.8 million, net of tax effect. Approximately $0.5 million, net of tax effect, of the unrecognized tax benefit is related to disqualifying dispositions of incentive stock options which would be recorded as an adjustment to equity rather than a decrease in retained earnings, if reversed.
At December 31, 2007, we had an unrecognized tax benefit of approximately $2.6 million. Future changes in the unrecognized tax benefit will have no impact on the effective tax rate due to the existence of a valuation allowance.
A reconciliation of the amount recorded for unrecognized tax benefits for the year ended December 31, 2007 is as follows:
| | | Year Ended December 31, 2007 | |
Unrecognized tax benefits – beginning of year | | $ | 1,841,995 | |
| Gross increases – tax positions in prior period | | | 787,301 | |
| Gross increases – current period tax positions | | | 0 | |
| Settlements | | | 0 | |
| Lapse of statute of limitations | | | 0 | |
| Unrecognized tax benefits – end of year | | $ | 2,629,296 | |
We plan to conduct a study within the next twelve months of possible limitations to our NOL and R&D credit carryforwards under Section 382 of the Internal Revenue Code of 1986 as more fully discussed below. It is reasonably possible that the total amount of unrecognized tax benefits will increase as a result of this study, although we are unable to estimate a range of potential increases to our unrecognized tax benefits at this time. Utilization of the NOL and R&D credit carryforwards may be subject to a substantial annual limitation due to the ownership change limitations that have occurred previously or that could occur in the future provided by
Section 382 of the Internal Revenue Code of 1986. These ownership changes may limit the amount of NOL and R&D credit carryforwards that can be utilized annually to offset future taxable income and tax, respectively. In general, an ownership change, as defined by Section 382, results from transactions increasing the ownership of certain shareholders or public groups in the stock of a corporation by more than 50 percentage points over a three-year period. We have raised capital through the issuance of capital stock on several occasions which, combined with the purchasing shareholders’ subsequent disposition of those shares, may have resulted in a change of control as defined by Section 382, or could result in a change of control in the future upon subsequent disposition. We have not currently completed a study to assess whether a change of control has occurred or whether there have been multiple changes of control since the Company’s formation due to the significant complexity and cost associated with such study and that there could be additional changes in control in the future. If we have experienced a change of control at any time since the Company’s formation, utilization of our NOL and R&D credit carryforwards would be subject to an annual limitation under Section 382 which is determined first by multiplying the value of our stock at the time of the ownership change by the applicable long-term tax-exempt rate, and then could be subject to additional adjustments, as required. Any limitation may result in the expiration of a portion of the NOL or R&D credit carryforwards before utilization. Further, until a study is completed and any limitation known, no amounts are being presented as an uncertain tax position under FIN 48.
Our policy is that we recognize interest and penalties accrued on any unrecognized tax benefits as a component of our income tax expense. As of the date of adoption of FIN 48, we did not have any accrued interest or penalties associated with any unrecognized tax benefits. For the years ended December 31, 2007, 2006, and 2005, we did not incur any income tax related interest income, expense or penalties.
8. STOCK OPTIONS, WARRANTS AND STOCK-BASED COMPENSATION PLANS:
The following table presents share-based compensation expense included in our consolidated statements of operations for the years ended December 31, 2007, 2006 and 2005, respectively:
| | | Year ended December 31, | |
| | | 2007 | | 2006 | | 2005 | |
| Cost of sales | | $ | 20,627 | | $ | - | | $ | - | |
| Research and development expense | | | 701,042 | | | 819,366 | | | 53,333 | |
| Sales and marketing expense | | | 423,675 | | | 336,241 | | | - | |
| General and administrative expense | | | 1,182,178 | | | 1,195,246 | | | 887,450 | |
| Total share-based expense | | $ | 2,327,522 | | $ | 2,350,853 | | $ | 940,783 | |
We did not recognize compensation expense for employee stock option awards for the year ended December 31, 2005 when the exercise price of the employee stock award equaled the market price of the underlying stock on the date of grant. We did recognize compensation expense for non-employee share-based awards of $940,783 for the year ended December 31, 2005.
We did not capitalize any expense related to share-based payments. We estimate the fair value of each option award on the date of the grant using the Black-Scholes option valuation model. Estimates of fair value are not intended to predict actual future events or the value ultimately realized by persons who receive equity awards. Key input assumptions used to estimate the fair value of stock options include the exercise price of the award, the expected option term, expected volatility of our stock over the option’s expected term, the risk-free interest rate over the option’s expected term, and our expected annual dividend yield.
The fair value of each option grant for the years ended December 31, 2007, 2006, and 2005 respectively, was estimated on the grant date using the Black-Scholes option-pricing model with the following assumptions:
| | | Year ended December 31, | |
| | | 2007 | | 2006 | | 2005 | |
| Expected option term (1) | | | 4 to 7 years | | | 4.25 to 7 years | | | 3 to 10 years | |
| Expected volatility factor (2) | | | 65.8% to 74.0% | | | 69.4% to 80.3% | | | 76.4% to 85.6% | |
| Risk-free interest rate (3) | | | 3.6% to 5.0% | | | 4.2% to 5.2% | | | 3.7% to 4.5% | |
| Expected annual dividend yield | | | 0% | | | 0% | | | 0% | |
| | (1) | The expected term was determined based on historical activity for grants with similar terms and for similar groups of employees and represents the period of time that options are expected to be outstanding. For employee options, groups of employees with similar historical exercise behavior are considered separately for valuation purposes. For directors and named executive officers, the contractual term is used as the expected term based on historical behavior. In cases where there was not sufficient historical information for grants with similar terms, the simplified or “plain-vanilla” method of estimating option life was utilized. |
| | (2) | The stock volatility for each grant is measured using the weighted average of historical daily price changes of our common stock over the most recent period equal to the expected option life of the grant. |
| | (3) | The risk-free interest rate for periods equal to the expected term of the share option is based on the U.S. Treasury yield curve in effect at the time of the grant. |
We had previously adopted the provisions of SFAS No. 123, as amended by SFAS No. 148, through disclosure only. The following table illustrates the effect on the net loss and loss per share for the year ended December 31, 2005, as if we had applied the fair value recognition provisions of SFAS No. 123, as amended by SFAS No. 148, to stock-based employee compensation.
| | | Year Ended December 31, 2005 | |
| Net loss, as reported | | $ | (23,099,448 | ) |
| Stock-based compensation expense that would have been included in reported net loss if the fair value provisions of SFAS No. 123 had been applied to all awards | | | (8,302,921 | ) |
| Proforma net loss | | $ | (31,402,369 | ) |
| | | | | |
| Basic and diluted net loss per common share: | | | | |
| As reported | | $ | (1.14 | ) |
| Proforma | | $ | (1.54 | ) |
Stock Incentive Plans
1993 Stock Plan
We adopted a stock plan in September 1993 (the “1993 Plan”). As of September 10, 2003, the Company was no longer able to issue grants under the 1993 Plan. The 1993 Plan, as amended, provided for the grant of options and other stock awards to employees, directors and consultants, not to exceed 3,500,000 shares of common stock. Options granted to employees and consultants under the 1993 Plan vested for periods up to ten years and are exercisable for a period of five years from the date the options vest. Options granted to directors under the 1993 Plan were exercisable immediately and expire ten years from the date of grant.
2000 Performance Equity Plan
We adopted a performance equity plan in July 2000 (the “2000 Plan”). The 2000 Plan provides for the grant of options and other stock awards to employees, directors and consultants, not to exceed 5,000,000 shares of common stock. The plan provides for benefits in the form of incentive stock options, nonqualified stock options, stock appreciation rights, restricted share awards, stock bonuses and various stock benefits or cash. Options granted to employees and consultants under the 2000 Plan generally vest over periods up to five years and are exercisable for a period of up to five years from the date the options become vested. Options
granted to directors under the 2000 Plan are generally exercisable within one year and expire seven to ten years from the date of grant. Options to purchase 693,238 shares of common stock were available for future grants under the 2000 Plan at December 31, 2007.
The following table presents a summary of option activity under the 1993 and 2000 Plans for the years ended December 31, 2007, 2006 and 2005, respectively:
| | | 2007 | | 2006 | | 2005 | |
| | | Shares | | Wtd. Avg. Ex. Price | | Shares | | Wtd. Avg. Ex. Price | | Shares | | Wtd. Avg. Ex. Price | |
| | | | | | | | | | | | | | |
Outstanding at beginning of year | | | 5,109,590 | | $ | 20.38 | | | 5,039,171 | | $ | 21.51 | | | 5,363,202 | | $ | 21.24 | |
| Granted | | | 378,955 | | | 11.26 | | | 705,407 | | | 8.84 | | | 493,770 | | | 6.85 | |
| Exercised | | | (163,958 | ) | | 7.52 | | | (39,250 | ) | | 10.14 | | | (63,900 | ) | | 6.67 | |
| Forfeited | | | (67,117 | ) | | 9.11 | | | (110,544 | ) | | 9.19 | | | (376,855 | ) | | 9.38 | |
| Expired | | | (555,743 | ) | | 17.96 | | | (485,194 | ) | | 19.12 | | | (377,046 | ) | | 13.31 | |
| Outstanding at end of year | | | 4,701,727 | | $ | 20.54 | | | 5,109,590 | | $ | 20.38 | | | 5,039,171 | | $ | 21.51 | |
| Exercisable at end of year | | | 3,860,398 | | $ | 23.00 | | | 4,181,537 | | $ | 23.20 | | | 4,363,273 | | $ | 23.64 | |
The aggregate intrinsic value of options exercised under the 1993 and 2000 Plans during 2007, 2006, and 2005 was $806,528, $157,910, and $127,300, respectively. As of December 31, 2007, there was $4,017,918 of total unrecognized compensation cost, net of estimated forfeitures, related to nonvested share-based compensation awards granted under the 1993 and 2000 Plans. That cost is expected to be recognized over a weighted-average period of 1.96 years.
A summary of the status of nonvested share options as of December 31, 2007, and changes during the year ended December 31, 2007 is presented below:
| | | Nonvested Shares | |
| | | Shares | | Weighted-Average Grant-Date Fair Value | |
| Nonvested at January 1, 2007 | | | 928,053 | | $ | 4.82 | |
| Granted | | | 378,955 | | | 7.55 | |
| Vested | | | (398,562 | ) | | 5.06 | |
| Forfeited | | | (67,117 | ) | | 8.96 | |
| Nonvested at December 31, 2007 | | | 841,329 | | $ | 6.48 | |
The weighted average fair value of shares granted during the years ended December 31, 2007, 2006 and 2005 was $7.55, $5.41 and $4.62, respectively. The total fair value of shares vested during the years ended December 31, 2007, 2006, and 2005 was $2,014,874, $2,107,390, and $9,438,918, respectively.
The options outstanding under the 2000 Plan include a grant to an outside consultant in July 2006 for the purchase of up to 63,750 shares of its common stock at an exercise price of $9.10 per share. These options were granted as performance incentives in connection with a consulting agreement with a thirty-month term. The number of options that will vest and the date on which they will vest are dependent upon the completion of specific performance conditions. Vested options, if any, will remain exercisable for four years from the date of grant. The consulting arrangement may be terminated by us for any reason with thirty days notice, and upon such termination, any unvested shares shall be forfeited. As the number of shares that will ultimately vest is indeterminable at the date of grant, management must adjust the options to their estimated fair value at each interim reporting date until vesting occurs. Fair value is estimated at each interim reporting
date using the Black-Scholes option pricing model and then amortized on a straight line basis over the estimated remaining requisite service period. At December 31, 2007 and 2006, the total estimated fair value of these options was approximately $102,600 and $94,950, respectively. For the years ended December 31, 2007 and 2006, approximately $42,570 and $18,990 of expense related to these options was recognized in the consolidated statement of operations.
The options granted under the 2000 Plan also include a grant to an outside consultant on May 31, 2006 for the purchase of an aggregate of 10,000 shares of its common stock at an exercise price of $10.20 per share for consulting services to be provided over a one year period. The total fair value of these options of approximately $63,000 was estimated as of the date of grant using the Black-Scholes option pricing model and was amortized to expense in consolidated statement of operations over the one-year term of the agreement.
On April 12, 2005, we granted stock options to an outside consultant under the 2000 Plan in connection with a consulting agreement to purchase an aggregate of 40,000 shares of its common stock at an exercise price of $10 per share. These options expire thirty-six months from the date they become vested. The first 20,000 options vested ratably over fifteen months. The remaining 20,000 options vested if certain market conditions were met. These market conditions were not met and the options were cancelled unvested in 2006. The total fair value of these options of approximately $146,000 was estimated as of the date of grant using the Black-Scholes option pricing model and was amortized to expense in the consolidated statement of operations over the term of the contract. For the years ended December 31, 2006 and 2005, approximately $58,550 and $87,450 was amortized to expense related to this contract, respectively.
Non-Plan Options/Warrants
We have granted options and warrants outside the 1993 and 2000 Plans for employment inducements, non-employee consulting services, and for underwriting and other services in connection with securities offerings. Non-plan options and warrants are generally granted with exercise prices equal to or above fair market value of the underlying shares at the date of grant.
A summary of non-plan option and warrant activity as of December 31, 2007, 2006 and 2005, and changes during the years then ended is presented below:
| | | 2007 | | 2006 | | 2005 | |
| | | Shares | | Wtd. Avg. Ex. Price | | Shares | | Wtd. Avg. Ex. Price | | Shares | | Wtd. Avg. Ex. Price | |
Outstanding at beginning of year | | | 2,570,736 | | $ | 25.26 | | | 1,977,401 | | $ | 30.29 | | | 1,257,401 | | $ | 42.49 | |
| Granted | | | - | | | - | | | 593,335 | | | 8.50 | | | 720,000 | | | 9.00 | |
| Exercised | | | (641,208 | ) | | 8.64 | | | - | | | - | | | - | | | - | |
| Forfeited | | | - | | | - | | | - | | | - | | | - | | | - | |
| Expired | | | - | | | - | | | - | | | - | | | - | | | - | |
| Outstanding at end of year | | | 1,929,528 | | $ | 30.79 | | | 2,570,736 | | $ | 25.26 | | | 1,977,401 | | $ | 30.29 | |
| Exercisable at end of year | | | 1,929,528 | | $ | 30.79 | | | 2,570,736 | | $ | 25.26 | | | 1,977,401 | | $ | 30.29 | |
Of the non-plan options and warrants outstanding and exercisable at December 31, 2007, warrants representing 1,814,528 shares were issued in connection with the sale of equity securities in various private placement transactions in 2000, 2001, 2005 and 2006. The estimated fair value of these warrants at the time of issuance of $17,492,097 is included in shareholders’ equity in the consolidated balance sheets. The remaining 115,000 share options outstanding and exercisable at December 31, 2007 represent options granted to employees and directors in 1999. The aggregate intrinsic value of non-plan options and warrants exercised in 2007 was $2,805,211.
The options outstanding at December 31, 2007 under all plans, including the non-plan options and warrants, have exercise price ranges, weighted average contractual lives, and weighted average exercise prices as follows:
| | | Options Outstanding | | Options Exercisable | |
Range of Exercise Prices | | Number Outstanding at December 31, 2007 | | Wtd. Avg. Remaining Contractual Life | | Wtd. Avg. Exercise Price | | Number Exercisable at December 31, 2007 | | Wtd. Avg. Exercise Price | | Wtd. Avg. Remaining Contractual Life | |
| | | | | | | | | | | | | | |
| $4.22-$6.33 | | | 660,500 | | | 5.89 | | $ | 5.46 | | | 510,609 | | $ | 5.50 | | | 5.80 | |
| $6.90-$10.35 | | | 1,935,006 | | | 4.70 | | | 8.78 | | | 1,558,041 | | | 5.72 | | | 4.22 | |
| $10.36-$15.54 | | | 447,438 | | | 5.21 | | | 12.45 | | | 132,965 | | | 14.62 | | | 1.93 | |
| $17.50-$26.25 | | | 1,068,910 | | | 2.29 | | | 21.83 | | | 1,068,910 | | | 21.83 | | | 2.29 | |
| $26.75-$40.13 | | | 1,109,926 | | | 3.05 | | | 32.37 | | | 1,109,926 | | | 32.37 | | | 3.05 | |
| $41.00-$61.50 | | | 1,409,475 | | | 3.12 | | | 50.07 | | | 1,409,475 | | | 50.07 | | | 3.12 | |
| | | | 6,631,255 | | | 3.86 | | $ | 23.53 | | | 5,789,926 | | $ | 25.59 | | | 3.46 | |
Upon exercise of options and warrants under all plans, we issue new registered shares of our common stock. Cash received from option and warrant exercises under all share-based payment arrangements for the year ended December 31, 2007 was $6,744,232. No tax benefit was realized for the tax deductions from exercise of the share-based payment arrangements for the year ended December 31, 2007 as the benefits were fully offset by a valuation allowance (see note 7).
9. STOCK AUTHORIZATION AND ISSUANCE
Preferred Stock
ParkerVision has 15,000,000 shares of preferred stock authorized for issuance at the direction of the board of directors. As of December 31, 2007, we had no outstanding preferred stock.
On November 17, 2005, the board of directors designated 100,000 shares of authorized preferred stock as the Series E Preferred Stock in conjunction with its adoption of a Shareholder Protection Rights Agreement (Note 10).
Common Stock and Warrants
On March 5, 2008, we completed the sale of an aggregate of 1,240,199 shares of our common stock to a limited number of domestic institutional and other investors in a private placement transaction pursuant to an offering exemption under the Securities Act of 1933. Such shares represent 4.7% of our outstanding common stock on an after-issued basis. 1,110,999 shares were sold at a price of $7.50 per share, and 129,200 shares were sold to Mr. Jeffrey Parker, our chief executive officer and chairman, at $7.74 per share. The net proceeds from this transaction of approximately $9 million will be used for general working capital purposes.
The common stock issued in the private offering will be registered by ParkerVision for re-offer and re-sale by the investors. We have committed to file the registration statement within 30 days of closing and to cause the registration statement to become effective on or prior to the earlier of (i) the fifth trading day following the date that we are notified by the SEC that the registration statement will not be reviewed or is no longer subject to review, or (ii) 120 days after the closing date. If the Common Stock is not registered for resale within those time periods, we will pay liquidated damages in the amount of one percent of the amount invested for each 30-day period (pro rated) until the filing or effectiveness of the registration statement, up to a maximum of ten percent of the gross proceeds, or $933,250.
On February 23, 2007, we completed the sale of an aggregate of 992,441 shares of our common stock to a limited number of domestic institutional and other investors in a private placement transaction pursuant to offering exemptions under the Securities Act of 1933. The shares, which represented 4.1% of our outstanding common stock on an after-issued basis, were sold at a price of $8.50 per share, for net proceeds of approximately $8.4 million. The net proceeds from this transaction were used for general working capital purposes.
On February 3, 2006, we completed the sale of an aggregate of 2,373,335 shares of common stock to a limited number of institutional and other investors in a private placement transaction pursuant to offering exemptions under the Securities Act of 1933. The shares, which represented 10.2% of our outstanding common stock on an after-issued basis, were sold at a price of $7.50 per share, for net proceeds of approximately $16.2 million. Warrants to purchase an additional 593,335 shares of common stock were issued in connection with the transaction for no additional consideration. The warrants were immediately exercisable at an exercise price of $8.50 per share and expire on February 3, 2011. The warrants may be redeemed by ParkerVision after February 3, 2008, at $.01 per warrant, provided that the shares underlying the warrants are registered for resale and the common stock traded at a volume weighted-average price equal to or greater than 200% of the then exercise price for a prescribed period of time. The estimated fair value of the warrants of $2,597,396 was classified as equity on the issuance date.
On September 19, 2005, we entered into a consulting agreement with an independent engineering consultant to perform services over a one year period. Total consideration for the services in the amount of $160,000 was payable to the consultant in cash or in shares of our common stock at our sole option. We issued 11,127 and 8,541 shares of our common stock in 2006 and 2005, respectively in settlement of this obligation. The shares were issued under the 2000 Plan.
On March 14, 2005, ParkerVision consummated the sale of an aggregate of 2,880,000 shares of common stock to a limited number of institutional and other investors in a private placement transaction pursuant to offering exemptions under the Securities Act of 1933. The shares, which represented 14% of the Company’s outstanding common stock on an after-issued basis, were sold at a price of $7.50 per share, for net proceeds of approximately $20.1 million. Warrants to purchase an additional 720,000 shares of common stock were issued in connection with the transaction for no additional consideration. The warrants were immediately exercisable at an exercise price of $9.00 per share and expire on March 10, 2010. The warrants may be redeemed by ParkerVision, at $.01 per warrant, provided that the shares underlying the warrants are registered for resale and the common stock trades at a volume weighted-average price equal to or greater than 200% of the then exercise price for a prescribed period of time. The estimated fair value of the warrants of $3,119,777 was classified as equity on the issuance date.
10. SHAREHOLDER PROTECTION RIGHTS AGREEMENT
On November 21, 2005, we adopted a Shareholder Protection Rights Agreement (“Rights Agreement”) which calls for the issuance, on November 29, 2005, as a dividend, rights to acquire fractional shares of Series E Preferred Stock. We did not assign any value to the dividend as the value of these rights is not believed to be objectively determinable. The principal objective of the Rights Agreement is to cause someone interested in acquiring us to negotiate with our Board of Directors rather than launch an unsolicited or hostile bid. The Rights Agreement subjects a potential acquirer to substantial voting and economic dilution. Each share of Common Stock issued in the future by ParkerVision will include an attached right.
The rights initially are not exercisable and trade with the Common Stock of ParkerVision. In the future, the rights may become exchangeable for shares of Series E Preferred Stock with various provisions that may discourage a takeover bid. Additionally, the rights have what are known as “flip-in” and “flip-over” provisions that could make any acquisition of us more costly to the potential acquirer. The rights may separate from the Common Stock following the acquisition of 15% or more of the outstanding shares of Common Stock by an acquiring person. Upon separation, the holder of the rights may exercise their right at an exercise price of $45 per right (the “Exercise Price”), subject to adjustment and payable in cash.
Upon payment of the exercise price, the holder of the right will receive from us that number of shares of Common Stock having an aggregate market price equal to twice the Exercise Price, as adjusted. The Rights Agreement also has a flip over provision allowing the holder to purchase that number of shares of common/voting equity of a successor entity, if we are not the surviving corporation in a business combination, at an aggregate market price equal to twice the Exercise Price.
We have the right to substitute for any of our shares of Common Stock that we are obligated to issue, shares of Series E Preferred Stock at a ratio of one ten-thousandth of a share of Series E Preferred Stock for each share of Common Stock. The Series E Preferred Stock, if and when issued, will have quarterly cumulative dividend rights payable when and as declared by the board of directors, liquidation, dissolution and winding up preferences, voting rights and will rank junior to other securities of ParkerVision unless otherwise determined by the board of directors.
The rights may be redeemed upon approval of the board of directors at a redemption price of $0.01. The Rights Agreement expires on November 21, 2015.
11. COMMITMENTS AND CONTINGENCIES
Lease Commitments
We entered into a lease agreement for our new headquarters facility in Jacksonville, Florida, pursuant to a non-cancelable lease agreement effective June 1, 2006. The lease provides for a straight-lined monthly rental payment of $15,806 through October 31, 2011 with an option for renewal. The lease provides for a tenant improvement allowance of approximately $437,000 which has been recorded in the accompanying balance sheet as leasehold improvements with a corresponding entry to deferred rent. The leasehold improvements will be depreciated over the lease term. Deferred rent will be amortized as a reduction to lease expense over the lease term.
We also lease office space in Lake Mary, Florida for our wireless design center. The lease term, as amended, was renewed in September 2005 and provides for a straight-lined monthly rental payment of approximately $20,296 through December 2010.
In addition to sales tax payable on base rental amounts, certain leases obligate us to pay pro-rated annual operating expenses for the properties. Rent expense for properties, net of sublease income, for the years ended December 31, 2007, 2006, and 2005 was $517,188, $510,014, and $688,258, respectively.
In addition, we lease certain equipment, primarily for research and development activities, under non-cancelable operating leases with lease terms through August 2009. Equipment rent expense for the years ended December 31, 2007, 2006 and 2005 was $220,169, $122,650 and $47,051, respectively.
Future minimum lease payments under all non-cancelable operating leases that have initial or remaining terms in excess of one year as of December 31, 2007 were as follows:
| 2008 | | $ | 650,000 | |
| 2009 | | | 562,000 | |
| 2010 | | | 525,000 | |
| 2011 | | | 242,000 | |
| | | $ | 1,979,000 | |
Legal Proceedings
We are subject to legal proceedings and claims which arise in the ordinary course of our business. We believe, based upon advice from outside legal counsel, that the final disposition of such matters will not have a material adverse effect on its financial position, results of operations or liquidity.
12. RELATED-PARTY TRANSACTIONS
We paid approximately $1,129,000, $1,532,000, and $1,921,000 in 2007, 2006, and 2005, respectively, for patent-related legal services to a law firm, of which Robert Sterne, one of our directors since September 2006, is a partner.
Through June 2006, we leased our headquarters facility from the Chairman and Chief Executive Officer of the Company and Barbara Parker, a related party. The lease provided annual base rental payments of approximately $280,000. We did not incur any losses related to early termination of this lease.
13. CONCENTRATIONS OF CREDIT RISK
Financial instruments that potentially subject us to a concentration of credit risk principally consist of cash and cash equivalents. At December 31, 2007, we had cash balances on deposit with banks that exceeded the balance insured by the F.D.I.C. We maintain our cash investments with what management believes to be quality financial institutions and limit the amount of credit exposure to any one institution.
14. COSTS ASSOCIATED WITH EXIT OR DISPOSAL ACTIVITY
In June 2005, we formally announced our decision to exit our retail business activities and terminated 44 employees whose roles were related to these activities. For the year ended December 31, 2005, we paid approximately $575,000 in termination benefits which are included in the consolidated statement of operations.
In addition to termination benefits, we recognized impairment charges on certain long-lived assets related to our retail activities. These charges include impairment of prepaid license fees of approximately $662,000, impairment of other intangible assets of approximately $584,000 and impairment of fixed assets, primarily the manufacturing and prototype facility assets, of approximately $626,000. These impairment charges are included as impairment loss in the consolidated statement of operations.
We also reduced the carrying value of our inventories to their estimated realizable value at June 30, 2005, resulting in a charge of approximately $2.25 million which was included as a separate component of cost of goods sold in the consolidated statement of operations.
During the second half of 2005, we reclaimed unsold product inventory from the distribution channel, liquidated our raw materials and finished product inventory through wholesale channels and liquidated our manufacturing and prototype facility assets and other property and equipment utilized in the retail business activities. This process was substantially completed as of December 31, 2005.
16. QUARTERLY FINANCIAL DATA (UNAUDITED)
The quarterly financial data presented below is in thousands except for per share data:
| | | For the three months ended | | For the year ended | |
| | | March 31, 2007 | | June 30, 2007 | | September 30, 2007 | | December 31, 2007 | | December 31, 2007 | |
| | | | | | | | | | | | |
| Revenues | | $ | 0 | | $ | 90 | | $ | 194 | | $ | 0 | | $ | 284 | |
| Gross margin | | | 0 | | | 13 | | | 19 | | | 0 | | | 32 | |
| Net loss | | | (4,468 | ) | | (4,416 | ) | | (4,656 | ) | | (4,673 | ) | | (18,213 | ) |
| | | | | | | | | | | | | | | | | |
| Basic and diluted net loss per common share | | $ | (0.19 | ) | $ | (0.18 | ) | $ | (0.19 | ) | $ | (0.19 | ) | $ | (0.74 | ) |
| | | For the three months ended | | For the year ended | |
| | | March 31, 2006 | | June 30, 2006 | | September 30, 2006 | | December 31, 2006 | | December 31, 2006 | |
| | | | | | | | | | | | |
| Revenues | | $ | 0 | | $ | 0 | | $ | 0 | | $ | 0 | | $ | 0 | |
| Gross margin | | | 0 | | | 0 | | | 0 | | | 0 | | | 0 | |
| Net loss | | | (4,344 | ) | | (4,319 | ) | | (3,787 | ) | | (3,366 | ) | | (15,816 | ) |
| | | | | | | | | | | | | | | | | |
| Basic and diluted net loss per common share | | $ | (0.19 | ) | $ | (0.18 | ) | $ | (0.16 | ) | $ | (0.14 | ) | $ | (0.68 | ) |
Item 9. Changes In and Disagreements with Accountants on Accounting and Financial Disclosure
None.
Item 9A. Controls and Procedures
Evaluation of Disclosure Controls and Procedures
Our management has established disclosure controls and procedures to ensure that material information relating to the Company, including its consolidated subsidiary, is made known to the officers who certify the Company’s financial reports and to other members of senior management and the Board of Directors.
An evaluation of the effectiveness of the Company’s disclosure controls and procedures as of December 31, 2007 was made under the supervision and with the participation of the Company’s senior management, including the chief executive officer and chief financial officer. Based on that evaluation, they concluded that the Company’s disclosure controls and procedures are effective as of the end of the period covered by this report.
Management’s Annual Report on Internal Control Over Financial Reporting
Our management is responsible for establishing and maintaining adequate internal control over financial reporting, as such term is defined in Exchange Act Rule 13a-15(f). Under the supervision and with the participation of our management, including our chief executive officer and chief financial officer, we conducted an evaluation of the effectiveness of our internal control over financial reporting based on the criteria established in Internal Control - Integrated Framework issued by the Committee of Sponsoring Organizations of the Treadway Commission. Based on our evaluation under the criteria established in Internal Control - Integrated Framework, our management concluded that our internal control over financial reporting was effective as of December 31, 2007.
Attestation Report of the Independent Registered Public Accounting Firm
The independent registered public accounting firm of PricewaterhouseCoopers LLP has attested to, and reported on, the effectiveness of our internal control over financial reporting. Their report is included in “Report of Independent Certified Public Accounting Firm” included in Item 8.
Changes in Internal Control Over Financial Reporting
For the three month period ended December 31, 2007, there has been no change in our internal control over financial reporting that has materially affected, or is reasonably likely to materially affect, our internal control over financial reporting.
Item 9B. Other Information.
None.
PART III
Item 10. Directors, Executive Officers and Corporate Governance.
Our directors and executive officers are listed below:
Name | | Age | | Position |
| | | | | |
| Jeffrey L. Parker | | 51 | | Chairman of the Board and Chief Executive Officer |
| Cynthia Poehlman | | 41 | | Chief Financial Officer and Corporate Secretary |
| David F. Sorrells | | 49 | | Chief Technical Officer and Director |
| William Hightower | | 64 | | Director |
| John Metcalf | | 57 | | Director |
| Todd Parker | | 43 | | Director |
| William L. Sammons | | 87 | | Director |
| Robert G. Sterne | | 56 | | Director |
| Nam P. Suh | | 71 | | Director |
| Papken S. der Torossian | | 69 | | Director |
Jeffrey L. Parker has been chairman of the board and our chief executive officer since our inception in August 1989 and our president from April 1993 to June 1998. From March 1983 to August 1989, Mr. Parker served as executive vice president for Parker Electronics, Inc., a joint venture partner with Carrier Corporation performing research development, manufacturing and sales and marketing for the heating, ventilation and air conditioning industry.
Cynthia Poehlman has been our chief financial officer since June 2004 and our Corporate Secretary since August 2007. From March 1994 to June 2004, Ms. Poehlman was our controller and our chief accounting officer.
David F. Sorrells has been our chief technical officer since September 1996 and has been a director since January 1997. From June 1990 to September 1996, Mr. Sorrells served as our engineering manager.
William A. Hightower has been a director since March 1999. From September 2003 to his retirement in November 2004, Mr. Hightower was the president of the company. Mr. Hightower was the president and chief operating officer and a director of Silicon Valley Group, Inc. (“SVGI”), from August 1997 until his retirement in May 2001. SVGI is a publicly held company which designs and builds semiconductor capital equipment tools for chip manufacturers. From January 1996 to August 1997, Mr. Hightower served as chairman and chief executive officer of CADNET Corporation, a developer of network software solutions for the architectural industry. From August 1989 to January 1996, Mr. Hightower was the president and chief executive officer of Telematics International, Inc.
John Metcalf has been a director since June 2004. Since November 2002, Mr. Metcalf has been a CFO Partner with Tatum LLC, the largest executive services and consulting firm in the United States. Mr. Metcalf has 18 years experience as a CFO, most recently at ESI, a provider of high-technology manufacturing equipment to the global electronics market. Prior to ESI, Mr. Metcalf served as CFO for Siltronic, WaferTech, Siltec Corporation, and OKI Semiconductor. Mr. Metcalf began his career at AMD, where he worked for eleven
years in a number of finance managerial positions including Director and Controller of North American Operations. Mr. Metcalf also currently serves on the Board of Directors and is Chairman of the Audit Committee for Microfield Group, Inc.
Todd Parker has been a director since our inception and was a vice president of ours from inception to June 1997 and from July 2002 to August 2006. Mr. Parker acted as a consultant to us from June 1997 through November 1997 and from September 2001 to July 2002. On July 31, 2002, Mr. Parker was appointed president of the Video Business Unit of the company until that division was sold in May 2004 when he took a position as Vice President for Corporate Development. Following the exit from retail business activities in June 2005, Mr. Parker took the position as our Vice President of Product Operations until his retirement in August 2006. From January 1985 to August 1989, Mr. Parker served as general manager of manufacturing for Parker Electronics.
William L. Sammons has been a director since October 1993. From 1981 until his retirement in 1985, Mr. Sammons was president of the North American Operations of Carrier Corporation.
Nam P. Suh has been a director since December 2003. Mr. Suh was inaugurated as President of Korea Advanced Institute of Science and Technology (KAIST) in July 2006. In 2008, he retired from MIT where he has been a member of the faculty since 1970. At MIT, Mr. Suh held many positions including director of the MIT Laboratory for Manufacturing and Productivity, head of the department of Mechanical Engineering (1991-2001) director of the MIT Manufacturing Institute and director of the Park Center for Complex Systems. In 1984, Mr. Suh was appointed the Assistant Director for Engineering of the National Science Foundation by President Ronald Reagan and confirmed by the U.S. Senate. Mr. Suh is a widely published author of approximately 300 articles and seven books on topics related to tribology, manufacturing, plastics and design. Mr. Suh has approximately 50 United States patents and many foreign patents, some of which relate to plastics, polymers and design. He is the recipient of six honorary doctorates from six universities in four continents. Mr. Suh also serves on the board of directors of Integrated Device Technology, Inc.
Robert G. Sterne has been a director since September 2006. Since 1978, Mr. Sterne has been a partner of the law firm of Sterne, Kessler, Goldstein & Fox PLLC, specializing in patent and other intellectual property law. Mr. Sterne provides legal services to us as one of our patent and intellectual property attorneys. Mr. Sterne served as a director of ParkerVision from February 2000 to June 2003.
Papken S. der Torossian has been a director since June 2003. Mr. der Torossian was chief executive officer of SVGI from 1986 until 2001. Prior to his joining SVGI, he was president and chief executive officer of ECS Microsystems, a communications and PC company that was acquired by AMPEX Corporation where he stayed on as a manager for a year. From 1976 to 1981 Mr. der Torossian was president of the Santa Cruz Division of Plantronics where he also served as vice president of the Telephone Products Group. Previous to that he spent four years at Spectra-Physics and twelve years with Hewlett-Packard in a variety of management positions. From March 2003 until May 2007, Mr. der Torossian served as chairman of the board of directors of Therma-Wave, Inc., a company engaged in the manufacture and sale of process control metrology systems used in manufacturing semiconductors. Since September 2005, Mr. der Torossian has served as Executive Chairman of Vistel Semiconductor Systems, Inc, a private company. Vistel Semiconductor Systems, Inc. is one of the portfolio companies of Golden Gate Capital, a private equity firm where Mr. der Torossian serves as advisor for semiconductor related activities. Since August 2007, Mr. der Torossian has served as a director and a member of the Compensation Committee and Nominating and Governance Committees of Atmel Corporation, a public company.
Family Relationships
Messrs. Jeffrey and Todd Parker are brothers.
Audit Committee and Financial Expert
We have an audit committee that is comprised of independent directors and is governed by a board-approved charter. The charter, among other things, contains the committee’s membership requirements and responsibilities. The members of the audit committee are Messrs. John Metcalf, William L. Sammons and Papken der Torossian. Mr. Metcalf serves as chairman of the audit committee.
The board of directors made a qualitative assessment of each member of the audit committee of the board of directors to determine their level of financial knowledge and experience based on a number of factors and has determined that each member is a financial expert within the meaning of all applicable rules. This determination was made with reference to the rules of Nasdaq and the SEC. The board of directors considered each of the members’ ability to understand generally accepted accounting principles and financial statements, their ability to assess the general application of generally accepted accounting principles in connection with our financial statements, including estimates, accruals and reserves, their experience in analyzing or evaluating financial statements of similar breadth and complexity as our financial statements, their understanding of internal controls and procedures for financial reporting and their understanding of the audit committee functions.
Shareholder Proposals and Nominations
There have been no material changes to the procedures by which security holders may recommend nominees to our board of directors.
Section 16(a) Beneficial Ownership Reporting Compliance
Section 16(a) of the Securities Exchange Act of 1934, as amended, requires our officers, directors and persons who beneficially own more than ten percent of a registered class of our equity securities to file reports of ownership and changes in ownership with the SEC and the National Association of Securities Dealers, Inc. Officers, directors and ten percent shareholders are charged by SEC regulation to furnish us with copies of all Section 16(a) forms they file. Based solely upon our review of the copies of such forms received by us, or written representations from certain reporting persons that no Forms 5 were required for those persons, we believe that, during the fiscal year ended December 31, 2007, all filing requirements applicable to the company executive officers, directors and ten percent shareholders were fulfilled.
Code of Ethics
The board of directors has adopted a code of ethics that is designed to deter wrongdoing and to promote ethical conduct and full, fair, accurate, timely and understandable reports that the company files or submits to the SEC and others. A copy of the code of ethics may be found on the company’s website at www.parkervision.com.
Item 11. Executive Compensation
Compensation Committee Interlocks and Insider Participation
The members of our compensation committee, all of whom are independent directors, are Messrs. William L. Sammons, Nam P. Suh and Papken der Torossian. Mr. Suh serves as chairman of the compensation committee.
Compensation Committee Report
The Compensation Committee of the Board of Directors (the “Committee”) oversees our company’s compensation programs on behalf of the Board. In fulfilling its oversight responsibilities, the Compensation Committee reviewed and discussed with management the Compensation Discussion and Analysis set forth in this Form 10-K. Based upon the review and discussions referred to above, the Compensation Committee recommended to the Board that the Compensation Discussion and Analysis be included in this Form 10-K.
Submitted by the Compensation Committee:
Nam Suh (Chair)
William Sammons
Papken der Torossian
Compensation Discussion and Analysis
Overview of Compensation Program
Our compensation program is designed to support our business objectives by structuring compensation packages to retain, reward, motivate and attract employees who possess the required technical and entrepreneurial skills and talent. The overall objectives of the business are to continue innovative technological advances of our wireless technologies, achieve technical and commercial acceptance of our wireless technologies, and, in doing so, to create significant shareholder value. The Committee is responsible for establishing and reviewing the compensation policies for our executives and ensuring that our executives are compensated in a manner consistent with those policies. The compensation of our executives is designed to reward the achievement of both quantitative and qualitative performance goals which specifically relate to the objectives of the business both short and long term.
There are three primary components of our compensation plan: (1) base salaries, (2) annual performance incentives, and (3) long-term incentives. These components are the same for all of our employees. The amount of each component is scaled according to the level of business responsibilities of each individual. Each component of the compensation program, and the manner in which the Committee determined each component for our 2007 fiscal year, are discussed in detail below. In addition, we provide standard employee benefits that include health benefits, life insurance, and tax-qualified savings plans. We did not provide any special employee benefits or perquisites in 2007 for executives other than supplemental life insurance policies for the benefit of Messrs. Jeffrey Parker and David Sorrells and an automotive allowance for Mr. Jeffrey Parker. We do not have pension or other retirement benefits or any type of nonqualified deferred compensation programs for our executives or other employees.
Comparative Benchmarking
In establishing our current executive compensation policies, programs and awards, the Committee has engaged Frederic W. Cook & Co., Inc. (“Cook”) annually since 2005 to assist with the compilation of comparative benchmark data and to provide recommendations. Cook recommended a comparative peer group (“Peer Group”) based on (i) companies generally in the wireless communications or communications equipment industries, (ii) companies that are broadly similarly sized in terms of market capitalization value, (iii) companies with similar growth and performance potential and/or (iv) companies that are considered competitors of ours in either the labor or capital markets. Financial metrics for each of these companies was gathered including most recent four quarters revenue, most recent four quarters operating income, most recent year employee count and market capitalization. Market capitalization was considered the most relevant data point in selecting the Peer Group.
As a result of changes in our business activities over the past several years, Cook recommended, and the Committee accepted, changes to our Peer Group. These changes generally included selecting companies more similarly matched in terms of size, market valuation, and industry. We expect that it will be necessary as
the business evolves to update the Peer Group periodically in order to maintain a list of relatively comparable companies for compensation evaluation purposes. However, we anticipate that the Committee will continue to apply consistent criteria in its selection of the Peer Group.
The current Peer Group, as recommended by Cook and approved by the Committee includes the following fourteen companies, listed in order of market capitalization (highest to lowest) as of June 30, 2007: Symmetricom Inc, Digi International Inc., EMS Technologies Inc., Oplink Communications Inc., Anaren Inc., Packeteer Inc., Network Equipment Technologies Inc., PCTEL, Inc., Radyne Corporation, Carrier Access Corporation (subsequently acquired by privately-held Turin Networks, Inc.), Airspan Networks Inc., EFJ Inc., Endwave Corporation, and Vyyo Inc. The range of market capitalization values for the Peer Group was from $123 million to $390 million at June 30, 2007. In relation to the Peer Group, we ranked sixth in terms of market capitalization at June 30, 2007.
The Committee reviewed the compensation programs for the Peer Group as a general indicator of relevant market conditions. The data from this Peer Group was considered in determining the proportions of base pay, annual incentive pay and long-term compensation value for our executives. All of the components of compensation were generally targeted at the market median or 50th percentile of the market.
Compensation Elements
Base Pay - Base salaries and related benefits are designed to provide basic economic security for our employees. Our base salaries are established at a level that is consistent with competitive practices in a technological, innovative and fast-moving industry in order to help retain and recruit our highly skilled workforce. Overall, base salaries are targeted at the median base salaries for the Peer Group in order to allow us to compete in the market for exceptional employees without placing an undue emphasis on fixed compensation. The base salary for our CTO, Mr. Sorrells, falls at or above the 75th percentile of the Peer Group. Our business objectives are heavily reliant upon technical innovation and we compete for technical talent with multi-national organizations with significantly greater financial resources and superior employee benefits. As such, the Committee has determined that targeting the 75th percentile or above for highly technical positions is appropriate.
Annual Performance Incentives – Annual performance incentives are specifically designed to link a meaningful portion of the executive’s pay to accomplishment of specific short-term objectives that are necessary for successful execution of our longer-term business plan.
The annual incentive plan for all employees, including executives, provides for cash awards that are determined at the end of each fiscal year immediately following the performance measurement period. The target award depends upon the achievement of corporate goals, the individual’s level of responsibility, the individual’s personal performance for the period, and the individual’s achievement of specific individual goals that support the overall corporate goals.
The incentive award target for executives is determined by the Committee and is defined as a percentage of base salary. In 2006, the Committee approved a formal performance incentive plan with target annual incentive compensation equal to 75% of base salary for the Chief Executive Officer and 50% of base salary for other named executive officers. The plan did not establish a minimum achievement level, nor did it allow for upside opportunity for above-target performance. The target percentages were determined based on the median of annual bonuses earned by the original Peer Group. The Committee compared these targets against the revised Peer Group in 2007 and determined that the target annual cash compensation for 2007 for our executives is generally at the median when compared to Peer Group target amounts. The Committee may exercise its discretion in reducing or increasing the size of an executive annual incentive award, although to date, the Committee has not done so.
For 2007, the Committee approved the following annual incentive awards for its named executive officers:
| Name and Position | | Value of Award Earned ($) | |
| Jeffrey Parker, Chief Executive Officer | | $ | 225,000 | |
| Cindy Poehlman, Chief Financial Officer | | $ | 69,200 | |
| David Sorrells, Chief Technology Officer | | $ | 100,000 | |
The awards for 2007 were based on the Committee’s assessment of both corporate goals and individual achievement. The corporate goals included (i) sales goals, as measured by design wins with target customers; (ii) customer support goals, as measured by performance against specified customer statements of work, (iii) technology goals, as measured by integrated circuit design achievements against specified marketing requirements documents, and (iii) financial goals, as measured by performance against operating expense and cash flow budgets. With regard to individual achievements, the Committee considered Mr. Parker’s ability to guide and develop the senior management team in both technological innovation and sales execution, as well as the progress made in developing business relationships in the highly-competitive mobile handset industry. With regard to Ms. Poehlman, the Committee considered her initiative in implementing process changes which increased the strength of financial reporting controls thereby continuing to ensure a high level of integrity in the financial reporting process, her growing role with regard to shareholder relations and her additional role as Corporate Secretary. With regard to Mr. Sorrells, the Committee considered Mr. Sorrells’ significant level of technical achievement, including his work with the patent office in filing new patents, his ability to guide the intellectual property team in securing issuance of the first d2p patent, his individual contribution to the development program with ITT and his significant level of contribution to support the technological aspects of business dealings with target customers. Furthermore, the Committee also took into consideration that Mr. Sorrells had 200,000 share options, with an exercise price of $15.13, expire unexercised in the preceding eighteen month period.
Although the annual performance incentive award is intended to be a cash-based award, the Committee allowed executives to elect payment of all or a portion of their award in equity in order to preserve cash for other business purposes. Mr. Parker elected to receive his full award, net of tax withholdings, in shares of common stock. Ms. Poehlman elected to receive one-third of her award in cash with the balance paid, net of tax withholdings, in shares of common stock. Mr. Sorrells elected to receive his full award in cash. The share-based awards were priced at $11.17 per share, the closing market price of our common stock on the date the award was approved by the Committee. The awards are reflected in column (e) of the Summary Compensation Table below. The equity portion of the awards are also reflected in columns (c) and (g) of the Grants of Plan Based Awards Table below.
Long Term Incentives - Long term incentives are specifically designed to align employee and shareholder interests by rewarding performance that enhances shareholder value. Equity-based awards are used for long-term incentives in order to link employee’s compensation to the value of our common stock. Stock options have been used as the primary vehicle for equity compensation for all employees, including executives. Stock options are granted at market and have no value without appreciation of the market price of our stock. Therefore, stock options are considered a strong motivator for enhancing shareholder value through corporate accomplishments.
In determining long-term equity incentive award size, the Committee used a Shareholder Value Transfer (“SVT”) Allocation methodology. SVT refers to the aggregate value or expense of grants as a percent of a company’s total market capitalization. The Committee considered data compiled by Cook regarding the average SVT rate and allocation percentages for the Peer Group. For 2007, the Committee targeted the 75th percentile of the Peer Group data rather than the median based on the large number of out-of-the-money share options held by the named executive officers, many of which had or were expected to soon expire
unexercised. The Committee approved aggregate awards of 185,000 shares for its named executive officers and 70,000 share options for other senior management employees as long-term incentive awards. Consistent with our equity grant practices as discussed below, these awards were granted and priced in four equal installments on pre-determined quarterly grant dates, beginning February 15, 2007. The options granted for named executives, and all other employees, vest over three years, with the first one-third vesting one year following the grant date and the remaining two-thirds vesting in monthly increments thereafter.
The Committee continues to evaluate the appropriate mix of long-term pay elements in comparison to the market and in line with our strategy. Recently the Committee has considered our historical stock option awards and their failure to provide the intended long-term incentive based on the significant volatility of our stock, general market conditions and the substantial number of out-of-the-money options expected to expire unexercised. Based on these and other factors, the Committee anticipates shifting towards a blend of stock options and restricted stock or restricted share unit awards in the future in order to continue to ensure that our long-term incentive programs produce the intended results.
Equity Grant Practices
Grants in connection with new hires and job promotions are made on the 15th day of the month following the new employee’s hire date and/or the effective date of the job promotion. All other employee equity grants are made on one of four pre-determined quarterly dates, whichever date most closely follows the date that all terms of the grant are approved by the Committee or its delegate. The preset quarterly dates are February 15th, May 15th, August 15th and November 15th, or, if the 15th falls on a non-trading day, the first trading day following such date. In addition, long-term equity grants made to executives and senior managers will be granted in four equal amounts on the four preset quarterly dates following the date a determination is made by the Committee as to the aggregate award. The intent of this grant policy is to (a) eliminate the need to evaluate potential grant dates in light of pending and/or recently disclosed material events and (b) to attempt to mitigate the effect of significant price volatility when a single date is utilized for annual equity awards.
Stock options are granted with an exercise price equal to the closing market value of our common stock on the grant date. In 2000, in connection with an employment agreement for our chief executive officer, options were granted at a premium to the closing market price. Options are never granted with exercise prices below market value on the date of grant.
Role of Executive Officers in Determining Executive Pay
The Committee makes all compensation decisions for all elements of compensation for the CEO and other named executive officers and approves recommendations regarding equity awards for all employees. Our chief executive officer, chief financial officer and human resource management personnel make recommendations to the Committee annually with regard to overall pay strategy including program designs, annual incentive plan design, and long-term incentive plan design for management employees. Our chief executive officer evaluates the performance of the other executive officers annually and makes recommendations regarding their compensation to the Committee for its consideration and determination. Human resource management provides the Committee with market information regarding executive officers’ base pay and annual performance incentives as requested. Executives do not determine any element or component of their own pay package or total compensation amount.
Executive and Director Stock Ownership Requirements
We currently do not have a policy with regard to minimum stock ownership for our executives or non-employee directors.
Summary Compensation Table
The following table summarizes the total compensation paid to or earned by each of our named executive
officers who served as executive officers during all or a portion of the year ended December 31, 2007 and 2006.
| (a) | | (b) | | (c) | | (d) | | (e) | | (f) | | (g) | |
Name and Principal Position | | Year | | Salary ($) | | Option Awards (1) ($) | | Non-equity Incentive Plan Compensation(2) ($) | | All other ($) | | Total ($) | |
Jeffrey Parker, Chief | | | 2007 | | $ | 325,000 | | $ | 381,096 | | $ | 225,000 | (3) | $ | 14,365 | (4) | $ | 945,461 | |
Executive Officer & Chairman of the Board | | | 2006 | | | 325,000 | | | 92,863 | | | 50,279 | (5) | | 4,520 | (6) | | 472,662 | |
Cynthia Poehlman, Chief Financial | | | 2007 | | | 200,000 | | | 262,653 | | | 69,200 | (7) | | 2,000 | (8) | | 533,853 | |
Officer and Corporate Secretary | | | 2006 | | | 200,000 | | | 188,636 | | | 21,250 | | | - | | | 409,886 | |
David Sorrells, Chief | | | 2007 | | | 275,625 | | | 228,701 | | | 100,000 | | | 2,100 | (6) | | 606,426 | |
Technology Officer | | | 2006 | | | 272,850 | | | 238,037 | | | 25,840 | | | 2,100 | (6) | | 538,827 | |
| | (1) | The amounts reported in column (d) represent the dollar amount of compensation cost recognized in 2007 and 2006 in accordance with FAS123R, excluding forfeiture estimates. Refer to Note 8 of the Consolidated Financial Statements included in Item 8 for the assumptions made in the valuation of stock options. |
| | (2) | The amounts reported in column (e) represent the dollar amount of compensation cost related to awards under non-equity incentive plans. Unless otherwise specified, all amounts reported in this column were determined and paid in the year reported. In certain cases, the named executive elected to forego his or her cash compensation in lieu of an equity award of equal dollar value. In these cases, the award value remains in this column but will be separately footnoted as to the amount of award distributed in equity. Any equity award included in this column will also be reflected in the Grants of Plan-Based Awards Table below. |
| | (3) | In 2007, our chief executive officer elected to forego a $225,000 cash performance incentive award in lieu of a stock award of 14,466 shares of common stock paid in 2008. The value of the stock award, net of $63,415 in tax withholdings, is $161,585 based on the closing market price of our common stock on the grant date. Refer to columns (c) and (g) of the Grants of Plan-Based Awards Table below. |
| | (4) | This amount includes the dollar value of premiums paid by us for life insurance for the benefit of Mr. Parker in the amount of $4,980, the gross value of Mr. Parker’s automobile allowance of $7,385, and an employer matching contribution to a 401k plan of $2,000. |
| | (5) | In 2006, our chief executive officer elected to forego a $50,279 cash performance incentive award in lieu of a stock award of 5,089 shares of common stock. |
| | (6) | This amount represents the dollar value of premiums paid, or payable, for life insurance for the benefit of the executive. |
| | (7) | In 2007, our chief financial offer elected to forego a portion of her cash performance incentive award in lieu of a stock award of 2,795 shares of common stock. The value of the stock award, net of $15,135 in tax withholdings, is $31,220 based on the closing market price of our common stock on the grant date. Refer to columns (c) and (g) of the Grants of Plan-Based Awards Table below. Both the cash and equity portions of this award were paid in 2008. |
| | (8) | Amount represents an employer matching contribution to a 401k plan. |
Grants of Plan-Based Awards
The following table summarizes each grant of an award made in 2007 to the executive officers who served as executive officers during all or a portion of 2007.
| (a) | | (b) | | (c) | | (d) | | (e) | | (f) | | (g) | |
| Name | | Grant Date | | Estimated Future Payouts Under Non-Equity Incentive Plan Awards ($) | | All Other Stock Awards: Number of Shares of Stock or Units (#) | | All Other Option Awards: Number of Securities Underlying Options (1) (#) | | Exercise or Base Price of Option Awards ($/Share) | | Full Grant Date Fair Value of Equity Award ($) | |
| | | | 2/15/2007 | | | - | | | - | | | 37,500 | | $ | 9.89 | | $ | 257,361 | |
| Jeffrey Parker | | | 5/15/2007 | | | - | | | - | | | 37,500 | | $ | 10.82 | | $ | 283,306 | |
| | | | 8/15/2007 | | | - | | | - | | | 37,500 | | $ | 12.30 | | $ | 318,555 | |
| | | | 11/15/2007 | | | - | | | - | | | 37,500 | | $ | 10.36 | | $ | 264,002 | |
| | | | | | | | | | | | | | | | | | | | |
| | | | 2/1/2008 | | $ | 225,000 | (2) | | - | | | - | | $ | 11.17 | | $ | 161,585 | |
| | | | | | | | | | | | | | | | | | | | |
| | | | 2/15/2007 | | | - | | | - | | | 8,750 | | $ | 9.89 | | $ | 60,051 | |
| Cynthia Poehlman | | | 5/15/2007 | | | - | | | - | | | 8,750 | | $ | 10.82 | | $ | 66,105 | |
| | | | 8/15/2007 | | | - | | | - | | | 8,750 | | $ | 12.30 | | $ | 74,329 | |
| | | 11/15/2007 | | | - | | | - | | | 8,750 | | $ | 10.36 | | $ | 61,600 | |
| | | | | | | | | | | | | | | | | | | | |
| | | | 2/1/2008 | | $ | 46,355 | (3) | | - | | | - | | $ | 11.17 | | $ | 31,220 | |
| (1) | Represents a long term equity incentive award for 2007 distributed in four equal installments in accordance with equity grant practices. Each award vests over three years and expires seven years from the date of grant. |
| (2) | Represents the aggregate value of Mr. Parker’s 2007 incentive award as reported in column (e) of the Summary Compensation Table above. Mr. Parker elected to forgo a cash award in lieu of an award of 14,466 shares of our common stock valued at $161,585, which is net of tax withholdings of $63,415. This award was paid on February 1, 2008. |
| (3) | Represents the aggregate value of the portion of Ms. Poehlman’s 2007 incentive award as included in column (e) of the Summary Compensation Table above for which Ms. Poehlman elected to accept a stock award of 2,795 shares of our common stock in lieu of cash. The stock award has a value of $31,220, which is net of tax withholdings of $15,135. This award was paid on February 1, 2008. |
Employment and Other Agreements
As of December 31, 2007, we had no employment agreements in place. We have non-compete arrangements in place with all of our employees. The non-compete agreements provide for restrictions on (i) employment or consultation with competing companies or customers, (ii) recruiting or hiring employees for a competing company and (iii) soliciting or accepting business from our customers.
In 2007, the Committee approved a change-in-control severance policy for the benefit of its named executives and other senior management employees. This policy provides for compensation to covered employees if they are terminated in connection with a change-of-control event. The compensation to be paid under this policy includes (a) a multiple of base salary, as determined on an individual basis by the Committee; (b) an amount in lieu of annual bonus or incentive compensation; (c) continuation of group health benefits and (d)
acceleration of any unvested and outstanding performance-based equity awards. Amounts to be paid to each executive in the event of a change in control are included in the tables under “Potential Payments upon Termination or Change in Control” below.
Outstanding Equity Awards at Fiscal Year End
The following table summarizes the outstanding equity awards as of December 31, 2007 for each executive officer who served as an executive officer during all or a portion of 2007.
| | | Option Awards | |
| Name | | Number of Securities Underlying Unexercised Options (#) Exercisable | | Number of Securities Underlying Unexercised Options (#) Unexercisable | | Equity Incentive Plan Awards: Number of Securities Underlying Unexercised Unearned Options (#) | | Option Exercise Price ($) | | Option Expiration Date | |
| | | | 12,500 | | | - | | | - | | $ | 19.00 | | | 3/10/2008 | |
| | | | 350,000 | | | - | | | - | | $ | 41.00 | | | 9/07/2010 | |
| | | | 150,000 | | | - | | | - | | $ | 61.50 | | | 10/01/2010 | |
| | | | 15,000 | | | - | | | - | | $ | 19.99 | | | 2/26/2012 | |
| Jeffrey Parker | | | 75,000 | | | - | | | - | | $ | 5.77 | | | 8/09/2012 | |
| | | | 10,908 | | | - | | | - | | $ | 8.91 | | | 12/20/2012 | |
| | | | 7,583 | | | - | | | - | | $ | 9.80 | | | 5/03/2013 | |
| | | | 35,000 | | | 55,000 | (1) | | - | | $ | 8.81 | | | 10/12/2013 | |
| | | | - | | | 37,500 | (1) | | - | | $ | 9.89 | | | 02/15/2014 | |
| | | | - | | | 37,500 | (1) | | - | | $ | 10.82 | | | 05/15/2014 | |
| | | | - | | | 37,500 | (1) | | - | | $ | 12.30 | | | 08/15/2014 | |
| | | | - | | | 37,500 | (1) | | - | | $ | 10.36 | | | 11/15/2014 | |
| | | | 7,500 | | | - | | | - | | $ | 15.13 | | | 5/15/2008 | |
| | | | 4,500 | | | - | | | - | | $ | 23.13 | | | 5/16/2008 | |
| | | | 9,500 | | | - | | | - | | $ | 15.13 | | | 5/15/2009 | |
| | | | 5,000 | | | - | | | - | | $ | 23.13 | | | 5/16/2009 | |
| | | | 30,000 | | | - | | | - | | $ | 41.50 | | | 12/31/2009 | |
| Cynthia Poehlman | | | 12,000 | | | - | | | - | | $ | 20.00 | | | 1/15/2011 | |
| | | | 19,444 | | | 5,556 | (1) | | - | | $ | 5.77 | | | 8/09/2012 | |
| | | | 4,563 | | | - | | | - | | $ | 8.91 | | | 12/20/2012 | |
| | | | 3,205 | | | - | | | - | | $ | 9.80 | | | 5/03/2013 | |
| | | | 9,722 | | | 15,278 | (1) | | - | | $ | 8.81 | | | 10/12/2013 | |
| | | | 90,000 | | | 60,000 | (2) | | - | | $ | 5.70 | | | 6/25/2014 | |
| | | | - | | | 8,750 | (1) | | - | | $ | 9.89 | | | 02/15/2014 | |
| | | | - | | | 8,750 | (1) | | - | | $ | 10.82 | | | 05/15/2014 | |
| | | | - | | | 8,750 | (1) | | - | | $ | 12.30 | | | 08/15/2014 | |
| | | | - | | | 8,750 | (1) | | - | | $ | 10.36 | | | 11/15/2014 | |
| | | Option Awards | |
| Name | | Number of Securities Underlying Unexercised Options (#) Exercisable | | Number of Securities Underlying Unexercised Options (#) Unexercisable | | Equity Incentive Plan Awards: Number of Securities Underlying Unexercised Unearned Options (#) | | Option Exercise Price ($) | | Option Expiration Date | |
| | | | 162,000 | | | - | | | - | | $ | 28.25 | | | 2/15/2008 | |
| | | | 12,500 | | | - | | | - | | $ | 19.00 | | | 3/10/2008 | |
| David Sorrells | | | 50,000 | | | - | | | - | | $ | 15.13 | | | 5/15/2008 | |
| | | | 100,000 | | | - | | | - | | $ | 23.13 | | | 12/11/2008 | |
| | | | 200,000 | | | - | | | - | | $ | 48.00 | | | 12/31/2010 | |
| | | | 18,444 | | | 7,556 | (1) | | - | | $ | 5.77 | | | 8/9/2012 | |
| | | | 125,000 | | | - | | | - | | $ | 9.00 | | | 11/21/2012 | |
| | | | 4,988 | | | - | | | - | | $ | 8.91 | | | 12/20/2012 | |
| | | | 3,898 | | | - | | | - | | $ | 9.80 | | | 5/3/2013 | |
| | | | 14,777 | | | 23,223 | (1) | | - | | $ | 8.81 | | | 10/12/2013 | |
| | (1) | Options vest over the first three years of the seven year option term, with 33% vesting one year following the grant date and the remaining 66% vesting in monthly increments for 24 months thereafter. |
| | (2) | Options vest at a rate of 20% per year for the first five years of the ten-year option term. |
Option Exercises and Stock Vested
The following table summarizes the option exercises and vesting of stock awards for the fiscal year ended December 31, 2007 for each executive officer who served as an executive officer during all or a portion of 2007.
| | | Option Awards | |
| Name | | Number of shares acquired on exercise (#) | | Value realized on exercise ($) | |
| Jeffrey Parker | | | - | | | - | |
| Cynthia Poehlman | | | - | | | - | |
David Sorrells | | | 9,000 | | $ | 81,486 | |
Potential Payments upon Termination or Change in Control
Payments Made Upon Termination - When an executive officer’s employment is terminated for any reason, other than for cause, he or she is entitled to receive his or her base salary through the date of termination and any earned but unused vacation pay. When an executive officer’s employment is terminated for cause, he or she is only entitled to his or her base salary through the date of termination.
Payments Made Upon Death or Disability - In the event of the death or disability of a named executive officer, in addition to the benefits listed under “Payments Made upon Termination” above, named executive officers, or their designated beneficiaries, will receive automatic acceleration of fifty percent of any unvested options in accordance with the terms of their individual option agreements. In addition upon death, the beneficiaries of Messrs. Parker and Sorrells will each receive proceeds from company-paid life insurance policies provided to them in their name.
Payments Made Upon a Change in Control- In the event of a change in control event, in addition to the benefits listed under “Payments Made upon Termination”, named executive officers will receive automatic acceleration of all unvested options in accordance with the terms of their individual option agreements. Furthermore, under our change-in-control severance policy, in the event an executive is terminated in connection with a change in control event, he or she will be paid (a) a multiple of base salary, as determined on an individual basis by the Committee; (b) an amount in lieu of annual bonus or incentive compensation; (c) continuation of group health benefits and (d) acceleration of unvested and outstanding performance-based equity awards, if any.
The following table reflects the estimated amount of compensation due to each of our named executive officers in the event of termination of their employment. Actual amounts to be paid out could only be determined at the time of an executive’s actual separation.
| Name | | Benefit and Payments Upon Separation | | Change in Control | | Disability | | Death | | Other | |
| Jeffrey Parker | | | | | | | | | | | | | | | | |
| | | | Salary | | $ | 975,000 | (1) | $ | - | | $ | - | | $ | - | |
| | | | Short-term Incentive Compensation | | | 225,000 | (2) | | - | | | - | | | - | |
| | | Long-Term Incentive Compensation: | | | | | | | | | | | | | |
| | | | Stock Options | | | 1,132,175 | (3) | | 566,088 | (4) | | 566,088 | (4) | | - | |
| | | | Benefits & Perquisites: | | | | | | | | | | | | | |
| | | | Health Benefits | | | 20,989 | | | - | | | - | | | - | |
| | | | Life Insurance Proceeds | | | - | | | - | | | 1,000,000 | (5) | | - | |
| | | | Accrued Vacation Pay | | | 12,500 | | | 12,500 | | | 12,500 | | | 12,500 | |
| | | | Total | | $ | 2,365,664 | | $ | 578,588 | | $ | 1,578,588 | | $ | 12,500 | |
| | | | | | | | | | | | | | | | | |
| Cynthia Poehlman | | | | | | | | | | | | | | | | |
| | | | Salary | | $ | 400,000 | (1) | $ | - | | $ | - | | $ | - | |
| | | | Short-term Incentive Compensation | | | 69,200 | (2) | | - | | | - | | | - | |
| | | | Long-Term Incentive Compensation: | | | | | | | | | | | | | |
| | | | Stock Options | | | 944,349 | (3) | | 472,175 | (4) | | 472,175 | (4) | | - | |
| | | | Benefits & Perquisites: | | | | | | | | | | | | | |
| | | | Health Benefits | | | 20,724 | | | - | | | - | | | - | |
| | | | Life Insurance Proceeds | | | - | | | - | | | - | | | - | |
| | | | Accrued Vacation Pay | | | 2,381 | | | 2,381 | | | 2,381 | | | 2,381 | |
| | | | Total | | $ | 1,436,654 | | $ | 474,556 | | $ | 474,556 | | $ | 2,381 | |
| | | | | | | | | | | | | | | | | |
| David Sorrells | | | | | | | | | | | | | | | | |
| | | | Salary | | $ | 826,875 | (1) | $ | - | | $ | - | | $ | - | |
| | | | Short-term Incentive Compensation | | | 100,000 | (2) | | - | | | - | | | - | |
| | | | Long-Term Incentive Compensation: | | | | | | | | | | | | | |
| | | | Stock Options | | | 238,731 | (3) | | 119,366 | (4) | | 119,366 | (4) | | - | |
| | | | Benefits & Perquisites: | | | | | | | | | | | | | |
| | | | Health Benefits | | | 20,989 | | | - | | | - | | | - | |
| | | | Life Insurance Proceeds | | | - | | | - | | | 1,000,000 | (5) | | - | |
| | | | Accrued Vacation Pay | | | 11,536 | | | 11,536 | | | 11,536 | | | 11,536 | |
| | | | Total | | $ | 1,198,131 | | $ | 130,902 | | $ | 1,130,902 | | $ | 11,536 | |
| (1) | Under our change in control severance policy, Messrs. Parker and Sorrells are entitled to receive three times their annual base salary, and Ms. Poehlman is entitled to two times her annual base salary upon termination following a change of control as defined in the agreement. |
| (2) | Under our change in control severance policy each executive is entitled to receive payment upon termination equal to the greater of (i) the amount of bonus and annual incentive compensation earned by the executive during the last full fiscal year prior to the change in control or (ii) the average of the bonus and annual incentive compensation earned by the executive during the prior three full fiscal years. |
| (3) | Under the terms of the individual option agreements, any unvested and outstanding options will automatically accelerate upon a change in control event. The amount reflected in the table represents the intrinsic value of options subject to accelerated vesting using the December 31, 2007 closing price of our common stock of $15.82. |
| (4) | Under the terms of the individual option agreements, one half of any unvested and outstanding options will automatically accelerate upon |
death or disability of the executive. The amount reflected in the table represents the intrinsic value of options subject to accelerated vesting using the December 31, 2007 closing price of our common stock of $15.82.
| (5) | Represents proceeds payable by a third-party insurance carrier on a company-paid life insurance policy for the benefit of the executive. |
Compensation of Outside Directors
The Committee is responsible for establishing outside directors’ compensation. Our current director compensation program was implemented in 2005 based on the Committee’s review of the benchmark data and best practices as compiled by Cook utilizing the same Peer Group used for executive compensation. The committee retainers were structured in such a way as to provide distinction between compensation for committee members and chairpersons and between the responsibilities of the various committees.
Our non-employee directors’ compensation plan currently provides for an annual cash retainer of $25,000 for board service. In addition, the plan provides for annual cash retainers for committee participation as follows:
| Audit Committee | | Compensation Committee | | Nominating Committee | |
| Chair | | Member | | Chair | | Member | | Chair | | Member | |
| $15,000 | | $ | 7,500 | | $ | 10,000 | | $ | 5,000 | | $ | 5,000 | | $ | 2,500 | |
All annual retainers are paid in quarterly installments at the end of each fiscal quarter. The plan also provides for an annual stock option award for our directors including an option grant of 40,000 shares upon initial election to the board and 10,000 shares annually following each subsequent year of service. The director options are granted on the 15th day of the first month following the directors’ election at the annual shareholders meeting. These options cliff vest one year from the date of grant. In the event a director resigns or is removed from the board for cause prior to the vesting date, any unvested options will be forfeited.
All board members are reimbursed for reasonable expenses incurred in attending meetings. In addition, the Company reimburses its board members for all or a portion of costs, including travel, for relevant director’s education.
The following table summarizes the compensation of our non-employee directors for the year ended December 31, 2007. Directors who are named executive officers do not receive separate compensation for their service as a director.
| (a) | | (b) | | (c) | | (d) | |
| Name | | Fees earned or paid in cash ($) | | Option awards(1) ($) | | Total ($) | |
| Papken der Torossian | | $ | 37,500 | | $ | 61,185 | | $ | 98,685 | |
| William Hightower | | | 25,000 | | | 61,185 | | | 86,185 | |
| John Metcalf | | | 42,500 | (2) | | 61,185 | | | 103,685 | |
| Todd Parker | | | 25,000 | | | 31,430 | | | 56,430 | |
| William Sammons | | | 37,500 | (3) | | 61,185 | | | 98,685 | |
| Robert Sterne | | | 30,000 | | | 150,449 | | | 180,449 | |
| Nam Suh | | | 37,500 | | | 61,185 | | | 98,685 | |
| | (1) | The amount reported in column (c) above represents the compensation expense related to director stock option awards as recognized under FAS123R. On August 15, 2007, each of our non-employee directors was granted an option to purchase 10,000 shares of our common stock at an exercise price of $12.30 per share. Each option vests one year from the date of grant and expires 7 years from the grant date. The grant date aggregate fair market value of each grant was $84,948. |
| (2) | The cash retainer for director’s fees for Mr. Metcalf is paid directly to Tatum Board Services, LLC. |
| | (3) | Mr. Sammons has waived receipt of any cash director’s fees. The amounts earned by Mr. Sammons are accrued by us and, at Mr. Sammons’ request, distributed to charitable organizations of his choosing. |
As of December 31, 2007, the number of options outstanding for each of our directors was as follows:
| | | Number of securities underlying outstanding options | |
| Name | | (#) exercisable | | (#) unexercisable (1) | |
| Papken der Torossian | | | 145,000 | | | 10,000 | |
| William Hightower | | | 192,500 | | | 10,000 | |
| John Metcalf | | | 70,000 | | | 10,000 | |
| Todd Parker | | | 55,000 | | | 10,000 | |
| William Sammons | | | 145,000 | | | 10,000 | |
| Robert Sterne | | | 177,500 | | | 10,000 | |
| Nam Suh | | | 116,000 | | | 10,000 | |
(1) The unexercisable shares for each director will vest in August 2008.
Item 12. Security Ownership of Certain Beneficial Owners and Management and Related Stockholder Matters
The following table sets forth certain information as of March 6, 2008 with respect to the stock ownership of (i) those persons or groups who beneficially own more than 5% of our common stock, (ii) each of our director nominees, (iii) each executive officer whose compensation exceeded $100,000 in 2007, and (iv) all of our directors, director nominees and executive officers as a group (based upon information furnished by those persons).
Name of Beneficial Owner | | Amount and Nature of Beneficial Ownership | | Percent of Class(1) | |
| | | | | | | | |
Jeffrey L. Parker (17) | | | 3,222,686 | (2) | | 11.86 | % |
Todd Parker (17) | | | 969,088 | (3) | | 3.65 | % |
David Sorrells (17) | | | 532,607 | (4) | | 1.97 | % |
William Hightower (17) | | | 217,500 | (5) | | 0.81 | % |
John Metcalf (17) | | | 70,000 | (6) | | 0.26 | % |
William L. Sammons (17) | | | 164,750 | (7) | | 0.62 | % |
Robert G. Sterne (17) | | | 178,300 | (8) | | 0.67 | % |
Nam P. Suh (17) | | | 109,000 | (9) | | 0.41 | % |
Papken S. der Torossian (17) | | | 145,000 | (10) | | 0.54 | % |
Cynthia Poehlman (17) | | | 203,923 | (11) | | 0.76 | % |
| Wellington Management Company, LLP | | | 3,151,713 | (12) | | 11.90 | % |
| Daniel M. Lewis | | | 2,402,606 | (13) | | 9.07 | % |
| Knoll Capital Management, LP | | | 1,825,917 | (14) | | 6.88 | % |
| MaxTak Capital Advisors, LLC | | | 1,637,907 | (15) | | 6.18 | % |
| All directors, director nominees and executive officers as a group (10 persons) | | | 5,812,854 | (16) | | 20.19 | % |
| (1) | Percentage includes all outstanding shares of common stock plus, for each person or group, any shares of common stock that the person or the group has the right to acquire within 60 days pursuant to options, warrants, conversion privileges or other rights. |
| (2) | Includes 673,491 shares of common stock issuable upon currently exercisable options, 2,277,584 shares held by Jeffrey Parker and Deborah Parker Joint Tenants in Common, 48,400 shares held by J-Parker Family Limited Partnership and 69,114 shares owned of record by Mr. Parker's three children over which he disclaims ownership. Mr. Jeffrey L. Parker has sole voting and dispositive power over the shares of common stock owned by the J-Parker Family Limited Partnership, as a result of which Mr. Jeffrey Parker is deemed to be the beneficial owner of such shares. Excludes 187,500 shares of common stock issuable upon options that may become exercisable in the future |
| (3) | Includes 55,000 shares of common stock issuable upon currently exercisable options, 876,255 shares held by T-Parker Family Limited Partnership and 10,100 shares owned of record by Mr. Parker’s spouse and child over which he disclaims ownership. Mr. Todd Parker has sole voting and dispositive power over the shares of common stock owned by the T-Parker Family Limited Partnership, as a result of which Mr. Todd Parker is deemed to be the beneficial owner of such shares. Excludes 10,000 shares of common stock issuable upon options that may become exercisable in the future |
| (4) | Represents 532,607 shares of common stock issuable upon currently exercisable options and excludes 26,779 shares of common stock issuable upon options that may become exercisable in the future. |
| (5) | Includes 192,500 shares of common stock issuable upon currently exercisable options and excludes 10,000 shares of common stock issuable upon options that may become exercisable in the future. |
| (6) | Represents 70,000 shares of common stock issuable upon currently exercisable options and excludes 10,000 shares of common stock issuable upon options that may become exercisable in the future. |
| (7) | Includes 145,000 shares of common stock issuable upon currently exercisable options and excludes 10,000 shares of common stock issuable upon options that may become exercisable in the future. |
| (8) | Includes 177,500 shares of common stock issuable upon currently exercisable options and excludes 10,000 shares of common stock issuable upon options that may become exercisable in the future. |
| (9) | Represents 109,000 shares of common stock issuable upon currently exercisable options and excludes 10,000 shares of common stock issuable upon options that may become exercisable in the future. |
| (10) | Represents 145,000 shares of common stock issuable upon currently exercisable options and excludes 10,000 shares of common stock issuable upon options that may become exercisable in the future. |
| (11) | Includes 201,128 shares of common stock issuable upon currently exercisable options and excludes 110,140 shares of common stock issuable upon options that may become exercisable in the future. |
| (12) | The business address of Wellington Management Company, LLP is 75 State Street, Boston, Massachusetts 02109. Wellington Management, in its capacity as investment adviser, may be deemed to have beneficial ownership of the shares of common stock of the Company that are owned of record by investment advisory clients of Wellington Management. |
| (13) | The business address is 100 State Street, Suite 2B, Teaneck, New Jersey 07666. Daniel Lewis, in his capacity as the controlling person of Gem Investment Advisors, LLC which is the general partner of Gem Partners, L.P., has shared voting and dispositive authority over 2,336,606 shares of our common stock owned by Gem Partners, L.P. Mr. Lewis also had sole voting authority over 66,000 shares of our common stock which he owns personally. Gem Investment Advisors, LLC is also deemed the beneficial owner of the 2,336,606 shares of our common stock owned by Gem Partners, L.P. |
| (14) | The business address is 666 Fifth Avenue, Suite 3702, New York, New York 10103. Knoll Capital Management, LP (KCMLP), in its capacity as investment manager, and Fred Knoll, as President of KCMLP are each deemed to have beneficial ownership of the shares of our common stock that are owned of record by investment advisory clients of KCMLP. Includes 33,335 shares of common stock issuable upon currently exercisable warrants |
| (15) | The business address is 2 Executive Drive, Suite 720, Fort Lee, New Jersey 07024. MaxTak Capital Advisors LLC (MaxTak), in its capacity as a commodity trading advisor, is deemed to have beneficial ownership of 1,637,907 shares of our common stock. |
| (16) | Includes 2,301,226 shares of common stock issuable upon currently exercisable options held by directors and officers and excludes 394,419 shares of common stock issuable upon options that may vest in the future held by directors and officers (see notes 2, 3, 4, 5, 6, 7, 8, 9, 10, and 11 above). |
| (17) | The person’s address is 7915 Baymeadows Way, Suite 400, Jacksonville, Florida 32256. |
Equity Compensation Plan Information
The following table gives the information about common stock that may be issued upon the exercise of options, warrants and rights under all of our existing equity compensation plans as of December 31, 2007, including the 1993 Stock Plan, the 2000 Performance Equity Plan and other miscellaneous plans.
Plan Category | | Number of securities to be issued upon exercise of outstanding options, warrants and rights | | Weighted-average exercise price of outstanding options, warrants and rights | | Number of securities remaining available for future issuance under equity compensation plans (excluding securities reflected in column (a)) | |
| | | (a) | | (b) | | (c) | |
| Equity compensation plans approved by security holders | | | 4,701,727 | | $ | 20.54 | | | 693,238 | |
| Equity compensation plans not approved by security holders | | | 115,000 | | $ | 23.25 | | | 0 | |
| Total | | | 4,816,727 | | | | | | 693,238 | |
The equity compensation plans reported upon in the above table that were not approved by security holders include (i) options to purchase 25,000 shares granted to two directors in March 1999 at exercise prices of $23.25 per share that are vested and expire in March 2009 and (ii) options to purchase 90,000 shares granted to an employee in March 1999 at an exercise price of $23.25 that are vested and expire in 2009.
Item 13. Certain Relationships and Related Transactions and Director Indpendence
Transactions with Related Persons
On March 5, 2008, we sold 129,200 shares of our common stock in a private placement transaction to our chief executive officer, Jeffrey Parker at a price of $7.74 per share.
Prior to June 2006, we leased our headquarters facility pursuant to a lease agreement dated March 1, 1992 with Jeffrey L. Parker, our chief executive officer and Barbara Parker, a related party. For the year ended December 31, 2006, we incurred approximately $140,000 in rental expense under the lease. We believe that the terms of the lease were no less favorable to us than terms we could have obtained from an unaffiliated third party.
We paid approximately $1,129,000 and 1,532,000 in 2007 and 2006, respectively, for patent-related legal services to a law firm, of which Robert Sterne, a director since September 2006, is a partner.
Review, Approval or Ratification of Transactions with Related Persons
The audit committee of our board of directors is responsible for reviewing and approving transactions with related persons. This responsibility is a part of the audit committee charter. In certain instances, the full board may review and approve a transaction.
Our common stock is listed on the Nasdaq Global Market System, and we follow the rules of Nasdaq in determining if a director is independent. The board of directors also consults with our counsel to ensure that the board of directors’ determination is consistent with those rules and all relevant securities and other laws and regulations regarding the independence of directors. Consistent with these considerations, the board of directors affirmatively has determined that Messrs. William Hightower, John Metcalf, William L. Sammons, Robert G. Sterne, Nam P. Suh, and Papken S. der Torossian are the independent directors. The other remaining directors are not considered independent due to their current or recent employment by the company.
Item 14. Principal Accountant Fees and Services
The firm of PricewaterhouseCoopers LLP acts as our principal accountants. The following is a summary of fees paid to the principal accountants for services rendered.
Audit Fees. For the years ended December 31, 2006 and December 31, 2007, the aggregate fees billed for professional services rendered for the audit of our annual financial statements, the review of our financial statements included in our quarterly reports, and services provided in connection with regulatory filings were approximately $390,000 and $458,500, respectively.
Audit Related Fees. For the years ended December 31, 2006 and December 31, 2007, there were no fees billed for professional services by our principal accountants for assurance and related services.
Tax Fees. For the years ended December 31, 2006 and December 31, 2007, there were no fees billed for professional services rendered by our principal accountants for tax compliance, tax advice or tax planning.
All Other Fees. For the year ended December 31, 2006, the aggregate fee billed for other professional services by our principal accountants was approximately $1,500 for an annual license fee for accounting research software. There were no fees billed for other professional services by our principal accountants for the year ended December 31, 2007.
All the services discussed above were approved by our audit committee. The audit committee pre-approves the services to be provided by our principal accountants, including the scope of the annual audit and non-audit services to be performed by the principal accountants and the principal accountants’ audit and non-audit fees. The audit committee also reviews and recommends to the board of directors whether or not to approve transactions between the company and an officer or director outside the ordinary course of business.
PART IV
Item 15. Exhibits, Financial Statement Schedules and Reports on Form 8-K
Exhibits
Exhibit Number | | Description |
| 3.1 | | Articles of Incorporation, as amended (incorporated by reference from Exhibit 3.1 of Registration Statement No. 33-70588-A) |
| | | |
| 3.2 | | Amendment to Amended Articles of Incorporation dated March 6, 2000 (incorporated by reference from Exhibit 3.2 of Annual Report on Form 10-K for the year ended December 31, 1999) |
| | | |
| 3.3 | | Bylaws, as amended (incorporated by reference from Exhibit 3.2 of Annual Report on Form 10-K for the year ended December 31, 1998) |
Exhibit Number | | Description |
| | | |
| 3.4 | | Amendment to Certificate of Incorporation dated July 17, 2000 (incorporated by reference from Exhibit 3.1 of Quarterly Report on Form 10-Q for the quarter ended June 30, 2000) |
| | | |
| 3.5 | | Certificate of Designations of the Preferences, Limitations and Relative Rights of Series E Preferred Stock (incorporated by reference from Exhibit 4.02 of Form 8-K dated November 21, 2005) |
| | | |
| 4.1 | | Form of common stock certificate (incorporated by reference from Exhibit 4.1 of Registration Statement No. 33-70588-A) |
| | | |
| 4.2 | | Purchase Option between the Registrant and Tyco Sigma Ltd. dated May 22, 2000 (incorporated by reference from Exhibit 4.1 of Quarterly Report on Form 10-Q for the quarter ended June 30, 2000) |
| | | |
| 4.3 | | Purchase Option between the Registrant and Leucadia National Corporation dated May 22, 2000 (incorporated by reference from Exhibit 4.2 of Quarterly Report on Form 10-Q for the quarter ended June 30, 2000) |
| | | |
| 4.4 | | Purchase Option between the Registrant and David M. Cumming dated May 22, 2000 (incorporated by reference from Exhibit 4.3 of Quarterly Report on Form 10-Q for the quarter ended June 30, 2000) |
| | | |
| 4.5 | | Purchase Option between the Registrant and Peconic Fund Ltd. dated May 22, 2000 (incorporated by reference from Exhibit 4.4 of Quarterly Report on Form 10-Q for the quarter ended June 30, 2000) |
| | | |
| 4.6 | | Purchase Option between the Registrant and Texas Instruments, Inc. dated March 8, 2001(incorporated by reference from exhibit 4.7 of Annual Report on Form 10-K for the year ended December 31, 2000) |
| | | |
| 4.7 | | Form of Warrant between the Registrant and each of the investors in the March 2005 private placement who are the Selling Shareholders (incorporated by reference from Exhibit 4.7 of Annual Report on Form 10-K for the year ended December 31, 2004) |
| | | |
| 4.8 | | Form of Warrant between the Registrant and each of the investors in the February 2006 private placement who are the Selling Shareholders (incorporated by reference from Exhibit 10.2 of Form 8-K dated February 3, 2006) |
| | | |
| 4.9 | | Shareholder Protection Rights Agreement between the Registrant and American Stock Transfer & Trust Company, as Rights Agent (incorporated by reference from Exhibit 4.01 of Form 8-K dated November 21, 2005) |
4.10 | | Form of Rights Certificate pursuant to Shareholder Protection Rights Agreement (incorporated by reference from Exhibit 4.03 of Form 8-K |
Exhibit Number | | Description |
| | | dated November 21, 2005) |
| | | |
| 4.11 | | Standard Form of Employee Option Agreement (incorporated by reference from Exhibit 4.11 of Annual Report on Form 10-K for the year ended December 31, 2006) |
| | | |
| 10.1 | | 1993 Stock Plan, as amended (incorporated by reference from the Company's Proxy Statement dated October 1, 1996) |
| | | |
| 10.2 | | Stock option agreement dated September 7, 2000 between Jeffrey Parker and Registrant (incorporated by reference from Exhibit 10.2 of Quarterly Report on Form 10-Q for the period ended June 30, 2001) |
| | | |
| 10.3 | | Stock option agreement dated September 7, 2000 between Jeffrey Parker and Registrant (incorporated by reference from Exhibit 10.3 of Quarterly Report on Form 10-Q for the period ended June 30, 2001) |
| | | |
| 10.4 | | 2000 Performance Equity Plan (incorporated by reference from Exhibit 10.11 of Registration Statement No. 333-43452) |
| | | |
| 10.5 | | Form of 2002 Indemnification Agreement for Directors and Officers (incorporated by reference from Exhibit 10.1 of Quarterly Report on Form 10-Q for the period ended September 30, 2002) |
| | | |
| 10.6 | | Asset Purchase Agreement and related ancillary agreements, dated as of February 25, 2004, among the Company, Thomson and Thomson Licensing (incorporated by reference from Exhibits 2.1, 10.1, 10.2, 10.3, 10.4, 10.4 and 10.6 of Current Report on Form 8-K for the event date of February 25, 2004) |
| | | |
| 10.7 | | List of Investors for Subscription Agreement and Warrants dated March 10, 2005 (incorporated by reference from Exhibit 10.30 of Annual Report on Form 10-K for the period ended December 31, 2004) |
| | | |
| 10.8 | | List of Investors for Subscription Agreement and Warrants dated February, 3 2006 (incorporated by reference from Exhibit 10.3 of Form 8-k dated February 3, 2006) |
| | | |
| 10.9 | | Form of Stock Purchase Agreement with each of the investors in the February 2007 private placement who are the Selling Stockholders (incorporated by reference from Exhibit 10.1 of Form 8-K dated February 23, 2007) |
| | | |
| 10.10 | | List of Investors for Subscription Agreement dated February 23, 2007 (incorporated by reference from Exhibit 10.2 of Form 8-K dated February 23, 2007) |
| | | |
| 10.11 | | Change in Control Severance Policy dated March 6, 2007 (incorporated by reference from Exhibit 10.19 from Annual Report on Form 10-K for |
| Exhibit Number | | Description |
| | | the period ended December 31, 2006) |
| | | |
| 10.12 | | Engineering Services Agreement, dated May 2, 2007, between Registrant and ITT Corporation (incorporated by reference from Exhibit 10.1 on Form 10-Q for the period ended June 30, 2007) |
| | | |
| 10.13 | | License Agreement, dated May 2, 2007, between Registrant and ITT Corporation (incorporated by reference from Exhibit 10.2 on Form 10-Q for the period ended June 30, 2007) |
| | | |
| 10.14 | | License and Engineering Service Agreement dated December 21, 2007 between Registrant and a mobile handset chip supplier* |
| | | |
| 10.15 | | Form of Stock Purchase Agreement with each of the investors in the March 2008 private placement who are the Selling Stockholders (incorporated by reference from Exhibit 10.1 of Form 8-K dated March 5, 2008) |
| | | |
| 10.16 | | List of Investors for Subscription Agreement dated March 5, 2008 (incorporated by reference from Exhibit 10.2 of Form 8-K dated March 5, 2008) |
| | | |
| 21.1 | | Table of Subsidiaries (incorporated by reference from Exhibit 22.1 of Annual Report on Form 10-K for the period ended December 31, 2004) |
| | | |
| 23.1 | | Consent of PricewaterhouseCoopers LLP* |
| | | |
| 31.1 | | Rule 13a-14 and 15d-14 Certification of Jeffrey Parker* |
| | | |
| 31.2 | | Rule 13a-14 and 15d-14 Certification of Cynthia Poehlman* |
| | | |
| 32.1 | | Section 1350 Certification of Jeffrey Parker and Cynthia Poehlman* |
| | | |
| 99.1 | | Compensation Committee Charter (incorporated by reference from Annual Report on Form 10-K for the period ended December 31, 2006) |
* Filed herewith
Financial Statement Schedules
Schedule II – Valuation and Qualifying Accounts
| | 1. | Form 8-K, dated December 21, 2007. Item 1.01 – Entry into a Material Definitive Agreement. Announcement of a royalty-bearing licensing agreement with a mobile handset chip supplier. |
| | 2. | Form 8-K, dated December 27, 2007. Item 5.02 – Departure of Directors or Certain Officers; Election of Directors; Appointment of Certain Officers; Compensatory Arrangements of Certain Officers. Announcement of 2007 cash performance incentive award for the chief technology officer. |
| | 3. | Form 8-K, dated February 1, 2008. Item 5.02 – Departure of Directors or Certain Officers; Election of Directors; Appointment of Certain Officers; Compensatory Arrangements of Certain Officers. Announcement of 2007 performance incentive awards for the chief executive officer and chief financial officer. |
| | 4. | Form 8-K, dated March 5, 2008. Item 2.02 – Results of Operations and Financial Condition. Announcement of the completion of a private placement. Item 3.02 - Unregistered Sales of Equity Securities. Announcement of the sale of 1,240,199 shares of common stock for aggregate proceeds of approximately $9.3 million and related registration requirements. |
Signatures
In accordance with Section 13 of the Exchange Act, the registrant caused this report to be signed on its behalf by the undersigned, thereunto duly authorized.
| Date: March 14, 2008 | | |
| | | |
| | | PARKERVISION, INC. |
| | | |
| | By: | /s/ Jeffrey L. Parker |
| | | Jeffrey L. Parker |
| | | Chief Executive Officer |
In accordance with the Exchange Act, this report has been signed below by the following persons on behalf of the registrant and in the capacities and on the dates indicated.
| Signature | | Title | Date |
| | | | | |
| By: | /s/ Jeffrey L. Parker | | Chief Executive Officer and Chairman | March 14, 2008 |
| | Jeffrey L. Parker | | of the Board (Principal Executive Officer) | |
| | | | | |
| By: | /s/ Cynthia L. Poehlman | | Chief Financial Officer (Principal Accounting | March 14, 2008 |
| | Cynthia L. Poehlman | | Officer) | |
| | | | | |
| By: | /s/ David F. Sorrells | | Chief Technical Officer and Director | March 14, 2008 |
| | David F. Sorrells | | | |
| | | | | |
| By: | /s/ William A. Hightower | | Director | March 14, 2008 |
| | William A. Hightower | | | |
| | | | | |
| By: | /s/ John Metcalf | | Director | March 14, 2008 |
| | John Metcalf | | | |
| | | | | |
| By: | /s/ Todd Parker | | Director | March 14, 2008 |
| | Todd Parker | | | |
| | | | | |
| By: | /s/ William L. Sammons | | Director | March 14, 2008 |
| | William L. Sammons | | | |
| | | | | |
| By: | /s/ Robert G. Sterne | | Director | March 14, 2008 |
| | Robert G. Sterne | | | |
| | | | | |
| By: | /s/ Nam P. Suh | | Director | March 14, 2008 |
| | Nam P. Suh | | | |
| | | | | |
| By: | /s/ Papken der Torossian | | Director | March 14, 2008 |
| | Papken der Torossian | | | |
PARKERVISION, INC. AND SUBSIDIARY
VALUATION AND QUALIFYING ACCOUNTS
SCHEDULE II
| Valuation Allowance for Income Taxes | | Balance at Beginning of Period | | Provision | | Write- Offs | | Balance at End of Period | |
| | | | | | | | | | |
| Year ended December 31, 2005 | | $ | 51,246,748 | | $ | 9,454,464 | | $ | 0 | | $ | 60,701,212 | |
| Year ended December 31, 2006 | | | 60,701,212 | | | 6,340,888 | | | 0 | | | 67,042,100 | |
| Year ended December 31, 2007 | | | 67,042,100 | | | 4,434,374 | | | 0 | | | 71,476,474 | |
Index to Exhibits
| 10.14 | | License and Engineering Service Agreement dated December 21, 2007 between Registrant and a mobile handset chip supplier |
| | | |
| 23.1 | | Consent of PricewaterhouseCoopers LLP |
| | | |
| 31.1 | | Rule 13a-14 and 15d-14 Certification of Jeffrey Parker |
| | | |
| 31.2 | | Rule 13a-14 and 15d-14 Certification of Cynthia Poehlman |
| | | |
| 32.1 | | Section 1350 Certification of Jeffrey Parker and Cynthia Poehlman |