UNITED STATES
SECURITIES AND EXCHANGE COMMISSION
Washington, D.C. 20549
Form 10-K
(Mark One)
| | | | | | | | |
| ☑ | | ANNUAL REPORT PURSUANT TO SECTION 13 OR 15(d) OF THE SECURITIES EXCHANGE ACT OF 1934 |
For the fiscal year ended December 31, 2024
OR
| | | | | | | | |
| ☐ | | TRANSITION REPORT PURSUANT TO SECTION 13 OR 15(d) OF THE SECURITIES EXCHANGE ACT OF 1934 |
For the transition period from to Commission file number 001-13908
Invesco Ltd.
(Exact Name of Registrant as Specified in Its Charter)
| | | | | | | | | | | | | | | | | |
| Bermuda | | 98-0557567 |
| (State or Other Jurisdiction of Incorporation or Organization) | | (I.R.S. Employer Identification No.) |
| | | | | |
| 1331 Spring Street, | Suite 2500, | Atlanta, | GA | | 30309 |
| (Address of Principal Executive Offices) | | (Zip Code) |
(404) 892-0896
(Registrant’s telephone number, including area code)
(Former name, former address and former fiscal year, if changed since last report)
Securities registered pursuant to Section 12(b) of the Act:
| | | | | | | | |
| Title of each class | Trading Symbol(s) | Name of each exchange on which registered |
| Common stock, $0.20 par value | IVZ | New York Stock Exchange |
Securities registered pursuant to Section 12(g) of the Act: None
Indicate by check mark if the registrant is a well-known, seasoned issuer, as defined in Rule 405 of the Securities Act. Yes ☐ No ☑
Indicate by check mark if the registrant is not required to file reports pursuant to Section 13 or Section 15(d) of the Act. Yes ☐ No ☑
Indicate by check mark whether the registrant: (1) has filed all reports required to be filed by Section 13 or 15(d) of the Securities Exchange Act of 1934 during the preceding 12 months (or for such shorter period that the registrant was required to file such reports), and (2) has been subject to such filing requirements for the past 90 days. Yes ☑ No ☐
Indicate by check mark whether the registrant has submitted electronically every Interactive Data File required to be submitted pursuant to Rule 405 of Regulation S-T (§ 232.405 of this chapter) during the preceding 12 months (or for such shorter period that the registrant was required to submit such files).
Yes ☑ No ☐
Indicate by check mark whether the registrant is a large accelerated filer, an accelerated filer, a non-accelerated filer, smaller reporting company, or an emerging growth company. See the definitions of “large accelerated filer,” “accelerated filer,” “smaller reporting company,” and "emerging growth company" in Rule 12b-2 of the Exchange Act. (Check one):
| | | | | | | | | | | | | | | | | | | | | | | |
| Large accelerated filer | ☑ | Accelerated filer | ☐ | Non-accelerated filer | ☐ | Smaller reporting company | ☐ |
| | | | | | Emerging growth company | ☐ |
If an emerging growth company, indicate by check mark if the registrant has elected not to use the extended transition period for complying with any new or revised financial accounting standards provided pursuant to Section 13(a) of the Exchange Act. ☐
Indicate by check mark whether the registrant has filed a report on and attestation to its management’s assessment of the effectiveness of its internal control over financial reporting under Section 404(b) of the Sarbanes-Oxley Act (15 U.S.C. 7262(b)) by the registered public accounting firm that prepared or issued its audit report. ☑
If securities are registered pursuant to Section 12(b) of the Act, indicate by check mark whether the financial statements of the registrant included in the filing reflect the correction of an error to previously issued financial statements. ☐
Indicate by check mark whether any of those error corrections are restatements that required a recovery analysis of incentive-based compensation received by any of the registrant’s executive officers during the relevant recovery period pursuant to §240.10D-1(b). ☐
Indicate by check mark whether the registrant is a shell company (as defined in Rule 12b-2 of the Exchange Act.) Yes ☐ No ☑
At June 30, 2024, the aggregate market value of the voting stock held by non-affiliates was $5.5 billion, based on the closing price of the registrant's Common Shares, par value U.S. $0.20 per share, on the New York Stock Exchange. At January 31, 2025, the most recent practicable date, the number of Common Shares outstanding was 447,601,799.
DOCUMENTS INCORPORATED BY REFERENCE
The registrant will incorporate by reference information required in response to Part II, Item 5 and Part III, Items 10-14 in its definitive Proxy Statement for its annual meeting of shareholders, to be filed with the Securities and Exchange Commission within 120 days after December 31, 2024.
TABLE OF CONTENTS
We include cross references to captions elsewhere in this Annual Report on Form 10-K, which we refer to as this “Report,” where you can find related additional information. The following table of contents tells you where to find these captions.
GLOSSARY OF DEFINED TERMS | | | | | | | | |
| Adjusted SOFR | — | | Secured Overnight Financing Rate plus 0.10% adjustment |
| AI | — | | Artificial Intelligence |
| AIF | — | | Alternative Investment Funds |
| APAC | — | | Asia-Pacific |
| AUM | — | | Assets under management |
| Board | — | | Board of Directors |
| bps | — | | Basis points |
| CEO | — | | Chief Executive Officer |
| CIP | — | | Consolidated investment products |
| CISO | — | | Chief Information Security Officer |
| CLOs | — | | Collateralized loan obligations |
| Companies Act | — | | Companies Act 1981 of Bermuda |
| CODM | — | | Chief Operating Decision Maker |
| COSO | — | | Committee of Sponsoring Organizations of the Treadway Commission |
| Covenant Adjusted EBITDA | — | | A financial measure set forth in covenants in our revolving credit agreement, which is defined to be earnings before income tax, depreciation, amortization, interest expense, common share-based compensation expense, unrealized (gains)/losses from investments, net, and unusual or otherwise non-recurring gains and losses
|
| EMEA | — | | Europe, Middle East and Africa |
| EPS | — | | Earnings per share |
| ERISA | — | | Employee Retirement Income Security Act of 1974 |
| ESG | — | | Environmental, social and governance |
| ESMA | — | | European Securities and Markets Authority |
| ETFs | — | | Exchange-traded funds |
| EU | — | | European Union |
| FASB | — | | Financial Accounting Standards Board |
| FCA | — | | Financial Conduct Authority |
| GDPR | — | | General Data Protection Regulation |
| GCSO | — | | Global Chief Security Officer |
| GEIP ST | — | | 2010 Global Equity Incentive Plan ST |
| IGW or Invesco Great Wall | — | | Invesco Great Wall Fund Management Company Limited |
| Long-term awards | — | | Common share-based awards and other long-term awards |
| MassMutual | — | | Massachusetts Mutual Life Insurance Company |
| NAV | — | | Net asset value |
| NYSE | — | | New York Stock Exchange |
| OECD | — | | Organization for Economic Cooperation and Development |
| PCAOB | — | | Public Company Accounting Oversight Board |
| Revolving credit agreement or credit facility | — | | Sixth amended and restated credit agreement, dated as of April 26, 2023, among Invesco Finance PLC and Bank of America included within Exhibit 10.1 of this Annual Report on Form 10-K |
| RSAs | — | | Restricted stock awards |
| RSUs | — | | Restricted stock units |
| S&P | — | | Standard & Poor's |
| SEC | — | | U.S. Securities and Exchange Commission |
| SFC | — | | Securities Futures Commission of Hong Kong |
| SFDR | — | | Sustainable Finance Disclosure Regulation |
| SOFR | — | | Secured Overnight Financing Rate |
| the company | — | | Invesco Ltd. and its consolidated entities |
| the Parent | — | | Invesco Ltd. |
| Report | — | | this Annual Report on Form 10-K |
| TRS | — | | Total return swap |
| UITs | — | | Unit investment trusts |
| U.K. | — | | United Kingdom |
| U.S. | — | | United States |
| U.S. GAAP | — | | U.S. Generally Accepted Accounting Principles |
| UCITS | — | | Undertakings for the Collective Investment in Transferable Securities |
| UTBs | — | | Unrecognized tax benefits |
| VIE | — | | Variable interest entity |
| VOE | — | | Voting interest entity |
SPECIAL CAUTIONARY NOTE REGARDING FORWARD-LOOKING STATEMENTS
This Report, other public filings and oral and written statements by us and our management, may include statements that constitute “forward-looking statements” within the meaning of the United States (U.S.) securities laws. These statements are based on the beliefs and assumptions of our management and on information available to us at the time such statements are made. Forward-looking statements include information concerning future results of our operations, expenses, earnings, liquidity, cash flows, capital expenditures, and assets under management (AUM) that could differ materially from actual results due to known and unknown risks and other important factors, including, but not limited to, industry or market conditions, geopolitical events and pandemics or health crises and their respective potential impact on the company, acquisitions and divestitures, debt and our ability to obtain additional financing or make payments, regulatory developments, demand for and pricing of our products, the prospects for certain legal contingencies, and other aspects of our business or general economic conditions. In addition, when used in this Report or such other documents or statements, words such as “believes,” “expects,” “anticipates,” “intends,” “plans,” “estimates,” “projects,” “forecasts,” and future or conditional verbs such as “will,” “may,” “could,” “should,” and “would,” and any other statement that necessarily depends on future events, are intended to identify forward-looking statements. None of this information should be considered in isolation from, or as a substitute for, historical financial statements.
Forward-looking statements are not guarantees and involve risks, uncertainties and assumptions. There can be no assurance that actual results will not differ materially from our expectations. In most cases, such assumptions will not be expressly stated. We caution investors not to rely unduly on any forward-looking statements.
The following important factors, and other factors described elsewhere in this Report or contained in our other filings with the U.S. Securities and Exchange Commission (SEC), among others, could cause our results to differ materially from any results described in any forward-looking statements:
•significant fluctuations in the performance of capital and credit markets worldwide;
•adverse changes in the global economy;
•the performance of our investment products;
•significant changes in net asset flows into or out of the accounts we manage or declines in market value of the assets in, or redemptions or other withdrawals from, those accounts;
•competitive pressures in the investment management business, including consolidation, which may force us to reduce fees we charge;
•failure to properly address the increased transformative pressures affecting the asset management industry;
•any inability to adjust our expenses quickly enough to match significant deterioration in markets;
•the effect of fluctuations in interest rates, liquidity and credit markets in the U.S. or globally;
•failure to maintain adequate corporate and contingent liquidity;
•exposure through certain investment products to credit losses in excess of our expectations and risks related to early stage real estate-related companies;
•our ability to acquire and integrate other companies into our operations successfully and the extent to which we can realize anticipated product sales, cost savings or synergies from such acquisitions;
•the occurrence of breaches and errors in the conduct of our business, including errors in our quantitative models and index tracking investment solutions, any failure to properly safeguard confidential and sensitive information, cyber-attacks or acts of fraud;
•our ability to attract and retain key personnel, including investment management professionals;
•limitations or restrictions on access to distribution channels for our products;
•our ability to develop, introduce and support new investment products and services;
•our ability to comply with client contractual requirements and/or investment guidelines despite preventative compliance procedures and controls;
•variations in demand for our investment products or services, including termination or non-renewal of our investment management agreements;
•harm to our reputation;
•our ability to maintain our credit ratings and access the capital markets in a timely manner;
•our debt and the limitations imposed by our revolving credit agreement;
•exchange rate fluctuations, especially as against the U.S. Dollar;
•man-made or natural disasters, pandemics or other widespread health crises or other business continuity problems and governmental responses to the same;
•the effect of political, economic or social instability in or involving countries in which we invest or do business (including the effect of terrorist attacks, war and other hostilities);
•the effect of failures or delays in support systems or customer service functions, and other interruptions of our operations;
•the effect of systems and other technological limitations on our ability to manage and grow our business;
•the effect of non-performance by our counterparties, third-party service providers and other key vendors to fulfill their obligations;
•impairment of goodwill and other intangible assets;
•adverse results in litigation and any other regulatory or other proceedings, governmental investigations and enforcement actions;
•the selling of our common stock by our significant shareholders;
•failure to meet disclosure requirements and expectations related to sustainability or ESG, and
•enactment of adverse federal, state or foreign legislation or changes in government policy or regulation (including accounting standards) affecting our operations, our capital requirements or the way in which our profits are taxed.
Other factors and assumptions not identified above were also involved in the derivation of these forward-looking statements, and the failure of such other assumptions to be realized may also cause actual results to differ materially from those projected. For more discussion of the risks affecting us, please refer to Item 1A, “Risk Factors.”
You should consider the areas of risk described above in connection with any forward-looking statements that may be made by us and our businesses generally. We expressly disclaim any obligation to update any of the information in this or any other public report if any forward-looking statement later turns out to be inaccurate, whether as a result of new information, future events or otherwise. For all forward-looking statements, we claim the “safe harbor” provided by Section 27A of the Securities Act of 1933, as amended, and Section 21E of the Securities Exchange Act of 1934, as amended.
Summary of Risk Factors
The following is a summary of material risks we are exposed to in the course of our business activities that could have an adverse effect on our business. It does not contain all of the information that may be important to you and should be read together with the more detailed discussion of risks in Item 1A, Risk Factors.
Risks Related to Market Dynamics and Volatility
•Volatility and disruption in global or regional capital and credit markets, as well as adverse changes in the global economy, could negatively affect our AUM, revenues, net income and liquidity.
•Our revenues and net income would likely be adversely affected by any reduction in AUM as a result of either a decline in market value of such assets or net outflows, each of which would reduce the investment management fees we earn.
•Our revenues and net income from money market and other fixed income assets may be harmed by interest rates, liquidity and credit volatility.
•Our financial condition and liquidity would be adversely affected by losses on our seed capital and co-investments.
•As many of our subsidiary operations are located outside of the U.S. and have functional currencies other than the U.S. Dollar, changes in the exchange rates to the U.S. Dollar impact our reported financial results.
Risks Related to Investment Performance and Competition
•Poor investment performance of our products could reduce the level of our AUM or affect our sales, and negatively impact our revenues and net income.
•Failure to properly address the increased transformative pressures affecting the asset management industry could negatively impact our business.
•Competitive pressures may force us to reduce the fees we charge to clients, which could reduce our profitability.
•Our private market products include investments in private credit, real estate, private market funds of funds and direct equity investments in operating companies that may expose our investment products, our clients and, to the extent of our investment in such investment products, us to risks and liabilities and to reputational harm.
•Our investment products, clients and, to the extent of our investment in such investment products, we could incur losses if the allowance for credit losses, including loan and lending-related commitment reserves, of portfolio-level investments is inadequate or if our expectations of future economic conditions deteriorate.
•We may be unable to develop new products and services, and the development of new products and services may expose us to additional costs or operational risk.
•The failure or negative performance of products offered by competitors may have a negative impact on similar Invesco products irrespective of our performance.
Risks Related to Human Capital, Operations and Technology
•Our investment management professionals and other key employees are a vital part of our ability to attract and retain clients, and the loss of key individuals or a significant portion of those professionals could result in a reduction of our AUM, revenues and net income.
•Changes in the distribution channels on which we depend could reduce our net income and hinder our growth.
•Failure to comply with client contractual requirements and/or investment guidelines could result in costs of correction, damage awards and/or regulatory fines and penalties against us and loss of revenues due to client terminations.
•Our investment advisory agreements are subject to termination or non-renewal, and our fund and other investors may withdraw their assets at any time.
•The quantitative models we use and our index tracking investment solutions may contain errors, which could result in financial losses or adversely impact product performance and client relationships.
•Disclosure requirements and expectations related to sustainability or environmental, social, and governance (ESG) are increasing and evolving. Our inability to meet these requirements and expectations could cause regulatory or reputational harm and affect our ability to attract and retain clients.
•If our reputation is harmed, we could suffer losses in our AUM, revenues and net income.
•The lack of soundness of other financial institutions could adversely affect us or the client portfolios we manage.
•We depend on information technology, and any failures of or damage to, attack on or unauthorized access to our information technology systems or facilities, or those of third parties with which we do business or that facilitate our business activities, including as a result of cyber-attacks, could result in significant limits on our ability to conduct our operations and activities, costs and reputational damage.
•Our ability to manage and grow our business successfully can be impeded by systems and other technological limitations.
•If we are unable to successfully recover from a man-made or natural disaster, severe weather event, health crisis or pandemic or other business continuity problem, we could suffer material financial loss, loss of human capital, regulatory actions, reputational harm or legal liability.
•Our business is vulnerable to deficiencies and failures in support systems, including data management, and customer service functions that could lead to breaches and errors or reputational harm, resulting in loss of customers or claims against us or our subsidiaries.
•Disruptions in the markets, to market participants and to the operations of third parties whose functions are integral to our exchange-traded funds (ETFs) platforms may adversely affect the prices at which ETFs trade, particularly during periods of market volatility.
•The recent advancements in and increased use of artificial intelligence (AI) present risks and challenges that may adversely impact our business.
Risks Related to Accounting, Capital Management and Liquidity
•The carrying value of goodwill and other intangible assets on our balance sheet has become impaired in the past and could become impaired in the future, which would adversely affect our results of operations.
•Our revolving credit agreement imposes operating covenants that impact our ability to conduct certain activities and, if amounts borrowed under it were subject to accelerated repayment, we might not have sufficient assets or liquidity to repay such amounts in full.
•We issued perpetual preferred stock having a value of approximately $4 billion, which could adversely affect our ability to raise additional capital and may limit our ability to fund other priorities.
•Failure to maintain adequate corporate and contingent liquidity may cause our AUM, revenues and net income to decline, as well as harm our prospects for growth.
•Distribution of earnings of our subsidiaries may be subject to limitations, including net capital requirements.
Risks Related to Strategic Transactions
•We may engage in strategic transactions that could create risks.
Risks Related to our Significant Shareholders
•Future sales of shares of our common stock could adversely impact the trading price of our common stock.
•Massachusetts Mutual Life Insurance Company (MassMutual) has the ability to significantly influence our business, and MassMutual’s interest in our business may be different from that of other shareholders.
Risks Related to Regulatory and Legal Matters
•We operate in an industry that is highly regulated in most countries, and any enforcement action or proceedings against us or significant changes in the laws or regulations governing our business or industry could damage our reputation or decrease our AUM, revenues, net income and liquidity.
•Civil litigation and governmental investigations and enforcement actions or proceedings against us could adversely affect our AUM and future net income and increase our costs of doing business.
•Legislative and other measures that may be taken by governmental authorities could materially increase our tax burden or otherwise adversely affect our net income or liquidity.
•Examinations and audits by tax authorities could result in additional tax payments for prior periods.
•Bermuda law differs from the laws in effect in the U.S. and may afford less protection to shareholders.
•Because we are incorporated in Bermuda, it may be difficult for shareholders to enforce non-monetary judgments against us or any judgment against us or our directors and officers. Shareholders may have to seek independent advice regarding the commencement of proceedings or service of foreign process in Bermuda.
•We have anti-takeover provisions in our Bye-Laws that may discourage a change of control.
General Risk Factors
•Our ability to maintain our credit ratings and to access the capital markets in a timely manner should we seek to do so depends on a number of factors.
•Insurance may not be available at a reasonable cost to protect us from loss or liability.
PART I
Item 1. Business
Introduction
Invesco Ltd. (the Parent), along with its consolidated entities (collectively, Invesco or the company), is an independent investment management firm dedicated to delivering a superior investment experience. Our comprehensive range of active, passive and alternative investment capabilities has been constructed over many years to help clients achieve their investment objectives. We draw on this comprehensive range of capabilities to provide solutions designed to deliver key outcomes aligned to client needs.
With approximately 8,500 employees and an on-the-ground presence in more than 20 countries, Invesco is well positioned to meet the needs of investors across the globe. We have specialized investment teams managing investments across a broad range of asset classes, investment styles and geographies. For decades, individuals and institutions have viewed Invesco as a trusted partner for a comprehensive set of investment needs. We have a significant presence in the retail and institutional markets within the investment management industry in the Americas, Europe, Middle East and Africa (EMEA) and Asia-Pacific (APAC), serving clients in more than 120 countries. As of December 31, 2024, the firm managed approximately $1.85 trillion in assets for investors around the world.
The key drivers of success for Invesco are long-term investment performance, high-quality client service, effective distribution relationships delivered across a diverse spectrum of investment management capabilities, distribution channels, geographic areas and market exposures, and competitive pricing. Through our focus on these areas, we seek to deliver better outcomes for clients, generate competitive investment results and positive net flows, and increase AUM and revenues.
We measure relative investment performance by comparing our investment capabilities to competitors' products, industry benchmarks and client investment objectives. Generally, distributors, investment advisors and consultants take into consideration longer-term investment performance (e.g., three-year and five-year performance) in their selection of investment products and recommendations to their clients. Third-party ratings may also influence client investment decisions. We monitor the quality of client service in a variety of ways, including periodic client satisfaction surveys, analysis of response times and redemption rates, competitive benchmarking of services and feedback from investment consultants.
The company is organized under the laws of Bermuda. Our common shares are listed and traded on the New York Stock Exchange (NYSE) under the symbol “IVZ.” We maintain a website at www.invesco.com/corporate. (Information contained on our website shall not be deemed to be part of, or be incorporated into, this document.)
Industry Trends
Trends around the world continue to transform the investment management industry and underscore the need to be well diversified with broad capabilities globally:
Individuals and Institutions expect personalized outcomes and experience
•Distribution partners are becoming more selective and continuing to maintain fewer relationships and partners, reducing the number of trusted investment managers with whom they work.
•Clients and distribution partners are demanding more from investment managers. While performance remains paramount and competitive pricing is essential, best-in class experience and value-added services (including portfolio analytics and consultative solutions) increasingly differentiate managers.
Structural shifts in client portfolio allocations
•Private market allocations continue to increase and become a more meaningful part of retail portfolios, driving industry fee growth as well as innovation and democratization.
•Beta, factor, and index offerings will continue to be core to portfolios in transparent, efficient markets. In this space, clients will demand ease of access and competitive pricing.
•Investors are selecting active strategies and place a high bar on proven and consistent performance.
•Investors have been shifting their investment strategies toward passively managed strategies, and we believe this trend will continue.
Leading asset managers must quickly curate options that solve clients’ problems
•Investment capabilities will be delivered efficiently and seamlessly using technologies, platforms, and vehicles.
•Investment managers are finding new ways of leveraging data and analytics to create insights that will provide strategic advantage and drive investment, distribution, and operational excellence.
•Winners will invest in talent and skills across new ecosystems, requiring new ways of working and strategic partnerships to drive synergies and scale.
These dynamics are driving fundamental changes within the industry and, we believe, will drive increasing consolidation. Additionally, the U.S. and China will continue to be the dominant global wealth markets, and global asset management leaders will need a considerable footprint in these markets. We believe the depth and breadth of Invesco's platform position us to understand, anticipate, and meet our clients' needs, successfully competing within our industry over the long term.
Strategy
At Invesco, we seek to drive sustainable profitable growth by delivering capabilities that build enduring relationships and create better outcomes for our clients. We have an advantageous position globally as a diversified, client-centric asset manager and a strategy to deliver for our shareholders. The firm's strategic priorities are aligned with four key long-term themes that are designed to sharpen our focus on clients' needs, further strengthen our business over time and help ensure our long-term success:
Deliver the excellence our clients expect
•Achieve strong, long-term investment performance.
•Deliver a quality investment process and a frictionless experience with superior engagement.
•Provide a holistic value proposition including advice and solutions to help our clients best manage their portfolios and succeed with their own clients.
Grow high demand investment offerings
•Prioritize the intersection of market size, secular change, and Invesco’s unique position to drive growth in the highest opportunity regions.
•Grow high demand private markets capabilities leveraging our strong retail channel and expanding investment strategies.
•Drive profitable organic growth, emphasizing high demand, scalable investment capabilities, and delivery vehicles.
Create an environment where talented people thrive
•Attract and develop high performing, diverse talent with skills aligned to deliver against business outcomes.
•Create an inclusive and engaging culture that values diversity of thought which enables us to work as one team to deliver better outcomes.
Act like owners for all stakeholders
•Embed next generation technology across all aspects of the business
•Strengthen financial flexibility emphasizing operating leverage
As an integrated global investment manager, we are keenly focused on meeting clients' needs and operating effectively and efficiently. We take a unified approach to our business and present our financial statements and other disclosures under one operating segment, “investment management.”
A key focus of our business is fostering a strong investment culture and providing the support that enables our investment teams to maintain well-performing investment capabilities. We believe the ability to leverage the capabilities of our investment teams to help clients across the globe achieve their investment objectives is a significant differentiator for our firm.
Investment Management Capabilities
We believe that the proven strength of our distinct and globally located investment teams and their well-defined investment disciplines and risk management approaches provide us with a robust competitive advantage. There are few independent investment managers with teams as globally diverse as Invesco's and with the same breadth and depth of investment capabilities and vehicles. We offer multiple investment objectives within the various asset classes and products that we manage. Our asset classes, broadly defined, include equity, fixed income, balanced, alternatives and money market.
Distribution Channels
Retail AUM typically originate from clients investing into funds available to the public in the form of shares or units. Institutional AUM originate from entities such as individual corporate clients, insurance companies, endowments, foundations, government authorities, universities or charities. AUM disclosed as retail AUM include AUM distributed by the company's retail sales teams. AUM disclosed as institutional AUM include AUM distributed by the company's institutional sales teams.
The company operates as an integrated global investment manager. Dedicated sales forces deliver our investment strategies through a variety of vehicles that meet the needs of retail and institutional clients. Note that not all products sold in the retail distribution channel are in "retail" vehicles, and not all products sold in the institutional channel are in "institutional" vehicles, as described in the table below. This aggregation, however, is viewed as a proxy for presenting AUM in the retail and institutional markets in which we operate.
The following lists our primary investment vehicles by distribution channel:
| | | | | | | | | | | |
Retail | | Institutional | |
| ● Alternative Investment Funds (AIF) | | ● Collective Trust Funds | |
| ● Closed-end Mutual Funds | | ● ETFs | |
| ● Exchange-traded funds (ETFs) | | ● Institutional Separate Accounts | |
| ● Individual Savings Accounts | | ● Open-end Mutual Funds | |
| ● Investment Companies with Variable Capital (ICVC) | | ● Private Funds |
| ● Investment Trusts | |
| ● Real Estate Investment Trusts (REIT) | | | |
| ● Open-end Mutual Funds | | | |
| ● Private Funds | | | |
| ● Separately Managed Accounts (SMA) | | | |
| ● Société d'investissement à Capital Variable (SICAV) | | | |
| ● Unit Investment Trusts (UITs) | | | |
| ● Variable Insurance Funds | | | |
Retail
Retail AUM were $1,265.6 billion at December 31, 2024. We offer retail products within all of the major asset classes. Our retail products are primarily distributed through third-party financial intermediaries, including major wire houses, direct wealth platforms, regional broker-dealers, insurance companies, banks and financial planners in the Americas, and independent brokers and financial advisors, banks and direct wealth platforms in EMEA and APAC.
The Americas and EMEA retail operations rank among the largest by AUM in their respective markets. As of December 31, 2024, Invesco's U.S. retail business, including our ETFs franchise, is among the leading asset managers in the U.S., and Invesco's retail business in EMEA is among the largest non-proprietary investment managers in the retail channel. In addition, Invesco Great Wall Fund Management Company Limited (IGW or Invesco Great Wall), our joint venture in China, is one of the largest Sino-foreign managers of equity products in China, with total AUM of approximately $93.2 billion at December 31, 2024. We provide our retail clients with one of the industry's most robust and comprehensive product lines.
Institutional
Institutional AUM were $580.4 billion at December 31, 2024. We offer a broad suite of domestic and global strategies, including traditional and quantitative equities, fixed income (including money market funds for institutional clients), real estate, financial structures and absolute return strategies. Regional sales forces distribute our products and provide services to clients and intermediaries around the world. We have a diversified client base that includes major public and private entities, unions, non-profit organizations, endowments, foundations, pension funds, financial institutions and sovereign wealth funds. Invesco's institutional money market funds serve some of the largest financial institutions, government entities and companies in the world.
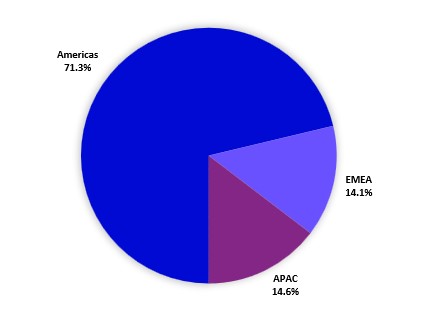
AUM Diversification
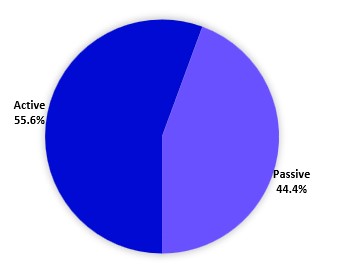
One of Invesco's competitive strengths is the diversification of AUM by client domicile, distribution channel and investment capability. We serve clients in more than 120 countries. The following tables present a breakdown of AUM by client domicile, distribution channel and investment capability as of December 31, 2024. Additionally, the fourth table below illustrates the split of our AUM as Passive and Active. Passive AUM include index-based ETFs, UITs, non-management fee earning AUM and other passive mandates. Active AUM are total AUM less Passive AUM. See the company's disclosures regarding the changes in AUM for the year ended December 31, 2024 in Part II, Item 7, "Management's Discussion and Analysis of Financial Condition and Results of Operations - Assets Under Management” for additional information regarding changes in AUM.
| | | | | | | | | | | | | | |
| By Client Domicile | | | |
| (in billions) | Total | | 1-Yr Change |
c Americas | $ | 1,315.5 | | | 16.0 | % |
| | | |
c EMEA | 260.3 | | | 20.6 | % |
c APAC | 270.2 | | | 14.7 | % |
| Total | $ | 1,846.0 | | | |
| | | |
| | | |
| | | |
| | | |
| | | |
| | | | | | | | | | | | | | |
| | | | |
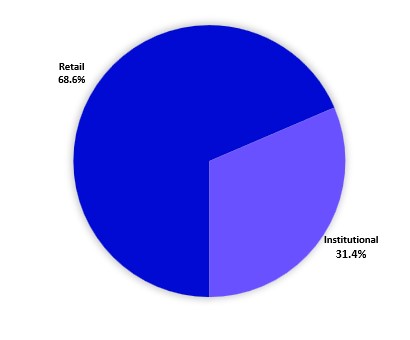
| By Distribution Channel | |
| (in billions) | Total | | 1-Yr Change |
c Retail | $ | 1,265.6 | | | 21.5 | % |
c Institutional | 580.4 | | | 6.8 | % |
| Total | $ | 1,846.0 | | | |
| | | |
| | | |
| | | |
| | | |
| | | |
| | | | | | | | | | | | | | |
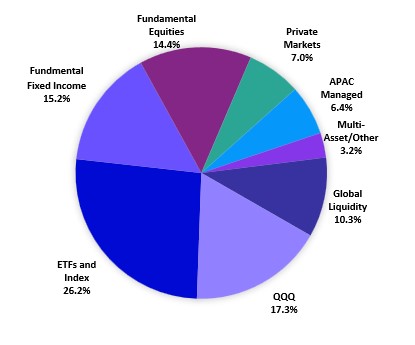
| By Investment Capability | | | | |
| (in billions) | Total | | 1-Yr Change |
c ETFs and Index | $ | 484.0 | | | 33.7 | % |
c Fundamental Fixed Income | 281.1 | | | 3.1 | % |
c Fundamental Equities | 266.5 | | | 2.3 | % |
c Private Markets | 128.5 | | | (0.9) | % |
c APAC Managed | 118.8 | | | 10.0 | % |
c Multi-Asset/Other | 58.8 | | | 2.4 | % |
c Global Liquidity | 189.4 | | | 14.8 | % |
c QQQ | 318.9 | | | 38.7 | % |
| Total | $ | 1,846.0 | | | |
| | | |
| | | |
| | | | | | | | | | | | | | |
| Active vs. Passive | | | | |
| (in billions) | Total | | 1-Yr Change |
c Active | $ | 1,026.5 | | | 4.2 | % |
c Passive | 819.5 | | | 36.6 | % |
| Total | $ | 1,846.0 | | | |
| | | |
| | | |
| | | |
| | | |
Corporate Responsibility and Human Capital
Invesco’s long-term success depends on our ability to retain, develop, engage and attract top talent. Invesco invests significantly in talent development, health and welfare programs, technology and other resources that support our employees in developing their full potential both personally and professionally. We believe that an employee community that is diverse and inclusive, engaged in community involvement and invested in employee well-being will drive positive outcomes for our clients and shareholders.
As of December 31, 2024, the company had 8,508 (December 31, 2023: 8,489) employees with an on-the-ground presence in over 20 countries. Our employees are not covered under collective bargaining agreements.
The company is committed to reducing our impact on the environment. Across Invesco offices, we carefully manage our operational activities with a focus on using natural resources wisely, increasing efficiencies wherever possible and providing a safe and healthy workplace for employees and visitors. This is the foundation of our environmental, health and safety management approach.
Competition
The investment management business is highly competitive, with points of differentiation including investment performance, fees, range of products offered, brand recognition, business reputation, financial strength, depth and continuity of relationships and quality of service. We compete with a large number of investment management firms, commercial banks, investment banks, broker-dealers, hedge funds, insurance companies and, increasingly, firms outside the traditional financial services industry, such as technology providers. Many of these competitors have greater financial resources and higher brand recognition than Invesco. However, we believe our experience as a trusted partner to clients, the quality and diversity of our investment capabilities, product types and channels of distribution, and our commitment to innovation enable us to compete effectively in the global investment management business. There are few independent investment managers with teams as globally diverse as Invesco's and the same breadth and depth of investment capabilities and vehicles. We offer multiple investment objectives within the various asset classes and products that we manage. We also believe being an independent investment manager is a competitive advantage, as our business model avoids conflicts that are inherent within institutions that both manage and distribute and/or service those products. Lastly, we believe continued execution against our strategic objectives will further strengthen our long-term competitive position.
Management Contracts
We derive substantially all of our revenues from investment management contracts. Fees vary with the type of assets being managed, with higher fees earned on actively managed equity and balanced accounts, along with real estate and other alternative asset products, and with lower fees earned on fixed income, money market and stable value accounts, and ETFs. Investment management contracts are generally terminable upon thirty or fewer days' notice. Typically, retail investors may withdraw their funds at any time without prior notice and institutional clients may elect to terminate their relationship with investment managers or reduce the aggregate amount of AUM with very short notice periods.
Risk Management
Invesco is committed to continually strengthening and evolving our risk management approach and activities to ensure they keep pace with business change and client expectations. We believe a key factor in our ability to manage through challenging market conditions and significant business change is our integrated and global approach to risk management. We seek to embed risk management in our day-to-day decision-making as well as our strategic planning process, while our global risk management framework seeks to enable consistent and meaningful risk dialogue up, down and across the company.
Our framework leverages two governance structures: (i) our Global Investment Risk and Performance Committee oversees the management of core investment risks; and (ii) our Enterprise Risk Management Committee oversees the management of all other business- and strategy-related risks. A network of regional, business unit and risk-specific management committees, with oversight by the Enterprise Risk Management Committee, provides ongoing identification, assessment, management, monitoring, and reporting of existing and emerging risks across all domains of our business.
Available Information
The SEC maintains a website that contains reports, proxy and information statements and other information regarding issuers at www.sec.gov. We make available free of charge on our website, www.invesco.com/corporate, our Annual Report on Form 10-K, Quarterly Reports on Form 10-Q, Current Reports on Form 8-K, proxy statement and amendments to those reports filed or furnished pursuant to Section 13(a) or 15(d) of the Securities Exchange Act of 1934, as amended, as soon as reasonably practicable after we electronically file such material with, or furnish it to, the SEC.
Item 1A. Risk Factors
Risks Related to Market Dynamics and Volatility
Volatility and disruption in global or regional capital and credit markets, as well as adverse changes in the global economy, could negatively affect our AUM, revenues, net income and liquidity.
In recent years, capital and credit markets have experienced substantial volatility. In this regard:
•In the event of extreme circumstances, including an economic, political or business crisis, such as widespread systemic failures or disruptions in the global or regional financial systems or failures of firms that have significant obligations as counterparties on financial instruments, we may suffer significant declines in AUM and severe liquidity or valuation issues in managed investment products in which client and company assets are invested, all of which would adversely affect our operating results, financial condition, liquidity, credit ratings, ability to access capital markets and ability to retain and attract key employees. Additionally, these factors could impact our ability to realize the carrying value of our goodwill and other intangible assets.
•Illiquidity and/or volatility of the global or regional risk asset markets could negatively affect our ability to manage investment products in which client and company assets are invested or client inflows and outflows or to timely meet client redemption requests.
•Uncertainties regarding geopolitical developments, such as nation state sovereignty, border disputes, diplomatic developments, social instability or changes in governmental policies, can produce volatility in global financial markets and regulatory environments. This volatility, including volatility arising from tensions between the U.S. and China, may impact the level and composition of our AUM and also negatively impact investor sentiment, which could result in reduced or negative flows.
•Changes to tax, tariff and import/export regulations and economic sanctions may have a negative effect on global or regional economic conditions, financial markets and our business. Any changes with respect to trade policies, treaties, taxes, government regulations and tariffs, or the perception that any of these changes could occur, may have a material adverse effect on global or regional economic conditions and the stability of global financial markets and may significantly reduce global trade or trade between certain nations. Given we are a global business, we could be more adversely affected than others by such market uncertainties.
Our revenues and net income would likely be adversely affected by any reduction in AUM as a result of either a decline in market value of such assets or net outflows, each of which would reduce the investment management fees we earn.
We derive substantially all our revenues from investment management contracts with clients. Under these contracts, the investment management fees paid to us are generally based on the market value of AUM. AUM may decline for various reasons. For any period in which revenues decline, our net income and operating margin would likely decline by a greater proportion because a majority of our expenses remain fixed. Factors that could decrease AUM, revenues, and net income include the following:
Declines in the market value of AUM in client portfolios. We cannot predict whether volatility in the markets will result in substantial or sustained declines in the markets generally or result in price declines in market segments in which our AUM are concentrated. Any of the foregoing could negatively impact the market value of our AUM, revenues and net income.
Redemptions and other withdrawals from, or shifting among, client portfolios. These changes could be caused by investors reducing their investments in client portfolios in general or in the market segments in which we focus; investors taking profits from their investments; and portfolio risk characteristics, which could cause investors to move assets to other investment managers. Furthermore, the fees we earn vary with the types of assets being managed, with higher fees earned on actively managed equity and balanced accounts, alternative asset products, and lower fees earned on fixed income, stable value accounts and passively managed products. Our revenues and net income may decline further if clients continue to shift their investments to lower fee accounts.
Our revenues and net income from money market and other fixed income assets may be harmed by interest rates, liquidity and credit volatility.
While inflation declined in 2024, our business is exposed to risks associated with inflation and fluctuations in interest rates should they increase in the future. Certain institutional investors using money market products and other short-term duration fixed income products for cash management purposes may shift these investments to direct investments in comparable instruments in order to realize higher yields. These redemptions would reduce AUM, thereby reducing our revenues and net
income. If securities within a money market portfolio default or investor redemptions force the portfolio to realize losses, there could be negative pressure on its net asset value (NAV). Although money market investments are not guaranteed instruments, the company might decide, under such a scenario, that it is in its best interest to provide support in the form of a support agreement, capital infusion or other methods to help stabilize a declining NAV, which may have an adverse impact on our profitability. Additionally, we have investments, including collateralized loan obligations (CLOs), real estate-related loans, commercial loans and seed capital in fixed income funds, the valuation of which could vary with changes in interest and default rates. Declines in the values of AUM could lead to reduced revenues and net income as management fees are generally calculated based upon the size of AUM.
Our financial condition and liquidity would be adversely affected by losses on our seed capital and co-investments.
The company has investments in managed investment products that invest in a variety of asset classes, including equities, fixed income products, commodities, derivatives, other similar financial instruments, and alternative investment products. Investments in these products are generally made to establish a track record, meet purchase size requirements for trading blocks or demonstrate economic alignment with other investors in our funds. Adverse market conditions may result in the need to write down the value of these seed capital and co-investments, which may adversely affect our results of operations or liquidity. As of December 31, 2024, we had approximately $1,125.6 million in seed capital and co-investments.
As many of our subsidiary operations are located outside of the U.S. and have functional currencies other than the U.S. Dollar, changes in the exchange rates to the U.S. Dollar impact our reported financial results.
The largest component of our net assets, revenues and expenses, as well as our AUM, is presently denominated in U.S. Dollars. However, we have a large number of subsidiaries outside of the U.S. whose functional currencies are not the U.S. Dollar. As a result, fluctuations in the exchange rates to the U.S. Dollar impact our reported financial results. Consequently, significant strengthening of the U.S. Dollar relative to the United Kingdom (U.K.) Pound Sterling, Euro, Chinese RMB, Japanese Yen or Canadian Dollar, among other currencies, could have a material negative impact on our reported financial results.
Risks Related to Investment Performance and Competition
Poor investment performance of our products could reduce the level of our AUM or affect our sales, and negatively impact our revenues and net income.
Our investment performance is critical to the success of our business. Strong investment performance often stimulates sales of our products. Poor investment performance (on a relative or absolute basis) as compared to third-party benchmarks or competitive products has in the past led, and could in the future lead, to a termination of investment management agreements, a decrease in sales of our products or stimulate redemptions from existing products, each of which could lower the overall level of AUM, reduce our management fees and negatively impact our revenues and net income. There is no assurance that past or present investment performance in our products will be indicative of future performance. If we fail, or appear to fail, to address successfully and promptly the underlying causes of any poor investment performance, we may be unsuccessful in reversing such underperformance, which could result in client loss or redemptions and the loss of future business prospects, both of which would negatively impact our revenues and net income.
Failure to properly address the increased transformative pressures affecting the asset management industry could negatively impact our business.
The asset management industry is facing transformative pressures and trends from a variety of different sources, including increased fee pressure; a continued shift away from actively managed fundamental equities and fixed income strategies towards alternatives, passive index and smart beta strategies; increased demands from clients and distributors for client engagement and services; a trend towards institutions concentrating on fewer relationships and partners and reducing the number of investment managers they work with; increased regulatory activity and scrutiny of many aspects of the asset management industry, including ESG practices and related matters, transparency/unbundling of fees, inducements, conflicts of interest, capital, liquidity, solvency, leverage, operational risk management, controls and compensation; addressing the key emerging markets in the world, such as China and India, which often have populations with different needs, preferences and horizons than the more developed U.S. and European markets; advances in technology and digital wealth and distribution tools and increasing client interest in interacting digitally with their investment portfolios; and growing crypto asset markets that remain subject to substantial volatility and significant regulatory uncertainty. As a result of these trends and pressures, the asset management industry is facing an increased level of disruption. If we are unable to adapt our strategy and business to adequately address
these trends and pressures, we may be unable to satisfactorily meet client needs, our competitive position may weaken, and our AUM, revenues, and net income may be adversely affected.
Competitive pressures may force us to reduce the fees we charge to clients, which could reduce our profitability.
The investment management business is highly competitive, and we compete based on a variety of factors, including investment performance, range of products offered, brand recognition, business reputation, financial strength, stability and continuity of client and financial intermediary relationships, quality of service, level of fees charged for services and the level of compensation paid and distribution support offered to financial intermediaries. We continue to face market pressures regarding fee levels in many products, including low fee, passively managed products that compete with our actively managed products.
Our competitors include many investment management firms and other financial institutions. Some of these institutions have greater capital and other resources, and offer more comprehensive lines of products and services, than we do. There are relatively few barriers to entry by new investment management firms, and the successful efforts of new entrants around the world have also resulted in increased competition. Further, our competitors may increase their market share to our detriment by reducing fees. The increasing size and market influence of certain distributors of our products and of certain direct competitors may have a negative impact on our ability to compete at the same levels of profitability in the future.
In addition, technology is subject to rapid advancements and changes and our competitors may, from time to time, implement newer technologies or more advanced platforms for their services and products, including digital advisers, low cost, high speed financial applications and services and investment platforms based on AI and other advanced electronic systems, which could adversely affect our business if we are unable to remain competitive.
Our private market products include investments in private credit, real estate, private market funds of funds and direct equity investments in operating companies that may expose our investment products, our clients and, to the extent of our investment in such investment products, us to risks and liabilities and reputational harm.
Our private market products include investments in private credit, real estate, private market funds of funds and direct equity investments in operating companies that may expose our investment products, our clients and, to the extent of our investment in such investment products, us to risks and liabilities that are inherent in the ownership, management and operation of such investments as well as reputational harm. These may include:
•risks related to the potential illiquidity, valuation and disposition of such investments;
•risks related to emerging and less established companies that have, among other things, short operating histories, not yet achieved or sustained profitability, new technologies and products, nascent control functions, quickly evolving markets and limited financial resources;
•construction risks, including as a result of force majeure, labor disputes or work stoppages, shortages of material or interruptions to the availability of necessary equipment;
•credit risks, including interest-rate movements and an issuer’s ability to make principal and interest payments on the debt it issues;
•risks related to investment in “stressed” and “distressed” securities, including abrupt and erratic market movements, above-average price volatility and bankruptcy;
•risks relating to minority equity investments and joint ventures, including limited control over the applicable portfolio investments or joint ventures;
•risks associated with a lack of diversification, such that any adverse change in one or a small number of issuers could have a material adverse effect on an investment product’s or client’s investments;
•accidents, pandemics, health crises or catastrophic events, climate-related risks, including greater frequency or intensity of adverse weather and natural disasters, that are beyond our control;
•personal injury or property damage;
•risks relating to reliance on underlying managers and funds to effect fund of funds programs;
•risks relating to the use of leverage, including as a result of increasing interest rates or an inability to timely obtain and effectively deploy leverage;
•failures on the part of third-party managers, service providers or sub-contractors appointed in connection with investments or projects to adequately perform their contractual duties or operate in accordance with applicable laws;
•exposure to stringent and complex foreign, federal, state and local laws, ordinances and regulations, including those related to private fund advisers, financial crime, permits, government contracting, conservation, exploration and production, lending, tenancy, occupational health and safety, employment law and regulation, foreign investment and environmental protection;
•environmental hazards;
•changes to the supply and demand for properties and/or tenancies;
•risks related to the availability, cost, coverage and other limitations on insurance;
•the financial resources of tenants or loan counterparties;
•contingent liabilities on disposition of investments; and
•conflicts of interest related to investments in operating companies.
The above risks may expose our investment products, clients and us, to the extent of our investment in such investment products, to expenses and liabilities, including costs associated with delays or remediation and increased legal or regulatory costs, all of which could impact the returns earned by our investment products and clients.
These risks could also result in direct liability for us by exposing us to losses, regulatory sanctions or litigation, including claims for compensatory or punitive damages. In addition, market conditions may change during the course of real estate development projects in which our investment products and clients invest that make such developments less attractive than at the time it was commenced and potentially harm the investment returns of our investment products, our clients and, to the extent of our investment in such investment products, us.
The occurrence of any such events may expose us to reputational harm, or cause our AUM, revenues and net income to decline.
Our investment products, clients and, to the extent of our investment in such investment products, we could incur losses if the allowance for credit losses, including loan and lending-related commitment reserves, of portfolio-level investments is inadequate or if our expectations of future economic conditions deteriorate.
When our investment products or clients loan money, commit to loan money, provide credit or enter into a credit-related contract or mortgage loan with a counterparty, our investment products, clients and, to the extent of our investment in such investment products, we incur credit risk or the risk of loss if the borrower or counterparty does not timely repay its loans or fails to perform according to the terms of its agreement. The revenues and profitability of investment products and clients may be subordinated (and thus exposed to the first level of default risk) or otherwise subject to substantial credit risks. Certain investments, including second lien debt, have a comparatively higher degree of risk of a loss of capital and may not show any return for a considerable period of time.
The revenues and profitability of investment products, clients and, to the extent of our investment in such investment products, us are adversely affected when borrowers and counterparties default, in whole or in part, on their obligations or when there is a significant deterioration in the credit quality of the loan portfolio or decline in the value of collateral. In the event of a default, investment returns will depend on the ability to foreclose and liquidate the collateral. Certain debt-related holdings may be difficult or impossible to dispose of readily at what we believe to be a fair price. Investment products and clients can have exposure to lower-rated instruments and securities, which generally reflects a greater possibility that adverse changes in the financial condition of the borrower or in general economic conditions (including, for example, a substantial period of rising interest rates or declining earnings), or both, may impair the ability of the borrower to make payment of principal and interest.
Current and future market and economic developments may increase default and delinquency rates and negatively impact the quality of the credit portfolio. Although our estimates contemplate current conditions and how we expect them to change over the life of the investment portfolio, it is possible that actual conditions could be worse than anticipated, which could cause our revenues and net income to decline.
We may be unable to develop new products and services, and the development of new products and services may expose us to additional costs or operational risk.
Our financial performance depends, in part, on our ability to develop, market and manage new investment products and services. The development and introduction of new products and services requires continued innovative efforts on our part and may require significant time and resources as well as ongoing support and investment. Substantial risk and uncertainties are associated with the introduction of new products and services, including the implementation of new and appropriate operational controls and procedures, shifting client and market preferences, the introduction of competing products or services and compliance with regulatory requirements. New products often must be in the market place for three or more years in order to generate the track records required to attract significant AUM inflows. Increasingly, clients and intermediaries are looking to investment managers to be able to deliver investment outcomes tailored to particular circumstances and needs, and to augment traditional investment management products and services with additional value-added services. A failure to continue to innovate and introduce successful new products and services or to manage effectively the risks associated with such products and services may impact our market share relevance and may cause our AUM, revenues and net income to decline.
The failure or negative performance of products offered by competitors may have a negative impact on similar Invesco products irrespective of our performance.
Many competitors offer similar products to those offered by us, and the failure or negative performance of competitors’ products could lead to a loss of confidence in similar Invesco products, irrespective of the performance of our products. Any loss of confidence in a product type could lead to withdrawals, redemptions and liquidity issues in such products, which could have a material adverse effect on our AUM, revenues and net income or liquidity.
Risks Related to Human Capital, Operations and Technology
Our investment management professionals and other key employees are a vital part of our ability to attract and retain clients, and the loss of key individuals or a significant portion of those professionals could result in a reduction of our AUM, revenues and net income.
Retaining highly skilled investment management and other in-high demand personnel is important to our ability to attract and retain our clients. The market for skilled investment management professionals and other key personnel is highly competitive. Our policy has been to provide our investment management professionals and other key personnel with a supportive professional working environment and compensation and benefits that we believe are competitive with other leading investment management firms. However, we may not be successful in retaining our investment management professionals and other key personnel, and the loss of significant investment professionals or other key personnel could reduce the attractiveness of our products and services to potential and current clients and could, therefore, adversely affect our AUM, revenues and net income.
Changes in the distribution channels on which we depend could reduce our net income and hinder our growth.
We sell substantially all of our retail investment products through a variety of third-party financial intermediaries. Increasing competition for these distribution channels could cause our distribution costs to rise, which would lower our net income. Certain of the third-party intermediaries upon whom we rely to distribute our investment products also sell their own competing proprietary investment products, which could limit the distribution of our products and certain distributors may demand higher levels of revenue sharing. Similarly, particularly in the U.S., certain distributors have substantially reduced the number of investment funds they make available to their customers. If a material portion of our distributors were to substantially narrow their product offerings, it could have a significant adverse effect on our AUM, revenues and net income. More broadly, in both retail and institutional channels, intermediaries (distribution firms and consultants) are seeking to reduce the number of investment management firms they do business with. While this offers opportunities to the company to have broader and deeper relationships with firms that continue to do business with us, it also poses risks of additional lost business if a particular firm chooses to stop or significantly reduce its business relationship with the company. Any failure to maintain strong business relationships with these intermediaries due to any of the above-described factors would impair our ability to sell our products, which in turn could have a negative effect on our AUM, revenues and net income.
Investors, particularly in the institutional market, rely on external consultants and other third parties for advice on the choice of investment manager. These consultants and third parties tend to exert a significant degree of influence over their clients' choices, and they may favor one of our competitors over us as better meeting their particular clients' needs. There is no assurance that our investment products will be among their recommended choices in the future. Any failure to maintain strong business relationships with the consultant community would impair our ability to sell our products, which in turn could have a negative effect on our AUM, revenues and net income.
Failure to comply with client contractual requirements and/or investment guidelines could result in costs of correction, damage awards and/or regulatory fines and penalties against us and loss of revenues due to client terminations.
Many of the investment management agreements under which we manage assets or provide products or services specify investment guidelines or requirements, such as adherence to investment restrictions or limits, that we are required to observe in the provision of our services. Laws and regulations impose similar requirements for certain investment products. A failure to comply with these guidelines or requirements could result in damage to our reputation or in our clients seeking to recover losses, withdrawing their assets or terminating their contracts. Regulators likewise may commence enforcement actions for violations of such requirements, which could lead to fines and penalties against the company, which could cause our AUM, revenues and net income to decline. We maintain various compliance procedures and other controls to seek to prevent, detect and correct such errors. Significant errors by the company could impact our reputation, AUM, revenues, net income or liquidity.
Our investment advisory agreements are subject to termination or non-renewal, and our fund and other investors may withdraw their assets at any time.
Substantially all our revenues are derived from investment management agreements. Investment management agreements are generally terminable upon 30 or fewer days' notice. Agreements with U.S. registered funds may be terminated with notice, or terminated in the event of an “assignment” (as defined in the U.S. Investment Company Act of 1940, as amended), and must be renewed and approved annually by the disinterested members of each fund's Board of Trustees or Directors, as required by law. In addition, the Boards of Trustees or Directors of certain other funds generally may terminate these investment management agreements upon written notice for any reason. Open-end registered fund and unit trust investors may generally withdraw their funds at any time without prior notice. Institutional clients may elect to terminate their relationships with us or reduce the aggregate amount of AUM, generally on short notice. Any termination of or failure to renew a significant number of these agreements, or any other loss of a significant number of our clients or AUM, would adversely affect our revenues, net income, and liquidity.
The quantitative models we use and our index tracking investment solutions may contain errors, which could result in financial losses or adversely impact product performance and client relationships.
We use various quantitative models to support investment decisions and investment processes, including those related to portfolio management, portfolio risk analysis, and client investment guidance. While we maintain controls to seek to prevent, detect and correct any errors, even effective controls and procedures can only provide reasonable assurance of achieving their control objectives. Any errors in the underlying models or model assumptions could have unanticipated and adverse consequences on our business and reputation. These risks may be heightened by the rapid growth and complexity of new models, evolving data sets and standards, and market volatility. In addition, we offer index tracking investment solutions for our passive products, and any errors or disruptions in our ability to accurately track a subject index could materially adversely affect our business or reputation, which would adversely affect our AUM, revenues, net income, and liquidity.
Disclosure requirements and expectations related to sustainability or ESG are increasing and evolving. Our inability to meet these requirements and expectations could cause regulatory or reputational harm and affect our ability to attract and retain clients.
Requirements and expectations related to commitment to and disclosures around sustainability or ESG topics continue to increase globally. These requirements are distinct from typical financial reporting constructs, given their focus on the disclosure of future sustainability or ESG related goals and targets, the strategy and governance designed to achieve those targets, and reporting of relevant metrics delineating progress towards those targets. Additionally, sustainability or ESG related disclosure requirements may use different definitions of materiality than those used for financial statement disclosures, including a focus on so-called “double materiality,” which can evaluate a sustainability or ESG matter as material, regardless of its direct impact on us, based on broader societal impacts.
Given evolving requirements and the associated standards, methodologies, processes, and controls related to sustainability and ESG related requirements and disclosures that may impact us or our clients, diverging requirements across jurisdictions, and distinct definitions and standards for materiality that could result in conflicting disclosures across frameworks, we may make disclosures that are incorrect or incomplete or fail to make required disclosures, which may result in regulatory or reputational consequences or that may directly or indirectly impact our ability to attract and retain clients.
Further, fiduciary, anti-competitive, voting power, governance, and other concerns with ESG investment strategies continue to be the subject of legislative and regulatory debate globally, particularly at both the federal and state levels in the U.S., the outcomes of which could impact both our asset management business and our clients, as well as, potentially, our investment activities more broadly. Certain U.S. officials have suggested that sustainability or ESG related investing practices may result in violations of law, including antitrust laws, and breaches of fiduciary duty. Views on sustainability or ESG practices, particularly those related to climate issues, have also become part of political discourse, which can amplify the reputational risks associated with such allegations. Further risks related to ESG investment strategies include negative market perception and diminished sales effectiveness and regulatory and litigation consequences associated with greenwashing claims or driven by association with certain clients, industries or products that may be inconsistent with our other clients’ ESG priorities.
If our reputation is harmed, we could suffer losses in our AUM, revenues and net income.
Our business depends on earning and maintaining the trust and confidence of clients, other market participants and regulators, and our good reputation is critical to our business. Our reputation is vulnerable to many threats that can be difficult or impossible to control, and costly or impossible to remediate. Regulatory inquiries, investigations or findings of wrongdoing, intentional or unintentional misrepresentation of our products and services in regulatory filings, product literature, advertising materials, public relations information, social media or other external communications, operational failures (including portfolio management errors or cyber breaches), employee dishonesty or other misconduct and rumors, among other things, can substantially damage our reputation, even if they are baseless or eventually satisfactorily addressed.
Our business also requires us to continuously manage actual and potential conflicts of interest, including situations where our services to a particular client conflict, or are perceived to conflict, with the interests of other clients or our own interests. The willingness of clients to enter into transactions in which such a conflict might arise may be affected if we fail - or appear to fail - to deal appropriately with conflicts of interest. In addition, potential or perceived conflicts could give rise to litigation or regulatory enforcement actions.
We have policies, procedures and controls that are designed to address and manage these risks; however, even effective procedures and controls can only provide reasonable assurance of achieving their objectives. If our policies, procedures or controls fail, our reputation could be damaged. Any damage to our reputation could impede our ability to attract and retain clients and key personnel, and lead to a reduction in the amount of our AUM, any of which could have a material adverse effect on our revenues, net income or liquidity.
The lack of soundness of other financial institutions could adversely affect us or the client portfolios we manage.
Financial services institutions are interrelated as a result of trading, clearing, counterparty or other relationships. We, and the client portfolios that we manage, have exposure to many different industries and counterparties, and routinely execute transactions with counterparties in the financial services industry. Many of these transactions expose us or such client portfolios to credit risk in the event of default of their counterparties. While we regularly conduct assessments of such risk posed by counterparties, an event of default may occur due to market factors, such as sudden swings in the financial and credit markets that may occur swiftly and without warning. Such event of default could produce a financial loss for the company or the client portfolios we manage.
We depend on information technology, and any failures of or damage to, attack on or unauthorized access to our information technology systems or facilities, or those of third parties with which we do business or that facilitate our business activities, including as a result of cyber-attacks, could result in significant limits on our ability to conduct our operations and activities, costs and reputational damage.
We are highly dependent upon the use of various proprietary and third-party information and security technology, software applications and other technology systems to operate our business. We are also dependent on the effectiveness of our information and cyber security infrastructure, policies, procedures and capabilities to protect our technology and digital systems and the data that reside on or are transmitted through them, including data provided by third parties that is significant to portions of our business and products. We use our technology to, among other things, manage and trade portfolio investments, obtain securities pricing information, process client transactions, protect the privacy of clients', employees' and business partners' data, support our other operations and provide other services to our clients.
In recent years, several financial services firms suffered cyber-attacks launched both domestically and from abroad, resulting in the disruption of services to clients, loss or misappropriation of confidential data, litigation and regulatory enforcement actions and reputational harm. Cyber security incidents and cyber-attacks have been occurring globally at a more frequent and severe level. Our status as a global financial institution and the nature of our client base may enhance the risk that we are targeted by such cyber threats. Although we take protective measures, including measures to effectively secure information through system security technology, have many controls, processes, digital backup and recovery processes in place, and seek to continually monitor and develop our systems to protect our technology infrastructure and data from misappropriation or corruption, our technology systems may still be vulnerable to unauthorized access as a result of an external attack, actions by employees or vendors with access to our systems, computer malware or other events that have a security impact and that result in the disclosure or release of confidential information inadvertently or through malfeasance, or result in the loss (temporarily or permanently) of data, applications or systems. The third parties with which we do business or which facilitate our business activities, including financial intermediaries and technology infrastructure, data storage and service providers, are also susceptible to the foregoing risks (including those related to the third parties with which they are similarly interconnected or on which they otherwise rely), and our or their business operations and activities may therefore be adversely affected, perhaps materially, by failures, terminations, errors or malfeasance by, or attacks or constraints on, one or more financial, technology or infrastructure institutions or intermediaries with whom we or they are interconnected or conduct business. Further, third-party service providers may have limited indemnification obligations to us in the event a cyber incident causes us to incur loss or damages.
A breach of our technology systems could damage our reputation and could result in the unauthorized disclosure or modification or loss of sensitive or confidential information (including client data); unauthorized disclosure, modification or loss of proprietary information relating to our business; inability to process client or company transactions and processes; breach and termination of client contracts; liability for stolen assets, information or identity; remediation costs to repair damage caused by the breach, including damage to systems and recovery of lost data; additional security costs to mitigate against future incidents; regulatory actions (including fines and penalties, which could be material) and litigation costs resulting from the incident. Such consequences could have a negative effect on our AUM, revenues and net income.
Our ability to manage and grow our business successfully can be impeded by systems and other technological limitations.
Our continued success in effectively managing and growing our business depends on our ability to integrate our varied accounting, financial, information and operational systems on a global basis. Moreover, adapting or developing the existing technology systems we use to meet our internal needs, as well as client needs, industry demands and new regulatory requirements, is also critical for our business. The introduction of new technologies, such as our State Street Alpha platform, presents new challenges and new potential risks to us. On an ongoing basis, we need to upgrade and improve our technology, including our data processing, financial, accounting, shareholder servicing and trading systems. Implementing any such upgrades, updates or other changes or replacements for our systems may be expensive and time-consuming, could divert management’s focus away from core business activities and may adversely affect our business if additional or unanticipated time or resources are necessary to complete any such changes to our systems. If the updated or new systems, such as our State Street Alpha platform, do not operate as anticipated or if other unforeseen issues arise with the transition to the new or updated systems, our business may be adversely affected. Further, we also must be proactive and prepared to implement new technology when growth opportunities present themselves, whether as a result of a business acquisition or rapidly increasing business activities in particular markets or regions. These needs could present operational issues or require significant capital and may require us to reevaluate the current value and/or expected useful lives of the technology we use, which could negatively impact our AUM, revenues, net income and liquidity.
If we are unable to successfully recover from a man-made or natural disaster, severe weather event, health crisis or pandemic or other business continuity problem, we could suffer material financial loss, loss of human capital, regulatory actions, reputational harm or legal liability.
If we were to experience a man-made or natural disaster, severe weather event, health crisis or pandemic, such as new variant of COVID-19, or other business continuity problem, our continued success will depend, in part, on the availability of our personnel, our office facilities and the proper functioning of our computer, telecommunication and other related systems and operations. In such an event, we believe our operational size, multiple office locations and our existing back-up systems should mitigate adverse impacts. Nevertheless, given our global presence, we could still experience near-term operational problems with regard to particular areas of our operations. Although we seek to regularly assess and improve our existing business continuity plans, a major disaster, a disaster that affected certain important operating areas, or our inability to successfully recover should we experience a disaster or other business continuity problem, could materially interrupt our business operations and cause material financial loss, loss of human capital, regulatory actions, reputational harm or legal liability.
The extent to which our business, revenues, AUM and net income are affected by a future pandemic or a new variant of COVID-19 will largely depend on new events or future developments, which cannot be accurately predicted and are uncertain, including the duration, severity and the length of time it will take for the economy to recover from the negative impacts on human capital and potentially more permanent impacts on how we operate and serve our clients.
Our business is vulnerable to deficiencies and failures in support systems, including data management, and customer service functions that could lead to breaches and errors or reputational harm, resulting in loss of customers or claims against us or our subsidiaries.
In addition to investment management, our services include fund administration, sales, distribution, marketing, shareholder servicing and trust, custody and other fiduciary services and portfolio management software services. We must properly perform our responsibilities associated with the forgoing services, including portfolio recordkeeping and accounting, security pricing, corporate actions, investment restrictions compliance, daily NAV computations, account reconciliations and required distributions to fund shareholders. The ability to consistently and reliably perform such services is essential to our continuing success. Certain types of securities may experience liquidity constraints that could impact fair value pricing, which is dependent on certain subjective judgments that have the potential to be challenged. Any delays or inaccuracies in obtaining pricing information, processing transactions or reports, other breaches and errors and/or any inadequacies in customer service, could result in reimbursement obligations or other liabilities, or alienate clients or distributors and/or claims against us. Our ability to conduct any of the foregoing actions is highly dependent on communications and information systems and on third-party service providers and their related technology systems and platforms. Certain of these processes involve a degree of manual input, and thus errors could occur. In addition, our operations and processes rely on commercially available data provided by third parties as well as providers of services, including technology services, and operating errors, process failures or failures to comply with data usage requirements with respect to these service providers may adversely impact us. Our data providers commonly disclaim the accuracy and completeness of data and we do not have the ability to validate or verify the accuracy and completeness of commercially sourced datasets. Our failure to properly perform and monitor our operations, including data management, or our otherwise suffering deficiencies and failures in these systems or service functions due to a failure of a third-party service provider or other key vendor could result in material financial loss or costs, regulatory actions, breach of client contracts, reputational harm or legal claims and liability, which in turn could have a negative effect on our AUM, revenues and net income.
Disruptions in the markets, to market participants and to the operations of third parties whose functions are integral to our ETF platforms may adversely affect the prices at which ETFs trade, particularly during periods of market volatility.
The trading price of an ETF’s shares or units fluctuates continuously throughout trading hours. While an ETF’s creation/redemption feature and the arbitrage mechanism are designed to make it more likely that the ETF’s shares or units normally will trade at prices close to the ETF’s NAV, exchange prices may deviate significantly from the NAV. ETF market prices are subject to numerous potential risks, including significant market volatility; imbalances in supply and demand; trading halts invoked by a stock exchange; and inability or unwillingness of market makers, authorized participants, settlement systems or other market participants to perform functions necessary for an ETF’s arbitrage.
If market events lead to instances where an ETF trades at prices that deviate significantly from the ETF’s NAV or indicative value, or trading halts are invoked by the relevant stock exchange or market, investors may lose confidence in ETF products and sell their holdings, which may cause our AUM, revenue and net income to decline.
The recent advancements in and increased use of AI present risks and challenges that may adversely impact our business.
We or our third-party vendors, clients or counterparties have developed, and may continue to develop or incorporate AI technology in certain business processes, services or products. The development and use of AI present a number of risks and challenges to our business. The legal and regulatory environment relating to AI is uncertain and rapidly evolving, in the U.S., and internationally, and includes regulation targeted specifically at AI technology, as well as provisions in intellectual property, privacy, consumer protection, employment and other laws applicable to the use of AI. These evolving laws and regulations could require changes in our implementation of AI technology, increase our compliance costs and the risk of non-compliance, and restrict or impede our ability to develop, adopt and deploy AI technologies efficiently and effectively. AI models, particularly generative AI models, may produce output or take action that is incorrect or outdated, that result in the release of personal, confidential or proprietary information, that reflect biases included in the data on which they are trained or introduced during the training or fine tuning process, that infringe on the intellectual property rights of others, or that is otherwise harmful. In addition, the complexity of many AI models makes it challenging to understand why they are generating particular outputs. This limited transparency increases the challenges associated with assessing the proper operation of AI technology, understanding and monitoring the capabilities of the AI technology developed by third parties and, to that extent, are dependent
in part on the manner in which those third parties develop and train their models. This results in risks arising from the inclusion of any unauthorized material in the training data for their models, and the effectiveness of the steps these third parties have taken to limit the risks associated with the output of their models, matters over which we may have limited visibility. Any of these risks could expose us to liability or adverse legal or regulatory consequences and harm our reputation and the public perception of our business or the effectiveness of our security measures. In addition to our use of AI technologies, we are exposed to risks arising from the use of AI technologies by bad actors to commit fraud and misappropriate funds and to facilitate cyberattacks. Generative AI, if used to perpetrate fraud or launch cyberattacks, could result in losses, liquidity outflows, or other adverse effects at a particular financial institution or exchange. If our use of AI becomes controversial, we may experience brand or reputational harm, competitive harm, or legal liability.
Risks Related to Accounting, Capital Management and Liquidity
The carrying value of goodwill and other intangible assets on our balance sheet has become impaired in the past and could become impaired in the future, which would adversely affect our results of operations.
We have goodwill and indefinite-lived intangible assets on our balance sheet that are subject to annual impairment reviews. We also have definite-lived intangible assets on our balance sheet that are subject to impairment testing. Goodwill and intangible assets totaled $8,318.1 million and $5,749.3 million, respectively, at December 31, 2024. We recorded a non-cash impairment of $1,248.9 million related to our indefinite-lived intangible assets related to acquired management contracts of U.S. retail mutual funds during the year ended December 31, 2023, and we may not realize the full value of our remaining goodwill and indefinite-lived intangible assets. We perform impairment reviews of these assets on an annual basis, or more frequently if impairment indicators are present. A variety of factors can result in impairment. Should the fair value be less than the carrying amount of either the goodwill or intangible assets, a write-down of the related assets would occur, adversely affecting our net income for the period. See Item 7, “Management's Discussion and Analysis of Financial Condition and Results of Operations - Critical Accounting Policies - Goodwill” and “- Intangibles,” for additional details of our impairment analysis process.
Our revolving credit agreement imposes operating covenants that impact our ability to conduct certain activities and, if amounts borrowed under it were subject to accelerated repayment, we might not have sufficient assets or liquidity to repay such amounts in full.
Our revolving credit agreement requires us to maintain specified financial ratios, including maximum debt-to-earnings and minimum interest coverage ratios. The revolving credit agreement also contains customary affirmative operating covenants and negative covenants that, among other things, restrict certain of our subsidiaries' ability to incur debt and restrict our ability to transfer assets, merge, make loans and other investments and create liens. The breach of any covenant could result in a default under the revolving credit agreement. In the event of any such default, lenders that are party to the revolving credit agreement could refuse to make further extensions of credit to us and require all amounts borrowed under the revolving credit agreement, together with accrued interest and other fees, to be immediately due and payable. If any indebtedness under the revolving credit agreement were subject to accelerated repayment, and if we had at that time a significant amount of outstanding debt under the revolving credit agreement, we might not have sufficient liquid assets to repay such indebtedness in full.
We issued perpetual preferred stock having a value of approximately $4 billion, which could adversely affect our ability to raise additional capital and may limit our ability to fund other priorities.
We issued approximately $4 billion of 5.9% fixed rate perpetual preferred stock in connection with the acquisition of OppenheimerFunds Inc. This issuance may limit our ability to obtain additional financing for working capital, capital expenditures, debt service requirements, acquisitions and general corporate or other purposes, may restrict our ability to pay dividends to holders of common shares in certain circumstances, may increase our vulnerability to general economic and industry conditions, and will require a significant portion of cash flow from operations to make required dividend payments to preferred shareholders.
Failure to maintain adequate corporate and contingent liquidity may cause our AUM, revenues and net income to decline, as well as harm our prospects for growth.
Our ability to meet anticipated cash needs depends upon a number of factors, including our creditworthiness and ability to generate operating cash flows. Failure to maintain adequate liquidity could lead to unanticipated costs and force us to revise existing strategic and business initiatives. Our access to equity and debt markets on reasonable terms may be limited by adverse market conditions, including tax and interest rates, a reduction in our long- or short-term credit ratings, or changes in government regulations. Failure to obtain funds and/or financing, or any adverse change to the cost of obtaining such funds and/or financing, may cause our AUM, revenues and net income to decline, curtail our operations and limit or impede our prospects for growth.
Distribution of earnings of our subsidiaries may be subject to limitations, including net capital requirements.
Substantially all of our operations are conducted through our subsidiaries. As a result, our cash flow and ability to fund operations are dependent upon the earnings of our subsidiaries and the distribution of earnings, intercompany loans or other payments by our subsidiaries to us. Any payments to us by our subsidiaries could be subject to statutory, regulatory or contractual restrictions and are contingent upon our subsidiaries' earnings and business or regulatory considerations. For example, certain of our subsidiaries are required under applicable laws and regulations to maintain appropriate levels of capital. Our financial condition or liquidity could be adversely affected if certain of our subsidiaries are unable to distribute funds to us.
All of our regulated European Union (EU) and U.K. subsidiaries are subject to capital requirements under applicable EU and U.K. requirements, and we maintain capital within this European sub-group to satisfy these regulations. We meet these requirements in part by holding cash and cash equivalents. This retained cash can be used for general business purposes in the European sub-group in the countries where it is located. Due to the capital restrictions, the ability to transfer cash between certain jurisdictions may be limited. In addition, transfers of cash between international jurisdictions may have adverse tax consequences. As of December 31, 2024, our minimum regulatory capital requirement was $324.9 million. Complying with our regulatory commitments may result in an increase in the capital requirements applicable to the European sub-group. Finally, as a result of regulatory requirements, certain of these subsidiaries may be required to limit their dividends to the company.
Risks Related to Strategic Transactions
We may engage in strategic transactions that could create risks.
We regularly review, and from time-to-time engage in strategic transactions, some of which may be material. Strategic transactions also pose the risk that any business we acquire may lose customers or employees or could underperform relative to expectations. We could also experience financial or other setbacks if potential or actual acquisitions or divestitures encounter unanticipated problems, including problems related to closing or integration. Following the completion of a strategic acquisition, we may have to rely on the seller to provide administrative and other support, including financial reporting and internal controls, to the acquired business for a period of time. There can be no assurance that such sellers will do so in a manner that is acceptable to us.
Risks Related to our Significant Shareholders
Future sales of shares of our common stock could adversely impact the trading price of our common stock.
If our significant shareholders sell substantial amounts of our common stock or express an intention to sell, or there is the perception that such sales may occur, such actions could have a significant impact on our common share trading price. In addition, if we sell substantial amounts of our common stock in the public market, or there is a perception that such sales may occur, the market price of our common stock could be negatively impacted.
MassMutual has the ability to significantly influence our business, and MassMutual’s interest in our business may be different from that of other shareholders.
MassMutual is entitled to designate an individual to serve on our board so long as it beneficially owns at least (i) 10% of our issued and outstanding shares of common stock or (ii) 5% of our issued and outstanding shares of common stock and $2.0 billion in aggregate liquidation preference of our Series A preferred shares. Additionally, we are not permitted to take certain actions without the prior written approval of MassMutual, including making certain changes in our capital structure or our organizational documents, adopting a shareholder rights plan or effectuating certain business combination transactions. MassMutual’s level of ownership and influence may make some transactions (such as those involving mergers, material share issuances or changes in control) more difficult or impossible without the support of MassMutual, which in turn could adversely affect the market price of our shares of common stock or prevent our shareholders from realizing a premium over the market price for their shares of our common stock. The interests of MassMutual may conflict with the interests of other shareholders.
Further, MassMutual has made significant capital or seed investments in several of our products. If MassMutual decides not to provide additional capital or seed investments in the future or to withdraw material amounts of capital or seed investments in existing products, it could impact our ability to timely launch new products or impact existing products.
Risks Related to Regulatory and Legal Matters
We operate in an industry that is highly regulated in most countries, and any enforcement action or proceeding against us or significant changes in the laws or regulations governing our business or industry could damage our reputation or decrease our AUM, revenues, net income and liquidity.
As with all investment management companies, our activities are highly regulated in nearly every country in which we conduct business. The regulatory environment in which we operate frequently changes, and in recent years we have seen a significant increase in both regulatory changes and enforcement actions and proceedings brought by governmental agencies and self-regulatory authorities against financial services companies. Laws and regulations generally grant governmental agencies and industry self-regulatory authorities broad administrative discretion over our activities, including the power to require registrations or licenses, limit or restrict our business activities, conduct examinations, risk assessments, investigations and capital adequacy reviews and impose remedial programs to address perceived deficiencies. As a result of regulatory oversight, we could face requirements, actions or proceedings that negatively impact the way in which we conduct business, delay or deny approval for new products or service offerings, cause or contribute to reduced sales of or increased redemptions of our existing products or services, impair the investment performance of certain of our products or services, impact our product mix, increase our compliance costs and/or impose additional capital requirements. Our regulators likewise have the authority to commence enforcement actions or proceedings that could lead to penalties and sanctions up to and including the revocation of registrations or licenses necessary to operate certain businesses, the suspension or expulsion from a particular jurisdiction or market of any of our business organizations or their key personnel or the imposition of fines and censures on us or our employees. Further, regulators across borders can coordinate actions against us as issues arise resulting in impacts on our business in multiple jurisdictions. Judgments or findings of wrongdoing or non-compliance with applicable law or regulation by governmental authorities, or in private civil litigation against us, could affect our reputation, increase our costs of doing business and/or negatively impact our revenues. Any of the effects discussed above could have a material negative impact on our AUM, revenue, net income or liquidity.
A substantial portion of the products and services we offer in the U.S. are regulated by the SEC, Financial Industry Regulatory Authority, Commodity Futures Trading Commission, the National Futures Association, Department of Labor (DOL) and/or the Texas Department of Banking and in the U.K. are regulated by the Financial Conduct Authority (FCA), and in Hong Kong and China are regulated by the Securities Futures Commission of Hong Kong (SFC) and the China Securities Regulatory Commission, respectively. Subsidiaries operating in the EU and the products and services they provide are mainly regulated by the Commission de Surveillance du Secteur Financier in Luxembourg, the Central Bank of Ireland, the Bundesanstalt für Finanzdienstleistungsaufsicht in Germany and the European Securities and Markets Authority (ESMA). Such subsidiaries are also subject to various EU Directives, which generally are implemented by member state national legislation and by EU Regulations. Our operations elsewhere in the world are regulated by similar agencies and authorities.
Regulators in the U.S., U.K., EU and Asia, have promulgated or are considering whether to promulgate various new or revised regulatory measures pertaining to financial services, including investment management.
Regulatory developments and changes specific to our business will or may include, without limitation:
•Regulations that place restrictions on outbound investments, such as the U.S. Department of Treasury’s Outbound Investment Screening Rule that became effective earlier this year, may impede our ability to provide certain products and add complexity to our compliance program with heightened regulatory requirements.
•Regulations pertaining to the privacy and use, security, transfer and management of personal data with respect to clients, employees and business partners. Privacy regulations such as the General Data Protection Regulation (GDPR) in Europe have strengthened privacy rules for organizations handling personal data, granted individuals more rights and control over the use of their personal data, and greatly increased penalties for non-compliance. In many other jurisdictions similar regulations, such as the California Consumer Privacy Act, India’s Digital Personal Data Protection Act, China’s Personal Information Protection Law and the Bermuda Personal Information Protection Act (PIPA), have been adopted. In addition, rules and legal requirements for international transfers of personal data from Europe and Asia, create additional complexity and risk, particularly regarding integrated global cloud-based systems and business services employed by us.
•Regulations promulgated to address perceptions that the asset management industry, or certain products or services provided by the industry, pose systematic risks to the financial system, which could impede our ability to provide certain products or services or subject us, certain of our activities or products to heightened regulation or increased liquidity or capital adequacy requirements.
•Regulations aimed at addressing concerns regarding open-end funds that are investing in less liquid asset classes. Regulators in the U.S., U.K. and EU have expressed concern that the daily redeemability features of these funds may create a “liquidity mismatch” with the assets in which they invest, and that can give rise to investor dilution and systemic risk, especially in times of financial market stress. In the EU, recent amendments to the Undertakings for the Collective Investment in Transferable Securities (UCITS) and Alternative Investment Fund Managers (AIFMD) directive frameworks introduce new rules regarding the use of certain liquidity management tools (e.g., swing pricing and side pockets) by UCITS funds and AIFs. In the U.S., the SEC has proposed changes to the regulations governing liquidity risk management programs for registered open-end funds (including ETFs) that, if finalized without change, could impede our ability to sponsor mutual funds and ETFs that invest in certain asset classes, including syndicated bank loans.
•Regulations aimed at the use of leverage by funds (in particular, leverage attained through derivatives), an example of which is the SEC’s 2020 rules with respect to the use of derivatives by U.S. registered funds. New or further regulations in this area could negatively impact our existing products that employ leverage or derivatives, impede our ability to bring new products to market and raise our compliance costs associated with sponsoring and managing products that employ leverage or derivatives.
•Regulations pertaining to the integration of ESG factors in asset management. These regulations have materially impacted the asset management industry in the EU and U.K. In particular, the integration of sustainability risks, the disclosure of information on the ESG characteristics of EU products and the integration of investors’ ESG preferences at the point of sale have had a significant impact on the features of EU products and on investment management activities. In the U.K., the FCA published a new regime on sustainability disclosure requirements, including product sustainability labels, that became applicable in 2024. In the EU, ESMA published in 2024 new guidelines on fund naming aimed at avoiding greenwashing practices. Separately, several changes to the Sustainable Finance Disclosure Regulation (SFDR) are being considered, including changes to the current ESG disclosure templates and longer-term amendments to the broader SFDR framework. On top of the disclosure obligations applying to the financial sector, the EU Corporate Sustainability Reporting Directive sets out new ESG disclosure requirements for EU undertakings based on new European standards. The new regime will have an impact on EU domiciled companies and on non-EU groups having substantial activities in the EU, including us. The SEC and other regulators in the U.S. are pursuing similar initiatives albeit with varying requirements, and the SEC during the past several years has increased its enforcement activity relating to ESG disclosures and practices of asset managers. Equally, a number of Asian jurisdictions are introducing climate-related risk and reporting requirements as well as ESG product disclosure standards.
•Enhanced licensing and qualification requirements for key personnel of financial services firms, including asset managers, such as the U.K. Senior Managers and Certification Regime and the SFC's Manager-in-Charge Regime, which could make it more difficult for the company to hire and retain key personnel.
•Strengthened laws and regulations applicable to asset managers with respect to preventing money laundering and the financing of terrorism, which may increase our compliance costs and burdens and regulatory enforcement risk. In June 2024, the EU introduced a new set of measures that resulted in the establishment of the Anti Money Laundering Authority (AMLA), which will gradually assume the supervision and regulatory responsibilities for anti-money laundering within the EU.
•Regulations promulgated to address risks of fraud, malfeasance, adverse consequences stemming from cyber-attacks and/or cross-border data transfer, and to ensure the digital operational resilience of firms. In particular, the new EU Digital Operational Resilience Act harmonizes the requirements applying to Information and Communication Technology risk management, outsourcing and operational resilience in the financial sector.
•The application of antitrust, change in bank control and similar competition laws and regulations to the asset
management industry, including proposed amendments to these laws and regulations that could require asset managers to make pre-acquisition notification filings or requests for approval with the U.S. Federal Trade Commission, Department of Justice and/or U.S. banking regulators and the potential for antitrust regulators to promulgate regulations limiting common ownership of competitive companies by a single fund or by affiliated funds in a single fund complex. Developments in these laws and regulations and their application to our business could impede our ability to provide certain products or limit the AUM of certain investment strategies that we provide.
•Guidelines regarding the structure and components of fund manager compensation and other related rules, regulations and disclosure requirements. Certain proposals could impose requirements for more widespread disclosures of compensation to highly-paid individuals. Depending upon the scope of any such requirements, we could be disadvantaged in retaining key employees vis-à-vis private companies, including hedge fund sponsors.
We cannot predict the full impact of legal and regulatory changes, changes in the interpretation of existing laws and regulations or possible enforcement actions or proceedings on our business. Such changes have imposed, and are likely to continue to impose, new compliance costs and/or capital requirements or impact us in other ways that could have a material adverse impact on our AUM, revenues, net income or liquidity. Moreover, certain legal or regulatory changes could require us to modify our strategies, businesses or operations, and we may incur other new constraints or costs, including the investment of significant management time and resources to satisfy new regulatory requirements or to compete in a changed business environment. In recent years, certain regulatory developments have also added to downward pressures on our fee levels.
Civil litigation and governmental investigations and enforcement actions or proceedings against us could adversely affect our AUM and future net income and increase our costs of doing business.
We and certain of our subsidiaries have in recent years been subject to various legal proceedings, including civil litigation and governmental investigations and enforcement actions and proceedings. These actions can arise from normal business operations and/or matters that have been the subject of previous regulatory examinations. As a global company with investment products registered in numerous countries and subject to the jurisdiction of one or more regulators in each country, at any given time our business operations may be subject to review, investigation or disciplinary action. For example, governmental agencies and authorities regularly make inquiries, hold investigations and administer examinations with respect to the company's compliance with applicable laws and regulations. Lawsuits or regulatory enforcement actions arising out of these inquiries may in the future be filed against the company its subsidiaries and/or its employees. Judgments in civil litigation or findings of wrongdoing by these agencies or authorities against us could affect our reputation, result in damages, fines, penalties or sanctions for which we would be responsible, increase our costs of doing business and/or negatively impact our revenues, any of which could have a material negative impact on our AUM, revenues, net income or liquidity.
Legislative and other measures that may be taken by governmental authorities could materially increase our tax burden or otherwise adversely affect our net income or liquidity.
The international tax environment continues to change as a result of both coordinated actions by governments and unilateral measures designed by individual countries, both intended to address concerns over tax base erosion, profit shifting, and perceived international tax avoidance. A growing number of jurisdictions have enacted, or have announced that they will enact, legislation to implement aspects of The Organization for Economic Cooperation and Development’s (OECD) global anti-base erosion rules intended to ensure that multinational companies pay a 15% minimum level of tax on a jurisdictional basis. In most jurisdictions, the new minimum tax rules are effective in 2024 with certain aspects of the rules becoming effective in 2025. In addition, in response to the OECD’s minimum tax proposal, Bermuda has enacted a corporate tax regime with a tax rate of 15%, effective January 1, 2025. As a result of these developments, our tax liabilities could increase.
We continually assess the impact of various U.S. federal, state and foreign legislative proposals and modifications to existing tax treaties, which could result in a material increase in our tax liability. We cannot predict the outcome of any specific legislative proposals. However, if unfavorable legislation were to be enacted, or if modifications were to be made to certain existing tax treaties, the consequences could have a materially adverse impact on the company, including increasing our tax burden, increasing the cost of our tax compliance or otherwise adversely affecting our future net income and liquidity.
In addition, changes in individual and corporate income tax rates, including the capital gains and dividend tax rates, could cause investors to view certain investment products we manage less favorably and reduce investor demand for the products and services we offer, which could have an adverse effect on our AUM, revenues and net income.
Examinations and audits by tax authorities could result in additional tax payments for prior periods.
The company and its subsidiaries are subject to income and non-income based taxes in numerous jurisdictions as well as current and potentially future tax audits. The calculation of our tax liabilities involves dealing with uncertainties in the application of complex tax regulations in a multitude of jurisdictions. Tax authorities may disagree with certain positions we have taken and assess additional taxes (and, in certain cases, interest, fines or penalties). We accrue tax liabilities for certain tax issues based on our estimate of whether, and the extent to which, additional taxes may be due. We adjust these liabilities periodically due to changes in interpretations of tax laws, status of tax authority examinations and new regulatory or judicial guidance that could impact the relative merits and risks of tax positions. Due to the complexity of these tax issues, the ultimate resolution may result in a payment of tax that is materially different from the liability that has been accrued or an increase in the cost of our tax compliance, which could have an adverse effect on our net income and liquidity.
Bermuda law differs from the laws in effect in the U.S. and may afford less protection to shareholders.
Our shareholders may have more difficulty protecting their interests than shareholders of a company incorporated in a jurisdiction of the U.S. As a Bermuda company, we are governed by the Companies Act 1981 of Bermuda (the Companies Act). The Companies Act differs in some material respects from laws generally applicable to U.S. corporations and shareholders, including provisions relating to interested directors, mergers, amalgamations and acquisitions, takeovers, shareholder lawsuits and indemnification of directors.
Under Bermuda law, the duties of directors and officers of a company are generally owed to the company only. Shareholders of Bermuda companies do not generally have rights to take action against directors or officers of the company, and may do so only in limited circumstances described in the following paragraph. However, directors and officers may owe duties to a company's creditors in cases of impending insolvency. Directors and officers of a Bermuda company must, in exercising their powers and performing their duties, act honestly and in good faith with a view to the best interests of the company and must exercise the care and skill that a reasonably prudent person would exercise in comparable circumstances. Directors have a duty not to put themselves in a position in which their duties to the company and their personal interests may conflict and also are under a duty to disclose any personal interest in any material contract or proposed material contract with the company or any of its subsidiaries. If a director or officer of a Bermuda company is found to have breached such director’s duties to that company, the director may be held personally liable to the company in respect of that breach of duty.
Class actions and derivative actions are generally not available to shareholders under the laws of Bermuda. However, Bermuda courts ordinarily would be expected to follow English case law precedent, which would permit a shareholder to commence an action in a company's name against the directors and officers to remedy a wrong done to the company where the act complained of is alleged to be beyond the company's corporate power or is illegal or would result in the violation of the company's memorandum of association or Bye-Laws. Furthermore, consideration would be given by the court to acts that are alleged to constitute a fraud against the minority shareholders or where an act requires the approval of a greater percentage of shareholders than actually approved it. Under our Bye-Laws, each of our shareholders agrees to waive any claim or right of action, both individually and on our behalf, other than those involving fraud or dishonesty, against the company or any of our officers, directors or employees. The waiver applies to any action taken by a director, officer or employee, or the failure of such person to take any action, in the performance of his or her duties, except with respect to any matter involving any fraud or dishonesty on the part of the director, officer or employee. This waiver limits the right of shareholders to assert claims against our directors, officers and employees unless the act or failure to act involves fraud or dishonesty.
Our Bye-Laws also provide for indemnification of our directors and officers in respect of any loss arising or liability attaching to them in respect of any negligence, default, breach of duty or breach of trust of which a director or officer may be guilty in relation to the company other than in respect of his or her own fraud or dishonesty, which is the maximum extent of indemnification permitted under the Companies Act.
Because we are incorporated in Bermuda, it may be difficult for shareholders to enforce non-monetary judgments against us or any judgment against us or our directors and officers. Shareholders may have to seek independent advice regarding the commencement of proceedings or service of foreign process in Bermuda.
The company is organized under the laws of Bermuda. In addition, certain of our officers and directors reside in countries outside the U.S. A substantial portion of the company's assets and the assets of these officers and directors are or may be located outside the U.S. Investors may have difficulty effecting service of process within the U.S. on our directors and officers who reside outside the U.S., even though the company has appointed an agent in the U.S. to receive service of process.
Further, it may not be possible in Bermuda or in countries other than the U.S. where the company has assets, to enforce court judgments obtained in the U.S. against the company based on the civil liability provisions of U.S. federal or state securities laws. We have been advised by our legal advisors in Bermuda that the U.S. and Bermuda do not currently have a treaty providing for the reciprocal recognition and enforcement of judgments in civil and commercial matters. Some remedies available under the laws of the U.S. or the states therein, including some remedies available under the U.S. federal securities laws, may not be allowed in Bermuda courts because they may be found to be contrary to Bermuda public policy. Therefore, a final judgment for the payment of money rendered by any federal or state court in the U.S. based on civil liability, whether or not based solely on U.S. federal or state securities laws, would not automatically be enforceable in Bermuda. Similarly, those judgments may not be enforceable in countries other than the U.S.
We have anti-takeover provisions in our Bye-Laws that may discourage a change of control.
Our Bye-Laws contain provisions that could make it more difficult for a third-party to acquire us or to obtain majority representation on our Board of Directors (Board) without the consent of our Board. As a result, shareholders may be limited in their ability to obtain a premium for their shares under such circumstances.
Specifically, our Bye-Laws contain the following provisions that may impede or delay a third-party to acquire or obtain majority representation on our Board:
•we are prohibited from engaging, under certain circumstances, in a business combination (as defined in our Bye-Laws) with any interested shareholder (as defined in our Bye-Laws) for three years following the date that the shareholder became an interested shareholder;
•our Board, without further shareholder action, is permitted by our Bye-Laws to issue preference shares, in one or more series, and determine by resolution any designations, preferences, qualifications, privileges, limitations, restrictions or special or relative rights of an additional series. The rights of preferred shareholders may supersede the rights of common shareholders;
•shareholders may only remove directors for “cause” (defined in our Bye-Laws to mean willful misconduct or gross negligence which is materially injurious to the company, fraud or embezzlement, or a conviction of, or a plea of “guilty” or “no contest” to, a felony);
•our Board is authorized to expand its size and fill vacancies; and
•shareholders cannot act by written consent unless the consent is unanimous.
General Risk Factors
Our ability to maintain our credit ratings and to access the capital markets in a timely manner should we seek to do so depends on a number of factors.
Our access to the capital markets depends significantly on our credit ratings. We anticipate that the rating agencies will continue to review our ratings regularly based on our results of operations and developments in our business. We believe that, in addition to factors specific to our company, rating agency concerns include the fact that our revenues are exposed to financial market volatility and the potential impact from regulatory changes to the industry. Additionally, the rating agencies could decide to downgrade the entire investment management industry based on their perspective of future growth and solvency. As further described below, any material deterioration of these factors, and others defined by each rating agency, could result in downgrades to our credit ratings, thereby limiting our ability to access additional financing, increasing the cost of such financing and/or limiting our ability to maintain investment management mandates, particularly in the institutional channel.
Our revolving credit agreement borrowing rates are tied to our credit ratings. A reduction in our long-term credit ratings could increase our borrowing costs, could limit our access to the capital markets and may result in outflows, thereby reducing AUM, revenues and net income. Volatility in global financing markets may also affect our ability to access the capital markets should we seek to do so. If we are unable to access capital markets in a timely manner, our business could be adversely affected.
Insurance may not be available at a reasonable cost to protect us from loss or liability.
We face the inherent risk of loss or liability related to claims from clients, third-parties, actions taken by regulatory agencies and costs and losses associated with operations failures, including cyber incidents. To help protect against these risks, we purchase insurance in amounts and at deductible levels, and against potential losses and liabilities that we consider appropriate, where such insurance is available at prices we deem reasonable. There can be no assurance, however, that a claim will be covered by insurance or, if covered, will not exceed coverage limits, that an insurer will meet its obligations regarding coverage, or that coverage will continue to be available on a cost-effective basis. Insurance costs are impacted by market
conditions, claims made on policies and our risk profile and may increase significantly over relatively short periods. In addition, certain insurance coverage may not be available or may only be available at prohibitive costs. Renewals of insurance policies may expose us to additional costs through higher premiums or the assumption of higher deductibles or co-insurance liability.
Item 1B. Unresolved Staff Comments
None.
Item 1C. Cybersecurity
Cyber threats are considered one of the most significant risks facing financial institutions. To mitigate that risk, we have a designated Global Chief Security Officer (GCSO) who leads our Global Security Department, which is responsible for identifying, assessing, and managing cybersecurity threats. Our GCSO has experience in the public and private sectors, specializing in security, investigations, and incident response. The Global Security Department oversees, among others, the following groups across Invesco: Information Security, Strategic Intelligence, Corporate Security, Business Continuity, Crisis Management, Global Privacy Office, Business Security, Projects and Strategy. This structure supports a more comprehensive, holistic approach to keeping our clients, employees, and critical assets safe, upholding privacy rights, and enabling a secure and resilient business.
The information security program for the company, excluding the subsidiary noted below, is led by our Chief Information Security Officer (CISO) who reports directly to the GCSO and has extensive experience in information security and risk management. Our information security program is designed to oversee all aspects of information security risk and seeks to ensure the confidentiality, integrity, and availability of information assets, including the implementation of controls aligned with industry guidelines and applicable statutes and regulations to identify threats, detect attacks and protect our information assets.
One company subsidiary operates on a distinct network and, therefore, manages its own information security program in close coordination with our Global Security Department. This subsidiary’s program aligns with all aspects of the company's information security program and is led by a dedicated CISO who reports to the Chief Operating Officer of the subsidiary and has comprehensive experience managing cybersecurity programs. The GCSO has indirect oversight of the subsidiary's CISO and its information security program.
Our cybersecurity programs include the following:
•Proactive assessments of technical infrastructure and security resilience are performed on a regular basis, which include penetration testing, offensive testing and maturity assessments.
•Conducting due diligence on third-party service providers regarding cybersecurity risks prior to on-boarding, periodic assessment of cybersecurity risks for existing third-party service providers and continuous monitoring for new third-party cybersecurity incidents.
•An incident response program that includes periodic testing and is designed to restore business operations as quickly and as orderly as possible in the event of a cybersecurity incident at Invesco or a third-party.
•Mandatory annual employee security awareness training, which focuses on cyber threats and security in general.
•Regular cyber phishing tests throughout the year to measure and raise employee awareness of cyber phishing threats.
Important to these programs is our investment in threat intelligence, our active engagement in industry and government security-related forums, and our utilization of external experts to challenge our program maturity, assess our controls and routinely test our capabilities.
The company's Board oversees cybersecurity risk and receives updates, at a minimum, twice a year regarding cybersecurity, including risks and protections. The Global Operational Risk Management Committee, one of the company's risk management committees, provides executive-level oversight and monitoring of the end-to-end programs dedicated to managing information security and cyber related risk. The members of this Committee include the Chief Information and Operations Officer, Chief Risk and Audit Officer, General Counsel, Chief Financial Officer, Chief Human Resources Officer, Global Head of Compliance, as well as other Global Operational Risk Owners which includes the GCSO. The Committee reports to the Enterprise Risk Management Committee, which provides updates to the Board to facilitate its oversight. For the subsidiary referenced above, an Enterprise Risk Management Steering Committee provides executive-level oversight and monitoring of its programs that manage information security and cyber related risk. The members of this Enterprise Risk Management Steering Committee include the subsidiary’s Chief Executive Officer (CEO), Chief Operating Officer, Head of Risk, Head of Legal,
Head of Privacy and the subsidiary’s CISO, as well as the company’s GCSO and CISO. The subsidiary’s CISO provides updates to the Board to facilitate its oversight at least annually.
As of December 31, 2024, we have not experienced any cyber incidents that have materially affected or are reasonably likely to materially affect Invesco’s business strategy, results of operations or financial condition.
Item 2. Properties
Our registered office is located in Hamilton, Bermuda, and our corporate headquarters is in leased office space at 1331 Spring Street, Suite 2500, Atlanta, Georgia, 30309, U.S.A. Our principal regional centers are maintained in leased facilities, except as noted below, in the following locations:
•Americas: 11 Greenway Plaza, Houston, Texas 77046; 225 Liberty St, New York City, New York 10281
•EMEA: Perpetual Park, Henley-on-Thames, Oxfordshire, RG9 1HH, United Kingdom (owned facilities)
•APAC: 1 Connaught Place, Central, Hong Kong
We maintain a global enterprise center in Hyderabad, India in leased facilities at DivyaSree Orion in the Ranga Reddy District. We lease office space in over 20 countries.
Item 3. Legal Proceedings
See Item 8, Financial Statements and Supplementary Data, Note 17, "Commitments and Contingencies" for information regarding legal proceedings.
Item 4. Mine Safety Disclosures
Not applicable.
PART II
Item 5. Market for Registrant's Common Equity, Related Stockholder Matters and Issuer Purchases of Equity Securities
Our common shares are listed and traded on the NYSE under the symbol “IVZ.” At January 31, 2025, there were approximately 4,800 holders of record of our common shares.
The following graph illustrates the cumulative total shareholder return of our common shares over the five-year period beginning from the market close on the last trading day of 2019 through and including the last trading day in the fiscal year ended December 31, 2024 and compares it to the cumulative total return of the Standard & Poor's (S&P) 500 Index and to a group of peer investment management companies. This table is not intended to forecast future performance of our common shares.
Cumulative Shareholder Returns
Note: Asset Manager Index includes Alliance Bernstein, Bank of New York Mellon, BlackRock, Franklin Resources,
Invesco Ltd., Janus Henderson, Lazard, Northern Trust, State Street and T. Rowe Price.
Securities Authorized for Issuance under Equity Compensation Plans
The equity compensation plan information required in Item 201(d) of Regulation S-K is set forth in the definitive Proxy Statement for the company's annual meeting of shareholders, which will be filed with the SEC no later than 120 days after the close of the fiscal year ended December 31, 2024 and is incorporated by reference in this Report.
Repurchases of Equity Securities
The following table shows common share repurchase activity during the three months ended December 31, 2024:
| | | | | | | | | | | | | | | | | | | | | | | |
| Month | Total Number of Common Shares Purchased (1) | | Average Price Paid Per Common Share | | Total Number of Common Shares
Purchased as Part of
Publicly Announced Plans or Programs (2) | | Approximate Dollar Value of Common Shares that
May Yet Be Purchased
Under the Plans
or Programs (2) (millions) |
| October 1 - 31, 2024 | 498,346 | | | $ | 17.81 | | | 482,194 | | | $ | 348.7 | |
| November 1 - 30, 2024 | 450,757 | | | $ | 17.82 | | | 438,237 | | | $ | 340.8 | |
| December 1 - 31, 2024 | 475,546 | | | $ | 17.89 | | | 458,622 | | | $ | 332.6 | |
| 1,424,649 | | | | | 1,379,053 | | | |
____________
(1) An aggregate of 45,596 common shares were surrendered to us by Invesco employees to satisfy tax withholding obligations in connection with the vesting of equity awards during the three months ended December 31, 2024.
(2) At December 31, 2024, a balance of $332.6 million remains available under the common share repurchase authorization approved by the Board on July 22, 2016.
Item 6. [Reserved]
Item 7. Management's Discussion and Analysis of Financial Condition and Results of Operations
The discussion and analysis disclosed herein apply to material changes in the Consolidated Financial Statements for 2024 and 2023. For the comparison of 2023 and 2022, see the Management's Discussion and Analysis of Financial Condition and Results of Operations in Part II, Item 7 of the company’s 2023 Annual Report on Form 10-K, filed with the SEC on February 21, 2024. The following discussion and analysis of the results of operations and financial condition of Invesco should be read in conjunction with the “Forward-looking Statements” disclosure set forth before Part I and the “Risk Factors” set forth in Item 1A of Part I of this Annual Report on Form 10‑K, each of which describe our risks, uncertainties and other important factors in more detail.
Executive Overview
The following executive overview summarizes the significant trends affecting our results of operations and financial condition for the periods presented. This overview and the remainder of this management's discussion and analysis and supplements should be read in conjunction with the Consolidated Financial Statements of Invesco Ltd. and the notes thereto contained elsewhere in this Annual Report on Form 10-K.
The table below summarizes the year ended December 31 returns based on price appreciation/(depreciation) of several major market indices for 2024 and 2023:
| | | | | | | | | | | | | | | | | |
| | | Year ended December 31, |
| Equity Indices - Domestic | | | 2024 | | 2023 | | |
| S&P 500 | | | 23.3% | | 24.2% | | |
| S&P 500 Equal-Weight | | | 10.9% | | 11.6% | | |
| S&P 500 Growth | | | 35.2% | | 28.4% | | |
| S&P 500 Values | | | 9.8% | | 19.8% | | |
| NASDAQ 100 | | | 24.9% | | 53.8% | | |
| Equity Indices - Global | | | | | | | |
| FTSE 100 (local currency) | | | 5.7% | | 3.8% | | |
| MSCI AC Asia Pacific | | | 7.2% | | 8.8% | | |
| MSCI China (local currency) | | | 15.7% | | (13.2)% | | |
| MSCI Emerging Markets | | | 5.1% | | 7.0% | | |
| MSCI Europe (local currency) | | | 5.8% | | 12.7% | | |
| MSCI Japan (local currency) | | | 18.5% | | 25.9% | | |
| Fixed Income Indices | | | | | | | |
| Bloomberg US Aggregate Bond | | | 1.3% | | 5.5% | | |
| Bloomberg Global Aggregated Bond | | | (1.7)% | | 5.7% | | |
| Bloomberg China Aggregated Bond | | | 4.9% | | 2.7% | | |
The company’s financial results are impacted by the fluctuations in exchange rates against the U.S. Dollar, as discussed in the “Results of Operations” section as applicable.
We continued to make progress in executing our strategic priorities and leveraging our competitive advantages to improve operating performance in 2024. Higher operating revenues along with expense discipline contributed to an increase in operating income from the prior year. See additional discussion in the "Results of Operations" section.
We also remain highly focused on our capital priorities, investing in our key capabilities, efficiently allocating resources, and simplifying and streamlining the organization to position the company for greater scale, performance and improved profitability. We are delivering on our commitment to improve our leverage profile and maintain a strong balance sheet. We redeemed our $600 million senior notes, that were due on January 30, 2024, and we ended the year with cash and cash equivalents of $1 billion and a zero balance on our revolving credit facility. We believe the progress we have made to build financial flexibility has Invesco well-positioned to navigate various market conditions and deliver long-term growth. We remain committed to returning capital to shareholders longer term through a combination of share repurchases and modestly increasing
dividends. During the year, the company repurchased 2.9 million common shares for $49.6 million in the open market, and we expect to continue common share repurchases on a regular basis going forward.
Presentation of Management's Discussion and Analysis of Financial Condition and Results of Operations - Impact of Consolidated Investment Products (CIP)
The company provides investment management services to, and has transactions with, investment products sponsored by the company in the normal course of business. The company's investment adviser subsidiaries serve as investment managers to these products, making day-to-day investment decisions concerning the assets of the products. The company is required to consolidate certain of these managed funds from time-to-time, as discussed more fully in Part II, Item 8, Financial Statements and Supplementary Data, Note 1, "Accounting Policies -- Basis of Accounting and Consolidation." Investment products that are consolidated are referred to in this Report as CIP. The company's economic risk with respect to each investment in CIP is limited to its equity ownership, unfunded equity commitments and any uncollected management and performance fees.
The majority of the company's CIP balances are CLO-related. The collateral assets of the CLOs are held solely to satisfy the obligations of the CLOs. The company has no right to the benefits from, nor does it bear the risks associated with, the collateral assets held by the CLOs beyond the company's direct investments in, and management and performance fees generated from, the CLOs. If the company were to liquidate, the collateral assets would not be available to the general creditors of the company, and as a result, the company does not consider these assets to be company assets. Likewise, the investors in the CLOs have no recourse to the general credit of the company for the notes issued by the CLOs. The company therefore does not consider this debt to be a company liability.
Due to the significant impact that CIP has on the presentation of the company’s Consolidated Financial Statements, the company has elected to deconsolidate these products in its non-GAAP disclosures (among other adjustments). See "Schedule of Non-GAAP Information" for additional information regarding these adjustments. The following discussion therefore combines the results presented under U.S. Generally Accepted Accounting Principles (U.S. GAAP) with the company’s non-GAAP presentation.
To assess the impact of CIP on the company's Results of Operations and Balance Sheet Discussion, refer to Part II, Item 8, Financial Statements and Supplementary Data, Note 18, "Consolidated Investment Products."
Summary Operating Information
Wherever a non-GAAP measure is referenced, a disclosure will follow in the narrative or in the note referring the reader to the Schedule of Non-GAAP Information, where additional details regarding the use of the non-GAAP measure by the company are disclosed, along with reconciliations of the most directly comparable U.S. GAAP measures to the non-GAAP measures. To enhance the readability of the Results of Operations section, separate tables for each of the revenue, expense and other income and expenses (non-operating income/expense) sections of the income statement introduce the narrative that follows, providing a section-by-section review of the company’s income statements for the periods presented.
Summary operating information for 2024, 2023 and 2022 is presented in the table below.
| | | | | | | | | | | | | | | | | |
| (in millions, other than per common share amounts, operating margins and AUM) | Year ended December 31, |
| U.S. GAAP Financial Measures Summary | 2024 | | 2023 | | 2022 |
| Operating revenues | $ | 6,067.0 | | | $ | 5,716.4 | | | $ | 6,048.9 | |
| Operating income/(loss) | $ | 832.1 | | | $ | (434.8) | | | $ | 1,317.7 | |
| Operating margin | 13.7 | % | | (7.6) | % | | 21.8 | % |
| Net income/(loss) attributable to Invesco Ltd. | $ | 538.0 | | | $ | (333.7) | | | $ | 683.9 | |
| Diluted earnings per share (EPS) | $ | 1.18 | | | $ | (0.73) | | | $ | 1.49 | |
| | | | | |
Non-GAAP Financial Measures Summary(1) | | | | | |
| Net revenues | $ | 4,400.5 | | | $ | 4,310.7 | | | $ | 4,645.0 | |
| Adjusted operating income | $ | 1,370.7 | | | $ | 1,213.5 | | | $ | 1,614.8 | |
| Adjusted operating margin | 31.1 | % | | 28.2 | % | | 34.8 | % |
| Adjusted net income attributable to Invesco Ltd. | $ | 781.7 | | | $ | 689.7 | | | $ | 773.2 | |
| Adjusted diluted earnings per share (EPS) | $ | 1.71 | | | $ | 1.51 | | | $ | 1.68 | |
| | | | | |
| Assets Under Management | | | | | |
| Ending AUM (billions) | $ | 1,846.0 | | | $ | 1,585.3 | | | $ | 1,409.2 | |
| Average AUM (billions) | $ | 1,712.2 | | | $ | 1,500.6 | | | $ | 1,452.5 | |
_________
(1)Net revenues, Adjusted Operating Income (and by calculation, adjusted operating margin), and Adjusted Net Income (and by calculation, adjusted diluted EPS) are non-GAAP financial measures, based on methodologies other than U.S. GAAP. See “Schedule of Non-GAAP Information” for a reconciliation of the most directly comparable U.S. GAAP measures to the non-GAAP measures.
Investment Capabilities Performance Overview
Invesco's first strategic objective is a commitment to deliver the excellence our clients expect, which includes strong investment performance over the long-term for our clients. The table below presents investment performance of our actively managed investment products measured by the percentage of our AUM in the first and second quartile compared to our peers and above benchmark for the investment capabilities for which peer and benchmark data are available.(1)
| | | | | | | | | | | | | | | | | | | | | | | | | | | | | | | | | | | |
| 1st Quartile | | 2nd Quartile | | Above Benchmark |
| 1yr | 3yr | 5yr | | 1yr | 3yr | 5yr | | 1yr | 3yr | 5yr |
| Overall | 48 | % | 49 | % | 47 | % | | 23 | % | 20 | % | 23 | % | | 64 | % | 62 | % | 68 | % |
| | | | | | | | | | | |
| Fundamental Equities | 33 | % | 37 | % | 35 | % | | 38 | % | 27 | % | 20 | % | | 46 | % | 44 | % | 46 | % |
| Fundamental Fixed Income | 40 | % | 40 | % | 38 | % | | 26 | % | 23 | % | 44 | % | | 60 | % | 52 | % | 60 | % |
| Multi-Asset | 40 | % | 34 | % | 30 | % | | 23 | % | 12 | % | 28 | % | | 61 | % | 61 | % | 72 | % |
____________
(1) Excludes passive products, closed-end funds, private equity limited partnerships, non-discretionary funds, UITs, fund of funds with component funds managed by Invesco, stable value building block funds and collateralized debt obligations. Certain funds and products were excluded from the analysis because of limited benchmark or peer group data. Had these been available, results may have been different. These results are preliminary and subject to revision.
AUM measured in the one, three and five year quartile rankings represents 37%, 37% and 37% of total Invesco AUM, respectively, and AUM measured versus benchmark on a one, three and five year basis represents 48%, 47%, and 45% of total Invesco AUM as of 12/31/2024. Peer group ranking are sourced from a widely-used third party ranking agency in each fund’s market (Morningstar, IA, Lipper, eVestment, Mercer, Galaxy, SITCA, Value Research) and asset-weighted in USD. Rankings are as of prior quarter-end for most institutional products and prior month-end for Australian retail funds due to their late release by third parties. Rankings are calculated against all funds in each peer group. Rankings for the primary share class of the most representative fund in each composite are applied to all products within each composite. Performance assumes the reinvestment of dividends. Past performance is not indicative of future results and may not reflect an investor’s experience.
Assets Under Management
The following presentation and discussion of AUM includes Passive and Active AUM. Passive AUM include index-based ETFs, UITs, non-management fee earning AUM and other passive mandates. Active AUM are Total AUM less Passive AUM.
Non-management fee earning AUM includes non-management fee earning ETFs, UITs and product leverage. The net flows in non-management fee earning AUM can be relatively short-term in nature and, due to the relatively low revenue yield, these net flows can have a significant impact on overall net revenue yield.
The AUM tables and the discussion below refer to certain AUM as long-term. Long-term inflows and the underlying reasons for the movements in this line item include investments from new clients, existing clients adding new accounts/funds or contributions/subscriptions into existing accounts/funds. Long-term outflows reflect client redemptions from accounts/funds and include the return of invested capital upon maturity. We present net flows into money market funds separately because shareholders of those funds typically use them as short-term funding vehicles and the flows are particularly sensitive to short-term interest rate movements.
Changes in Active and Passive AUM were as follows:
| | | | | | | | | | | | | | | | | | | | | | | | | | | | | | | | | | | | | | | | | | | | | | | | | | | | | |
| 2024 | | 2023 | | 2022 |
| (in billions) | Total AUM | | Active | | Passive | | Total AUM | | Active | | Passive | | Total AUM | | Active | | Passive |
| Beginning Assets (January 1) | $ | 1,585.3 | | | $ | 985.3 | | | $ | 600.0 | | | $ | 1,409.2 | | | $ | 976.2 | | | $ | 433.0 | | | $ | 1,610.9 | | | $ | 1,082.5 | | | $ | 528.4 | |
| Long-term inflows | 419.0 | | | 194.0 | | | 225.0 | | | 299.1 | | | 164.3 | | | 134.8 | | | 330.3 | | | 197.9 | | | 132.4 | |
| Long-term outflows | (353.9) | | | (209.4) | | | (144.5) | | | (288.9) | | | (193.3) | | | (95.6) | | | (330.8) | | | (226.2) | | | (104.6) | |
| Net long-term flows | 65.1 | | | (15.4) | | | 80.5 | | | 10.2 | | | (29.0) | | | 39.2 | | | (0.5) | | | (28.3) | | | 27.8 | |
| Net flows in non-management fee earning AUM | 29.8 | | | — | | | 29.8 | | | 6.2 | | | — | | | 6.2 | | | (3.2) | | | — | | | (3.2) | |
| Net flows in money market funds | 23.4 | | | 23.4 | | | — | | | (11.1) | | | (11.1) | | | — | | | 56.4 | | | 56.4 | | | — | |
| Total net flows | 118.3 | | | 8.0 | | | 110.3 | | | 5.3 | | | (40.1) | | | 45.4 | | | 52.7 | | | 28.1 | | | 24.6 | |
| Reinvested distributions | 16.0 | | | 16.0 | | | — | | | 11.5 | | | 11.5 | | — | | | 15.2 | | | 15.2 | | | — | |
| Market gains and losses | 142.7 | | | 30.0 | | | 112.7 | | | 161.1 | | | 40.0 | | | 121.1 | | | (243.5) | | | (125.6) | | | (117.9) | |
| | | | | | | | | | | | | | | | | |
| Dispositions | — | | | — | | | — | | | (1.4) | | | (1.4) | | | — | | | — | | | — | | | — | |
| Foreign currency translation | (16.3) | | | (12.8) | | | (3.5) | | | (0.4) | | | (0.9) | | | 0.5 | | | (26.1) | | | (24.0) | | | (2.1) | |
| Ending Assets (December 31) | $ | 1,846.0 | | | $ | 1,026.5 | | | $ | 819.5 | | | $ | 1,585.3 | | | $ | 985.3 | | | $ | 600.0 | | | $ | 1,409.2 | | | $ | 976.2 | | | $ | 433.0 | |
| Average AUM | | | | | | | | | | | | | | | | | |
| Average long-term AUM | $ | 1,233.0 | | | $ | 808.1 | | | $ | 424.9 | | | $ | 1,091.3 | | | $ | 780.4 | | | $ | 310.9 | | | $ | 1,104.8 | | | $ | 820.8 | | | $ | 284.0 | |
| Average AUM | $ | 1,712.2 | | | $ | 1,001.9 | | | $ | 710.3 | | | $ | 1,500.6 | | | $ | 992.3 | | | $ | 508.3 | | | $ | 1,452.5 | | | $ | 988.2 | | | $ | 464.3 | |
| Average QQQ AUM | $ | 275.8 | | | $ | — | | | $ | 275.8 | | | $ | 187.5 | | | $ | — | | | $ | 187.5 | | | $ | 169.1 | | | $ | — | | | $ | 169.1 | |
| | | | | | | | | | | | | | | | | |
| | | | | | | | | | | | | | | | | |
| | | | | | | | | | | | | | | | | |
| | | | | | | | | | | | | | | | | |
| | | | | | | | | | | | | | | | | |
| | | | | | | | | | | | | | | | | |
| | | |
| 2024 | | 2023 | | 2022 |
Revenue yield (bps) (1) | | | | | |
| U.S. GAAP gross revenue yield | 37.4 | | 40.4 | | 44.5 |
Net revenue yield ex performance fees ex QQQ (2) | 30.2 | | 32.4 | | 35.5 |
| Active net revenue yield ex performance fees | 36.9 | | 37.7 | | 40.7 |
Passive net revenue yield ex QQQ (2) | 14.9 | | 16.0 | | 18.1 |
____________
(1) U.S. GAAP gross revenue yield on AUM is equal to U.S. GAAP annualized total operating revenues divided by average AUM, excluding IGW AUM. The average AUM for IGW was $88.6 billion in 2024 (2023: $87.2 billion, 2022: $93.5 billion). It is appropriate to exclude the average AUM of IGW as the revenues resulting from these AUM are not presented in our U.S. GAAP operating revenues. Additionally, the U.S. GAAP gross revenue yield is not a good measure because the numerator excludes the management fees earned from CIP; however, the denominator of the measure includes the AUM of these investment products. Net revenue yield metrics include the net revenues and average AUM of IGW and CIP. See “Schedule of Non-GAAP Information” for a reconciliation of operating revenues to net revenues.
(2) Performance fees are earned when certain performance metrics are achieved; Invesco QQQ Trust does not earn net revenues. Therefore, net revenue yield is calculated excluding performance fees and Invesco QQQ Trust AUM. Passive net revenue yield is calculated excluding Invesco QQQ Trust AUM.
Flows
There are numerous drivers of AUM inflows and outflows, including individual investor decisions to change investment preferences, fiduciaries and other gatekeepers making broad asset allocation decisions on behalf of their clients, and reallocation of investments within portfolios. We are not a party to these asset allocation decisions, as the company does not generally have access to the underlying investor's decision-making process, including their risk appetite or liquidity needs. Therefore, the company is not in a position to provide meaningful information regarding the drivers of inflows and outflows.
Market Returns
Market gains and losses include the net change in AUM resulting from changes in market values of the underlying securities from period to period. The table in the “Executive Overview” section of this Management's Discussion and Analysis summarizes returns based on price appreciation/(depreciation) of several major market indices for the years ended December 31, 2024 and December 31, 2023.
Foreign Exchange Rates
During the year ended December 31, 2024, we experienced a decrease in AUM of $16.3 billion due to changes in foreign exchange rates (December 31, 2023: AUM decreased $0.4 billion; December 31, 2022: AUM decreased $26.1 billion).
Total AUM by Channel (1)
| | | | | | | | | | | | | | | | | | | | | | | | | | | | | | | | | | | | | | | | | | | | | | | | | | | | | |
| 2024 | | 2023 | | 2022 |
| (in billions) | Total | | Retail | | Institutional | | Total | | Retail | | Institutional | | Total | | Retail | | Institutional |
| Beginning Assets (January 1) | $ | 1,585.3 | | | $ | 1,042.0 | | | $ | 543.3 | | | $ | 1,409.2 | | | $ | 872.3 | | | $ | 536.9 | | | $ | 1,610.9 | | | $ | 1,106.5 | | | $ | 504.4 | |
| Long-term inflows | 419.0 | | | 319.6 | | | 99.4 | | | 299.1 | | | 219.9 | | | 79.2 | | | 330.3 | | | 243.9 | | | 86.4 | |
| Long-term outflows | (353.9) | | | (259.6) | | | (94.3) | | | (288.9) | | | (214.5) | | | (74.4) | | | (330.8) | | | (257.5) | | | (73.3) | |
| Net long-term flows | 65.1 | | | 60.0 | | | 5.1 | | | 10.2 | | | 5.4 | | | 4.8 | | | (0.5) | | | (13.6) | | | 13.1 | |
| Net flows in non-management fee earning AUM | 29.8 | | | 28.7 | | | 1.1 | | | 6.2 | | | 5.9 | | | 0.3 | | | (3.2) | | | 0.9 | | | (4.1) | |
| Net flows in money market funds | 23.4 | | | 1.5 | | | 21.9 | | | (11.1) | | | 1.4 | | | (12.5) | | | 56.4 | | | 1.8 | | | 54.6 | |
| Total net flows | 118.3 | | | 90.2 | | | 28.1 | | | 5.3 | | | 12.7 | | | (7.4) | | | 52.7 | | | (10.9) | | | 63.6 | |
| Reinvested distributions | 16.0 | | | 15.8 | | | 0.2 | | | 11.5 | | | 11.0 | | | 0.5 | | | 15.2 | | | 14.8 | | | 0.4 | |
| Market gains and losses | 142.7 | | | 123.4 | | | 19.3 | | | 161.1 | | | 145.2 | | | 15.9 | | | (243.5) | | | (227.3) | | | (16.2) | |
| | | | | | | | | | | | | | | | | |
| Dispositions | — | | | — | | | — | | | (1.4) | | | — | | | (1.4) | | | — | | | — | | | — | |
| Foreign currency translation | (16.3) | | | (5.8) | | | (10.5) | | | (0.4) | | | 0.8 | | | (1.2) | | | (26.1) | | | (10.8) | | | (15.3) | |
| Ending Assets (December 31) | $ | 1,846.0 | | | $ | 1,265.6 | | | $ | 580.4 | | | $ | 1,585.3 | | | $ | 1,042.0 | | | $ | 543.3 | | | $ | 1,409.2 | | | $ | 872.3 | | | $ | 536.9 | |
| | | | | | | | | | | | | | | | | |
| | | | | | | | | | | | | | | | | |
| | | | | | | | | | | | | | | | | |
| | | | | | | | | | | | | | | | | |
| | | | | | | | | | | | | | | | | |
| | | | | | | | | | | | | | | | | |
| | | | | | | | | | | | | | | | | |
| | | | | | | | | | | | | | | | | |
| | | | | | | | | | | | | | | | | |
| | | | | | | | | | | | | | | | | |
| | | | | | | | | | | | | | | | | |
| | | | | | | | | | | | | | | | | |
| | | | | | | | | | | | | | | | | |
| | | | | | | | | | | | | | | | | |
| | | | | | | | | | | | | | | | | |
| | | | | | | | | | | | | | | | | |
| | | | | | | | | | | | | | | | | |
| | | | | | | | | | | | | | | | | |
| | | | | | | | | | | | | | | | | |
| | | | | | | | | | | | | | | | | |
| | | | | | | | | | | | | | | | | |
| | | | | | | | | | | | | | | | | |
| | | | | | | | | | | | | | | | | |
| | | | | | | | | | | | | | | | | |
| | | | | | | | | | | | | | | | | |
| | | | | | | | | | | | | | | | | |
| | | | | | | | | | | | | | | | | |
| | | | | | | | | | | | | | | | | |
Total AUM by Client Domicile (2)
| | | | | | | | | | | | | | | | | | | | | | | | | | | | | | | | | | | | | | | | | | | | | | | | | | | | | | | | | | | | | | | | | | | | | | | | | | | |
| 2024 | | 2023 | | 2022 | | | | |
| (in billions) | Total | | Americas | | APAC | | EMEA | | Total | | Americas | | APAC | | EMEA | | Total | | Americas | | APAC | | EMEA | | | | |
| Beginning Assets (January 1) | $ | 1,585.3 | | | $ | 1,133.9 | | | $ | 235.5 | | | $ | 215.9 | | | $ | 1,409.2 | | | $ | 999.4 | | | $ | 223.5 | | | $ | 186.3 | | | $ | 1,610.9 | | | $ | 1,132.5 | | | $ | 247.3 | | | $ | 231.1 | | | | | |
| Long-term inflows | 419.0 | | | 212.5 | | | 121.0 | | | 85.5 | | | 299.1 | | | 154.0 | | | 77.1 | | | 68.0 | | | 330.3 | | | 184.0 | | | 76.6 | | | 69.7 | | | | | |
| Long-term outflows | (353.9) | | | (190.7) | | | (94.9) | | | (68.3) | | | (288.9) | | | (156.0) | | | (67.0) | | | (65.9) | | | (330.8) | | | (193.8) | | | (62.5) | | | (74.5) | | | | | |
| Net long-term flows | 65.1 | | | 21.8 | | | 26.1 | | | 17.2 | | | 10.2 | | | (2.0) | | | 10.1 | | | 2.1 | | | (0.5) | | | (9.8) | | | 14.1 | | | (4.8) | | | | | |
| Net flows in non-management fee earning AUM | 29.8 | | | 23.8 | | | 0.1 | | | 5.9 | | | 6.2 | | | 7.2 | | | (0.3) | | | (0.7) | | | (3.2) | | | (3.6) | | | 1.1 | | | (0.7) | | | | | |
| Net flows in money market funds | 23.4 | | | 24.0 | | | — | | | (0.6) | | | (11.1) | | | (11.7) | | | 1.3 | | | (0.7) | | | 56.4 | | | 58.3 | | | (0.3) | | | (1.6) | | | | | |
| Total net flows | 118.3 | | | 69.6 | | | 26.2 | | | 22.5 | | | 5.3 | | | (6.5) | | | 11.1 | | | 0.7 | | | 52.7 | | | 44.9 | | | 14.9 | | | (7.1) | | | | | |
| Reinvested distributions | 16.0 | | | 15.8 | | | — | | | 0.2 | | | 11.5 | | | 11.3 | | | — | | | 0.2 | | | 15.2 | | | 14.9 | | | — | | | 0.3 | | | | | |
| Market gains and losses | 142.7 | | | 101.5 | | | 16.3 | | | 24.9 | | | 161.1 | | | 130.4 | | | 6.3 | | | 24.4 | | | (243.5) | | | (191.3) | | | (22.6) | | | (29.6) | | | | | |
| Transfer | — | | | (3.4) | | | 3.6 | | | (0.2) | | | — | | | — | | | — | | | — | | | — | | | — | | | — | | | — | | | | | |
| Dispositions | — | | | — | | | — | | | — | | | (1.4) | | | (1.4) | | | — | | | — | | | — | | | — | | | — | | | — | | | | | |
| Foreign currency translation | (16.3) | | | (1.9) | | | (11.4) | | | (3.0) | | | (0.4) | | | 0.7 | | | (5.4) | | | 4.3 | | | (26.1) | | | (1.6) | | | (16.1) | | | (8.4) | | | | | |
| Ending Assets (December 31) | $ | 1,846.0 | | | $ | 1,315.5 | | | $ | 270.2 | | | $ | 260.3 | | | $ | 1,585.3 | | | $ | 1,133.9 | | | $ | 235.5 | | | $ | 215.9 | | | $ | 1,409.2 | | | $ | 999.4 | | | $ | 223.5 | | | $ | 186.3 | | | | | |
| | | | | | | | | | | | | | | | | | | | | | | | | | | |
| | | | | | | | | | | | | | | | | | | | | | | | | | | |
| | | | | | | | | | | | | | | | | | | | | | | | | | | |
| | | | | | | | | | | | | | | | | | | | | | | | | | | |
| | | | | | | | | | | | | | | | | | | | | | | | | | | |
| | | | | | | | | | | | | | | | | | | | | | | | | | | |
| | | | | | | | | | | | | | | | | | | | | | | | | | | |
| | | | | | | | | | | | | | | | | | | | | | | | | | | |
| | | | | | | | | | | | | | | | | | | | | | | | | | | |
| | | | | | | | | | | | | | | | | | | | | | | | | | | |
| | | | | | | | | | | | | | | | | | | | | | | | | | | |
| | | | | | | | | | | | | | | | | | | | | | | | | | | |
| | | | | | | | | | | | | | | | | | | | | | | | | | | |
| | | | | | | | | | | | | | | | | | | | | | | | | | | |
| | | | | | | | | | | | | | | | | | | | | | | | | | | |
| | | | | | | | | | | | | | | | | | | | | | | | | | | |
| | | | | | | | | | | | | | | | | | | | | | | | | | | |
| | | | | | | | | | | | | | | | | | | | | | | | | | | |
| | | | | | | | | | | | | | | | | | | | | | | | | | | |
| | | | | | | | | | | | | | | | | | | | | | | | | | | |
| | | | | | | | | | | | | | | | | | | | | | | | | | | |
| | | | | | | | | | | | | | | | | | | | | | | | | | | |
| | | | | | | | | | | | | | | | | | | | | | | | | | | |
| | | | | | | | | | | | | | | | | | | | | | | | | | | |
| | | | | | | | | | | | | | | | | | | | | | | | | | | |
| | | | | | | | | | | | | | | | | | | | | | | | | | | |
| | | | | | | | | | | | | | | | | | | | | | | | | | | |
| | | | | | | | | | | | | | | | | | | | | | | | | | | |
____________
See accompanying notes immediately following these AUM tables.
Total AUM by Investment Capability (3)
| | | | | | | | | | | | | | | | | | | | | | | | | | | | | | | | | | | | | | | | | | | | | | | | | | | | | |
| Twelve months ended December 31, 2024 |
| (in billions) | Total | | ETFs and Index (4) | | Fundamental Fixed Income (5) | | Fundamental Equities (6) | | Private Markets (7) | | APAC Managed (8) | | Multi-Asset/ Other (9) | | Global Liquidity (10) | | QQQ (11) |
| Beginning Assets (January 1) | $ | 1,585.3 | | | $ | 362.1 | | | $ | 272.6 | | | $ | 260.5 | | | $ | 129.7 | | | $ | 108.0 | | | $ | 57.4 | | | $ | 165.0 | | | $ | 230.0 | |
| Long-term inflows | 419.0 | | | 192.7 | | | 68.5 | | | 35.7 | | | 25.0 | | | 86.7 | | | 10.4 | | | — | | | — | |
| Long-term outflows | (353.9) | | | (121.4) | | | (60.7) | | | (59.9) | | | (20.9) | | | (78.1) | | | (12.9) | | | — | | | — | |
| Net long-term flows | 65.1 | | | 71.3 | | | 7.8 | | | (24.2) | | | 4.1 | | | 8.6 | | | (2.5) | | | — | | | — | |
| Net flows in non-management fee earning AUM | 29.8 | | | — | | | — | | | — | | | — | | | — | | | 0.7 | | | — | | | 29.1 | |
| Net flows in money market funds | 23.4 | | | — | | | — | | | — | | | — | | | (0.2) | | | — | | | 23.6 | | | — | |
| Total net flows | 118.3 | | | 71.3 | | | 7.8 | | | (24.2) | | | 4.1 | | | 8.4 | | | (1.8) | | | 23.6 | | | 29.1 | |
| Reinvested distributions | 16.0 | | | 0.5 | | | 2.1 | | | 11.6 | | | 0.8 | | | — | | | 0.6 | | | 0.4 | | | — | |
| Market gains and losses | 142.7 | | | 53.2 | | | 3.2 | | | 21.2 | | | (4.6) | | | 5.6 | | | 3.8 | | | 0.5 | | | 59.8 | |
| | | | | | | | | | | | | | | | | |
| | | | | | | | | | | | | | | | | |
| Foreign currency translation | (16.3) | | | (3.1) | | | (4.6) | | | (2.6) | | | (1.5) | | | (3.2) | | | (1.2) | | | (0.1) | | | — | |
| Ending Assets (December 31) | $ | 1,846.0 | | | $ | 484.0 | | | $ | 281.1 | | | $ | 266.5 | | | $ | 128.5 | | | $ | 118.8 | | | $ | 58.8 | | | $ | 189.4 | | | $ | 318.9 | |
| | | | | | | | | | | | | | | | | |
| Average AUM | $ | 1,712.2 | | | $ | 423.8 | | | $ | 276.9 | | | $ | 269.4 | | | $ | 128.5 | | | $ | 112.1 | | | $ | 59.8 | | | $ | 165.9 | | | $ | 275.8 | |
| | | | | | | | | | | | | | | | | |
| | | | | | | | | | | | | | | | | |
| Twelve months ended December 31, 2023 |
| Beginning Assets (January 1) | $ | 1,409.2 | | | $ | 285.6 | | | $ | 261.3 | | | $ | 238.8 | | | $ | 129.9 | | | $ | 113.6 | | | $ | 57.7 | | | $ | 176.4 | | | $ | 145.9 | |
| Long-term inflows | 299.1 | | | 124.1 | | | 60.6 | | | 36.7 | | | 16.1 | | | 52.5 | | | 9.1 | | | — | | | — | |
| Long-term outflows | (288.9) | | | (90.8) | | | (59.6) | | | (54.3) | | | (15.5) | | | (55.1) | | | (13.6) | | | — | | | — | |
| Net long-term flows | 10.2 | | | 33.3 | | | 1.0 | | | (17.6) | | | 0.6 | | | (2.6) | | | (4.5) | | | — | | | — | |
| Net flows in non-management fee earning AUM | 6.2 | | | — | | | — | | | — | | | — | | | — | | | (0.3) | | | — | | | 6.5 | |
| Net flows in money market funds | (11.1) | | | — | | | — | | | — | | | — | | | 1.2 | | | — | | | (12.3) | | | — | |
| Total net flows | 5.3 | | | 33.3 | | | 1.0 | | | (17.6) | | | 0.6 | | | (1.4) | | | (4.8) | | | (12.3) | | | 6.5 | |
| Reinvested distributions | 11.5 | | | 0.3 | | | 1.9 | | | 7.8 | | | 0.8 | | | — | | | 0.4 | | | 0.3 | | | — | |
| Market gains and losses | 161.1 | | | 42.5 | | | 9.4 | | | 29.9 | | | (0.9) | | | (1.1) | | | 3.2 | | | 0.5 | | | 77.6 | |
| | | | | | | | | | | | | | | | | |
| Dispositions | (1.4) | | | — | | | — | | | — | | | (1.4) | | | — | | | — | | | — | | | — | |
| Foreign currency translation | (0.4) | | | 0.4 | | | (1.0) | | | 1.6 | | | 0.7 | | | (3.1) | | | 0.9 | | | 0.1 | | | — | |
| Ending Assets (December 31) | $ | 1,585.3 | | | $ | 362.1 | | | $ | 272.6 | | | $ | 260.5 | | | $ | 129.7 | | | $ | 108.0 | | | $ | 57.4 | | | $ | 165.0 | | | $ | 230.0 | |
| | | | | | | | | | | | | | | | | |
| Average AUM | $ | 1,500.6 | | | $ | 316.7 | | | $ | 264.5 | | | $ | 249.9 | | | $ | 128.2 | | | $ | 111.0 | | | $ | 59.7 | | | $ | 183.1 | | | $ | 187.5 | |
___________
See accompanying notes immediately following these AUM tables.
| | | | | | | | | | | | | | | | | | | | | | | | | | | | | | | | | | | | | | | | | | | | | | | | | | | | | |
| Twelve months ended December 31, 2022 |
| (in billions) | Total | | ETFs and Index (4) | | Fundamental Fixed Income (5) | | Fundamental Equities (6) | | Private Markets (7) | | APAC Managed (8) | | Multi-Asset/ Other (9) | | Global Liquidity (10) | | QQQ (11) |
| Beginning Assets (January 1) | $ | 1,610.9 | | | $ | 303.5 | | | $ | 288.5 | | | $ | 343.5 | | | $ | 134.4 | | | $ | 127.9 | | | $ | 78.9 | | | $ | 119.1 | | | $ | 215.1 | |
| Long-term inflows | 330.3 | | | 131.9 | | | 70.8 | | | 40.4 | | | 25.2 | | | 53.4 | | | 8.6 | | | — | | | — | |
| Long-term outflows | (330.8) | | | (101.2) | | | (68.6) | | | (70.9) | | | (27.7) | | | (46.7) | | | (15.7) | | | — | | | — | |
| Net long-term flows | (0.5) | | | 30.7 | | | 2.2 | | | (30.5) | | | (2.5) | | | 6.7 | | | (7.1) | | | — | | | — | |
| Net flows in non-management fee earning AUM | (3.2) | | | — | | | — | | | — | | | — | | | — | | | (4.5) | | | — | | | 1.3 | |
| Net flows in money market funds | 56.4 | | | — | | | — | | | — | | | — | | | (0.2) | | | — | | | 56.6 | | | — | |
| Total net flows | 52.7 | | | 30.7 | | | 2.2 | | | (30.5) | | | (2.5) | | | 6.5 | | | (11.6) | | | 56.6 | | | 1.3 | |
| Reinvested distributions | 15.2 | | | 0.5 | | | 1.7 | | | 11.4 | | | 1.0 | | | — | | | 0.6 | | | — | | | — | |
| Market gains and losses | (243.5) | | | (47.3) | | | (25.1) | | | (81.4) | | | (1.3) | | | (11.3) | | | (7.6) | | | 1.0 | | | (70.5) | |
| | | | | | | | | | | | | | | | | |
| | | | | | | | | | | | | | | | | |
| Foreign currency translation | (26.1) | | | (1.8) | | | (6.0) | | | (4.2) | | | (1.7) | | | (9.5) | | | (2.6) | | | (0.3) | | | — | |
| Ending Assets (December 31) | $ | 1,409.2 | | | $ | 285.6 | | | $ | 261.3 | | | $ | 238.8 | | | $ | 129.9 | | | $ | 113.6 | | | $ | 57.7 | | | $ | 176.4 | | | $ | 145.9 | |
| | | | | | | | | | | | | | | | | |
| Average AUM | $ | 1,452.5 | | | $ | 293.5 | | | $ | 264.5 | | | $ | 270.5 | | | $ | 134.1 | | | $ | 117.8 | | | $ | 64.9 | | | $ | 138.1 | | | $ | 169.1 | |
____________
See accompanying notes immediately following these AUM tables.
Active AUM by Channel (1)
| | | | | | | | | | | | | | | | | | | | | | | | | | | | | | | | | | | | | | | | | | | | | | | | | | | | | |
| 2024 | | 2023 | | 2022 |
| (in billions) | Total | | Retail | | Institutional | | Total | | Retail | | Institutional | | Total | | Retail | | Institutional |
| Beginning Assets (January 1) | $ | 985.3 | | | $ | 501.5 | | | $ | 483.8 | | | $ | 976.2 | | | $ | 482.1 | | | $ | 494.1 | | | $ | 1,082.5 | | | $ | 631.7 | | | $ | 450.8 | |
| Long-term inflows | 194.0 | | | 109.6 | | | 84.4 | | | 164.3 | | | 98.8 | | | 65.5 | | | 197.9 | | | 117.0 | | | 80.9 | |
| Long-term outflows | (209.4) | | | (128.8) | | | (80.6) | | | (193.3) | | | (126.0) | | | (67.3) | | | (226.2) | | | (157.5) | | | (68.7) | |
| Net long-term flows | (15.4) | | | (19.2) | | | 3.8 | | | (29.0) | | | (27.2) | | | (1.8) | | | (28.3) | | | (40.5) | | | 12.2 | |
| Net flows in non-management fee earning AUM | — | | | — | | | — | | | — | | | 0.1 | | | (0.1) | | | — | | | — | | | — | |
| Net flows in money market funds | 23.4 | | | 1.5 | | | 21.9 | | | (11.1) | | | 1.4 | | | (12.5) | | | 56.4 | | | 1.8 | | | 54.6 | |
| Total net flows | 8.0 | | | (17.7) | | | 25.7 | | | (40.1) | | | (25.7) | | | (14.4) | | | 28.1 | | | (38.7) | | | 66.8 | |
| Reinvested distributions | 16.0 | | | 15.8 | | | 0.2 | | | 11.5 | | | 11.0 | | | 0.5 | | | 15.2 | | | 14.8 | | | 0.4 | |
| Market gains and losses | 30.0 | | | 22.4 | | | 7.6 | | | 40.0 | | | 33.7 | | | 6.3 | | | (125.6) | | | (115.6) | | | (10.0) | |
| | | | | | | | | | | | | | | | | |
| Dispositions | — | | | — | | | — | | | (1.4) | | | — | | | (1.4) | | | — | | | — | | | — | |
| Foreign currency translation | (12.8) | | | (4.5) | | | (8.3) | | | (0.9) | | | 0.4 | | | (1.3) | | | (24.0) | | | (10.1) | | | (13.9) | |
| Ending Assets (December 31) | $ | 1,026.5 | | | $ | 517.5 | | | $ | 509.0 | | | $ | 985.3 | | | $ | 501.5 | | | $ | 483.8 | | | $ | 976.2 | | | $ | 482.1 | | | $ | 494.1 | |
| | | | | | | | | | | | | | | | | |
| | | | | | | | | | | | | | | | | |
| | | | | | | | | | | | | | | | | |
| | | | | | | | | | | | | | | | | |
| | | | | | | | | | | | | | | | | |
| | | | | | | | | | | | | | | | | |
| | | | | | | | | | | | | | | | | |
| | | | | | | | | | | | | | | | | |
| | | | | | | | | | | | | | | | | |
| | | | | | | | | | | | | | | | | |
| | | | | | | | | | | | | | | | | |
| | | | | | | | | | | | | | | | | |
| | | | | | | | | | | | | | | | | |
| | | | | | | | | | | | | | | | | |
| | | | | | | | | | | | | | | | | |
| | | | | | | | | | | | | | | | | |
| | | | | | | | | | | | | | | | | |
| | | | | | | | | | | | | | | | | |
| | | | | | | | | | | | | | | | | |
| | | | | | | | | | | | | | | | | |
| | | | | | | | | | | | | | | | | |
| | | | | | | | | | | | | | | | | |
| | | | | | | | | | | | | | | | | |
| | | | | | | | | | | | | | | | | |
| | | | | | | | | | | | | | | | | |
| | | | | | | | | | | | | | | | | |
| | | | | | | | | | | | | | | | | |
| | | | | | | | | | | | | | | | | |
| | | | | | | | | | | | | | | | | |
Active AUM by Client Domicile (2)
| | | | | | | | | | | | | | | | | | | | | | | | | | | | | | | | | | | | | | | | | | | | | | | | | | | | | | | | | | | | | | | | | | | | | | | | | | | | | | | | | | | | | | | | |
| 2024 | | 2023 | | 2022 | | | | | | | | | | | | | | | | | |
| (in billions) | Total | | Americas | | APAC | | EMEA | | Total | | Americas | | APAC | | EMEA | | Total | | Americas | | APAC | | EMEA | | | | | | | | | | | | | | | | | |
| Beginning Assets (January 1) | $ | 985.3 | | | $ | 671.4 | | | $ | 192.0 | | | $ | 121.9 | | | $ | 976.2 | | | $ | 670.8 | | | $ | 191.0 | | | $ | 114.4 | | | $ | 1,082.5 | | | $ | 724.5 | | | $ | 208.8 | | | $ | 149.2 | | | | | | | | | | | | | | | | | | |
| Long-term inflows | 194.0 | | | 84.1 | | | 84.7 | | | 25.2 | | | 164.3 | | | 78.0 | | | 61.1 | | | 25.2 | | | 197.9 | | | 104.0 | | | 69.3 | | | 24.6 | | | | | | | | | | | | | | | | | | |
| Long-term outflows | (209.4) | | | (111.8) | | | (70.2) | | | (27.4) | | | (193.3) | | | (109.7) | | | (55.0) | | | (28.6) | | | (226.2) | | | (133.4) | | | (56.1) | | | (36.7) | | | | | | | | | | | | | | | | | | |
| Net long-term flows | (15.4) | | | (27.7) | | | 14.5 | | | (2.2) | | | (29.0) | | | (31.7) | | | 6.1 | | | (3.4) | | | (28.3) | | | (29.4) | | | 13.2 | | | (12.1) | | | | | | | | | | | | | | | | | | |
| Net flows in non-management fee earning AUM | — | | | — | | | — | | | — | | | — | | | — | | | — | | | — | | | — | | | — | | | 0.1 | | | (0.1) | | | | | | | | | | | | | | | | | | |
| Net flows in money market funds | 23.4 | | | 24.0 | | | — | | | (0.6) | | | (11.1) | | | (11.7) | | | 1.3 | | | (0.7) | | | 56.4 | | | 58.3 | | | (0.3) | | | (1.6) | | | | | | | | | | | | | | | | | | |
| Total net flows | 8.0 | | | (3.7) | | | 14.5 | | | (2.8) | | | (40.1) | | | (43.4) | | | 7.4 | | | (4.1) | | | 28.1 | | | 28.9 | | | 13.0 | | | (13.8) | | | | | | | | | | | | | | | | | | |
| Reinvested distributions | 16.0 | | | 15.8 | | | — | | | 0.2 | | | 11.5 | | | 11.3 | | | — | | | 0.2 | | | 15.2 | | | 14.9 | | | — | | | 0.3 | | | | | | | | | | | | | | | | | | |
| Market gains and losses | 30.0 | | | 19.7 | | | 6.2 | | | 4.1 | | | 40.0 | | | 33.4 | | | (1.0) | | | 7.6 | | | (125.6) | | | (96.0) | | | (16.3) | | | (13.3) | | | | | | | | | | | | | | | | | | |
| Transfer | — | | | (3.4) | | | 3.6 | | | (0.2) | | | — | | | — | | | — | | | — | | | — | | | — | | | — | | | — | | | | | | | | | | | | | | | | | | |
| Dispositions | — | | | — | | | — | | | — | | | (1.4) | | | (1.4) | | | — | | | — | | | — | | | — | | | — | | | — | | | | | | | | | | | | | | | | | | |
| Foreign currency translation | (12.8) | | | (1.6) | | | (8.9) | | | (2.3) | | | (0.9) | | | 0.7 | | | (5.4) | | | 3.8 | | | (24.0) | | | (1.5) | | | (14.5) | | | (8.0) | | | | | | | | | | | | | | | | | | |
| Ending Assets (December 31) | $ | 1,026.5 | | | $ | 698.2 | | | $ | 207.4 | | | $ | 120.9 | | | $ | 985.3 | | | $ | 671.4 | | | $ | 192.0 | | | $ | 121.9 | | | $ | 976.2 | | | $ | 670.8 | | | $ | 191.0 | | | $ | 114.4 | | | | | | | | | | | | | | | | | | |
| | | | | | | | | | | | | | | | | | | | | | | | | | | | | | | | | | | | | | | | |
| | | | | | | | | | | | | | | | | | | | | | | | | | | | | | | | | | | | | | | | |
| | | | | | | | | | | | | | | | | | | | | | | | | | | | | | | | | | | | | | | | |
| | | | | | | | | | | | | | | | | | | | | | | | | | | | | | | | | | | | | | | | |
| | | | | | | | | | | | | | | | | | | | | | | | | | | | | | | | | | | | | | | | |
| | | | | | | | | | | | | | | | | | | | | | | | | | | | | | | | | | | | | | | | |
| | | | | | | | | | | | | | | | | | | | | | | | | | | | | | | | | | | | | | | | |
| | | | | | | | | | | | | | | | | | | | | | | | | | | | | | | | | | | | | | | | |
| | | | | | | | | | | | | | | | | | | | | | | | | | | | | | | | | | | | | | | | |
| | | | | | | | | | | | | | | | | | | | | | | | | | | | | | | | | | | | | | | | |
| | | | | | | | | | | | | | | | | | | | | | | | | | | | | | | | | | | | | | | | |
| | | | | | | | | | | | | | | | | | | | | | | | | | | | | | | | | | | | | | | | |
| | | | | | | | | | | | | | | | | | | | | | | | | | | | | | | | | | | | | | | | |
| | | | | | | | | | | | | | | | | | | | | | | | | | | | | | | | | | | | | | | | |
| | | | | | | | | | | | | | | | | | | | | | | | | | | | | | | | | | | | | | | | |
| | | | | | | | | | | | | | | | | | | | | | | | | | | | | | | | | | | | | | | | |
| | | | | | | | | | | | | | | | | | | | | | | | | | | | | | | | | | | | | | | | |
| | | | | | | | | | | | | | | | | | | | | | | | | | | | | | | | | | | | | | | | |
| | | | | | | | | | | | | | | | | | | | | | | | | | | | | | | | | | | | | | | | |
| | | | | | | | | | | | | | | | | | | | | | | | | | | | | | | | | | | | | | | | |
| | | | | | | | | | | | | | | | | | | | | | | | | | | | | | | | | | | | | | | | |
| | | | | | | | | | | | | | | | | | | | | | | | | | | | | | | | | | | | | | | | |
| | | | | | | | | | | | | | | | | | | | | | | | | | | | | | | | | | | | | | | | |
| | | | | | | | | | | | | | | | | | | | | | | | | | | | | | | | | | | | | | | | |
| | | | | | | | | | | | | | | | | | | | | | | | | | | | | | | | | | | | | | | | |
| | | | | | | | | | | | | | | | | | | | | | | | | | | | | | | | | | | | | | | | |
| | | | | | | | | | | | | | | | | | | | | | | | | | | | | | | | | | | | | | | | |
| | | | | | | | | | | | | | | | | | | | | | | | | | | | | | | | | | | | | | | | |
| | | | | | | | | | | | | | | | | | | | | | | | | | | | | | | | | | | | | | | | |
____________
See accompanying notes immediately following these AUM tables.
Passive AUM by Channel (1)
| | | | | | | | | | | | | | | | | | | | | | | | | | | | | | | | | | | | | | | | | | | | | | | | | | | | | |
| 2024 | | 2023 | | 2022 |
| (in billions) | Total | | Retail | | Institutional | | Total | | Retail | | Institutional | | Total | | Retail | | Institutional |
| Beginning Assets (January 1) | $ | 600.0 | | | $ | 540.5 | | | $ | 59.5 | | | $ | 433.0 | | | $ | 390.2 | | | $ | 42.8 | | | $ | 528.4 | | | $ | 474.8 | | | $ | 53.6 | |
| Long-term inflows | 225.0 | | | 210.0 | | | 15.0 | | | 134.8 | | | 121.1 | | | 13.7 | | | 132.4 | | | 126.9 | | | 5.5 | |
| Long-term outflows | (144.5) | | | (130.8) | | | (13.7) | | | (95.6) | | | (88.5) | | | (7.1) | | | (104.6) | | | (100.0) | | | (4.6) | |
| Net long-term flows | 80.5 | | | 79.2 | | | 1.3 | | | 39.2 | | | 32.6 | | | 6.6 | | | 27.8 | | | 26.9 | | | 0.9 | |
| Net flows in non-management fee earning AUM | 29.8 | | | 28.7 | | | 1.1 | | | 6.2 | | | 5.8 | | | 0.4 | | | (3.2) | | | 0.9 | | | (4.1) | |
| | | | | | | | | | | | | | | | | |
| Total net flows | 110.3 | | | 107.9 | | | 2.4 | | | 45.4 | | | 38.4 | | | 7.0 | | | 24.6 | | | 27.8 | | | (3.2) | |
| | | | | | | | | | | | | | | | | |
| Market gains and losses | 112.7 | | | 101.0 | | | 11.7 | | | 121.1 | | | 111.5 | | | 9.6 | | | (117.9) | | | (111.7) | | | (6.2) | |
| | | | | | | | | | | | | | | | | |
| | | | | | | | | | | | | | | | | |
| Foreign currency translation | (3.5) | | | (1.3) | | | (2.2) | | | 0.5 | | | 0.4 | | | 0.1 | | | (2.1) | | | (0.7) | | | (1.4) | |
| Ending Assets (December 31) | $ | 819.5 | | | $ | 748.1 | | | $ | 71.4 | | | $ | 600.0 | | | $ | 540.5 | | | $ | 59.5 | | | $ | 433.0 | | | $ | 390.2 | | | $ | 42.8 | |
| | | | | | | | | | | | | | | | | |
| | | | | | | | | | | | | | | | | |
| | | | | | | | | | | | | | | | | |
| | | | | | | | | | | | | | | | | |
| | | | | | | | | | | | | | | | | |
| | | | | | | | | | | | | | | | | |
| | | | | | | | | | | | | | | | | |
| | | | | | | | | | | | | | | | | |
| | | | | | | | | | | | | | | | | |
| | | | | | | | | | | | | | | | | |
| | | | | | | | | | | | | | | | | |
| | | | | | | | | | | | | | | | | |
| | | | | | | | | | | | | | | | | |
| | | | | | | | | | | | | | | | | |
| | | | | | | | | | | | | | | | | |
| | | | | | | | | | | | | | | | | |
| | | | | | | | | | | | | | | | | |
| | | | | | | | | | | | | | | | | |
| | | | | | | | | | | | | | | | | |
| | | | | | | | | | | | | | | | | |
| | | | | | | | | | | | | | | | | |
| | | | | | | | | | | | | | | | | |
| | | | | | | | | | | | | | | | | |
| | | | | | | | | | | | | | | | | |
| | | | | | | | | | | | | | | | | |
| | | | | | | | | | | | | | | | | |
| | | | | | | | | | | | | | | | | |
| | | | | | | | | | | | | | | | | |
| | | | | | | | | | | | | | | | | |
Passive AUM by Client Domicile (2)
| | | | | | | | | | | | | | | | | | | | | | | | | | | | | | | | | | | | | | | | | | | | | | | | | | | | | | | | | | | | | | | | | | | | | | | | | |
| 2024 | | 2023 | | 2022 | | |
| (in billions) | Total | | Americas | | APAC | | EMEA | | Total | | Americas | | APAC | | EMEA | | Total | | Americas | | APAC | | EMEA | | |
| Beginning Assets (January 1) | $ | 600.0 | | | $ | 462.5 | | | $ | 43.5 | | | $ | 94.0 | | | $ | 433.0 | | | $ | 328.6 | | | $ | 32.5 | | | $ | 71.9 | | | $ | 528.4 | | | $ | 408.0 | | | $ | 38.5 | | | $ | 81.9 | | | |
| Long-term inflows | 225.0 | | | 128.4 | | | 36.3 | | | 60.3 | | | 134.8 | | | 76.0 | | | 16.0 | | | 42.8 | | | 132.4 | | | 80.0 | | | 7.3 | | | 45.1 | | | |
| Long-term outflows | (144.5) | | | (78.9) | | | (24.7) | | | (40.9) | | | (95.6) | | | (46.3) | | | (12.0) | | | (37.3) | | | (104.6) | | | (60.4) | | | (6.4) | | | (37.8) | | | |
| Net long-term flows | 80.5 | | | 49.5 | | | 11.6 | | | 19.4 | | | 39.2 | | | 29.7 | | | 4.0 | | | 5.5 | | | 27.8 | | | 19.6 | | | 0.9 | | | 7.3 | | | |
| Net flows in non-management fee earning AUM | 29.8 | | | 23.8 | | | 0.1 | | | 5.9 | | | 6.2 | | | 7.2 | | | (0.3) | | | (0.7) | | | (3.2) | | | (3.6) | | | 1.0 | | | (0.6) | | | |
| | | | | | | | | | | | | | | | | | | | | | | | | |
| Total net flows | 110.3 | | | 73.3 | | | 11.7 | | | 25.3 | | | 45.4 | | | 36.9 | | | 3.7 | | | 4.8 | | | 24.6 | | | 16.0 | | | 1.9 | | | 6.7 | | | |
| | | | | | | | | | | | | | | | | | | | | | | | | |
| Market gains and losses | 112.7 | | | 81.8 | | | 10.1 | | | 20.8 | | | 121.1 | | | 97.0 | | | 7.3 | | | 16.8 | | | (117.9) | | | (95.3) | | | (6.3) | | | (16.3) | | | |
| | | | | | | | | | | | | | | | | | | | | | | | | |
| Foreign currency translation | (3.5) | | | (0.3) | | | (2.5) | | | (0.7) | | | 0.5 | | | — | | | — | | | 0.5 | | | (2.1) | | | (0.1) | | | (1.6) | | | (0.4) | | | |
| Ending Assets (December 31) | $ | 819.5 | | | $ | 617.3 | | | $ | 62.8 | | | $ | 139.4 | | | $ | 600.0 | | | $ | 462.5 | | | $ | 43.5 | | | $ | 94.0 | | | $ | 433.0 | | | $ | 328.6 | | | $ | 32.5 | | | $ | 71.9 | | | |
| | | | | | | | | | | | | | | | | | | | | | | | | |
| | | | | | | | | | | | | | | | | | | | | | | | | |
| | | | | | | | | | | | | | | | | | | | | | | | | |
| | | | | | | | | | | | | | | | | | | | | | | | | |
| | | | | | | | | | | | | | | | | | | | | | | | | |
| | | | | | | | | | | | | | | | | | | | | | | | | |
| | | | | | | | | | | | | | | | | | | | | | | | | |
| | | | | | | | | | | | | | | | | | | | | | | | | |
| | | | | | | | | | | | | | | | | | | | | | | | | |
| | | | | | | | | | | | | | | | | | | | | | | | | |
| | | | | | | | | | | | | | | | | | | | | | | | | |
| | | | | | | | | | | | | | | | | | | | | | | | | |
| | | | | | | | | | | | | | | | | | | | | | | | | |
| | | | | | | | | | | | | | | | | | | | | | | | | |
| | | | | | | | | | | | | | | | | | | | | | | | | |
| | | | | | | | | | | | | | | | | | | | | | | | | |
| | | | | | | | | | | | | | | | | | | | | | | | | |
| | | | | | | | | | | | | | | | | | | | | | | | | |
| | | | | | | | | | | | | | | | | | | | | | | | | |
| | | | | | | | | | | | | | | | | | | | | | | | | |
| | | | | | | | | | | | | | | | | | | | | | | | | |
| | | | | | | | | | | | | | | | | | | | | | | | | |
| | | | | | | | | | | | | | | | | | | | | | | | | |
| | | | | | | | | | | | | | | | | | | | | | | | | |
| | | | | | | | | | | | | | | | | | | | | | | | | |
| | | | | | | | | | | | | | | | | | | | | | | | | |
| | | | | | | | | | | | | | | | | | | | | | | | | |
____________
See accompanying notes immediately following these AUM tables.
Invesco Ltd.
Footnotes to the Assets Under Management Tables
(1) Channel refers to the internal distribution channel from which the AUM originated. Retail AUM represents AUM distributed by the company’s retail sales teams. Institutional AUM represents AUM distributed by our institutional sales teams. This aggregation is viewed as a proxy for presenting AUM in the retail and institutional markets in which the company operates.
(2) Client domicile groups AUM by the domicile of the underlying clients.
(3) Investment capabilities are descriptive groupings of AUM by investment strategy. The company believes that presenting AUM by investment capability provides a more granular depiction of asset categorization and removed presentation of AUM by asset class in the quarter ending March 31, 2024. The comparative periods reflect the current period presentation.
(4) ETFs and Index includes ETFs and Indexed Strategies and excludes Invesco QQQ Trust.
(5) Fundamental Fixed Income includes Fixed Income products, including certain ETFs managed within this capability.
(6) Fundamental Equities includes Equity products.
(7) Private Markets includes Private Credit and Real Estate investments comprised primarily of Real Estate, CLOs, Private Credit and listed real assets, including certain ETFs managed within this capability.
(8) APAC Managed includes all products managed in the APAC region, including Invesco Great Wall, APAC managed short term, Money Market, passive, and ETFs.
(9) Multi-Asset/Other includes Global Asset Allocation, Invesco Quantitative Strategies, Global Targeted Returns, Solutions, Intelliflo, and UITs, including certain ETFs managed within this capability.
(10) Global Liquidity is comprised mainly of Money Market funds excluding APAC Money Market funds.
(11) QQQ represents assets held within Invesco QQQ Trust.
Results of Operations for the Year Ended December 31, 2024 compared to December 31, 2023
The discussion below includes the use of non-GAAP financial measures. See “Schedule of Non-GAAP Information” for additional details and reconciliations of the most directly comparable U.S. GAAP measures to the non-GAAP measures.
Operating Revenues and Net Revenues
The main categories of revenues, and the dollar and percentage change between the periods, are as follows:
| | | | | | | | | | | | | | | | | | | | | | | | | | | | | | | | | | | | | | | | | |
| | | | | | | |
| Years ended December 31, | | 2024 vs 2023 | | 2023 vs 2022 |
| (in millions) | 2024 | | 2023 | | 2022 | | $ Change | | % Change | | $ Change | | % Change |
| Investment management fees | $ | 4,342.3 | | | $ | 4,106.0 | | | $ | 4,358.4 | | | $ | 236.3 | | | 5.8 | % | | $ | (252.4) | | | (5.8) | % |
| Service and distribution fees | 1,479.7 | | | 1,374.6 | | | 1,405.5 | | | 105.1 | | | 7.6 | % | | (30.9) | | | (2.2) | % |
| Performance fees | 46.4 | | | 46.7 | | | 68.2 | | | (0.3) | | | (0.6) | % | | (21.5) | | | (31.5) | % |
| Other | 198.6 | | | 189.1 | | | 216.8 | | | 9.5 | | | 5.0 | % | | (27.7) | | | (12.8) | % |
| Total operating revenues | $ | 6,067.0 | | | $ | 5,716.4 | | | $ | 6,048.9 | | | $ | 350.6 | | | 6.1 | % | | $ | (332.5) | | | (5.5) | % |
| | | | | | | | | | | | | |
| Revenue Adjustments: | | | | | | | | | | | | | |
| Investment management fees | $ | (816.6) | | | $ | (766.4) | | | $ | (764.7) | | | $ | (50.2) | | | 6.6 | % | | $ | (1.7) | | | 0.2 | % |
| Service and distribution fees | (1,048.8) | | | (911.7) | | | (961.1) | | | (137.1) | | | 15.0 | % | | 49.4 | | | (5.1) | % |
| Other | (160.2) | | | (147.1) | | | (160.4) | | | (13.1) | | | 8.9 | % | | 13.3 | | | (8.3) | % |
Total Revenue Adjustments (1) | (2,025.6) | | | (1,825.2) | | | (1,886.2) | | | (200.4) | | | 11.0 | % | | 61.0 | | | (3.2) | % |
| | | | | | | | | | | | | |
| Invesco Great Wall | 318.1 | | | 368.3 | | | 432.7 | | | (50.2) | | | (13.6) | % | | (64.4) | | | (14.9) | % |
| CIP | 41.0 | | | 51.2 | | | 49.6 | | | (10.2) | | | (19.9) | % | | 1.6 | | | 3.2 | % |
| | | | | | | | | | | | | |
| | | | | | | | | | | | | |
| | | | | | | | | | | | | |
| | | | | | | | | | | | | |
Net revenues (2) | $ | 4,400.5 | | | $ | 4,310.7 | | | $ | 4,645.0 | | | $ | 89.8 | | | 2.1 | % | | $ | (334.3) | | | (7.2) | % |
_________
(1) Total Revenue Adjustments remove pass through investment management fees, service and distribution fees, and other revenues and equal the same amount as the Third-party distribution, service and advisory expenses.
(2) See “Schedule of Non-GAAP Information” for additional important disclosures regarding the use of net revenues.
Our revenues are directly influenced by the level and composition of our AUM. Therefore, movements in global capital market levels, net inflows (or outflows), and changes in the mix of investment products between asset classes and geographies may materially affect our revenues from period to period. See the company’s disclosures regarding the changes in AUM during the year ended December 31, 2024 and December 31, 2023 in the “Assets Under Management” section above for additional information.
Average AUM were $1,712.2 billion for the year ended December 31, 2024 as compared to $1,500.6 billion for the year ended December 31, 2023. As secular shifts in client demand continue, our broad set of investment capabilities have allowed us to capture evolving client product preferences, including products that have lower net revenue yields. Due to this change in the mix of AUM, net revenue yield excluding performance fees and Invesco QQQ Trust declined to 30.2 basis points (bps) for the year ended December 31, 2024 from 32.4 bps for the year ended December 31, 2023.
In addition, as fee rates differ across geographic locations, changes to the mix of AUM between geographies and exchange rates have an impact on operating revenues and net revenue yields.
Investment Management Fees
Investment management fees were $4,342.3 million for the year ended December 31, 2024 as compared to $4,106.0 million for the year ended December 31, 2023 as a result of higher average AUM partially offset by the shift in AUM toward lower yield products. See discussion above on how AUM changes impact our Investment management fees.
Service and Distribution Fees
For the year ended December 31, 2024, Service and distribution fees were $1,479.7 million as compared to $1,374.6 million for the year ended December 31, 2023. The increase was primarily driven by higher distribution fees of $91.2 million and administrative fees of $12.9 million resulting from higher average AUM to which the fees apply.
Performance Fees
For the years ended December 31, 2024, Performance fees were $46.4 million as compared to $46.7 million for the year ended December 31, 2023. Performance fees for the years ended December 31, 2024 and 2023 were primarily generated from multi-asset/other, private markets real estate and fundamental equities products.
Other Revenues
For the year ended December 31, 2024, Other revenues were $198.6 million as compared to $189.1 million for the year ended December 31, 2023. The increase in Other revenues was primarily driven by higher front end fees of $10.0 million and real estate transaction fees of $4.1 million, partially offset by lower other transaction fees of $4.6 million.
Invesco Great Wall
The company’s most significant joint venture is our investment in IGW. The company reflects 100% of IGW's results in its Net revenues and Adjusted operating expenses because it is important to evaluate the contribution that IGW is making to the business. The company’s non-GAAP operating results reflect the economics of these holdings on a basis consistent with the underlying AUM and flows. Adjusted net income attributable to Invesco Ltd. is reduced by the amount of earnings attributable to the noncontrolling interests. See “Schedule of Non-GAAP Information” for additional disclosures regarding the use of Net revenues.
Net revenues from IGW were $318.1 million and average AUM was $88.6 billion for the year ended December 31, 2024 (Net revenues were $368.3 million and average AUM was $87.2 billion, for the year ended December 31, 2023). The decrease in IGW revenues was primarily driven by the shift in AUM toward lower yield products and the introduction of regulatory mandated fee reductions in China in August 2023.
CIP
Management believes that the consolidation of investment products may impact a reader's analysis of our underlying results of operations and could result in investor confusion or the production of information about the company by analysts or external credit rating agencies that is not reflective of the underlying results of operations and financial condition of the company. Accordingly, management believes that it is appropriate to adjust operating revenues for the impact of CIP in calculating Net revenues. As Management and Performance fees earned by Invesco from the consolidated products are eliminated upon consolidation of the investment products, management believes that it is appropriate to add these Operating revenues back in the calculation of Net revenues. See “Schedule of Non-GAAP Information” for additional disclosures regarding the use of Net revenues.
Management and Performance fees earned from CIP were $41.0 million in the year ended December 31, 2024, as compared to $51.2 million for the year ended December 31, 2023.
Operating Expenses
The main categories of operating expenses, and the dollar and percentage changes between periods, are as follows:
| | | | | | | | | | | | | | | | | | | | | | | | | | | | | | | | | | | | | | | | | |
| Years ended December 31, | | 2024 vs 2023 | | 2023 vs 2022 |
| (in millions) | 2024 | | 2023 | | 2022 | | $ Change | | % Change | | $ Change | | % Change |
| Third-party distribution, service and advisory | $ | 2,025.6 | | | $ | 1,825.2 | | | $ | 1,886.2 | | | $ | 200.4 | | | 11.0 | % | | $ | (61.0) | | | (3.2) | % |
| Employee compensation | 2,014.2 | | | 1,885.8 | | | 1,725.1 | | | 128.4 | | | 6.8 | % | | 160.7 | | | 9.3 | % |
Marketing (1) | 81.3 | | | 82.1 | | | 94.6 | | | (0.8) | | | (1.0) | % | | (12.5) | | | (13.2) | % |
Property, office and technology (1) | 474.3 | | | 450.1 | | | 446.7 | | | 24.2 | | | 5.4 | % | | 3.4 | | | 0.8 | % |
General and administrative (1) | 594.7 | | | 567.6 | | | 493.6 | | | 27.1 | | | 4.8 | % | | 74.0 | | | 15.0 | % |
Transaction, integration and restructuring (2) | — | | | 41.6 | | | 21.2 | | | (41.6) | | | N/A | | 20.4 | | | 96.2 | % |
| Amortization and impairment of intangibles | 44.8 | | | 1,298.8 | | | 63.8 | | | (1,254.0) | | | (96.6) | % | | 1,235.0 | | | 1,935.7 | % |
| Total operating expenses | $ | 5,234.9 | | | $ | 6,151.2 | | | $ | 4,731.2 | | | $ | (916.3) | | | (14.9) | % | | $ | 1,420.0 | | | 30.0 | % |
The table below sets forth these expense categories as a percentage of total Operating expenses and Operating revenues, which we believe provides useful information as to the relative significance of each type of expense.
| | | | | | | | | | | | | | | | | | | | | | | | | | | | | | | | | | | | | | | | | | | | | | | | | | | | | |
| (in millions) | 2024 | | % of Total Operating Expenses | | % of Operating Revenues | | 2023 | | % of Total Operating Expenses | | % of Operating Revenues | | 2022 | | % of Total Operating Expenses | | % of Operating Revenues |
| Third-party distribution, service and advisory | $ | 2,025.6 | | | 38.7 | % | | 33.4 | % | | $ | 1,825.2 | | | 29.7 | % | | 31.9 | % | | $ | 1,886.2 | | | 39.9 | % | | 31.2 | % |
| Employee compensation | 2,014.2 | | | 38.5 | % | | 33.2 | % | | 1,885.8 | | | 30.7 | % | | 33.0 | % | | 1,725.1 | | | 36.5 | % | | 28.5 | % |
Marketing (1) | 81.3 | | | 1.5 | % | | 1.4 | % | | 82.1 | | | 1.3 | % | | 1.5 | % | | 94.6 | | | 2.1 | % | | 1.5 | % |
Property, office and technology (1) | 474.3 | | | 9.1 | % | | 7.8 | % | | 450.1 | | | 7.3 | % | | 7.9 | % | | 446.7 | | | 9.4 | % | | 7.4 | % |
General and administrative (1) | 594.7 | | | 11.4 | % | | 9.8 | % | | 567.6 | | | 9.2 | % | | 9.9 | % | | 493.6 | | | 10.4 | % | | 8.1 | % |
Transaction, integration and restructuring (2) | — | | | — | % | | — | % | | 41.6 | | | 0.7 | % | | 0.7 | % | | 21.2 | | | 0.4 | % | | 0.4 | % |
| Amortization and impairment of intangibles | 44.8 | | | 0.8 | % | | 0.7 | % | | 1,298.8 | | | 21.1 | % | | 22.7 | % | | 63.8 | | | 1.3 | % | | 1.1 | % |
| Total operating expenses | $ | 5,234.9 | | | 100.0 | % | | 86.3 | % | | $ | 6,151.2 | | | 100.0 | % | | 107.6 | % | | $ | 4,731.2 | | | 100.0 | % | | 78.2 | % |
__________
(1) Comparative periods presented reflect reclassification of certain operating expenses to align with current period presentation. The reclassification had no impact on our reported Operating revenues, Operating income, Net income, or any internal performance measure on which management is compensated. See Note 1, "Accounting Policies," for additional information.
(2) Transaction, integration and restructuring charges were primarily restructuring costs relating to our strategic evaluation which we completed in the first quarter of 2023.
Operating expenses decreased $916.3 million for the year ended December 31, 2024 as compared to the year ended December 31, 2023. The year ended December 31, 2023 included a $1,248.9 million non-cash impairment of our indefinite-lived intangible assets related to prior acquisitions of management contracts of U.S. retail mutual funds. The year ended December 31, 2024 included a one-time acceleration of $147.6 million in Employee compensation expense resulting from changes to the retirement criteria for vesting of currently outstanding common share-based awards and other long-term awards (collectively, Long-term awards). Excluding the intangible asset impairment charge for the year ended December 31, 2023 and the acceleration of Employee compensation expense for the year ended December 31, 2024, Operating expenses for the year ended December 31, 2024 increased $185.0 million as compared to the year ended December 31, 2023.
Third-Party Distribution, Service and Advisory
Third-party distribution, service and advisory expenses include periodic “renewal” commissions which are paid to brokers and independent financial advisors for providing services to their client accounts while they are invested in an Invesco product. Renewal commissions are calculated based upon a percentage of the AUM value and apply to much of the company's non-U.S. retail operations. The revenues from the company’s U.S. retail operations include 12b-1 distribution fees, which are largely passed through to brokers who sell the funds as third-party distribution expenses along with additional marketing support distribution costs. Both the revenues and the costs are dependent on the underlying AUM of the brokers' clients. The upfront distribution commissions are amortized over the redemption period. Also included in Third-party distribution, service and advisory expenses are sub-transfer agency fees that are paid to third parties for processing client common share purchases and redemptions, call center support and client reporting. These costs are reimbursed by the related funds.
Third-party distribution, service and advisory expenses were $2,025.6 million for the year ended December 31, 2024 as compared to $1,825.2 million for the year ended December 31, 2023. The increase was primarily due to increases of $112.9 million in service costs and $86.3 million in administrative and other third-party management fees resulting from higher average AUM and fund related costs. See "Schedule of Non-GAAP Information" for additional disclosures.
Employee Compensation
Employee compensation includes salary, cash bonuses and long-term incentive plans designed to attract and retain the highest caliber employees. Employee staff benefit plan costs and payroll taxes are also included in Employee compensation.
Employee compensation was $2,014.2 million for the year ended December 31, 2024 as compared to $1,885.8 million for the year ended December 31, 2023. The increase was primarily due to the previously noted acceleration of expense for currently outstanding Long-term awards of $147.6 million, higher variable compensation costs of $47.5 million and an increase of $29.2 million in expense related to the mark-to-market on deferred compensation liabilities. The increase was partially offset by lower costs related to executive retirements and organizational changes of $82.5 million.
Headcount at December 31, 2024 was 8,508 (December 31, 2023; 8,489).
Marketing
Marketing expenses include the cost of direct advertising of our products through trade publications, television and other media, and public relations costs, such as the marketing of the company's products through conferences or other sponsorships.
Marketing expenses were $81.3 million for the year ended December 31, 2024 as compared to $82.1 million for the year ended December 31, 2023.
Property, Office and Technology
Property, office and technology expenses include rent and utilities for our various leased facilities, depreciation of company-owned property, equipment and software, and other technology expenses including maintenance and licensing fees.
Property, office and technology expenses were $474.3 million for the year ended December 31, 2024 as compared to $450.1 million for the year ended December 31, 2023. The increase was primarily due to higher software costs of $21.2 million.
General and Administrative
General and administrative expenses include information service subscriptions, irrecoverable indirect taxes, employee travel, professional fees, recruitment and training costs as well as costs for outsourced services such as technology, middle office and back office management services.
General and administrative expenses were $594.7 million for the year ended December 31, 2024 as compared to $567.6 million for the year ended December 31, 2023. The increase was primarily due to a $52.5 million expense related to the settlement of regulatory matters partially offset by lower professional fees of $28.1 million.
Amortization and impairment of intangible assets
Amortization of intangible assets was $44.8 million for the year ended December 31, 2024 as compared to $49.9 million for the year ended December 31, 2023. The year ended December 31, 2023 included a $1,248.9 million non-cash impairment of our indefinite-lived intangible assets related to management contracts of U.S. retail mutual funds.
Operating Income, Adjusted Operating Income, Operating Margin and Adjusted Operating Margin
Operating income was $832.1 million in the year ended December 31, 2024, as compared to an operating loss of $434.8 million for the year ended December 31, 2023. Operating margin (operating income divided by operating revenues) increased to 13.7% for the year ended December 31, 2024 from (7.6)% in the year ended December 31, 2023. The operating loss for the year ended December 31, 2023 was primarily due to the $1,248.9 million intangible asset impairment as discussed above.
Adjusted operating income increased to $1,370.7 million for the year ended December 31, 2024 from $1,213.5 million for the year ended December 31, 2023. Adjusted operating margin increased to 31.1% for the year ended December 31, 2024 from 28.2% for the year ended December 31, 2023. See “Schedule of Non-GAAP Information” for a reconciliation of Operating revenues to Net revenues, a reconciliation of Operating income to Adjusted operating income and additional important disclosures regarding Net revenues, Adjusted operating income and Adjusted operating margin.
Other Income and Expenses
The main categories of other income and expenses, and the dollar and percentage changes between periods are as follows:
| | | | | | | | | | | | | | | | | | | | | | | | | | | | | | | | | | | | | | | | | |
| Years ended December 31, | | 2024 vs 2023 | | 2023 vs 2022 |
| (in millions) | 2024 | | 2023 | | 2022 | | $ Change | | % Change | | $ Change | | % Change |
| Equity in earnings of unconsolidated affiliates | $ | 43.0 | | | $ | 71.3 | | | $ | 106.1 | | | $ | (28.3) | | | (39.7) | % | | $ | (34.8) | | | (32.8) | % |
| Interest and dividend income | 58.9 | | | 47.8 | | | 24.4 | | | 11.1 | | | 23.2 | % | | 23.4 | | | 95.9 | % |
| Interest expense | (58.0) | | | (70.5) | | | (85.2) | | | 12.5 | | | (17.7) | % | | 14.7 | | | (17.3) | % |
| Other gains and losses, net | 47.7 | | | 98.0 | | | (139.5) | | | (50.3) | | | (51.3) | % | | 237.5 | | | N/A |
| Other income/(expense) of CIP, net | 81.6 | | | 50.3 | | | 24.2 | | | 31.3 | | | 62.2 | % | | 26.1 | | | 107.9 | % |
| | | | | | | | | | | | | |
| | | | | | | | | | | | | |
| | | | | | | | | | | | | |
| Total other income and expenses | $ | 173.2 | | | $ | 196.9 | | | $ | (70.0) | | | $ | (23.7) | | | (12.0) | % | | $ | 266.9 | | | N/A |
Equity in earnings of unconsolidated affiliates
Equity in earnings of unconsolidated affiliates decreased to $43.0 million for the year ended December 31, 2024 as compared to $71.3 million for the year ended December 31, 2023. The decrease was primarily driven by a decrease in income of $13.5 million from our joint venture investment in IGW and $9.6 million from our private markets real estate investments.
Interest and dividend income
Interest and dividend income was $58.9 million for the year ended December 31, 2024 as compared to $47.8 million for the year ended December 31, 2023. The increase was primarily due to an increase in dividend income earned on our private markets, deferred compensation and seed capital investments and higher interest income earned from Cash and cash equivalents.
Interest expense
Interest expense was $58.0 million for the year ended December 31, 2024 as compared to $70.5 million for the year ended December 31, 2023 as a result of the decrease in outstanding debt.
Other gains and losses, net
Other gains and losses, net was a gain of $47.7 million for the year ended December 31, 2024 as compared to a net gain of $98.0 million for the year ended December 31, 2023. The net gains for the years ended December 31, 2024 and 2023 included net market gains on deferred compensation related investments, other hedging instruments, and seed capital investments. The net gain for the year ended December 31, 2023 also included a $45 million gain on the sale of certain Hong Kong pension sponsorship rights.
Other income/(expense) of CIP, net
Other income/(expense) of CIP, net includes interest and dividend income, interest expense, and realized and unrealized gains and losses on the underlying investments and debt owned by CIP. For the year ended December 31, 2024, net interest income of CIP was $139.5 million as compared to $226.6 million for the year ended December 31, 2023. The decrease in net interest income was primarily a result of newly consolidated investment products in the year ended December 31, 2023 which were deconsolidated in the year ended December 31, 2024 as well as lower net interest income earned by the CLOs. For the year ended December 31, 2024, other gains and losses of CIP were a net loss of $57.9 million as compared to a net loss of $176.3 million for the year ended December 31, 2023. The net losses for the years ended December 31, 2024 and 2023 were attributable to market-driven losses on investments held by consolidated funds.
Net impact of CIP and related noncontrolling interests in consolidated entities
The adjustment to Net income for the Net income/(loss) attributable to noncontrolling interests in consolidated entities removes the income/(expense) of CIP which is attributable to third-party investors. Therefore, the consolidation of investment products did not have an impact on Net income attributable to Invesco for the year ended December 31, 2024 and 2023. Also, the net income or loss of CIP is taxed at the investor level, not at the product level; therefore, a tax provision is not reflected in the net impact of CIP.
Income Tax Expense
The income tax provision was an expense of $252.9 million for the year ended December 31, 2024, compared to a benefit of $(69.7) million for the year ended December 31, 2023, resulting in effective tax rates of 25.2% and 29.3% for the years ended December 31, 2024 and 2023, respectively. The higher effective tax rate for the year ended December 31, 2023 was primarily a result of favorable permanent tax adjustments increasing the effective tax due to the pre-tax book loss in 2023. The effective tax rate for the year ended December 31, 2024 was unfavorably impacted by nondeductible regulatory settlements and an increase in the valuation allowance recorded against certain net operating losses. For additional income tax information, please refer to Note 14, “Taxation,” in Part II, Item 8, Financial Statements and Supplementary Data.
Schedule of Non-GAAP Information
We utilize the following non-GAAP performance measures: Net revenue (and by calculation, Net revenue yield on AUM), Adjusted operating income, Adjusted operating margin, Adjusted net income attributable to Invesco and Adjusted diluted EPS. The company believes the adjusted measures provide valuable insight into the company’s ongoing operational performance and assist in comparisons to its competitors. These measures also assist the company’s management with the establishment of operational budgets and forecasts. The most directly comparable U.S. GAAP measures are Operating revenues (and by calculation, Gross revenue yield on AUM), Operating income, Operating margin, Net income/(loss) attributable to Invesco and Diluted EPS. Each of these measures is discussed more fully below.
The following are reconciliations of the U.S. GAAP measures to the non-GAAP measures. The non-GAAP measures should not be considered as substitutes for any U.S. GAAP measures and may not be comparable to other similarly titled measures of other companies. Additional reconciling items may be added in the future to the non-GAAP measures if deemed appropriate. The tax effects related to the reconciling items have been calculated based on the tax rate attributable to the jurisdiction to which the transaction relates. Notes to the reconciliations follow the tables.
Reconciliation of Operating revenues to Net revenues:
| | | | | | | | | | | | | | | | | |
| (in millions) | 2024 | | 2023 | | 2022 |
| Operating revenues, U.S. GAAP basis | $ | 6,067.0 | | | $ | 5,716.4 | | | $ | 6,048.9 | |
| | | | | |
Revenue adjustments: (1) | | | | | |
| Investment management fees | (816.6) | | | (766.4) | | | (764.7) | |
| Service and distribution fees | (1,048.8) | | | (911.7) | | | (961.1) | |
| Other | (160.2) | | | (147.1) | | | (160.4) | |
| Total revenue adjustments | (2,025.6) | | | (1,825.2) | | | (1,886.2) | |
Invesco Great Wall (2) | 318.1 | | | 368.3 | | | 432.7 | |
CIP (3) | 41.0 | | | 51.2 | | | 49.6 | |
| Net revenues | $ | 4,400.5 | | | $ | 4,310.7 | | | $ | 4,645.0 | |
| | | | | |
Reconciliation of Operating income/(loss) to Adjusted operating income:
| | | | | | | | | | | | | | | | | |
| (in millions) | 2024 | | 2023 | | 2022 |
| Operating income/(loss), U.S. GAAP basis | $ | 832.1 | | $ | (434.8) | | $ | 1,317.7 |
Invesco Great Wall (2) | 163.3 | | 201.9 | | 262.7 |
CIP (3) | 60.2 | | 84.8 | | 65.7 |
Transaction, integration and restructuring (4) | — | | 41.6 | | 21.2 |
Amortization and impairment of intangible assets (5) | 44.8 | | 1,298.8 | | 63.8 |
Compensation expense related to market valuation changes of deferred compensation liabilities (6) | 70.2 | | 41.2 | | (46.3) |
One-time acceleration of compensation expense for currently outstanding Long-term awards (7) | 147.6 | | — | | — |
General and administrative (8) | 52.5 | | (20.0) | | (70.0) |
| Adjusted operating income | $ | 1,370.7 | | $ | 1,213.5 | | $ | 1,614.8 |
| | | | | |
Operating margin (9) | 13.7 | % | | (7.6) | % | | 21.8 | % |
Adjusted operating margin (10) | 31.1 | % | | 28.2 | % | | 34.8 | % |
Reconciliation of Net income/(loss) attributable to Invesco to Adjusted net income attributable to Invesco:
| | | | | | | | | | | | | | | | | |
| (in millions, except per common share data) | 2024 | | 2023 | | 2022 |
| Net income/(loss) attributable to Invesco Ltd., U.S. GAAP basis | $ | 538.0 | | | $ | (333.7) | | | $ | 683.9 | |
| Adjustments (excluding tax): | | | | | |
| | | | | |
Transaction, integration and restructuring (4) | — | | | 41.6 | | | 21.2 | |
Amortization and impairment of intangible assets (5) | 44.8 | | | 1,298.8 | | | 63.8 | |
Deferred compensation net market valuation changes (6) | 17.6 | | | (18.6) | | | 73.6 | |
One-time acceleration of compensation expense for currently outstanding Long-term awards (7) | 147.6 | | | — | | | — | |
General and administrative (8) | 52.5 | | | (20.0) | | (70.0) |
| Total adjustments excluding tax | $ | 262.5 | | | $ | 1,301.8 | | | $ | 88.6 | |
Tax adjustment for amortization of intangible assets and goodwill (11) | 17.6 | | 16.7 | | 14.2 |
| Tax adjustment for impairment of intangible assets | — | | | (296.1) | | | — | |
| Other tax effects of adjustments above | (36.4) | | | 1.0 | | | (13.5) | |
| Adjusted net income attributable to Invesco Ltd. | $ | 781.7 | | $ | 689.7 | | $ | 773.2 |
| | | | | |
| Average common shares outstanding - diluted | 457.7 | | | 456.2 | | | 459.5 | |
| Diluted EPS | $ | 1.18 | | | $ | (0.73) | | | $ | 1.49 | |
Adjusted diluted EPS (12) | $ | 1.71 | | | $ | 1.51 | | | $ | 1.68 | |
____________
(1) Revenue adjustments: The company calculates Net revenues by reducing Operating revenues to exclude fees that are passed through to external parties who perform functions on behalf of, and distribute, the company’s managed funds. The Net revenue presentation assists in identifying the revenue contribution generated by the company, removing distortions caused by the differing distribution channel fees and allowing for a fair comparison with U.S. peer investment managers and within Invesco’s own investment units. Additionally, management evaluates Net revenue yield on AUM, which is equal to Net revenues divided by Average AUM during the reporting period, as an indicator of the Net revenues we receive for each dollar of AUM we manage.
Investment management fees are adjusted by renewal commissions and certain administrative fees. Service and distributions fees are primarily adjusted by distribution fees passed through to broker dealers for certain share classes and pass through fund-related costs. Other revenues are primarily adjusted by transaction fees passed through to third parties.
(2) Invesco Great Wall: The company reflects 100% of IGW in its Net revenues and Adjusted operating income (and by calculation, Adjusted operating margin). The company’s non-GAAP operating results reflect the economics of these holdings on a basis consistent with the underlying AUM and flows. Adjusted net income is reduced by the amount of earning attributable to the noncontrolling interests.
(3) CIP: See Part II, Item 8, Financial Statements and Supplementary Data, Note 18, “Consolidated Investment Products,” for a detailed analysis of the impact to the company’s Condensed Consolidated Financial Statements from the consolidation of CIP. The company believes that the CIP may impact a reader’s analysis of our underlying results of operations and could result in investor confusion or the production of information about the company by analysts or external credit rating agencies that is not reflective of the underlying results of operations and financial condition of the company. Accordingly, the company believes that it is appropriate to adjust Operating revenues and Operating income for the impact of CIP in calculating the respective Net revenues and Adjusted operating income (and by calculation, Adjusted operating margin).
(4) Transaction, integration and restructuring: The company believes it is useful to adjust for the Transaction, integration and restructuring charges in arriving at Adjusted operating income, Adjusted operating margin, Adjusted net income, and Adjusted diluted EPS, as this will aid comparability of our results period to period, and aid comparability with peer companies that may not have similar acquisition and restructuring related charges. Transaction, integration and restructuring charges were primarily restructuring costs relating to our strategic evaluation which we completed in the first quarter of 2023.
(5) Amortization and impairment of intangible assets: The company removes amortization and non-cash impairment expense related to acquired assets in arriving at Adjusted operating income, Adjusted operating margin, Adjusted net income and Adjusted diluted EPS, as this will aid comparability of our results period to period, and aid comparability with peer companies that may not have similar acquisition-related charges.
(6) Market valuation changes related to deferred compensation plan liabilities: Certain deferred compensation plan awards provide a return to the employee linked to the appreciation (depreciation) of specified investments. The company economically hedges the exposure to market movements on these deferred compensation liabilities. Since these liabilities are economically hedged, the company believes it is useful to remove the market movements related to the deferred compensation plan liabilities from the calculation of Adjusted operating income (and by calculation, Adjusted operating margin) and to remove the net impact of the economic hedge from the calculation of Adjusted net income (and by calculation, Adjusted diluted EPS) to produce results that will be more comparable period to period.
(7) One-time acceleration of compensation expense for currently outstanding Long-term awards: In the third quarter of 2024, the company recorded a one-time non-cash acceleration of Compensation expense of $147.6 million resulting from changes to the retirement criteria for vesting of currently outstanding Long-term awards. Due to the non-recurring nature of this item, the company removed this expense in arriving at Adjusted operating income, Adjusted operating margin, Adjusted net income, and Adjusted diluted EPS as this will aid comparability of our results period to period.
(8) General and administrative: In 2024, the company removed the expense related to the settlement of regulatory matters. In 2023 and 2022, the company removed insurance recoveries related to fund-related losses incurred in prior periods. Due to the non-recurring nature of these items, the company removed these expenses in arriving at Adjusted operating income, Adjusted operating margin, Adjusted net income and Adjusted diluted EPS as this will aid comparability of our results period to period.
(9) Operating margin is equal to Operating income divided by Operating revenues.
(10) Adjusted operating margin is equal to Adjusted operating income divided by Net revenues.
(11) Tax adjustment for amortization of intangible assets and goodwill: The company reflects the tax benefit realized on the tax amortization of goodwill and intangible assets in Adjusted net income. The company believes it is useful to include this tax benefit in arriving at the Adjusted diluted EPS measure.
(12) Adjusted diluted EPS is equal to Adjusted net income attributable to Invesco Ltd. divided by the weighted average number of common and restricted common shares outstanding.
Balance Sheet Discussion (1)
The following table represents a reconciliation of the balance sheet information presented on a U.S. GAAP basis to the balance sheet information excluding the impact of CIP for the reasons outlined in footnote 1 to the table:
| | | | | | | | | | | | | | | | | | | | | | | | | | | | | | | | | | | | | |
| December 31, 2024 | | December 31, 2023 |
Balance sheet information
(in millions) | U.S. GAAP | | Impact of CIP | | | | Excluding CIP | | U.S. GAAP | | Impact of CIP | | Excluding CIP |
| ASSETS | | | | | | | | | | | | | |
| Cash and cash equivalents | $ | 986.5 | | | $ | — | | | | | $ | 986.5 | | | $ | 1,469.2 | | | $ | — | | | $ | 1,469.2 | |
| | | | | | | | | | | | | |
| Investments | 1,240.0 | | | 401.4 | | | | | 1,641.4 | | | 919.1 | | | 527.4 | | | 1,446.5 | |
| | | | | | | | | | | | | |
| Goodwill and intangible assets, net | 14,067.4 | | | — | | | | | 14,067.4 | | | 14,539.6 | | | — | | | 14,539.6 | |
Other assets (2) | 2,340.5 | | | 11.1 | | | | | 2,351.6 | | | 2,527.5 | | | 18.8 | | | 2,546.3 | |
Investments and other assets of CIP (3) | 8,374.5 | | | (8,374.5) | | | | | — | | | 9,478.4 | | | (9,478.4) | | | — | |
| Total assets | $ | 27,008.9 | | | $ | (7,962.0) | | | | | $ | 19,046.9 | | | $ | 28,933.8 | | | $ | (8,932.2) | | | $ | 20,001.6 | |
| LIABILITIES | | | | | | | | | | | | | |
| | | | | | | | | | | | | |
| | | | | | | | | | | | | |
| Debt | $ | 890.6 | | | $ | — | | | | | $ | 890.6 | | | $ | 1,489.5 | | | $ | — | | | $ | 1,489.5 | |
Other liabilities (4) | 3,596.4 | | | — | | | | | 3,596.4 | | | 3,914.4 | | | — | | | 3,914.4 | |
| Debt and other liabilities of CIP | 6,853.1 | | | (6,853.1) | | | | | — | | | 7,613.9 | | | (7,613.9) | | | — | |
| Total liabilities | $ | 11,340.1 | | | $ | (6,853.1) | | | | | $ | 4,487.0 | | | $ | 13,017.8 | | | $ | (7,613.9) | | | $ | 5,403.9 | |
| EQUITY | | | | | | | | | | | | | |
| Total equity attributable to Invesco Ltd. | $ | 14,559.9 | | | $ | — | | | | | $ | 14,559.9 | | | $ | 14,597.6 | | | $ | 0.1 | | | $ | 14,597.7 | |
Noncontrolling interests (5) | 1,108.9 | | | (1,108.9) | | | | | — | | | 1,318.4 | | | (1,318.4) | | | — | |
| Total equity | 15,668.8 | | | (1,108.9) | | | | | 14,559.9 | | | 15,916.0 | | | (1,318.3) | | | 14,597.7 | |
| Total liabilities and equity | $ | 27,008.9 | | | $ | (7,962.0) | | | | | $ | 19,046.9 | | | $ | 28,933.8 | | | $ | (8,932.2) | | | $ | 20,001.6 | |
____________(1) This table includes non-GAAP presentations. Assets of CIP are not available for use by Invesco. Additionally, there is no recourse to Invesco for CIP debt.
(2) Amounts include Accounts receivable, Property, equipment and software, and Other assets.
(3) Amounts include Cash and cash equivalents of CIP.
(4) Amounts include Accrued compensation and benefits, Accounts payable and accrued expenses, and Deferred tax liabilities.
(5) Amounts include Redeemable noncontrolling interests in consolidated entities and Equity attributable to nonredeemable noncontrolling interests in consolidated entities.
Cash and cash equivalents
Cash and cash equivalents decreased $482.7 million from $1,469.2 million at December 31, 2023 to $986.5 million at December 31, 2024. See “Cash Flows Discussion” below within this Management's Discussion and Analysis for additional discussion regarding the movements in cash flows during the periods. See Part II, Item 8, Financial Statements and Supplementary Data - Note 1, “Accounting Policies - Cash and Cash Equivalents,” regarding capital adequacy requirements in certain jurisdictions.
Investments
Investments are comprised primarily of the equity method investment in IGW, seed capital and co-investments in affiliated funds, and investments related to the company’s deferred compensation plans.
As of December 31, 2024 and December 31, 2023, the company had $1,125.6 million and $956.0 million in seed capital and co-investments, respectively, including direct investments in CIP. Total seed capital and co-investments is presented as a helpful measure for investors and represents our net investment including our net investment in CIP. The following table reconciles the investment balance to the total seed capital and co-investment balance.
| | | | | | | | | | | |
| (in millions) | December 31, 2024 | | December 31, 2023 |
| Investments | $ | 1,240.0 | | | $ | 919.1 | |
| Net investment in CIP | 401.4 | | | 527.4 | |
| Less: Investments related to deferred compensation plans, joint ventures, and other investments | (515.8) | | | (490.5) | |
Total seed capital and co-investments (1) | $ | 1,125.6 | | | $ | 956.0 | |
____________
(1) Included in the total seed and co-investment balance as of December 31, 2024 is $414.0 million of seed capital and $711.6 million of co-investments (December 31, 2023: $314.1 million of seed capital and $641.9 million of co-investments).
Goodwill and intangible assets, net
Goodwill and intangible assets, net decreased to $14,067.4 million at December 31, 2024 from $14,539.6 million at December 31, 2023. The decrease was due to amortization expense of $44.8 million, the transfer of $225.9 million of goodwill and intangible assets to held for sale, and foreign exchange impacts of $201.5 million. See "Critical Accounting Policies and Estimates” and Item 8, Financial Statements and Supplementary Data - Note 1, “Accounting Policies,” for additional information.
Liquidity and Capital Resources
Our capital structure, together with available cash balances, cash flows generated from operations, existing capacity under our revolving credit agreement and further capital market activities, if necessary, should provide us with sufficient resources to meet present and future cash needs, including operating expenses, debt and other obligations as they come due and anticipated future capital requirements.
Sources of Liquidity by Type
| | | | | | | | | | | |
| (in millions) | December 31, 2024 | | December 31, 2023 |
| Cash and cash equivalents | $ | 986.5 | | | $ | 1,469.2 | |
| Available revolving credit agreement | 2,000.0 | | | 2,000.0 | |
| Total Sources of Liquidity by Type | $ | 2,986.5 | | | $ | 3,469.2 | |
On January 30, 2024, Invesco Finance PLC, a wholly-owned indirect subsidiary of the Parent, paid in full the outstanding balance of the $600.0 million senior notes which were due on January 30, 2024. As of December 31, 2024, the balance on the $2.0 billion revolving credit agreement was zero.
In the ordinary course of business, Invesco enters into contracts or purchase obligations with third parties whereby the third parties provide services to or on behalf of Invesco. Purchase obligations represent fixed-price contracts, which are either non-cancelable or cancellable with a penalty. As of December 31, 2024, the company's purchase obligations totaled $694.4 million (December 31, 2023: $663.5 million) and primarily reflect standard service contracts for portfolio, market data, office-related services and third-party marketing and promotional services. Purchase obligations are recorded as liabilities in the company's Consolidated Financial Statements when services are provided.
Capital Management
Our capital management priorities have evolved with the growth and success of our business and include, in no particular order of priority: reinvestment in the business, maintaining a strong balance sheet and returning capital to shareholders longer term through a combination of share repurchases and modestly increasing dividends.
During the year ended December 31, 2024, the company repurchased 2.9 million common shares for $49.6 million in the open market. As of December 31, 2024, approximately $332.6 million remained authorized under the company’s common share repurchase authorization approved by the Board on July 22, 2016.
Our capital process is executed in a manner consistent with our desire to maintain strong, investment grade credit ratings. As of the date of our filing, Invesco held credit ratings of BBB+/Stable, A3/Stable and A/Stable from S&P Ratings Service, Moody’s Investor Services and Fitch Ratings, respectively.
Other Items
Certain of our subsidiaries are required to maintain minimum levels of regulatory capital, liquidity, and working capital. Such requirements may change from time-to-time as additional guidance is released based on a variety of factors, including balance sheet composition, assessment of risk exposures and governance, and review from regulators. These and other similar provisions of applicable laws and regulations may have the effect of limiting withdrawals of capital, repayment of intercompany loans and payment of dividends by such entities. Our financial condition or liquidity could be adversely affected if certain of our subsidiaries are unable to distribute funds to us.
We are in compliance with all regulatory minimum net capital requirements. As of December 31, 2024, the company's minimum regulatory capital requirement was $324.9 million (December 31, 2023: $395.8 million).
We meet the regulatory liquidity and working capital requirements by holding cash and cash equivalents in the European sub-group. This retained cash can be used for general business purposes in the European sub-group in the countries where it is located. Due to the liquidity and working capital requirements, the ability to transfer cash between certain jurisdictions may be limited. In addition, transfers of cash between international jurisdictions may have adverse tax consequences.
The consolidation of $8,374.5 million and $6,200.9 million of total assets and debt of CIP as of December 31, 2024, respectively, did not impact the company’s liquidity and capital resources. See Part II, Item 8, Financial Statements and Supplementary Data - Note 18, “Consolidated Investment Products,” for additional details.
Cash Flows Discussion
The following table represents a reconciliation of the cash flow information presented on a U.S. GAAP basis to the cash flow information, excluding the impact of the cash flows of CIP for the reasons outlined in footnote 1 to the table:
| | | | | | | | | | | | | | | | | | | | | | | | | | | | | | | | | | | | | | | | | | | | | | | | | | | | | |
| Years ended December 31, |
Cash flows information (1) | 2024 | | 2023 | | 2022 |
| (in millions) | U.S. GAAP | | Impact of CIP | | Excluding CIP | | U.S. GAAP | | Impact of CIP | | Excluding CIP | | U.S. GAAP | | Impact of CIP | | Excluding CIP |
| Cash and cash equivalents beginning of the period | $ | 1,931.6 | | | $ | (462.4) | | | $ | 1,469.2 | | | $ | 1,434.1 | | | $ | (199.4) | | | $ | 1,234.7 | | | $ | 2,147.1 | | | $ | (250.7) | | | $ | 1,896.4 | |
| Cash flows from operating activities | 1,190.0 | | | (114.8) | | | 1,075.2 | | | 1,300.8 | | | (136.6) | | | 1,164.2 | | | 703.2 | | | 414.1 | | | 1,117.3 | |
| Cash flows from investing activities | 68.4 | | | (308.4) | | | (240.0) | | | (244.3) | | | 72.8 | | | (171.5) | | | (375.6) | | | 81.5 | | | (294.1) | |
| Cash flows from financing activities | (1,661.6) | | | 374.0 | | | (1,287.6) | | | (585.4) | | | (196.8) | | | (782.2) | | | (966.9) | | | (449.4) | | | (1,416.3) | |
| Increase/(decrease) in cash and cash equivalents | (403.2) | | | (49.2) | | | (452.4) | | | 471.1 | | | (260.6) | | | 210.5 | | | (639.3) | | | 46.2 | | | (593.1) | |
| Foreign exchange movement on cash and cash equivalents | (32.4) | | | 2.1 | | | (30.3) | | | 26.4 | | | (2.4) | | | 24.0 | | | (73.7) | | | 5.1 | | | (68.6) | |
| Cash and cash equivalents, end of the period | $ | 1,496.0 | | | $ | (509.5) | | | $ | 986.5 | | | $ | 1,931.6 | | | $ | (462.4) | | | $ | 1,469.2 | | | $ | 1,434.1 | | | $ | (199.4) | | | $ | 1,234.7 | |
| | | | | | | | | | | | | | | | | |
| Cash and cash equivalents | $ | 986.5 | | | $ | — | | | $ | 986.5 | | | $ | 1,469.2 | | | $ | — | | | $ | 1,469.2 | | | $ | 1,234.7 | | | $ | — | | | $ | 1,234.7 | |
| | | | | | | | | | | | | | | | | |
| Cash and cash equivalents of CIP | 509.5 | | | (509.5) | | | — | | | 462.4 | | | (462.4) | | | — | | | 199.4 | | | (199.4) | | | — | |
| Total cash and cash equivalents per consolidated statement of cash flows | $ | 1,496.0 | | | $ | (509.5) | | | $ | 986.5 | | | $ | 1,931.6 | | | $ | (462.4) | | | $ | 1,469.2 | | | $ | 1,434.1 | | | $ | (199.4) | | | $ | 1,234.7 | |
____________
(1) These tables include non-GAAP presentations. Cash held by CIP is not available for use by Invesco. Additionally, there is no recourse to Invesco for CIP debt. The cash flows of CIP do not form part of the company’s cash flow management processes, nor do they form part of the company’s significant liquidity evaluations and decisions.
Operating Activities
Operating cash flows include the receipt of Investment management and other fees generated from AUM, offset by Operating expenses and changes in operating assets and liabilities. After allowing for the change in cash held by CIP, investment activities, non-cash activity, and seasonal payments, such as bonus payments in the first quarter, our operating cash flows generally move in the same direction as our Operating income/(loss).
Cash inflows for the year ended December 31, 2024, excluding the impact of CIP, were primarily driven by operating income and changes in payables and receivables due to the timing of payments and receipts.
Investing Activities
Cash outflows for the year ended December 31, 2024, excluding the impact of CIP, includes purchases of investments of $307.0 million (year ended December 31, 2023: $108.2 million) and property, equipment and software of $69.1 million (year ended December 31, 2023: $164.3 million), partially offset by proceeds of $135.9 million from Capital distributions from equity method investees (year ended December 31, 2023: $28.0 million). The year ended December 31, 2023 also included proceeds of $26.8 million from the Sale of investments and $46.2 million from the sale of certain Hong Kong pension sponsorship rights.
Financing Activities
Financing cash outflows during the year ended December 31, 2024 included $371.5 million of common dividend payments for dividends declared in January, April, July and October 2024 (year ended December 31, 2023: dividends paid of $357.9 million), $236.8 million of preferred dividend payments for dividends declared in January, April, July and October 2024 (year ended December 31, 2023: $236.8 million), $49.6 million for the repurchase of common shares through the open market (year ended December 31, 2023: $150.0 million), and the payment of $29.7 million to meet employees' withholding tax obligations on common share vestings (2023: $37.5 million). Financing cash outflows during the year ended December 31, 2024 also included a $600.0 million redemption of senior notes. Net borrowings under the revolving credit agreement were zero during the years ended December 31, 2024 and December 31, 2023.
Dividends
When declared, Invesco pays dividends on a quarterly basis in arrears. Holders of our preferred shares are eligible to receive dividends at an annual rate of 5.9% of the liquidation preference of $1,000 per share, or $59 per share per annum. The preferred dividend is payable quarterly on a non-cumulative basis when, if and as declared by our Board. However, if we have not declared and paid or set aside for payment full quarterly dividends on the preferred stock for a particular dividend period, we may not declare or pay dividends on, redeem, purchase or acquire our common stock or other junior securities in the next succeeding dividend period. In addition, if we have not declared and paid or set aside for payment quarterly dividends on the preferred stock for six quarterly periods, whether or not consecutive, the number of directors of the company will be increased by two and the holders of the preferred shares shall have the right to elect such two additional members of the Board.
On January 27, 2025, the company declared a fourth quarter 2024 cash dividend of $0.205 per common share to the holders of common shares. The dividend is payable on March 4, 2025, to common shareholders of record at the close of business on February 14, 2025, with an ex-dividend date of February 14, 2025.
On January 27, 2025, the company declared a preferred dividend of $14.75 per preferred share representing the period from December 1, 2024 through February 28, 2025. The preferred dividend is payable on March 3, 2025.
The declaration, payment and amount of any future dividends will depend upon, among other factors, our earnings, financial condition and capital requirements at the time such declaration and payment are considered. The company has a policy of managing dividends in a prudent fashion, with due consideration given to profit levels, overall debt levels and historical dividend payouts.
Common Share Repurchase Plan
During 2024, the company repurchased 2.9 million shares for $49.6 million in the open market as compared to 9.6 million shares for $150 million during 2023. At December 31, 2024, approximately $332.6 million remained authorized under the company's common share repurchase authorization approved by the Board on July 22, 2016 (December 31, 2023: $382.2 million).
Debt
The carrying value of our debt at December 31, 2024 was $890.6 million (December 31, 2023: $1,489.5 million), See Item 8, Financial Statements and Supplementary Data, Note 8, “Debt,” for additional disclosures.
For the year ended December 31, 2024, the company's weighted average cost of debt was 4.64% (year ended December 31, 2023: 4.28%).
Financial covenants under the revolving credit agreement include: (i) the quarterly maintenance of an Adjusted debt/Earnings before income tax, depreciation, amortization, interest expense, common share-based compensation expense, unrealized (gains)/losses from investments, net, and unusual or otherwise non-recurring gains and losses (Covenant Adjusted EBITDA) leverage ratio, as defined in the revolving credit agreement, of not greater than 3.25:1.00, (ii) an interest coverage ratio (Covenant Adjusted EBITDA/interest expense for the four consecutive fiscal quarters ended before the date of determination) of not less than 4.00:1.00. As of December 31, 2024, we were in compliance with our financial covenants. At December 31, 2024, our leverage ratio was 0.25:1.00 (December 31, 2023: 0.69:1.00), and our interest coverage ratio was 26.84:1.00 (December 31, 2023: 20.40:1.00).
The December 31, 2024 and 2023 coverage ratio calculations are as follows:
| | | | | | | | | | | |
| (in millions) | December 31, 2024 | | December 31, 2023 |
| Net income/(loss) attributable to Invesco Ltd. | $ | 538.0 | | | $ | (333.7) | |
| Dividends on preferred shares | 236.8 | | | 236.8 | |
| | | |
| Interest expense | 58.0 | | | 70.5 | |
| Tax expense/(benefit) | 252.9 | | | (69.7) | |
Amortization/depreciation/impairment (1) | 184.1 | | | 1,431.7 | |
| Common share-based compensation expense | 71.1 | | | 114.6 | |
One-time acceleration of compensation expense for currently outstanding Long-term awards (2) | 147.6 | | | — | |
Regulatory matters (2) | 52.5 | | | — | |
Unrealized (gains)/losses from investments, net (3) | 16.0 | | | (11.9) | |
Covenant Adjusted EBITDA (4) | $ | 1,557.0 | | | $ | 1,438.3 | |
Adjusted debt (4) | $ | 393.8 | | | $ | 992.4 | |
| Leverage ratio (Adjusted debt/Covenant Adjusted EBITDA - maximum 3.25:1.00) | 0.25 | | | 0.69 | |
| Interest coverage (Covenant Adjusted EBITDA/Interest expense - minimum 4.00:1.00) | 26.84 | | | 20.40 | |
____________
(1) Includes amortization of cloud technology implementation costs.
(2) Unusual or otherwise non-recurring gains and losses, as defined in our revolving credit agreement, are adjusted for in the determination of Covenant Adjusted EBITDA. A one-time acceleration of $147.6 million in expense resulting from changes to the criteria for retirements for currently outstanding Long-term awards and an expense of $52.5 million related to the settlement of regulatory matters in 2024 are non-recurring expenses and have been removed from the determination of Covenant Adjusted EBITDA.
(3) Adjustments for unrealized gains and losses from investments, as defined in our revolving credit agreement, may also include non-cash gains and losses on investments to the extent that they do not represent anticipated future cash receipts or expenditures.
(4) Covenant Adjusted EBITDA and Adjusted debt are non-GAAP financial measures that are used by management in connection with certain debt covenant calculations under our revolving credit agreement. The calculation of Covenant Adjusted EBITDA above (a reconciliation from Net income attributable to Invesco Ltd.) is defined by our revolving credit agreement, and therefore Net income attributable to Invesco Ltd. is the most appropriate GAAP measure from which to reconcile to Covenant Adjusted EBITDA. The calculation of 2024 Adjusted debt is defined in our amended revolving credit agreement and equals debt of $890.6 million plus $3.2 million in letters of credit less $500.0 million of excess unrestricted cash (cash and cash equivalents less the minimum regulatory capital requirement, not to exceed $500 million (2023: $500.0 million).
On January 30, 2024, Invesco Finance PLC, a wholly-owned indirect subsidiary of the Parent, paid in full the outstanding balance of the $600.0 million senior notes which were due on January 30, 2024.
The discussion that follows identifies risks associated with the company's liquidity and capital resources. The Item 1. Business - Risk Management section contains a broader discussion of the company's overall approach to risk management.
Credit and Liquidity Risk
The company manages its capital by reviewing annual and projected cash flow forecasts and by monitoring credit, liquidity and market risks, such as interest rate and foreign currency risks (as discussed in Item 7A, “Quantitative and Qualitative Disclosures About Market Risk”), through measurement and analysis.
Credit Risk
Credit risk is the risk that one party to a financial instrument will cause a financial loss for the other party by failing to meet an obligation. The company is primarily exposed to credit risk through its cash and cash equivalent deposits, which are held by external firms. The company invests its cash balances in its own institutional money market products, as well as with external high credit-quality financial institutions. These arrangements create exposure to concentrations of credit risk. As of December 31, 2024, our maximum exposure to credit risk related to our Cash and cash equivalent balances is $986.5 million, of which $479.3 million is invested in affiliated money market funds. See Part II, Item 8, Financial Statements and Supplementary Data - Note 2, "Fair Value of Assets and Liabilities" for information regarding Cash and cash equivalents invested in affiliated money market funds.
Liquidity Risk
Liquidity risk is the risk that the company will encounter difficulty in meeting obligations associated with its financial liabilities as the same become due. The company is exposed to liquidity risk through its $890.6 million in total debt. The company actively manages liquidity risk by preparing cash flow forecasts for future periods, reviewing them regularly with senior management, maintaining a committed revolving credit agreement, scheduling significant gaps between major debt maturities and engaging external financing sources in regular dialogue.
Effects of Inflation
Inflation can impact our organization primarily in two ways. First, inflationary pressures can result in increases in our cost structure, especially to the extent that large expense components such as compensation are impacted. To the degree that these expense increases are not recoverable or cannot be counterbalanced through pricing increases due to the competitive environment, our net income could be negatively impacted. Secondly, the value of the assets that we manage may be negatively impacted when inflationary expectations result in a rising interest rate environment. A decline in the value of AUM could lead to reduced revenues as management fees are generally calculated based upon the value of AUM.
Off Balance Sheet Commitments
See Part II, Item 8, Financial Statements and Supplementary Data - Note 17, “Commitments and Contingencies,” for more information regarding undrawn capital commitments.
Critical Accounting Policies and Estimates
Our significant accounting policies are disclosed in Part II, Item 8, Financial Statements and Supplementary Data - Note 1, “Accounting Policies." Critical accounting policies and estimates are those that require complex management judgment regarding matters that are highly uncertain at the time policies were applied and estimates were made. Different estimates reasonably could have been used in the current period that would have had a material effect on these Consolidated Financial Statements, and changes in these estimates are likely to occur from period-to-period in the future. The discussion below provides information on the significant judgments and assumptions applied in each area and should be read in conjunction with the significant accounting policies footnote previously referenced.
Intangible Assets
Management has the option to first assess indefinite-lived intangible assets for qualitative factors to determine whether it is necessary to perform a quantitative impairment test. Definite-lived intangible assets are reviewed for impairment whenever events or changes in circumstances indicate that their carrying amount may not be recoverable (i.e., the carrying amount exceeds the fair value of the intangible asset). In addition, management's judgment is required to estimate the period over which definite-lived intangible assets will contribute to the company's cash flows and the pattern in which these assets will be consumed. A change in the remaining useful life of any of these assets, or the reclassification of an indefinite-lived intangible asset to a definite-lived intangible asset, could have a significant impact on the company's amortization expense.
Intangible assets not subject to amortization are tested for impairment annually as of October 1 or more frequently if events or changes in circumstances indicate that the asset might be impaired. If a quantitative assessment is required, the impairment test consists of a comparison of the fair value of an intangible asset to its carrying amount. If the carrying amount of the intangible asset exceeds its fair value, an impairment loss is recognized in an amount equal to that excess. Management used an income approach to value indefinite-lived intangible assets related to acquired management contracts of U.S. retail mutual funds. An income approach includes assumptions for current market conditions, including the asset’s updated forecasts of AUM to take into consideration market gains or losses, net long-term flows and the corresponding changes in revenue and expenses. The most sensitive assumptions used in the income approach are the long-term growth rate and the discount rate applied to the cash flow forecast to determine present value. Taking into consideration the AUM mix of the U.S. retail mutual funds, the long-term growth rate was determined using the historical returns of the S&P 500 index, treasury bonds and treasury bills. The long-term growth rate used by management in the annual impairment test was 2.5% and is consistent with the prior year annual impairment test. The discount rate is an estimate of the weighted average cost of capital for the investment management sector reflecting the overall industry risks associated with future cash flows and considers an applicable size premium for the intangible asset. The discount rate used by management was 12.88%, which declined 17 bps from the prior year primarily due to a decrease in the risk-free rate. We continued to factor an asset-specific risk premium into the discount rate for the U.S. retail mutual fund indefinite-lived intangible assets to account for the uncertainty around future AUM flows given the continued shift
in investor preferences away from actively managed funds. We assessed the reasonableness of the estimated fair value of the intangible assets by considering applicable market data.
Based on our annual impairment analysis as of October 1, 2024, we determined that the estimated fair value of the indefinite-lived intangible assets related to acquired management contracts of U.S. retail mutual funds exceeded its carrying value of $4,572.1 million by $267.4 million or 6%. Headroom increased from the prior year due to favorable market conditions and a decrease in the discount rate. While the company believes all assumptions utilized in our assessment are reasonable and appropriate, changes in these estimates could produce different fair value amounts which could drive impairment in future periods. For example, assuming all other assumptions remain static, a decrease to the long-term growth rate of 25 bps would decrease headroom to $178.1 million or 3.9%. Also, an increase to the discount rate of 15 bps would decrease headroom to $206.2 million or 4.5%.
Our annual impairment reviews of our other indefinite-lived intangible assets determined that there was not an impairment of these intangibles. The classifications of indefinite-lived and definite-lived intangible assets remain appropriate, and no changes to the expected lives of definite-lived intangible assets were required.
Goodwill
Management has the option to first assess goodwill for qualitative factors to determine whether it is necessary to perform a quantitative impairment test. We performed a quantitative annual impairment test as of October 1, 2023 and determined that the estimated fair value of the reporting unit exceeded its carrying value by 5%. For our annual impairment test in 2024, management performed the optional qualitative approach. Based on our annual impairment analysis of goodwill as of October 1, 2024, we determined that a quantitative assessment of the goodwill impairment test was not necessary. The qualitative impairment analysis indicated that headroom improved from the prior year impairment test due to improved profitability, favorable market conditions and a decrease in the discount rate.
The company cannot predict the occurrence of future events that might adversely affect the reported value of goodwill of $8,318.1 million at December 31, 2024. Such events include, but are not limited to, strategic decisions made in response to economic and competitive conditions or a significant decline in our revenue and operating income due to a change in AUM mix or unfavorable market conditions, including a significant decline in our stock price for an extended period of time. However, an impairment in the future would not impact the company’s liquidity or capital resources.
Income Taxes
The company files U.S. federal, state and numerous foreign income tax returns. The income tax laws are complex and subject to different interpretations by the taxpayer and the relevant taxing authorities. Significant judgment is required in the determination of our annual income tax provision, which includes the assessment of deferred tax assets and uncertain tax positions, as well as the interpretation and application of existing and newly enacted tax laws, regulation changes and new judicial rulings. Therefore, it is possible that actual results will vary from those recognized in our Consolidated Financial Statements due to changes in the interpretation of applicable guidance or as a result of examinations by taxing authorities.
Deferred tax assets, net of any associated valuation allowance, have been recognized based on management's belief that taxable income of the appropriate character, more likely than not, will be sufficient to realize the benefits of these assets over time. In the event that actual results differ from our expectations, or if our historical trends of positive operating income changes, we may be required to record a valuation allowance on some or all of these deferred tax assets, which may have a significant effect on our financial condition and results of operations. In assessing whether a valuation allowance should be established against a deferred income tax asset, the company considers all available evidence, which includes the nature, frequency and severity of recent losses, forecasts of future profitability and the duration of statutory carry back and carry forward periods, among other factors.
In the assessment of uncertain tax positions, significant judgment is required to estimate the range of possible outcomes and determine the probability, on a more likely than not basis, of favorable or unfavorable outcomes upon ultimate settlement of an issue. Changes in the estimate of uncertain tax positions occur periodically due to changes in interpretations of tax laws, the status of examinations by tax authorities and new regulatory or judicial guidance that could impact the relative merits and risk of tax positions. These changes, when they occur, impact tax expense and can materially impact results of operations. The company recognizes any interest and penalties related to unrecognized tax benefits (UTBs) on the Consolidated Statements of Income as components of income tax expense.
CIP
Assessing if an entity is a variable interest entity (VIE) or voting interest entity (VOE) involves judgment and analysis on a structure-by-structure basis. Factors assessed as part of the analysis include the legal organization of the entity, the company's contractual involvement with the entity and any related party or de facto agent implications of the company's involvement with the entity. If the company is deemed to have the power to direct the activities of the fund that most significantly impact the fund's economic performance and the obligation to absorb losses/right to receive benefits from the fund that could potentially be significant to the fund, then the company is deemed to be the fund's primary beneficiary and is required to consolidate the fund. Assessing if the company has the power to direct the activities that most significantly impact the fund’s economic results may involve significant judgment.
Recent Accounting Standards
See Part II, Item 8, Financial Statements and Supplementary Data - Note 1, “Accounting Policies - Accounting Pronouncements Recently Adopted and Pending Accounting Pronouncements.”
Item 7A. Quantitative and Qualitative Disclosures About Market Risk
In the normal course of its business, the company is primarily exposed to market risk in the form of AUM market price risk, securities market risk, interest rate risk and foreign exchange rate risk.
AUM Market Price Risk
The company's investment management revenues are comprised of fees based on the value of AUM. Declines in the market prices of equity and fixed income securities, commodities and derivatives, or other similar financial instruments held in client portfolios could cause revenues to decline because of lower investment management fees by:
•Causing the value of AUM to decrease.
•Causing the returns realized on AUM to decrease (impacting performance fees).
•Causing clients to withdraw funds in favor of investments in markets that they perceive to offer greater opportunity and that the company does not serve.
•Causing clients to rebalance assets away from investments that the company manages into investments that the company does not manage.
•Causing clients to reallocate assets away from products that earn higher revenues into products that earn lower revenues.
Underperformance of client accounts relative to competing products could exacerbate these factors.
Assuming the revenue yield on AUM for the year remains unchanged, a decline in the average AUM for the year would result in a corresponding decline in revenue. Certain expenses, including distribution and compensation expenses, may not vary in proportion with the changes in the market value of AUM. As such, the impact on operating margin or net income of a decline in the market values of AUM may be greater than the percentage decline in the market value of AUM.
Securities Market Risk
The company's exposure to market risk from financial instruments measured at fair value arises primarily from its investments. The following table summarizes the impact of a 10% increase or decrease in the fair values of these financial instruments:
| | | | | | | | | | | | | | | | | | | | | | | |
| December 31, 2024 | | |
| (in millions) | Fair Value | | Fair Value assuming 10% increase | | Fair Value assuming 10% decrease | | | | | | |
Equity investments (1) | $ | 371.2 | | | $ | 408.3 | | | $ | 334.1 | | | | | | | |
| Total assets measured at fair value exposed to market risk | $ | 371.2 | | | $ | 408.3 | | | $ | 334.1 | | | | | | | |
| | | | | | | | | | | |
Net investments in CIP (2) | $ | 401.4 | | | $ | 441.5 | | | $ | 361.3 | | | | | | | |
____________
(1)If such a 10% increase or decrease in fair values were to occur, the change attributable to $371.2 million of these equity investments would result in a corresponding increase or decrease in our pre-tax earnings. At December 31, 2024, $219.6 million of these equity investments are held to hedge economically certain deferred compensation plans in which the company's employees participate. In addition to holding equity investments, the company has a total return swap (TRS) to economically hedge certain deferred compensation plan liabilities. The notional value of the TRS at December 31, 2024 was $421.2 million. The company recognizes as compensation expense the appreciation or depreciation of the compensation liability over the award's vesting period in proportion to the vested amount of the award. The company immediately recognizes the appreciation or depreciation of these investments, which is included in other gains and losses. This creates a timing difference between the recognition of the compensation expense and the investment gain or loss impacting net income, which will reverse and will offset to zero over the life of the award at the end of the multi-year vesting period.
(2)Upon consolidation, the company's net investments in CIP are eliminated, and the assets and liabilities of the CIP are consolidated in the Consolidated Balance Sheets, which are offset by a noncontrolling interest balance representing the portion of the CIP owned by third parties. The assets of CIP include investments which are measured at fair value. If a 10% increase or decrease in the fair values of Invesco’s net investments in CIP were to occur, it would result in a corresponding increase or decrease in our Net income attributable to Invesco Ltd.
Cash balances invested in money market funds of $479.3 million have been excluded from the table above. These are valued under the market approach at the NAV of the underlying funds, which is maintained at $1.
Interest Rate Risk
Interest rate risk relates to the risk that the fair value of future cash flows of a financial instrument will fluctuate because of changes in market interest rates. The company is exposed to interest rate risk primarily through its external debt and cash and cash equivalent investments. On December 31, 2024, the interest rates on 100.0% of the company's borrowings were fixed for a weighted average period of 8.9 years, and the company had a balance of zero on its revolving credit agreement.
The interest rate profile of the financial liabilities of the company on December 31 was:
| | | | | | | | | | | |
| (in millions) | December 31, 2024 | | December 31, 2023 |
| Debt | | | |
| Fixed rate | $ | 890.6 | | | $ | 1,489.5 | |
| Floating rate | — | | | — | |
| Total | $ | 890.6 | | | $ | 1,489.5 | |
| | | |
| Weighted average interest rate percentage | 4.6 | % | | 4.3 | % |
| Weighted average period for which rate is fixed in years | 8.9 | | | 6.0 | |
See Item 8, Financial Statements and Supplementary Data, Note 8, “Debt,” for additional disclosures relating to the U.S. Dollar floating and fixed rate obligations.
The sensitivity of our financial assets to interest rate risk is immaterial.
Foreign Exchange Rate Risk
The company has transactional currency exposures that occur when any of the company’s subsidiaries receive or pay cash in a currency different from its functional currency. Such exposure arises from sales or purchases by operating subsidiaries in currencies other than the subsidiaries’ functional currencies. These exposures are not actively managed.
In addition, the net assets and financial results of the company's foreign operations are exposed to foreign currency translation risk when translated into U.S. Dollars upon consolidation into Invesco. A strengthening U.S. Dollar has a negative impact on the company's foreign currency denominated earnings when presented in U.S. Dollars. The company's most significant foreign exchange rate risk exposure relates to the translation of Pound Sterling-denominated and Euro-denominated transactions into the U.S. Dollar reporting currency. Item 8, Financial Statements and Supplementary Data, Note 16, "Segment and Geographic Information," contains disclosure of revenue by geography.
The company is also exposed to foreign currency translation risk on monetary assets and liabilities that are held by subsidiaries in different functional currencies than the subsidiaries' functional currencies. The impact of the revaluation is recorded in the Consolidated Statements of Income. Net foreign exchange revaluation gains and losses were zero in 2024 (2023: $0.9 million of losses) and are included in General and administrative expenses and Other gains and losses, net on the Consolidated Statements of Income.
Item 8. Financial Statements and Supplementary Data
Index to Financial Statements and Supplementary Data
Annual Report of Management on Internal Control over Financial Reporting
Management of the company is responsible for establishing and maintaining adequate internal control over financial reporting, as defined in the Securities Exchange Act of 1934 Rules 13a-15(f) and 15d-15(f). The company’s internal control over financial reporting is a process designed to provide reasonable assurance regarding the reliability of financial reporting and the preparation of financial statements for external purposes in accordance with generally accepted accounting principles. Because of its inherent limitations, internal control over financial reporting may not prevent or detect misstatements. Also, projections of any evaluation of effectiveness to future periods are subject to the risk that controls may become inadequate because of changes in conditions, or that the degree of compliance with the policies or procedures may deteriorate.
Under the supervision, and with the participation of the chief executive officer and chief financial officer, management assessed the effectiveness of the company’s internal control over financial reporting as of December 31, 2024. In making this assessment, management used the criteria set forth by the Internal Control - Integrated Framework (2013) issued by Committee of Sponsoring Organizations of the Treadway Commission (COSO). Based on this assessment, management concluded that the company’s internal control over financial reporting was effective as of December 31, 2024.
The company's independent registered public accounting firm, PricewaterhouseCoopers LLP, has issued a report on the effectiveness of our internal control over financial reporting, which is included herein.
Report of Independent Registered Public Accounting Firm
To the Board of Directors and Shareholders of Invesco Ltd.
Opinions on the Financial Statements and Internal Control over Financial Reporting
We have audited the accompanying consolidated balance sheets of Invesco Ltd. and its subsidiaries (the “Company”) as of December 31, 2024 and 2023, and the related consolidated statements of income, of comprehensive income, of changes in equity and of cash flows for each of the three years in the period ended December 31, 2024, including the related notes (collectively referred to as the “consolidated financial statements”). We also have audited the Company's internal control over financial reporting as of December 31, 2024, based on criteria established in Internal Control - Integrated Framework (2013) issued by the Committee of Sponsoring Organizations of the Treadway Commission (COSO).
In our opinion, the consolidated financial statements referred to above present fairly, in all material respects, the financial position of the Company as of December 31, 2024 and 2023, and the results of its operations and its cash flows for each of the three years in the period ended December 31, 2024 in conformity with accounting principles generally accepted in the United States of America. Also in our opinion, the Company maintained, in all material respects, effective internal control over financial reporting as of December 31, 2024, based on criteria established in Internal Control - Integrated Framework (2013) issued by the COSO.
Basis for Opinions
The Company's management is responsible for these consolidated financial statements, for maintaining effective internal control over financial reporting, and for its assessment of the effectiveness of internal control over financial reporting, included in Annual Report of Management on Internal Control over Financial Reporting appearing under Item 8. Our responsibility is to express opinions on the Company’s consolidated financial statements and on the Company's internal control over financial reporting based on our audits. We are a public accounting firm registered with the Public Company Accounting Oversight Board (United States) (PCAOB) and are required to be independent with respect to the Company in accordance with the U.S. federal securities laws and the applicable rules and regulations of the Securities and Exchange Commission and the PCAOB.
We conducted our audits in accordance with the standards of the PCAOB. Those standards require that we plan and perform the audits to obtain reasonable assurance about whether the consolidated financial statements are free of material misstatement, whether due to error or fraud, and whether effective internal control over financial reporting was maintained in all material respects.
Our audits of the consolidated financial statements included performing procedures to assess the risks of material misstatement of the consolidated financial statements, whether due to error or fraud, and performing procedures that respond to those risks. Such procedures included examining, on a test basis, evidence regarding the amounts and disclosures in the consolidated financial statements. Our audits also included evaluating the accounting principles used and significant estimates made by management, as well as evaluating the overall presentation of the consolidated financial statements. Our audit of internal control over financial reporting included obtaining an understanding of internal control over financial reporting, assessing the risk that a material weakness exists, and testing and evaluating the design and operating effectiveness of internal control based on the assessed risk. Our audits also included performing such other procedures as we considered necessary in the circumstances. We believe that our audits provide a reasonable basis for our opinions.
Definition and Limitations of Internal Control over Financial Reporting
A company’s internal control over financial reporting is a process designed to provide reasonable assurance regarding the reliability of financial reporting and the preparation of financial statements for external purposes in accordance with generally accepted accounting principles. A company’s internal control over financial reporting includes those policies and procedures that (i) pertain to the maintenance of records that, in reasonable detail, accurately and fairly reflect the transactions and dispositions of the assets of the company; (ii) provide reasonable assurance that transactions are recorded as necessary to permit preparation of financial statements in accordance with generally accepted accounting principles, and that receipts and expenditures of the company are being made only in accordance with authorizations of management and directors of the company; and (iii) provide reasonable assurance regarding prevention or timely detection of unauthorized acquisition, use, or disposition of the company’s assets that could have a material effect on the financial statements.
Because of its inherent limitations, internal control over financial reporting may not prevent or detect misstatements. Also, projections of any evaluation of effectiveness to future periods are subject to the risk that controls may become inadequate because of changes in conditions, or that the degree of compliance with the policies or procedures may deteriorate.
Critical Audit Matters
The critical audit matter communicated below is a matter arising from the current period audit of the consolidated financial statements that was communicated or required to be communicated to the audit committee and that (i) relates to accounts or disclosures that are material to the consolidated financial statements and (ii) involved our especially challenging, subjective, or complex judgments. The communication of critical audit matters does not alter in any way our opinion on the consolidated financial statements, taken as a whole, and we are not, by communicating the critical audit matter below, providing a separate opinion on the critical audit matter or on the accounts or disclosures to which it relates.
Indefinite-Lived Intangible Assets Impairment Assessment for Acquired Management Contracts of U.S. Retail Mutual Funds
As described in Notes 1 and 5 to the consolidated financial statements, the Company’s management contracts indefinite-lived intangible assets, net balance was $5,651.7 million as of December 31, 2024, of which a significant portion relates to indefinite-lived intangible assets related to acquired management contracts of U.S. retail mutual funds. Management tests for impairment annually as of October 1 or more frequently if events or changes in circumstances indicate that the asset might be impaired. If the qualitative assessment indicates that an impairment may be likely or management elects to not perform the qualitative assessment, management performs a quantitative test to determine the fair value of the intangible assets and compares the fair value with its carrying amount. If the carrying amount of the intangible asset exceeds its fair value, an impairment loss is recognized. Fair value is generally determined using an income approach where estimated future cash flows are discounted to arrive at a single present value amount. As disclosed by management, the most sensitive assumptions used in the income approach are the long-term growth rate and the discount rate.
The principal considerations for our determination that performing procedures relating to the indefinite-lived intangible assets impairment assessment for acquired management contracts of U.S. retail mutual funds is a critical audit matter are (i) the significant judgment by management when developing the fair value estimate of the intangible assets; (ii) a high degree of auditor judgment, subjectivity, and effort in performing procedures and evaluating management’s significant assumptions related to the long-term growth rate and the discount rate; and (iii) the audit effort involved the use of professionals with specialized skill and knowledge.
Addressing the matter involved performing procedures and evaluating audit evidence in connection with forming our overall opinion on the consolidated financial statements. These procedures included testing the effectiveness of controls relating to management’s indefinite-lived intangible assets impairment assessment for acquired management contracts of U.S. retail mutual funds, including controls over the valuation of the acquired management contracts of U.S. retail mutual fund indefinite-lived intangible assets. These procedures also included, among others (i) testing management’s process for developing the fair value estimate of the indefinite lived intangible assets; (ii) evaluating the appropriateness of the income approach used by management; (iii) testing the completeness and accuracy of underlying data used in the income approach; and (iv) evaluating the reasonableness of the significant assumptions used by management related to the long-term growth rate and the discount rate. Professionals with specialized skill and knowledge were used to assist in evaluating (i) the appropriateness of the income approach and (ii) the reasonableness of the long-term growth rate and discount rate assumptions.
/s/ PricewaterhouseCoopers LLP
Atlanta, Georgia
February 25, 2025
We have served as the Company’s auditor since 2013.
Invesco Ltd.
Consolidated Balance Sheets
| | | | | | | | | | | |
| (in millions, except per share data) | December 31, 2024 | | December 31, 2023 |
| ASSETS | | | |
| Cash and cash equivalents | $ | 986.5 | | | $ | 1,469.2 | |
| | | |
| | | |
| Accounts receivable | 740.8 | | | 701.5 | |
| Investments | 1,240.0 | | | 919.1 | |
| Other assets | 1,120.7 | | | 1,226.5 | |
| Property, equipment and software, net | 479.0 | | | 599.5 | |
| Intangible assets, net | 5,749.3 | | | 5,848.1 | |
| Goodwill | 8,318.1 | | | 8,691.5 | |
Investments and other assets of CIP (1): | 8,374.5 | | | 9,478.4 | |
| Total assets | $ | 27,008.9 | | | $ | 28,933.8 | |
| LIABILITIES | | | |
| Accrued compensation and benefits | $ | 1,029.2 | | | $ | 900.4 | |
| Accounts payable and accrued expenses | 1,285.3 | | | 1,688.3 | |
| Debt | 890.6 | | | 1,489.5 | |
| Deferred tax liabilities, net | 1,281.9 | | | 1,325.7 | |
Debt and other liabilities of CIP (1): | 6,853.1 | | | 7,613.9 | |
| Total liabilities | 11,340.1 | | | 13,017.8 | |
| Commitments and contingencies (See Note 17) | | | |
| TEMPORARY EQUITY | | | |
| Redeemable noncontrolling interests in consolidated entities | 544.7 | | | 745.7 | |
| PERMANENT EQUITY | | | |
| Equity attributable to Invesco Ltd.: | | | |
| Preferred shares ($0.20 par value; $1,000 liquidation preference; 4.0 million authorized, issued and outstanding as of December 31, 2024 and 2023) | 4,010.5 | | | 4,010.5 | |
| Common shares ($0.20 par value; 1,050.0 million authorized; 566.1 million shares issued as of December 31, 2024 and 2023) | 113.2 | | | 113.2 | |
| Additional paid-in-capital | 7,334.6 | | | 7,451.6 | |
| Treasury shares | (2,852.7) | | | (3,002.6) | |
| Retained earnings | 6,990.4 | | | 6,826.7 | |
| Accumulated other comprehensive income/(loss), net of tax | (1,036.1) | | | (801.8) | |
| Total equity attributable to Invesco Ltd. | 14,559.9 | | | 14,597.6 | |
| Equity attributable to nonredeemable noncontrolling interests in consolidated entities | 564.2 | | | 572.7 | |
| Total permanent equity | 15,124.1 | | | 15,170.3 | |
| Total liabilities, temporary and permanent equity | $ | 27,008.9 | | | $ | 28,933.8 | |
(1) See Note 18, “Consolidated Investment Products,” for balances related to consolidated VIEs.
See accompanying notes.
Invesco Ltd.
Consolidated Statements of Income
| | | | | | | | | | | | | | | | | |
| Years ended December 31, |
| (in millions, except per common share data) | 2024 | | 2023 | | 2022 |
| Operating revenues: | | | | | |
| Investment management fees | $ | 4,342.3 | | | $ | 4,106.0 | | | $ | 4,358.4 | |
| Service and distribution fees | 1,479.7 | | | 1,374.6 | | | 1,405.5 | |
| Performance fees | 46.4 | | | 46.7 | | | 68.2 | |
| Other | 198.6 | | | 189.1 | | | 216.8 | |
| Total operating revenues | 6,067.0 | | | 5,716.4 | | | 6,048.9 | |
| Operating expenses: | | | | | |
| Third-party distribution, service and advisory | 2,025.6 | | | 1,825.2 | | | 1,886.2 | |
| Employee compensation | 2,014.2 | | | 1,885.8 | | | 1,725.1 | |
| Marketing | 81.3 | | | 82.1 | | | 94.6 | |
| Property, office and technology | 474.3 | | | 450.1 | | | 446.7 | |
| General and administrative | 594.7 | | | 567.6 | | | 493.6 | |
| Transaction, integration and restructuring | — | | | 41.6 | | | 21.2 | |
| Amortization and impairment of intangible assets | 44.8 | | | 1,298.8 | | | 63.8 | |
| Total operating expenses | 5,234.9 | | | 6,151.2 | | | 4,731.2 | |
| Operating income/(loss) | 832.1 | | | (434.8) | | | 1,317.7 | |
| Other income/(expense): | | | | | |
| Equity in earnings of unconsolidated affiliates | 43.0 | | | 71.3 | | | 106.1 | |
| Interest and dividend income | 58.9 | | | 47.8 | | | 24.4 | |
| Interest expense | (58.0) | | | (70.5) | | | (85.2) | |
| Other gains/(losses), net | 47.7 | | | 98.0 | | | (139.5) | |
| Other income/(expense) of CIP, net | 81.6 | | | 50.3 | | | 24.2 | |
| Income/(loss) before income taxes | 1,005.3 | | | (237.9) | | | 1,247.7 | |
| Income tax provision | (252.9) | | | 69.7 | | | (322.2) | |
| Net income/(loss) | 752.4 | | | (168.2) | | | 925.5 | |
| Net (income)/loss attributable to noncontrolling interests in consolidated entities | 22.4 | | | 71.3 | | | (4.8) | |
| Dividends declared on preferred shares | (236.8) | | | (236.8) | | | (236.8) | |
| Net income/(loss) attributable to Invesco Ltd. | $ | 538.0 | | | $ | (333.7) | | | $ | 683.9 | |
| | | | | |
| Earnings per common share: | | | | | |
| -basic | $ | 1.18 | | | $ | (0.73) | | | $ | 1.50 | |
| -diluted | $ | 1.18 | | | $ | (0.73) | | | $ | 1.49 | |
See accompanying notes.
Invesco Ltd.
Consolidated Statements of Comprehensive Income
| | | | | | | | | | | | | | | | | |
| Years ended December 31, |
| (in millions) | 2024 | | 2023 | | 2022 |
| Net income/(loss) | $ | 752.4 | | | $ | (168.2) | | | $ | 925.5 | |
| Other comprehensive income/(loss), net of tax: | | | | | |
| Currency translation differences on investments in foreign subsidiaries | (234.3) | | | 144.9 | | | (463.1) | |
| | | | | |
| Other comprehensive income/(loss), net of tax | — | | | (4.3) | | | (37.8) | |
| Other comprehensive income/(loss) | (234.3) | | | 140.6 | | | (500.9) | |
| Total comprehensive income/(loss) | 518.1 | | | (27.6) | | | 424.6 | |
| Comprehensive loss/(income) attributable to noncontrolling interests in consolidated entities | 22.4 | | | 71.3 | | | (4.8) | |
| Dividends declared on preferred shares | (236.8) | | | (236.8) | | | (236.8) | |
| Comprehensive income/(loss) attributable to Invesco Ltd. | $ | 303.7 | | | $ | (193.1) | | | $ | 183.0 | |
See accompanying notes.
Invesco Ltd.
Consolidated Statements of Cash Flows
| | | | | | | | | | | | | | | | | |
| Years ended December 31, |
| (in millions) | 2024 | | 2023 | | 2022 |
| Operating activities: | | | | | |
| Net income/(loss) | $ | 752.4 | | | $ | (168.2) | | | $ | 925.5 | |
| Adjustments to reconcile net income to net cash provided by/(used in) operating activities: | | | | | |
| Amortization and depreciation | 179.6 | | | 182.8 | | | 195.3 | |
| Impairment of intangible assets | — | | | 1,248.9 | | | — | |
| Common share-based compensation expense | 104.6 | | | 114.6 | | | 106.2 | |
| | | | | |
| Other (gains)/losses, net | (45.1) | | | (97.3) | | | 139.5 | |
| Other (gains)/losses of CIP, net | 57.9 | | | 176.3 | | | 126.9 | |
| Equity in earnings of unconsolidated affiliates | (43.0) | | | (71.3) | | | (106.1) | |
| Distributions from equity method investees | 82.1 | | | 69.4 | | | 74.2 | |
| Changes in operating assets and liabilities: | | | | | |
| (Purchase)/sale of investments by CIP, net | 17.1 | | | (50.8) | | | (359.2) | |
| (Purchase)/sale of investments, net | (61.8) | | | 69.4 | | | (27.6) | |
| (Increase)/decrease in receivables and other assets | 319.7 | | | 448.7 | | | 912.8 | |
| Increase/(decrease) in payables and other liabilities | (173.5) | | | (621.7) | | | (1,284.3) | |
| Net cash provided by/(used in) operating activities | 1,190.0 | | | 1,300.8 | | | 703.2 | |
| Investing activities: | | | | | |
| Purchase of property, equipment and software | (69.1) | | | (164.3) | | | (192.9) | |
| | | | | |
| Purchase of investments by CIP | (4,134.7) | | | (3,214.4) | | | (2,717.2) | |
| Sale of investments by CIP | 4,479.5 | | | 3,111.6 | | | 2,638.4 | |
| Purchase of investments | (293.2) | | | (65.2) | | | (217.8) | |
| Sale of investments | 0.2 | | | 26.8 | | | 97.9 | |
| Capital distribution from equity method investees | 126.8 | | | 23.3 | | | 32.6 | |
| | | | | |
| | | | | |
| | | | | |
| | | | | |
| Other investing activities | — | | | 46.2 | | | — | |
| Net cash inflows/(outflows) upon consolidation/deconsolidation of CIP | (41.1) | | | (8.3) | | | (16.6) | |
| Net cash provided by/(used in) investing activities | 68.4 | | | (244.3) | | | (375.6) | |
| Financing activities: | | | | | |
| Purchases of treasury shares | (79.3) | | | (187.5) | | | (244.7) | |
| Dividends paid - preferred | (236.8) | | | (236.8) | | | (236.8) | |
| Dividends paid - common | (371.5) | | | (357.9) | | | (334.8) | |
| | | | | |
| Third-party capital invested into CIP | 150.0 | | | 201.2 | | | 709.2 | |
| Third-party capital distributed by CIP | (201.1) | | | (255.6) | | | (284.8) | |
| Borrowings of debt of CIP | 1,488.8 | | | 703.0 | | | 30.1 | |
| Repayments of debt of CIP | (1,811.7) | | | (451.8) | | | (5.1) | |
| Borrowings of revolving credit agreement | 2,269.5 | | | — | | | — | |
| Repayments of revolving credit agreement | (2,269.5) | | | — | | | — | |
| Repayment of senior notes | (600.0) | | | — | | | (600.0) | |
| | | | | |
| | | | | |
| | | | | |
| | | | | |
| Net cash provided by/(used in) financing activities | (1,661.6) | | | (585.4) | | | (966.9) | |
| Increase/(decrease) in cash and cash equivalents | (403.2) | | | 471.1 | | | (639.3) | |
| Foreign exchange movement on cash and cash equivalents | (30.3) | | | 24.0 | | | (68.6) | |
| Foreign exchange movement on cash and cash equivalents of CIP | (2.1) | | | 2.4 | | | (5.1) | |
| Cash and cash equivalents, beginning of period | 1,931.6 | | | 1,434.1 | | | 2,147.1 | |
| Cash and cash equivalents, end of period | $ | 1,496.0 | | | $ | 1,931.6 | | | $ | 1,434.1 | |
| | | | | |
| Cash and cash equivalents | $ | 986.5 | | | $ | 1,469.2 | | | $ | 1,234.7 | |
| | | | | |
| Cash and cash equivalents of CIP | 509.5 | | | 462.4 | | | 199.4 | |
| Total cash and cash equivalents per consolidated statement of cash flows | 1,496.0 | | | 1,931.6 | | | 1,434.1 | |
| | | | | |
| Supplemental Cash Flow Information: | | | | | |
| Interest paid | (53.6) | | | (68.2) | | | (67.4) | |
| Interest received | 35.5 | | | 31.0 | | | 8.7 | |
| Taxes paid | (236.3) | | | (195.1) | | | (301.4) | |
See accompanying notes.
Invesco Ltd.
Consolidated Statements of Changes in Equity
| | | | | | | | | | | | | | | | | | | | | | | | | | | | | | | | | | | | | | | | | | | | | | | | | | | | | | | | | | | |
| Equity Attributable to Invesco Ltd. | | | | | | |
| (in millions, except per share data) | Preferred Shares | | Common Shares | | Additional Paid-in-Capital | | Treasury Shares | | Retained Earnings | | Accumulated Other Comprehensive Income/(Loss) | | Total Equity Attributable to Invesco Ltd. | | Nonredeemable Noncontrolling Interests in Consolidated Entities | | Total Permanent Equity | | Redeemable Noncontrolling Interests in Consolidated Entities/Temporary Equity |
| January 1, 2024 | $ | 4,010.5 | | | $ | 113.2 | | | $ | 7,451.6 | | | $ | (3,002.6) | | | $ | 6,826.7 | | | $ | (801.8) | | | $ | 14,597.6 | | | $ | 572.7 | | | $ | 15,170.3 | | | $ | 745.7 | |
| | | | | | | | | | | | | | | | | | | |
| | | | | | | | | | | | | | | | | | | |
| Net income | — | | | — | | | — | | | — | | | 774.8 | | | — | | | 774.8 | | | 31.4 | | | 806.2 | | | (53.8) | |
| Other comprehensive income/(loss) | — | | | — | | | — | | | — | | | — | | | (234.3) | | | (234.3) | | | — | | | (234.3) | | | — | |
| Change in noncontrolling interests in consolidated entities, net | — | | | — | | | — | | | — | | | — | | | — | | | — | | | (39.9) | | | (39.9) | | | (147.2) | |
| | | | | | | | | | | | | | | | | | | |
| Dividends declared - preferred ($59.00 per share) | — | | | — | | | — | | | — | | | (236.8) | | | — | | | (236.8) | | | — | | | (236.8) | | | — | |
| Dividends declared - common ($0.815 per share) | — | | | — | | | — | | | — | | | (374.3) | | | — | | | (374.3) | | | — | | | (374.3) | | | — | |
| Employee common share plans: | | | | | | | | | | | | | | | | | | | |
| Common share-based compensation | — | | | — | | | 104.6 | | | — | | | — | | | — | | | 104.6 | | | — | | | 104.6 | | | — | |
| Vested common shares | — | | | — | | | (211.0) | | | 211.0 | | | — | | | — | | | — | | | — | | | — | | | — | |
| Other common share awards | — | | | — | | | (10.6) | | | 18.2 | | | — | | | — | | | 7.6 | | | — | | | 7.6 | | | — | |
| Purchase of common shares | — | | | — | | | — | | | (79.3) | | | — | | | — | | | (79.3) | | | — | | | (79.3) | | | — | |
| December 31, 2024 | $ | 4,010.5 | | | $ | 113.2 | | | $ | 7,334.6 | | | $ | (2,852.7) | | | $ | 6,990.4 | | | $ | (1,036.1) | | | $ | 14,559.9 | | | $ | 564.2 | | | $ | 15,124.1 | | | $ | 544.7 | |
See accompanying notes.
Invesco Ltd.
Consolidated Statements of Changes in Equity (continued)
| | | | | | | | | | | | | | | | | | | | | | | | | | | | | | | | | | | | | | | | | | | | | | | | | | | | | | | | | | | |
| Equity Attributable to Invesco Ltd. | | | | | | |
| (in millions, except per share data) | Preferred Shares | | Common Shares | | Additional Paid-in-Capital | | Treasury Shares | | Retained Earnings | | Accumulated Other Comprehensive Income/(Loss) | | Total Equity Attributable to Invesco Ltd. | | Nonredeemable Noncontrolling Interests in Consolidated Entities | | Total Permanent Equity | | Redeemable Noncontrolling Interests in Consolidated Entities/Temporary Equity |
| January 1, 2023 | $ | 4,010.5 | | | $ | 113.2 | | | $ | 7,554.9 | | | $ | (3,040.9) | | | $ | 7,518.3 | | | $ | (942.4) | | | $ | 15,213.6 | | | $ | 629.9 | | | $ | 15,843.5 | | | $ | 998.7 | |
| | | | | | | | | | | | | | | | | | | |
| | | | | | | | | | | | | | | | | | | |
| Net income/(loss) | — | | | — | | | — | | | — | | | (96.9) | | | — | | | (96.9) | | | (35.2) | | | (132.1) | | | (36.1) | |
| Other comprehensive income/(loss) | — | | | — | | | — | | | — | | | — | | | 140.6 | | | 140.6 | | | — | | | 140.6 | | | — | |
| Change in noncontrolling interests in consolidated entities, net | — | | | — | | | — | | | — | | | — | | | — | | | — | | | (22.0) | | | (22.0) | | | (216.9) | |
| | | | | | | | | | | | | | | | | | | |
Dividends declared - preferred ($59.00 per share) | — | | | — | | | — | | | — | | | (236.8) | | | — | | | (236.8) | | | — | | | (236.8) | | | — | |
| Dividends declared - common ($0.7875 per share) | — | | | — | | | — | | | — | | | (357.9) | | | — | | | (357.9) | | | — | | | (357.9) | | | — | |
| Employee common share plans: | | | | | | | | | | | | | | | | | | | |
| Common share-based compensation | — | | | — | | | 114.6 | | | — | | | — | | | — | | | 114.6 | | | — | | | 114.6 | | | — | |
| Vested common shares | — | | | — | | | (209.2) | | | 209.2 | | | — | | | — | | | — | | | — | | | — | | | — | |
| Other common share awards | — | | | — | | | (8.7) | | | 16.6 | | | — | | | — | | | 7.9 | | | — | | | 7.9 | | | — | |
| Purchase of common shares | — | | | — | | | — | | | (187.5) | | | — | | | — | | | (187.5) | | | — | | | (187.5) | | | — | |
| December 31, 2023 | $ | 4,010.5 | | | $ | 113.2 | | | $ | 7,451.6 | | | $ | (3,002.6) | | | $ | 6,826.7 | | | $ | (801.8) | | | $ | 14,597.6 | | | $ | 572.7 | | | $ | 15,170.3 | | | $ | 745.7 | |
See accompanying notes.
Invesco Ltd.
Consolidated Statements of Changes in Equity (continued)
| | | | | | | | | | | | | | | | | | | | | | | | | | | | | | | | | | | | | | | | | | | | | | | | | | | | | | | | | | | |
| Equity Attributable to Invesco Ltd. | | | | | | |
| (in millions, except per share data) | Preferred Shares | | Common Shares | | Additional Paid-in-Capital | | Treasury Shares | | Retained Earnings | | Accumulated Other Comprehensive Income/(Loss) | | Total Equity Attributable to Invesco Ltd. | | Nonredeemable Noncontrolling Interests in Consolidated Entities | | Total Permanent Equity | | Redeemable Noncontrolling Interests in Consolidated Entities/Temporary Equity |
| January 1, 2022 | $ | 4,010.5 | | | $ | 113.2 | | | $ | 7,688.0 | | | $ | (3,043.6) | | | $ | 7,169.2 | | | $ | (441.5) | | | $ | 15,495.8 | | | $ | 672.2 | | | $ | 16,168.0 | | | $ | 510.8 | |
| | | | | | | | | | | | | | | | | | | |
| | | | | | | | | | | | | | | | | | | |
| Net income | — | | | — | | | — | | | — | | | 920.7 | | | — | | | 920.7 | | | 8.8 | | | 929.5 | | | (4.0) | |
| Other comprehensive income/(loss) | — | | | — | | | — | | | — | | | — | | | (500.9) | | | (500.9) | | | — | | | (500.9) | | | — | |
| Change in noncontrolling interests in consolidated entities, net | — | | | — | | | — | | | — | | | — | | | — | | | — | | | (51.1) | | | (51.1) | | | 491.9 | |
| | | | | | | | | | | | | | | | | | | |
| Dividends declared - preferred ($59.00 per share) | — | | | — | | | — | | | — | | | (236.8) | | | — | | | (236.8) | | | — | | | (236.8) | | | — | |
| Dividends declared - common ($0.73 per share) | — | | | — | | | — | | | — | | | (334.8) | | | — | | | (334.8) | | | — | | | (334.8) | | | — | |
| Employee common share plans: | | | | | | | | | | | | | | | | | | | |
| Common share-based compensation | — | | | — | | | 106.2 | | | — | | | — | | | — | | | 106.2 | | | — | | | 106.2 | | | — | |
| Vested common shares | — | | | — | | | (228.6) | | | 228.6 | | | — | | | — | | | — | | | — | | | — | | | — | |
| Other common share awards | — | | | — | | | (10.7) | | | 18.8 | | | — | | | — | | | 8.1 | | | — | | | 8.1 | | | — | |
| Purchase of common shares | — | | | — | | | — | | | (244.7) | | | — | | | — | | | (244.7) | | | — | | | (244.7) | | | — | |
| December 31, 2022 | $ | 4,010.5 | | | $ | 113.2 | | | $ | 7,554.9 | | | $ | (3,040.9) | | | $ | 7,518.3 | | | $ | (942.4) | | | $ | 15,213.6 | | | $ | 629.9 | | | $ | 15,843.5 | | | $ | 998.7 | |
See accompanying notes.
Invesco Ltd.
Notes to the Consolidated Financial Statements
1. ACCOUNTING POLICIES
Corporate Information
The company provides retail and institutional clients with an array of investment management capabilities. The company operates globally and its sole business is investment management.
Accounting Pronouncements Recently Adopted
Segment Disclosures. On January 1, 2024, the company adopted Accounting Standards Update 2023-07, "Segment Reporting: Improvements to Reportable Segment Disclosures" (ASU 2023-07). The standard requires disclosure of the Chief Operating Decision Maker (CODM) and information about segment expenses on a quarterly and annual basis. The adoption of this amendment resulted in additional disclosures, see Note 16, "Segment and Geographic Information."
Pending Accounting Pronouncements
Income Tax Disclosures. In December 2023, the Financial Accounting Standards Board (FASB) issued Accounting Standards Update 2023-09, "Income Taxes: Improvements to Income Tax Disclosures" (ASU 2023-09). The standard requires disaggregated income tax disclosures of the effective tax rate reconciliation and income taxes paid. ASU 2023-09 is effective for fiscal years beginning after December 15, 2024 and interim periods within fiscal years beginning after December 15, 2025 and early adoption is permitted. The adoption of this amendment will result in incremental disclosures within the Consolidated Financial Statements.
Disaggregation of Income Statement Expenses. In November 2024, the FASB issued Accounting Standards Update 2024-03, "Disaggregation of Income Statement Expenses" (ASU 2024-03). The standard requires the disaggregated disclosure of certain income statement items. ASU 2024-03 is effective for fiscal years beginning after December 15, 2026 and interim periods beginning after December 15, 2027 and early adoption is permitted. The company is currently evaluating the impact of this amendment on its Consolidated Financial Statements.
Basis of Presentation
The Consolidated Financial Statements have been prepared in accordance with accounting principles generally accepted in the U.S. and with rules and regulations of the SEC and consolidate the financial statements of the Parent and all of its controlled subsidiaries. In the opinion of management, the Consolidated Financial Statements reflect all adjustments, consisting of normal recurring accruals, which are necessary for the fair presentation of the financial condition and results of operations for the periods presented. All significant intercompany transactions, balances, revenues and expenses are eliminated upon consolidation.
The Consolidated Financial Statements have been prepared primarily on the historical cost basis; however, certain items are presented using other bases such as fair value, where such treatment is required or voluntarily elected. The financial statements of subsidiaries, with the exception of certain CIP, are prepared for the same reporting period as the Parent and use consistent accounting policies, which, where applicable, have been adjusted to U.S. GAAP from local generally accepted accounting principles or reporting regulations. The financial information of certain CIP is included in the company's Consolidated Financial Statements on a lag (generally three months) based upon the availability of fund financial information. Noncontrolling interests in consolidated entities represents the interests in certain entities consolidated by the company either because the company has control over the entity or has determined that it is the primary beneficiary, but the company does not own all of the entity's equity. To the extent that noncontrolling interests represent equity which is redeemable or convertible for cash or other assets at the option of the equity holder, these are deemed to represent temporary equity, and are classified as equity attributable to redeemable noncontrolling interests in the Consolidated Balance Sheets. Nonredeemable noncontrolling interests are classified as a component of permanent equity.
Basis of Accounting and Consolidation
In addition to consolidating the financial statements of the Parent and all of its controlled subsidiaries, the Consolidated Financial Statements include the consolidation of certain investment products that meet the definition of either a VOE, if the company is deemed to have a controlling financial interest in the fund, or a VIE, if the company has been deemed to be the primary beneficiary of the fund.
Certain of these investment products including, but not limited to, CLOs, funds that are structured as partnership entities (such as private equity funds, real estate funds and fund-of-funds) and certain non-U.S. mutual funds are considered, for accounting and consolidation analysis purposes, to be VIEs. A VIE, in the context of the company and its managed funds, is a fund that does not have sufficient equity to finance its operations without additional subordinated financial support, or a fund for which the risks and rewards of ownership are not directly linked to voting interests. If the company is deemed to have the power to direct the activities of the fund that most significantly impact the fund's economic performance and the obligation to absorb losses/right to receive benefits from the fund that could potentially be significant to the fund, then the company is deemed to be the fund's primary beneficiary and is required to consolidate the fund.
The company's economic risk with respect to each investment in a CIP is limited to its equity ownership and any uncollected management and performance fees. See Note 18, "Consolidated Investment Products," for additional information regarding the impact of CIP.
The company assesses modifications to existing funds on an ongoing basis to determine if a significant reconsideration event has occurred. The consolidation analysis includes a detailed review of the terms of the fund's governing documents and a comparison of the significant terms against the consolidation criteria in ASC Topic 810, including a determination of whether the fund is a VIE or a VOE. Seed capital and co-investments in managed funds in which the company has determined that it is the primary beneficiary or in which the company has a controlling financial interest are consolidated if the impact of doing so is deemed material. If the company subsequently determines that it no longer controls the managed funds in which it has invested, or no longer has an obligation to absorb losses or rights to receive benefits, the company will deconsolidate the funds. If there are any remaining holdings in the managed funds or if the managed funds are not required to be consolidated, the investment is no longer accounted for as CIP and is moved to the investments line item in the balance sheet and is accounted for as described in the "Investments" accounting policy below.
All of the investments held by VIEs are presented at fair value in the company's Consolidated Balance Sheets at December 31, 2024 and 2023. The company has elected the fair value option under ASC Topic 825-10-25 for measuring the collateral assets held and notes issued by its consolidated CLOs to eliminate inconsistencies that would otherwise arise from using different accounting bases. The notes issued by consolidated CLOs are measured under the measurement alternative that requires the reporting entity to measure both the financial assets and liabilities of the CLOs using the more observable fair value. By electing the fair value option, the notes issued by the CLOs are measured based on the fair value of the net assets of the CLOs. Gains or losses related to assets and liabilities of consolidated CLOs are offset in Other income/(expense) of CIP, net in the Consolidated Statements of Income. Net income (loss) attributable to Invesco Ltd. includes only the changes in fair value of the company’s economic interests in the consolidated CLOs due to the elimination of net income (loss) related to noncontrolling interests.
Reclassifications
During the year ended December 31, 2024, expenses for client-related travel and entertainment and outsourced services were reclassified to General and administrative expenses. The impact of this reclassification on the Consolidated Statements of Income is as follows:
• For the twelve months ended December 31, 2024: decreased Marketing and Property, office and technology expenses by $28.9 million and $92.7 million, respectively, and increased General and administrative by $121.6 million.
• For the twelve months ended December 31, 2023: decreased Marketing and Property, office and technology expenses by $21.3 million and $95.9 million, respectively, and increased General and administrative by $117.2 million.
The reclassification had no impact on our reported Operating revenues, Operating income, Net income, or any internal performance measure on which management is compensated.
Assets and Liabilities Held for Sale
During the year ended December 31, 2024, the company and IndusInd International Holdings Limited, a company organized under the laws of the Republic of Mauritius, entered into a definitive agreement to form a joint venture through the sale of 60% of the company's stake in Invesco Asset Management (India) Private Limited, a wholly owned subsidiary. The transaction is expected to close in 2025. As a result, Invesco Asset Management (India) Private Limited's business has been classified as held for sale and the associated assets and liabilities are presented on the Consolidated Balance Sheets within Other assets and Accounts payable and accrued expenses, respectively.
Use of Estimates
In preparing the Consolidated Financial Statements, management is required to make estimates and assumptions that affect reported revenues, expenses, assets, liabilities and disclosure of contingent liabilities. The primary estimates and assumptions relate to goodwill and intangible impairment, certain investments which are carried at fair value, post-employment benefit plan obligations, income taxes and contingent losses. Additionally, estimation is involved when determining investment and debt valuation for certain CIP; however, changes in the fair values of these amounts are largely offset by noncontrolling interests. Use of available information and application of judgment are inherent in the formation of estimates. Actual results in the future could differ from such estimates, and the differences may be material to the Consolidated Financial Statements.
Change in Accounting Estimate
In September 2024, the company made changes to the retirement criteria for vesting of currently outstanding long-term awards which resulted in a change in estimate for long-term awards granted to employees who meet the criteria. The change to the criteria became effective during the year ended December 31, 2024 and resulted in the accelerated recognition of $147.6 million in Employee compensation expense.
Cash and Cash Equivalents
Cash and cash equivalents consist of cash held at banks and short-term investments with a maturity of three months or less (primarily held in affiliated money market funds). Cash and cash equivalents of CIP are not available for general use by the company and are included in Investments and other assets of CIP on the Consolidated Balance Sheets.
Cash balances may not be readily accessible to the Parent due to capital adequacy requirements of certain of our subsidiaries. We meet these requirements in part by holding Cash and cash equivalents. This retained cash can be used for general business purposes in the countries where it is located and is therefore not considered restricted cash.
Investments
The majority of the company’s investment balances relate to balances held in affiliated funds and equity method investees. In the normal course of business, the company invests in various types of affiliated investment products, either as “seed capital” or as longer-term investments alongside third-party investors, typically referred to as “co-investments.” Seed capital investments are investments held in Invesco managed funds with the purpose of providing capital to the funds during their development periods to allow the funds to achieve critical mass, establish their track records and obtain third-party investments. Seed capital may also be held for regulatory purposes in certain jurisdictions. Co-investments are often required of the investment manager by third-party investors in closed-ended funds to demonstrate an alignment of the investment manager’s interests with those of the third-party investors. The company also invests in affiliated funds in connection with its deferred compensation plans.
Investments are categorized as equity investments, equity method investments and other investments. See Note 3, “Investments,” for additional details.
Equity investments include seed capital, investments held to settle the company's deferred compensation plan liabilities and other equity securities. Equity investments are securities bought and held principally for the purpose of selling them in the near term. Equity investments are measured at fair value. Gains or losses arising from changes in the fair value of equity investments are included in income.
Equity method investments include investments over which the company is deemed to have significant influence. Significant influence typically exists when the company owns between 20% to 50% of an investee, although other factors are considered including representation on the Board, the concentration of other shareholders and the impacts of contractual arrangements. The equity method of accounting requires that the investment is initially recorded at cost, including any excess value paid over the book value of the investment acquired. The carrying amount of the investment is increased or decreased to recognize the company's share of the after-tax profit or loss of the investee after the date of acquisition and is decreased as distributions are received. Distributions received from equity method investees are classified in the Consolidated Statements of Cash Flows as either operating or investing activities based on the nature of the distribution. The proportionate share of income or loss is included in Equity in earnings of unconsolidated affiliates in the Consolidated Statements of Income.
Fair Value
Fair value is determined using a valuation hierarchy (discussed in Note 2, “Fair Value of Assets and Liabilities”), generally by reference to an active trading market, using quoted closing or bid prices as of each reporting period end. When a readily ascertainable market value does not exist for an investment, the fair value is calculated based on the expected cash flows of its underlying net asset base, taking into account applicable discount rates and other factors. Judgment is used to ascertain if a formerly active market has become inactive and in determining fair values when markets have become inactive. As a practical expedient, the company may elect to use NAV as the fair value for certain CIP.
Property, Equipment, Software and Depreciation
Property, equipment and software includes owned property, leasehold improvements, computer hardware/software and other equipment and is stated at cost less accumulated depreciation or amortization and any previously recorded impairment in value. Expenditures for major additions and improvements are capitalized; minor replacements, maintenance and repairs are charged to expense as incurred. Amounts incurred are presented as work-in-progress until the construction or purchase of the property and equipment is substantially complete and ready for its intended use, at which point, the asset will begin to be depreciated or amortized. Depreciation or amortization is provided on property, equipment and software at rates calculated to write off the cost, less estimated residual value, on a straight-line basis over the asset's expected useful life: owned buildings over 50 years, leasehold improvements over the shorter of the lease term or useful life of the improvement; and computers and other equipment between three and seven years.
Purchased and internally developed software is capitalized if the costs can be measured reliably, and it is probable that the asset will generate future economic benefits. For internally developed software, the company capitalizes certain internal and external costs incurred related to software development activities that will generate future economic benefits. These capitalized costs are amortized into operating expenses on a straight-line basis over the software's useful life, generally five to seven years. Depreciation or amortization expense is included in Property, office and technology expense on the Consolidated Income Statement.
The company reevaluates the useful life determination for property, equipment and software each reporting period to determine whether events and circumstances warrant a revision to the remaining useful life. Upon a sale or retirement, the asset cost and related accumulated depreciation or amortization are removed from the Consolidated Financial Statements and any related gain or loss is reflected in income.
The carrying amounts of property, equipment and software are reviewed for impairment when events or changes in circumstances indicate that the carrying values may not be recoverable. At each reporting date, an assessment is made to identify any indicators of impairment. An impairment test is performed if an impairment indicator is identified.
Intangible Assets
Intangible assets identified on the acquisition of a business are capitalized separately from goodwill if the fair value can be measured reliably on initial recognition (transaction date). Intangible assets consist primarily of mutual fund and other client management contracts, customer relationships and distribution agreements. Certain management contracts are managed and operated on a single global platform and are therefore reviewed in aggregate as one unit of valuation. These contracts are considered interchangeable because investors may freely transfer between funds.
Intangible assets that are determined to be finite-lived are amortized on a straight-line basis over their useful lives, from two to ten years, which reflects the pattern in which the economic benefits are realized. The company reviews intangible assets each reporting period to determine whether events or circumstances have occurred that indicate the expected period of economic benefit may no longer be appropriate or there is an indication of impairment. If there is an indication of impairment, management will perform an impairment analysis.
Where evidence exists that the underlying agreements have a high likelihood of continued renewal at little or no cost to the company, the intangible asset is assigned an indefinite life and reviewed for impairment on an annual basis. Intangible assets not subject to amortization are tested for impairment annually as of October 1st or more frequently if events or changes in circumstances indicate that the asset might be impaired. When testing intangible assets for impairment, management has the option to first perform a qualitative assessment. If the qualitative assessment indicates that an impairment may be likely or management elected to not perform the qualitative assessment, management performs a quantitative test to determine the fair value of the intangible assets and compares the fair value with its carrying amount. If the carrying amount of the intangible asset exceeds its fair value, an impairment loss is recognized in an amount equal to that excess. Fair value is generally determined using an income approach where estimated future cash flows are discounted to arrive at a single present value amount.
Goodwill
Goodwill represents the excess of cost over the identifiable net assets of businesses acquired and is recorded in the functional currency of the acquired entity. Goodwill is recognized as an asset and is reviewed for impairment annually as of October 1st and between annual tests when events and circumstances indicate that impairment may have occurred.
The company has determined that it has one reporting unit for goodwill impairment testing purposes which is consistent with internal management reporting and management's oversight of operations. The company evaluated the components of its business, which are business units one level below the operating segment level in making this determination. The company's operating segment represents one reporting unit because all of the components are similar due to the common nature of products and services offered, type of clients, methods of distribution, manner in which each component is operated, extent to which they share assets and resources and the extent to which they support and benefit from common product development efforts.
The company has the option to first qualitatively assess whether it is more likely than not that the fair value of a reporting unit is less than its carrying value. If the qualitative assessment indicates that an impairment may be likely or management elected to not perform the qualitative assessment, a quantitative impairment test is performed at the reporting unit level. If the carrying amount of the reporting unit exceeds its fair value, an impairment loss is recognized for the reporting unit in an amount equal to that excess. However, the impairment cannot exceed the total amount of goodwill allocated to the reporting unit.
The principal method of determining fair value of the reporting unit is an income approach where estimated future cash flows are discounted to arrive at a single present value amount. The discount rate used is derived based on the weighted average cost of capital and the risk profile of the stream of future cash flows. The calculated present value amount is the fair value of the reporting unit.
Debt Issuance Costs
Debt issuance costs related to the issuance of senior notes are presented as a deduction from the carrying amount of the related debt liability. Debt issuance costs related to the company's revolving credit agreement are presented as a deferred asset within Other assets on the company's Consolidated Balance Sheets. Debt issuance costs are amortized over the term of the debt using the effective interest method and are reflected in Interest expense in the Consolidated Statements of Income. After initial recognition, debt issuance costs are measured at amortized cost.
Revenue Recognition
Revenue is measured and recognized based on the five step process outlined in ASC Topic 606, "Revenue from Contracts with Customers." Revenue is determined based on the transaction price negotiated with the customer, net of discounts, value added tax and other sales-related taxes.
Investment management fees are derived from providing professional services to manage client accounts and sponsored investment vehicles. Investment management services are satisfied over time as the services are provided and are typically based upon a percentage of the value of the client’s AUM. Investment management fees for certain arrangements include fees for distribution and administrative-related services. Any fees collected in advance are deferred and recognized as income over the period in which services are rendered.
Service fees are earned for services rendered relating to fund accounting, transfer agent, administrative and/or other maintenance activities performed for sponsored investment vehicles. Service fees are generally based upon a percentage of the value of the AUM. Service fees are also earned from the delivery of digital solutions to our customers. All of these services are satisfied over time.
The company provides distribution services to certain sponsored investment vehicles. Fees are generally earned based upon a percentage of the value of the AUM, as the fee amounts do not crystallize completely upon the sale of a share or unit. Accordingly, the distribution fee revenues are recognized over time as the amount of the fees becomes known. For example, U.S. distribution fees can include 12b-1 fees earned from certain mutual funds to cover allowable sales and marketing expenses for those funds and also include asset-based sales charges paid by certain mutual funds for a period of time after the sale of those funds. Generally, retail products offered outside of the U.S. do not generate a separate distribution fee; the quoted management fee rate is inclusive of these services. The company also has certain arrangements whereby the distribution fees are paid upon the subscription or redemption of a share or unit.
Performance fee revenues, including carried interests and performance fees related to partnership investments and separate accounts, are generated on certain management contracts when performance hurdles are achieved. Such fee revenues are recorded in Operating revenues when the contractual performance criteria have been met and when it is probable that a significant reversal of revenue recognized will not occur in future reporting periods. Cash receipt of performance fees generally occurs after the performance fee revenue is earned; however, the company may receive, from time-to-time, cash distributions of carried interest before any revenue is earned. Such distributions are reflected as deferred carried interest liabilities within Accounts payable and accrued expenses on the Consolidated Balance Sheets. Given the uniqueness of each fee arrangement, performance fee contracts are evaluated on an individual basis to determine the timing of revenue recognition.
Other revenues include fees derived primarily from transaction commissions earned upon the sale of new investments into certain of our funds and fees earned upon the completion of transactions in our real estate and private equity asset groups. These transaction fees are recorded in the Consolidated Statements of Income on the date when Invesco’s services are complete, which typically coincides with when the transactions are legally complete.
Principal versus Agent
The company utilizes third-party service providers to fulfill certain performance obligations in its revenue agreements. Generally, the company is deemed to be the principal in these arrangements because the company controls the investment management and other related services before they are transferred to customers. Such control is evidenced by the company’s primary responsibility to customers and the ability to negotiate the third-party contract price as well as select and direct third-party service providers, or a combination of these factors. Therefore, investment management and service and distribution fee revenues and the related third-party distribution, service and advisory expenses are reported on a gross basis.
As discussed above, the revenues from the company’s U.S. retail operations include 12b-1 distribution fees, which are largely passed through to brokers who sell the funds. The fees passed through to the broker dealers are included in third-party distribution expenses along with additional marketing support distribution costs. Both the revenues and the costs are dependent on the underlying AUM of the brokers' clients. Third-party distribution expenses also include the amortization of upfront commissions paid to broker-dealers for sales of fund shares with a CDSC (a charge levied to the investor for client redemption of AUM within a certain contracted period of time). The upfront distribution commissions are amortized over the redemption period. Also included in third-party distribution, service and advisory expenses are sub-transfer agency fees that are paid to third parties for processing client common share purchases and redemptions, call center support and client reporting. These costs are reimbursed by the related funds and are included in service and distribution fees.
Common Share-Based Compensation
The company issues equity-settled common share-based awards to certain employees, which are measured at fair value at the date of grant. Fair value for the common share awards representing equity interests identical to those associated with common shares traded in the open market is determined using the market price at the date of grant. The fair value determined at the grant date is expensed, based on the company's estimate of common shares that will eventually vest, on a straight-line or accelerated basis over the vesting period.
Deferred Compensation
The company grants deferred cash awards to certain employees which are linked in value to investment products. During the vesting period, employees earn a return linked to the appreciation or depreciation of specified investments. The company recognizes as compensation expense the value of the liability to employees, including the appreciation or depreciation of the liability, over the award's vesting period in proportion to the vested amount of the award.
The company currently economically hedges the exposure to market movements on certain of these awards by either holding the underlying investment products on its balance sheet or through a TRS financial instrument. The company immediately recognizes the full value of the investment in Investments on the Consolidated Balance Sheets and any subsequent appreciation or depreciation of the investments, in Other gains/(losses), net in the Consolidated Statements of Income.
Pensions
For defined contribution plans, contributions payable related to the accounting period are expensed and included in Employee compensation expense. For defined benefit plans, the cost of providing benefits is separately determined for each plan using the projected unit credit method, based on actuarial valuations performed at each balance sheet date. The company's annual measurement date is December 31st. A portion of actuarial gains and losses is expensed and included in Other gains/(losses), net if the net cumulative unrecognized actuarial gain or loss at the end of the prior period exceeds the greater of 10.0% of the present value of the defined benefit obligation (before deducting plan assets) at that date and 10.0% of the fair value of any plan assets.
Leases
The company determines whether an arrangement is a lease at contract inception. Lease liabilities and right-of-use assets are recognized on the lease commencement date based on the net present value of fixed lease payments over the lease term. The company includes options to extend or terminate a lease within the lease term when it is reasonably certain the option will be exercised. Leases with an initial term of 12 months or less are not recorded on the balance sheet. Lease liabilities represent an obligation to make lease payments arising from a lease, and right-of-use assets represent a right to use an underlying asset during the lease term. Right-of-use assets exclude capital improvement funding and other lease concessions provided by the landlord.
As the company's leases generally do not have a readily determinable implicit rate, the company uses its incremental borrowing rate to determine the present value of fixed lease payments based on information available at the lease commencement date. Fixed lease expenses for operating leases are generally recognized on a straight-line basis over the lease term. The company combines lease components and non-lease components such as fixed maintenance and other costs into a single lease component, which results in the capitalization of all fixed payments within lease liabilities and right-of-use assets. Variable lease payments, such as variable maintenance costs or payments based on an index rate or usage, are expensed as incurred and are excluded from lease liabilities and right-of-use assets.
Taxation
Deferred tax assets and liabilities are recorded for temporary differences between the reported amounts of assets and liabilities in the financial statements and their respective tax bases, using the enacted statutory tax rates in effect for the year in which the differences are expected to reverse. The effect of a change in tax rates on deferred tax assets and liabilities is recognized in the income tax provision in the period in which the change is enacted. A valuation allowance is recorded to reduce the carrying amounts of deferred tax assets to the amount that is more likely than not to be realized. The company recognizes all excess tax benefits and deficiencies related to common share-based awards as a discrete item in the income tax provision in the period in which the awards vest. The company records a liability for UTBs resulting from uncertain tax positions taken or expected to be taken in a tax return. The company recognizes interest and penalties related to income tax matters in the income tax provision.
Earnings Per Common Share
Basic and diluted EPS are computed using the two-class method, which treats unvested restricted common shares as if they were a separate class of common shares. Under the two-class method, Net income attributable to Invesco is adjusted for the allocation of earnings to the unvested restricted common shares. In addition, the weighted-average common shares outstanding is adjusted for unvested restricted common shares.
Comprehensive Income
The company's Other comprehensive income/(loss) consists of foreign currency translation adjustments and employee benefit plan liability adjustments. Such amounts are recorded net of applicable taxes.
Translation of Foreign Currencies
Transactions in foreign currencies (currencies other than the functional currencies of the company's subsidiaries) are recorded at the rates of exchange prevailing on the dates of the transactions. At each balance sheet date, monetary assets and liabilities that are denominated in foreign currencies are remeasured into the functional currencies of the company's subsidiaries at the rates prevailing at the balance sheet date. The revaluation of these transactions is included in the Consolidated Statements of Income.
The company's reporting currency and the functional currency of the Parent is U.S. Dollars. On consolidation, the assets and liabilities of the company's subsidiaries, whose functional currencies are currencies other than the U.S. Dollar, are translated at the rates of exchange prevailing at the balance sheet date. Exchange differences arising on the translation of the assets and liabilities of foreign operations are recorded directly to accumulated other comprehensive income in equity until the disposal of the net investment of the foreign entity, at which time, the exchange differences are recognized in the Consolidated Statements of Income. Income and expense items included in the Consolidated Statements of Income are translated at the weighted average rates for the year, which approximate actual exchange rates with the foreign exchange impact recorded to the Consolidated Statements of Income. Goodwill and other fair value adjustments arising on acquisition of a foreign entity are treated as assets and liabilities of the foreign entity and are translated at rates of exchange prevailing at the balance sheet date.
2. FAIR VALUE OF ASSETS AND LIABILITIES
The fair value of financial instruments are presented in the below summary table. The fair value of financial instruments held by CIP are presented in Note 18, "Consolidated Investment Products."
| | | | | | | | | | | | | | | | | |
| | | | | December 31, 2024 | | | | December 31, 2023 |
| (in millions) | | | | | Fair Value | | | | Fair Value |
| Cash and cash equivalents | | | | | $ | 986.5 | | | | | $ | 1,469.2 | |
| | | | | | | | | |
| Equity investments | | | | | 371.2 | | | | | 272.4 | |
| | | | | | | | | |
| | | | | | | | | |
| Assets held for policyholders | | | | | — | | | | | 393.9 | |
Policyholder payables (1) | | | | | — | | | | | (393.9) | |
| Total return swap related to deferred compensation plans | | | | | (9.4) | | | | | 4.9 | |
| | | | | | | | | |
| | | | | | | | | |
____________
(1)These financial instruments are not measured at fair value on a recurring basis. Policyholder payables are indexed to the value of the assets held for policyholders and changes in fair value are recorded and offset to zero in other operating revenues. In January 2024, all funds were distributed to customers.
A three-level valuation hierarchy exists for disclosure of fair value measurements based upon the transparency of inputs to the valuation of an asset or liability as of the measurement date. The three levels are defined as follows:
•Level 1 - inputs to the valuation methodology are quoted prices (unadjusted) for identical assets or liabilities in active markets.
•Level 2 - inputs to the valuation methodology include quoted prices for similar assets and liabilities in active markets, and inputs that are observable for the asset or liability, either directly or indirectly, for substantially the full term of the financial instrument.
•Level 3 - inputs to the valuation methodology are unobservable and significant to the fair value measurement.
An asset or liability's categorization within the valuation hierarchy is based upon the lowest level of input that is significant to the fair value measurement.
The following table presents, for each of the hierarchy levels described above, the carrying value of the company's assets and liabilities, including by major security type for equity investments, which are measured at fair value on the company's Consolidated Balance Sheets as of December 31, 2024 and 2023, respectively:
| | | | | | | | | | | | | | | | | | | | | | | |
| December 31, 2024 |
| (in millions) | Fair Value Measurements | | Quoted Prices in Active Markets for Identical Assets
(Level 1) | | Significant Other Observable Inputs
(Level 2) | | Significant Unobservable Inputs
(Level 3) |
| Assets: | | | | | | | |
| Cash equivalents: | | | | | | | |
Money market funds (1) | $ | 479.3 | | | $ | 479.3 | | | $ | — | | | $ | — | |
Investments: (2) | | | | | | | |
| Equity investments: | | | | | | | |
| Seed capital | 151.6 | | | 151.6 | | | — | | | — | |
| Investments related to deferred compensation plans | 219.6 | | | 219.6 | | | — | | | — | |
| | | | | | | |
| | | | | | | |
| | | | | | | |
| | | | | | | |
| | | | | | | |
| | | | | | | |
| Total | $ | 850.5 | | | $ | 850.5 | | | $ | — | | | $ | — | |
| Liabilities: | | | | | | | |
| Total return swap related to deferred compensation plans | $ | (9.4) | | | $ | — | | | $ | (9.4) | | | $ | — | |
| Contingent consideration liability | (1.3) | | | — | | | — | | | (1.3) | |
| Total | $ | (10.7) | | | $ | — | | | $ | (9.4) | | | $ | (1.3) | |
| | | | | | | | | | | | | | | | | | | | | | | |
| December 31, 2023 |
| (in millions) | Fair Value Measurements | | Quoted Prices in Active Markets for Identical Assets
(Level 1) | | Significant Other Observable Inputs
(Level 2) | | Significant Unobservable Inputs
(Level 3) |
| Assets: | | | | | | | |
| Cash equivalents: | | | | | | | |
Money market funds (1) | $ | 927.8 | | | $ | 927.8 | | | $ | — | | | $ | — | |
Investments: (2) | | | | | | | |
| Equity investments: | | | | | | | |
| Seed capital | 75.7 | | | 75.7 | | | — | | | — | |
| Investments related to deferred compensation plans | 196.7 | | | 196.7 | | | — | | | — | |
| | | | | | | |
Assets held for policyholders (3) | 393.9 | | | 393.9 | | | — | | | — | |
| Total return swap related to deferred compensation plans | 4.9 | | | — | | | 4.9 | | | — | |
| Total | $ | 1,599.0 | | | $ | 1,594.1 | | | $ | 4.9 | | | $ | — | |
| Liabilities: | | | | | | | |
| | | | | | | |
| Contingent consideration liability | (1.3) | | | — | | | — | | | (1.3) | |
| Total | $ | (1.3) | | | $ | — | | | $ | — | | | $ | (1.3) | |
____________
(1)The balance primarily represents cash held in affiliated money market funds.
(2)Equity method and other investments of $854.5 million and $14.3 million, respectively, as of December 31, 2024 (December 31, 2023: $631.8 million and $14.9 million, respectively) are also excluded from this table. These investments are not measured at fair value, in accordance with applicable accounting standards.
(3)The majority of Assets held for policyholders were held in affiliated funds.
Total Return Swap
In addition to holding equity investments, the company has a TRS to hedge economically certain deferred compensation liabilities. The notional value of the TRS at December 31, 2024 was $421.2 million, and the fair value of the TRS was a liability of $9.4 million (December 31, 2023 notional value was $393.0 million and the fair value was an asset of $4.9 million). During the year ended December 31, 2024, market valuation gains related to the TRS were $23.8 million (December 31, 2023: $30.1 million net gains).
The fair value of the TRS was determined under the market approach using quoted prices of the underlying investments and, as such, is classified as level 2 of the valuation hierarchy. The TRS is not designated as a hedging instrument for accounting purposes.
3. INVESTMENTS
The disclosures below include details of the company's investments. Investments held by CIP are detailed in Note 18, "Consolidated Investment Products."
| | | | | | | | | | | |
| (in millions) | December 31, 2024 | | December 31, 2023 |
| Equity investments: | | | |
| Seed capital | $ | 151.6 | | | $ | 75.7 | |
| Investments related to deferred compensation plans | 219.6 | | | 196.7 | |
| | | |
| Equity method investments | 854.5 | | | 631.8 | |
| | | |
| Other | 14.3 | | | 14.9 | |
Total investments (1) | $ | 1,240.0 | | | $ | 919.1 | |
____________
(1) The majority of the company’s investment balances relate to balances held in affiliated funds and equity method investees.
Equity investments
Net gains recorded in Other gains/(losses) in the Consolidated Statements of Income resulting from equity investments and the TRS for the year ended December 31, 2024, were $44.2 million (December 31, 2023: $61.3 million net gains). The unrealized gains and losses for the year ended December 31, 2024, that relate to equity investments still held at December 31, 2024, was a $20.5 million net gain (December 31, 2023: $17.2 million net gain).
Equity method investments
Investments on the Consolidated Balance Sheets which are accounted for using the equity method include the company's investments in Invesco Great Wall as well as certain of its managed private equity, real estate and other investment entities. These investment entities include variable interest entities for which the company has determined that it is not the primary beneficiary and other investment products structured as partnerships for which the company is the general partner and the other limited partners possess either substantive kick-out, liquidation or participation rights. See Note 1, “Accounting Policies,” for additional information.
4. PROPERTY, EQUIPMENT AND SOFTWARE
The following is a summary of property, equipment and software:
| | | | | | | | | | | |
| (in millions) | December 31, 2024 | | December 31, 2023 |
| Technology and Other Equipment | $ | 240.3 | | | $ | 267.6 | |
| Software | 778.5 | | | 800.0 | |
| Land and Buildings | 85.2 | | | 87.3 | |
| Leasehold Improvements | 267.3 | | | 277.7 | |
| Work in Process | 62.4 | | | 111.6 | |
| Property, Equipment and Software, Gross | 1,433.7 | | | 1,544.2 | |
| Less: Accumulated Depreciation | (945.9) | | | (935.9) | |
| Less: Accumulated Impairment | (8.8) | | | (8.8) | |
| Property, Equipment and Software, Net | $ | 479.0 | | | $ | 599.5 | |
Depreciation expense related to Property, equipment and software was $134.8 million, $132.9 million and $131.5 million for the years ended December 31, 2024, 2023 and 2022, respectively.
5. INTANGIBLE ASSETS
The following table presents the major classes of the company's intangible assets at December 31, 2024 and 2023:
| | | | | | | | | | | | | | | | | |
| (in millions) | Gross Book Value | | Accumulated Amortization and Impairment | | Net Book Value |
| December 31, 2024 | | | | | |
| Management contracts - indefinite-lived | $ | 6,900.6 | | | $ | (1,248.9) | | | $ | 5,651.7 | |
| Management contracts - finite-lived | 317.7 | | | (253.2) | | | 64.5 | |
| | | | | |
Other (1) | 195.7 | | | (162.6) | | | 33.1 | |
| Total | $ | 7,414.0 | | | $ | (1,664.7) | | | $ | 5,749.3 | |
| December 31, 2023 | | | | | |
| Management contracts - indefinite-lived | $ | 6,954.3 | | | $ | (1,248.9) | | | $ | 5,705.4 | |
| Management contracts - finite-lived | 318.3 | | | (221.5) | | | 96.8 | |
| | | | | |
Other (1) | 201.4 | | | (155.5) | | | 45.9 | |
| Total | $ | 7,474.0 | | | $ | (1,625.9) | | | $ | 5,848.1 | |
__________
(1) Includes indefinite-lived non-management contracts intangible assets of $19.1 million for the years ended December 31, 2024 and 2023, and developed technology intangible assets that were fully amortized during the year ended December 31, 2024.
Amortization expense was $44.8 million (December 31, 2023: $49.9 million; December 31, 2022: $63.8 million). An impairment related to indefinite-lived management contracts of U.S. retail mutual funds of $1,248.9 million was recorded during the year ended December 31, 2023. Estimated amortization expense for each of the five succeeding fiscal years based upon the company's intangible assets at December 31, 2024 is as follows:
| | | | | |
(in millions)
Years Ended December 31, | Estimated Amortization Expense |
| 2025 | $ | (37.6) | |
| 2026 | $ | (35.8) | |
| 2027 | $ | (3.6) | |
| 2028 | $ | (1.5) | |
| 2029 | $ | — | |
6. GOODWILL
The table below details changes in the goodwill balance:
| | | | | | | | | |
| (in millions) | | | | | Net Book Value |
| January 1, 2024 | | | | | $ | 8,691.5 | |
| | | | | |
| Foreign exchange | | | | | (189.2) | |
Transfer to held for sale (1) | | | | | (184.2) | |
| December 31, 2024 | | | | | $ | 8,318.1 | |
| | | | | |
| January 1, 2023 | | | | | $ | 8,557.7 | |
| | | | | |
| Foreign exchange | | | | | 133.8 | |
| December 31, 2023 | | | | | $ | 8,691.5 | |
_________(1) Included in Other assets on the Consolidated Balance Sheet. See Note 1, “Accounting Policies,” for additional information.
7. OTHER LIABILITIES
The table below details the components of other liabilities:
| | | | | | | | | | | |
| (in millions) | December 31, 2024 | | December 31, 2023 |
| Compensation and benefits | $ | 74.2 | | | $ | 98.3 | |
| Accrued bonus and deferred compensation | 955.0 | | | 802.1 | |
| Accrued compensation and benefits | $ | 1,029.2 | | | $ | 900.4 | |
| | | |
| Accruals and other liabilities | $ | 584.4 | | | $ | 961.4 | |
| | | |
| | | |
| | | |
| Lease liability (See Note 13) | 454.9 | | | 433.7 | |
| Accounts payable | 30.6 | | | 31.5 | |
| Unsettled funds payable | 69.4 | | | 151.2 | |
| Income taxes payable | 146.0 | | | 110.5 | |
| Accounts payable and accrued expenses | $ | 1,285.3 | | | $ | 1,688.3 | |
| | | |
8. DEBT
The issuer of the senior notes, Invesco Finance PLC, is an indirect 100% owned finance subsidiary of the Parent, and the Parent fully and unconditionally guarantees the securities.
The disclosures below include details of the company's debt. Debt of CIP is detailed in Note 18, “Consolidated Investment Products.”
| | | | | | | | | | | | | | | | | | | | | | | |
| December 31, 2024 | | December 31, 2023 |
| (in millions) | Carrying Value (4) | | Fair Value | | Carrying Value (4) | | Fair Value |
$2.0 billion revolving credit agreement expiring April 26, 2028 (1) | $ | — | | | $ | — | | | $ | — | | | $ | — | |
Unsecured Senior Notes (2): | | | | | | | |
| | | | | | | |
$600 million 4.000% - due January 30, 2024 (3) | — | | | — | | | 599.9 | | | 599.1 | |
| $500 million 3.750% - due January 15, 2026 | 499.3 | | | 494.5 | | | 498.6 | | | 489.1 | |
| $400 million 5.375% - due November 30, 2043 | 391.3 | | | 391.7 | | | 391.0 | | | 409.6 | |
| Debt | $ | 890.6 | | | $ | 886.2 | | | $ | 1,489.5 | | | $ | 1,497.8 | |
____________(1)The base interest rate is the secured overnight financing rate (SOFR) plus a 0.10% adjustment (Adjusted SOFR).
(2)The company's senior note indentures contain certain restrictions on mergers or consolidations. Beyond these items, there are no other restrictive covenants in the indentures.
(3)On January 30, 2024, the outstanding balance of the $600.0 million senior notes was paid in full.
(4)The difference between the principal amounts and the carrying values of the senior notes in the table above reflect the unamortized debt issuance costs and discounts.
The fair market value of the company's senior notes was determined by market quotes provided by a third-party pricing service, which utilizes Level 2 valuation inputs. In the absence of an active market, the company relies upon the average price quoted by brokers for determining the fair market value of the debt.
At December 31, 2024, the outstanding balance on the revolving credit agreement was zero. Borrowings under the revolving credit agreement will bear interest at (i) Adjusted SOFR for specified interest periods or (ii) a floating base rate (based upon the highest of (a) the Bank of America prime rate, (b) the Federal Funds rate plus 0.50% and (c) Adjusted SOFR for an interest period of one month plus 1.00%), plus, in either case, an applicable margin determined with reference to the higher of the available credit ratings of the Parent or its indirect subsidiary, Invesco Finance PLC. Based on credit ratings of the Parent as of December 31, 2024 and December 31, 2023, the applicable margin for SOFR-based loans was 1.13% and for base rate loans was 0.13%. In addition, the company is required to pay the lenders a facility fee on the aggregate commitments of the lenders (whether or not used) at a rate per annum which is based on the higher of the available credit ratings of the Parent or its indirect subsidiary, Invesco Finance PLC. Based on credit ratings as of December 31, 2024 and December 31, 2023, the annual facility fee was equal to 0.13% for both periods.
The revolving credit agreement contains customary restrictive covenants on the company and its subsidiaries. Restrictive covenants in the revolving credit agreement include, but are not limited to: prohibitions on creating, incurring or assuming any liens; entering into merger arrangements; selling, leasing, transferring or otherwise disposing of assets; making a material change in the nature of the business; making a significant accounting policy change in certain situations; entering into transactions with affiliates; and incurring indebtedness through the subsidiaries (other than the borrower, Invesco Finance PLC). Many of these restrictions are subject to certain minimum thresholds and exceptions. Financial covenants under the revolving credit agreement include: (i) the quarterly maintenance of a debt/Covenant Adjusted EBITDA leverage ratio, as defined in the revolving credit agreement, of not greater than 3.25:1.00, (ii) an interest coverage ratio (Covenant Adjusted EBITDA, as defined in the revolving credit agreement/interest expense for the four consecutive fiscal quarters ended before the date of determination) of not less than 4.00:1.00. The company is in compliance with all restrictive debt covenants as of December 31, 2024.
The revolving credit agreement also contains customary provisions regarding events of default which could result in an acceleration or increase in amounts due, including (subject to certain materiality thresholds and grace periods) payment default, failure to comply with covenants, material inaccuracy of representation or warranty, bankruptcy or insolvency proceedings, change of control, certain judgments, ERISA matters, cross-default to other debt agreements, governmental action prohibiting or restricting the company or its subsidiaries in a manner that has a material adverse effect, and failure of certain guaranty obligations.
9. SHARE CAPITAL
The preferred shares have a $0.20 par value, liquidation preference of $1,000 per share and fixed cash dividend rate of 5.90% per annum, payable quarterly on a non-cumulative basis. Shares of preferred stock are not redeemable prior to the 21st anniversary of their original issue date of May 24, 2019. The number of preferred shares issued and outstanding is represented in the table below:
| | | | | | | | | | | | | |
| in millions | December 31, 2024 | | December 31, 2023 | | |
Preferred shares issued (1) | 4.0 | | 4.0 | | |
| | | | | |
Preferred shares outstanding (1) | 4.0 | | 4.0 | | |
__________
(1) The five-year lock-up period which prohibited the sale of preferred shares by MassMutual expired on May 24, 2024.
The number of common shares and common share equivalents issued are represented in the table below:
| | | | | | | | | | | | | | | | | |
| in millions | December 31, 2024 | | December 31, 2023 | | December 31, 2022 |
| | | | | |
| | | | | |
| Common shares issued | 566.1 | | | 566.1 | | | 566.1 | |
| Less: Treasury shares for which dividend and voting rights do not apply | (118.1) | | | (116.6) | | | (111.3) | |
| Common shares outstanding | 448.0 | | | 449.5 | | | 454.8 | |
During the year ended December 31, 2024, the company repurchased 2.9 million common shares in the open market at a cost of $49.6 million (December 31, 2023: 9.6 million common shares at a cost of $150.0 million). Separately, an aggregate of 2.0 million shares were withheld on vesting events during the year ended December 31, 2024 to meet employees' withholding tax obligations (December 31, 2023: 1.9 million). The fair value of the common shares withheld at the respective withholding dates was $29.7 million (December 31, 2023: $37.5 million). At December 31, 2024, approximately $332.6 million remained authorized under the company's common share repurchase authorization approved by the Board on July 22, 2016 (December 31, 2023: $382.2 million).
Total treasury shares at December 31, 2024 were 123.0 million (December 31, 2023: 124.7 million), including 4.9 million unvested restricted common stock awards (December 31, 2023: 8.1 million) for which dividend and voting rights apply. The market price of common shares on December 31, 2024 was $17.48. The total market value of the company's 123.0 million treasury shares was $2.2 billion at December 31, 2024.
Movements in Treasury Shares comprise:
| | | | | | | | | | | | | | | | | |
| in millions | 2024 | | 2023 | | 2022 |
| Beginning balance on January 1 | 124.7 | | | 119.5 | | | 115.7 | |
| Acquisition of common shares | 4.9 | | | 11.5 | | | 11.3 | |
| Distribution of common shares | (6.2) | | | (6.0) | | | (7.1) | |
| Common shares distributed to meet ESPP obligation | (0.4) | | | (0.3) | | | (0.4) | |
| | | | | |
| Ending balance on December 31 | 123.0 | | | 124.7 | | | 119.5 | |
10. OTHER COMPREHENSIVE INCOME/(LOSS)
The components of accumulated other comprehensive income/(loss) were as follows:
| | | | | | | | | | | | | | | | | | | | |
| 2024 | | | |
| (in millions) | Foreign currency translation | | Employee benefit plans | | Total | | | |
| Other comprehensive income/(loss), net of tax: | | | | | | | | |
| Currency translation differences on investments in foreign subsidiaries | $ | (234.3) | | | $ | — | | | $ | (234.3) | | | | |
| | | | | | | | |
| Other comprehensive income/(loss), net | — | | | — | | | — | | | | |
| Other comprehensive income/(loss), net of tax | (234.3) | | | — | | | (234.3) | | | | |
| | | | | | | | |
| Beginning balance on January 1 | (670.1) | | | (131.7) | | | (801.8) | | | | |
| | | | | | | | |
| | | | | | | | |
| Other comprehensive income/(loss), net of tax | (234.3) | | | — | | | (234.3) | | | | |
| Ending balance on December 31 | $ | (904.4) | | | $ | (131.7) | | | $ | (1,036.1) | | | | |
| | | | | | | | | | | | | | | | | | | | |
| 2023 |
| (in millions) | Foreign currency translation | | Employee benefit plans | | | | | Total |
| Other comprehensive income/(loss), net of tax: | | | | | | | | |
| Currency translation differences on investments in foreign subsidiaries | $ | 144.9 | | | $ | — | | | | | | $ | 144.9 | |
| | | | | | | | |
| Other comprehensive income/(loss), net | — | | | (4.3) | | | | | | (4.3) | |
| Other comprehensive income/(loss), net of tax | 144.9 | | | (4.3) | | | | | | 140.6 | |
| | | | | | | | |
| Beginning balance on January 1 | (815.0) | | | (127.4) | | | | | | (942.4) | |
| | | | | | | | |
| | | | | | | | |
| Other comprehensive income/(loss), net of tax | 144.9 | | | (4.3) | | | | | | 140.6 | |
| Ending balance on December 31 | $ | (670.1) | | | $ | (131.7) | | | | | | $ | (801.8) | |
| | | | | | | | | | | | | | | | | | | | | |
| 2022 |
| (in millions) | Foreign currency translation | | Employee benefit plans | | | | | | Total |
| Other comprehensive income/(loss) net of tax: | | | | | | | | | |
| Currency translation differences on investments in foreign subsidiaries | $ | (463.1) | | | $ | — | | | | | | | $ | (463.1) | |
| | | | | | | | | |
| Other comprehensive income/(loss), net | — | | | (37.8) | | | | | | | (37.8) | |
| Other comprehensive income/(loss), net of tax | (463.1) | | | (37.8) | | | | | | | (500.9) | |
| | | | | | | | | |
| Beginning balance on January 1 | (351.9) | | | (89.6) | | | | | | | (441.5) | |
| | | | | | | | | |
| | | | | | | | | |
| Other comprehensive income/(loss), net of tax | (463.1) | | | (37.8) | | | | | | | (500.9) | |
| Ending balance on December 31 | $ | (815.0) | | | $ | (127.4) | | | | | | | $ | (942.4) | |
11. COMMON SHARE-BASED COMPENSATION
The company recognized total compensation expense of $104.6 million, $114.6 million and $106.2 million related to equity-settled common share-based compensation for the years ended December 31, 2024, 2023 and 2022, respectively. The income tax benefit recognized in the Consolidated Statements of Income for common share-based compensation arrangements was $22.1 million for 2024 (2023: $17.4 million; 2022: $21.7 million).
Employee common share awards are broadly classified into two categories: time-vested and performance-vested. Time-vested awards vest ratably over a defined period of continued employee service. Performance-vested awards vest upon (i) the company's attainment of certain pre-established performance criteria, and (ii) a defined period of continued employee service.
Time-vested and performance-vested equity awards are granted in the form of restricted stock awards (RSAs) or restricted stock units (RSUs). With respect to the performance-vested awards granted in February 2022, 2023 and 2024, vesting is tied to the achievement of specific levels of adjusted operating margin and relative total shareholder return with vesting ranging from 0% to 150%.
Employee common share awards are measured at fair value based on Invesco's common stock price at the date of grant and are expensed on a straight-line or accelerated basis over the vesting period.
With respect to time-vested awards, dividends accrue directly to the employee holder of RSAs, and cash payments in lieu of dividends are made to employee holders of RSUs. With respect to performance-vested awards, cash payments in lieu of dividends are deferred and are paid at the same rate as on the underlying shares if and to the extent the award vests.
The 2016 Global Equity Incentive Plan, which was originally approved by the company's common shareholders in May 2016 and most recently amended and restated in July 2024, authorizes the issuance of up to 21.2 million shares. In May 2010, the board approved the 2010 Global Equity Incentive Plan ST (GEIP ST). The GEIP ST authorizes the issuance of up to 8.5 million shares. With respect to the GEIP ST, awards are only granted as employment inducement awards in connection with a strategic transaction and, as a result, do not require shareholder approval under the rules of the NYSE or otherwise.
Movements on employee common share awards during the years ended December 31, 2024, 2023 and 2022 were detailed below:
| | | | | | | | | | | | | | | | | | | | | | | | | | | | | | | | | | | | | | | | | |
| 2024 | | 2023 | | 2022 |
| (in millions of common shares, except fair values) | Time-Vested | | Performance-Vested | | Weighted Average Grant Date Fair Value | | Time-Vested | | Performance-Vested | | Time-Vested | | Performance-Vested |
| Unvested at the beginning of year | 10.4 | | | 1.6 | | | $ | 18.84 | | | 10.3 | | | 2.1 | | | 13.5 | | | 1.9 | |
| Granted | 5.0 | | | 0.9 | | | 15.20 | | | 5.7 | | | 0.3 | | | 3.6 | | | 1.0 | |
| Forfeited/Canceled due to performance measures | (0.5) | | | (0.1) | | | 17.72 | | | (0.3) | | | (0.2) | | | (0.3) | | | (0.1) | |
| Vested and distributed | (5.1) | | | (1.0) | | | 18.52 | | | (5.3) | | | (0.6) | | | (6.5) | | | (0.7) | |
| Unvested at the end of the year | 9.8 | | | 1.4 | | | $ | 17.17 | | | 10.4 | | | 1.6 | | | 10.3 | | | 2.1 | |
___________
The total fair value of common shares that vested during 2024 was $95.7 million (2023: $101.4 million; 2022: $141.8 million). The weighted average grant date fair value of the U.S. dollar share awards that were granted during 2024 was $15.20 (2023: $17.53; 2022: $21.23).
At December 31, 2024, there was $94.7 million of total unrecognized compensation cost related to non-vested common share awards; that cost is expected to be recognized over a weighted average period of 2.30 years.
12. RETIREMENT BENEFIT PLANS
Defined Contribution Plans
The company operates defined contribution retirement benefit plans for all qualifying employees. The assets of the plans are held separately from those of the company in funds under the control of trustees. When employees leave the plans prior to vesting fully in the contributions, the contributions payable by the company may be reduced by the amount of forfeited contributions.
The total amounts charged to the Consolidated Statements of Income for the year ended December 31, 2024 of $75.4 million (December 31, 2023: $73.9 million, December 31, 2022: $76.4 million) represent contributions paid or payable to these plans by the company at rates specified in the rules of the plans. As of December 31, 2024, accrued contributions of $13.0 million (December 31, 2023: $12.9 million) for the current year will be paid to the plans.
Defined Benefit Plans
The company maintains legacy defined benefit pension plans for qualifying employees of its subsidiaries in the U.K., Ireland, Germany and Taiwan. All defined benefit plans are closed to new participants.
The most recent actuarial valuations of plan assets and the present value of the defined benefit obligation were valued as of December 31, 2024. The benefit obligation, related current service cost and prior service cost were measured using the projected unit credit method.
Benefit Obligations and Funded Status
The amounts included in the Consolidated Balance Sheets arising from the company's obligations and plan assets in respect of its defined benefit retirement plans were as follows:
| | | | | | | | | | | |
| (in millions) | 2024 | | 2023 |
| Benefit obligation | $ | (285.7) | | | $ | (325.8) | |
| Fair value of plan assets | 304.7 | | | 350.1 | |
| Funded status | $ | 19.0 | | | $ | 24.3 | |
| Amounts recognized in the Consolidated Balance Sheets: | | | |
| Other assets | $ | 21.9 | | | $ | 27.0 | |
| Accrued compensation and benefits | (2.9) | | | (2.7) | |
| Funded status | $ | 19.0 | | | $ | 24.3 | |
Changes in the benefit obligations were as follows:
| | | | | | | | | | | |
| (in millions) | 2024 | | 2023 |
| January 1 | $ | 325.8 | | | $ | 303.0 | |
| Service cost | 0.1 | | | 0.2 | |
| Interest cost | 14.0 | | | 14.0 | |
| | | |
| Actuarial (gains)/losses | (35.6) | | | 5.0 | |
| Exchange difference | (6.9) | | | 17.2 | |
| Benefits paid | (11.7) | | | (13.6) | |
| | | |
| | | |
| | | |
| December 31 | $ | 285.7 | | | $ | 325.8 | |
Key assumptions used in plan valuations are detailed below. Appropriate local mortality tables were also used. The weighted average assumptions used to determine defined benefit obligations at December 31, 2024 and 2023 were as follows:
| | | | | | | | | | | |
| 2024 | | 2023 |
| Discount rate | 5.23 | % | | 4.37 | % |
| Expected rate of salary increases | 2.90 | % | | 2.87 | % |
| Future pension trend rate increases | 3.29 | % | | 3.28 | % |
Changes in the fair value of plan assets in the current period were as follows:
| | | | | | | | | | | |
| Retirement Plans |
| (in millions) | 2024 | | 2023 |
| January 1 | $ | 350.1 | | | $ | 335.8 | |
| Actual return on plan assets | (26.8) | | | 8.4 | |
| Foreign currency changes | (7.1) | | | 19.3 | |
| Contributions from the company | 0.2 | | | 0.2 | |
| | | |
| Benefits paid | (11.7) | | | (13.6) | |
| | | |
| December 31 | $ | 304.7 | | | $ | 350.1 | |
The components of the amount recognized in accumulated other comprehensive income at December 31, 2024 and 2023 were as follows:
| | | | | | | | | | | |
| Retirement Plans |
| (in millions) | 2024 | | 2023 |
| Prior service cost/(credit) | $ | 5.3 | | | $ | 5.6 | |
| Net actuarial loss/(gain) | 157.1 | | | 156.5 | |
| Total | $ | 162.4 | | | $ | 162.1 | |
The amounts in accumulated other comprehensive income expected to be amortized into the Consolidated Income Statement during the year ending December 31, 2025 are as follows:
| | | | | |
| (in millions) | Retirement Plans |
| Prior service cost/(credit) | $ | 0.3 | |
| Net actuarial loss/(gain) | 5.0 | |
| Total | $ | 5.3 | |
The total accumulated and projected benefit obligation and fair value of plan assets for plans with accumulated and projected benefit obligations in excess of plan assets were as follows: | | | | | | | | | | | |
| Retirement Plans |
| (in millions) | 2024 | | 2023 |
| Plans with accumulated and projected benefit obligation in excess of plan assets: | | | |
| Accumulated and projected benefit obligation | $ | 4.3 | | | $ | 4.2 | |
| Fair value of plan assets | $ | 1.4 | | | $ | 1.5 | |
Net Periodic Benefit Cost
The components of net periodic benefit cost in respect of these defined benefit plans were as follows:
| | | | | | | | | | | | | | | | | |
| Retirement Plans |
| (in millions) | 2024 | | 2023 | | 2022 |
| Service cost | $ | 0.1 | | | $ | 0.2 | | | $ | — | |
| Interest cost | 14.0 | | | 14.0 | | | 8.8 | |
| Expected return on plan assets | (14.2) | | | (14.7) | | | (13.5) | |
| Amortization of prior service cost/(credit) | 0.2 | | | 0.5 | | | 0.2 | |
| Amortization of net actuarial (gain)/loss | 4.8 | | | 3.8 | | | 0.8 | |
| | | | | |
| | | | | |
| Net periodic benefit cost/(credit) | $ | 4.9 | | | $ | 3.8 | | | $ | (3.7) | |
The weighted average assumptions used to determine net periodic benefit cost for the years ended December 31, 2024, 2023 and 2022 were:
| | | | | | | | | | | | | | | | | |
| Retirement Plans |
| 2024 | | 2023 | | 2022 |
| Discount rate | 4.37 | % | | 4.55 | % | | 1.91 | % |
| Expected return on plan assets | 5.02 | % | | 4.13 | % | | 3.28 | % |
| Expected rate of salary increases | 2.87 | % | | 2.97 | % | | 3.10 | % |
| Future pension rate increases | 3.28 | % | | 3.35 | % | | 3.29 | % |
In developing the expected rate of return, the company considers long-term compound annualized returns based on historical and current market data. Using this reference information, the company develops forward-looking return expectations for each asset category and an expected long-term rate of return for a targeted portfolio. Discount rate assumptions were based upon AA-rated corporate bonds of suitable terms and currencies.
Plan Assets
The analysis of the plan assets as of December 31, 2024 was as follows:
| | | | | | | | | | | |
| (in millions) | 2024 | | % of Plan Assets |
| Cash and cash equivalents | $ | 13.8 | | | 4.5 | % |
| Fund investments | 92.7 | | | 30.4 | % |
| Equity securities | 17.9 | | | 5.9 | % |
| Government debt securities | 13.3 | | | 4.4 | % |
| Guaranteed investments contracts | 85.5 | | | 28.1 | % |
| Other investments | 81.5 | | | 26.7 | % |
| Total | $ | 304.7 | | | 100.0 | % |
The analysis of the plan assets as of December 31, 2023 was as follows:
| | | | | | | | | | | |
| (in millions) | 2023 | | % of Plan Assets |
| Cash and cash equivalents | $ | 36.9 | | | 10.5 | % |
| Fund investments | 75.6 | | | 21.6 | % |
| Equity securities | 15.7 | | | 4.5 | % |
| Government debt securities | 16.3 | | | 4.7 | % |
| Guaranteed investments contracts | 97.0 | | | 27.7 | % |
| Other investments | 108.6 | | | 31.0 | % |
| Total | $ | 350.1 | | | 100.0 | % |
Plan assets are not held in company stock. The investment policies and strategies for plan assets held by defined benefit plans include:
•Funding - to have sufficient assets available to pay members benefits;
•Security - to maintain the minimum Funding Requirement;
•Stability - to have due regard to the employer's ability in meeting contribution payments given their size and incidence.
The following is a description of the valuation methodologies used for each major category of plan assets measured at fair value. Information about the valuation hierarchy levels used to measure fair value is detailed in Note 2, “Fair Value of Assets and Liabilities.”
Cash and cash equivalents
Cash equivalents include cash in the bank and cash investments in money market funds. Cash investments in money market funds are valued under the market approach through the use of quoted market prices in an active market, which is the NAV of the underlying funds, and are classified within level 1 of the valuation hierarchy.
Fund investments
These plan assets are primarily invested in affiliated funds and are classified within level 1 of the valuation hierarchy. They are valued at the NAV of common shares held by the plan at year end.
Equity securities, government debt securities and other investments
These plan assets are classified within level 1 of the valuation hierarchy and are valued at the closing price reported on the active market on which the individual securities are traded.
Guaranteed investment contracts
These plan assets are classified within level 3 of the valuation hierarchy and are valued through use of unobservable inputs by discounting the related cash flows based on current yields of similar instruments with comparable durations considering the credit-worthiness of the issuer.
Cash Flows
The estimated amounts of contributions expected to be paid to the plans during 2025 are $0.2 million. There are no future annual benefits of plan participants covered by insurance contracts issued by the employer or related parties.
The benefits expected to be paid in each of the next five fiscal years and in the five fiscal years thereafter are as follows:
| | | | | |
| (in millions) | |
| Expected benefit payments: | |
| 2025 | $ | 10.0 | |
| 2026 | $ | 10.4 | |
| 2027 | $ | 10.6 | |
| 2028 | $ | 11.0 | |
| 2029 | $ | 11.5 | |
| Thereafter in the succeeding five years | $ | 65.7 | |
13. OPERATING LEASES
The company leases office space in almost all its business locations and data centers and has certain equipment under non-cancelable operating leases. The operating leases have a weighted-average remaining lease term of 9.93 years for the year ended December 31, 2024 (2023: 9.95 years) and generally include one or more options to renew, with renewal terms that can extend the lease term from 1 to 10 years. Certain lease arrangements include an option to terminate the lease if a notification is provided to the landlord within 1 to 4.2 years prior to the end of the lease term. The company has sole discretion in exercising lease renewal and termination options. The lease terms used in the company’s lease measurements do not include renewal options as they are not reasonably certain to be exercised as of the date of this report.
The company elected to combine lease and non-lease components in calculating the lease liability and right-of-use asset for operating leases.
Variable lease payments are determined based on the terms and conditions outlined in the lease contracts and are primarily determined in relation to the extent of the company’s usage of the right-of-use asset or the nature and extent of services received from the lessor. Variable lease costs consists primarily of common area maintenance and other operating expenses as negotiated with the lessor.
As of December 31, 2024, the right-of-use asset of $335.3 million was included in Other assets, and the lease liability of $454.9 million was included in Accounts payable and accrued expenses, on the Consolidated Balance Sheets.
The components of lease expense for the years ended December 31, 2024, 2023 and 2022 were as follows:
| | | | | | | | | | | | | | | | | |
| (in millions) | 2024 | | 2023 | | 2022 |
| Operating lease cost | $ | 73.7 | | | $ | 75.4 | | | $ | 82.9 | |
| Variable lease cost | 27.9 | | 25.9 | | 19.0 |
| Less: sublease income | (1.9) | | | (2.3) | | | (1.6) | |
| Total lease expense | $ | 99.7 | | | $ | 99.0 | | | $ | 100.3 | |
| | | | | |
Supplemental cash flow information related to leases for the years ended December 31, 2024 and 2023 was as follows:
| | | | | | | | | | | |
| (in millions) | 2024 | | 2023 |
| Cash outflows from operating leases included in the measurement of lease liabilities | $ | 75.0 | | | $ | 80.8 | |
| Right-of-use assets obtained in exchange for new operating lease liabilities | $ | 57.2 | | | $ | 22.7 | |
In determining the discount rate, the company considered the interest rate yield for specific interest rate environments and the company’s credit spread at the inception of the lease.
The weighted-average discount rate for the operating lease liability for the year ended December 31, 2024 was 4.42% (2023: 4.14%).
As of December 31, 2024, the maturities of the company’s lease liabilities (primarily related to real estate leases) were as follows:
| | | | | |
| (in millions) | |
| 2025 | $ | 66.2 | |
| 2026 | 69.3 | |
| 2027 | 64.8 | |
| 2028 | 55.6 | |
| 2029 | 40.4 | |
| Thereafter | 267.8 | |
| Total lease payments | 564.1 | |
| Less: interest | (109.2) | |
| Present value of lease liabilities | $ | 454.9 | |
14. TAXATION
The components of the company's income tax expense (benefit) for the years ended December 31, 2024, 2023 and 2022 were as follows:
| | | | | | | | | | | | | | | | | |
| (in millions) | 2024 | | 2023 | | 2022 |
| Current: | | | | | |
| Federal | $ | 201.2 | | | $ | 164.0 | | | $ | 214.1 | |
| State | 51.3 | | | 42.7 | | | 50.2 | |
| Foreign | 38.5 | | | 32.8 | | | 9.6 | |
| $ | 291.0 | | | $ | 239.5 | | | $ | 273.9 | |
| Deferred: | | | | | |
| Federal | $ | (19.3) | | | $ | (235.3) | | | $ | 35.2 | |
| State | (2.0) | | | (44.1) | | | (1.1) | |
| Foreign | (16.8) | | | (29.8) | | | 14.2 | |
| (38.1) | | | (309.2) | | | 48.3 | |
| Total income tax expense (benefit) | $ | 252.9 | | | $ | (69.7) | | | $ | 322.2 | |
A reconciliation between the statutory U.S. federal income tax rate and the effective tax rate per the Consolidated Statements of Income for the years ended December 31, 2024, 2023 and 2022 is as follows:
| | | | | | | | | | | | | | | | | |
| 2024 | | 2023 (1) | | 2022 |
| Statutory rate | 21.0 | % | | 21.0 | % | | 21.0 | % |
| State taxes, net of federal tax effect | 3.9 | % | | 3.2 | % | | 3.1 | % |
| Foreign tax rate differential | (2.8) | % | | 11.1 | % | | 1.3 | % |
| Income/(loss) attributable to noncontrolling interests in consolidated entities | 0.5 | % | | (6.3) | % | | (0.1) | % |
| Income/(loss) attributable to equity method investments in corporate joint ventures | (1.3) | % | | 7.4 | % | | (1.7) | % |
| Valuation allowance | 1.2 | % | | (2.9) | % | | — | % |
| Nondeductible regulatory settlements | 1.1 | % | | — | % | | — | % |
| Nondeductible executive compensation | — | % | | (4.6) | % | | — | % |
| Nontaxable gain | — | % | | 3.9 | % | | — | % |
| Other | 1.6 | % | | (3.5) | % | | 2.2 | % |
| Effective tax rate per Consolidated Statements of Income | 25.2 | % | | 29.3 | % | | 25.8 | % |
__________
(1) Certain signs within the table in the year ended December 31, 2023 are the opposite compared to the years ended December 31, 2024 and 2022 as a result of applying each line’s total income tax benefit or expense to the loss before income taxes.
The company’s effective tax rate is affected by the tax rates in foreign jurisdictions, which are different than the U.S. federal statutory tax rate of 21%, and the relative amount of income earned in those jurisdictions. As a result, the effective tax rate will vary from year to year depending on the mix of the profits and losses from each jurisdiction.
The components of income/(loss) before taxes for the years ended December 31, 2024, 2023 and 2022 were as follows:
| | | | | | | | | | | | | | | | | |
| (in millions) | 2024 | | 2023 | | 2022 |
| Domestic | $ | 850.6 | | | $ | (469.2) | | | $ | 1,212.0 | |
| Foreign | 154.7 | | | 231.3 | | | 35.7 | |
| Income/(loss) before income taxes | $ | 1,005.3 | | | $ | (237.9) | | | $ | 1,247.7 | |
The components of the deferred tax assets and liabilities reflected in the Consolidated Balance Sheets at December 31, 2024 and 2023 included the following:
| | | | | | | | | | | |
| (in millions) | 2024 | | 2023 |
| Deferred tax assets: | | | |
| Compensation and benefits | $ | 118.3 | | | $ | 95.6 | |
| Lease obligations | 85.5 | | | 66.7 | |
| Net operating loss carryforwards | 165.0 | | | 154.3 | |
| Fixed assets | 24.9 | | | 15.7 | |
| Accrued liabilities | 38.0 | | | 34.4 | |
| Other | 4.7 | | | 4.9 | |
| Total deferred tax assets | 436.4 | | | 371.6 | |
| Valuation allowance | (99.2) | | | (98.9) | |
| Deferred tax assets, net of valuation allowance | 337.2 | | | 272.7 | |
| Deferred tax liabilities: | | | |
| Goodwill and intangibles | (1,522.1) | | | (1,519.1) | |
| Leased assets | (60.0) | | | (55.9) | |
| | | |
| Other | (27.3) | | | (21.8) | |
| Total deferred tax liabilities | (1,609.4) | | | (1,596.8) | |
| Net deferred tax liability | $ | (1,272.2) | | | $ | (1,324.1) | |
Deferred income tax assets and liabilities are recorded net when related to the same tax jurisdiction. At December 31, 2024, the company recorded on the Consolidated Balance Sheets net deferred tax assets of $9.7 million in Other assets and net Deferred tax liabilities of $1,281.9 million. At December 31, 2023, the company recorded on the Consolidated Balance Sheets net deferred tax assets of $1.6 million in Other assets and net Deferred tax liabilities of $1,325.7 million.
At December 31, 2024, the company had state net operating loss carryforwards of $33.5 million, which will expire, if not utilized, between 2025 and 2038 except for approximately $4.1 million which have an indefinite life. At December 31, 2024, the company also had federal and foreign net operating loss carryforwards of $131.5 million, of which approximately $8.6 million will expire over several years starting in 2025, with the remaining $122.9 million having an indefinite life. A valuation allowance has been recorded against certain carryforwards and certain deferred tax assets related to tax jurisdictions in which it is unlikely that the deferred tax asset will be realized.
Deferred tax liabilities are recognized for taxes that would be payable on the unremitted earnings of the company's foreign subsidiaries and corporate joint ventures, except where it is our intention to indefinitely reinvest the undistributed earnings. A deferred tax liability has not been recognized for our Canadian unremitted earnings, which are indefinitely reinvested, of approximately $989.1 million and $1,068.8 million at December 31, 2024 and 2023, respectively. If these earnings were distributed as a dividend, Canadian withholding tax of 5.0% would be due on the dividend. There are no other significant jurisdictions for which a deferred tax liability has not been recognized on unremitted earnings.
A reconciliation of the gross UTBs for the years ended December 31, 2024, 2023 and 2022 is as follows:
| | | | | | | | | | | | | | | | | |
| (in millions) | 2024 | | 2023 | | 2022 |
| Balance at January 1 | $ | 91.3 | | | $ | 100.2 | | | $ | 86.6 | |
| Additions for tax positions related to the current year | 11.7 | | | 9.6 | | | 16.2 | |
| Additions for tax positions related to prior years | 1.3 | | | 1.3 | | | 3.1 | |
| | | | | |
| Reductions for tax positions related to prior years | (0.6) | | | (7.7) | | | (1.2) | |
| Reductions related to lapse of statute of limitations | (4.4) | | | (1.8) | | | (2.1) | |
| Reductions related to settlements | — | | | (10.3) | | | (2.4) | |
| Balance at December 31 | $ | 99.3 | | | $ | 91.3 | | | $ | 100.2 | |
The amount of UTBs that, if recognized, would favorably affect the company's effective tax rate was $78.9 million at December 31, 2024. The company recognizes accrued interest and penalties related to UTBs as a component of the income tax provision. The Consolidated Balance Sheets include accrued interest and penalties related to UTBs of $21.6 million, $17.0 million and $15.1 million at December 31, 2024, 2023 and 2022, respectively. The company recognized expense for interest and penalties related to UTBs of $4.5 million, $1.9 million and $1.4 million in 2024, 2023 and 2022, respectively.
The company files U.S. federal, U.S. state and local, and numerous foreign income tax returns. The company is periodically examined by various taxing authorities. With few exceptions, the company is no longer subject to income tax examinations for years prior to 2014. As a result of the completion of taxing authorities' examinations and the expiration of statutes of limitations, it is reasonably possible that the company's gross UTBs may decrease by as much as $11.0 million within the next twelve months.
15. EARNINGS PER COMMON SHARE
The calculation of EPS for the years ended December 31, 2024, 2023 and 2022 is as follows:
| | | | | | | | | | | | | | | | | |
| (In millions, except per share data) | 2024 | | 2023 | | 2022 |
| Net income/(loss) attributable to Invesco Ltd. | $ | 538.0 | | | $ | (333.7) | | | $ | 683.9 | |
| | | | | |
| Invesco Ltd: | | | | | |
| Weighted average common shares outstanding - basic | 457.0 | | | 454.8 | | | 457.5 | |
| Dilutive effect of non-participating common share-based awards | 0.7 | | | 1.4 | | | 2.0 | |
| Weighted average common shares outstanding - diluted | 457.7 | | | 456.2 | | | 459.5 | |
| | | | | |
| Earnings per common share: | | | | | |
| -basic | $ | 1.18 | | | $ | (0.73) | | | $ | 1.50 | |
| -diluted | $ | 1.18 | | | $ | (0.73) | | | $ | 1.49 | |
Certain performance-vested awards are excluded from diluted EPS share calculations as the designated contingency was not met.
16. SEGMENT AND GEOGRAPHIC INFORMATION
The company has one operating segment, investment management.
The company’s CODM is the President and CEO as he assesses the company’s performance and makes decisions about resource allocation. Net income/(loss) is one of the performance measures used by the CODM to evaluate the segment's performance and allocate capital. When assessing performance, the CODM uses regularly provided GAAP and non-GAAP financial information and metrics to monitor actual results against forecasts, prior period results and peers’ results. The information regularly provided to the CODM on the segment's revenues and significant expenses aligns with the categories presented in the Consolidated Statements of Income. The segment's assets are reported on the Consolidated Balance Sheets as Total assets.
Geographical information is presented below. There are no revenues or long-lived assets attributed to the company's country of domicile, Bermuda.
| | | | | | | | | | | | | | | | | | | | | | | | | |
| (in millions) | Americas | | APAC | | EMEA | | | | Total |
| For the year ended December 31, 2024 | | | | | | | | | |
| | | | | | | | | |
| | | | | | | | | |
Total operating revenues (1) | $ | 4,653.1 | | | $ | 270.9 | | | $ | 1,143.0 | | | | | $ | 6,067.0 | |
| Long-lived assets | $ | 312.8 | | | $ | 33.7 | | | $ | 132.5 | | | | | $ | 479.0 | |
| | | | | | | | | |
| For the year ended December 31, 2023 | | | | | | | | | |
| | | | | | | | | |
| | | | | | | | | |
Total operating revenues (1) | $ | 4,380.3 | | | $ | 263.8 | | | $ | 1,072.3 | | | | | $ | 5,716.4 | |
| Long-lived assets | $ | 416.0 | | | $ | 40.0 | | | $ | 143.5 | | | | | $ | 599.5 | |
| | | | | | | | | |
| For the year ended December 31, 2022 | | | | | | | | | |
| | | | | | | | | |
| | | | | | | | | |
Total operating revenues (1) | $ | 4,665.1 | | | $ | 284.9 | | | $ | 1,098.9 | | | | | $ | 6,048.9 | |
| Long-lived assets | $ | 395.4 | | | $ | 28.0 | | | $ | 137.7 | | | | | $ | 561.1 | |
__________
(1) Operating revenues reflect the geographical regions from which services are provided.
17. COMMITMENTS AND CONTINGENCIES
Commitments and contingencies may arise in the ordinary course of business.
The company has committed to co-invest in certain investment products which may be called in future periods. At December 31, 2024, the company’s undrawn co-invest capital commitments were $693.7 million (December 31, 2023: $623.3 million).
Certain of our managed investment products have entered into revolving credit facilities with financial institutions. The company provided equity commitments and guarantees to the financial institutions for certain of these revolving credit facilities that are temporary in nature. The revolving credit facilities look first to the respective investment products for repayment and servicing. The company’s equity commitment or guarantee would only be called in the event a particular investment product is unable to meet its obligation. The company believes the likelihood of being required to fund its equity commitments or guarantees under these arrangements to be remote. To date, the company has not been required to fund any equity commitments or guarantees under these arrangements. The maximum amount of future payments under the commitments is $219.5 million and under the guarantees is $65.0 million. The fair value of the guarantee liability is not significant to the consolidated financial statements.
The company and some of its subsidiaries have entered into agreements with financial institutions to guarantee certain obligations of other company subsidiaries. The company would be required to perform under these guarantees in the event of certain defaults. The company has not had prior claims or losses pursuant to these contracts and expects the risk of loss to be remote.
Legal Contingencies
The company is from time to time involved in pending or threatened litigation relating to claims arising in the ordinary course of its business. The nature and progression of litigation can make it difficult to predict the impact a particular lawsuit or claim will have on the company. There are many reasons that the company cannot make these assessments, including, among others, one or more of the following: the proceeding is in its early stages (or merely threatened); the damages sought are unspecified, unsupportable, unexplained or uncertain; the claimant is seeking relief other than compensatory damages; the matter presents novel legal claims or other meaningful legal uncertainties; discovery has not started or is not complete; there are significant facts in dispute; and there are other parties who may share in any ultimate liability.
The company and certain related entities have in recent years been subject to various regulatory inquiries, reviews and investigations and legal proceedings, including civil litigation, regulatory investigations and enforcement actions. These actions can arise from normal business operations and/or matters that have been the subject of previous regulatory reviews. As a global company with investment products registered in numerous countries and subject to the jurisdiction of one or more regulators in each country, at any given time, our business operations may be subject to review, investigation, or disciplinary action.
In assessing the impact that a legal or regulatory matter will have on the company, management evaluates the need for an accrual on a case-by-case basis. If the likelihood of a loss is deemed probable and is reasonably estimable, the estimated loss is accrued. If the likelihood of a loss is assessed as less than probable, a loss is not accrued. If a loss is deemed probable but an amount or range of loss cannot be reasonably estimated, a loss is not accrued but the matter is disclosed.
In management’s opinion, adequate accrual has been made as of December 31, 2024 to provide for any losses that may arise from matters for which the company could reasonably estimate an amount and are deemed probable. Management believes that the ultimate resolution of any litigation or regulatory investigations will not materially affect the company’s business, revenue, net income or liquidity.
Further, the investment management industry also is generally subject to extensive levels of ongoing regulatory oversight and examination. In the jurisdictions in which the company operates, governmental authorities regularly make inquiries, hold investigations and administer market conduct examinations with respect to the company’s compliance with applicable laws and regulations. Additional lawsuits or regulatory enforcement actions arising out of these inquiries may in the future be filed against the company, related entities and individuals in the jurisdictions in which the company and its affiliates operate. Any material loss of investor and/or client confidence as a result of such inquiries and/or litigation could result in a significant decline in AUM, which would have an adverse effect on the company’s future financial results and its ability to grow its business.
18. CONSOLIDATED INVESTMENT PRODUCTS
The company's risk with respect to each investment in CIP is limited to its equity ownership and any uncollected management and performance fees. The company has no right to the benefits from, nor does it bear the risks associated with, these investments, beyond the company's direct investments in, and management and performance fees generated from, the investment products. If the company were to liquidate, these investments would not be available to the general creditors of the company, and as a result, the company does not consider investments held by CIP to be company assets. Additionally, the collateral assets of consolidated CLOs are held solely to satisfy the obligations of the CLOs, and the investors in the consolidated CLOs have no recourse to the general credit of the company for the notes issued by the CLOs. CIP are taxed at the investor level and not at the product level; therefore, there is no tax provision reflected in the net impact of CIP. Substantially all of CIP are VIEs. The following table presents the balances related to CIP that are included on the Consolidated Balance Sheets as well as Invesco's net investment in and net receivables from CIP for each period presented.
| | | | | | | | | | | |
| (in millions) | December 31, 2024 | | December 31, 2023 |
| ASSETS | | | |
| Cash and cash equivalents of CIP | $ | 509.5 | | | $ | 462.4 | |
| Accounts receivable and other assets of CIP | 372.3 | | | 250.1 | |
| Investments of CIP | 7,492.7 | | | 8,765.9 | |
| Investments and other assets of CIP | $ | 8,374.5 | | | $ | 9,478.4 | |
| LIABILITIES | | | |
| Debt of CIP | 6,200.9 | | | 7,121.8 | |
| Other liabilities of CIP | 652.2 | | | 492.1 | |
| Debt and other liabilities of CIP | 6,853.1 | | | 7,613.9 | |
| EQUITY | | | |
| Equity attributable to redeemable noncontrolling interests | 544.7 | | | 745.7 | |
| Retained earnings | — | | | (0.1) | |
| | | |
| | | |
| Invesco's net investment in and net receivables from CIP | 412.5 | | | 546.2 | |
| Equity attributable to nonredeemable noncontrolling interests | 564.2 | | | 572.7 | |
| Total liabilities, noncontrolling interests, and equity | $ | 8,374.5 | | | $ | 9,478.4 | |
| | | |
The following table reflects the impact of consolidation of investment products into the Consolidated Statements of Income for the years ended December 31, 2024, 2023 and 2022.
| | | | | | | | | | | | | | | | | | | | |
| (in millions) | | 2024 | | 2023 | | 2022 |
| | | | | | |
| | | | | | |
| Operating income/(loss) | | $ | (60.2) | | | $ | (84.8) | | | $ | (65.7) | |
| | | | | | |
| | | | | | |
| | | | | | |
| | | | | | |
| | | | | | |
| | | | | | |
| Other income/(expense) | | 37.8 | | | 13.5 | | | 70.5 | |
| | | | | | |
| | | | | | |
| | | | | | |
| Net (income)/loss attributable to noncontrolling interests in consolidated entities | | 22.4 | | | 71.3 | | | (4.8) | |
| Net income/(loss) attributable to Invesco Ltd. | | $ | — | | | $ | — | | | $ | — | |
The following tables present the fair value hierarchy levels of certain CIP balances which are measured at fair value as of December 31, 2024 and December 31, 2023:
| | | | | | | | | | | | | | | | | | | | | | | | | | | | | |
| December 31, 2024 |
| (in millions) | Fair Value Measurements | | Quoted Prices in Active Markets for Identical Assets (Level 1) | | Significant Other Observable Inputs (Level 2) | | Significant Unobservable Inputs
(Level 3) | | Investments Measured at NAV as a practical expedient(2) |
| Assets: | | | | | | | | | |
| | | | | | | | | |
Bank loans(1) | $ | 5,793.0 | | | $ | — | | | $ | 5,494.5 | | | $ | 298.5 | | | $ | — | |
| Bonds | 605.5 | | | 17.2 | | | 588.3 | | | — | | | — | |
| Equity securities | 144.5 | | | 37.2 | | | 22.7 | | | 84.6 | | | — | |
| | | | | | | | | |
| | | | | | | | | |
| Equity and fixed income mutual funds | 96.5 | | | 3.2 | | | 93.3 | | | — | | | — | |
| | | | | | | | | |
| Investments in other private equity funds | 414.6 | | | — | | | — | | | — | | | 414.6 | |
| Real estate investments | 438.6 | | | — | | | — | | | — | | | 438.6 | |
| | | | | | | | | |
| | | | | | | | | |
| | | | | | | | | |
| Total assets at fair value | $ | 7,492.7 | | | $ | 57.6 | | | $ | 6,198.8 | | | $ | 383.1 | | | $ | 853.2 | |
| | | | | | | | | |
| | | | | | | | | |
| | | | | | | | | |
| | | | | | | | | |
| | | | | | | | | | | | | | | | | | | | | | | | | | | | | |
| December 31, 2023 |
| (in millions) | Fair Value Measurements | | Quoted Prices in Active Markets for Identical Assets (Level 1) | | Significant Other Observable Inputs (Level 2) | | Significant Unobservable Inputs
(Level 3) | | Investments Measured at NAV as a Practical expedient(2) |
| Assets: | | | | | | | | | |
| | | | | | | | | |
Bank loans(1) | $ | 6,837.2 | | | $ | — | | | $ | 6,140.1 | | | $ | 697.1 | | | $ | — | |
| Bonds | 669.8 | | | 13.3 | | | 656.2 | | | 0.3 | | | — | |
| Equity securities | 231.9 | | | 85.2 | | | 18.3 | | | 128.4 | | | — | |
| | | | | | | | | |
| | | | | | | | | |
| Equity and fixed income mutual funds | 137.9 | | | 8.0 | | | 129.9 | | | — | | | — | |
| | | | | | | | | |
| Investments in other private equity funds | 425.5 | | | — | | | — | | | — | | | 425.5 | |
| Real estate investments | 463.6 | | | — | | | — | | | — | | | 463.6 | |
| | | | | | | | | |
| | | | | | | | | |
| | | | | | | | | |
| Total assets at fair value | $ | 8,765.9 | | | $ | 106.5 | | | $ | 6,944.5 | | | $ | 825.8 | | | $ | 889.1 | |
| | | | | | | | | |
| | | | | | | | | |
| | | | | | | | | |
| | | | | | | | | |
_________
(1) Bank loan investments, which comprise the majority of the consolidated CLOs' portfolio collateral, are senior secured corporate loans from a variety of industries. Bank loan investments mature at various dates between 2025 and 2032, pay interest at the applicable reference rate plus a spread of up to 10.95%, and typically range in S&P credit rating categories from BBB down to unrated. Notes issued by the consolidated CLOs mature at various dates between 2028 and 2038 and have a weighted average maturity of eight years. The notes are issued in various tranches with different risk profiles. The interest rates are generally variable rates based on the applicable reference rate plus a pre-defined spread, which varies from 0.40% for the more senior tranches to 8.68% for the more subordinated tranches. The investors of the notes are not affiliated with the company and have no recourse to the general credit of the company. The company elected the fair value option for collateral assets held and notes issued by its consolidated CLOs, see Note 1 "Accounting Policies," for details. At December 31, 2024, the unpaid principal balance exceeds the fair value of the senior secured bank loans and bonds by approximately $303.9 million (December 31, 2023: the unpaid principal balance exceeded the fair value of the senior secured bank loans and bonds by approximately $340.9 million). Approximately 0.37% of the collateral assets are in default as of December 31, 2024 (December 31, 2023: approximately 0.07% of the collateral assets were in default).
(2) The table below summarizes as of December 31, 2024 and December 31, 2023, the nature of investments that are valued using the NAV as a practical expedient. Private equity funds are not subject to redemption; however, for certain funds, investors may sell or transfer their interest. Real estate funds are generally subject to a redemption notice period that requires at least 45 days, and the frequency of redemptions is either quarterly or best efforts. | | | | | | | | | | | | | | | | | | | | | | | | | | | | | | | | | | | | | | |
| | December 31, 2024 | | December 31, 2023 |
| (in millions, except term data) | | Fair Value | | Total Unfunded Commitments | | Weighted Average Remaining Term | | Fair Value | | Total Unfunded Commitments | | Weighted Average Remaining Term |
| Private equity funds | | $414.6 | | $32.5 | | 5.2 years | | $425.5 | | $56.5 | | 5.9 years |
| Real estate investments | | $438.6 | | $13.7 | | N/A | | $463.6 | | $53.8 | | N/A |
| | | | | | | | | | | | |
The following table shows a reconciliation of the beginning and ending fair value measurements for level 3 assets using significant unobservable inputs as of December 31, 2024 and December 31, 2023:
| | | | | | | | | | | | | |
| 2024 | | 2023 | | |
| (in millions) | Level 3 Assets | | Level 3 Assets | | |
| | | | | |
| | | | | |
| Beginning Balance as of January 1 | $ | 825.8 | | | $ | 368.6 | | | |
| | | | | |
| | | | | |
| | | | | |
| | | | | |
| | | | | |
| | | | | |
| CIP Purchases | 392.5 | | | 566.6 | | | |
| | | | | |
| | | | | |
| | | | | |
| CIP Sales | (134.7) | | | (54.9) | | | |
| Deconsolidation of CIP | (724.9) | | | (0.6) | | | |
| Gains and losses included in the Consolidated Statements of Income | (18.5) | | | 7.9 | | | |
| Transfers from Level 3 into Levels 1 or 2 | (169.5) | | | (377.9) | | | |
| Transfers into Level 3 from Levels 1 or 2 | 214.5 | | | 310.2 | | | |
| Foreign exchange | (2.1) | | | 5.9 | | | |
| Ending Balance as of December 31 | $ | 383.1 | | | $ | 825.8 | | | |
Non-consolidated VIEs
At December 31, 2024, the company's carrying value and risk of loss with respect to VIEs in which the company is not the primary beneficiary included our investment carrying value of $106.1 million (December 31, 2023: $122.9 million) and unfunded capital commitments of $141.2 million (December 31, 2023: $142.5 million).
19. RELATED PARTIES
MassMutual owns approximately 18.2% of the common stock of the company and owns substantially all of the outstanding $4.0 billion in perpetual, non-cumulative preferred shares as of December 31, 2024. Based on the level of shares owned by MassMutual and the corresponding customary minority shareholder rights, which includes representation on Invesco’s Board, the company considers MassMutual a related party.
Additionally, certain managed funds are deemed to be affiliated entities under the related party definition in ASC 850, “Related Party Disclosures.” The majority of the company's Operating revenues and receivables are from Invesco's managed funds. Related parties also include those defined in the company’s proxy statement.
Refer to Note 2, "Fair Value of Assets and Liabilities," and Note 3, "Investments," for more information on balances invested in Invesco affiliated funds.
20. SUBSEQUENT EVENTS
On January 27, 2025, the company declared a fourth quarter 2024 dividend of $0.205 per common share, payable on March 4, 2025, to common shareholders of record at the close of business on February 14, 2025 with an ex-dividend date of February 14, 2025.
On January 27, 2025, the company declared a preferred dividend of $14.75 per preferred share to the holders of preferred shares representing the period from December 1, 2024 through February 28, 2025. The preferred dividend is payable on March 3, 2025.
Item 9. Changes in and Disagreements with Accountants on Accounting and Financial Disclosure
None
Item 9A. Controls and Procedures
Evaluation of Disclosure Controls and Procedures
Management, with the participation of the chief executive officer and chief financial officer, has evaluated the effectiveness of our disclosure controls and procedures (as defined in the Securities and Exchange Act of 1934 Rules 13a-15(e) and 15d-15(e)) as of December 31, 2024. Based upon this evaluation, the chief executive officer and chief financial officer concluded that the company’s disclosure controls and procedures were effective to provide reasonable assurance that information required to be disclosed in the reports that we file or submit under the Exchange Act is recorded, processed, summarized and reported within the time periods specified in the applicable rules and forms, and that it is accumulated and communicated to our management, including our chief executive officer and chief financial officer, as appropriate to allow timely decisions regarding the required disclosure.
Management's report on internal control over financial reporting is located in Item 8, “Financial Statements and Supplementary Data” of this Annual Report on Form 10-K. Our independent registered public accounting firm PricewaterhouseCoopers LLP, has issued an attestation report on the effectiveness of our internal control over financial reporting for the year ended December 31, 2024.
Changes in Internal Control over Financial Reporting
There were no changes in internal control over financial reporting that occurred during the three months ended December 31, 2024 that have materially affected, or are reasonably likely to materially affect, our internal control over financial reporting.
Item 9B. Other Information
Rule 10b5-1 Trading Plans
During the fiscal quarter ended December 31, 2024, no director or officer (as defined in Rule 16a-1(f) under the Exchange Act) of Invesco adopted or terminated a “Rule 10b5-1 trading arrangement” or “non-Rule 10b5-1 trading arrangement” as each term is defined in Item 408 of Regulation S-K.
Item 9C. Disclosure Regarding Foreign Jurisdictions that Prevent Inspections
Not applicable.
PART III
Item 10. Directors, Executive Officers and Corporate Governance
Invesco filed the certification of its Chief Executive Officer with the NYSE in 2024 as required pursuant to Section 303A of the NYSE Listed Company Manual. In addition, Invesco filed the Sarbanes-Oxley Act Section 302 certifications of its Chief Executive Officer and Chief Financial Officer with the SEC, which certifications are attached hereto as Exhibit 31.1 and Exhibit 31.2, respectively.
Invesco has an Insider Trading Policy (the “Invesco Ltd. Insider Trading Policy”) that applies to all executive officers, directors, employees, temporary employees, consultants and independent contractors of Invesco and our subsidiaries and certain covered family members and controlled entities. The Insider Trading Policy is designed to promote compliance with insider trading laws, rules and regulations with respect to the purchase, sale and/or other dispositions of Invesco’s securities, as well as the applicable rules and regulations of the NYSE. The Insider Trading Policy addresses the implementation of certain pre-clearance procedures and trading blackout periods in Invesco’ securities (including common stock, debt, options, and other related derivative securities) for covered persons. A copy of the Insider Trading Policy is filed as an exhibit to this Annual Report.
The other information required by this Item will be included in the definitive Proxy Statement for the company's annual meeting of shareholders, which will be filed with the SEC no later than 120 days after the close of the fiscal year ended December 31, 2024, under the captions “Our Executive Officers,” “Corporate Governance,” “Board of Directors,” "Delinquent Section 16(a) Reports" (to the extent there are any late filings to report) and possibly elsewhere therein. Such information is incorporated into this Item 10 by reference.
Item 11. Executive Compensation
The information required by this Item will be included in the definitive Proxy Statement for the company's annual meeting of shareholders, which will be filed with the SEC no later than 120 days after the close of the fiscal year ended December 31, 2024, under the captions “Board of Directors - Director Compensation,” “Executive Compensation,” “Compensation Committee Interlocks and Insider Participation,” and possibly elsewhere therein. Such information is incorporated into this Item 11 by reference.
Item 12. Security Ownership of Certain Beneficial Owners and Management and Related Stockholder Matters
The information required by this Item will be included in the definitive Proxy Statement for the company's annual meeting of shareholders, which will be filed with the SEC no later than 120 days after the close of the fiscal year ended December 31, 2024, under the captions “Executive Compensation,” “Security Ownership of Principal Shareholders,” “Security Ownership of Management,” and possibly elsewhere therein. Such information is incorporated into this Item 12 by reference.
Item 13. Certain Relationships and Related Transactions, and Director Independence
The information required by this Item will be included in the definitive Proxy Statement for the company's annual meeting of shareholders, which will be filed with the SEC no later than 120 days after the close of the fiscal year ended December 31, 2024, under the captions “Corporate Governance,” “Certain Relationships and Related Transactions,” “Board of Directors,” “Related Person Transaction Policy,” and possibly elsewhere therein. Such information is incorporated into this Item 13 by reference.
Item 14. Principal Accountant Fees and Services
The information required by this Item will be included in the definitive Proxy Statement for the company's annual meeting of shareholders, which will be filed with the SEC no later than 120 days after the close of the fiscal year ended December 31, 2024, under the captions “Fees Paid to Independent Registered Public Accounting Firm,” “Pre-Approval Process and Policy,” and possibly elsewhere therein. Such information is incorporated into this Item 14 by reference.
PART IV
Item 15. Exhibits and Financial Statement Schedule
(a)(1) The Consolidated Financial Statements filed as part of this Report are listed in Item 8, “Financial Statements and Supplementary Data.”
(a)(2) No financial statement schedules are required to be filed as part of this Report; therefore, all such schedules have been omitted. Such omission has been made on the basis that information is provided in the Consolidated Financial Statements or related footnotes in Item 8, “Financial Statements and Supplementary Data,” or is not required to be filed as the information is not applicable.
(a)(3) The exhibits listed on the Exhibit Index are included with this Report.
Item 16. Form 10-K Summary
Not applicable
Exhibit Index
(Note: Exhibits 10.3 through 10.23 are management contracts or compensatory plans or arrangements required to be filed as an exhibit to this Report pursuant to Item 15(b) of this Report.
| | | | | |
| 3.1 | |
| 3.2 | |
| 3.3 | |
| 4.1 | |
| 4.2 | |
| 4.3 | |
| 4.4 | |
| 4.5 | |
| 4.6 | |
| 4.7 | |
| 10.1 | Sixth Amended and Restated Credit Agreement, dated as of April 26, 2023, among Invesco Finance PLC, the company, the banks, financial institutions and other institutional lenders from time to time a party thereto and Bank of America, N.A., as administrative agent incorporated by reference to exhibit 10.6 to Invesco’s Quarterly Report on Form 10-Q for the period ended March 31, 2023, filed with the Securities and Exchange Commission on May 3, 2023 |
| 10.2 | Sixth Amended and Restated Guaranty, dated as of April 26, 2023, with respect to the Sixth Amended and Restated Credit Agreement by the company in favor of Bank of America, N.A., as administrative agent, and the lenders party incorporated by reference to exhibit 10.7 to Invesco’s Quarterly Report on Form 10-Q for the period ended March 31, 2023, filed with the Securities and Exchange Commission on May 3, 2023 to the Sixth Amended and Restated Credit Agreement incorporated by reference to exhibit 10.6- to Invesco’s Quarterly Report on Form 10-Q for the period ended March 31, 2023, filed with the Securities and Exchange Commission on May 3, 2023 |
| | | | | |
| 10.3 | |
| 10.4 | |
| 10.5 | |
| 10.6 | |
| 10.7 | |
| 10.8 | |
| 10.9 | |
| 10.10 | |
| 10.11 | |
| 10.12 | |
| 10.13 | |
| 10.14 | |
| 10.15 | |
| 10.16 | |
| 10.17 | |
| 10.18 | |
| 10.19 | |
| | | | | |
| 10.20 | |
| 10.21 | |
| 10.22 | |
| 10.23 | |
| 10.24 | |
| 10.25 | |
| 10.26 | |
| 10.27 | First Amendment, dated as of April 11, 2019, to the Agreement and Plan of Merger, dated as of October 17, 2018, by and among Invesco Ltd., Gem Acquisition Corp., Gem Acquisition Two Corp., MM Asset Management Holding LLC and Oppenheimer Acquisition Corp., incorporated by reference to exhibit 10.4 to Invesco’s Quarterly Report on Form 10-Q for the quarter ended March 31, 2019, filed with the Securities and Exchange Commission on April 25, 2019 |
| 10.28 | Second Amendment to the Agreement and Plan of Merger, dated May 24, 2019, by and among Invesco Ltd., Gem Acquisition Corp., Gem Acquisition Two Corp., MM Asset Management Holding LLC, and Oppenheimer Acquisition Corp., incorporated by reference to exhibit 2.3 to Invesco’s Current Report on Form 8-K, filed with the Securities and Exchange Commission on May 24, 2019 |
| 10.29 | |
| 19.0 | |
| 21.0 | |
| 22.0 | |
| 23.1 | |
| 31.1 | |
| 31.2 | |
| 32.1 | |
| 32.2 | |
| 97 | |
| 101 | The following financial statements from the company’s Quarterly Report on Form 10-K for the year ended December 31, 2024, formatted in Inline Extensible Business Reporting Language (iXBRL) : (i) Consolidated Balance Sheets, (ii) Consolidated Statements of Income, (iii) Consolidated Statements of Comprehensive Income, (iv) Consolidated Statements of Cash Flows, (v) Consolidated Statements of Changes in Equity, and (vi) Notes to Consolidated Financial Statements, tagged as blocks of text and including detailed tags |
| 104 | Cover page from the company’s Annual Report on Form 10-K for the year ended December 31, 2024, formatted in Inline XBRL and contained in Exhibit 101 |
SIGNATURES
Pursuant to the requirements of Section 13 or 15(d) of the Securities Exchange Act of 1934, the registrant has duly caused this Report to be signed on its behalf by the undersigned, thereunto duly authorized.
| | | | | |
| Invesco Ltd. |
| |
| By: | /s/ ANDREW R. SCHLOSSBERG |
| Name: | Andrew R. Schlossberg |
| Title: | President and Chief Executive Officer |
| |
| Date: | February 25, 2025 |
Pursuant to the requirements of the Securities Exchange Act of 1934, this Report has been signed below by the following persons on behalf of the registrant and in the capacities and on the dates indicated.
| | | | | | | | |
Name | Title | Date |
| | |
| /s/ ANDREW R. SCHLOSSBERG | Chief Executive Officer (Principal Executive Officer) and President; Director | February 25, 2025 |
| Andrew R. Schlossberg | | |
| /s/ L. ALLISON DUKES | Senior Managing Director and Chief Financial Officer (Principal Financial Officer) | February 25, 2025 |
| L. Allison Dukes | | |
| /s/ TERRY G. VACHERON | Chief Accounting Officer (Principal Accounting Officer) | February 25, 2025 |
| Terry G. Vacheron | | |
| /s/ G. RICHARD WAGONER, JR. | Chairperson and Director | February 25, 2025 |
| G. Richard Wagoner, Jr. | | |
| /s/ SARAH E. BESHAR | Director | February 25, 2025 |
| Sarah E. Beshar | | |
| /s/ THOMAS M. FINKE | Director | February 25, 2025 |
| Thomas M. Finke | | |
| /s/ THOMAS P. GIBBONS | Director | February 25, 2025 |
| Thomas P. Gibbons | | |
| /s/ WILLIAM F. GLAVIN, JR. | Director | February 25, 2025 |
| William F. Glavin, Jr. | | |
| /s/ ELIZABETH. S. JOHNSON | Director | February 25, 2025 |
| Elizabeth S. Johnson | | |
| /s/ SIR NIGEL SHEINWALD | Director | February 25, 2025 |
| Sir Nigel Sheinwald | | |
| /s/ PAULA C. TOLLIVER | Director | February 25, 2025 |
| Paula C. Tolliver | | |
| /s/ CHRISTOPHER C. WOMACK | Director | February 25, 2025 |
| Christopher C. Womack | | |
| /s/ PHOEBE A. WOOD | Director | February 25, 2025 |
| Phoebe A. Wood | | |